APPENDIX 3 CHICOT EQUIVALENT AQUIFER SYSTEM SUMMARY BASELINE MONITORING PROJECT, EPA FY’00 (July 1999 Through June 2000) PART II OF TRIENNIAL SUMMARY REPORT FOR THE ENVIRONMENTAL EVALUATION DIVISION OF LOUISIANA DEPARTMENT OF ENVIRONMENTAL QUALITY PARTIAL FUNDING PROVIDED THROUGH CWA 106 GRANT

Welcome message from author
This document is posted to help you gain knowledge. Please leave a comment to let me know what you think about it! Share it to your friends and learn new things together.
Transcript

APPENDIX 3
CHICOT EQUIVALENT AQUIFER SYSTEM SUMMARY
BASELINE MONITORING PROJECT, EPA FY’00
(July 1999 Through June 2000)
PART II
OF
TRIENNIAL SUMMARY REPORT
FOR THE
ENVIRONMENTAL EVALUATION DIVISION
OF
LOUISIANA DEPARTMENT OF ENVIRONMENTAL QUALITY
PARTIAL FUNDING PROVIDED THROUGH CWA 106 GRANT
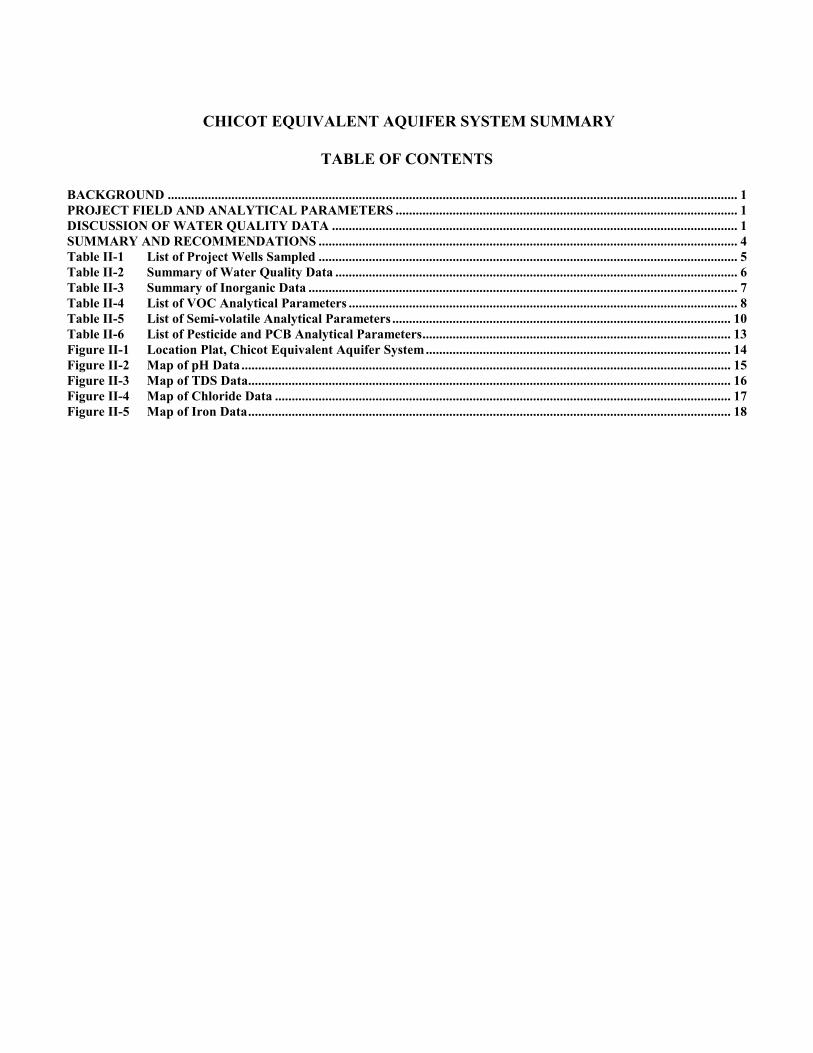
CHICOT EQUIVALENT AQUIFER SYSTEM SUMMARY
TABLE OF CONTENTS
BACKGROUND .......................................................................................................................................................................... 1
PROJECT FIELD AND ANALYTICAL PARAMETERS ...................................................................................................... 1
DISCUSSION OF WATER QUALITY DATA ......................................................................................................................... 1
SUMMARY AND RECOMMENDATIONS ............................................................................................................................. 4
Table II-1 List of Project Wells Sampled ............................................................................................................................. 5
Table II-2 Summary of Water Quality Data ........................................................................................................................ 6
Table II-3 Summary of Inorganic Data ................................................................................................................................ 7
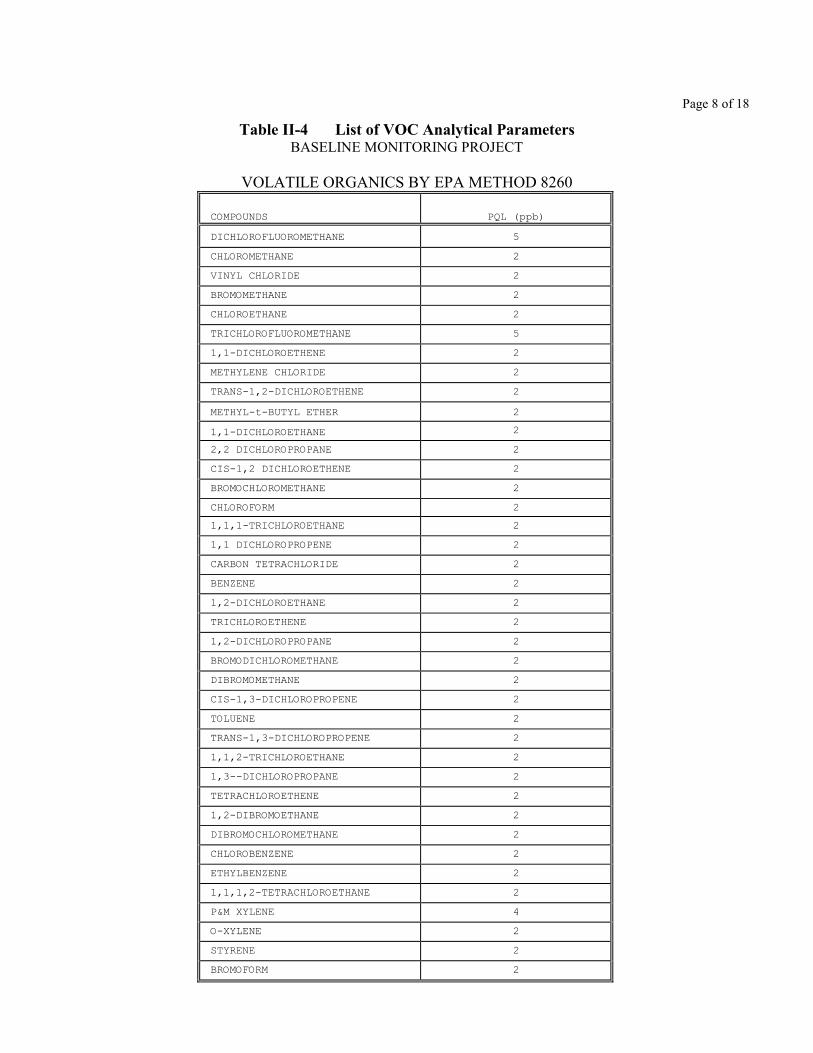
Table II-4 List of VOC Analytical Parameters .................................................................................................................... 8
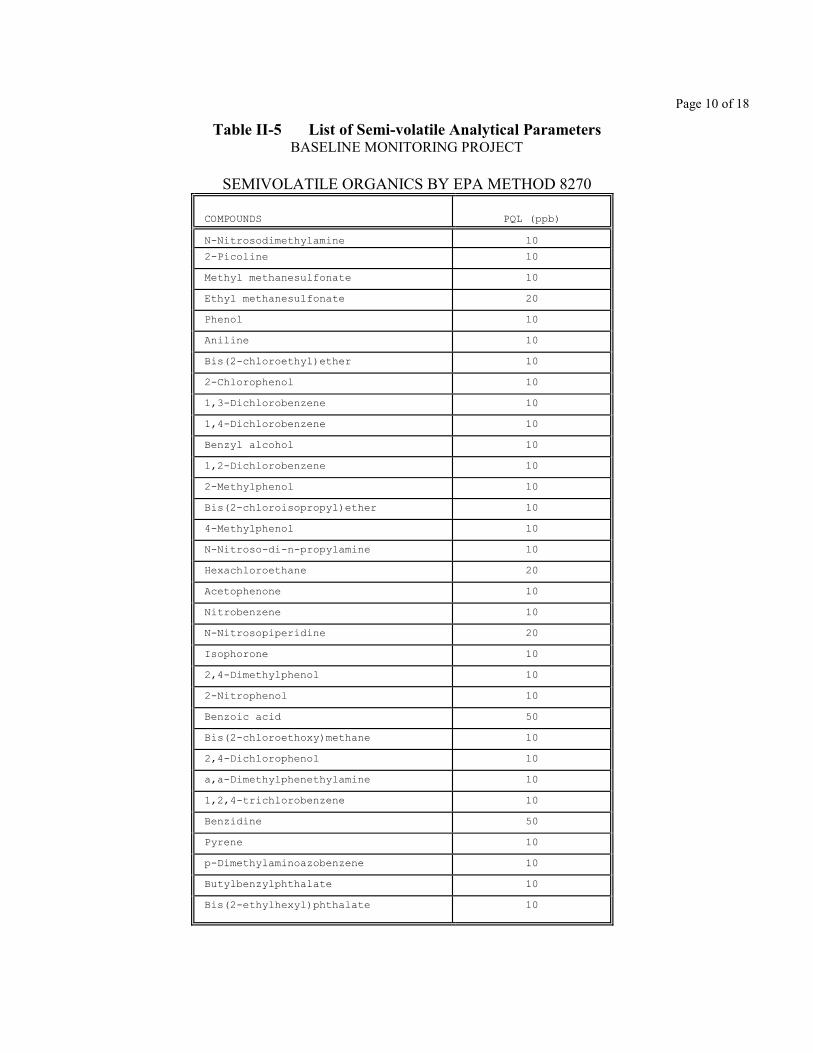
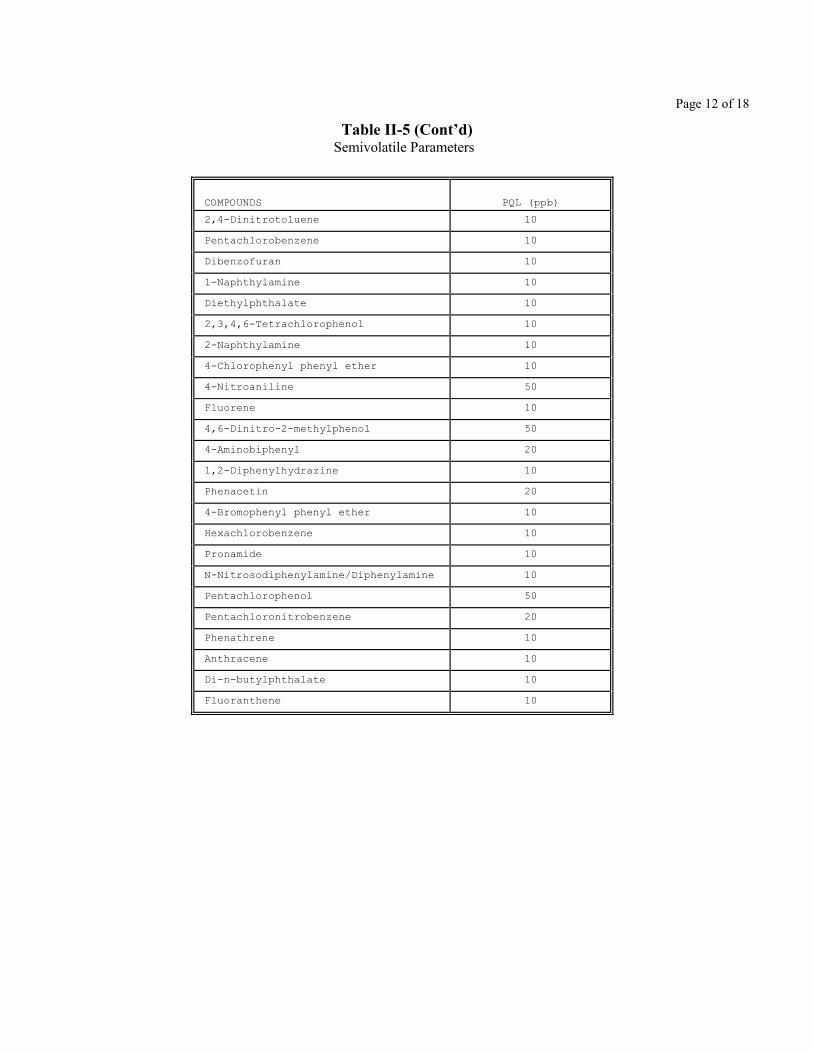
Table II-5 List of Semi-volatile Analytical Parameters ..................................................................................................... 10
Table II-6 List of Pesticide and PCB Analytical Parameters ............................................................................................ 13
Figure II-1 Location Plat, Chicot Equivalent Aquifer System ........................................................................................... 14
Figure II-2 Map of pH Data .................................................................................................................................................. 15
Figure II-3 Map of TDS Data................................................................................................................................................ 16
Figure II-4 Map of Chloride Data ........................................................................................................................................ 17
Figure II-5 Map of Iron Data ................................................................................................................................................ 18

Page 1 of 18
BACKGROUND
To better assess the water quality of a particular aquifer at a given point in time, an attempt was made during the project year to
sample all project wells producing from a common aquifer in a narrow time frame. Also, to more conveniently and economically
promulgate those data collected, these aquifer summaries will make up the project Triennial Summary Report.
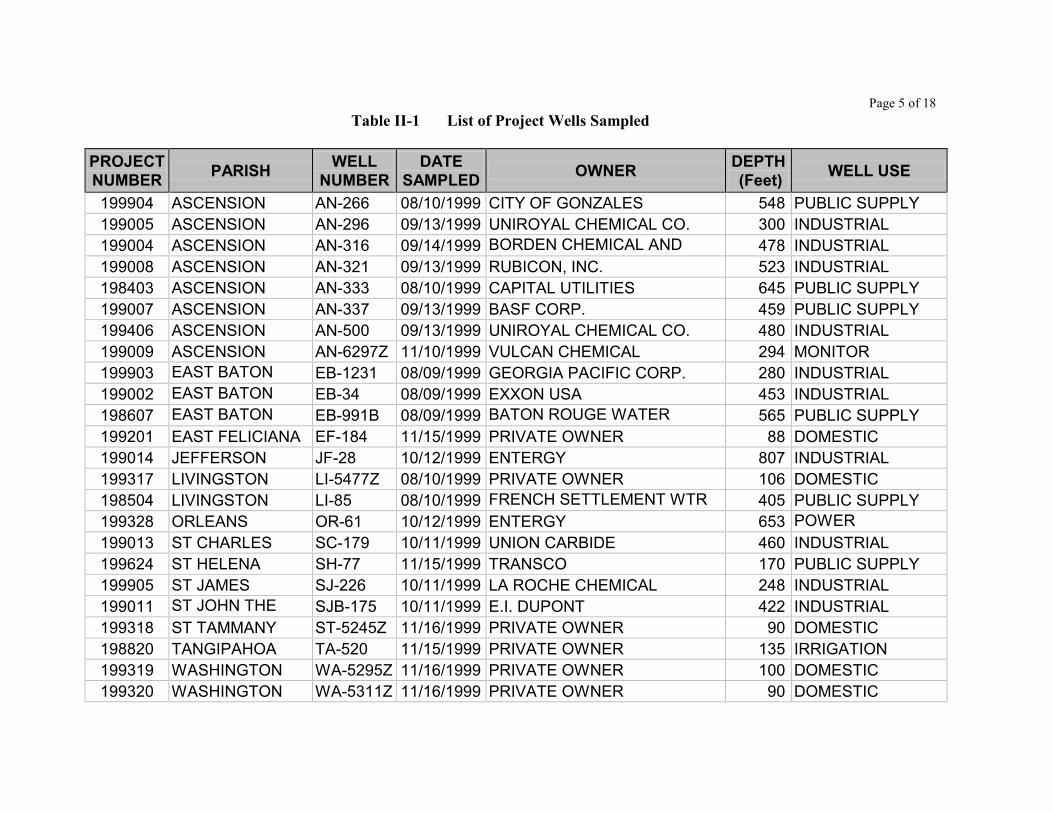
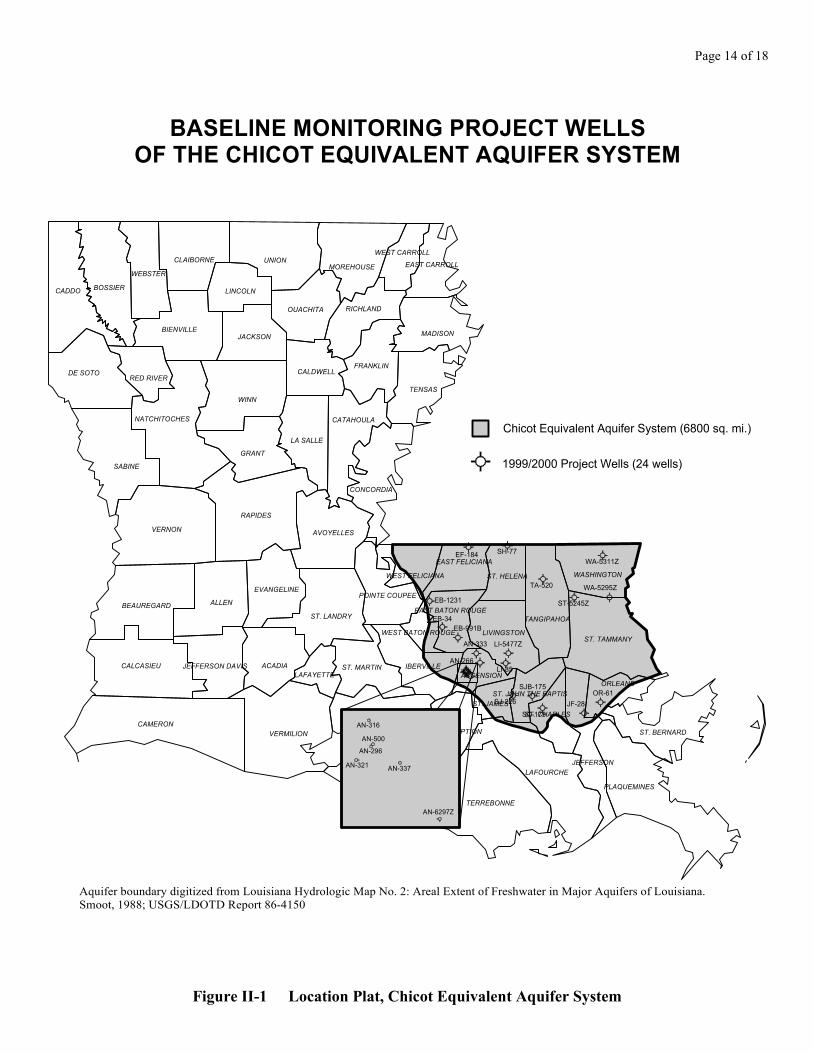
Figure II-1 shows the geographic locations of the Chicot Equivalent Aquifer System and the associated project wells, whereas Table
II-1 lists the wells in the aquifer along with their total depths and the use made of produced waters and the date sampled.
These data show that from August through December of 1999, twenty-four project wells were sampled which produce from the
Chicot Equivalent Aquifer System. Of these twenty-four wells, ten are classified as Industrial wells, six are classified as Public
Supply, five are classified as a Domestic, one is classified as a Power Generation well, one is classified as a Monitoring well, and
one is classified as an Irrigation well. The wells are located in thirteen parishes in southeast Louisiana.
Well data for registered project water wells were obtained from the Louisiana Department of Transportation and Development’s
Water Well Registration Data file.
PROJECT FIELD AND ANALYTICAL PARAMETERS
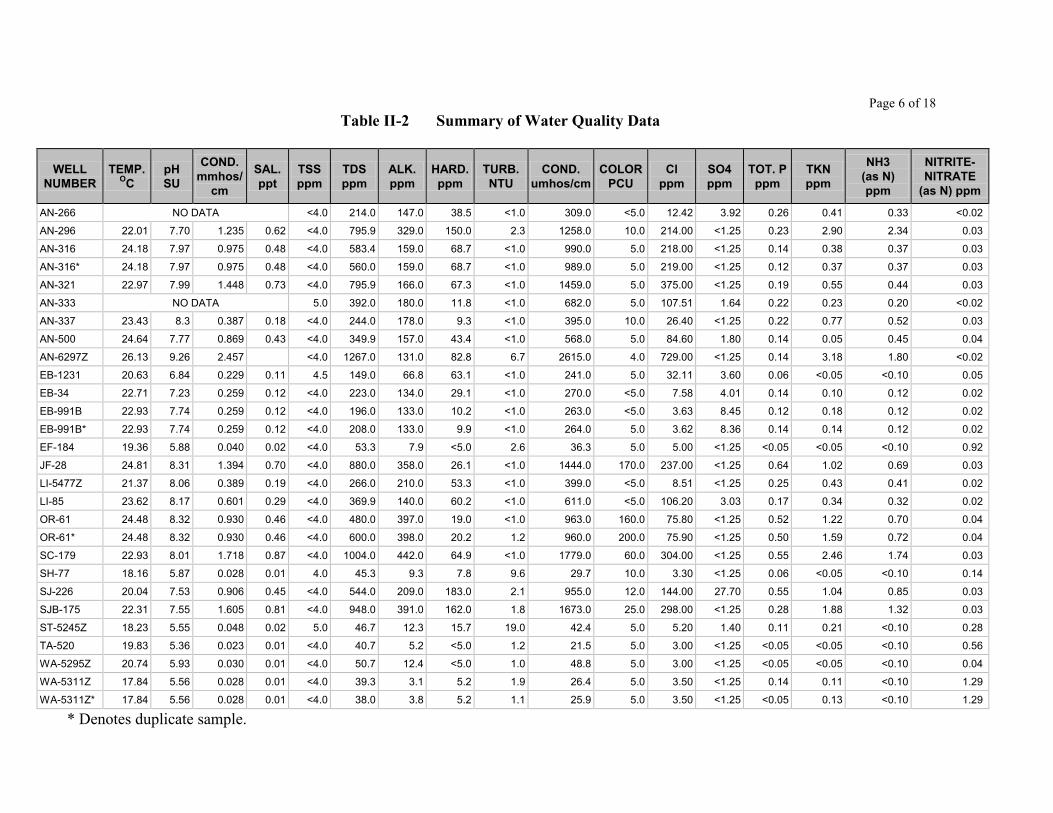
The field parameters that are checked at each sampling site and the list of water quality parameters that are analyzed in the
laboratory are shown in Table II-2. Those project inorganic (total metals) parameters analyzed in the laboratory are listed in Table
II-3. These tables also show the field and analytical results determined for each analyte.
In addition to the analytical parameters mentioned above, a list of project analytical parameters that include three other categories of
compounds (volatiles, semi-volatiles, and pesticides/PCB’s) is included. Due to the large number of analytes in these three
categories, tables were not prepared for each well. However, in order for the reader to be aware of the total list of analytes, Tables
II-4, II-5, and II-6 were included in this summary. These tables list the project analytes along with their Practical Quantitation
Limits (PQLs) used during processing.
DISCUSSION OF WATER QUALITY DATA
FEDERAL PRIMARY DRINKING WATER STANDARDS: Under the Federal Safe Drinking Water Act, EPA has established
Maximum Contaminant Levels (MCL) for pollutants that may pose a health risk in public drinking water. An MCL is the highest
level of a contaminant that EPA allows in public drinking water. MCLs ensure that drinking water does not pose either a short-term
or long-term health risk. While not all wells sampled were public supply wells, this Office does use the MCLs as a benchmark for
further evaluation.
Laboratory data from the sampling of the Chicot Equivalent Aquifer System show that two project water wells exceeded the Federal
MCL of 6 parts per billion (ppb) for bis(2-ethylhexyl)phthalate (BEHP). Laboratory data from the sampling of EB-34 exhibited a
value of 39 ppb for BEHP. EB-991B exhibited a value of 23 ppb in the initial sample and 29 ppb in the duplicate sample.
However, these two wells were resampled for semi-volatile organics, and BEHP was not detected in these resamples. Therefore it is
the opinion of this Office that the BEHP exceedances were due laboratory/field contamination.
Laboratory data from the sampling of project well ST-5245Z revealed a concentration of 0.43 ppb for mercury. While this
concentration did not exceed the Federal Primary MCL of 2 ppb established for mercury, it is a higher than expected concentration.
Therefore the well was resampled for total metals and the results of the resampling showed concentrations of 0.20 ppb in the initial
resample and in the duplicate resample. It is this Office’s opinion that the resampling has confirmed the existence of mercury in the
well. Please see the Summary and Recommendations for further discussion of this.
Those project wells reporting turbidity levels of >1 NTU, do not exceed the MCL of 1.0, as this primary standard applies to surface

Page 2 of 18
water systems only.
FEDERAL SECONDARY DRINKING WATER STANDARDS: EPA has set secondary standards which are defined as non-
enforceable taste, odor or appearance guidelines. Field and laboratory data contained in Tables II-2 and II-3 show that nine of the
wells sampled in the Chicot Equivalent Aquifer System exceeded the Secondary Maximum Contaminant Level (SMCL) for total
dissolved solids (TDS), four of the wells exceeded the SMCL for iron, four wells exceeded the SMCL for chloride, seven of the
wells exceeded the SMCL for pH, and four wells exceeded the SMCL for color.
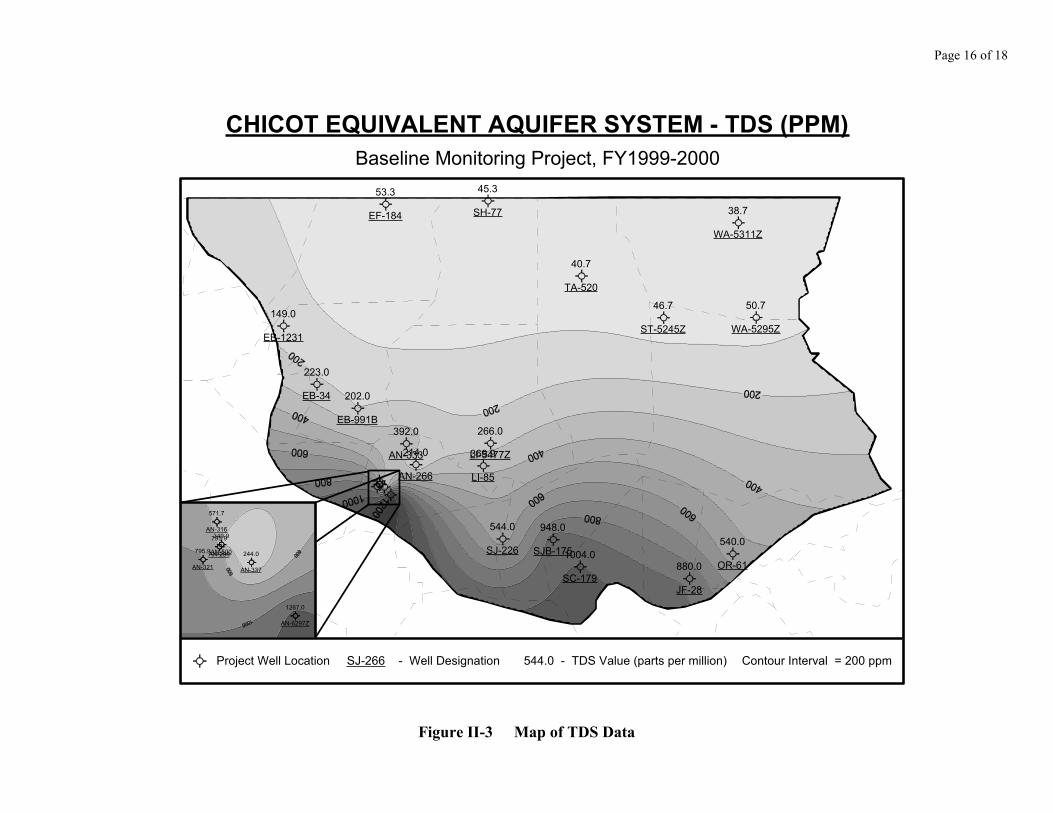
TDS (SMCL=500 ppm):
AN-296 – 795.9 ppm AN-321 – 795.9 ppm
AN-316 – 583.4 ppm, 560 ppm SJ-226 – 544 ppm
SJB-175 – 948 ppm SC-179 – 1,004 ppm
JF-28 – 880 ppm OR-61 – 600 ppm
AN-6297Z – 1,267 ppm
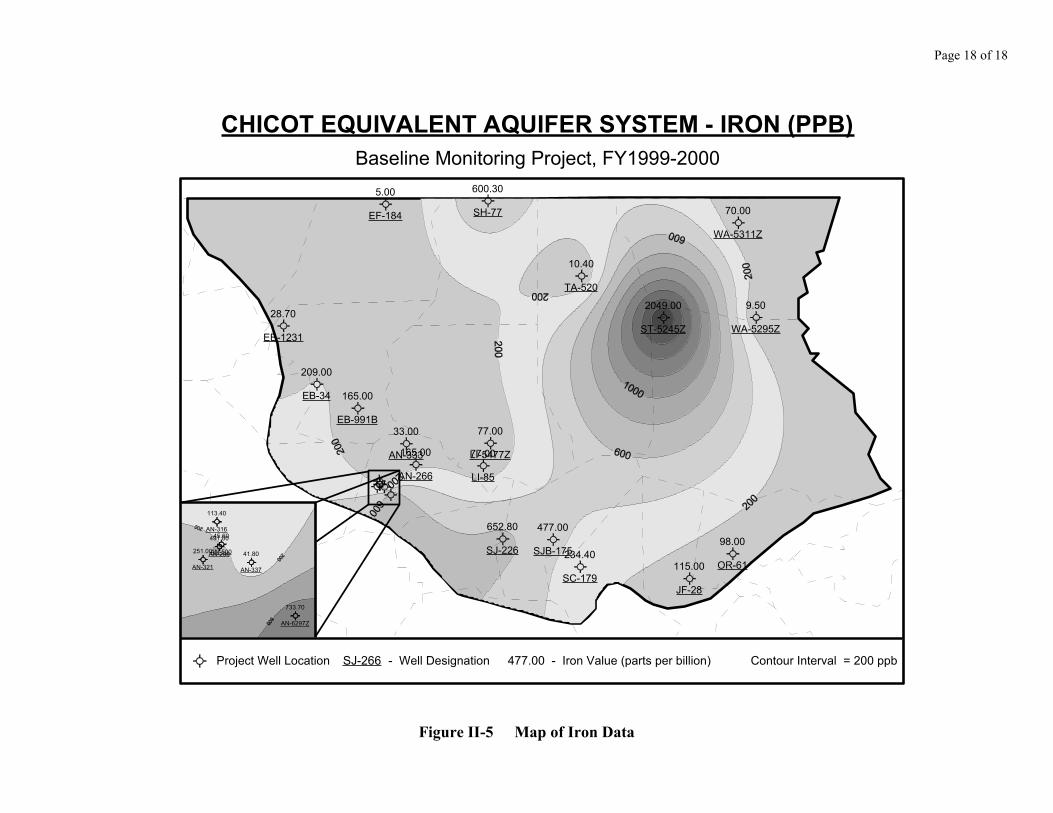
Iron (SMCL=300 ppm):
AN-296 – 491 ppb AN-6297Z – 733.7 ppb
SH-77 – 600.3 ppb ST-5245Z – 2,049 ppb, 2,418 ppb (resample),
2,332 ppb (resample duplicate)
Chloride (SMCL=250 ppm):
AN-321 – 375 ppm SJB-175 – 298 ppm
SC-179 – 304 ppm AN-6297Z – 729 ppm
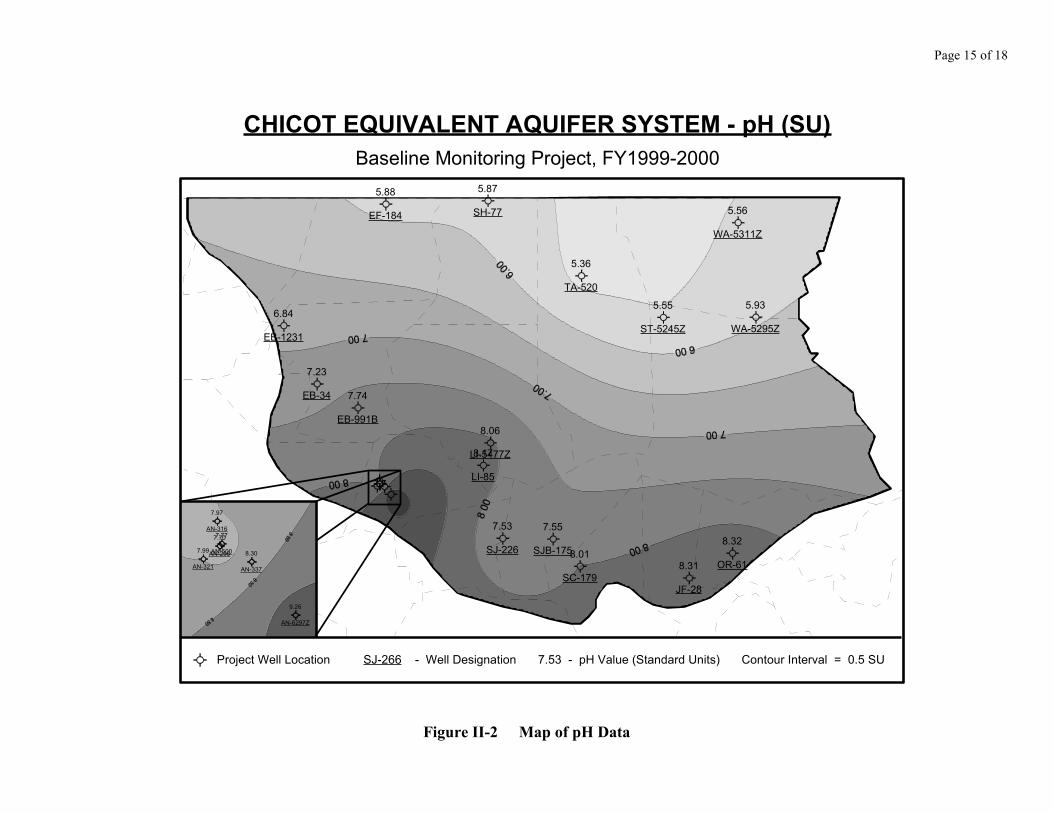
pH (SMCL=6.5 – 8.5 standard units (S.U.)):
AN-6297Z – 9.26 S.U. SH-77 – 5.87 S.U.
EF-184 – 5.88 S.U. TA-520 – 5.36 S.U.
WA-5311Z – 5.56 S.U. WA-5295Z – 5.93 S.U.
ST-5245Z – 5.55 S.U., 5.49 S.U. (resample)
Color (SMCL=15 color units (PCU)):
SJB-175 – 25 PCU SC-179 – 60 PCU
JF-28 – 170 PCU OR-61 – 200 PCU
FEDERAL LEAD ACTION LEVEL: Under the Federal Safe Drinking Water Act, EPA has established an Action Level of 15 ppb

Page 3 of 18
for lead to ensure that this contaminant does not pose either a short-term or long-term health risk in public drinking water. While not
all wells sampled were public supply wells, this Office does use this Action Level as a benchmark for further evaluation. Laboratory
data contained in Table II-3 show that one of the wells sampled exceeded the Action Level for lead. ST-5245Z exceeded the Action
Level with a concentration of 32.2 ppb. Even though this well is not a public supply well, it was resampled due to this
concentration. The laboratory results from the resampling revealed a concentration of 13.9 ppb (under the Action Level) for the
initial resample and 15.9 ppb (over the Action Level) for the duplicate resample. It is this Office’s opinion that the resampling has
confirmed the existence of lead in the well. Please see the Summary and Recommendations for further discussion of this.
SEMIVOLATILE ORGANICS WHICH HAVE NO ESTABLISHED MCL: A concentration of 32 ppb of butylbenzylphthalate was
exhibited in the sample results from project well SJ-226. As of the writing of this summary, no MCL has been established for
butylbenzylphthalate. Since this well is an industrial well and since butylbenzylphthalate has no established primary MCL, the well
was not resampled. Taking into account the EPA guidance document “Guidance For Data Usability In Risk Assessment, EPA
1992,” it is this Office’s opinion that the occurrence of butylbenzylphthalate is due to field/laboratory contamination. It will
therefore be considered a false positive.
SELECTED WATER QUALITY MAPS: For the reader’s convenience, maps showing the contoured values for pH, TDS, chloride,
and iron are included in this summary report in Figures II-2 through II-5.

Page 4 of 18
SUMMARY AND RECOMMENDATIONS
In summary, the analytical data show that the ground water from this aquifer is of fair quality when considering taste, odor or
appearance guidelines. The data also show that this aquifer is of good quality as far as short-term or long-term health risks are
concerned.
This is with the exception of the occurrence of mercury and lead in project well ST-5245Z. The well is located on a horse ranch
north of Folsom, it is 90 feet deep, and the water drawn from it feeds into a pond located toward the front of the property which is
mainly used for fishing. The laboratory results from the regularly scheduled sampling of this well revealed that lead was at a
concentration of 32.2 ppb, which is above the Federal Action Level of 15 ppb for lead, and that mercury was at a concentration of
0.43 ppb. Consequently, the well was resampled for metals. The laboratory results from both the initial resample, and the duplicate
resample taken directly after the initial resample, revealed concentrations of lead and mercury. Lead was detected at a concentration
of 13.9 ppb in the initial resample and at a concentration of 15.9 ppb in the duplicate resample. Mercury was detected at a
concentration of 0.20 ppb in both the initial and the duplicate resamples. It is this Office’s opinion that the resampling has
confirmed the existence of lead and mercury in the well. The owner of the well was made aware of this and was given information
on lead and mercury contamination, and was informed of steps that can be taken to alleviate the problem. In addition to the owner,
LDEQ’s Mercury Contaminant Program, the Louisiana Department of Health and Hospitals, and the Louisiana Department of
Agriculture and Forestry was also notified.
It is recommended that the several project wells assigned to the Chicot Equivalent Aquifer be resampled as planned, in
approximately three years. In addition, several wells should be added to those currently sampled to increase the well density for this
aquifer.
Page 5 of 18
Table II-1 List of Project Wells Sampled
PROJECT
NUMBER PARISH
WELL
NUMBER
DATE
SAMPLED OWNER
DEPTH
(Feet) WELL USE
199904 ASCENSION AN-266 08/10/1999 CITY OF GONZALES 548 PUBLIC SUPPLY
199005 ASCENSION AN-296 09/13/1999 UNIROYAL CHEMICAL CO. 300 INDUSTRIAL
199004 ASCENSION AN-316 09/14/1999 BORDEN CHEMICAL AND PLASTICS
478 INDUSTRIAL
199008 ASCENSION AN-321 09/13/1999 RUBICON, INC. 523 INDUSTRIAL
198403 ASCENSION AN-333 08/10/1999 CAPITAL UTILITIES 645 PUBLIC SUPPLY
199007 ASCENSION AN-337 09/13/1999 BASF CORP. 459 PUBLIC SUPPLY
199406 ASCENSION AN-500 09/13/1999 UNIROYAL CHEMICAL CO. 480 INDUSTRIAL
199009 ASCENSION AN-6297Z 11/10/1999 VULCAN CHEMICAL 294 MONITOR
199903 EAST BATON ROUGE
EB-1231 08/09/1999 GEORGIA PACIFIC CORP. 280 INDUSTRIAL
199002 EAST BATON ROUGE
EB-34 08/09/1999 EXXON USA 453 INDUSTRIAL
198607 EAST BATON ROUGE
EB-991B 08/09/1999 BATON ROUGE WATER WORKS
565 PUBLIC SUPPLY
199201 EAST FELICIANA EF-184 11/15/1999 PRIVATE OWNER 88 DOMESTIC
199014 JEFFERSON JF-28 10/12/1999 ENTERGY 807 INDUSTRIAL
199317 LIVINGSTON LI-5477Z 08/10/1999 PRIVATE OWNER 106 DOMESTIC
198504 LIVINGSTON LI-85 08/10/1999 FRENCH SETTLEMENT WTR SYS
405 PUBLIC SUPPLY
199328 ORLEANS OR-61 10/12/1999 ENTERGY 653 POWER GENERATION 199013 ST CHARLES SC-179 10/11/1999 UNION CARBIDE 460 INDUSTRIAL
199624 ST HELENA SH-77 11/15/1999 TRANSCO 170 PUBLIC SUPPLY
199905 ST JAMES SJ-226 10/11/1999 LA ROCHE CHEMICAL 248 INDUSTRIAL
199011 ST JOHN THE BAPTIST
SJB-175 10/11/1999 E.I. DUPONT 422 INDUSTRIAL
199318 ST TAMMANY ST-5245Z 11/16/1999 PRIVATE OWNER 90 DOMESTIC
198820 TANGIPAHOA TA-520 11/15/1999 PRIVATE OWNER 135 IRRIGATION
199319 WASHINGTON WA-5295Z 11/16/1999 PRIVATE OWNER 100 DOMESTIC
199320 WASHINGTON WA-5311Z 11/16/1999 PRIVATE OWNER 90 DOMESTIC
Page 6 of 18
Table II-2 Summary of Water Quality Data
WELL
NUMBER
TEMP. OC
pH
SU
COND.
mmhos/
cm
SAL.
ppt
TSS
ppm
TDS
ppm
ALK.
ppm
HARD.
ppm
TURB.
NTU
COND.
umhos/cm
COLOR
PCU
Cl
ppm
SO4
ppm
TOT. P
ppm
TKN
ppm
NH3
(as N)
ppm
NITRITE-
NITRATE
(as N) ppm
AN-266 NO DATA <4.0 214.0 147.0 38.5 <1.0 309.0 <5.0 12.42 3.92 0.26 0.41 0.33 <0.02
AN-296 22.01 7.70 1.235 0.62 <4.0 795.9 329.0 150.0 2.3 1258.0 10.0 214.00 <1.25 0.23 2.90 2.34 0.03
AN-316 24.18 7.97 0.975 0.48 <4.0 583.4 159.0 68.7 <1.0 990.0 5.0 218.00 <1.25 0.14 0.38 0.37 0.03
AN-316* 24.18 7.97 0.975 0.48 <4.0 560.0 159.0 68.7 <1.0 989.0 5.0 219.00 <1.25 0.12 0.37 0.37 0.03
AN-321 22.97 7.99 1.448 0.73 <4.0 795.9 166.0 67.3 <1.0 1459.0 5.0 375.00 <1.25 0.19 0.55 0.44 0.03
AN-333 NO DATA 5.0 392.0 180.0 11.8 <1.0 682.0 5.0 107.51 1.64 0.22 0.23 0.20 <0.02
AN-337 23.43 8.3 0.387 0.18 <4.0 244.0 178.0 9.3 <1.0 395.0 10.0 26.40 <1.25 0.22 0.77 0.52 0.03
AN-500 24.64 7.77 0.869 0.43 <4.0 349.9 157.0 43.4 <1.0 568.0 5.0 84.60 1.80 0.14 0.05 0.45 0.04
AN-6297Z 26.13 9.26 2.457 <4.0 1267.0 131.0 82.8 6.7 2615.0 4.0 729.00 <1.25 0.14 3.18 1.80 <0.02
EB-1231 20.63 6.84 0.229 0.11 4.5 149.0 66.8 63.1 <1.0 241.0 5.0 32.11 3.60 0.06 <0.05 <0.10 0.05
EB-34 22.71 7.23 0.259 0.12 <4.0 223.0 134.0 29.1 <1.0 270.0 <5.0 7.58 4.01 0.14 0.10 0.12 0.02
EB-991B 22.93 7.74 0.259 0.12 <4.0 196.0 133.0 10.2 <1.0 263.0 <5.0 3.63 8.45 0.12 0.18 0.12 0.02
EB-991B* 22.93 7.74 0.259 0.12 <4.0 208.0 133.0 9.9 <1.0 264.0 5.0 3.62 8.36 0.14 0.14 0.12 0.02
EF-184 19.36 5.88 0.040 0.02 <4.0 53.3 7.9 <5.0 2.6 36.3 5.0 5.00 <1.25 <0.05 <0.05 <0.10 0.92
JF-28 24.81 8.31 1.394 0.70 <4.0 880.0 358.0 26.1 <1.0 1444.0 170.0 237.00 <1.25 0.64 1.02 0.69 0.03
LI-5477Z 21.37 8.06 0.389 0.19 <4.0 266.0 210.0 53.3 <1.0 399.0 <5.0 8.51 <1.25 0.25 0.43 0.41 0.02
LI-85 23.62 8.17 0.601 0.29 <4.0 369.9 140.0 60.2 <1.0 611.0 <5.0 106.20 3.03 0.17 0.34 0.32 0.02
OR-61 24.48 8.32 0.930 0.46 <4.0 480.0 397.0 19.0 <1.0 963.0 160.0 75.80 <1.25 0.52 1.22 0.70 0.04
OR-61* 24.48 8.32 0.930 0.46 <4.0 600.0 398.0 20.2 1.2 960.0 200.0 75.90 <1.25 0.50 1.59 0.72 0.04
SC-179 22.93 8.01 1.718 0.87 <4.0 1004.0 442.0 64.9 <1.0 1779.0 60.0 304.00 <1.25 0.55 2.46 1.74 0.03
SH-77 18.16 5.87 0.028 0.01 4.0 45.3 9.3 7.8 9.6 29.7 10.0 3.30 <1.25 0.06 <0.05 <0.10 0.14
SJ-226 20.04 7.53 0.906 0.45 <4.0 544.0 209.0 183.0 2.1 955.0 12.0 144.00 27.70 0.55 1.04 0.85 0.03
SJB-175 22.31 7.55 1.605 0.81 <4.0 948.0 391.0 162.0 1.8 1673.0 25.0 298.00 <1.25 0.28 1.88 1.32 0.03
ST-5245Z 18.23 5.55 0.048 0.02 5.0 46.7 12.3 15.7 19.0 42.4 5.0 5.20 1.40 0.11 0.21 <0.10 0.28
TA-520 19.83 5.36 0.023 0.01 <4.0 40.7 5.2 <5.0 1.2 21.5 5.0 3.00 <1.25 <0.05 <0.05 <0.10 0.56
WA-5295Z 20.74 5.93 0.030 0.01 <4.0 50.7 12.4 <5.0 1.0 48.8 5.0 3.00 <1.25 <0.05 <0.05 <0.10 0.04
WA-5311Z 17.84 5.56 0.028 0.01 <4.0 39.3 3.1 5.2 1.9 26.4 5.0 3.50 <1.25 0.14 0.11 <0.10 1.29
WA-5311Z* 17.84 5.56 0.028 0.01 <4.0 38.0 3.8 5.2 1.1 25.9 5.0 3.50 <1.25 <0.05 0.13 <0.10 1.29
* Denotes duplicate sample.

Page 7 of 18
Table II-3 Summary of Inorganic Data
WELL
NUMBER
ARSENIC
ppb
SILVER
ppb
BARIUM
ppb
BERYLLIUM
ppb
CADMIUM
ppb
CHROMIUM
ppb
COPPER
ppb
IRON
ppb
MERCURY
ppb
NICKEL
ppb
ANTIMONY
ppb
SELENIUM
ppb
LEAD
ppb
THALLIUM
ppb
ZINC
ppb
AN-266 <5.0 <2.0 111.0 <1.0 <1.0 <5.0 <5.0 165.0 0.06 <5.0 <5.0 <1.0 <10.0 <1.0 <10.0
AN-296 <5.0 <1.0 330.0 <1.0 <1.0 <1.0 6.0 491.0 <0.05 <5.0 <5.0 <5.0 <10.0 <5.0 46.4
AN-316 <5.0 <1.0 321.0 <1.0 <1.0 <5.0 <5.0 185.0 <0.05 <5.0 <5.0 <5.0 <10.0 <5.0 26.0
AN-316* <5.0 <1.0 50.7 <1.0 <1.0 <5.0 <5.0 41.8 <0.05 <5.0 <5.0 <5.0 <10.0 <5.0 <10.0
AN-321 <5.0 <1.0 320.0 <1.0 <1.0 <5.0 <5.0 251.0 <0.05 <5.0 <5.0 <5.0 <10.0 <5.0 15.3
AN-333 <5.0 <2.0 83.7 <1.0 <1.0 <5.0 15.0 33.0 0.05 <5.0 <5.0 <1.0 <10.0 <1.0 10.7
AN-337 <5.0 <1.0 50.7 <1.0 <1.0 <5.0 <5.0 41.8 <0.05 <5.0 <10.0 <5.0 <10.0 <5.0 <10.0
AN-500 <5.0 <1.0 136.0 <1.0 <1.0 <5.0 <5.0 45.6 <0.05 <5.0 <5.0 <5.0 <10.0 <5.0 111.0
AN-6297Z <5.0 <1.0 292.4 <1.0 <1.0 <5.0 <5.0 733.7 <0.05 10.2 <5.0 <5.0 <10.0 <5.0 25.0
EB-1231 <5.0 <2.0 127.0 <1.0 <1.0 <5.0 <5.0 28.7 0.13 <5.0 <5.0 <1.0 <10.0 <1.0 6.4
EB-34 <5.0 <2.0 89.9 <1.0 1.0 <5.0 <5.0 209.0 0.05 <5.0 <5.0 <1.0 <10.0 <1.0 16.4
EB-991B <5.0 <2.0 28.1 <1.0 <1.0 <5.0 <5.0 165.0 0.07 <5.0 <5.0 <1.0 <10.0 <1.0 11.8
EB-991B* <5.0 <2.0 29.2 <1.0 <1.0 <5.0 <5.0 165.0 0.06 <5.0 <5.0 <1.0 <10.0 <1.0 20.2
EF-184 <5.0 <1.0 7.3 <1.0 <1.0 <5.0 <5.0 <10.0 <0.05 <5.0 <5.0 <5.0 <10.0 <5.0 32.8
JF-28 <5.0 <1.0 117.5 <1.0 <1.0 <5.0 <5.0 115.0 <0.05 <5.0 <5.0 <5.0 <10.0 <5.0 <10.0
LI-5477Z <5.0 <5.0 97.7 <1.0 3.7 <5.0 <5.0 77.0 <0.05 <5.0 <5.0 <1.0 <10.0 <1.0 <10.0
LI-85 <5.0 <2.0 201.0 <1.0 <1.0 <5.0 26.7 77.0 <0.05 <5.0 <5.0 <1.0 <10.0 <1.0 12.2
OR-61 <5.0 <1.0 71.0 <1.0 <1.0 <5.0 <5.0 97.1 <0.05 <5.0 <5.0 <5.0 <10.0 <5.0 <10.0
OR-61* <5.0 <1.0 72.2 <1.0 <1.0 <5.0 <5.0 98.9 <0.05 <5.0 <5.0 <5.0 <10.0 <5.0 221.3
SC-179 <5.0 <1.0 78.1 <1.0 <1.0 <5.0 <5.0 234.4 <0.05 <5.0 <5.0 <5.0 <10.0 <5.0 <10.0
SH-77 <5.0 <1.0 14.6 <1.0 <1.0 <5.0 18.8 600.3 <0.05 <5.0 <5.0 <5.0 <10.0 <5.0 283.0
SJ-226 10.8 <1.0 273.1 <1.0 <1.0 <5.0 <5.0 652.8 <0.05 <5.0 <5.0 <5.0 <10.0 <5.0 <10.0
SJB-175 <5.0 <1.0 341.9 <1.0 <1.0 <5.0 <5.0 477.0 <0.05 <5.0 <5.0 <5.0 <10.0 <5.0 14.6
ST-5245Z <5.0 <1.0 132.7 <1.0 <1.0 <5.0 18.1 2,049.0 0.43 <5.0 <5.0 <5.0 32.2 <5.0 28.0
TA-520 <5.0 <1.0 21.1 <1.0 <1.0 <5.0 13.3 10.4 <0.05 5.9 <5.0 <5.0 <10.0 <5.0 14.7
WA-5295Z <5.0 <1.0 65.8 <1.0 <1.0 <5.0 79.6 9.5 <0.05 <5.0 <5.0 <5.0 <10.0 <5.0 31.1
WA-5311Z <5.0 <1.0 28.5 <1.0 <1.0 <5.0 47.2 100.9 <0.05 <5.0 <5.0 <5.0 <10.0 <5.0 49.6
WA-5311Z* <5.0 <1.0 28.4 <1.0 <1.0 <5.0 54.6 39.1 <0.05 <5.0 <5.0 <5.0 <10.0 <5.0 45.0
* Denotes duplicate sample.
Page 8 of 18
Table II-4 List of VOC Analytical Parameters BASELINE MONITORING PROJECT
VOLATILE ORGANICS BY EPA METHOD 8260 COMPOUNDS
PQL (ppb) DICHLOROFLUOROMETHANE
5
CHLOROMETHANE
2
VINYL CHLORIDE
2
BROMOMETHANE
2
CHLOROETHANE
2
TRICHLOROFLUOROMETHANE
5
1,1-DICHLOROETHENE
2
METHYLENE CHLORIDE
2
TRANS-1,2-DICHLOROETHENE
2
METHYL-t-BUTYL ETHER 2 1,1-DICHLOROETHANE
2
2,2 DICHLOROPROPANE
2
CIS-1,2 DICHLOROETHENE
2
BROMOCHLOROMETHANE
2
CHLOROFORM
2
1,1,1-TRICHLOROETHANE
2
1,1 DICHLOROPROPENE
2
CARBON TETRACHLORIDE
2
BENZENE
2
1,2-DICHLOROETHANE
2
TRICHLOROETHENE
2
1,2-DICHLOROPROPANE
2
BROMODICHLOROMETHANE
2
DIBROMOMETHANE
2
CIS-1,3-DICHLOROPROPENE
2
TOLUENE
2
TRANS-1,3-DICHLOROPROPENE
2
1,1,2-TRICHLOROETHANE
2
1,3--DICHLOROPROPANE
2
TETRACHLOROETHENE
2
1,2-DIBROMOETHANE
2
DIBROMOCHLOROMETHANE
2
CHLOROBENZENE
2
ETHYLBENZENE
2
1,1,1,2-TETRACHLOROETHANE
2
P&M XYLENE
4
O-XYLENE
2
STYRENE
2
BROMOFORM
2

Page 9 of 18
Table II-4 (Cont’d) Volatile Organic (VOC) Parameters
COMPOUNDS
PQL (ppb) ISOPROPYLBENZENE
2
1,1,2,2-TETRACHLOROMETHANE
2
1,2,3,-TRICHLOROPROPANE
2
BROMOBENZENE 2 n-PROPYLBENZENE
2
2-CHLOROTOLUENE
2
4-CHLOROTOLUENE
2
1,3,5-TRIMETHYLBENZENE
2
TERT-BUTYLBENZENE
2
1,2,4-TRIMETHYLBENZENE
2
SEC-BUTYLBENZENE
2
P-ISOPROPYLTOLUENE
2
1,3-DICHLOROBENZENE
2
1,4-DICHLOROBENZENE
2
n-BUTYLBENZENE
2
1,2-DIBROMO-3-CHLOROPROPANE
2
NAPHTHALENE
2
1,2,4-TRICHLOROBENZENE
2
HEXACHLOROBUTADIENE
2
1,2-DICHLOROBENZENE
2
1,2,3-TRICHLOROBENZENE
2
PQL = Practical Quantitation Limit
ppb = parts per billion
Page 10 of 18
Table II-5 List of Semi-volatile Analytical Parameters BASELINE MONITORING PROJECT
SEMIVOLATILE ORGANICS BY EPA METHOD 8270 COMPOUNDS
PQL (ppb)
N-Nitrosodimethylamine
10
2-Picoline
10
Methyl methanesulfonate
10
Ethyl methanesulfonate
20
Phenol
10
Aniline
10
Bis(2-chloroethyl)ether
10
2-Chlorophenol
10
1,3-Dichlorobenzene
10
1,4-Dichlorobenzene
10
Benzyl alcohol
10
1,2-Dichlorobenzene
10
2-Methylphenol
10
Bis(2-chloroisopropyl)ether
10
4-Methylphenol
10
N-Nitroso-di-n-propylamine
10
Hexachloroethane
20
Acetophenone
10
Nitrobenzene
10
N-Nitrosopiperidine
20
Isophorone
10
2,4-Dimethylphenol
10
2-Nitrophenol
10
Benzoic acid
50
Bis(2-chloroethoxy)methane
10
2,4-Dichlorophenol
10
a,a-Dimethylphenethylamine
10
1,2,4-trichlorobenzene
10
Benzidine
50
Pyrene
10
p-Dimethylaminoazobenzene
10
Butylbenzylphthalate
10
Bis(2-ethylhexyl)phthalate
10

Page 11 of 18
Table II-5 (Cont’d) Semivolatile Parameters
COMPOUNDS
PQL (ppb)
3,3'-Dichlorobenzidine
20
Benzo(a)anthracene
10
Chrysene
10
Di-n-octylphthalate
10
7,12-Dimetnylbenz(a)anthracine
10
Benzo(b)fluoranthene
10
Benzo(k)fluoranthene
10
Benzo(a)pyrene
10
3-Methylcholanthrene
10
Dibenz(a,j)acridine
10
Indeno(1,2,3-cd)pyrene
10
Dibenz(a,h)anthracene
10
Benzo(g,h,i)perylene
10
Napthalene
10
4-Chloroaniline
10
2,6-Dichlorophenol
10
Hexachlorobutadiene
10
N-Nitrose-di-n-butylamine
10
4-Chloro-3-methylphenol
20
2-Methylnapthalene
10
Hexachlorocyclopentadiene
10
1,2,4,5-Tetrachlorobenzene
10
2,4,6-Trichlorophenol
10
2,4,5-Trichlorophenol
10
2-Chloronapthalene
10
1-Chloronapthalene
10
2-Nitroaniline
50
Dimethylphthalate
10
2,6-Dinitrotoluene
10
Acenaphthylene
10
3-Nitroaniline
50
4-Nitrophenol
50
2,4-Dinitrophenol
50
Acenaphthene
10
Page 12 of 18
Table II-5 (Cont’d) Semivolatile Parameters
COMPOUNDS
PQL (ppb) 2,4-Dinitrotoluene
10
Pentachlorobenzene
10
Dibenzofuran
10
1-Naphthylamine
10
Diethylphthalate
10
2,3,4,6-Tetrachlorophenol
10
2-Naphthylamine
10
4-Chlorophenyl phenyl ether
10
4-Nitroaniline
50
Fluorene
10
4,6-Dinitro-2-methylphenol
50
4-Aminobiphenyl
20
1,2-Diphenylhydrazine
10
Phenacetin
20
4-Bromophenyl phenyl ether
10
Hexachlorobenzene
10
Pronamide
10
N-Nitrosodiphenylamine/Diphenylamine
10
Pentachlorophenol
50
Pentachloronitrobenzene
20
Phenathrene
10
Anthracene
10
Di-n-butylphthalate
10
Fluoranthene
10

Page 13 of 18
Table II-6 List of Pesticide and PCB Analytical Parameters BASELINE MONITORING PROJECT
SEMIVOLATILE ORGANICS BY EPA METHOD 8270 COMPOUNDS
PQL (ppb) Alpha BHC
2
Beta BHC
2
Gamma BHC
2
Delta BHC
2
Heptachlor
2
Aldrin
2
Heptachlor epoxide
2
Chlordane
2
Endosulfan I
2
4,4'-DDE
2
Dieldrin
2
4,4'DDD
2
Endrin
2
Toxaphene
2
Endosulfan II
2
Endrin Aldehyde
2
4,4'DDT
2
Endosulfan Sulfate
2
Methoxychlor
2
Endrin Ketone
2
SEMIVOLATILE ORGANICS BY EPA METHOD 8270 COMPOUNDS
PQL (ppb)
PCB 1221/ PCB 1232 10
PCB 1016/ PCB 12342 10
PCB 1254 10
PCB 1248 10
PCB 1260 10
Page 14 of 18
Figure II-1 Location Plat, Chicot Equivalent Aquifer System
ACADIA
ALLEN
ASCENSION
ASSUMPTION
AVOYELLES
BEAUREGARD
BIENVILLE
BOSSIERCADDO
CALCASIEU
CALDWELL
CAMERON
CATAHOULA
CLAIBORNE
CONCORDIA
DE SOTO
EAST BATON ROUGE
EAST CARROLL
EAST FELICIANA
EVANGELINE
FRANKLIN
GRANT
IBERIA
IBERVILLE
JACKSON
JEFFERSON
JEFFERSON DAVIS
LAFAYETTE
LAFOURCHE
LA SALLE
LINCOLN
LIVINGSTON
MADISON
MOREHOUSE
NATCHITOCHES
ORLEANS
OUACHITA
PLAQUEMINES
POINTE COUPEE
RAPIDES
RED RIVER
RICHLAND
SABINE
ST. BERNARD
ST. CHARLES
ST. HELENA
ST. JAMES
ST. JOHN THE BAPTIS
ST. LANDRY
ST. MARTIN
ST. MARY
ST. TAMMANY
TANGIPAHOA
TENSAS
TERREBONNE
UNION
VERMILION
VERNON
WASHINGTON
WEBSTER
WEST BATON ROUGE
WEST CARROLL
WINN
WEST FELICIANA
BASELINE MONITORING PROJECT WELLSOF THE CHICOT EQUIVALENT AQUIFER SYSTEM
Chicot Equivalent Aquifer System (6800 sq. mi.)
1999/2000 Project Wells (24 wells)
Aquifer boundary digitized from Louisiana Hydrologic Map No. 2: Areal Extent of Freshwater in Major Aquifers of Louisiana.
Smoot, 1988; USGS/LDOTD Report 86-4150
AN-266
AN-333
EB-1231
EB-34
EB-991B
EF-184
JF-28
LI-5477Z
LI-85
OR-61
SC-179
SH-77
SJ-226
SJB-175
ST-5245Z
TA-520 WA-5295Z
WA-5311Z
AN-296
AN-316
AN-321AN-337
AN-500
AN-6297Z
Page 15 of 18
Figure II-2 Map of pH Data
6.84
7.23
7.74
5.88
8.31
8.06
8.17
8.32
8.01
5.87
7.53 7.55
5.55
5.36
5.93
5.56
EB-1231
EB-34
EB-991B
EF-184
JF-28
LI-5477Z
LI-85
OR-61
SC-179
SH-77
SJ-226 SJB-175
ST-5245Z
TA-520
WA-5295Z
WA-5311Z
7.70
7.97
7.99 8.30
7.77
9.26
AN-296
AN-316
AN-321 AN-337
AN-500
AN-6297Z
7.53 - pH Value (Standard Units) Contour Interval = 0.5 SUProject Well Location SJ-266 - Well Designation
CHICOT EQUIVALENT AQUIFER SYSTEM - pH (SU)
Baseline Monitoring Project, FY1999-2000
Page 16 of 18
Figure II-3 Map of TDS Data
53.3 45.3
40.7
38.7
50.746.7
223.0
149.0
202.0
392.0
214.0 369.9
266.0
544.0 948.0
1004.0880.0
540.0
EF-184 SH-77
TA-520
WA-5311Z
WA-5295ZST-5245Z
EB-34
EB-1231
EB-991B
AN-333
AN-266 LI-85
LI-5477Z
SJ-226 SJB-175
SC-179JF-28
OR-61
795.9349.9
795.9 244.0
571.7
1267.0
AN-296AN-500
AN-321 AN-337
AN-316
AN-6297Z
544.0 - TDS Value (parts per million) Contour Interval = 200 ppmProject Well Location SJ-266 - Well Designation
CHICOT EQUIVALENT AQUIFER SYSTEM - TDS (PPM)
Baseline Monitoring Project, FY1999-2000

Page 17 of 18
Figure II-4 Map of Chloride Data
5.00 3.30
3.00
3.50
3.005.20
7.58
32.11
3.63
107.51
12.42 106.20
8.51
144.00 298.00
304.00237.00
75.90
EF-184 SH-77
TA-520
WA-5311Z
WA-5295ZST-5245Z
EB-34
EB-1231
EB-991B
AN-333
AN-266 LI-85
LI-5477Z
SJ-226 SJB-175
SC-179JF-28
OR-61
214.084.6
375.0 26.4
218.5
729.0
AN-296AN-500
AN-321 AN-337
AN-316
AN-6297Z
298.00 - Chloride Value (parts per million) Contour Interval = 100 ppmProject Well Location SJ-266 - Well Designation
CHICOT EQUIVALENT AQUIFER SYSTEM - CHLORIDE (PPM)
Baseline Monitoring Project, FY1999-2000
Page 18 of 18
Figure II-5 Map of Iron Data
5.00 600.30
10.40
70.00
9.502049.00
209.00
28.70
165.00
33.00
165.00 77.00
77.00
652.80 477.00
234.40115.00
98.00
EF-184 SH-77
TA-520
WA-5311Z
WA-5295ZST-5245Z
EB-34
EB-1231
EB-991B
AN-333
AN-266 LI-85
LI-5477Z
SJ-226 SJB-175
SC-179JF-28
OR-61
491.0045.60
251.00 41.80
113.40
733.70
AN-296AN-500
AN-321 AN-337
AN-316
AN-6297Z
477.00 - Iron Value (parts per billion) Contour Interval = 200 ppbProject Well Location SJ-266 - Well Designation
CHICOT EQUIVALENT AQUIFER SYSTEM - IRON (PPB)
Baseline Monitoring Project, FY1999-2000
Related Documents