1 Updated on October 14, 2020 This is the Title of Example My APA Paper Megan A. Sumeracki Psychology Department, Rhode Island College Psyc 477: Research Methods III Professor Jane Doe Oct. 14, 2020 APA is now flexible with regard to font and size. Typical fonts include Times New Roman (12pt) and Arial (11pt or 12pt).Use 1 inch margins on all sides of the page. Double space your paper AND make sure to remove any extra spaces between paragraphs. To do this, go to Format, then Paragraph. Where it says “Spacing” put 0s in the “Before” and “After” boxes. Change line spacing to “double.” This is an example of a student title page. Note, if your professor gives you specific instructions, follow those. If you are a professional, you will need to look up what is needed for an author note and running head. You will not need the course information. Put 3 returns (lines) above the title of your paper. Put 2 returns (lines) in between the title of the paper and the author name(s). Include the page number. you can do this by clicking “Page #” in the header/footer menu of Microsoft Word.

Welcome message from author
This document is posted to help you gain knowledge. Please leave a comment to let me know what you think about it! Share it to your friends and learn new things together.
Transcript
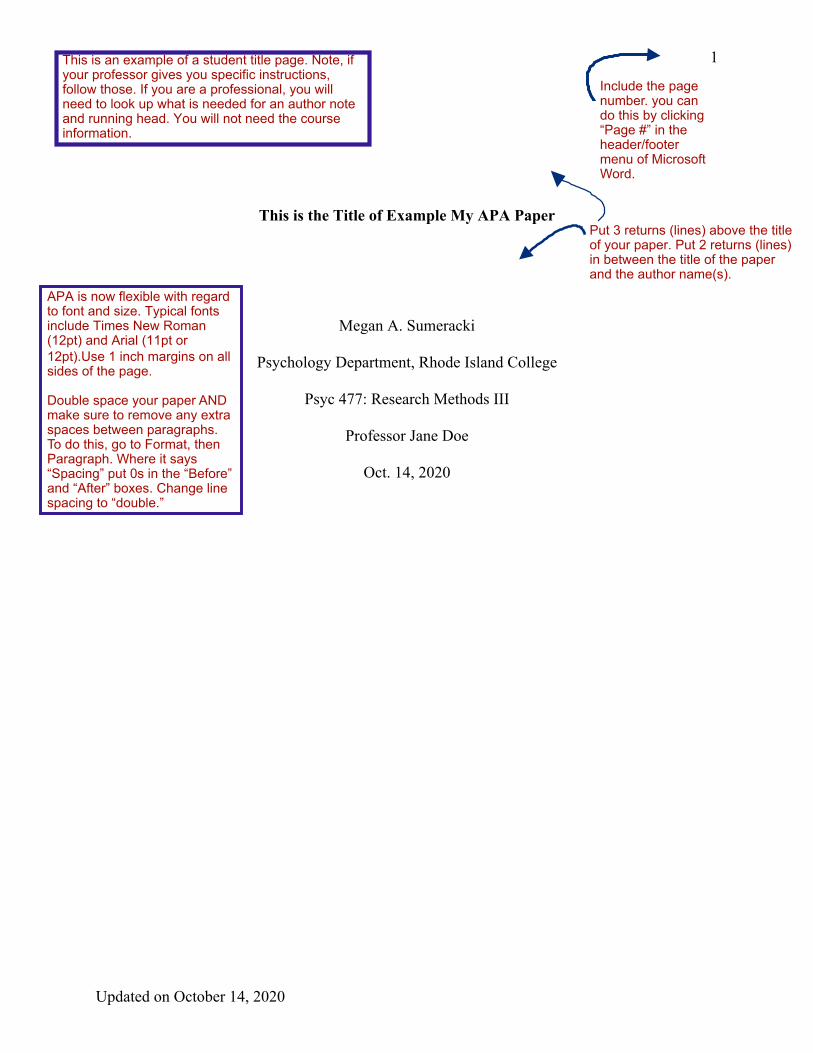
1
Updated on October 14, 2020
This is the Title of Example My APA Paper
Megan A. Sumeracki
Psychology Department, Rhode Island College
Psyc 477: Research Methods III
Professor Jane Doe
Oct. 14, 2020
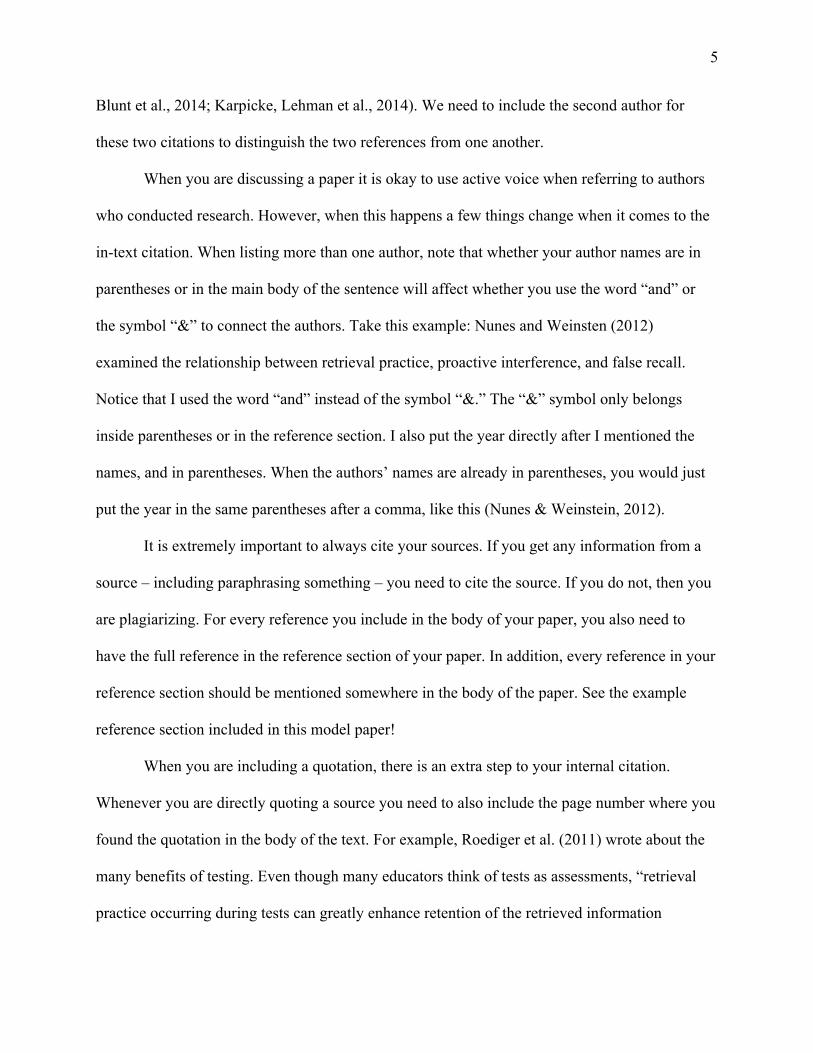
APA is now flexible with regard to font and size. Typical fonts include Times New Roman (12pt) and Arial (11pt or 12pt).Use 1 inch margins on all sides of the page.
Double space your paper AND make sure to remove any extra spaces between paragraphs. To do this, go to Format, then Paragraph. Where it says “Spacing” put 0s in the “Before” and “After” boxes. Change line spacing to “double.”
This is an example of a student title page. Note, if your professor gives you specific instructions, follow those. If you are a professional, you will need to look up what is needed for an author note and running head. You will not need the course information.
Put 3 returns (lines) above the title of your paper. Put 2 returns (lines) in between the title of the paper and the author name(s).
Include the page number. you can do this by clicking “Page #” in the header/footer menu of Microsoft Word.
2
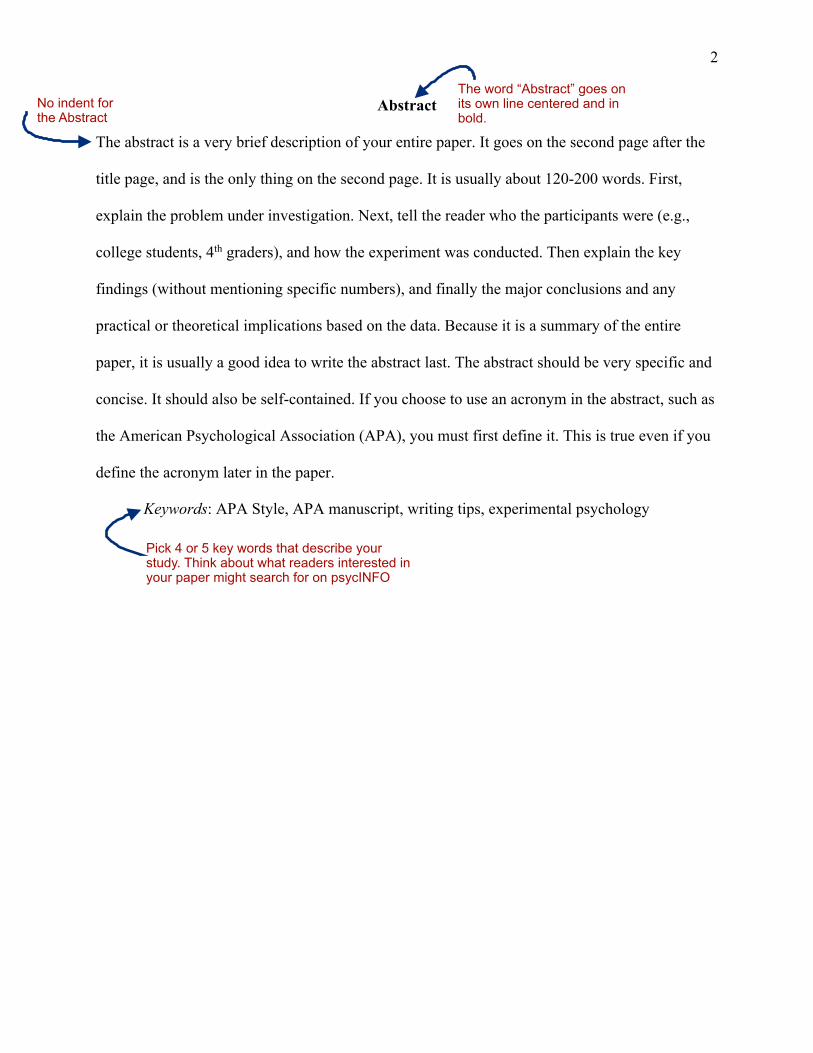
Abstract
The abstract is a very brief description of your entire paper. It goes on the second page after the
title page, and is the only thing on the second page. It is usually about 120-200 words. First,
explain the problem under investigation. Next, tell the reader who the participants were (e.g.,
college students, 4th graders), and how the experiment was conducted. Then explain the key
findings (without mentioning specific numbers), and finally the major conclusions and any
practical or theoretical implications based on the data. Because it is a summary of the entire
paper, it is usually a good idea to write the abstract last. The abstract should be very specific and
concise. It should also be self-contained. If you choose to use an acronym in the abstract, such as
the American Psychological Association (APA), you must first define it. This is true even if you
define the acronym later in the paper.
No indent for the Abstract
The word “Abstract” goes on its own line centered and in bold.
Keywords: APA Style, APA manuscript, writing tips, experimental psychology
Pick 4 or 5 key words that describe your study. Think about what readers interested in your paper might search for on psycINFO
3
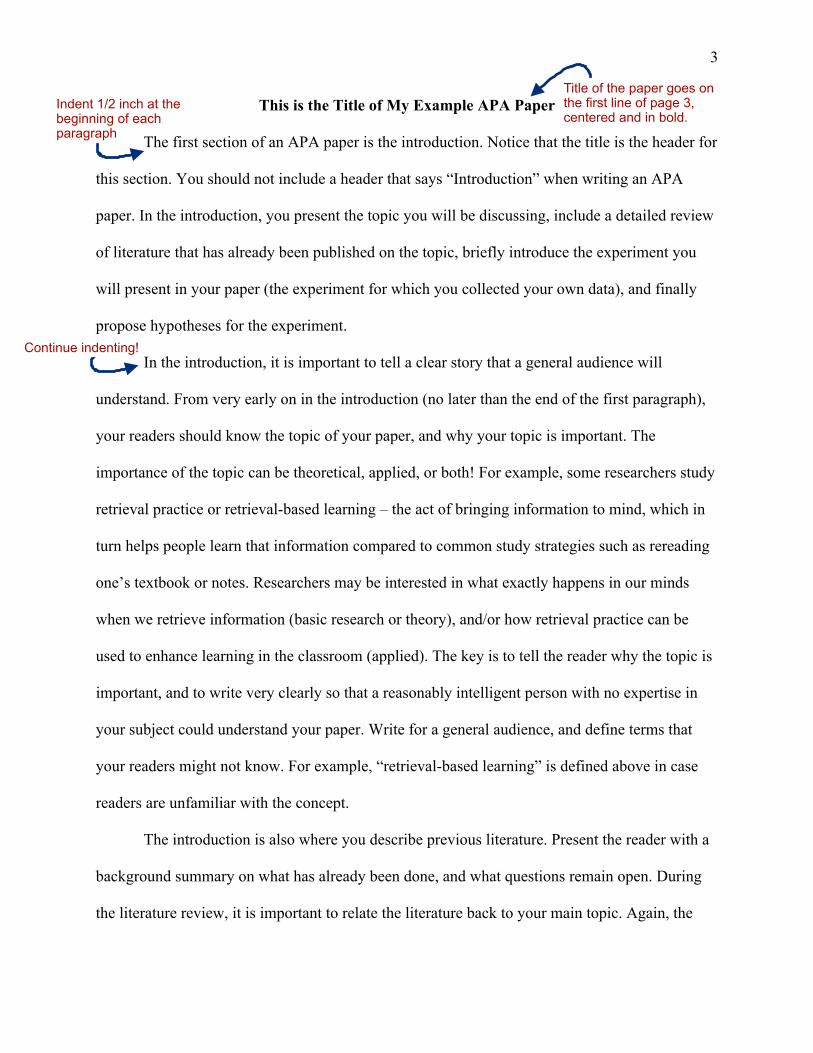
This is the Title of My Example APA Paper
The first section of an APA paper is the introduction. Notice that the title is the header for
this section. You should not include a header that says “Introduction” when writing an APA
paper. In the introduction, you present the topic you will be discussing, include a detailed review
of literature that has already been published on the topic, briefly introduce the experiment you
will present in your paper (the experiment for which you collected your own data), and finally
propose hypotheses for the experiment.
In the introduction, it is important to tell a clear story that a general audience will
understand. From very early on in the introduction (no later than the end of the first paragraph),
your readers should know the topic of your paper, and why your topic is important. The
importance of the topic can be theoretical, applied, or both! For example, some researchers study
retrieval practice or retrieval-based learning – the act of bringing information to mind, which in
turn helps people learn that information compared to common study strategies such as rereading
one’s textbook or notes. Researchers may be interested in what exactly happens in our minds
when we retrieve information (basic research or theory), and/or how retrieval practice can be
used to enhance learning in the classroom (applied). The key is to tell the reader why the topic is
important, and to write very clearly so that a reasonably intelligent person with no expertise in
your subject could understand your paper. Write for a general audience, and define terms that
your readers might not know. For example, “retrieval-based learning” is defined above in case
readers are unfamiliar with the concept.
The introduction is also where you describe previous literature. Present the reader with a
background summary on what has already been done, and what questions remain open. During
the literature review, it is important to relate the literature back to your main topic. Again, the
paragraph
Indent 1/2 inch at the beginning of each
Title of the paper goes on the first line of page 3, centered and in bold.
Continue indenting!
4
introduction should tell a story. Avoid starting paragraphs with “Now I will tell you about what
Author and Writer (2015) did” or “Author and Writer (2015) did xyz” without explaining how
the literature is related to your overall topic. A good rule of thumb is to start each paragraph with
a topic sentence that describes what the paragraph will be about. Then, the last sentence of the
paragraph should link the information presented in the paragraph back to the main topic of your
paper. If you are having trouble, try having a friend read the first and last sentences of each
paragraph in your introduction, and then ask them to describe the introduction to you. If they can
clearly understand and explain the story you are trying to tell in your introduction, then you are
probably in good shape. If they are confused, missing key elements of the introduction, or feel
the introduction is disorganized, then you need to work on your topic sentences and the clarity of
your story.
It is important to understand how to appropriately cite sources in your introduction, and
throughout the rest of your paper. When you cite a source within the body of your paper, it is
sometimes referred to as an internal or in-text citation. If there is only one author (e.g., Tulving,
1983), or two authors (e.g., Nunes & Weinstein, 2012), then you always refer to the paper using
one or both authors. If there are 3 or more authors, then you list the first author and then “et al.”
after the first author to represent the remaining authors. For example Dunlosky et al. (2013) has
five authors, and so only the name Dunlosky is written and et al. follows. The year is always
included, as usual. The rules used to be a lot more complicated with regard to how authors were
listed. However, in the 7th edition if there are three or more authors, you can almost always use et
al. throughout. The only time you will list more authors is if leaving all authors out would create
ambiguity. For example, pretend that in our paper we need the following two citations (Karpicke,
5
Blunt et al., 2014; Karpicke, Lehman et al., 2014). We need to include the second author for
these two citations to distinguish the two references from one another.
When you are discussing a paper it is okay to use active voice when referring to authors
who conducted research. However, when this happens a few things change when it comes to the
in-text citation. When listing more than one author, note that whether your author names are in
parentheses or in the main body of the sentence will affect whether you use the word “and” or
the symbol “&” to connect the authors. Take this example: Nunes and Weinsten (2012)
examined the relationship between retrieval practice, proactive interference, and false recall.
Notice that I used the word “and” instead of the symbol “&.” The “&” symbol only belongs
inside parentheses or in the reference section. I also put the year directly after I mentioned the
names, and in parentheses. When the authors’ names are already in parentheses, you would just
put the year in the same parentheses after a comma, like this (Nunes & Weinstein, 2012).
It is extremely important to always cite your sources. If you get any information from a
source – including paraphrasing something – you need to cite the source. If you do not, then you
are plagiarizing. For every reference you include in the body of your paper, you also need to
have the full reference in the reference section of your paper. In addition, every reference in your
reference section should be mentioned somewhere in the body of the paper. See the example
reference section included in this model paper!
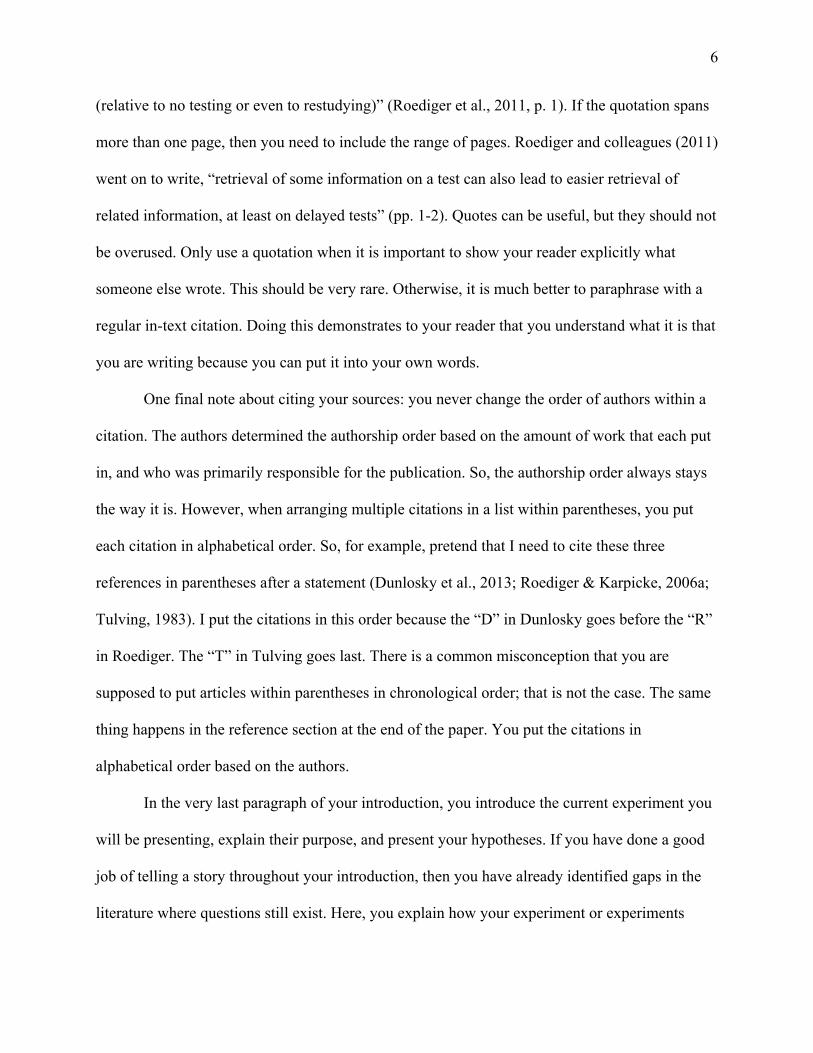
When you are including a quotation, there is an extra step to your internal citation.
Whenever you are directly quoting a source you need to also include the page number where you
found the quotation in the body of the text. For example, Roediger et al. (2011) wrote about the
many benefits of testing. Even though many educators think of tests as assessments, “retrieval
practice occurring during tests can greatly enhance retention of the retrieved information
6
(relative to no testing or even to restudying)” (Roediger et al., 2011, p. 1). If the quotation spans
more than one page, then you need to include the range of pages. Roediger and colleagues (2011)
went on to write, “retrieval of some information on a test can also lead to easier retrieval of
related information, at least on delayed tests” (pp. 1-2). Quotes can be useful, but they should not
be overused. Only use a quotation when it is important to show your reader explicitly what
someone else wrote. This should be very rare. Otherwise, it is much better to paraphrase with a
regular in-text citation. Doing this demonstrates to your reader that you understand what it is that
you are writing because you can put it into your own words.
One final note about citing your sources: you never change the order of authors within a
citation. The authors determined the authorship order based on the amount of work that each put
in, and who was primarily responsible for the publication. So, the authorship order always stays
the way it is. However, when arranging multiple citations in a list within parentheses, you put
each citation in alphabetical order. So, for example, pretend that I need to cite these three
references in parentheses after a statement (Dunlosky et al., 2013; Roediger & Karpicke, 2006a;
Tulving, 1983). I put the citations in this order because the “D” in Dunlosky goes before the “R”
in Roediger. The “T” in Tulving goes last. There is a common misconception that you are
supposed to put articles within parentheses in chronological order; that is not the case. The same
thing happens in the reference section at the end of the paper. You put the citations in
alphabetical order based on the authors.
In the very last paragraph of your introduction, you introduce the current experiment you
will be presenting, explain their purpose, and present your hypotheses. If you have done a good
job of telling a story throughout your introduction, then you have already identified gaps in the
literature where questions still exist. Here, you explain how your experiment or experiments
7
attempted to answer those questions, or at least portions of the questions. It is tempting to write
this section in the future tense, because the experiment is about to be presented, but this section
does need to be written in the past tense – since the experiment has already been carried out from
the reader’s perspective. When you have described the purpose of the current work, you can
briefly describe the method for the experiment. Do not include too much detail, as you want to
save the specifics for the method section. In this paragraph you give the reader a taste of your
methods, and give them enough information so that they understand your hypotheses.
Remember: your hypotheses should be based on the previous literature.
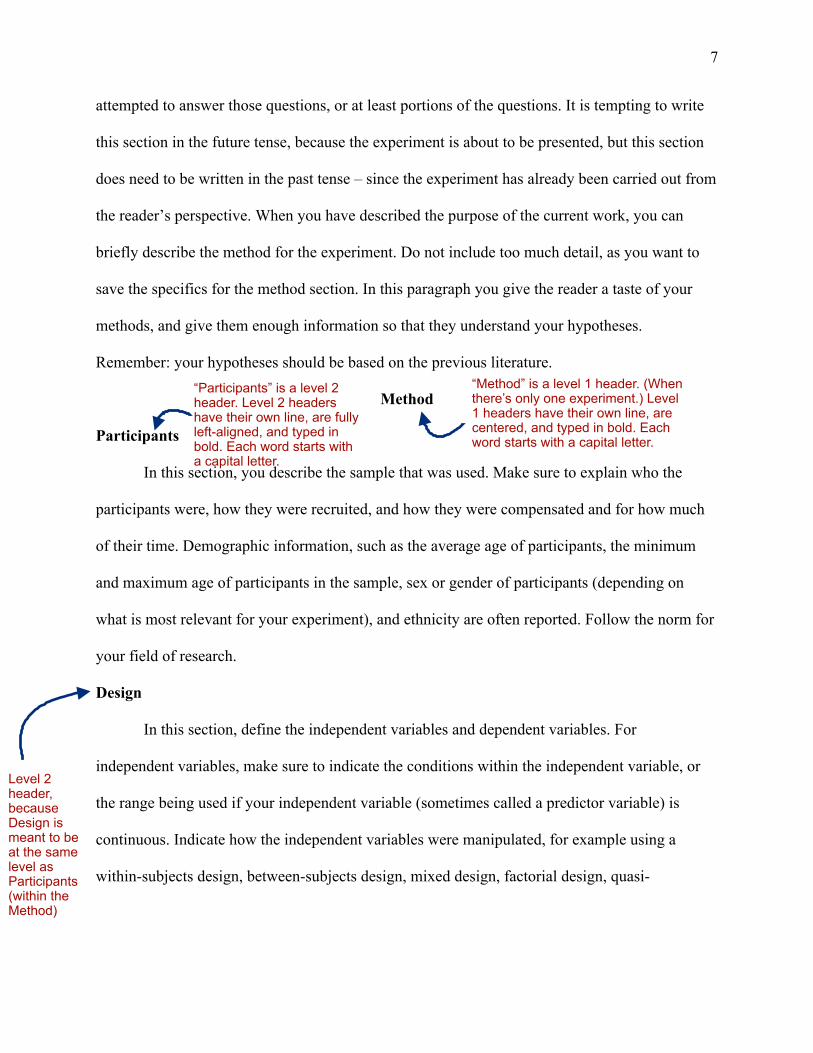
Method
Participants
In this section, you describe the sample that was used. Make sure to explain who the
participants were, how they were recruited, and how they were compensated and for how much
of their time. Demographic information, such as the average age of participants, the minimum
and maximum age of participants in the sample, sex or gender of participants (depending on
what is most relevant for your experiment), and ethnicity are often reported. Follow the norm for
your field of research.
Design
In this section, define the independent variables and dependent variables. For
independent variables, make sure to indicate the conditions within the independent variable, or
the range being used if your independent variable (sometimes called a predictor variable) is
continuous. Indicate how the independent variables were manipulated, for example using a
within-subjects design, between-subjects design, mixed design, factorial design, quasi-
“Method” is a level 1 header. (When there’s only one experiment.) Level 1 headers have their own line, are centered, and typed in bold. Each word starts with a capital letter.
“Participants” is a level 2 header. Level 2 headers have their own line, are fully left-aligned, and typed in bold. Each word starts with a capital letter.
Level 2 header, because Design is meant to be at the same level as Participants (within the Method)
8
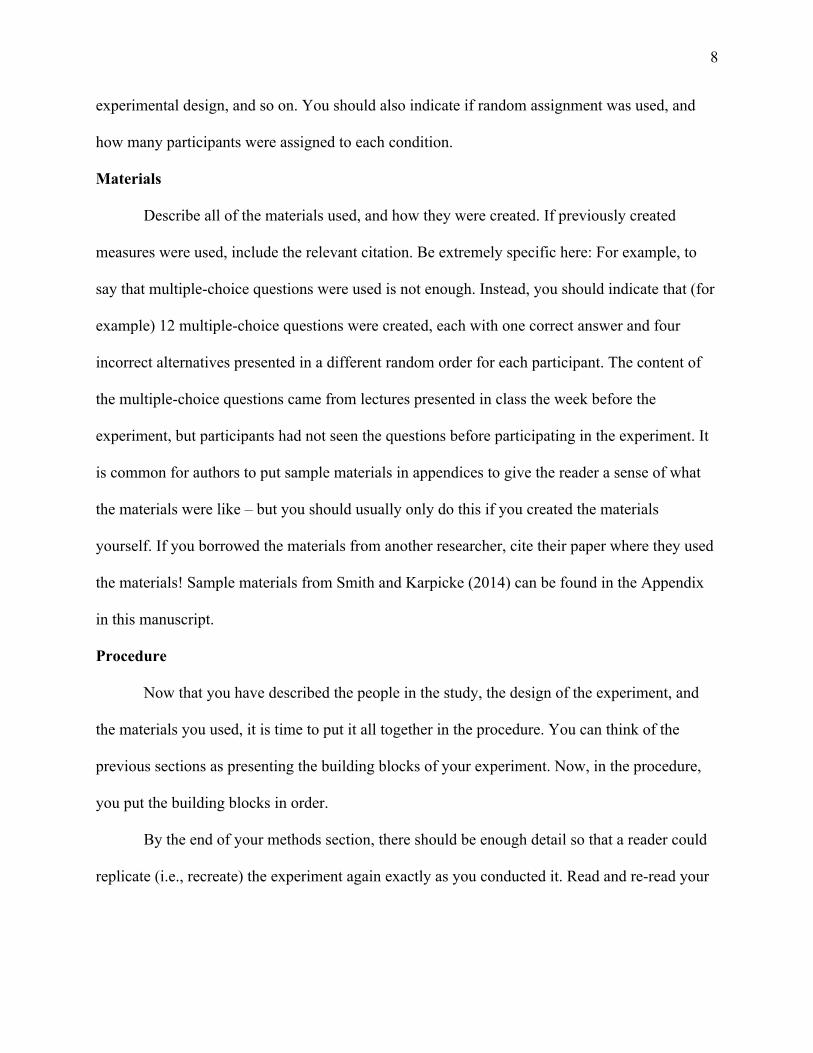
experimental design, and so on. You should also indicate if random assignment was used, and
how many participants were assigned to each condition.
Materials
Describe all of the materials used, and how they were created. If previously created
measures were used, include the relevant citation. Be extremely specific here: For example, to
say that multiple-choice questions were used is not enough. Instead, you should indicate that (for
example) 12 multiple-choice questions were created, each with one correct answer and four
incorrect alternatives presented in a different random order for each participant. The content of
the multiple-choice questions came from lectures presented in class the week before the
experiment, but participants had not seen the questions before participating in the experiment. It
is common for authors to put sample materials in appendices to give the reader a sense of what
the materials were like – but you should usually only do this if you created the materials
yourself. If you borrowed the materials from another researcher, cite their paper where they used
the materials! Sample materials from Smith and Karpicke (2014) can be found in the Appendix
in this manuscript.
Procedure
Now that you have described the people in the study, the design of the experiment, and
the materials you used, it is time to put it all together in the procedure. You can think of the
previous sections as presenting the building blocks of your experiment. Now, in the procedure,
you put the building blocks in order.
By the end of your methods section, there should be enough detail so that a reader could
replicate (i.e., recreate) the experiment again exactly as you conducted it. Read and re-read your
9
procedure to make sure that no details are missing. It is best to write a draft of the procedure very
shortly after you have conducted the experiment so that you do not forget any of the details.
Scoring
For most research, the data need to be processed in some way before they can be
analyzed. For example, in learning and memory research, test data need to be scored. It is
customary to explain exactly how the data were scored in the method section of the paper, or
sometimes at the beginning of the results section. For example, to score participants’ answers to
short-answer questions, a researcher might give 0 points for incorrect or missing responses, 0.5
points for partially correct responses, and 1 point for correct responses. To score free recall data,
a researcher might split a passage into idea units and give one point for every idea unit correctly
recalled. Whatever the method, it should be described in detail here. You can find examples in
papers already published in your area. For learning and memory examples, see Roediger and
Karpicke (2006a) or Smith and Karpicke (2014).
Results
The first step is to mention any Tables or Figures that describe your data. Tables and
Figures go on their own pages at the end of the paper, after the reference section but before any
Appendices. You can find examples of Tables and Figures at the end of this paper. However, you
still need to direct your reader to the Tables and Figures. You might first say: Data from the final
assessment test are shown in Figure 1; or overall confidence during the initial learning session is
shown in Table 1. Tables and Figures are easy ways to present your descriptive statistics (i.e.,
means, standard deviations or standard errors). Then, describe the analyses you ran in order to
make inferences about your data. You should have run analyses that tested your hypotheses.
Always tell the reader what test you ran, and describe in words what the test found. You can then
Level 1 header, because Results is meant to be at the same level as the Method section
10
support your statement using the test statistics with degrees of freedom, p-values, and effect
sizes.
Here is a simple example: We ran a paired-samples t-test to test whether overt and covert
retrieval practice led to different levels of initial confidence during learning. The test indicated
that when students were in the experimental group, their recall was higher than when they were
in the control group, t(116) = 4.00, p < .05, d = 0.75, 95% CI [0.37, 1.12]. We also ran a paired-
samples t-test to determine whether there were any differences between the experimental group
and the control group on their judgments of how much they had learned. Results showed the two
groups did not differ, t(124) = 0.77, p = .44 d = 0.14, 95% CI [-0.21, 0.49].
Here are a few tips when writing your results section. First, always present all of the
analyses you ran, even if you did not find sufficient evidence to support hypotheses. Second,
always describe what the statistics actually mean in plain language, and then include the
statistical values. You can think of the statistics themselves as references. When you make a
claim, such as retrieval practice improves learning (Roediger & Karpicke, 2006b) you include a
reference to tell the reader where you are getting the information. However, when you presenting
your own data, there is no reference to cite. Instead, you collected data and you are analyzing
your own data to make claims. Think of the statistics as citations to tell the reader where you are
getting the information to make a claim. Third, conditions cannot do things; people in conditions
can do things. You want to avoid sentences like “the short-answer condition performed better
than the study-only condition,” and instead write, “participants in the short-answer condition
performed better than did those in the study-only condition.” Make sure your description of the
results reflects the way you manipulated the independent variable. The example just mentioned
suggests a between-subjects design, because two groups of participants are mentioned. For a
11
within-subjects design, you could say, “participants performed better in the short-answer
condition than in the study-only condition.” No matter what the design, make sure Finally,
remember data are plural. Make sure your subject and verb agree in your sentences.
Discussion
Now that the results have been presented in detail in the results section, you will need to
briefly describe them again at the beginning of the discussion. How do you make sure this
section does not repeat the Results? Well, it needs to be less technical and more of a summary.
Start with the most important results first. In the discussion statistics should not be presented;
instead, simply describe the results clearly in words. Link the results back to your hypotheses,
indicating which ones were supported by your data.
Then, it is time to go beyond the data. Did your data support your hypotheses? Why or
why not? Explain what the results mean, for theory, application, or both. It is also important to
make links back to previous literature (and of course provide the appropriate in-text citations).
The general discussion is also the place where you discuss limitations of your research (every
experiment has at least a few limitations), present new hypotheses, and discuss directions for
future research. For each limitation, explain why it is a problem and how it could be addressed in
future research. Finally, the last paragraph of the discussion should be the main takeaway
message from your paper.
Hopefully, this resource helps you write your APA manuscript. It is important to
understand what information goes in each section, and how to format each section. There are
many other resources available to help you write your APA manuscript as well. Landrum’s
(2013) book on Undergraduate writing is an excellent resource. I particularly recommend the
first chapter about telling your scientific story. . You can also find answers to any questions you
Level 1 header
12
have about APA format in the 7th edition of the APA Publication Manual (American
Psychological Association, 2020). The Purdue Online Writing Lab (OWL; 2020) includes many
writing tips and updated information about APA format (as well as MLA and CMS formats).
You can find the URL in the reference section of this paper.
13
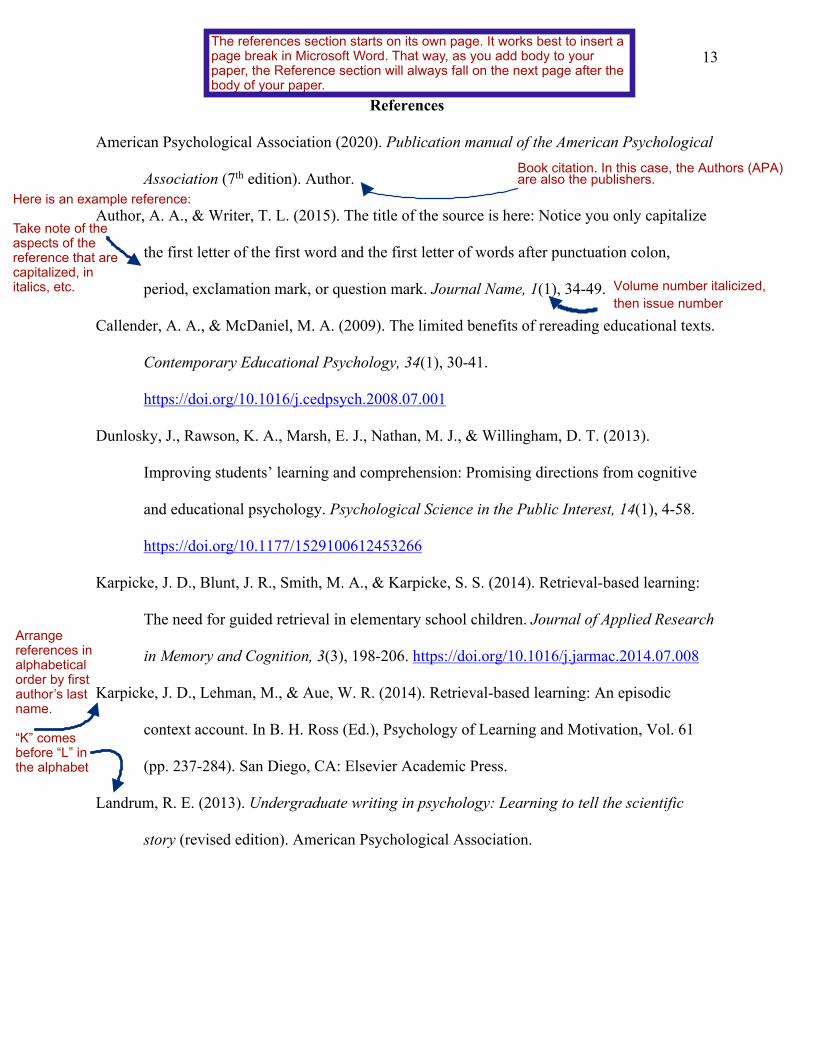
References
American Psychological Association (2020). Publication manual of the American Psychological
Association (7th edition). Author.
Author, A. A., & Writer, T. L. (2015). The title of the source is here: Notice you only capitalize
the first letter of the first word and the first letter of words after punctuation colon,
period, exclamation mark, or question mark. Journal Name, 1(1), 34-49.
Callender, A. A., & McDaniel, M. A. (2009). The limited benefits of rereading educational texts.
Contemporary Educational Psychology, 34(1), 30-41.
https://doi.org/10.1016/j.cedpsych.2008.07.001
Dunlosky, J., Rawson, K. A., Marsh, E. J., Nathan, M. J., & Willingham, D. T. (2013).
Improving students’ learning and comprehension: Promising directions from cognitive
and educational psychology. Psychological Science in the Public Interest, 14(1), 4-58.
https://doi.org/10.1177/1529100612453266
Karpicke, J. D., Blunt, J. R., Smith, M. A., & Karpicke, S. S. (2014). Retrieval-based learning:
The need for guided retrieval in elementary school children. Journal of Applied Research
in Memory and Cognition, 3(3), 198-206. https://doi.org/10.1016/j.jarmac.2014.07.008
Karpicke, J. D., Lehman, M., & Aue, W. R. (2014). Retrieval-based learning: An episodic
context account. In B. H. Ross (Ed.), Psychology of Learning and Motivation, Vol. 61
(pp. 237-284). San Diego, CA: Elsevier Academic Press.
Landrum, R. E. (2013). Undergraduate writing in psychology: Learning to tell the scientific
story (revised edition). American Psychological Association.
The references section starts on its own page. It works best to insert a page break in Microsoft Word. That way, as you add body to your paper, the Reference section will always fall on the next page after the body of your paper.
Book citation. In this case, the Authors (APA)are also the publishers.
Here is an example reference:
Take note of the aspects of the reference that are capitalized, in italics, etc.
Arrange references in alphabetical order by first author’s last name.
“K” comes before “L” in the alphabet
Volume number italicized, then issue number
14
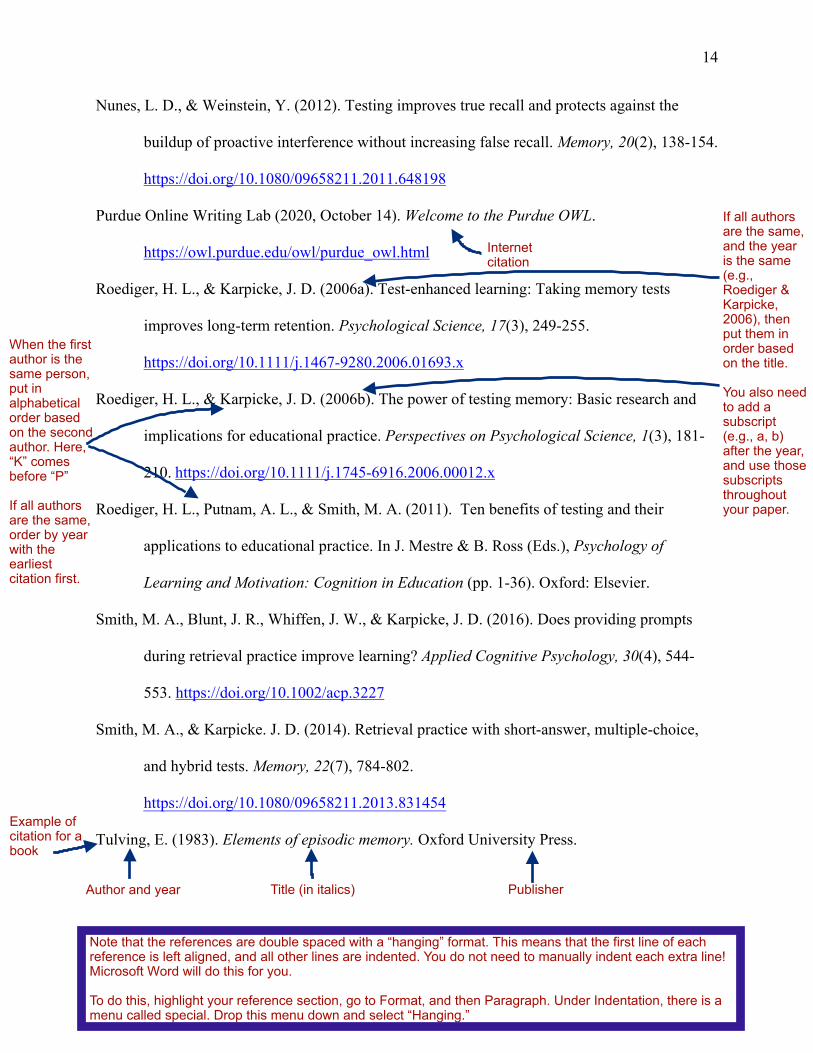
Nunes, L. D., & Weinstein, Y. (2012). Testing improves true recall and protects against the
buildup of proactive interference without increasing false recall. Memory, 20(2), 138-154.
https://doi.org/10.1080/09658211.2011.648198
Purdue Online Writing Lab (2020, October 14). Welcome to the Purdue OWL.
https://owl.purdue.edu/owl/purdue_owl.html
Roediger, H. L., & Karpicke, J. D. (2006a). Test-enhanced learning: Taking memory tests
improves long-term retention. Psychological Science, 17(3), 249-255.
https://doi.org/10.1111/j.1467-9280.2006.01693.x
Roediger, H. L., & Karpicke, J. D. (2006b). The power of testing memory: Basic research and
implications for educational practice. Perspectives on Psychological Science, 1(3), 181-
210. https://doi.org/10.1111/j.1745-6916.2006.00012.x
Roediger, H. L., Putnam, A. L., & Smith, M. A. (2011). Ten benefits of testing and their
applications to educational practice. In J. Mestre & B. Ross (Eds.), Psychology of
Learning and Motivation: Cognition in Education (pp. 1-36). Oxford: Elsevier.
Smith, M. A., Blunt, J. R., Whiffen, J. W., & Karpicke, J. D. (2016). Does providing prompts
during retrieval practice improve learning? Applied Cognitive Psychology, 30(4), 544-
553. https://doi.org/10.1002/acp.3227
Smith, M. A., & Karpicke. J. D. (2014). Retrieval practice with short-answer, multiple-choice,
and hybrid tests. Memory, 22(7), 784-802.
https://doi.org/10.1080/09658211.2013.831454
Tulving, E. (1983). Elements of episodic memory. Oxford University Press.
Internet citation
When the first author is the same person, put in alphabetical order based on the second author. Here, “K” comes before “P”
If all authors are the same, order by year with the earliest citation first.
If all authors are the same, and the year is the same (e.g., Roediger & Karpicke, 2006), then put them in order based on the title.
You also need to add a subscript (e.g., a, b) after the year, and use those subscripts throughout your paper.
Example of citation for a book
Author and year Title (in italics) Publisher
Note that the references are double spaced with a “hanging” format. This means that the first line of each reference is left aligned, and all other lines are indented. You do not need to manually indent each extra line! Microsoft Word will do this for you.
To do this, highlight your reference section, go to Format, and then Paragraph. Under Indentation, there is a menu called special. Drop this menu down and select “Hanging.”
15
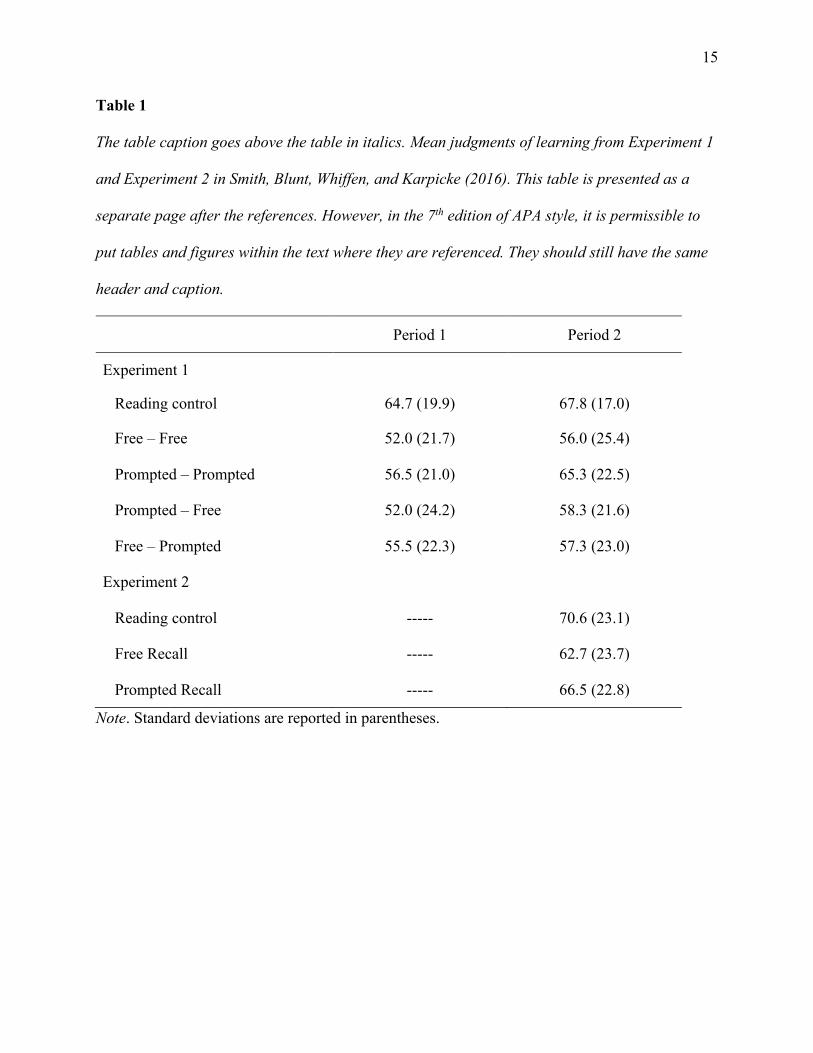
Table 1
The table caption goes above the table in italics. Mean judgments of learning from Experiment 1
and Experiment 2 in Smith, Blunt, Whiffen, and Karpicke (2016). This table is presented as a
separate page after the references. However, in the 7th edition of APA style, it is permissible to
put tables and figures within the text where they are referenced. They should still have the same
header and caption.
Period 1 Period 2
Experiment 1
Reading control 64.7 (19.9) 67.8 (17.0)
Free – Free 52.0 (21.7) 56.0 (25.4)
Prompted – Prompted 56.5 (21.0) 65.3 (22.5)
Prompted – Free 52.0 (24.2) 58.3 (21.6)
Free – Prompted 55.5 (22.3) 57.3 (23.0)
Experiment 2
Reading control ----- 70.6 (23.1)
Free Recall ----- 62.7 (23.7)
Prompted Recall ----- 66.5 (22.8)
Note. Standard deviations are reported in parentheses.
16
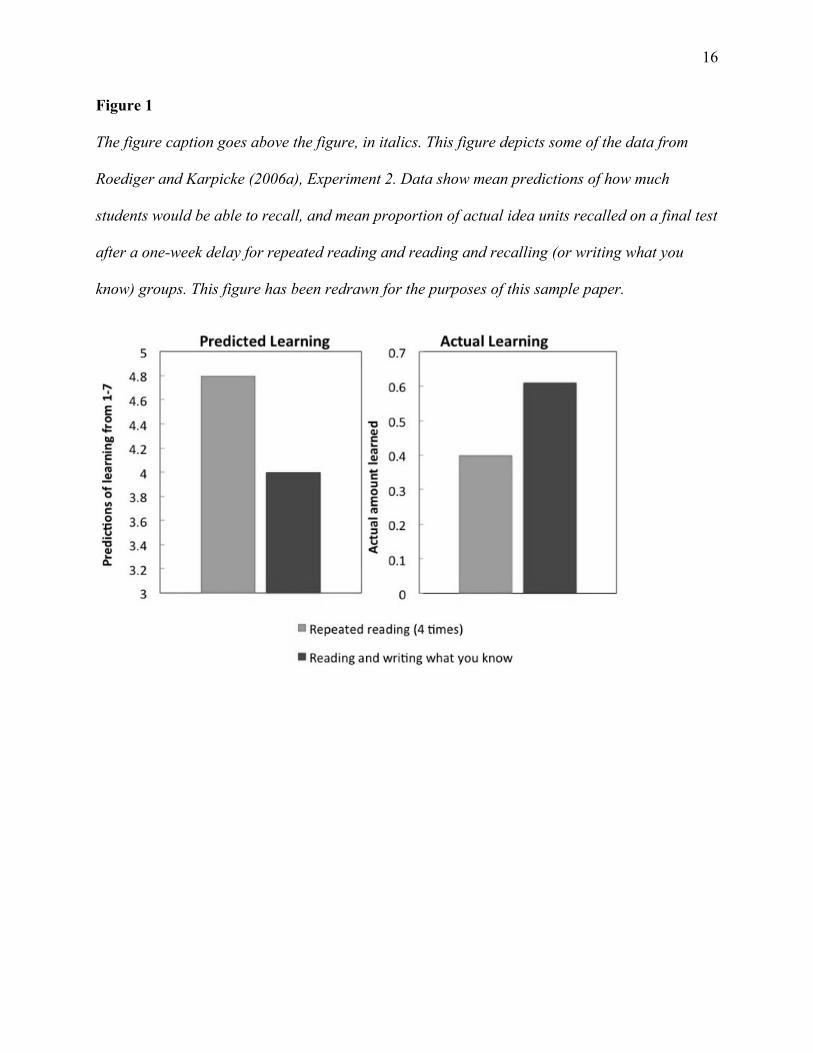
Figure 1
The figure caption goes above the figure, in italics. This figure depicts some of the data from
Roediger and Karpicke (2006a), Experiment 2. Data show mean predictions of how much
students would be able to recall, and mean proportion of actual idea units recalled on a final test
after a one-week delay for repeated reading and reading and recalling (or writing what you
know) groups. This figure has been redrawn for the purposes of this sample paper.
17
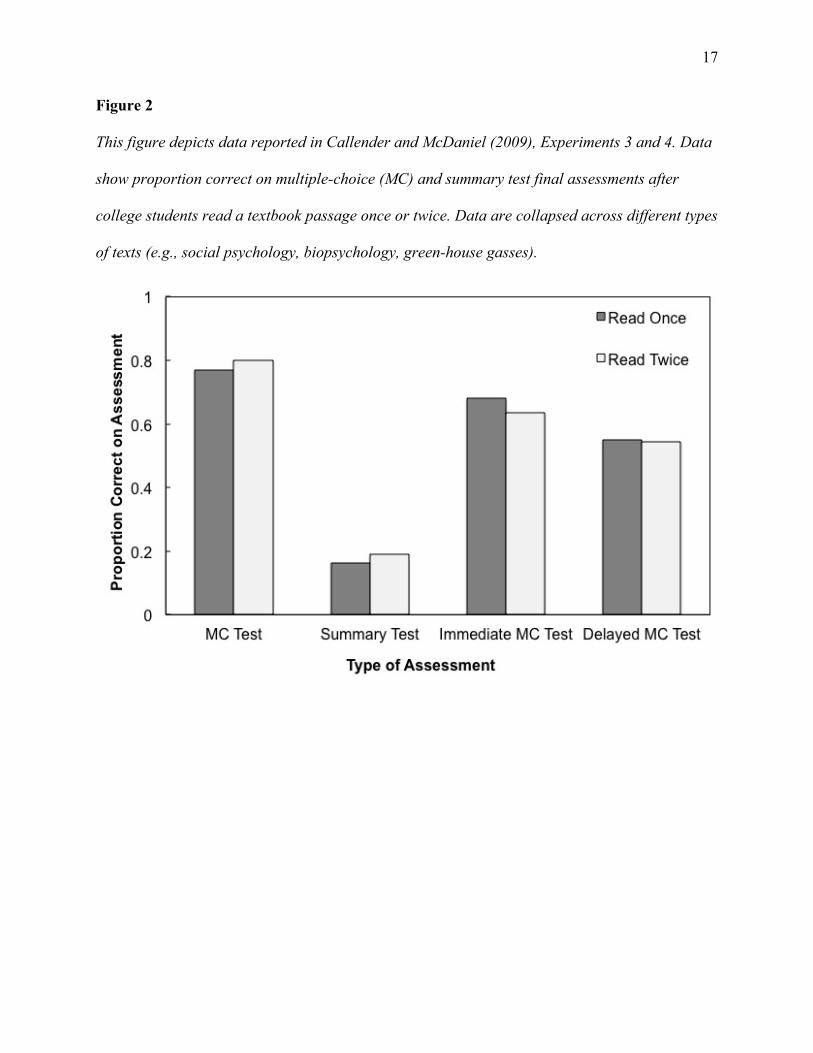
Figure 2
This figure depicts data reported in Callender and McDaniel (2009), Experiments 3 and 4. Data
show proportion correct on multiple-choice (MC) and summary test final assessments after
college students read a textbook passage once or twice. Data are collapsed across different types
of texts (e.g., social psychology, biopsychology, green-house gasses).
18
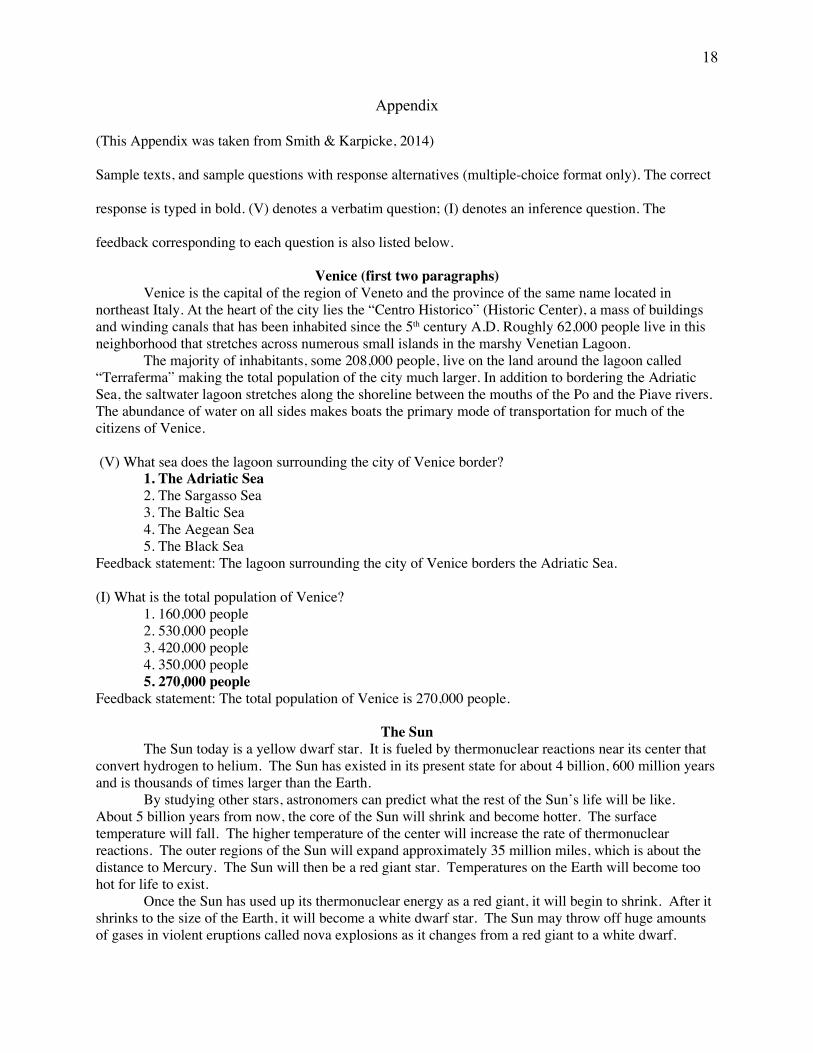
Appendix
(This Appendix was taken from Smith & Karpicke, 2014)
Sample texts, and sample questions with response alternatives (multiple-choice format only). The correct
response is typed in bold. (V) denotes a verbatim question; (I) denotes an inference question. The
feedback corresponding to each question is also listed below.
Venice (first two paragraphs) Venice is the capital of the region of Veneto and the province of the same name located in
northeast Italy. At the heart of the city lies the “Centro Historico” (Historic Center), a mass of buildings and winding canals that has been inhabited since the 5th century A.D. Roughly 62,000 people live in this neighborhood that stretches across numerous small islands in the marshy Venetian Lagoon.
The majority of inhabitants, some 208,000 people, live on the land around the lagoon called “Terraferma” making the total population of the city much larger. In addition to bordering the Adriatic Sea, the saltwater lagoon stretches along the shoreline between the mouths of the Po and the Piave rivers. The abundance of water on all sides makes boats the primary mode of transportation for much of the citizens of Venice.
(V) What sea does the lagoon surrounding the city of Venice border? 1. The Adriatic Sea 2. The Sargasso Sea 3. The Baltic Sea 4. The Aegean Sea 5. The Black Sea Feedback statement: The lagoon surrounding the city of Venice borders the Adriatic Sea. (I) What is the total population of Venice? 1. 160,000 people 2. 530,000 people 3. 420,000 people 4. 350,000 people 5. 270,000 people Feedback statement: The total population of Venice is 270,000 people.
The Sun The Sun today is a yellow dwarf star. It is fueled by thermonuclear reactions near its center that
convert hydrogen to helium. The Sun has existed in its present state for about 4 billion, 600 million years and is thousands of times larger than the Earth. By studying other stars, astronomers can predict what the rest of the Sun’s life will be like. About 5 billion years from now, the core of the Sun will shrink and become hotter. The surface temperature will fall. The higher temperature of the center will increase the rate of thermonuclear reactions. The outer regions of the Sun will expand approximately 35 million miles, which is about the distance to Mercury. The Sun will then be a red giant star. Temperatures on the Earth will become too hot for life to exist. Once the Sun has used up its thermonuclear energy as a red giant, it will begin to shrink. After it shrinks to the size of the Earth, it will become a white dwarf star. The Sun may throw off huge amounts of gases in violent eruptions called nova explosions as it changes from a red giant to a white dwarf.
Related Documents