Number 361 + July 7, 2005 Anthropometric Reference Data for Children and Adults: U.S. Population, 1999–2002 by Margaret A. McDowell, M.P.H., R.D.; Cheryl D. Fryar, M.S.P.H.; Rosemarie Hirsch, M.D.; and Cynthia L. Ogden, Ph.D., Division of Health and Nutrition Examination Surveys Abstract This report presents national anthropometric reference data based on health examination survey results from the National Health and Nutrition Examination Survey (NHANES), 1999–2002, for all ages of the U.S. population (1,2). Weighted population means, standard errors of the means, and selected percentiles are presented for the total U.S. population by sex, race or ethnic group, and age in years or age group. Findings for some population groups are reported in a way that is comparable with results reported from National Health Examination Surveys (NHES) and NHANES conducted between 1960 and 1994 (3–9). These data add to the knowledge about trends in child growth and development and are used to monitor prevalent conditions in the U.S. population such as overweight and obesity (10–13). Keywords: c Anthropometry c Body measures c Nutrition surveys c National Health and Nutrition Examination Survey (NHANES) Introduction The field of anthropometry encompasses a variety of human body measurements, such as weight, height, and size, including circumferences, lengths, breadths, and skinfold thicknesses. Anthropometry is a key component of nutrition status assessment in children and adults (14). Anthropometric data for children reflect general health status, dietary adequacy, and growth and development over time. In adults, body measurement data are used to evaluate health and dietary status, disease risk, and body composition changes that occur over the adult lifespan. This report provides anthropometric reference data for U.S. children and adults of all ages. Methods National Health and Nutrition Examination Surveys are conducted by the National Center for Health Statistics (NCHS), Centers for Disease Control and Prevention. NHANES data are the primary source of body measurement and related health and nutrition data for the civilian noninstitutionalized U.S. population. Surveys were conducted on a periodic basis from 1960 to 1994. NHANES became a continuous survey in 1999. Each annual survey sample is nationally representative; 2 or more years of data are required for subgroup analyses (15,16). NHANES 1999–2002 data were released in two, 2-year data sets. A combined 4-year dataset was used for this report because it provides robust sample sizes and more reliable statistical estimates. Additional 2-year data sets will be released as more data become available. Household interview and health examination methods are used to collect NHANES data. All health examinations are conducted in mobile examination centers (MECs). The MECs provide a standardized environment for the collection of high-quality health data. The MECs are staffed by full-time personnel including health technicians and interviewers, dentists, physicians, dietary interviewers, laboratory technicians, and data managers. All NHANES health technicians complete a comprehensive body measurement training program that uses videotape, demonstration, and practice exercises with an expert examiner. Health technician performance is monitored by means of direct observation, data review, and expert examiner evaluations. Although portions of the health examination component have varied during the survey’s history, much of the U.S. DEPARTMENT OF HEALTH AND HUMAN SERVICES Centers for Disease Control and Prevention National Center for Health Statistics

Welcome message from author
This document is posted to help you gain knowledge. Please leave a comment to let me know what you think about it! Share it to your friends and learn new things together.
Transcript
Number 361 + July 7, 2005
Anthropometric Reference Data for Children and Adults: U.S. Population, 1999–2002
by Margaret A. McDowell, M.P.H., R.D.; Cheryl D. Fryar, M.S.P.H.; Rosemarie Hirsch, M.D.; and Cynthia L. Ogden, Ph.D., Division of Health and Nutrition Examination Surveys
Abstract This report presents national anthropometric reference data based on health
examination survey results from the National Health and Nutrition Examination Survey (NHANES), 1999–2002, for all ages of the U.S. population (1,2). Weighted population means, standard errors of the means, and selected percentiles are presented for the total U.S. population by sex, race or ethnic group, and age in years or age group. Findings for some population groups are reported in a way that is comparable with results reported from National Health Examination Surveys (NHES) and NHANES conducted between 1960 and 1994 (3–9). These data add to the knowledge about trends in child growth and development and are used to monitor prevalent conditions in the U.S. population such as overweight and obesity (10–13).
Keywords: c Anthropometry c Body measures c Nutrition surveys c National Health and Nutrition Examination Survey (NHANES)
Introduction The field of anthropometry
encompasses a variety of human body measurements, such as weight, height, and size, including circumferences, lengths, breadths, and skinfold thicknesses. Anthropometry is a key component of nutrition status assessment in children and adults (14). Anthropometric data for children reflect general health status, dietary adequacy, and growth and development over time. In adults, body measurement data are used to evaluate health and dietary status, disease risk, and body composition changes that occur over the
U.S. DEPARTMENT OF HCenters for Disease ConNational Center for Heal
adult lifespan. This report provides anthropometric reference data for U.S. children and adults of all ages.
Methods National Health and Nutrition
Examination Surveys are conducted by the National Center for Health Statistics (NCHS), Centers for Disease Control and Prevention. NHANES data are the primary source of body measurement and related health and nutrition data for the civilian noninstitutionalized U.S. population. Surveys were conducted on a periodic basis from 1960 to 1994. NHANES became a continuous survey
EALTH AND HUMAN SERVICES trol and Prevention th Statistics
in 1999. Each annual survey sample is nationally representative; 2 or more years of data are required for subgroup analyses (15,16). NHANES 1999–2002 data were released in two, 2-year data sets. A combined 4-year dataset was used for this report because it provides robust sample sizes and more reliable statistical estimates. Additional 2-year data sets will be released as more data become available.
Household interview and health examination methods are used to collect NHANES data. All health examinations are conducted in mobile examination centers (MECs). The MECs provide a standardized environment for the collection of high-quality health data. The MECs are staffed by full-time personnel including health technicians and interviewers, dentists, physicians, dietary interviewers, laboratory technicians, and data managers. All NHANES health technicians complete a comprehensive body measurement training program that uses videotape, demonstration, and practice exercises with an expert examiner. Health technician performance is monitored by means of direct observation, data review, and expert examiner evaluations.
Although portions of the health examination component have varied during the survey’s history, much of the
2 Advance Data No. 361 + July 7, 2005
anthropometry component methodology has remained consistent over time. The use of consistent data collection methods makes it possible to examine trends in body measurements over time. NHANES data have been used to produce growth charts for growing infants and children and to produce national prevalence estimates for overweight and obesity.
The NHANES body measurement component is conducted in a dedicated room in the MEC. The room is equipped with a digital scale, wall-mounted stadiometer, bench, wall mirror, infantometer, and computer workstation. A health technician performs the anthropometry exam and is assisted by a recorder. NHANES subjects wear socks and lightweight examination gowns at the MEC.
Sample description
The NHANES 1999–2002 sample includes all ages. Adolescents aged 12–19 years, persons aged 60 years and over, Mexican Americans, black persons, low income persons, and pregnant women are oversampled to improve the precision of statistical estimates produced for these groups. Additional information pertaining to the NHANES 1999–2002 survey design, survey methodology, and public-use microdata is posted on the NHANES Web site (15).
The analytic sample for this report was based on the NHANES 1999–2002 eligible sample composed of 21,004 persons, and of these, 19,759 were examined. All examined persons are eligible for the body measurement component of the NHANES health examination. Pregnant women are excluded from weight and circumference tabulations. The estimates in this report are based on a single body measurement examination.
Anthropometry component
The NHANES 1999–2000 Body Measurements Training and Procedures Manual describes the protocol, equipment, and measurement procedures in detail (17). The manual also provides detailed information about equipment calibration methods, quality control, and
survey procedures. NCHS produced an anthropometry methodology videotape during NHANES III (18). Weight is measured to the nearest 0.1 kilogram; height, length, and circumference are measured to the nearest millimeter; skinfold thickness is measured to the nearest 0.1 millimeter. (For this report, weight is also reported in pounds (tables 4, 17, and 30), and height is reported in inches (tables 6, 19, and 32). Kilograms were converted to pounds by multiplying weight in kilograms by a conversion factor of 2.2. Centimeters were converted to inches by dividing height in centimeters by 2.54.)
Weight is measured using a digital floor scale. An infantometer is used to measure recumbent length of infants and young children. Standing height is measured with a wall-mounted stadiometer. Head circumference measurements are made using a plastic head circumference measurement tape. Waist circumference is measured at the lateral border of the ilium bone. Upper arm length is measured from the posterior border of the acromial process to the tip of the olecranon, and the upper-arm-length midpoint is marked. The upper arm length midpoint mark is used to measure mid-arm circumference and the triceps skinfold. Subscapular skinfold is measured on all subjects at a point medial to the inferior angle of the scapula. Weight, recumbent length, and standing height values are recorded automatically; other data are recorded using computer-assisted data entry.
In addition to weight, standing height, upper arm length, mid-arm circumference, waist circumference, and skinfold measurements, three additional measurements are taken on subjects aged 8 years and over. Upper leg length measurements are taken on seated subjects; the distance from the inguinal crease to the distal end of the femur is measured. Maximal calf circumference is also measured in a seated position; a measurement tape is positioned around the calf at the point of maximum circumference. Mid-thigh circumference is measured on standing subjects with the measurement tape placed around the mid-thigh, perpendicular to the long axis of the femur bone.
Statistical analysis
Population means, standard errors of the means, and percentiles were weighted using the NHANES examination sample weights to produce national estimates. The NHANES examination sample weights incorporate the differential probabilities of selection and include adjustments for oversampling of selected populations, noncoverage, and nonresponse. Standard errors were estimated using SUDAAN by Taylor series linearization (19). The reliability of the estimates was determined using the relative standard error (RSE), a calculated figure defined as the ratio of the standard error of the mean. NCHS recommends using an RSE greater than 30 percent to identify unreliable estimates (16). Percentile values that did not meet the standard of reliability or precision were replaced with asterisks in all tables.
The age categories recommended in the NHANES 1999–2000 Analytic Guidelines, based on the survey sample domains, were used for adults aged 20 years and over (16). The results for subjects under age 20 years are by single years (or less for the youngest children). All age categories were based on age at the time of the examination.
Results The anthropometric measurements
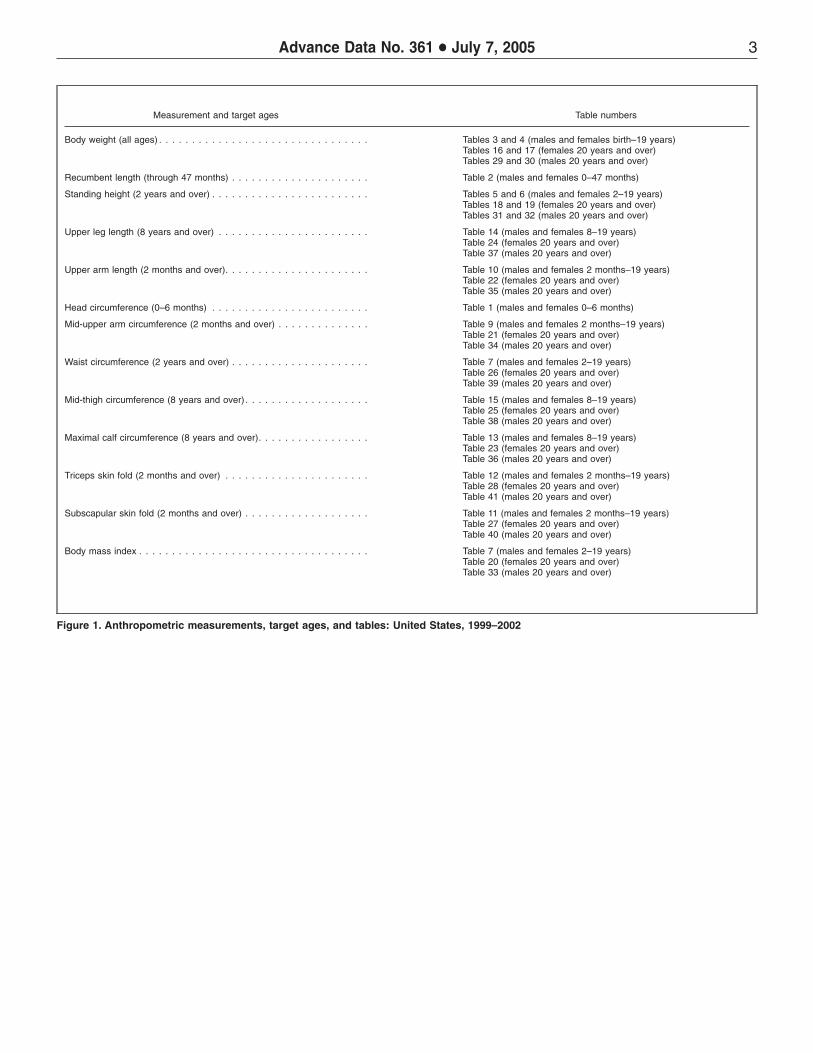
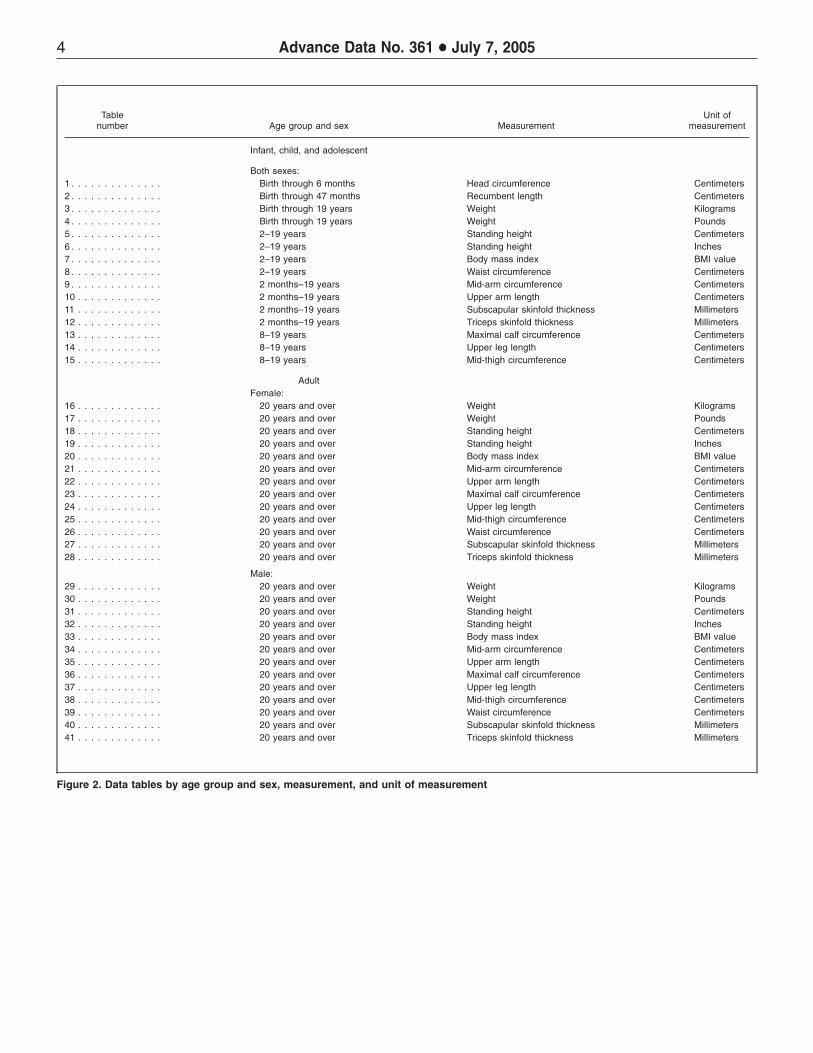
performed in the survey are listed in figure 1, by measurement and target age. Figure 2 lists the tables in this report by age group and sex, measurement, and unit of measurement.
Results are reported by sex and age groups in all tables; results for adults 20 years of age and over also are presented by race or ethnicity group. Results for infants, children, and teenagers through 19 years are presented in tables 1–15. Results for adults aged 20 years and over are presented in tables 16–41. The NHANES 1999–2002 findings for some population groups may be compared with the results reported from previous NHES and NHANES conducted between 1960 and 1994 (20–28).
3 Advance Data No. 361 + July 7, 2005
Measurement and target ages Table numbers
Body weight (all ages) . . . . . . . . . . . . . . . . . . . . . . . . . . . . . . . . Tables 3 and 4 (males and females birth–19 years) Tables 16 and 17 (females 20 years and over) Tables 29 and 30 (males 20 years and over)
Recumbent length (through 47 months) . . . . . . . . . . . . . . . . . . . . . Table 2 (males and females 0–47 months)
Standing height (2 years and over) . . . . . . . . . . . . . . . . . . . . . . . . Tables 5 and 6 (males and females 2–19 years) Tables 18 and 19 (females 20 years and over) Tables 31 and 32 (males 20 years and over)
Upper leg length (8 years and over) . . . . . . . . . . . . . . . . . . . . . . . Table 14 (males and females 8–19 years) Table 24 (females 20 years and over) Table 37 (males 20 years and over)
Upper arm length (2 months and over). . . . . . . . . . . . . . . . . . . . . . Table 10 (males and females 2 months–19 years) Table 22 (females 20 years and over) Table 35 (males 20 years and over)
Head circumference (0–6 months) . . . . . . . . . . . . . . . . . . . . . . . . Table 1 (males and females 0–6 months)
Mid-upper arm circumference (2 months and over) . . . . . . . . . . . . . . Table 9 (males and females 2 months–19 years) Table 21 (females 20 years and over) Table 34 (males 20 years and over)
Waist circumference (2 years and over) . . . . . . . . . . . . . . . . . . . . . Table 7 (males and females 2–19 years) Table 26 (females 20 years and over) Table 39 (males 20 years and over)
Mid-thigh circumference (8 years and over) . . . . . . . . . . . . . . . . . . . Table 15 (males and females 8–19 years) Table 25 (females 20 years and over) Table 38 (males 20 years and over)
Maximal calf circumference (8 years and over). . . . . . . . . . . . . . . . . Table 13 (males and females 8–19 years) Table 23 (females 20 years and over) Table 36 (males 20 years and over)
Triceps skin fold (2 months and over) . . . . . . . . . . . . . . . . . . . . . . Table 12 (males and females 2 months–19 years) Table 28 (females 20 years and over) Table 41 (males 20 years and over)
Subscapular skin fold (2 months and over) . . . . . . . . . . . . . . . . . . . Table 11 (males and females 2 months–19 years) Table 27 (females 20 years and over) Table 40 (males 20 years and over)
Body mass index . . . . . . . . . . . . . . . . . . . . . . . . . . . . . . . . . . . Table 7 (males and females 2–19 years) Table 20 (females 20 years and over) Table 33 (males 20 years and over)
Figure 1. Anthropometric measurements, target ages, and tables: United States, 1999–2002
4 Advance Data No. 361 + July 7, 2005
Table Unit of number Age group and sex Measurement measurement
Infant, child, and adolescent
Both sexes:1 . . . . . . . . . . . . . . Birth through 6 months2 . . . . . . . . . . . . . . Birth through 47 months3 . . . . . . . . . . . . . . Birth through 19 years4 . . . . . . . . . . . . . . Birth through 19 years5 . . . . . . . . . . . . . . 2–19 years6 . . . . . . . . . . . . . . 2–19 years7 . . . . . . . . . . . . . . 2–19 years8 . . . . . . . . . . . . . . 2–19 years9 . . . . . . . . . . . . . . 2 months–19 years10 . . . . . . . . . . . . . 2 months–19 years11 . . . . . . . . . . . . . 2 months–19 years12 . . . . . . . . . . . . . 2 months–19 years13 . . . . . . . . . . . . . 8–19 years14 . . . . . . . . . . . . . 8–19 years15 . . . . . . . . . . . . . 8–19 years
AdultFemale:
16 . . . . . . . . . . . . . 20 years and over17 . . . . . . . . . . . . . 20 years and over18 . . . . . . . . . . . . . 20 years and over19 . . . . . . . . . . . . . 20 years and over20 . . . . . . . . . . . . . 20 years and over21 . . . . . . . . . . . . . 20 years and over22 . . . . . . . . . . . . . 20 years and over23 . . . . . . . . . . . . . 20 years and over24 . . . . . . . . . . . . . 20 years and over25 . . . . . . . . . . . . . 20 years and over26 . . . . . . . . . . . . . 20 years and over27 . . . . . . . . . . . . . 20 years and over28 . . . . . . . . . . . . . 20 years and over
Male:29 . . . . . . . . . . . . . 20 years and over30 . . . . . . . . . . . . . 20 years and over31 . . . . . . . . . . . . . 20 years and over32 . . . . . . . . . . . . . 20 years and over33 . . . . . . . . . . . . . 20 years and over34 . . . . . . . . . . . . . 20 years and over35 . . . . . . . . . . . . . 20 years and over36 . . . . . . . . . . . . . 20 years and over37 . . . . . . . . . . . . . 20 years and over38 . . . . . . . . . . . . . 20 years and over39 . . . . . . . . . . . . . 20 years and over40 . . . . . . . . . . . . . 20 years and over41 . . . . . . . . . . . . . 20 years and over
Head circumference Centimeters Recumbent length Centimeters Weight Kilograms Weight Pounds Standing height Centimeters Standing height Inches Body mass index BMI value Waist circumference Centimeters Mid-arm circumference Centimeters Upper arm length Centimeters Subscapular skinfold thickness Millimeters Triceps skinfold thickness Millimeters Maximal calf circumference Centimeters Upper leg length Centimeters Mid-thigh circumference Centimeters
Weight Kilograms Weight Pounds Standing height Centimeters Standing height Inches Body mass index BMI value Mid-arm circumference Centimeters Upper arm length Centimeters Maximal calf circumference Centimeters Upper leg length Centimeters Mid-thigh circumference Centimeters Waist circumference Centimeters Subscapular skinfold thickness Millimeters Triceps skinfold thickness Millimeters
Weight Kilograms Weight Pounds Standing height Centimeters Standing height Inches Body mass index BMI value Mid-arm circumference Centimeters Upper arm length Centimeters Maximal calf circumference Centimeters Upper leg length Centimeters Mid-thigh circumference Centimeters Waist circumference Centimeters Subscapular skinfold thickness Millimeters Triceps skinfold thickness Millimeters
Figure 2. Data tables by age group and sex, measurement, and unit of measurement
5 Advance Data No. 361 + July 7, 2005
References 1. CDC. 2002a. NHANES 1999–2000
Data File Documentation. Examination File; Body Measurements Dataset. National Center for Health Statistics. 2002b. http://www.cdc.gov/nchs/about/major/ nhanes/nhanes99_00.htm #Examination%20Files. 2004.
2. CDC. 2002b. NHANES 2001–2002 Data File Documentation. Examination File; Body Measurements Dataset. National Center for Health Statistics. http:// www.cdc.gov/nchs/about/major/ nhanes/nhanes01–02.htm# Examination%20Files. 2004.
3. National Center for Health Statistics. Plan and initial program of the Health Examination Survey. National Center for Health Statistics. Vital Health Stat 1(4). 1965.
4. National Center for Health Statistics. Plan, operation, and response results of a program of children’s examinations. National Center for Health Statistics. Vital Health Stat 1(5). 1967.
5. National Center for Health Statistics. Plan and operation of a health examination survey of U.S. youths 12–17 years of age. National Center for Health Statistics. Vital Health Stat 1(8). 1969.
6. CDC. Reports and manuals from the first National Health and Nutrition Examination Survey (NHANES I, 1971–75). http://www.cdc.gov/nchs/ about/major/nhanes/nh1rrm.htm. 2004.
7. CDC. Reports and manuals from the second National Health and Nutrition Examination Survey (NHANES II, 1976–80). http://www.cdc.gov/nchs/ about/major/nhanes/nh2rrm.htm. 2004.
8. CDC. Reports and manuals from the Hispanic Health and Nutrition Examination Survey (HHANES, 1982–84). http://www.cdc.gov/nchs/ about/major/nhanes/hhanesrrm.htm. 2004.
9. CDC. Reports and manuals from the third National Health and Nutrition Examination Survey (NHANES III, 1988–94). http://www.cdc.gov/nchs/ about/major/nhanes/NHANESIII_ Reference_Manuals.htm. 2004.
10. Ogden CL, Fryar CD, Carroll MD, Flegal KM. Mean body weight, height, and body mass index, United States 1960–2002. Advance data
from vital and health statistics; no 347. Hyattsville, MD: National Center for Health Statistics. 2004.
11. Kuczmarski RJ, Ogden CL, Guo SS, et al. 2000 CDC growth charts for the United States: Methods and development. National Center for Health Statistics. Vital Health Stat 11(246). 2002.
12. Flegal KM, Ogden CL, Carroll MD. Prevalence and trends in overweight in Mexican-American adults and children. Nutr Rev 62(7 part 2). S144–8. 2004.
13. Hedley AA, Ogden CL, Johnson Cl, et al. Prevalence of overweight and obesity among U.S. children, adolescents, and adults, 1999–2002. JAMA 291(23). 2,847–50. 2004.
14. Simko MD, Cowell C, Gilbride JA. Nutrition assessment: A comprehensive guide for planning intervention. 2nd ed. Gaithersburg, MD: Aspen Publishers. 1995.
15. CDC. 2004a. Descriptive information about the National Health and Nutrition Examination Survey (NHANES). http://www.cdc.gov/ nchs/nhanes.htm. 2004.
16. CDC. 2004b. NHANES 1999–2000 Analytic Guidelines. Hyattsville, MD: National Center for Health Statistics. http://www.cdc.gov/nchs/ data/nhanes/guidelines1.pdf. 2003.
17. National Center for Health Statistics. NHANES Anthropometry Procedures Manual. Revised January 2002. http://www.cdc.gov/nchs/data/nhanes/ nhanes_01_02/body_measures_ year_3.pdf. 2004.
18. National Center for Health Statistics. NHANES III: Anthropometric Procedures. [Videotape]. http:// www.cdc.gov/nchs/about/major/ nhanes/avideo.htm. 1996.
19. Wolter KM. Introduction to variance estimation. New York: Springer-Verlag. 1990.
20. Stoudt HW, Damon A, McFarland RA, Roberts J. Skin folds, body girths, biacromial diameter, and selected anthropometric indices of adults: United States, 1960–1962. National Center for Health Statistics. Vital Health Stat 11(35). 1970.
21. Stoudt HW, Damon A, McFarland R, Roberts J. Weight, height, and selected body dimensions of adults, United States, 1960–1962. National Center for Health Statistics. Vital Health Stat 11(8). 1965.
22. Roberts J. Weight by height and age of adults, United States, 1960–1962.
National Center for Health Statistics. Vital Health Stat 11(14). 1966.
23. Malina RM, Hamill PVV, Lemeshow S. Selected body measurements of children 6–11 years, United States. National Center for Health Statistics. Vital Health Stat 11(123). 1973.
24. Hamill PVV, Johnston FE, Lemeshow S. Height and weight of youths 12–17 years, United States. National Center for Health Statistics. Vital Health Stat 11(124). 1973.
25. Johnson CL, Fulwood R, Abraham S, Bryner JD. Basic data on anthropometric measurements and angular measurements of the hip and knee joints for selected age groups 1–74 years of age, United States, 1971–1975. National Center for Health Statistics. Vital Health Stat 11(219). 1981.
26. Najjar MF, Rowland M. Anthropometric reference data and prevalence of overweight, United States, 1976–80. National Center for Health Statistics. Vital Health Stat 11(238). 1987.
27. Najjar MF, Kuczmarski RJ. Anthropometric data and prevalence of overweight for Hispanics, 1982–84. National Center for Health Statistics. Vital Health Stat 11(239). 1989.
28. CDC. Anthropometric reference data, United States, 1988–1994. http:// www.cdc.gov/nchs/about/major/ nhanes/Anthropometric%20 Measures.htm. 2005.
6 Advance Data No. 361 + July 7, 2005
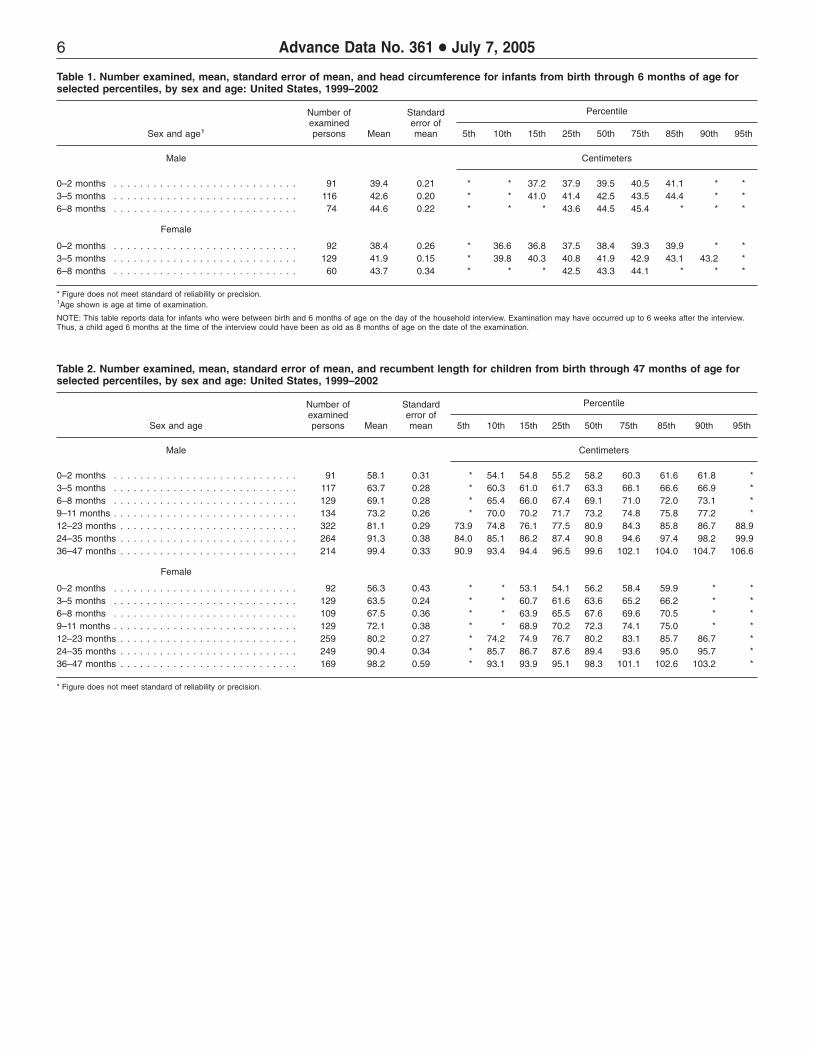
Table 1. Number examined, mean, standard error of mean, and head circumference for infants from birth through 6 months of age for selected percentiles, by sex and age: United States, 1999–2002
Number of Standard Percentile examined error of
Sex and age1 persons Mean mean 5th 10th 15th 25th 50th 75th 85th 90th 95th
Male Centimeters
0–2 months . . . . . . . . . . . . . . . . . . . . . . . . . . . . 91 39.4 0.21 * * 37.2 37.9 39.5 40.5 41.1 * * 3–5 months . . . . . . . . . . . . . . . . . . . . . . . . . . . . 116 42.6 0.20 * * 41.0 41.4 42.5 43.5 44.4 * * 6–8 months . . . . . . . . . . . . . . . . . . . . . . . . . . . . 74 44.6 0.22 * * * 43.6 44.5 45.4 * * *
Female
0–2 months . . . . . . . . . . . . . . . . . . . . . . . . . . . . 92 38.4 0.26 * 36.6 36.8 37.5 38.4 39.3 39.9 * * 3–5 months . . . . . . . . . . . . . . . . . . . . . . . . . . . . 129 41.9 0.15 * 39.8 40.3 40.8 41.9 42.9 43.1 43.2 * 6–8 months . . . . . . . . . . . . . . . . . . . . . . . . . . . . 60 43.7 0.34 * * * 42.5 43.3 44.1 * * *
* Figure does not meet standard of reliability or precision. 1Age shown is age at time of examination.
NOTE: This table reports data for infants who were between birth and 6 months of age on the day of the household interview. Examination may have occurred up to 6 weeks after the interview. Thus, a child aged 6 months at the time of the interview could have been as old as 8 months of age on the date of the examination.
Table 2. Number examined, mean, standard error of mean, and recumbent length for children from birth through 47 months of age for selected percentiles, by sex and age: United States, 1999–2002
Number of Standard Percentile examined error of
Sex and age persons Mean mean 5th 10th 15th 25th 50th 75th 85th 90th 95th
Male Centimeters
0–2 months . . . . . . . . . . . . . . . . . . . . . . . . . . . . 91 58.1 0.31 * 54.1 54.8 55.2 58.2 60.3 61.6 61.8 * 3–5 months . . . . . . . . . . . . . . . . . . . . . . . . . . . . 117 63.7 0.28 * 60.3 61.0 61.7 63.3 66.1 66.6 66.9 * 6–8 months . . . . . . . . . . . . . . . . . . . . . . . . . . . . 129 69.1 0.28 * 65.4 66.0 67.4 69.1 71.0 72.0 73.1 * 9–11 months . . . . . . . . . . . . . . . . . . . . . . . . . . . . 134 73.2 0.26 * 70.0 70.2 71.7 73.2 74.8 75.8 77.2 * 12–23 months . . . . . . . . . . . . . . . . . . . . . . . . . . . 322 81.1 0.29 73.9 74.8 76.1 77.5 80.9 84.3 85.8 86.7 88.9 24–35 months . . . . . . . . . . . . . . . . . . . . . . . . . . . 264 91.3 0.38 84.0 85.1 86.2 87.4 90.8 94.6 97.4 98.2 99.9 36–47 months . . . . . . . . . . . . . . . . . . . . . . . . . . . 214 99.4 0.33 90.9 93.4 94.4 96.5 99.6 102.1 104.0 104.7 106.6
Female
0–2 months . . . . . . . . . . . . . . . . . . . . . . . . . . . . 92 56.3 0.43 * * 53.1 54.1 56.2 58.4 59.9 * * 3–5 months . . . . . . . . . . . . . . . . . . . . . . . . . . . . 129 63.5 0.24 * * 60.7 61.6 63.6 65.2 66.2 * * 6–8 months . . . . . . . . . . . . . . . . . . . . . . . . . . . . 109 67.5 0.36 * * 63.9 65.5 67.6 69.6 70.5 * * 9–11 months . . . . . . . . . . . . . . . . . . . . . . . . . . . . 129 72.1 0.38 * * 68.9 70.2 72.3 74.1 75.0 * * 12–23 months . . . . . . . . . . . . . . . . . . . . . . . . . . . 259 80.2 0.27 * 74.2 74.9 76.7 80.2 83.1 85.7 86.7 * 24–35 months . . . . . . . . . . . . . . . . . . . . . . . . . . . 249 90.4 0.34 * 85.7 86.7 87.6 89.4 93.6 95.0 95.7 * 36–47 months . . . . . . . . . . . . . . . . . . . . . . . . . . . 169 98.2 0.59 * 93.1 93.9 95.1 98.3 101.1 102.6 103.2 *
* Figure does not meet standard of reliability or precision.
7 Advance Data No. 361 + July 7, 2005
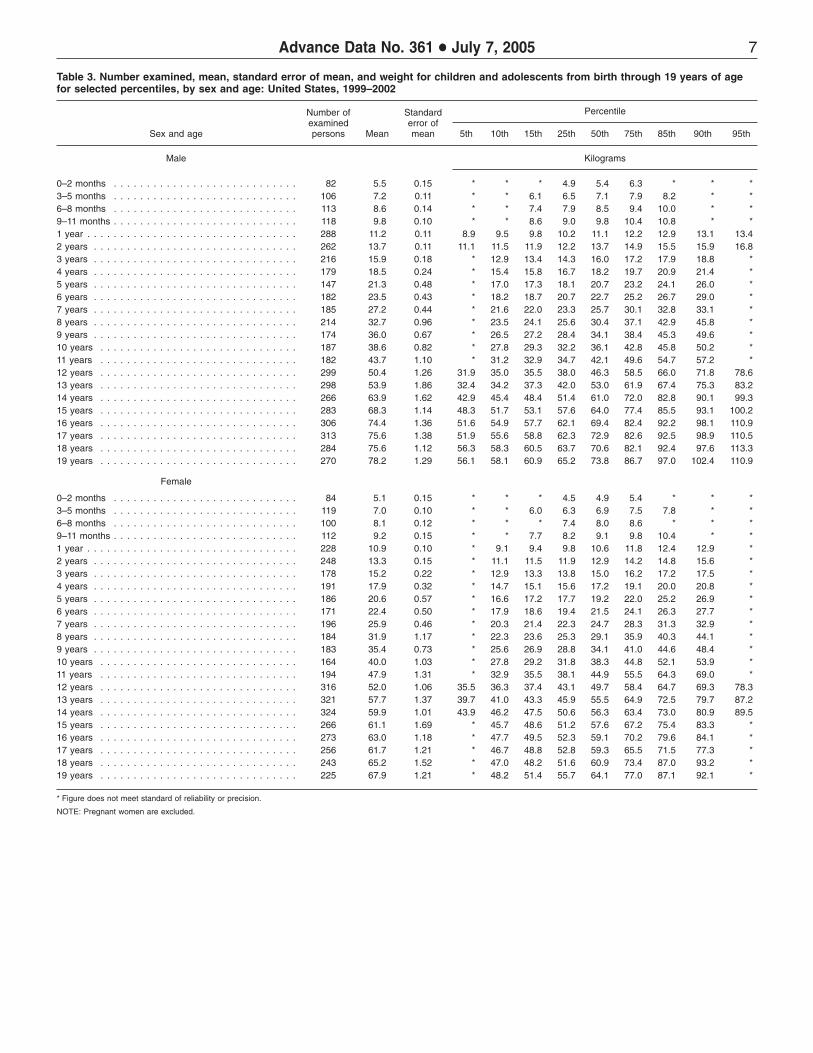
Table 3. Number examined, mean, standard error of mean, and weight for children and adolescents from birth through 19 years of age for selected percentiles, by sex and age: United States, 1999–2002
Sex and age
Number of examined persons Mean
Standard error of mean 5th 10th 15th 25th
Percentile
50th 75th 85th 90th 95th
Male Kilograms
0–2 months . . . . . . . . . . . . . . . . . . . . . . . . . . . . 82 5.5 0.15 * * * 4.9 5.4 6.3 * * * 3–5 months . . . . . . . . . . . . . . . . . . . . . . . . . . . . 106 7.2 0.11 * * 6.1 6.5 7.1 7.9 8.2 * * 6–8 months . . . . . . . . . . . . . . . . . . . . . . . . . . . . 113 8.6 0.14 * * 7.4 7.9 8.5 9.4 10.0 * * 9–11 months . . . . . . . . . . . . . . . . . . . . . . . . . . . . 118 9.8 0.10 * * 8.6 9.0 9.8 10.4 10.8 * * 1 year . . . . . . . . . . . . . . . . . . . . . . . . . . . . . . . . 288 11.2 0.11 8.9 9.5 9.8 10.2 11.1 12.2 12.9 13.1 13.4 2 years . . . . . . . . . . . . . . . . . . . . . . . . . . . . . . . 262 13.7 0.11 11.1 11.5 11.9 12.2 13.7 14.9 15.5 15.9 16.8 3 years . . . . . . . . . . . . . . . . . . . . . . . . . . . . . . . 216 15.9 0.18 * 12.9 13.4 14.3 16.0 17.2 17.9 18.8 * 4 years . . . . . . . . . . . . . . . . . . . . . . . . . . . . . . . 179 18.5 0.24 * 15.4 15.8 16.7 18.2 19.7 20.9 21.4 * 5 years . . . . . . . . . . . . . . . . . . . . . . . . . . . . . . . 147 21.3 0.48 * 17.0 17.3 18.1 20.7 23.2 24.1 26.0 * 6 years . . . . . . . . . . . . . . . . . . . . . . . . . . . . . . . 182 23.5 0.43 * 18.2 18.7 20.7 22.7 25.2 26.7 29.0 * 7 years . . . . . . . . . . . . . . . . . . . . . . . . . . . . . . . 185 27.2 0.44 * 21.6 22.0 23.3 25.7 30.1 32.8 33.1 * 8 years . . . . . . . . . . . . . . . . . . . . . . . . . . . . . . . 214 32.7 0.96 * 23.5 24.1 25.6 30.4 37.1 42.9 45.8 * 9 years . . . . . . . . . . . . . . . . . . . . . . . . . . . . . . . 174 36.0 0.67 * 26.5 27.2 28.4 34.1 38.4 45.3 49.6 * 10 years . . . . . . . . . . . . . . . . . . . . . . . . . . . . . . 187 38.6 0.82 * 27.8 29.3 32.2 36.1 42.8 45.8 50.2 * 11 years . . . . . . . . . . . . . . . . . . . . . . . . . . . . . . 182 43.7 1.10 * 31.2 32.9 34.7 42.1 49.6 54.7 57.2 * 12 years . . . . . . . . . . . . . . . . . . . . . . . . . . . . . . 299 50.4 1.26 31.9 35.0 35.5 38.0 46.3 58.5 66.0 71.8 78.6 13 years . . . . . . . . . . . . . . . . . . . . . . . . . . . . . . 298 53.9 1.86 32.4 34.2 37.3 42.0 53.0 61.9 67.4 75.3 83.2 14 years . . . . . . . . . . . . . . . . . . . . . . . . . . . . . . 266 63.9 1.62 42.9 45.4 48.4 51.4 61.0 72.0 82.8 90.1 99.3 15 years . . . . . . . . . . . . . . . . . . . . . . . . . . . . . . 283 68.3 1.14 48.3 51.7 53.1 57.6 64.0 77.4 85.5 93.1 100.2 16 years . . . . . . . . . . . . . . . . . . . . . . . . . . . . . . 306 74.4 1.36 51.6 54.9 57.7 62.1 69.4 82.4 92.2 98.1 110.9 17 years . . . . . . . . . . . . . . . . . . . . . . . . . . . . . . 313 75.6 1.38 51.9 55.6 58.8 62.3 72.9 82.6 92.5 98.9 110.5 18 years . . . . . . . . . . . . . . . . . . . . . . . . . . . . . . 284 75.6 1.12 56.3 58.3 60.5 63.7 70.6 82.1 92.4 97.6 113.3 19 years . . . . . . . . . . . . . . . . . . . . . . . . . . . . . . 270 78.2 1.29 56.1 58.1 60.9 65.2 73.8 86.7 97.0 102.4 110.9
Female
0–2 months . . . . . . . . . . . . . . . . . . . . . . . . . . . . 84 5.1 0.15 * * * 4.5 4.9 5.4 * * * 3–5 months . . . . . . . . . . . . . . . . . . . . . . . . . . . . 119 7.0 0.10 * * 6.0 6.3 6.9 7.5 7.8 * * 6–8 months . . . . . . . . . . . . . . . . . . . . . . . . . . . . 100 8.1 0.12 * * * 7.4 8.0 8.6 * * * 9–11 months . . . . . . . . . . . . . . . . . . . . . . . . . . . . 112 9.2 0.15 * * 7.7 8.2 9.1 9.8 10.4 * * 1 year . . . . . . . . . . . . . . . . . . . . . . . . . . . . . . . . 228 10.9 0.10 * 9.1 9.4 9.8 10.6 11.8 12.4 12.9 * 2 years . . . . . . . . . . . . . . . . . . . . . . . . . . . . . . . 248 13.3 0.15 * 11.1 11.5 11.9 12.9 14.2 14.8 15.6 * 3 years . . . . . . . . . . . . . . . . . . . . . . . . . . . . . . . 178 15.2 0.22 * 12.9 13.3 13.8 15.0 16.2 17.2 17.5 * 4 years . . . . . . . . . . . . . . . . . . . . . . . . . . . . . . . 191 17.9 0.32 * 14.7 15.1 15.6 17.2 19.1 20.0 20.8 * 5 years . . . . . . . . . . . . . . . . . . . . . . . . . . . . . . . 186 20.6 0.57 * 16.6 17.2 17.7 19.2 22.0 25.2 26.9 * 6 years . . . . . . . . . . . . . . . . . . . . . . . . . . . . . . . 171 22.4 0.50 * 17.9 18.6 19.4 21.5 24.1 26.3 27.7 * 7 years . . . . . . . . . . . . . . . . . . . . . . . . . . . . . . . 196 25.9 0.46 * 20.3 21.4 22.3 24.7 28.3 31.3 32.9 * 8 years . . . . . . . . . . . . . . . . . . . . . . . . . . . . . . . 184 31.9 1.17 * 22.3 23.6 25.3 29.1 35.9 40.3 44.1 * 9 years . . . . . . . . . . . . . . . . . . . . . . . . . . . . . . . 183 35.4 0.73 * 25.6 26.9 28.8 34.1 41.0 44.6 48.4 * 10 years . . . . . . . . . . . . . . . . . . . . . . . . . . . . . . 164 40.0 1.03 * 27.8 29.2 31.8 38.3 44.8 52.1 53.9 * 11 years . . . . . . . . . . . . . . . . . . . . . . . . . . . . . . 194 47.9 1.31 * 32.9 35.5 38.1 44.9 55.5 64.3 69.0 * 12 years . . . . . . . . . . . . . . . . . . . . . . . . . . . . . . 316 52.0 1.06 35.5 36.3 37.4 43.1 49.7 58.4 64.7 69.3 78.3 13 years . . . . . . . . . . . . . . . . . . . . . . . . . . . . . . 321 57.7 1.37 39.7 41.0 43.3 45.9 55.5 64.9 72.5 79.7 87.2 14 years . . . . . . . . . . . . . . . . . . . . . . . . . . . . . . 324 59.9 1.01 43.9 46.2 47.5 50.6 56.3 63.4 73.0 80.9 89.5 15 years . . . . . . . . . . . . . . . . . . . . . . . . . . . . . . 266 61.1 1.69 * 45.7 48.6 51.2 57.6 67.2 75.4 83.3 * 16 years . . . . . . . . . . . . . . . . . . . . . . . . . . . . . . 273 63.0 1.18 * 47.7 49.5 52.3 59.1 70.2 79.6 84.1 * 17 years . . . . . . . . . . . . . . . . . . . . . . . . . . . . . . 256 61.7 1.21 * 46.7 48.8 52.8 59.3 65.5 71.5 77.3 * 18 years . . . . . . . . . . . . . . . . . . . . . . . . . . . . . . 243 65.2 1.52 * 47.0 48.2 51.6 60.9 73.4 87.0 93.2 * 19 years . . . . . . . . . . . . . . . . . . . . . . . . . . . . . . 225 67.9 1.21 * 48.2 51.4 55.7 64.1 77.0 87.1 92.1 *
* Figure does not meet standard of reliability or precision.
NOTE: Pregnant women are excluded.
8 Advance Data No. 361 + July 7, 2005
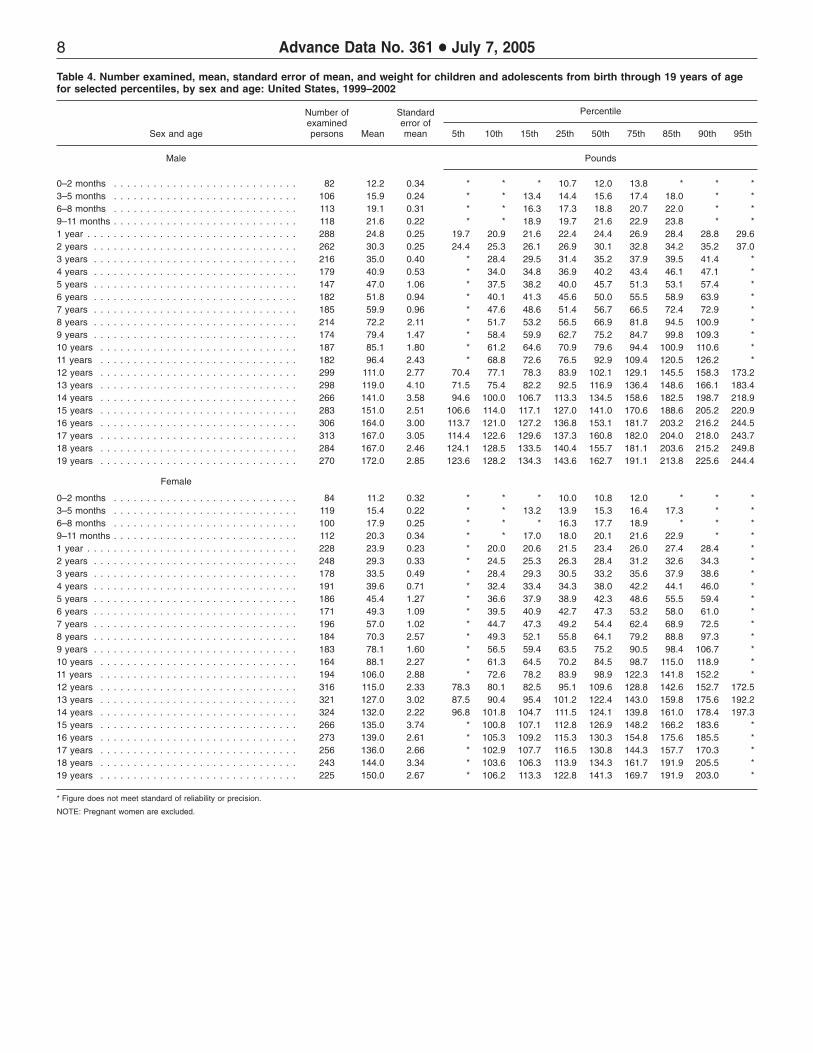
Table 4. Number examined, mean, standard error of mean, and weight for children and adolescents from birth through 19 years of age for selected percentiles, by sex and age: United States, 1999–2002
Sex and age
Number of examined persons Mean
Standard error of mean 5th 10th 15th 25th
Percentile
50th 75th 85th 90th 95th
Male Pounds
0–2 months . . . . . . . . . . . . . . . . . . . . . . . . . . . . 82 12.2 0.34 * * * 10.7 12.0 13.8 * * * 3–5 months . . . . . . . . . . . . . . . . . . . . . . . . . . . . 106 15.9 0.24 * * 13.4 14.4 15.6 17.4 18.0 * * 6–8 months . . . . . . . . . . . . . . . . . . . . . . . . . . . . 113 19.1 0.31 * * 16.3 17.3 18.8 20.7 22.0 * * 9–11 months . . . . . . . . . . . . . . . . . . . . . . . . . . . . 118 21.6 0.22 * * 18.9 19.7 21.6 22.9 23.8 * * 1 year . . . . . . . . . . . . . . . . . . . . . . . . . . . . . . . . 288 24.8 0.25 19.7 20.9 21.6 22.4 24.4 26.9 28.4 28.8 29.6 2 years . . . . . . . . . . . . . . . . . . . . . . . . . . . . . . . 262 30.3 0.25 24.4 25.3 26.1 26.9 30.1 32.8 34.2 35.2 37.0 3 years . . . . . . . . . . . . . . . . . . . . . . . . . . . . . . . 216 35.0 0.40 * 28.4 29.5 31.4 35.2 37.9 39.5 41.4 * 4 years . . . . . . . . . . . . . . . . . . . . . . . . . . . . . . . 179 40.9 0.53 * 34.0 34.8 36.9 40.2 43.4 46.1 47.1 * 5 years . . . . . . . . . . . . . . . . . . . . . . . . . . . . . . . 147 47.0 1.06 * 37.5 38.2 40.0 45.7 51.3 53.1 57.4 * 6 years . . . . . . . . . . . . . . . . . . . . . . . . . . . . . . . 182 51.8 0.94 * 40.1 41.3 45.6 50.0 55.5 58.9 63.9 * 7 years . . . . . . . . . . . . . . . . . . . . . . . . . . . . . . . 185 59.9 0.96 * 47.6 48.6 51.4 56.7 66.5 72.4 72.9 * 8 years . . . . . . . . . . . . . . . . . . . . . . . . . . . . . . . 214 72.2 2.11 * 51.7 53.2 56.5 66.9 81.8 94.5 100.9 * 9 years . . . . . . . . . . . . . . . . . . . . . . . . . . . . . . . 174 79.4 1.47 * 58.4 59.9 62.7 75.2 84.7 99.8 109.3 * 10 years . . . . . . . . . . . . . . . . . . . . . . . . . . . . . . 187 85.1 1.80 * 61.2 64.6 70.9 79.6 94.4 100.9 110.6 * 11 years . . . . . . . . . . . . . . . . . . . . . . . . . . . . . . 182 96.4 2.43 * 68.8 72.6 76.5 92.9 109.4 120.5 126.2 * 12 years . . . . . . . . . . . . . . . . . . . . . . . . . . . . . . 299 111.0 2.77 70.4 77.1 78.3 83.9 102.1 129.1 145.5 158.3 173.2 13 years . . . . . . . . . . . . . . . . . . . . . . . . . . . . . . 298 119.0 4.10 71.5 75.4 82.2 92.5 116.9 136.4 148.6 166.1 183.4 14 years . . . . . . . . . . . . . . . . . . . . . . . . . . . . . . 266 141.0 3.58 94.6 100.0 106.7 113.3 134.5 158.6 182.5 198.7 218.9 15 years . . . . . . . . . . . . . . . . . . . . . . . . . . . . . . 283 151.0 2.51 106.6 114.0 117.1 127.0 141.0 170.6 188.6 205.2 220.9 16 years . . . . . . . . . . . . . . . . . . . . . . . . . . . . . . 306 164.0 3.00 113.7 121.0 127.2 136.8 153.1 181.7 203.2 216.2 244.5 17 years . . . . . . . . . . . . . . . . . . . . . . . . . . . . . . 313 167.0 3.05 114.4 122.6 129.6 137.3 160.8 182.0 204.0 218.0 243.7 18 years . . . . . . . . . . . . . . . . . . . . . . . . . . . . . . 284 167.0 2.46 124.1 128.5 133.5 140.4 155.7 181.1 203.6 215.2 249.8 19 years . . . . . . . . . . . . . . . . . . . . . . . . . . . . . . 270 172.0 2.85 123.6 128.2 134.3 143.6 162.7 191.1 213.8 225.6 244.4
Female
0–2 months . . . . . . . . . . . . . . . . . . . . . . . . . . . . 84 11.2 0.32 * * * 10.0 10.8 12.0 * * * 3–5 months . . . . . . . . . . . . . . . . . . . . . . . . . . . . 119 15.4 0.22 * * 13.2 13.9 15.3 16.4 17.3 * * 6–8 months . . . . . . . . . . . . . . . . . . . . . . . . . . . . 100 17.9 0.25 * * * 16.3 17.7 18.9 * * * 9–11 months . . . . . . . . . . . . . . . . . . . . . . . . . . . . 112 20.3 0.34 * * 17.0 18.0 20.1 21.6 22.9 * * 1 year . . . . . . . . . . . . . . . . . . . . . . . . . . . . . . . . 228 23.9 0.23 * 20.0 20.6 21.5 23.4 26.0 27.4 28.4 * 2 years . . . . . . . . . . . . . . . . . . . . . . . . . . . . . . . 248 29.3 0.33 * 24.5 25.3 26.3 28.4 31.2 32.6 34.3 * 3 years . . . . . . . . . . . . . . . . . . . . . . . . . . . . . . . 178 33.5 0.49 * 28.4 29.3 30.5 33.2 35.6 37.9 38.6 * 4 years . . . . . . . . . . . . . . . . . . . . . . . . . . . . . . . 191 39.6 0.71 * 32.4 33.4 34.3 38.0 42.2 44.1 46.0 * 5 years . . . . . . . . . . . . . . . . . . . . . . . . . . . . . . . 186 45.4 1.27 * 36.6 37.9 38.9 42.3 48.6 55.5 59.4 * 6 years . . . . . . . . . . . . . . . . . . . . . . . . . . . . . . . 171 49.3 1.09 * 39.5 40.9 42.7 47.3 53.2 58.0 61.0 * 7 years . . . . . . . . . . . . . . . . . . . . . . . . . . . . . . . 196 57.0 1.02 * 44.7 47.3 49.2 54.4 62.4 68.9 72.5 * 8 years . . . . . . . . . . . . . . . . . . . . . . . . . . . . . . . 184 70.3 2.57 * 49.3 52.1 55.8 64.1 79.2 88.8 97.3 * 9 years . . . . . . . . . . . . . . . . . . . . . . . . . . . . . . . 183 78.1 1.60 * 56.5 59.4 63.5 75.2 90.5 98.4 106.7 * 10 years . . . . . . . . . . . . . . . . . . . . . . . . . . . . . . 164 88.1 2.27 * 61.3 64.5 70.2 84.5 98.7 115.0 118.9 * 11 years . . . . . . . . . . . . . . . . . . . . . . . . . . . . . . 194 106.0 2.88 * 72.6 78.2 83.9 98.9 122.3 141.8 152.2 * 12 years . . . . . . . . . . . . . . . . . . . . . . . . . . . . . . 316 115.0 2.33 78.3 80.1 82.5 95.1 109.6 128.8 142.6 152.7 172.5 13 years . . . . . . . . . . . . . . . . . . . . . . . . . . . . . . 321 127.0 3.02 87.5 90.4 95.4 101.2 122.4 143.0 159.8 175.6 192.2 14 years . . . . . . . . . . . . . . . . . . . . . . . . . . . . . . 324 132.0 2.22 96.8 101.8 104.7 111.5 124.1 139.8 161.0 178.4 197.3 15 years . . . . . . . . . . . . . . . . . . . . . . . . . . . . . . 266 135.0 3.74 * 100.8 107.1 112.8 126.9 148.2 166.2 183.6 * 16 years . . . . . . . . . . . . . . . . . . . . . . . . . . . . . . 273 139.0 2.61 * 105.3 109.2 115.3 130.3 154.8 175.6 185.5 * 17 years . . . . . . . . . . . . . . . . . . . . . . . . . . . . . . 256 136.0 2.66 * 102.9 107.7 116.5 130.8 144.3 157.7 170.3 * 18 years . . . . . . . . . . . . . . . . . . . . . . . . . . . . . . 243 144.0 3.34 * 103.6 106.3 113.9 134.3 161.7 191.9 205.5 * 19 years . . . . . . . . . . . . . . . . . . . . . . . . . . . . . . 225 150.0 2.67 * 106.2 113.3 122.8 141.3 169.7 191.9 203.0 *
* Figure does not meet standard of reliability or precision.
NOTE: Pregnant women are excluded.
9 Advance Data No. 361 + July 7, 2005
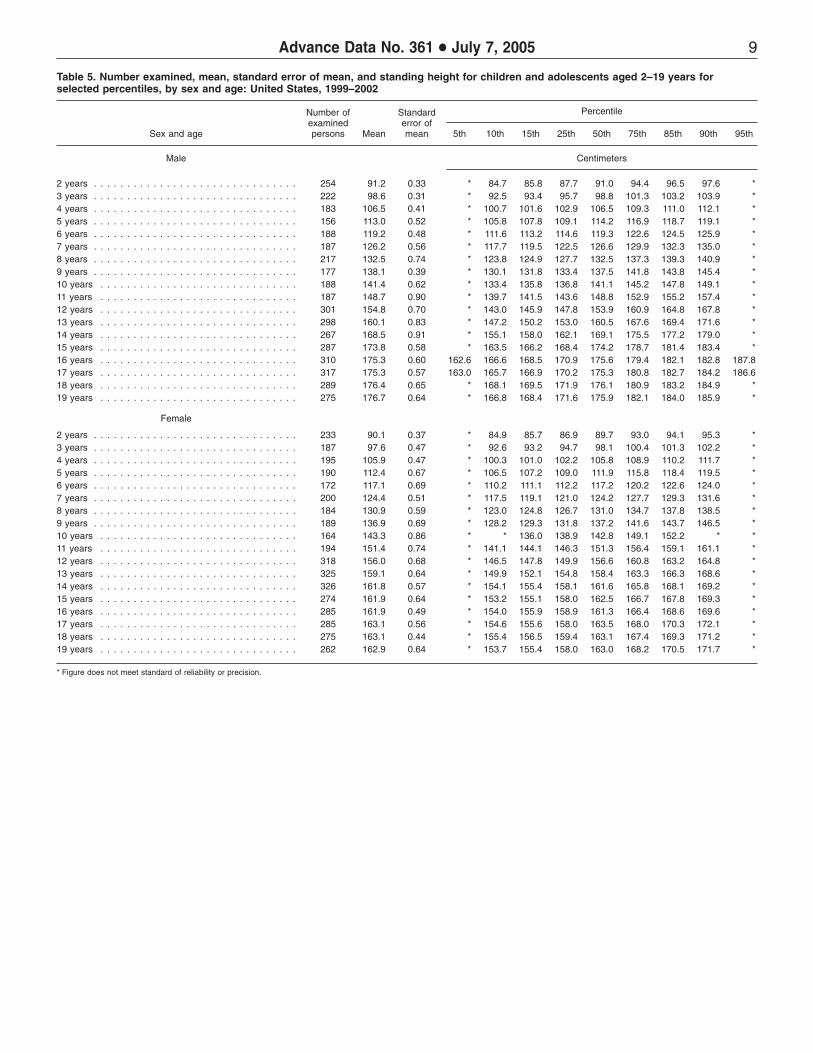
Table 5. Number examined, mean, standard error of mean, and standing height for children and adolescents aged 2–19 years for selected percentiles, by sex and age: United States, 1999–2002
Number of Standard Percentile examined error of
Sex and age persons Mean mean 5th 10th 15th 25th 50th 75th 85th 90th 95th
Male Centimeters
2 years . . . . . . . . . . . . . . . . . . . . . . . . . . . . . . . 254 91.2 0.33 * 84.7 85.8 87.7 91.0 94.4 96.5 97.6 * 3 years . . . . . . . . . . . . . . . . . . . . . . . . . . . . . . . 222 98.6 0.31 * 92.5 93.4 95.7 98.8 101.3 103.2 103.9 *4 years . . . . . . . . . . . . . . . . . . . . . . . . . . . . . . . 183 106.5 0.41 * 100.7 101.6 102.9 106.5 109.3 111.0 112.1 *5 years . . . . . . . . . . . . . . . . . . . . . . . . . . . . . . . 156 113.0 0.52 * 105.8 107.8 109.1 114.2 116.9 118.7 119.1 *6 years . . . . . . . . . . . . . . . . . . . . . . . . . . . . . . . 188 119.2 0.48 * 111.6 113.2 114.6 119.3 122.6 124.5 125.9 *7 years . . . . . . . . . . . . . . . . . . . . . . . . . . . . . . . 187 126.2 0.56 * 117.7 119.5 122.5 126.6 129.9 132.3 135.0 *8 years . . . . . . . . . . . . . . . . . . . . . . . . . . . . . . . 217 132.5 0.74 * 123.8 124.9 127.7 132.5 137.3 139.3 140.9 *9 years . . . . . . . . . . . . . . . . . . . . . . . . . . . . . . . 177 138.1 0.39 * 130.1 131.8 133.4 137.5 141.8 143.8 145.4 *10 years . . . . . . . . . . . . . . . . . . . . . . . . . . . . . . 188 141.4 0.62 * 133.4 135.8 136.8 141.1 145.2 147.8 149.1 *11 years . . . . . . . . . . . . . . . . . . . . . . . . . . . . . . 187 148.7 0.90 * 139.7 141.5 143.6 148.8 152.9 155.2 157.4 *12 years . . . . . . . . . . . . . . . . . . . . . . . . . . . . . . 301 154.8 0.70 * 143.0 145.9 147.8 153.9 160.9 164.8 167.8 *13 years . . . . . . . . . . . . . . . . . . . . . . . . . . . . . . 298 160.1 0.83 * 147.2 150.2 153.0 160.5 167.6 169.4 171.6 *14 years . . . . . . . . . . . . . . . . . . . . . . . . . . . . . . 267 168.5 0.91 * 155.1 158.0 162.1 169.1 175.5 177.2 179.0 *15 years . . . . . . . . . . . . . . . . . . . . . . . . . . . . . . 287 173.8 0.58 * 163.5 166.2 168.4 174.2 178.7 181.4 183.4 *16 years . . . . . . . . . . . . . . . . . . . . . . . . . . . . . . 310 175.3 0.60 162.6 166.6 168.5 170.9 175.6 179.4 182.1 182.8 187.817 years . . . . . . . . . . . . . . . . . . . . . . . . . . . . . . 317 175.3 0.57 163.0 165.7 166.9 170.2 175.3 180.8 182.7 184.2 186.618 years . . . . . . . . . . . . . . . . . . . . . . . . . . . . . . 289 176.4 0.65 * 168.1 169.5 171.9 176.1 180.9 183.2 184.9 *19 years . . . . . . . . . . . . . . . . . . . . . . . . . . . . . . 275 176.7 0.64 * 166.8 168.4 171.6 175.9 182.1 184.0 185.9 *
Female
2 years . . . . . . . . . . . . . . . . . . . . . . . . . . . . . . . 233 90.1 0.37 * 84.9 85.7 86.9 89.7 93.0 94.1 95.3 * 3 years . . . . . . . . . . . . . . . . . . . . . . . . . . . . . . . 187 97.6 0.47 * 92.6 93.2 94.7 98.1 100.4 101.3 102.2 *4 years . . . . . . . . . . . . . . . . . . . . . . . . . . . . . . . 195 105.9 0.47 * 100.3 101.0 102.2 105.8 108.9 110.2 111.7 *5 years . . . . . . . . . . . . . . . . . . . . . . . . . . . . . . . 190 112.4 0.67 * 106.5 107.2 109.0 111.9 115.8 118.4 119.5 *6 years . . . . . . . . . . . . . . . . . . . . . . . . . . . . . . . 172 117.1 0.69 * 110.2 111.1 112.2 117.2 120.2 122.6 124.0 *7 years . . . . . . . . . . . . . . . . . . . . . . . . . . . . . . . 200 124.4 0.51 * 117.5 119.1 121.0 124.2 127.7 129.3 131.6 *8 years . . . . . . . . . . . . . . . . . . . . . . . . . . . . . . . 184 130.9 0.59 * 123.0 124.8 126.7 131.0 134.7 137.8 138.5 *9 years . . . . . . . . . . . . . . . . . . . . . . . . . . . . . . . 189 136.9 0.69 * 128.2 129.3 131.8 137.2 141.6 143.7 146.5 *10 years . . . . . . . . . . . . . . . . . . . . . . . . . . . . . . 164 143.3 0.86 * * 136.0 138.9 142.8 149.1 152.2 * *11 years . . . . . . . . . . . . . . . . . . . . . . . . . . . . . . 194 151.4 0.74 * 141.1 144.1 146.3 151.3 156.4 159.1 161.1 *12 years . . . . . . . . . . . . . . . . . . . . . . . . . . . . . . 318 156.0 0.68 * 146.5 147.8 149.9 156.6 160.8 163.2 164.8 *13 years . . . . . . . . . . . . . . . . . . . . . . . . . . . . . . 325 159.1 0.64 * 149.9 152.1 154.8 158.4 163.3 166.3 168.6 *14 years . . . . . . . . . . . . . . . . . . . . . . . . . . . . . . 326 161.8 0.57 * 154.1 155.4 158.1 161.6 165.8 168.1 169.2 *15 years . . . . . . . . . . . . . . . . . . . . . . . . . . . . . . 274 161.9 0.64 * 153.2 155.1 158.0 162.5 166.7 167.8 169.3 *16 years . . . . . . . . . . . . . . . . . . . . . . . . . . . . . . 285 161.9 0.49 * 154.0 155.9 158.9 161.3 166.4 168.6 169.6 *17 years . . . . . . . . . . . . . . . . . . . . . . . . . . . . . . 285 163.1 0.56 * 154.6 155.6 158.0 163.5 168.0 170.3 172.1 *18 years . . . . . . . . . . . . . . . . . . . . . . . . . . . . . . 275 163.1 0.44 * 155.4 156.5 159.4 163.1 167.4 169.3 171.2 *19 years . . . . . . . . . . . . . . . . . . . . . . . . . . . . . . 262 162.9 0.64 * 153.7 155.4 158.0 163.0 168.2 170.5 171.7 *
* Figure does not meet standard of reliability or precision.

10 Advance Data No. 361 + July 7, 2005
Table 6. Number examined, mean, standard error of mean, and standing height for children and adolescents aged 2–19 years for selected percentiles, by sex and age: United States, 1999–2002
Number of Standard Percentile examined error of
Sex and age persons Mean mean 5th 10th 15th 25th 50th 75th 85th 90th 95th
Male Inches
2 years . . . . . . . . . . . . . . . . . . . . . . . . . . . . . . . 254 35.9 0.13 * 33.4 33.8 34.5 35.8 37.2 38.0 38.4 * 3 years . . . . . . . . . . . . . . . . . . . . . . . . . . . . . . . 222 38.8 0.12 * 36.4 36.8 37.7 38.9 39.9 40.6 40.9 * 4 years . . . . . . . . . . . . . . . . . . . . . . . . . . . . . . . 183 41.9 0.16 * 39.6 40.0 40.5 41.9 43.0 43.7 44.1 * 5 years . . . . . . . . . . . . . . . . . . . . . . . . . . . . . . . 156 44.5 0.20 * 41.7 42.4 43.0 45.0 46.0 46.7 46.9 * 6 years . . . . . . . . . . . . . . . . . . . . . . . . . . . . . . . 188 46.9 0.19 * 43.9 44.6 45.1 47.0 48.3 49.0 49.6 * 7 years . . . . . . . . . . . . . . . . . . . . . . . . . . . . . . . 187 49.7 0.22 * 46.4 47.0 48.2 49.8 51.2 52.1 53.2 * 8 years . . . . . . . . . . . . . . . . . . . . . . . . . . . . . . . 217 52.2 0.29 * 48.7 49.2 50.3 52.1 54.0 54.9 55.5 * 9 years . . . . . . . . . . . . . . . . . . . . . . . . . . . . . . . 177 54.4 0.15 * 51.2 51.9 52.5 54.1 55.8 56.6 57.3 * 10 years . . . . . . . . . . . . . . . . . . . . . . . . . . . . . . 188 55.7 0.24 * 52.5 53.5 53.9 55.6 57.2 58.2 58.7 * 11 years . . . . . . . . . . . . . . . . . . . . . . . . . . . . . . 187 58.5 0.36 * 55.0 55.7 56.5 58.6 60.2 61.1 62.0 * 12 years . . . . . . . . . . . . . . . . . . . . . . . . . . . . . . 301 60.9 0.28 * 56.3 57.4 58.2 60.6 63.3 64.9 66.0 * 13 years . . . . . . . . . . . . . . . . . . . . . . . . . . . . . . 298 63.1 0.33 * 58.0 59.1 60.2 63.2 66.0 66.7 67.6 * 14 years . . . . . . . . . . . . . . . . . . . . . . . . . . . . . . 267 66.3 0.36 * 61.1 62.2 63.8 66.6 69.1 69.8 70.5 * 15 years . . . . . . . . . . . . . . . . . . . . . . . . . . . . . . 287 68.4 0.23 * 64.4 65.4 66.3 68.6 70.4 71.4 72.2 * 16 years . . . . . . . . . . . . . . . . . . . . . . . . . . . . . . 310 69.0 0.23 64.0 65.6 66.3 67.3 69.1 70.6 71.7 72.0 73.9 17 years . . . . . . . . . . . . . . . . . . . . . . . . . . . . . . 317 69.0 0.22 64.2 65.2 65.7 67.0 69.0 71.2 71.9 72.5 73.5 18 years . . . . . . . . . . . . . . . . . . . . . . . . . . . . . . 289 69.5 0.26 * 66.2 66.7 67.7 69.3 71.2 72.1 72.8 * 19 years . . . . . . . . . . . . . . . . . . . . . . . . . . . . . . 275 69.6 0.25 * 65.7 66.3 67.6 69.3 71.7 72.4 73.2 *
Female
2 years . . . . . . . . . . . . . . . . . . . . . . . . . . . . . . . 233 35.5 0.15 * 33.4 33.8 34.2 35.3 36.6 37.0 37.5 * 3 years . . . . . . . . . . . . . . . . . . . . . . . . . . . . . . . 187 38.4 0.18 * 36.4 36.7 37.3 38.6 39.5 39.9 40.2 * 4 years . . . . . . . . . . . . . . . . . . . . . . . . . . . . . . . 195 41.7 0.18 * 39.5 39.8 40.2 41.6 42.9 43.4 44.0 * 5 years . . . . . . . . . . . . . . . . . . . . . . . . . . . . . . . 190 44.3 0.26 * 41.9 42.2 42.9 44.0 45.6 46.6 47.1 * 6 years . . . . . . . . . . . . . . . . . . . . . . . . . . . . . . . 172 46.1 0.27 * 43.4 43.8 44.2 46.1 47.3 48.3 48.8 * 7 years . . . . . . . . . . . . . . . . . . . . . . . . . . . . . . . 200 49.0 0.20 * 46.3 46.9 47.6 48.9 50.3 50.9 51.8 * 8 years . . . . . . . . . . . . . . . . . . . . . . . . . . . . . . . 184 51.5 0.23 * 48.4 49.1 49.9 51.6 53.0 54.3 54.5 * 9 years . . . . . . . . . . . . . . . . . . . . . . . . . . . . . . . 189 53.9 0.27 * 50.5 50.9 51.9 54.0 55.8 56.6 57.7 * 10 years . . . . . . . . . . . . . . . . . . . . . . . . . . . . . . 164 56.4 0.34 * * 53.5 54.7 56.2 58.7 59.9 * * 11 years . . . . . . . . . . . . . . . . . . . . . . . . . . . . . . 194 59.6 0.29 * 55.6 56.7 57.6 59.6 61.6 62.6 63.4 * 12 years . . . . . . . . . . . . . . . . . . . . . . . . . . . . . . 318 61.4 0.27 * 57.7 58.2 59.0 61.7 63.3 64.2 64.9 * 13 years . . . . . . . . . . . . . . . . . . . . . . . . . . . . . . 325 62.6 0.25 * 59.0 59.9 60.9 62.3 64.3 65.5 66.4 * 14 years . . . . . . . . . . . . . . . . . . . . . . . . . . . . . . 326 63.7 0.23 * 60.7 61.2 62.3 63.6 65.3 66.2 66.6 * 15 years . . . . . . . . . . . . . . . . . . . . . . . . . . . . . . 274 63.8 0.25 * 60.3 61.0 62.2 64.0 65.6 66.1 66.7 * 16 years . . . . . . . . . . . . . . . . . . . . . . . . . . . . . . 285 63.7 0.19 * 60.6 61.4 62.6 63.5 65.5 66.4 66.8 * 17 years . . . . . . . . . . . . . . . . . . . . . . . . . . . . . . 285 64.2 0.22 * 60.9 61.3 62.2 64.4 66.1 67.1 67.8 * 18 years . . . . . . . . . . . . . . . . . . . . . . . . . . . . . . 275 64.2 0.17 * 61.2 61.6 62.8 64.2 65.9 66.6 67.4 * 19 years . . . . . . . . . . . . . . . . . . . . . . . . . . . . . . 262 64.1 0.25 * 60.5 61.2 62.2 64.2 66.2 67.1 67.6 *
* Figure does not meet standard of reliability or precision.
11 Advance Data No. 361 + July 7, 2005
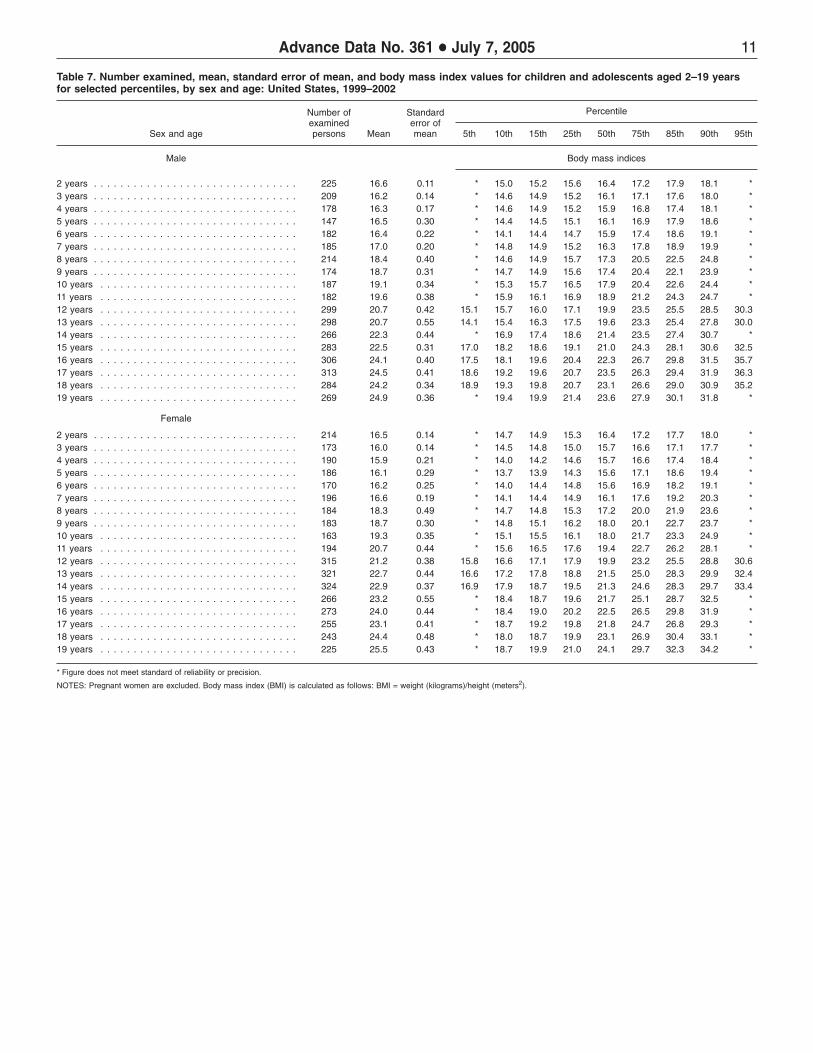
Table 7. Number examined, mean, standard error of mean, and body mass index values for children and adolescents aged 2–19 years for selected percentiles, by sex and age: United States, 1999–2002
Number of Standard Percentile examined error of
Sex and age persons Mean mean 5th 10th 15th 25th 50th 75th 85th 90th 95th
Male Body mass indices
2 years . . . . . . . . . . . . . . . . . . . . . . . . . . . . . . . 225 16.6 0.11 * 15.0 15.2 15.6 16.4 17.2 17.9 18.1 *3 years . . . . . . . . . . . . . . . . . . . . . . . . . . . . . . . 209 16.2 0.14 * 14.6 14.9 15.2 16.1 17.1 17.6 18.0 *4 years . . . . . . . . . . . . . . . . . . . . . . . . . . . . . . . 178 16.3 0.17 * 14.6 14.9 15.2 15.9 16.8 17.4 18.1 *5 years . . . . . . . . . . . . . . . . . . . . . . . . . . . . . . . 147 16.5 0.30 * 14.4 14.5 15.1 16.1 16.9 17.9 18.6 *6 years . . . . . . . . . . . . . . . . . . . . . . . . . . . . . . . 182 16.4 0.22 * 14.1 14.4 14.7 15.9 17.4 18.6 19.1 *7 years . . . . . . . . . . . . . . . . . . . . . . . . . . . . . . . 185 17.0 0.20 * 14.8 14.9 15.2 16.3 17.8 18.9 19.9 *8 years . . . . . . . . . . . . . . . . . . . . . . . . . . . . . . . 214 18.4 0.40 * 14.6 14.9 15.7 17.3 20.5 22.5 24.8 *9 years . . . . . . . . . . . . . . . . . . . . . . . . . . . . . . . 174 18.7 0.31 * 14.7 14.9 15.6 17.4 20.4 22.1 23.9 *10 years . . . . . . . . . . . . . . . . . . . . . . . . . . . . . . 187 19.1 0.34 * 15.3 15.7 16.5 17.9 20.4 22.6 24.4 *11 years . . . . . . . . . . . . . . . . . . . . . . . . . . . . . . 182 19.6 0.38 * 15.9 16.1 16.9 18.9 21.2 24.3 24.7 * 12 years . . . . . . . . . . . . . . . . . . . . . . . . . . . . . . 299 20.7 0.42 15.1 15.7 16.0 17.1 19.9 23.5 25.5 28.5 30.313 years . . . . . . . . . . . . . . . . . . . . . . . . . . . . . . 298 20.7 0.55 14.1 15.4 16.3 17.5 19.6 23.3 25.4 27.8 30.014 years . . . . . . . . . . . . . . . . . . . . . . . . . . . . . . 266 22.3 0.44 * 16.9 17.4 18.6 21.4 23.5 27.4 30.7 *15 years . . . . . . . . . . . . . . . . . . . . . . . . . . . . . . 283 22.5 0.31 17.0 18.2 18.6 19.1 21.0 24.3 28.1 30.6 32.516 years . . . . . . . . . . . . . . . . . . . . . . . . . . . . . . 306 24.1 0.40 17.5 18.1 19.6 20.4 22.3 26.7 29.8 31.5 35.717 years . . . . . . . . . . . . . . . . . . . . . . . . . . . . . . 313 24.5 0.41 18.6 19.2 19.6 20.7 23.5 26.3 29.4 31.9 36.318 years . . . . . . . . . . . . . . . . . . . . . . . . . . . . . . 284 24.2 0.34 18.9 19.3 19.8 20.7 23.1 26.6 29.0 30.9 35.219 years . . . . . . . . . . . . . . . . . . . . . . . . . . . . . . 269 24.9 0.36 * 19.4 19.9 21.4 23.6 27.9 30.1 31.8 *
Female
2 years . . . . . . . . . . . . . . . . . . . . . . . . . . . . . . . 214 16.5 0.14 * 14.7 14.9 15.3 16.4 17.2 17.7 18.0 *3 years . . . . . . . . . . . . . . . . . . . . . . . . . . . . . . . 173 16.0 0.14 * 14.5 14.8 15.0 15.7 16.6 17.1 17.7 *4 years . . . . . . . . . . . . . . . . . . . . . . . . . . . . . . . 190 15.9 0.21 * 14.0 14.2 14.6 15.7 16.6 17.4 18.4 *5 years . . . . . . . . . . . . . . . . . . . . . . . . . . . . . . . 186 16.1 0.29 * 13.7 13.9 14.3 15.6 17.1 18.6 19.4 *6 years . . . . . . . . . . . . . . . . . . . . . . . . . . . . . . . 170 16.2 0.25 * 14.0 14.4 14.8 15.6 16.9 18.2 19.1 *7 years . . . . . . . . . . . . . . . . . . . . . . . . . . . . . . . 196 16.6 0.19 * 14.1 14.4 14.9 16.1 17.6 19.2 20.3 *8 years . . . . . . . . . . . . . . . . . . . . . . . . . . . . . . . 184 18.3 0.49 * 14.7 14.8 15.3 17.2 20.0 21.9 23.6 *9 years . . . . . . . . . . . . . . . . . . . . . . . . . . . . . . . 183 18.7 0.30 * 14.8 15.1 16.2 18.0 20.1 22.7 23.7 *10 years . . . . . . . . . . . . . . . . . . . . . . . . . . . . . . 163 19.3 0.35 * 15.1 15.5 16.1 18.0 21.7 23.3 24.9 *11 years . . . . . . . . . . . . . . . . . . . . . . . . . . . . . . 194 20.7 0.44 * 15.6 16.5 17.6 19.4 22.7 26.2 28.1 * 12 years . . . . . . . . . . . . . . . . . . . . . . . . . . . . . . 315 21.2 0.38 15.8 16.6 17.1 17.9 19.9 23.2 25.5 28.8 30.613 years . . . . . . . . . . . . . . . . . . . . . . . . . . . . . . 321 22.7 0.44 16.6 17.2 17.8 18.8 21.5 25.0 28.3 29.9 32.414 years . . . . . . . . . . . . . . . . . . . . . . . . . . . . . . 324 22.9 0.37 16.9 17.9 18.7 19.5 21.3 24.6 28.3 29.7 33.415 years . . . . . . . . . . . . . . . . . . . . . . . . . . . . . . 266 23.2 0.55 * 18.4 18.7 19.6 21.7 25.1 28.7 32.5 *16 years . . . . . . . . . . . . . . . . . . . . . . . . . . . . . . 273 24.0 0.44 * 18.4 19.0 20.2 22.5 26.5 29.8 31.9 *17 years . . . . . . . . . . . . . . . . . . . . . . . . . . . . . . 255 23.1 0.41 * 18.7 19.2 19.8 21.8 24.7 26.8 29.3 *18 years . . . . . . . . . . . . . . . . . . . . . . . . . . . . . . 243 24.4 0.48 * 18.0 18.7 19.9 23.1 26.9 30.4 33.1 *19 years . . . . . . . . . . . . . . . . . . . . . . . . . . . . . . 225 25.5 0.43 * 18.7 19.9 21.0 24.1 29.7 32.3 34.2 *
* Figure does not meet standard of reliability or precision.
NOTES: Pregnant women are excluded. Body mass index (BMI) is calculated as follows: BMI = weight (kilograms)/height (meters2).
12 Advance Data No. 361 + July 7, 2005
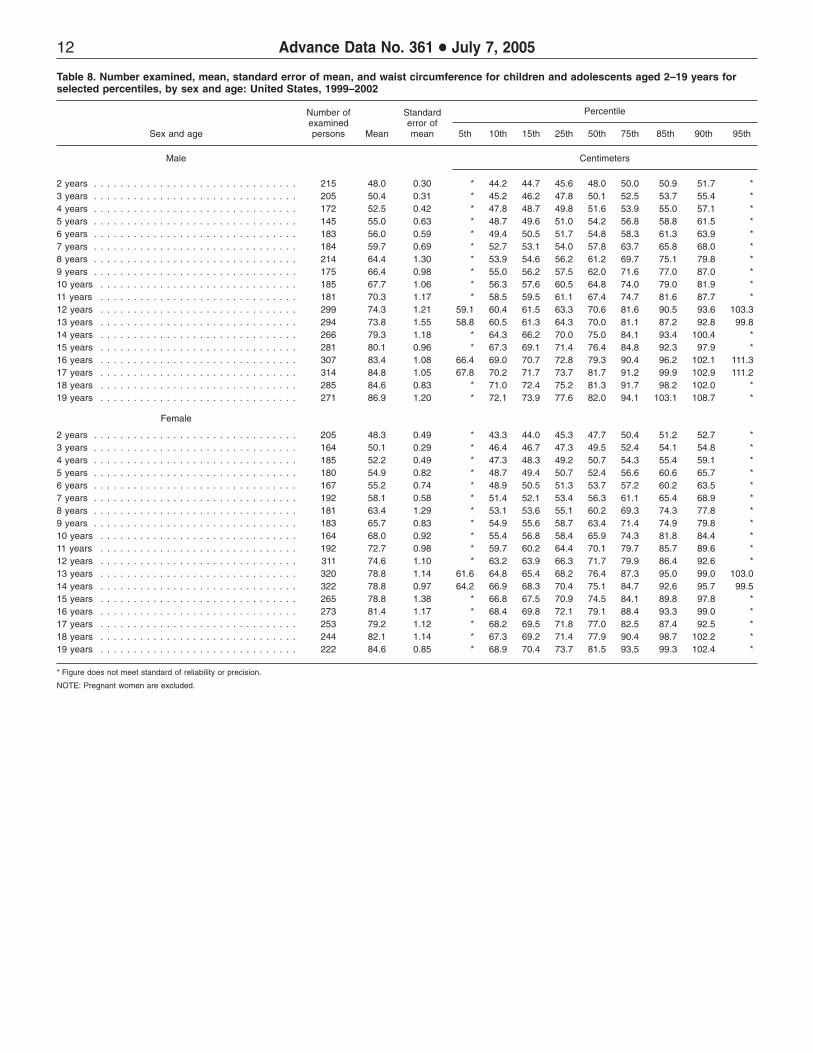
Table 8. Number examined, mean, standard error of mean, and waist circumference for children and adolescents aged 2–19 years for selected percentiles, by sex and age: United States, 1999–2002
Number of Standard Percentile examined error of
Sex and age persons Mean mean 5th 10th 15th 25th 50th 75th 85th 90th 95th
Male Centimeters
2 years . . . . . . . . . . . . . . . . . . . . . . . . . . . . . . . 215 48.0 0.30 * 44.2 44.7 45.6 48.0 50.0 50.9 51.7 * 3 years . . . . . . . . . . . . . . . . . . . . . . . . . . . . . . . 205 50.4 0.31 * 45.2 46.2 47.8 50.1 52.5 53.7 55.4 * 4 years . . . . . . . . . . . . . . . . . . . . . . . . . . . . . . . 172 52.5 0.42 * 47.8 48.7 49.8 51.6 53.9 55.0 57.1 * 5 years . . . . . . . . . . . . . . . . . . . . . . . . . . . . . . . 145 55.0 0.63 * 48.7 49.6 51.0 54.2 56.8 58.8 61.5 * 6 years . . . . . . . . . . . . . . . . . . . . . . . . . . . . . . . 183 56.0 0.59 * 49.4 50.5 51.7 54.8 58.3 61.3 63.9 * 7 years . . . . . . . . . . . . . . . . . . . . . . . . . . . . . . . 184 59.7 0.69 * 52.7 53.1 54.0 57.8 63.7 65.8 68.0 * 8 years . . . . . . . . . . . . . . . . . . . . . . . . . . . . . . . 214 64.4 1.30 * 53.9 54.6 56.2 61.2 69.7 75.1 79.8 * 9 years . . . . . . . . . . . . . . . . . . . . . . . . . . . . . . . 175 66.4 0.98 * 55.0 56.2 57.5 62.0 71.6 77.0 87.0 * 10 years . . . . . . . . . . . . . . . . . . . . . . . . . . . . . . 185 67.7 1.06 * 56.3 57.6 60.5 64.8 74.0 79.0 81.9 * 11 years . . . . . . . . . . . . . . . . . . . . . . . . . . . . . . 181 70.3 1.17 * 58.5 59.5 61.1 67.4 74.7 81.6 87.7 * 12 years . . . . . . . . . . . . . . . . . . . . . . . . . . . . . . 299 74.3 1.21 59.1 60.4 61.5 63.3 70.6 81.6 90.5 93.6 103.3 13 years . . . . . . . . . . . . . . . . . . . . . . . . . . . . . . 294 73.8 1.55 58.8 60.5 61.3 64.3 70.0 81.1 87.2 92.8 99.8 14 years . . . . . . . . . . . . . . . . . . . . . . . . . . . . . . 266 79.3 1.18 * 64.3 66.2 70.0 75.0 84.1 93.4 100.4 * 15 years . . . . . . . . . . . . . . . . . . . . . . . . . . . . . . 281 80.1 0.96 * 67.3 69.1 71.4 76.4 84.8 92.3 97.9 * 16 years . . . . . . . . . . . . . . . . . . . . . . . . . . . . . . 307 83.4 1.08 66.4 69.0 70.7 72.8 79.3 90.4 96.2 102.1 111.3 17 years . . . . . . . . . . . . . . . . . . . . . . . . . . . . . . 314 84.8 1.05 67.8 70.2 71.7 73.7 81.7 91.2 99.9 102.9 111.2 18 years . . . . . . . . . . . . . . . . . . . . . . . . . . . . . . 285 84.6 0.83 * 71.0 72.4 75.2 81.3 91.7 98.2 102.0 * 19 years . . . . . . . . . . . . . . . . . . . . . . . . . . . . . . 271 86.9 1.20 * 72.1 73.9 77.6 82.0 94.1 103.1 108.7 *
Female
2 years . . . . . . . . . . . . . . . . . . . . . . . . . . . . . . . 205 48.3 0.49 * 43.3 44.0 45.3 47.7 50.4 51.2 52.7 * 3 years . . . . . . . . . . . . . . . . . . . . . . . . . . . . . . . 164 50.1 0.29 * 46.4 46.7 47.3 49.5 52.4 54.1 54.8 * 4 years . . . . . . . . . . . . . . . . . . . . . . . . . . . . . . . 185 52.2 0.49 * 47.3 48.3 49.2 50.7 54.3 55.4 59.1 * 5 years . . . . . . . . . . . . . . . . . . . . . . . . . . . . . . . 180 54.9 0.82 * 48.7 49.4 50.7 52.4 56.6 60.6 65.7 * 6 years . . . . . . . . . . . . . . . . . . . . . . . . . . . . . . . 167 55.2 0.74 * 48.9 50.5 51.3 53.7 57.2 60.2 63.5 * 7 years . . . . . . . . . . . . . . . . . . . . . . . . . . . . . . . 192 58.1 0.58 * 51.4 52.1 53.4 56.3 61.1 65.4 68.9 * 8 years . . . . . . . . . . . . . . . . . . . . . . . . . . . . . . . 181 63.4 1.29 * 53.1 53.6 55.1 60.2 69.3 74.3 77.8 * 9 years . . . . . . . . . . . . . . . . . . . . . . . . . . . . . . . 183 65.7 0.83 * 54.9 55.6 58.7 63.4 71.4 74.9 79.8 * 10 years . . . . . . . . . . . . . . . . . . . . . . . . . . . . . . 164 68.0 0.92 * 55.4 56.8 58.4 65.9 74.3 81.8 84.4 * 11 years . . . . . . . . . . . . . . . . . . . . . . . . . . . . . . 192 72.7 0.98 * 59.7 60.2 64.4 70.1 79.7 85.7 89.6 * 12 years . . . . . . . . . . . . . . . . . . . . . . . . . . . . . . 311 74.6 1.10 * 63.2 63.9 66.3 71.7 79.9 86.4 92.6 * 13 years . . . . . . . . . . . . . . . . . . . . . . . . . . . . . . 320 78.8 1.14 61.6 64.8 65.4 68.2 76.4 87.3 95.0 99.0 103.0 14 years . . . . . . . . . . . . . . . . . . . . . . . . . . . . . . 322 78.8 0.97 64.2 66.9 68.3 70.4 75.1 84.7 92.6 95.7 99.5 15 years . . . . . . . . . . . . . . . . . . . . . . . . . . . . . . 265 78.8 1.38 * 66.8 67.5 70.9 74.5 84.1 89.8 97.8 * 16 years . . . . . . . . . . . . . . . . . . . . . . . . . . . . . . 273 81.4 1.17 * 68.4 69.8 72.1 79.1 88.4 93.3 99.0 * 17 years . . . . . . . . . . . . . . . . . . . . . . . . . . . . . . 253 79.2 1.12 * 68.2 69.5 71.8 77.0 82.5 87.4 92.5 * 18 years . . . . . . . . . . . . . . . . . . . . . . . . . . . . . . 244 82.1 1.14 * 67.3 69.2 71.4 77.9 90.4 98.7 102.2 * 19 years . . . . . . . . . . . . . . . . . . . . . . . . . . . . . . 222 84.6 0.85 * 68.9 70.4 73.7 81.5 93.5 99.3 102.4 *
* Figure does not meet standard of reliability or precision.
NOTE: Pregnant women are excluded.

13 Advance Data No. 361 + July 7, 2005
Table 9. Number examined, mean, standard error of mean, and mid-arm circumference for children and adolescents aged 2 months–19 years for selected percentiles, by sex and age: United States, 1999–2002
Sex and age
Number of examined persons Mean
Standard error of mean 5th 10th 15th
Percentile
25th 50th 75th 85th 90th 95th
Male Centimeters
2 months . . . . . . . . . . . . . . . . . . . . . . . . . . . . . . 16 * * * * * * * * * * * 3–5 months . . . . . . . . . . . . . . . . . . . . . . . . . . . . 107 14.6 0.15 * * 13.1 13.6 14.7 15.4 16.0 * * 6–8 months . . . . . . . . . . . . . . . . . . . . . . . . . . . . 119 15.2 0.14 * * 13.9 14.1 15.0 16.1 16.3 * * 9–11 months . . . . . . . . . . . . . . . . . . . . . . . . . . . . 125 15.6 0.11 * * 14.4 14.9 15.5 16.2 16.5 * * 1 year . . . . . . . . . . . . . . . . . . . . . . . . . . . . . . . . 293 16.0 0.11 13.9 14.3 14.6 15.1 15.7 16.7 17.3 17.6 18.1 2 years . . . . . . . . . . . . . . . . . . . . . . . . . . . . . . . 256 16.4 0.10 * 14.8 15.0 15.4 16.3 17.3 17.7 17.9 * 3 years . . . . . . . . . . . . . . . . . . . . . . . . . . . . . . . 215 17.0 0.13 * 15.4 15.7 16.0 16.7 17.7 18.2 18.6 * 4 years . . . . . . . . . . . . . . . . . . . . . . . . . . . . . . . 176 17.7 0.15 * 16.0 16.2 16.5 17.5 18.3 18.7 19.2 * 5 years . . . . . . . . . . . . . . . . . . . . . . . . . . . . . . . 150 18.3 0.21 * 16.2 16.4 16.8 17.9 19.0 20.1 20.7 * 6 years . . . . . . . . . . . . . . . . . . . . . . . . . . . . . . . 185 18.9 0.21 * 16.3 16.8 17.3 18.4 20.2 20.9 21.4 * 7 years . . . . . . . . . . . . . . . . . . . . . . . . . . . . . . . 185 20.1 0.23 * 17.7 17.9 18.2 19.4 21.2 22.4 23.2 * 8 years . . . . . . . . . . . . . . . . . . . . . . . . . . . . . . . 213 21.6 0.34 * 17.6 18.1 18.8 20.8 24.2 26.0 27.1 * 9 years . . . . . . . . . . . . . . . . . . . . . . . . . . . . . . . 174 22.4 0.26 * 18.4 18.6 19.3 21.5 23.9 26.9 27.2 * 10 years . . . . . . . . . . . . . . . . . . . . . . . . . . . . . . 184 23.2 0.31 * 19.0 19.8 20.8 22.4 24.5 26.1 28.1 * 11 years . . . . . . . . . . . . . . . . . . . . . . . . . . . . . . 182 24.2 0.34 * 19.8 20.3 21.1 24.1 26.2 28.1 29.0 * 12 years . . . . . . . . . . . . . . . . . . . . . . . . . . . . . . 302 25.5 0.43 19.5 20.3 20.9 21.7 24.6 28.1 30.3 32.4 34.4 13 years . . . . . . . . . . . . . . . . . . . . . . . . . . . . . . 295 26.1 0.52 19.4 20.1 21.4 22.7 25.6 29.3 30.9 32.7 34.4 14 years . . . . . . . . . . . . . . . . . . . . . . . . . . . . . . 267 28.0 0.41 * 23.2 23.6 24.6 27.0 30.2 33.3 35.6 * 15 years . . . . . . . . . . . . . . . . . . . . . . . . . . . . . . 283 28.7 0.31 23.0 24.4 24.8 26.0 27.6 30.9 33.5 35.0 36.4 16 years . . . . . . . . . . . . . . . . . . . . . . . . . . . . . . 308 30.7 0.35 23.8 25.6 26.4 27.5 29.6 33.2 36.2 37.8 39.8 17 years . . . . . . . . . . . . . . . . . . . . . . . . . . . . . . 314 31.1 0.34 25.1 25.9 26.5 27.8 30.9 33.2 35.4 36.2 39.0 18 years . . . . . . . . . . . . . . . . . . . . . . . . . . . . . . 285 31.4 0.28 25.7 26.5 27.1 28.2 30.6 33.6 35.4 36.9 39.2 19 years . . . . . . . . . . . . . . . . . . . . . . . . . . . . . . 272 31.8 0.31 26.3 26.5 27.3 28.5 31.6 34.7 35.7 37.0 38.9
Female
0–2 months . . . . . . . . . . . . . . . . . . . . . . . . . . . . 14 * * * * * * * * * * * 3–5 months . . . . . . . . . . . . . . . . . . . . . . . . . . . . 116 14.4 0.12 * * 13.2 13.4 14.4 15.0 15.4 * * 6–8 months . . . . . . . . . . . . . . . . . . . . . . . . . . . . 100 15.1 0.13 * * 13.8 14.2 15.1 15.8 16.3 * * 9–11 months . . . . . . . . . . . . . . . . . . . . . . . . . . . . 113 15.7 0.16 * * 14.2 14.5 15.5 16.8 17.3 * * 1 year . . . . . . . . . . . . . . . . . . . . . . . . . . . . . . . . 238 15.8 0.11 * 14.2 14.6 14.9 15.7 16.5 17.0 17.3 * 2 years . . . . . . . . . . . . . . . . . . . . . . . . . . . . . . . 242 16.3 0.10 * 14.7 15.0 15.3 16.1 16.9 17.4 17.7 * 3 years . . . . . . . . . . . . . . . . . . . . . . . . . . . . . . . 173 16.7 0.13 * 15.0 15.5 15.9 16.6 17.2 17.9 18.3 * 4 years . . . . . . . . . . . . . . . . . . . . . . . . . . . . . . . 187 17.5 0.21 * 15.5 15.8 16.2 17.1 18.2 18.9 19.3 * 5 years . . . . . . . . . . . . . . . . . . . . . . . . . . . . . . . 186 18.2 0.25 * 16.0 16.3 16.7 17.5 19.3 20.7 21.4 * 6 years . . . . . . . . . . . . . . . . . . . . . . . . . . . . . . . 169 18.7 0.24 * 16.4 16.7 17.3 18.2 19.6 20.7 21.5 * 7 years . . . . . . . . . . . . . . . . . . . . . . . . . . . . . . . 196 19.6 0.17 * 16.9 17.6 18.0 19.2 20.7 21.7 23.3 * 8 years . . . . . . . . . . . . . . . . . . . . . . . . . . . . . . . 180 21.7 0.48 * 18.0 18.2 18.6 20.9 23.9 25.4 26.9 * 9 years . . . . . . . . . . . . . . . . . . . . . . . . . . . . . . . 185 22.5 0.26 * 18.6 19.2 20.0 21.9 24.4 25.6 26.9 * 10 years . . . . . . . . . . . . . . . . . . . . . . . . . . . . . . 163 23.5 0.37 * 19.1 19.4 20.1 22.9 25.6 27.8 28.7 * 11 years . . . . . . . . . . . . . . . . . . . . . . . . . . . . . . 191 25.0 0.44 * 20.0 20.5 21.9 24.0 26.9 30.2 31.8 * 12 years . . . . . . . . . . . . . . . . . . . . . . . . . . . . . . 313 25.5 0.33 20.0 21.0 21.7 22.6 24.7 27.5 29.5 31.0 33.4 13 years . . . . . . . . . . . . . . . . . . . . . . . . . . . . . . 322 27.0 0.38 20.8 21.8 22.5 23.3 26.4 30.0 32.2 33.5 35.9 14 years . . . . . . . . . . . . . . . . . . . . . . . . . . . . . . 327 27.2 0.30 22.0 22.8 23.4 24.3 26.2 29.2 31.6 33.1 35.5 15 years . . . . . . . . . . . . . . . . . . . . . . . . . . . . . . 269 27.6 0.48 * 23.1 23.6 24.8 26.4 29.4 32.7 34.5 * 16 years . . . . . . . . . . . . . . . . . . . . . . . . . . . . . . 275 28.1 0.37 * 23.0 23.5 25.0 27.5 30.4 33.0 33.5 * 17 years . . . . . . . . . . . . . . . . . . . . . . . . . . . . . . 255 27.9 0.33 * 23.2 24.1 25.1 27.4 29.3 31.1 32.7 * 18 years . . . . . . . . . . . . . . . . . . . . . . . . . . . . . . 245 28.9 0.34 * 23.1 24.0 25.1 28.2 31.0 33.8 36.1 * 19 years . . . . . . . . . . . . . . . . . . . . . . . . . . . . . . 223 29.5 0.37 * 24.1 25.2 26.1 28.4 32.3 35.1 36.4 *
* Figure does not meet standard of reliability or precision.
NOTE: Pregnant women are excluded.

14 Advance Data No. 361 + July 7, 2005
Table 10. Number examined, mean, standard error of mean, and upper arm length for children and adolescents aged 2 months–19 years for selected percentiles, by sex and age: United States, 1999–2002
Number of Standard Percentile examined error of
Sex and age persons Mean mean 5th 10th 15th 25th 50th 75th 85th 90th 95th
Male Centimeters
2 months . . . . . . . . . . . . . . . . . . . . . . . . . . . . . . 16 * * * * * * * * * * *3–5 months . . . . . . . . . . . . . . . . . . . . . . . . . . . . 107 12.4 0.16 * * 11.0 11.5 12.2 13.2 13.5 * * 6–8 months . . . . . . . . . . . . . . . . . . . . . . . . . . . . 119 13.7 0.13 * * 11.9 12.8 13.9 14.5 14.9 * * 9–11 months . . . . . . . . . . . . . . . . . . . . . . . . . . . . 123 14.8 0.18 * * 13.4 14.0 14.9 15.5 16.0 * * 1 year . . . . . . . . . . . . . . . . . . . . . . . . . . . . . . . . 294 16.1 0.08 * 14.4 14.9 15.2 16.0 17.0 17.5 17.8 *2 years . . . . . . . . . . . . . . . . . . . . . . . . . . . . . . . 258 18.3 0.10 * 16.2 16.7 17.2 18.2 19.3 19.9 20.1 *3 years . . . . . . . . . . . . . . . . . . . . . . . . . . . . . . . 215 20.0 0.12 * 18.3 18.5 19.0 20.0 20.9 21.2 21.6 *4 years . . . . . . . . . . . . . . . . . . . . . . . . . . . . . . . 176 21.6 0.16 * 19.3 20.0 20.8 21.6 22.7 23.1 23.2 *5 years . . . . . . . . . . . . . . . . . . . . . . . . . . . . . . . 150 23.3 0.16 * * 21.5 22.3 23.4 24.4 25.0 * *6 years . . . . . . . . . . . . . . . . . . . . . . . . . . . . . . . 185 24.3 0.15 * 22.1 22.8 23.0 24.0 25.3 26.1 26.6 *7 years . . . . . . . . . . . . . . . . . . . . . . . . . . . . . . . 185 26.3 0.17 * 24.0 24.7 25.1 26.2 27.2 27.6 28.2 *8 years . . . . . . . . . . . . . . . . . . . . . . . . . . . . . . . 213 27.8 0.23 * 25.3 25.7 26.3 27.5 29.1 30.0 30.7 *9 years . . . . . . . . . . . . . . . . . . . . . . . . . . . . . . . 174 29.1 0.19 * 26.7 26.9 27.6 28.9 30.1 31.4 31.9 *10 years . . . . . . . . . . . . . . . . . . . . . . . . . . . . . . 184 30.1 0.20 * 27.9 28.4 28.8 29.9 31.4 32.3 32.5 *11 years . . . . . . . . . . . . . . . . . . . . . . . . . . . . . . 183 31.6 0.22 * 29.1 29.3 29.9 31.5 33.2 33.5 34.0 * 12 years . . . . . . . . . . . . . . . . . . . . . . . . . . . . . . 302 33.3 0.22 * 29.9 30.4 31.4 33.0 34.7 36.2 37.1 *13 years . . . . . . . . . . . . . . . . . . . . . . . . . . . . . . 295 34.4 0.28 * 30.7 31.5 32.5 34.6 36.3 37.0 37.7 *14 years . . . . . . . . . . . . . . . . . . . . . . . . . . . . . . 267 36.4 0.28 * 32.7 33.5 34.5 36.3 38.4 38.9 39.5 *15 years . . . . . . . . . . . . . . . . . . . . . . . . . . . . . . 283 37.5 0.20 * 34.5 35.4 36.1 37.6 39.2 39.7 40.4 *16 years . . . . . . . . . . . . . . . . . . . . . . . . . . . . . . 308 38.1 0.22 34.5 35.4 35.7 36.4 38.0 39.5 40.5 41.7 42.317 years . . . . . . . . . . . . . . . . . . . . . . . . . . . . . . 314 37.8 0.17 34.5 34.9 35.5 36.3 37.6 39.4 40.4 40.6 41.318 years . . . . . . . . . . . . . . . . . . . . . . . . . . . . . . 286 38.2 0.21 * 35.6 35.9 36.5 38.0 39.6 40.4 40.7 *19 years . . . . . . . . . . . . . . . . . . . . . . . . . . . . . . 272 38.3 0.18 * 35.6 36.1 37.1 38.3 39.4 40.3 40.9 *
Female
0–2 months . . . . . . . . . . . . . . . . . . . . . . . . . . . . 14 * * * * * * * * * * *3–5 months . . . . . . . . . . . . . . . . . . . . . . . . . . . . 116 12.5 0.13 * * 11.3 11.8 12.2 13.0 13.5 * * 6–8 months . . . . . . . . . . . . . . . . . . . . . . . . . . . . 100 13.2 0.16 * * * 12.3 13.0 13.9 * * * 9–11 months . . . . . . . . . . . . . . . . . . . . . . . . . . . . 113 14.4 0.14 * * 13.2 13.5 14.4 15.2 15.5 * * 1 year . . . . . . . . . . . . . . . . . . . . . . . . . . . . . . . . 238 15.9 0.09 * 14.2 14.7 15.1 15.9 16.8 17.1 17.6 *2 years . . . . . . . . . . . . . . . . . . . . . . . . . . . . . . . 242 18.0 0.15 * 16.2 16.6 17.0 18.0 19.0 19.5 19.9 *3 years . . . . . . . . . . . . . . . . . . . . . . . . . . . . . . . 173 19.8 0.12 * 18.1 18.4 18.9 19.7 20.5 20.9 21.1 *4 years . . . . . . . . . . . . . . . . . . . . . . . . . . . . . . . 187 21.3 0.13 * 19.5 19.9 20.0 21.2 22.0 22.8 23.4 *5 years . . . . . . . . . . . . . . . . . . . . . . . . . . . . . . . 187 22.8 0.19 * 21.0 21.2 21.9 22.7 23.9 24.4 24.7 *6 years . . . . . . . . . . . . . . . . . . . . . . . . . . . . . . . 169 24.0 0.22 * 22.1 22.4 22.6 23.9 25.2 25.6 26.0 *7 years . . . . . . . . . . . . . . . . . . . . . . . . . . . . . . . 196 25.7 0.15 * 23.6 24.0 24.4 25.5 26.6 27.2 27.6 *8 years . . . . . . . . . . . . . . . . . . . . . . . . . . . . . . . 180 27.5 0.21 * 24.8 25.5 26.1 27.3 28.6 29.9 30.4 *9 years . . . . . . . . . . . . . . . . . . . . . . . . . . . . . . . 185 29.1 0.26 * 26.4 26.8 27.3 28.9 30.7 31.3 31.8 *10 years . . . . . . . . . . . . . . . . . . . . . . . . . . . . . . 163 30.4 0.25 * * 27.8 28.4 30.3 31.9 32.9 * *11 years . . . . . . . . . . . . . . . . . . . . . . . . . . . . . . 191 32.4 0.19 * 29.7 29.9 30.8 32.0 33.9 34.9 35.4 * 12 years . . . . . . . . . . . . . . . . . . . . . . . . . . . . . . 313 33.3 0.24 * 29.8 30.3 31.8 33.3 34.9 35.8 36.6 *13 years . . . . . . . . . . . . . . . . . . . . . . . . . . . . . . 323 34.5 0.21 * 32.0 32.3 33.0 34.3 36.1 36.9 37.1 *14 years . . . . . . . . . . . . . . . . . . . . . . . . . . . . . . 327 34.9 0.20 * 32.3 32.5 33.4 34.7 36.0 36.8 37.5 *15 years . . . . . . . . . . . . . . . . . . . . . . . . . . . . . . 272 34.9 0.27 * 31.9 32.5 33.3 34.9 36.3 37.0 37.6 *16 years . . . . . . . . . . . . . . . . . . . . . . . . . . . . . . 285 35.1 0.15 * 32.5 33.1 33.7 34.9 36.4 37.1 37.5 *17 years . . . . . . . . . . . . . . . . . . . . . . . . . . . . . . 281 35.3 0.17 * 32.5 33.1 34.0 35.4 36.5 37.3 37.7 *18 years . . . . . . . . . . . . . . . . . . . . . . . . . . . . . . 270 35.6 0.19 * 33.0 33.8 34.3 35.4 36.5 37.6 38.4 *19 years . . . . . . . . . . . . . . . . . . . . . . . . . . . . . . 253 35.3 0.17 * 32.6 33.2 33.8 35.4 36.4 37.2 37.5 *
* Figure does not meet standard of reliability or precision.
15 Advance Data No. 361 + July 7, 2005
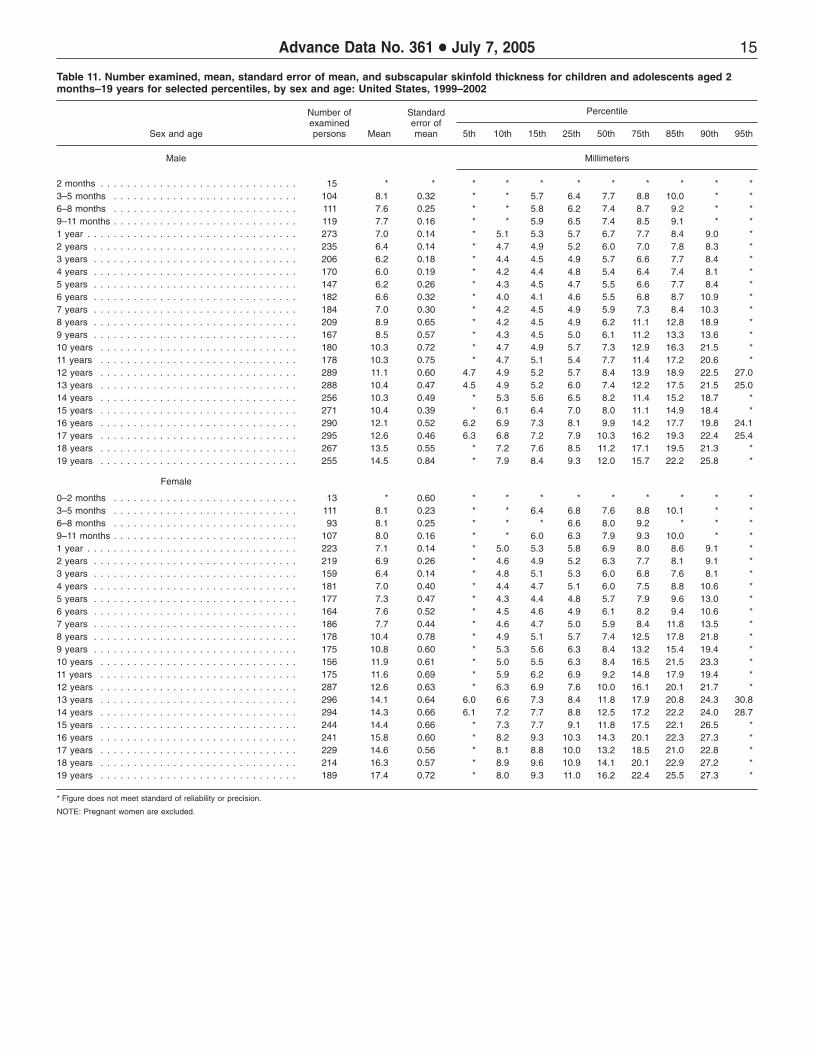
Table 11. Number examined, mean, standard error of mean, and subscapular skinfold thickness for children and adolescents aged 2 months–19 years for selected percentiles, by sex and age: United States, 1999–2002
Sex and age
Number of examined persons Mean
Standard error of mean 5th 10th 15th
Percentile
25th 50th 75th 85th 90th 95th
Male Millimeters
2 months . . . . . . . . . . . . . . . . . . . . . . . . . . . . . . 15 * * * * * * * * * * * 3–5 months . . . . . . . . . . . . . . . . . . . . . . . . . . . . 104 8.1 0.32 * * 5.7 6.4 7.7 8.8 10.0 * * 6–8 months . . . . . . . . . . . . . . . . . . . . . . . . . . . . 111 7.6 0.25 * * 5.8 6.2 7.4 8.7 9.2 * * 9–11 months . . . . . . . . . . . . . . . . . . . . . . . . . . . . 119 7.7 0.16 * * 5.9 6.5 7.4 8.5 9.1 * * 1 year . . . . . . . . . . . . . . . . . . . . . . . . . . . . . . . . 273 7.0 0.14 * 5.1 5.3 5.7 6.7 7.7 8.4 9.0 * 2 years . . . . . . . . . . . . . . . . . . . . . . . . . . . . . . . 235 6.4 0.14 * 4.7 4.9 5.2 6.0 7.0 7.8 8.3 * 3 years . . . . . . . . . . . . . . . . . . . . . . . . . . . . . . . 206 6.2 0.18 * 4.4 4.5 4.9 5.7 6.6 7.7 8.4 * 4 years . . . . . . . . . . . . . . . . . . . . . . . . . . . . . . . 170 6.0 0.19 * 4.2 4.4 4.8 5.4 6.4 7.4 8.1 * 5 years . . . . . . . . . . . . . . . . . . . . . . . . . . . . . . . 147 6.2 0.26 * 4.3 4.5 4.7 5.5 6.6 7.7 8.4 * 6 years . . . . . . . . . . . . . . . . . . . . . . . . . . . . . . . 182 6.6 0.32 * 4.0 4.1 4.6 5.5 6.8 8.7 10.9 * 7 years . . . . . . . . . . . . . . . . . . . . . . . . . . . . . . . 184 7.0 0.30 * 4.2 4.5 4.9 5.9 7.3 8.4 10.3 * 8 years . . . . . . . . . . . . . . . . . . . . . . . . . . . . . . . 209 8.9 0.65 * 4.2 4.5 4.9 6.2 11.1 12.8 18.9 * 9 years . . . . . . . . . . . . . . . . . . . . . . . . . . . . . . . 167 8.5 0.57 * 4.3 4.5 5.0 6.1 11.2 13.3 13.6 * 10 years . . . . . . . . . . . . . . . . . . . . . . . . . . . . . . 180 10.3 0.72 * 4.7 4.9 5.7 7.3 12.9 16.3 21.5 * 11 years . . . . . . . . . . . . . . . . . . . . . . . . . . . . . . 178 10.3 0.75 * 4.7 5.1 5.4 7.7 11.4 17.2 20.6 * 12 years . . . . . . . . . . . . . . . . . . . . . . . . . . . . . . 289 11.1 0.60 4.7 4.9 5.2 5.7 8.4 13.9 18.9 22.5 27.0 13 years . . . . . . . . . . . . . . . . . . . . . . . . . . . . . . 288 10.4 0.47 4.5 4.9 5.2 6.0 7.4 12.2 17.5 21.5 25.0 14 years . . . . . . . . . . . . . . . . . . . . . . . . . . . . . . 256 10.3 0.49 * 5.3 5.6 6.5 8.2 11.4 15.2 18.7 * 15 years . . . . . . . . . . . . . . . . . . . . . . . . . . . . . . 271 10.4 0.39 * 6.1 6.4 7.0 8.0 11.1 14.9 18.4 * 16 years . . . . . . . . . . . . . . . . . . . . . . . . . . . . . . 290 12.1 0.52 6.2 6.9 7.3 8.1 9.9 14.2 17.7 19.8 24.1 17 years . . . . . . . . . . . . . . . . . . . . . . . . . . . . . . 295 12.6 0.46 6.3 6.8 7.2 7.9 10.3 16.2 19.3 22.4 25.4 18 years . . . . . . . . . . . . . . . . . . . . . . . . . . . . . . 267 13.5 0.55 * 7.2 7.6 8.5 11.2 17.1 19.5 21.3 * 19 years . . . . . . . . . . . . . . . . . . . . . . . . . . . . . . 255 14.5 0.84 * 7.9 8.4 9.3 12.0 15.7 22.2 25.8 *
Female
0–2 months . . . . . . . . . . . . . . . . . . . . . . . . . . . . 13 * 0.60 * * * * * * * * * 3–5 months . . . . . . . . . . . . . . . . . . . . . . . . . . . . 111 8.1 0.23 * * 6.4 6.8 7.6 8.8 10.1 * * 6–8 months . . . . . . . . . . . . . . . . . . . . . . . . . . . . 93 8.1 0.25 * * * 6.6 8.0 9.2 * * * 9–11 months . . . . . . . . . . . . . . . . . . . . . . . . . . . . 107 8.0 0.16 * * 6.0 6.3 7.9 9.3 10.0 * * 1 year . . . . . . . . . . . . . . . . . . . . . . . . . . . . . . . . 223 7.1 0.14 * 5.0 5.3 5.8 6.9 8.0 8.6 9.1 * 2 years . . . . . . . . . . . . . . . . . . . . . . . . . . . . . . . 219 6.9 0.26 * 4.6 4.9 5.2 6.3 7.7 8.1 9.1 * 3 years . . . . . . . . . . . . . . . . . . . . . . . . . . . . . . . 159 6.4 0.14 * 4.8 5.1 5.3 6.0 6.8 7.6 8.1 * 4 years . . . . . . . . . . . . . . . . . . . . . . . . . . . . . . . 181 7.0 0.40 * 4.4 4.7 5.1 6.0 7.5 8.8 10.6 * 5 years . . . . . . . . . . . . . . . . . . . . . . . . . . . . . . . 177 7.3 0.47 * 4.3 4.4 4.8 5.7 7.9 9.6 13.0 * 6 years . . . . . . . . . . . . . . . . . . . . . . . . . . . . . . . 164 7.6 0.52 * 4.5 4.6 4.9 6.1 8.2 9.4 10.6 * 7 years . . . . . . . . . . . . . . . . . . . . . . . . . . . . . . . 186 7.7 0.44 * 4.6 4.7 5.0 5.9 8.4 11.8 13.5 * 8 years . . . . . . . . . . . . . . . . . . . . . . . . . . . . . . . 178 10.4 0.78 * 4.9 5.1 5.7 7.4 12.5 17.8 21.8 * 9 years . . . . . . . . . . . . . . . . . . . . . . . . . . . . . . . 175 10.8 0.60 * 5.3 5.6 6.3 8.4 13.2 15.4 19.4 * 10 years . . . . . . . . . . . . . . . . . . . . . . . . . . . . . . 156 11.9 0.61 * 5.0 5.5 6.3 8.4 16.5 21.5 23.3 * 11 years . . . . . . . . . . . . . . . . . . . . . . . . . . . . . . 175 11.6 0.69 * 5.9 6.2 6.9 9.2 14.8 17.9 19.4 * 12 years . . . . . . . . . . . . . . . . . . . . . . . . . . . . . . 287 12.6 0.63 * 6.3 6.9 7.6 10.0 16.1 20.1 21.7 * 13 years . . . . . . . . . . . . . . . . . . . . . . . . . . . . . . 296 14.1 0.64 6.0 6.6 7.3 8.4 11.8 17.9 20.8 24.3 30.8 14 years . . . . . . . . . . . . . . . . . . . . . . . . . . . . . . 294 14.3 0.66 6.1 7.2 7.7 8.8 12.5 17.2 22.2 24.0 28.7 15 years . . . . . . . . . . . . . . . . . . . . . . . . . . . . . . 244 14.4 0.66 * 7.3 7.7 9.1 11.8 17.5 22.1 26.5 * 16 years . . . . . . . . . . . . . . . . . . . . . . . . . . . . . . 241 15.8 0.60 * 8.2 9.3 10.3 14.3 20.1 22.3 27.3 * 17 years . . . . . . . . . . . . . . . . . . . . . . . . . . . . . . 229 14.6 0.56 * 8.1 8.8 10.0 13.2 18.5 21.0 22.8 * 18 years . . . . . . . . . . . . . . . . . . . . . . . . . . . . . . 214 16.3 0.57 * 8.9 9.6 10.9 14.1 20.1 22.9 27.2 * 19 years . . . . . . . . . . . . . . . . . . . . . . . . . . . . . . 189 17.4 0.72 * 8.0 9.3 11.0 16.2 22.4 25.5 27.3 *
* Figure does not meet standard of reliability or precision.
NOTE: Pregnant women are excluded.

16 Advance Data No. 361 + July 7, 2005
Table 12. Number examined, mean, standard error of mean, and triceps skinfold thickness for children and adolescents aged 2 months– 19 years for selected percentiles, by sex and age: United States, 1999–2002
Sex and age
Number of examined persons Mean
Standard error of mean 5th 10th 15th
Percentile
25th 50th 75th 85th 90th 95th
Male Millimeters
2 months . . . . . . . . . . . . . . . . . . . . . . . . . . . . . . 16 * * * * * * * * * * * 3–5 months . . . . . . . . . . . . . . . . . . . . . . . . . . . . 106 11.2 0.35 * * 8.2 9.6 11.1 12.3 13.6 * * 6–8 months . . . . . . . . . . . . . . . . . . . . . . . . . . . . 117 11.3 0.28 * * 8.9 9.7 11.1 12.4 13.5 * * 9–11 months . . . . . . . . . . . . . . . . . . . . . . . . . . . . 121 10.9 0.29 * * 8.4 9.1 10.5 12.1 13.1 * * 1 year . . . . . . . . . . . . . . . . . . . . . . . . . . . . . . . . 287 10.0 0.26 * 7.2 7.7 8.2 9.5 11.2 12.2 13.0 * 2 years . . . . . . . . . . . . . . . . . . . . . . . . . . . . . . . 247 9.7 0.28 * 6.9 7.1 7.8 9.1 10.9 12.3 13.8 * 3 years . . . . . . . . . . . . . . . . . . . . . . . . . . . . . . . 211 9.4 0.18 * 6.3 6.8 7.5 8.9 10.4 11.9 12.4 * 4 years . . . . . . . . . . . . . . . . . . . . . . . . . . . . . . . 173 9.4 0.21 * 6.5 6.8 7.2 9.0 10.8 11.8 12.1 * 5 years . . . . . . . . . . . . . . . . . . . . . . . . . . . . . . . 150 9.8 0.54 * * 6.4 7.0 8.5 10.7 12.7 * * 6 years . . . . . . . . . . . . . . . . . . . . . . . . . . . . . . . 184 9.9 0.21 * 6.0 6.2 7.1 9.0 11.7 13.3 14.4 * 7 years . . . . . . . . . . . . . . . . . . . . . . . . . . . . . . . 185 10.3 0.37 * 6.2 6.7 7.4 9.1 11.3 14.4 15.0 * 8 years . . . . . . . . . . . . . . . . . . . . . . . . . . . . . . . 211 12.3 0.70 * 5.7 6.3 7.3 10.7 14.3 19.4 22.2 * 9 years . . . . . . . . . . . . . . . . . . . . . . . . . . . . . . . 173 13.4 0.74 * 6.9 7.0 7.7 10.5 15.0 21.4 25.8 * 10 years . . . . . . . . . . . . . . . . . . . . . . . . . . . . . . 184 14.0 0.59 * 7.3 8.1 8.7 12.6 16.3 20.4 24.0 * 11 years . . . . . . . . . . . . . . . . . . . . . . . . . . . . . . 182 13.8 0.65 * 7.1 8.0 8.6 11.6 18.2 22.3 24.7 * 12 years . . . . . . . . . . . . . . . . . . . . . . . . . . . . . . 298 14.6 0.74 * 7.0 7.6 8.9 12.1 19.0 22.8 26.1 * 13 years . . . . . . . . . . . . . . . . . . . . . . . . . . . . . . 289 13.4 0.73 * 6.6 7.1 7.8 10.5 17.9 21.6 24.3 * 14 years . . . . . . . . . . . . . . . . . . . . . . . . . . . . . . 264 13.7 0.59 * 6.8 7.1 8.0 11.0 17.9 21.0 24.3 * 15 years . . . . . . . . . . . . . . . . . . . . . . . . . . . . . . 281 12.0 0.50 * 6.1 6.5 7.1 9.3 15.2 18.8 20.8 * 16 years . . . . . . . . . . . . . . . . . . . . . . . . . . . . . . 301 13.5 0.71 * 6.0 6.8 7.8 11.2 17.1 21.9 25.3 * 17 years . . . . . . . . . . . . . . . . . . . . . . . . . . . . . . 304 12.4 0.60 5.0 5.3 5.9 6.9 10.4 15.8 20.1 23.3 27.9 18 years . . . . . . . . . . . . . . . . . . . . . . . . . . . . . . 280 12.5 0.50 * 6.1 7.0 7.8 10.4 15.7 18.8 21.9 * 19 years . . . . . . . . . . . . . . . . . . . . . . . . . . . . . . 263 12.9 0.79 * 6.1 6.6 7.4 10.0 15.4 21.7 24.9 *
Female
0–2 months . . . . . . . . . . . . . . . . . . . . . . . . . . . . 14 * * * * * * * * * * * 3–5 months . . . . . . . . . . . . . . . . . . . . . . . . . . . . 116 11.4 0.25 * * 8.5 9.4 10.9 12.9 14.1 * * 6–8 months . . . . . . . . . . . . . . . . . . . . . . . . . . . . 99 11.2 0.30 * * * 9.4 10.8 13.0 * * * 9–11 months . . . . . . . . . . . . . . . . . . . . . . . . . . . . 109 10.5 0.35 * * 7.6 8.2 9.9 12.0 13.3 * * 1 year . . . . . . . . . . . . . . . . . . . . . . . . . . . . . . . . 230 10.1 0.26 * 6.9 7.5 8.1 9.9 11.5 12.5 14.0 * 2 years . . . . . . . . . . . . . . . . . . . . . . . . . . . . . . . 236 10.1 0.22 * 7.0 7.4 8.0 9.7 11.5 12.2 13.1 * 3 years . . . . . . . . . . . . . . . . . . . . . . . . . . . . . . . 169 10.0 0.18 * 7.4 7.9 8.6 9.8 11.2 11.7 12.4 * 4 years . . . . . . . . . . . . . . . . . . . . . . . . . . . . . . . 183 10.3 0.38 * 7.1 7.6 7.9 9.6 11.6 13.0 14.0 * 5 years . . . . . . . . . . . . . . . . . . . . . . . . . . . . . . . 185 11.0 0.45 * 6.5 6.9 7.9 10.2 13.0 15.0 15.6 * 6 years . . . . . . . . . . . . . . . . . . . . . . . . . . . . . . . 169 11.1 0.58 * 6.6 7.3 8.3 10.1 12.7 13.6 15.2 * 7 years . . . . . . . . . . . . . . . . . . . . . . . . . . . . . . . 195 11.5 0.42 * 7.3 7.5 7.9 10.1 13.3 16.8 18.1 * 8 years . . . . . . . . . . . . . . . . . . . . . . . . . . . . . . . 180 14.3 0.72 * 8.1 8.4 9.6 12.1 17.3 22.9 24.8 * 9 years . . . . . . . . . . . . . . . . . . . . . . . . . . . . . . . 184 15.4 0.52 * 8.0 9.2 9.7 13.7 19.7 21.7 23.4 * 10 years . . . . . . . . . . . . . . . . . . . . . . . . . . . . . . 163 15.5 0.58 * 8.1 8.7 9.7 12.9 19.4 23.1 25.0 * 11 years . . . . . . . . . . . . . . . . . . . . . . . . . . . . . . 189 16.7 0.70 * 9.3 10.0 11.0 14.1 20.9 24.8 27.9 * 12 years . . . . . . . . . . . . . . . . . . . . . . . . . . . . . . 306 16.7 0.60 7.6 8.9 9.8 11.5 15.3 21.0 24.3 26.6 30.2 13 years . . . . . . . . . . . . . . . . . . . . . . . . . . . . . . 310 18.0 0.65 8.1 8.9 9.2 11.8 17.0 22.5 26.7 30.9 33.4 14 years . . . . . . . . . . . . . . . . . . . . . . . . . . . . . . 314 18.7 0.67 9.0 10.3 10.9 13.6 17.0 23.2 26.2 28.2 31.5 15 years . . . . . . . . . . . . . . . . . . . . . . . . . . . . . . 258 18.3 0.79 * 10.2 11.0 12.7 17.2 22.9 26.1 27.6 * 16 years . . . . . . . . . . . . . . . . . . . . . . . . . . . . . . 264 19.6 0.57 * 11.0 11.6 14.1 18.3 25.2 28.3 29.8 * 17 years . . . . . . . . . . . . . . . . . . . . . . . . . . . . . . 244 18.9 0.57 * 11.0 11.3 13.2 18.2 23.6 25.9 28.0 * 18 years . . . . . . . . . . . . . . . . . . . . . . . . . . . . . . 234 20.3 0.58 * 11.9 12.7 13.7 19.2 24.4 28.4 31.5 * 19 years . . . . . . . . . . . . . . . . . . . . . . . . . . . . . . 214 21.0 0.72 * 10.8 11.9 13.8 20.3 27.3 30.9 32.6 *
* Figure does not meet standard of reliability or precision.
NOTE: Pregnant women are excluded.
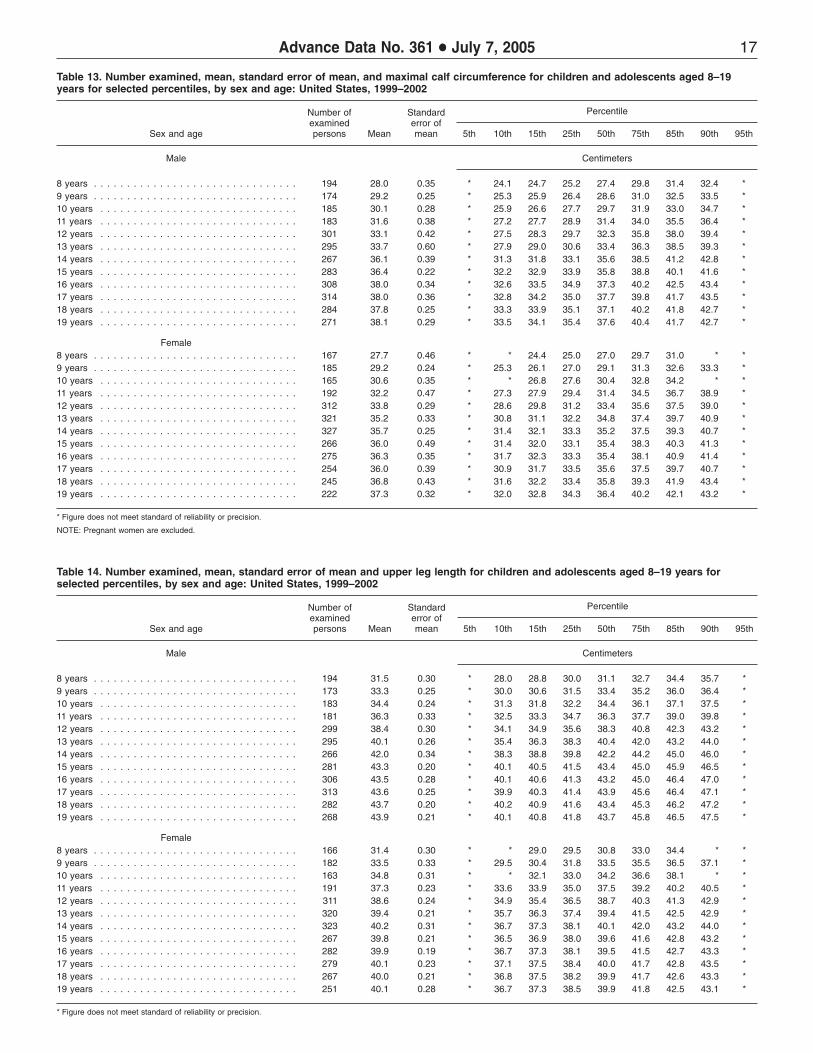
17 Advance Data No. 361 + July 7, 2005
Table 13. Number examined, mean, standard error of mean, and maximal calf circumference for children and adolescents aged 8–19 years for selected percentiles, by sex and age: United States, 1999–2002
Number of Standard Percentile examined error of
Sex and age persons Mean mean 5th 10th 15th 25th 50th 75th 85th 90th 95th
Male Centimeters
8 years . . . . . . . . . . . . . . . . . . . . . . . . . . . . . . . 194 28.0 0.35 * 24.1 24.7 25.2 27.4 29.8 31.4 32.4 *9 years . . . . . . . . . . . . . . . . . . . . . . . . . . . . . . . 174 29.2 0.25 * 25.3 25.9 26.4 28.6 31.0 32.5 33.5 *10 years . . . . . . . . . . . . . . . . . . . . . . . . . . . . . . 185 30.1 0.28 * 25.9 26.6 27.7 29.7 31.9 33.0 34.7 *11 years . . . . . . . . . . . . . . . . . . . . . . . . . . . . . . 183 31.6 0.38 * 27.2 27.7 28.9 31.4 34.0 35.5 36.4 * 12 years . . . . . . . . . . . . . . . . . . . . . . . . . . . . . . 301 33.1 0.42 * 27.5 28.3 29.7 32.3 35.8 38.0 39.4 *13 years . . . . . . . . . . . . . . . . . . . . . . . . . . . . . . 295 33.7 0.60 * 27.9 29.0 30.6 33.4 36.3 38.5 39.3 *14 years . . . . . . . . . . . . . . . . . . . . . . . . . . . . . . 267 36.1 0.39 * 31.3 31.8 33.1 35.6 38.5 41.2 42.8 *15 years . . . . . . . . . . . . . . . . . . . . . . . . . . . . . . 283 36.4 0.22 * 32.2 32.9 33.9 35.8 38.8 40.1 41.6 *16 years . . . . . . . . . . . . . . . . . . . . . . . . . . . . . . 308 38.0 0.34 * 32.6 33.5 34.9 37.3 40.2 42.5 43.4 *17 years . . . . . . . . . . . . . . . . . . . . . . . . . . . . . . 314 38.0 0.36 * 32.8 34.2 35.0 37.7 39.8 41.7 43.5 *18 years . . . . . . . . . . . . . . . . . . . . . . . . . . . . . . 284 37.8 0.25 * 33.3 33.9 35.1 37.1 40.2 41.8 42.7 *19 years . . . . . . . . . . . . . . . . . . . . . . . . . . . . . . 271 38.1 0.29 * 33.5 34.1 35.4 37.6 40.4 41.7 42.7 *
Female8 years . . . . . . . . . . . . . . . . . . . . . . . . . . . . . . . 167 27.7 0.46 * * 24.4 25.0 27.0 29.7 31.0 * *9 years . . . . . . . . . . . . . . . . . . . . . . . . . . . . . . . 185 29.2 0.24 * 25.3 26.1 27.0 29.1 31.3 32.6 33.3 *10 years . . . . . . . . . . . . . . . . . . . . . . . . . . . . . . 165 30.6 0.35 * * 26.8 27.6 30.4 32.8 34.2 * *11 years . . . . . . . . . . . . . . . . . . . . . . . . . . . . . . 192 32.2 0.47 * 27.3 27.9 29.4 31.4 34.5 36.7 38.9 * 12 years . . . . . . . . . . . . . . . . . . . . . . . . . . . . . . 312 33.8 0.29 * 28.6 29.8 31.2 33.4 35.6 37.5 39.0 *13 years . . . . . . . . . . . . . . . . . . . . . . . . . . . . . . 321 35.2 0.33 * 30.8 31.1 32.2 34.8 37.4 39.7 40.9 *14 years . . . . . . . . . . . . . . . . . . . . . . . . . . . . . . 327 35.7 0.25 * 31.4 32.1 33.3 35.2 37.5 39.3 40.7 *15 years . . . . . . . . . . . . . . . . . . . . . . . . . . . . . . 266 36.0 0.49 * 31.4 32.0 33.1 35.4 38.3 40.3 41.3 *16 years . . . . . . . . . . . . . . . . . . . . . . . . . . . . . . 275 36.3 0.35 * 31.7 32.3 33.3 35.4 38.1 40.9 41.4 *17 years . . . . . . . . . . . . . . . . . . . . . . . . . . . . . . 254 36.0 0.39 * 30.9 31.7 33.5 35.6 37.5 39.7 40.7 *18 years . . . . . . . . . . . . . . . . . . . . . . . . . . . . . . 245 36.8 0.43 * 31.6 32.2 33.4 35.8 39.3 41.9 43.4 *19 years . . . . . . . . . . . . . . . . . . . . . . . . . . . . . . 222 37.3 0.32 * 32.0 32.8 34.3 36.4 40.2 42.1 43.2 *
* Figure does not meet standard of reliability or precision.
NOTE: Pregnant women are excluded.
Table 14. Number examined, mean, standard error of mean and upper leg length for children and adolescents aged 8–19 years for selected percentiles, by sex and age: United States, 1999–2002
Number of Standard Percentile examined error of
Sex and age persons Mean mean 5th 10th 15th 25th 50th 75th 85th 90th 95th
Male Centimeters
8 years . . . . . . . . . . . . . . . . . . . . . . . . . . . . . . . 194 31.5 0.30 * 28.0 28.8 30.0 31.1 32.7 34.4 35.7 *9 years . . . . . . . . . . . . . . . . . . . . . . . . . . . . . . . 173 33.3 0.25 * 30.0 30.6 31.5 33.4 35.2 36.0 36.4 *10 years . . . . . . . . . . . . . . . . . . . . . . . . . . . . . . 183 34.4 0.24 * 31.3 31.8 32.2 34.4 36.1 37.1 37.5 *11 years . . . . . . . . . . . . . . . . . . . . . . . . . . . . . . 181 36.3 0.33 * 32.5 33.3 34.7 36.3 37.7 39.0 39.8 * 12 years . . . . . . . . . . . . . . . . . . . . . . . . . . . . . . 299 38.4 0.30 * 34.1 34.9 35.6 38.3 40.8 42.3 43.2 *13 years . . . . . . . . . . . . . . . . . . . . . . . . . . . . . . 295 40.1 0.26 * 35.4 36.3 38.3 40.4 42.0 43.2 44.0 *14 years . . . . . . . . . . . . . . . . . . . . . . . . . . . . . . 266 42.0 0.34 * 38.3 38.8 39.8 42.2 44.2 45.0 46.0 *15 years . . . . . . . . . . . . . . . . . . . . . . . . . . . . . . 281 43.3 0.20 * 40.1 40.5 41.5 43.4 45.0 45.9 46.5 *16 years . . . . . . . . . . . . . . . . . . . . . . . . . . . . . . 306 43.5 0.28 * 40.1 40.6 41.3 43.2 45.0 46.4 47.0 *17 years . . . . . . . . . . . . . . . . . . . . . . . . . . . . . . 313 43.6 0.25 * 39.9 40.3 41.4 43.9 45.6 46.4 47.1 *18 years . . . . . . . . . . . . . . . . . . . . . . . . . . . . . . 282 43.7 0.20 * 40.2 40.9 41.6 43.4 45.3 46.2 47.2 *19 years . . . . . . . . . . . . . . . . . . . . . . . . . . . . . . 268 43.9 0.21 * 40.1 40.8 41.8 43.7 45.8 46.5 47.5 *
Female8 years . . . . . . . . . . . . . . . . . . . . . . . . . . . . . . . 166 31.4 0.30 * * 29.0 29.5 30.8 33.0 34.4 * *9 years . . . . . . . . . . . . . . . . . . . . . . . . . . . . . . . 182 33.5 0.33 * 29.5 30.4 31.8 33.5 35.5 36.5 37.1 *10 years . . . . . . . . . . . . . . . . . . . . . . . . . . . . . . 163 34.8 0.31 * * 32.1 33.0 34.2 36.6 38.1 * *11 years . . . . . . . . . . . . . . . . . . . . . . . . . . . . . . 191 37.3 0.23 * 33.6 33.9 35.0 37.5 39.2 40.2 40.5 * 12 years . . . . . . . . . . . . . . . . . . . . . . . . . . . . . . 311 38.6 0.24 * 34.9 35.4 36.5 38.7 40.3 41.3 42.9 *13 years . . . . . . . . . . . . . . . . . . . . . . . . . . . . . . 320 39.4 0.21 * 35.7 36.3 37.4 39.4 41.5 42.5 42.9 *14 years . . . . . . . . . . . . . . . . . . . . . . . . . . . . . . 323 40.2 0.31 * 36.7 37.3 38.1 40.1 42.0 43.2 44.0 *15 years . . . . . . . . . . . . . . . . . . . . . . . . . . . . . . 267 39.8 0.21 * 36.5 36.9 38.0 39.6 41.6 42.8 43.2 *16 years . . . . . . . . . . . . . . . . . . . . . . . . . . . . . . 282 39.9 0.19 * 36.7 37.3 38.1 39.5 41.5 42.7 43.3 *17 years . . . . . . . . . . . . . . . . . . . . . . . . . . . . . . 279 40.1 0.23 * 37.1 37.5 38.4 40.0 41.7 42.8 43.5 *18 years . . . . . . . . . . . . . . . . . . . . . . . . . . . . . . 267 40.0 0.21 * 36.8 37.5 38.2 39.9 41.7 42.6 43.3 *19 years . . . . . . . . . . . . . . . . . . . . . . . . . . . . . . 251 40.1 0.28 * 36.7 37.3 38.5 39.9 41.8 42.5 43.1 *
* Figure does not meet standard of reliability or precision.

18 Advance Data No. 361 + July 7, 2005
Table 15. Number examined, mean, standard error of mean, and mid-thigh circumference for children and adolescents aged 8–19 years for selected percentiles, by sex and age: United States, 1999–2002
Number of Standard Percentile examined error of
Sex and age persons Mean mean 5th 10th 15th 25th 50th 75th 85th 90th 95th
Male Centimeters
8 years . . . . . . . . . . . . . . . . . . . . . . . . . . . . . . . 194 39.0 0.65 * 32.4 33.5 34.6 38.0 41.8 46.2 47.9 *9 years . . . . . . . . . . . . . . . . . . . . . . . . . . . . . . . 173 40.6 0.47 * 34.3 34.7 35.9 39.4 43.0 46.0 48.7 *10 years . . . . . . . . . . . . . . . . . . . . . . . . . . . . . . 182 42.0 0.52 * 35.8 36.5 38.4 40.3 45.5 47.6 49.3 *11 years . . . . . . . . . . . . . . . . . . . . . . . . . . . . . . 181 43.7 0.56 * 37.4 38.4 40.0 42.9 46.9 48.7 50.1 * 12 years . . . . . . . . . . . . . . . . . . . . . . . . . . . . . . 299 45.8 0.70 * 37.3 38.2 40.4 43.9 49.5 53.8 55.9 *13 years . . . . . . . . . . . . . . . . . . . . . . . . . . . . . . 294 46.7 0.89 * 37.8 39.9 41.3 45.8 50.5 54.9 57.1 *14 years . . . . . . . . . . . . . . . . . . . . . . . . . . . . . . 265 49.8 0.62 * 41.6 43.0 45.1 48.5 53.3 57.6 58.8 *15 years . . . . . . . . . . . . . . . . . . . . . . . . . . . . . . 279 50.7 0.43 * 43.4 44.6 45.8 49.6 54.7 57.5 60.7 *16 years . . . . . . . . . . . . . . . . . . . . . . . . . . . . . . 306 53.5 0.50 * 45.0 46.2 48.2 52.5 57.2 60.9 63.4 *17 years . . . . . . . . . . . . . . . . . . . . . . . . . . . . . . 312 53.6 0.53 * 45.1 46.5 48.6 52.5 57.1 60.8 63.8 *18 years . . . . . . . . . . . . . . . . . . . . . . . . . . . . . . 283 53.0 0.52 * 45.6 46.9 48.0 52.0 56.6 60.3 62.3 *19 years . . . . . . . . . . . . . . . . . . . . . . . . . . . . . . 268 53.6 0.50 * 46.3 47.0 49.1 53.0 56.4 59.7 61.9 *
Female8 years . . . . . . . . . . . . . . . . . . . . . . . . . . . . . . . 164 38.7 0.78 * 32.7 33.4 34.0 37.4 41.9 44.1 47.2 *9 years . . . . . . . . . . . . . . . . . . . . . . . . . . . . . . . 181 40.8 0.47 * 34.7 35.6 37.1 40.2 44.1 46.4 48.5 *10 years . . . . . . . . . . . . . . . . . . . . . . . . . . . . . . 163 42.3 0.55 * 35.3 35.9 38.3 41.5 45.7 47.9 50.6 *11 years . . . . . . . . . . . . . . . . . . . . . . . . . . . . . . 191 44.9 0.65 * 38.6 39.1 40.3 42.9 48.3 52.4 55.5 * 12 years . . . . . . . . . . . . . . . . . . . . . . . . . . . . . . 311 46.6 0.50 38.0 39.0 39.8 41.5 45.4 50.0 53.1 55.2 59.913 years . . . . . . . . . . . . . . . . . . . . . . . . . . . . . . 319 48.8 0.59 38.9 40.8 41.9 43.8 48.3 52.3 55.7 59.2 62.414 years . . . . . . . . . . . . . . . . . . . . . . . . . . . . . . 323 49.8 0.49 40.0 43.2 44.2 45.8 47.9 52.6 56.1 58.6 62.215 years . . . . . . . . . . . . . . . . . . . . . . . . . . . . . . 263 50.4 0.71 * 42.8 44.3 45.9 48.9 54.1 57.4 59.9 *16 years . . . . . . . . . . . . . . . . . . . . . . . . . . . . . . 273 51.1 0.56 * 43.5 44.7 46.1 49.4 55.4 57.9 59.6 *17 years . . . . . . . . . . . . . . . . . . . . . . . . . . . . . . 252 50.6 0.58 * 43.4 44.5 46.2 49.5 53.7 55.7 58.3 *18 years . . . . . . . . . . . . . . . . . . . . . . . . . . . . . . 243 51.5 0.61 * 43.2 43.9 45.5 49.6 55.2 59.9 62.6 *19 years . . . . . . . . . . . . . . . . . . . . . . . . . . . . . . 221 52.8 0.61 * 44.2 45.5 47.5 51.1 56.5 60.0 63.1 *
* Figure does not meet standard of reliability or precision.
NOTE: Pregnant women are excluded.
Table 16. Number examined, mean, standard error of mean, and weight for females aged 20 years and over for selected percentiles, by race or ethnicity and age: United States, 1999–2002
Race or ethnicity and age
Number of examined persons Mean
Standard error of mean 5th 10th 15th 25th
Percentile
50th 75th 85th 90th 95th
All race or ethnicity groups Kilograms
20 years and over . . . . . . . . . . . . . . . . . . . . . . . . 20–29 years . . . . . . . . . . . . . . . . . . . . . . . . . . 30–39 years . . . . . . . . . . . . . . . . . . . . . . . . . . 40–49 years . . . . . . . . . . . . . . . . . . . . . . . . . . 50–59 years . . . . . . . . . . . . . . . . . . . . . . . . . . 60–69 years . . . . . . . . . . . . . . . . . . . . . . . . . . 70–79 years . . . . . . . . . . . . . . . . . . . . . . . . . . 80 years and over . . . . . . . . . . . . . . . . . . . . . . .
4,299 656 699 787 593 728 486 350
74.1 71.1 74.1 76.5 76.9 76.3 71.0 63.7
0.46 0.90 0.91 1.09 1.15 0.76 0.76 1.31
49.8 47.3 50.2 51.3 52.8 51.8 49.3 45.3
53.4 51.0 53.3 54.4 56.1 56.4 53.4 46.8
56.0 54.3 55.5 56.6 58.5 59.1 56.2 49.5
60.1 57.8 59.4 60.8 62.5 63.3 60.5 53.7
70.2 67.7 68.8 72.5 73.4 73.5 69.6 62.4
83.7 81.1 83.9 87.3 86.4 85.8 80.0 71.3
93.5 89.8 95.1 96.1 97.2 94.7 87.0 77.5
100.2 96.2
103.8 102.6 103.7 102.9 91.4 79.8
110.2 106.6 112.7 117.1 113.1 110.7 96.8 91.3
Non-Hispanic white
20 years and over . . . . . . . . . . . . . . . . . . . . . . . . 20–39 years . . . . . . . . . . . . . . . . . . . . . . . . . . 40–59 years . . . . . . . . . . . . . . . . . . . . . . . . . . 60 years and over . . . . . . . . . . . . . . . . . . . . . . .
2,052 564 628 860
73.6 71.9 76.2 71.8
0.53 0.89 1.00 0.53
49.8 49.1 51.4 48.6
53.3 52.4 54.5 52.8
55.9 55.1 56.6 55.8
59.8 58.3 60.8 60.6
69.9 67.8 72.6 69.4
83.3 81.8 87.2 80.0
93.1 91.0 96.2 88.8
99.1 97.3
102.5 93.7
108.7 108.5 114.5 103.8
Non-Hispanic black
20 years and over . . . . . . . . . . . . . . . . . . . . . . . . 20–39 years . . . . . . . . . . . . . . . . . . . . . . . . . . 40–59 years . . . . . . . . . . . . . . . . . . . . . . . . . . 60 years and over . . . . . . . . . . . . . . . . . . . . . . .
861 297 292 272
82.9 81.5 85.8 80.4
0.70 1.36 1.25 1.50
53.2 52.5 56.3 51.3
58.2 55.9 60.9 57.2
60.9 59.4 64.9 60.7
66.9 63.8 69.1 66.3
79.3 76.1 80.5 79.3
94.4 93.9 97.7 91.3
105.5 105.8 106.0 101.2
112.4 113.6 112.5 108.8
126.4 128.5 129.0 114.8
Mexican American
20 years and over . . . . . . . . . . . . . . . . . . . . . . . . 20–39 years . . . . . . . . . . . . . . . . . . . . . . . . . . 40–59 years . . . . . . . . . . . . . . . . . . . . . . . . . . 60 years and over . . . . . . . . . . . . . . . . . . . . . . .
1,019 358 332 329
71.2 69.5 75.2 68.5
0.73 1.00 1.19 1.20
49.8 48.9 52.1 44.0
52.5 52.0 55.9 49.6
55.8 55.0 58.3 53.2
59.5 58.5 62.8 58.1
68.3 66.5 73.4 67.1
80.4 77.5 83.9 77.2
88.3 85.4 91.6 83.8
92.3 90.2 97.5 89.0
102.0 100.9 105.5 93.9
NOTE: Pregnant women are excluded.

19 Advance Data No. 361 + July 7, 2005
Table 17. Number examined, mean, standard error of mean, and weight for females aged 20 years and over for selected percentiles, by race or ethnicity and age: United States, 1999–2002
Number of Standard Percentile examined error of
Race or ethnicity and age persons Mean mean 5th 10th 15th 25th 50th 75th 85th 90th 95th
All race or ethnicity groups Pounds
20 years and over . . . . . . . . . . . . . . . . . . . . . . . . 4,299 163.3 1.02 109.8 117.6 123.4 132.5 154.8 184.6 206.1 220.8 243.020–29 years . . . . . . . . . . . . . . . . . . . . . . . . . . 656 156.8 1.98 104.4 112.5 119.6 127.5 149.2 178.9 198.0 212.2 235.030–39 years . . . . . . . . . . . . . . . . . . . . . . . . . . 699 163.4 2.00 110.6 117.6 122.3 131.0 151.7 185.0 209.7 228.8 248.540–49 years . . . . . . . . . . . . . . . . . . . . . . . . . . 787 168.6 2.41 113.2 119.9 124.7 134.0 159.9 192.5 211.8 226.2 258.250–59 years . . . . . . . . . . . . . . . . . . . . . . . . . . 593 169.5 2.53 116.4 123.7 129.0 137.8 161.9 190.4 214.2 228.6 249.460–69 years . . . . . . . . . . . . . . . . . . . . . . . . . . 728 168.1 1.68 114.1 124.4 130.3 139.6 162.0 189.2 208.7 226.8 244.070–79 years . . . . . . . . . . . . . . . . . . . . . . . . . . 486 156.4 1.68 108.6 117.8 123.9 133.3 153.4 176.3 191.8 201.5 213.580 years and over . . . . . . . . . . . . . . . . . . . . . . . 350 140.5 2.90 99.9 103.1 109.2 118.3 137.5 157.2 171.0 175.8 201.2
Non-Hispanic white
20 years and over . . . . . . . . . . . . . . . . . . . . . . . . 2,052 162.2 1.16 109.8 117.4 123.2 131.9 154.0 183.7 205.3 218.5 239.620–39 years . . . . . . . . . . . . . . . . . . . . . . . . . . 564 158.6 1.97 108.2 115.6 121.6 128.5 149.5 180.3 200.5 214.5 239.240–59 years . . . . . . . . . . . . . . . . . . . . . . . . . . 628 167.9 2.20 113.4 120.2 124.7 134.1 160.0 192.3 212.0 226.0 252.460 years and over . . . . . . . . . . . . . . . . . . . . . . . 860 158.3 1.17 107.2 116.3 123.0 133.6 152.9 176.4 195.8 206.5 228.8
Non-Hispanic black
20 years and over . . . . . . . . . . . . . . . . . . . . . . . . 861 182.8 1.53 117.2 128.3 134.3 147.6 174.8 208.0 232.5 247.8 278.720–39 years . . . . . . . . . . . . . . . . . . . . . . . . . . 297 179.6 3.00 115.8 123.3 131.0 140.6 167.7 206.9 233.2 250.4 283.240–59 years . . . . . . . . . . . . . . . . . . . . . . . . . . 292 189.3 2.75 124.0 134.2 143.0 152.3 177.4 215.4 233.7 247.9 284.460 years and over . . . . . . . . . . . . . . . . . . . . . . . 272 177.2 3.32 113.2 126.2 133.8 146.1 174.7 201.2 223.1 239.9 253.0
Mexican American
20 years and over . . . . . . . . . . . . . . . . . . . . . . . . 1,019 157.0 1.62 109.7 115.7 123.0 131.2 150.5 177.1 194.6 203.5 224.920–39 years . . . . . . . . . . . . . . . . . . . . . . . . . . 358 153.2 2.20 107.7 114.7 121.2 129.0 146.6 170.8 188.4 198.9 222.340–59 years . . . . . . . . . . . . . . . . . . . . . . . . . . 332 165.9 2.61 114.9 123.2 128.6 138.4 161.8 184.9 202.0 215.1 232.660 years and over . . . . . . . . . . . . . . . . . . . . . . . 329 151.0 2.65 96.9 109.3 117.3 128.2 148.0 170.2 184.6 196.2 206.9
NOTE: Pregnant women are excluded.
Table 18. Number examined, mean, standard error of mean, and standing height for females aged 20 years and over for selected percentiles, by race or ethnicity and age: United States, 1999–2002
Number of Standard Percentile examined error of
Race or ethnicity and age persons Mean mean 5th 10th 15th 25th 50th 75th 85th 90th 95th
All race or ethnicity groups Centimeters
20 years and over . . . . . . . . . . . . . . . . . . . 4,888 162.1 0.14 150.8 153.1 155.0 157.4 162.1 166.6 169.0 170.9 173.320–29 years . . . . . . . . . . . . . . . . . . . . . . 1,034 162.8 0.31 152.1 153.7 156.0 158.1 162.9 167.0 170.2 171.5 173.630–39 years . . . . . . . . . . . . . . . . . . . . . . 909 163.1 0.28 152.0 154.5 156.1 158.6 163.1 167.5 169.9 171.5 174.240–49 years . . . . . . . . . . . . . . . . . . . . . . 799 163.4 0.24 152.2 154.4 156.3 158.7 163.3 167.8 170.1 171.7 174.550–59 years . . . . . . . . . . . . . . . . . . . . . . 604 162.3 0.35 151.7 153.9 155.7 157.8 162.3 166.3 168.6 170.8 173.060–69 years . . . . . . . . . . . . . . . . . . . . . . 723 160.6 0.27 149.9 152.2 154.3 156.5 160.6 164.8 167.1 168.8 170.570–79 years . . . . . . . . . . . . . . . . . . . . . . 482 159.0 0.31 148.3 150.1 152.1 155.0 159.0 162.8 165.8 167.1 169.180 years and over . . . . . . . . . . . . . . . . . . 337 155.8 0.34 145.7 147.6 149.7 151.9 155.9 159.4 161.8 163.6 166.7
Non-Hispanic white
20 years and over . . . . . . . . . . . . . . . . . . . 2,325 162.9 0.16 152.1 154.8 156.2 158.6 163.0 167.1 169.6 171.3 173.820–39 years . . . . . . . . . . . . . . . . . . . . . . 847 164.3 0.25 154.1 156.2 157.6 160.4 163.9 168.2 170.9 172.1 174.340–59 years . . . . . . . . . . . . . . . . . . . . . . 635 164.1 0.24 154.3 156.2 157.8 160.2 164.0 167.9 170.3 172.3 174.560 years and over . . . . . . . . . . . . . . . . . . 843 159.6 0.17 148.7 151.1 152.8 155.4 159.5 163.8 166.2 167.8 169.7
Non-Hispanic black
20 years and over . . . . . . . . . . . . . . . . . . . 941 163.0 0.20 152.9 155.0 156.3 158.5 163.1 167.5 169.6 171.3 173.820–39 years . . . . . . . . . . . . . . . . . . . . . . 372 163.9 0.32 153.7 155.7 156.7 159.5 163.8 168.0 170.5 171.7 174.140–59 years . . . . . . . . . . . . . . . . . . . . . . 294 163.2 0.32 153.2 155.6 156.8 158.6 162.9 167.4 168.9 171.3 174.060 years and over . . . . . . . . . . . . . . . . . . 275 160.6 0.35 148.9 151.9 153.7 156.0 160.4 165.6 167.6 169.3 172.6
Mexican American
20 years and over . . . . . . . . . . . . . . . . . . . 1,175 157.4 0.31 146.8 149.4 150.8 153.1 157.2 161.6 163.9 165.9 168.120–39 years . . . . . . . . . . . . . . . . . . . . . . 513 158.0 0.45 148.1 150.0 151.9 153.7 157.8 162.1 164.4 165.9 168.340–59 years . . . . . . . . . . . . . . . . . . . . . . 338 157.3 0.41 146.7 148.5 150.7 152.9 157.0 161.3 164.2 166.3 168.560 years and over . . . . . . . . . . . . . . . . . . 324 154.1 0.33 142.5 145.0 147.2 150.4 154.3 158.1 161.1 162.5 163.8

20 Advance Data No. 361 + July 7, 2005
Table 19. Number examined, mean, standard error of mean, and standing height for females aged 20 years and over for selected percentiles, by race or ethnicity and age: United States, 1999–2002
Number of Standard Percentile examined error of
Race or ethnicity and age persons Mean mean 5th 10th 15th 25th 50th 75th 85th 90th 95th
All race or ethnicity groups Inches
20 years and over . . . . . . . . . . . . . . . . . . . . . . . . 4,888 63.8 0.06 59.4 60.3 61.0 62.0 63.8 65.6 66.5 67.3 68.220–29 years . . . . . . . . . . . . . . . . . . . . . . . . . . 1,034 64.1 0.12 59.9 60.5 61.4 62.3 64.1 65.8 67.0 67.5 68.4 30–39 years . . . . . . . . . . . . . . . . . . . . . . . . . . 909 64.2 0.11 59.9 60.8 61.5 62.4 64.2 65.9 66.9 67.5 68.6 40–49 years . . . . . . . . . . . . . . . . . . . . . . . . . . 799 64.3 0.09 59.9 60.8 61.5 62.5 64.3 66.1 67.0 67.6 68.7 50–59 years . . . . . . . . . . . . . . . . . . . . . . . . . . 604 63.9 0.14 59.7 60.6 61.3 62.1 63.9 65.5 66.4 67.2 68.1 60–69 years . . . . . . . . . . . . . . . . . . . . . . . . . . 723 63.2 0.10 59.0 59.9 60.7 61.6 63.2 64.9 65.8 66.5 67.1 70–79 years . . . . . . . . . . . . . . . . . . . . . . . . . . 482 62.6 0.12 58.4 59.1 59.9 61.0 62.6 64.1 65.3 65.8 66.6 80 years and over . . . . . . . . . . . . . . . . . . . . . . . 337 61.3 0.13 57.4 58.1 58.9 59.8 61.4 62.8 63.7 64.4 65.6
Non-Hispanic white
20 years and over . . . . . . . . . . . . . . . . . . . . . . . . 2,325 64.1 0.06 59.9 61.0 61.5 62.4 64.2 65.8 66.8 67.4 68.420–39 years . . . . . . . . . . . . . . . . . . . . . . . . . . 847 64.7 0.10 60.7 61.5 62.1 63.2 64.5 66.2 67.3 67.8 68.6 40–59 years . . . . . . . . . . . . . . . . . . . . . . . . . . 635 64.6 0.10 60.8 61.5 62.1 63.1 64.6 66.1 67.1 67.8 68.7 60 years and over . . . . . . . . . . . . . . . . . . . . . . . 843 62.8 0.07 58.5 59.5 60.2 61.2 62.8 64.5 65.4 66.1 66.8
Non-Hispanic black
20 years and over . . . . . . . . . . . . . . . . . . . . . . . . 941 64.2 0.08 60.2 61.0 61.5 62.4 64.2 65.9 66.8 67.4 68.420–39 years . . . . . . . . . . . . . . . . . . . . . . . . . . 372 64.5 0.13 60.5 61.3 61.7 62.8 64.5 66.1 67.1 67.6 68.5 40–59 years . . . . . . . . . . . . . . . . . . . . . . . . . . 294 64.3 0.13 60.3 61.3 61.7 62.4 64.1 65.9 66.5 67.4 68.5 60 years and over . . . . . . . . . . . . . . . . . . . . . . . 275 63.2 0.14 58.6 59.8 60.5 61.4 63.2 65.2 66.0 66.7 67.9
Mexican American
20 years and over . . . . . . . . . . . . . . . . . . . . . . . . 1,175 62.0 0.12 57.8 58.8 59.4 60.3 61.9 63.6 64.5 65.3 66.220–39 years . . . . . . . . . . . . . . . . . . . . . . . . . . 513 62.2 0.18 58.3 59.1 59.8 60.5 62.1 63.8 64.7 65.3 66.2 40–59 years . . . . . . . . . . . . . . . . . . . . . . . . . . 338 61.9 0.16 57.7 58.5 59.3 60.2 61.8 63.5 64.6 65.5 66.3 60 years and over . . . . . . . . . . . . . . . . . . . . . . . 324 60.7 0.13 56.1 57.1 57.9 59.2 60.7 62.2 63.4 64.0 64.5
Table 20. Number examined, mean, standard error of mean, and body mass index values for females aged 20 years and over for selected percentiles, by race or ethnicity and age: United States, 1999–2002
Number of Standard Percentile examined error of
Race or ethnicity and age persons Mean mean 5th 10th 15th 25th 50th 75th 85th 90th 95th
All race or ethnicity groups Body mass indices
20 years and over . . . . . . . . . . . . . . . . . . . . . . . . 4,243 28.2 0.17 19.4 20.6 21.6 23.1 26.8 32.0 35.3 37.7 41.520–29 years . . . . . . . . . . . . . . . . . . . . . . . . . . 654 26.8 0.29 18.5 19.6 20.7 22.1 25.2 30.3 33.6 35.6 39.4 30–39 years . . . . . . . . . . . . . . . . . . . . . . . . . . 698 27.9 0.33 19.0 20.3 21.0 22.6 26.1 31.5 36.0 38.0 42.2 40–49 years . . . . . . . . . . . . . . . . . . . . . . . . . . 783 28.6 0.40 19.3 20.5 21.7 23.1 26.9 32.8 36.0 38.9 42.1 50–59 years . . . . . . . . . . . . . . . . . . . . . . . . . . 591 29.2 0.40 20.4 21.3 22.3 23.7 27.9 33.1 36.4 38.9 42.1 60–69 years . . . . . . . . . . . . . . . . . . . . . . . . . . 720 29.6 0.30 20.6 22.0 23.3 24.7 28.5 33.3 36.4 38.7 42.1 70–79 years . . . . . . . . . . . . . . . . . . . . . . . . . . 470 28.0 0.29 19.4 21.1 22.2 24.1 27.5 31.1 34.0 35.7 37.7 80 years and over . . . . . . . . . . . . . . . . . . . . . . . 327 26.1 0.48 18.5 19.8 21.2 22.9 25.1 28.8 30.9 32.7 37.2
Non-Hispanic white
20 years and over . . . . . . . . . . . . . . . . . . . . . . . . 2,015 27.7 0.21 19.2 20.4 21.2 22.6 26.3 31.4 34.8 37.2 40.620–39 years . . . . . . . . . . . . . . . . . . . . . . . . . . 562 26.7 0.32 18.5 19.8 20.7 21.9 24.8 29.9 33.8 36.6 39.6 40–59 years . . . . . . . . . . . . . . . . . . . . . . . . . . 625 28.3 0.37 19.4 20.5 21.3 22.6 26.6 32.7 36.0 38.4 41.6 60 years and over . . . . . . . . . . . . . . . . . . . . . . . 828 28.1 0.22 19.7 21.1 22.2 23.9 27.3 31.5 34.2 36.6 40.2
Non-Hispanic black20 years and over . . . . . . . . . . . . . . . . . . . . . . . . 854 31.1 0.28 20.5 22.0 23.4 25.3 29.8 35.6 39.1 42.4 46.7
20–39 years . . . . . . . . . . . . . . . . . . . . . . . . . . 297 30.2 0.52 19.5 21.1 22.1 23.9 28.7 34.6 38.4 42.4 46.7 40–59 years . . . . . . . . . . . . . . . . . . . . . . . . . . 289 32.1 0.48 21.3 23.2 24.1 26.1 30.0 36.0 39.9 43.0 47.6 60 years and over . . . . . . . . . . . . . . . . . . . . . . . 268 31.1 0.57 20.5 23.3 24.3 26.2 30.0 35.8 39.5 41.1 43.2
Mexican American20 years and over . . . . . . . . . . . . . . . . . . . . . . . . 1,012 28.8 0.34 20.3 21.9 22.8 24.4 27.5 32.3 34.9 36.5 40.6
20–39 years . . . . . . . . . . . . . . . . . . . . . . . . . . 358 27.8 0.43 19.6 21.2 22.4 23.4 26.7 31.3 33.6 36.0 40.2 40–59 years . . . . . . . . . . . . . . . . . . . . . . . . . . 332 30.4 0.48 21.8 23.2 24.3 25.4 29.6 33.6 36.0 38.1 41.6 60 years and over . . . . . . . . . . . . . . . . . . . . . . . 322 29.0 0.41 20.0 22.3 23.6 24.7 28.3 32.1 35.1 36.4 39.5
NOTES: Pregnant women are excluded. Body mass index (BMI) is calculated as follows: BMI = weight (kilograms)/height (meters2).

21 Advance Data No. 361 + July 7, 2005
Table 21. Number examined, mean, standard error of mean, and mid-arm circumference for females aged 20 years and over for selected percentiles, by race or ethnicity and age: United States, 1999–2002
Number of Standard Percentile examined error of
Race or ethnicity and age persons Mean mean 5th 10th 15th 25th 50th 75th 85th 90th 95th
All race or ethnicity groups Centimeters
20 years and over . . . . . . . . . . . . . . . . . . . . . . . . 4,280 32.0 0.13 24.5 25.9 26.7 28.1 31.2 35.1 37.4 39.1 42.120–29 years . . . . . . . . . . . . . . . . . . . . . . . . . . 651 30.9 0.26 23.7 24.9 25.9 27.1 29.9 33.6 36.5 37.9 41.1 30–39 years . . . . . . . . . . . . . . . . . . . . . . . . . . 692 31.8 0.25 24.3 25.6 26.3 28.0 30.6 34.9 37.1 38.9 43.0 40–49 years . . . . . . . . . . . . . . . . . . . . . . . . . . 781 32.6 0.28 25.2 26.1 26.8 28.4 31.9 36.0 38.0 39.7 43.1 50–59 years . . . . . . . . . . . . . . . . . . . . . . . . . . 593 32.9 0.29 25.9 27.0 27.6 29.0 32.1 36.0 38.1 39.9 42.3 60–69 years . . . . . . . . . . . . . . . . . . . . . . . . . . 723 33.2 0.22 25.9 27.4 28.0 29.6 32.4 36.2 38.5 40.1 42.4 70–79 years . . . . . . . . . . . . . . . . . . . . . . . . . . 491 31.5 0.22 23.7 26.3 27.1 28.3 31.4 34.4 36.1 36.9 38.6 80 years and over . . . . . . . . . . . . . . . . . . . . . . . 349 29.3 0.41 22.9 23.5 24.6 26.4 28.9 31.5 33.4 35.5 38.6
Non-Hispanic white20 years and over . . . . . . . . . . . . . . . . . . . . . . . . 2,043 31.7 0.16 24.4 25.8 26.5 27.9 31.0 34.8 37.1 38.7 41.0
20–39 years . . . . . . . . . . . . . . . . . . . . . . . . . . 556 31.0 0.24 23.9 25.2 26.1 27.2 30.0 33.7 36.2 37.6 40.9 40–59 years . . . . . . . . . . . . . . . . . . . . . . . . . . 623 32.4 0.28 25.1 26.1 26.9 28.3 31.7 36.1 37.9 39.4 42.3 60 years and over . . . . . . . . . . . . . . . . . . . . . . . 864 31.6 0.15 23.7 25.9 27.0 28.2 31.2 34.6 36.7 38.3 40.4
Non-Hispanic black20 years and over . . . . . . . . . . . . . . . . . . . . . . . . 855 34.2 0.24 25.6 26.8 28.0 29.8 33.3 37.6 40.8 42.7 45.6
20–39 years . . . . . . . . . . . . . . . . . . . . . . . . . . 295 33.7 0.41 24.9 26.1 26.9 28.9 32.5 36.8 40.9 42.6 44.9 40–59 years . . . . . . . . . . . . . . . . . . . . . . . . . . 289 34.8 0.34 26.6 27.9 28.8 30.5 33.6 38.1 41.1 43.1 46.1 60 years and over . . . . . . . . . . . . . . . . . . . . . . . 271 34.2 0.51 25.2 27.3 28.4 29.9 33.3 37.5 40.2 42.3 45.5
Mexican American
20 years and over . . . . . . . . . . . . . . . . . . . . . . . . 1,014 31.9 0.19 25.3 26.4 27.5 28.6 31.3 34.5 36.6 37.8 40.120–39 years . . . . . . . . . . . . . . . . . . . . . . . . . . 356 31.2 0.26 24.9 26.0 26.8 28.2 30.6 33.4 35.3 36.9 39.1 40–59 years . . . . . . . . . . . . . . . . . . . . . . . . . . 330 33.3 0.32 26.3 27.7 28.6 29.7 33.0 36.2 37.5 39.0 41.7 60 years and over . . . . . . . . . . . . . . . . . . . . . . . 328 31.9 0.32 24.8 26.5 27.4 28.5 31.5 34.6 36.6 37.9 39.7
NOTE: Pregnant women are excluded.
Table 22. Number examined, mean, standard error of mean, and upper arm length for females aged 20 years and over for selected percentiles, by race or ethnicity and age: United States, 1999–2002
Number of Standard Percentile examined error of
Race or ethnicity and age persons Mean mean 5th 10th 15th 25th 50th 75th 85th 90th 95th
All race or ethnicity groups Centimeters
20 years and over . . . . . . . . . . . . . . . . . . . . . . . . 4,838 35.9 0.07 32.3 33.0 33.5 34.3 35.8 37.3 38.0 38.6 39.520–29 years . . . . . . . . . . . . . . . . . . . . . . . . . . 1,009 35.5 0.11 31.6 32.6 33.2 34.0 35.5 37.0 37.7 38.3 39.2 30–39 years . . . . . . . . . . . . . . . . . . . . . . . . . . 887 35.8 0.10 32.4 33.0 33.5 34.4 35.7 37.2 38.0 38.4 39.4 40–49 years . . . . . . . . . . . . . . . . . . . . . . . . . . 786 36.0 0.11 32.7 33.2 33.8 34.4 36.0 37.5 38.1 38.8 39.5 50–59 years . . . . . . . . . . . . . . . . . . . . . . . . . . 596 36.0 0.12 32.1 33.0 33.8 34.4 36.0 37.2 38.0 38.6 39.6 60–69 years . . . . . . . . . . . . . . . . . . . . . . . . . . 724 35.9 0.11 32.1 33.0 33.5 34.2 35.7 37.5 38.4 39.0 40.0 70–79 years . . . . . . . . . . . . . . . . . . . . . . . . . . 488 36.1 0.12 32.8 33.5 33.9 34.5 36.0 37.5 38.2 38.7 39.4 80 years and over . . . . . . . . . . . . . . . . . . . . . . . 348 35.6 0.18 32.4 33.0 33.4 34.0 35.4 36.9 37.6 38.0 38.9
Non-Hispanic white20 years and over . . . . . . . . . . . . . . . . . . . . . . . . 2,313 36.0 0.06 32.7 33.4 33.9 34.5 35.9 37.3 38.0 38.5 39.4
20–39 years . . . . . . . . . . . . . . . . . . . . . . . . . . 824 35.8 0.09 32.4 33.3 33.6 34.4 35.8 37.1 37.8 38.4 39.3 40–59 years . . . . . . . . . . . . . . . . . . . . . . . . . . 625 36.1 0.10 32.9 33.5 34.0 34.6 36.0 37.4 38.0 38.6 39.4 60 years and over . . . . . . . . . . . . . . . . . . . . . . . 864 36.0 0.09 32.7 33.3 33.9 34.4 35.9 37.4 38.0 38.6 39.4
Non-Hispanic black20 years and over . . . . . . . . . . . . . . . . . . . . . . . . 920 36.8 0.11 32.9 33.9 34.4 35.1 36.8 38.2 39.1 39.9 40.9
20–39 years . . . . . . . . . . . . . . . . . . . . . . . . . . 364 36.6 0.14 32.6 33.8 34.3 35.0 36.5 38.0 38.9 39.4 40.8 40–59 years . . . . . . . . . . . . . . . . . . . . . . . . . . 288 36.9 0.16 33.0 33.8 34.4 35.3 36.9 38.2 39.2 39.9 40.9 60 years and over . . . . . . . . . . . . . . . . . . . . . . . 268 37.2 0.18 33.6 34.2 34.7 35.4 37.0 38.9 39.8 40.3 41.1
Mexican American20 years and over . . . . . . . . . . . . . . . . . . . . . . . . 1,164 34.8 0.09 31.4 32.1 32.7 33.4 34.7 36.0 36.9 37.4 38.2
20–39 years . . . . . . . . . . . . . . . . . . . . . . . . . . 502 34.6 0.10 31.4 32.0 32.5 33.2 34.5 35.8 36.4 37.4 38.0 40–59 years . . . . . . . . . . . . . . . . . . . . . . . . . . 334 35.0 0.14 31.3 32.1 32.9 33.5 35.0 36.3 37.0 37.4 38.2 60 years and over . . . . . . . . . . . . . . . . . . . . . . . 328 35.0 0.14 31.9 32.5 32.9 33.5 34.8 36.3 37.3 37.9 38.7

22 Advance Data No. 361 + July 7, 2005
Table 23. Number examined, mean, standard error of mean, and maximal calf circumference for females aged 20 years and over for selected percentiles, by race or ethnicity and age: United States, 1999–2002
Number of Standard Percentile examined error of
Race or ethnicity and age persons Mean mean 5th 10th 15th 25th 50th 75th 85th 90th 95th
All race or ethnicity groups Centimeters
20 years and over . . . . . . . . . . . . . . . . . . . . . . . . 4,275 38.1 0.12 31.6 32.7 33.6 34.9 37.5 40.6 42.7 44.3 46.720–29 years . . . . . . . . . . . . . . . . . . . . . . . . . . 647 38.0 0.24 31.9 32.8 33.6 34.8 37.5 40.3 42.7 44.2 46.9 30–39 years . . . . . . . . . . . . . . . . . . . . . . . . . . 696 38.6 0.24 31.5 32.9 34.2 35.3 37.7 41.1 43.4 44.9 48.1 40–49 years . . . . . . . . . . . . . . . . . . . . . . . . . . 784 38.8 0.23 32.7 33.6 34.2 35.5 38.1 41.3 43.3 45.0 47.7 50–59 years . . . . . . . . . . . . . . . . . . . . . . . . . . 591 38.4 0.23 32.0 33.0 33.8 35.4 37.7 41.0 42.7 44.0 46.3 60–69 years . . . . . . . . . . . . . . . . . . . . . . . . . . 723 38.2 0.19 32.0 32.9 33.7 35.0 37.8 41.0 42.6 44.3 46.1 70–79 years . . . . . . . . . . . . . . . . . . . . . . . . . . 483 36.7 0.25 30.1 31.7 32.8 34.0 36.3 39.3 40.9 42.2 44.2 80 years and over . . . . . . . . . . . . . . . . . . . . . . . 351 34.6 0.36 28.4 30.2 31.0 32.0 34.4 36.9 38.2 39.1 41.7
Non-Hispanic white
20 years and over . . . . . . . . . . . . . . . . . . . . . . . . 2,033 38.2 0.13 31.8 32.9 33.7 35.0 37.5 40.7 42.7 44.3 46.720–39 years . . . . . . . . . . . . . . . . . . . . . . . . . . 557 38.4 0.25 31.9 33.0 34.0 35.3 37.5 40.7 43.1 44.7 47.1 40–59 years . . . . . . . . . . . . . . . . . . . . . . . . . . 621 38.7 0.20 32.4 33.4 34.0 35.5 38.0 41.4 43.1 44.7 47.5 60 years and over . . . . . . . . . . . . . . . . . . . . . . . 855 37.2 0.15 30.9 32.0 32.9 34.0 36.6 39.6 41.7 43.4 45.1
Non-Hispanic black
20 years and over . . . . . . . . . . . . . . . . . . . . . . . . 857 39.4 0.19 32.3 33.4 34.4 35.9 38.8 42.2 44.3 45.6 48.620–39 years . . . . . . . . . . . . . . . . . . . . . . . . . . 295 39.8 0.30 32.5 34.0 34.6 36.2 39.2 42.9 44.8 46.2 48.9 40–59 years . . . . . . . . . . . . . . . . . . . . . . . . . . 292 39.8 0.30 32.8 34.3 34.8 36.5 39.0 41.8 44.3 45.7 50.3 60 years and over . . . . . . . . . . . . . . . . . . . . . . . 270 37.7 0.45 29.8 31.9 32.9 34.4 37.7 40.4 42.3 43.8 46.1
Mexican American
20 years and over . . . . . . . . . . . . . . . . . . . . . . . . 1,015 36.9 0.17 30.9 32.0 32.7 34.0 36.5 39.3 41.0 42.1 44.420–39 years . . . . . . . . . . . . . . . . . . . . . . . . . . 355 37.0 0.24 31.2 32.1 32.7 34.0 36.5 39.2 41.0 42.1 44.4 40–59 years . . . . . . . . . . . . . . . . . . . . . . . . . . 331 37.5 0.24 31.6 32.5 33.2 34.8 37.0 39.9 41.5 42.5 44.7 60 years and over . . . . . . . . . . . . . . . . . . . . . . . 329 35.3 0.32 28.2 29.9 31.2 32.9 35.0 37.4 39.2 40.4 42.2
NOTE: Pregnant women are excluded.
Table 24. Number examined, mean, standard error of mean, and upper leg length for females aged 20 years and over for selected percentiles, by race or ethnicity and age: United States, 1999–2002
Number of Standard Percentile examined error of
Race or ethnicity and age persons Mean mean 5th 10th 15th 25th 50th 75th 85th 90th 95th
All race or ethnicity groups Centimeters
20 years and over . . . . . . . . . . . . . . . . . . . . . . . . 4,750 38.9 0.11 33.5 34.7 35.6 36.9 39.0 40.9 42.0 42.7 44.020–29 years . . . . . . . . . . . . . . . . . . . . . . . . . . 994 40.0 0.14 34.9 36.2 37.0 38.0 40.1 41.9 42.9 43.7 44.7 30–39 years . . . . . . . . . . . . . . . . . . . . . . . . . . 876 39.7 0.15 34.8 36.0 36.7 37.9 39.6 41.5 42.5 43.2 44.4 40–49 years . . . . . . . . . . . . . . . . . . . . . . . . . . 780 39.1 0.13 33.9 35.1 36.2 37.4 39.2 41.0 42.0 42.6 43.8 50–59 years . . . . . . . . . . . . . . . . . . . . . . . . . . 584 38.3 0.18 32.9 34.3 34.9 36.2 38.3 40.2 41.2 42.0 43.2 60–69 years . . . . . . . . . . . . . . . . . . . . . . . . . . 703 37.9 0.22 32.9 34.0 34.6 35.7 37.9 39.9 41.1 41.9 43.0 70–79 years . . . . . . . . . . . . . . . . . . . . . . . . . . 472 37.6 0.24 31.9 33.4 34.1 35.5 37.7 39.7 40.8 41.6 42.5 80 years and over . . . . . . . . . . . . . . . . . . . . . . . 341 37.1 0.25 * 33.1 34.0 35.1 37.0 39.0 40.0 41.0 *
Non-Hispanic white
20 years and over . . . . . . . . . . . . . . . . . . . . . . . . 2,275 39.0 0.10 33.9 35.1 36.0 37.1 39.0 40.9 41.9 42.5 43.720–39 years . . . . . . . . . . . . . . . . . . . . . . . . . . 815 39.9 0.13 35.6 36.5 37.3 38.1 40.0 41.7 42.6 43.2 44.3 40–59 years . . . . . . . . . . . . . . . . . . . . . . . . . . 620 38.9 0.13 34.0 35.2 36.0 37.1 39.1 40.6 41.6 42.3 43.4 60 years and over . . . . . . . . . . . . . . . . . . . . . . . 840 37.7 0.19 32.5 33.7 34.5 35.7 37.7 39.7 40.9 41.6 42.7
Non-Hispanic black
20 years and over . . . . . . . . . . . . . . . . . . . . . . . . 903 40.5 0.16 34.9 36.2 37.4 38.4 40.5 42.5 43.6 44.4 45.720–39 years . . . . . . . . . . . . . . . . . . . . . . . . . . 357 41.4 0.15 36.9 37.9 38.5 39.4 41.1 43.3 44.3 45.0 46.2 40–59 years . . . . . . . . . . . . . . . . . . . . . . . . . . 285 40.1 0.26 34.9 35.9 37.2 38.1 40.3 42.3 43.0 43.5 44.9 60 years and over . . . . . . . . . . . . . . . . . . . . . . . 261 39.0 0.25 33.4 34.4 35.4 36.6 39.0 41.2 41.9 42.7 43.8
Mexican American20 years and over . . . . . . . . . . . . . . . . . . . . . . . . 1,139 37.4 0.18 32.3 33.5 34.3 35.4 37.3 39.4 40.6 41.5 42.6
20–39 years . . . . . . . . . . . . . . . . . . . . . . . . . . 494 38.0 0.23 33.4 34.2 35.0 36.1 37.8 40.0 41.0 42.0 43.2 40–59 years . . . . . . . . . . . . . . . . . . . . . . . . . . 330 36.9 0.22 * 32.8 33.7 34.8 36.8 39.0 40.1 41.0 * 60 years and over . . . . . . . . . . . . . . . . . . . . . . . 315 35.5 0.25 * 31.1 32.4 33.9 35.6 37.4 38.5 39.4 *
* Figure does not meet standard of reliability or precision.

23 Advance Data No. 361 + July 7, 2005
Table 25. Number examined, mean, standard error of mean, and mid-thigh circumference for females 20 years and over for selected percentiles, by race or ethnicity and age: United States, 1999–2002
Number of Standard Percentile examined error of
Race or ethnicity and age persons Mean mean 5th 10th 15th 25th 50th 75th 85th 90th 95th
All race or ethnicity groups Centimeters
20 years and over . . . . . . . . . . . . . . . . . . . . . . . . 4,164 53.1 0.20 42.5 44.3 45.7 47.7 52.0 57.5 60.9 63.3 67.4 20–29 years . . . . . . . . . . . . . . . . . . . . . . . . . . 640 53.9 0.35 43.9 45.2 46.5 48.6 52.6 57.9 61.9 63.8 68.8 30–39 years . . . . . . . . . . . . . . . . . . . . . . . . . . 685 54.0 0.36 44.0 45.4 46.5 48.4 52.4 58.4 62.3 64.7 68.3 40–49 years . . . . . . . . . . . . . . . . . . . . . . . . . . 770 54.1 0.39 43.3 45.1 46.6 48.6 53.1 58.7 61.4 63.7 68.3 50–59 years . . . . . . . . . . . . . . . . . . . . . . . . . . 580 53.2 0.38 42.9 44.4 45.7 47.6 52.3 57.7 61.6 63.2 66.3 60–69 years . . . . . . . . . . . . . . . . . . . . . . . . . . 704 52.8 0.32 42.9 44.4 45.6 47.5 52.0 56.6 60.0 62.8 68.4 70–79 years . . . . . . . . . . . . . . . . . . . . . . . . . . 463 50.1 0.39 39.5 41.7 43.4 46.0 49.3 54.0 56.2 58.4 61.4 80 years and over . . . . . . . . . . . . . . . . . . . . . . . 322 47.2 0.71 38.6 39.4 40.5 42.7 46.2 49.9 53.4 56.0 60.6
Non-Hispanic white
20 years and over . . . . . . . . . . . . . . . . . . . . . . . . 1,999 52.6 0.22 42.2 44.1 45.5 47.4 51.6 56.8 60.3 62.7 66.9 20–39 years . . . . . . . . . . . . . . . . . . . . . . . . . . 553 53.4 0.38 43.7 45.1 46.4 48.3 51.9 57.6 60.9 63.8 67.9 40–59 years . . . . . . . . . . . . . . . . . . . . . . . . . . 617 53.4 0.31 43.0 44.5 45.9 48.0 52.7 58.1 61.2 63.0 67.2 60 years and over . . . . . . . . . . . . . . . . . . . . . . . 829 50.7 0.26 40.0 42.6 43.9 46.0 49.6 54.9 57.2 59.9 63.9
Non-Hispanic black
20 years and over . . . . . . . . . . . . . . . . . . . . . . . . 826 58.1 0.27 45.1 47.6 49.2 51.6 57.1 63.2 66.5 69.9 74.1 20–39 years . . . . . . . . . . . . . . . . . . . . . . . . . . 290 58.4 0.58 45.9 48.2 49.5 51.7 57.7 63.2 66.7 70.3 74.6 40–59 years . . . . . . . . . . . . . . . . . . . . . . . . . . 283 58.8 0.52 45.8 48.5 50.1 52.5 57.8 64.0 67.4 70.3 74.0 60 years and over . . . . . . . . . . . . . . . . . . . . . . . 253 55.7 0.80 43.0 45.1 46.9 48.7 55.6 61.2 64.2 67.3 71.4
Mexican American
20 years and over . . . . . . . . . . . . . . . . . . . . . . . . 983 51.7 0.27 42.4 44.1 45.3 47.2 50.8 55.5 58.3 60.3 63.3 20–39 years . . . . . . . . . . . . . . . . . . . . . . . . . . 348 52.0 0.35 43.3 44.8 45.8 47.6 50.9 55.4 58.7 61.3 64.1 40–59 years . . . . . . . . . . . . . . . . . . . . . . . . . . 325 52.4 0.42 42.8 44.4 46.1 47.8 51.9 56.3 58.8 60.0 63.2 60 years and over . . . . . . . . . . . . . . . . . . . . . . . 310 48.3 0.47 38.2 40.9 42.0 44.0 48.0 52.4 55.2 56.9 59.8
NOTE: Pregnant women are excluded.
Table 26. Number examined, mean, standard error of mean, and waist circumference for females aged 20 years and over for selected percentiles, by race or ethnicity and age: United States, 1999–2002
Number of Standard Percentile examined error of
Race or ethnicity and age persons Mean mean 5th 10th 15th 25th 50th 75th 85th 90th 95th
All race or ethnicity groups Centimeters
20 years and over . . . . . . . . . . . . . . . . . . . . . . . . 4,212 92.7 0.47 70.6 73.9 76.3 80.6 90.7 102.7 109.4 113.7 120.920–29 years . . . . . . . . . . . . . . . . . . . . . . . . . . 640 87.1 0.79 67.4 69.9 72.8 76.4 84.0 96.4 103.2 107.2 115.730–39 years . . . . . . . . . . . . . . . . . . . . . . . . . . 688 89.9 0.84 69.1 71.6 74.0 77.0 87.6 98.1 107.4 112.8 120.640–49 years . . . . . . . . . . . . . . . . . . . . . . . . . . 774 92.7 0.87 71.1 73.8 76.2 80.0 90.3 103.2 109.9 114.6 121.750–59 years . . . . . . . . . . . . . . . . . . . . . . . . . . 591 95.7 1.04 74.1 77.3 79.8 84.3 93.4 106.1 111.7 117.2 123.160–69 years . . . . . . . . . . . . . . . . . . . . . . . . . . 714 98.1 0.65 76.3 79.0 81.9 87.3 98.0 107.3 113.5 119.3 125.870–79 years . . . . . . . . . . . . . . . . . . . . . . . . . . 472 96.5 0.61 75.7 79.4 81.4 86.3 97.1 105.3 109.9 112.0 118.380 years and over . . . . . . . . . . . . . . . . . . . . . . . 333 92.5 0.97 70.8 74.3 78.7 82.6 92.0 102.5 105.9 109.1 112.2
Non-Hispanic white
20 years and over . . . . . . . . . . . . . . . . . . . . . . . . 2,018 92.1 0.60 70.5 73.4 75.9 79.7 90.0 102.3 109.2 112.9 120.520–39 years . . . . . . . . . . . . . . . . . . . . . . . . . . 554 87.5 0.82 68.1 70.7 72.7 76.1 84.6 96.0 103.2 109.4 116.040–59 years . . . . . . . . . . . . . . . . . . . . . . . . . . 620 93.0 0.94 71.4 74.5 76.3 80.1 90.7 103.9 110.0 114.7 121.660 years and over . . . . . . . . . . . . . . . . . . . . . . . 844 96.3 0.46 74.0 77.8 80.8 85.9 96.7 105.0 110.3 113.7 121.2
Non-Hispanic black
20 years and over . . . . . . . . . . . . . . . . . . . . . . . . 830 97.5 0.74 72.1 77.3 80.2 85.7 96.6 108.6 116.0 119.9 126.620–39 years . . . . . . . . . . . . . . . . . . . . . . . . . . 289 94.0 1.18 69.0 73.5 76.3 80.5 90.9 106.0 113.1 118.3 126.440–59 years . . . . . . . . . . . . . . . . . . . . . . . . . . 287 99.6 0.88 76.0 82.0 85.0 88.4 97.4 109.4 117.2 120.4 127.160 years and over . . . . . . . . . . . . . . . . . . . . . . . 254 101.1 1.20 77.2 81.2 85.0 91.8 100.5 111.1 116.3 119.7 126.3
Mexican American 20 years and over . . . . . . . . . . . . . . . . . . . . . . . . 1,001 92.7 0.84 72.3 76.3 78.4 82.0 91.4 102.0 107.1 110.2 118.5
20–39 years . . . . . . . . . . . . . . . . . . . . . . . . . . 351 89.5 1.05 69.6 74.5 76.6 79.6 87.4 98.0 104.6 107.0 113.240–59 years . . . . . . . . . . . . . . . . . . . . . . . . . . 328 96.6 1.10 76.2 78.8 82.0 86.9 95.1 105.1 109.6 113.4 121.260 years and over . . . . . . . . . . . . . . . . . . . . . . . 322 97.1 1.19 77.9 80.9 83.9 88.1 96.6 105.7 110.5 114.3 120.4
NOTE: Pregnant women are excluded.

24 Advance Data No. 361 + July 7, 2005
Table 27. Number examined, mean, standard error of mean, and subscapular skinfold thickness for females aged 20 years and over for selected percentiles, by race or ethnicity and age: United States, 1999–2002
Number of Standard Percentile examined error of
Race or ethnicity and age persons Mean mean 5th 10th 15th 25th 50th 75th 85th 90th 95th
All race or ethnicity groups Millimeters
20 years and over . . . . . . . . . . . . . . . . . . . . . . . . 3,318 20.3 0.23 8.2 9.7 11.0 13.5 19.4 26.3 29.9 32.1 34.720–29 years . . . . . . . . . . . . . . . . . . . . . . . . . . 513 18.9 0.49 7.7 9.2 10.3 12.2 16.8 24.3 29.2 31.7 34.4 30–39 years . . . . . . . . . . . . . . . . . . . . . . . . . . 530 19.8 0.41 8.2 9.4 10.8 12.9 18.7 26.1 29.2 31.1 34.1 40–49 years . . . . . . . . . . . . . . . . . . . . . . . . . . 564 21.2 0.62 8.1 9.8 10.9 14.0 20.6 28.1 31.5 33.6 35.8 50–59 years . . . . . . . . . . . . . . . . . . . . . . . . . . 416 22.0 0.44 9.1 11.4 14.1 16.2 22.1 27.6 30.1 32.4 34.2 60–69 years . . . . . . . . . . . . . . . . . . . . . . . . . . 563 22.0 0.36 9.2 11.9 13.3 17.3 21.5 27.0 30.4 32.4 34.7 70–79 years . . . . . . . . . . . . . . . . . . . . . . . . . . 417 19.4 0.53 7.7 9.4 10.6 13.5 18.5 24.4 28.7 31.1 33.0 80 years and over . . . . . . . . . . . . . . . . . . . . . . . 315 15.5 0.53 6.2 7.9 8.7 10.1 14.6 19.2 22.5 25.0 28.2
Non-Hispanic white 20 years and over . . . . . . . . . . . . . . . . . . . . . . . . 1,696 19.5 0.28 7.9 9.2 10.4 12.9 18.4 25.3 29.2 31.5 34.3
20–39 years . . . . . . . . . . . . . . . . . . . . . . . . . . 464 18.3 0.43 7.5 8.9 9.9 11.8 16.4 24.1 28.3 30.2 33.5 40–59 years . . . . . . . . . . . . . . . . . . . . . . . . . . 485 20.8 0.58 8.2 9.6 11.0 14.1 20.0 26.6 30.4 33.0 35.6 60 years and over . . . . . . . . . . . . . . . . . . . . . . . 747 19.3 0.29 7.6 9.2 10.5 13.1 18.8 24.3 28.4 30.5 33.1
Non-Hispanic black
20 years and over . . . . . . . . . . . . . . . . . . . . . . . . 563 23.1 0.46 9.4 11.1 12.8 16.0 22.9 29.9 32.9 34.4 36.720–39 years . . . . . . . . . . . . . . . . . . . . . . . . . . 203 22.0 0.52 9.0 10.4 11.8 14.9 21.9 28.9 32.1 33.5 36.3 40–59 years . . . . . . . . . . . . . . . . . . . . . . . . . . 170 24.7 0.74 * 12.9 14.0 18.2 25.6 30.8 34.1 35.6 * 60 years and over . . . . . . . . . . . . . . . . . . . . . . . 190 22.7 0.63 8.6 10.4 12.3 16.0 22.7 29.5 32.2 33.6 35.6
Mexican American
20 years and over . . . . . . . . . . . . . . . . . . . . . . . . 779 21.8 0.51 10.3 12.0 13.6 16.1 21.2 26.6 30.3 32.1 34.820–39 years . . . . . . . . . . . . . . . . . . . . . . . . . . 268 21.0 0.70 9.4 11.1 12.3 15.3 20.3 26.0 29.1 31.1 34.6 40–59 years . . . . . . . . . . . . . . . . . . . . . . . . . . 234 23.6 0.42 * 14.4 15.7 18.1 22.6 29.8 31.6 33.1 * 60 years and over . . . . . . . . . . . . . . . . . . . . . . . 277 21.1 0.56 9.8 12.1 13.0 15.3 20.6 25.3 29.2 32.2 35.0
* Figure does not meet standard of reliability or precision.
NOTE: Pregnant women are excluded.
Table 28. Number examined, mean, standard error of mean, and triceps skinfold thickness for females aged 20 years and over for selected percentiles, by race or ethnicity and age: United States, 1999–2002
Race or ethnicity and age
Number of examined persons Mean
Standard error of mean 5th 10th 15th
Percentile
25th 50th 75th 85th 90th 95th
All race or ethnicity groups Millimeters
20 years and over . . . . . . . . . . . . . . . . . . . . . . . . 20–29 years . . . . . . . . . . . . . . . . . . . . . . . . . . 30–39 years . . . . . . . . . . . . . . . . . . . . . . . . . . 40–49 years . . . . . . . . . . . . . . . . . . . . . . . . . . 50–59 years . . . . . . . . . . . . . . . . . . . . . . . . . . 60–69 years . . . . . . . . . . . . . . . . . . . . . . . . . . 70–79 years . . . . . . . . . . . . . . . . . . . . . . . . . . 80 years and over . . . . . . . . . . . . . . . . . . . . . . .
3,820 596 614 670 515 638 455 332
23.6 22.5 23.5 24.3 24.9 25.1 22.3 19.4
0.20 0.39 0.39 0.40 0.35 0.35 0.37 0.57
11.4 10.5 10.3 12.1 13.0 14.6 11.0 8.7
13.7 12.6 12.6 14.1 15.7 16.0 13.2 10.8
15.3 14.3 14.7 15.9 17.4 17.5 14.9 12.4
18.1 16.7 16.9 18.9 19.8 19.3 17.4 14.4
23.4 22.1 23.4 24.5 24.7 25.0 21.9 18.6
28.9 27.8 29.6 29.0 30.0 30.1 26.8 23.7
31.9 30.4 32.7 32.7 32.7 33.0 29.0 26.9
33.8 32.4 34.2 34.4 34.2 35.0 31.2 28.6
36.1 35.4 36.5 36.8 36.4 36.8 33.6 31.1
Non-Hispanic white
20 years and over . . . . . . . . . . . . . . . . . . . . . . . . 20–39 years . . . . . . . . . . . . . . . . . . . . . . . . . . 40–59 years . . . . . . . . . . . . . . . . . . . . . . . . . . 60 years and over . . . . . . . . . . . . . . . . . . . . . . .
1,845 510 542 793
23.3 22.7 24.2 22.8
0.25 0.36 0.40 0.25
11.1 10.1 12.1 11.4
13.3 12.4 14.1 13.7
15.2 14.2 15.9 15.2
17.9 16.7 18.9 17.6
23.1 22.2 24.1 22.5
28.5 28.4 29.1 27.9
31.7 31.7 32.7 30.3
33.7 33.1 34.2 32.9
36.0 35.5 36.7 35.4
Non-Hispanic black
20 years and over . . . . . . . . . . . . . . . . . . . . . . . . 20–39 years . . . . . . . . . . . . . . . . . . . . . . . . . . 40–59 years . . . . . . . . . . . . . . . . . . . . . . . . . . 60 years and over . . . . . . . . . . . . . . . . . . . . . . .
704 241 232 231
24.8 23.9 26.3 23.9
0.39 0.59 0.50 0.60
10.9 10.4 12.2 9.6
14.2 12.9 15.6 12.9
15.3 14.8 18.3 15.3
18.4 16.3 21.9 18.1
25.6 24.3 26.8 24.4
30.9 30.9 31.5 29.6
33.1 33.0 33.7 31.9
34.6 34.8 35.3 33.2
36.9 36.8 36.6 37.1
Mexican American
20 years and over . . . . . . . . . . . . . . . . . . . . . . . . 20–39 years . . . . . . . . . . . . . . . . . . . . . . . . . . 40–59 years . . . . . . . . . . . . . . . . . . . . . . . . . . 60 years and over . . . . . . . . . . . . . . . . . . . . . . .
930 333 294 303
23.9 23.2 25.7 22.6
0.38 0.51 0.35 0.52
12.5 12.4 14.3 10.8
14.7 14.0 16.3 13.4
16.1 15.5 17.9 15.6
18.4 17.4 20.2 17.0
24.0 23.4 25.9 22.0
28.8 27.9 30.3 26.9
31.8 30.4 32.8 31.0
33.9 33.3 34.8 32.9
36.2 35.4 37.3 36.0
NOTE: Pregnant women are excluded.
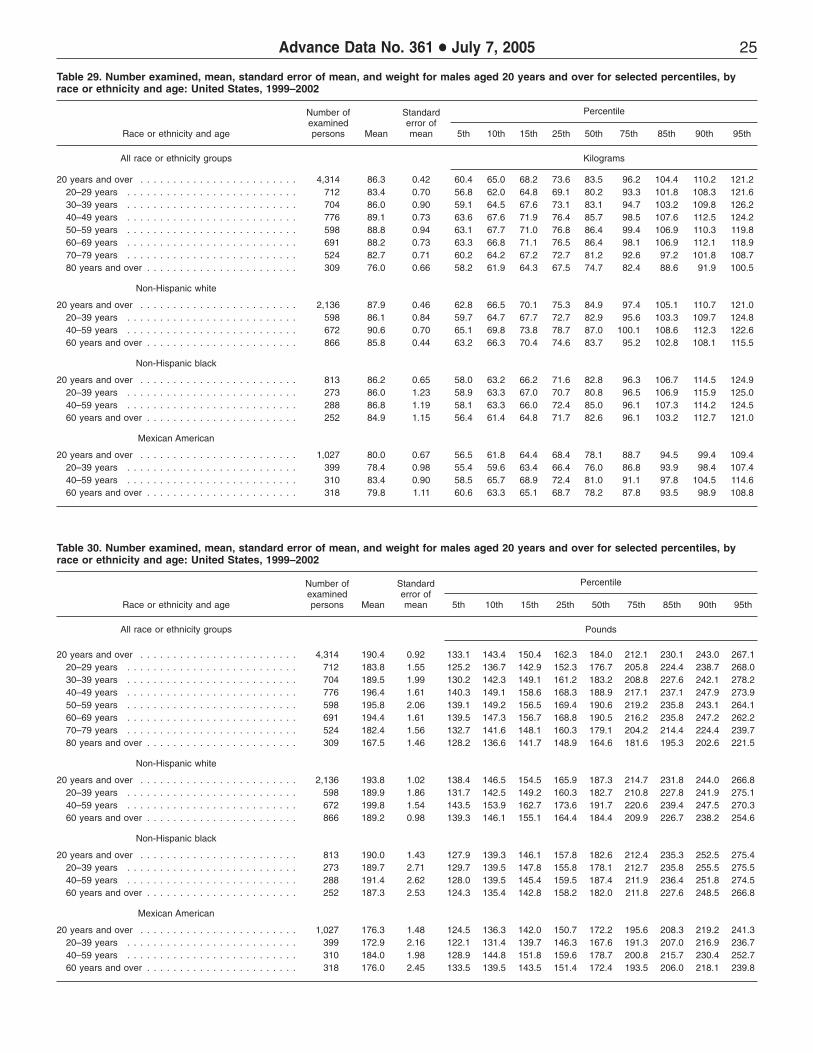
25 Advance Data No. 361 + July 7, 2005
Table 29. Number examined, mean, standard error of mean, and weight for males aged 20 years and over for selected percentiles, by race or ethnicity and age: United States, 1999–2002
Number of Standard Percentile examined error of
Race or ethnicity and age persons Mean mean 5th 10th 15th 25th 50th 75th 85th 90th 95th
All race or ethnicity groups Kilograms
20 years and over . . . . . . . . . . . . . . . . . . . . . . . . 4,314 86.3 0.42 60.4 65.0 68.2 73.6 83.5 96.2 104.4 110.2 121.220–29 years . . . . . . . . . . . . . . . . . . . . . . . . . . 712 83.4 0.70 56.8 62.0 64.8 69.1 80.2 93.3 101.8 108.3 121.630–39 years . . . . . . . . . . . . . . . . . . . . . . . . . . 704 86.0 0.90 59.1 64.5 67.6 73.1 83.1 94.7 103.2 109.8 126.240–49 years . . . . . . . . . . . . . . . . . . . . . . . . . . 776 89.1 0.73 63.6 67.6 71.9 76.4 85.7 98.5 107.6 112.5 124.250–59 years . . . . . . . . . . . . . . . . . . . . . . . . . . 598 88.8 0.94 63.1 67.7 71.0 76.8 86.4 99.4 106.9 110.3 119.860–69 years . . . . . . . . . . . . . . . . . . . . . . . . . . 691 88.2 0.73 63.3 66.8 71.1 76.5 86.4 98.1 106.9 112.1 118.970–79 years . . . . . . . . . . . . . . . . . . . . . . . . . . 524 82.7 0.71 60.2 64.2 67.2 72.7 81.2 92.6 97.2 101.8 108.780 years and over . . . . . . . . . . . . . . . . . . . . . . . 309 76.0 0.66 58.2 61.9 64.3 67.5 74.7 82.4 88.6 91.9 100.5
Non-Hispanic white
20 years and over . . . . . . . . . . . . . . . . . . . . . . . . 2,136 87.9 0.46 62.8 66.5 70.1 75.3 84.9 97.4 105.1 110.7 121.020–39 years . . . . . . . . . . . . . . . . . . . . . . . . . . 598 86.1 0.84 59.7 64.7 67.7 72.7 82.9 95.6 103.3 109.7 124.840–59 years . . . . . . . . . . . . . . . . . . . . . . . . . . 672 90.6 0.70 65.1 69.8 73.8 78.7 87.0 100.1 108.6 112.3 122.660 years and over . . . . . . . . . . . . . . . . . . . . . . . 866 85.8 0.44 63.2 66.3 70.4 74.6 83.7 95.2 102.8 108.1 115.5
Non-Hispanic black
20 years and over . . . . . . . . . . . . . . . . . . . . . . . . 813 86.2 0.65 58.0 63.2 66.2 71.6 82.8 96.3 106.7 114.5 124.920–39 years . . . . . . . . . . . . . . . . . . . . . . . . . . 273 86.0 1.23 58.9 63.3 67.0 70.7 80.8 96.5 106.9 115.9 125.040–59 years . . . . . . . . . . . . . . . . . . . . . . . . . . 288 86.8 1.19 58.1 63.3 66.0 72.4 85.0 96.1 107.3 114.2 124.560 years and over . . . . . . . . . . . . . . . . . . . . . . . 252 84.9 1.15 56.4 61.4 64.8 71.7 82.6 96.1 103.2 112.7 121.0
Mexican American
20 years and over . . . . . . . . . . . . . . . . . . . . . . . . 1,027 80.0 0.67 56.5 61.8 64.4 68.4 78.1 88.7 94.5 99.4 109.420–39 years . . . . . . . . . . . . . . . . . . . . . . . . . . 399 78.4 0.98 55.4 59.6 63.4 66.4 76.0 86.8 93.9 98.4 107.440–59 years . . . . . . . . . . . . . . . . . . . . . . . . . . 310 83.4 0.90 58.5 65.7 68.9 72.4 81.0 91.1 97.8 104.5 114.660 years and over . . . . . . . . . . . . . . . . . . . . . . . 318 79.8 1.11 60.6 63.3 65.1 68.7 78.2 87.8 93.5 98.9 108.8
Table 30. Number examined, mean, standard error of mean, and weight for males aged 20 years and over for selected percentiles, by race or ethnicity and age: United States, 1999–2002
Number of Standard Percentile examined error of
Race or ethnicity and age persons Mean mean 5th 10th 15th 25th 50th 75th 85th 90th 95th
All race or ethnicity groups Pounds
20 years and over . . . . . . . . . . . . . . . . . . . . . . . . 4,314 190.4 0.92 133.1 143.4 150.4 162.3 184.0 212.1 230.1 243.0 267.120–29 years . . . . . . . . . . . . . . . . . . . . . . . . . . 712 183.8 1.55 125.2 136.7 142.9 152.3 176.7 205.8 224.4 238.7 268.030–39 years . . . . . . . . . . . . . . . . . . . . . . . . . . 704 189.5 1.99 130.2 142.3 149.1 161.2 183.2 208.8 227.6 242.1 278.240–49 years . . . . . . . . . . . . . . . . . . . . . . . . . . 776 196.4 1.61 140.3 149.1 158.6 168.3 188.9 217.1 237.1 247.9 273.950–59 years . . . . . . . . . . . . . . . . . . . . . . . . . . 598 195.8 2.06 139.1 149.2 156.5 169.4 190.6 219.2 235.8 243.1 264.160–69 years . . . . . . . . . . . . . . . . . . . . . . . . . . 691 194.4 1.61 139.5 147.3 156.7 168.8 190.5 216.2 235.8 247.2 262.270–79 years . . . . . . . . . . . . . . . . . . . . . . . . . . 524 182.4 1.56 132.7 141.6 148.1 160.3 179.1 204.2 214.4 224.4 239.780 years and over . . . . . . . . . . . . . . . . . . . . . . . 309 167.5 1.46 128.2 136.6 141.7 148.9 164.6 181.6 195.3 202.6 221.5
Non-Hispanic white
20 years and over . . . . . . . . . . . . . . . . . . . . . . . . 2,136 193.8 1.02 138.4 146.5 154.5 165.9 187.3 214.7 231.8 244.0 266.820–39 years . . . . . . . . . . . . . . . . . . . . . . . . . . 598 189.9 1.86 131.7 142.5 149.2 160.3 182.7 210.8 227.8 241.9 275.140–59 years . . . . . . . . . . . . . . . . . . . . . . . . . . 672 199.8 1.54 143.5 153.9 162.7 173.6 191.7 220.6 239.4 247.5 270.360 years and over . . . . . . . . . . . . . . . . . . . . . . . 866 189.2 0.98 139.3 146.1 155.1 164.4 184.4 209.9 226.7 238.2 254.6
Non-Hispanic black
20 years and over . . . . . . . . . . . . . . . . . . . . . . . . 813 190.0 1.43 127.9 139.3 146.1 157.8 182.6 212.4 235.3 252.5 275.420–39 years . . . . . . . . . . . . . . . . . . . . . . . . . . 273 189.7 2.71 129.7 139.5 147.8 155.8 178.1 212.7 235.8 255.5 275.540–59 years . . . . . . . . . . . . . . . . . . . . . . . . . . 288 191.4 2.62 128.0 139.5 145.4 159.5 187.4 211.9 236.4 251.8 274.560 years and over . . . . . . . . . . . . . . . . . . . . . . . 252 187.3 2.53 124.3 135.4 142.8 158.2 182.0 211.8 227.6 248.5 266.8
Mexican American
20 years and over . . . . . . . . . . . . . . . . . . . . . . . . 1,027 176.3 1.48 124.5 136.3 142.0 150.7 172.2 195.6 208.3 219.2 241.320–39 years . . . . . . . . . . . . . . . . . . . . . . . . . . 399 172.9 2.16 122.1 131.4 139.7 146.3 167.6 191.3 207.0 216.9 236.740–59 years . . . . . . . . . . . . . . . . . . . . . . . . . . 310 184.0 1.98 128.9 144.8 151.8 159.6 178.7 200.8 215.7 230.4 252.760 years and over . . . . . . . . . . . . . . . . . . . . . . . 318 176.0 2.45 133.5 139.5 143.5 151.4 172.4 193.5 206.0 218.1 239.8
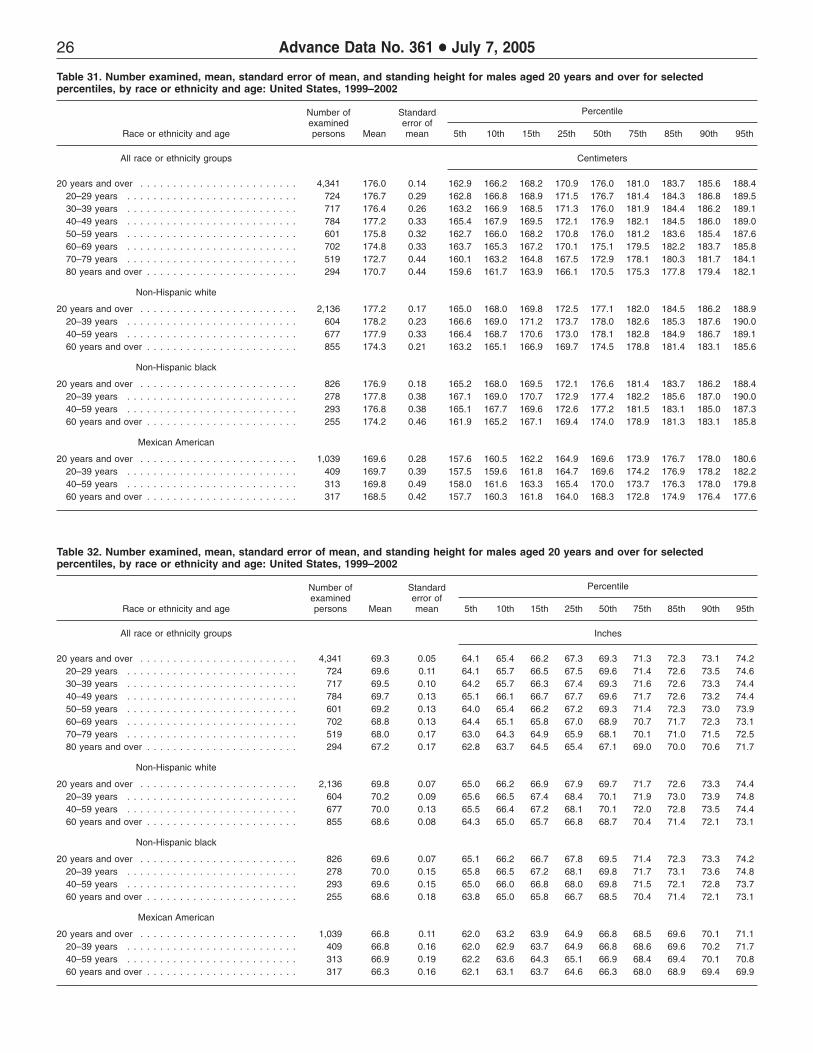
26 Advance Data No. 361 + July 7, 2005
Table 31. Number examined, mean, standard error of mean, and standing height for males aged 20 years and over for selected percentiles, by race or ethnicity and age: United States, 1999–2002
Number of Standard Percentile examined error of
Race or ethnicity and age persons Mean mean 5th 10th 15th 25th 50th 75th 85th 90th 95th
All race or ethnicity groups Centimeters
20 years and over . . . . . . . . . . . . . . . . . . . . . . . . 4,341 176.0 0.14 162.9 166.2 168.2 170.9 176.0 181.0 183.7 185.6 188.420–29 years . . . . . . . . . . . . . . . . . . . . . . . . . . 724 176.7 0.29 162.8 166.8 168.9 171.5 176.7 181.4 184.3 186.8 189.530–39 years . . . . . . . . . . . . . . . . . . . . . . . . . . 717 176.4 0.26 163.2 166.9 168.5 171.3 176.0 181.9 184.4 186.2 189.140–49 years . . . . . . . . . . . . . . . . . . . . . . . . . . 784 177.2 0.33 165.4 167.9 169.5 172.1 176.9 182.1 184.5 186.0 189.050–59 years . . . . . . . . . . . . . . . . . . . . . . . . . . 601 175.8 0.32 162.7 166.0 168.2 170.8 176.0 181.2 183.6 185.4 187.660–69 years . . . . . . . . . . . . . . . . . . . . . . . . . . 702 174.8 0.33 163.7 165.3 167.2 170.1 175.1 179.5 182.2 183.7 185.870–79 years . . . . . . . . . . . . . . . . . . . . . . . . . . 519 172.7 0.44 160.1 163.2 164.8 167.5 172.9 178.1 180.3 181.7 184.180 years and over . . . . . . . . . . . . . . . . . . . . . . . 294 170.7 0.44 159.6 161.7 163.9 166.1 170.5 175.3 177.8 179.4 182.1
Non-Hispanic white
20 years and over . . . . . . . . . . . . . . . . . . . . . . . . 2,136 177.2 0.17 165.0 168.0 169.8 172.5 177.1 182.0 184.5 186.2 188.920–39 years . . . . . . . . . . . . . . . . . . . . . . . . . . 604 178.2 0.23 166.6 169.0 171.2 173.7 178.0 182.6 185.3 187.6 190.040–59 years . . . . . . . . . . . . . . . . . . . . . . . . . . 677 177.9 0.33 166.4 168.7 170.6 173.0 178.1 182.8 184.9 186.7 189.160 years and over . . . . . . . . . . . . . . . . . . . . . . . 855 174.3 0.21 163.2 165.1 166.9 169.7 174.5 178.8 181.4 183.1 185.6
Non-Hispanic black
20 years and over . . . . . . . . . . . . . . . . . . . . . . . . 826 176.9 0.18 165.2 168.0 169.5 172.1 176.6 181.4 183.7 186.2 188.420–39 years . . . . . . . . . . . . . . . . . . . . . . . . . . 278 177.8 0.38 167.1 169.0 170.7 172.9 177.4 182.2 185.6 187.0 190.040–59 years . . . . . . . . . . . . . . . . . . . . . . . . . . 293 176.8 0.38 165.1 167.7 169.6 172.6 177.2 181.5 183.1 185.0 187.360 years and over . . . . . . . . . . . . . . . . . . . . . . . 255 174.2 0.46 161.9 165.2 167.1 169.4 174.0 178.9 181.3 183.1 185.8
Mexican American
20 years and over . . . . . . . . . . . . . . . . . . . . . . . . 1,039 169.6 0.28 157.6 160.5 162.2 164.9 169.6 173.9 176.7 178.0 180.620–39 years . . . . . . . . . . . . . . . . . . . . . . . . . . 409 169.7 0.39 157.5 159.6 161.8 164.7 169.6 174.2 176.9 178.2 182.240–59 years . . . . . . . . . . . . . . . . . . . . . . . . . . 313 169.8 0.49 158.0 161.6 163.3 165.4 170.0 173.7 176.3 178.0 179.860 years and over . . . . . . . . . . . . . . . . . . . . . . . 317 168.5 0.42 157.7 160.3 161.8 164.0 168.3 172.8 174.9 176.4 177.6
Table 32. Number examined, mean, standard error of mean, and standing height for males aged 20 years and over for selected percentiles, by race or ethnicity and age: United States, 1999–2002
Number of Standard Percentile examined error of
Race or ethnicity and age persons Mean mean 5th 10th 15th 25th 50th 75th 85th 90th 95th
All race or ethnicity groups Inches
20 years and over . . . . . . . . . . . . . . . . . . . . . . . . 4,341 69.3 0.05 64.1 65.4 66.2 67.3 69.3 71.3 72.3 73.1 74.2 20–29 years . . . . . . . . . . . . . . . . . . . . . . . . . . 724 69.6 0.11 64.1 65.7 66.5 67.5 69.6 71.4 72.6 73.5 74.6 30–39 years . . . . . . . . . . . . . . . . . . . . . . . . . . 717 69.5 0.10 64.2 65.7 66.3 67.4 69.3 71.6 72.6 73.3 74.4 40–49 years . . . . . . . . . . . . . . . . . . . . . . . . . . 784 69.7 0.13 65.1 66.1 66.7 67.7 69.6 71.7 72.6 73.2 74.4 50–59 years . . . . . . . . . . . . . . . . . . . . . . . . . . 601 69.2 0.13 64.0 65.4 66.2 67.2 69.3 71.4 72.3 73.0 73.9 60–69 years . . . . . . . . . . . . . . . . . . . . . . . . . . 702 68.8 0.13 64.4 65.1 65.8 67.0 68.9 70.7 71.7 72.3 73.1 70–79 years . . . . . . . . . . . . . . . . . . . . . . . . . . 519 68.0 0.17 63.0 64.3 64.9 65.9 68.1 70.1 71.0 71.5 72.5 80 years and over . . . . . . . . . . . . . . . . . . . . . . . 294 67.2 0.17 62.8 63.7 64.5 65.4 67.1 69.0 70.0 70.6 71.7
Non-Hispanic white
20 years and over . . . . . . . . . . . . . . . . . . . . . . . . 2,136 69.8 0.07 65.0 66.2 66.9 67.9 69.7 71.7 72.6 73.3 74.4 20–39 years . . . . . . . . . . . . . . . . . . . . . . . . . . 604 70.2 0.09 65.6 66.5 67.4 68.4 70.1 71.9 73.0 73.9 74.8 40–59 years . . . . . . . . . . . . . . . . . . . . . . . . . . 677 70.0 0.13 65.5 66.4 67.2 68.1 70.1 72.0 72.8 73.5 74.4 60 years and over . . . . . . . . . . . . . . . . . . . . . . . 855 68.6 0.08 64.3 65.0 65.7 66.8 68.7 70.4 71.4 72.1 73.1
Non-Hispanic black
20 years and over . . . . . . . . . . . . . . . . . . . . . . . . 826 69.6 0.07 65.1 66.2 66.7 67.8 69.5 71.4 72.3 73.3 74.2 20–39 years . . . . . . . . . . . . . . . . . . . . . . . . . . 278 70.0 0.15 65.8 66.5 67.2 68.1 69.8 71.7 73.1 73.6 74.8 40–59 years . . . . . . . . . . . . . . . . . . . . . . . . . . 293 69.6 0.15 65.0 66.0 66.8 68.0 69.8 71.5 72.1 72.8 73.7 60 years and over . . . . . . . . . . . . . . . . . . . . . . . 255 68.6 0.18 63.8 65.0 65.8 66.7 68.5 70.4 71.4 72.1 73.1
Mexican American
20 years and over . . . . . . . . . . . . . . . . . . . . . . . . 1,039 66.8 0.11 62.0 63.2 63.9 64.9 66.8 68.5 69.6 70.1 71.1 20–39 years . . . . . . . . . . . . . . . . . . . . . . . . . . 409 66.8 0.16 62.0 62.9 63.7 64.9 66.8 68.6 69.6 70.2 71.7 40–59 years . . . . . . . . . . . . . . . . . . . . . . . . . . 313 66.9 0.19 62.2 63.6 64.3 65.1 66.9 68.4 69.4 70.1 70.8 60 years and over . . . . . . . . . . . . . . . . . . . . . . . 317 66.3 0.16 62.1 63.1 63.7 64.6 66.3 68.0 68.9 69.4 69.9
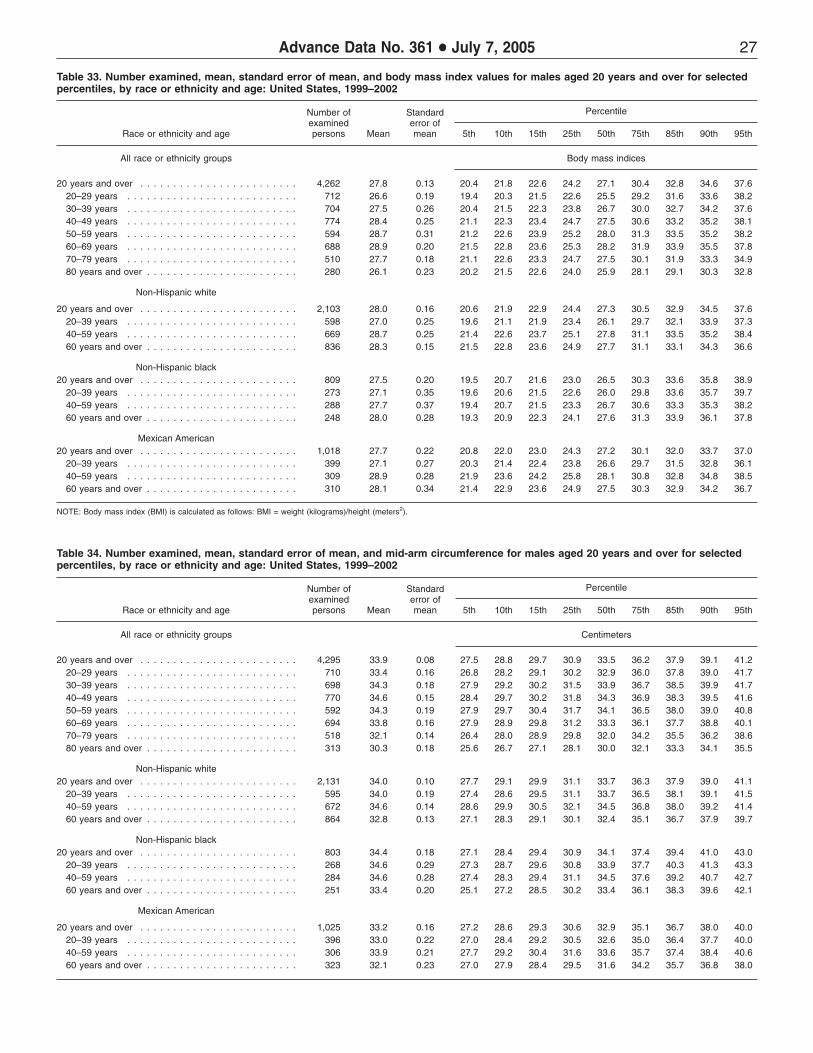
27 Advance Data No. 361 + July 7, 2005
Table 33. Number examined, mean, standard error of mean, and body mass index values for males aged 20 years and over for selected percentiles, by race or ethnicity and age: United States, 1999–2002
Number of Standard Percentile examined error of
Race or ethnicity and age persons Mean mean 5th 10th 15th 25th 50th 75th 85th 90th 95th
All race or ethnicity groups Body mass indices
20 years and over . . . . . . . . . . . . . . . . . . . . . . . . 4,262 27.8 0.13 20.4 21.8 22.6 24.2 27.1 30.4 32.8 34.6 37.620–29 years . . . . . . . . . . . . . . . . . . . . . . . . . . 712 26.6 0.19 19.4 20.3 21.5 22.6 25.5 29.2 31.6 33.6 38.2 30–39 years . . . . . . . . . . . . . . . . . . . . . . . . . . 704 27.5 0.26 20.4 21.5 22.3 23.8 26.7 30.0 32.7 34.2 37.6 40–49 years . . . . . . . . . . . . . . . . . . . . . . . . . . 774 28.4 0.25 21.1 22.3 23.4 24.7 27.5 30.6 33.2 35.2 38.1 50–59 years . . . . . . . . . . . . . . . . . . . . . . . . . . 594 28.7 0.31 21.2 22.6 23.9 25.2 28.0 31.3 33.5 35.2 38.2 60–69 years . . . . . . . . . . . . . . . . . . . . . . . . . . 688 28.9 0.20 21.5 22.8 23.6 25.3 28.2 31.9 33.9 35.5 37.8 70–79 years . . . . . . . . . . . . . . . . . . . . . . . . . . 510 27.7 0.18 21.1 22.6 23.3 24.7 27.5 30.1 31.9 33.3 34.9 80 years and over . . . . . . . . . . . . . . . . . . . . . . . 280 26.1 0.23 20.2 21.5 22.6 24.0 25.9 28.1 29.1 30.3 32.8
Non-Hispanic white
20 years and over . . . . . . . . . . . . . . . . . . . . . . . . 2,103 28.0 0.16 20.6 21.9 22.9 24.4 27.3 30.5 32.9 34.5 37.620–39 years . . . . . . . . . . . . . . . . . . . . . . . . . . 598 27.0 0.25 19.6 21.1 21.9 23.4 26.1 29.7 32.1 33.9 37.3 40–59 years . . . . . . . . . . . . . . . . . . . . . . . . . . 669 28.7 0.25 21.4 22.6 23.7 25.1 27.8 31.1 33.5 35.2 38.4 60 years and over . . . . . . . . . . . . . . . . . . . . . . . 836 28.3 0.15 21.5 22.8 23.6 24.9 27.7 31.1 33.1 34.3 36.6
Non-Hispanic black 20 years and over . . . . . . . . . . . . . . . . . . . . . . . . 809 27.5 0.20 19.5 20.7 21.6 23.0 26.5 30.3 33.6 35.8 38.9
20–39 years . . . . . . . . . . . . . . . . . . . . . . . . . . 273 27.1 0.35 19.6 20.6 21.5 22.6 26.0 29.8 33.6 35.7 39.7 40–59 years . . . . . . . . . . . . . . . . . . . . . . . . . . 288 27.7 0.37 19.4 20.7 21.5 23.3 26.7 30.6 33.3 35.3 38.2 60 years and over . . . . . . . . . . . . . . . . . . . . . . . 248 28.0 0.28 19.3 20.9 22.3 24.1 27.6 31.3 33.9 36.1 37.8
Mexican American 20 years and over . . . . . . . . . . . . . . . . . . . . . . . . 1,018 27.7 0.22 20.8 22.0 23.0 24.3 27.2 30.1 32.0 33.7 37.0
20–39 years . . . . . . . . . . . . . . . . . . . . . . . . . . 399 27.1 0.27 20.3 21.4 22.4 23.8 26.6 29.7 31.5 32.8 36.1 40–59 years . . . . . . . . . . . . . . . . . . . . . . . . . . 309 28.9 0.28 21.9 23.6 24.2 25.8 28.1 30.8 32.8 34.8 38.5 60 years and over . . . . . . . . . . . . . . . . . . . . . . . 310 28.1 0.34 21.4 22.9 23.6 24.9 27.5 30.3 32.9 34.2 36.7
NOTE: Body mass index (BMI) is calculated as follows: BMI = weight (kilograms)/height (meters2).
Table 34. Number examined, mean, standard error of mean, and mid-arm circumference for males aged 20 years and over for selected percentiles, by race or ethnicity and age: United States, 1999–2002
Number of Standard Percentile examined error of
Race or ethnicity and age persons Mean mean 5th 10th 15th 25th 50th 75th 85th 90th 95th
All race or ethnicity groups Centimeters
20 years and over . . . . . . . . . . . . . . . . . . . . . . . . 4,295 33.9 0.08 27.5 28.8 29.7 30.9 33.5 36.2 37.9 39.1 41.220–29 years . . . . . . . . . . . . . . . . . . . . . . . . . . 710 33.4 0.16 26.8 28.2 29.1 30.2 32.9 36.0 37.8 39.0 41.7 30–39 years . . . . . . . . . . . . . . . . . . . . . . . . . . 698 34.3 0.18 27.9 29.2 30.2 31.5 33.9 36.7 38.5 39.9 41.7 40–49 years . . . . . . . . . . . . . . . . . . . . . . . . . . 770 34.6 0.15 28.4 29.7 30.2 31.8 34.3 36.9 38.3 39.5 41.6 50–59 years . . . . . . . . . . . . . . . . . . . . . . . . . . 592 34.3 0.19 27.9 29.7 30.4 31.7 34.1 36.5 38.0 39.0 40.8 60–69 years . . . . . . . . . . . . . . . . . . . . . . . . . . 694 33.8 0.16 27.9 28.9 29.8 31.2 33.3 36.1 37.7 38.8 40.1 70–79 years . . . . . . . . . . . . . . . . . . . . . . . . . . 518 32.1 0.14 26.4 28.0 28.9 29.8 32.0 34.2 35.5 36.2 38.6 80 years and over . . . . . . . . . . . . . . . . . . . . . . . 313 30.3 0.18 25.6 26.7 27.1 28.1 30.0 32.1 33.3 34.1 35.5
Non-Hispanic white 20 years and over . . . . . . . . . . . . . . . . . . . . . . . . 2,131 34.0 0.10 27.7 29.1 29.9 31.1 33.7 36.3 37.9 39.0 41.1
20–39 years . . . . . . . . . . . . . . . . . . . . . . . . . . 595 34.0 0.19 27.4 28.6 29.5 31.1 33.7 36.5 38.1 39.1 41.5 40–59 years . . . . . . . . . . . . . . . . . . . . . . . . . . 672 34.6 0.14 28.6 29.9 30.5 32.1 34.5 36.8 38.0 39.2 41.4 60 years and over . . . . . . . . . . . . . . . . . . . . . . . 864 32.8 0.13 27.1 28.3 29.1 30.1 32.4 35.1 36.7 37.9 39.7
Non-Hispanic black 20 years and over . . . . . . . . . . . . . . . . . . . . . . . . 803 34.4 0.18 27.1 28.4 29.4 30.9 34.1 37.4 39.4 41.0 43.0
20–39 years . . . . . . . . . . . . . . . . . . . . . . . . . . 268 34.6 0.29 27.3 28.7 29.6 30.8 33.9 37.7 40.3 41.3 43.3 40–59 years . . . . . . . . . . . . . . . . . . . . . . . . . . 284 34.6 0.28 27.4 28.3 29.4 31.1 34.5 37.6 39.2 40.7 42.7 60 years and over . . . . . . . . . . . . . . . . . . . . . . . 251 33.4 0.20 25.1 27.2 28.5 30.2 33.4 36.1 38.3 39.6 42.1
Mexican American
20 years and over . . . . . . . . . . . . . . . . . . . . . . . . 1,025 33.2 0.16 27.2 28.6 29.3 30.6 32.9 35.1 36.7 38.0 40.020–39 years . . . . . . . . . . . . . . . . . . . . . . . . . . 396 33.0 0.22 27.0 28.4 29.2 30.5 32.6 35.0 36.4 37.7 40.0 40–59 years . . . . . . . . . . . . . . . . . . . . . . . . . . 306 33.9 0.21 27.7 29.2 30.4 31.6 33.6 35.7 37.4 38.4 40.6 60 years and over . . . . . . . . . . . . . . . . . . . . . . . 323 32.1 0.23 27.0 27.9 28.4 29.5 31.6 34.2 35.7 36.8 38.0
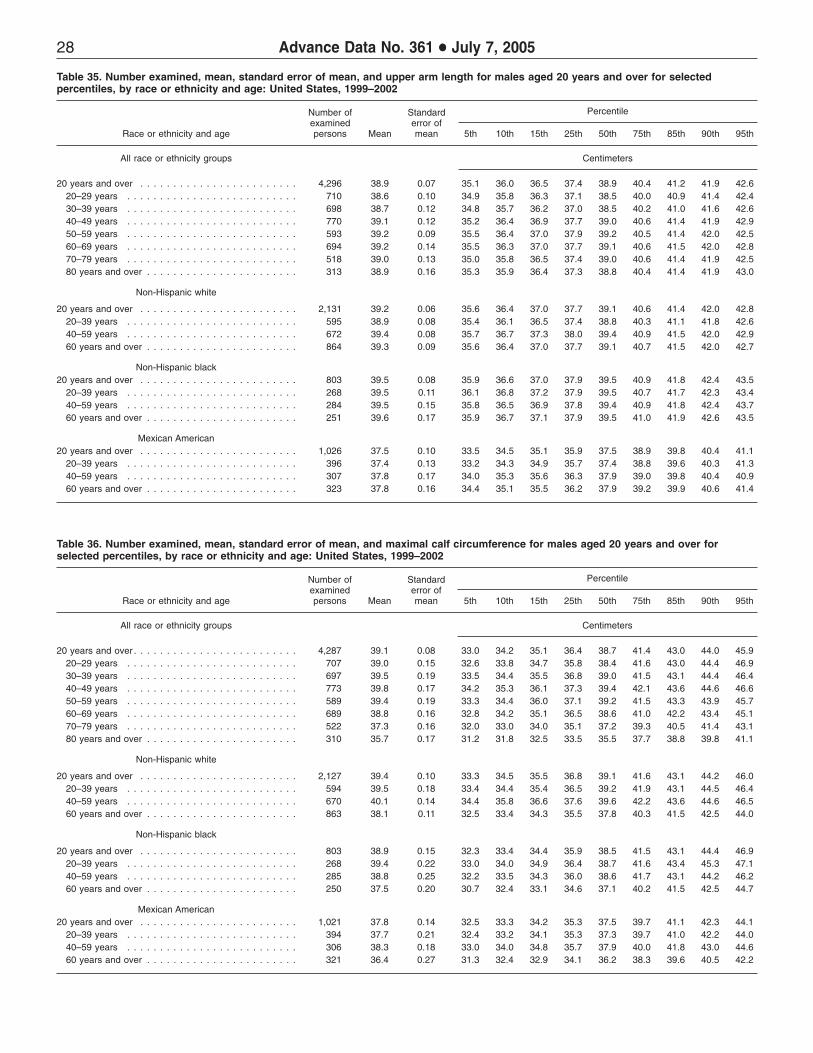
28 Advance Data No. 361 + July 7, 2005
Table 35. Number examined, mean, standard error of mean, and upper arm length for males aged 20 years and over for selected percentiles, by race or ethnicity and age: United States, 1999–2002
Number of Standard Percentile examined error of
Race or ethnicity and age persons Mean mean 5th 10th 15th 25th 50th 75th 85th 90th 95th
All race or ethnicity groups Centimeters
20 years and over . . . . . . . . . . . . . . . . . . . . . . . . 4,296 38.9 0.07 35.1 36.0 36.5 37.4 38.9 40.4 41.2 41.9 42.6 20–29 years . . . . . . . . . . . . . . . . . . . . . . . . . . 710 38.6 0.10 34.9 35.8 36.3 37.1 38.5 40.0 40.9 41.4 42.4 30–39 years . . . . . . . . . . . . . . . . . . . . . . . . . . 698 38.7 0.12 34.8 35.7 36.2 37.0 38.5 40.2 41.0 41.6 42.6 40–49 years . . . . . . . . . . . . . . . . . . . . . . . . . . 770 39.1 0.12 35.2 36.4 36.9 37.7 39.0 40.6 41.4 41.9 42.9 50–59 years . . . . . . . . . . . . . . . . . . . . . . . . . . 593 39.2 0.09 35.5 36.4 37.0 37.9 39.2 40.5 41.4 42.0 42.5 60–69 years . . . . . . . . . . . . . . . . . . . . . . . . . . 694 39.2 0.14 35.5 36.3 37.0 37.7 39.1 40.6 41.5 42.0 42.8 70–79 years . . . . . . . . . . . . . . . . . . . . . . . . . . 518 39.0 0.13 35.0 35.8 36.5 37.4 39.0 40.6 41.4 41.9 42.5 80 years and over . . . . . . . . . . . . . . . . . . . . . . . 313 38.9 0.16 35.3 35.9 36.4 37.3 38.8 40.4 41.4 41.9 43.0
Non-Hispanic white
20 years and over . . . . . . . . . . . . . . . . . . . . . . . . 2,131 39.2 0.06 35.6 36.4 37.0 37.7 39.1 40.6 41.4 42.0 42.8 20–39 years . . . . . . . . . . . . . . . . . . . . . . . . . . 595 38.9 0.08 35.4 36.1 36.5 37.4 38.8 40.3 41.1 41.8 42.6 40–59 years . . . . . . . . . . . . . . . . . . . . . . . . . . 672 39.4 0.08 35.7 36.7 37.3 38.0 39.4 40.9 41.5 42.0 42.9 60 years and over . . . . . . . . . . . . . . . . . . . . . . . 864 39.3 0.09 35.6 36.4 37.0 37.7 39.1 40.7 41.5 42.0 42.7
Non-Hispanic black 20 years and over . . . . . . . . . . . . . . . . . . . . . . . . 803 39.5 0.08 35.9 36.6 37.0 37.9 39.5 40.9 41.8 42.4 43.5
20–39 years . . . . . . . . . . . . . . . . . . . . . . . . . . 268 39.5 0.11 36.1 36.8 37.2 37.9 39.5 40.7 41.7 42.3 43.4 40–59 years . . . . . . . . . . . . . . . . . . . . . . . . . . 284 39.5 0.15 35.8 36.5 36.9 37.8 39.4 40.9 41.8 42.4 43.7 60 years and over . . . . . . . . . . . . . . . . . . . . . . . 251 39.6 0.17 35.9 36.7 37.1 37.9 39.5 41.0 41.9 42.6 43.5
Mexican American 20 years and over . . . . . . . . . . . . . . . . . . . . . . . . 1,026 37.5 0.10 33.5 34.5 35.1 35.9 37.5 38.9 39.8 40.4 41.1
20–39 years . . . . . . . . . . . . . . . . . . . . . . . . . . 396 37.4 0.13 33.2 34.3 34.9 35.7 37.4 38.8 39.6 40.3 41.3 40–59 years . . . . . . . . . . . . . . . . . . . . . . . . . . 307 37.8 0.17 34.0 35.3 35.6 36.3 37.9 39.0 39.8 40.4 40.9 60 years and over . . . . . . . . . . . . . . . . . . . . . . . 323 37.8 0.16 34.4 35.1 35.5 36.2 37.9 39.2 39.9 40.6 41.4
Table 36. Number examined, mean, standard error of mean, and maximal calf circumference for males aged 20 years and over for selected percentiles, by race or ethnicity and age: United States, 1999–2002
Race or ethnicity and age
Number of examined persons Mean
Standard error of mean 5th 10th 15th
Percentile
25th 50th 75th 85th 90th 95th
All race or ethnicity groups Centimeters
20 years and over . . . . . . . . . . . . . . . . . . . . . . . . . 20–29 years . . . . . . . . . . . . . . . . . . . . . . . . . . 30–39 years . . . . . . . . . . . . . . . . . . . . . . . . . . 40–49 years . . . . . . . . . . . . . . . . . . . . . . . . . . 50–59 years . . . . . . . . . . . . . . . . . . . . . . . . . . 60–69 years . . . . . . . . . . . . . . . . . . . . . . . . . . 70–79 years . . . . . . . . . . . . . . . . . . . . . . . . . . 80 years and over . . . . . . . . . . . . . . . . . . . . . . .
4,287 707 697 773 589 689 522 310
39.1 39.0 39.5 39.8 39.4 38.8 37.3 35.7
0.08 0.15 0.19 0.17 0.19 0.16 0.16 0.17
33.0 32.6 33.5 34.2 33.3 32.8 32.0 31.2
34.2 33.8 34.4 35.3 34.4 34.2 33.0 31.8
35.1 34.7 35.5 36.1 36.0 35.1 34.0 32.5
36.4 35.8 36.8 37.3 37.1 36.5 35.1 33.5
38.7 38.4 39.0 39.4 39.2 38.6 37.2 35.5
41.4 41.6 41.5 42.1 41.5 41.0 39.3 37.7
43.0 43.0 43.1 43.6 43.3 42.2 40.5 38.8
44.0 44.4 44.4 44.6 43.9 43.4 41.4 39.8
45.9 46.9 46.4 46.6 45.7 45.1 43.1 41.1
Non-Hispanic white
20 years and over . . . . . . . . . . . . . . . . . . . . . . . . 20–39 years . . . . . . . . . . . . . . . . . . . . . . . . . . 40–59 years . . . . . . . . . . . . . . . . . . . . . . . . . . 60 years and over . . . . . . . . . . . . . . . . . . . . . . .
2,127 594 670 863
39.4 39.5 40.1 38.1
0.10 0.18 0.14 0.11
33.3 33.4 34.4 32.5
34.5 34.4 35.8 33.4
35.5 35.4 36.6 34.3
36.8 36.5 37.6 35.5
39.1 39.2 39.6 37.8
41.6 41.9 42.2 40.3
43.1 43.1 43.6 41.5
44.2 44.5 44.6 42.5
46.0 46.4 46.5 44.0
Non-Hispanic black
20 years and over . . . . . . . . . . . . . . . . . . . . . . . . 20–39 years . . . . . . . . . . . . . . . . . . . . . . . . . . 40–59 years . . . . . . . . . . . . . . . . . . . . . . . . . . 60 years and over . . . . . . . . . . . . . . . . . . . . . . .
803 268 285 250
38.9 39.4 38.8 37.5
0.15 0.22 0.25 0.20
32.3 33.0 32.2 30.7
33.4 34.0 33.5 32.4
34.4 34.9 34.3 33.1
35.9 36.4 36.0 34.6
38.5 38.7 38.6 37.1
41.5 41.6 41.7 40.2
43.1 43.4 43.1 41.5
44.4 45.3 44.2 42.5
46.9 47.1 46.2 44.7
Mexican American 20 years and over . . . . . . . . . . . . . . . . . . . . . . . .
20–39 years . . . . . . . . . . . . . . . . . . . . . . . . . . 40–59 years . . . . . . . . . . . . . . . . . . . . . . . . . . 60 years and over . . . . . . . . . . . . . . . . . . . . . . .
1,021 394 306 321
37.8 37.7 38.3 36.4
0.14 0.21 0.18 0.27
32.5 32.4 33.0 31.3
33.3 33.2 34.0 32.4
34.2 34.1 34.8 32.9
35.3 35.3 35.7 34.1
37.5 37.3 37.9 36.2
39.7 39.7 40.0 38.3
41.1 41.0 41.8 39.6
42.3 42.2 43.0 40.5
44.1 44.0 44.6 42.2
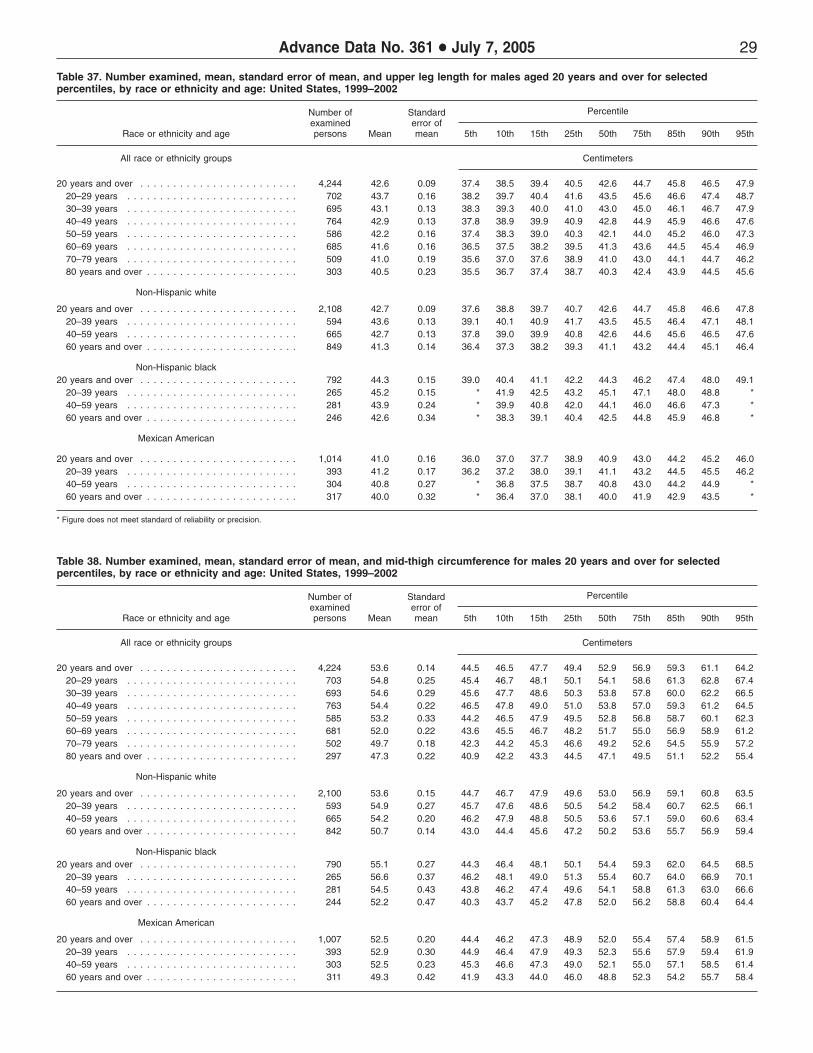
Advance Data No. 361 + July 7, 2005 29
Table 37. Number examined, mean, standard error of mean, and upper leg length for males aged 20 years and over for selected percentiles, by race or ethnicity and age: United States, 1999–2002
Number of Standard Percentile examined error of
Race or ethnicity and age persons Mean mean 5th 10th 15th 25th 50th 75th 85th 90th 95th
All race or ethnicity groups Centimeters
20 years and over . . . . . . . . . . . . . . . . . . . . . . . . 4,244 42.6 0.09 37.4 38.5 39.4 40.5 42.6 44.7 45.8 46.5 47.9 20–29 years . . . . . . . . . . . . . . . . . . . . . . . . . . 702 43.7 0.16 38.2 39.7 40.4 41.6 43.5 45.6 46.6 47.4 48.7 30–39 years . . . . . . . . . . . . . . . . . . . . . . . . . . 695 43.1 0.13 38.3 39.3 40.0 41.0 43.0 45.0 46.1 46.7 47.9 40–49 years . . . . . . . . . . . . . . . . . . . . . . . . . . 764 42.9 0.13 37.8 38.9 39.9 40.9 42.8 44.9 45.9 46.6 47.6 50–59 years . . . . . . . . . . . . . . . . . . . . . . . . . . 586 42.2 0.16 37.4 38.3 39.0 40.3 42.1 44.0 45.2 46.0 47.3 60–69 years . . . . . . . . . . . . . . . . . . . . . . . . . . 685 41.6 0.16 36.5 37.5 38.2 39.5 41.3 43.6 44.5 45.4 46.9 70–79 years . . . . . . . . . . . . . . . . . . . . . . . . . . 509 41.0 0.19 35.6 37.0 37.6 38.9 41.0 43.0 44.1 44.7 46.2 80 years and over . . . . . . . . . . . . . . . . . . . . . . . 303 40.5 0.23 35.5 36.7 37.4 38.7 40.3 42.4 43.9 44.5 45.6
Non-Hispanic white
20 years and over . . . . . . . . . . . . . . . . . . . . . . . . 2,108 42.7 0.09 37.6 38.8 39.7 40.7 42.6 44.7 45.8 46.6 47.8 20–39 years . . . . . . . . . . . . . . . . . . . . . . . . . . 594 43.6 0.13 39.1 40.1 40.9 41.7 43.5 45.5 46.4 47.1 48.1 40–59 years . . . . . . . . . . . . . . . . . . . . . . . . . . 665 42.7 0.13 37.8 39.0 39.9 40.8 42.6 44.6 45.6 46.5 47.6 60 years and over . . . . . . . . . . . . . . . . . . . . . . . 849 41.3 0.14 36.4 37.3 38.2 39.3 41.1 43.2 44.4 45.1 46.4
Non-Hispanic black 20 years and over . . . . . . . . . . . . . . . . . . . . . . . . 792 44.3 0.15 39.0 40.4 41.1 42.2 44.3 46.2 47.4 48.0 49.1
20–39 years . . . . . . . . . . . . . . . . . . . . . . . . . . 265 45.2 0.15 * 41.9 42.5 43.2 45.1 47.1 48.0 48.8 * 40–59 years . . . . . . . . . . . . . . . . . . . . . . . . . . 281 43.9 0.24 * 39.9 40.8 42.0 44.1 46.0 46.6 47.3 * 60 years and over . . . . . . . . . . . . . . . . . . . . . . . 246 42.6 0.34 * 38.3 39.1 40.4 42.5 44.8 45.9 46.8 *
Mexican American
20 years and over . . . . . . . . . . . . . . . . . . . . . . . . 1,014 41.0 0.16 36.0 37.0 37.7 38.9 40.9 43.0 44.2 45.2 46.0 20–39 years . . . . . . . . . . . . . . . . . . . . . . . . . . 393 41.2 0.17 36.2 37.2 38.0 39.1 41.1 43.2 44.5 45.5 46.2 40–59 years . . . . . . . . . . . . . . . . . . . . . . . . . . 304 40.8 0.27 * 36.8 37.5 38.7 40.8 43.0 44.2 44.9 * 60 years and over . . . . . . . . . . . . . . . . . . . . . . . 317 40.0 0.32 * 36.4 37.0 38.1 40.0 41.9 42.9 43.5 *
* Figure does not meet standard of reliability or precision.
Table 38. Number examined, mean, standard error of mean, and mid-thigh circumference for males 20 years and over for selected percentiles, by race or ethnicity and age: United States, 1999–2002
Number of Standard Percentile examined error of
Race or ethnicity and age persons Mean mean 5th 10th 15th 25th 50th 75th 85th 90th 95th
All race or ethnicity groups Centimeters
20 years and over . . . . . . . . . . . . . . . . . . . . . . . . 4,224 53.6 0.14 44.5 46.5 47.7 49.4 52.9 56.9 59.3 61.1 64.2 20–29 years . . . . . . . . . . . . . . . . . . . . . . . . . . 703 54.8 0.25 45.4 46.7 48.1 50.1 54.1 58.6 61.3 62.8 67.4 30–39 years . . . . . . . . . . . . . . . . . . . . . . . . . . 693 54.6 0.29 45.6 47.7 48.6 50.3 53.8 57.8 60.0 62.2 66.5 40–49 years . . . . . . . . . . . . . . . . . . . . . . . . . . 763 54.4 0.22 46.5 47.8 49.0 51.0 53.8 57.0 59.3 61.2 64.5 50–59 years . . . . . . . . . . . . . . . . . . . . . . . . . . 585 53.2 0.33 44.2 46.5 47.9 49.5 52.8 56.8 58.7 60.1 62.3 60–69 years . . . . . . . . . . . . . . . . . . . . . . . . . . 681 52.0 0.22 43.6 45.5 46.7 48.2 51.7 55.0 56.9 58.9 61.2 70–79 years . . . . . . . . . . . . . . . . . . . . . . . . . . 502 49.7 0.18 42.3 44.2 45.3 46.6 49.2 52.6 54.5 55.9 57.2 80 years and over . . . . . . . . . . . . . . . . . . . . . . . 297 47.3 0.22 40.9 42.2 43.3 44.5 47.1 49.5 51.1 52.2 55.4
Non-Hispanic white
20 years and over . . . . . . . . . . . . . . . . . . . . . . . . 2,100 53.6 0.15 44.7 46.7 47.9 49.6 53.0 56.9 59.1 60.8 63.5 20–39 years . . . . . . . . . . . . . . . . . . . . . . . . . . 593 54.9 0.27 45.7 47.6 48.6 50.5 54.2 58.4 60.7 62.5 66.1 40–59 years . . . . . . . . . . . . . . . . . . . . . . . . . . 665 54.2 0.20 46.2 47.9 48.8 50.5 53.6 57.1 59.0 60.6 63.4 60 years and over . . . . . . . . . . . . . . . . . . . . . . . 842 50.7 0.14 43.0 44.4 45.6 47.2 50.2 53.6 55.7 56.9 59.4
Non-Hispanic black 20 years and over . . . . . . . . . . . . . . . . . . . . . . . . 790 55.1 0.27 44.3 46.4 48.1 50.1 54.4 59.3 62.0 64.5 68.5
20–39 years . . . . . . . . . . . . . . . . . . . . . . . . . . 265 56.6 0.37 46.2 48.1 49.0 51.3 55.4 60.7 64.0 66.9 70.1 40–59 years . . . . . . . . . . . . . . . . . . . . . . . . . . 281 54.5 0.43 43.8 46.2 47.4 49.6 54.1 58.8 61.3 63.0 66.6 60 years and over . . . . . . . . . . . . . . . . . . . . . . . 244 52.2 0.47 40.3 43.7 45.2 47.8 52.0 56.2 58.8 60.4 64.4
Mexican American
20 years and over . . . . . . . . . . . . . . . . . . . . . . . . 1,007 52.5 0.20 44.4 46.2 47.3 48.9 52.0 55.4 57.4 58.9 61.5 20–39 years . . . . . . . . . . . . . . . . . . . . . . . . . . 393 52.9 0.30 44.9 46.4 47.9 49.3 52.3 55.6 57.9 59.4 61.9 40–59 years . . . . . . . . . . . . . . . . . . . . . . . . . . 303 52.5 0.23 45.3 46.6 47.3 49.0 52.1 55.0 57.1 58.5 61.4 60 years and over . . . . . . . . . . . . . . . . . . . . . . . 311 49.3 0.42 41.9 43.3 44.0 46.0 48.8 52.3 54.2 55.7 58.4
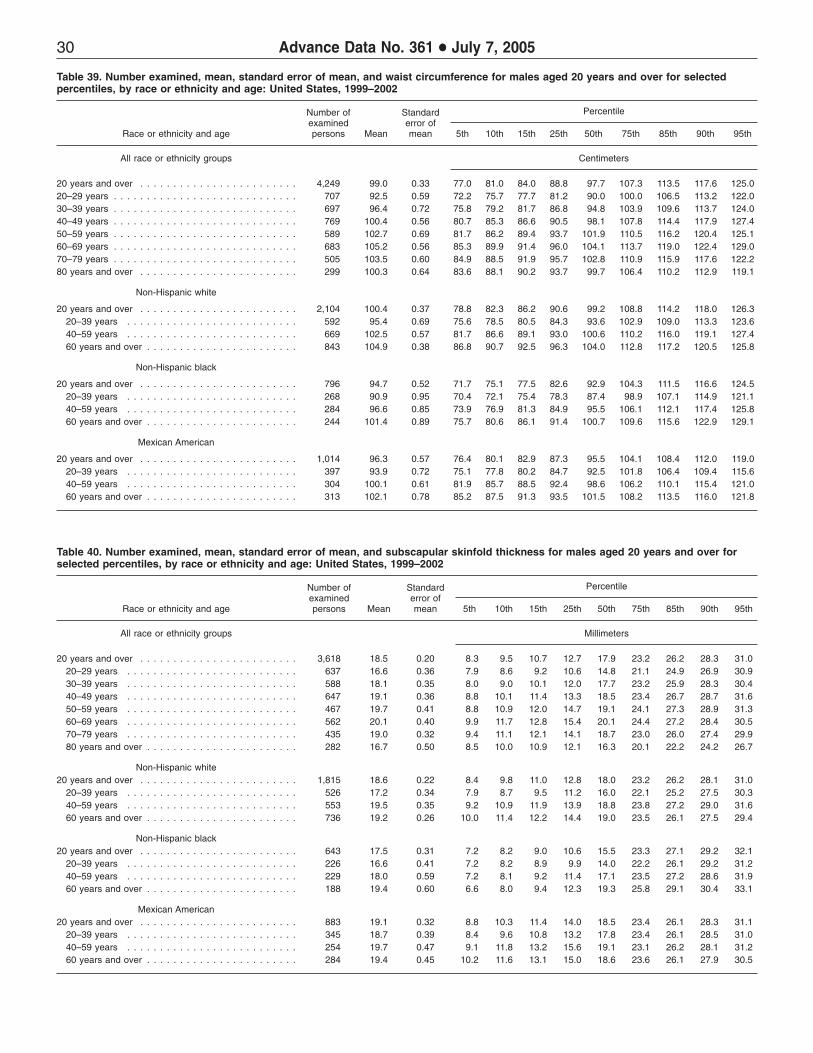
30 Advance Data No. 361 + July 7, 2005
Table 39. Number examined, mean, standard error of mean, and waist circumference for males aged 20 years and over for selected percentiles, by race or ethnicity and age: United States, 1999–2002
Number of Standard Percentile examined error of
Race or ethnicity and age persons Mean mean 5th 10th 15th 25th 50th 75th 85th 90th 95th
All race or ethnicity groups Centimeters
20 years and over . . . . . . . . . . . . . . . . . . . . . . . . 4,249 99.0 0.33 77.0 81.0 84.0 88.8 97.7 107.3 113.5 117.6 125.020–29 years . . . . . . . . . . . . . . . . . . . . . . . . . . . . 707 92.5 0.59 72.2 75.7 77.7 81.2 90.0 100.0 106.5 113.2 122.030–39 years . . . . . . . . . . . . . . . . . . . . . . . . . . . . 697 96.4 0.72 75.8 79.2 81.7 86.8 94.8 103.9 109.6 113.7 124.040–49 years . . . . . . . . . . . . . . . . . . . . . . . . . . . . 769 100.4 0.56 80.7 85.3 86.6 90.5 98.1 107.8 114.4 117.9 127.450–59 years . . . . . . . . . . . . . . . . . . . . . . . . . . . . 589 102.7 0.69 81.7 86.2 89.4 93.7 101.9 110.5 116.2 120.4 125.160–69 years . . . . . . . . . . . . . . . . . . . . . . . . . . . . 683 105.2 0.56 85.3 89.9 91.4 96.0 104.1 113.7 119.0 122.4 129.070–79 years . . . . . . . . . . . . . . . . . . . . . . . . . . . . 505 103.5 0.60 84.9 88.5 91.9 95.7 102.8 110.9 115.9 117.6 122.280 years and over . . . . . . . . . . . . . . . . . . . . . . . . 299 100.3 0.64 83.6 88.1 90.2 93.7 99.7 106.4 110.2 112.9 119.1
Non-Hispanic white
20 years and over . . . . . . . . . . . . . . . . . . . . . . . . 2,104 100.4 0.37 78.8 82.3 86.2 90.6 99.2 108.8 114.2 118.0 126.320–39 years . . . . . . . . . . . . . . . . . . . . . . . . . . 592 95.4 0.69 75.6 78.5 80.5 84.3 93.6 102.9 109.0 113.3 123.640–59 years . . . . . . . . . . . . . . . . . . . . . . . . . . 669 102.5 0.57 81.7 86.6 89.1 93.0 100.6 110.2 116.0 119.1 127.460 years and over . . . . . . . . . . . . . . . . . . . . . . . 843 104.9 0.38 86.8 90.7 92.5 96.3 104.0 112.8 117.2 120.5 125.8
Non-Hispanic black
20 years and over . . . . . . . . . . . . . . . . . . . . . . . . 796 94.7 0.52 71.7 75.1 77.5 82.6 92.9 104.3 111.5 116.6 124.520–39 years . . . . . . . . . . . . . . . . . . . . . . . . . . 268 90.9 0.95 70.4 72.1 75.4 78.3 87.4 98.9 107.1 114.9 121.140–59 years . . . . . . . . . . . . . . . . . . . . . . . . . . 284 96.6 0.85 73.9 76.9 81.3 84.9 95.5 106.1 112.1 117.4 125.860 years and over . . . . . . . . . . . . . . . . . . . . . . . 244 101.4 0.89 75.7 80.6 86.1 91.4 100.7 109.6 115.6 122.9 129.1
Mexican American
20 years and over . . . . . . . . . . . . . . . . . . . . . . . . 1,014 96.3 0.57 76.4 80.1 82.9 87.3 95.5 104.1 108.4 112.0 119.020–39 years . . . . . . . . . . . . . . . . . . . . . . . . . . 397 93.9 0.72 75.1 77.8 80.2 84.7 92.5 101.8 106.4 109.4 115.640–59 years . . . . . . . . . . . . . . . . . . . . . . . . . . 304 100.1 0.61 81.9 85.7 88.5 92.4 98.6 106.2 110.1 115.4 121.060 years and over . . . . . . . . . . . . . . . . . . . . . . . 313 102.1 0.78 85.2 87.5 91.3 93.5 101.5 108.2 113.5 116.0 121.8
Table 40. Number examined, mean, standard error of mean, and subscapular skinfold thickness for males aged 20 years and over for selected percentiles, by race or ethnicity and age: United States, 1999–2002
Number of Standard Percentile examined error of
Race or ethnicity and age persons Mean mean 5th 10th 15th 25th 50th 75th 85th 90th 95th
All race or ethnicity groups Millimeters
20 years and over . . . . . . . . . . . . . . . . . . . . . . . . 3,618 18.5 0.20 8.3 9.5 10.7 12.7 17.9 23.2 26.2 28.3 31.0 20–29 years . . . . . . . . . . . . . . . . . . . . . . . . . . 637 16.6 0.36 7.9 8.6 9.2 10.6 14.8 21.1 24.9 26.9 30.9 30–39 years . . . . . . . . . . . . . . . . . . . . . . . . . . 588 18.1 0.35 8.0 9.0 10.1 12.0 17.7 23.2 25.9 28.3 30.4 40–49 years . . . . . . . . . . . . . . . . . . . . . . . . . . 647 19.1 0.36 8.8 10.1 11.4 13.3 18.5 23.4 26.7 28.7 31.6 50–59 years . . . . . . . . . . . . . . . . . . . . . . . . . . 467 19.7 0.41 8.8 10.9 12.0 14.7 19.1 24.1 27.3 28.9 31.3 60–69 years . . . . . . . . . . . . . . . . . . . . . . . . . . 562 20.1 0.40 9.9 11.7 12.8 15.4 20.1 24.4 27.2 28.4 30.5 70–79 years . . . . . . . . . . . . . . . . . . . . . . . . . . 435 19.0 0.32 9.4 11.1 12.1 14.1 18.7 23.0 26.0 27.4 29.9 80 years and over . . . . . . . . . . . . . . . . . . . . . . . 282 16.7 0.50 8.5 10.0 10.9 12.1 16.3 20.1 22.2 24.2 26.7
Non-Hispanic white 20 years and over . . . . . . . . . . . . . . . . . . . . . . . . 1,815 18.6 0.22 8.4 9.8 11.0 12.8 18.0 23.2 26.2 28.1 31.0
20–39 years . . . . . . . . . . . . . . . . . . . . . . . . . . 526 17.2 0.34 7.9 8.7 9.5 11.2 16.0 22.1 25.2 27.5 30.3 40–59 years . . . . . . . . . . . . . . . . . . . . . . . . . . 553 19.5 0.35 9.2 10.9 11.9 13.9 18.8 23.8 27.2 29.0 31.6 60 years and over . . . . . . . . . . . . . . . . . . . . . . . 736 19.2 0.26 10.0 11.4 12.2 14.4 19.0 23.5 26.1 27.5 29.4
Non-Hispanic black 20 years and over . . . . . . . . . . . . . . . . . . . . . . . . 643 17.5 0.31 7.2 8.2 9.0 10.6 15.5 23.3 27.1 29.2 32.1
20–39 years . . . . . . . . . . . . . . . . . . . . . . . . . . 226 16.6 0.41 7.2 8.2 8.9 9.9 14.0 22.2 26.1 29.2 31.2 40–59 years . . . . . . . . . . . . . . . . . . . . . . . . . . 229 18.0 0.59 7.2 8.1 9.2 11.4 17.1 23.5 27.2 28.6 31.9 60 years and over . . . . . . . . . . . . . . . . . . . . . . . 188 19.4 0.60 6.6 8.0 9.4 12.3 19.3 25.8 29.1 30.4 33.1
Mexican American 20 years and over . . . . . . . . . . . . . . . . . . . . . . . . 883 19.1 0.32 8.8 10.3 11.4 14.0 18.5 23.4 26.1 28.3 31.1
20–39 years . . . . . . . . . . . . . . . . . . . . . . . . . . 345 18.7 0.39 8.4 9.6 10.8 13.2 17.8 23.4 26.1 28.5 31.0 40–59 years . . . . . . . . . . . . . . . . . . . . . . . . . . 254 19.7 0.47 9.1 11.8 13.2 15.6 19.1 23.1 26.2 28.1 31.2 60 years and over . . . . . . . . . . . . . . . . . . . . . . . 284 19.4 0.45 10.2 11.6 13.1 15.0 18.6 23.6 26.1 27.9 30.5
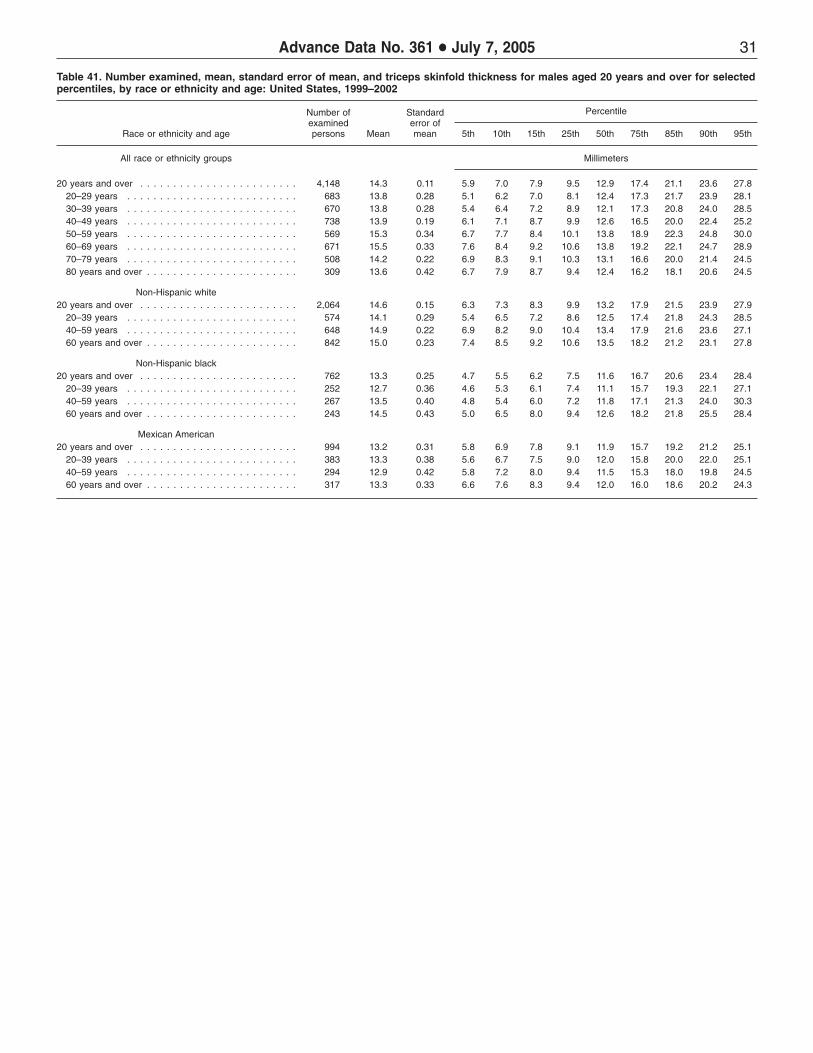
31 Advance Data No. 361 + July 7, 2005
Table 41. Number examined, mean, standard error of mean, and triceps skinfold thickness for males aged 20 years and over for selected percentiles, by race or ethnicity and age: United States, 1999–2002
Number of Standard Percentile examined error of
Race or ethnicity and age persons Mean mean 5th 10th 15th 25th 50th 75th 85th 90th 95th
All race or ethnicity groups Millimeters
20 years and over . . . . . . . . . . . . . . . . . . . . . . . . 4,148 14.3 0.11 5.9 7.0 7.9 9.5 12.9 17.4 21.1 23.6 27.820–29 years . . . . . . . . . . . . . . . . . . . . . . . . . . 683 13.8 0.28 5.1 6.2 7.0 8.1 12.4 17.3 21.7 23.9 28.1 30–39 years . . . . . . . . . . . . . . . . . . . . . . . . . . 670 13.8 0.28 5.4 6.4 7.2 8.9 12.1 17.3 20.8 24.0 28.5 40–49 years . . . . . . . . . . . . . . . . . . . . . . . . . . 738 13.9 0.19 6.1 7.1 8.7 9.9 12.6 16.5 20.0 22.4 25.2 50–59 years . . . . . . . . . . . . . . . . . . . . . . . . . . 569 15.3 0.34 6.7 7.7 8.4 10.1 13.8 18.9 22.3 24.8 30.0 60–69 years . . . . . . . . . . . . . . . . . . . . . . . . . . 671 15.5 0.33 7.6 8.4 9.2 10.6 13.8 19.2 22.1 24.7 28.9 70–79 years . . . . . . . . . . . . . . . . . . . . . . . . . . 508 14.2 0.22 6.9 8.3 9.1 10.3 13.1 16.6 20.0 21.4 24.5 80 years and over . . . . . . . . . . . . . . . . . . . . . . . 309 13.6 0.42 6.7 7.9 8.7 9.4 12.4 16.2 18.1 20.6 24.5
Non-Hispanic white 20 years and over . . . . . . . . . . . . . . . . . . . . . . . . 2,064 14.6 0.15 6.3 7.3 8.3 9.9 13.2 17.9 21.5 23.9 27.9
20–39 years . . . . . . . . . . . . . . . . . . . . . . . . . . 574 14.1 0.29 5.4 6.5 7.2 8.6 12.5 17.4 21.8 24.3 28.5 40–59 years . . . . . . . . . . . . . . . . . . . . . . . . . . 648 14.9 0.22 6.9 8.2 9.0 10.4 13.4 17.9 21.6 23.6 27.1 60 years and over . . . . . . . . . . . . . . . . . . . . . . . 842 15.0 0.23 7.4 8.5 9.2 10.6 13.5 18.2 21.2 23.1 27.8
Non-Hispanic black 20 years and over . . . . . . . . . . . . . . . . . . . . . . . . 762 13.3 0.25 4.7 5.5 6.2 7.5 11.6 16.7 20.6 23.4 28.4
20–39 years . . . . . . . . . . . . . . . . . . . . . . . . . . 252 12.7 0.36 4.6 5.3 6.1 7.4 11.1 15.7 19.3 22.1 27.1 40–59 years . . . . . . . . . . . . . . . . . . . . . . . . . . 267 13.5 0.40 4.8 5.4 6.0 7.2 11.8 17.1 21.3 24.0 30.3 60 years and over . . . . . . . . . . . . . . . . . . . . . . . 243 14.5 0.43 5.0 6.5 8.0 9.4 12.6 18.2 21.8 25.5 28.4
Mexican American 20 years and over . . . . . . . . . . . . . . . . . . . . . . . . 994 13.2 0.31 5.8 6.9 7.8 9.1 11.9 15.7 19.2 21.2 25.1
20–39 years . . . . . . . . . . . . . . . . . . . . . . . . . . 383 13.3 0.38 5.6 6.7 7.5 9.0 12.0 15.8 20.0 22.0 25.1 40–59 years . . . . . . . . . . . . . . . . . . . . . . . . . . 294 12.9 0.42 5.8 7.2 8.0 9.4 11.5 15.3 18.0 19.8 24.5 60 years and over . . . . . . . . . . . . . . . . . . . . . . . 317 13.3 0.33 6.6 7.6 8.3 9.4 12.0 16.0 18.6 20.2 24.3

32 Advance Data No. 361 + July 7, 2005
Suggested citation
McDowell MA, Fryar CD, Hirsch R, Ogden CL. Anthropometric reference data for children and adults: U.S. population, 1999–2002. Advance data from vital and health statistics; no 361. Hyattsville, MD: National Center for Health Statistics. 2005.
Copyright information
All material appearing in this report is in the public domain and may be reproduced or copied without permission; citation as to source, however, is appreciated.
National Center for Health Statistics
DirectorEdward J. Sondik, Ph.D.
Acting Co-Deputy DirectorsJennifer H. Madans, Ph.D.
Michael H. Sadagursky
U.S. DEPARTMENT OF HEALTH & HUMAN SERVICES
Centers for Disease Control and Prevention National Center for Health Statistics 3311 Toledo Road Hyattsville, Maryland 20782
FIRST CLASSPOSTAGE & FEES PAID
CDC/NCHSPERMIT NO. G-284
OFFICIAL BUSINESS PENALTY FOR PRIVATE USE, $300
To receive this publication regularly, contact the National Center for Health Statistics by calling 1-866-441-NCHS (6247) E-mail: [email protected] Internet: www.cdc.gov/nchs
DHHS Publication No. (PHS) 2005-1250 05-0345 (7/05)
Related Documents