Anthropometric Reference Data for Children and Adults: United States, 2011–2014 Series 3, Number 39 August 2016

Welcome message from author
This document is posted to help you gain knowledge. Please leave a comment to let me know what you think about it! Share it to your friends and learn new things together.
Transcript

Serie
s 3,
Nu
mb
er 3
9 A
ug
ust
201
6
Anthropometric ReferenceData for Children and Adults: United States, 2011–2014

Copyright information
All material appearing in this report is in the public domain and may be reproduced or copied without permission; citation as to source, however, is appreciated.
Suggested citation
Fryar CD, Gu Q, Ogden CL, Flegal KM. Anthropometric reference data for children and adults: United States, 2011–2014. National Center for Health Statistics. Vital Health Stat 3(39). 2016.
Library of Congress Cataloging-in-Publication Data
Names: National Center for Health Statistics (U.S.), issuing body. | National Health and Nutrition Examination Survey (U.S.), researcher.Title: Anthropometric reference data for children and adults : United States, 2011-2014.Other titles: Anthropometric reference data for children and adults (2016) | DHHS publication ; no. (PHS) 2016-1423.Description: Hyattsville, Maryland : U.S. Department of Health and Human
Services, Centers for Disease Control and Prevention, National Center for Health Statistics, August 2016. | Series: Vital and health statistics. Series 3, Data from the National Health and Nutrition Examination Survey ; number 39 | Series: DHHS publication ; no. (PHS) 2016-1423 | Includes bibliographical references.Identifiers: LCCN 2016032998| ISBN 9780840606754 | ISBN 0840606753Subjects: | MESH: Body Weights and Measures--statistics & numerical data | Anthropometry--methods | Nutrition Surveys | United States | StatisticsClassification: LCC RA407.3 | NLM W2 A N148vcn no.39 2016 | DDC 614.4/273--dc23LC record available at https://lccn.loc.gov/2016032998For sale by the U.S. Government Printing Office Superintendent of Documents Mail Stop: SSOP Washington, DC 20402–9328 Printed on acid-free paper.

Series 3, Number 39
Anthropometric Reference Data for Children and Adults: United States, 2011–2014
Data from the National Health and Nutrition Examination Survey
U.S. DEPARTMENT OF HEALTH AND HUMAN SERVICES Centers for Disease Control and Prevention National Center for Health Statistics
Hyattsville, Maryland August 2016 DHHS Publication No. 2016–1604

National Center for Health Statistics
Charles J. Rothwell, M.S., M.B.A., Director
Jennifer H. Madans, Ph.D., Associate Director for Science
Division of Health and Nutrition Examination Surveys
Kathryn S. Porter, M.D., M.S., Director
Ryne Paulose-Ram, Ph.D., Associate Director for Science

Contents
Abstract . . . . . . . . . . . . . . . . . . . . . . . . . . . . . . . . . . . . . . . . . . . . . . . . . . . . . . . . . . . . . . . . . . . . . . . . . . . . . . . . . . . . . . . . . . . . . . . . . 1
Introduction . . . . . . . . . . . . . . . . . . . . . . . . . . . . . . . . . . . . . . . . . . . . . . . . . . . . . . . . . . . . . . . . . . . . . . . . . . . . . . . . . . . . . . . . . . . . . . 1
Methods . . . . . . . . . . . . . . . . . . . . . . . . . . . . . . . . . . . . . . . . . . . . . . . . . . . . . . . . . . . . . . . . . . . . . . . . . . . . . . . . . . . . . . . . . . . . . . . . . 1 Sample Description . . . . . . . . . . . . . . . . . . . . . . . . . . . . . . . . . . . . . . . . . . . . . . . . . . . . . . . . . . . . . . . . . . . . . . . . . . . . . . . . . . . . . . 1 Body Measures . . . . . . . . . . . . . . . . . . . . . . . . . . . . . . . . . . . . . . . . . . . . . . . . . . . . . . . . . . . . . . . . . . . . . . . . . . . . . . . . . . . . . . . . . 2 Statistical Analysis. . . . . . . . . . . . . . . . . . . . . . . . . . . . . . . . . . . . . . . . . . . . . . . . . . . . . . . . . . . . . . . . . . . . . . . . . . . . . . . . . . . . . . . 2
Results . . . . . . . . . . . . . . . . . . . . . . . . . . . . . . . . . . . . . . . . . . . . . . . . . . . . . . . . . . . . . . . . . . . . . . . . . . . . . . . . . . . . . . . . . . . . . . . . . . 2
Discussion . . . . . . . . . . . . . . . . . . . . . . . . . . . . . . . . . . . . . . . . . . . . . . . . . . . . . . . . . . . . . . . . . . . . . . . . . . . . . . . . . . . . . . . . . . . . . . . 2
References . . . . . . . . . . . . . . . . . . . . . . . . . . . . . . . . . . . . . . . . . . . . . . . . . . . . . . . . . . . . . . . . . . . . . . . . . . . . . . . . . . . . . . . . . . . . . . . 3
Appendix . . . . . . . . . . . . . . . . . . . . . . . . . . . . . . . . . . . . . . . . . . . . . . . . . . . . . . . . . . . . . . . . . . . . . . . . . . . . . . . . . . . . . . . . . . . . . . . . 37
Text Table Detailed tables with body measurements or indices from the National Health and Nutrition Examination Survey, 2011–2014 . . . . . . . . . . . . . . . . . . . . . . . . . . . . . . . . . . . . . . . . . . . . . . . . . . . . . . . . . . . . . . . . . . . . . . . . . . . . . . . . . . . 3
Appendix Table Historical summary of published anthropometric reference data . . . . . . . . . . . . . . . . . . . . . . . . . . . . . . . . . . . . . . . . . . . . . . 37
Detailed Tables 1. Weight in kilograms for children and adolescents from birth through age 19 years and number of examined persons,
mean, standard error of the mean, and selected percentiles, by sex and age: United States, 2011–2014 . . . . . . . . . . . . . . . 5 2. Weight in pounds for children and adolescents from birth through age 19 years and number of examined persons,
mean, standard error of the mean, and selected percentiles, by sex and age: United States, 2011–2014 . . . . . . . . . . . . . . . 6 3. Weight in kilograms for females aged 20 and over and number of examined persons, mean, standard error of the
mean, and selected percentiles, by race and Hispanic origin and age: United States, 2011–2014. . . . . . . . . . . . . . . . . . . . . 7 4. Weight in pounds for females aged 20 and over and number of examined persons, mean, standard error of the mean,
and selected percentiles, by race and Hispanic origin and age: United States, 2011–2014 . . . . . . . . . . . . . . . . . . . . . . . . . . 8 5. Weight in kilograms for males aged 20 and over and number of examined persons, mean, standard error of the mean,
and selected percentiles, by race and Hispanic origin and age: United States, 2011–2014 . . . . . . . . . . . . . . . . . . . . . . . . . . 9 6. Weight in pounds for males aged 20 and over and number of examined persons, mean, standard error of the mean,
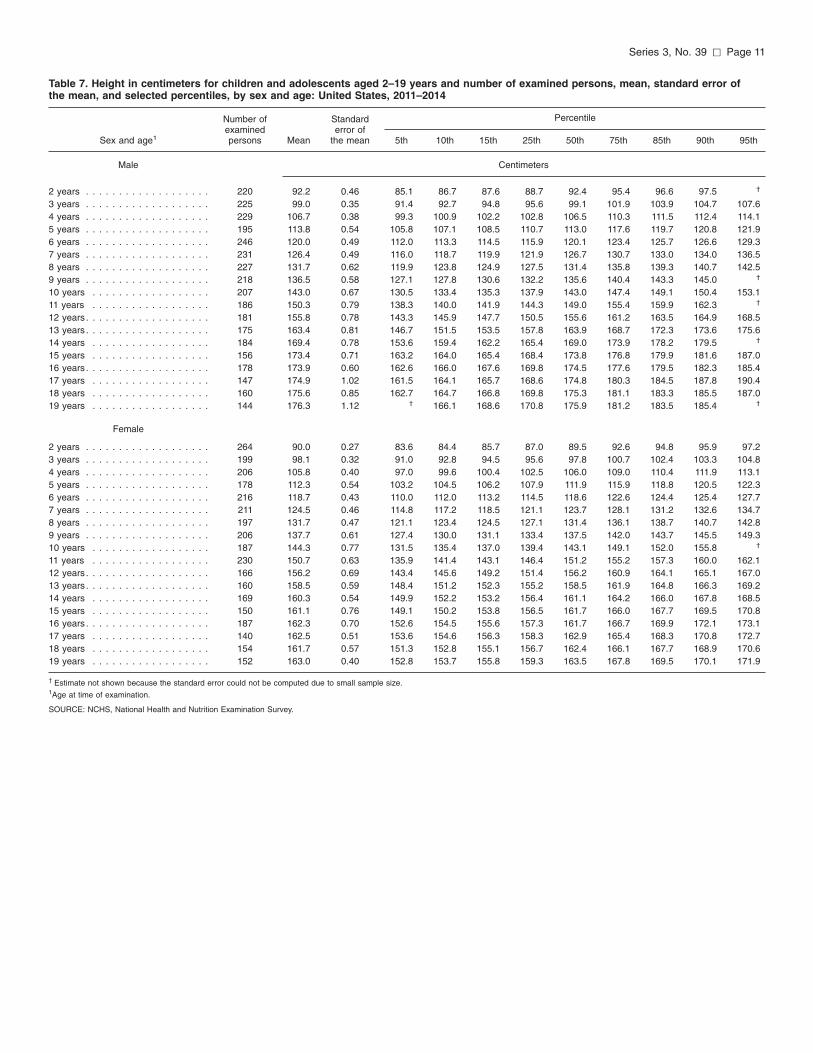
and selected percentiles, by race and Hispanic origin and age: United States, 2011–2014 . . . . . . . . . . . . . . . . . . . . . . . . . 10 7. Height in centimeters for children and adolescents aged 2–19 years and number of examined persons, mean, standard
error of the mean, and selected percentiles, by sex and age: United States, 2011–2014 . . . . . . . . . . . . . . . . . . . . . . . . . . . 11 8. Height in inches for children and adolescents aged 2–19 years and number of examined persons, mean, standard error
of the mean, and selected percentiles, by sex and age: United States, 2011–2014. . . . . . . . . . . . . . . . . . . . . . . . . . . . . . . . 12 9. Height in centimeters for females aged 20 and over and number of examined persons, mean, standard error of the
mean, and selected percentiles, by race and Hispanic origin and age: United States, 2011–2014. . . . . . . . . . . . . . . . . . . . 13 10. Height in inches for females aged 20 and over and number of examined persons, mean, standard error of the mean,
and selected percentiles, by race and Hispanic origin and age: United States, 2011–2014 . . . . . . . . . . . . . . . . . . . . . . . . . 14 11. Height in centimeters for males aged 20 and over and number of examined persons, mean, standard error of the mean,
and selected percentiles, by race and Hispanic origin and age: United States, 2011–2014 . . . . . . . . . . . . . . . . . . . . . . . . . 15
iii

12. Height in inches for males aged 20 and over and number of examined persons, mean, standard error of the mean, and selected percentiles, by race and Hispanic origin and age: United States, 2011–2014 . . . . . . . . . . . . . . . . . . . . . . . . . 16
13. Body mass index values for children and adolescents aged 2–19 years and number of examined persons, mean, standard error of the mean, and selected percentiles, by sex and age: United States, 2011–2014. . . . . . . . . . . . . . . . . . . . 17
14. Body mass index values for females aged 20 and over and number of examined persons, mean, standard error of the mean, and selected percentiles, by race and Hispanic origin and age: United States, 2011–2014. . . . . . . . . . . . . . . . . . . . 18
15. Body mass index values for males aged 20 and over and number of examined persons, mean, standard error of the mean, and selected percentiles, by race and Hispanic origin and age: United States, 2011–2014. . . . . . . . . . . . . . . . . . . . 19
16. Head circumference in centimeters for infants from birth through age 6 months and number of examined persons, mean, standard error of the mean, and selected percentiles, by sex and age: United States, 2011–2014 . . . . . . . . . . . . . . 20
17. Recumbent length in centimeters for children from birth through age 47 months and number of examined persons, mean, standard error of the mean, and selected percentiles, by sex and age: United States, 2011–2014 . . . . . . . . . . . . . . 21
18. Waist circumference in centimeters for children and adolescents aged 2–19 years and number of examined persons, mean, standard error of the mean, and selected percentiles, by sex and age: United States, 2011–2014 . . . . . . . . . . . . . . 22
19. Waist circumference in centimeters for females aged 20 and over and number of examined persons, mean, standard error of the mean, and selected percentiles, by race and Hispanic origin and age: United States, 2011–2014. . . . . . . . . . 23
20. Waist circumference in centimeters for males aged 20 and over and number of examined persons, mean, standard error of the mean, and selected percentiles, by race and Hispanic origin and age: United States, 2011–2014 . . . . . . . . . . . . . . 24
21. Sagittal abdominal diameter in centimeters for children and adolescents aged 8–19 years and number of examined persons, mean, standard error of the mean, and selected percentiles, by sex and age: United States, 2011–2014 . . . . . . . 25
22. Sagittal abdominal diameter in centimeters for females aged 20 and over and number of examined persons, mean, standard error of the mean, and selected percentiles, by race and Hispanic origin and age: United States, 2011–2014 . . 26
23. Sagittal abdominal diameter in centimeters for males aged 20 and over and number of examined persons, mean, standard error of the mean, and selected percentiles, by race and Hispanic origin and age: United States, 2011–2014 . . 27
24. Midarm circumference in centimeters for children and adolescents aged 2 months through 19 years and number of examined persons, mean, standard error of the mean, and selected percentiles, by sex and age: United States, 2011–2014. . . . . . . . . . . . . . . . . . . . . . . . . . . . . . . . . . . . . . . . . . . . . . . . . . . . . . . . . . . . . . . . . . . . . . . . . . . . . . . . . . . . . . . . . 28
25. Midarm circumference in centimeters for females aged 20 and over and number of examined persons, mean, standard error of the mean, and selected percentiles, by race and Hispanic origin and age: United States, 2011–2014. . . . . . . . . . 29
26. Midarm circumference in centimeters for males aged 20 and over and number of examined persons, mean, standard error of the mean, and selected percentiles, by race and Hispanic origin and age: United States, 2011–2014. . . . . . . . . . 30
27. Upper arm length in centimeters for children and adolescents aged 2 months through 19 years and number of examined persons, mean, standard error of the mean, and selected percentiles, by sex and age: United States, 2011–2014 . . . . . . . 31
28. Upper arm length in centimeters for females aged 20 and over and number of examined persons, mean, standard error of the mean, and selected percentiles, by race and Hispanic origin and age: United States, 2011–2014 . . . . . . . . . . . . . . 32
29. Upper arm length in centimeters for males aged 20 and over and number of examined persons, mean, standard error of the mean, and selected percentiles, by race and Hispanic origin and age: United States, 2011–2014. . . . . . . . . . . . . . . . . 33
30. Upper leg length in centimeters for children and adolescents aged 8–19 years and number of examined persons, mean, standard error of the mean, and selected percentiles, by sex and age: United States, 2011–2014. . . . . . . . . . . . . . . . . . . . 34
31. Upper leg length in centimeters for females aged 20 and over and number of examined persons, mean, standard error of the mean, and selected percentiles, by race and Hispanic origin and age: United States, 2011–2014 . . . . . . . . . . . . . . 35
32. Upper leg length in centimeters for males aged 20 and over and number of examined persons, mean, standard error of the mean, and selected percentiles, by race and Hispanic origin and age: United States, 2011–2014. . . . . . . . . . . . . . . . . 36
iv
Nutrition Examination Surveys
Objective This report presents anthropometric
reference data for the U.S. population in 2011–2014.
Methods Body measurements were obtained
from 19,151 participants in the 2011–2014 National Health and Nutrition Examination Survey (NHANES). Measurements included weight, height, recumbent length, circumferences, limb lengths, and sagittal abdominal diameter (SAD).
Results Weighted population means,
standard errors of the means, and selected percentiles of body measurement values are reported. Body measurement results are shown by sex and age, as well as race and Hispanic origin in adults.
Conclusions These latest NHANES data show the
distribution of weight, height, body mass index, circumferences, lengths, and SAD in the U.S. population.
Keywords: anthropometry • body measures • nutrition surveys • National Health and Nutrition Examination Survey
Anthropometric Reference Data for Children and Adults: United States, 2011–2014 by Cheryl D. Fryar, M.S.P.H.; Qiuping Gu, M.D.; Cynthia L. Ogden, Ph.D.; and Katherine M. Flegal, Ph.D., Division of Health and
Introduction
Anthropometry or human body measurements provide important indicators of nutritional status in children and adults (1). In children, measurements reflect general health status, dietary adequacy, and growth and development over time. In adults, body measurements are used to evaluate health and dietary status, disease risk, and body composition. This report presents anthropometric reference data for 2011–2014 for U.S. children and adults.
Methods
National Health and Nutrition Examination Surveys (NHANES) are conducted by the National Center for Health Statistics. NHANES data are the primary source of body measurement information for the U.S. population. Household interviews and health examinations are used to collect NHANES data. Health examinations are conducted in mobile examination centers (MECs). The MECs are staffed by full-time personnel, including health technicians who perform body measurements on survey participants following a standard protocol.
Surveys were conducted on a periodic basis from 1960 through 1994. NHANES became a continuous survey in 1999. Each of the continuous NHANES annual samples is nationally representative. For reasons that include disclosure and data reliability, public-use data files are released in 2-year cycles.
A combined 4-year data set based on 2011–2012 and 2013–2014 data was used for this report to improve the stability and reliability of the statistical estimates (2–5). During 2011–2014, the overall examination response rate was 69%.
Sample Description NHANES is a complex, multistage
probability sample of the civilian noninstitutionalized U.S. population. The NHANES 2011–2014 sample included participants of all ages. Those aged 80 and over, Hispanic persons, non-Hispanic black persons, non-Hispanic Asian persons, and those with low income were oversampled to improve the precision of the statistical estimates for these groups (5). The oversampling of non-Hispanic Asian persons is new to the 2011–2014 data collection methodology. The analytic sample for this report was based on the 2011–2014 examined sample of 19,151 persons. Pregnant females were excluded from the tabulations of weight, body mass index (BMI), and circumference measurements.
The age and race and Hispanic-origin categories used for adults aged 20 and over were based on the survey sample domains (4). Age was categorized into three groups: 20–39, 40–59, and 60 and over. Race and Hispanic origin were reported for non-Hispanic white, non-Hispanic black, non-Hispanic Asian, all Hispanic, and Mexican-American persons. For participants under age 20, results are reported by single year of age, except for results for infants under age 1 year, which are reported by month of age.
Page 1

Page 2 [ Series 3, No. 39
Body Measures The NHANES Anthropometry
Procedures Manual describes the protocol, equipment, quality control, and measurement procedures in detail (6).
Weight was measured on all participants to the nearest 0.1 kilogram using a digital floor scale. Head circumference was measured on infants from birth through 6 months of age to the nearest 0.1 centimeter (cm) using a plastic head circumference measurement tape. Recumbent length was measured from birth through 47 months of age to the nearest 0.1 cm using a digital infantometer. Upper arm length and arm circumference were measured on participants starting at 2 months of age. Upper arm length was measured with a tape measure from the posterior border of the acromion process to the tip of the olecranon process; during the measurement, the upper arm length midpoint was marked. Midarm circumference was measured with a tape measure at the marked point.
Standing height or stature and waist circumference were measured to the nearest 0.1 cm on participants starting at age 2 years. Standing height was measured with a digital stadiometer. Waist circumference was measured with a tape measure at the uppermost lateral border of the hip crest (ilium).
In addition to these measurements, upper leg length and sagittal abdominal diameter (SAD) measurements were taken on participants aged 8 and over. Pregnant females and persons over 600 pounds were excluded from SAD measurements. Upper leg measurements were taken on seated participants; the distance from the inguinal crease to the distal end of the femur was measured. SAD measurements were taken on participants in a supine position; the external distance between the front of the abdomen and the small of the back at the iliac level line was measured.
Weight, recumbent length, and standing height values were recorded automatically. Other body measurement data were recorded using computer-assisted data entry. All results, except SAD, were based on a single body measurement examination. SAD data arebased on an average of up to four measurement readings, although most participants had only two readings.
One index is reported: BMI, which was calculated as weight in kilograms divided by height in meters squared (kg/m2).
Statistical Analysis Data were weighted using
NHANES 4-year calculated examination sample weights to produce national estimates. The NHANES examination sample weights incorporate the differential probabilities of selection and include adjustments for oversampling of selected populations, noncoverage, and nonresponse. Standard errors were estimated using SUDAAN by Taylor series linearization because of the complex sample design (7).
The reliability of the estimates produced for this report was evaluated. Estimates based on less than 12 degrees of freedom or with a relative standard error (RSE) greater than 30% were considered statistically unreliable (4). RSE is defined as the ratio of the standard error of the estimate divided bythe estimate, multiplied by 100. No estimates in this report had RSEs greaterthan 30%. In Tables 1–32, estimates based on less than 12 degrees of freedom are identified with an asterisk (*). Estimates with standard errors that could not be calculated using SUDAAN because of small cell sizes were omitted from the tables and are identified with a dagger (†).
Results
A list of detailed tables based on body measurements and BMI is found in the text Table. Tables 1–32 contain the results from each measurement and BMI. Results are reported by sex and age group, and results for adults aged 20 and over are also presented by race and Hispanic origin. Results from previous surveys for most measurements have been reported for the National Health Examination Survey and NHANES conducted during 1960–2010 (8–21). A historical summary of published body measurement reference data is available in the Appendix.
Discussion
This report provides the most recent anthropometric reference data for U.S. children and adults. The SAD measurements provide the first national reference data across various demographic groups. NHANES anthropometric data have been used by researchers and policy makers for a variety of research and policy applications (22–29). NHANES will continue to collect anthropometric data and provide vital information to support national health programs and policy efforts.

Series 3, No. 39 [ Page 3
Table. Detailed tables with body measurements or indices from the National Health and Nutrition Examination Survey, 2011–2014
Table Measurement/index number (unit of measurement) Age group and sex
1 . . . . . . . . . Weight (kilograms) Birth–19 years 2 . . . . . . . . . 3 . . . . . . . . . 4 . . . . . . . . .
Weight (pounds) Weight (kilograms) Weight (pounds)
Birth–19 years Females 20 years and over Females 20 years and over
5 . . . . . . . . . Weight (kilograms) Males 20 years and over 6 . . . . . . . . . Weight (pounds) Males 20 years and over 7 . . . . . . . . . Standing height (centimeters) Persons 2–19 years 8 . . . . . . . . . Standing height (inches) Persons 2–19 years 9 . . . . . . . . . 10 . . . . . . . . 11 . . . . . . . . 12 . . . . . . . .
Standing height (centimeters) Standing height (inches) Standing height (centimeters) Standing height (inches)
Females 20 years and over Females 20 years and over Males 20 years and over Males 20 years and over
13 . . . . . . . . Body mass index Persons 2–19 years 14 . . . . . . . . Body mass index Females 20 years and over 15 . . . . . . . . 16 . . . . . . . . 17 . . . . . . . . 18 . . . . . . . . 19 . . . . . . . .
Body mass index Head circumference (centimeters) Recumbent length (centimeters) Waist circumference (centimeters) Waist circumference (centimeters)
Males 20 years and over Birth through 6 months Birth through 47 months Persons 2–19 years Females 20 years and over
20 . . . . . . . . Waist circumference (centimeters) Males 20 years and over 21 . . . . . . . . Sagittal abdominal diameter (centimeters) Persons 8–19 years 22 . . . . . . . . 23 . . . . . . . . 24 . . . . . . . . 25 . . . . . . . . 26 . . . . . . . .
Sagittal abdominal diameter (centimeters) Sagittal abdominal diameter (centimeters) Midarm circumference (centimeters) Midarm circumference (centimeters) Midarm circumference (centimeters)
Females 20 years and over Males 20 years and over Persons 2 months–19 years Females 20 years and over Males 20 years and over
27 . . . . . . . . Upper arm length (centimeters) Persons 2 months–19 years 28 . . . . . . . . Upper arm length (centimeters) Females 20 years and over 29 . . . . . . . . Upper arm length (centimeters) Males 20 years and over 30 . . . . . . . . 31 . . . . . . . . 32 . . . . . . . .
Upper leg length (centimeters) Upper leg length (centimeters) Upper leg length (centimeters)
Persons 8–19 years Females 20 years and over Males 20 years and over
References
1. Gibson RS. Principles of nutritional assessment. Second edition. Oxford University Press. 2005.
2. National Center for Health Statistics. National Health and Nutrition Examination Survey, 2011–2012 data documentation, codebook, and frequencies: Body measures. 2015. Available from: https://wwwn.cdc.gov/ Nchs/Nhanes/2011-2012/BMX_G.htm.
3. National Center for Health Statistics. National Health and Nutrition Examination Survey, 2013–2014 data documentation, codebook, and frequencies: Body measures. 2015. Available from: https://wwwn.cdc.gov/ Nchs/Nhanes/2013-2014/BMX_H.htm.
4. CDC. National Center for Health Statistics. National Health and NutritionExamination Survey: Analytic guidelines, 2011–2012. 2013. Available from: http://www.cdc.gov/nchs/data/ nhanes/analytic_guidelines_11_12.pdf.
5. Johnson CL, Dohrmann SM, Burt VL, Mohadjer LK. National Health and Nutrition Examination Survey: Sample design, 2011–2014. National Center for Health Statistics. Vital Health Stat 2(162). 2014. Available from: http://www.cdc.gov/nchs/data/series/ sr_02/sr02_162.pdf.
6. CDC. National Center for Health Statistics. National Health and Nutrition Examination Survey (NHANES) anthropometry procedures manual. 2013. Available from: http:// www.cdc.gov/nchs/data/nhanes/ nhanes_13_14/2013_ Anthropometry.pdf.
7. Wolter KM. Introduction to variance estimation. 2nd ed. New York, NY: Springer. 2007.
8. Stoudt HW, Damon A, McFarland R, Roberts J. Weight, height, and selected body dimensions of adults. National Center for Health Statistics. Vital Health Stat 11(8). 1965. Available from: http://www.cdc.gov/nchs/data/ series/sr_11/sr11_008.pdf.
9. Stoudt HW, Damon A, McFarland RA, Roberts J. Skinfolds, body girths, biacromial diameter, and selected anthropometric indices of adults: United States, 1960–1962. National Center for Health Statistics. Vital Health Stat 11(35). 1970. Available from: http://www.cdc.gov/nchs/data/ series/sr_11/sr11_035acc.pdf.
10. Roberts J. Weight by height and age of adults: United States, 1960–1962. National Center for Health Statistics. Vital Health Stat 11(14). 1966. Available from: http://www.cdc.gov/ nchs/data/series/sr_11/sr11_014acc.pdf.
11. Malina RM, Hamill PVV, Lemeshow S. Selected body measurements of children 6–11 years: United States. National Center for Health Statistics. Vital Health Stat 11(123). 1973. Available from: http://www.cdc.gov/ nchs/data/series/sr_11/sr11_123acc.pdf.
12. Hamill PVV, Johnston FE, Lemeshow S. Height and weight of youths 12–17 years: United States. National Center for Health Statistics. Vital Health Stat 11(124). 1973. Available from: http://www.cdc.gov/nchs/data/series/ sr_11/sr11_124.pdf.
13. Abraham S, Johnson CL, Najjar MF. Weight and height of adults 18–74 years of age: United States, 1971–74. National Center for Health Statistics. Vital Health Stat 11(211). 1979. Available from: http://www.cdc.gov/ nchs/data/series/sr_11/sr11_211.pdf.
14. Johnson CL, Fulwood R, Abraham S, Bryner JD. Basic data on anthropometric measurements and angular measurements of the hip and knee joints for selected age groups 1–74 years of age: United States, 1971–1975. National Center for Health Statistics. Vital Health Stat 11(219). 1981. Available from: http:// www.cdc.gov/nchs/data/series/sr_11/ sr11_219.pdf.
15. Najjar MF, Rowland M. Anthropometric reference data and prevalence of overweight: United States, 1976–80. National Center for Health Statistics. Vital Health Stat 11(238). 1987. Available from: http://www.cdc.gov/nchs/data/series/ sr_11/sr11_238.pdf.
16. Najjar MF, Kuczmarski RJ. Anthropometric data and prevalence of overweight for Hispanics: 1982–84. National Center for Health Statistics. Vital Health Stat 11(239). 1989. Available from: http://www.cdc.gov/ nchs/data/series/sr_11/sr11_239.pdf.
Page 4 [ Series 3, No. 39
17. McDowell MA, Fryar CD, Ogden CL. Anthropometric reference data for children and adults: United States, 1988–1994. National Center for Health Statistics. Vital Health Stat 11(249). 2009. Available from: http:// www.cdc.gov/nchs/data/series/sr_11/ sr11_249.pdf.
18. Ogden CL, Fryar CD, Carroll MD, Flegal KM. Mean body weight, height, and body mass index, United States 1960–2002. Advance data from vital and health statistics; no 347. Hyattsville, MD: National Center for Health Statistics. 2004. Available from: http://www.cdc.gov/nchs/data/ad/ ad347.pdf.
19. McDowell MA, Fryar CD, Hirsch R, Ogden CL. Anthropometric reference data for children and adults: U.S. population, 1999–2002. Advance data from vital and health statistics; no 361. Hyattsville, MD: National Center for Health Statistics. 2005. Available from: http://www.cdc.gov/nchs/data/ad/
20. ad361.pdf. McDowell MA, Fryar CD, Ogden CL, Flegal KM. Anthropometric reference data for children and adults: United States, 2003–2006. National health statistics reports; no 10. Hyattsville, MD: National Center for Health Statistics. 2008. Available from: http://www.cdc.gov/nchs/data/nhsr/
21. nhsr010.pdf. Fryar CD, Gu Q, Ogden CL. Anthropometric reference data for children and adults: United States, 2007–2010. National Center for Health Statistics. Vital Health Stat 11(252). 2012. Available from: http:// www.cdc.gov/nchs/data/series/sr_11/
22. sr11_252.pdf. Flegal KM, Kruszon-Moran D, Carroll MD, Fryar CD, Ogden CL. Trends in obesity among adults in the United States, 2005 to 2014. JAMA 315(21):2284–91. 2016.
23. Ogden CL, Carroll MD, Lawman HG, Fryar CD, Kruszon-Moran D, Kit BK, Flegal KM. Trends in obesity prevalence among children and adolescents in the United States, 1988–1994 through 2013–2014. JAMA 315(21):2292–9. 2016.
24. White House Task Force on Childhood Obesity report to the President. Solving the problem of childhood obesity within a generation. 2010. Available from: http://www.letsmove.gov/sites/ letsmove.gov/files/TaskForce_on_ Childhood_Obesity_May2010_ FullReport.pdf.
25. Ostchega Y, Hughes JP, Zhang G, Nwankwo T, Chiappa MM. Mean mid-arm circumference and blood pressure cuff sizes for U.S. adults: National Health and Nutrition Examination Survey, 1999–2010. Blood Press Monit 18(3):138–43. 2013.
26. Ostchega Y, Hughes JP, Prineas RJ, Zhang G, Nwankwo T, Chiappa MM. Mid-arm circumference and recommended blood pressure cuffs for children and adolescents aged between 3 and 19 years: Data from the National Health and Nutrition Examination Survey, 1999–2010. Blood Press Monit
27. 19(1):26–31. 2014. Consumer Product Safety Commission.
28.
Human factors staff recommendation for anthropometry project. 1998. Available from: http://www.cpsc.gov/ library/foia/foia98/os/antrpmtr.pdf. U.S. Department of Transportation. Advisory circular: Aircraft weight and balance control. Federal Aviation Administration. 2004.
29. Department of Homeland Security. Passenger weight and inspected vessel stability requirements; Final rule. Fed Regist 75(239):78064. 2010.

Series 3, No. 39 [ Page 5
Table 1. Weight in kilograms for children and adolescents from birth through age 19 years and number of examined persons, mean, standard error of the mean, and selected percentiles, by sex and age: United States, 2011–2014
Sex and age1
Number of examined persons Mean
Standard error of
the mean 5th 10th 15th 25th
Percentile
50th 75th 85th 90th 95th
Male Kilograms
Birth–2 months . . . . . . . . . . . . . . 75 5.4 0.10 4.0 4.3 4.4 4.7 5.3 5.9 6.3 6.5 6.7 3–5 months . . . . . . . . . . . . . . . . . 90 7.3 0.12 5.8 6.0 6.2 6.5 7.2 8.0 8.2 8.7 8.9 6–8 months . . . . . . . . . . . . . . . . . 103 8.5 0.12 6.9 7.2 7.4 7.7 8.4 9.2 9.6 9.7 10.1 9–11 months . . . . . . . . . . . . . . . . 97 9.7 0.16 7.6 8.0 8.3 8.7 9.5 10.6 11.2 11.4 11.8 1 year . . . . . . . . . . . . . . . . . . . . 240 11.4 0.10 9.3 9.7 10.1 10.4 11.3 12.0 13.0 13.2 13.9 2 years . . . . . . . . . . . . . . . . . . . 258 14.2 0.14 11.5 11.9 12.4 13.0 14.0 15.0 16.0 16.6 17.5 3 years . . . . . . . . . . . . . . . . . . . 234 16.0 0.16 13.3 13.8 14.2 14.7 15.7 16.9 18.1 18.3 19.1 4 years . . . . . . . . . . . . . . . . . . . 230 18.5 0.18 14.6 15.3 15.6 16.4 18.1 19.9 20.7 21.6 23.9 5 years . . . . . . . . . . . . . . . . . . . 195 21.2 0.39 16.9 17.5 18.2 18.8 20.1 23.1 24.3 25.4 29.1 6 years . . . . . . . . . . . . . . . . . . . 247 23.9 0.39 18.3 19.1 20.1 21.0 23.1 25.8 27.4 28.8 32.5 7 years . . . . . . . . . . . . . . . . . . . 231 28.1 0.52 20.4 21.7 21.9 23.3 26.0 30.1 33.7 38.9 42.5 8 years . . . . . . . . . . . . . . . . . . . 228 31.5 0.58 21.7 23.0 24.1 25.9 29.7 35.0 38.0 40.0 46.4 9 years . . . . . . . . . . . . . . . . . . . 218 33.8 0.69 23.3 25.1 25.9 28.2 31.8 36.2 42.0 46.2 50.4 10 years . . . . . . . . . . . . . . . . . . 207 40.3 1.25 26.6 28.8 30.8 32.1 36.5 45.8 50.5 54.1 62.8 11 years . . . . . . . . . . . . . . . . . . 186 48.5 1.39 30.9 33.3 35.4 38.0 45.8 55.6 63.6 71.4 76.1 12 years . . . . . . . . . . . . . . . . . . . 181 50.6 1.44 33.4 36.0 37.3 41.2 47.6 54.9 64.1 70.2 79.8 13 years . . . . . . . . . . . . . . . . . . . 175 60.7 1.64 39.8 41.8 43.6 48.6 56.7 67.7 75.3 83.9 93.9 14 years . . . . . . . . . . . . . . . . . . 184 65.9 1.83 43.9 47.5 51.4 53.9 61.4 74.0 84.2 89.9 101.4 15 years . . . . . . . . . . . . . . . . . . 156 71.3 1.91 47.2 51.6 53.6 57.7 65.5 82.6 84.8 94.2 110.3 16 years . . . . . . . . . . . . . . . . . . . 178 74.4 1.21 52.6 55.7 57.5 61.3 68.7 84.2 90.2 96.1 110.3 17 years . . . . . . . . . . . . . . . . . . 147 75.1 2.08 52.4 56.6 59.0 61.7 71.1 80.7 91.5 99.6 114.2 18 years . . . . . . . . . . . . . . . . . . 160 81.4 3.22 53.9 57.8 60.0 65.9 76.4 87.8 100.3 107.8 †
19 years . . . . . . . . . . . . . . . . . . 144 78.9 2.24 54.5 55.7 59.6 63.9 73.7 87.3 96.3 113.1 †
Female
Birth–2 months . . . . . . . . . . . . . . 72 4.8 0.08 3.7 3.9 4.0 4.3 4.7 5.1 5.4 5.8 †
3–5 months . . . . . . . . . . . . . . . . . 104 6.8 0.12 5.1 5.4 5.6 6.1 6.7 7.4 7.8 7.9 8.2 6–8 months . . . . . . . . . . . . . . . . . 91 8.0 0.12 6.2 6.7 6.8 7.3 7.8 8.5 8.8 9.2 †
9–11 months . . . . . . . . . . . . . . . . 104 9.3 0.16 7.1 7.7 8.0 8.3 9.1 10.1 10.5 10.6 11.5 1 year . . . . . . . . . . . . . . . . . . . . 224 11.2 0.14 8.5 9.1 9.5 9.9 11.1 12.2 12.8 13.3 13.9 2 years . . . . . . . . . . . . . . . . . . . 293 13.3 0.12 10.7 11.2 11.4 11.9 13.1 14.3 15.0 15.4 16.4 3 years . . . . . . . . . . . . . . . . . . . 201 15.7 0.22 12.8 13.1 13.6 14.2 15.1 16.5 17.5 18.7 19.4 4 years . . . . . . . . . . . . . . . . . . . 206 18.3 0.28 13.9 14.4 14.9 15.9 17.9 19.8 20.6 21.4 25.4 5 years . . . . . . . . . . . . . . . . . . . 179 20.4 0.34 15.3 16.0 16.6 17.9 19.9 21.8 23.9 24.6 27.8 6 years . . . . . . . . . . . . . . . . . . . 216 23.8 0.48 17.3 17.8 18.7 20.1 22.2 26.5 29.4 30.8 33.4 7 years . . . . . . . . . . . . . . . . . . . 211 26.6 0.63 19.2 19.9 20.7 21.8 24.5 29.5 33.6 36.4 40.7 8 years . . . . . . . . . . . . . . . . . . . 197 31.7 0.62 22.6 23.3 23.8 25.4 28.7 35.4 39.1 43.0 46.3 9 years . . . . . . . . . . . . . . . . . . . 206 37.5 0.86 24.9 26.6 27.2 29.2 34.2 42.2 48.2 51.2 58.7 10 years . . . . . . . . . . . . . . . . . . 187 41.3 1.27 25.6 27.7 29.6 33.0 38.7 47.3 51.9 57.3 63.0 11 years . . . . . . . . . . . . . . . . . . 230 47.4 1.17 30.0 33.3 34.6 37.8 44.0 54.1 59.5 64.8 75.8 12 years . . . . . . . . . . . . . . . . . . . 166 55.8 1.64 34.6 37.9 40.1 43.2 50.9 65.7 72.4 77.7 90.7 13 years . . . . . . . . . . . . . . . . . . . 160 55.5 1.47 38.6 41.0 43.4 45.4 51.4 61.3 71.0 77.4 78.1 14 years . . . . . . . . . . . . . . . . . . 169 59.6 1.52 42.5 45.1 47.2 49.9 53.8 66.2 74.9 81.4 85.2 15 years . . . . . . . . . . . . . . . . . . 150 64.3 2.50 43.7 47.1 49.4 52.3 58.1 72.1 82.1 88.6 †
16 years . . . . . . . . . . . . . . . . . . . 187 65.0 2.60 45.8 46.9 48.9 50.9 60.0 70.3 83.8 95.3 †
17 years . . . . . . . . . . . . . . . . . . 139 67.4 1.86 47.1 50.4 51.4 53.6 60.7 77.5 85.7 90.5 108.7 18 years . . . . . . . . . . . . . . . . . . 154 67.2 2.59 45.0 47.8 51.3 54.3 62.1 72.7 81.9 91.2 †
19 years . . . . . . . . . . . . . . . . . . 152 68.5 2.16 44.2 46.0 49.7 54.2 62.6 79.0 85.5 100.0 113.3
† Estimate not shown because the standard error could not be computed due to small sample size. 1Age at time of examination.
NOTE: Data exclude pregnant females.
SOURCE: NCHS, National Health and Nutrition Examination Survey.

Page 6 [ Series 3, No. 39
Table 2. Weight in pounds for children and adolescents from birth through age 19 years and number of examined persons, mean, standard error of the mean, and selected percentiles, by sex and age: United States, 2011–2014
Sex and age1
Number of examined persons Mean
Standard error of
the mean 5th 10th 15th 25th
Percentile
50th 75th 85th 90th 95th
Male Pounds
Birth–2 months . . . . . . . . . . . . . . 75 11.8 0.22 8.7 9.5 9.7 10.3 11.7 12.9 14.0 14.4 14.8 3–5 months . . . . . . . . . . . . . . . . . 90 16.1 0.27 12.8 13.2 13.7 14.3 16.0 17.7 18.1 19.1 19.5 6–8 months . . . . . . . . . . . . . . . . . 103 18.7 0.27 15.2 15.8 16.3 16.9 18.5 20.2 21.1 21.4 22.2 9–11 months . . . . . . . . . . . . . . . . 97 21.5 0.36 16.9 17.7 18.3 19.2 21.0 23.3 24.8 25.2 26.0 1 year . . . . . . . . . . . . . . . . . . . . 240 25.2 0.22 20.4 21.3 22.3 23.0 24.9 26.5 28.7 29.2 30.7 2 years . . . . . . . . . . . . . . . . . . . 258 31.3 0.30 25.3 26.2 27.3 28.6 30.8 33.0 35.2 36.6 38.7 3 years . . . . . . . . . . . . . . . . . . . 234 35.3 0.34 29.4 30.3 31.2 32.4 34.6 37.3 39.9 40.3 42.2 4 years . . . . . . . . . . . . . . . . . . . 230 40.8 0.39 32.1 33.8 34.4 36.1 39.8 43.9 45.6 47.6 52.8 5 years . . . . . . . . . . . . . . . . . . . 195 46.6 0.87 37.2 38.6 40.1 41.5 44.4 50.9 53.6 56.0 64.2 6 years . . . . . . . . . . . . . . . . . . . 247 52.8 0.85 40.3 42.1 44.3 46.3 50.8 56.8 60.5 63.4 71.7 7 years . . . . . . . . . . . . . . . . . . . 231 61.9 1.15 45.0 47.9 48.3 51.3 57.4 66.4 74.4 85.8 93.6 8 years . . . . . . . . . . . . . . . . . . . 228 69.4 1.27 47.8 50.7 53.2 57.2 65.5 77.2 83.7 88.3 102.3 9 years . . . . . . . . . . . . . . . . . . . 218 74.4 1.52 51.4 55.3 57.1 62.1 70.2 79.9 92.6 101.9 111.1 10 years . . . . . . . . . . . . . . . . . . 207 88.7 2.76 58.6 63.4 67.9 70.8 80.5 100.9 111.4 119.3 138.5 11 years . . . . . . . . . . . . . . . . . . 186 107.0 3.07 68.2 73.4 78.0 83.8 100.9 122.7 140.1 157.4 167.8 12 years . . . . . . . . . . . . . . . . . . . 181 111.6 3.17 73.6 79.3 82.2 90.9 105.0 121.1 141.3 154.7 175.9 13 years . . . . . . . . . . . . . . . . . . . 175 133.9 3.61 87.8 92.1 96.1 107.1 125.1 149.2 166.0 184.9 207.0 14 years . . . . . . . . . . . . . . . . . . 184 145.2 4.03 96.7 104.7 113.3 118.9 135.4 163.1 185.5 198.1 223.6 15 years . . . . . . . . . . . . . . . . . . 156 157.3 4.20 104.0 113.7 118.1 127.3 144.5 182.1 186.9 207.7 243.2 16 years . . . . . . . . . . . . . . . . . . . 178 164.1 2.67 116.0 122.7 126.7 135.1 151.4 185.7 198.9 211.8 243.2 17 years . . . . . . . . . . . . . . . . . . 147 165.5 4.58 115.5 124.9 130.0 136.1 156.8 177.8 201.7 219.6 251.7 18 years . . . . . . . . . . . . . . . . . . 160 179.4 7.09 118.9 127.4 132.3 145.3 168.5 193.6 221.1 237.6 †
19 years . . . . . . . . . . . . . . . . . . 144 174.0 4.95 120.2 122.8 131.3 140.8 162.5 192.5 212.3 249.3 †
Female
Birth–2 months . . . . . . . . . . . . . . 72 10.6 0.18 8.2 8.6 8.9 9.5 10.4 11.2 11.9 12.7 †
3–5 months . . . . . . . . . . . . . . . . . 104 14.9 0.26 11.3 11.9 12.3 13.4 14.7 16.4 17.2 17.4 18.1 6–8 months . . . . . . . . . . . . . . . . . 91 17.7 0.26 13.6 14.7 14.9 16.1 17.2 18.8 19.5 20.3 †
9–11 months . . . . . . . . . . . . . . . . 104 20.4 0.36 15.6 17.0 17.5 18.4 20.1 22.3 23.1 23.3 25.3 1 year . . . . . . . . . . . . . . . . . . . . 224 24.6 0.30 18.7 20.0 20.9 21.7 24.4 26.9 28.3 29.3 30.6 2 years . . . . . . . . . . . . . . . . . . . 293 29.3 0.26 23.6 24.7 25.0 26.3 28.8 31.5 33.1 34.0 36.0 3 years . . . . . . . . . . . . . . . . . . . 201 34.5 0.49 28.1 28.8 29.9 31.3 33.4 36.3 38.6 41.2 42.8 4 years . . . . . . . . . . . . . . . . . . . 206 40.3 0.62 30.7 31.7 32.8 35.0 39.5 43.6 45.3 47.2 56.0 5 years . . . . . . . . . . . . . . . . . . . 179 45.0 0.74 33.7 35.2 36.6 39.5 43.8 48.0 52.6 54.3 61.3 6 years . . . . . . . . . . . . . . . . . . . 216 52.4 1.05 38.2 39.2 41.1 44.4 49.0 58.4 64.8 67.8 73.7 7 years . . . . . . . . . . . . . . . . . . . 211 58.7 1.38 42.4 43.8 45.6 48.0 53.9 64.9 74.1 80.2 89.7 8 years . . . . . . . . . . . . . . . . . . . 197 69.9 1.37 49.7 51.4 52.5 56.0 63.3 78.1 86.1 94.8 102.0 9 years . . . . . . . . . . . . . . . . . . . 206 82.7 1.90 54.9 58.6 59.9 64.4 75.5 93.0 106.2 112.9 129.4 10 years . . . . . . . . . . . . . . . . . . 187 90.9 2.80 56.5 61.1 65.3 72.8 85.3 104.2 114.4 126.3 139.0 11 years . . . . . . . . . . . . . . . . . . 230 104.5 2.58 66.2 73.4 76.4 83.4 97.0 119.2 131.1 142.8 167.0 12 years . . . . . . . . . . . . . . . . . . . 166 122.9 3.61 76.3 83.6 88.5 95.2 112.2 144.8 159.5 171.3 199.9 13 years . . . . . . . . . . . . . . . . . . . 160 122.4 3.25 85.1 90.3 95.7 100.1 113.2 135.2 156.6 170.7 172.3 14 years . . . . . . . . . . . . . . . . . . 169 131.4 3.35 93.7 99.5 104.1 109.9 118.5 145.9 165.1 179.4 187.7 15 years . . . . . . . . . . . . . . . . . . 150 141.7 5.50 96.3 103.8 108.8 115.2 128.1 158.9 181.0 195.4 †
16 years . . . . . . . . . . . . . . . . . . . 187 143.3 5.73 100.9 103.5 107.8 112.1 132.3 155.0 184.6 210.1 †
17 years . . . . . . . . . . . . . . . . . . 139 148.5 4.11 103.8 111.2 113.2 118.1 133.8 170.9 189.0 199.6 239.7 18 years . . . . . . . . . . . . . . . . . . 154 148.2 5.72 99.1 105.3 113.1 119.6 137.0 160.2 180.5 201.0 †
19 years . . . . . . . . . . . . . . . . . . 152 150.9 4.77 97.5 101.4 109.6 119.6 137.9 174.1 188.5 220.5 249.9
† Estimate not shown because the standard error could not be computed due to small sample size. 1Age at time of examination.
NOTE: Data exclude pregnant females.
SOURCE: NCHS, National Health and Nutrition Examination Survey.

Series 3, No. 39 [ Page 7
Table 3. Weight in kilograms for females aged 20 and over and number of examined persons, mean, standard error of the mean, and selected percentiles, by race and Hispanic origin and age: United States, 2011–2014
Number of Standard Percentile examined error of
Race and Hispanic origin and age persons Mean the mean 5th 10th 15th 25th 50th 75th 85th 90th 95th
All racial and Hispanic-origin groups1 Kilograms
20 years and over . . . . . . . . . . . . . . . 5,425 76.4 0.42 50.1 54.3 57.5 61.7 72.1 86.7 96.2 104.0 116.5 20–29 years . . . . . . . . . . . . . . . . . 853 73.4 0.85 48.6 51.7 54.3 58.4 67.9 83.7 96.5 103.7 115.8 30–39 years . . . . . . . . . . . . . . . . . 915 78.4 0.87 52.1 56.3 58.4 62.5 72.8 88.9 98.9 107.8 122.1 40–49 years . . . . . . . . . . . . . . . . . 979 78.5 1.00 52.5 56.6 59.3 63.0 74.4 89.3 98.8 107.6 118.5 50–59 years . . . . . . . . . . . . . . . . . 923 79.1 1.05 52.3 56.6 58.6 64.0 75.9 89.5 99.5 108.6 123.1 60–69 years . . . . . . . . . . . . . . . . . 889 76.6 0.90 49.0 55.6 58.8 63.7 74.6 86.7 93.8 102.0 111.4 70–79 years . . . . . . . . . . . . . . . . . 527 75.2 0.94 49.1 54.5 58.1 62.9 71.9 85.5 93.3 98.2 108.0 80 years and over . . . . . . . . . . . . . 339 64.4 0.74 44.0 47.1 50.2 55.2 64.0 72.8 78.2 81.8 86.5
Non-Hispanic white
20 years and over . . . . . . . . . . . . . . . 2,157 76.4 0.54 50.9 55.4 57.9 62.3 72.0 86.3 94.9 102.7 116.2 20–39 years . . . . . . . . . . . . . . . . . 649 76.2 0.86 51.1 54.3 57.2 60.8 70.7 85.7 97.5 104.7 116.4 40–59 years . . . . . . . . . . . . . . . . . 686 78.7 0.96 53.5 57.6 59.6 63.9 75.4 88.6 98.8 107.7 120.2 60 years and over . . . . . . . . . . . . . 822 73.9 0.83 47.9 53.1 57.1 61.8 71.2 83.2 91.2 97.6 107.2
Non-Hispanic black
20 years and over . . . . . . . . . . . . . . . 1,264 86.3 0.69 54.9 59.7 63.7 69.9 83.1 98.8 109.0 116.5 128.7 20–39 years . . . . . . . . . . . . . . . . . 380 86.2 1.25 52.3 58.8 62.1 68.5 83.1 99.3 110.4 119.4 129.2 40–59 years . . . . . . . . . . . . . . . . . 481 89.1 1.12 58.3 63.5 67.3 72.2 85.0 101.4 111.7 117.8 130.0 60 years and over . . . . . . . . . . . . . 403 81.6 1.08 50.3 57.2 61.1 66.8 79.2 94.7 102.8 106.6 118.3
Non-Hispanic Asian
20 years and over . . . . . . . . . . . . . . . 691 59.6 0.58 45.3 47.4 48.9 51.3 57.6 65.1 71.0 74.5 80.8 20–39 years . . . . . . . . . . . . . . . . . 258 58.3 0.71 45.4 47.3 48.4 50.1 55.5 62.4 71.1 73.1 79.1 40–59 years . . . . . . . . . . . . . . . . . 267 61.8 0.91 46.1 48.9 50.0 52.6 59.1 68.4 73.8 77.6 84.6 60 years and over . . . . . . . . . . . . . 166 58.2 0.88 43.2 46.2 48.1 51.1 58.7 64.3 67.8 69.5 72.2
Hispanic2
20 years and over . . . . . . . . . . . . . . . 1,166 74.7 0.63 51.3 55.0 56.9 61.5 71.4 84.4 93.3 99.4 109.3 20–39 years . . . . . . . . . . . . . . . . . 408 74.2 1.21 50.9 54.8 56.7 61.1 69.4 82.8 93.7 100.1 111.4 40–59 years . . . . . . . . . . . . . . . . . 417 76.7 0.96 53.0 55.7 57.9 62.9 74.2 87.0 95.2 100.6 109.4 60 years and over . . . . . . . . . . . . . 341 71.8 0.80 48.3 51.9 55.5 60.1 69.9 81.6 88.5 92.9 99.7
Mexican American
20 years and over . . . . . . . . . . . . . . . 611 76.0 0.84 51.9 55.6 58.0 62.4 72.5 85.9 94.6 100.7 111.2 20–39 years . . . . . . . . . . . . . . . . . 238 75.0 1.56 51.8 55.7 57.6 61.5 70.5 82.9 93.9 102.5 114.5 40–59 years . . . . . . . . . . . . . . . . . 220 78.5 1.13 54.5 56.7 59.9 64.3 76.7 89.1 96.7 101.6 110.2 60 years and over . . . . . . . . . . . . . 153 *73.4 1.10 *47.8 *51.2 *54.4 *62.6 *70.4 *85.4 *91.2 *94.9 *102.5
* Estimate does not meet standards of reliability or precision based on less than 12 degrees of freedom. 1Includes persons of other races. 2Includes Mexican-American persons.
NOTE: Data exclude pregnant females.
SOURCE: NCHS, National Health and Nutrition Examination Survey.

Page 8 [ Series 3, No. 39
Table 4. Weight in pounds for females aged 20 and over and number of examined persons, mean, standard error of the mean, and selected percentiles, by race and Hispanic origin and age: United States, 2011–2014
Number of Standard Percentile examined error of
Race and Hispanic origin and age persons Mean the mean 5th 10th 15th 25th 50th 75th 85th 90th 95th
All racial and Hispanic-origin groups1 Pounds
20 years and over . . . . . . . . . . . . . . . 5,425 168.5 0.92 110.5 119.8 126.8 136.0 159.1 191.1 212.2 229.3 256.8 20–29 years . . . . . . . . . . . . . . . . . 853 161.8 1.88 107.2 113.9 119.7 128.8 149.8 184.6 212.8 228.7 255.2 30–39 years . . . . . . . . . . . . . . . . . 915 172.9 1.92 114.9 124.0 128.7 137.7 160.5 195.9 218.1 237.7 269.2 40–49 years . . . . . . . . . . . . . . . . . 979 173.1 2.21 115.6 124.8 130.7 138.8 164.0 196.8 217.7 237.2 261.3 50–59 years . . . . . . . . . . . . . . . . . 923 174.4 2.31 115.2 124.9 129.2 141.0 167.4 197.2 219.4 239.4 271.3 60–69 years . . . . . . . . . . . . . . . . . 889 168.8 1.98 107.9 122.5 129.6 140.3 164.4 191.2 206.8 224.8 245.6 70–79 years . . . . . . . . . . . . . . . . . 527 165.8 2.08 108.2 120.2 128.1 138.6 158.5 188.5 205.8 216.5 238.2 80 years and over . . . . . . . . . . . . . 339 141.9 1.64 96.9 103.8 110.7 121.7 141.0 160.6 172.4 180.4 190.6
Non-Hispanic white
20 years and over . . . . . . . . . . . . . . . 2,157 168.4 1.19 112.2 122.2 127.7 137.4 158.7 190.3 209.1 226.5 256.1 20–39 years . . . . . . . . . . . . . . . . . 649 167.9 1.90 112.6 119.8 126.1 134.0 155.9 189.0 215.0 230.8 256.7 40–59 years . . . . . . . . . . . . . . . . . 686 173.4 2.12 118.0 127.0 131.3 140.9 166.1 195.4 217.8 237.5 265.0 60 years and over . . . . . . . . . . . . . 822 162.9 1.83 105.7 117.0 125.9 136.2 157.0 183.4 201.1 215.3 236.2
Non-Hispanic black
20 years and over . . . . . . . . . . . . . . . 1,264 190.2 1.52 121.0 131.6 140.4 154.0 183.1 217.8 240.3 256.8 283.7 20–39 years . . . . . . . . . . . . . . . . . 380 190.0 2.76 115.2 129.6 137.0 151.0 183.1 219.0 243.4 263.3 284.8 40–59 years . . . . . . . . . . . . . . . . . 481 196.5 2.47 128.6 140.0 148.4 159.2 187.3 223.5 246.2 259.6 286.5 60 years and over . . . . . . . . . . . . . 403 179.9 2.39 111.0 126.0 134.8 147.2 174.7 208.9 226.6 235.1 260.7
Non-Hispanic Asian
20 years and over . . . . . . . . . . . . . . . 691 131.4 1.28 99.8 104.6 107.8 113.0 127.0 143.6 156.5 164.2 178.2 20–39 years . . . . . . . . . . . . . . . . . 258 128.6 1.56 100.1 104.2 106.6 110.5 122.4 137.5 156.7 161.0 174.3 40–59 years . . . . . . . . . . . . . . . . . 267 136.3 2.01 101.6 107.8 110.2 115.9 130.4 150.8 162.7 171.2 186.5 60 years and over . . . . . . . . . . . . . 166 128.2 1.93 95.3 101.9 106.0 112.6 129.3 141.7 149.4 153.3 159.1
Hispanic2
20 years and over . . . . . . . . . . . . . . . 1,166 164.7 1.39 113.1 121.3 125.4 135.5 157.4 186.2 205.7 219.2 241.0 20–39 years . . . . . . . . . . . . . . . . . 408 163.5 2.66 112.3 120.7 125.0 134.8 152.9 182.5 206.6 220.7 245.5 40–59 years . . . . . . . . . . . . . . . . . 417 169.1 2.11 116.8 122.7 127.7 138.6 163.6 191.8 209.8 221.7 241.1 60 years and over . . . . . . . . . . . . . 341 158.3 1.76 106.4 114.4 122.5 132.5 154.0 179.9 195.0 204.8 219.7
Mexican American
20 years and over . . . . . . . . . . . . . . . 611 167.6 1.86 114.4 122.6 127.8 137.5 159.8 189.4 208.6 222.0 245.1 20–39 years . . . . . . . . . . . . . . . . . 238 165.3 3.45 114.1 122.7 127.0 135.7 155.5 182.7 207.1 226.0 252.5 40–59 years . . . . . . . . . . . . . . . . . 220 173.0 2.49 120.2 124.9 132.2 141.8 169.0 196.5 213.1 223.9 243.0 60 years and over . . . . . . . . . . . . . 153 *161.9 2.42 *105.4 *113.0 *120.0 *138.0 *155.2 *188.3 *201.0 *209.3 *225.9
* Estimate does not meet standards of reliability or precision based on less than 12 degrees of freedom. 1Includes persons of other races. 2Includes Mexican-American persons.
NOTE: Data exclude pregnant females.
SOURCE: NCHS, National Health and Nutrition Examination Survey.
Series 3, No. 39 [ Page 9
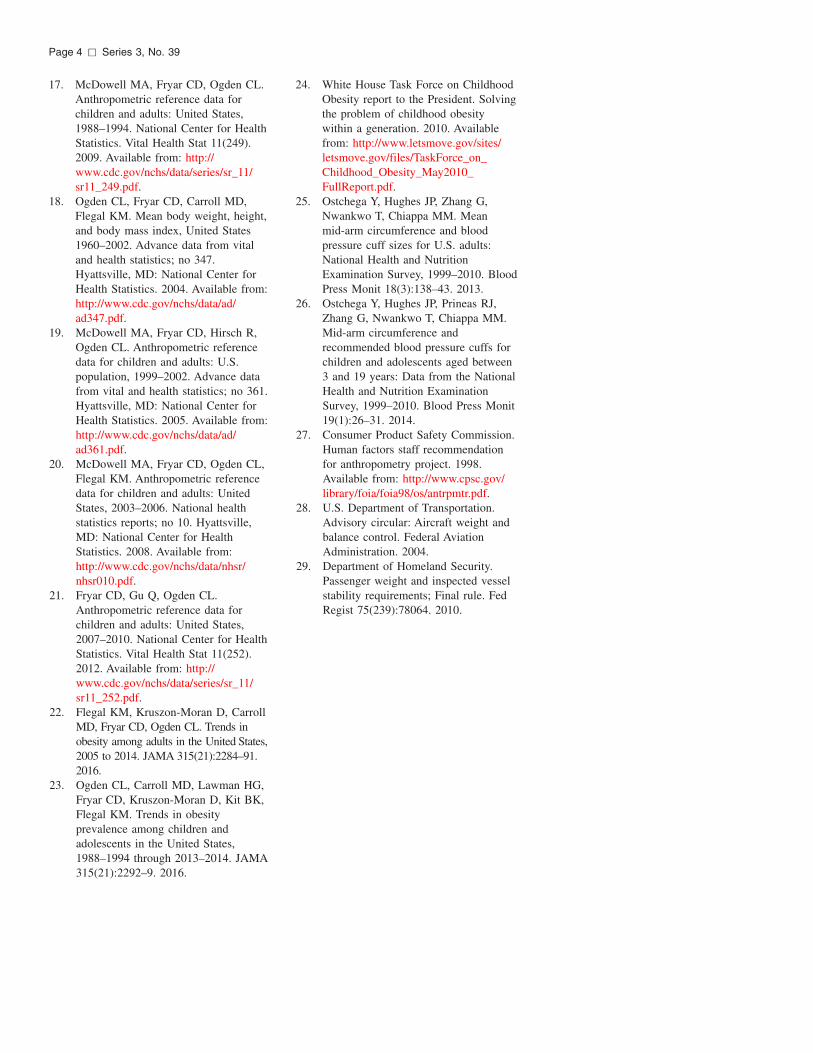
Table 5. Weight in kilograms for males aged 20 and over and number of examined persons, mean, standard error of the mean, and selected percentiles, by race and Hispanic origin and age: United States, 2011–2014
Race and Hispanic origin and age
Number of examined persons Mean
Standard error of
the mean 5th 10th 15th 25th
Percentile
50th 75th 85th 90th 95th
All racial and Hispanic-origin groups1 Kilograms
20 years and over . . . . . . . . . . . . . . . 5,236 88.8 0.43 62.0 66.3 69.9 74.9 85.9 99.2 107.4 113.3 124.9 20–29 years . . . . . . . . . . . . . . . . . 936 84.7 1.18 57.3 62.4 65.3 69.4 80.7 94.6 105.3 112.1 127.4 30–39 years . . . . . . . . . . . . . . . . . 914 90.2 0.78 63.6 68.1 71.7 76.2 86.6 100.3 110.2 117.7 127.9 40–49 years . . . . . . . . . . . . . . . . . 872 91.5 0.73 66.3 70.9 73.9 77.9 89.1 100.9 107.6 113.0 126.6 50–59 years . . . . . . . . . . . . . . . . . 854 90.5 0.92 63.5 69.0 72.6 77.2 88.8 100.8 107.4 113.6 126.7 60–69 years . . . . . . . . . . . . . . . . . 874 90.6 1.37 62.5 66.7 70.0 76.2 88.6 101.2 110.8 115.8 126.6 70–79 years . . . . . . . . . . . . . . . . . 486 85.8 0.92 61.9 66.3 69.2 75.6 83.3 96.1 103.0 107.2 114.1 80 years and over . . . . . . . . . . . . . 300 79.2 0.86 56.8 60.1 64.1 69.9 77.6 88.2 94.0 98.0 105.9
Non-Hispanic white
20 years and over . . . . . . . . . . . . . . . 2,099 90.2 0.56 63.9 68.8 72.1 76.7 87.5 100.4 107.9 113.6 124.8 20–39 years . . . . . . . . . . . . . . . . . 715 87.9 1.24 62.0 65.7 68.8 73.3 83.2 99.1 107.8 115.7 128.0 40–59 years . . . . . . . . . . . . . . . . . 655 92.8 0.94 68.2 73.1 75.1 79.7 90.4 102.3 107.9 113.6 127.6 60 years and over . . . . . . . . . . . . . 729 89.2 0.96 62.7 67.6 71.3 76.6 86.3 99.5 108.0 113.0 120.1
Non-Hispanic black
20 years and over . . . . . . . . . . . . . . . 1,222 90.4 0.73 59.0 64.1 67.8 73.2 86.9 103.1 112.0 119.9 133.9 20–39 years . . . . . . . . . . . . . . . . . 404 89.7 1.39 56.8 62.9 65.9 71.6 85.7 103.4 112.9 119.8 137.3 40–59 years . . . . . . . . . . . . . . . . . 396 92.9 1.20 59.4 66.7 70.2 77.0 89.2 105.0 114.2 122.6 135.8 60 years and over . . . . . . . . . . . . . 422 86.8 1.30 60.1 64.1 67.0 72.0 84.2 97.3 106.0 114.2 123.3
Non-Hispanic Asian
20 years and over . . . . . . . . . . . . . . . 665 73.0 0.49 53.7 58.6 60.6 64.5 71.3 79.8 85.6 89.4 97.9 20–39 years . . . . . . . . . . . . . . . . . 260 74.9 0.98 53.1 58.8 60.6 63.9 72.4 82.4 89.7 95.9 100.8 40–59 years . . . . . . . . . . . . . . . . . 247 73.2 0.56 55.3 59.7 62.1 66.5 72.1 81.0 83.1 87.1 90.2 60 years and over . . . . . . . . . . . . . 158 68.5 0.86 48.5 56.5 58.1 61.5 68.1 74.0 77.7 80.1 †
Hispanic2
20 years and over . . . . . . . . . . . . . . . 1,089 86.1 0.90 60.9 64.9 68.3 73.3 83.8 94.9 103.1 108.9 120.2 20–39 years . . . . . . . . . . . . . . . . . 385 87.2 1.30 60.5 64.6 67.7 72.9 84.4 97.1 106.4 110.6 124.2 40–59 years . . . . . . . . . . . . . . . . . 381 86.2 1.11 62.2 66.8 70.6 75.3 84.7 94.0 100.5 105.3 116.4 60 years and over . . . . . . . . . . . . . 323 81.3 1.05 59.7 63.5 65.0 69.6 79.6 89.9 96.1 102.7 110.6
Mexican American
20 years and over . . . . . . . . . . . . . . . 628 87.1 0.93 62.2 65.7 69.8 73.8 84.8 95.8 104.9 109.8 122.7 20–39 years . . . . . . . . . . . . . . . . . 233 88.2 1.54 62.3 65.2 69.4 73.5 86.6 98.2 107.6 111.5 129.0 40–59 years . . . . . . . . . . . . . . . . . 228 86.4 1.37 61.2 66.1 70.8 75.8 84.7 94.1 100.7 107.4 116.6 60 years and over . . . . . . . . . . . . . 167 84.0 1.31 59.8 65.0 67.4 72.8 81.0 92.7 99.2 106.1 111.5
† Estimate not shown because the standard error could not be calculated due to small sample size. 1Includes persons of other races. 2Includes Mexican-American persons.
SOURCE: NCHS, National Health and Nutrition Examination Survey.

Page 10 [ Series 3, No. 39
Table 6. Weight in pounds for males aged 20 and over and number of examined persons, mean, standard error of the mean, and selected percentiles, by race and Hispanic origin and age: United States, 2011–2014
Race and Hispanic origin and age
Number of examined persons Mean
Standard error of
the mean 5th 10th 15th 25th
Percentile
50th 75th 85th 90th 95th
All racial and Hispanic-origin groups1 Pounds
20 years and over . . . . . . . . . . . . 5,236 195.7 0.94 136.7 146.2 154.2 165.1 189.3 218.8 236.7 249.9 275.4 20–29 years . . . . . . . . . . . . . . 936 186.8 2.60 126.2 137.6 143.9 152.9 177.8 208.5 232.1 247.2 280.8 30–39 years . . . . . . . . . . . . . . 914 198.8 1.73 140.2 150.2 158.2 168.1 190.8 221.2 242.8 259.6 281.9 40–49 years . . . . . . . . . . . . . . 872 201.7 1.60 146.2 156.3 162.9 171.7 196.4 222.5 237.2 249.0 279.2 50–59 years . . . . . . . . . . . . . . 854 199.5 2.03 140.0 152.0 160.0 170.2 195.9 222.3 236.9 250.4 279.4 60–69 years . . . . . . . . . . . . . . 874 199.7 3.02 137.9 147.0 154.3 168.0 195.3 223.1 244.2 255.3 279.2 70–79 years . . . . . . . . . . . . . . 486 189.3 2.03 136.5 146.2 152.6 166.6 183.6 212.0 227.0 236.3 251.5 80 years and over . . . . . . . . . . . 300 174.6 1.90 125.2 132.6 141.4 154.2 171.1 194.5 207.1 216.1 233.5
Non-Hispanic white
20 years and over . . . . . . . . . . . . 2,099 198.8 1.23 140.9 151.6 158.9 169.1 192.9 221.4 237.9 250.5 275.2 20–39 years . . . . . . . . . . . . . . 715 193.8 2.72 136.6 144.9 151.6 161.7 183.5 218.5 237.7 255.0 282.3 40–59 years . . . . . . . . . . . . . . 655 204.6 2.07 150.4 161.2 165.5 175.7 199.3 225.5 237.8 250.4 281.3 60 years and over . . . . . . . . . . . 729 196.5 2.11 138.2 149.0 157.2 168.9 190.2 219.3 238.1 249.2 264.8
Non-Hispanic black
20 years and over . . . . . . . . . . . . 1,222 199.3 1.61 130.0 141.4 149.4 161.4 191.6 227.2 247.0 264.4 295.2 20–39 years . . . . . . . . . . . . . . 404 197.7 3.07 125.2 138.6 145.4 157.9 189.0 228.0 248.9 264.2 302.6 40–59 years . . . . . . . . . . . . . . 396 204.8 2.64 130.9 147.0 154.8 169.8 196.6 231.4 251.8 270.3 299.5 60 years and over . . . . . . . . . . . 422 191.4 2.86 132.6 141.2 147.8 158.8 185.5 214.4 233.7 251.9 271.8
Non-Hispanic Asian
20 years and over . . . . . . . . . . . . 665 161.0 1.09 118.5 129.1 133.6 142.1 157.2 175.9 188.8 197.0 215.8 20–39 years . . . . . . . . . . . . . . 260 165.0 2.15 117.1 129.6 133.5 140.9 159.6 181.6 197.8 211.5 222.2 40–59 years . . . . . . . . . . . . . . 247 161.3 1.23 122.0 131.7 137.0 146.6 158.9 178.6 183.2 192.0 198.8 60 years and over . . . . . . . . . . . 158 151.1 1.89 106.8 124.6 128.0 135.7 150.1 163.2 171.2 176.6 †
Hispanic2
20 years and over . . . . . . . . . . . . 1,089 189.9 1.98 134.2 143.1 150.6 161.6 184.7 209.1 227.3 240.0 264.9 20–39 years . . . . . . . . . . . . . . 385 192.2 2.87 133.4 142.3 149.2 160.7 186.0 214.1 234.6 243.9 273.7 40–59 years . . . . . . . . . . . . . . 381 190.1 2.44 137.2 147.2 155.5 166.0 186.8 207.2 221.6 232.2 256.6 60 years and over . . . . . . . . . . . 323 179.3 2.32 131.6 140.1 143.3 153.3 175.4 198.3 211.8 226.5 243.9
Mexican American
20 years and over . . . . . . . . . . . . 628 192.1 2.06 137.1 144.9 153.8 162.7 186.9 211.1 231.2 242.1 270.6 20–39 years . . . . . . . . . . . . . . 233 194.6 3.40 137.3 143.8 153.0 162.1 190.8 216.5 237.2 245.8 284.4 40–59 years . . . . . . . . . . . . . . 228 190.5 3.01 134.8 145.8 156.1 167.1 186.8 207.5 222.0 236.8 257.1 60 years and over . . . . . . . . . . . 167 185.1 2.90 131.8 143.3 148.6 160.6 178.6 204.4 218.8 234.0 245.8
† Estimate not shown because the standard error could not be computed due to small sample size. 1Includes persons of other races. 2Includes Mexican-American persons.
SOURCE: NCHS, National Health and Nutrition Examination Survey.
Series 3, No. 39 [ Page 11
Table 7. Height in centimeters for children and adolescents aged 2–19 years and number of examined persons, mean, standard error of the mean, and selected percentiles, by sex and age: United States, 2011–2014
Sex and age1
Number of examined persons Mean
Standard error of
the mean 5th 10th 15th 25th
Percentile
50th 75th 85th 90th 95th
Male Centimeters
2 years . . . . . . . . . . . . . . . . . . . 220 92.2 0.46 85.1 86.7 87.6 88.7 92.4 95.4 96.6 97.5 †
3 years . . . . . . . . . . . . . . . . . . . 225 99.0 0.35 91.4 92.7 94.8 95.6 99.1 101.9 103.9 104.7 107.6 4 years . . . . . . . . . . . . . . . . . . . 229 106.7 0.38 99.3 100.9 102.2 102.8 106.5 110.3 111.5 112.4 114.1 5 years . . . . . . . . . . . . . . . . . . . 195 113.8 0.54 105.8 107.1 108.5 110.7 113.0 117.6 119.7 120.8 121.9 6 years . . . . . . . . . . . . . . . . . . . 246 120.0 0.49 112.0 113.3 114.5 115.9 120.1 123.4 125.7 126.6 129.3 7 years . . . . . . . . . . . . . . . . . . . 231 126.4 0.49 116.0 118.7 119.9 121.9 126.7 130.7 133.0 134.0 136.5 8 years . . . . . . . . . . . . . . . . . . . 227 131.7 0.62 119.9 123.8 124.9 127.5 131.4 135.8 139.3 140.7 142.5 9 years . . . . . . . . . . . . . . . . . . . 218 136.5 0.58 127.1 127.8 130.6 132.2 135.6 140.4 143.3 145.0 †
10 years . . . . . . . . . . . . . . . . . . 207 143.0 0.67 130.5 133.4 135.3 137.9 143.0 147.4 149.1 150.4 153.1 11 years . . . . . . . . . . . . . . . . . . 186 150.3 0.79 138.3 140.0 141.9 144.3 149.0 155.4 159.9 162.3 †
12 years . . . . . . . . . . . . . . . . . . . 181 155.8 0.78 143.3 145.9 147.7 150.5 155.6 161.2 163.5 164.9 168.5 13 years . . . . . . . . . . . . . . . . . . . 175 163.4 0.81 146.7 151.5 153.5 157.8 163.9 168.7 172.3 173.6 175.6 14 years . . . . . . . . . . . . . . . . . . 184 169.4 0.78 153.6 159.4 162.2 165.4 169.0 173.9 178.2 179.5 †
15 years . . . . . . . . . . . . . . . . . . 156 173.4 0.71 163.2 164.0 165.4 168.4 173.8 176.8 179.9 181.6 187.0 16 years . . . . . . . . . . . . . . . . . . . 178 173.9 0.60 162.6 166.0 167.6 169.8 174.5 177.6 179.5 182.3 185.4 17 years . . . . . . . . . . . . . . . . . . 147 174.9 1.02 161.5 164.1 165.7 168.6 174.8 180.3 184.5 187.8 190.4 18 years . . . . . . . . . . . . . . . . . . 160 175.6 0.85 162.7 164.7 166.8 169.8 175.3 181.1 183.3 185.5 187.0 19 years . . . . . . . . . . . . . . . . . . 144 176.3 1.12 † 166.1 168.6 170.8 175.9 181.2 183.5 185.4 †
Female
2 years . . . . . . . . . . . . . . . . . . . 264 90.0 0.27 83.6 84.4 85.7 87.0 89.5 92.6 94.8 95.9 97.2 3 years . . . . . . . . . . . . . . . . . . . 199 98.1 0.32 91.0 92.8 94.5 95.6 97.8 100.7 102.4 103.3 104.8 4 years . . . . . . . . . . . . . . . . . . . 206 105.8 0.40 97.0 99.6 100.4 102.5 106.0 109.0 110.4 111.9 113.1 5 years . . . . . . . . . . . . . . . . . . . 178 112.3 0.54 103.2 104.5 106.2 107.9 111.9 115.9 118.8 120.5 122.3 6 years . . . . . . . . . . . . . . . . . . . 216 118.7 0.43 110.0 112.0 113.2 114.5 118.6 122.6 124.4 125.4 127.7 7 years . . . . . . . . . . . . . . . . . . . 211 124.5 0.46 114.8 117.2 118.5 121.1 123.7 128.1 131.2 132.6 134.7 8 years . . . . . . . . . . . . . . . . . . . 197 131.7 0.47 121.1 123.4 124.5 127.1 131.4 136.1 138.7 140.7 142.8 9 years . . . . . . . . . . . . . . . . . . . 206 137.7 0.61 127.4 130.0 131.1 133.4 137.5 142.0 143.7 145.5 149.3 10 years . . . . . . . . . . . . . . . . . . 187 144.3 0.77 131.5 135.4 137.0 139.4 143.1 149.1 152.0 155.8 †
11 years . . . . . . . . . . . . . . . . . . 230 150.7 0.63 135.9 141.4 143.1 146.4 151.2 155.2 157.3 160.0 162.1 12 years . . . . . . . . . . . . . . . . . . . 166 156.2 0.69 143.4 145.6 149.2 151.4 156.2 160.9 164.1 165.1 167.0 13 years . . . . . . . . . . . . . . . . . . . 160 158.5 0.59 148.4 151.2 152.3 155.2 158.5 161.9 164.8 166.3 169.2 14 years . . . . . . . . . . . . . . . . . . 169 160.3 0.54 149.9 152.2 153.2 156.4 161.1 164.2 166.0 167.8 168.5 15 years . . . . . . . . . . . . . . . . . . 150 161.1 0.76 149.1 150.2 153.8 156.5 161.7 166.0 167.7 169.5 170.8 16 years . . . . . . . . . . . . . . . . . . . 187 162.3 0.70 152.6 154.5 155.6 157.3 161.7 166.7 169.9 172.1 173.1 17 years . . . . . . . . . . . . . . . . . . 140 162.5 0.51 153.6 154.6 156.3 158.3 162.9 165.4 168.3 170.8 172.7 18 years . . . . . . . . . . . . . . . . . . 154 161.7 0.57 151.3 152.8 155.1 156.7 162.4 166.1 167.7 168.9 170.6 19 years . . . . . . . . . . . . . . . . . . 152 163.0 0.40 152.8 153.7 155.8 159.3 163.5 167.8 169.5 170.1 171.9
† Estimate not shown because the standard error could not be computed due to small sample size. 1Age at time of examination.
SOURCE: NCHS, National Health and Nutrition Examination Survey.

Page 12 [ Series 3, No. 39
Table 8. Height in inches for children and adolescents aged 2–19 years and number of examined persons, mean, standard error of the mean, and selected percentiles, by sex and age: United States, 2011–2014
Sex and age1
Number of examined persons Mean
Standard error of
the mean 5th 10th 15th 25th
Percentile
50th 75th 85th 90th 95th
Male Inches
2 years . . . . . . . . . . . . . . . . . . . 220 36.3 0.18 33.5 34.1 34.5 34.9 36.4 37.6 38.0 38.4 †
3 years . . . . . . . . . . . . . . . . . . . 225 39.0 0.14 36.0 36.5 37.3 37.6 39.0 40.1 40.9 41.2 42.4 4 years . . . . . . . . . . . . . . . . . . . 229 42.0 0.15 39.1 39.7 40.3 40.5 41.9 43.4 43.9 44.2 44.9 5 years . . . . . . . . . . . . . . . . . . . 195 44.8 0.21 41.6 42.2 42.7 43.6 44.5 46.3 47.1 47.6 48.0 6 years . . . . . . . . . . . . . . . . . . . 246 47.2 0.19 44.1 44.6 45.1 45.6 47.3 48.6 49.5 49.8 50.9 7 years . . . . . . . . . . . . . . . . . . . 231 49.8 0.19 45.7 46.7 47.2 48.0 49.9 51.5 52.4 52.7 53.8 8 years . . . . . . . . . . . . . . . . . . . 227 51.9 0.24 47.2 48.7 49.2 50.2 51.7 53.4 54.8 55.4 56.1 9 years . . . . . . . . . . . . . . . . . . . 218 53.7 0.23 50.0 50.3 51.4 52.1 53.4 55.3 56.4 57.1 †
10 years . . . . . . . . . . . . . . . . . . 207 56.3 0.26 51.4 52.5 53.3 54.3 56.3 58.0 58.7 59.2 60.3 11 years . . . . . . . . . . . . . . . . . . 186 59.2 0.31 54.5 55.1 55.9 56.8 58.7 61.2 63.0 63.9 †
12 years . . . . . . . . . . . . . . . . . . . 181 61.4 0.31 56.4 57.4 58.1 59.3 61.2 63.5 64.4 64.9 66.3 13 years . . . . . . . . . . . . . . . . . . . 175 64.3 0.32 57.8 59.7 60.4 62.1 64.5 66.4 67.8 68.3 69.1 14 years . . . . . . . . . . . . . . . . . . 184 66.7 0.31 60.5 62.7 63.8 65.1 66.5 68.5 70.2 70.7 †
15 years . . . . . . . . . . . . . . . . . . 156 68.3 0.28 64.2 64.6 65.1 66.3 68.4 69.6 70.8 71.5 73.6 16 years . . . . . . . . . . . . . . . . . . . 178 68.5 0.24 64.0 65.4 66.0 66.9 68.7 69.9 70.7 71.8 73.0 17 years . . . . . . . . . . . . . . . . . . 147 68.9 0.40 63.6 64.6 65.3 66.4 68.8 71.0 72.6 73.9 75.0 18 years . . . . . . . . . . . . . . . . . . 160 69.1 0.33 64.1 64.8 65.7 66.9 69.0 71.3 72.2 73.0 73.6 19 years . . . . . . . . . . . . . . . . . . 144 69.4 0.44 64.0 65.4 66.4 67.2 69.3 71.3 72.2 73.0 †
Female
2 years . . . . . . . . . . . . . . . . . . . 264 35.4 0.11 32.9 33.2 33.8 34.3 35.2 36.5 37.3 37.7 38.2 3 years . . . . . . . . . . . . . . . . . . . 199 38.6 0.13 35.8 36.5 37.2 37.6 38.5 39.6 40.3 40.7 41.3 4 years . . . . . . . . . . . . . . . . . . . 206 41.7 0.16 38.2 39.2 39.5 40.4 41.7 42.9 43.5 44.1 44.5 5 years . . . . . . . . . . . . . . . . . . . 178 44.2 0.21 40.6 41.1 41.8 42.5 44.0 45.6 46.8 47.4 48.2 6 years . . . . . . . . . . . . . . . . . . . 216 46.7 0.17 43.3 44.1 44.6 45.1 46.7 48.3 49.0 49.4 50.3 7 years . . . . . . . . . . . . . . . . . . . 211 49.0 0.18 45.2 46.1 46.7 47.7 48.7 50.4 51.6 52.2 53.0 8 years . . . . . . . . . . . . . . . . . . . 197 51.8 0.18 47.7 48.6 49.0 50.0 51.7 53.6 54.6 55.4 56.2 9 years . . . . . . . . . . . . . . . . . . . 206 54.2 0.24 50.2 51.2 51.6 52.5 54.1 55.9 56.6 57.3 58.8 10 years . . . . . . . . . . . . . . . . . . 187 56.8 0.30 51.8 53.3 54.0 54.9 56.3 58.7 59.8 61.3 †
11 years . . . . . . . . . . . . . . . . . . 230 59.3 0.25 53.5 55.7 56.3 57.6 59.5 61.1 61.9 63.0 63.8 12 years . . . . . . . . . . . . . . . . . . . 166 61.5 0.27 56.5 57.3 58.7 59.6 61.5 63.4 64.6 65.0 65.8 13 years . . . . . . . . . . . . . . . . . . . 160 62.4 0.23 58.4 59.5 60.0 61.1 62.4 63.7 64.9 65.5 66.6 14 years . . . . . . . . . . . . . . . . . . 169 63.1 0.21 59.0 59.9 60.3 61.6 63.4 64.6 65.3 66.1 66.3 15 years . . . . . . . . . . . . . . . . . . 150 63.4 0.30 58.7 59.1 60.6 61.6 63.6 65.4 66.0 66.8 67.2 16 years . . . . . . . . . . . . . . . . . . . 187 63.9 0.28 60.1 60.8 61.3 61.9 63.7 65.6 66.9 67.7 68.1 17 years . . . . . . . . . . . . . . . . . . 140 64.0 0.20 60.5 60.9 61.5 62.3 64.1 65.1 66.2 67.3 68.0 18 years . . . . . . . . . . . . . . . . . . 154 63.6 0.22 59.6 60.1 61.0 61.7 63.9 65.4 66.0 66.5 67.2 19 years . . . . . . . . . . . . . . . . . . 152 64.2 0.16 60.1 60.5 61.4 62.7 64.4 66.1 66.7 67.0 67.7
† Estimate not shown because the standard error could not be computed due to small sample size. 1Age at time of examination.
SOURCE: NCHS, National Health and Nutrition Examination Survey.

Series 3, No. 39 [ Page 13
Table 9. Height in centimeters for females aged 20 and over and number of examined persons, mean, standard error of the mean, and selected percentiles, by race and Hispanic origin and age: United States, 2011–2014
Number of Standard Percentile examined error of
Race and Hispanic origin and age persons Mean the mean 5th 10th 15th 25th 50th 75th 85th 90th 95th
All racial and Hispanic-origin groups1 Centimeters
20 years and over . . . . . . . . . . . . 5,547 161.8 0.21 149.8 152.7 154.3 156.8 161.9 166.4 169.0 170.7 173.5 20–29 years . . . . . . . . . . . . . . 928 162.9 0.30 151.9 154.4 156.0 158.4 162.9 167.2 169.1 171.1 174.2 30–39 years . . . . . . . . . . . . . . 957 163.4 0.30 151.2 153.8 155.6 158.3 163.6 168.6 170.9 172.5 175.3 40–49 years . . . . . . . . . . . . . . 987 162.9 0.31 150.9 153.7 155.4 158.1 163.0 167.3 169.8 171.7 174.4 50–59 years . . . . . . . . . . . . . . 924 161.9 0.37 150.9 152.9 154.7 156.9 162.2 165.9 168.5 170.5 173.2 60–69 years . . . . . . . . . . . . . . 888 160.5 0.37 149.9 152.5 153.6 156.1 160.5 164.7 167.0 168.8 171.9 70–79 years . . . . . . . . . . . . . . 527 159.3 0.35 147.5 150.3 152.0 154.5 160.0 163.8 166.0 167.9 170.3 80 years and over . . . . . . . . . . . 336 155.6 0.37 144.6 146.4 148.1 151.5 155.7 160.2 161.8 163.4 166.4
Non-Hispanic white
20 years and over . . . . . . . . . . . . 2,199 162.9 0.23 151.7 154.0 155.7 158.3 162.9 167.2 169.7 171.5 174.4 20–39 years . . . . . . . . . . . . . . 689 165.0 0.20 154.2 156.6 158.1 160.6 164.8 169.1 171.4 173.3 176.5 40–59 years . . . . . . . . . . . . . . 692 163.7 0.37 152.9 155.1 156.6 159.5 163.5 167.7 170.1 172.2 174.6 60 years and over . . . . . . . . . . . 818 159.9 0.31 148.8 151.6 153.2 155.3 160.1 164.2 166.7 168.3 170.6
Non-Hispanic black
20 years and over . . . . . . . . . . . . 1,302 163.0 0.27 151.4 154.1 155.7 158.8 163.1 167.3 169.6 171.1 173.5 20–39 years . . . . . . . . . . . . . . 418 163.6 0.39 152.5 154.7 156.2 159.7 163.7 167.5 170.0 171.5 174.8 40–59 years . . . . . . . . . . . . . . 482 163.8 0.36 152.8 155.2 157.2 159.7 164.0 167.8 170.4 171.9 174.0 60 years and over . . . . . . . . . . . 402 160.3 0.41 149.4 151.3 153.2 155.8 160.6 164.8 167.0 168.6 170.9
Non-Hispanic Asian
20 years and over . . . . . . . . . . . . 708 157.0 0.35 146.4 148.4 150.2 152.8 156.9 161.0 163.3 165.2 167.1 20–39 years . . . . . . . . . . . . . . 272 158.4 0.45 148.2 150.8 152.3 154.4 158.1 162.2 164.1 166.0 167.9 40–59 years . . . . . . . . . . . . . . 269 157.3 0.37 147.0 148.7 150.7 153.3 157.0 161.7 164.4 165.6 167.9 60 years and over . . . . . . . . . . . 167 153.6 0.48 145.0 145.8 147.5 149.4 153.6 157.4 158.8 160.1 161.8
Hispanic2
20 years and over . . . . . . . . . . . . 1,186 157.5 0.24 146.7 149.0 150.5 153.1 157.3 161.9 164.5 165.8 168.5 20–39 years . . . . . . . . . . . . . . 428 158.9 0.34 147.8 150.4 152.1 154.4 159.1 163.0 165.2 166.4 169.3 40–59 years . . . . . . . . . . . . . . 417 157.3 0.28 147.0 149.1 150.5 152.6 156.6 161.4 164.7 166.2 168.3 60 years and over . . . . . . . . . . . 341 153.9 0.28 144.0 146.0 147.5 150.1 153.9 157.8 160.2 161.6 163.9
Mexican American
20 years and over . . . . . . . . . . . . 620 157.3 0.30 146.7 148.7 150.2 152.5 157.2 161.6 164.3 165.5 168.1 20–39 years . . . . . . . . . . . . . . 247 158.4 0.40 147.5 150.0 151.7 153.6 158.7 162.7 164.9 165.9 169.1 40–59 years . . . . . . . . . . . . . . 220 156.9 0.44 146.6 148.6 149.4 151.8 156.9 161.1 164.1 165.8 167.7 60 years and over . . . . . . . . . . . 153 *153.5 0.42 *143.3 *146.2 *147.6 *150.1 *153.5 *157.1 *159.9 *160.6 *163.8
* Estimate does not meet standards of reliability or precision based on less than 12 degrees of freedom. 1Includes persons of other races. 2Includes Mexican-American persons.
SOURCE: NCHS, National Health and Nutrition Examination Survey.

Page 14 [ Series 3, No. 39
Table 10. Height in inches for females aged 20 and over and number of examined persons, mean, standard error of the mean, and selected percentiles, by race and Hispanic origin and age: United States, 2011–2014
Number of Standard Percentile examined error of
Race and Hispanic origin and age persons Mean the mean 5th 10th 15th 25th 50th 75th 85th 90th 95th
All racial and Hispanic-origin groups1 Inches
20 years and over . . . . . . . . . . . . . . . 5,547 63.7 0.08 59.0 60.1 60.7 61.7 63.7 65.5 66.5 67.2 68.3 20–29 years . . . . . . . . . . . . . . . . . 928 64.1 0.12 59.8 60.8 61.4 62.3 64.1 65.8 66.6 67.4 68.6 30–39 years . . . . . . . . . . . . . . . . . 957 64.3 0.12 59.5 60.5 61.3 62.3 64.4 66.4 67.3 67.9 69.0 40–49 years . . . . . . . . . . . . . . . . . 987 64.1 0.12 59.4 60.5 61.2 62.2 64.2 65.9 66.8 67.6 68.7 50–59 years . . . . . . . . . . . . . . . . . 924 63.7 0.15 59.4 60.2 60.9 61.8 63.9 65.3 66.3 67.1 68.2 60–69 years . . . . . . . . . . . . . . . . . 888 63.2 0.15 59.0 60.1 60.5 61.5 63.2 64.9 65.8 66.5 67.7 70–79 years . . . . . . . . . . . . . . . . . 527 62.7 0.14 58.1 59.2 59.8 60.8 63.0 64.5 65.4 66.1 67.1 80 years and over . . . . . . . . . . . . . 336 61.3 0.15 56.9 57.7 58.3 59.6 61.3 63.1 63.7 64.3 65.5
Non-Hispanic white
20 years and over . . . . . . . . . . . . . . . 2,199 64.1 0.09 59.7 60.6 61.3 62.3 64.1 65.8 66.8 67.5 68.6 20–39 years . . . . . . . . . . . . . . . . . 689 64.9 0.08 60.7 61.7 62.2 63.2 64.9 66.6 67.5 68.2 69.5 40–59 years . . . . . . . . . . . . . . . . . 692 64.4 0.15 60.2 61.1 61.6 62.8 64.4 66.0 67.0 67.8 68.8 60 years and over . . . . . . . . . . . . . 818 63.0 0.12 58.6 59.7 60.3 61.1 63.0 64.7 65.6 66.3 67.2
Non-Hispanic black
20 years and over . . . . . . . . . . . . . . . 1,302 64.2 0.10 59.6 60.7 61.3 62.5 64.2 65.9 66.8 67.4 68.3 20–39 years . . . . . . . . . . . . . . . . . 418 64.4 0.15 60.1 60.9 61.5 62.9 64.4 66.0 66.9 67.5 68.8 40–59 years . . . . . . . . . . . . . . . . . 482 64.5 0.14 60.1 61.1 61.9 62.9 64.6 66.1 67.1 67.7 68.5 60 years and over . . . . . . . . . . . . . 402 63.1 0.16 58.8 59.6 60.3 61.4 63.2 64.9 65.8 66.4 67.3
Non-Hispanic Asian
20 years and over . . . . . . . . . . . . . . . 708 61.8 0.14 57.7 58.4 59.1 60.2 61.8 63.4 64.3 65.0 65.8 20–39 years . . . . . . . . . . . . . . . . . 272 62.4 0.18 58.4 59.4 60.0 60.8 62.2 63.9 64.6 65.4 66.1 40–59 years . . . . . . . . . . . . . . . . . 269 61.9 0.15 57.9 58.6 59.3 60.4 61.8 63.7 64.7 65.2 66.1 60 years and over . . . . . . . . . . . . . 167 60.5 0.19 57.1 57.4 58.1 58.8 60.5 62.0 62.5 63.1 63.7
Hispanic2
20 years and over . . . . . . . . . . . . . . . 1,186 62.0 0.09 57.8 58.7 59.3 60.3 61.9 63.7 64.8 65.3 66.3 20–39 years . . . . . . . . . . . . . . . . . 428 62.6 0.13 58.2 59.2 59.9 60.8 62.6 64.2 65.0 65.5 66.6 40–59 years . . . . . . . . . . . . . . . . . 417 61.9 0.11 57.9 58.7 59.3 60.1 61.6 63.5 64.8 65.4 66.3 60 years and over . . . . . . . . . . . . . 341 60.6 0.11 56.7 57.5 58.1 59.1 60.6 62.1 63.1 63.6 64.5
Mexican American
20 years and over . . . . . . . . . . . . . . . 620 61.9 0.12 57.7 58.6 59.1 60.0 61.9 63.6 64.7 65.2 66.2 20–39 years . . . . . . . . . . . . . . . . . 247 62.4 0.16 58.1 59.1 59.7 60.5 62.5 64.1 64.9 65.3 66.6 40–59 years . . . . . . . . . . . . . . . . . 220 61.8 0.17 57.7 58.5 58.8 59.8 61.8 63.4 64.6 65.3 66.0 60 years and over . . . . . . . . . . . . . 153 *60.5 0.16 *56.4 *57.6 *58.1 *59.1 *60.4 *61.9 *62.9 *63.2 *64.5
* Estimate does not meet standards of reliability or precision based on less than 12 degrees of freedom. 1Includes persons of other races. 2Includes Mexican-American persons.
SOURCE: NCHS, National Health and Nutrition Examination Survey.

Series 3, No. 39 [ Page 15
Table 11. Height in centimeters for males aged 20 and over and number of examined persons, mean, standard error of the mean, and selected percentiles, by race and Hispanic origin and age: United States, 2011–2014
Race and Hispanic origin and age
Number of examined persons Mean
Standard error of
the mean 5th 10th 15th 25th
Percentile
50th 75th 85th 90th 95th
All racial and Hispanic-origin groups1 Centimeters
20 years and over . . . . . . . . . . . . . . . 5,232 175.7 0.21 163.4 166.2 168.0 170.6 175.6 180.8 183.7 185.4 188.1 20–29 years . . . . . . . . . . . . . . . . . 937 176.4 0.26 164.9 166.9 168.5 171.1 176.2 181.3 184.5 186.4 188.8 30–39 years . . . . . . . . . . . . . . . . . 914 176.6 0.30 163.8 167.1 168.8 171.5 176.6 181.6 184.4 186.6 189.1 40–49 years . . . . . . . . . . . . . . . . . 872 176.2 0.42 163.8 166.8 168.5 171.0 176.1 180.9 184.3 185.7 187.7 50–59 years . . . . . . . . . . . . . . . . . 852 176.0 0.50 164.5 166.9 168.5 170.7 175.6 181.3 183.7 185.4 188.5 60–69 years . . . . . . . . . . . . . . . . . 877 175.3 0.46 162.1 165.5 167.4 170.3 175.6 180.8 183.1 184.2 187.4 70–79 years . . . . . . . . . . . . . . . . . 486 173.0 0.32 162.2 164.3 165.4 168.3 172.6 177.4 180.0 182.2 185.2 80 years and over . . . . . . . . . . . . . 294 171.6 0.59 159.7 163.0 164.2 167.5 171.9 176.2 179.0 180.3 182.8
Non-Hispanic white
20 years and over . . . . . . . . . . . . . . . 2,094 177.1 0.27 165.5 168.0 169.7 172.1 176.8 181.7 184.5 186.3 188.9 20–39 years . . . . . . . . . . . . . . . . . 715 178.2 0.27 166.8 169.1 171.0 173.2 178.3 183.3 186.1 187.6 189.6 40–59 years . . . . . . . . . . . . . . . . . 655 177.5 0.43 166.7 168.9 170.3 173.1 177.5 182.0 184.9 186.2 188.9 60 years and over . . . . . . . . . . . . . 724 175.2 0.34 163.9 165.9 167.7 170.2 175.2 180.1 182.7 183.8 187.0
Non-Hispanic black
20 years and over . . . . . . . . . . . . . . . 1,222 176.4 0.29 164.9 167.7 169.1 171.2 175.9 181.4 184.0 186.1 188.8 20–39 years . . . . . . . . . . . . . . . . . 405 177.4 0.31 165.7 168.5 169.8 171.8 177.2 182.7 185.2 187.0 189.8 40–59 years . . . . . . . . . . . . . . . . . 394 176.5 0.48 165.3 167.9 169.4 171.6 176.0 181.3 182.8 185.0 188.0 60 years and over . . . . . . . . . . . . . 423 174.1 0.38 162.5 165.5 167.1 169.5 173.8 178.6 182.4 183.8 186.2
Non-Hispanic Asian
20 years and over . . . . . . . . . . . . . . . 666 170.3 0.41 158.7 161.1 163.1 165.6 170.1 174.6 177.5 179.1 181.3 20–39 years . . . . . . . . . . . . . . . . . 260 172.3 0.38 161.0 163.9 166.0 168.1 172.2 176.6 178.8 180.4 183.0 40–59 years . . . . . . . . . . . . . . . . . 247 170.2 0.55 159.4 161.7 163.4 165.8 170.0 174.4 176.8 178.7 180.9 60 years and over . . . . . . . . . . . . . 159 165.7 0.60 155.0 157.8 159.0 161.6 165.3 169.5 172.1 173.4 177.0
Hispanic2
20 years and over . . . . . . . . . . . . . . . 1,089 171.3 0.25 159.5 161.9 163.7 166.3 170.9 176.0 178.8 180.7 183.4 20–39 years . . . . . . . . . . . . . . . . . 385 172.4 0.29 160.5 163.5 165.3 167.5 172.3 177.3 179.7 181.6 184.3 40–59 years . . . . . . . . . . . . . . . . . 381 170.8 0.46 158.5 161.5 163.1 165.8 170.6 175.4 177.7 180.2 183.5 60 years and over . . . . . . . . . . . . . 323 167.7 0.37 156.7 159.1 160.6 162.9 167.3 171.7 174.5 176.4 179.7
Mexican American
20 years and over . . . . . . . . . . . . . . . 627 171.0 0.31 159.1 162.0 163.7 166.1 170.4 175.8 178.4 180.5 182.8 20–39 years . . . . . . . . . . . . . . . . . 233 172.2 0.43 160.1 163.5 165.2 167.5 172.1 177.1 180.0 181.6 183.5 40–59 years . . . . . . . . . . . . . . . . . 227 169.8 0.52 157.9 160.9 162.3 164.8 169.7 174.4 177.1 178.7 182.5 60 years and over . . . . . . . . . . . . . 167 168.4 0.39 158.2 159.7 161.8 164.4 168.2 172.6 175.7 177.1 178.7
1Includes persons of other races. 2Includes Mexican-American persons.
SOURCE: NCHS, National Health and Nutrition Examination Survey.

Page 16 [ Series 3, No. 39
Table 12. Height in inches for males aged 20 and over and number of examined persons, mean, standard error of the mean, and selected percentiles, by race and Hispanic origin and age: United States, 2011–2014
Race and Hispanic origin and age
Number of examined persons Mean
Standard error of
the mean 5th 10th 15th 25th
Percentile
50th 75th 85th 90th 95th
All racial and Hispanic-origin groups1 Inches
20 years and over . . . . . . . . . . . . . . . 5,232 69.2 0.08 64.3 65.4 66.1 67.2 69.1 71.2 72.3 73.0 74.1 20–29 years . . . . . . . . . . . . . . . . . 937 69.4 0.10 64.9 65.7 66.3 67.4 69.4 71.4 72.6 73.4 74.3 30–39 years . . . . . . . . . . . . . . . . . 914 69.5 0.12 64.5 65.8 66.5 67.5 69.5 71.5 72.6 73.5 74.4 40–49 years . . . . . . . . . . . . . . . . . 872 69.4 0.17 64.5 65.7 66.3 67.3 69.3 71.2 72.6 73.1 73.9 50–59 years . . . . . . . . . . . . . . . . . 852 69.3 0.20 64.8 65.7 66.3 67.2 69.1 71.4 72.3 73.0 74.2 60–69 years . . . . . . . . . . . . . . . . . 877 69.0 0.18 63.8 65.2 65.9 67.1 69.1 71.2 72.1 72.5 73.8 70–79 years . . . . . . . . . . . . . . . . . 486 68.1 0.12 63.9 64.7 65.1 66.3 67.9 69.8 70.9 71.7 72.9 80 years and over . . . . . . . . . . . . . 294 67.6 0.23 62.9 64.2 64.7 65.9 67.7 69.4 70.5 71.0 72.0
Non-Hispanic white
20 years and over . . . . . . . . . . . . . . . 2,094 69.7 0.10 65.2 66.2 66.8 67.7 69.6 71.5 72.7 73.3 74.4 20–39 years . . . . . . . . . . . . . . . . . 715 70.1 0.11 65.7 66.6 67.3 68.2 70.2 72.1 73.3 73.8 74.7 40–59 years . . . . . . . . . . . . . . . . . 655 69.9 0.17 65.6 66.5 67.0 68.1 69.9 71.7 72.8 73.3 74.4 60 years and over . . . . . . . . . . . . . 724 69.0 0.14 64.5 65.3 66.0 67.0 69.0 70.9 71.9 72.4 73.6
Non-Hispanic black
20 years and over . . . . . . . . . . . . . . . 1,222 69.5 0.11 64.9 66.0 66.6 67.4 69.3 71.4 72.4 73.3 74.3 20–39 years . . . . . . . . . . . . . . . . . 405 69.8 0.12 65.2 66.3 66.9 67.6 69.7 71.9 72.9 73.6 74.7 40–59 years . . . . . . . . . . . . . . . . . 394 69.5 0.19 65.1 66.1 66.7 67.6 69.3 71.4 72.0 72.8 74.0 60 years and over . . . . . . . . . . . . . 423 68.5 0.15 64.0 65.2 65.8 66.7 68.4 70.3 71.8 72.4 73.3
Non-Hispanic Asian
20 years and over . . . . . . . . . . . . . . . 666 67.0 0.16 62.5 63.4 64.2 65.2 67.0 68.8 69.9 70.5 71.4 20–39 years . . . . . . . . . . . . . . . . . 260 67.8 0.15 63.4 64.5 65.4 66.2 67.8 69.5 70.4 71.0 72.0 40–59 years . . . . . . . . . . . . . . . . . 247 67.0 0.22 62.7 63.7 64.3 65.3 66.9 68.7 69.6 70.4 71.2 60 years and over . . . . . . . . . . . . . 159 65.2 0.24 61.0 62.1 62.6 63.6 65.1 66.7 67.7 68.3 69.7
Hispanic2
20 years and over . . . . . . . . . . . . . . . 1,089 67.4 0.10 62.8 63.8 64.5 65.5 67.3 69.3 70.4 71.1 72.2 20–39 years . . . . . . . . . . . . . . . . . 385 67.9 0.11 63.2 64.4 65.1 65.9 67.8 69.8 70.8 71.5 72.6 40–59 years . . . . . . . . . . . . . . . . . 381 67.2 0.18 62.4 63.6 64.2 65.3 67.2 69.1 69.9 70.9 72.2 60 years and over . . . . . . . . . . . . . 323 66.0 0.15 61.7 62.6 63.2 64.1 65.9 67.6 68.7 69.4 70.7
Mexican American
20 years and over . . . . . . . . . . . . . . . 627 67.3 0.12 62.6 63.8 64.5 65.4 67.1 69.2 70.2 71.1 72.0 20–39 years . . . . . . . . . . . . . . . . . 233 67.8 0.17 63.0 64.4 65.0 66.0 67.8 69.7 70.9 71.5 72.2 40–59 years . . . . . . . . . . . . . . . . . 227 66.9 0.21 62.2 63.4 63.9 64.9 66.8 68.6 69.7 70.3 71.8 60 years and over . . . . . . . . . . . . . 167 66.3 0.15 62.3 62.9 63.7 64.7 66.2 67.9 69.2 69.7 70.4
1Includes persons of other races. 2Includes Mexican-American persons.
SOURCE: NCHS, National Health and Nutrition Examination Survey.

Series 3, No. 39 [ Page 17
Table 13. Body mass index values for children and adolescents aged 2–19 years and number of examined persons, mean, standard error of the mean, and selected percentiles, by sex and age: United States, 2011–2014
Number of Standard Percentile examined error of
Sex and age1 persons Mean the mean 5th 10th 15th 25th 50th 75th 85th 90th 95th
Male Body mass index
2 years . . . . . . . . . . . . . . . . . . . 220 16.8 0.13 14.7 15.1 15.4 15.9 16.7 17.6 18.1 18.3 18.9 3 years . . . . . . . . . . . . . . . . . . . 223 16.3 0.12 14.4 14.7 15.1 15.4 16.0 17.1 17.4 17.7 18.8 4 years . . . . . . . . . . . . . . . . . . . 229 16.2 0.11 14.1 14.5 14.6 14.9 15.8 16.7 17.4 17.8 19.7 5 years . . . . . . . . . . . . . . . . . . . 195 16.3 0.17 13.9 14.3 14.6 15.0 16.1 16.9 17.4 18.3 20.6 6 years . . . . . . . . . . . . . . . . . . . 246 16.5 0.18 14.1 14.3 14.6 15.1 16.0 17.1 18.0 18.8 20.5 7 years . . . . . . . . . . . . . . . . . . . 231 17.4 0.24 13.9 14.4 14.7 15.2 16.2 18.3 20.4 22.8 25.0 8 years . . . . . . . . . . . . . . . . . . . 227 17.9 0.24 14.1 14.7 15.1 15.5 16.6 19.3 21.3 22.5 24.2 9 years . . . . . . . . . . . . . . . . . . . 218 18.0 0.28 † 14.2 14.8 15.5 17.1 19.1 21.5 22.9 25.6 10 years . . . . . . . . . . . . . . . . . . 207 19.5 0.47 14.4 14.8 15.5 16.2 17.9 21.8 23.7 25.2 28.0 11 years . . . . . . . . . . . . . . . . . . 186 21.2 0.46 15.2 15.7 16.0 17.1 20.5 23.8 26.3 27.8 30.3 12 years . . . . . . . . . . . . . . . . . . . 181 20.6 0.45 15.2 16.1 16.8 17.6 19.2 22.3 25.3 27.9 29.7 13 years . . . . . . . . . . . . . . . . . . . 175 22.6 0.56 16.3 17.0 17.4 18.7 21.0 25.4 27.4 29.7 31.6 14 years . . . . . . . . . . . . . . . . . . 184 22.8 0.48 16.8 17.7 18.6 19.4 21.2 24.2 28.1 30.0 33.7 15 years . . . . . . . . . . . . . . . . . . 156 23.6 0.58 17.1 17.9 18.3 19.5 22.0 26.0 28.4 30.7 36.5 16 years . . . . . . . . . . . . . . . . . . . 178 24.5 0.40 18.3 18.8 19.1 20.4 22.9 26.9 30.4 31.3 36.7 17 years . . . . . . . . . . . . . . . . . . 147 24.5 0.58 18.1 18.8 19.1 20.4 23.6 26.2 29.1 31.8 36.2 18 years . . . . . . . . . . . . . . . . . . 160 26.3 0.86 18.8 19.7 20.0 21.6 24.6 28.8 32.5 33.4 38.8 19 years . . . . . . . . . . . . . . . . . . 144 25.4 0.71 17.0 17.8 19.5 21.8 23.7 27.6 31.2 36.1 40.2
Female
2 years . . . . . . . . . . . . . . . . . . . 264 16.6 0.11 14.4 14.8 15.3 15.7 16.3 17.2 17.8 18.3 18.9 3 years . . . . . . . . . . . . . . . . . . . 199 16.3 0.17 14.3 14.6 14.9 15.3 15.9 16.7 17.6 18.0 19.2 4 years . . . . . . . . . . . . . . . . . . . 206 16.2 0.18 13.5 14.1 14.3 14.7 15.9 17.2 17.7 18.0 20.4 5 years . . . . . . . . . . . . . . . . . . . 178 16.1 0.18 13.7 14.1 14.4 14.8 15.6 16.8 17.6 18.2 20.8 6 years . . . . . . . . . . . . . . . . . . . 216 16.7 0.26 13.6 14.0 14.3 14.7 15.9 18.1 19.6 20.4 22.3 7 years . . . . . . . . . . . . . . . . . . . 211 17.0 0.30 13.4 13.6 14.1 14.7 16.1 18.3 20.5 21.9 23.4 8 years . . . . . . . . . . . . . . . . . . . 197 18.1 0.28 14.1 14.5 14.7 15.5 17.1 19.7 21.5 22.4 25.2 9 years . . . . . . . . . . . . . . . . . . . 206 19.6 0.34 14.4 15.1 15.4 16.2 18.3 21.4 24.1 25.5 29.2 10 years . . . . . . . . . . . . . . . . . . 187 19.5 0.45 13.9 14.6 15.1 16.4 19.1 21.6 24.2 25.1 26.8 11 years . . . . . . . . . . . . . . . . . . 230 20.7 0.47 14.5 15.4 16.1 17.0 19.3 23.3 25.8 28.1 31.8 12 years . . . . . . . . . . . . . . . . . . . 166 22.6 0.64 15.5 16.6 17.0 18.0 21.0 26.1 27.7 30.3 35.9 13 years . . . . . . . . . . . . . . . . . . . 160 22.0 0.59 16.0 16.5 17.1 18.1 20.5 24.3 27.0 30.4 31.6 14 years . . . . . . . . . . . . . . . . . . 169 23.2 0.58 16.9 18.3 18.6 19.1 21.5 26.6 28.3 29.4 32.7 15 years . . . . . . . . . . . . . . . . . . 150 24.6 0.86 17.4 18.8 19.1 20.4 23.2 27.2 30.8 32.6 37.3 16 years . . . . . . . . . . . . . . . . . . . 187 24.6 0.76 17.7 18.6 19.1 20.0 22.5 26.1 31.9 35.4 40.0 17 years . . . . . . . . . . . . . . . . . . 139 25.4 0.68 18.4 19.1 19.6 20.3 22.9 29.4 33.0 34.6 38.8 18 years . . . . . . . . . . . . . . . . . . 154 25.7 1.12 18.3 19.5 20.4 20.9 23.5 27.5 30.3 35.5 43.4 19 years . . . . . . . . . . . . . . . . . . 152 25.8 0.84 17.0 18.4 18.9 20.2 23.4 29.5 32.7 37.6 42.5
† Estimate not shown because the standard error could not be computed due to small sample size. 1Age at time of examination.
NOTES: Data exclude pregnant females. Body mass index (BMI) is calculated as: BMI = weight(kilograms)/height(meters2).
SOURCE: NCHS, National Health and Nutrition Examination Survey.

Page 18 [ Series 3, No. 39
Table 14. Body mass index values for females aged 20 and over and number of examined persons, mean, standard error of the mean, and selected percentiles, by race and Hispanic origin and age: United States, 2011–2014
Number of Standard Percentile examined error of
Race and Hispanic origin and age persons Mean the mean 5th 10th 15th 25th 50th 75th 85th 90th 95th
All racial and Hispanic-origin groups1 Body mass index
20 years and over . . . . . . . . . . . . 5,413 29.2 0.17 19.6 21.0 22.0 23.6 27.7 33.2 36.5 39.3 43.3 20–29 years . . . . . . . . . . . . . . 853 27.6 0.32 18.6 19.8 20.7 21.9 25.6 31.8 36.0 38.9 42.0 30–39 years . . . . . . . . . . . . . . 915 29.4 0.33 19.8 21.1 22.0 23.3 27.6 33.1 36.6 40.0 44.7 40–49 years . . . . . . . . . . . . . . 978 29.6 0.39 20.0 21.5 22.5 23.7 28.1 33.4 37.0 39.6 44.5 50–59 years . . . . . . . . . . . . . . 922 30.2 0.40 19.9 21.5 22.2 24.5 28.6 34.4 38.3 40.7 45.2 60–69 years . . . . . . . . . . . . . . 886 29.7 0.27 20.0 21.7 23.0 24.5 28.9 33.4 36.1 38.7 41.8 70–79 years . . . . . . . . . . . . . . 525 29.6 0.41 20.5 22.1 22.9 24.6 28.3 33.4 36.5 39.1 42.9 80 years and over . . . . . . . . . . . 334 26.6 0.32 19.3 20.4 21.3 23.3 26.1 29.7 30.9 32.8 35.2
Non-Hispanic white
20 years and over . . . . . . . . . . . . 2,151 28.8 0.22 19.5 20.9 21.9 23.4 27.3 32.6 36.0 38.8 43.0 20–39 years . . . . . . . . . . . . . . 649 28.0 0.30 19.0 20.4 21.1 22.3 25.9 31.8 35.8 38.9 42.5 40–59 years . . . . . . . . . . . . . . 686 29.4 0.34 19.8 21.4 22.1 23.6 27.9 33.4 37.2 40.1 43.8 60 years and over . . . . . . . . . . . 816 28.9 0.31 19.8 21.4 22.6 24.2 27.9 32.4 35.0 37.5 41.2
Non-Hispanic black
20 years and over . . . . . . . . . . . . 1,261 32.5 0.25 20.9 22.8 24.3 26.6 31.3 36.8 40.5 43.5 48.8 20–39 years . . . . . . . . . . . . . . 380 32.1 0.35 19.7 21.8 23.5 25.9 31.0 36.9 40.6 43.4 47.1 40–59 years . . . . . . . . . . . . . . 480 33.3 0.44 21.9 23.5 24.9 27.1 31.9 37.2 41.7 44.8 50.4 60 years and over . . . . . . . . . . . 401 31.7 0.45 21.6 22.8 24.1 26.2 30.9 35.8 39.0 41.3 46.1
Non-Hispanic Asian
20 years and over . . . . . . . . . . . . 691 24.2 0.22 18.4 19.1 19.8 20.8 23.3 26.7 28.8 30.5 32.6 20–39 years . . . . . . . . . . . . . . 258 23.3 0.31 17.9 18.6 19.0 19.9 22.4 25.0 28.3 30.0 31.8 40–59 years . . . . . . . . . . . . . . 267 24.9 0.30 19.1 19.9 20.4 21.5 23.9 27.2 29.1 31.6 34.2 60 years and over . . . . . . . . . . . 166 24.7 0.34 18.9 19.9 20.5 21.7 24.1 27.2 29.2 30.2 31.4
Hispanic2
20 years and over . . . . . . . . . . . . 1,163 30.0 0.27 20.8 22.1 23.1 25.1 28.9 33.9 36.9 38.8 42.8 20–39 years . . . . . . . . . . . . . . 408 29.3 0.45 19.9 21.7 22.3 24.4 27.9 32.9 36.4 38.6 42.6 40–59 years . . . . . . . . . . . . . . 416 31.0 0.34 21.7 22.7 23.7 26.1 30.2 34.9 37.6 39.5 44.1 60 years and over . . . . . . . . . . . 339 30.3 0.34 21.5 22.4 23.6 25.9 29.5 34.3 36.4 38.4 41.2
Mexican American
20 years and over . . . . . . . . . . . . 609 30.7 0.35 21.4 22.5 23.8 25.8 29.6 34.8 37.5 39.5 43.8 20–39 years . . . . . . . . . . . . . . 238 29.8 0.55 20.3 21.9 23.0 24.9 28.8 32.9 36.5 38.7 42.7 40–59 years . . . . . . . . . . . . . . 219 31.8 0.40 22.6 23.8 25.0 26.4 30.8 35.8 38.0 40.5 44.1 60 years and over . . . . . . . . . . . 152 *31.1 0.47 *21.3 *22.2 *23.9 *26.1 *30.2 *35.5 *38.2 *39.3 *41.6
* Estimate does not meet standards of reliability or precision based on less than 12 degrees of freedom. 1Includes persons of other races. 2Includes Mexican-American persons.
NOTES: Data exclude pregnant females. Body mass index (BMI) is calculated as: BMI = weight(kilograms)/height(meters2).
SOURCE: NCHS, National Health and Nutrition Examination Survey.
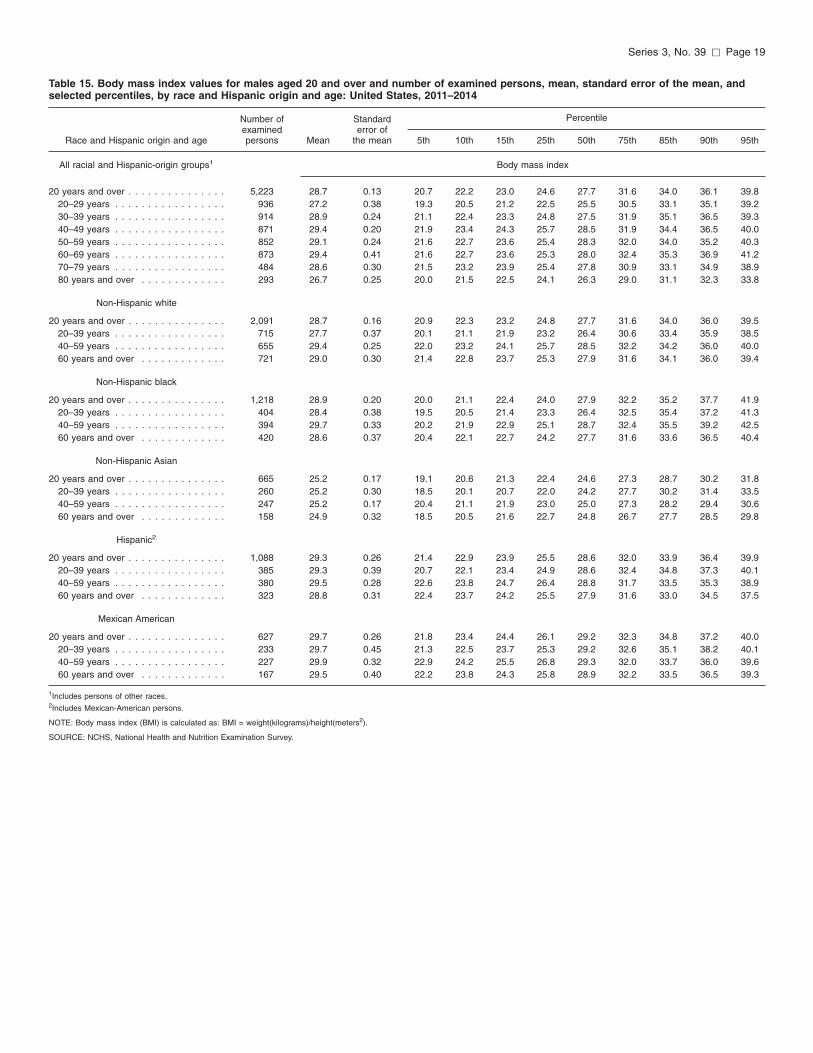
Series 3, No. 39 [ Page 19
Table 15. Body mass index values for males aged 20 and over and number of examined persons, mean, standard error of the mean, and selected percentiles, by race and Hispanic origin and age: United States, 2011–2014
Race and Hispanic origin and age
Number of examined persons Mean
Standard error of
the mean 5th 10th 15th 25th
Percentile
50th 75th 85th 90th 95th
All racial and Hispanic-origin groups1 Body mass index
20 years and over . . . . . . . . . . . . . . . 5,223 28.7 0.13 20.7 22.2 23.0 24.6 27.7 31.6 34.0 36.1 39.8 20–29 years . . . . . . . . . . . . . . . . . 936 27.2 0.38 19.3 20.5 21.2 22.5 25.5 30.5 33.1 35.1 39.2 30–39 years . . . . . . . . . . . . . . . . . 914 28.9 0.24 21.1 22.4 23.3 24.8 27.5 31.9 35.1 36.5 39.3 40–49 years . . . . . . . . . . . . . . . . . 871 29.4 0.20 21.9 23.4 24.3 25.7 28.5 31.9 34.4 36.5 40.0 50–59 years . . . . . . . . . . . . . . . . . 852 29.1 0.24 21.6 22.7 23.6 25.4 28.3 32.0 34.0 35.2 40.3 60–69 years . . . . . . . . . . . . . . . . . 873 29.4 0.41 21.6 22.7 23.6 25.3 28.0 32.4 35.3 36.9 41.2 70–79 years . . . . . . . . . . . . . . . . . 484 28.6 0.30 21.5 23.2 23.9 25.4 27.8 30.9 33.1 34.9 38.9 80 years and over . . . . . . . . . . . . . 293 26.7 0.25 20.0 21.5 22.5 24.1 26.3 29.0 31.1 32.3 33.8
Non-Hispanic white
20 years and over . . . . . . . . . . . . . . . 2,091 28.7 0.16 20.9 22.3 23.2 24.8 27.7 31.6 34.0 36.0 39.5 20–39 years . . . . . . . . . . . . . . . . . 715 27.7 0.37 20.1 21.1 21.9 23.2 26.4 30.6 33.4 35.9 38.5 40–59 years . . . . . . . . . . . . . . . . . 655 29.4 0.25 22.0 23.2 24.1 25.7 28.5 32.2 34.2 36.0 40.0 60 years and over . . . . . . . . . . . . . 721 29.0 0.30 21.4 22.8 23.7 25.3 27.9 31.6 34.1 36.0 39.4
Non-Hispanic black
20 years and over . . . . . . . . . . . . . . . 1,218 28.9 0.20 20.0 21.1 22.4 24.0 27.9 32.2 35.2 37.7 41.9 20–39 years . . . . . . . . . . . . . . . . . 404 28.4 0.38 19.5 20.5 21.4 23.3 26.4 32.5 35.4 37.2 41.3 40–59 years . . . . . . . . . . . . . . . . . 394 29.7 0.33 20.2 21.9 22.9 25.1 28.7 32.4 35.5 39.2 42.5 60 years and over . . . . . . . . . . . . . 420 28.6 0.37 20.4 22.1 22.7 24.2 27.7 31.6 33.6 36.5 40.4
Non-Hispanic Asian
20 years and over . . . . . . . . . . . . . . . 665 25.2 0.17 19.1 20.6 21.3 22.4 24.6 27.3 28.7 30.2 31.8 20–39 years . . . . . . . . . . . . . . . . . 260 25.2 0.30 18.5 20.1 20.7 22.0 24.2 27.7 30.2 31.4 33.5 40–59 years . . . . . . . . . . . . . . . . . 247 25.2 0.17 20.4 21.1 21.9 23.0 25.0 27.3 28.2 29.4 30.6 60 years and over . . . . . . . . . . . . . 158 24.9 0.32 18.5 20.5 21.6 22.7 24.8 26.7 27.7 28.5 29.8
Hispanic2
20 years and over . . . . . . . . . . . . . . . 1,088 29.3 0.26 21.4 22.9 23.9 25.5 28.6 32.0 33.9 36.4 39.9 20–39 years . . . . . . . . . . . . . . . . . 385 29.3 0.39 20.7 22.1 23.4 24.9 28.6 32.4 34.8 37.3 40.1 40–59 years . . . . . . . . . . . . . . . . . 380 29.5 0.28 22.6 23.8 24.7 26.4 28.8 31.7 33.5 35.3 38.9 60 years and over . . . . . . . . . . . . . 323 28.8 0.31 22.4 23.7 24.2 25.5 27.9 31.6 33.0 34.5 37.5
Mexican American
20 years and over . . . . . . . . . . . . . . . 627 29.7 0.26 21.8 23.4 24.4 26.1 29.2 32.3 34.8 37.2 40.0 20–39 years . . . . . . . . . . . . . . . . . 233 29.7 0.45 21.3 22.5 23.7 25.3 29.2 32.6 35.1 38.2 40.1 40–59 years . . . . . . . . . . . . . . . . . 227 29.9 0.32 22.9 24.2 25.5 26.8 29.3 32.0 33.7 36.0 39.6 60 years and over . . . . . . . . . . . . . 167 29.5 0.40 22.2 23.8 24.3 25.8 28.9 32.2 33.5 36.5 39.3
1Includes persons of other races. 2Includes Mexican-American persons.
NOTE: Body mass index (BMI) is calculated as: BMI = weight(kilograms)/height(meters2).
SOURCE: NCHS, National Health and Nutrition Examination Survey.

Page 20 [ Series 3, No. 39
Table 16. Head circumference in centimeters for infants from birth through age 6 months and number of examined persons, mean, standard error of the mean, and selected percentiles, by sex and age: United States, 2011–2014
Sex and age1
Number of examined persons Mean
Standard error of
the mean 5th 10th 15th 25th
Percentile
50th 75th 85th 90th 95th
Male Centimeters
Birth–2 months . . . . . . . . . . . . . . 3–5 months . . . . . . . . . . . . . . . . . 6 months . . . . . . . . . . . . . . . . . .
75 90 35
39.4 42.7
*44.0
0.20 0.23 0.20
36.3 39.8
†
36.7 40.3
*42.3
37.3 41.2
*42.5
38.3 41.8
*43.4
39.4 42.6
*43.9
40.4 43.7
*44.7
41.2 44.3
*44.9
41.6 44.5
*45.4
41.9 45.3
†
Female
Birth–2 months . . . . . . . . . . . . . . 3–5 months . . . . . . . . . . . . . . . . . 6 months . . . . . . . . . . . . . . . . . .
72 104
38
38.0 41.3
*43.2
0.16 0.18 0.23
35.7 38.5
*41.3
36.2 39.0
*41.8
36.4 39.6
*42.0
37.0 40.4
*42.1
38.0 41.2
*42.7
38.7 42.3
*44.0
39.4 42.9
*44.4
39.9 43.3
*44.9
40.2 43.7
†
* Estimate does not meet standards of reliability or precision based on less than 12 degrees of freedom. † Estimate not shown because the standard error could not be computed due to small sample size. 1Age at time of examination.
SOURCE: NCHS, National Health and Nutrition Examination Survey.

Series 3, No. 39 [ Page 21
Table 17. Recumbent length in centimeters for children from birth through age 47 months and number of examined persons, mean, standard error of the mean, and selected percentiles, by sex and age: United States, 2011–2014
Sex and age1
Number of examined persons Mean
Standard error of
the mean 5th 10th 15th 25th
Percentile
50th 75th 85th 90th 95th
Male Centimeters
Birth–2 months . . . . . . . . . . . . . . 75 57.5 0.41 51.6 52.9 54.7 55.1 57.7 59.5 60.6 61.3 †
3–5 months . . . . . . . . . . . . . . . . . 90 64.0 0.35 58.9 59.5 60.8 61.9 64.2 66.3 67.5 68.0 68.5 6–8 months . . . . . . . . . . . . . . . . . 103 68.9 0.28 64.5 65.8 66.4 67.1 68.7 70.6 71.1 71.6 72.7 9–11 months . . . . . . . . . . . . . . . . 96 73.5 0.28 68.8 69.7 70.2 71.6 73.3 75.1 76.6 77.1 77.9 1 year . . . . . . . . . . . . . . . . . . . . 239 81.6 0.28 74.8 76.0 76.9 78.6 81.3 84.4 86.5 87.2 89.1 2 years . . . . . . . . . . . . . . . . . . . 238 92.4 0.41 85.4 86.9 87.9 89.5 92.4 95.4 96.7 97.6 99.3 3 years . . . . . . . . . . . . . . . . . . . 219 100.0 0.38 92.4 93.6 95.2 96.9 99.8 102.7 104.7 105.4 108.6
Female
Birth–2 months . . . . . . . . . . . . . . 71 55.7 0.24 51.0 53.0 53.5 54.0 55.5 57.5 58.4 59.4 60.1 3–5 months . . . . . . . . . . . . . . . . . 104 62.9 0.39 57.9 58.7 59.4 60.1 62.5 65.8 66.5 66.8 67.0 6–8 months . . . . . . . . . . . . . . . . . 91 67.3 0.29 63.1 63.8 64.3 65.1 67.0 69.3 70.3 70.8 71.6 9–11 months . . . . . . . . . . . . . . . . 104 71.5 0.24 67.6 68.5 68.8 69.8 71.6 72.9 73.6 74.4 75.1 1 year . . . . . . . . . . . . . . . . . . . . 221 80.8 0.43 71.9 73.7 75.3 76.8 80.9 84.5 86.3 87.1 88.7 2 years . . . . . . . . . . . . . . . . . . . 276 90.4 0.31 83.8 85.4 85.9 87.6 90.1 93.2 95.3 96.5 97.6 3 years . . . . . . . . . . . . . . . . . . . 192 99.2 0.35 91.9 93.5 95.4 96.6 99.2 101.7 103.6 104.4 106.1
† Estimate not shown because the standard error could not be computed due to small sample size. 1Age at time of examination.
SOURCE: NCHS, National Health and Nutrition Examination Survey.

Page 22 [ Series 3, No. 39
Table 18. Waist circumference in centimeters for children and adolescents aged 2–19 years and number of examined persons, mean, standard error of the mean, and selected percentiles, by sex and age: United States, 2011–2014
Sex and age1
Number of examined persons Mean
Standard error of
the mean 5th 10th 15th 25th
Percentile
50th 75th 85th 90th 95th
Male Centimeters
2 years . . . . . . . . . . . . . . . . . . . 200 48.7 0.23 43.5 44.7 45.7 47.1 48.3 50.2 51.5 52.4 53.3 3 years . . . . . . . . . . . . . . . . . . . 203 50.3 0.23 45.4 46.2 46.9 48.5 50.1 51.6 52.7 53.4 54.8 4 years . . . . . . . . . . . . . . . . . . . 217 52.9 0.32 47.2 47.7 48.3 49.3 52.1 55.3 56.5 57.2 63.0 5 years . . . . . . . . . . . . . . . . . . . 182 55.0 0.50 48.5 49.7 50.4 51.9 54.1 56.4 59.4 60.8 63.9 6 years . . . . . . . . . . . . . . . . . . . 239 57.0 0.48 49.8 50.9 51.9 53.0 55.6 59.3 61.4 63.3 67.7 7 years . . . . . . . . . . . . . . . . . . . 226 60.6 0.66 51.3 52.6 53.3 55.0 57.9 62.3 68.6 75.2 81.0 8 years . . . . . . . . . . . . . . . . . . . 219 62.8 0.61 52.5 54.4 55.2 56.4 59.9 66.6 72.0 74.1 80.8 9 years . . . . . . . . . . . . . . . . . . . 213 64.4 0.80 52.2 54.9 56.6 58.1 61.5 67.5 72.3 78.8 86.5 10 years . . . . . . . . . . . . . . . . . . 199 69.1 1.25 55.2 56.5 58.2 59.9 64.2 76.3 81.0 86.2 90.8 11 years . . . . . . . . . . . . . . . . . . 182 74.9 1.40 57.7 60.3 61.6 64.0 71.5 82.4 90.3 95.2 101.1 12 years . . . . . . . . . . . . . . . . . . . 172 73.9 1.37 58.6 61.4 63.1 65.8 70.1 77.5 87.6 89.9 98.6 13 years . . . . . . . . . . . . . . . . . . . 169 79.5 1.56 62.0 64.1 65.7 68.9 74.8 89.5 93.9 100.7 †
14 years . . . . . . . . . . . . . . . . . . 176 79.8 1.26 64.3 65.8 67.6 70.3 75.4 84.5 95.8 102.0 111.4 15 years . . . . . . . . . . . . . . . . . . 152 82.3 1.53 † 68.0 69.0 71.3 77.4 88.0 94.4 103.4 114.9 16 years . . . . . . . . . . . . . . . . . . . 174 84.8 1.09 68.8 70.7 71.5 74.1 78.6 92.3 101.7 104.7 117.1 17 years . . . . . . . . . . . . . . . . . . 143 84.4 1.66 69.5 71.8 73.0 74.2 80.0 88.1 95.8 105.8 120.9 18 years . . . . . . . . . . . . . . . . . . 156 87.9 1.55 † 71.6 73.7 76.9 85.0 95.8 101.2 105.5 119.0 19 years . . . . . . . . . . . . . . . . . . 142 87.0 1.90 69.9 72.0 73.6 76.6 82.5 90.7 102.2 † †
Female
2 years . . . . . . . . . . . . . . . . . . . 241 48.3 0.33 43.0 43.9 44.5 45.7 48.2 50.4 51.5 52.0 54.3 3 years . . . . . . . . . . . . . . . . . . . 182 51.1 0.48 45.0 46.0 46.4 47.6 50.1 53.4 55.4 56.9 59.1 4 years . . . . . . . . . . . . . . . . . . . 194 53.1 0.49 46.2 47.8 48.4 49.5 51.8 55.2 57.7 58.4 64.6 5 years . . . . . . . . . . . . . . . . . . . 170 54.7 0.44 47.2 48.5 49.3 51.4 54.0 56.2 58.8 62.1 66.6 6 years . . . . . . . . . . . . . . . . . . . 210 57.5 0.66 49.5 50.3 51.6 52.5 55.3 60.5 65.5 68.4 73.2 7 years . . . . . . . . . . . . . . . . . . . 204 59.1 0.78 49.3 50.0 51.2 52.5 57.0 63.3 68.5 70.3 76.8 8 years . . . . . . . . . . . . . . . . . . . 190 63.7 0.85 52.1 53.4 54.3 56.3 59.9 69.2 73.9 75.6 83.3 9 years . . . . . . . . . . . . . . . . . . . 198 68.0 1.05 54.3 55.4 56.5 58.8 65.6 74.5 81.3 85.6 91.8 10 years . . . . . . . . . . . . . . . . . . 182 69.5 1.29 54.8 56.4 57.4 60.1 66.9 77.7 82.9 87.5 89.4 11 years . . . . . . . . . . . . . . . . . . 223 73.5 1.16 58.9 59.8 61.0 63.9 70.1 79.9 87.0 92.5 98.6 12 years . . . . . . . . . . . . . . . . . . . 163 78.0 1.58 59.2 62.0 64.9 67.0 74.4 86.3 92.0 98.7 108.0 13 years . . . . . . . . . . . . . . . . . . . 155 77.1 1.32 61.9 64.6 66.6 69.6 73.6 82.1 87.9 97.6 100.1 14 years . . . . . . . . . . . . . . . . . . 163 79.6 1.30 66.0 67.7 68.8 70.3 76.1 85.9 93.9 97.2 101.3 15 years . . . . . . . . . . . . . . . . . . 146 82.2 1.79 67.1 69.4 70.0 73.0 77.2 89.0 98.5 104.4 108.4 16 years . . . . . . . . . . . . . . . . . . . 180 83.5 2.28 65.7 68.1 69.7 72.1 78.6 87.2 101.8 108.8 †
17 years . . . . . . . . . . . . . . . . . . 133 85.0 1.61 67.5 70.1 72.2 73.4 80.1 95.7 101.3 102.2 114.5 18 years . . . . . . . . . . . . . . . . . . 153 84.7 2.18 67.0 69.3 70.6 72.8 79.9 89.6 97.6 112.2 †
19 years . . . . . . . . . . . . . . . . . . 145 86.7 1.76 67.4 68.5 69.7 74.9 82.0 92.3 101.0 117.2 123.2
† Estimate not shown because the standard error could not be computed due to small sample size. 1Age at time of examination.
NOTE: Data exclude pregnant females.
SOURCE: NCHS, National Health and Nutrition Examination Survey.

Series 3, No. 39 [ Page 23
Table 19. Waist circumference in centimeters for females aged 20 and over and number of examined persons, mean, standard error of the mean, and selected percentiles, by race and Hispanic origin and age: United States, 2011–2014
Number of Standard Percentile examined error of
Race and Hispanic origin and age persons Mean the mean 5th 10th 15th 25th 50th 75th 85th 90th 95th
All racial and Hispanic-origin groups1 Centimeters
20 years and over . . . . . . . . . . . . . . . 5,116 96.9 0.38 73.8 77.3 79.9 84.4 94.8 106.5 113.9 119.2 127.9 20–29 years . . . . . . . . . . . . . . . . . 812 91.0 0.88 70.5 72.9 74.4 78.0 86.9 100.4 109.9 115.8 125.6 30–39 years . . . . . . . . . . . . . . . . . 885 96.0 0.74 74.0 76.5 78.8 82.6 92.7 104.8 113.2 120.3 128.7 40–49 years . . . . . . . . . . . . . . . . . 935 97.1 0.79 74.7 77.8 80.1 84.2 95.7 107.2 113.8 119.0 128.1 50–59 years . . . . . . . . . . . . . . . . . 887 99.7 0.85 76.5 80.1 82.8 86.6 97.5 109.1 116.1 124.8 134.0 60–69 years . . . . . . . . . . . . . . . . . 856 99.7 0.71 77.9 81.2 84.8 88.9 99.0 108.0 115.3 119.6 127.1 70–79 years . . . . . . . . . . . . . . . . . 471 100.3 0.87 77.5 82.5 86.3 91.1 99.2 109.2 115.2 119.1 125.0 80 years and over . . . . . . . . . . . . . 270 94.3 0.84 76.0 79.2 81.3 85.3 93.5 102.1 106.7 109.2 115.4
Non-Hispanic white
20 years and over . . . . . . . . . . . . . . . 2,032 96.8 0.45 74.0 77.6 79.9 84.3 94.8 106.2 113.4 119.0 128.0 20–39 years . . . . . . . . . . . . . . . . . 631 92.9 0.79 72.1 74.4 76.9 79.7 89.3 102.7 111.5 117.9 126.7 40–59 years . . . . . . . . . . . . . . . . . 665 98.1 0.73 74.9 78.6 81.4 85.0 95.9 107.5 114.9 121.2 132.9 60 years and over . . . . . . . . . . . . . 736 98.8 0.71 77.6 80.5 84.5 88.7 97.8 107.2 113.3 117.8 124.6
Non-Hispanic black
20 years and over . . . . . . . . . . . . . . . 1,177 102.5 0.48 76.1 80.5 84.2 89.9 100.9 113.5 120.2 126.3 133.5 20–39 years . . . . . . . . . . . . . . . . . 359 100.0 1.02 71.4 77.1 80.2 86.3 97.7 111.6 119.3 125.7 134.4 40–59 years . . . . . . . . . . . . . . . . . 455 104.3 0.87 78.5 83.2 87.2 90.9 102.6 114.9 122.2 127.4 134.5 60 years and over . . . . . . . . . . . . . 363 103.4 0.96 80.5 84.2 87.3 92.7 102.3 113.0 119.2 123.2 130.1
Non-Hispanic Asian
20 years and over . . . . . . . . . . . . . . . 652 85.3 0.56 69.5 72.0 73.5 77.1 83.5 92.4 97.3 101.2 106.3 20–39 years . . . . . . . . . . . . . . . . . 246 81.6 0.73 66.2 69.5 70.9 73.6 79.8 87.1 92.5 96.4 102.2 40–59 years . . . . . . . . . . . . . . . . . 248 87.3 0.71 71.9 73.8 75.8 79.2 85.3 93.4 99.1 102.9 108.5 60 years and over . . . . . . . . . . . . . 158 88.5 0.94 71.4 76.1 78.6 81.5 86.9 95.0 99.2 103.6 106.8
Hispanic2
20 years and over . . . . . . . . . . . . . . . 1,115 97.3 0.77 75.0 78.7 81.9 86.2 95.5 106.8 112.7 117.0 126.0 20–39 years . . . . . . . . . . . . . . . . . 390 95.0 1.16 73.7 76.1 78.6 83.7 92.0 104.2 109.8 116.9 127.0 40–59 years . . . . . . . . . . . . . . . . . 406 99.0 0.83 78.4 81.2 83.5 88.8 97.3 108.5 113.2 116.6 125.0 60 years and over . . . . . . . . . . . . . 319 100.7 0.84 80.5 84.0 86.3 91.3 99.0 108.9 115.2 119.8 125.1
Mexican American
20 years and over . . . . . . . . . . . . . . . 585 98.7 0.96 75.9 80.3 83.5 87.5 96.7 108.4 113.9 119.5 126.7 20–39 years . . . . . . . . . . . . . . . . . 230 96.4 1.47 74.1 77.4 80.4 85.0 93.9 106.0 111.0 119.4 127.7 40–59 years . . . . . . . . . . . . . . . . . 213 100.7 0.93 80.5 83.7 86.4 90.4 98.8 110.2 113.7 116.5 123.3 60 years and over . . . . . . . . . . . . . 142 *102.1 1.41 *78.5 *83.5 *85.2 *90.5 *101.5 *112.3 *120.0 *122.9 *126.4
* Estimate does not meet standards of reliability or precision based on less than 12 degrees of freedom. 1Includes persons of other races. 2Includes Mexican-American persons.
NOTE: Data exclude pregnant females.
SOURCE: NCHS, National Health and Nutrition Examination Survey.

Page 24 [ Series 3, No. 39
Table 20. Waist circumference in centimeters for males aged 20 and over and number of examined persons, mean, standard error of the mean, and selected percentiles, by race and Hispanic origin and age: United States, 2011–2014
Race and Hispanic origin and age
Number of examined persons Mean
Standard error of
the mean 5th 10th 15th 25th
Percentile
50th 75th 85th 90th 95th
All racial and Hispanic-origin groups1 Centimeters
20 years and over . . . . . . . . . . . . . . . 5,018 101.5 0.39 78.2 82.3 85.6 90.4 100.3 110.5 116.8 121.2 129.5 20–29 years . . . . . . . . . . . . . . . . . 914 93.6 1.03 73.5 75.8 77.8 81.3 89.5 102.4 110.5 115.3 126.0 30–39 years . . . . . . . . . . . . . . . . . 889 99.5 0.57 79.4 82.5 85.3 89.1 97.0 107.2 114.7 118.9 127.5 40–49 years . . . . . . . . . . . . . . . . . 842 102.8 0.48 83.0 87.0 89.4 92.8 101.1 109.5 115.4 120.9 128.6 50–59 years . . . . . . . . . . . . . . . . . 832 104.3 0.60 82.8 87.3 90.3 94.3 103.5 113.0 117.9 121.4 131.3 60–69 years . . . . . . . . . . . . . . . . . 840 106.8 1.01 83.7 87.6 90.8 96.0 105.6 116.4 122.5 127.5 133.2 70–79 years . . . . . . . . . . . . . . . . . 453 106.2 0.75 85.6 91.5 93.6 98.3 105.3 113.8 118.2 122.1 127.3 80 years and over . . . . . . . . . . . . . 248 103.6 0.74 83.1 88.5 92.6 97.0 103.0 110.3 115.3 118.0 122.6
Non-Hispanic white
20 years and over . . . . . . . . . . . . . . . 2,010 102.8 0.47 79.7 84.3 87.1 92.1 101.4 111.9 118.0 121.9 129.7 20–39 years . . . . . . . . . . . . . . . . . 701 96.6 1.10 76.7 79.3 81.3 85.0 93.5 104.8 113.3 118.4 125.8 40–59 years . . . . . . . . . . . . . . . . . 639 104.9 0.59 85.4 89.2 91.7 95.5 103.7 112.5 118.4 121.4 129.9 60 years and over . . . . . . . . . . . . . 670 107.3 0.75 85.0 90.5 93.7 98.5 106.5 115.7 121.0 125.8 131.3
Non-Hispanic black
20 years and over . . . . . . . . . . . . . . . 1,164 98.7 0.57 73.7 76.6 79.5 85.0 97.0 109.4 115.7 121.5 132.2 20–39 years . . . . . . . . . . . . . . . . . 390 93.7 0.95 72.2 73.9 75.5 79.0 90.8 105.5 112.0 116.1 125.5 40–59 years . . . . . . . . . . . . . . . . . 381 101.9 0.99 75.3 80.6 83.9 89.5 100.1 111.1 118.5 125.5 136.2 60 years and over . . . . . . . . . . . . . 393 103.0 1.01 79.4 85.3 87.3 92.7 102.1 111.1 119.1 123.2 132.3
Non-Hispanic Asian
20 years and over . . . . . . . . . . . . . . . 636 90.4 0.47 73.9 76.7 79.1 82.9 90.2 97.0 101.2 103.9 107.6 20–39 years . . . . . . . . . . . . . . . . . 250 88.7 0.87 70.6 74.6 76.3 79.4 87.2 96.0 102.5 104.8 110.3 40–59 years . . . . . . . . . . . . . . . . . 236 91.4 0.41 77.2 79.7 82.2 85.6 91.1 96.5 100.2 101.7 105.9 60 years and over . . . . . . . . . . . . . 150 92.7 0.71 74.3 81.2 84.0 86.2 93.4 98.3 101.8 102.9 107.4
Hispanic2
20 years and over . . . . . . . . . . . . . . . 1,051 100.8 0.76 79.1 83.9 86.9 90.8 100.0 108.4 114.5 118.8 127.6 20–39 years . . . . . . . . . . . . . . . . . 377 99.2 1.09 76.9 81.4 84.0 88.6 97.3 107.6 114.4 117.4 128.9 40–59 years . . . . . . . . . . . . . . . . . 373 102.3 0.87 83.5 87.2 89.6 93.2 101.3 108.9 114.3 118.5 126.1 60 years and over . . . . . . . . . . . . . 301 103.8 0.88 86.6 89.6 91.8 95.1 101.6 110.4 116.6 120.3 125.6
Mexican American
20 years and over . . . . . . . . . . . . . . . 604 101.9 0.85 79.7 85.2 87.9 92.0 100.8 109.2 116.3 120.1 128.1 20–39 years . . . . . . . . . . . . . . . . . 228 100.5 1.33 77.8 82.5 85.2 89.9 99.0 108.8 115.9 120.1 128.9 40–59 years . . . . . . . . . . . . . . . . . 223 103.0 0.96 85.3 88.6 90.9 93.8 101.9 108.9 115.9 119.5 125.9 60 years and over . . . . . . . . . . . . . 153 105.5 1.07 85.1 89.7 93.7 97.0 102.5 112.8 118.5 120.7 127.1
1Includes persons of other races. 2Includes Mexican-American persons.
SOURCE: NCHS, National Health and Nutrition Examination Survey.

Series 3, No. 39 [ Page 25
Table 21. Sagittal abdominal diameter in centimeters for children and adolescents aged 8–19 years and number of examined persons, mean, standard error of the mean, and selected percentiles, by sex and age: United States, 2011–2014
Sex and age1
Number of examined persons Mean
Standard error of
the mean 5th 10th 15th 25th
Percentile
50th 75th 85th 90th 95th
Male Centimeters
8 years . . . . . . . . . . . . . . . . . . . 197 14.2 0.18 11.6 12.0 12.4 12.7 13.4 15.2 16.3 17.0 18.4 9 years . . . . . . . . . . . . . . . . . . . 211 14.4 0.18 11.7 12.1 12.4 12.9 14.0 15.0 16.3 17.8 19.6 10 years . . . . . . . . . . . . . . . . . . 199 15.4 0.31 12.1 12.4 12.7 13.1 14.5 17.6 18.4 19.7 20.8 11 years . . . . . . . . . . . . . . . . . . 182 16.7 0.31 12.6 13.1 13.5 14.1 15.8 18.6 19.7 21.3 22.9 12 years . . . . . . . . . . . . . . . . . . . 169 16.3 0.31 12.3 13.3 13.6 14.2 15.7 17.2 19.2 20.6 21.9 13 years . . . . . . . . . . . . . . . . . . . 169 17.5 0.34 13.6 14.1 14.4 15.1 16.8 19.4 20.4 21.2 23.6 14 years . . . . . . . . . . . . . . . . . . 175 17.7 0.30 14.1 14.3 14.7 15.3 16.8 19.0 21.7 22.1 25.0 15 years . . . . . . . . . . . . . . . . . . 152 18.3 0.34 † 14.7 15.3 16.0 17.3 19.7 21.0 22.3 26.9 16 years . . . . . . . . . . . . . . . . . . . 173 18.8 0.24 15.1 15.4 15.7 16.3 17.4 20.9 21.8 23.1 25.8 17 years . . . . . . . . . . . . . . . . . . 143 18.8 0.41 14.9 15.4 15.6 16.3 18.0 19.9 21.5 23.9 26.2 18 years . . . . . . . . . . . . . . . . . . 156 19.6 0.41 † 15.8 16.1 16.9 18.7 21.4 22.6 23.8 26.3 19 years . . . . . . . . . . . . . . . . . . 142 19.4 0.41 15.6 15.9 16.2 16.9 18.4 20.4 23.4 24.6 27.6
Female
8 years . . . . . . . . . . . . . . . . . . . 177 14.4 0.21 11.3 11.9 12.0 12.5 13.8 15.3 17.2 17.5 18.9 9 years . . . . . . . . . . . . . . . . . . . 198 15.5 0.28 11.8 12.2 12.5 12.9 14.8 17.2 18.6 19.8 21.7 10 years . . . . . . . . . . . . . . . . . . 182 15.5 0.28 11.5 12.4 12.7 13.5 14.9 17.0 18.2 18.7 21.1 11 years . . . . . . . . . . . . . . . . . . 221 16.4 0.28 12.5 13.1 13.3 13.8 15.5 18.3 19.9 20.8 22.7 12 years . . . . . . . . . . . . . . . . . . . 163 17.2 0.32 13.2 13.9 14.2 14.5 16.5 19.0 20.8 21.9 23.3 13 years . . . . . . . . . . . . . . . . . . . 156 17.1 0.33 13.7 13.9 14.6 14.9 16.0 18.1 20.5 21.5 22.8 14 years . . . . . . . . . . . . . . . . . . 162 17.4 0.30 13.9 14.5 14.9 15.3 16.5 19.0 20.9 21.4 22.5 15 years . . . . . . . . . . . . . . . . . . 145 18.1 0.45 13.4 14.6 15.0 15.6 17.1 20.0 22.2 23.1 24.4 16 years . . . . . . . . . . . . . . . . . . . 179 18.6 0.49 14.4 14.6 14.9 15.9 17.6 20.2 22.5 24.7 28.1 17 years . . . . . . . . . . . . . . . . . . 132 18.9 0.34 14.8 15.0 15.4 16.0 17.7 21.7 23.1 23.5 25.1 18 years . . . . . . . . . . . . . . . . . . 150 18.7 0.46 14.6 15.0 15.6 16.2 17.7 19.9 22.1 23.0 26.5 19 years . . . . . . . . . . . . . . . . . . 143 19.1 0.38 14.6 15.0 15.4 16.1 18.2 20.6 23.1 25.4 28.3
† Estimate not shown because the standard error could not be computed due to small sample size. 1Age at time of examination.
NOTE: Data exclude pregnant females.
SOURCE: NCHS, National Health and Nutrition Examination Survey.

Page 26 [ Series 3, No. 39
Table 22. Sagittal abdominal diameter in centimeters for females aged 20 and over and number of examined persons, mean, standard error of the mean, and selected percentiles, by race and Hispanic origin and age: United States, 2011–2014
Number of Standard Percentile examined error of
Race and Hispanic origin and age persons Mean the mean 5th 10th 15th 25th 50th 75th 85th 90th 95th
All racial and Hispanic-origin groups1 Centimeters
20 years and over . . . . . . . . . . . . . . . 4,954 21.9 0.10 15.8 16.6 17.2 18.4 21.2 24.7 26.7 28.1 30.3 20–29 years . . . . . . . . . . . . . . . . . 788 20.2 0.21 15.0 15.7 16.1 16.9 19.1 22.7 25.2 26.6 28.6 30–39 years . . . . . . . . . . . . . . . . . 862 21.4 0.17 15.5 16.4 16.9 17.7 20.4 24.3 26.2 27.4 29.9 40–49 years . . . . . . . . . . . . . . . . . 927 22.0 0.24 15.8 16.5 16.9 18.4 21.2 24.9 26.8 28.0 30.9 50–59 years . . . . . . . . . . . . . . . . . 870 22.9 0.23 16.5 17.4 18.1 19.3 22.4 25.7 27.9 29.8 31.9 60–69 years . . . . . . . . . . . . . . . . . 827 22.7 0.16 17.1 17.9 18.4 19.5 22.3 25.3 27.1 28.6 30.0 70–79 years . . . . . . . . . . . . . . . . . 443 23.1 0.23 16.9 18.4 19.1 20.0 23.1 25.7 27.3 28.4 29.8 80 years and over . . . . . . . . . . . . . 237 21.6 0.25 16.5 17.5 17.9 19.2 21.3 23.7 24.8 26.2 27.5
Non-Hispanic white
20 years and over . . . . . . . . . . . . . . . 1,971 21.8 0.13 15.8 16.6 17.1 18.2 21.1 24.4 26.6 27.9 30.1 20–39 years . . . . . . . . . . . . . . . . . 622 20.5 0.19 15.2 15.9 16.4 17.0 19.2 22.7 25.5 26.8 29.1 40–59 years . . . . . . . . . . . . . . . . . 655 22.2 0.22 16.1 16.6 17.1 18.5 21.5 24.9 27.1 28.9 31.8 60 years and over . . . . . . . . . . . . . 694 22.5 0.16 17.0 17.9 18.4 19.6 22.1 24.8 26.7 27.7 29.4
Non-Hispanic black
20 years and over . . . . . . . . . . . . . . . 1,140 24.1 0.13 17.4 18.8 19.5 20.8 23.8 26.8 28.5 29.9 31.6 20–39 years . . . . . . . . . . . . . . . . . 349 23.2 0.23 16.6 17.8 18.6 19.9 22.6 26.1 27.9 28.7 30.8 40–59 years . . . . . . . . . . . . . . . . . 450 24.6 0.23 18.0 19.3 20.1 21.1 24.3 27.4 29.3 30.8 32.0 60 years and over . . . . . . . . . . . . . 341 24.6 0.24 18.4 19.3 20.0 21.6 24.5 27.2 28.8 29.9 31.6
Non-Hispanic Asian
20 years and over . . . . . . . . . . . . . . . 634 18.9 0.17 14.6 15.1 15.7 16.5 18.2 20.6 22.1 23.6 24.9 20–39 years . . . . . . . . . . . . . . . . . 235 18.0 0.18 14.2 14.7 15.1 15.8 17.4 19.5 20.9 21.7 22.7 40–59 years . . . . . . . . . . . . . . . . . 248 19.3 0.27 15.0 15.6 15.9 16.8 18.5 21.0 23.2 24.1 25.5 60 years and over . . . . . . . . . . . . . 151 20.0 0.28 15.1 16.2 16.9 18.0 19.3 21.6 23.3 24.2 26.3
Hispanic2
20 years and over . . . . . . . . . . . . . . . 1,075 22.0 0.20 16.1 16.9 17.7 18.9 21.4 24.7 26.4 27.6 29.4 20–39 years . . . . . . . . . . . . . . . . . 376 21.1 0.29 15.5 16.3 16.9 17.9 20.4 23.9 25.5 26.5 28.3 40–59 years . . . . . . . . . . . . . . . . . 397 22.7 0.24 17.0 17.7 18.6 19.8 22.0 25.4 27.1 28.3 30.0 60 years and over . . . . . . . . . . . . . 302 23.2 0.26 17.6 18.6 19.1 20.0 22.8 25.9 27.3 28.8 30.0
Mexican American
20 years and over . . . . . . . . . . . . . . . 567 22.3 0.26 16.2 17.2 17.9 19.2 21.7 24.9 26.7 27.7 29.7 20–39 years . . . . . . . . . . . . . . . . . 221 21.4 0.37 15.5 16.4 17.0 18.3 20.7 24.3 25.6 26.6 28.4 40–59 years . . . . . . . . . . . . . . . . . 210 23.1 0.26 17.4 17.9 19.1 20.2 22.5 25.7 27.4 28.2 29.8 60 years and over . . . . . . . . . . . . . 136 *23.6 0.40 *17.4 *18.6 *19.3 *20.2 *23.0 *26.8 *28.8 *29.3 *30.5
* Estimate does not meet standards of reliability or precision based on less than 12 degrees of freedom. 1Includes persons of other races. 2Includes Mexican-American persons.
NOTE: Data exclude pregnant females.
SOURCE: NCHS, National Health and Nutrition Examination Survey.
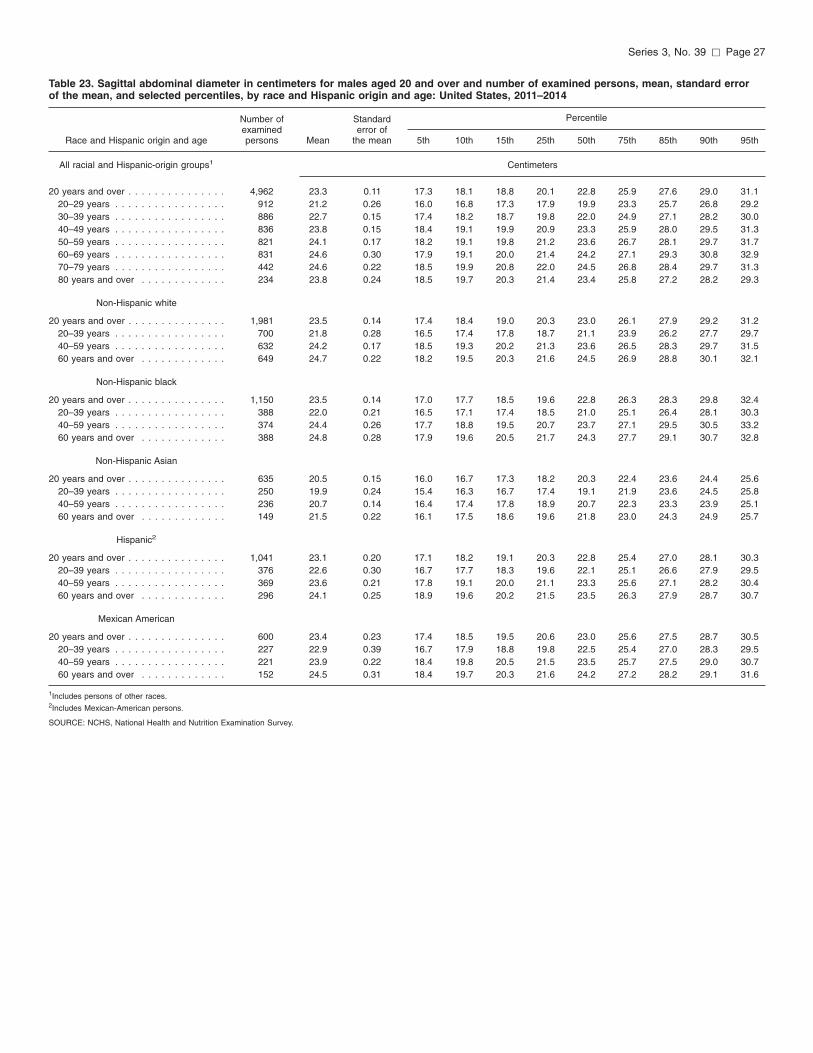
Series 3, No. 39 [ Page 27
Table 23. Sagittal abdominal diameter in centimeters for males aged 20 and over and number of examined persons, mean, standard error of the mean, and selected percentiles, by race and Hispanic origin and age: United States, 2011–2014
Race and Hispanic origin and age
Number of examined persons Mean
Standard error of
the mean 5th 10th 15th 25th
Percentile
50th 75th 85th 90th 95th
All racial and Hispanic-origin groups1 Centimeters
20 years and over . . . . . . . . . . . . . . . 4,962 23.3 0.11 17.3 18.1 18.8 20.1 22.8 25.9 27.6 29.0 31.1 20–29 years . . . . . . . . . . . . . . . . . 912 21.2 0.26 16.0 16.8 17.3 17.9 19.9 23.3 25.7 26.8 29.2 30–39 years . . . . . . . . . . . . . . . . . 886 22.7 0.15 17.4 18.2 18.7 19.8 22.0 24.9 27.1 28.2 30.0 40–49 years . . . . . . . . . . . . . . . . . 836 23.8 0.15 18.4 19.1 19.9 20.9 23.3 25.9 28.0 29.5 31.3 50–59 years . . . . . . . . . . . . . . . . . 821 24.1 0.17 18.2 19.1 19.8 21.2 23.6 26.7 28.1 29.7 31.7 60–69 years . . . . . . . . . . . . . . . . . 831 24.6 0.30 17.9 19.1 20.0 21.4 24.2 27.1 29.3 30.8 32.9 70–79 years . . . . . . . . . . . . . . . . . 442 24.6 0.22 18.5 19.9 20.8 22.0 24.5 26.8 28.4 29.7 31.3 80 years and over . . . . . . . . . . . . . 234 23.8 0.24 18.5 19.7 20.3 21.4 23.4 25.8 27.2 28.2 29.3
Non-Hispanic white
20 years and over . . . . . . . . . . . . . . . 1,981 23.5 0.14 17.4 18.4 19.0 20.3 23.0 26.1 27.9 29.2 31.2 20–39 years . . . . . . . . . . . . . . . . . 700 21.8 0.28 16.5 17.4 17.8 18.7 21.1 23.9 26.2 27.7 29.7 40–59 years . . . . . . . . . . . . . . . . . 632 24.2 0.17 18.5 19.3 20.2 21.3 23.6 26.5 28.3 29.7 31.5 60 years and over . . . . . . . . . . . . . 649 24.7 0.22 18.2 19.5 20.3 21.6 24.5 26.9 28.8 30.1 32.1
Non-Hispanic black
20 years and over . . . . . . . . . . . . . . . 1,150 23.5 0.14 17.0 17.7 18.5 19.6 22.8 26.3 28.3 29.8 32.4 20–39 years . . . . . . . . . . . . . . . . . 388 22.0 0.21 16.5 17.1 17.4 18.5 21.0 25.1 26.4 28.1 30.3 40–59 years . . . . . . . . . . . . . . . . . 374 24.4 0.26 17.7 18.8 19.5 20.7 23.7 27.1 29.5 30.5 33.2 60 years and over . . . . . . . . . . . . . 388 24.8 0.28 17.9 19.6 20.5 21.7 24.3 27.7 29.1 30.7 32.8
Non-Hispanic Asian
20 years and over . . . . . . . . . . . . . . . 635 20.5 0.15 16.0 16.7 17.3 18.2 20.3 22.4 23.6 24.4 25.6 20–39 years . . . . . . . . . . . . . . . . . 250 19.9 0.24 15.4 16.3 16.7 17.4 19.1 21.9 23.6 24.5 25.8 40–59 years . . . . . . . . . . . . . . . . . 236 20.7 0.14 16.4 17.4 17.8 18.9 20.7 22.3 23.3 23.9 25.1 60 years and over . . . . . . . . . . . . . 149 21.5 0.22 16.1 17.5 18.6 19.6 21.8 23.0 24.3 24.9 25.7
Hispanic2
20 years and over . . . . . . . . . . . . . . . 1,041 23.1 0.20 17.1 18.2 19.1 20.3 22.8 25.4 27.0 28.1 30.3 20–39 years . . . . . . . . . . . . . . . . . 376 22.6 0.30 16.7 17.7 18.3 19.6 22.1 25.1 26.6 27.9 29.5 40–59 years . . . . . . . . . . . . . . . . . 369 23.6 0.21 17.8 19.1 20.0 21.1 23.3 25.6 27.1 28.2 30.4 60 years and over . . . . . . . . . . . . . 296 24.1 0.25 18.9 19.6 20.2 21.5 23.5 26.3 27.9 28.7 30.7
Mexican American
20 years and over . . . . . . . . . . . . . . . 600 23.4 0.23 17.4 18.5 19.5 20.6 23.0 25.6 27.5 28.7 30.5 20–39 years . . . . . . . . . . . . . . . . . 227 22.9 0.39 16.7 17.9 18.8 19.8 22.5 25.4 27.0 28.3 29.5 40–59 years . . . . . . . . . . . . . . . . . 221 23.9 0.22 18.4 19.8 20.5 21.5 23.5 25.7 27.5 29.0 30.7 60 years and over . . . . . . . . . . . . . 152 24.5 0.31 18.4 19.7 20.3 21.6 24.2 27.2 28.2 29.1 31.6
1Includes persons of other races. 2Includes Mexican-American persons.
SOURCE: NCHS, National Health and Nutrition Examination Survey.

Page 28 [ Series 3, No. 39
Table 24. Midarm circumference in centimeters for children and adolescents aged 2 months through 19 years and number of examined persons, mean, standard error of the mean, and selected percentiles, by sex and age: United States, 2011–2014
Sex and age1
Number of examined persons Mean
Standard error of
the mean 5th 10th 15th 25th
Percentile
50th 75th 85th 90th 95th
Male Centimeters
2–5 months . . . . . . . . . . . . . . . . 93 14.1 0.11 12.1 12.4 12.8 13.2 14.1 14.9 15.3 15.6 16.5 6–8 months . . . . . . . . . . . . . . . . . 103 14.8 0.12 13.1 13.2 13.3 13.9 14.8 15.5 16.1 16.2 16.4 9–11 months . . . . . . . . . . . . . . . . 95 15.4 0.15 13.3 13.8 14.2 14.5 15.3 16.2 16.5 16.7 17.3 1 year . . . . . . . . . . . . . . . . . . . . 228 15.5 0.08 13.6 14.2 14.4 14.9 15.4 16.1 16.7 16.9 17.3 2 years . . . . . . . . . . . . . . . . . . . 227 16.2 0.09 14.5 14.8 15.1 15.4 16.1 16.7 17.1 17.5 18.6 3 years . . . . . . . . . . . . . . . . . . . 214 16.6 0.11 14.9 15.2 15.5 15.9 16.4 17.4 17.9 18.1 18.4 4 years . . . . . . . . . . . . . . . . . . . 217 17.3 0.10 15.2 15.5 15.8 16.1 16.9 18.1 18.9 19.2 20.8 5 years . . . . . . . . . . . . . . . . . . . 184 18.1 0.21 15.4 15.8 16.3 16.8 17.6 18.9 19.7 20.3 22.6 6 years . . . . . . . . . . . . . . . . . . . 238 18.8 0.20 15.7 16.5 16.8 17.4 18.3 19.5 20.8 21.2 22.7 7 years . . . . . . . . . . . . . . . . . . . 228 20.0 0.21 16.5 16.9 17.1 18.0 19.1 21.0 22.9 24.8 26.4 8 years . . . . . . . . . . . . . . . . . . . 223 20.9 0.23 16.9 17.4 17.9 18.4 20.3 22.8 24.2 25.2 26.6 9 years . . . . . . . . . . . . . . . . . . . 216 21.4 0.30 17.1 17.7 17.8 18.9 20.6 22.9 24.8 26.2 28.2 10 years . . . . . . . . . . . . . . . . . . 199 22.9 0.45 17.6 18.7 19.1 19.9 21.9 25.4 27.2 28.7 29.9 11 years . . . . . . . . . . . . . . . . . . 182 25.2 0.42 19.2 20.0 20.4 21.7 24.9 27.9 29.6 30.6 32.6 12 years . . . . . . . . . . . . . . . . . . . 173 25.4 0.45 20.0 20.7 21.4 22.2 24.7 27.5 29.5 31.4 34.1 13 years . . . . . . . . . . . . . . . . . . . 170 27.5 0.42 21.2 22.0 22.8 24.0 26.6 30.4 32.2 34.0 35.1 14 years . . . . . . . . . . . . . . . . . . 177 28.3 0.33 21.8 23.8 24.0 25.2 27.6 29.8 33.2 35.0 37.3 15 years . . . . . . . . . . . . . . . . . . 153 29.7 0.50 22.4 23.8 24.5 26.0 28.7 33.1 35.2 35.7 39.8 16 years . . . . . . . . . . . . . . . . . . . 174 30.8 0.33 24.6 25.7 26.0 27.1 30.2 33.8 35.6 36.4 39.3 17 years . . . . . . . . . . . . . . . . . . 144 30.7 0.47 24.3 25.1 26.2 27.5 30.4 32.9 34.6 37.1 38.3 18 years . . . . . . . . . . . . . . . . . . 157 32.8 0.70 26.0 26.5 27.5 28.9 32.0 34.9 37.8 39.5 42.1 19 years . . . . . . . . . . . . . . . . . . 142 32.1 0.53 25.4 25.9 27.2 28.6 31.3 34.7 37.0 39.4 42.9
Female
2–5 months . . . . . . . . . . . . . . . . 113 13.6 0.10 11.5 12.1 12.3 12.9 13.5 14.3 14.7 14.9 15.2 6–8 months . . . . . . . . . . . . . . . . . 90 14.5 0.13 12.8 13.1 13.2 13.7 14.4 15.0 15.5 15.8 †
9–11 months . . . . . . . . . . . . . . . . 104 15.3 0.19 13.2 13.8 13.9 14.4 15.2 16.3 16.7 16.9 †
1 year . . . . . . . . . . . . . . . . . . . . 215 15.6 0.10 13.5 14.0 14.3 14.7 15.6 16.3 16.7 17.0 17.6 2 years . . . . . . . . . . . . . . . . . . . 267 16.2 0.10 14.4 14.6 14.8 15.2 16.1 16.9 17.4 17.7 18.3 3 years . . . . . . . . . . . . . . . . . . . 184 16.8 0.15 14.6 15.0 15.3 15.8 16.5 17.4 18.1 18.7 19.4 4 years . . . . . . . . . . . . . . . . . . . 196 17.5 0.19 15.0 15.4 15.7 16.2 17.3 18.5 19.0 19.5 21.3 5 years . . . . . . . . . . . . . . . . . . . 171 18.1 0.17 15.5 15.9 16.2 16.8 17.7 18.9 19.4 20.8 22.6 6 years . . . . . . . . . . . . . . . . . . . 211 19.1 0.26 15.7 16.2 16.7 17.3 18.6 20.2 22.1 23.0 23.6 7 years . . . . . . . . . . . . . . . . . . . 204 19.9 0.30 16.0 16.7 17.1 17.7 19.0 21.5 22.6 24.8 26.0 8 years . . . . . . . . . . . . . . . . . . . 192 21.3 0.24 17.4 17.9 18.1 18.8 20.5 23.4 24.4 25.0 26.8 9 years . . . . . . . . . . . . . . . . . . . 201 23.0 0.31 17.8 18.7 19.3 20.0 22.0 25.0 27.2 28.3 30.2 10 years . . . . . . . . . . . . . . . . . . 182 23.5 0.41 17.5 18.6 19.4 20.6 23.2 25.7 27.7 28.5 29.7 11 years . . . . . . . . . . . . . . . . . . 226 24.6 0.37 18.9 19.4 20.3 21.5 23.7 27.1 28.9 30.6 32.2 12 years . . . . . . . . . . . . . . . . . . . 164 26.5 0.50 19.9 21.0 21.6 22.8 25.5 29.5 31.7 33.0 36.5 13 years . . . . . . . . . . . . . . . . . . . 157 26.0 0.52 20.4 21.1 21.7 23.1 25.2 28.7 30.5 31.8 34.0 14 years . . . . . . . . . . . . . . . . . . 164 27.3 0.54 21.2 22.0 22.7 24.2 25.7 30.4 32.7 34.0 34.9 15 years . . . . . . . . . . . . . . . . . . 148 28.5 0.70 22.1 23.9 24.3 24.8 27.6 30.4 34.0 35.1 37.9 16 years . . . . . . . . . . . . . . . . . . . 180 28.8 0.53 23.0 24.3 24.8 25.4 27.1 31.0 34.4 37.0 39.6 17 years . . . . . . . . . . . . . . . . . . 134 29.4 0.48 22.9 24.1 24.4 25.9 27.8 32.5 34.3 35.8 36.6 18 years . . . . . . . . . . . . . . . . . . 153 29.4 0.80 21.8 24.2 25.2 25.6 28.1 31.2 34.1 36.7 †
19 years . . . . . . . . . . . . . . . . . . 149 30.0 0.63 23.1 24.1 24.8 25.8 28.3 32.6 36.4 38.8 42.6
† Estimate not shown because the standard error could not be computed due to small sample size. 1Age at time of examination.
NOTE: Data exclude pregnant females.
SOURCE: NCHS, National Health and Nutrition Examination Survey.
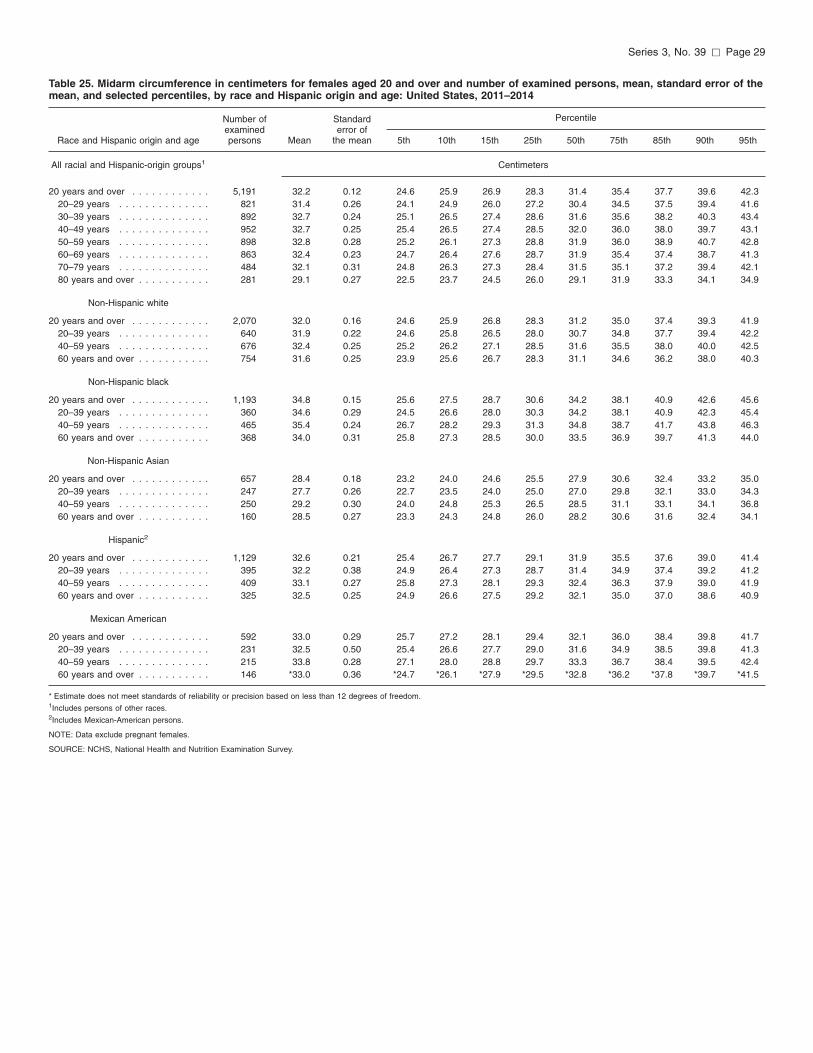
Series 3, No. 39 [ Page 29
Table 25. Midarm circumference in centimeters for females aged 20 and over and number of examined persons, mean, standard error of the mean, and selected percentiles, by race and Hispanic origin and age: United States, 2011–2014
Number of Standard Percentile examined error of
Race and Hispanic origin and age persons Mean the mean 5th 10th 15th 25th 50th 75th 85th 90th 95th
All racial and Hispanic-origin groups1 Centimeters
20 years and over . . . . . . . . . . . . 5,191 32.2 0.12 24.6 25.9 26.9 28.3 31.4 35.4 37.7 39.6 42.3 20–29 years . . . . . . . . . . . . . . 821 31.4 0.26 24.1 24.9 26.0 27.2 30.4 34.5 37.5 39.4 41.6 30–39 years . . . . . . . . . . . . . . 892 32.7 0.24 25.1 26.5 27.4 28.6 31.6 35.6 38.2 40.3 43.4 40–49 years . . . . . . . . . . . . . . 952 32.7 0.25 25.4 26.5 27.4 28.5 32.0 36.0 38.0 39.7 43.1 50–59 years . . . . . . . . . . . . . . 898 32.8 0.28 25.2 26.1 27.3 28.8 31.9 36.0 38.9 40.7 42.8 60–69 years . . . . . . . . . . . . . . 863 32.4 0.23 24.7 26.4 27.6 28.7 31.9 35.4 37.4 38.7 41.3 70–79 years . . . . . . . . . . . . . . 484 32.1 0.31 24.8 26.3 27.3 28.4 31.5 35.1 37.2 39.4 42.1 80 years and over . . . . . . . . . . . 281 29.1 0.27 22.5 23.7 24.5 26.0 29.1 31.9 33.3 34.1 34.9
Non-Hispanic white
20 years and over . . . . . . . . . . . . 2,070 32.0 0.16 24.6 25.9 26.8 28.3 31.2 35.0 37.4 39.3 41.9 20–39 years . . . . . . . . . . . . . . 640 31.9 0.22 24.6 25.8 26.5 28.0 30.7 34.8 37.7 39.4 42.2 40–59 years . . . . . . . . . . . . . . 676 32.4 0.25 25.2 26.2 27.1 28.5 31.6 35.5 38.0 40.0 42.5 60 years and over . . . . . . . . . . . 754 31.6 0.25 23.9 25.6 26.7 28.3 31.1 34.6 36.2 38.0 40.3
Non-Hispanic black
20 years and over . . . . . . . . . . . . 1,193 34.8 0.15 25.6 27.5 28.7 30.6 34.2 38.1 40.9 42.6 45.6 20–39 years . . . . . . . . . . . . . . 360 34.6 0.29 24.5 26.6 28.0 30.3 34.2 38.1 40.9 42.3 45.4 40–59 years . . . . . . . . . . . . . . 465 35.4 0.24 26.7 28.2 29.3 31.3 34.8 38.7 41.7 43.8 46.3 60 years and over . . . . . . . . . . . 368 34.0 0.31 25.8 27.3 28.5 30.0 33.5 36.9 39.7 41.3 44.0
Non-Hispanic Asian
20 years and over . . . . . . . . . . . . 657 28.4 0.18 23.2 24.0 24.6 25.5 27.9 30.6 32.4 33.2 35.0 20–39 years . . . . . . . . . . . . . . 247 27.7 0.26 22.7 23.5 24.0 25.0 27.0 29.8 32.1 33.0 34.3 40–59 years . . . . . . . . . . . . . . 250 29.2 0.30 24.0 24.8 25.3 26.5 28.5 31.1 33.1 34.1 36.8 60 years and over . . . . . . . . . . . 160 28.5 0.27 23.3 24.3 24.8 26.0 28.2 30.6 31.6 32.4 34.1
Hispanic2
20 years and over . . . . . . . . . . . . 1,129 32.6 0.21 25.4 26.7 27.7 29.1 31.9 35.5 37.6 39.0 41.4 20–39 years . . . . . . . . . . . . . . 395 32.2 0.38 24.9 26.4 27.3 28.7 31.4 34.9 37.4 39.2 41.2 40–59 years . . . . . . . . . . . . . . 409 33.1 0.27 25.8 27.3 28.1 29.3 32.4 36.3 37.9 39.0 41.9 60 years and over . . . . . . . . . . . 325 32.5 0.25 24.9 26.6 27.5 29.2 32.1 35.0 37.0 38.6 40.9
Mexican American
20 years and over . . . . . . . . . . . . 592 33.0 0.29 25.7 27.2 28.1 29.4 32.1 36.0 38.4 39.8 41.7 20–39 years . . . . . . . . . . . . . . 231 32.5 0.50 25.4 26.6 27.7 29.0 31.6 34.9 38.5 39.8 41.3 40–59 years . . . . . . . . . . . . . . 215 33.8 0.28 27.1 28.0 28.8 29.7 33.3 36.7 38.4 39.5 42.4 60 years and over . . . . . . . . . . . 146 *33.0 0.36 *24.7 *26.1 *27.9 *29.5 *32.8 *36.2 *37.8 *39.7 *41.5
* Estimate does not meet standards of reliability or precision based on less than 12 degrees of freedom. 1Includes persons of other races. 2Includes Mexican-American persons.
NOTE: Data exclude pregnant females.
SOURCE: NCHS, National Health and Nutrition Examination Survey.

Page 30 [ Series 3, No. 39
Table 26. Midarm circumference in centimeters for males aged 20 and over and number of examined persons, mean, standard error of the mean, and selected percentiles, by race and Hispanic origin and age: United States, 2011–2014
Race and Hispanic origin and age
Number of examined persons Mean
Standard error of
the mean 5th 10th 15th 25th
Percentile
50th 75th 85th 90th 95th
All racial and Hispanic-origin groups1 Centimeters
20 years and over . . . . . . . . . . . . . . . 5,059 34.3 0.08 27.7 28.9 29.8 31.2 33.9 36.8 38.3 39.5 41.7 20–29 years . . . . . . . . . . . . . . . . . 917 33.7 0.28 26.8 28.0 28.7 30.2 33.2 36.7 38.4 39.5 42.4 30–39 years . . . . . . . . . . . . . . . . . 892 35.0 0.16 28.5 29.8 30.5 31.9 34.6 37.4 39.2 40.3 42.4 40–49 years . . . . . . . . . . . . . . . . . 849 35.3 0.15 29.0 30.5 31.2 32.6 35.1 37.4 38.9 40.0 42.2 50–59 years . . . . . . . . . . . . . . . . . 836 34.4 0.19 28.1 29.3 30.0 31.7 34.2 37.0 38.2 39.5 41.7 60–69 years . . . . . . . . . . . . . . . . . 850 34.0 0.25 28.1 29.2 29.9 31.0 33.8 36.1 38.0 39.4 41.7 70–79 years . . . . . . . . . . . . . . . . . 460 32.8 0.17 26.7 27.9 29.1 30.5 32.7 35.0 36.4 37.7 39.1 80 years and over . . . . . . . . . . . . . 255 30.9 0.24 24.9 26.9 27.5 28.7 30.7 33.0 34.3 35.6 36.7
Non-Hispanic white
20 years and over . . . . . . . . . . . . . . . 2,030 34.3 0.10 27.9 29.1 29.9 31.4 34.0 36.8 38.2 39.4 41.6 20–39 years . . . . . . . . . . . . . . . . . 703 34.2 0.26 27.7 28.6 29.5 30.9 33.7 36.9 38.5 39.7 42.1 40–59 years . . . . . . . . . . . . . . . . . 645 35.0 0.19 28.6 29.8 31.0 32.4 34.9 37.2 38.6 39.5 41.6 60 years and over . . . . . . . . . . . . . 682 33.5 0.19 27.4 28.6 29.5 30.7 33.0 35.6 37.4 38.4 40.4
Non-Hispanic black
20 years and over . . . . . . . . . . . . . . . 1,174 35.2 0.16 27.0 28.5 29.8 31.4 35.0 38.5 40.3 41.8 44.1 20–39 years . . . . . . . . . . . . . . . . . 390 35.1 0.35 26.9 28.2 29.3 31.2 34.8 38.7 40.4 41.7 44.2 40–59 years . . . . . . . . . . . . . . . . . 383 36.0 0.25 27.5 29.5 30.6 32.1 35.5 39.3 41.1 42.7 44.7 60 years and over . . . . . . . . . . . . . 401 33.7 0.32 26.0 27.9 29.1 30.4 33.4 36.5 38.4 39.9 41.7
Non-Hispanic Asian
20 years and over . . . . . . . . . . . . . . . 641 31.3 0.17 25.7 27.1 27.9 29.0 30.9 33.5 34.8 35.9 37.4 20–39 years . . . . . . . . . . . . . . . . . 251 31.9 0.32 25.5 26.7 27.6 28.9 31.4 34.5 36.1 37.0 38.5 40–59 years . . . . . . . . . . . . . . . . . 238 31.3 0.20 26.8 28.0 28.6 29.5 30.9 33.0 34.0 34.8 36.3 60 years and over . . . . . . . . . . . . . 152 29.9 0.23 25.2 26.2 26.8 28.2 29.6 31.6 32.6 33.6 35.0
Hispanic2
20 years and over . . . . . . . . . . . . . . . 1,053 34.4 0.18 28.3 29.6 30.5 31.7 34.2 36.7 38.1 39.2 41.1 20–39 years . . . . . . . . . . . . . . . . . 378 34.7 0.28 28.0 29.6 30.8 31.9 34.5 37.2 38.7 39.8 41.7 40–59 years . . . . . . . . . . . . . . . . . 373 34.5 0.19 29.1 30.3 31.0 32.1 34.3 36.3 37.7 38.3 40.8 60 years and over . . . . . . . . . . . . . 302 32.6 0.23 27.2 28.4 29.2 30.3 32.2 34.7 36.0 37.2 39.1
Mexican American
20 years and over . . . . . . . . . . . . . . . 606 34.5 0.16 28.5 30.1 30.9 32.0 34.3 36.7 38.1 39.0 41.1 20–39 years . . . . . . . . . . . . . . . . . 229 34.9 0.28 28.6 30.3 31.1 32.2 34.7 37.2 38.7 39.8 41.7 40–59 years . . . . . . . . . . . . . . . . . 223 34.4 0.25 29.1 30.4 31.1 32.2 34.3 36.2 37.7 38.2 39.9 60 years and over . . . . . . . . . . . . . 154 33.0 0.28 27.1 28.5 29.4 30.5 32.7 35.2 36.5 38.0 39.5
1Includes persons of other races. 2Includes Mexican-American persons.
SOURCE: NCHS, National Health and Nutrition Examination Survey.
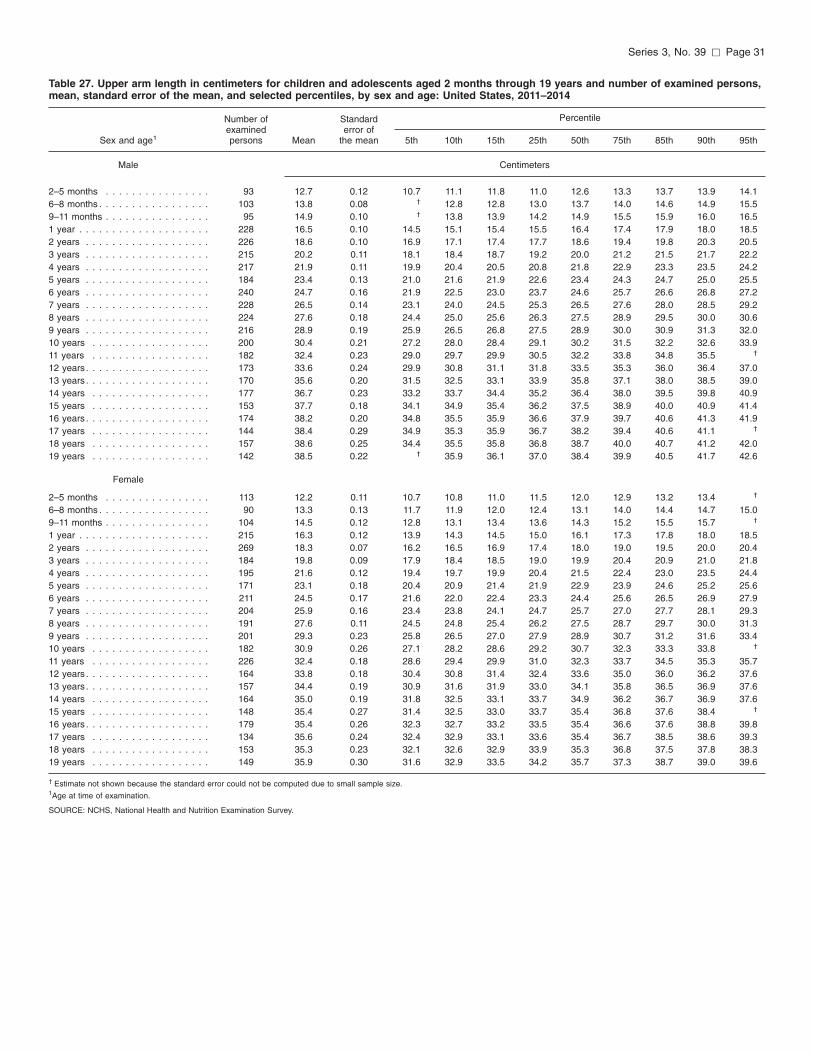
Series 3, No. 39 [ Page 31
Table 27. Upper arm length in centimeters for children and adolescents aged 2 months through 19 years and number of examined persons, mean, standard error of the mean, and selected percentiles, by sex and age: United States, 2011–2014
Sex and age1
Number of examined persons Mean
Standard error of
the mean 5th 10th 15th 25th
Percentile
50th 75th 85th 90th 95th
Male Centimeters
2–5 months . . . . . . . . . . . . . . . . 93 12.7 0.12 10.7 11.1 11.8 11.0 12.6 13.3 13.7 13.9 14.1 6–8 months . . . . . . . . . . . . . . . . . 103 13.8 0.08 † 12.8 12.8 13.0 13.7 14.0 14.6 14.9 15.5 9–11 months . . . . . . . . . . . . . . . . 95 14.9 0.10 † 13.8 13.9 14.2 14.9 15.5 15.9 16.0 16.5 1 year . . . . . . . . . . . . . . . . . . . . 228 16.5 0.10 14.5 15.1 15.4 15.5 16.4 17.4 17.9 18.0 18.5 2 years . . . . . . . . . . . . . . . . . . . 226 18.6 0.10 16.9 17.1 17.4 17.7 18.6 19.4 19.8 20.3 20.5 3 years . . . . . . . . . . . . . . . . . . . 215 20.2 0.11 18.1 18.4 18.7 19.2 20.0 21.2 21.5 21.7 22.2 4 years . . . . . . . . . . . . . . . . . . . 217 21.9 0.11 19.9 20.4 20.5 20.8 21.8 22.9 23.3 23.5 24.2 5 years . . . . . . . . . . . . . . . . . . . 184 23.4 0.13 21.0 21.6 21.9 22.6 23.4 24.3 24.7 25.0 25.5 6 years . . . . . . . . . . . . . . . . . . . 240 24.7 0.16 21.9 22.5 23.0 23.7 24.6 25.7 26.6 26.8 27.2 7 years . . . . . . . . . . . . . . . . . . . 228 26.5 0.14 23.1 24.0 24.5 25.3 26.5 27.6 28.0 28.5 29.2 8 years . . . . . . . . . . . . . . . . . . . 224 27.6 0.18 24.4 25.0 25.6 26.3 27.5 28.9 29.5 30.0 30.6 9 years . . . . . . . . . . . . . . . . . . . 216 28.9 0.19 25.9 26.5 26.8 27.5 28.9 30.0 30.9 31.3 32.0 10 years . . . . . . . . . . . . . . . . . . 200 30.4 0.21 27.2 28.0 28.4 29.1 30.2 31.5 32.2 32.6 33.9 11 years . . . . . . . . . . . . . . . . . . 182 32.4 0.23 29.0 29.7 29.9 30.5 32.2 33.8 34.8 35.5 †
12 years . . . . . . . . . . . . . . . . . . . 173 33.6 0.24 29.9 30.8 31.1 31.8 33.5 35.3 36.0 36.4 37.0 13 years . . . . . . . . . . . . . . . . . . . 170 35.6 0.20 31.5 32.5 33.1 33.9 35.8 37.1 38.0 38.5 39.0 14 years . . . . . . . . . . . . . . . . . . 177 36.7 0.23 33.2 33.7 34.4 35.2 36.4 38.0 39.5 39.8 40.9 15 years . . . . . . . . . . . . . . . . . . 153 37.7 0.18 34.1 34.9 35.4 36.2 37.5 38.9 40.0 40.9 41.4 16 years . . . . . . . . . . . . . . . . . . . 174 38.2 0.20 34.8 35.5 35.9 36.6 37.9 39.7 40.6 41.3 41.9 17 years . . . . . . . . . . . . . . . . . . 144 38.4 0.29 34.9 35.3 35.9 36.7 38.2 39.4 40.6 41.1 †
18 years . . . . . . . . . . . . . . . . . . 157 38.6 0.25 34.4 35.5 35.8 36.8 38.7 40.0 40.7 41.2 42.0 19 years . . . . . . . . . . . . . . . . . . 142 38.5 0.22 † 35.9 36.1 37.0 38.4 39.9 40.5 41.7 42.6
Female
2–5 months . . . . . . . . . . . . . . . . 113 12.2 0.11 10.7 10.8 11.0 11.5 12.0 12.9 13.2 13.4 †
6–8 months . . . . . . . . . . . . . . . . . 90 13.3 0.13 11.7 11.9 12.0 12.4 13.1 14.0 14.4 14.7 15.0 9–11 months . . . . . . . . . . . . . . . . 104 14.5 0.12 12.8 13.1 13.4 13.6 14.3 15.2 15.5 15.7 †
1 year . . . . . . . . . . . . . . . . . . . . 215 16.3 0.12 13.9 14.3 14.5 15.0 16.1 17.3 17.8 18.0 18.5 2 years . . . . . . . . . . . . . . . . . . . 269 18.3 0.07 16.2 16.5 16.9 17.4 18.0 19.0 19.5 20.0 20.4 3 years . . . . . . . . . . . . . . . . . . . 184 19.8 0.09 17.9 18.4 18.5 19.0 19.9 20.4 20.9 21.0 21.8 4 years . . . . . . . . . . . . . . . . . . . 195 21.6 0.12 19.4 19.7 19.9 20.4 21.5 22.4 23.0 23.5 24.4 5 years . . . . . . . . . . . . . . . . . . . 171 23.1 0.18 20.4 20.9 21.4 21.9 22.9 23.9 24.6 25.2 25.6 6 years . . . . . . . . . . . . . . . . . . . 211 24.5 0.17 21.6 22.0 22.4 23.3 24.4 25.6 26.5 26.9 27.9 7 years . . . . . . . . . . . . . . . . . . . 204 25.9 0.16 23.4 23.8 24.1 24.7 25.7 27.0 27.7 28.1 29.3 8 years . . . . . . . . . . . . . . . . . . . 191 27.6 0.11 24.5 24.8 25.4 26.2 27.5 28.7 29.7 30.0 31.3 9 years . . . . . . . . . . . . . . . . . . . 201 29.3 0.23 25.8 26.5 27.0 27.9 28.9 30.7 31.2 31.6 33.4 10 years . . . . . . . . . . . . . . . . . . 182 30.9 0.26 27.1 28.2 28.6 29.2 30.7 32.3 33.3 33.8 †
11 years . . . . . . . . . . . . . . . . . . 226 32.4 0.18 28.6 29.4 29.9 31.0 32.3 33.7 34.5 35.3 35.7 12 years . . . . . . . . . . . . . . . . . . . 164 33.8 0.18 30.4 30.8 31.4 32.4 33.6 35.0 36.0 36.2 37.6 13 years . . . . . . . . . . . . . . . . . . . 157 34.4 0.19 30.9 31.6 31.9 33.0 34.1 35.8 36.5 36.9 37.6 14 years . . . . . . . . . . . . . . . . . . 164 35.0 0.19 31.8 32.5 33.1 33.7 34.9 36.2 36.7 36.9 37.6 15 years . . . . . . . . . . . . . . . . . . 148 35.4 0.27 31.4 32.5 33.0 33.7 35.4 36.8 37.6 38.4 †
16 years . . . . . . . . . . . . . . . . . . . 179 35.4 0.26 32.3 32.7 33.2 33.5 35.4 36.6 37.6 38.8 39.8 17 years . . . . . . . . . . . . . . . . . . 134 35.6 0.24 32.4 32.9 33.1 33.6 35.4 36.7 38.5 38.6 39.3 18 years . . . . . . . . . . . . . . . . . . 153 35.3 0.23 32.1 32.6 32.9 33.9 35.3 36.8 37.5 37.8 38.3 19 years . . . . . . . . . . . . . . . . . . 149 35.9 0.30 31.6 32.9 33.5 34.2 35.7 37.3 38.7 39.0 39.6
† Estimate not shown because the standard error could not be computed due to small sample size. 1Age at time of examination.
SOURCE: NCHS, National Health and Nutrition Examination Survey.

Page 32 [ Series 3, No. 39
Table 28. Upper arm length in centimeters for females aged 20 and over and number of examined persons, mean, standard error of the mean, and selected percentiles, by race and Hispanic origin and age: United States, 2011–2014
Number of Standard Percentile examined error of
Race and Hispanic origin and age persons Mean the mean 5th 10th 15th 25th 50th 75th 85th 90th 95th
All racial and Hispanic-origin groups1 Centimeters
20 years and over . . . . . . . . . . . . . . . 5,302 35.9 0.07 32.4 33.0 33.6 34.4 35.9 37.2 38.1 38.7 39.6 20–29 years . . . . . . . . . . . . . . . . . 891 35.7 0.08 32.4 33.1 33.6 34.3 35.5 37.0 37.9 38.5 39.4 30–39 years . . . . . . . . . . . . . . . . . 930 36.1 0.09 32.4 32.9 33.6 34.5 36.0 37.4 38.5 39.2 40.0 40–49 years . . . . . . . . . . . . . . . . . 956 36.0 0.10 32.5 33.1 33.7 34.4 35.9 37.3 38.2 39.0 39.9 50–59 years . . . . . . . . . . . . . . . . . 897 35.9 0.11 32.3 33.0 33.6 34.4 36.0 37.5 38.1 38.6 39.5 60–69 years . . . . . . . . . . . . . . . . . 863 35.9 0.10 32.3 33.0 33.6 34.4 35.9 37.1 37.9 38.4 39.3 70–79 years . . . . . . . . . . . . . . . . . 485 35.9 0.11 32.2 33.2 33.7 34.4 35.9 37.2 38.4 39.0 39.8 80 years and over . . . . . . . . . . . . . 280 35.4 0.16 31.8 32.6 33.1 34.0 35.4 37.0 37.7 38.1 38.8
Non-Hispanic white
20 years and over . . . . . . . . . . . . . . . 2,109 36.1 0.08 32.7 33.5 34.0 34.7 36.0 37.3 38.1 38.8 39.5 20–39 years . . . . . . . . . . . . . . . . . 679 36.2 0.09 32.8 33.6 34.0 34.8 36.0 37.4 38.4 38.9 39.7 40–59 years . . . . . . . . . . . . . . . . . 677 36.2 0.11 32.8 33.6 34.0 34.7 36.1 37.5 38.2 38.9 39.6 60 years and over . . . . . . . . . . . . . 753 36.0 0.09 32.4 33.3 33.9 34.5 35.9 37.1 37.9 38.5 39.3
Non-Hispanic black
20 years and over . . . . . . . . . . . . . . . 1,226 36.9 0.07 32.9 33.9 34.5 35.3 36.9 38.3 39.2 39.9 40.7 20–39 years . . . . . . . . . . . . . . . . . 392 36.7 0.12 32.5 33.8 34.3 35.1 36.5 38.1 39.2 39.9 40.7 40–59 years . . . . . . . . . . . . . . . . . 465 37.1 0.12 33.2 34.2 34.7 35.5 37.0 38.4 39.3 39.9 40.6 60 years and over . . . . . . . . . . . . . 369 36.9 0.16 32.9 34.0 34.5 35.1 37.0 38.3 39.2 39.7 41.1
Non-Hispanic Asian
20 years and over . . . . . . . . . . . . . . . 672 33.8 0.09 30.7 31.5 31.9 32.5 33.7 35.0 35.6 36.0 36.9 20–39 years . . . . . . . . . . . . . . . . . 260 34.0 0.13 30.8 31.6 32.1 32.7 34.0 35.2 35.8 36.3 36.9 40–59 years . . . . . . . . . . . . . . . . . 252 33.9 0.14 30.9 31.5 31.9 32.5 33.7 35.0 35.7 36.3 37.2 60 years and over . . . . . . . . . . . . . 160 33.3 0.20 30.3 30.8 31.5 32.0 33.2 34.5 35.2 35.6 36.0
Hispanic2
20 years and over . . . . . . . . . . . . . . . 1,148 34.9 0.08 31.5 32.4 32.7 33.4 34.8 36.2 37.0 37.5 38.4 20–39 years . . . . . . . . . . . . . . . . . 414 35.1 0.12 31.8 32.5 32.9 33.6 35.0 36.3 37.0 37.6 38.5 40–59 years . . . . . . . . . . . . . . . . . 409 34.7 0.12 31.5 32.1 32.5 33.2 34.6 36.2 37.0 37.5 38.1 60 years and over . . . . . . . . . . . . . 325 34.6 0.12 31.2 32.0 32.4 33.2 34.4 35.8 36.7 37.4 38.3
Mexican American
20 years and over . . . . . . . . . . . . . . . 602 34.9 0.10 31.5 32.3 32.6 33.4 34.8 36.2 37.0 37.5 38.3 20–39 years . . . . . . . . . . . . . . . . . 240 35.0 0.16 31.5 32.5 32.9 33.5 34.9 36.2 37.0 37.4 38.5 40–59 years . . . . . . . . . . . . . . . . . 216 34.8 0.14 31.4 32.0 32.5 33.4 34.6 36.3 37.0 37.6 38.0 60 years and over . . . . . . . . . . . . . 146 *34.6 0.21 *31.3 *31.9 *32.3 *33.0 *34.3 *35.8 *36.7 *37.7 *38.2
* Estimate does not meet standards of reliability or precision based on less than 12 degrees of freedom. 1Includes persons of other races. 2Includes Mexican-American persons.
SOURCE: NCHS, National Health and Nutrition Examination Survey.

Series 3, No. 39 [ Page 33
Table 29. Upper arm length in centimeters for males aged 20 and over and number of examined persons, mean, standard error of the mean, and selected percentiles, by race and Hispanic origin and age: United States, 2011–2014
Race and Hispanic origin and age
Number of examined persons Mean
Standard error of
the mean 5th 10th 15th 25th
Percentile
50th 75th 85th 90th 95th
All racial and Hispanic-origin groups1 Centimeters
20 years and over . . . . . . . . . . . . . . . 5,059 39.1 0.07 35.2 36.1 36.7 37.5 39.1 40.7 41.5 42.0 43.0 20–29 years . . . . . . . . . . . . . . . . . 918 38.9 0.10 34.7 35.8 36.3 37.1 38.7 40.5 41.6 42.1 43.0 30–39 years . . . . . . . . . . . . . . . . . 890 39.1 0.09 35.4 36.1 36.6 37.5 39.0 40.4 41.4 41.9 42.9 40–49 years . . . . . . . . . . . . . . . . . 848 39.2 0.12 35.3 36.3 36.8 37.6 39.1 40.5 41.5 41.9 43.2 50–59 years . . . . . . . . . . . . . . . . . 837 39.3 0.12 35.6 36.4 37.0 37.7 39.2 40.8 41.6 42.0 43.1 60–69 years . . . . . . . . . . . . . . . . . 850 39.4 0.16 35.4 36.2 36.9 37.8 39.3 41.0 41.8 42.4 43.4 70–79 years . . . . . . . . . . . . . . . . . 461 39.0 0.15 35.0 35.8 36.4 37.3 38.9 40.7 41.4 41.9 42.6 80 years and over . . . . . . . . . . . . . 255 39.2 0.18 34.8 35.7 36.3 37.8 39.5 40.9 41.6 42.3 42.9
Non-Hispanic white
20 years and over . . . . . . . . . . . . . . . 2,030 39.5 0.08 35.9 36.6 37.2 37.9 39.4 40.9 41.7 42.2 43.2 20–39 years . . . . . . . . . . . . . . . . . 703 39.2 0.11 35.5 36.3 37.0 37.6 39.1 40.6 41.7 42.2 43.0 40–59 years . . . . . . . . . . . . . . . . . 645 39.6 0.12 36.4 36.9 37.3 38.0 39.5 40.9 41.7 42.2 43.3 60 years and over . . . . . . . . . . . . . 682 39.6 0.14 35.8 36.5 37.2 38.0 39.5 41.0 41.9 42.4 43.3
Non-Hispanic black
20 years and over . . . . . . . . . . . . . . . 1,173 39.6 0.11 35.7 36.4 37.0 37.9 39.6 41.2 42.0 42.8 43.6 20–39 years . . . . . . . . . . . . . . . . . 389 39.6 0.22 35.7 36.2 36.8 37.7 39.5 41.4 42.3 42.9 43.5 40–59 years . . . . . . . . . . . . . . . . . 382 39.7 0.12 35.7 36.7 37.2 38.0 39.7 41.2 42.0 42.6 43.7 60 years and over . . . . . . . . . . . . . 402 39.5 0.10 35.5 36.5 37.2 37.9 39.5 41.0 41.8 42.4 43.1
Non-Hispanic Asian
20 years and over . . . . . . . . . . . . . . . 641 37.0 0.12 33.4 34.2 34.7 35.5 36.9 38.4 39.3 39.9 40.5 20–39 years . . . . . . . . . . . . . . . . . 251 37.3 0.16 33.7 34.4 34.9 35.9 37.3 38.8 39.8 40.0 40.9 40–59 years . . . . . . . . . . . . . . . . . 238 37.2 0.14 33.7 34.6 35.2 35.6 37.1 38.3 39.2 39.9 40.4 60 years and over . . . . . . . . . . . . . 152 36.1 0.18 32.5 33.2 33.9 34.6 36.1 37.5 38.0 38.6 39.5
Hispanic2
20 years and over . . . . . . . . . . . . . . . 1,054 38.1 0.10 34.5 35.3 35.7 36.5 38.0 39.5 40.3 40.9 41.8 20–39 years . . . . . . . . . . . . . . . . . 378 38.3 0.14 34.8 35.5 36.0 36.7 38.1 39.6 40.4 41.0 41.9 40–59 years . . . . . . . . . . . . . . . . . 374 38.0 0.14 34.3 35.1 35.5 36.4 38.0 39.4 40.4 40.9 41.8 60 years and over . . . . . . . . . . . . . 302 37.4 0.11 34.1 34.9 35.4 36.1 37.2 38.5 39.5 40.0 40.8
Mexican American
20 years and over . . . . . . . . . . . . . . . 607 38.0 0.12 34.5 35.4 35.8 36.4 37.9 39.5 40.2 40.7 41.6 20–39 years . . . . . . . . . . . . . . . . . 229 38.1 0.16 34.6 35.4 35.9 36.5 38.0 39.5 40.3 40.9 41.7 40–59 years . . . . . . . . . . . . . . . . . 224 38.0 0.18 34.5 35.2 35.7 36.4 38.0 39.5 40.2 40.6 41.7 60 years and over . . . . . . . . . . . . . 154 37.5 0.12 34.3 35.0 35.4 36.3 37.3 38.5 39.6 40.1 40.7
1Includes persons of other races. 2Includes Mexican-American persons.
SOURCE: NCHS, National Health and Nutrition Examination Survey.
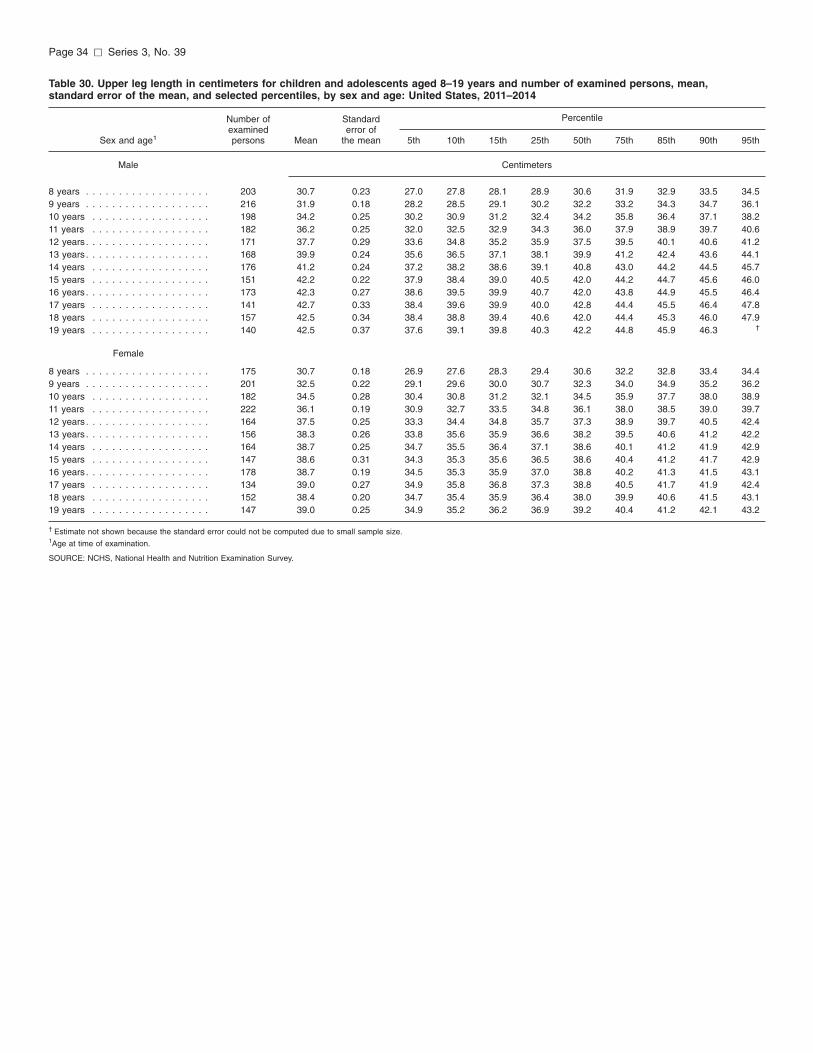
Page 34 [ Series 3, No. 39
Table 30. Upper leg length in centimeters for children and adolescents aged 8–19 years and number of examined persons, mean, standard error of the mean, and selected percentiles, by sex and age: United States, 2011–2014
Sex and age1
Number of examined persons Mean
Standard error of
the mean 5th 10th 15th 25th
Percentile
50th 75th 85th 90th 95th
Male Centimeters
8 years . . . . . . . . . . . . . . . . . . . 203 30.7 0.23 27.0 27.8 28.1 28.9 30.6 31.9 32.9 33.5 34.5 9 years . . . . . . . . . . . . . . . . . . . 216 31.9 0.18 28.2 28.5 29.1 30.2 32.2 33.2 34.3 34.7 36.1 10 years . . . . . . . . . . . . . . . . . . 198 34.2 0.25 30.2 30.9 31.2 32.4 34.2 35.8 36.4 37.1 38.2 11 years . . . . . . . . . . . . . . . . . . 182 36.2 0.25 32.0 32.5 32.9 34.3 36.0 37.9 38.9 39.7 40.6 12 years . . . . . . . . . . . . . . . . . . . 171 37.7 0.29 33.6 34.8 35.2 35.9 37.5 39.5 40.1 40.6 41.2 13 years . . . . . . . . . . . . . . . . . . . 168 39.9 0.24 35.6 36.5 37.1 38.1 39.9 41.2 42.4 43.6 44.1 14 years . . . . . . . . . . . . . . . . . . 176 41.2 0.24 37.2 38.2 38.6 39.1 40.8 43.0 44.2 44.5 45.7 15 years . . . . . . . . . . . . . . . . . . 151 42.2 0.22 37.9 38.4 39.0 40.5 42.0 44.2 44.7 45.6 46.0 16 years . . . . . . . . . . . . . . . . . . . 173 42.3 0.27 38.6 39.5 39.9 40.7 42.0 43.8 44.9 45.5 46.4 17 years . . . . . . . . . . . . . . . . . . 141 42.7 0.33 38.4 39.6 39.9 40.0 42.8 44.4 45.5 46.4 47.8 18 years . . . . . . . . . . . . . . . . . . 157 42.5 0.34 38.4 38.8 39.4 40.6 42.0 44.4 45.3 46.0 47.9 19 years . . . . . . . . . . . . . . . . . . 140 42.5 0.37 37.6 39.1 39.8 40.3 42.2 44.8 45.9 46.3 †
Female
8 years . . . . . . . . . . . . . . . . . . . 175 30.7 0.18 26.9 27.6 28.3 29.4 30.6 32.2 32.8 33.4 34.4 9 years . . . . . . . . . . . . . . . . . . . 201 32.5 0.22 29.1 29.6 30.0 30.7 32.3 34.0 34.9 35.2 36.2 10 years . . . . . . . . . . . . . . . . . . 182 34.5 0.28 30.4 30.8 31.2 32.1 34.5 35.9 37.7 38.0 38.9 11 years . . . . . . . . . . . . . . . . . . 222 36.1 0.19 30.9 32.7 33.5 34.8 36.1 38.0 38.5 39.0 39.7 12 years . . . . . . . . . . . . . . . . . . . 164 37.5 0.25 33.3 34.4 34.8 35.7 37.3 38.9 39.7 40.5 42.4 13 years . . . . . . . . . . . . . . . . . . . 156 38.3 0.26 33.8 35.6 35.9 36.6 38.2 39.5 40.6 41.2 42.2 14 years . . . . . . . . . . . . . . . . . . 164 38.7 0.25 34.7 35.5 36.4 37.1 38.6 40.1 41.2 41.9 42.9 15 years . . . . . . . . . . . . . . . . . . 147 38.6 0.31 34.3 35.3 35.6 36.5 38.6 40.4 41.2 41.7 42.9 16 years . . . . . . . . . . . . . . . . . . . 178 38.7 0.19 34.5 35.3 35.9 37.0 38.8 40.2 41.3 41.5 43.1 17 years . . . . . . . . . . . . . . . . . . 134 39.0 0.27 34.9 35.8 36.8 37.3 38.8 40.5 41.7 41.9 42.4 18 years . . . . . . . . . . . . . . . . . . 152 38.4 0.20 34.7 35.4 35.9 36.4 38.0 39.9 40.6 41.5 43.1 19 years . . . . . . . . . . . . . . . . . . 147 39.0 0.25 34.9 35.2 36.2 36.9 39.2 40.4 41.2 42.1 43.2
† Estimate not shown because the standard error could not be computed due to small sample size. 1Age at time of examination.
SOURCE: NCHS, National Health and Nutrition Examination Survey.
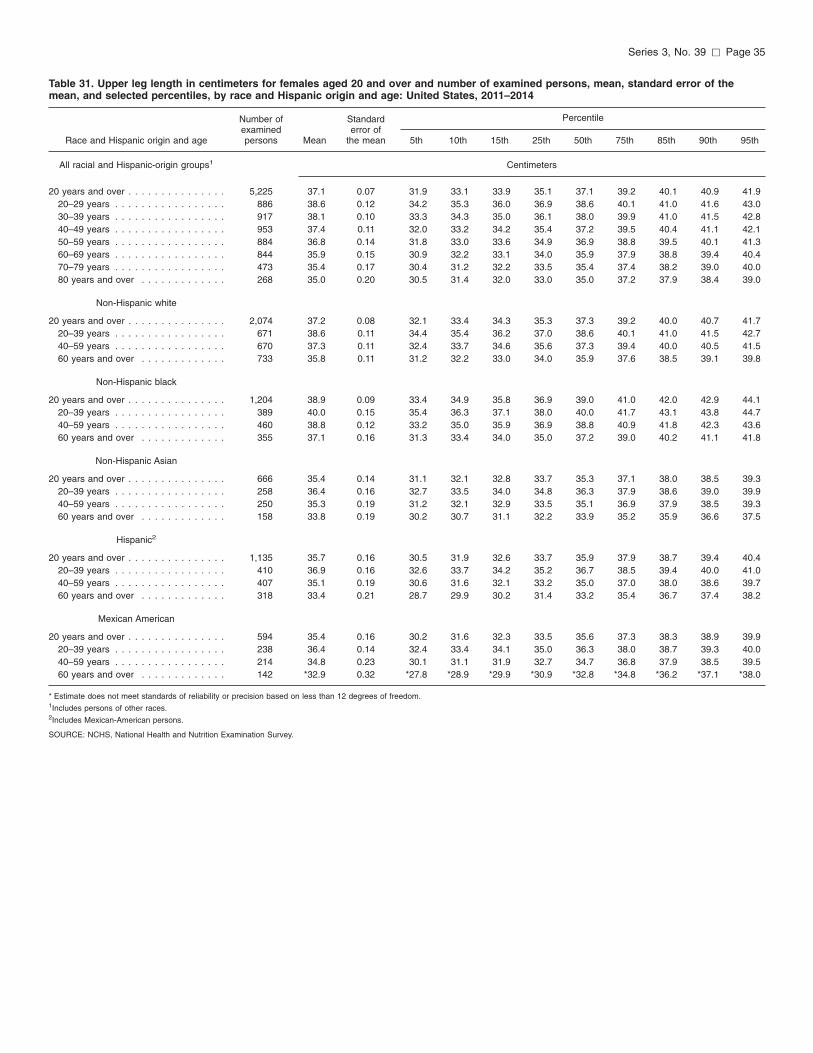
Series 3, No. 39 [ Page 35
Table 31. Upper leg length in centimeters for females aged 20 and over and number of examined persons, mean, standard error of the mean, and selected percentiles, by race and Hispanic origin and age: United States, 2011–2014
Number of Standard Percentile examined error of
Race and Hispanic origin and age persons Mean the mean 5th 10th 15th 25th 50th 75th 85th 90th 95th
All racial and Hispanic-origin groups1 Centimeters
20 years and over . . . . . . . . . . . . . . . 5,225 37.1 0.07 31.9 33.1 33.9 35.1 37.1 39.2 40.1 40.9 41.9 20–29 years . . . . . . . . . . . . . . . . . 886 38.6 0.12 34.2 35.3 36.0 36.9 38.6 40.1 41.0 41.6 43.0 30–39 years . . . . . . . . . . . . . . . . . 917 38.1 0.10 33.3 34.3 35.0 36.1 38.0 39.9 41.0 41.5 42.8 40–49 years . . . . . . . . . . . . . . . . . 953 37.4 0.11 32.0 33.2 34.2 35.4 37.2 39.5 40.4 41.1 42.1 50–59 years . . . . . . . . . . . . . . . . . 884 36.8 0.14 31.8 33.0 33.6 34.9 36.9 38.8 39.5 40.1 41.3 60–69 years . . . . . . . . . . . . . . . . . 844 35.9 0.15 30.9 32.2 33.1 34.0 35.9 37.9 38.8 39.4 40.4 70–79 years . . . . . . . . . . . . . . . . . 473 35.4 0.17 30.4 31.2 32.2 33.5 35.4 37.4 38.2 39.0 40.0 80 years and over . . . . . . . . . . . . . 268 35.0 0.20 30.5 31.4 32.0 33.0 35.0 37.2 37.9 38.4 39.0
Non-Hispanic white
20 years and over . . . . . . . . . . . . . . . 2,074 37.2 0.08 32.1 33.4 34.3 35.3 37.3 39.2 40.0 40.7 41.7 20–39 years . . . . . . . . . . . . . . . . . 671 38.6 0.11 34.4 35.4 36.2 37.0 38.6 40.1 41.0 41.5 42.7 40–59 years . . . . . . . . . . . . . . . . . 670 37.3 0.11 32.4 33.7 34.6 35.6 37.3 39.4 40.0 40.5 41.5 60 years and over . . . . . . . . . . . . . 733 35.8 0.11 31.2 32.2 33.0 34.0 35.9 37.6 38.5 39.1 39.8
Non-Hispanic black
20 years and over . . . . . . . . . . . . . . . 1,204 38.9 0.09 33.4 34.9 35.8 36.9 39.0 41.0 42.0 42.9 44.1 20–39 years . . . . . . . . . . . . . . . . . 389 40.0 0.15 35.4 36.3 37.1 38.0 40.0 41.7 43.1 43.8 44.7 40–59 years . . . . . . . . . . . . . . . . . 460 38.8 0.12 33.2 35.0 35.9 36.9 38.8 40.9 41.8 42.3 43.6 60 years and over . . . . . . . . . . . . . 355 37.1 0.16 31.3 33.4 34.0 35.0 37.2 39.0 40.2 41.1 41.8
Non-Hispanic Asian
20 years and over . . . . . . . . . . . . . . . 666 35.4 0.14 31.1 32.1 32.8 33.7 35.3 37.1 38.0 38.5 39.3 20–39 years . . . . . . . . . . . . . . . . . 258 36.4 0.16 32.7 33.5 34.0 34.8 36.3 37.9 38.6 39.0 39.9 40–59 years . . . . . . . . . . . . . . . . . 250 35.3 0.19 31.2 32.1 32.9 33.5 35.1 36.9 37.9 38.5 39.3 60 years and over . . . . . . . . . . . . . 158 33.8 0.19 30.2 30.7 31.1 32.2 33.9 35.2 35.9 36.6 37.5
Hispanic2
20 years and over . . . . . . . . . . . . . . . 1,135 35.7 0.16 30.5 31.9 32.6 33.7 35.9 37.9 38.7 39.4 40.4 20–39 years . . . . . . . . . . . . . . . . . 410 36.9 0.16 32.6 33.7 34.2 35.2 36.7 38.5 39.4 40.0 41.0 40–59 years . . . . . . . . . . . . . . . . . 407 35.1 0.19 30.6 31.6 32.1 33.2 35.0 37.0 38.0 38.6 39.7 60 years and over . . . . . . . . . . . . . 318 33.4 0.21 28.7 29.9 30.2 31.4 33.2 35.4 36.7 37.4 38.2
Mexican American
20 years and over . . . . . . . . . . . . . . . 594 35.4 0.16 30.2 31.6 32.3 33.5 35.6 37.3 38.3 38.9 39.9 20–39 years . . . . . . . . . . . . . . . . . 238 36.4 0.14 32.4 33.4 34.1 35.0 36.3 38.0 38.7 39.3 40.0 40–59 years . . . . . . . . . . . . . . . . . 214 34.8 0.23 30.1 31.1 31.9 32.7 34.7 36.8 37.9 38.5 39.5 60 years and over . . . . . . . . . . . . . 142 *32.9 0.32 *27.8 *28.9 *29.9 *30.9 *32.8 *34.8 *36.2 *37.1 *38.0
* Estimate does not meet standards of reliability or precision based on less than 12 degrees of freedom. 1Includes persons of other races. 2Includes Mexican-American persons.
SOURCE: NCHS, National Health and Nutrition Examination Survey.

Page 36 [ Series 3, No. 39
Table 32. Upper leg length in centimeters for males aged 20 and over and number of examined persons, mean, standard error of the mean, and selected percentiles, by race and Hispanic origin and age: United States, 2011–2014
Race and Hispanic origin and age
Number of examined persons Mean
Standard error of
the mean 5th 10th 15th 25th
Percentile
50th 75th 85th 90th 95th
All racial and Hispanic-origin groups1 Centimeters
20 years and over . . . . . . . . . . . . . . . 5,013 41.2 0.09 36.2 37.2 38.0 39.1 41.1 43.1 44.2 45.0 46.1 20–29 years . . . . . . . . . . . . . . . . . 912 42.3 0.09 37.5 38.6 39.3 40.2 42.3 44.0 45.1 46.1 47.0 30–39 years . . . . . . . . . . . . . . . . . 887 41.8 0.10 37.3 38.3 39.2 40.0 41.7 43.6 44.6 45.2 46.3 40–49 years . . . . . . . . . . . . . . . . . 837 41.3 0.15 36.7 37.6 38.2 39.3 41.1 43.1 44.2 45.0 46.0 50–59 years . . . . . . . . . . . . . . . . . 832 40.9 0.17 35.8 37.0 37.9 39.0 41.0 42.9 44.1 44.8 45.5 60–69 years . . . . . . . . . . . . . . . . . 841 40.2 0.26 34.9 36.3 37.0 38.1 40.1 42.4 43.5 44.2 45.4 70–79 years . . . . . . . . . . . . . . . . . 454 39.2 0.14 34.3 35.5 36.2 37.0 39.2 41.2 42.2 42.9 44.2 80 years and over . . . . . . . . . . . . . 250 39.4 0.22 34.5 35.6 36.5 37.3 39.2 41.2 42.4 43.2 44.3
Non-Hispanic white
20 years and over . . . . . . . . . . . . . . . 2,012 41.3 0.11 36.5 37.5 38.3 39.4 41.3 43.2 44.3 45.0 46.1 20–39 years . . . . . . . . . . . . . . . . . 701 42.3 0.11 38.0 39.1 39.6 40.4 42.3 43.8 44.9 45.9 46.9 40–59 years . . . . . . . . . . . . . . . . . 638 41.4 0.16 36.8 37.9 38.5 39.5 41.3 43.1 44.3 45.0 45.7 60 years and over . . . . . . . . . . . . . 673 40.0 0.20 35.1 36.3 37.0 38.0 39.9 42.0 43.1 44.0 45.0
Non-Hispanic black
20 years and over . . . . . . . . . . . . . . . 1,159 42.7 0.11 37.6 38.9 39.4 40.5 42.6 44.7 45.7 46.4 47.6 20–39 years . . . . . . . . . . . . . . . . . 388 43.6 0.20 38.8 39.9 40.2 41.4 43.6 45.4 46.5 47.3 48.4 40–59 years . . . . . . . . . . . . . . . . . 377 42.4 0.15 37.8 39.0 39.4 40.4 42.4 44.2 45.3 45.9 47.2 60 years and over . . . . . . . . . . . . . 394 41.1 0.16 36.0 37.4 38.0 38.9 41.1 43.1 44.2 44.9 45.9
Non-Hispanic Asian
20 years and over . . . . . . . . . . . . . . . 637 39.3 0.15 34.5 35.7 36.4 37.2 39.2 41.1 42.1 42.9 44.2 20–39 years . . . . . . . . . . . . . . . . . 248 40.5 0.16 36.4 37.1 37.9 38.4 40.4 42.1 43.5 44.3 44.8 40–59 years . . . . . . . . . . . . . . . . . 237 39.0 0.20 34.9 36.1 36.5 37.2 38.9 40.9 41.3 41.9 42.9 60 years and over . . . . . . . . . . . . . 152 36.9 0.18 33.0 33.7 34.1 35.2 36.8 38.5 39.5 40.0 40.7
Hispanic2
20 years and over . . . . . . . . . . . . . . . 1,048 40.0 0.09 35.0 36.2 37.0 38.0 40.0 42.0 43.0 43.8 44.6 20–39 years . . . . . . . . . . . . . . . . . 375 40.8 0.13 36.3 37.4 38.1 39.1 40.6 42.6 43.5 44.2 45.0 40–59 years . . . . . . . . . . . . . . . . . 372 39.6 0.14 34.7 35.6 36.5 37.7 39.6 41.2 42.5 43.3 44.5 60 years and over . . . . . . . . . . . . . 301 37.8 0.16 33.7 34.4 35.0 35.9 37.6 39.4 40.5 41.4 42.6
Mexican American
20 years and over . . . . . . . . . . . . . . . 602 39.9 0.10 34.8 35.9 36.7 37.9 40.0 41.7 43.0 43.9 44.7 20–39 years . . . . . . . . . . . . . . . . . 227 40.7 0.17 36.0 37.2 37.8 39.0 40.6 42.4 43.6 44.2 45.0 40–59 years . . . . . . . . . . . . . . . . . 222 39.3 0.19 34.6 35.4 36.1 37.1 39.2 40.9 42.2 43.0 44.4 60 years and over . . . . . . . . . . . . . 153 37.8 0.24 33.7 34.4 35.0 35.8 37.7 39.1 40.4 41.4 42.6
1Includes persons of other races. 2Includes Mexican-American persons.
SOURCE: NCHS, National Health and Nutrition Examination Survey.

Series 3, No. 39 [ Page 37
Appendix
Appendix table. Historical summary of published anthropometric reference data
Survey years
Measurement 1960–19621–3 1963–19654 1966–19705 1971–19746,7 1976–19808 1988–19949 1999–200210 2003–200611 2007–201012 2011–2014
Weight, height, and length
Weight . . . . . . . . . . . . x x x x x x x x x x Standing height . . . . . . x x x x x x x x x x Recumbent length . . . . . . . . . . . . . . . . x x x x x x Sitting height . . . . . . . . x x . . . x x x . . . . . . . . . . . . Knee height . . . . . . . . x x . . . . . . . . . x . . . . . . . . . . . . Elbow rest height . . . . . x . . . . . . . . . . . . . . . . . . . . . . . . . . . Popliteal height . . . . . . . x x . . . . . . . . . . . . . . . . . . . . . . . . Thigh clearance height . . x x . . . . . . . . . . . . . . . . . . . . . . . . Buttock-knee length . . . x x . . . . . . . . . . . . . . . . . . . . . . . . Buttock-popliteal length . . x x . . . . . . . . . . . . . . . . . . . . . . . . Elbow-wrist length . . . . . . . x . . . . . . . . . . . . . . . . . . . . . . . . Hand length . . . . . . . . . . . x . . . . . . . . . . . . . . . . . . . . . . . . Upper arm length . . . . . . . . x . . . . . . . . . x x x x x Upper leg length . . . . . . . . . . . . . . . . . . . . . x x x x x Foot length . . . . . . . . . . . . x . . . . . . . . . . . . . . . . . . . . . . . . Crown-rump length . . . . . . . . . . . . . . . . x . . . . . . . . . . . . . . .
Indices
Body mass index13 . . . . . . . . . . . . . . . . x x x x x x
Skinfolds
Subscapular skinfold . . . x x x x x x x x x . . . Triceps skinfold . . . . . . x x x x x x x x x . . . Thigh skinfold . . . . . . . . . . . . . . . . . . . . . . x . . . . . . . . . . . . Suprailiac skinfold . . . . . . . . . . . . . . . . . . . . x . . . . . . . . . . . .
Circumferences and breadths
Head circumference . . . . . . . . . . . . . . . x x x x x x Chest circumference . . . x x . . . x x . . . . . . . . . . . . . . . Waist circumference. . . . x x . . . . . . . . . x x x x x Sagittal abdominal . . . . diameter . . . . . . . . . . . . . . . . . . . . . . . . . . . . . . . . . . . . . x
Midarm circumference . . . x x x x x x x x x x Midthigh circumference . . . . . . . . . . . . . . . . . x x x . . . . . . Buttocks circumference . . . . . x . . . . . . . . . x . . . . . . . . . . . . Maximal calf circumference . . . . . . . . . . . . . . . . . . . . . . . . . x x . . . . . .
Chest breadth . . . . . . . . . . x . . . . . . . . . . . . . . . . . . . . . . . . Hand breadth . . . . . . . . . . . x Wrist breadth . . . . . . . . . . . . . . . . . . . . . . . x . . . . . . . . . . . . Biacromial breadth . . . . . x . . . . . . . . . . . . x . . . . . . . . . . . . Biiliac breadth . . . . . . . . . . . . . . . . . . . . . . . x . . . . . . . . . . . .
See footnotes at end of table.

Page 38 [ Series 3, No. 39
Appendix table. Historical summary of published anthropometric reference data—Con.
Survey years
Measurement 1960–19621–3 1963–19654 1966–19705 1971–19746,7 1976–19808 1988–19949 1999–200210 2003–200611 2007–201012 2011–2014
Circumferences and breadths—Con.
Bitrochanteric breadth . . Elbow breadth . . . . . . . Elbow-elbow breadth . . . Seat breadth . . . . . . . . Foot breadth . . . . . . . .
. . .
. . . x x
. . .
. . .
. . . x x x
. . .
. . .
. . .
. . .
. . .
x x
. . .
. . .
. . .
x x
. . .
. . .
. . .
. . . x
. . .
. . .
. . .
. . .
. . .
. . .
. . .
. . .
. . .
. . .
. . .
. . .
. . .
. . .
. . .
. . .
. . .
. . .
. . .
. . .
. . .
. . .
. . .
. . . Category not applicable. 1Stoudt HW, Damon A, McFarland R, Roberts J. Weight, height, and selected body dimensions of adults. National Center for Health Statistics. Vital Health Stat 11(8). 1965. Available from: http:// www.cdc.gov/nchs/data/series/sr_11/sr11_008.pdf. 2Stoudt HW, Damon A, McFarland RA, Roberts J. Skinfolds, body girths, biacromial diameter, and selected anthropometric indices of adults: United States, 1960–1962. National Center for Health Statistics. Vital Health Stat 11(35). 1970. Available from: http://www.cdc.gov/nchs/data/series/sr_11/sr11_035acc.pdf. 3Roberts J. Weight by height and age of adults: United States, 1960–1962. National Center for Health Statistics. Vital Health Stat 11(14). 1966. Available from: http://www.cdc.gov/nchs/data/series/ sr_11/sr11_014acc.pdf. 4Malina RM, Hamill PVV, Lemeshow S. Selected body measurements of children 6–11 years: United States. National Center for Health Statistics. Vital Health Stat 11(123). 1973. Available from: http://www.cdc.gov/nchs/data/series/sr_11/sr11_123acc.pdf. 5Hamill PVV, Johnston FE, Lemeshow S. Height and weight of youths 12–17 years: United States. National Center for Health Statistics. Vital Health Stat 11(124). 1973. Available from: http://www.cdc.gov/nchs/data/series/sr_11/sr11_124.pdf. 6Abraham S, Johnson CL, Najjar MF. Weight and height of adults 18–74 years of age: United States, 1971–74. National Center for Health Statistics. Vital Health Stat 11(211). 1979. Available from: http://www.cdc.gov/nchs/data/series/sr_11/sr11_211.pdf. 7Johnson CL, Fulwood R, Abraham S, Bryner JD. Basic data on anthropometric measurements and angular measurements of the hip and knee joints for selected age groups 1–74 years of age: United States, 1971–1975. National Center for Health Statistics. Vital Health Stat 11(219). 1981. Available from: http://www.cdc.gov/nchs/data/series/sr_11/sr11_219.pdf. 8Najjar MF, Rowland M. Anthropometric reference data and prevalence of overweight: United States, 1976–80. National Center for Health Statistics. Vital Health Stat 11(238). 1987. Available from: http://www.cdc.gov/nchs/data/series/sr_11/sr11_238.pdf. 9McDowell MA, Fryar CD, Ogden CL. Anthropometric reference data for children and adults: United States, 1988–1994. National Center for Health Statistics. Vital Health Stat 11(249). 2009. Available from: http://www.cdc.gov/nchs/data/series/sr_11/sr11_249.pdf. 10McDowell MA, Fryar CD, Hirsch R, Ogden CL. Anthropometric reference data for children and adults: U.S. population, 1999–2002. Advance data from vital and health statistics; no 361. Hyattsville, MD: National Center for Health Statistics. 2005. Available from: http://www.cdc.gov/nchs/data/ad/ad361.pdf. 11McDowell MA, Fryar CD, Ogden CL, Flegal KM. Anthropometric reference data for children and adults: United States, 2003–2006. National health statistics reports; no 10. Hyattsville, MD: National Center for Health Statistics. 2008. Available from: http://www.cdc.gov/nchs/data/nhsr/nhsr010.pdf. 12Fryar CD, Gu Q, Ogden CL. Anthropometric reference data for children and adults: United States, 2007–2010. National Center for Health Statistics. Vital Health Stat 11(252). 2012. Available from: http://www.cdc.gov/nchs/data/series/sr_11/sr11_252.pdf. 13Body mass index (BMI) is calculated as: BMI = weight(kilograms)/height(meters2).
NOTE: Terminology for a particular measure may have changed across survey years.

Vital and Health Statistics Series Descriptions
Active Series
Series 1. Programs and Collection Procedures Reports describe the programs and data systems of the National Center for Health Statistics, and the data collection and survey methods used. Series 1 reports also include definitions, survey design, estimation, and other material necessary for understanding and analyzing the data.
Series 2. Data Evaluation and Methods Research Reports present new statistical methodology including experimental tests of new survey methods, studies of vital and health statistics collection methods, new analytical techniques, objective evaluations of reliability of collected data, and contributions to statistical theory. Reports also include comparison of U.S. methodology with those of other countries.
Series 3. Analytical and Epidemiological Studies Reports present data analyses, epidemiological studies, and descriptive statistics based on national surveys and data systems. As of 2015, Series 3 includes reports that would have previously been published in Series 5, 10–15, and 20– 23.
Discontinued Series
Series 4. Documents and Committee Reports Reports contain findings of major committees concerned with vital and health statistics and documents. The last Series 4 report was published in 2002; these are now included in Series 2 or another appropriate series.
Series 5. International Vital and Health Statistics Reports Reports present analytical and descriptive comparisons of U.S. vital and health statistics with those of other countries. The last Series 5 report was published in 2003; these are now included in Series 3 or another appropriate series.
Series 6. Cognition and Survey Measurement Reports use methods of cognitive science to design, evaluate, and test survey instruments. The last Series 6 report was published in 1999; these are now included in Series 2.
Series 10. Data From the National Health Interview Survey Reports present statistics on illness; accidental injuries; disability; use of hospital, medical, dental, and other services; and other health-related topics. As of 2015, these are included in Series 3.
Series 11. Data From the National Health Examination Survey, the National Health and Nutrition Examination Surveys, and the Hispanic Health and Nutrition Examination Survey Reports present 1) estimates of the medically defined prevalence of specific diseases in the United States and the distribution of the population with respect to physical, physiological, and psychological characteristics and 2) analysis of relationships among the various measurements. As of 2015, these are included in Series 3.
Series 12. Data From the Institutionalized Population Surveys The last Series 12 report was published in 1974; these reports were included in Series 13, and as of 2015 are in Series 3.
Series 13. Data From the National Health Care Survey Reports present statistics on health resources and use of health care resources based on data collected from health care providers and provider records. As of 2015, these reports are included in Series 3.
Series 14. Data on Health Resources: Manpower and Facilities The last Series 14 report was published in 1989; these reports were included in Series 13, and are now included in Series 3.
Series 15. Data From Special Surveys Reports contain statistics on health and health-related topics from surveys that are not a part of the continuing data systems of the National Center for Health Statistics. The last Series 15 report was published in 2002; these reports are now included in Series 3.
Series 16. Compilations of Advance Data From Vital and Health Statistics The last Series 16 report was published in 1996. All reports are available online; compilations are no longer needed.
Series 20. Data on Mortality Reports include analyses by cause of death and demographic variables, and geographic and trend analyses. The last Series 20 report was published in 2007; these reports are now included in Series 3.
Series 21. Data on Natality, Marriage, and Divorce Reports include analyses by health and demographic variables, and geographic and trend analyses. The last Series 21 report was published in 2006; these reports are now included in Series 3.
Series 22. Data From the National Natality and Mortality Surveys The last Series 22 report was published in 1973. Reports from sample surveys of vital records were included in Series 20 or 21, and are now included in Series 3.
Series 23. Data From the National Survey of Family Growth Reports contain statistics on factors that affect birth rates, factors affecting the formation and dissolution of families, and behavior related to the risk of HIV and other sexually transmitted diseases. The last Series 23 report was published in 2011; these reports are now included in Series 3.
Series 24. Compilations of Data on Natality, Mortality, Marriage, and Divorce The last Series 24 report was published in 1996. All reports are available online; compilations are no longer needed.
For answers to questions about this report or for a list of reports published in these series, contact:
Information Dissemination Staff National Center for Health Statistics Centers for Disease Control and Prevention 3311 Toledo Road, Room 5419 Hyattsville, MD 20782–2064
Tel: 1–800–CDC–INFO (1–800–232–4636) TTY: 1–888–232–6348 Internet: http://www.cdc.gov/nchs Online request form: http://www.cdc.gov/info For e-mail updates on NCHS publication releases, subscribe
online at: http://www.cdc.gov/nchs/govdelivery.htm.

U.S. DEPARTMENT OF HEALTH & HUMAN SERVICES
Centers for Disease Control and Prevention National Center for Health Statistics 3311 Toledo Road, Room 5419 Hyattsville, MD 20782–2064
OFFICIAL BUSINESS PENALTY FOR PRIVATE USE, $300
For more NCHS Series reports, visit: http://www.cdc.gov/nchs/products/series.htm.
FIRST CLASS MAIL POSTAGE & FEES PAID
CDC/NCHS PERMIT NO. G-284
DHHS Publication No. 2016–1604, Series 3, No. 39 CS265811
Related Documents