ANNUAL REPORT ON MIGRATION AND INTERNATIONAL PROTECTION STATISTICS FOR IRELAND: 2009 Corona Joyce December 2011

Welcome message from author
This document is posted to help you gain knowledge. Please leave a comment to let me know what you think about it! Share it to your friends and learn new things together.
Transcript
ANNUAL REPORT ON MIGRATION AND INTERNATIONAL PROTECTION STATISTICS FOR IRELAND: 2009
Corona Joyce
December 2011

ANNUAL REPORT ON MIGRATION
AND INTERNATIONAL PROTECTION
STATISTICS FOR IRELAND: 2009
Corona Joyce
December 2011
Study completed by the Irish National Contact Point of the European Migration Network (EMN)
which is financially supported by the European Union and the Irish Department of Justice and
Equality. The EMN has been established via Council Decision 2008/381/EC.
Available to download from www.emn.europa.eu and www.emn.ie
© The Economic and Social Research Institute Whitaker Square, Sir John Rogerson’s Quay, Dublin 2
ISBN 978-0-7070-0328-3
The European Migration Network
The aim of the European Migration Network (EMN) is to provide up-to-date, objective, reliable and
comparable information on migration and asylum at Member State and EU-level with a view to
supporting policymaking and informing the general public.
The Irish National Contact Point of the European Migration Network, EMN Ireland, is located at the
Economic and Social Research Institute (ESRI).
The ESRI
The Economic Research Institute was founded in Dublin in 1960, with the assistance of a grant from
the Ford Foundation of New York. In 1966 the remit of the Institute was expanded to include social
research, resulting in the Institute being renamed The Economic and Social Research Institute (ESRI).
In 2010 the Institute entered into a strategic research alliance with Trinity College Dublin, while
retaining its status as an independent research institute.
The ESRI is governed by an independent Council which acts as the board of the Institute with
responsibility for guaranteeing its independence and integrity. The Institute’s research strategy is
determined by the Council in association with the Director and staff. The research agenda seeks to
contribute to three overarching and interconnected goals, namely, economic growth, social progress
and environmental sustainability. The Institute’s research is disseminated through international and
national peer reviewed journals and books, in reports and books published directly by the Institute
itself and in the Institute’s working paper series. Researchers are responsible for the accuracy of
their research.
| iii
The Author
Corona Joyce is Senior Policy Officer of the Irish National Contact Point of the European Migration
Network.
Acknowledgements
Assistance in verifying specified data contained in the report by officials of the Central Statistics
Office (CSO) and the Department of Justice and Equality is greatly appreciated.
Sincere thanks are also due to my colleagues Elaine Byrne, Philip O’Connell and Emma Quinn for
their valued input.
The opinions presented in this report are those of the Irish National Contact Point of the European
Migration Network and do not represent the position of the Irish Department of Justice and
Equality or the European Commission Directorate General Home Affairs.

iv | Annual Report on Migration and International Protection Statistics for Ireland: 2009
Table of Contents
List of Tables v
List of Charts vi
Abbreviations and Irish Terms viii
CHAPTER 1 INTRODUCTION 1
CHAPTER 2 METHODOLOGY 9
CHAPTER 3 LEGAL IMMIGRATION AND INTEGRATION 11
3.1 International Migration, Usually Resident Population and Acquisition of
Citizenship (Article 3) 11
3.1.1 International Migration Flows 11
3.1.1.1 Immigration 11
3.1.1.2 Emigration 13
3.1.2 Usual Residence 14
3.1.3 Acquisition of Citizenship 17
3.2 Residence Permits and Residence of Third Country Nationals (Article 6) 18
3.2.1 All Residence Permits 18
3.2.2 New Residence Permits 19
3.2.3 Change of Status 20
3.2.4 Long-Term Residents 20
3.2.4.1 Long-Term Residency 20
3.2.4.2 General Permission to Remain 22
3.2.4.3 EU Treaty Rights Based on being the Spouse of an EU National 22
CHAPTER 4 ILLEGAL IMMIGRATION AND RETURN 23
4.1 Prevention of Illegal Entry and Stay – Apprehensions (Article 5.1b) 23
4.2 Returns (Article 7) 24
4.2.1 Voluntary Return 25
4.2.2 Judicial Review 25
CHAPTER 5 BORDER CONTROL 26
5.1 Prevention of Illegal Entry and Stay – Refusals (Article 5.1a) 27
5.2 Relationship between Refusals, Apprehensions and Returns 28
CHAPTER 6 ASYLUM AND INTERNATIONAL PROTECTION (ARTICLE 4) 29
6.1 Applications for International Protection 29
6.1.1 Asylum Applications 29
6.1.2 Withdrawn Applications for Asylum 30
6.2 Decisions on International Protection 31
6.2.1 First Instance Decisions 32
List of Tables | v
6.2.1.1 Decisions Withdrawing Status Granted at First Instance Decision 33
6.2.2 Final Instance Decisions 33
6.2.2.1 Decisions Withdrawing Status Granted as Final Decision 34
6.2.2.2 Leave to Remain 34
6.2.3 Resettlement 34
6.3 Dublin Transfers 35
6.3.1 Incoming Requests 35
6.3.2 Outgoing Requests 37
6.4 Unaccompanied Minors 38
CHAPTER 7 OPTIONAL: OTHER STATISTICS AND INFORMATION AVAILABLE 41
7.1 Certificates of Registration 41
7.2 Economic Migration 42
7.3 Personal Public Service Numbers (PPSN) Analysis 47
7.4 Family Reunification 54
7.5 Provisions for Victims of Trafficking 54
7.6 Visas 54
REFERENCES 55
ANNEX I 56
vi | Annual Report on Migration and International Protection Statistics for Ireland: 2009
List of Tables
Table 1: Migration Flows, 2002 – 2009 11
Table 2: Immigration by Broad Group of Citizenship, 2009 12
Table 3: Immigration by Country of Citizenship (Third Country Nationals); Country of Birth (Third Country Nationals); Country of Previous Residence (Non-EU), 2009 13
Table 4: Emigration by Broad Group of Citizenship, 2009 13
Table 5: Emigration by Country of Citizenship (Third Country Nationals) and Next Usual Residence (Non-EU), 2009 14
Table 6: Population by Citizenship: Breakdown by Sex and Age, 2009 15
Table 7: Population by Country of Birth: Breakdown by Sex and Age, 2009 16
Table 8: Population by Main Country of Citizenship (Third Country Nationals); Country of Birth (Third Country Nationals), 2009 17
Table 9: Acquisition of Citizenship by Sex and Age, 2009 17
Table 10: Acquisition of Citizenship by Country of Former Citizenship, 2009 18
Table 11: All Valid Residence Permits by Reason and Length of Validity, 2009 18
Table 12: All Valid Residence Permits by Main Country of Citizenship (Third Country Nationals), 2009 19
Table 13: First Permits by Reason and Citizenship, 2009 19
Table 14: First Permits by Main Country of Citizenship, 2009 20
Table 15: Change of Immigration Status Permits by Reason, 2009 20
Table 16: Long-Term Residents by Main Country of Citizenship, 2009 21
Table 17: Third Country Nationals Found to be Illegally Present by Sex and Age, 2009 23
Table 18: Third Country Nationals Found to be Illegally Present by Main Country of Citizenship, 2009 24
Table 19: Third Country Nationals Ordered to Leave by Citizenship, 2009 24
Table 20: Third Country Nationals Returned Following an Order to Leave by Main Country of Nationality, 2009 25
Table 21: Third Country Nationals Refused Entry by Ground for Refusal, 2009 27
Table 22: Third Country Nationals Refused Entry by Main Country of Citizenship, 2009 28
Table 23: New Asylum Applications, 1997-2009 29
Table 24: Overall Applications for Asylum by Main Country of Citizenship, 2009; New Asylum Applicants by Main Country of Citizenship, 2009 30
Table 25: Withdrawn Asylum Applications by Sex and Age, 2009 31
Table 26: Withdrawn Asylum Applications by Main Country of Citizenship, 2009 31
Table 27: First Instance Decisions on Asylum Applications by Type of Decision/Status, 2009 32
Table 28: First Instance Decisions on Asylum Applications by Main Country of Citizenship and Type of Decision/Status, 2009 32
List of Tables | vii
Table 29: Decisions Withdrawing Status Granted at First Instance Decision by Type of Status Withdrawn, 2009 33
Table 30: Final Instance Decisions on Asylum Applications by Type of Decision/Status, 2009 33
Table 31: Final Decisions on Asylum Applications by Main Country of Citizenship and Type of Decision / Status, 2009 34
Table 32: Decisions Withdrawing Status Granted as Final Decision by Type of Status Withdrawn, 2009 34
Table 33: Resettled Persons by Sex and Age, 2009 35
Table 34: Resettled Persons by Main Country of Citizenship, 2009 35
Table 35: Incoming Requests - Dublin Transfers, 2009 35
Table 36: Incoming Requests (Dublin Transfers) to Ireland by Reason for Request and Decision Taken, 2009 36
Table 37: Total Incoming Requests by Member State Requesting and Reason for Request, 2009 37
Table 38: Outgoing Requests - Dublin Transfers, 2009 37
Table 39: Outgoing Requests (Dublin Transfers) from Ireland by Reason for Request and Decision Taken, 2009 38
Table 40: Total Outgoing Requests by Member State, 2009 38
Table 41: Asylum Applicants Considered to be Unaccompanied Minors, 2004 – 2009 39
Table 42: Asylum Applicants Considered to be Unaccompanied Minors by Age, 2009 39
Table 43: Asylum Applicants Considered to be Unaccompanied Minors by Main Country of Citizenship, 2009 39
Table 44: Certificates of Registration, 2008 and 2009 42
Table 45: Employment Permits Issued, Processed and Percentage Refused and Renewed, 2004-2009 43
Table 46: New Employment Permits Issued 2009 by Country of Nationality 43
Table 47: Stock of Workers Employed in Specific Occupations by Nationality Grouping, 2009 44
Table 48: Economic Status of Irish and Non-Irish Nationals. October-December, 2009 (000s) 47
Table 49: PPSN Allocations to Foreign Nationals (Number) by Country and Year 2003-2009 48
List of Charts
Chart 1: Relationship between Refusals, Apprehensions and Returns, 2009 28
Chart 2: New Asylum Applicants by Main Country of Citizenship 2009 from 2004-2009 30
viii | Annual Report on Migration and International Protection Statistics for Ireland: 2009
Abbreviations and Irish Terms
CSO Central Statistics Office
Department of Justice
and Equality
From March 2011, this Department was named the
Department of Justice and Equality. For the purpose of this
report and for consistency, this term will be used for all
references prior to this date, excluding citations.
Department of Jobs,
Enterprise and
Innovation
From March 2011, this Department was named the
Department of Jobs, Enterprise and Innovation. For the
purpose of this report and for consistency, this term will be
used for all references prior to this date, excluding citations.
ECJ European Court of Justice
EURODAC European Dactyloscopy Database
FÁS Irish Training & Employment Authority
HSE Health Services Executive
GNIB Garda National Immigration Bureau
IBIS Irish Border Information System
ICOS Irish Commission for Overseas Students
IOM International Organization for Migration
NCP EMN National Contact Point
ORAC Office of the Refugee Applications Commissioner
RAT Refugee Appeals Tribunal
PPSN Personal Public Service Numbers
TFEU The Treaty on the Functioning of the European Union
UKBA UK Border Agency
VAC Visa Application Centres
VFS Visa Facilitation Services
VIS Visa Information System

Introduction | 1
Chapter 1
Introduction
This report provides an analysis of statistics relating to migration and
international protection in Ireland and is the seventh in the current series. It aims
to describe statistical trends on migration, international protection, refusals,
apprehensions, residence permits and returns for the year 2009 based on
Eurostat data, and to facilitate comparisons and interpretations pertaining to
migratory trends on the European level as well as in the international context.
Ireland saw a change to net outward migration at -27,844 in 2009. Recorded
immigration decreased by 41.5 per cent year-on-year from 63,927 during 2008 to
37,409 in 2009, while recorded emigration saw an increase of 8.4 per cent from
60,189 in 2008 to 65,253 in 2009. In 2009 some 37,409 persons migrated to
Ireland. The largest single group comprised citizens of other EU27 countries
(15,978 persons) representing 43 per cent of total immigration, followed by Irish
nationals with 14,734 persons and representing 39 per cent of the total. Non-EU
nationals accounted for 17 per cent of all recorded immigration at 6,502 persons.
While the absolute number of Irish nationals immigrants fell by 3,123 in 2009,
their share of the total nevertheless increased by over 11 percentage points
Immigrants were equally divided by gender, and the majority of those migrating
to Ireland were within the 20-34 age group (21,731, representing 58 per cent).
Some 65,253 persons emigrated from Ireland in 2009, almost twice the flow of
emigration in 2005. 2009 saw a year-on-year increase of 8 per cent. Some 36,702
EU27 nationals emigrated in 2009, representing the largest overall grouping (56
per cent of all emigrants). Irish nationals the next largest single grouping: 20,507
emigrated, representing 31 per cent of the total. Non-EU27 nationals represented
12 per cent of total emigration. The majority of those emigrating from Ireland
were male (61 per cent) and within the 20-34 age group (65 per cent, or 42,176
persons). During 2009, Australia continued as both the single largest non-EU
country of previous residence of immigrants (9 per cent of all persons
immigrating into Ireland), and country of next usual residence for emigrants (16
per cent).
Some 4,467,854 persons were considered to be usually resident in Ireland during
2009, an increase of 0.4 per cent on 2008 figures. Of these, 9.9 per cent
represented non-Irish nationals, a decrease of 1.6 percentage points on 2008
figures. Some 70.1 per cent of all non-Irish nationals were from other EU27
2 | Annual Report on Migration and International Protection Statistics for Ireland: 2009
countries. There are nine countries which predominate both in terms of
citizenship and country of birth: Australia, China (including Hong Kong), India,
Nigeria, the Philippines, Pakistan, Russia, South Africa and the United States. All
countries appeared across both categories during 2008 also. Nationals of China
(including Hong Kong) saw an increase of 22.2 per cent points in population by
main country of birth during 2009 year-on-year. Nationals of Australia (18.6),
Canada (23.8), India (9.6 per cent), Nigeria (0.7 per cent), the Philippines (1.9 per
cent), Pakistan (2.5 per cent), Russia (20.2 per cent), South Africa (20.4 per cent)
and the United States (11.8 per cent) all saw a decrease in population by main
country of birth in 2009.
Some 27,765 applications for naturalisation were submitted in 2009. Overall,
some 4,533 persons acquired citizenship in Ireland1 during 2009, an increase of 40
per cent on corresponding figures for 2008. There was a largely equal distribution
in terms of gender, with a majority (53.7 per cent) within the 35-64 age group. In
terms of nationality, Third Country Nationals were the largest single grouping and
constituted 94.2 per cent (accounting for 4,271 persons) of all acquisitions.
Increases took place year-on-year for all countries (China [62.4], India [106.7],
Nigeria [42.3], Pakistan [2.6], Russia [59.1] and South Africa [179.5]) excluding the
Ukraine (56.1).
A total of 134,153 residence permits were valid in 2009, a decrease of 5.4 per
cent on 2008 figures. The majority of permits were issued for ‘Other’ reasons
during 2009 (30.7 per cent), followed by ‘Remunerated Activities’ (30.1 per cent),
‘Education Reasons’ (26.3 per cent) and ‘Family Reasons’ (12.9 per cent). Most
permits were issued for over six months (96.4 per cent), with the majority of
those issued for over 12 months (68.7 per cent). There was substantial continuity
between 2008 and 2009 in the citizenship of persons with valid residence permits.
A total of 25,509 first permits were issued during 2009, a decrease on
corresponding 2008 figures (11.8 per cent). The majority were issued for
‘Education Reasons’ (48.1 per cent of all permits). The largest single nationality to
receive new residence permits were U.S. nationals (15.5 per cent of all first
permits). The majority of countries of citizenship of persons granted new permits
during 2009 were also present in data for 2008, although Pakistan and the
Philippines were present for 2009 only. Of those countries present for both years,
most saw a decrease in new permits issued during 2009 year-on-year (Australia
[40.6 per cent], Brazil [26.4 per cent], Canada [14.7 per cent], India [27 per cent],
Nigeria [19.4 per cent] and Mauritius [32.5 per cent]), however increases took
place for Chinese and U.S. nationals year-on-year by 26.7 per cent and 8.2 per
cent respectively.
Some 14,588 changes of immigration status took place during 2009. The largest
change in status took place from remunerated activities to ‘Other’ (7,614 cases).
1 Ireland does not require naturalised citizens to relinquish their former citizenship status and allows an Irish citizen
to hold dual citizenship.
Introduction | 3
The largest change to ‘Family Reasons’ came from persons already in the State for
‘Remunerated Activity’ reasons (575 cases). For ‘Education Reasons’, the largest
transfer of status came from those previously in the State under ‘Other’ reasons
(1,950). For ‘Other’ reasons, a change to remunerated activity constituted the
largest single transfer of status at 1,800 cases.
A total of 3,946 long-term residency permissions were issued during 2009,
representing a sharp decrease of 23.5 per cent on corresponding 2008 figures.
Nationals of Nigeria constituted the largest single grouping of long-term Third
Country Nationals during 2009, accounting for 986 persons. Nine of the top ten
countries of nationality of Third Country Nationals acquiring residency permission
during 2009 were present in corresponding figures for 2008; Belarus was not
present in 2008 figures. Of the nine countries present in both years, three saw
year-on-year increases: China (54.1 per cent), India (15.6 per cent) and Moldova
(30.1 per cent). Of the remaining, year-on-year decreases occurred for Australia
(37.6 per cent), Japan (30.1 per cent), Nigeria (7.3 per cent), South Africa (29.8
per cent), Ukraine (1.8 per cent) and the United States (55.2 per cent).
During 2009, some 2,939 applications for General Permission to Remain2 in the
State were received, with decisions taken on 1,807 cases. Of these, 1,313
applications were approved.
During 2009 there were 2,070 applications for residence in Ireland by spouses of
an EU national and under the EU Free Movement Directive 2004/38/EC. Of the
main applicant countries (excluding EU2 applications), Pakistani nationals were
the largest single grouping representing 384 applications. Nationals of Nigeria
(238 applications), Brazil (148 applications), India (121 applications) and South
Africa (117 applications) were also represented in the largest groups within
applications.
In 2009, some 5,035 Third Country Nationals were apprehended or found to be
illegally present in Ireland, an increase of 58.1 per cent on corresponding figures
for 2008. Almost two-thirds were male and 54 per cent were within the 18-34 age
group. Eight of the main nationalities were also present in corresponding data for
2008, with Brazil and Zimbabwe present for 2009 only. During 2009, the numbers
of apprehensions increased in respect of persons from Congo (74.8 per cent),
Georgia (71.2 per cent), Ghana (57.9 per cent), Moldova (20 per cent), Nigeria
(15.7 per cent), Pakistan (238.7 per cent) and South Africa (43.8 per cent).
A total of 1,615 Third Country Nationals were ordered to leave the State during
2009, an increase of 26.6 per cent on corresponding figures for 2008. Nigerian
nationals constituted the single largest grouping of non-EU nationals ordered to
2 The category of ‘General Permission to Remain’ includes Change of Status; De Facto Relationship with Irish
Nationals; De Facto Relationship with Non-EEA Nationals; Dependants of Non-EEA or Irish Nationals; Extension of C Visit Visa; Extension of Student Conditions; Extension of Visitors Conditions including Self Sufficiency; Extension of Work Permit Conditions; Medical Treatment; Missionaries; Stamp 4 (original circumstances changed); Doctors; Turkish Association; Undocumented Scheme (Scheme closed as of end of 2009).

4 | Annual Report on Migration and International Protection Statistics for Ireland: 2009
leave, accounting for almost half (44.9 per cent) of all orders. Some 830 persons
were returned following an order to leave during 2009. Nigerian nationals
comprised the largest single group of Third Country Nationals returned following
an order to leave (29 per cent). Six of the main nationality groupings were also
present in corresponding figures for 2008, with increases in persons returned
year-on-year from Georgia (175 per cent), Moldova (26.7 per cent), Nigeria (110.5
per cent) and South Africa (133.3 per cent). Year-on-year decreases took place for
persons returned following an order to leave from Brazil (25.4 per cent) and China
(46 per cent). In 2009 in Ireland, 539 persons were assisted in returning home
voluntarily. Of this figure, some 405 persons were assisted to return by the
International Organization for Migration (IOM) and 134 persons received
administrative assistance to return by the Department of Justice and Equality.3
The overall number of non-Irish nationals refused entry to the State during 2009
decreased significantly by 32.3 per cent year-on-year from 5,260 in 2008 to 3,560
in 2009. Of this number, over three-quarters (76.1 per cent) were refused at an
air border, with 17.7 per cent refused entry at a land border and 6.3 per cent at a
sea port. In terms of reasons for refusal of entry, almost half (42.4 per cent) of all
cases related to false visa and residence permits. A lack of valid visa or residence
permits was the second largest reason for refusal (24.9 per cent), followed by the
lack of a valid travel document (17.7 per cent). The main country of citizenship of
Third Country Nationals refused entry is Brazil, accounting for 13.2 per cent of all
refusals and repeating a trend seen in 2008. Eight of the main countries of
citizenship of persons refused were present in corresponding figures for 2008.
Overall refusals decreased for six nationalities (Bolivia [41.2 per cent], Brazil [53.7
per cent], Malaysia [30.8 per cent], Mauritius [13 per cent], Nigeria [43.6 per
cent] and South Africa [41.1 per cent]), and increased for nationals of the United
States (6.7 per cent). Refusals remained the same in terms of actual figures for
nationals of China and Pakistan.
The overall number of asylum applications made during 2009 was 2,690, of which
2,660 were new applications. The number of new applications decreased by 30.1
per cent during 2009 and remained much lower than preceding years. Almost
two-thirds of asylum applicants were male and over half were within the 18-34
age group. Almost a quarter of applications (22.7 per cent) concerned those less
than 14 years old. New asylum applications followed the pattern of overall cases,
with a majority of male applicants (65.6 per cent) and those within the 18-34 age
group (55.5 per cent). Table 19 shows the main citizenship groupings of both
overall and new applicants for asylum during 2009. Nigerian nationals continued
as the largest single grouping in 2009, with nine of the same countries present in
figures for 2008 and 2009.
3 The Department of Justice, Equality and Law Reform until March 2010 and Department of Justice and Law Reform
from March 2010 to March 2011. From March 2011, this Department is named the Department of Justice and Equality. For the purpose of this report and for consistency, this term will be used for all references prior to this date, excluding citations.
Introduction | 5
During 2009, some 900 applications for asylum were withdrawn, accounting for a
decrease of 2.2 per cent on figures for 2008. Overall, the vast majority of
withdrawn applications were by male applicants (76.1 per cent) and were in the
18 – 34 age group (63.9 per cent). This follows a broadly similar pattern of age
and gender breakdown as in 2008. As in 2008, during 2009 Chinese nationals
constituted the largest single grouping and comprised 17.2 per cent of all
withdrawals. Seven of the ten citizenship groupings were present in 2008 data
also, with increases for Georgia (30 per cent), Iran (20 per cent) and Pakistan (100
per cent). Year-on-year decreases took place for nationals of Iraq (14.3 per cent),
Moldova (46.2 per cent) and Nigeria (14.3 per cent).
Some 6,560 first and final instance decisions on applications for international
protection were made during 2009, an increase of 7.8 per cent on 2008 figures.
Some 395 total positive decisions were made during 2009, accounting for a
decrease of 33.6 per cent. In addition, some 659 applications for leave to remain
were granted under Section 3 of the Immigration Act, 1999 (as amended), a year-
on-year decrease of 48.4 per cent. Some 3,135 first instance decisions on
applications for asylum were made during 2009, accounting for a decrease of 13.5
per cent on corresponding figures for 2008. In 2009, 96 per cent were rejected,
with just 125 positive decisions. Of the positive decisions, the majority (84 per
cent) related to cases acquiring status under the Geneva Convention, while 25
cases referred to positive decisions related to subsidiary protection status. Almost
two-thirds of all first instance decisions referred to male applicants (65.1 per
cent), as did the majority of rejected and positive decisions (64.8 per cent and
72.9 per cent respectively). The majority of first instance decisions related to
persons within the 18-34 age group (54.4 per cent), with this age group
accounting for the majority of rejections (54.7 per cent) and positive decisions (48
per cent) also. Nigerian nationals continued to constitute the largest single
nationality of all first-instance decisions, accounting for a decrease in overall
decisions of 42.2 per cent year-on-year. Nationals from Nigeria accounted for 0.5
per cent of positive decisions at first instance during 2008, falling to zero for 2009.
Nine of the main countries of citizenship were present for 2008 and 2009 also,
with nationals of Iraq (16 per cent of all positive decisions), Somalia (20 per cent
of all positive decisions) and Sudan (16 per cent of all positive decisions) showing
the largest numbers of positive decisions again in 2009.
Some 2,089 applications for Subsidiary Protection in the State were made during
2009, accounting for an increase of 42.6 per cent year-on-year. Some 677
decisions were made (a sharp increase on a comparable figure of 471 decisions
for 2008). Of these, 24 applications for subsidiary protection were granted.
In 2009, some five decisions withdrawing status granted at first instance were
made. All cases refer to a withdrawal of Geneva Convention status.
6 | Annual Report on Migration and International Protection Statistics for Ireland: 2009
Table 30 shows that some 3,425 decisions regarding applications for asylum were
made at final instance during 2009, accounting for an increase of 39.2 per cent on
corresponding figures for 2008. Of the 2009 positive number, some 7.9 per cent
of all applications were positive decisions with all relating to Geneva Convention
Status. Both the number of absolute positive decisions (295 to 270) and
percentage of positive decisions in the total number of decisions (12 per cent to
7.9 per cent) fell year-on-year. Regarding the main countries of citizenship of final
decisions on applications for asylum during 2009, nine of the ten countries
appeared in corresponding data for 2008, with the majority showing increases
during 2009 (Afghanistan [66.7 per cent], Congo [32 per cent], Georgia [111.1 per
cent], Ghana [20 per cent], Iraq [76.9 per cent], Moldova [40 per cent] and
Pakistan [178.9 per cent]). A decrease of 2.8 per cent year-on-year in final
decisions on asylum cases for Nigerian nationals took place.
In 2008, some 5 decisions withdrawing status granted at final instance were
made. All of these refer to Geneva Convention status and reflect similar
determinations made at first instance stage and for 2008.
There was a sharp decrease (48.4 per cent) in persons granted leave to remain in
the State following submissions pursuant to section 3 of the Immigration Act,
1999 (as amended) during 2009 (659 persons), in comparison to 2008 figures.
During 2009, some 190 refugees were resettled in Ireland under the United
Nations’ Refugee Resettlement Programme, including a group of 85 refugees
from the DRC and 80 refugees from Myanmar. Resettlement also took place for
refugees from Iran (ten persons), Cuba (five persons), Jordan (five persons) and
Iraq (five persons). There was an equal distribution between male and female.
The majority of resettled refugees were under 14 years old.
Regarding operation of the Dublin Regulation, a total of 188 incoming requests
(take back and taking charge requests) were received by Ireland during 2009
under the Dublin Regulation, with the majority (87.2 per cent) concerning take
back requests. An additional 141 requests related to EURODAC and 284 requests
for information were made. Some 85 inward transfers took place, accounting for
a slight decrease (5.6 per cent) on 2008 data. Regarding reasons for incoming
transfers under the Regulation, the dominance of documentation and entry
reasons under Articles 9-12 of the Regulation within taking charge requests can
be seen. The largest single accepted and transferred figures during 2009
concerned taking back requests which had been rejected with no permission to
stay under Article 16 (1)(e). As in 2008, the United Kingdom continued to be the
main source of incoming taking back and taking charge requests (62 per cent of all
such requests) and requests for information (95.1 per cent of all information
requests) during 2009.
Some 497 outgoing requests (taking back and taking charge total figures) were
made in 2009 by Ireland, a slight decrease of 4.6 per cent on corresponding
Introduction | 7
figures for 2008. The majority (55.5 per cent) related to taking back requests. An
additional 259 cases were related to EURODAC (accounting for a decrease of 17.8
per cent on 2008 figures). A total of 243 outward transfers took place during
2009. Regarding reasons for outgoing transfers from Ireland under the
Regulation, cases under examination with no permission to stay under Article 16
(1)(c) continued to be most common. Within taking charge requests, a further 208
cases concerned documentation and entry reasons under Articles 9-12 of the
Regulation. The largest transferred figures during 2009 concerned taking charge
requests under Articles 9-12 (105 cases) and taking back requests under Article
(1) (c) (93 cases). The vast majority of outgoing taking back and taking charge
requests from Ireland during 2009 continued to concern the United Kingdom (437
cases), accounting for an increase of 45.7 per cent on 2008 figures. The United
Kingdom also continued to be the main recipient of requests for information by
Ireland, receiving 845 requests and accounting for a 15.4 per cent increase on
2008 figures.
There was a sharp decrease (45 per cent) in asylum applications from
unaccompanied minors between 2008 and 2009 (55 cases). During 2009, almost
three-quarters (72.7 per cent) of unaccompanied minors submitting applications
for asylum were between 16 and 17 years old. Nigerian nationals were the largest
single nationality grouping of unaccompanied minors seeking asylum during 2009.
Four of the main nationality groupings seen during 2009 were also present in
comparable data for 2008, with Nigerian nationals being the only nationality to
register a decrease year-on-year (33.3 per cent). Nationals of Cameroon, Congo
(DRC) and Somalia saw absolute figures remain the same between 2008 and
2009.
Overall, some 166,387 Certificates of Registration (referring to new registrations
and renewals) were issued during 2009. Notable increases in the numbers of
Stamps for categories 1A, 4, 4 EUFAM and 5 occurred while numbers of
registration under Stamp 1 decreased by 27 per cent to 23,417.
There was a sharp decrease in the number of new employment permits issued in
2009 year-on-year from 2008, with the overall number of permits (new and
renewals) issued falling by 41 per cent to 7,962 permits. Figures for 2009 show
that the number of new permits issued fell by 53 per cent to 4,024 permits, with
the number of renewals falling year-on-year by 23 per cent during 2009 to 3,938
permits.4
During 2009, some 895 applications for family reunification of recognised
refugees were received, with some 731 cases approved during the same period.
4 See the Department of Jobs, Enterprise and Innovation website (www.djei.ie) for further information.
8 | Annual Report on Migration and International Protection Statistics for Ireland: 2009
During 2009, some ten persons received the 60 day ‘recovery and reflection’
period to remain in Ireland and 11 persons were granted temporary residence
permits.
During 2009, some 123,082 visas were issued by Irish authorities worldwide,
including 57,411 re-entry visas. During the same year 133,967 visa applications
were received.
Methodology | 9
Chapter 2
Methodology
The Migratory Statistics Regulation (EC) No. 862/20075 establishes common rules
for the collection and compilation of Community statistics on:
(a) immigration to and emigration from the Member State territories, including
flows from the territory of one Member State to that of another Member
State and flows between a Member State and the territory of a Third
Country;
(b) the citizenship and country of birth of persons usually resident in the territory
of the Member States;
(c) administrative and judicial procedures and processes in the Member States
relating to immigration, granting of permission to reside, citizenship, asylum
and other forms of international protection and the prevention of illegal
immigration.
The statistics are provided by national data providers within respective Member
States to Eurostat,6 and are based on records of administrative and judicial
actions; registers relating to administrative actions and population registers;
censuses; and sample surveys. Specific notes relevant to certain tables are
included as appropriate. Definitions used are in general accordance with Article 2
of the Migratory Statistics Regulation No. 862/2007. The majority of the data
supplied in this National Report have been sourced from Eurostat and where
other sources have been used this is marked below the relevant table.
For reference, full tables of data for all EU Member States used in this report, as
extracted from Eurostat according to common specifications are contained in
Annex I. Modified extracts of these tables are contained within this report. A
similar report is to be produced by other European Migration Network (EMN)
National Contact Points (NCPs). As with all EMN outputs, a synthesis report will
subsequently be compiled that will draw together the findings of these studies
and provide an overview of statistical trends in the area of asylum and migration
in a European context during 2009.
5 Available at http://eur-lex.europa.eu/LexUriServ/LexUriServ.do?uri=CELEX:32007R0862:EN:NOT.
6 In the Irish context, national data providers are the Central Statistics Office (CSO) and the Department of Justice and
Equality.
10 | Annual Report on Migration and International Protection Statistics for Ireland: 2009
Other sources used for this National Report include published Annual Reports and
other relevant studies in the area.
As data collected prior to the introduction of the Migratory Statistics Regulation
may not necessarily adhere to specifications contained within the Regulation, in
general, comparative data for preceding years has not been included. Where
exceptions exist (this has been noted) and comparative data is available, limited
analysis of trends is presented.
Of note, in accordance with best practice procedure and provisions under the
Migratory Statistics Regulation, rounding of published figures for international
protection and for refused entry has taken place.
Legal Immigration and Integration | 11
Chapter 3
Legal Immigration and Integration
3.1 INTERNATIONAL MIGRATION, USUALLY RESIDENT POPULATION AND ACQUISITION OF
CITIZENSHIP (ARTICLE 3)
3.1.1 International Migration Flows
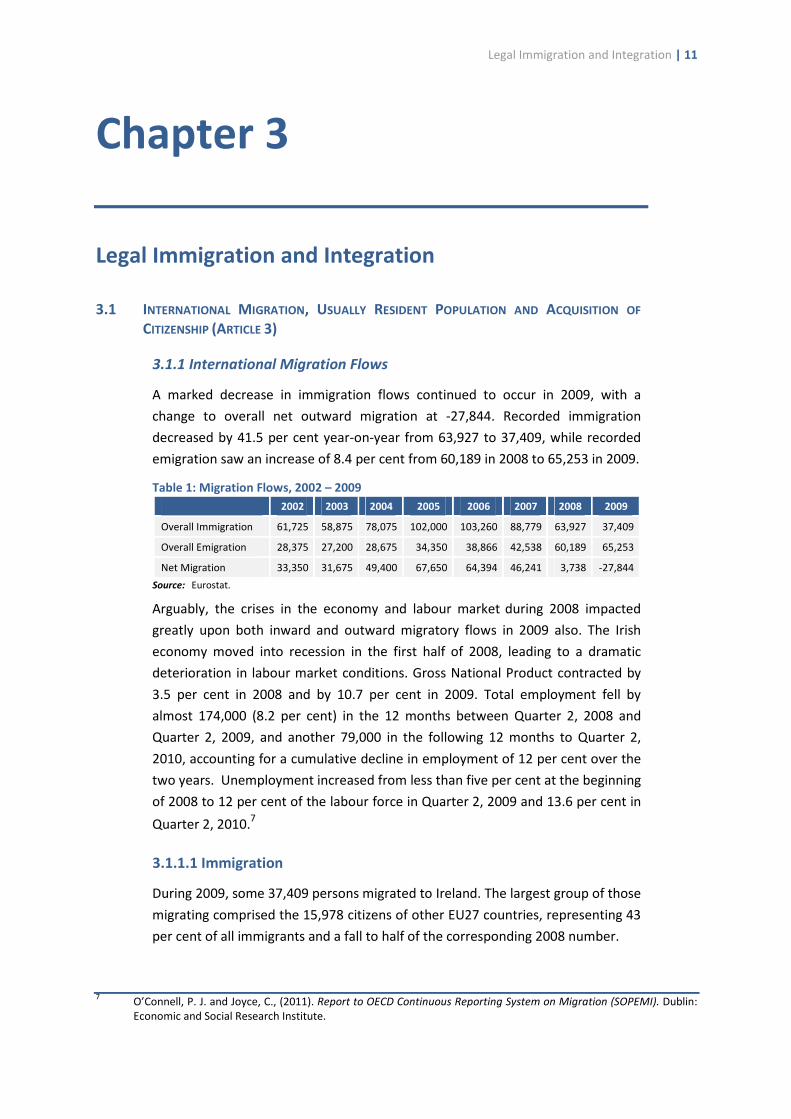
A marked decrease in immigration flows continued to occur in 2009, with a
change to overall net outward migration at -27,844. Recorded immigration
decreased by 41.5 per cent year-on-year from 63,927 to 37,409, while recorded
emigration saw an increase of 8.4 per cent from 60,189 in 2008 to 65,253 in 2009.
Table 1: Migration Flows, 2002 – 2009
2002 2003 2004 2005 2006 2007 2008 2009
Overall Immigration 61,725 58,875 78,075 102,000 103,260 88,779 63,927 37,409
Overall Emigration 28,375 27,200 28,675 34,350 38,866 42,538 60,189 65,253
Net Migration 33,350 31,675 49,400 67,650 64,394 46,241 3,738 -27,844
Source: Eurostat.
Arguably, the crises in the economy and labour market during 2008 impacted
greatly upon both inward and outward migratory flows in 2009 also. The Irish
economy moved into recession in the first half of 2008, leading to a dramatic
deterioration in labour market conditions. Gross National Product contracted by
3.5 per cent in 2008 and by 10.7 per cent in 2009. Total employment fell by
almost 174,000 (8.2 per cent) in the 12 months between Quarter 2, 2008 and
Quarter 2, 2009, and another 79,000 in the following 12 months to Quarter 2,
2010, accounting for a cumulative decline in employment of 12 per cent over the
two years. Unemployment increased from less than five per cent at the beginning
of 2008 to 12 per cent of the labour force in Quarter 2, 2009 and 13.6 per cent in
Quarter 2, 2010.7
3.1.1.1 Immigration
During 2009, some 37,409 persons migrated to Ireland. The largest group of those
migrating comprised the 15,978 citizens of other EU27 countries, representing 43
per cent of all immigrants and a fall to half of the corresponding 2008 number.
7 O’Connell, P. J. and Joyce, C., (2011). Report to OECD Continuous Reporting System on Migration (SOPEMI). Dublin:
Economic and Social Research Institute.

12 | Annual Report on Migration and International Protection Statistics for Ireland: 2009
Table 2: Immigration by Broad Group of Citizenship, 2009
Broad Citizenship Grouping Total
Ireland 14,734
EU27 countries except Ireland 15,978
Non-EU27 countries nor Ireland 6,502
European Free Trade Association 92
Candidate Countries in 2007 (3 countries) 56
Countries other than EU27, EFTA and Candidate Countries 6,354
Stateless 47
Unknown 195
Total 37,409
Source: Eurostat.
Irish nationals constituted the second largest group with 14,734 persons,
accounting for 39.4 per cent of all recorded immigration. While this entailed a
small numerical decline of 3,123, the actual share of Irish nationals in total
recorded immigration increased by 11.5 percentage points year-on-year.
Non-EU nationals accounted for 17.4 per cent of all recorded immigration at
6,502 persons, and accounting for a proportional percentage drop of 3.7
percentage points year-on-year.
In terms of overall numbers, there was an equal breakdown of immigration by
gender (50.6 per cent of overall immigration was female, accounting for 18,914
persons) with the majority of those migrating to Ireland within the 20-34 age
group (21,731 persons, accounting for 58.1 of the total). As with 2008 data,
excluding immigration by Irish nationals, all main groups (other EU27 nationals;
countries outside the EU27) saw a slight majority of females migrating to Ireland.
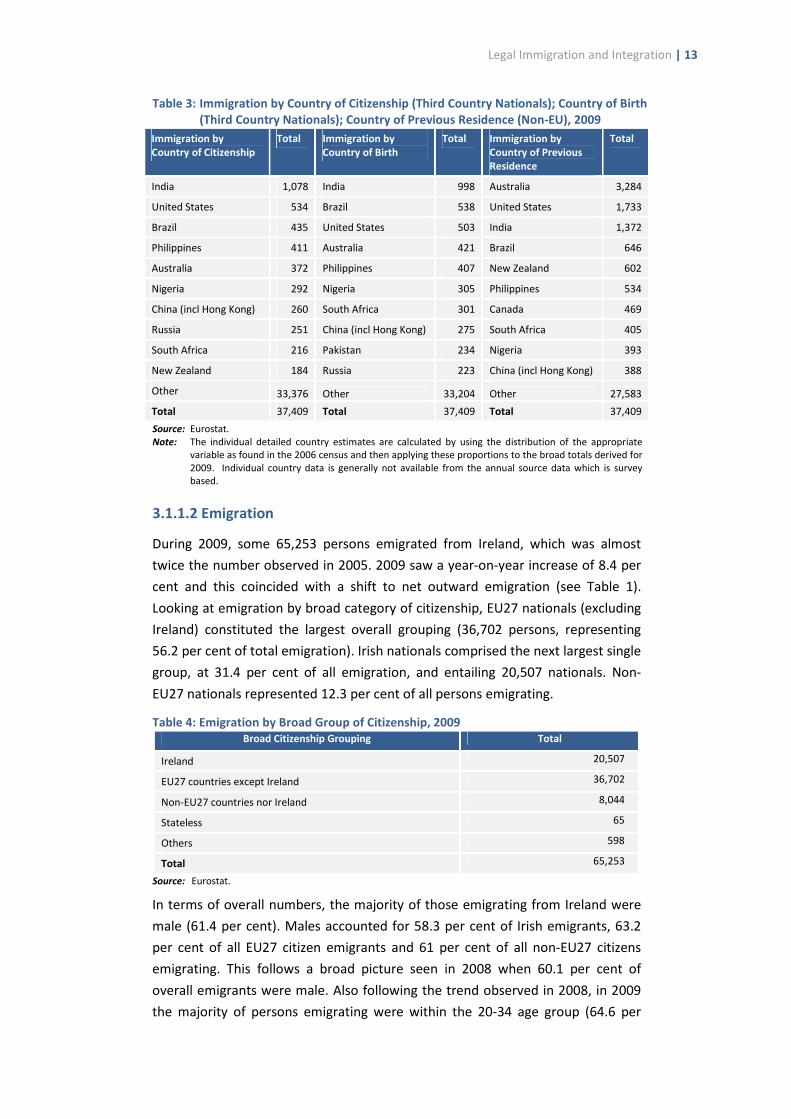
Table 3 shows the main citizenship groupings of immigration by country of
citizenship and country of birth for Third Country Nationals, and non-EU country
of previous residence for all immigrants. All follow patterns broadly seen in 2008.
Almost all countries (Australia, Brazil, China [including Hong Kong], India, Nigeria,
the Philippines, South Africa and the United States) appear across each column,
with Indian nationals accounting for the largest single non-EU27 nationality
grouping by country of citizenship and birth at 2.9 per cent and 2.7 per cent
respectively.
With regard to immigration by country of previous residence, Australia represents
the single largest grouping at 8.8 per cent of all persons immigrating to Ireland.
Russian nationals appear across both immigration by country of citizenship and
country of birth (0.7 per cent and 0.6 of the overall number respectively), and
nationals of New Zealand are present in main groups of immigrants by country of
citizenship and country of previous residence only (0.5 per cent and 1.6 per cent
respectively).
Legal Immigration and Integration | 13
Table 3: Immigration by Country of Citizenship (Third Country Nationals); Country of Birth
(Third Country Nationals); Country of Previous Residence (Non-EU), 2009
Immigration by
Country of Citizenship
Total Immigration by
Country of Birth
Total Immigration by
Country of Previous
Residence
Total
India 1,078 India 998 Australia 3,284
United States 534 Brazil 538 United States 1,733
Brazil 435 United States 503 India 1,372
Philippines 411 Australia 421 Brazil 646
Australia 372 Philippines 407 New Zealand 602
Nigeria 292 Nigeria 305 Philippines 534
China (incl Hong Kong) 260 South Africa 301 Canada 469
Russia 251 China (incl Hong Kong) 275 South Africa 405
South Africa 216 Pakistan 234 Nigeria 393
New Zealand 184 Russia 223 China (incl Hong Kong) 388
Other 33,376 Other 33,204 Other 27,583
Total 37,409 Total 37,409 Total 37,409
Source: Eurostat. Note: The individual detailed country estimates are calculated by using the distribution of the appropriate
variable as found in the 2006 census and then applying these proportions to the broad totals derived for 2009. Individual country data is generally not available from the annual source data which is survey based.
3.1.1.2 Emigration
During 2009, some 65,253 persons emigrated from Ireland, which was almost
twice the number observed in 2005. 2009 saw a year-on-year increase of 8.4 per
cent and this coincided with a shift to net outward emigration (see Table 1).
Looking at emigration by broad category of citizenship, EU27 nationals (excluding
Ireland) constituted the largest overall grouping (36,702 persons, representing
56.2 per cent of total emigration). Irish nationals comprised the next largest single
group, at 31.4 per cent of all emigration, and entailing 20,507 nationals. Non-
EU27 nationals represented 12.3 per cent of all persons emigrating.
Table 4: Emigration by Broad Group of Citizenship, 2009
Broad Citizenship Grouping Total
Ireland 20,507
EU27 countries except Ireland 36,702
Non-EU27 countries nor Ireland 8,044
Stateless 65
Others 598
Total 65,253
Source: Eurostat.
In terms of overall numbers, the majority of those emigrating from Ireland were
male (61.4 per cent). Males accounted for 58.3 per cent of Irish emigrants, 63.2
per cent of all EU27 citizen emigrants and 61 per cent of all non-EU27 citizens
emigrating. This follows a broad picture seen in 2008 when 60.1 per cent of
overall emigrants were male. Also following the trend observed in 2008, in 2009
the majority of persons emigrating were within the 20-34 age group (64.6 per

14 | Annual Report on Migration and International Protection Statistics for Ireland: 2009
cent, accounting for 42,176 persons). All broad categories saw a majority of those
emigrating fall within the 20-34 age group.
Table 5: Emigration by Country of Citizenship (Third Country Nationals) and Next Usual Residence
(Non-EU), 2009
Emigration by Citizenship Total Emigration by Country of
Next Usual Residence
Total
China (including Hong Kong) 1,000 Australia 10,539
Nigeria 814 United States 2,237
United States 549 China (including Hong Kong) 1,502
India 530 Nigeria 1,050
Philippines 434 India 815
Pakistan 335 South Africa 588
Brazil 319 Pakistan 568
South Africa 298 Philippines 554
Russia 275 Brazil 487
Malaysia 238 Malaysia 360
Other 60,461 46,553
Total 65,253 Total 65,253
Source: Eurostat. Note: The individual detailed country estimates are calculated by using the distribution of the appropriate
variable as found in the 2006 census and then applying these proportions to the broad totals derived for 2009. Individual country data is generally not available from the annual source data which is survey based.
Table 5 shows the main citizenship grouping of emigration by country of
citizenship for Third Country Nationals, and non-EU country of next usual
residence. Nine of the same ten countries listed appear across both tables (Brazil,
China [including Hong Kong], India, Malaysia, Nigeria, Pakistan, the Philippines,
South Africa and the United States). As in 2008, Chinese nationals constitute the
largest single grouping of those emigrating by citizenship (1.5 per cent of all
applications). Australia continued to be listed as the single largest country of next
usual residence for all emigrants, at 16.2 per cent.
3.1.2 Usual Residence
Some 4,467,854 persons were considered to be usually resident in Ireland during
2009, an increase of 0.4 per cent on 2008 figures. Just under four million were
Irish citizens, and just over 440,000 were non-Irish nationals (9.9 per cent). Some
70.1 per cent of all non-Irish nationals were from other EU27 countries.
Table 6 shows an overall equal gender breakdown (50.4 per cent female) of
population by citizenship. There was a slight majority of males among the EU27
(excluding Ireland) category and 2007 Candidate Countries. While a majority of
Irish nationals are in the 35-64 age group, all other breakdowns show a majority
of persons within the 20-34 age group.

Legal Immigration and Integration | 15
Table 6: Population by Citizenship: Breakdown by Sex and Age, 2009
Gender Age
Total Males Females 0-19 20-34 35-64 65+ Unknown
Total 4,467,854 2,216,444 2,251,410 1,228,333 1,057,011 1,676,630 505,880 0
Declaring country 4,026,561 1,992,134 2,034,427 1,155,770 842,958 1,538,824 489,009 0
EU27 countries except declaring country
309,366 158,496 150,870 44,256 158,783 96,165 10,162 0
Extra EU27 67,911 33,203 34,708 : : : : :
Non-EU27 countries nor declaring country
75,033 36,573 38,460 16,486 34,235 22,800 1,512 0
European Free Trade Association
661 284 377 77 292 247 45 0
Candidate Countries in 2007 (3 countries)
958 608 350 161 538 254 5 0
Countries other than EU27, EFTA and Candidate Countries
73,414 35,681 37,733 16,248 33,405 22,299 1,462 0
Highly developed countries
27,675 13,147 14,528 6,619 10,962 8,944 1,150 0
Medium developed countries
32,038 16,246 15,792 5,476 17,312 9,040 210 0
Less developed countries
13,701 6,288 7,413 4,153 5,131 4,315 102 0
Stateless 736 406 330 265 203 217 51 0
Others 6,043 3,086 2,957 1,620 1,939 2,047 437 0
Unknown 56,894 29,241 27,653 11,821 21,035 18,841 5,197 0
Source: Eurostat.
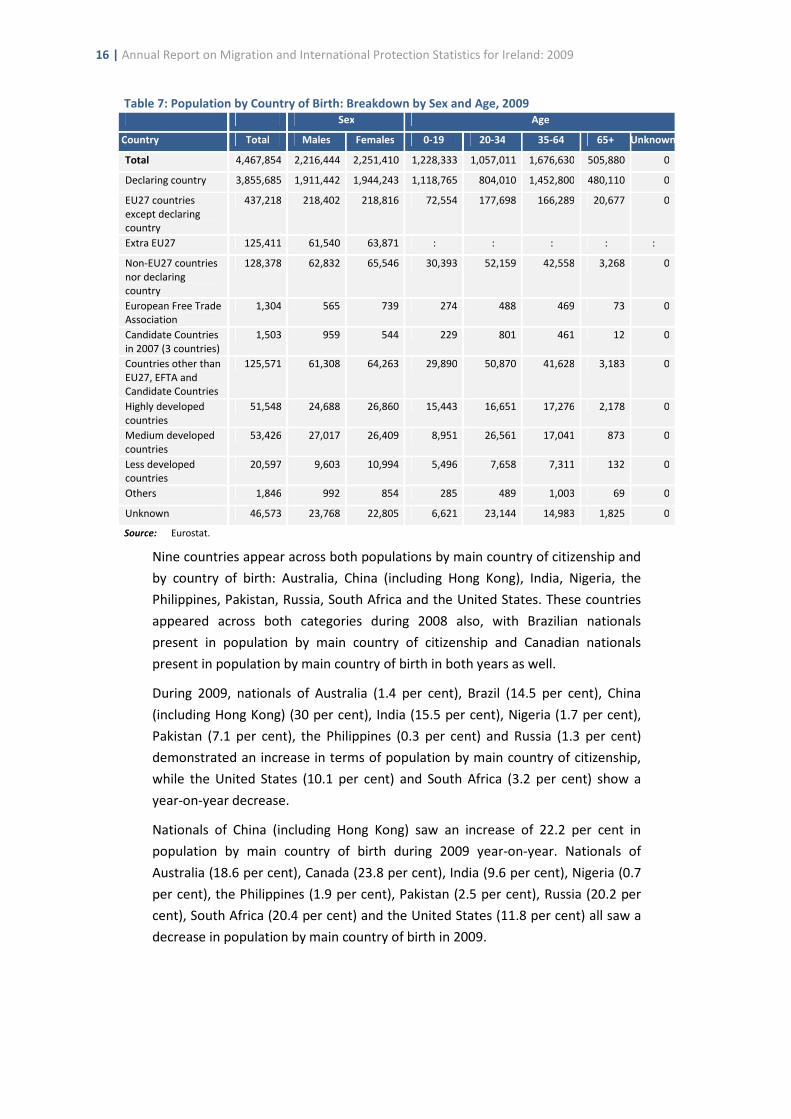
Table 7 shows that some 13.7 per cent of the population (612,169) have declared
a country of birth other than ‘Ireland’. Of this number, 71.4 per cent are in the
EU27 (excluding Ireland) category.
16 | Annual Report on Migration and International Protection Statistics for Ireland: 2009
Table 7: Population by Country of Birth: Breakdown by Sex and Age, 2009
Sex Age
Country Total Males Females 0-19 20-34 35-64 65+ Unknown
Total 4,467,854 2,216,444 2,251,410 1,228,333 1,057,011 1,676,630 505,880 0
Declaring country 3,855,685 1,911,442 1,944,243 1,118,765 804,010 1,452,800 480,110 0
EU27 countries except declaring country
437,218 218,402 218,816 72,554 177,698 166,289 20,677 0
Extra EU27 125,411 61,540 63,871 : : : : :
Non-EU27 countries nor declaring country
128,378 62,832 65,546 30,393 52,159 42,558 3,268 0
European Free Trade Association
1,304 565 739 274 488 469 73 0
Candidate Countries in 2007 (3 countries)
1,503 959 544 229 801 461 12 0
Countries other than EU27, EFTA and Candidate Countries
125,571 61,308 64,263 29,890 50,870 41,628 3,183 0
Highly developed countries
51,548 24,688 26,860 15,443 16,651 17,276 2,178 0
Medium developed countries
53,426 27,017 26,409 8,951 26,561 17,041 873 0
Less developed countries
20,597 9,603 10,994 5,496 7,658 7,311 132 0
Others 1,846 992 854 285 489 1,003 69 0
Unknown 46,573 23,768 22,805 6,621 23,144 14,983 1,825 0
Source: Eurostat.
Nine countries appear across both populations by main country of citizenship and
by country of birth: Australia, China (including Hong Kong), India, Nigeria, the
Philippines, Pakistan, Russia, South Africa and the United States. These countries
appeared across both categories during 2008 also, with Brazilian nationals
present in population by main country of citizenship and Canadian nationals
present in population by main country of birth in both years as well.
During 2009, nationals of Australia (1.4 per cent), Brazil (14.5 per cent), China
(including Hong Kong) (30 per cent), India (15.5 per cent), Nigeria (1.7 per cent),
Pakistan (7.1 per cent), the Philippines (0.3 per cent) and Russia (1.3 per cent)
demonstrated an increase in terms of population by main country of citizenship,
while the United States (10.1 per cent) and South Africa (3.2 per cent) show a
year-on-year decrease.
Nationals of China (including Hong Kong) saw an increase of 22.2 per cent in
population by main country of birth during 2009 year-on-year. Nationals of
Australia (18.6 per cent), Canada (23.8 per cent), India (9.6 per cent), Nigeria (0.7
per cent), the Philippines (1.9 per cent), Pakistan (2.5 per cent), Russia (20.2 per
cent), South Africa (20.4 per cent) and the United States (11.8 per cent) all saw a
decrease in population by main country of birth in 2009.
Legal Immigration and Integration | 17
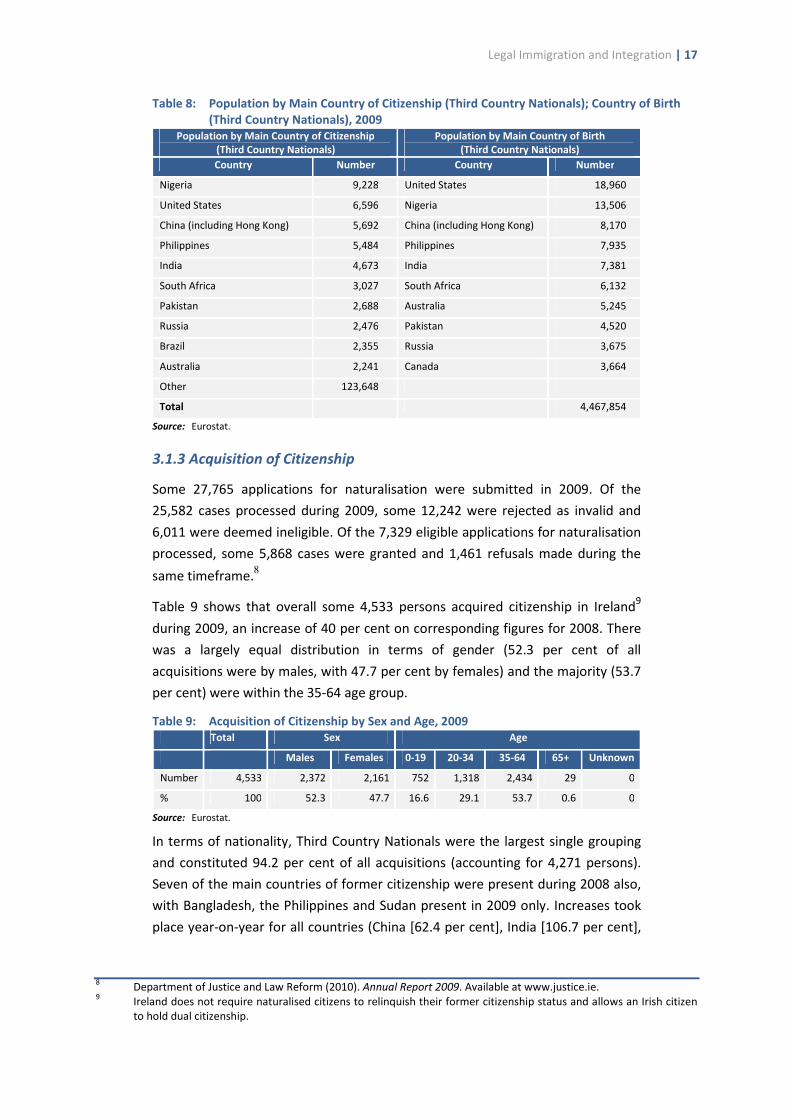
Table 8: Population by Main Country of Citizenship (Third Country Nationals); Country of Birth
(Third Country Nationals), 2009
Population by Main Country of Citizenship
(Third Country Nationals)
Population by Main Country of Birth
(Third Country Nationals)
Country Number Country Number
Nigeria 9,228 United States 18,960
United States 6,596 Nigeria 13,506
China (including Hong Kong) 5,692 China (including Hong Kong) 8,170
Philippines 5,484 Philippines 7,935
India 4,673 India 7,381
South Africa 3,027 South Africa 6,132
Pakistan 2,688 Australia 5,245
Russia 2,476 Pakistan 4,520
Brazil 2,355 Russia 3,675
Australia 2,241 Canada 3,664
Other 123,648
Total 4,467,854
Source: Eurostat.
3.1.3 Acquisition of Citizenship
Some 27,765 applications for naturalisation were submitted in 2009. Of the
25,582 cases processed during 2009, some 12,242 were rejected as invalid and
6,011 were deemed ineligible. Of the 7,329 eligible applications for naturalisation
processed, some 5,868 cases were granted and 1,461 refusals made during the
same timeframe.8
Table 9 shows that overall some 4,533 persons acquired citizenship in Ireland9
during 2009, an increase of 40 per cent on corresponding figures for 2008. There
was a largely equal distribution in terms of gender (52.3 per cent of all
acquisitions were by males, with 47.7 per cent by females) and the majority (53.7
per cent) were within the 35-64 age group.
Table 9: Acquisition of Citizenship by Sex and Age, 2009
Total Sex Age
Males Females 0-19 20-34 35-64 65+ Unknown
Number 4,533 2,372 2,161 752 1,318 2,434 29 0
% 100 52.3 47.7 16.6 29.1 53.7 0.6 0
Source: Eurostat.
In terms of nationality, Third Country Nationals were the largest single grouping
and constituted 94.2 per cent of all acquisitions (accounting for 4,271 persons).
Seven of the main countries of former citizenship were present during 2008 also,
with Bangladesh, the Philippines and Sudan present in 2009 only. Increases took
place year-on-year for all countries (China [62.4 per cent], India [106.7 per cent],
8 Department of Justice and Law Reform (2010). Annual Report 2009. Available at www.justice.ie.
9 Ireland does not require naturalised citizens to relinquish their former citizenship status and allows an Irish citizen
to hold dual citizenship.

18 | Annual Report on Migration and International Protection Statistics for Ireland: 2009
Nigeria [42.3 per cent], Pakistan (2.6 per cent], Russia [59.1 per cent] and South
Africa [179.5 per cent]) excluding the Ukraine (56.1 per cent).
Table 10: Acquisition of Citizenship by Country of Former Citizenship, 2009
Country Number %
Nigeria 454 10.0
Philippines 412 9.1
India 337 7.4
South Africa 313 6.9
Russia 253 5.6
Pakistan 201 4.4
China (including Hong Kong) 164 3.6
Ukraine 153 3.4
Bangladesh 146 3.2
Sudan 123 2.7
Other 1,977 44
Total 4,533 100
Source: Eurostat.
The issue of processing times for applications for citizenship continued to prompt
significant discussion during 2009. In response to a Parliamentary Question of July
2009 it was noted that the average processing time for an application for
citizenship from application to decision was 23 months.10
3.2 RESIDENCE PERMITS AND RESIDENCE OF THIRD COUNTRY NATIONALS (ARTICLE 6)
3.2.1 All Residence Permits
Residence permits refer to the number of valid permissions to stay in Ireland as of
31 December 2009 as held by Third Country Nationals. A total of 134,153 permits
were valid in 2009, a decrease of 5.4 per cent on 2008 figures.
The majority of permits were issued for ‘Other’ reasons during 2009 (30.7 per
cent), followed by for ‘Remunerated Activities’ (30.1 per cent), ‘Education
Reasons’ (26.3 per cent) and ‘Family Reasons’ (12.9 per cent).
Table 11: All Valid Residence Permits by Reason and Length of Validity, 2009
Reason Total From 3 to
5 months
From 6 to
11 months
12 months
or over
Total 134,152 4,863 37,142 92,147
Family reasons 17,266 125 1,223 15,918
Education reasons 35,304 2,304 20,229 12,771
Remunerated Activities reasons 40,421 1,555 9,454 29,412
Other reasons 41,161 879 6,236 34,046
Source: Eurostat.
The majority of permits were issued for over six months (96.4 per cent), with the
majority issued for over 12 months (68.7 per cent).
10 Parliamentary Question No. 324 (7 July 2009) Available at http://debates.oireachtas.ie.
Legal Immigration and Integration | 19
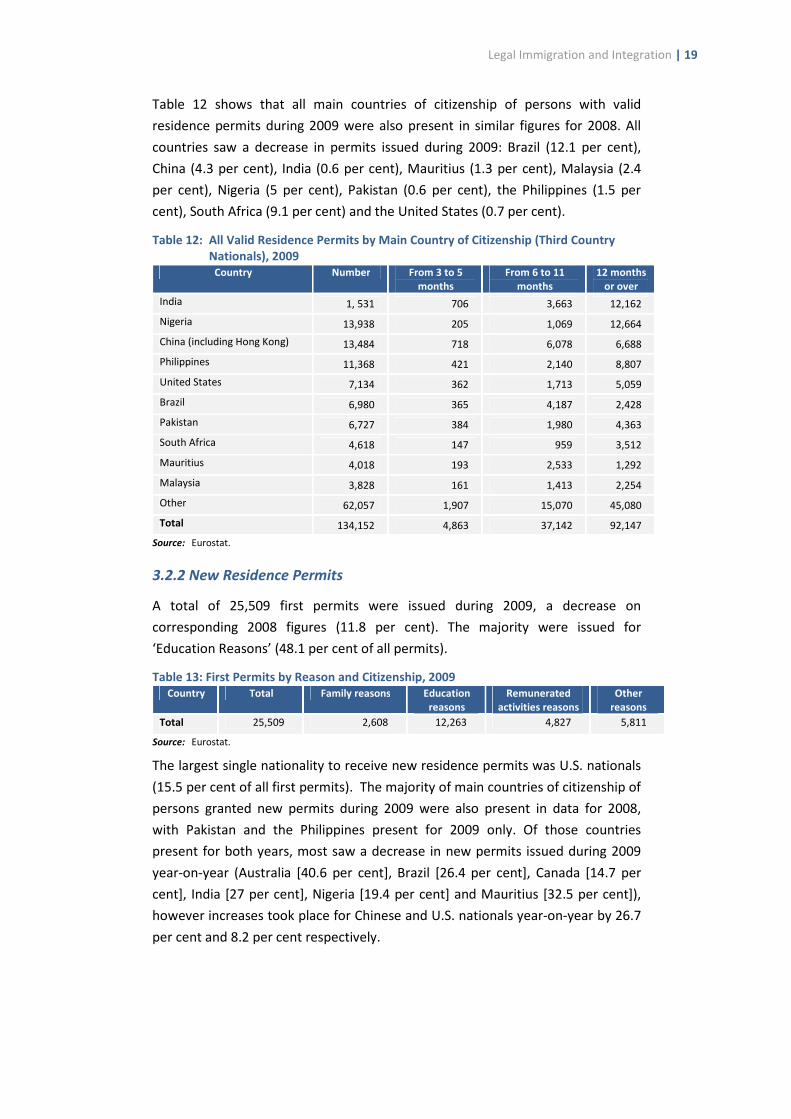
Table 12 shows that all main countries of citizenship of persons with valid
residence permits during 2009 were also present in similar figures for 2008. All
countries saw a decrease in permits issued during 2009: Brazil (12.1 per cent),
China (4.3 per cent), India (0.6 per cent), Mauritius (1.3 per cent), Malaysia (2.4
per cent), Nigeria (5 per cent), Pakistan (0.6 per cent), the Philippines (1.5 per
cent), South Africa (9.1 per cent) and the United States (0.7 per cent).
Table 12: All Valid Residence Permits by Main Country of Citizenship (Third Country
Nationals), 2009
Country Number From 3 to 5
months
From 6 to 11
months
12 months
or over
India 1, 531 706 3,663 12,162
Nigeria 13,938 205 1,069 12,664
China (including Hong Kong) 13,484 718 6,078 6,688
Philippines 11,368 421 2,140 8,807
United States 7,134 362 1,713 5,059
Brazil 6,980 365 4,187 2,428
Pakistan 6,727 384 1,980 4,363
South Africa 4,618 147 959 3,512
Mauritius 4,018 193 2,533 1,292
Malaysia 3,828 161 1,413 2,254
Other 62,057 1,907 15,070 45,080
Total 134,152 4,863 37,142 92,147
Source: Eurostat.
3.2.2 New Residence Permits
A total of 25,509 first permits were issued during 2009, a decrease on
corresponding 2008 figures (11.8 per cent). The majority were issued for
‘Education Reasons’ (48.1 per cent of all permits).
Table 13: First Permits by Reason and Citizenship, 2009
Country Total Family reasons Education
reasons
Remunerated
activities reasons
Other
reasons
Total 25,509 2,608 12,263 4,827 5,811
Source: Eurostat.
The largest single nationality to receive new residence permits was U.S. nationals
(15.5 per cent of all first permits). The majority of main countries of citizenship of
persons granted new permits during 2009 were also present in data for 2008,
with Pakistan and the Philippines present for 2009 only. Of those countries
present for both years, most saw a decrease in new permits issued during 2009
year-on-year (Australia [40.6 per cent], Brazil [26.4 per cent], Canada [14.7 per
cent], India [27 per cent], Nigeria [19.4 per cent] and Mauritius [32.5 per cent]),
however increases took place for Chinese and U.S. nationals year-on-year by 26.7
per cent and 8.2 per cent respectively.

20 | Annual Report on Migration and International Protection Statistics for Ireland: 2009
Table 14: First Permits by Main Country of Citizenship, 2009
Country Number
United States 3,963
Brazil 2,787
India 1,950
China (including Hong Kong) 1,943
Nigeria 1,221
Canada 914
Australia 903
Mauritius 802
Philippines 801
Pakistan 762
Other 9,463
Total 25,509
Source: Eurostat.
3.2.3 Change of Status
Some 14,588 changes of immigration status took place during 2009. The largest
change in status took place from remunerated activities to ‘Other’ (7,614 cases).
The largest increase in family reasons came from persons already in the State for
remunerated activity reasons (575 cases). For education reasons, the largest
transfer of status came from those previously in the State under ‘Other’ reasons
(1,950). For ‘Other’ reasons, a change to remunerated activity constituted the
largest single transfer of status at 1,800 cases. This pattern broadly follows trends
seen in 2008; however that year saw the largest increase from ‘Other’ to
remunerated activity.
Table 15: Change of Immigration Status Permits by Reason, 2009
To reason Family
reasons
Education
reasons
Remunerated
activities reasons
Other
reasons
Total 1,574 828 2,525 9,661
From reason
Family reasons 33 80 97
Education reasons 482 645 1,950
Remunerated Activities reasons 575 325 7,614
Other reasons 517 470 1,800
Source: Eurostat.
3.2.4 Long-Term Residents
3.2.4.1 Long-Term Residency
A total of 3,946 long-term residency permissions were issued during 2009,
accounting for a sharp decrease of 23.5 per cent on corresponding 2008 figures.
Table 12 shows that nationals of Nigeria constituted the largest single grouping of
long-term Third Country Nationals during 2009, accounting for 986 persons. Nine
of the top ten countries of nationality of Third Country Nationals acquiring
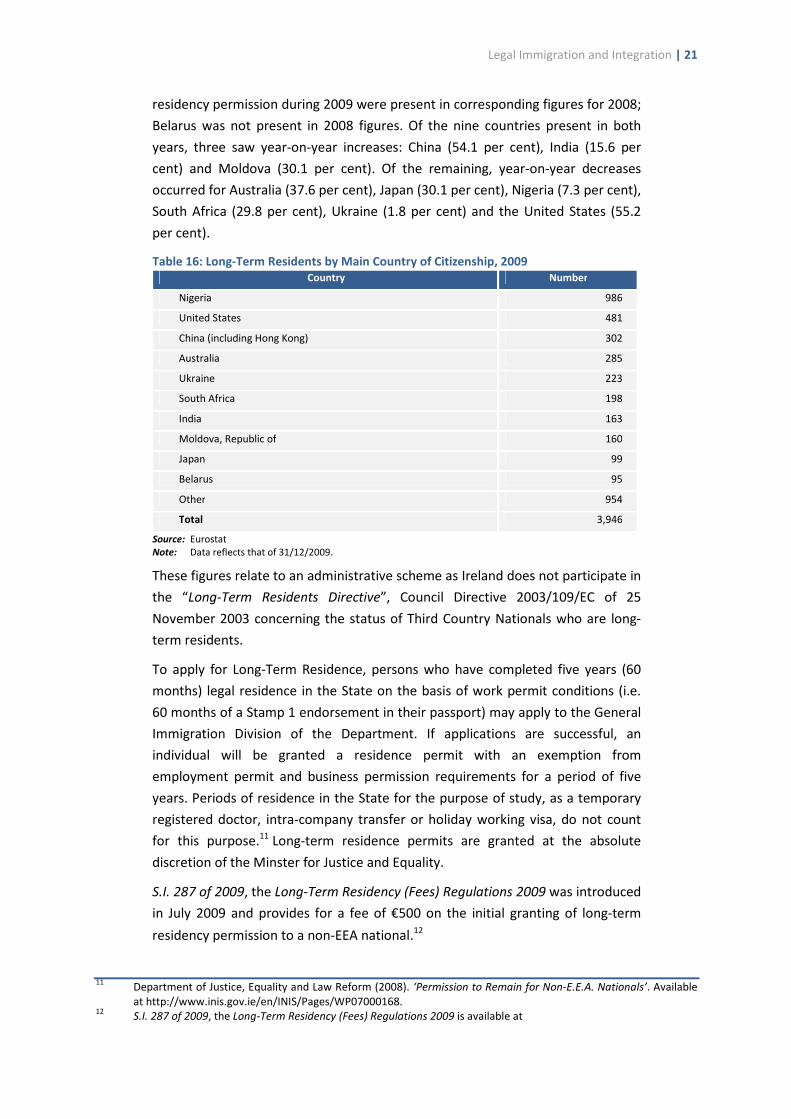
Legal Immigration and Integration | 21
residency permission during 2009 were present in corresponding figures for 2008;
Belarus was not present in 2008 figures. Of the nine countries present in both
years, three saw year-on-year increases: China (54.1 per cent), India (15.6 per
cent) and Moldova (30.1 per cent). Of the remaining, year-on-year decreases
occurred for Australia (37.6 per cent), Japan (30.1 per cent), Nigeria (7.3 per cent),
South Africa (29.8 per cent), Ukraine (1.8 per cent) and the United States (55.2
per cent).
Table 16: Long-Term Residents by Main Country of Citizenship, 2009
Country Number
Nigeria 986
United States 481
China (including Hong Kong) 302
Australia 285
Ukraine 223
South Africa 198
India 163
Moldova, Republic of 160
Japan 99
Belarus 95
Other 954
Total 3,946
Source: Eurostat Note: Data reflects that of 31/12/2009.
These figures relate to an administrative scheme as Ireland does not participate in
the “Long-Term Residents Directive”, Council Directive 2003/109/EC of 25
November 2003 concerning the status of Third Country Nationals who are long-
term residents.
To apply for Long-Term Residence, persons who have completed five years (60
months) legal residence in the State on the basis of work permit conditions (i.e.
60 months of a Stamp 1 endorsement in their passport) may apply to the General
Immigration Division of the Department. If applications are successful, an
individual will be granted a residence permit with an exemption from
employment permit and business permission requirements for a period of five
years. Periods of residence in the State for the purpose of study, as a temporary
registered doctor, intra-company transfer or holiday working visa, do not count
for this purpose.11 Long-term residence permits are granted at the absolute
discretion of the Minster for Justice and Equality.
S.I. 287 of 2009, the Long-Term Residency (Fees) Regulations 2009 was introduced
in July 2009 and provides for a fee of €500 on the initial granting of long-term
residency permission to a non-EEA national.12
11 Department of Justice, Equality and Law Reform (2008). ‘Permission to Remain for Non-E.E.A. Nationals’. Available
at http://www.inis.gov.ie/en/INIS/Pages/WP07000168. 12
S.I. 287 of 2009, the Long-Term Residency (Fees) Regulations 2009 is available at
22 | Annual Report on Migration and International Protection Statistics for Ireland: 2009
3.2.4.2 General Permission to Remain
During 2009, some 2,939 applications for General Permission to Remain13 in the
State were received, with decisions taken on 1,807 cases. Of these, 1,313
applications were approved.
3.2.4.3 EU Treaty Rights Based on being the Spouse of an EU National
In 2008, several cases concerning Third Country National spouses of an EU citizen
residing in Ireland were taken to the European Court of Justice (ECJ) (headed by
the Metock case),14 with the ECJ subsequently finding that the Government
should not prevent Third Country spouses of EU citizens from living in Ireland on
the basis of not having prior lawful residence in a Member State, and thus
providing residency rights to significant numbers of non-EU national spouses who
had been served with ‘intent to deport’ notices by the Department of Justice and
Equality beginning in 2007. It also caused the Government to amend a 2006
Regulation stipulating that Third Country non-EU nationals married to EU citizens
must have resided in another Member State before moving to Ireland, and in July
2008 the European Communities (Free Movement of Persons) (Amendment)
Regulations 2008 (S.I. No. 310 of 2008) was published. During 2009 there were
2,070 applications for residence in Ireland by spouses of an EU national and under
the EU Free Movement Directive 2004/38/EC.15 Of the main applicant countries
(excluding EU2 applications), Pakistani nationals were the largest single grouping
accounting for 384 applications. Nationals of Nigeria (238 applications), Brazil
(148 applications), India (121 applications) and South Africa (117 applications)
were also represented in the largest groups within applications.
http://www.irishstatutebook.ie/2009/en/si/0287.html. 13
The category of ‘General Permission to Remain’ includes Change of Status; De Facto Relationship with Irish Nationals; De Facto Relationship with Non-EEA Nationals; Dependants of Non-EEA or Irish Nationals; Extension of C Visit Visa; Extension of Student Conditions; Extension of Visitors Conditions including Self Sufficiency; Extension of Work Permit Conditions; Medical Treatment; Missionaries; Stamp 4 (original circumstances changed); Doctors; Turkish Association; Undocumented Scheme (scheme closed as of end of 2009).
14 Case C-127/08 Metock and Ors v Minister for Justice, Equality and Law Reform, Unreported, European Court of
Justice, 25/07/2008; Unreported, High Court, Finlay Geoghegan J., 14/03/2008. 15
Department of Justice and Equality.

Illegal Immigration and Return | 23
Chapter 4
Illegal Immigration and Return
In January 2009, the Minister for Justice and Equality announced the approval by
Government of the first phase of a new border control system to be introduced in
2010. The Irish Border Information System (IBIS) is intended to address the issue
of ‘overstayers’ in Ireland and will entail all passenger information collected by
carriers prior to travel being sent to an Irish Border Operations Centre (I-BOC)
where it will be screened against ‘immigration, Garda, customs and other watch-
lists’.16 If a match occurs, the relevant agency will be notified and provided with
time to take appropriate measures such as monitoring, intercepting or arresting
the passenger.
4.1 PREVENTION OF ILLEGAL ENTRY AND STAY – APPREHENSIONS (ARTICLE 5.1B)
In 2009, some 5,035 Third Country Nationals were apprehended or found to be
illegally present in Ireland, an increase of 58.1 per cent on corresponding figures
for 2008. Of the 2009 number, almost two-thirds were male (63.2 per cent) and
within the 18-34 age group (54 per cent).
Table 17: Third Country Nationals Found to be Illegally Present by Sex and Age, 2009
Sex Age
Total Males Females Less than 14 years 14 to 17 years 18 to 34 years 35 years or over
5,035 3,180 1,855 765 115 2,720 1,435
Source: Eurostat.
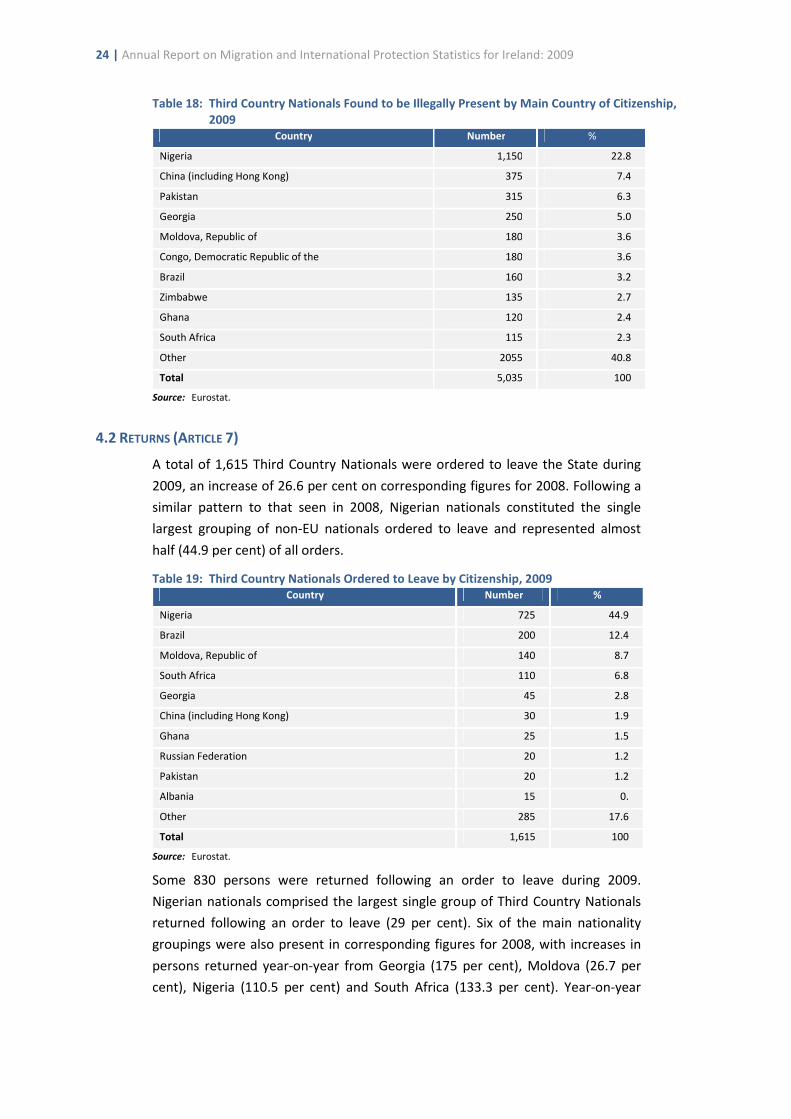
Table 18 outlines the main nationality groupings of Third Country Nationals
apprehended or found to be illegally present in Ireland during 2009. Eight of the
main nationalities were also present in corresponding data for 2008, with Brazil
and Zimbabwe present for 2009 only. During 2009, increased numbers of
apprehensions were found to be persons from Congo (74.8 per cent), Georgia
(71.2 per cent), Ghana (57.9 per cent), Moldova (20 per cent), Nigeria (15.7 per
cent), Pakistan (238.7 per cent) and South Africa (43.8 per cent).
16 Department of Justice, Equality and Law Reform (15 January 2009). ‘Ahern Announces New Border Control System’.
Press Release. Available at http://www.justice.ie/en/JELR/Pages/PR09000014.
24 | Annual Report on Migration and International Protection Statistics for Ireland: 2009
Table 18: Third Country Nationals Found to be Illegally Present by Main Country of Citizenship,
2009
Country Number %
Nigeria 1,150 22.8
China (including Hong Kong) 375 7.4
Pakistan 315 6.3
Georgia 250 5.0
Moldova, Republic of 180 3.6
Congo, Democratic Republic of the 180 3.6
Brazil 160 3.2
Zimbabwe 135 2.7
Ghana 120 2.4
South Africa 115 2.3
Other 2055 40.8
Total 5,035 100
Source: Eurostat.
4.2 RETURNS (ARTICLE 7)
A total of 1,615 Third Country Nationals were ordered to leave the State during
2009, an increase of 26.6 per cent on corresponding figures for 2008. Following a
similar pattern to that seen in 2008, Nigerian nationals constituted the single
largest grouping of non-EU nationals ordered to leave and represented almost
half (44.9 per cent) of all orders.
Table 19: Third Country Nationals Ordered to Leave by Citizenship, 2009
Country Number %
Nigeria 725 44.9
Brazil 200 12.4
Moldova, Republic of 140 8.7
South Africa 110 6.8
Georgia 45 2.8
China (including Hong Kong) 30 1.9
Ghana 25 1.5
Russian Federation 20 1.2
Pakistan 20 1.2
Albania 15 0.
Other 285 17.6
Total 1,615 100
Source: Eurostat.
Some 830 persons were returned following an order to leave during 2009.
Nigerian nationals comprised the largest single group of Third Country Nationals
returned following an order to leave (29 per cent). Six of the main nationality
groupings were also present in corresponding figures for 2008, with increases in
persons returned year-on-year from Georgia (175 per cent), Moldova (26.7 per
cent), Nigeria (110.5 per cent) and South Africa (133.3 per cent). Year-on-year

Illegal Immigration and Return | 25
decreases took place for persons returned following an order to leave from Brazil
(25.4 per cent) and China (46 per cent).
Table 20: Third Country Nationals Returned Following an Order to Leave by Main Country of
Nationality, 2009
Country Number %
Nigeria 240 29.0
Brazil 200 24.1
Moldova, Republic of 95 11.4
Georgia 55 6.6
South Africa 35 4.2
China (including Hong Kong) 20 2.4
Pakistan 20 2.4
Russian Federation 15 1.8
Mauritius 15 1.8
Croatia 10 1.2
Other 125 15.1
Total 830 100
Source: Eurostat Note: Returns effected may relate to orders signed in previous years.
4.2.1 Voluntary Return
In 2009 in Ireland, 539 persons were assisted in returning home voluntarily.17 Of
this figure, some 405 persons were assisted to return by the International
Organization for Migration (IOM) and 134 persons received administrative
assistance to return by the Department of Justice and Equality. Overall, the
majority of returnees were of Brazilian nationality with nationals of Moldova,
Nigeria, Georgia and Mauritius also constituting large groupings.
4.2.2 Judicial Review
A total of 267 legal challenges via judicial review were instituted by persons facing
deportation/transfer or removal from Ireland during 2009. By year end, some 250
judicial review cases were still before the courts.
17 Department of Justice and Equality.
26 | Annual Report on Migration and International Protection Statistics for Ireland: 2009
Chapter 5
Border Control
Two pieces of legislation in the arena of border control came into operation
during 2009: the Immigration Act 2004 (Visas)(No.2) Order 2009 and the
Immigration Act 2004 (Visas) Order 2009.
S.I. No. 453 of 2009, the Immigration Act 2004 (Visas) (No.2) Order 2009 was
signed on 16 November 2009 to be enacted on 1 January 2010. It revoked S.I. No.
239 of 2009, the Immigration Act 2004 (Visas) Order 2009, which came into effect
on 1 July 2009. The principal change effected by the Order is that nationals of
Mauritius are subject to an Irish visa requirement from 1 January 2010. The Order
specifies the classes of non-Irish nationals who are not required to be in
possession of a valid Irish visa when travelling to Ireland (including EU nationals),
as well as nationalities who are required to have a transit visa when travelling
through Ireland to another country. The Order also includes certain non-Irish
national holders of a valid Convention travel document issued by specified
countries,18 a valid permanent residence card issued under Regulation 16 of the
Regulations of 2006 or a valid residence card issued under Regulation 7 of the
Regulations of 2006 as being exempt from requiring a valid Irish visa when landing
in the State.19
S.I. 239 of 2009, the Immigration Act 2004 (Visas) Order 2009, was signed on 10
June 2009 and specified the classes of non-nationals required to be in possession
of a valid Irish transit visa when arriving at a port in the State for purposes of
passing through the port in order to travel to another state. The change effected
by the Order is that nationals of Taiwan are, from 1 July 2009, no longer subject
to an Irish visa requirement.20 It was revoked by S.I. No.453 of 2009 (detailed
above), to be enacted on 1 January 2010.
18 A valid Convention travel document is specified as being issued by Belgium, Czech Republic, Denmark, Finland,
Germany, Iceland, Italy, Liechtenstein, Luxembourg, Malta, Netherlands, Norway, Poland, Portugal, Romania, Slovak Republic, Spain, Sweden, or Switzerland and where the intended purpose of the travel to the State by the holder of such a travel document is solely for a visit of up to a maximum period of three months.
19 S.I. No. 453 of 2009, the Immigration Act 2004 (Visas) (No.2) Order 2009 is available at
http://www.irishstatutebook.ie/2009/en/si/0453.html. 20
S.I. 239 of 2009, the Immigration Act 2004 (Visas) Order 2009 is available at http://www.irishstatutebook.ie/2009/en/si/0239.html.
Border Control | 27
5.1 PREVENTION OF ILLEGAL ENTRY AND STAY – REFUSALS (ARTICLE 5.1A)
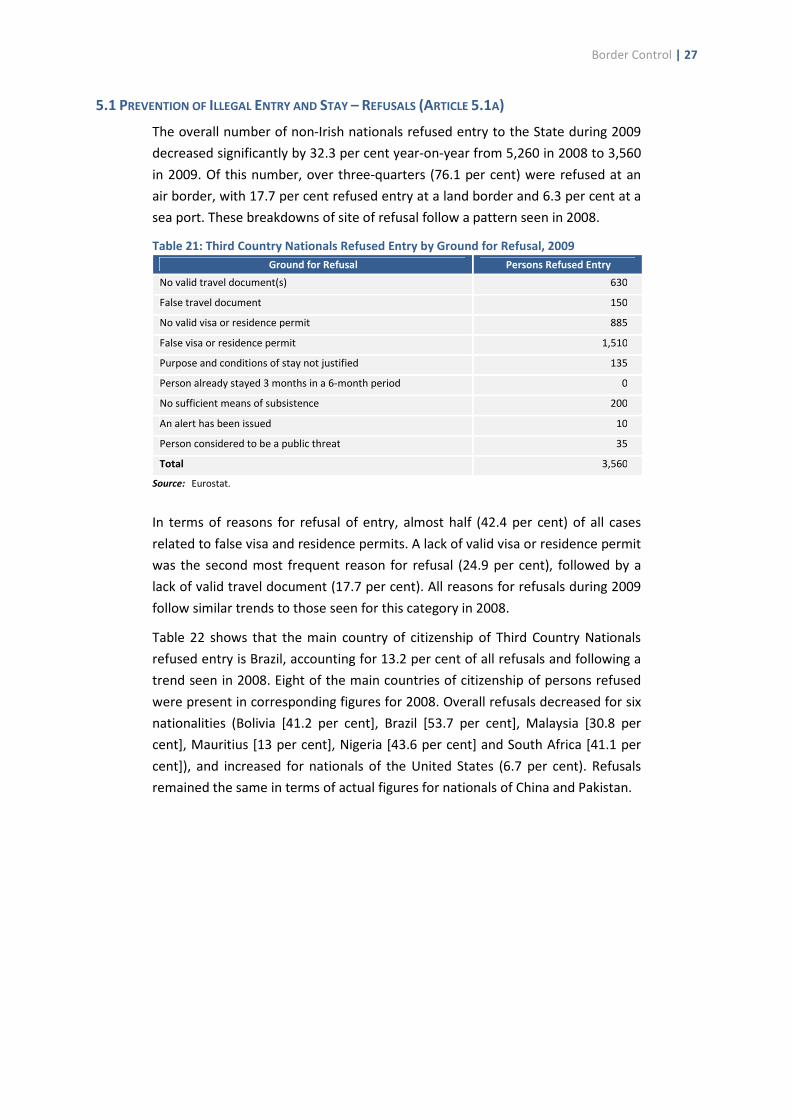
The overall number of non-Irish nationals refused entry to the State during 2009
decreased significantly by 32.3 per cent year-on-year from 5,260 in 2008 to 3,560
in 2009. Of this number, over three-quarters (76.1 per cent) were refused at an
air border, with 17.7 per cent refused entry at a land border and 6.3 per cent at a
sea port. These breakdowns of site of refusal follow a pattern seen in 2008.
Table 21: Third Country Nationals Refused Entry by Ground for Refusal, 2009
Ground for Refusal Persons Refused Entry
No valid travel document(s) 630
False travel document 150
No valid visa or residence permit 885
False visa or residence permit 1,510
Purpose and conditions of stay not justified 135
Person already stayed 3 months in a 6-month period 0
No sufficient means of subsistence 200
An alert has been issued 10
Person considered to be a public threat 35
Total 3,560
Source: Eurostat.
In terms of reasons for refusal of entry, almost half (42.4 per cent) of all cases
related to false visa and residence permits. A lack of valid visa or residence permit
was the second most frequent reason for refusal (24.9 per cent), followed by a
lack of valid travel document (17.7 per cent). All reasons for refusals during 2009
follow similar trends to those seen for this category in 2008.
Table 22 shows that the main country of citizenship of Third Country Nationals
refused entry is Brazil, accounting for 13.2 per cent of all refusals and following a
trend seen in 2008. Eight of the main countries of citizenship of persons refused
were present in corresponding figures for 2008. Overall refusals decreased for six
nationalities (Bolivia [41.2 per cent], Brazil [53.7 per cent], Malaysia [30.8 per
cent], Mauritius [13 per cent], Nigeria [43.6 per cent] and South Africa [41.1 per
cent]), and increased for nationals of the United States (6.7 per cent). Refusals
remained the same in terms of actual figures for nationals of China and Pakistan.

28 | Annual Report on Migration and International Protection Statistics for Ireland: 2009
Table 22: Third Country Nationals Refused Entry by Main Country of Citizenship, 2009
Country Persons
Refused Entry
Refused at the
Land Border
Refused at the
Sea Border
Refused at the
Air Border
Brazil 470 20 10 440
China (including Hong Kong) 385 145 15 225
Nigeria 285 60 25 205
South Africa 215 10 5 200
United States 160 5 5 150
Malaysia 135 10 5 120
Egypt 105 20 0 85
Mauritius 100 5 0 95
Bolivia 100 0 5 90
Pakistan 95 30 5 60
Other 1510 325 150 1040
Total 3,560 630 225 2,710
Source: Eurostat.
5.2 RELATIONSHIP BETWEEN REFUSALS, APPREHENSIONS AND RETURNS
Regarding the relationship between refusals, apprehensions and returns in 2009,
several countries can be seen across all categories: Brazilian, Chinese, Nigerian,
Pakistani and South African nationals can be seen across all categories, with
nationals of Georgia and Moldova present across main country of nationality for
apprehensions and returns. Nationals of Mauritius can be seen across main
country of nationality for refusals and returns.
Chart 1: Relationship between Refusals, Apprehensions and Returns, 2009
Source: Eurostat.
0 500 1000 1500
Nigeria
China (incl Hong Kong)
Pakistan
Georgia
Moldova
Brazil
South Africa
Mauritius
Returns
Apprehensions
Refusals

Asylum and International Protection (Article 4) | 29
Chapter 6
Asylum and International Protection (Article 4)
6.1 APPLICATIONS FOR INTERNATIONAL PROTECTION
Data regarding new asylum applications is available for years preceding the
introduction of the Migratory Statistics Regulation and is included for
comparability. Of note, in accordance with best practice procedure and provisions
under the Migratory Statistics Regulation, rounding of published figures for
international protection has taken place. Therefore, cases may exist where the
overall total figures do not match the total figures by age group or sex.
6.1.1 Asylum Applications
The overall number of asylum applications made during 2009 was 2,690, of which
2,660 were new applications. The number of new applications decreased by 30.1
per cent during 2009 and remained much lower than preceding years. This is in
direct contrast to wider European trends for 2009 where EU27 Member States
registered an overall year-on-year increase of 3 per cent in asylum applications.21
Table 23: New Asylum Applications, 1997-2009
1997 1998 1999 2000 2001 2002 2003 2004 2005 2006 2007 2008 2009
Number of First Applications
3,355 4,369 7,673 10,911 10,316 11,598 7,483 4,265 4,304 4,241 3,933 3,805 2,660
Source: 1997-2007: Eurostat, Department of Justice and Equality as referenced in Annual Report on Asylum and Migration Statistics
for Ireland:
2007; 2008 onwards: Eurostat.
Overall asylum applications saw a preponderance of male applicants (65.4 per
cent) and a concentration of those within the 18-34 age group (55 per cent).
Almost a quarter of applications (22.7 per cent) concerned those less than 14
years.
New asylum applications followed the pattern of overall cases, with a majority of
male applicants (65.6 per cent) and those within the 18-34 age group (55.5 per
cent).
Table 24 shows the main citizenship groupings of both overall and new applicants
for asylum during 2009. Nigerian nationals continued to present as the largest
21 UNHCR (2010). Asylum Levels and Trends in Industrialized Countries 2009. Available at www.unhcr.org.

30 | Annual Report on Migration and International Protection Statistics for Ireland: 2009
single grouping in 2009, with nine of the same countries present in figures for
2008 and 2009.
Table 24: Overall Applications for Asylum by Main Country of Citizenship, 2009;
New Asylum Applicants by Main Country of Citizenship, 2009
Overall Asylum Applicants by Main Country of
Citizenship, 2009
New Asylum Applicants by Main Country of
Citizenship, 2009
Country Number Country Number
Nigeria 570 Nigeria 565
Pakistan 260 Pakistan 260
China (including Hong Kong) 195 China (including Hong Kong) 195
Congo, Democratic Republic of the 100 Congo, Democratic Republic of the 100
Zimbabwe 90 Zimbabwe 90
Georgia 90 Somalia 85
Moldova, Republic of 85 Georgia 85
Somalia 85 Moldova, Republic of 80
Ghana 80 Ghana 80
Iraq 75 Iraq 75
Other 1,060 Other 1,045
Total 2,690 Total 2,660
Source: Eurostat.
Chart 2 shows the presence of main countries of citizenship for new asylum
applicants during 2009 from 2004 to date. Nigeria, China and Georgia are present
across each year, with nationals of Nigeria and Georgian showing a decrease in
2009 figures.
Chart 2: New Asylum Applicants by Main Country of Citizenship 2009 from 2004-2009
Source: 2004-2007: Department of Justice and Equality; 2008 onwards: Eurostat.
6.1.2 Withdrawn Applications for Asylum
During 2009, some 900 applications for asylum were withdrawn, accounting for a
decrease of 2.2 per cent decrease on figures for 200. Overall, the vast majority of
0
200
400
600
800
1000
1200
1400
1600
2004 2005 2006 2007 2008 2009
Nigeria
China
Moldova
Somalia
Congo, DRC
Georgia
Iraq
Pakistan
Zimbabwe
Ghana
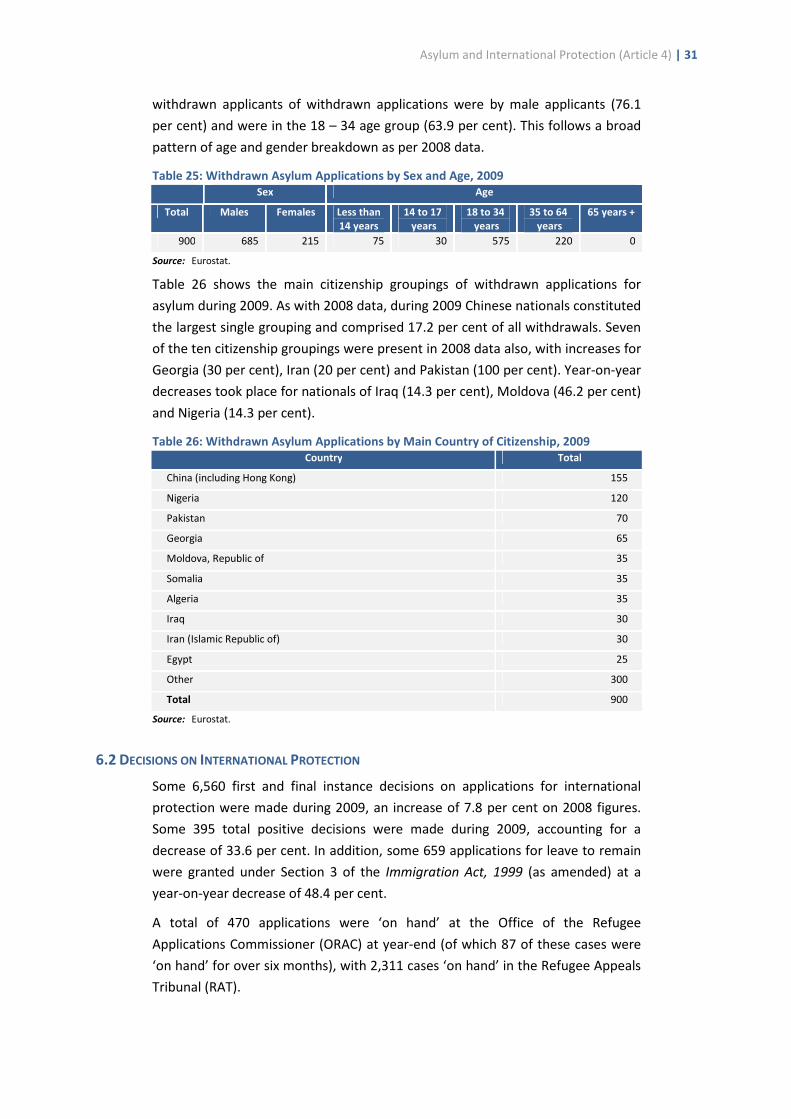
Asylum and International Protection (Article 4) | 31
withdrawn applicants of withdrawn applications were by male applicants (76.1
per cent) and were in the 18 – 34 age group (63.9 per cent). This follows a broad
pattern of age and gender breakdown as per 2008 data.
Table 25: Withdrawn Asylum Applications by Sex and Age, 2009
Sex Age
Total Males Females Less than
14 years
14 to 17
years
18 to 34
years
35 to 64
years
65 years +
900 685 215 75 30 575 220 0
Source: Eurostat.
Table 26 shows the main citizenship groupings of withdrawn applications for
asylum during 2009. As with 2008 data, during 2009 Chinese nationals constituted
the largest single grouping and comprised 17.2 per cent of all withdrawals. Seven
of the ten citizenship groupings were present in 2008 data also, with increases for
Georgia (30 per cent), Iran (20 per cent) and Pakistan (100 per cent). Year-on-year
decreases took place for nationals of Iraq (14.3 per cent), Moldova (46.2 per cent)
and Nigeria (14.3 per cent).
Table 26: Withdrawn Asylum Applications by Main Country of Citizenship, 2009
Country Total
China (including Hong Kong) 155
Nigeria 120
Pakistan 70
Georgia 65
Moldova, Republic of 35
Somalia 35
Algeria 35
Iraq 30
Iran (Islamic Republic of) 30
Egypt 25
Other 300
Total 900
Source: Eurostat.
6.2 DECISIONS ON INTERNATIONAL PROTECTION
Some 6,560 first and final instance decisions on applications for international
protection were made during 2009, an increase of 7.8 per cent on 2008 figures.
Some 395 total positive decisions were made during 2009, accounting for a
decrease of 33.6 per cent. In addition, some 659 applications for leave to remain
were granted under Section 3 of the Immigration Act, 1999 (as amended) at a
year-on-year decrease of 48.4 per cent.
A total of 470 applications were ‘on hand’ at the Office of the Refugee
Applications Commissioner (ORAC) at year-end (of which 87 of these cases were
‘on hand’ for over six months), with 2,311 cases ‘on hand’ in the Refugee Appeals
Tribunal (RAT).
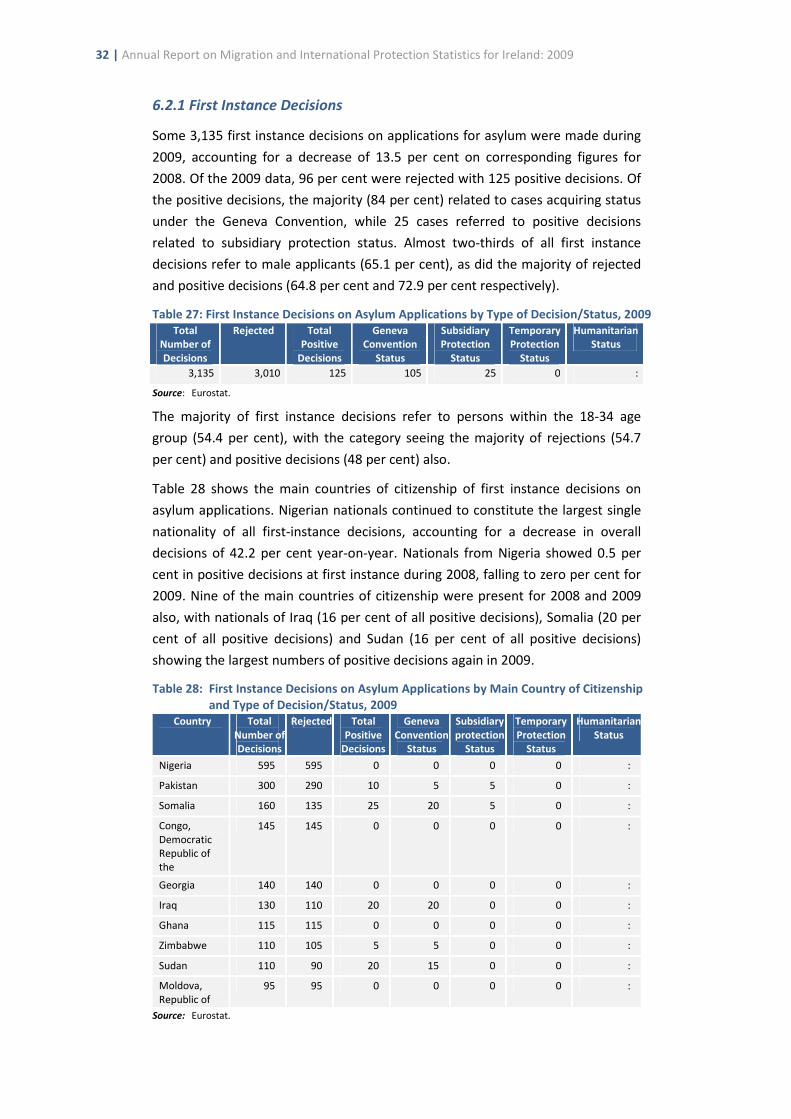
32 | Annual Report on Migration and International Protection Statistics for Ireland: 2009
6.2.1 First Instance Decisions
Some 3,135 first instance decisions on applications for asylum were made during
2009, accounting for a decrease of 13.5 per cent on corresponding figures for
2008. Of the 2009 data, 96 per cent were rejected with 125 positive decisions. Of
the positive decisions, the majority (84 per cent) related to cases acquiring status
under the Geneva Convention, while 25 cases referred to positive decisions
related to subsidiary protection status. Almost two-thirds of all first instance
decisions refer to male applicants (65.1 per cent), as did the majority of rejected
and positive decisions (64.8 per cent and 72.9 per cent respectively).
Table 27: First Instance Decisions on Asylum Applications by Type of Decision/Status, 2009
Total
Number of
Decisions
Rejected Total
Positive
Decisions
Geneva
Convention
Status
Subsidiary
Protection
Status
Temporary
Protection
Status
Humanitarian
Status
3,135 3,010 125 105 25 0 :
Source: Eurostat.
The majority of first instance decisions refer to persons within the 18-34 age
group (54.4 per cent), with the category seeing the majority of rejections (54.7
per cent) and positive decisions (48 per cent) also.
Table 28 shows the main countries of citizenship of first instance decisions on
asylum applications. Nigerian nationals continued to constitute the largest single
nationality of all first-instance decisions, accounting for a decrease in overall
decisions of 42.2 per cent year-on-year. Nationals from Nigeria showed 0.5 per
cent in positive decisions at first instance during 2008, falling to zero per cent for
2009. Nine of the main countries of citizenship were present for 2008 and 2009
also, with nationals of Iraq (16 per cent of all positive decisions), Somalia (20 per
cent of all positive decisions) and Sudan (16 per cent of all positive decisions)
showing the largest numbers of positive decisions again in 2009.
Table 28: First Instance Decisions on Asylum Applications by Main Country of Citizenship
and Type of Decision/Status, 2009
Country Total
Number of
Decisions
Rejected Total
Positive
Decisions
Geneva
Convention
Status
Subsidiary
protection
Status
Temporary
Protection
Status
Humanitarian
Status
Nigeria 595 595 0 0 0 0 :
Pakistan 300 290 10 5 5 0 :
Somalia 160 135 25 20 5 0 :
Congo, Democratic Republic of the
145 145 0 0 0 0 :
Georgia 140 140 0 0 0 0 :
Iraq 130 110 20 20 0 0 :
Ghana 115 115 0 0 0 0 :
Zimbabwe 110 105 5 5 0 0 :
Sudan 110 90 20 15 0 0 :
Moldova, Republic of
95 95 0 0 0 0 :
Source: Eurostat.
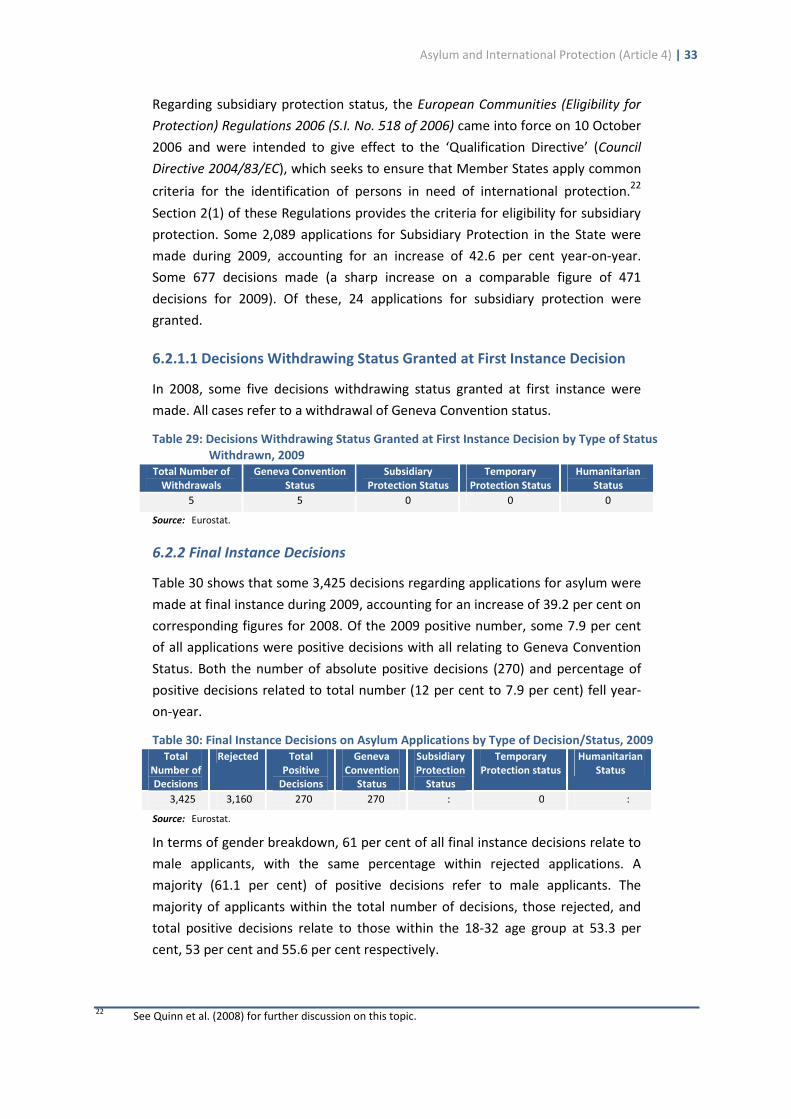
Asylum and International Protection (Article 4) | 33
Regarding subsidiary protection status, the European Communities (Eligibility for
Protection) Regulations 2006 (S.I. No. 518 of 2006) came into force on 10 October
2006 and were intended to give effect to the ‘Qualification Directive’ (Council
Directive 2004/83/EC), which seeks to ensure that Member States apply common
criteria for the identification of persons in need of international protection.22
Section 2(1) of these Regulations provides the criteria for eligibility for subsidiary
protection. Some 2,089 applications for Subsidiary Protection in the State were
made during 2009, accounting for an increase of 42.6 per cent year-on-year.
Some 677 decisions made (a sharp increase on a comparable figure of 471
decisions for 2009). Of these, 24 applications for subsidiary protection were
granted.
6.2.1.1 Decisions Withdrawing Status Granted at First Instance Decision
In 2008, some five decisions withdrawing status granted at first instance were
made. All cases refer to a withdrawal of Geneva Convention status.
Table 29: Decisions Withdrawing Status Granted at First Instance Decision by Type of Status
Withdrawn, 2009
Total Number of
Withdrawals
Geneva Convention
Status
Subsidiary
Protection Status
Temporary
Protection Status
Humanitarian
Status
5 5 0 0 0
Source: Eurostat.
6.2.2 Final Instance Decisions
Table 30 shows that some 3,425 decisions regarding applications for asylum were
made at final instance during 2009, accounting for an increase of 39.2 per cent on
corresponding figures for 2008. Of the 2009 positive number, some 7.9 per cent
of all applications were positive decisions with all relating to Geneva Convention
Status. Both the number of absolute positive decisions (270) and percentage of
positive decisions related to total number (12 per cent to 7.9 per cent) fell year-
on-year.
Table 30: Final Instance Decisions on Asylum Applications by Type of Decision/Status, 2009
Total
Number of
Decisions
Rejected Total
Positive
Decisions
Geneva
Convention
Status
Subsidiary
Protection
Status
Temporary
Protection status
Humanitarian
Status
3,425 3,160 270 270 : 0 :
Source: Eurostat.
In terms of gender breakdown, 61 per cent of all final instance decisions relate to
male applicants, with the same percentage within rejected applications. A
majority (61.1 per cent) of positive decisions refer to male applicants. The
majority of applicants within the total number of decisions, those rejected, and
total positive decisions relate to those within the 18-32 age group at 53.3 per
cent, 53 per cent and 55.6 per cent respectively.
22 See Quinn et al. (2008) for further discussion on this topic.
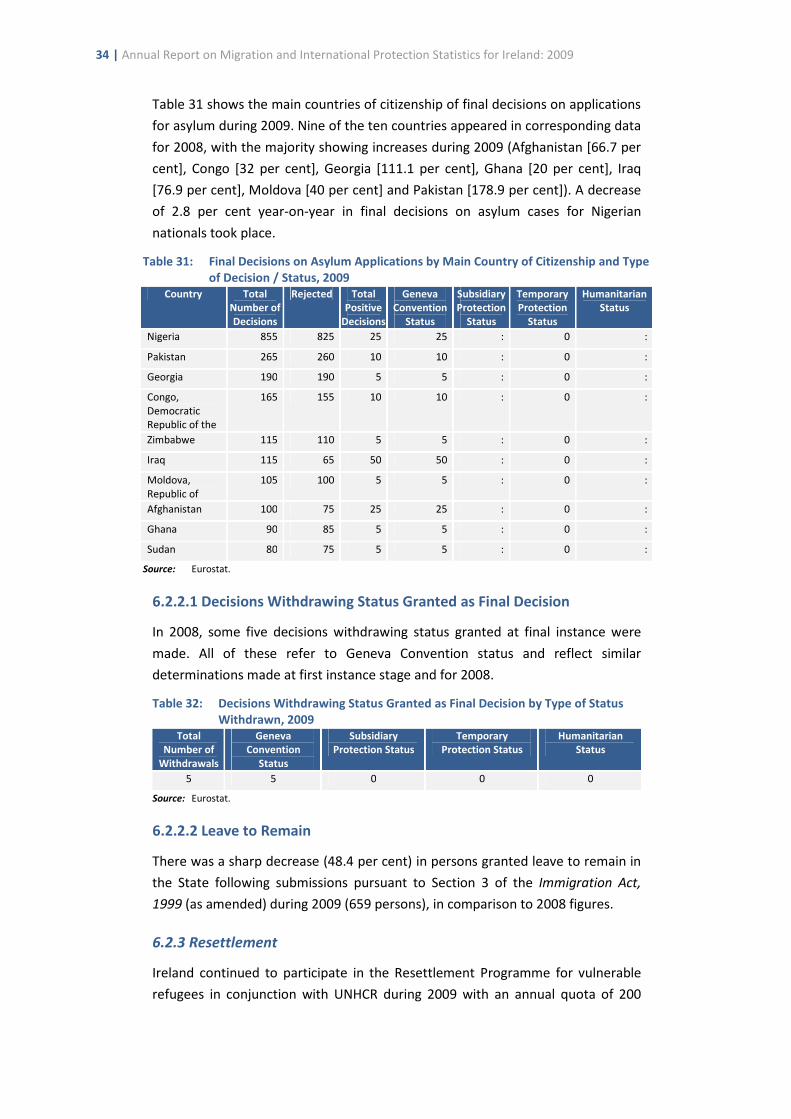
34 | Annual Report on Migration and International Protection Statistics for Ireland: 2009
Table 31 shows the main countries of citizenship of final decisions on applications
for asylum during 2009. Nine of the ten countries appeared in corresponding data
for 2008, with the majority showing increases during 2009 (Afghanistan [66.7 per
cent], Congo [32 per cent], Georgia [111.1 per cent], Ghana [20 per cent], Iraq
[76.9 per cent], Moldova [40 per cent] and Pakistan [178.9 per cent]). A decrease
of 2.8 per cent year-on-year in final decisions on asylum cases for Nigerian
nationals took place.
Table 31: Final Decisions on Asylum Applications by Main Country of Citizenship and Type
of Decision / Status, 2009
Country Total
Number of
Decisions
Rejected Total
Positive
Decisions
Geneva
Convention
Status
Subsidiary
Protection
Status
Temporary
Protection
Status
Humanitarian
Status
Nigeria 855 825 25 25 : 0 :
Pakistan 265 260 10 10 : 0 :
Georgia 190 190 5 5 : 0 :
Congo, Democratic Republic of the
165 155 10 10 : 0 :
Zimbabwe 115 110 5 5 : 0 :
Iraq 115 65 50 50 : 0 :
Moldova, Republic of
105 100 5 5 : 0 :
Afghanistan 100 75 25 25 : 0 :
Ghana 90 85 5 5 : 0 :
Sudan 80 75 5 5 : 0 :
Source: Eurostat.
6.2.2.1 Decisions Withdrawing Status Granted as Final Decision
In 2008, some five decisions withdrawing status granted at final instance were
made. All of these refer to Geneva Convention status and reflect similar
determinations made at first instance stage and for 2008.
Table 32: Decisions Withdrawing Status Granted as Final Decision by Type of Status
Withdrawn, 2009
Total
Number of
Withdrawals
Geneva
Convention
Status
Subsidiary
Protection Status
Temporary
Protection Status
Humanitarian
Status
5 5 0 0 0
Source: Eurostat.
6.2.2.2 Leave to Remain
There was a sharp decrease (48.4 per cent) in persons granted leave to remain in
the State following submissions pursuant to Section 3 of the Immigration Act,
1999 (as amended) during 2009 (659 persons), in comparison to 2008 figures.
6.2.3 Resettlement
Ireland continued to participate in the Resettlement Programme for vulnerable
refugees in conjunction with UNHCR during 2009 with an annual quota of 200
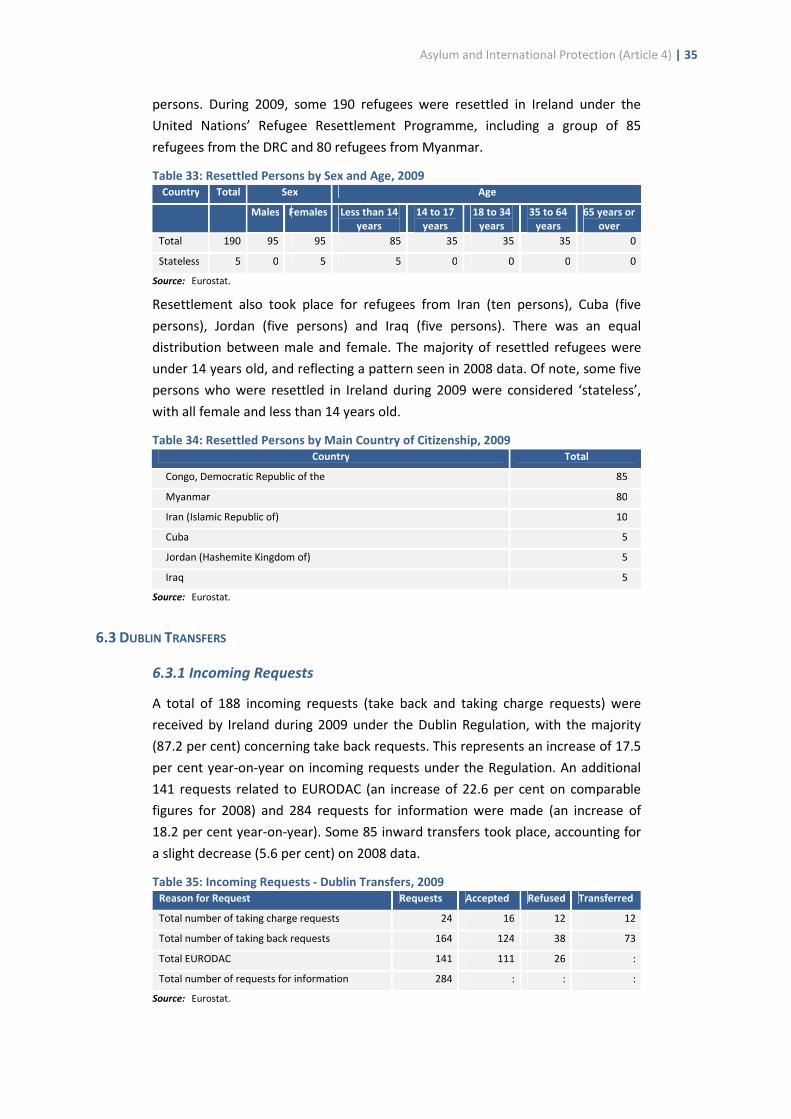
Asylum and International Protection (Article 4) | 35
persons. During 2009, some 190 refugees were resettled in Ireland under the
United Nations’ Refugee Resettlement Programme, including a group of 85
refugees from the DRC and 80 refugees from Myanmar.
Table 33: Resettled Persons by Sex and Age, 2009
Country Total Sex Age
Males Females Less than 14
years
14 to 17
years
18 to 34
years
35 to 64
years
65 years or
over
Total 190 95 95 85 35 35 35 0
Stateless 5 0 5 5 0 0 0 0
Source: Eurostat.
Resettlement also took place for refugees from Iran (ten persons), Cuba (five
persons), Jordan (five persons) and Iraq (five persons). There was an equal
distribution between male and female. The majority of resettled refugees were
under 14 years old, and reflecting a pattern seen in 2008 data. Of note, some five
persons who were resettled in Ireland during 2009 were considered ‘stateless’,
with all female and less than 14 years old.
Table 34: Resettled Persons by Main Country of Citizenship, 2009
Country Total
Congo, Democratic Republic of the 85
Myanmar 80
Iran (Islamic Republic of) 10
Cuba 5
Jordan (Hashemite Kingdom of) 5
Iraq 5
Source: Eurostat.
6.3 DUBLIN TRANSFERS
6.3.1 Incoming Requests
A total of 188 incoming requests (take back and taking charge requests) were
received by Ireland during 2009 under the Dublin Regulation, with the majority
(87.2 per cent) concerning take back requests. This represents an increase of 17.5
per cent year-on-year on incoming requests under the Regulation. An additional
141 requests related to EURODAC (an increase of 22.6 per cent on comparable
figures for 2008) and 284 requests for information were made (an increase of
18.2 per cent year-on-year). Some 85 inward transfers took place, accounting for
a slight decrease (5.6 per cent) on 2008 data.
Table 35: Incoming Requests - Dublin Transfers, 2009
Reason for Request Requests Accepted Refused Transferred
Total number of taking charge requests 24 16 12 12
Total number of taking back requests 164 124 38 73
Total EURODAC 141 111 26 :
Total number of requests for information 284 : : :
Source: Eurostat.
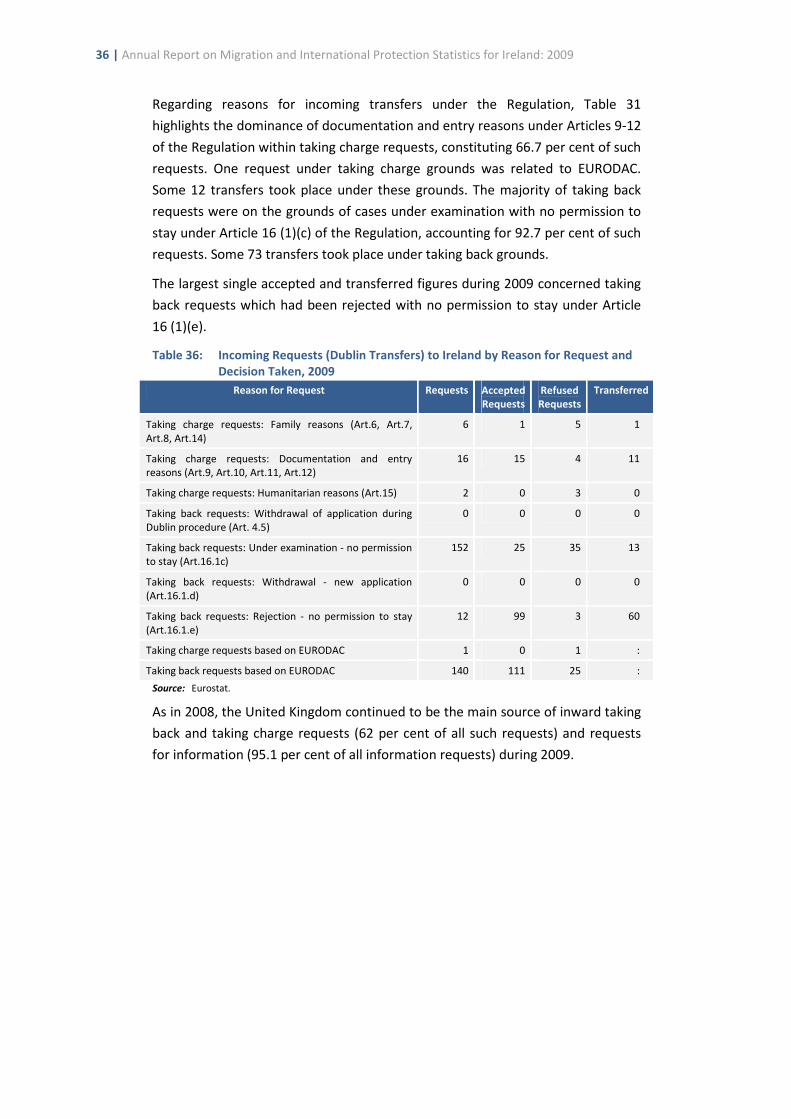
36 | Annual Report on Migration and International Protection Statistics for Ireland: 2009
Regarding reasons for incoming transfers under the Regulation, Table 31
highlights the dominance of documentation and entry reasons under Articles 9-12
of the Regulation within taking charge requests, constituting 66.7 per cent of such
requests. One request under taking charge grounds was related to EURODAC.
Some 12 transfers took place under these grounds. The majority of taking back
requests were on the grounds of cases under examination with no permission to
stay under Article 16 (1)(c) of the Regulation, accounting for 92.7 per cent of such
requests. Some 73 transfers took place under taking back grounds.
The largest single accepted and transferred figures during 2009 concerned taking
back requests which had been rejected with no permission to stay under Article
16 (1)(e).
Table 36: Incoming Requests (Dublin Transfers) to Ireland by Reason for Request and
Decision Taken, 2009
Reason for Request Requests Accepted
Requests
Refused
Requests
Transferred
Taking charge requests: Family reasons (Art.6, Art.7, Art.8, Art.14)
6 1 5 1
Taking charge requests: Documentation and entry reasons (Art.9, Art.10, Art.11, Art.12)
16 15 4 11
Taking charge requests: Humanitarian reasons (Art.15) 2 0 3 0
Taking back requests: Withdrawal of application during Dublin procedure (Art. 4.5)
0 0 0 0
Taking back requests: Under examination - no permission to stay (Art.16.1c)
152 25 35 13
Taking back requests: Withdrawal - new application (Art.16.1.d)
0 0 0 0
Taking back requests: Rejection - no permission to stay (Art.16.1.e)
12 99 3 60
Taking charge requests based on EURODAC 1 0 1 :
Taking back requests based on EURODAC 140 111 25 :
Source: Eurostat.
As in 2008, the United Kingdom continued to be the main source of inward taking
back and taking charge requests (62 per cent of all such requests) and requests
for information (95.1 per cent of all information requests) during 2009.
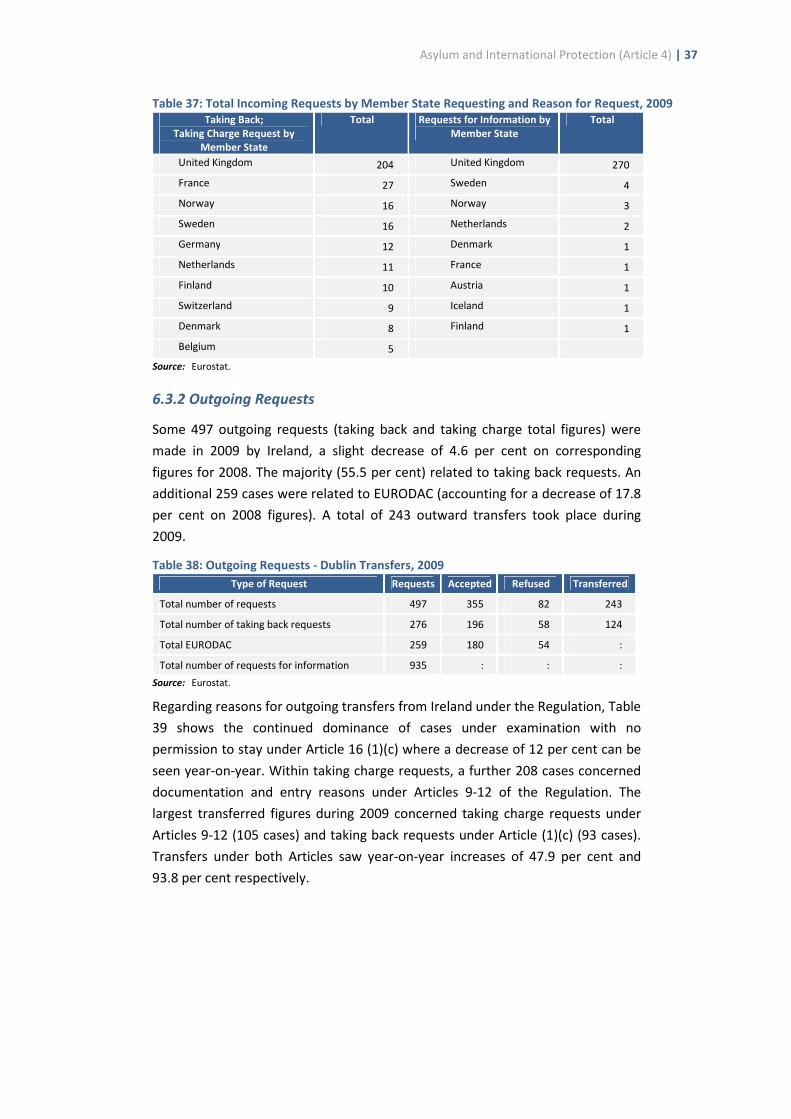
Asylum and International Protection (Article 4) | 37
Table 37: Total Incoming Requests by Member State Requesting and Reason for Request, 2009
Taking Back;
Taking Charge Request by
Member State
Total Requests for Information by
Member State
Total
United Kingdom 204 United Kingdom 270
France 27 Sweden 4
Norway 16 Norway 3
Sweden 16 Netherlands 2
Germany 12 Denmark 1
Netherlands 11 France 1
Finland 10 Austria 1
Switzerland 9 Iceland 1
Denmark 8 Finland 1
Belgium 5
Source: Eurostat.
6.3.2 Outgoing Requests
Some 497 outgoing requests (taking back and taking charge total figures) were
made in 2009 by Ireland, a slight decrease of 4.6 per cent on corresponding
figures for 2008. The majority (55.5 per cent) related to taking back requests. An
additional 259 cases were related to EURODAC (accounting for a decrease of 17.8
per cent on 2008 figures). A total of 243 outward transfers took place during
2009.
Table 38: Outgoing Requests - Dublin Transfers, 2009
Type of Request Requests Accepted Refused Transferred
Total number of requests 497 355 82 243
Total number of taking back requests 276 196 58 124
Total EURODAC 259 180 54 :
Total number of requests for information 935 : : :
Source: Eurostat.
Regarding reasons for outgoing transfers from Ireland under the Regulation, Table
39 shows the continued dominance of cases under examination with no
permission to stay under Article 16 (1)(c) where a decrease of 12 per cent can be
seen year-on-year. Within taking charge requests, a further 208 cases concerned
documentation and entry reasons under Articles 9-12 of the Regulation. The
largest transferred figures during 2009 concerned taking charge requests under
Articles 9-12 (105 cases) and taking back requests under Article (1)(c) (93 cases).
Transfers under both Articles saw year-on-year increases of 47.9 per cent and
93.8 per cent respectively.
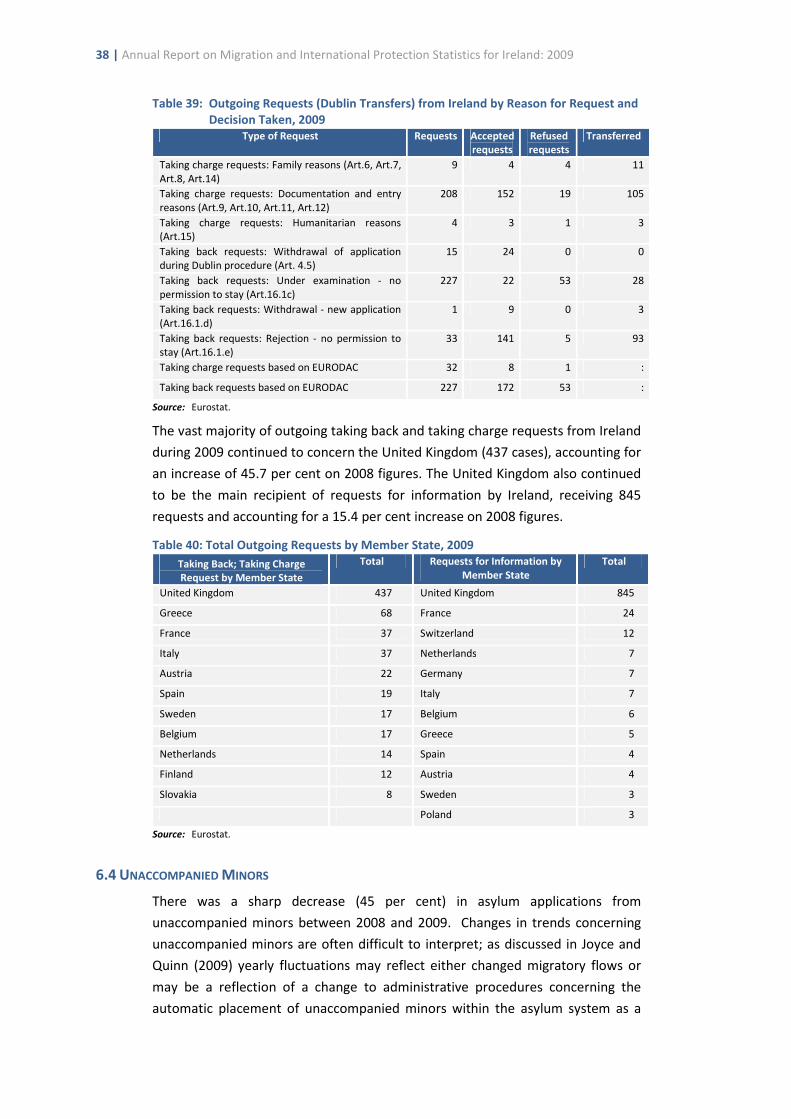
38 | Annual Report on Migration and International Protection Statistics for Ireland: 2009
Table 39: Outgoing Requests (Dublin Transfers) from Ireland by Reason for Request and
Decision Taken, 2009
Type of Request Requests Accepted
requests
Refused
requests
Transferred
Taking charge requests: Family reasons (Art.6, Art.7, Art.8, Art.14)
9 4 4 11
Taking charge requests: Documentation and entry reasons (Art.9, Art.10, Art.11, Art.12)
208 152 19 105
Taking charge requests: Humanitarian reasons (Art.15)
4 3 1 3
Taking back requests: Withdrawal of application during Dublin procedure (Art. 4.5)
15 24 0 0
Taking back requests: Under examination - no permission to stay (Art.16.1c)
227 22 53 28
Taking back requests: Withdrawal - new application (Art.16.1.d)
1 9 0 3
Taking back requests: Rejection - no permission to stay (Art.16.1.e)
33 141 5 93
Taking charge requests based on EURODAC 32 8 1 :
Taking back requests based on EURODAC 227 172 53 :
Source: Eurostat.
The vast majority of outgoing taking back and taking charge requests from Ireland
during 2009 continued to concern the United Kingdom (437 cases), accounting for
an increase of 45.7 per cent on 2008 figures. The United Kingdom also continued
to be the main recipient of requests for information by Ireland, receiving 845
requests and accounting for a 15.4 per cent increase on 2008 figures.
Table 40: Total Outgoing Requests by Member State, 2009
Taking Back; Taking Charge
Request by Member State
Total Requests for Information by
Member State
Total
United Kingdom 437 United Kingdom 845
Greece 68 France 24
France 37 Switzerland 12
Italy 37 Netherlands 7
Austria 22 Germany 7
Spain 19 Italy 7
Sweden 17 Belgium 6
Belgium 17 Greece 5
Netherlands 14 Spain 4
Finland 12 Austria 4
Slovakia 8 Sweden 3
Poland 3
Source: Eurostat.
6.4 UNACCOMPANIED MINORS
There was a sharp decrease (45 per cent) in asylum applications from
unaccompanied minors between 2008 and 2009. Changes in trends concerning
unaccompanied minors are often difficult to interpret; as discussed in Joyce and
Quinn (2009) yearly fluctuations may reflect either changed migratory flows or
may be a reflection of a change to administrative procedures concerning the
automatic placement of unaccompanied minors within the asylum system as a
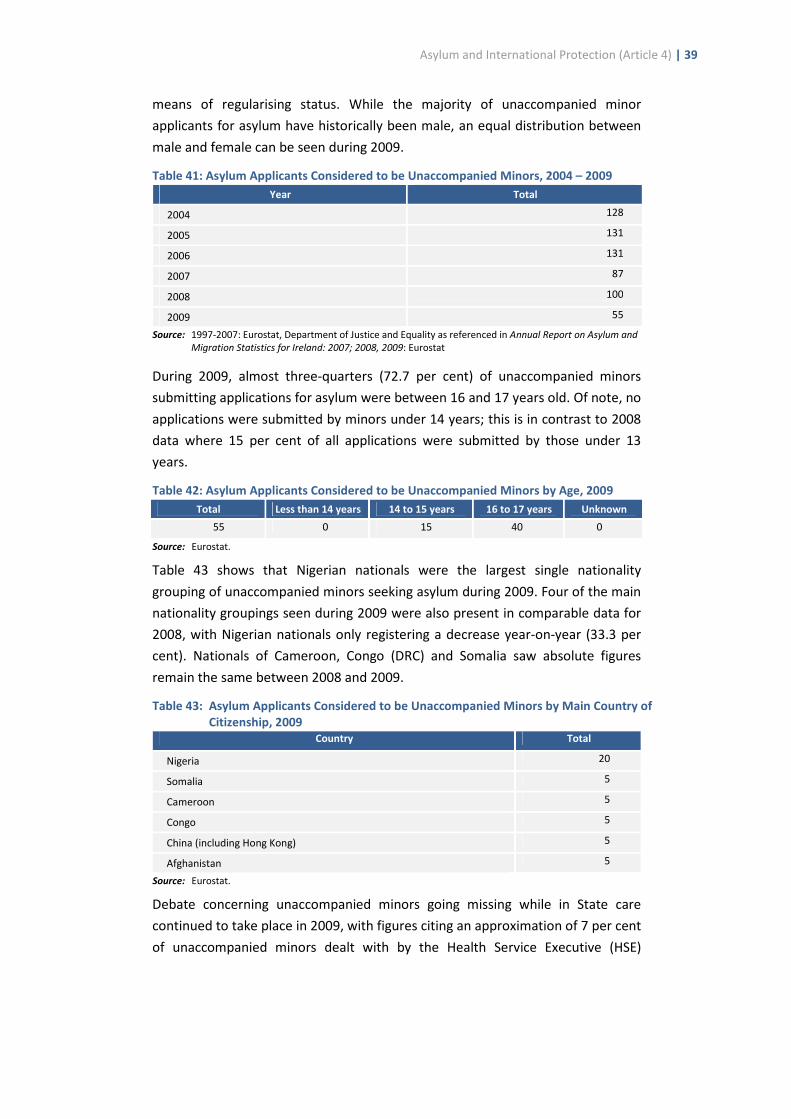
Asylum and International Protection (Article 4) | 39
means of regularising status. While the majority of unaccompanied minor
applicants for asylum have historically been male, an equal distribution between
male and female can be seen during 2009.
Table 41: Asylum Applicants Considered to be Unaccompanied Minors, 2004 – 2009
Year Total
2004 128
2005 131
2006 131
2007 87
2008 100
2009 55
Source: 1997-2007: Eurostat, Department of Justice and Equality as referenced in Annual Report on Asylum and
Migration Statistics for Ireland: 2007; 2008, 2009: Eurostat
During 2009, almost three-quarters (72.7 per cent) of unaccompanied minors
submitting applications for asylum were between 16 and 17 years old. Of note, no
applications were submitted by minors under 14 years; this is in contrast to 2008
data where 15 per cent of all applications were submitted by those under 13
years.
Table 42: Asylum Applicants Considered to be Unaccompanied Minors by Age, 2009
Total Less than 14 years 14 to 15 years 16 to 17 years Unknown
55 0 15 40 0
Source: Eurostat.
Table 43 shows that Nigerian nationals were the largest single nationality
grouping of unaccompanied minors seeking asylum during 2009. Four of the main
nationality groupings seen during 2009 were also present in comparable data for
2008, with Nigerian nationals only registering a decrease year-on-year (33.3 per
cent). Nationals of Cameroon, Congo (DRC) and Somalia saw absolute figures
remain the same between 2008 and 2009.
Table 43: Asylum Applicants Considered to be Unaccompanied Minors by Main Country of
Citizenship, 2009
Country Total
Nigeria 20
Somalia 5
Cameroon 5
Congo 5
China (including Hong Kong) 5
Afghanistan 5
Source: Eurostat.
Debate concerning unaccompanied minors going missing while in State care
continued to take place in 2009, with figures citing an approximation of 7 per cent
of unaccompanied minors dealt with by the Health Service Executive (HSE)

40 | Annual Report on Migration and International Protection Statistics for Ireland: 2009
between 2000 and 2008 having subsequently gone missing.23 In June 2009,
figures cited by The Irish Times stated that some 23 unaccompanied minors had
disappeared from HSE managed hostels since the beginning of 2009.24 Year-end
figures of minors recorded as missing from care stood at 47 cases, with the HSE
stating that some 36 of these minors were of Chinese nationality.25
In terms of policy provision, in April 2009 the HSE and An Garda Síochána signed a
Joint Protocol on Missing Children which sets out the roles and responsibilities of
both agencies in relation to children missing from State care, including
unaccompanied minors.26 The Office of the Minister for Children published an
Implementation Plan from the Report of the Commission to Inquire into Child
Abuse, 2009 in July of this year.27 The Plan contains a review of the number of,
and care provisions for, unaccompanied minors. A commitment is made to
allocate a social worker to unaccompanied minors in care, and for them to be
placed in ‘accommodation suitable for their needs and inspected like any other
children’s hostels’.
23 Health Service Executive report ‘The Review of Adequacy of Services for Children and Families, 2008’ as cited in the
Irish Times (4 November 2009). Available at www.irishtimes.com. 24
The Irish Times (17 June 2009) ‘Disappeared: 20-plus children missing from HSE care’. Available at www.irishtimes.com.
25 The Irish Times (1 February 2010) ‘Most minors who went missing from care were Chinese’. Available at
www.irishtimes.com. 26
Health Service Executive (23 July 2007). An Garda Síochána and Health Service Executive Joint Protocol on Missing Children. Press release available at http://www.hse.ie/eng/services/newscentre/2009_Archive/April_2009/An_Garda_S%C3%ADochana_and_Health_Service_Executive%C2%A0_%C2%A0JOINT_PROTOCOL_ON_MISSING_CHILDREN.html.
27 Office of the Minister for Children (July 2009). Implementation Plan from the Report of the Commission to Inquire
into Child Abuse, 2009. Available at http://www.omc.gov.ie/documents/publications/Implementation_Plan_from_Ryan_Commission_Report.pdf.
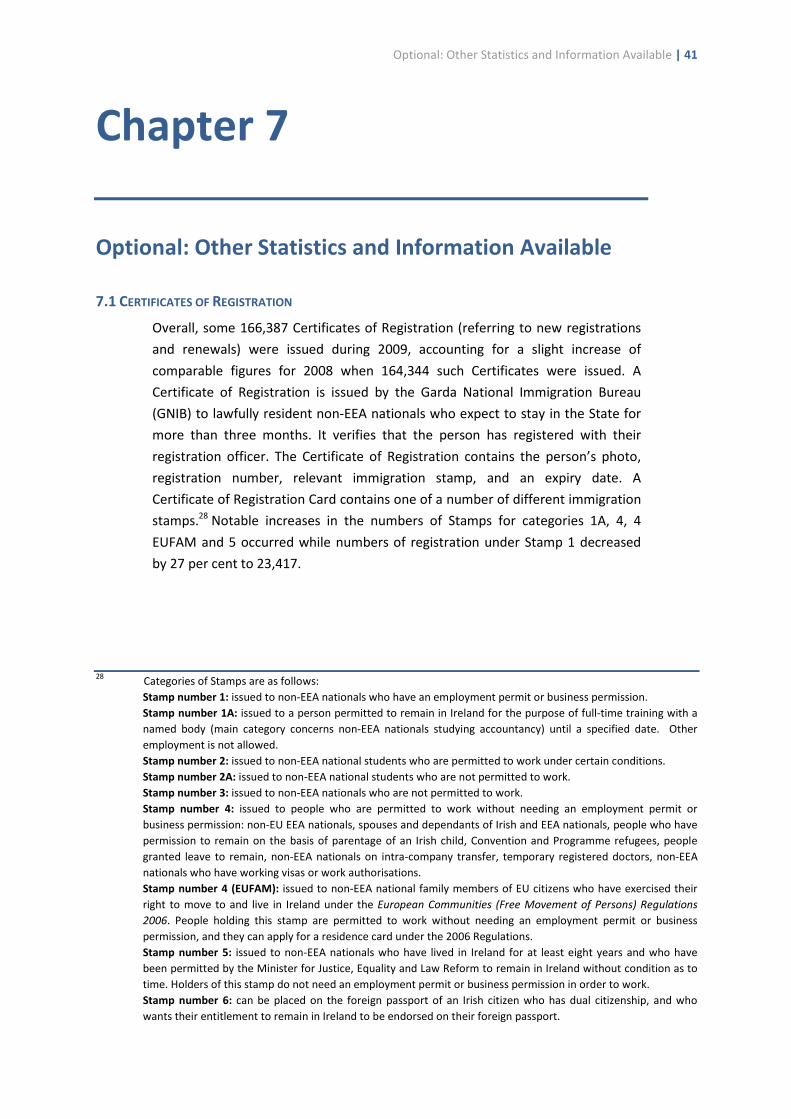
Optional: Other Statistics and Information Available | 41
Chapter 7
Optional: Other Statistics and Information Available
7.1 CERTIFICATES OF REGISTRATION
Overall, some 166,387 Certificates of Registration (referring to new registrations
and renewals) were issued during 2009, accounting for a slight increase of
comparable figures for 2008 when 164,344 such Certificates were issued. A
Certificate of Registration is issued by the Garda National Immigration Bureau
(GNIB) to lawfully resident non-EEA nationals who expect to stay in the State for
more than three months. It verifies that the person has registered with their
registration officer. The Certificate of Registration contains the person’s photo,
registration number, relevant immigration stamp, and an expiry date. A
Certificate of Registration Card contains one of a number of different immigration
stamps.28 Notable increases in the numbers of Stamps for categories 1A, 4, 4
EUFAM and 5 occurred while numbers of registration under Stamp 1 decreased
by 27 per cent to 23,417.
28 Categories of Stamps are as follows:
Stamp number 1: issued to non-EEA nationals who have an employment permit or business permission.
Stamp number 1A: issued to a person permitted to remain in Ireland for the purpose of full-time training with a
named body (main category concerns non-EEA nationals studying accountancy) until a specified date. Other
employment is not allowed.
Stamp number 2: issued to non-EEA national students who are permitted to work under certain conditions.
Stamp number 2A: issued to non-EEA national students who are not permitted to work.
Stamp number 3: issued to non-EEA nationals who are not permitted to work.
Stamp number 4: issued to people who are permitted to work without needing an employment permit or
business permission: non-EU EEA nationals, spouses and dependants of Irish and EEA nationals, people who have
permission to remain on the basis of parentage of an Irish child, Convention and Programme refugees, people
granted leave to remain, non-EEA nationals on intra-company transfer, temporary registered doctors, non-EEA
nationals who have working visas or work authorisations.
Stamp number 4 (EUFAM): issued to non-EEA national family members of EU citizens who have exercised their
right to move to and live in Ireland under the European Communities (Free Movement of Persons) Regulations
2006. People holding this stamp are permitted to work without needing an employment permit or business
permission, and they can apply for a residence card under the 2006 Regulations.
Stamp number 5: issued to non-EEA nationals who have lived in Ireland for at least eight years and who have
been permitted by the Minister for Justice, Equality and Law Reform to remain in Ireland without condition as to
time. Holders of this stamp do not need an employment permit or business permission in order to work.
Stamp number 6: can be placed on the foreign passport of an Irish citizen who has dual citizenship, and who
wants their entitlement to remain in Ireland to be endorsed on their foreign passport.

42 | Annual Report on Migration and International Protection Statistics for Ireland: 2009
Table 44: Certificates of Registration, 2008 and 2009
Stamp Category 2008 2009 %
change
1 Issued to non-EEA nationals who have an employment permit or business permission.
31,944 23,417 -26.7
1A Issued to non-EEA nationals permitted to remain in Ireland for the purpose of full time training with a named body until a specified date. Other employment is not allowed.
67 887 1,223.9
2 Issued to non-EEA national students who are permitted to work under certain conditions.
41,097 41,639 1.3
2A Issued to non-EEA national students who are not permitted to work.
3,845 3,879 0.9
3 Issued to non-EEA nationals who are not permitted to work. 17,437 17,554 0.7
4 Issued to people who are permitted to work without needing an employment permit or business permission: Non-EU EEA nationals; Spouses and dependents of Irish and EEA nationals; People who have permission to remain on the basis of parentage of an Irish child; Convention and Programme refugees; People granted leave to remain; Non-EEA nationals on intra-company transfer; Temporary registered doctors; Non-EEA nationals who have working visas or work authorisations.
63,658 70,803 11.2
4 EU-FAM
Issued to non-EEA national family members of EU citizens who have exercised their right to move to and live in Ireland under the European Communities (Free Movement of Persons) Regulations 2006. People holding this stamp are permitted to work without needing an employment permit or business permission, and they can apply for a residence card under the 2006 Regulations.
3,723 5,208 39.9
5 Issued to non-EEA nationals who have lived in Ireland for at least eight years and who have been permitted by the Minister for Justice, Equality and Law Reform to remain in Ireland without condition as to time. Holders of this stamp do not need an employment permit or business permission in order to work.
218 548 151.4
6 Can be placed on the foreign passport of an Irish citizen who has dual citizenship, and who wants their entitlement to remain in Ireland to be endorsed on their foreign passport.
26 61 134.6
Unrecorded 2,028 2,391 17.9
A 2
B - -
Total 164,045 166,387
Source: Department of Justice and Equality as cited in O’Connell P. J. and Joyce, C. (2011) ‘International Migration
in Ireland, 2010’. ESRI Working Paper. Dublin: ESRI.
7.2 ECONOMIC MIGRATION
In terms of type of permits issued during 2009, the number of new permits,
renewals and overall number processed fell by 54.2 per cent (from 8,375 to 3,835
permits), 22.6 per cent (from 4,964 to 3,842 permits) and 37.8 per cent (15,903 to
9,899 permits) respectively year on year. The rate of refusals doubled between
2008 and 2009, from 2.1 per cent to 4.5 per cent. Percentage of renewals
increased during 2009 from 31.2 per cent to 38.8 per cent year on year, while the
proportion of new permits issued fell from 52.7 per cent during 2008 to 38.7 per
cent in 2009.
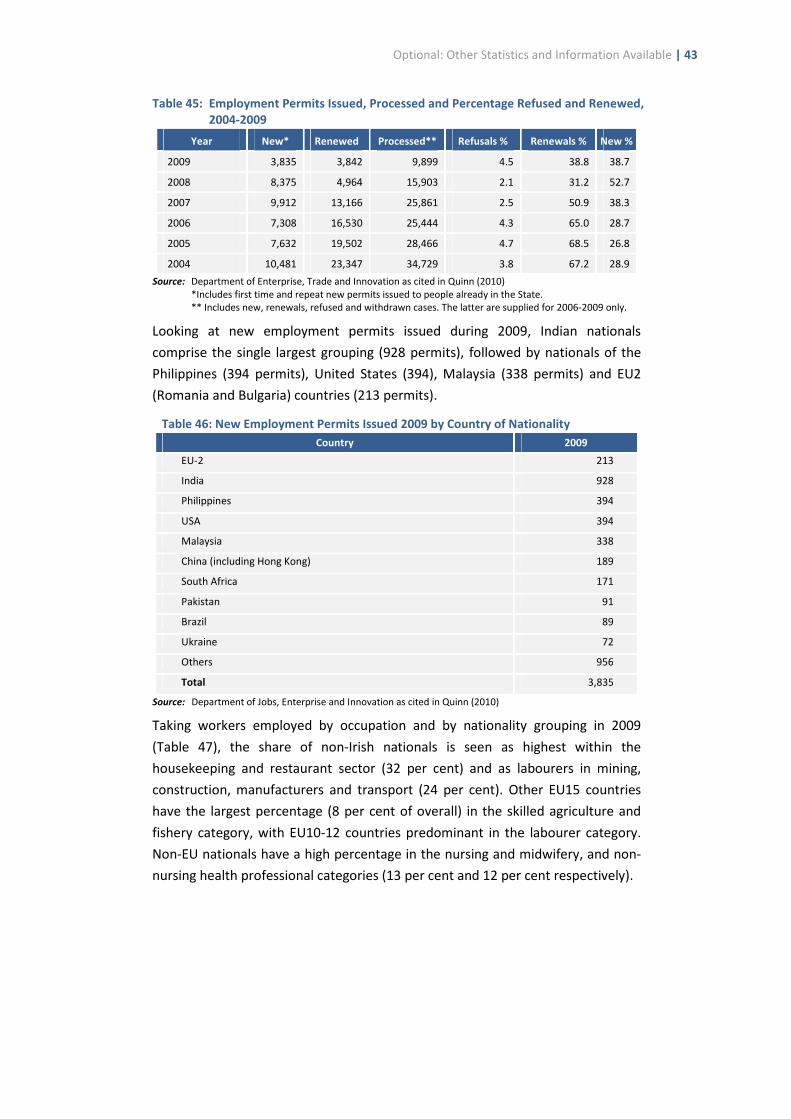
Optional: Other Statistics and Information Available | 43
Table 45: Employment Permits Issued, Processed and Percentage Refused and Renewed,
2004-2009
Year New* Renewed Processed** Refusals % Renewals % New %
2009 3,835 3,842 9,899 4.5 38.8 38.7
2008 8,375 4,964 15,903 2.1 31.2 52.7
2007 9,912 13,166 25,861 2.5 50.9 38.3
2006 7,308 16,530 25,444 4.3 65.0 28.7
2005 7,632 19,502 28,466 4.7 68.5 26.8
2004 10,481 23,347 34,729 3.8 67.2 28.9
Source: Department of Enterprise, Trade and Innovation as cited in Quinn (2010) *Includes first time and repeat new permits issued to people already in the State. ** Includes new, renewals, refused and withdrawn cases. The latter are supplied for 2006-2009 only.
Looking at new employment permits issued during 2009, Indian nationals
comprise the single largest grouping (928 permits), followed by nationals of the
Philippines (394 permits), United States (394), Malaysia (338 permits) and EU2
(Romania and Bulgaria) countries (213 permits).
Table 46: New Employment Permits Issued 2009 by Country of Nationality
Country 2009
EU-2 213
India 928
Philippines 394
USA 394
Malaysia 338
China (including Hong Kong) 189
South Africa 171
Pakistan 91
Brazil 89
Ukraine 72
Others 956
Total 3,835
Source: Department of Jobs, Enterprise and Innovation as cited in Quinn (2010)
Taking workers employed by occupation and by nationality grouping in 2009
(Table 47), the share of non-Irish nationals is seen as highest within the
housekeeping and restaurant sector (32 per cent) and as labourers in mining,
construction, manufacturers and transport (24 per cent). Other EU15 countries
have the largest percentage (8 per cent of overall) in the skilled agriculture and
fishery category, with EU10-12 countries predominant in the labourer category.
Non-EU nationals have a high percentage in the nursing and midwifery, and non-
nursing health professional categories (13 per cent and 12 per cent respectively).

44 | Annual Report on Migration and International Protection Statistics for Ireland: 2009
Table 47: Stock of Workers Employed in Specific Occupations by Nationality Grouping, 2009
Specific occupations Irish
%
Other
EU15 %
EU10/12*
%
TCN % Total
Housekeeping and Restaurant Service (512) 68 5 18 9 83,255
Personal care and rel. (513) 84 5 4 7 81,463
Health professionals (except nursing) (222) 82 * * 12 17,306
Nursing and midwifery profs. (223) 83 3 * 13 56,531
Skilled Agric and Fishery (61) 84 8 * * 13,333
Architects, Engineers and rel. prof. (214) 87 6 3 3 45,513
Teaching personnel (23) 94 4 * 1 99,829
Labrs In Mining., Const., Manuf., Trans (93) 76 2 20 * 62,276
Total 82 4 7 6 459,506
Source: Central Statistics Office cited in Quinn (2010) Note: * denotes figure below 1,000
There were several changes related to the situation for employment permit
holders in Ireland during 2009, arguably reflecting a changed economic context. In
April 2009 the Department of Jobs, Enterprise and Innovation announced a
revision of the list of occupations eligible for Green Cards in the €30,000-€59,999
per annum category. Skills determined to no longer require inclusion on the
occupational shortage category included those within the healthcare, financial
services and industry/services category. All removed occupations continued to be
eligible for Green Cards where the salary payable to the jobholder is €60,000 or
more per annum.29 In the same month, the Department reiterated a policy of
providing up to three months from date of redundancy for Green Card holders to
find new employment.30
Also in April 2009, and with effect from 1 June 2009, the Department of Jobs,
Enterprise and Innovation announced a number of changes to eligibility
requirements for new work permits for prospective first-time entrants to the Irish
labour market. The measures related to qualifying conditions both for work
permits in the lower skills/qualifications areas, relating to jobs which could be
‘increasingly’ filled by Irish or EU citizens, and to short-time work permits. Work
permits for jobs paying less than €30,000 per annum will only be granted in
‘exceptional’ cases. Measures included:
• New arrangements applying to first-time new work permit applications
received on or after 1 June 2009. New fees for employment permits where
the application for the non-EEA national’s first employment permit was
received in the State on or after 1 June 2009 were announced. While the fees
for first application for a work permit and all Green Card, Spousal/Dependant
and Intra-Country Transfer permits remain the same, the primary changes
relate to renewal of work permits. All first employment applications for a
29 Department of Enterprise, Trade and Employment (April 2009). Revision of the List of Occupations Eligible for Green
Cards in the Salary Range €30,000-€59,999. Available at www.entemp.ie. 30
Department of Enterprise, Trade and Employment (April 2009). Revised Arrangements for Green Card Scheme, April
2009. Available at http://www.entemp.ie/labour/workpermits/revisedgreencard.htm.

Optional: Other Statistics and Information Available | 45
work permit received after the end of May 2009 would be subject to an
increased renewal fee depending on whether the term was for six months or
less (an increase of 50 per cent, from €500 to €750); up to 24 months (an
increase of 50 per cent, from €1,000 to €1,500); and up to 36 months (an
increase of 50 per cent, from €1,500 to €2,250).
• New arrangements for applying for future renewal of these permits (including
revised fees). These changes related primarily to an increase in fees for work
permit renewals.
• Spouses/dependants of first-time new work permit applications received on
or after 1 June 2009 cannot be considered for an employment permit under
the Spousal/Dependant Scheme. In cases where the application for the
principal permit holder’s first employment permit is received on or after 1
June 2009, only spouses/dependants of Green Card holders and Researchers
are eligible to apply for a Spousal/Dependant Permit. Spouses/dependants of
all other employment permit holders who applied for a principal employment
permit in the State on or after 1 June 2009 are required to apply for an
employment permit in their own right according to standard eligibility
criteria.31
• Reintroduction of a Labour Market Needs Test. A vacancy for which an
application for a work permit is made must be advertised with the FÁS/EURES
employment network for at least eight weeks, in addition to local and
national newspapers for six days. This is to ensure that in the first instance a
national of the EEA or Norway, Iceland, Liechtenstein and Switzerland, or in
the second instance a national of Bulgaria or Romania, cannot be found to fill
the vacancy.
• New arrangements for all work permit holders placed on short-term working
In addition, certain categories of work permit holders (horse racing riders, heavy
goods vehicle drivers and domestic workers, including carers in the home and
childminders) are no longer eligible for new work permits and will be eligible for
renewal only. A notable change in policy related to an increase in time to seek
alternative employment for work permit holders who have been made
redundant. Work permit holders in employment for less than five years will have
up to six months from the date of redundancy to seek alternative employment
and a Labour Market Needs Test will not be required in respect of any subsequent
work permit application made.32
31 Department of Enterprise, Trade and Employment (April 2009). Employment Permits Arrangements Schedule of
Fees for Employment Permits. Available at www.entemp.ie. 32
Department of Enterprise, Trade and Employment (April 2009). Changes to Work Permits Arrangements, April 2009. Available at http://www.entemp.ie//labour/workpermits/revisedworkpermitarrangements%20-%20june%2020 09.htm.
46 | Annual Report on Migration and International Protection Statistics for Ireland: 2009
In August 2009 a change in policy on employment permits for non-EEA national
holders of permits of five years or more was announced. The announcement
acknowledged that those who had worked in the State for five years would be
eligible for applications for long-term residence and/or citizenship, and may have
pending applications. Those who have worked lawfully and held an employment
permit for five consecutive years and are either still in employment or have been
made redundant will no longer require an employment permit. The Department
of Justice and Equality will provide such persons with an immigration permission
to reside in Ireland and to work without the need for an employment permit. The
permission will run for one year initially and be open to renewal. It is not an
unconditional permit and the holders are expected to work, support themselves
and any dependents and seek new employment if made redundant. An easing of
immigration rules for redundant non-EEA migrant workers who have held an
employment permit for less than five years was also announced, with an
immediate increase from three to six months of ‘breathing space’ to find
alternative employment. In addition, a Labour Market Needs Test will not be
required in respect of work permit applications from current and future
employment permit holders who have been made redundant.33
In September 2009 a new scheme for foreign nationals who have become
undocumented through ‘no fault of their own’ after previously being in
possession of a work permit was announced with effect from 1 October 2009. The
Undocumented Workers Scheme provided a facility whereby undocumented non-
EEA nationals, who can show that their undocumented status is through ‘no fault
of their own’ but due to the action or inaction of their employer, can obtain a
temporary immigration permission of four months within which to seek
legitimate employment, or, if they are already employed, within which to obtain
an employment permit from the Department of Jobs, Enterprise and Innovation.
Each case will be considered on its own merit and it was noted that the scheme
was not to be considered a regularisation ‘in any sense’. This temporary
permission did not apply to other categories of irregular migrants such as those
who had entered the State illegally or overstayed their visa permission.34 The
scheme ran until 31 December 2009 and 185 applications were received.35
33 Department of Enterprise, Trade and Employment (August 2009). Policy on Employment Permits for non-EEA
nationals who have held permits for 5 years or more and easing of the immigration rules for redundant non-EEA
migrant workers. Available at http://www.entemp.ie/labour/workpermits/policyonpermitrequirementsafterfiveyears.htm. In October 2009 the
Department of Enterprise, Trade and Employment also announced that as part of commitments within the Renewed Programme for Government - October 2009, a Labour Market Needs Test will not be required in respect of work permit applications from current and future Employment Permit holders who have been made redundant.
34 Department of Enterprise, Trade and Employment (September 2009). Undocumented Workers Scheme. Available at
http://www.entemp.ie//labour/workpermits/undocumented.htm; Department of Justice, Equality and Law Reform (14 September 2009). ‘Ahern Launches New Work Permit Scheme for Foreign Nationals’. Press Release. Available at: http://www.justice.ie/en/JELR/Pages/Ahern%20Launches%20New%20Work%20Scheme %20for%20Foreign%20Nationals.
35 Department of Justice, Equality and Law Reform (2010). Annual Report 2009. Available at www.justice.ie.
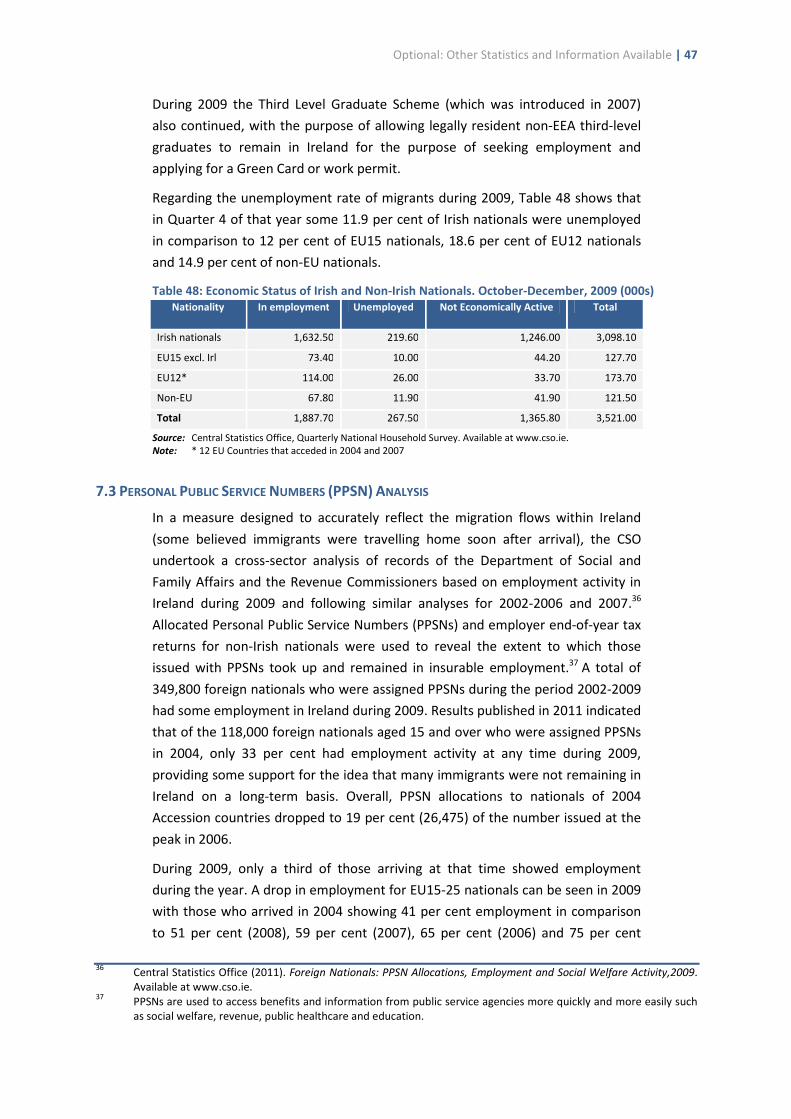
Optional: Other Statistics and Information Available | 47
During 2009 the Third Level Graduate Scheme (which was introduced in 2007)
also continued, with the purpose of allowing legally resident non-EEA third-level
graduates to remain in Ireland for the purpose of seeking employment and
applying for a Green Card or work permit.
Regarding the unemployment rate of migrants during 2009, Table 48 shows that
in Quarter 4 of that year some 11.9 per cent of Irish nationals were unemployed
in comparison to 12 per cent of EU15 nationals, 18.6 per cent of EU12 nationals
and 14.9 per cent of non-EU nationals.
Table 48: Economic Status of Irish and Non-Irish Nationals. October-December, 2009 (000s)
Nationality In employment Unemployed Not Economically Active Total
Irish nationals 1,632.50 219.60 1,246.00 3,098.10
EU15 excl. Irl 73.40 10.00 44.20 127.70
EU12* 114.00 26.00 33.70 173.70
Non-EU 67.80 11.90 41.90 121.50
Total 1,887.70 267.50 1,365.80 3,521.00
Source: Central Statistics Office, Quarterly National Household Survey. Available at www.cso.ie. Note: * 12 EU Countries that acceded in 2004 and 2007
7.3 PERSONAL PUBLIC SERVICE NUMBERS (PPSN) ANALYSIS
In a measure designed to accurately reflect the migration flows within Ireland
(some believed immigrants were travelling home soon after arrival), the CSO
undertook a cross-sector analysis of records of the Department of Social and
Family Affairs and the Revenue Commissioners based on employment activity in
Ireland during 2009 and following similar analyses for 2002-2006 and 2007.36
Allocated Personal Public Service Numbers (PPSNs) and employer end-of-year tax
returns for non-Irish nationals were used to reveal the extent to which those
issued with PPSNs took up and remained in insurable employment.37 A total of
349,800 foreign nationals who were assigned PPSNs during the period 2002-2009
had some employment in Ireland during 2009. Results published in 2011 indicated
that of the 118,000 foreign nationals aged 15 and over who were assigned PPSNs
in 2004, only 33 per cent had employment activity at any time during 2009,
providing some support for the idea that many immigrants were not remaining in
Ireland on a long-term basis. Overall, PPSN allocations to nationals of 2004
Accession countries dropped to 19 per cent (26,475) of the number issued at the
peak in 2006.
During 2009, only a third of those arriving at that time showed employment
during the year. A drop in employment for EU15-25 nationals can be seen in 2009
with those who arrived in 2004 showing 41 per cent employment in comparison
to 51 per cent (2008), 59 per cent (2007), 65 per cent (2006) and 75 per cent
36 Central Statistics Office (2011). Foreign Nationals: PPSN Allocations, Employment and Social Welfare Activity,2009.
Available at www.cso.ie. 37
PPSNs are used to access benefits and information from public service agencies more quickly and more easily such as social welfare, revenue, public healthcare and education.
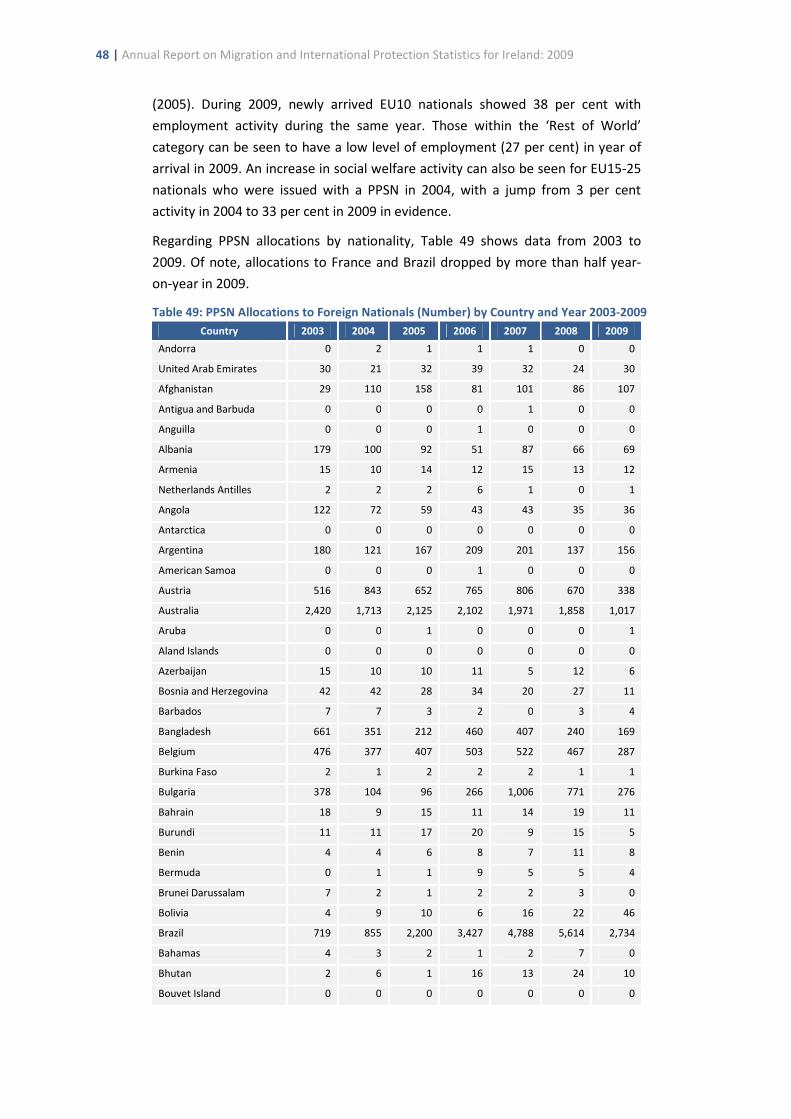
48 | Annual Report on Migration and International Protection Statistics for Ireland: 2009
(2005). During 2009, newly arrived EU10 nationals showed 38 per cent with
employment activity during the same year. Those within the ‘Rest of World’
category can be seen to have a low level of employment (27 per cent) in year of
arrival in 2009. An increase in social welfare activity can also be seen for EU15-25
nationals who were issued with a PPSN in 2004, with a jump from 3 per cent
activity in 2004 to 33 per cent in 2009 in evidence.
Regarding PPSN allocations by nationality, Table 49 shows data from 2003 to
2009. Of note, allocations to France and Brazil dropped by more than half year-
on-year in 2009.
Table 49: PPSN Allocations to Foreign Nationals (Number) by Country and Year 2003-2009
Country 2003 2004 2005 2006 2007 2008 2009
Andorra 0 2 1 1 1 0 0
United Arab Emirates 30 21 32 39 32 24 30
Afghanistan 29 110 158 81 101 86 107
Antigua and Barbuda 0 0 0 0 1 0 0
Anguilla 0 0 0 1 0 0 0
Albania 179 100 92 51 87 66 69
Armenia 15 10 14 12 15 13 12
Netherlands Antilles 2 2 2 6 1 0 1
Angola 122 72 59 43 43 35 36
Antarctica 0 0 0 0 0 0 0
Argentina 180 121 167 209 201 137 156
American Samoa 0 0 0 1 0 0 0
Austria 516 843 652 765 806 670 338
Australia 2,420 1,713 2,125 2,102 1,971 1,858 1,017
Aruba 0 0 1 0 0 0 1
Aland Islands 0 0 0 0 0 0 0
Azerbaijan 15 10 10 11 5 12 6
Bosnia and Herzegovina 42 42 28 34 20 27 11
Barbados 7 7 3 2 0 3 4
Bangladesh 661 351 212 460 407 240 169
Belgium 476 377 407 503 522 467 287
Burkina Faso 2 1 2 2 2 1 1
Bulgaria 378 104 96 266 1,006 771 276
Bahrain 18 9 15 11 14 19 11
Burundi 11 11 17 20 9 15 5
Benin 4 4 6 8 7 11 8
Bermuda 0 1 1 9 5 5 4
Brunei Darussalam 7 2 1 2 2 3 0
Bolivia 4 9 10 6 16 22 46
Brazil 719 855 2,200 3,427 4,788 5,614 2,734
Bahamas 4 3 2 1 2 7 0
Bhutan 2 6 1 16 13 24 10
Bouvet Island 0 0 0 0 0 0 0
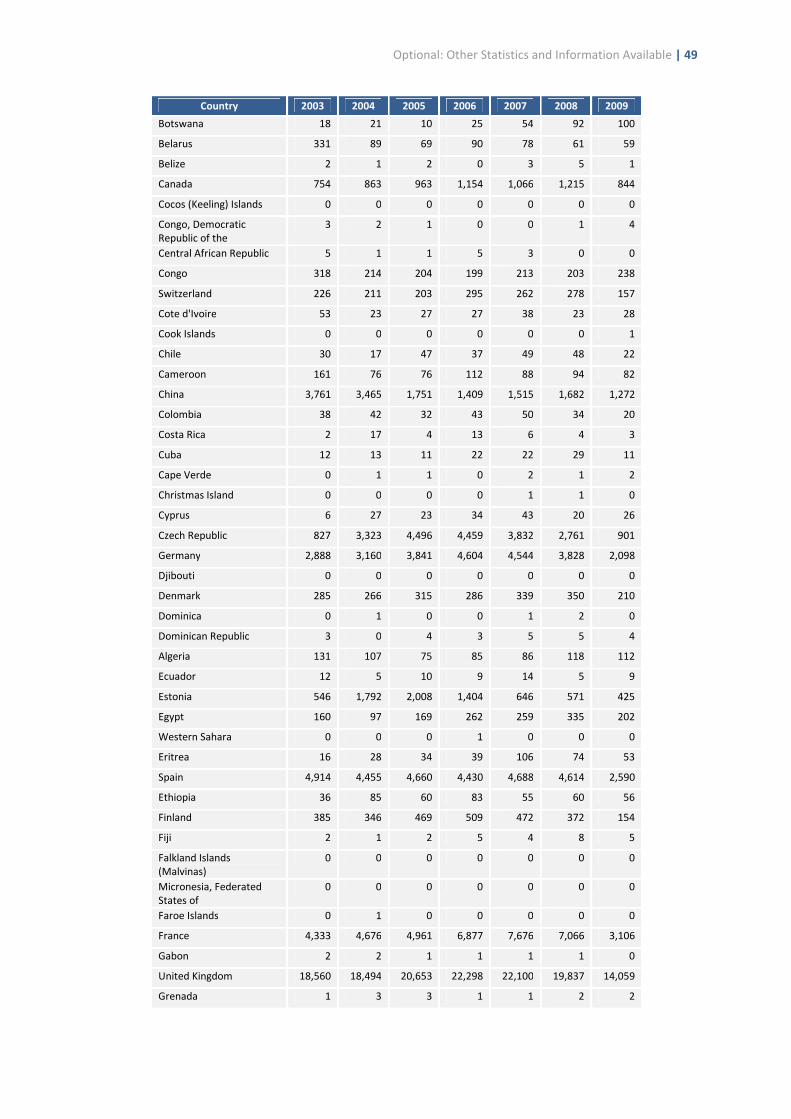
Optional: Other Statistics and Information Available | 49
Country 2003 2004 2005 2006 2007 2008 2009
Botswana 18 21 10 25 54 92 100
Belarus 331 89 69 90 78 61 59
Belize 2 1 2 0 3 5 1
Canada 754 863 963 1,154 1,066 1,215 844
Cocos (Keeling) Islands 0 0 0 0 0 0 0
Congo, Democratic Republic of the
3 2 1 0 0 1 4
Central African Republic 5 1 1 5 3 0 0
Congo 318 214 204 199 213 203 238
Switzerland 226 211 203 295 262 278 157
Cote d'Ivoire 53 23 27 27 38 23 28
Cook Islands 0 0 0 0 0 0 1
Chile 30 17 47 37 49 48 22
Cameroon 161 76 76 112 88 94 82
China 3,761 3,465 1,751 1,409 1,515 1,682 1,272
Colombia 38 42 32 43 50 34 20
Costa Rica 2 17 4 13 6 4 3
Cuba 12 13 11 22 22 29 11
Cape Verde 0 1 1 0 2 1 2
Christmas Island 0 0 0 0 1 1 0
Cyprus 6 27 23 34 43 20 26
Czech Republic 827 3,323 4,496 4,459 3,832 2,761 901
Germany 2,888 3,160 3,841 4,604 4,544 3,828 2,098
Djibouti 0 0 0 0 0 0 0
Denmark 285 266 315 286 339 350 210
Dominica 0 1 0 0 1 2 0
Dominican Republic 3 0 4 3 5 5 4
Algeria 131 107 75 85 86 118 112
Ecuador 12 5 10 9 14 5 9
Estonia 546 1,792 2,008 1,404 646 571 425
Egypt 160 97 169 262 259 335 202
Western Sahara 0 0 0 1 0 0 0
Eritrea 16 28 34 39 106 74 53
Spain 4,914 4,455 4,660 4,430 4,688 4,614 2,590
Ethiopia 36 85 60 83 55 60 56
Finland 385 346 469 509 472 372 154
Fiji 2 1 2 5 4 8 5
Falkland Islands (Malvinas)
0 0 0 0 0 0 0
Micronesia, Federated States of
0 0 0 0 0 0 0
Faroe Islands 0 1 0 0 0 0 0
France 4,333 4,676 4,961 6,877 7,676 7,066 3,106
Gabon 2 2 1 1 1 1 0
United Kingdom 18,560 18,494 20,653 22,298 22,100 19,837 14,059
Grenada 1 3 3 1 1 2 2
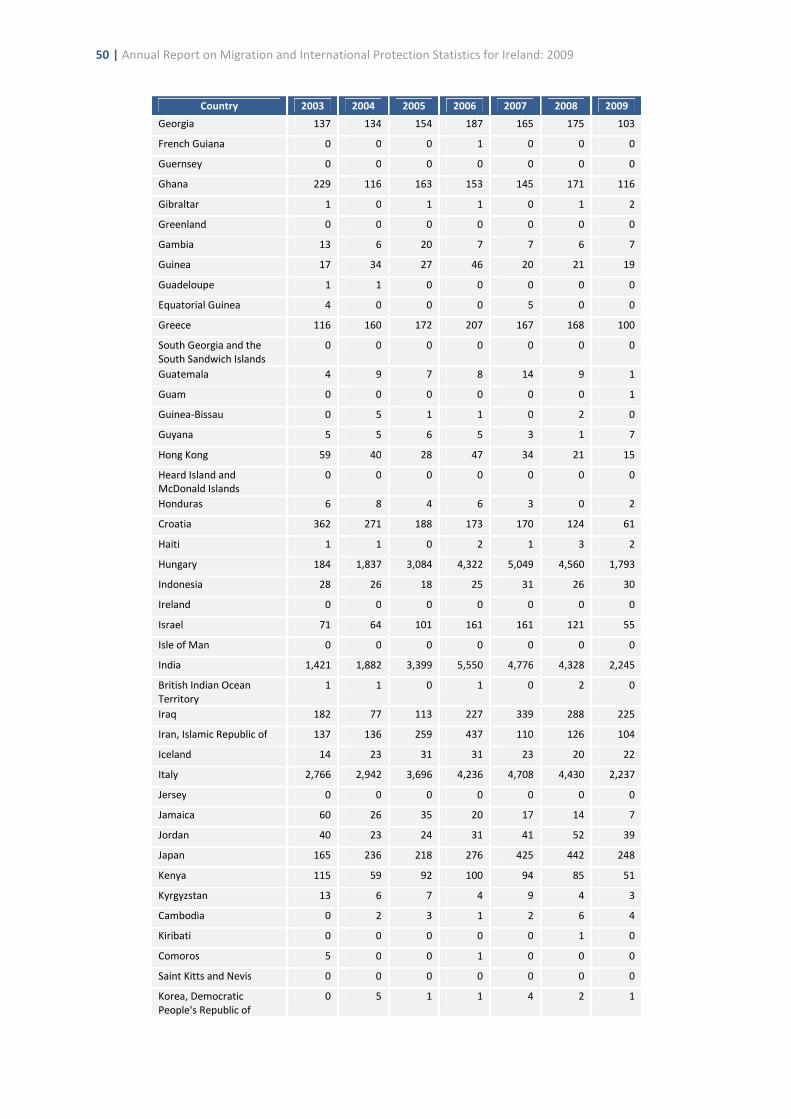
50 | Annual Report on Migration and International Protection Statistics for Ireland: 2009
Country 2003 2004 2005 2006 2007 2008 2009
Georgia 137 134 154 187 165 175 103
French Guiana 0 0 0 1 0 0 0
Guernsey 0 0 0 0 0 0 0
Ghana 229 116 163 153 145 171 116
Gibraltar 1 0 1 1 0 1 2
Greenland 0 0 0 0 0 0 0
Gambia 13 6 20 7 7 6 7
Guinea 17 34 27 46 20 21 19
Guadeloupe 1 1 0 0 0 0 0
Equatorial Guinea 4 0 0 0 5 0 0
Greece 116 160 172 207 167 168 100
South Georgia and the South Sandwich Islands
0 0 0 0 0 0 0
Guatemala 4 9 7 8 14 9 1
Guam 0 0 0 0 0 0 1
Guinea-Bissau 0 5 1 1 0 2 0
Guyana 5 5 6 5 3 1 7
Hong Kong 59 40 28 47 34 21 15
Heard Island and McDonald Islands
0 0 0 0 0 0 0
Honduras 6 8 4 6 3 0 2
Croatia 362 271 188 173 170 124 61
Haiti 1 1 0 2 1 3 2
Hungary 184 1,837 3,084 4,322 5,049 4,560 1,793
Indonesia 28 26 18 25 31 26 30
Ireland 0 0 0 0 0 0 0
Israel 71 64 101 161 161 121 55
Isle of Man 0 0 0 0 0 0 0
India 1,421 1,882 3,399 5,550 4,776 4,328 2,245
British Indian Ocean Territory
1 1 0 1 0 2 0
Iraq 182 77 113 227 339 288 225
Iran, Islamic Republic of 137 136 259 437 110 126 104
Iceland 14 23 31 31 23 20 22
Italy 2,766 2,942 3,696 4,236 4,708 4,430 2,237
Jersey 0 0 0 0 0 0 0
Jamaica 60 26 35 20 17 14 7
Jordan 40 23 24 31 41 52 39
Japan 165 236 218 276 425 442 248
Kenya 115 59 92 100 94 85 51
Kyrgyzstan 13 6 7 4 9 4 3
Cambodia 0 2 3 1 2 6 4
Kiribati 0 0 0 0 0 1 0
Comoros 5 0 0 1 0 0 0
Saint Kitts and Nevis 0 0 0 0 0 0 0
Korea, Democratic People's Republic of
0 5 1 1 4 2 1

Optional: Other Statistics and Information Available | 51
Country 2003 2004 2005 2006 2007 2008 2009
Korea, Republic of 151 281 460 489 949 1,146 431
Kuwait 24 44 50 82 81 40 38
Cayman Islands 5 2 3 6 6 4 4
Kazakhstan 42 19 13 21 41 26 8
Lao People's Democratic Republic
0 1 0 0 1 2 2
Lebanon 16 18 31 46 28 23 12
Saint Lucia 1 0 0 1 2 0 2
Liechtenstein 2 5 9 4 5 1 1
Sri Lanka 72 43 54 101 96 78 43
Liberia 44 28 26 27 19 19 17
Lesotho 4 9 7 7 9 10 5
Lithuania 2,409 12,822 18,698 16,022 10,706 6,420 3,760
Luxembourg 39 14 26 18 13 19 15
Latvia 1,250 6,304 9,313 7,949 4,666 3,718 3,911
Libyan Arab Jamahiriya 148 83 49 52 27 26 30
Morocco 77 83 87 111 79 78 74
Monaco 0 1 0 0 0 0 1
Moldova, Republic of 653 248 200 299 408 300 252
Montenegro 0 0 1 1 0 0 0
Madagascar 0 1 1 2 4 1 1
Marshall Islands 0 0 0 0 0 0 0
Macedonia, The Former Yugoslav Republic of
0 0 0 0 0 0 0
Mali 3 0 1 3 1 3 1
Myanmar 2 4 4 12 5 5 4
Mongolia 404 434 117 53 57 52 66
Macao 6 10 5 2 3 2 0
Northern Mariana Islands 0 0 0 0 0 0 0
Martinique 0 0 0 0 0 0 0
Mauritania 8 15 14 94 89 55 2
Montserrat 7 62 3 7 5 3 8
Malta 191 207 122 143 160 134 67
Mauritius 125 158 467 1,934 1,987 1,431 887
Maldives 3 3 2 0 1 4 6
Malawi 12 13 16 21 49 55 69
Mexico 95 109 119 155 170 189 160
Malaysia 349 301 522 636 744 657 439
Mozambique 10 2 5 4 2 7 2
Namibia 8 1 5 1 4 2 1
New Caledonia 1 4 0 0 0 0 4
Niger 16 17 9 11 13 10 8
Norfolk Island 0 0 0 0 0 0 1
Nigeria 3,809 1,966 2,143 1,601 1,603 1,549 896
Nicaragua 4 2 4 6 5 5 1
Netherlands 759 935 975 1,111 1,055 903 647
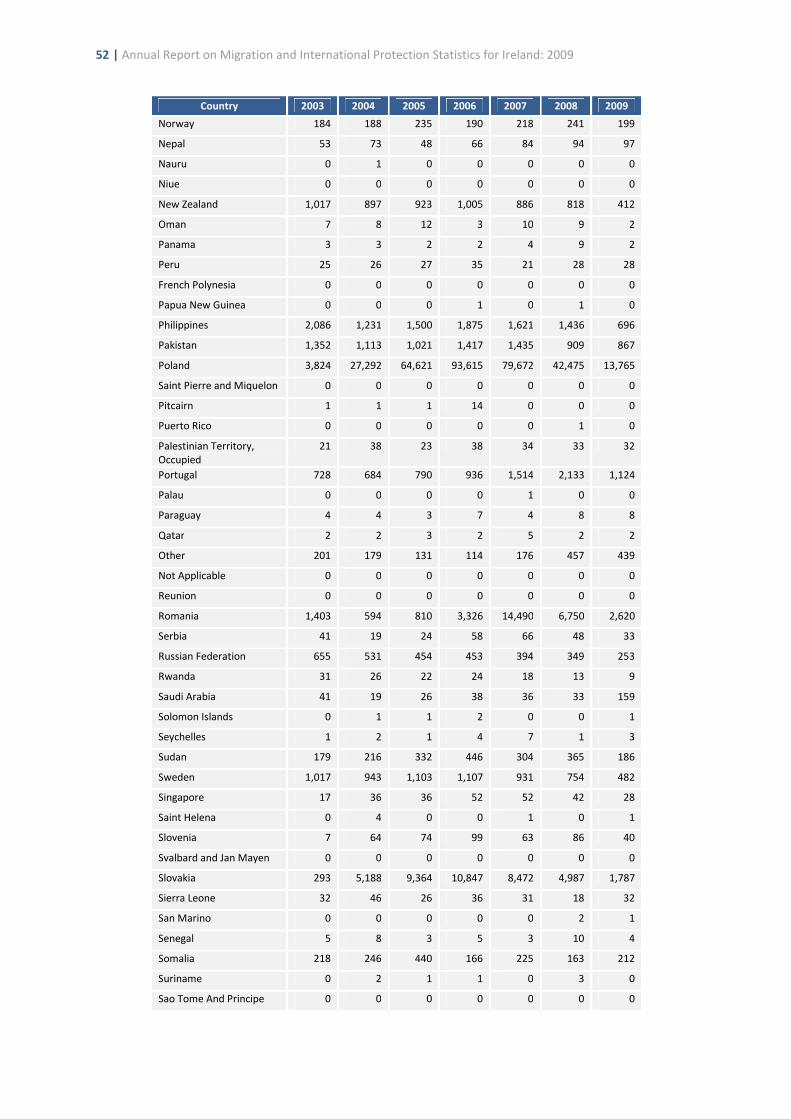
52 | Annual Report on Migration and International Protection Statistics for Ireland: 2009
Country 2003 2004 2005 2006 2007 2008 2009
Norway 184 188 235 190 218 241 199
Nepal 53 73 48 66 84 94 97
Nauru 0 1 0 0 0 0 0
Niue 0 0 0 0 0 0 0
New Zealand 1,017 897 923 1,005 886 818 412
Oman 7 8 12 3 10 9 2
Panama 3 3 2 2 4 9 2
Peru 25 26 27 35 21 28 28
French Polynesia 0 0 0 0 0 0 0
Papua New Guinea 0 0 0 1 0 1 0
Philippines 2,086 1,231 1,500 1,875 1,621 1,436 696
Pakistan 1,352 1,113 1,021 1,417 1,435 909 867
Poland 3,824 27,292 64,621 93,615 79,672 42,475 13,765
Saint Pierre and Miquelon 0 0 0 0 0 0 0
Pitcairn 1 1 1 14 0 0 0
Puerto Rico 0 0 0 0 0 1 0
Palestinian Territory, Occupied
21 38 23 38 34 33 32
Portugal 728 684 790 936 1,514 2,133 1,124
Palau 0 0 0 0 1 0 0
Paraguay 4 4 3 7 4 8 8
Qatar 2 2 3 2 5 2 2
Other 201 179 131 114 176 457 439
Not Applicable 0 0 0 0 0 0 0
Reunion 0 0 0 0 0 0 0
Romania 1,403 594 810 3,326 14,490 6,750 2,620
Serbia 41 19 24 58 66 48 33
Russian Federation 655 531 454 453 394 349 253
Rwanda 31 26 22 24 18 13 9
Saudi Arabia 41 19 26 38 36 33 159
Solomon Islands 0 1 1 2 0 0 1
Seychelles 1 2 1 4 7 1 3
Sudan 179 216 332 446 304 365 186
Sweden 1,017 943 1,103 1,107 931 754 482
Singapore 17 36 36 52 52 42 28
Saint Helena 0 4 0 0 1 0 1
Slovenia 7 64 74 99 63 86 40
Svalbard and Jan Mayen 0 0 0 0 0 0 0
Slovakia 293 5,188 9,364 10,847 8,472 4,987 1,787
Sierra Leone 32 46 26 36 31 18 32
San Marino 0 0 0 0 0 2 1
Senegal 5 8 3 5 3 10 4
Somalia 218 246 440 166 225 163 212
Suriname 0 2 1 1 0 3 0
Sao Tome And Principe 0 0 0 0 0 0 0
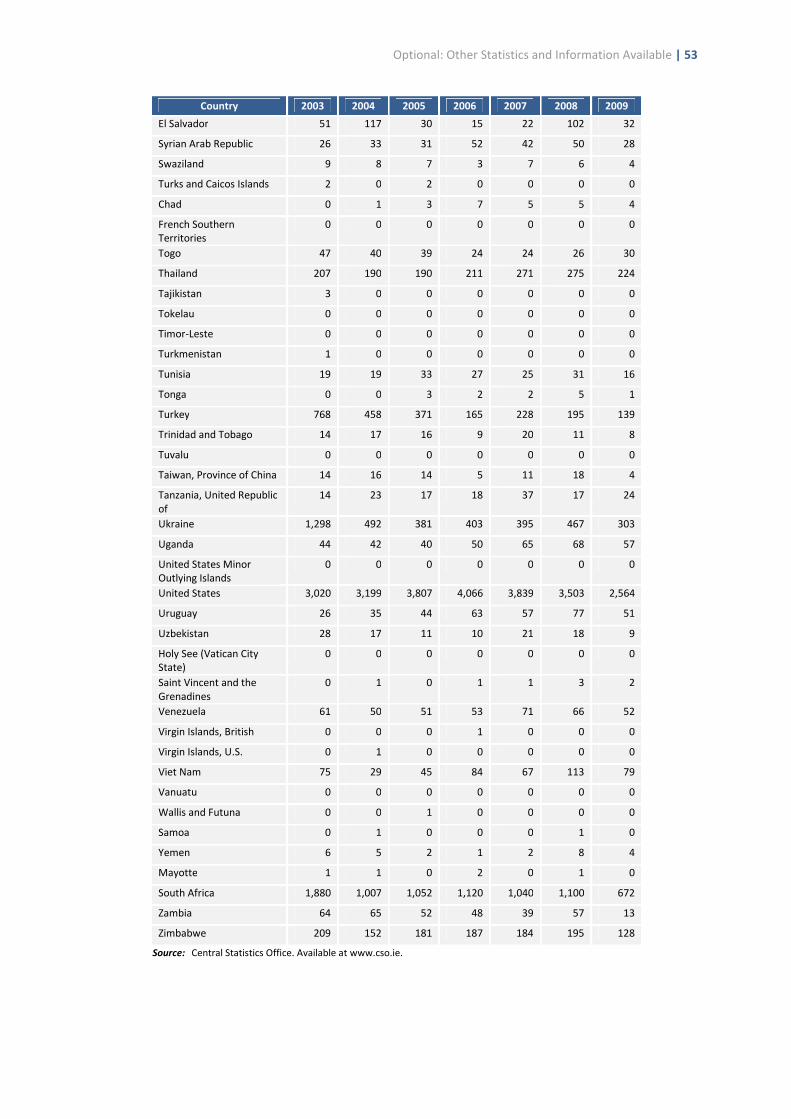
Optional: Other Statistics and Information Available | 53
Country 2003 2004 2005 2006 2007 2008 2009
El Salvador 51 117 30 15 22 102 32
Syrian Arab Republic 26 33 31 52 42 50 28
Swaziland 9 8 7 3 7 6 4
Turks and Caicos Islands 2 0 2 0 0 0 0
Chad 0 1 3 7 5 5 4
French Southern Territories
0 0 0 0 0 0 0
Togo 47 40 39 24 24 26 30
Thailand 207 190 190 211 271 275 224
Tajikistan 3 0 0 0 0 0 0
Tokelau 0 0 0 0 0 0 0
Timor-Leste 0 0 0 0 0 0 0
Turkmenistan 1 0 0 0 0 0 0
Tunisia 19 19 33 27 25 31 16
Tonga 0 0 3 2 2 5 1
Turkey 768 458 371 165 228 195 139
Trinidad and Tobago 14 17 16 9 20 11 8
Tuvalu 0 0 0 0 0 0 0
Taiwan, Province of China 14 16 14 5 11 18 4
Tanzania, United Republic of
14 23 17 18 37 17 24
Ukraine 1,298 492 381 403 395 467 303
Uganda 44 42 40 50 65 68 57
United States Minor Outlying Islands
0 0 0 0 0 0 0
United States 3,020 3,199 3,807 4,066 3,839 3,503 2,564
Uruguay 26 35 44 63 57 77 51
Uzbekistan 28 17 11 10 21 18 9
Holy See (Vatican City State)
0 0 0 0 0 0 0
Saint Vincent and the Grenadines
0 1 0 1 1 3 2
Venezuela 61 50 51 53 71 66 52
Virgin Islands, British 0 0 0 1 0 0 0
Virgin Islands, U.S. 0 1 0 0 0 0 0
Viet Nam 75 29 45 84 67 113 79
Vanuatu 0 0 0 0 0 0 0
Wallis and Futuna 0 0 1 0 0 0 0
Samoa 0 1 0 0 0 1 0
Yemen 6 5 2 1 2 8 4
Mayotte 1 1 0 2 0 1 0
South Africa 1,880 1,007 1,052 1,120 1,040 1,100 672
Zambia 64 65 52 48 39 57 13
Zimbabwe 209 152 181 187 184 195 128
Source: Central Statistics Office. Available at www.cso.ie.
54 | Annual Report on Migration and International Protection Statistics for Ireland: 2009
7.4 FAMILY REUNIFICATION
During 2009, some 895 applications for family reunification of recognised
refugees were received, with some 731 cases approved during the same period.
In response to a Parliamentary Question in July 2009 the Minister for Justice,
Equality and Law Reform noted that 401 applications were approved in 2008.38
The average time for processing of applications was listed as taking approximately
24 months and it is reported to be much longer in many cases. Overall, processing
times from the receipt of the file in ORAC Family Reunification Unit from the
Department of Justice and Equality to the completion of the investigation of the
family reunification application and issue of the Section 18 report under the
Refugee Act, 1996 were between 16 and 18 weeks on average over the year.39
7.5 PROVISIONS FOR VICTIMS OF TRAFFICKING
Provision commenced of legal assistance to potential and suspected victims of
trafficking by the Refugee Legal Service in November 2009. A range of supports
(accommodation, health services, crime prevention advice, interpretation,
education etc.) were expanded during 2009 to include the provision of a
‘comprehensive individual care plan’ by the HSE for each potential or suspected
victim of trafficking.40
During 2009, some ten persons received the 60 day
‘recovery and reflection’ period to remain in Ireland and 11 persons were granted
temporary residence permits.41 Overall, some 68 incidents of alleged human
trafficking offences were reported to An Garda Síochána, involving 49 adults and
17 minors. Of this overall number, 40 were in the asylum process in Ireland, 15
required immigration permission, five were in the care of the HSE as minors, four
were EU citizens and a further two voluntarily left the State.42
7.6 VISAS
During 2009, some 123,082 visas were issued by Irish authorities worldwide,
including 57,411 re-entry visas. During the same year 133,967 visa applications
were received.43
38 Parliamentary Question No.497 (9 July 2009). Available at http://debates.oireachtas.ie/Xml/30/DAL20090709A.pdf.
39 Joyce, C., (2011). Annual Report on Migration and International Protection Statistics for Ireland: 2008. European
Migration Network. Dublin: Economic and Social Research Institute Available: http://www.emn.ie. 40
Department of Justice, Equality and Law Reform (2010). Annual Report 2009. Available at www.justice.ie. 41
A further EU national had been granted a temporary residence permit. 42
Department of Justice, Equality and Law Reform (2010). Annual Report 2009. Available at www.justice.ie. 43
Department of Justice and Equality.
References | 55
REFERENCES
CENTRAL STATISTICS OFFICE (2011). Foreign Nationals: PPSN Allocations,
Employment and Social Welfare Activity, 2009. Available at www.cso.ie.
CENTRAL STATISTICS OFFICE (2010). Quarterly National Household Survey.
Available at www.cso.ie.
DEPARTMENT OF JUSTICE, EQUALITY AND LAW REFORM (2009). Annual Report
2009. Available at www.justice.ie .
JOYCE, C. and E. QUINN (2009). Policies on Unaccompanied Minors in Ireland.
European Migration Network. Dublin: Economic and Social Research Institute.
Available from: http://www.emn.ie.
JOYCE, C., (2011). Annual Report on Migration and International Protection
Statistics for Ireland: 2008. European Migration Network. Dublin: Economic and
Social Research Institute Available: http://www.emn.ie.
JOYCE, C., (2010). Annual Policy Report on Migration and Asylum 2009: Ireland
(March 2011). European Migration Network. Dublin: Economic and Social
Research Institute Available: http://www.emn.ie.
O’CONNELL, P. J. and JOYCE, C., (2011). Report to OECD Continuous Reporting
System on Migration (SOPEMI). Dublin: Economic and Social Research Institute.
OFFICE OF THE MINISTER FOR CHILDREN (2009). Implementation Plan from the
Report of the Commission to Inquire into Child Abuse, 2009. Available:
http://www.omc.gov.ie/documents/publications/Implementation_Plan_from_Ry
an_Commission_Report.pdf
QUINN, E., (2010). Satisfying Labour Demand Through Migration: Ireland. Dublin:
Economic and Social Research Institute.
QUINN, E., J. STANLEY, C. JOYCE, P.J. O’CONNELL, (2008). Handbook on
Immigration and Asylum in Ireland 2007. Dublin: Economic and Social Research
Institute. Available: http://www.emn.ie.
UNHCR (2010). Asylum Levels and Trends in Industrialized Countries, 2009.
Geneva: UNHCR. Available: http://www.unhcr.org.
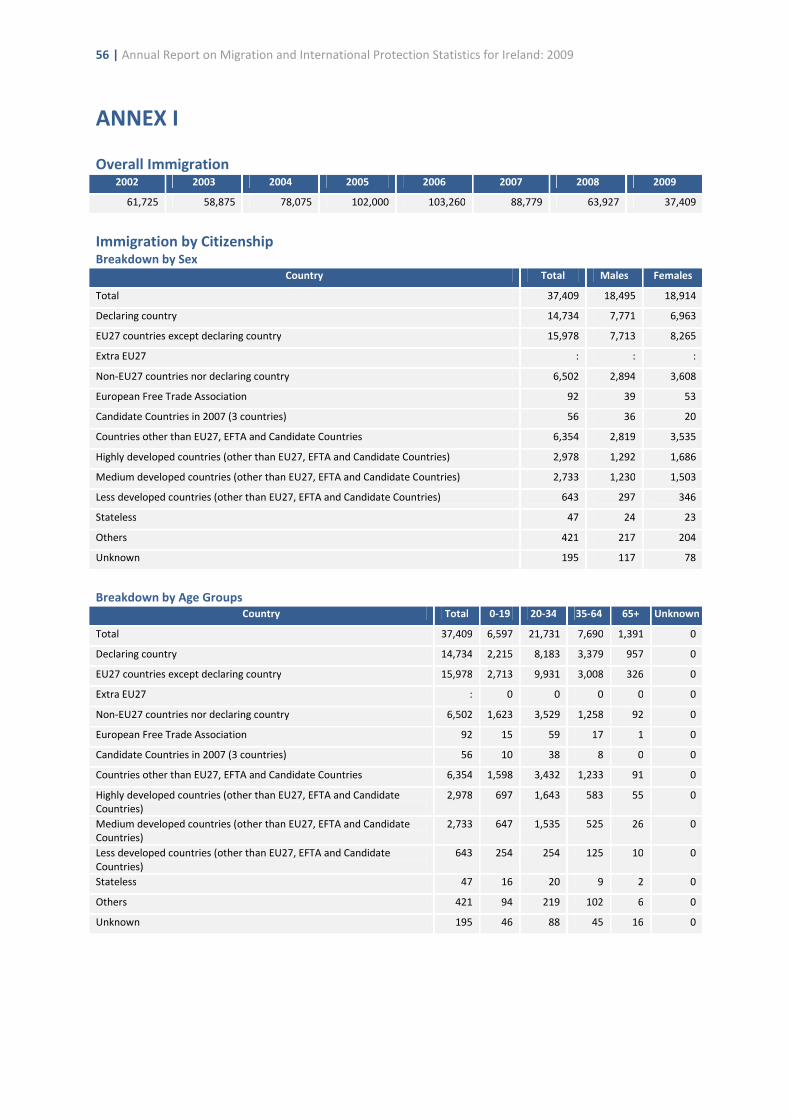
56 | Annual Report on Migration and International Protection Statistics for Ireland: 2009
ANNEX I
Overall Immigration 2002 2003 2004 2005 2006 2007 2008 2009
61,725 58,875 78,075 102,000 103,260 88,779 63,927 37,409
Immigration by Citizenship Breakdown by Sex
Country Total Males Females
Total 37,409 18,495 18,914
Declaring country 14,734 7,771 6,963
EU27 countries except declaring country 15,978 7,713 8,265
Extra EU27 : : :
Non-EU27 countries nor declaring country 6,502 2,894 3,608
European Free Trade Association 92 39 53
Candidate Countries in 2007 (3 countries) 56 36 20
Countries other than EU27, EFTA and Candidate Countries 6,354 2,819 3,535
Highly developed countries (other than EU27, EFTA and Candidate Countries) 2,978 1,292 1,686
Medium developed countries (other than EU27, EFTA and Candidate Countries) 2,733 1,230 1,503
Less developed countries (other than EU27, EFTA and Candidate Countries) 643 297 346
Stateless 47 24 23
Others 421 217 204
Unknown 195 117 78
Breakdown by Age Groups
Country Total 0-19 20-34 35-64 65+ Unknown
Total 37,409 6,597 21,731 7,690 1,391 0
Declaring country 14,734 2,215 8,183 3,379 957 0
EU27 countries except declaring country 15,978 2,713 9,931 3,008 326 0
Extra EU27 : 0 0 0 0 0
Non-EU27 countries nor declaring country 6,502 1,623 3,529 1,258 92 0
European Free Trade Association 92 15 59 17 1 0
Candidate Countries in 2007 (3 countries) 56 10 38 8 0 0
Countries other than EU27, EFTA and Candidate Countries 6,354 1,598 3,432 1,233 91 0
Highly developed countries (other than EU27, EFTA and Candidate Countries)
2,978 697 1,643 583 55 0
Medium developed countries (other than EU27, EFTA and Candidate Countries)
2,733 647 1,535 525 26 0
Less developed countries (other than EU27, EFTA and Candidate Countries)
643 254 254 125 10 0
Stateless 47 16 20 9 2 0
Others 421 94 219 102 6 0
Unknown 195 46 88 45 16 0
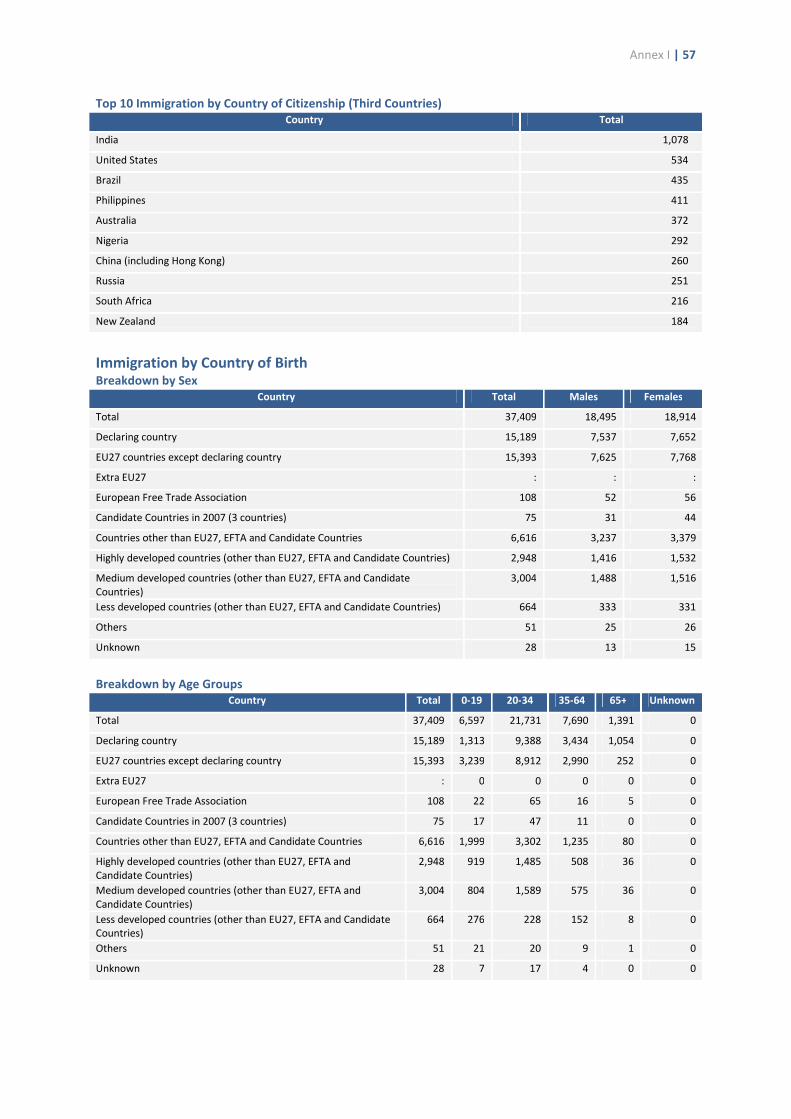
Annex I | 57
Top 10 Immigration by Country of Citizenship (Third Countries)
Country Total
India 1,078
United States 534
Brazil 435
Philippines 411
Australia 372
Nigeria 292
China (including Hong Kong) 260
Russia 251
South Africa 216
New Zealand 184
Immigration by Country of Birth Breakdown by Sex
Country Total Males Females
Total 37,409 18,495 18,914
Declaring country 15,189 7,537 7,652
EU27 countries except declaring country 15,393 7,625 7,768
Extra EU27 : : :
European Free Trade Association 108 52 56
Candidate Countries in 2007 (3 countries) 75 31 44
Countries other than EU27, EFTA and Candidate Countries 6,616 3,237 3,379
Highly developed countries (other than EU27, EFTA and Candidate Countries) 2,948 1,416 1,532
Medium developed countries (other than EU27, EFTA and Candidate Countries)
3,004 1,488 1,516
Less developed countries (other than EU27, EFTA and Candidate Countries) 664 333 331
Others 51 25 26
Unknown 28 13 15
Breakdown by Age Groups
Country Total 0-19 20-34 35-64 65+ Unknown
Total 37,409 6,597 21,731 7,690 1,391 0
Declaring country 15,189 1,313 9,388 3,434 1,054 0
EU27 countries except declaring country 15,393 3,239 8,912 2,990 252 0
Extra EU27 : 0 0 0 0 0
European Free Trade Association 108 22 65 16 5 0
Candidate Countries in 2007 (3 countries) 75 17 47 11 0 0
Countries other than EU27, EFTA and Candidate Countries 6,616 1,999 3,302 1,235 80 0
Highly developed countries (other than EU27, EFTA and Candidate Countries)
2,948 919 1,485 508 36 0
Medium developed countries (other than EU27, EFTA and Candidate Countries)
3,004 804 1,589 575 36 0
Less developed countries (other than EU27, EFTA and Candidate Countries)
664 276 228 152 8 0
Others 51 21 20 9 1 0
Unknown 28 7 17 4 0 0
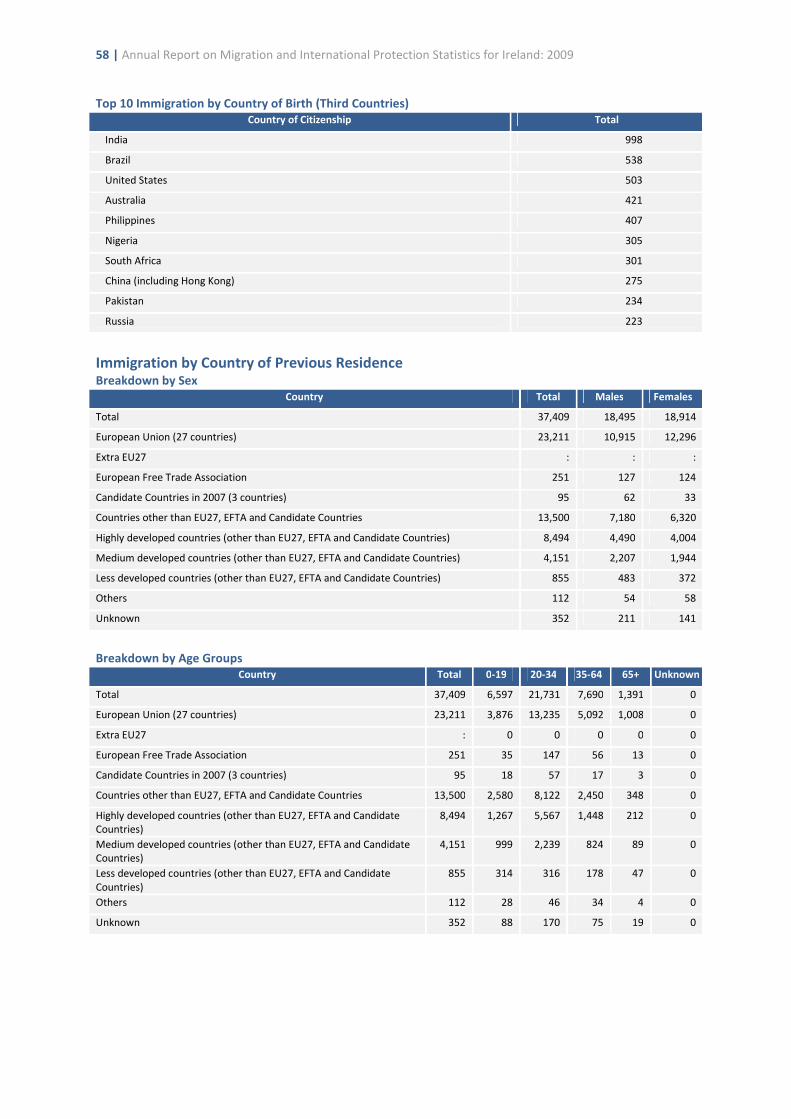
58 | Annual Report on Migration and International Protection Statistics for Ireland: 2009
Top 10 Immigration by Country of Birth (Third Countries)
Country of Citizenship Total
India 998
Brazil 538
United States 503
Australia 421
Philippines 407
Nigeria 305
South Africa 301
China (including Hong Kong) 275
Pakistan 234
Russia 223
Immigration by Country of Previous Residence Breakdown by Sex
Country Total Males Females
Total 37,409 18,495 18,914
European Union (27 countries) 23,211 10,915 12,296
Extra EU27 : : :
European Free Trade Association 251 127 124
Candidate Countries in 2007 (3 countries) 95 62 33
Countries other than EU27, EFTA and Candidate Countries 13,500 7,180 6,320
Highly developed countries (other than EU27, EFTA and Candidate Countries) 8,494 4,490 4,004
Medium developed countries (other than EU27, EFTA and Candidate Countries) 4,151 2,207 1,944
Less developed countries (other than EU27, EFTA and Candidate Countries) 855 483 372
Others 112 54 58
Unknown 352 211 141
Breakdown by Age Groups
Country Total 0-19 20-34 35-64 65+ Unknown
Total 37,409 6,597 21,731 7,690 1,391 0
European Union (27 countries) 23,211 3,876 13,235 5,092 1,008 0
Extra EU27 : 0 0 0 0 0
European Free Trade Association 251 35 147 56 13 0
Candidate Countries in 2007 (3 countries) 95 18 57 17 3 0
Countries other than EU27, EFTA and Candidate Countries 13,500 2,580 8,122 2,450 348 0
Highly developed countries (other than EU27, EFTA and Candidate Countries)
8,494 1,267 5,567 1,448 212 0
Medium developed countries (other than EU27, EFTA and Candidate Countries)
4,151 999 2,239 824 89 0
Less developed countries (other than EU27, EFTA and Candidate Countries)
855 314 316 178 47 0
Others 112 28 46 34 4 0
Unknown 352 88 170 75 19 0

Annex I | 59
Top 10 Immigration by Country of Previous Residence (Third Countries)
Country Total
Australia 3,284
United States 1,733
India 1,372
Brazil 646
New Zealand 602
Philippines 534
Canada 469
South Africa 405
Nigeria 393
China (including Hong Kong) 388
Overall Emigration
2002 2003 2004 2005 2006 2007 2008 2009
28,375 27,200 28,675 34,350 38,866 42,538 60,189 65,253
Emigration by Citizenship Breakdown by Sex
Country Total Males Females
Total 65,253 40,062 25,191
Declaring country 20,507 11,949 8,558
EU27 countries except declaring country 36,702 23,206 13,496
Extra EU27 : : :
Non-EU27 countries nor declaring country 8,044 4,907 3,137
Stateless 65 46 19
Others 598 378 220
Unknown 0 0 0
Breakdown by Age Groups
Country Total 0-19 20-34 35-64 65+ Unknown
Total 65,253 9,235 42,176 11,463 2,379 0
Declaring country 20,507 5,185 8,496 4,846 1,980 0
EU27 countries except declaring country 36,702 2,945 28,350 5,080 327 0
Extra EU27 : 0 0 0 0 0
Non-EU27 countries nor declaring country 8,044 1,105 5,330 1,537 72 0
Stateless 65 11 35 16 3 0
Others 598 120 322 127 29 0
Unknown 0 0 0 0 0 0
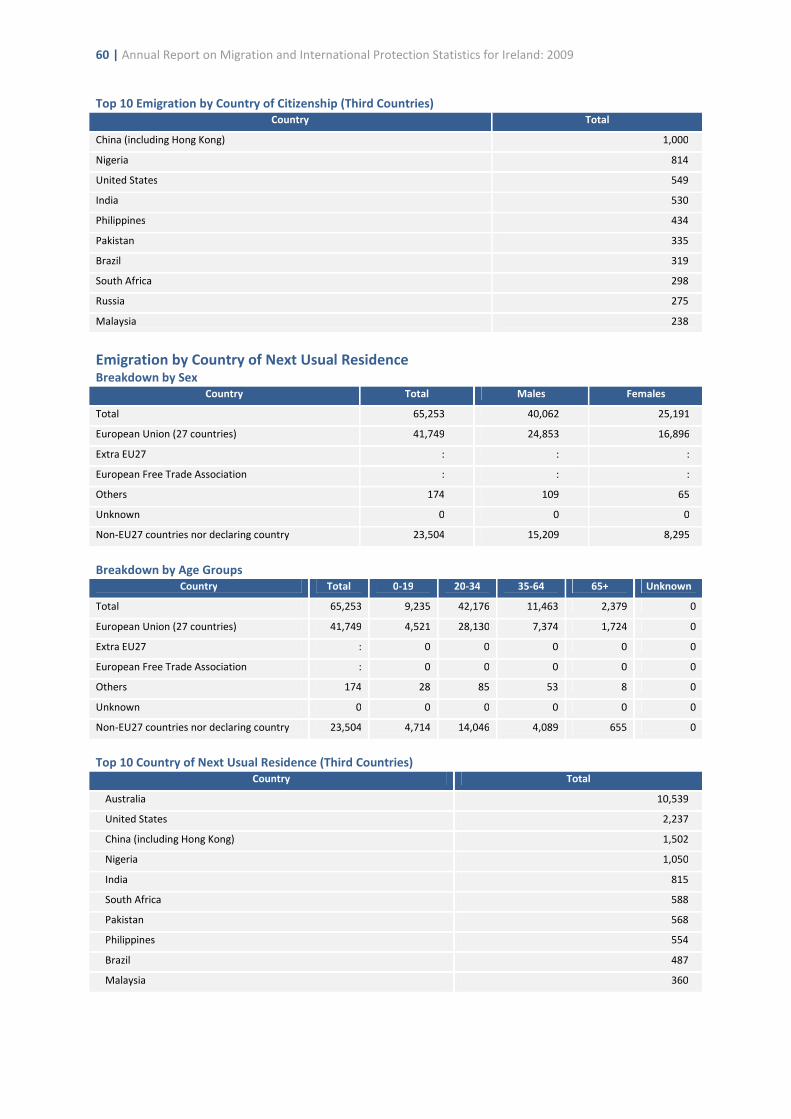
60 | Annual Report on Migration and International Protection Statistics for Ireland: 2009
Top 10 Emigration by Country of Citizenship (Third Countries)
Country Total
China (including Hong Kong) 1,000
Nigeria 814
United States 549
India 530
Philippines 434
Pakistan 335
Brazil 319
South Africa 298
Russia 275
Malaysia 238
Emigration by Country of Next Usual Residence Breakdown by Sex
Country Total Males Females
Total 65,253 40,062 25,191
European Union (27 countries) 41,749 24,853 16,896
Extra EU27 : : :
European Free Trade Association : : :
Others 174 109 65
Unknown 0 0 0
Non-EU27 countries nor declaring country 23,504 15,209 8,295
Breakdown by Age Groups
Country Total 0-19 20-34 35-64 65+ Unknown
Total 65,253 9,235 42,176 11,463 2,379 0
European Union (27 countries) 41,749 4,521 28,130 7,374 1,724 0
Extra EU27 : 0 0 0 0 0
European Free Trade Association : 0 0 0 0 0
Others 174 28 85 53 8 0
Unknown 0 0 0 0 0 0
Non-EU27 countries nor declaring country 23,504 4,714 14,046 4,089 655 0
Top 10 Country of Next Usual Residence (Third Countries)
Country Total
Australia 10,539
United States 2,237
China (including Hong Kong) 1,502
Nigeria 1,050
India 815
South Africa 588
Pakistan 568
Philippines 554
Brazil 487
Malaysia 360
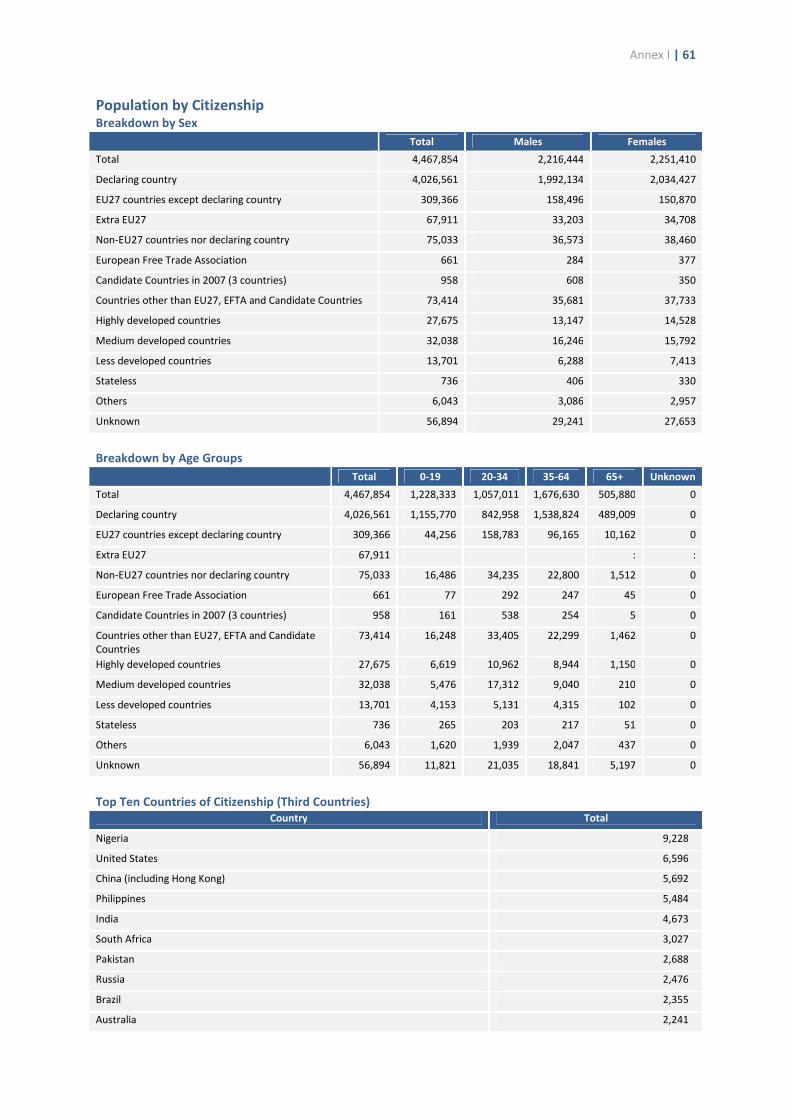
Annex I | 61
Population by Citizenship Breakdown by Sex
Total Males Females
Total 4,467,854 2,216,444 2,251,410
Declaring country 4,026,561 1,992,134 2,034,427
EU27 countries except declaring country 309,366 158,496 150,870
Extra EU27 67,911 33,203 34,708
Non-EU27 countries nor declaring country 75,033 36,573 38,460
European Free Trade Association 661 284 377
Candidate Countries in 2007 (3 countries) 958 608 350
Countries other than EU27, EFTA and Candidate Countries 73,414 35,681 37,733
Highly developed countries 27,675 13,147 14,528
Medium developed countries 32,038 16,246 15,792
Less developed countries 13,701 6,288 7,413
Stateless 736 406 330
Others 6,043 3,086 2,957
Unknown 56,894 29,241 27,653
Breakdown by Age Groups
Total 0-19 20-34 35-64 65+ Unknown
Total 4,467,854 1,228,333 1,057,011 1,676,630 505,880 0
Declaring country 4,026,561 1,155,770 842,958 1,538,824 489,009 0
EU27 countries except declaring country 309,366 44,256 158,783 96,165 10,162 0
Extra EU27 67,911 : :
Non-EU27 countries nor declaring country 75,033 16,486 34,235 22,800 1,512 0
European Free Trade Association 661 77 292 247 45 0
Candidate Countries in 2007 (3 countries) 958 161 538 254 5 0
Countries other than EU27, EFTA and Candidate Countries
73,414 16,248 33,405 22,299 1,462 0
Highly developed countries 27,675 6,619 10,962 8,944 1,150 0
Medium developed countries 32,038 5,476 17,312 9,040 210 0
Less developed countries 13,701 4,153 5,131 4,315 102 0
Stateless 736 265 203 217 51 0
Others 6,043 1,620 1,939 2,047 437 0
Unknown 56,894 11,821 21,035 18,841 5,197 0
Top Ten Countries of Citizenship (Third Countries)
Country Total
Nigeria 9,228
United States 6,596
China (including Hong Kong) 5,692
Philippines 5,484
India 4,673
South Africa 3,027
Pakistan 2,688
Russia 2,476
Brazil 2,355
Australia 2,241

62 | Annual Report on Migration and International Protection Statistics for Ireland: 2009
Population by Country of Birth Breakdown by Sex
Total Males Females
Total 4,467,854 2,216,444 2,251,410
Declaring country 3,855,685 1,911,442 1,944,243
EU27 countries except declaring country 437,218 218,402 218,816
Extra EU27 125,411 61,540 63,871
Non-EU27 countries nor declaring country 128,378 62,832 65,546
European Free Trade Association 1,304 565 739
Candidate Countries in 2007 (3 countries) 1,503 959 544
Countries other than EU27, EFTA and Candidate Countries 125,571 61,308 64,263
Highly developed countries 51,548 24,688 26,860
Medium developed countries 53,426 27,017 26,409
Less developed countries 20,597 9,603 10,994
Others 1,846 992 854
Unknown 46,573 23,768 22,805
Breakdown by Age Groups
Total 0-19 20-34 35-64 65+ Unknown
Total 4,467,854 1,228,333 1,057,011 1,676,630 505,880 0
Declaring country 3,855,685 1,118,765 804,010 1,452,800 48, 110 0
EU27 countries except declaring country
437,218 72,554 177,698 166,289 20,677 0
Extra EU27 125,411 : : : : :
Non-EU27 countries nor declaring country
128,378 30,393 52,159 42,558 3,268 0
European Free Trade Association 1,304 274 488 469 73 0
Candidate Countries in 2007 (3 countries)
1,503 229 801 461 12 0
Countries other than EU27, EFTA and Candidate Countries
125,571 29,890 50,870 41,628 3,183 0
Highly developed countries 51,548 15,443 16,651 17,276 2, 178 0
Medium developed countries 53,426 8,951 26,561 17,041 873 0
Less developed countries 20,597 5,496 7,658 7,311 132 0
Others 1,846 285 489 1,003 69 0
Unknown 46,573 6,621 23,144 14,983 1,825 0
Top Ten Countries of Citizenship (Third Countries)
Country Total
United States 18,960
Nigeria 13,506
China (including Hong Kong) 8,170
Philippines 7,935
India 7,381
South Africa 6,132
Australia 5,245
Pakistan 4,520
Russia 3,675
Canada 3,664
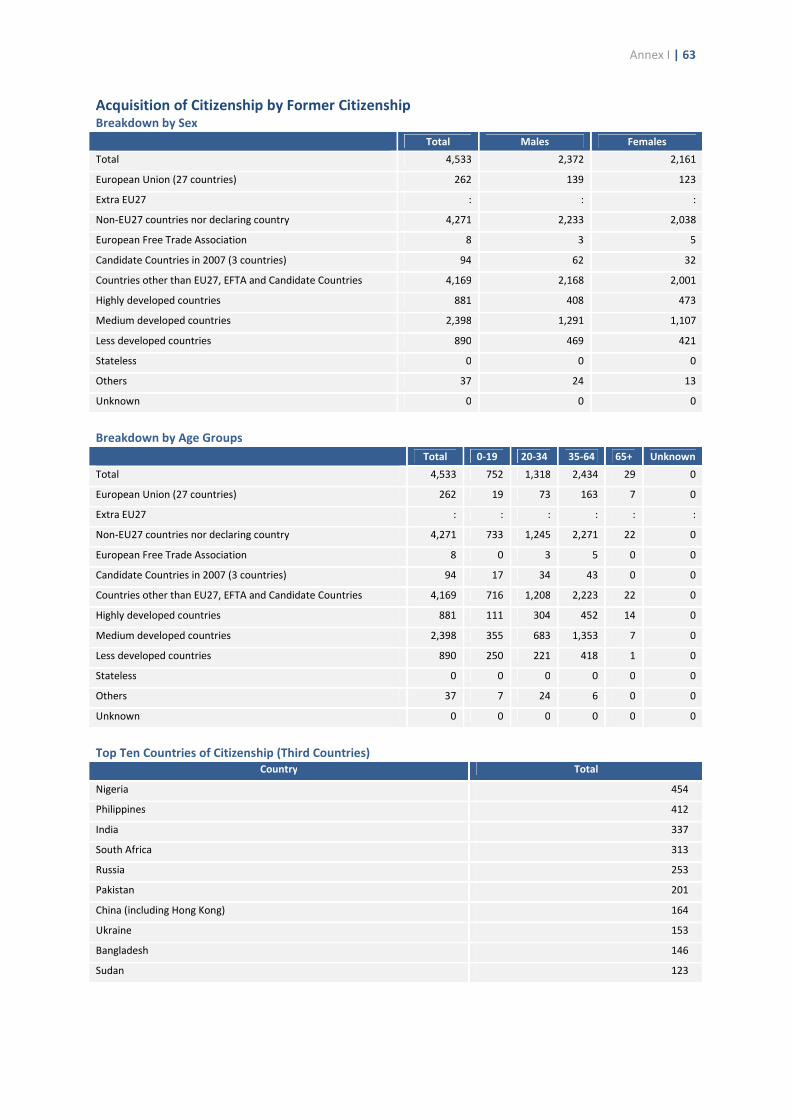
Annex I | 63
Acquisition of Citizenship by Former Citizenship Breakdown by Sex
Total Males Females
Total 4,533 2,372 2,161
European Union (27 countries) 262 139 123
Extra EU27 : : :
Non-EU27 countries nor declaring country 4,271 2,233 2,038
European Free Trade Association 8 3 5
Candidate Countries in 2007 (3 countries) 94 62 32
Countries other than EU27, EFTA and Candidate Countries 4,169 2,168 2,001
Highly developed countries 881 408 473
Medium developed countries 2,398 1,291 1,107
Less developed countries 890 469 421
Stateless 0 0 0
Others 37 24 13
Unknown 0 0 0
Breakdown by Age Groups
Total 0-19 20-34 35-64 65+ Unknown
Total 4,533 752 1,318 2,434 29 0
European Union (27 countries) 262 19 73 163 7 0
Extra EU27 : : : : : :
Non-EU27 countries nor declaring country 4,271 733 1,245 2,271 22 0
European Free Trade Association 8 0 3 5 0 0
Candidate Countries in 2007 (3 countries) 94 17 34 43 0 0
Countries other than EU27, EFTA and Candidate Countries 4,169 716 1,208 2,223 22 0
Highly developed countries 881 111 304 452 14 0
Medium developed countries 2,398 355 683 1,353 7 0
Less developed countries 890 250 221 418 1 0
Stateless 0 0 0 0 0 0
Others 37 7 24 6 0 0
Unknown 0 0 0 0 0 0
Top Ten Countries of Citizenship (Third Countries)
Country Total
Nigeria 454
Philippines 412
India 337
South Africa 313
Russia 253
Pakistan 201
China (including Hong Kong) 164
Ukraine 153
Bangladesh 146
Sudan 123
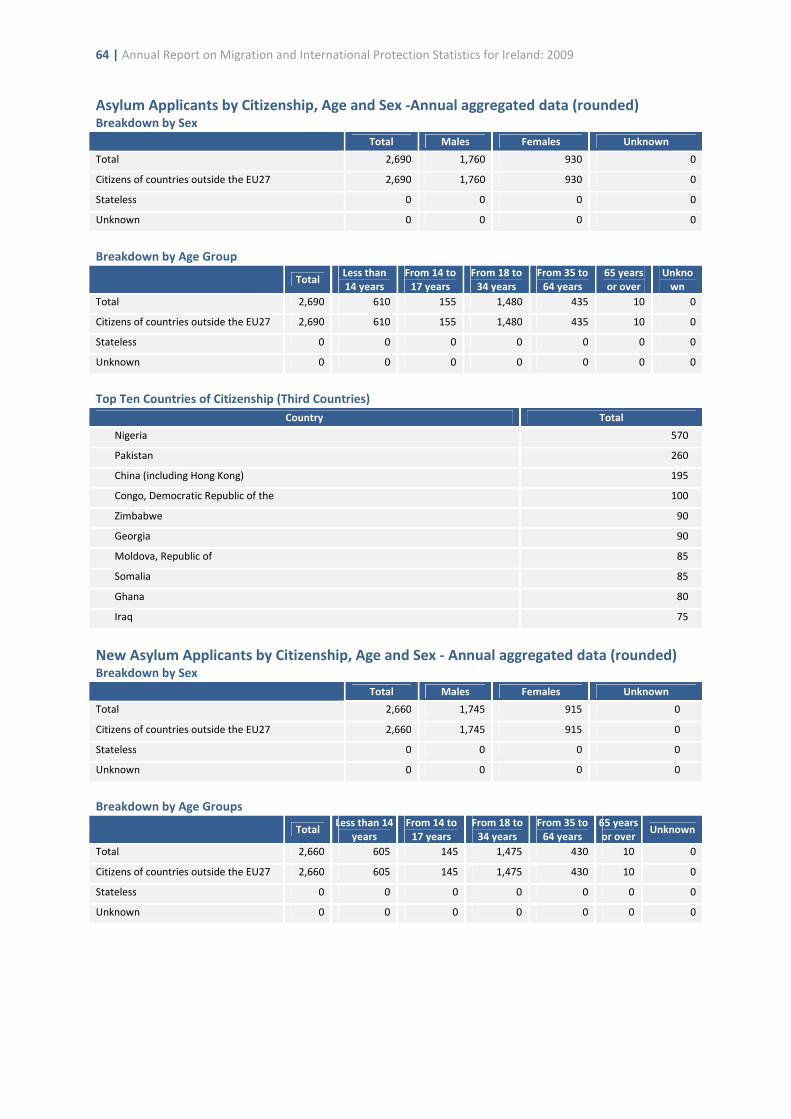
64 | Annual Report on Migration and International Protection Statistics for Ireland: 2009
Asylum Applicants by Citizenship, Age and Sex -Annual aggregated data (rounded) Breakdown by Sex
Total Males Females Unknown
Total 2,690 1,760 930 0
Citizens of countries outside the EU27 2,690 1,760 930 0
Stateless 0 0 0 0
Unknown 0 0 0 0
Breakdown by Age Group
Total
Less than
14 years
From 14 to
17 years
From 18 to
34 years
From 35 to
64 years
65 years
or over
Unkno
wn
Total 2,690 610 155 1,480 435 10 0
Citizens of countries outside the EU27 2,690 610 155 1,480 435 10 0
Stateless 0 0 0 0 0 0 0
Unknown 0 0 0 0 0 0 0
Top Ten Countries of Citizenship (Third Countries)
Country Total
Nigeria 570
Pakistan 260
China (including Hong Kong) 195
Congo, Democratic Republic of the 100
Zimbabwe 90
Georgia 90
Moldova, Republic of 85
Somalia 85
Ghana 80
Iraq 75
New Asylum Applicants by Citizenship, Age and Sex - Annual aggregated data (rounded) Breakdown by Sex
Total Males Females Unknown
Total 2,660 1,745 915 0
Citizens of countries outside the EU27 2,660 1,745 915 0
Stateless 0 0 0 0
Unknown 0 0 0 0
Breakdown by Age Groups
Total
Less than 14
years
From 14 to
17 years
From 18 to
34 years
From 35 to
64 years
65 years
or over Unknown
Total 2,660 605 145 1,475 430 10 0
Citizens of countries outside the EU27 2,660 605 145 1,475 430 10 0
Stateless 0 0 0 0 0 0 0
Unknown 0 0 0 0 0 0 0
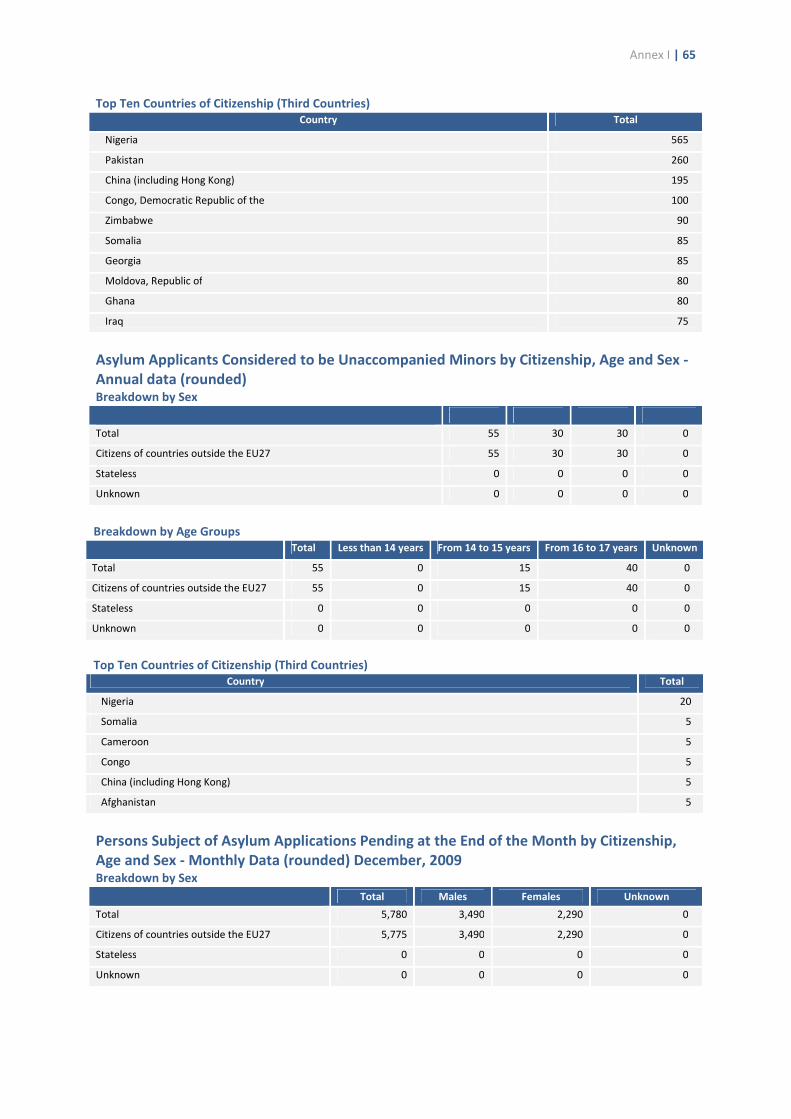
Annex I | 65
Top Ten Countries of Citizenship (Third Countries)
Country Total
Nigeria 565
Pakistan 260
China (including Hong Kong) 195
Congo, Democratic Republic of the 100
Zimbabwe 90
Somalia 85
Georgia 85
Moldova, Republic of 80
Ghana 80
Iraq 75
Asylum Applicants Considered to be Unaccompanied Minors by Citizenship, Age and Sex -
Annual data (rounded) Breakdown by Sex
Total Males Females Unknown
Total 55 30 30 0
Citizens of countries outside the EU27 55 30 30 0
Stateless 0 0 0 0
Unknown 0 0 0 0
Breakdown by Age Groups
Total Less than 14 years From 14 to 15 years From 16 to 17 years Unknown
Total 55 0 15 40 0
Citizens of countries outside the EU27 55 0 15 40 0
Stateless 0 0 0 0 0
Unknown 0 0 0 0 0
Top Ten Countries of Citizenship (Third Countries)
Country Total
Nigeria 20
Somalia 5
Cameroon 5
Congo 5
China (including Hong Kong) 5
Afghanistan 5
Persons Subject of Asylum Applications Pending at the End of the Month by Citizenship,
Age and Sex - Monthly Data (rounded) December, 2009 Breakdown by Sex
Total Males Females Unknown
Total 5,780 3,490 2,290 0
Citizens of countries outside the EU27 5,775 3,490 2,290 0
Stateless 0 0 0 0
Unknown 0 0 0 0
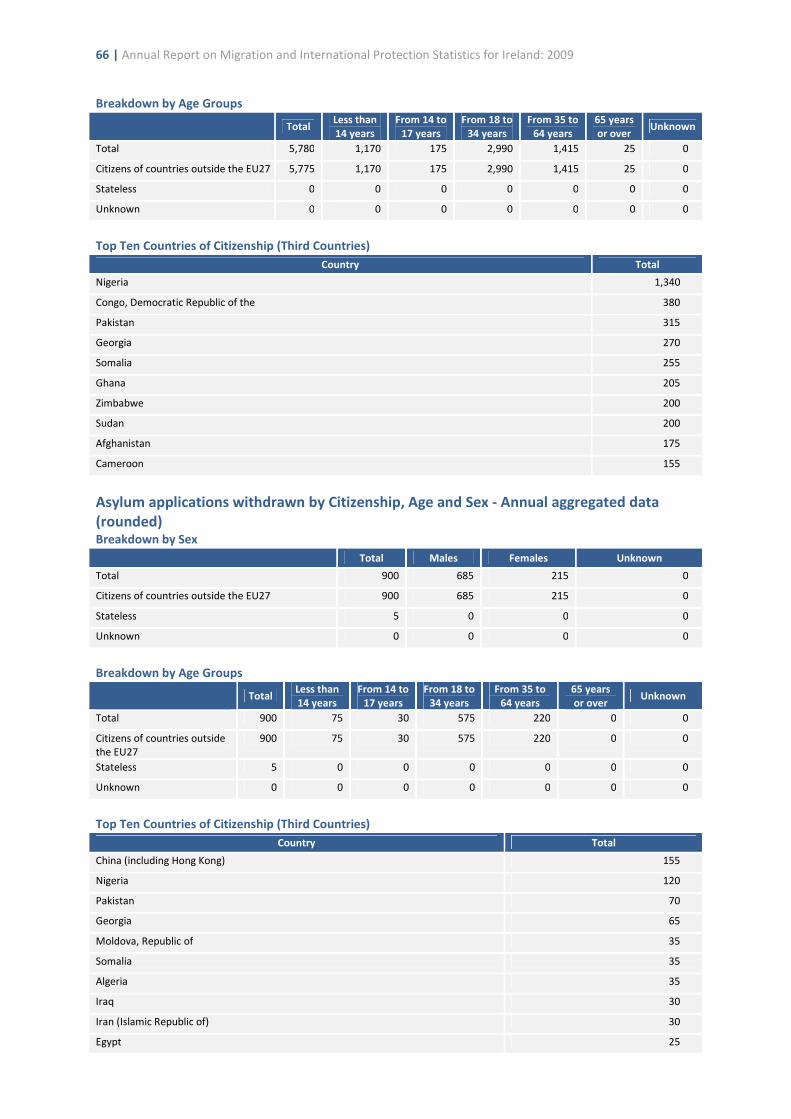
66 | Annual Report on Migration and International Protection Statistics for Ireland: 2009
Breakdown by Age Groups
Total
Less than
14 years
From 14 to
17 years
From 18 to
34 years
From 35 to
64 years
65 years
or over Unknown
Total 5,780 1,170 175 2,990 1,415 25 0
Citizens of countries outside the EU27 5,775 1,170 175 2,990 1,415 25 0
Stateless 0 0 0 0 0 0 0
Unknown 0 0 0 0 0 0 0
Top Ten Countries of Citizenship (Third Countries)
Country Total
Nigeria 1,340
Congo, Democratic Republic of the 380
Pakistan 315
Georgia 270
Somalia 255
Ghana 205
Zimbabwe 200
Sudan 200
Afghanistan 175
Cameroon 155
Asylum applications withdrawn by Citizenship, Age and Sex - Annual aggregated data
(rounded) Breakdown by Sex
Total Males Females Unknown
Total 900 685 215 0
Citizens of countries outside the EU27 900 685 215 0
Stateless 5 0 0 0
Unknown 0 0 0 0
Breakdown by Age Groups
Total
Less than
14 years
From 14 to
17 years
From 18 to
34 years
From 35 to
64 years
65 years
or over Unknown
Total 900 75 30 575 220 0 0
Citizens of countries outside the EU27
900 75 30 575 220 0 0
Stateless 5 0 0 0 0 0 0
Unknown 0 0 0 0 0 0 0
Top Ten Countries of Citizenship (Third Countries)
Country Total
China (including Hong Kong) 155
Nigeria 120
Pakistan 70
Georgia 65
Moldova, Republic of 35
Somalia 35
Algeria 35
Iraq 30
Iran (Islamic Republic of) 30
Egypt 25
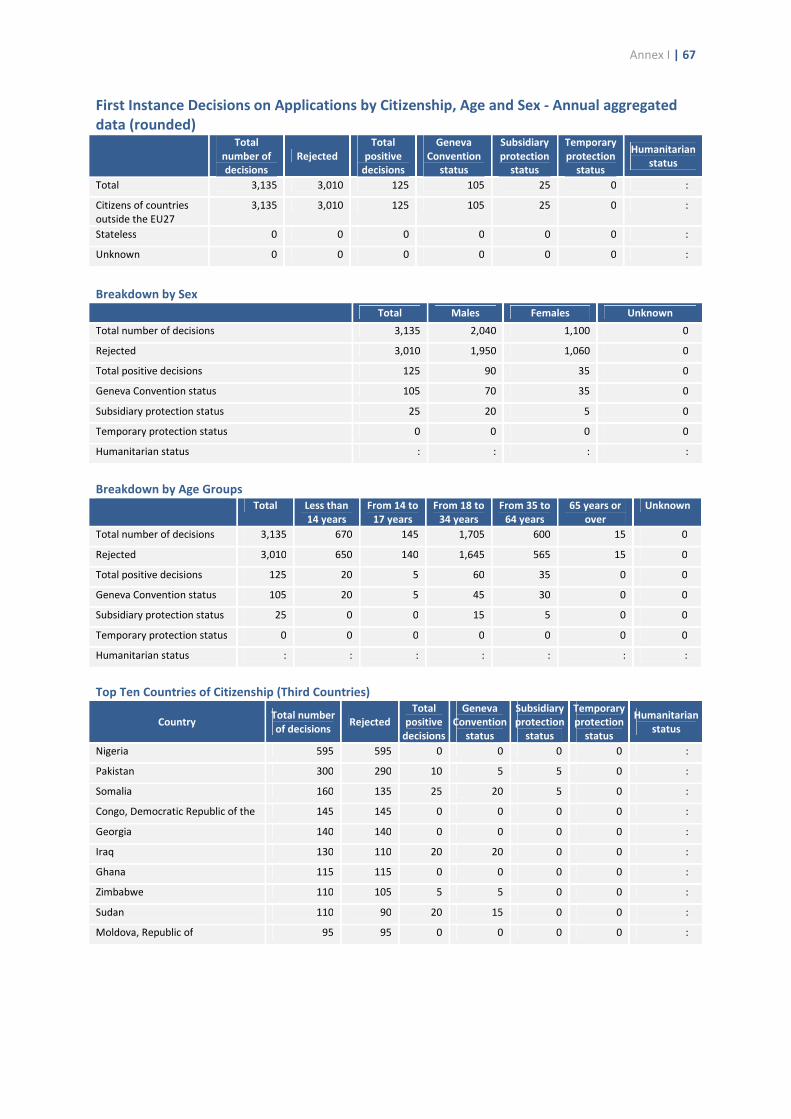
Annex I | 67
First Instance Decisions on Applications by Citizenship, Age and Sex - Annual aggregated
data (rounded)
Total
number of
decisions
Rejected
Total
positive
decisions
Geneva
Convention
status
Subsidiary
protection
status
Temporary
protection
status
Humanitarian
status
Total 3,135 3,010 125 105 25 0 :
Citizens of countries outside the EU27
3,135 3,010 125 105 25 0 :
Stateless 0 0 0 0 0 0 :
Unknown 0 0 0 0 0 0 :
Breakdown by Sex
Total Males Females Unknown
Total number of decisions 3,135 2,040 1,100 0
Rejected 3,010 1,950 1,060 0
Total positive decisions 125 90 35 0
Geneva Convention status 105 70 35 0
Subsidiary protection status 25 20 5 0
Temporary protection status 0 0 0 0
Humanitarian status : : : :
Breakdown by Age Groups
Total Less than
14 years
From 14 to
17 years
From 18 to
34 years
From 35 to
64 years
65 years or
over
Unknown
Total number of decisions 3,135 670 145 1,705 600 15 0
Rejected 3,010 650 140 1,645 565 15 0
Total positive decisions 125 20 5 60 35 0 0
Geneva Convention status 105 20 5 45 30 0 0
Subsidiary protection status 25 0 0 15 5 0 0
Temporary protection status 0 0 0 0 0 0 0
Humanitarian status : : : : : : :
Top Ten Countries of Citizenship (Third Countries)
Country Total number
of decisions Rejected
Total
positive
decisions
Geneva
Convention
status
Subsidiary
protection
status
Temporary
protection
status
Humanitarian
status
Nigeria 595 595 0 0 0 0 :
Pakistan 300 290 10 5 5 0 :
Somalia 160 135 25 20 5 0 :
Congo, Democratic Republic of the 145 145 0 0 0 0 :
Georgia 140 140 0 0 0 0 :
Iraq 130 110 20 20 0 0 :
Ghana 115 115 0 0 0 0 :
Zimbabwe 110 105 5 5 0 0 :
Sudan 110 90 20 15 0 0 :
Moldova, Republic of 95 95 0 0 0 0 :

68 | Annual Report on Migration and International Protection Statistics for Ireland: 2009
Decisions withdrawing status granted at first instance decision by type of status
withdrawn and by citizenship - Annual aggregated data (rounded)
Total number
of withdrawals
Geneva
Convention
status
Subsidiary
protection
status
Temporary
protection
status
Humanitarian
status
Total 5 5 0 0 0
Citizens of countries outside the EU27 5 5 0 0 0
Stateless 0 0 0 0 0
Unknown 0 0 0 0 0
Top Ten Countries of Citizenship (Third Countries)
Total number of withdrawals Geneva Convention
status
Subsidiary protection
status
Temporary
protection status Humanitarian status
- - -
- - -
- - -
- - -
- - -
- - -
- - -
- - -
- - -
- - -
Final Decisions on Applications by Citizenship, Age and Sex - Annual data (rounded) Total number of
decisions
Rejected Total
positive
decisions
Geneva
Convention
status
Subsidiary
protection
status
Temporary
protection
status
Humanitarian
status
Total 3 425 3 160 270 270 : 0 :
Citizens of countries outside the EU27
3 420 3 155 270 270 : 0 :
Stateless 0 0 0 0 : 0 :
Unknown 0 0 0 0 : 0 :
Breakdown by Sex
Total Males Females Unknown
Total number of decisions 3,425 2,090 1,335 0
Rejected 3,160 1,925 1,235 0
Total positive decisions 270 165 100 0
Geneva Convention status 270 165 100 0
Subsidiary protection status : : : :
Temporary protection status 0 0 0 0
Humanitarian status : : : :
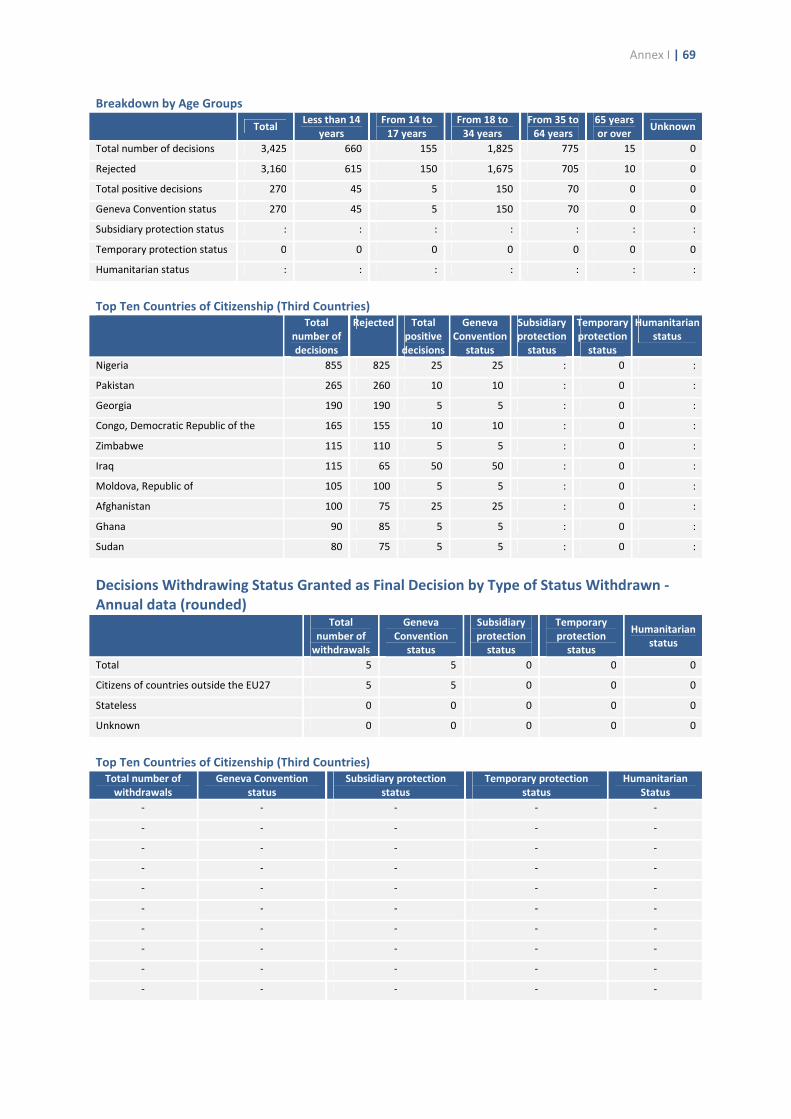
Annex I | 69
Breakdown by Age Groups
Total
Less than 14
years
From 14 to
17 years
From 18 to
34 years
From 35 to
64 years
65 years
or over Unknown
Total number of decisions 3,425 660 155 1,825 775 15 0
Rejected 3,160 615 150 1,675 705 10 0
Total positive decisions 270 45 5 150 70 0 0
Geneva Convention status 270 45 5 150 70 0 0
Subsidiary protection status : : : : : : :
Temporary protection status 0 0 0 0 0 0 0
Humanitarian status : : : : : : :
Top Ten Countries of Citizenship (Third Countries)
Total
number of
decisions
Rejected Total
positive
decisions
Geneva
Convention
status
Subsidiary
protection
status
Temporary
protection
status
Humanitarian
status
Nigeria 855 825 25 25 : 0 :
Pakistan 265 260 10 10 : 0 :
Georgia 190 190 5 5 : 0 :
Congo, Democratic Republic of the 165 155 10 10 : 0 :
Zimbabwe 115 110 5 5 : 0 :
Iraq 115 65 50 50 : 0 :
Moldova, Republic of 105 100 5 5 : 0 :
Afghanistan 100 75 25 25 : 0 :
Ghana 90 85 5 5 : 0 :
Sudan 80 75 5 5 : 0 :
Decisions Withdrawing Status Granted as Final Decision by Type of Status Withdrawn -
Annual data (rounded)
Total
number of
withdrawals
Geneva
Convention
status
Subsidiary
protection
status
Temporary
protection
status
Humanitarian
status
Total 5 5 0 0 0
Citizens of countries outside the EU27 5 5 0 0 0
Stateless 0 0 0 0 0
Unknown 0 0 0 0 0
Top Ten Countries of Citizenship (Third Countries)
Total number of
withdrawals
Geneva Convention
status
Subsidiary protection
status
Temporary protection
status
Humanitarian
Status
- - - - -
- - - - -
- - - - -
- - - - -
- - - - -
- - - - -
- - - - -
- - - - -
- - - - -
- - - - -
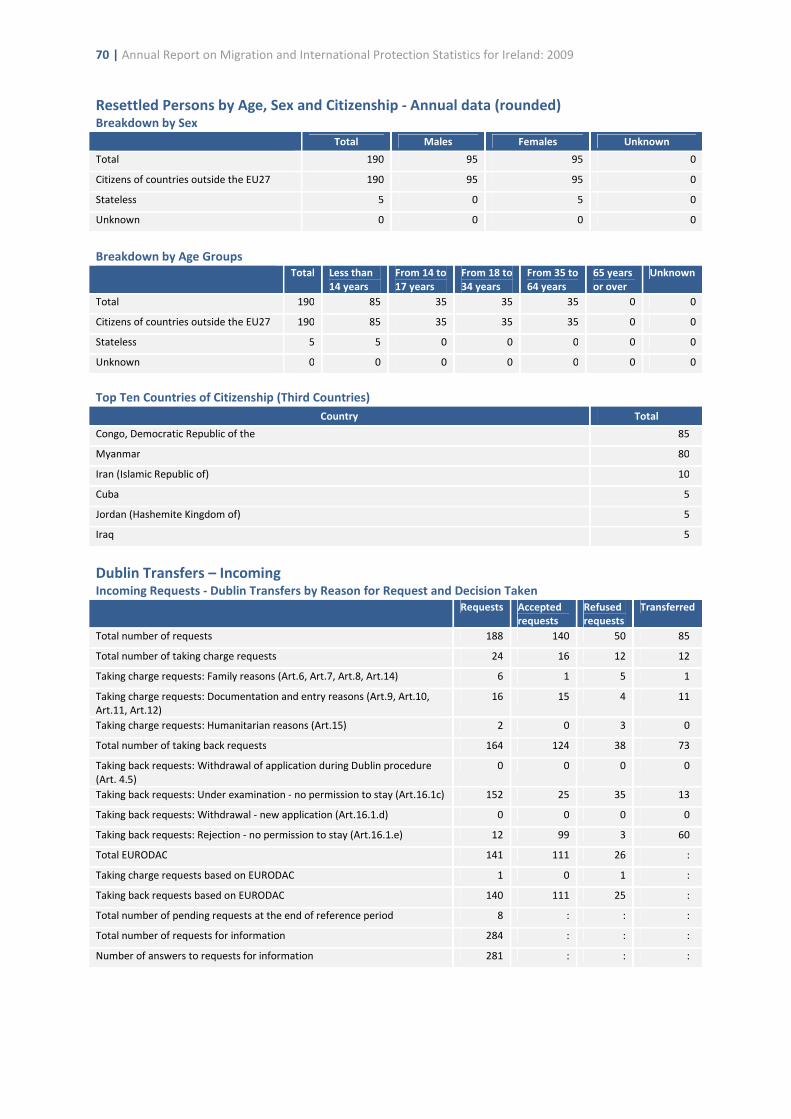
70 | Annual Report on Migration and International Protection Statistics for Ireland: 2009
Resettled Persons by Age, Sex and Citizenship - Annual data (rounded) Breakdown by Sex
Total Males Females Unknown
Total 190 95 95 0
Citizens of countries outside the EU27 190 95 95 0
Stateless 5 0 5 0
Unknown 0 0 0 0
Breakdown by Age Groups
Total Less than
14 years
From 14 to
17 years
From 18 to
34 years
From 35 to
64 years
65 years
or over
Unknown
Total 190 85 35 35 35 0 0
Citizens of countries outside the EU27 190 85 35 35 35 0 0
Stateless 5 5 0 0 0 0 0
Unknown 0 0 0 0 0 0 0
Top Ten Countries of Citizenship (Third Countries)
Country Total
Congo, Democratic Republic of the 85
Myanmar 80
Iran (Islamic Republic of) 10
Cuba 5
Jordan (Hashemite Kingdom of) 5
Iraq 5
Dublin Transfers – Incoming Incoming Requests - Dublin Transfers by Reason for Request and Decision Taken
Requests Accepted
requests
Refused
requests
Transferred
Total number of requests 188 140 50 85
Total number of taking charge requests 24 16 12 12
Taking charge requests: Family reasons (Art.6, Art.7, Art.8, Art.14) 6 1 5 1
Taking charge requests: Documentation and entry reasons (Art.9, Art.10, Art.11, Art.12)
16 15 4 11
Taking charge requests: Humanitarian reasons (Art.15) 2 0 3 0
Total number of taking back requests 164 124 38 73
Taking back requests: Withdrawal of application during Dublin procedure (Art. 4.5)
0 0 0 0
Taking back requests: Under examination - no permission to stay (Art.16.1c) 152 25 35 13
Taking back requests: Withdrawal - new application (Art.16.1.d) 0 0 0 0
Taking back requests: Rejection - no permission to stay (Art.16.1.e) 12 99 3 60
Total EURODAC 141 111 26 :
Taking charge requests based on EURODAC 1 0 1 :
Taking back requests based on EURODAC 140 111 25 :
Total number of pending requests at the end of reference period 8 : : :
Total number of requests for information 284 : : :
Number of answers to requests for information 281 : : :
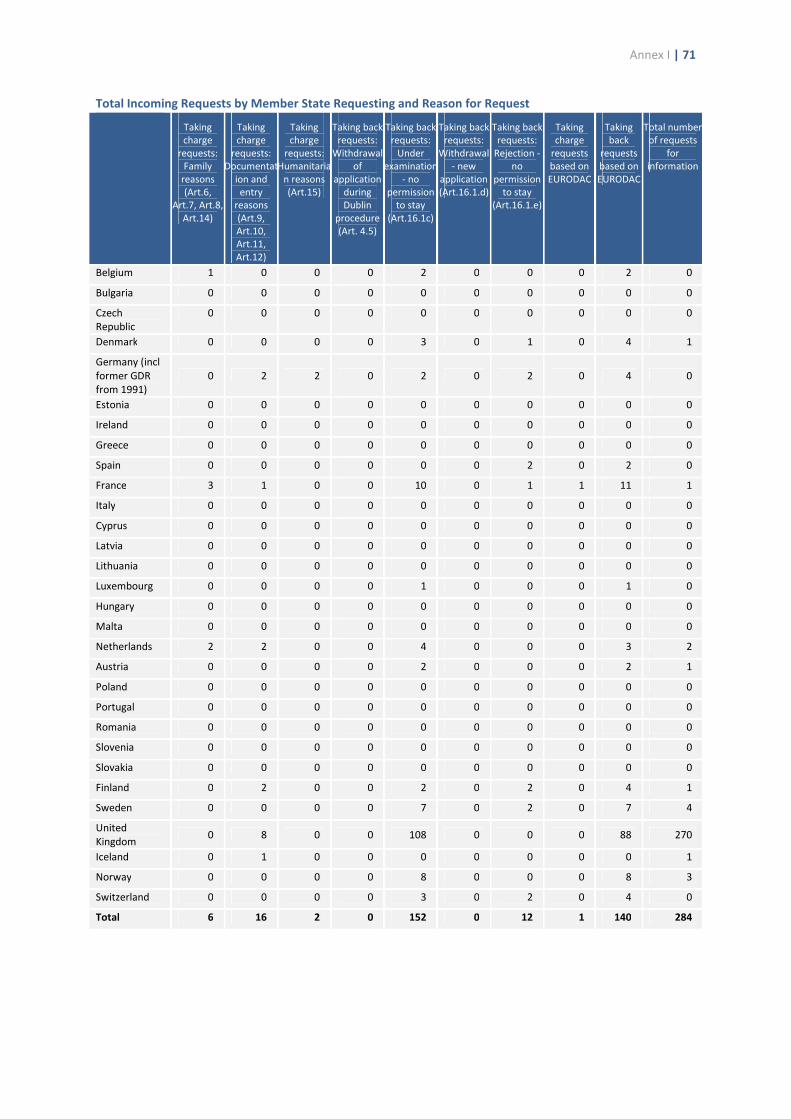
Annex I | 71
Total Incoming Requests by Member State Requesting and Reason for Request
Taking charge
requests: Family
reasons (Art.6,
Art.7, Art.8, Art.14)
Taking charge
requests: Documentat
ion and entry
reasons (Art.9, Art.10, Art.11, Art.12)
Taking charge
requests: Humanitaria
n reasons (Art.15)
Taking back requests:
Withdrawal of
application during Dublin
procedure (Art. 4.5)
Taking back requests:
Under examination
- no permission
to stay (Art.16.1c)
Taking back requests:
Withdrawal - new
application (Art.16.1.d)
Taking back requests:
Rejection - no
permission to stay
(Art.16.1.e)
Taking charge
requests based on EURODAC
Taking back
requests based on EURODAC
Total number of requests
for information
Belgium 1 0 0 0 2 0 0 0 2 0
Bulgaria 0 0 0 0 0 0 0 0 0 0
Czech Republic
0 0 0 0 0 0 0 0 0 0
Denmark 0 0 0 0 3 0 1 0 4 1
Germany (incl former GDR from 1991)
0 2 2 0 2 0 2 0 4 0
Estonia 0 0 0 0 0 0 0 0 0 0
Ireland 0 0 0 0 0 0 0 0 0 0
Greece 0 0 0 0 0 0 0 0 0 0
Spain 0 0 0 0 0 0 2 0 2 0
France 3 1 0 0 10 0 1 1 11 1
Italy 0 0 0 0 0 0 0 0 0 0
Cyprus 0 0 0 0 0 0 0 0 0 0
Latvia 0 0 0 0 0 0 0 0 0 0
Lithuania 0 0 0 0 0 0 0 0 0 0
Luxembourg 0 0 0 0 1 0 0 0 1 0
Hungary 0 0 0 0 0 0 0 0 0 0
Malta 0 0 0 0 0 0 0 0 0 0
Netherlands 2 2 0 0 4 0 0 0 3 2
Austria 0 0 0 0 2 0 0 0 2 1
Poland 0 0 0 0 0 0 0 0 0 0
Portugal 0 0 0 0 0 0 0 0 0 0
Romania 0 0 0 0 0 0 0 0 0 0
Slovenia 0 0 0 0 0 0 0 0 0 0
Slovakia 0 0 0 0 0 0 0 0 0 0
Finland 0 2 0 0 2 0 2 0 4 1
Sweden 0 0 0 0 7 0 2 0 7 4
United Kingdom
0 8 0 0 108 0 0 0 88 270
Iceland 0 1 0 0 0 0 0 0 0 1
Norway 0 0 0 0 8 0 0 0 8 3
Switzerland 0 0 0 0 3 0 2 0 4 0
Total 6 16 2 0 152 0 12 1 140 284
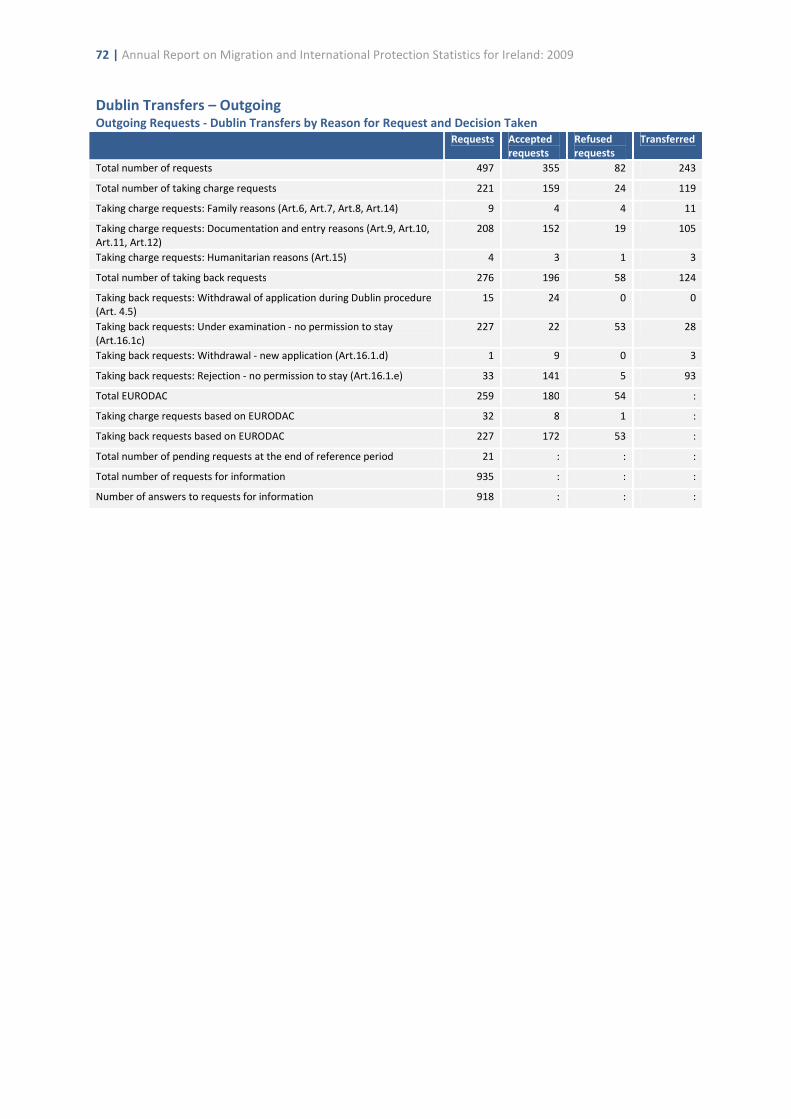
72 | Annual Report on Migration and International Protection Statistics for Ireland: 2009
Dublin Transfers – Outgoing Outgoing Requests - Dublin Transfers by Reason for Request and Decision Taken
Requests Accepted
requests
Refused
requests
Transferred
Total number of requests 497 355 82 243
Total number of taking charge requests 221 159 24 119
Taking charge requests: Family reasons (Art.6, Art.7, Art.8, Art.14) 9 4 4 11
Taking charge requests: Documentation and entry reasons (Art.9, Art.10, Art.11, Art.12)
208 152 19 105
Taking charge requests: Humanitarian reasons (Art.15) 4 3 1 3
Total number of taking back requests 276 196 58 124
Taking back requests: Withdrawal of application during Dublin procedure (Art. 4.5)
15 24 0 0
Taking back requests: Under examination - no permission to stay (Art.16.1c)
227 22 53 28
Taking back requests: Withdrawal - new application (Art.16.1.d) 1 9 0 3
Taking back requests: Rejection - no permission to stay (Art.16.1.e) 33 141 5 93
Total EURODAC 259 180 54 :
Taking charge requests based on EURODAC 32 8 1 :
Taking back requests based on EURODAC 227 172 53 :
Total number of pending requests at the end of reference period 21 : : :
Total number of requests for information 935 : : :
Number of answers to requests for information 918 : : :
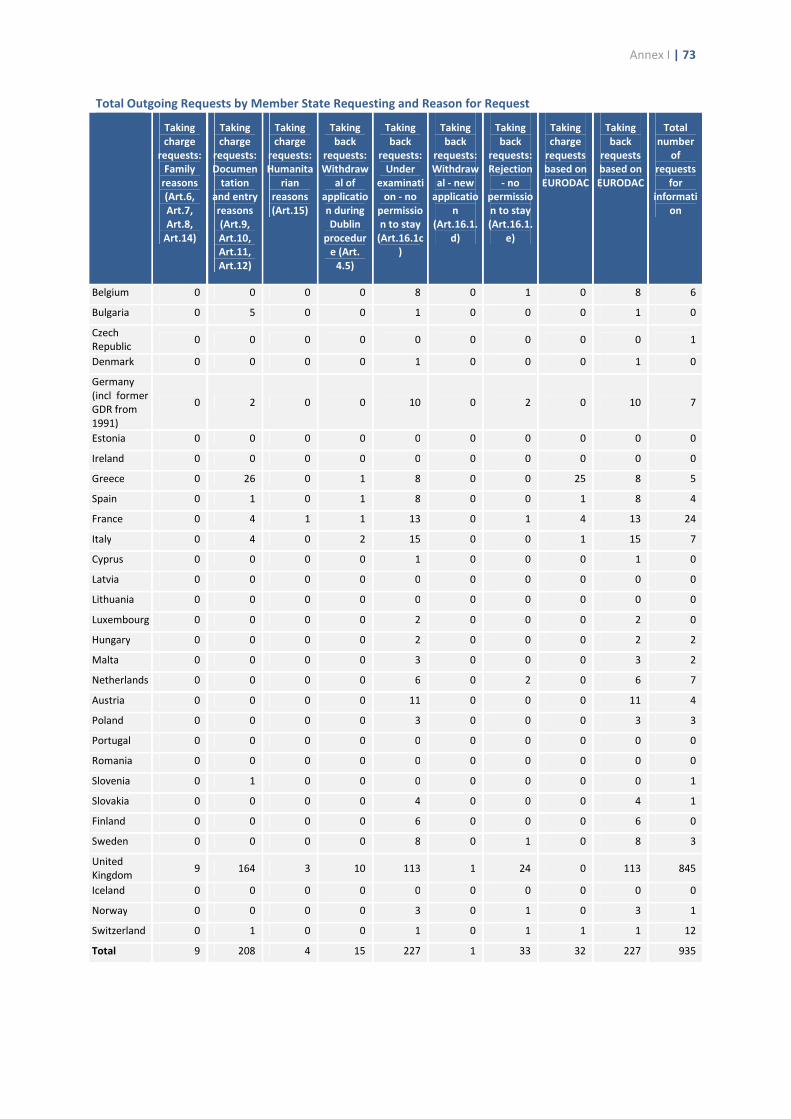
Annex I | 73
Total Outgoing Requests by Member State Requesting and Reason for Request
Taking
charge
requests:
Family
reasons
(Art.6,
Art.7,
Art.8,
Art.14)
Taking
charge
requests:
Documen
tation
and entry
reasons
(Art.9,
Art.10,
Art.11,
Art.12)
Taking
charge
requests:
Humanita
rian
reasons
(Art.15)
Taking
back
requests:
Withdraw
al of
applicatio
n during
Dublin
procedur
e (Art.
4.5)
Taking
back
requests:
Under
examinati
on - no
permissio
n to stay
(Art.16.1c
)
Taking
back
requests:
Withdraw
al - new
applicatio
n
(Art.16.1.
d)
Taking
back
requests:
Rejection
- no
permissio
n to stay
(Art.16.1.
e)
Taking
charge
requests
based on
EURODAC
Taking
back
requests
based on
EURODAC
Total
number
of
requests
for
informati
on
Belgium 0 0 0 0 8 0 1 0 8 6
Bulgaria 0 5 0 0 1 0 0 0 1 0
Czech Republic
0 0 0 0 0 0 0 0 0 1
Denmark 0 0 0 0 1 0 0 0 1 0
Germany (incl former GDR from 1991)
0 2 0 0 10 0 2 0 10 7
Estonia 0 0 0 0 0 0 0 0 0 0
Ireland 0 0 0 0 0 0 0 0 0 0
Greece 0 26 0 1 8 0 0 25 8 5
Spain 0 1 0 1 8 0 0 1 8 4
France 0 4 1 1 13 0 1 4 13 24
Italy 0 4 0 2 15 0 0 1 15 7
Cyprus 0 0 0 0 1 0 0 0 1 0
Latvia 0 0 0 0 0 0 0 0 0 0
Lithuania 0 0 0 0 0 0 0 0 0 0
Luxembourg 0 0 0 0 2 0 0 0 2 0
Hungary 0 0 0 0 2 0 0 0 2 2
Malta 0 0 0 0 3 0 0 0 3 2
Netherlands 0 0 0 0 6 0 2 0 6 7
Austria 0 0 0 0 11 0 0 0 11 4
Poland 0 0 0 0 3 0 0 0 3 3
Portugal 0 0 0 0 0 0 0 0 0 0
Romania 0 0 0 0 0 0 0 0 0 0
Slovenia 0 1 0 0 0 0 0 0 0 1
Slovakia 0 0 0 0 4 0 0 0 4 1
Finland 0 0 0 0 6 0 0 0 6 0
Sweden 0 0 0 0 8 0 1 0 8 3
United Kingdom
9 164 3 10 113 1 24 0 113 845
Iceland 0 0 0 0 0 0 0 0 0 0
Norway 0 0 0 0 3 0 1 0 3 1
Switzerland 0 1 0 0 1 0 1 1 1 12
Total 9 208 4 15 227 1 33 32 227 935
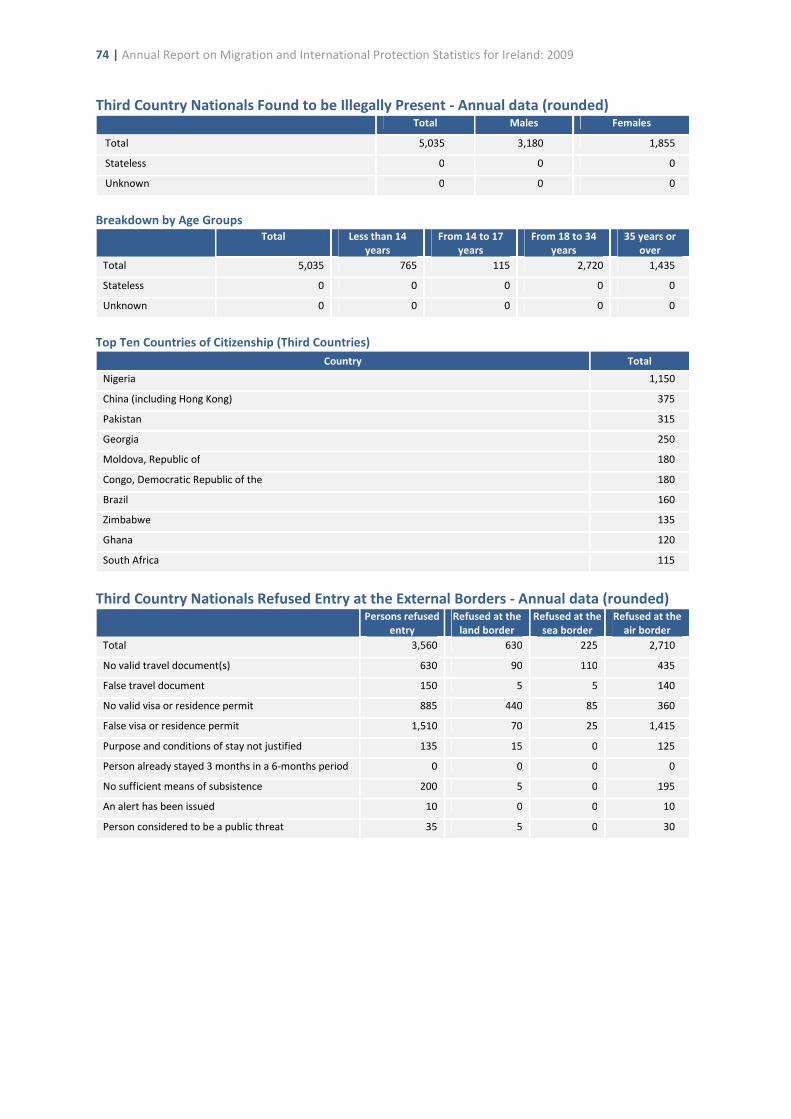
74 | Annual Report on Migration and International Protection Statistics for Ireland: 2009
Third Country Nationals Found to be Illegally Present - Annual data (rounded) Total Males Females
Total 5,035 3,180 1,855
Stateless 0 0 0
Unknown 0 0 0
Breakdown by Age Groups
Total Less than 14
years
From 14 to 17
years
From 18 to 34
years
35 years or
over
Total 5,035 765 115 2,720 1,435
Stateless 0 0 0 0 0
Unknown 0 0 0 0 0
Top Ten Countries of Citizenship (Third Countries)
Country Total
Nigeria 1,150
China (including Hong Kong) 375
Pakistan 315
Georgia 250
Moldova, Republic of 180
Congo, Democratic Republic of the 180
Brazil 160
Zimbabwe 135
Ghana 120
South Africa 115
Third Country Nationals Refused Entry at the External Borders - Annual data (rounded) Persons refused
entry
Refused at the
land border
Refused at the
sea border
Refused at the
air border
Total 3,560 630 225 2,710
No valid travel document(s) 630 90 110 435
False travel document 150 5 5 140
No valid visa or residence permit 885 440 85 360
False visa or residence permit 1,510 70 25 1,415
Purpose and conditions of stay not justified 135 15 0 125
Person already stayed 3 months in a 6-months period 0 0 0 0
No sufficient means of subsistence 200 5 0 195
An alert has been issued 10 0 0 10
Person considered to be a public threat 35 5 0 30
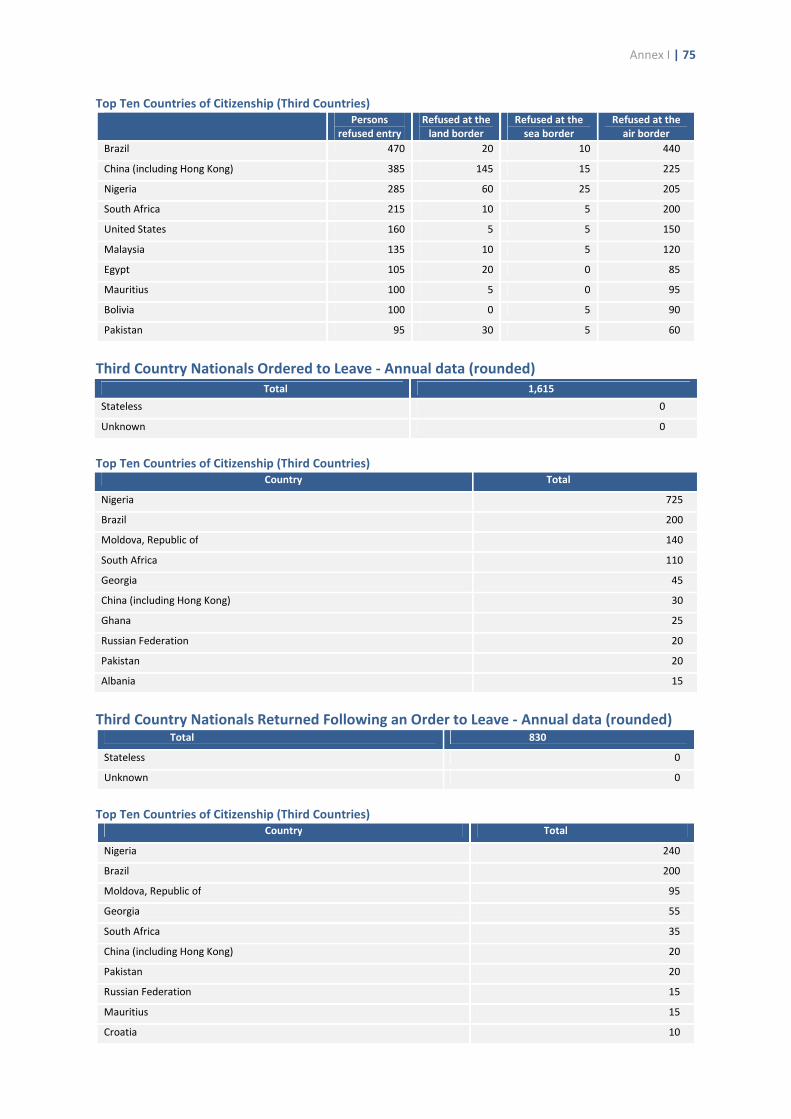
Annex I | 75
Top Ten Countries of Citizenship (Third Countries)
Persons
refused entry
Refused at the
land border
Refused at the
sea border
Refused at the
air border
Brazil 470 20 10 440
China (including Hong Kong) 385 145 15 225
Nigeria 285 60 25 205
South Africa 215 10 5 200
United States 160 5 5 150
Malaysia 135 10 5 120
Egypt 105 20 0 85
Mauritius 100 5 0 95
Bolivia 100 0 5 90
Pakistan 95 30 5 60
Third Country Nationals Ordered to Leave - Annual data (rounded)
Total 1,615
Stateless 0
Unknown 0
Top Ten Countries of Citizenship (Third Countries)
Country Total
Nigeria 725
Brazil 200
Moldova, Republic of 140
South Africa 110
Georgia 45
China (including Hong Kong) 30
Ghana 25
Russian Federation 20
Pakistan 20
Albania 15
Third Country Nationals Returned Following an Order to Leave - Annual data (rounded) Total 830
Stateless 0
Unknown 0
Top Ten Countries of Citizenship (Third Countries)
Country Total
Nigeria 240
Brazil 200
Moldova, Republic of 95
Georgia 55
South Africa 35
China (including Hong Kong) 20
Pakistan 20
Russian Federation 15
Mauritius 15
Croatia 10
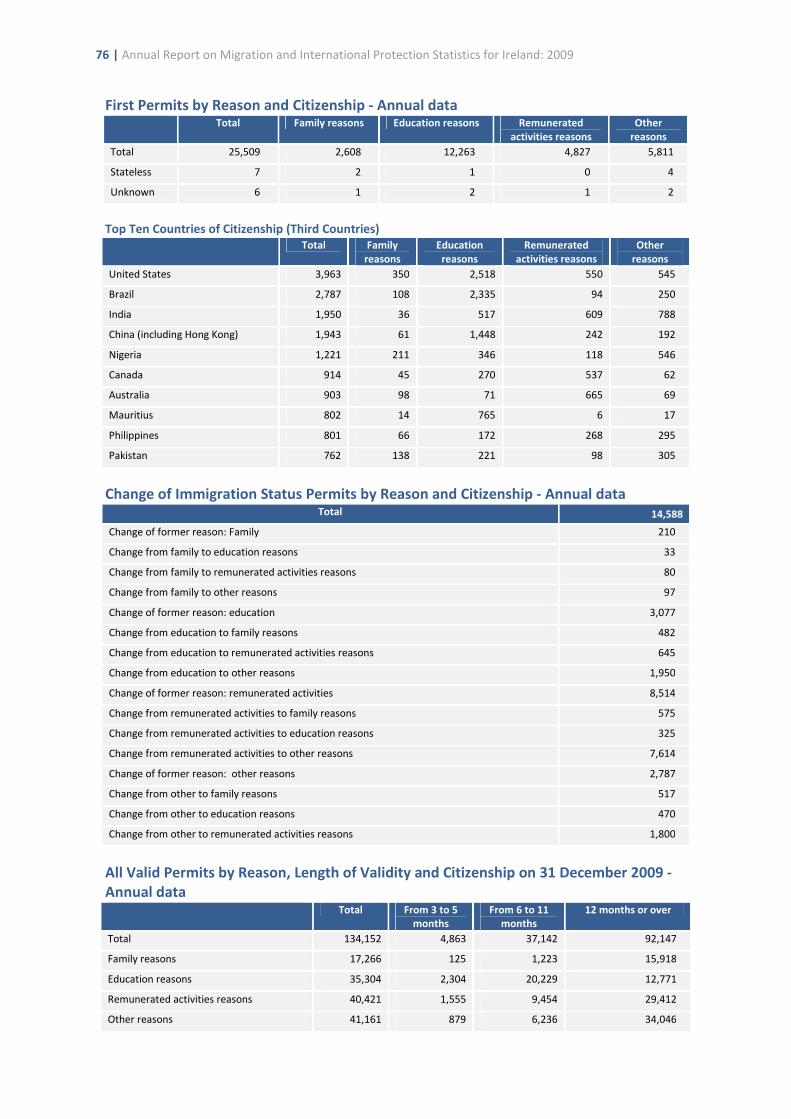
76 | Annual Report on Migration and International Protection Statistics for Ireland: 2009
First Permits by Reason and Citizenship - Annual data Total Family reasons Education reasons Remunerated
activities reasons
Other
reasons
Total 25,509 2,608 12,263 4,827 5,811
Stateless 7 2 1 0 4
Unknown 6 1 2 1 2
Top Ten Countries of Citizenship (Third Countries)
Total Family
reasons
Education
reasons
Remunerated
activities reasons
Other
reasons
United States 3,963 350 2,518 550 545
Brazil 2,787 108 2,335 94 250
India 1,950 36 517 609 788
China (including Hong Kong) 1,943 61 1,448 242 192
Nigeria 1,221 211 346 118 546
Canada 914 45 270 537 62
Australia 903 98 71 665 69
Mauritius 802 14 765 6 17
Philippines 801 66 172 268 295
Pakistan 762 138 221 98 305
Change of Immigration Status Permits by Reason and Citizenship - Annual data Total 14,588
Change of former reason: Family 210
Change from family to education reasons 33
Change from family to remunerated activities reasons 80
Change from family to other reasons 97
Change of former reason: education 3,077
Change from education to family reasons 482
Change from education to remunerated activities reasons 645
Change from education to other reasons 1,950
Change of former reason: remunerated activities 8,514
Change from remunerated activities to family reasons 575
Change from remunerated activities to education reasons 325
Change from remunerated activities to other reasons 7,614
Change of former reason: other reasons 2,787
Change from other to family reasons 517
Change from other to education reasons 470
Change from other to remunerated activities reasons 1,800
All Valid Permits by Reason, Length of Validity and Citizenship on 31 December 2009 -
Annual data Total From 3 to 5
months
From 6 to 11
months
12 months or over
Total 134,152 4,863 37,142 92,147
Family reasons 17,266 125 1,223 15,918
Education reasons 35,304 2,304 20,229 12,771
Remunerated activities reasons 40,421 1,555 9,454 29,412
Other reasons 41,161 879 6,236 34,046
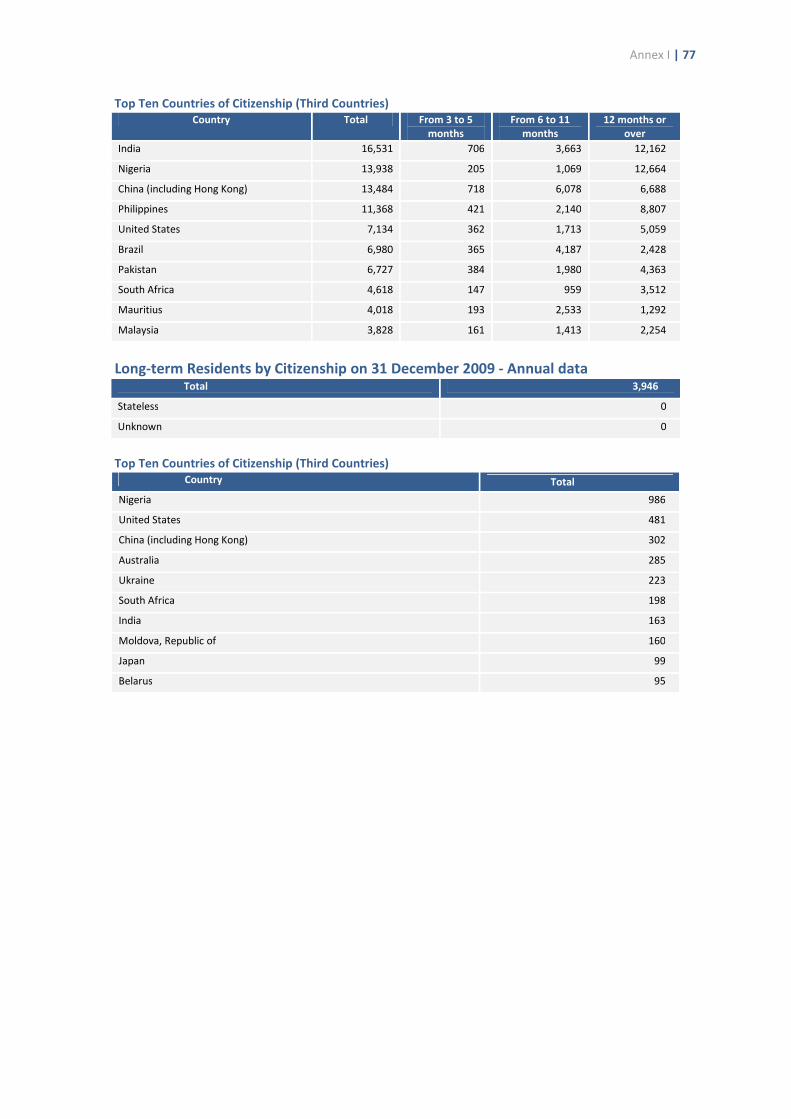
Annex I | 77
Top Ten Countries of Citizenship (Third Countries)
Country Total From 3 to 5
months
From 6 to 11
months
12 months or
over
India 16,531 706 3,663 12,162
Nigeria 13,938 205 1,069 12,664
China (including Hong Kong) 13,484 718 6,078 6,688
Philippines 11,368 421 2,140 8,807
United States 7,134 362 1,713 5,059
Brazil 6,980 365 4,187 2,428
Pakistan 6,727 384 1,980 4,363
South Africa 4,618 147 959 3,512
Mauritius 4,018 193 2,533 1,292
Malaysia 3,828 161 1,413 2,254
Long-term Residents by Citizenship on 31 December 2009 - Annual data Total 3,946
Stateless 0
Unknown 0
Top Ten Countries of Citizenship (Third Countries)
Country Total
Nigeria 986
United States 481
China (including Hong Kong) 302
Australia 285
Ukraine 223
South Africa 198
India 163
Moldova, Republic of 160
Japan 99
Belarus 95
EMN IrelandThe Economic & Social Research Institute Whitaker SquareSir John Rogerson’s Quay Dublin 2, Ireland + 353 1 863 2000
Related Documents


