STANDARD BANK (MAURITIUS) LIMITED ANNUAL REPORT 2020 Standard Bank (Mauritius) Limited standardbank.mu ANNUAL REPORT 2020 Standard Bank (Mauritius) Limited

Welcome message from author
This document is posted to help you gain knowledge. Please leave a comment to let me know what you think about it! Share it to your friends and learn new things together.
Transcript
STANDARD BANK (MAURITIUS) LIMITED
AN
NU
AL R
EP
OR
T 2
02
0S
tand
ard B
ank (M
auritiu
s) Limited
standardbank.mu
ANNUAL REPORT 2020
Standard Bank (Mauritius) Limited

on an International Financial Reporting Standards (IFRS) basis, unless otherwise specified. Any restatements of comparable information are noted.
Forward-looking statements
This report contains a number of projections relating to Standard Bank’s strategy, the future demand for our products and services and the operating environment in which we operate. Our actual results may differ materially from these forecasts. The Bank has no plan to update any forward-looking statements periodically. Readers are therefore advised not to place undue reliance on this information.
Reporting boundary
This report evaluates the financial and non-financial performance of Standard Bank (Mauritius) Limited (the “Bank”) during the financial year ended 31 December 2020. It highlights the trends and challenges facing our business (p. 10), our long-term strategy (p. 8); and the risks we face (p. 30). It also assesses the performance of our business lines over the year (p. 16-17).
It includes material information up to the date of board approval on 17 March 2021.
The financial information complies with the standards set out in the Mauritius Companies Act 2001 and has been prepared
About this report
Contents Business Review04 Financial Highlights
05 Non Financial Performance
06 Chairman's and Acting Chief Executive's Message
08 Management Discussion and Analysis
Ensuring our sustainability30 Risk and Capital Management Report
54 Corporate Governance Report
81 Sustainability Report
84 Statement of Compliance
Annual financial statements88 Statement of management's responsibility for
financial reporting
89 Statement of directors' responsibilities in respect of the financial statements
90 Secretary's certificate
91 Auditors' Report
94 Statement of Financial Position
95 Statement of profit or loss and other comprehensive income
96 Statement of Cash Flows
97 Statement of Changes in Equity
98 Notes to and forming part of the Financial Statements
1STANDARD BANK (MAURITIUS) LIMITED Annual report 20203

04 Financial Highlights
05Non-Financial Performance
06 Chairman's and Acting Chief Executive's Message
08 Management Discussion and Analysis
BUSINESS REVIEW
BUSINESS REVIEW 3STANDARD BANK (MAURITIUS) LIMITED Annual report 20202

The Bank, a wholly owned subsidiary of Standard Bank Group, distinguishes itself from the fiercely competitive banking landscape in Mauritius by focusing on global corporations with operations across the African continent, as well as African corporations that operate on the continent and offshore.
Our footprint across 20 countries in Africa, combined with our expertise of the Mauritian jurisdiction and extensive global network, puts us in the unique position to support corporations in their ambitious African strategies. The extensive knowledge
we have of our markets, gained through our on-the-ground presence, and our deep understanding of our clients’ businesses allows us to continuously assess and define opportunity, country, sector and client risk. This enables us to respond quickly and appropriately to changes in our operating context. We remain focused on key sectors where we have a deep sector-specific knowledge and expertise, while sufficiently diversified across geographies and markets to reduce our exposure to risk and show resilience in the face of an ever-changing operating environment.
About Standard Bank Mauritius
Financial Highlights
Non-Financial Performance
KPI
Our new brand positioning
Sponsorships Sponsorships are an opportunity to support causes and organisations that Standard Bank believes in and that align with our values. They also provide us with a platform through which to engage with our stakeholders. They are essential to building our brand and creating relevance in the markets in which we operate.
Given the exceptional context in 2020, with the Covid-19 pandemic having resulted in many events being cancelled or postponed, Standard Bank Mauritius sponsored a single event last year. The Bank was the title sponsor of the Royal Raid Special Edition 2020, which took place in November 2020. The Standard Bank Royal Raid was the first trail ever to be organised in Mauritius and remains one of the most popular trail-running events on the island. It epitomises all the qualities that Standard Bank stands for: hard work, dedication, endurance and the desire to succeed.
In 2020, Standard Bank Mauritius unveiled a refreshed slogan with our new brand promise being 'Finding New Ways to Make Dreams Possible' with our new brand slogan being 'It Can Be'.
These reinforced the Bank’s strategic positioning as the ideal partner for clients wishing to establish or expand a presence in Africa from Mauritius. They are intended to communicate our confidence in Africa’s future and the possibilities that exist on the continent, while also showcasing Standard Bank’s client-centric and inventive solutions. ‘It Can Be’ reflects Standard Bank’s efforts to put our clients at the centre of everything we do, invest in new digital capabilities and new skills for our employees and find new ways to make our client’s dreams possible.
Dec-20 USD’000
Dec-19USD’000
Dec-18USD’000
Earnings attributable to shareholder 7,481 22,254 25,573
Statement of Financial Position
Gross Loans to Customers 206,349 235,128 232,248
Total Assets 1,750,166 1,446,356 1,587,170
Total Deposits 1,604,722 1,299,500 1,422,348
Shareholder’s Funds 129,750 127,857 115,791
Common Equity Tier 1 / Tier 1 Capital before regulatory adjustment 112,980 109,241 97,524
Risk weighted assets 350,753 422,285 380,950
Performance Ratios (%)
Return on average total assets 0.5% 1.5% 1.8%
Return on average equity 5.8% 18.3% 24.7%
Return on average Tier I Capital 6.7% 21.5% 30.3%
Cost to Income Ratio 48.3% 39.7% 39.4%
Non interest income to total income 34.6% 30.8% 39.5%
Loan to Deposit Ratio 13.7% 19.8% 16.0%
Capital Adequacy Ratio
Common Equity Tier 1 / Tier 1 Capital Ratio 32.2% 25.9% 24.1%
Capital to risk weighted assets 33.0% 26.1% 25.0%
Asset Quality
Non-performing loans (NPL) 22,442 21,909 812
NPL Ratio (%) 9.3% 9.3% 0.4%
Allowance for loan impairment losses 18,331 8,479 4,286
Credit loss ratio (CLR) 3.8% 1.9% 1.0%
Number of employees 127 134 136
Regulatory minimum 12.5% was revised to 11.875% following amendment in Guideline on scope of application in May 2020.
0
5%
10%
15%
20%
25%
30%
0
5,000
10,000
15,000
20,000
2018 2019 2020
Earnings attributable to shareholder
Earnings ROE
Return of Equity
5.8%
Cost to income
48.3%
Diversity Score
46%
No. of hours training delivered
1,426
PAT
USD 7.5m
Deposits
USD 1.6bn
BUSINESS REVIEW FINANCIAL HIGHLIGHTS 5STANDARD BANK (MAURITIUS) LIMITED Annual report 20204

Chairman's and Acting Chief Executive’s Message
Dear Shareholder,
It gives us great pleasure on behalf of the Board of Directors to present Standard Bank (Mauritius) Limited’s Annual Report for the financial year ended 31 December 2020.
Covid–19Similar to the rest of the world, Mauritius had to go through strict lockdown, whereby the economic life of the country came to a standstill. Governments across the world have implemented a variety of fiscal measures to minimise business impact, preventing retrenchments, expanding social assistance, injecting equity into businesses. The Bank of Mauritius and the Mauritian Government undertook swift action to help contain the pandemic and limit the damage on the Mauritian economy by introducing several monetary and fiscal measures.
We are very pleased and commend Management on the way the Bank quickly reacted to the challenges that Covid-19 brought along. As the country went into lockdown on 20th March 2020, the Bank reacted swiftly to enable Work from Home (WFH) arrangements, with the main objective to keep the workforce safe while ensuring client service was not impacted. Within a week, a 100% WFH workforce was enabled with amended processes to ensure continuous management of risks. A crisis committee was set up and met daily online to stay connected with each other and support our employees and clients during this difficult time. Our staff remained resilient and were able to ensure seamless continuity of service to our clients remotely, with no incidents to report.
Our overall performanceThe events unfolding in 2020 were unprecedented in that Covid-19 impacted the whole world which triggered a worsening of the global economic environment. The effects of which are expected to linger over the next few years before any expectations of a full recovery. With a view to counter the slowdown in their economies, most countries embarked on a reduction of their benchmark rates, with almost all rates for the major currencies converging towards zero. This turn of events as well as the slowdown in business activity has undermined our financial objectives assumptions and led our financial performance to underperform against the goals set. Our operating income witnessed a decrease across all revenue lines primarily due to the impact of the declining interest rate environment and margin contraction. Our Balance Sheet, however, remained strong with our deposit base not impacted by these unforeseen circumstances which has led to an outperformance of 6.1% against our deposit targets. As a result of the prevailing economic conditions, one of our existing non-performing asset indicated further signs of distress and required that we adopt a prudent approach to credit risk by increasing the level of credit impairment charges by USD8.5m. This along with the difficult operating environment has adversely impacted our financial performance, with profit after tax closing at USD7.5m (-66.4% against prior year).
Transforming our organisation for long-term growthOur strategy of driving Africa’s growth remains unchanged. However, to win in this digital age, we recognise the need to have a deep understanding of our customers, otherwise we risk losing the attention of our customers as they migrate away from traditional financial services. As such, the Bank has been gearing up to be a Future Ready platform business implying that we will understand each client better and offer them far more than just financial products and services. We will aim to provide complete solutions, and increasingly rely on trusted partner organisations in our ecosystems. The Bank also embarked on a people’s promise journey, which is the Bank’s commitment to create a better work environment where people can give the best of themselves.
The Board of the Standard Bank (Mauritius) Limited is pleased to present its eighteenth Annual Report for the year ended 31 December 2020.
Our five key value drivers We continued to focus on our five key value drivers which we consider essential to remain relevant in our markets:
Client focusAs a Bank, we are committed to deliver exceptional client service. Being client-centric is one of our key focus areas following customers’ expectations of quality, speed, convenience and security. Demand for value has been intensifying in the banking industry, with customers’ ability to negotiate pricing and quality of service as banks and financial institutions competing among themselves to offer better customer experience and digital channels for service delivery.
Brilliant Basics has enabled the Bank to meet the client promise in terms of value, consistent quality customer service and security across channels and putting the clients at the centre of everything we do. We will continue to strive to better understand and serve our clients.
Employee engagementThe Bank is indebted to its employees who have shown great resilience in this difficult year and who have strived to assist and advise our customers and support the communities amidst the challenges and virus threats. Our focus remains on upskilling our people to deliver on our transformation into the digital world. Throughout 2020, a number of initiatives were undertaken to prepare our teams for our Future-Ready transformation.
Risk and ConductThe Bank’s risk management approach provides for a consistent and effective management of risk through appropriate accountability and oversight structures. In this rapidly changing world, it is crucial that we equip ourselves with the necessary knowledge and skills to effectively recognise and manage the risks faced not only by the Bank but our customers as well in a timely manner. This year the Bank re-assessed the risks arising out of the ‘new ways of work’ and realigned processes and controls accordingly. We also worked out several stress scenarios which we believe could threaten the organisation and this was factored as part of the bank’s stress testing and recovery and resolution planning process.
Our Social, Economic and Environmental (SEE) impact Our Corporate Social Responsibility approach remained focused on three core areas, namely, education, environment and health. Education remains one of the most important drivers of growth and sustainable development. We continued our scholarship scheme for the University of Mauritius, internships and development opportunities to new graduates to equip them with the skills required to thrive in the workplace. We also partnered effectively with the Mauritius Wildlife Foundation on various key projects and assisted them in mitigating the impact of the Wakashio oil spill in our lagoons, on endangered species. Finally, we contributed to the Covid-19 Solidarity Fund, which was set up by the Government to provide support to the population and the community at large who have been affected by the Covid-19 pandemic.
Looking aheadWe expect in 2021 for the economy to rebound, underpinned by the wider use of the vaccine, though we expect a slowdown in recovery across the African jurisdictions, on account of renewed restrictions. Our immediate priority is to manage uncertainties prevailing from a potential resurgence of a new wave of infection, by continuously supporting our clients and facilitating business as they recover, rebuild and explore new opportunities. In such a fast-changing environment, we will need to adapt quickly to evolving risks and optimise our resource allocation. We acknowledge it will take a while to revert back to prior year headline earnings levels and we remain steadfast in growing our Balance Sheet.
AcknowledgementsThe Bank’s Chief Executive, Lakshman Bheenick, resigned from the Bank on 30 November 2020. We thank him for his contribution and commitment over the past ten years in driving the Bank’s strategy. On behalf of the Board members, we wish him all the very best for the future.
The Board of Directors has been actively involved in identifying and appointing a replacement for Lakshman Bheenick since early December and hopes to make an appointment in this regard shortly. In the meantime, the Board has appointed Mrs. Michele Ah See, Executive Director, to stand in as Acting Chief Executive in the interim.
We are grateful to our Board of Directors for their guidance. We thank our clients, regulators, management, business partners and shareholders for their ongoing support to the Bank and remain positive and confident about 2021 as we adapt and enter a post Covid-19 environment.
Michele Ah See Acting Chief Executive
Duncan Westcott Chairman
Financial OutcomeOur results are reflective of the unforeseen events which unfolded in 2020, with the business bearing the brunt of reduced activities. However, our Balance Sheet remained resilient. Some key reporting metrics are as follows:-
• Headline Earnings • Customer Deposits • Gross Customer Loans
: USD7.5m – (2019: USD22.3m): USD1.5bn – (2019: USD1.2bn): USD206.3m – (2019: USD235.1m)
Michele Ah SeeActing Chief Executive
Duncan WestcottChairman 17 March 2021
BUSINESS REVIEW CHAIRMAN'S AND ACTING CHIEF EXECUTIVE'S MESSAGE 7STANDARD BANK (MAURITIUS) LIMITED Annual report 20206

Management Discussion and Analysis Strategy Standard Bank Mauritius positions itself as the go-to financial partner for clients wishing to establish or strengthen their African presence via the Mauritius International Financial Centre and to benefit our Group’s extensive coverage, expertise and integrated financial services offer across the continent.
We place our clients at the centre of everything we do and in so doing the Bank entered into a future-ready transformation journey, which is a further evolution and acceleration of the Bank’s strategy. This is important in order to remain relevant and profitable to our stakeholders. This year our short-term objectives were as follows:
Five strategic value drivers have been defined to help focus our efforts and measure our progress on delivering our strategy. Standard Bank Mauritius uses these value drivers to evaluate our performance at every level, from how our bank is performing overall to assessing the progress of individual teams and their team members.
The Bank has three strategic focus points which are core in achieving its commercial goals. These focus areas and related strategic priorities have been cascaded to each of our business
lines and corporate functions for execution.
We remain committed to our Group purpose which is “Africa is our home;
we drive her growth”.
Our Group vision is to be the leading financial services organisation
in, for and across Africa, delivering exceptional client experiences and
superior value.
Deliver exceptional client experiences.
Transform into an integrated, platform-based financial services organisation that delivers complete solutions to our clients.
Leveraging digital to improve how we meet our clients’ and employees’ needs / deliver secure, personalised and relevant experiences to our clients and employees.
Client Centricity Digitalisation Integration and collaboration
New Group architecture standards
In 2019, Standard Bank Group communicated a new Group operational architecture to support the delivery of our strategy and the structural blueprint was released in 2020 for implementation.
The objective is to improve collaboration and ensuing that teams work seamlessly together, enabled by our ongoing digitalisation, in order to anticipate and meet our clients’ changing needs. Aligned to this, we continue to invest in Standard Bank’s human capital to future-proof our people's skillsets as evidenced by our People's Promise.
This will enable our move towards becoming an integrated financial services organisation and enabling our adoption of digital platforms.
1 Adopting the new Group architecture framework across each of our teams, allowing them to become more agile and work seamlessly together, in order to transform the Bank into an integrated financial services organisation.
3 Accelerate our speed of execution and operational excellence and continue to offer clients relevant, targeted products across an increasing range of channels.
4 Continue to improve the quality of our digital offerings by streamlining existing processes, leveraging data and analytics to personalise our offerings and delivering new products and services that improve the user experience for our clients and employees.
2 Continue to pursue a Bank-wide client acquisition strategy in partnership with Standard Bank affiliates throughout the African continent. The strategy targeted existing Group clients with a potential need for an offshore presence in the Mauritius International Financial Centre, to enable them to invest in African markets. The aim is to diversify our portfolio across sectors, geographies and ecosystems, minimising our concentration risks, while leveraging the Standard Bank Group’s Africa-wide presence, sector-specific contacts and integrated delivery capabilities.
Providing services, solutions and opportunities that our clients and employees need to achieve growth, prosperity and fulfilment.
Serving clients predominantly online, processing in the cloud, embracing open innovation underpinned by data and insights.
In the medium term, we aim to become…
TRULY HUMAN
TRULY DIGITAL
SEE: Social, Economic and Environmental
CLIENT FOCUS
RISK AND CONDUCT
SEE IMPACT
EMPLOYEE ENGAGEMENT
FINANCIAL OUTCOME
CLIENT FOCUS
EMPLOYEE ENGAGEMENT
RISK AND CONDUCT
FINANCIAL OUTCOME
SOCIAL, ECONOMIC AND ENVIRONMENTAL IMPACT
By placing the client at the heart of everything we do, we ensure the continued relevance and sustainability of our organisation.
Our biggest asset is our people. Our organisation’s growth is directly correlated to the wellbeing and engagement of our team members.
Supporting our clients by doing business the right way, in compliance with relevant laws and regulations.
Creating value for our shareholders, as measured by our financial outcomes.
Creating and maintaining shared value by contributing to the social, economic and environmental wellbeing of the communities in which we operate.
The impact of Covid-19 on our strategy
• On 11 March 2020, the World Health Organisation declared a global pandemic arising from the outbreak of Covid-19. This has required us to adopt new practices and to prioritise certain activities, it has notably speeded up our digitalisation processes both client-facing and internally and initiated new ways of working. Refer to p. 15 for information about our Covid-19 response.
BUSINESS REVIEW MANAGEMENT DISCUSSION AND ANALYSIS 9STANDARD BANK (MAURITIUS) LIMITED Annual report 20208

Operating Environment
Major market trends Impact on our business How we are responding Link to main risks
Link to strategic
objectives
Covid-19 pandemic and global economic slowdown The 2020 financial year was dominated by the outbreak of the Covid-19 pandemic, resulting in lockdowns worldwide. Global economic performance remained under the spell of uncertainty. As a result, a global contraction of 3.5% is forecasted in growth worldwide (IMF).
Mauritius was locked down for three months with a phased reopening of our borders to prevent further transmission of the Covid-19 virus. Government had to put various measures in place to prevent widespread bankruptcies, to maintain employment levels, guaranteeing credit and injecting funds into core sectors of the economy. As a result a 15.2% GDP contraction is forecasted for 2020.
The pandemic brought certain sectors, namely tourism and textiles, largest purveyors of foreign currencies to a standstill. This created a shortage in foreign currencies and an 11% drop in the value of the Mauritian Rupee against the US Dollar was noted since December 2019. The Bank of Mauritius (BoM) intervened in a sustained manner since March 2020 to contain volatility in the local currency pair and ensure stability in foreign exchange liquidity in the domestic market. This is expected to persist over 2021.
The Key Repo Rate (KRR) was cut by 100 basis points to 1.85% on 16 April 2020 and has remained flat ever since. The Bank of Mauritius has ensured that there is enough liquidity in the banking system to support impacted economic operators.
Overall, Standard Bank witnessed a decline in trade finance transactions due to the impact of the Covid-19 pandemic and worldwide lockdowns. On the other hand, the deposit base has not been adversely impacted during Covid-19 and has actually grown by 24.2%, in view of the conservative stance taken by the depositors to park their funds.
The Bank’s portfolio is relatively diversified with a focus on the global business sector. Covid-19 had a mixed impact on our clients, with some sectors being more exposed than others, whilst other sectors (such as pharmaceuticals and mining) were not adversely impacted by the pandemic.
The Bank has limited exposure to Mauritian corporates/sectors that were hard-hit by the pandemic, such as tourism. As a result, the Bank was not substantially impacted by BoM measures concerning the local economy.
The Bank swiftly began monitoring and managing its liquidity and credit position.
We reached out to existing clients during the lockdown to ensure that we could anticipate their needs and provide the right support at a difficult time for many businesses.
We continued to accelerate our speed of execution and operational excellence to offer clients relevant, targeted products across a range of channels.
We diversified our business through the client acquisition plan, in partnership with the Group targeting existing and new opportunities.
Liquidity and Credit Risk
Risk and Conduct
Client Centricity
Client Centricity
Client Centricity
Major market trends Impact on our business How we are responding Link to main risks
Link to strategic
objectives
The Bank of Mauritius has implemented several measures encompassing monetary, liquidity and quantitative easing to support the local economy during the pandemic, including:
• Reducing the Cash Reserve Ratio applicable to banks from 9% to 8% to support banks to further assist businesses directly impacted by Covid-19.
• Putting on hold the Guideline on Credit Impairment Measurement and Income Recognition, to allow banks to continue supporting enterprises facing cash flow and working capital difficulties in the context of Covid-19.
• A transitional arrangement for the regulatory capital treatment of IFRS 9 provisions was introduced. The aim is to alleviate the impact of Covid-19 on the provisioning levels of banks. The transitional arrangements will allow banks to add back a portion of their IFRS 9 provisions to their regulatory capital. These arrangements, will start as from Year 2021, and will phase out over a 4-year period.
• The capital conservation buffer was reviewed and its increase to 2.5% was deferred to 1st Jan 2021 such that banks will be allowed to maintain a capital conservation of 1.875% until 31st Dec 2020.
• Advising Banks to refrain from paying dividends or making other transfers from profit until the end of 2020.
The amount released through this cut was held in a special account at the Bank of Mauritius to allow banks to use these particular balances for any facility to be granted to any impacted economic operator.
The Bank applied its IFRS 9 methodology to assess the credit viability of its exposures and as a result an uplift in the level of credit provisioning was noted.
The Bank proactively managed its credit risk through various initiatives taken and onboarded the required level of credit provisioning in line with IFRS 9.
No major impact.
As the Bank was not involved on the local market, these funds have not been used in the granting of any facility to any impacted economic operator.
The impact of Covid-19 on our IFRS 9 impairment assessment was factored in, following an ongoing re-rating exercise being performed during the year.
The Bank has elected not to apply the transitional arrangement.
The Bank adopted the revised capital conservation buffer.
Liquidity Risk
Credit Risk
Credit Risk
Risk and Conduct
Risk and Conduct
Risk and Conduct
BUSINESS REVIEW MANAGEMENT DISCUSSION AND ANALYSIS CONTINUED 11STANDARD BANK (MAURITIUS) LIMITED Annual report 202010
Major market trends Impact on our business How we are responding Link to main risks
Link to strategic
objectives
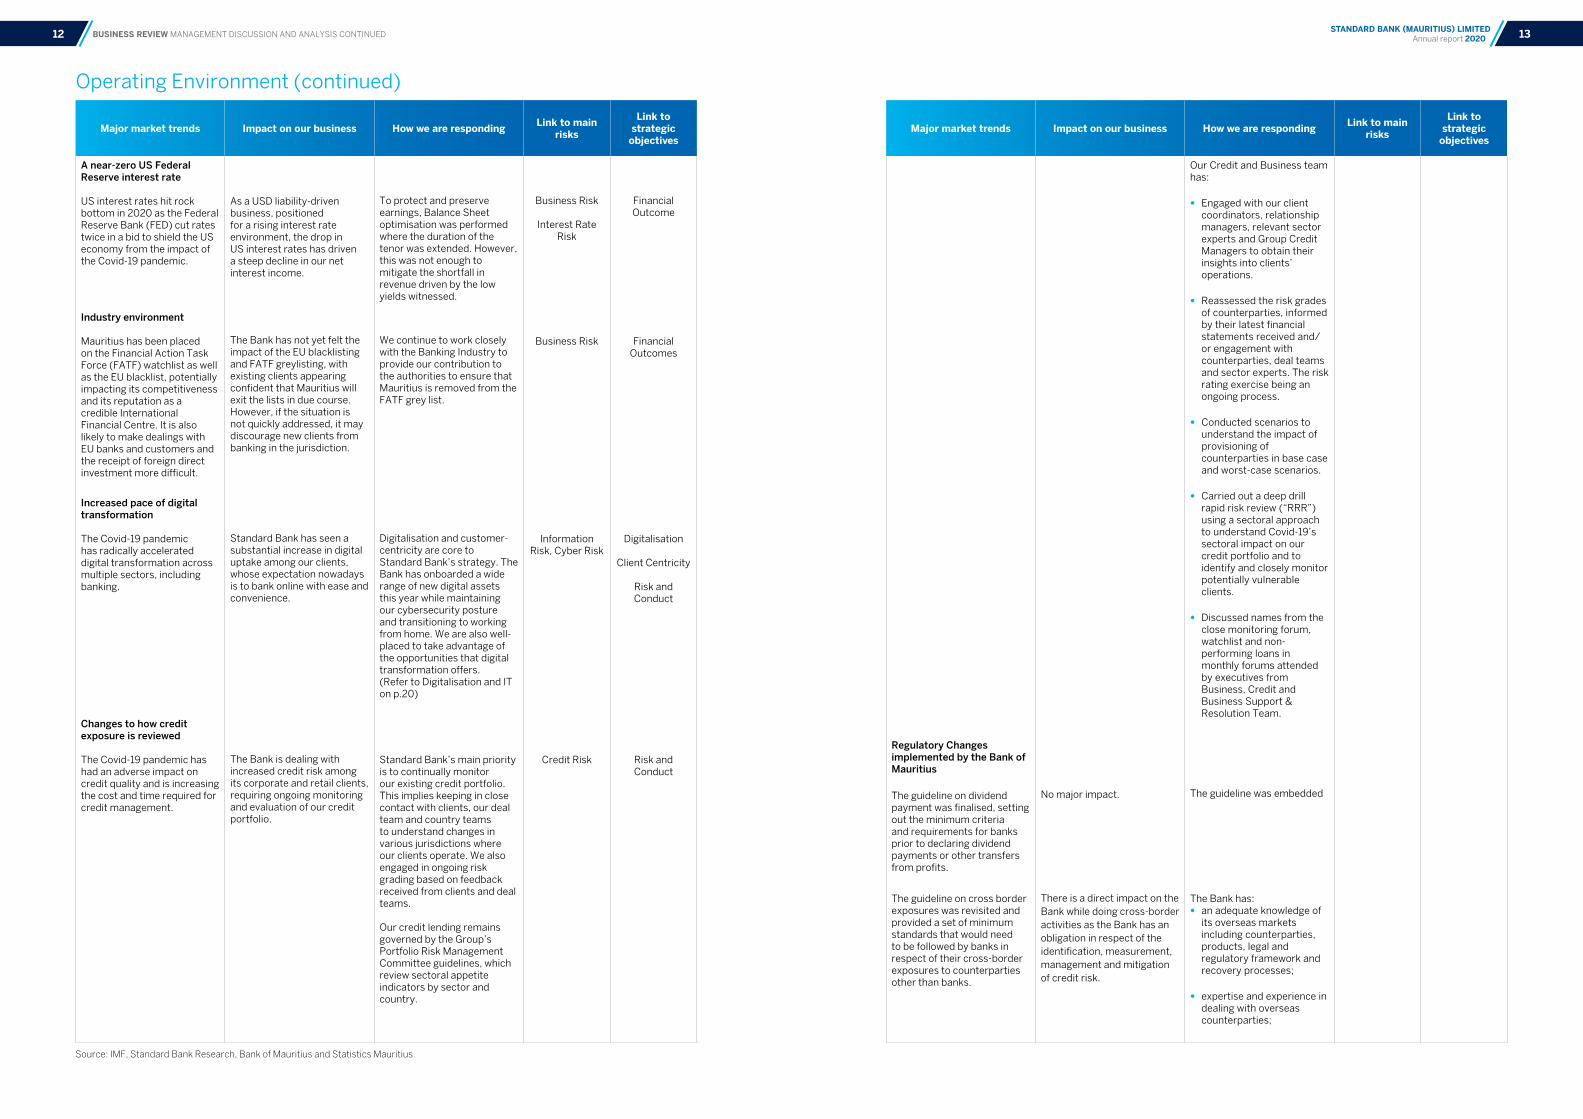
A near-zero US Federal Reserve interest rate
US interest rates hit rock bottom in 2020 as the Federal Reserve Bank (FED) cut rates twice in a bid to shield the US economy from the impact of the Covid-19 pandemic.
As a USD liability-driven business, positioned for a rising interest rate environment, the drop in US interest rates has driven a steep decline in our net interest income.
To protect and preserve earnings, Balance Sheet optimisation was performed where the duration of the tenor was extended. However, this was not enough to mitigate the shortfall in revenue driven by the low yields witnessed.
Business Risk
Interest Rate Risk
Financial Outcome
Industry environment Mauritius has been placed on the Financial Action Task Force (FATF) watchlist as well as the EU blacklist, potentially impacting its competitiveness and its reputation as a credible International Financial Centre. It is also likely to make dealings with EU banks and customers and the receipt of foreign direct investment more difficult.
The Bank has not yet felt the impact of the EU blacklisting and FATF greylisting, with existing clients appearing confident that Mauritius will exit the lists in due course. However, if the situation is not quickly addressed, it may discourage new clients from banking in the jurisdiction.
We continue to work closely with the Banking Industry to provide our contribution to the authorities to ensure that Mauritius is removed from the FATF grey list.
Business Risk Financial Outcomes
Increased pace of digital transformation
The Covid-19 pandemic has radically accelerated digital transformation across multiple sectors, including banking.
Standard Bank has seen a substantial increase in digital uptake among our clients, whose expectation nowadays is to bank online with ease and convenience.
Digitalisation and customer-centricity are core to Standard Bank’s strategy. The Bank has onboarded a wide range of new digital assets this year while maintaining our cybersecurity posture and transitioning to working from home. We are also well-placed to take advantage of the opportunities that digital transformation offers.(Refer to Digitalisation and IT on p.20)
Information Risk, Cyber Risk
Digitalisation
Client Centricity
Risk and Conduct
Changes to how credit exposure is reviewed
The Covid-19 pandemic has had an adverse impact on credit quality and is increasing the cost and time required for credit management.
The Bank is dealing with increased credit risk among its corporate and retail clients, requiring ongoing monitoring and evaluation of our credit portfolio.
Standard Bank’s main priority is to continually monitor our existing credit portfolio. This implies keeping in close contact with clients, our deal team and country teams to understand changes in various jurisdictions where our clients operate. We also engaged in ongoing risk grading based on feedback received from clients and deal teams.
Our credit lending remains governed by the Group’s Portfolio Risk Management Committee guidelines, which review sectoral appetite indicators by sector and country.
Credit Risk Risk and Conduct
Major market trends Impact on our business How we are responding Link to main risks
Link to strategic
objectives
Our Credit and Business team has:
• Engaged with our client coordinators, relationship managers, relevant sector experts and Group Credit Managers to obtain their insights into clients’ operations.
• Reassessed the risk grades of counterparties, informed by their latest financial statements received and/or engagement with counterparties, deal teams and sector experts. The risk rating exercise being an ongoing process.
• Conducted scenarios to understand the impact of provisioning of counterparties in base case and worst-case scenarios.
• Carried out a deep drill rapid risk review (“RRR”) using a sectoral approach to understand Covid-19’s sectoral impact on our credit portfolio and to identify and closely monitor potentially vulnerable clients.
• Discussed names from the close monitoring forum, watchlist and non-performing loans in monthly forums attended by executives from Business, Credit and Business Support & Resolution Team.
Regulatory Changes implemented by the Bank of Mauritius
The guideline on dividend payment was finalised, setting out the minimum criteria and requirements for banks prior to declaring dividend payments or other transfers from profits.
The guideline on cross border exposures was revisited and provided a set of minimum standards that would need to be followed by banks in respect of their cross-border exposures to counterparties other than banks.
No major impact.
There is a direct impact on the Bank while doing cross-border activities as the Bank has an obligation in respect of the identification, measurement, management and mitigation of credit risk.
The guideline was embedded
The Bank has: • an adequate knowledge of
its overseas markets including counterparties, products, legal and regulatory framework and recovery processes;
• expertise and experience in dealing with overseas counterparties;
Source: IMF, Standard Bank Research, Bank of Mauritius and Statistics Mauritius
BUSINESS REVIEW MANAGEMENT DISCUSSION AND ANALYSIS CONTINUED
Operating Environment (continued)
13STANDARD BANK (MAURITIUS) LIMITED Annual report 202012
Major market trends Impact on our business How we are responding Link to main risks
Link to strategic
objectives
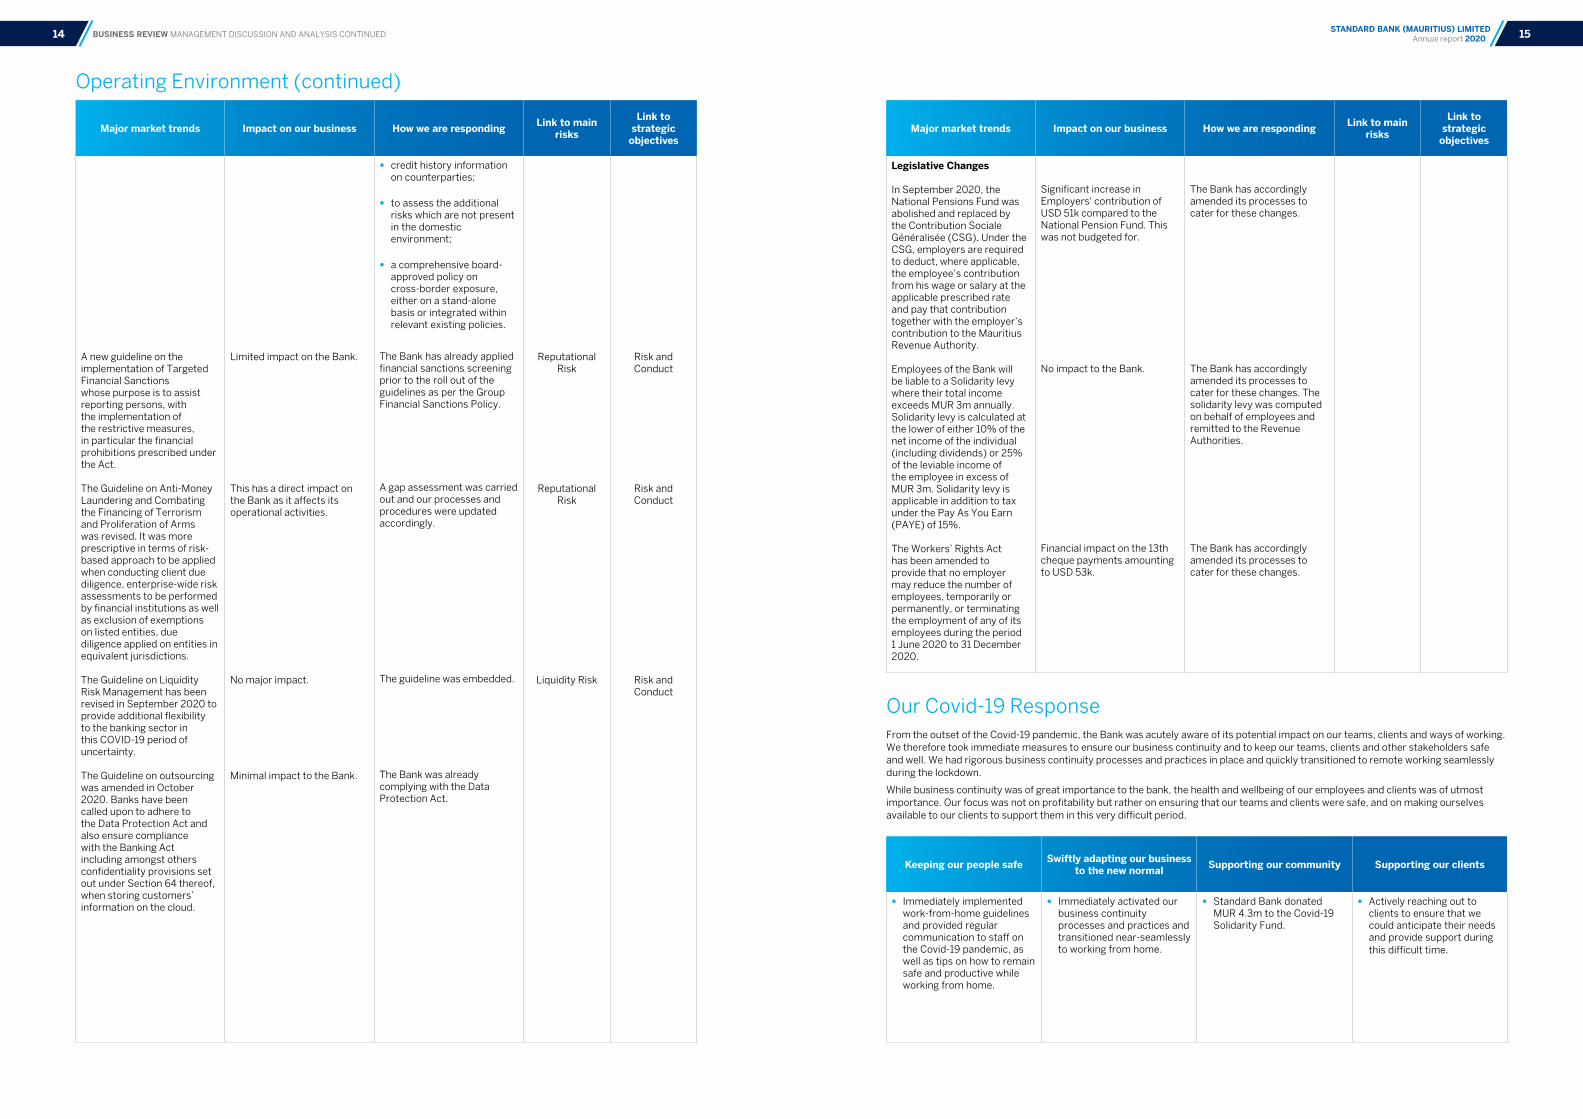
A new guideline on the implementation of Targeted Financial Sanctions whose purpose is to assist reporting persons, with the implementation of the restrictive measures, in particular the financial prohibitions prescribed under the Act.
The Guideline on Anti-Money Laundering and Combating the Financing of Terrorism and Proliferation of Arms was revised. It was more prescriptive in terms of risk-based approach to be applied when conducting client due diligence, enterprise-wide risk assessments to be performed by financial institutions as well as exclusion of exemptions on listed entities, due diligence applied on entities in equivalent jurisdictions.
The Guideline on Liquidity Risk Management has been revised in September 2020 to provide additional flexibility to the banking sector in this COVID-19 period of uncertainty.
The Guideline on outsourcing was amended in October 2020. Banks have been called upon to adhere to the Data Protection Act and also ensure compliance with the Banking Act including amongst others confidentiality provisions set out under Section 64 thereof, when storing customers’ information on the cloud.
Limited impact on the Bank.
This has a direct impact on the Bank as it affects its operational activities.
No major impact.
Minimal impact to the Bank.
• credit history information on counterparties;
• to assess the additional risks which are not present in the domestic environment;
• a comprehensive board-approved policy on cross-border exposure, either on a stand-alone basis or integrated within relevant existing policies.
The Bank has already applied financial sanctions screening prior to the roll out of the guidelines as per the Group Financial Sanctions Policy.
A gap assessment was carried out and our processes and procedures were updated accordingly.
The guideline was embedded.
The Bank was already complying with the Data Protection Act.
Reputational Risk
Reputational Risk
Liquidity Risk
Risk and Conduct
Risk and Conduct
Risk and Conduct
Major market trends Impact on our business How we are responding Link to main risks
Link to strategic
objectives
Legislative Changes
In September 2020, the National Pensions Fund was abolished and replaced by the Contribution Sociale Généralisée (CSG). Under the CSG, employers are required to deduct, where applicable, the employee’s contribution from his wage or salary at the applicable prescribed rate and pay that contribution together with the employer’s contribution to the Mauritius Revenue Authority.
Employees of the Bank will be liable to a Solidarity levy where their total income exceeds MUR 3m annually. Solidarity levy is calculated at the lower of either 10% of the net income of the individual (including dividends) or 25% of the leviable income of the employee in excess of MUR 3m. Solidarity levy is applicable in addition to tax under the Pay As You Earn (PAYE) of 15%.
The Workers’ Rights Act has been amended to provide that no employer may reduce the number of employees, temporarily or permanently, or terminating the employment of any of its employees during the period 1 June 2020 to 31 December 2020.
Significant increase in Employers' contribution of USD 51k compared to the National Pension Fund. This was not budgeted for.
No impact to the Bank.
Financial impact on the 13th cheque payments amounting to USD 53k.
The Bank has accordingly amended its processes to cater for these changes.
The Bank has accordingly amended its processes to cater for these changes. The solidarity levy was computed on behalf of employees and remitted to the Revenue Authorities.
The Bank has accordingly amended its processes to cater for these changes.
Keeping our people safe Swiftly adapting our business to the new normal Supporting our community Supporting our clients
• Immediately implemented work-from-home guidelines and provided regular communication to staff on the Covid-19 pandemic, as well as tips on how to remain safe and productive while working from home.
• Immediately activated our business continuity processes and practices and transitioned near-seamlessly to working from home.
• Standard Bank donated MUR 4.3m to the Covid-19 Solidarity Fund.
• Actively reaching out to clients to ensure that we could anticipate their needs and provide support during this difficult time.
Our Covid-19 Response From the outset of the Covid-19 pandemic, the Bank was acutely aware of its potential impact on our teams, clients and ways of working. We therefore took immediate measures to ensure our business continuity and to keep our teams, clients and other stakeholders safe and well. We had rigorous business continuity processes and practices in place and quickly transitioned to remote working seamlessly during the lockdown.
While business continuity was of great importance to the bank, the health and wellbeing of our employees and clients was of utmost importance. Our focus was not on profitability but rather on ensuring that our teams and clients were safe, and on making ourselves available to our clients to support them in this very difficult period.
BUSINESS REVIEW MANAGEMENT DISCUSSION AND ANALYSIS CONTINUED
Operating Environment (continued)
15STANDARD BANK (MAURITIUS) LIMITED Annual report 202014
Keeping our people safe Swiftly adapting our business to the new normal Supporting our community Supporting our clients
• During the first few weeks of the lockdown, the security of our staff was of prime importance and we supported our staff by supplying food hampers delivered by our transport partner to their homes.
• During the lockdown, we enforced personal sanitary and social distancing guidelines including mandatory mask wearing, temperature-taking prior to staff entering the workspace, hand sanitisers provided as well as gloves (where needed), etc. We also implemented a wide range of cleaning and hygiene protocols measures to minimise the risks of the virus transmission.
• With the end of the lockdown, we implemented a phased in approach to returning to normal operations to ensure everyone’s safety, with reinforced hygiene, cleaning, sanitary and social distancing protocols remaining in place at all times.
• Throughout the Covid-19 lockdown, the Human Capital team stayed very close to staff, facilitating a number of programmes to ensure employee engagement and wellbeing.
• Adopted remote tools and new protocols including the Microsoft Office 365 suite to facilitate business continuity while working from home during lockdown. (Refer to Digitalisation and IT on p.20)
• Continued to provide clients with all the products and services we offer under normal conditions (except where it required physical despatch of documents as all courier services were suspended).
• Swift mobilisation of the Credit and Business team to monitoring existing credit portfolio on an ongoing basis, keeping in close contact with clients, deal teams and country teams.
• Provided the Mauritian Government with continued support to ensure a sustained effort to contain Covid-19 and protect the most vulnerable within our society.
• We also encouraged our staff to volunteer in the fight against Covid-19 and contribute generously to the Covid-19 Solidarity Fund.
• Rapid deployment of new digital platforms and processes to provide clients with convenient new services, available remotely. (Refer to Digitalisation and IT on p.20)
• In line with our wider client acquisition strategy, we pursued our client acquisition plan to target new clients with a potential need for a presence in Mauritius.
Priorities/objectives for 2020
Delivery on strategic
objectives2020 Performance Outlook and priorities for 2021
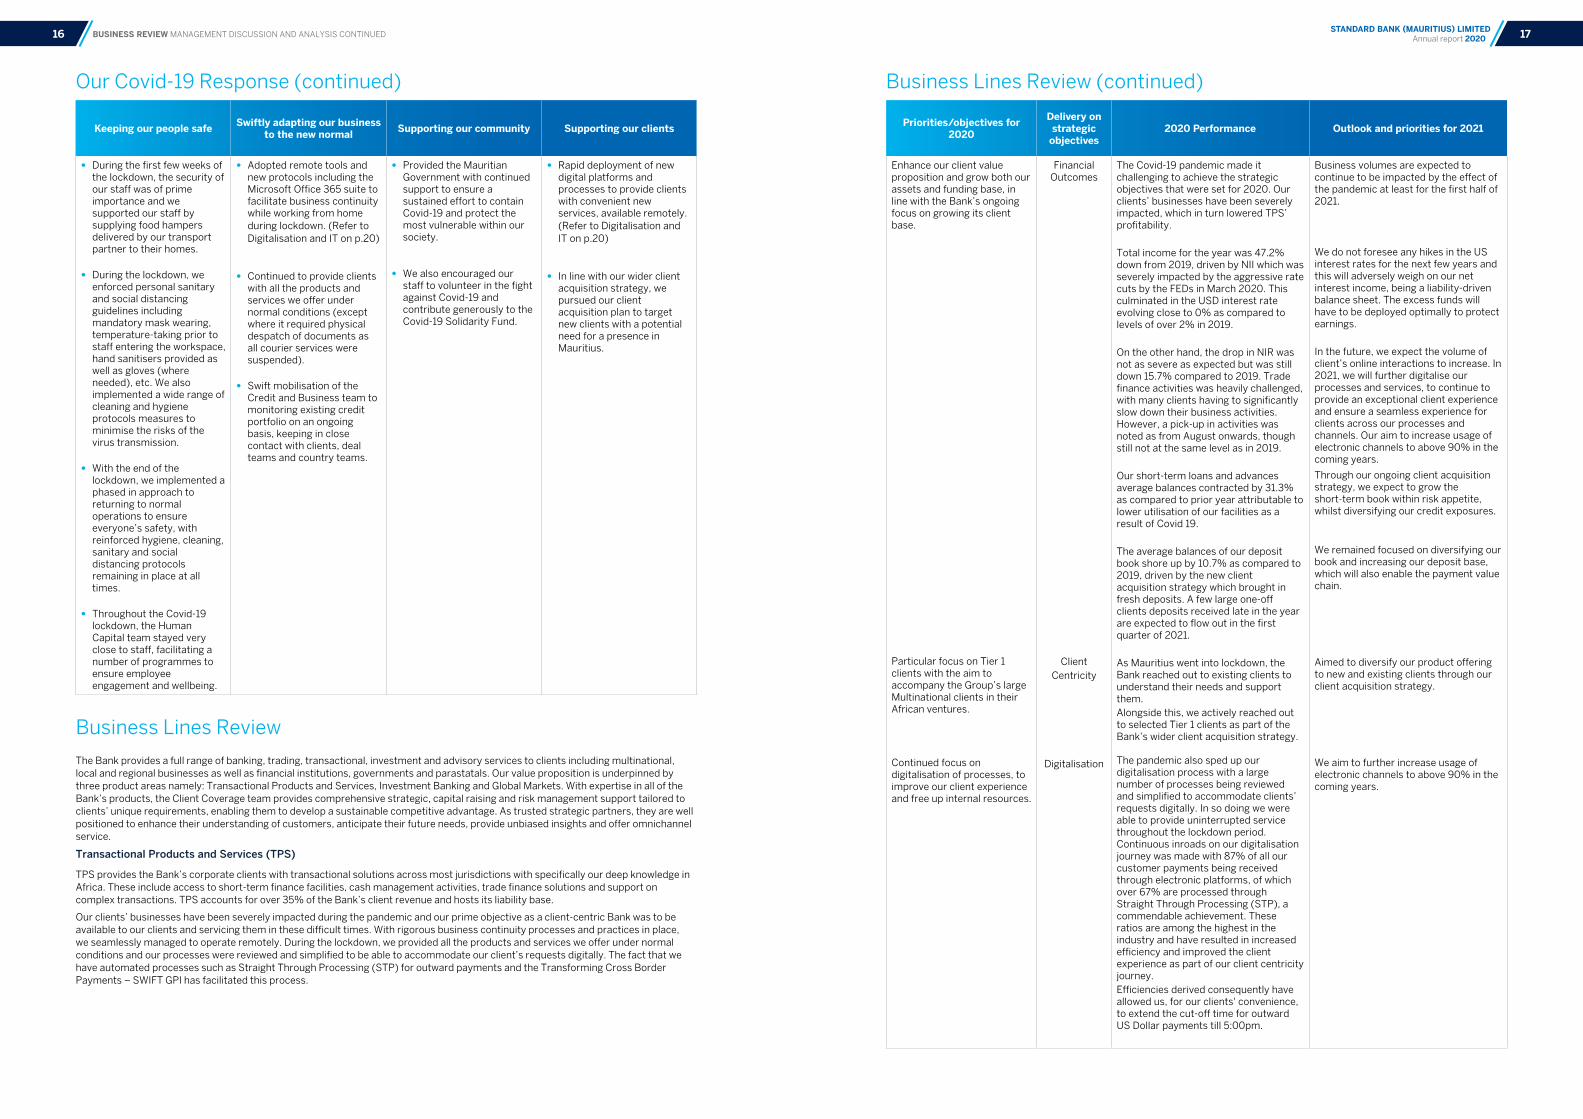
Enhance our client value proposition and grow both our assets and funding base, in line with the Bank’s ongoing focus on growing its client base.
Particular focus on Tier 1 clients with the aim to accompany the Group’s large Multinational clients in their African ventures.
Continued focus on digitalisation of processes, to improve our client experience and free up internal resources.
Financial Outcomes
Client
Centricity
Digitalisation
The Covid-19 pandemic made it challenging to achieve the strategic objectives that were set for 2020. Our clients’ businesses have been severely impacted, which in turn lowered TPS’ profitability.
Total income for the year was 47.2% down from 2019, driven by NII which was severely impacted by the aggressive rate cuts by the FEDs in March 2020. This culminated in the USD interest rate evolving close to 0% as compared to levels of over 2% in 2019.
On the other hand, the drop in NIR was not as severe as expected but was still down 15.7% compared to 2019. Trade finance activities was heavily challenged, with many clients having to significantly slow down their business activities. However, a pick-up in activities was noted as from August onwards, though still not at the same level as in 2019.
Our short-term loans and advances average balances contracted by 31.3% as compared to prior year attributable to lower utilisation of our facilities as a result of Covid 19.
The average balances of our deposit book shore up by 10.7% as compared to 2019, driven by the new client acquisition strategy which brought in fresh deposits. A few large one-off clients deposits received late in the year are expected to flow out in the first quarter of 2021.
As Mauritius went into lockdown, the Bank reached out to existing clients to understand their needs and support them. Alongside this, we actively reached out to selected Tier 1 clients as part of the Bank’s wider client acquisition strategy.
The pandemic also sped up our digitalisation process with a large number of processes being reviewed and simplified to accommodate clients’ requests digitally. In so doing we were able to provide uninterrupted service throughout the lockdown period. Continuous inroads on our digitalisation journey was made with 87% of all our customer payments being received through electronic platforms, of which over 67% are processed through Straight Through Processing (STP), a commendable achievement. These ratios are among the highest in the industry and have resulted in increased efficiency and improved the client experience as part of our client centricity journey. Efficiencies derived consequently have allowed us, for our clients' convenience, to extend the cut-off time for outward US Dollar payments till 5:00pm.
Business volumes are expected to continue to be impacted by the effect of the pandemic at least for the first half of 2021.
We do not foresee any hikes in the US interest rates for the next few years and this will adversely weigh on our net interest income, being a liability-driven balance sheet. The excess funds will have to be deployed optimally to protect earnings.
In the future, we expect the volume of client’s online interactions to increase. In 2021, we will further digitalise our processes and services, to continue to provide an exceptional client experience and ensure a seamless experience for clients across our processes and channels. Our aim to increase usage of electronic channels to above 90% in the coming years.
Through our ongoing client acquisition strategy, we expect to grow the short-term book within risk appetite, whilst diversifying our credit exposures.
We remained focused on diversifying our book and increasing our deposit base, which will also enable the payment value chain.
Aimed to diversify our product offering to new and existing clients through our client acquisition strategy.
We aim to further increase usage of electronic channels to above 90% in the coming years.
Business Lines Review The Bank provides a full range of banking, trading, transactional, investment and advisory services to clients including multinational, local and regional businesses as well as financial institutions, governments and parastatals. Our value proposition is underpinned by three product areas namely: Transactional Products and Services, Investment Banking and Global Markets. With expertise in all of the Bank’s products, the Client Coverage team provides comprehensive strategic, capital raising and risk management support tailored to clients’ unique requirements, enabling them to develop a sustainable competitive advantage. As trusted strategic partners, they are well positioned to enhance their understanding of customers, anticipate their future needs, provide unbiased insights and offer omnichannel service.
Transactional Products and Services (TPS)
TPS provides the Bank’s corporate clients with transactional solutions across most jurisdictions with specifically our deep knowledge in Africa. These include access to short-term finance facilities, cash management activities, trade finance solutions and support on complex transactions. TPS accounts for over 35% of the Bank’s client revenue and hosts its liability base.
Our clients’ businesses have been severely impacted during the pandemic and our prime objective as a client-centric Bank was to be available to our clients and servicing them in these difficult times. With rigorous business continuity processes and practices in place, we seamlessly managed to operate remotely. During the lockdown, we provided all the products and services we offer under normal conditions and our processes were reviewed and simplified to be able to accommodate our client’s requests digitally. The fact that we have automated processes such as Straight Through Processing (STP) for outward payments and the Transforming Cross Border Payments – SWIFT GPI has facilitated this process.
BUSINESS REVIEW MANAGEMENT DISCUSSION AND ANALYSIS CONTINUED
Our Covid-19 Response (continued) Business Lines Review (continued)
17STANDARD BANK (MAURITIUS) LIMITED Annual report 202016

Priorities/objectives for 2020
Delivery on strategic
objectives2020 Performance Outlook and priorities for 2021
Improve our client value proposition.
Enhance yields on our excess funds.
Active involvement in diversifying our client portfolio across sectors, geographies and ecosystems, in order to reduce concentration risks in the medium to long term.
Step up engagements with existing clients with the objective of deepening our understanding of and adding greater value to their businesses.
Financial Outcomes
Client Centricity
Digitalisation
Overall, trading revenue declined by 17.7% due to lower flows from key clients and margin compression witnessed. Global Markets had locked in their excess funds at fixed rates in anticipation of the falling US interest rates. This contributed positively to GM’s NII this year. Our performance was also supported by a rise in placement volumes led by an increase in the deposit base as well as the Bank’s continued efforts to optimise its balance sheet.
The pandemic and declining US interest rate environment has made it challenging to improve yields on our high-quality liquid assets. Given the interest rate environment and the deterioration of the credit environment, we were not able to pursue this objective in 2020.
During 2020, we stepped up the client engagements and stayed close to our clients to assist them with the impact of the Covid-19. The pandemic has a mixed impact on our client base depending on the industry they operate in. Overall, flows proved to be resilient with our biggest challenge being margin erosion.As part of a bank-wide initiative to diversify our client base, we worked with sector heads and relationship managers from the Group to identify entities that would find our value proposition of interest. These engagements are bearing fruit and new clients have been acquired during the year.
We continued to promote our e-market trading platform to our clients in our drive to improve efficiency in the dealing room and deliver real-time pricing and trade execution on a single, integrated platform.
We successfully upgraded our Global Markets booking system, migrating our systems to a new version of the Calypso booking platform in November 2020 and broadening the range of products available to clients.
While most economists are predicting a recovery in 2021, the environment remains very uncertain. We expect the US interest rate environment to remain low until the jobs market turns a corner and inflation shows signs of rising.
Our focus remains to optimise and deploy our excess funds in an efficient manner.
Client engagement will remain our key priority next year. Our objective is to deepen and broaden our relationships with our clients with a view to adding more value to their businesses.
We aim to continue our efforts to acquire new clients to reduce risk and revenue concentration.
We will launch the African Market Tracker, the mobile version of e-Market Trader, to provide clients with convenient access to information.
Priorities/objectives for 2020
Delivery on strategic
objectives2020 Performance Outlook and priorities for 2021
Build the asset book, notably via focused collaboration with Client Coverage to generate additional opportunities across our target sectors.
Accelerate our speed of execution and operational excellence.
Continue to diversify our exposure and build resilience against the net effect of credit impairment events.
Deploy an upgraded loan management system that will boost efficiencies, reduce operational risks and increase security.
Procure a Corporate Finance Advisory Licence, which would enable us to market a more comprehensive set of services (namely Capital Markets and Advisory) which are fully aligned with the global IB value proposition. Our ambition is to provide clients with the same services and experience as in the rest of the Standard Bank Group.
ClientCentricity
Digitalisation
With the global impact of Covid-19 early in the year, many clients took a more introspective stance and a far more cautious approach to any material corporate finance activity, including taking on leverage. This slowed down the pace of existing deals in execution and liquidity was closely monitored as globally it was observed that some clients opted to defensively draw available facilities. Furthermore, intense focus was placed on monitoring and managing existing exposures to clients in sectors that are vulnerable to the macroeconomic effects of Covid-19. We proactively sought to anticipate and manage client needs given the variable impact of the pandemic on their businesses.
As a result, it has been a subdued year in terms of ability to build pipeline beyond those transactions already at a sufficiently advanced stage of completion early in the year. While corporate activity began to recover somewhat from mid-year, this was inconsistent between sectors and geographies. Overall, we ended the year at a moderate deficit to our 2019 asset book size.
IB has no exposure to the Mauritian industries that were hardest hit, namely tourism and travel. Our exposure has been relatively diversified, both in terms of sector and geography. Certain of these exposures required greater attention, such as exposure to certain real estate assets, and jurisdictions such as Zambia.
The second half of the year saw substantial efforts to implement a new loan booking system called ACBS, with an expectation of system go-live in early 2021. ACBS will enable the business to offer more structured debt products and mitigate operational risk relating to the system that is currently in use. Use of the system will also involve the outsourcing of transaction management and loan administration tasks to a centralised team in South Africa.
Given the focus on managing credit risk and defending the balance sheet, among other projects, the procurement of a corporate finance advisory licence was deferred to 2021.
Business volumes are expected to continue to be impacted by the effects of the pandemic until at least the second half of 2021. This will likely have an impact on the Investment Banking team’s ability to originate quality new pipeline and may require continued focus on defensive loan management depending on the degree to which certain sectors and geographies continue to be affected.
We will continue to work closely with Client Coverage to proactively develop solutions for our target clients.
We aim to migrate all existing loans to ACBS and go live in early 2021. This system will provide a platform for IB to further digitalise our processes and offer new tools and services to our clients.
Submit the application to the FSC for the corporate finance advisory licence and initiate business development efforts in partnership with the Group’s Capital Markets and Advisory teams.
Investment Banking (IB)Our Investment Banking team leverages insights from our local, regional and international footprint to deliver financial solutions to multinational corporations with a strong presence in Africa. Our expertise alongside our global strategic relationships and unparalleled network enables us to identify unique opportunities and deliver growth through debt capital market solutions, innovative debt solutions and flexible primary financing solutions.
Global Markets (GM)Global Markets provide clients with access to the market for their foreign exchange and interest rate requirements. It offers structured and innovative solutions using risk mitigation and yield enhancement strategies. Its income consists of two streams: Net Interest Income and trading revenue. NII is generated primarily by bank placements while trading revenue is driven by client flows.
BUSINESS REVIEW MANAGEMENT DISCUSSION AND ANALYSIS CONTINUED 19STANDARD BANK (MAURITIUS) LIMITED Annual report 202018

Digitalisation and IT Digitalisation and IT are key enablers of our Group’s transformation into a platform-based services organisation, allowing us to provide a client experience that is as fluid, seamless and consistent as possible. Each of our digitalisation and IT projects and deliverables supported our long-term ambition to become a truly digital and truly human bank. The Covid-19 pandemic has also geared up the implementation of a number of digital banking initiatives that were already underway, while providing the opportunity for further innovation.
Throughout the year, we continued to invest significant resources into automating and streamlining our processes, particularly with regard to financial document management and internal reporting. This not only reduced processing time and errors, improved client service, but also freed up our staff’s time and resources, allowing them to focus on value-added activities rather than on labour-intensive, routine tasks.
We have also increasingly migrated tools to our new platform as a service, notably using cloud computing. By 2024, we aim to have 85% of all of our IT workloads located in the cloud, using platforms such as Amazon Web Services and Microsoft Azure. Agreements are already in place and we have engaged with regulators to obtain approval for this strategy, both in Mauritius and at a Group level.
Concurrently, we have adopted ever more agile ways of working, underpinned by extensive training to develop future-ready skills and cultivate a digital-first mindset among our staff. (Refer to People and Culture on p. 21 for information about training provided to our teams).
Key deliverables:
• We decommissioned a number of legacy systems to reduce point of failures and increase systems availability to clients.
• We adopted technology standards as defined by the Group architecture initiative.
• We implemented straight-through processing (STP) for several different teams.
• We implemented safe settlement, minimising the risk of failed inward transactions and allowing us to substantially increase the number and value of transactions being put through Straight Through Processing queue.
• We closed on our first robotics solution which will be implemented in January 2021, automating the processing of tax payments from client accounts to the Mauritius Revenue Authority and removing the need for human intervention in the majority of these transactions.
• We invested considerable resources into ensuring the integrity of our KYC records, with a dedicated taskforce drilling down into our records to ensure that no information was missing. This is important from both a regulatory perspective and is aligned to our values and our commitment to doing business the right way.
A swift and agile transition to working from home
• In January 2020, prior to the emergence of the Covid-19 pandemic, the Bank implemented protocols to allow staff to remotely connect to our systems and work from home part-time.
• Having extensively tested these capabilities ahead of time, we were able to swiftly shift our entire workforce to working from home when the Covid-19 lockdown was announced in March 2020 by:
• Quickly enabling secure remote access for all of our users;
• Procuring secondary screens, desktops and Wi-Fi devices delivered to key staff across the island;
• Implementing the ability to execute daily core banking End of Day system processes remotely.
• We have embedded a new work-from-home policy, having replaced desktops with laptops, and having a fully mobile workforce. This has allowed us to provide a reliable, convenient service to clients anywhere, at any time and represents the value-added for our employees. It has also substantially strengthened our business resilience and continuity plans.
Improving our IT security posture
As a result of the increases in both digital transactions and the proportion of employees working from home, cybersecurity has been a major focus throughout 2020.
Throughout the lockdown, we were able to maintain our security posture without any interruptions, by implementing processes to ensure that this could remain the case.
• New security features and solutions were implemented this year to strengthen our cyber-resilience and assist with the detection of cyber-threats. We also removed all of our legacy operating systems to eliminate a number of legacy weaknesses.
• A month-long, in-country disaster recovery test was carried out in August 2020, while a Cyber Security Incident Response Simulation was conducted by F-Secure, a well-known cyber-security operator, with positive results. We ranked third out of the Standard Bank Group’s 19 entities.
• A cyber simulation was also successfully carried out by a well-known cyber-security operator, with strong positive results. The simulation consisted of a rigorous set of IT Security tests to assess our IT team’s ability to adequately manage a cyber security incident.
• We onboarded an access management tool that assists in hardening Data Leakage Prevention (DLP), to more effectively protect our systems from external access. This guaranteed a better, safer and more consistent service to our clients. The Bank currently has the highest-rated security posture in the Standard Bank Group.
People and Culture In 2020, Human Capital (HC) assisted with the Culture roll out as part of the Standard Bank transformation journey. The team continued to work closely with each of the Bank’s business units, enabling a shift towards more collaborative and cross-functional ways of working, in helping to deliver the Bank’s main strategy. There were various initiatives which were deployed to accompany our people in the transformation journey, and these were:
Leadership Circle
In 2020, the setup of the Leadership Coaching as part of the Culture Journey was initiated to the top management tier of Standard Bank, Mauritius. The aim of the programme was to ensure alignment of values and behaviours across the leadership team, which would drive the strategic initiatives of the Bank. It is expected that the learnings of the leadership team be cascaded homogenously across the Bank going forward. The Human Capital team assisted in the development and customisation of the programme to ensure its relevance to the country. The programme is ongoing and expected to be completed towards the later part of 2021. The programme is centred on the 8 leadership identities embraced by the Group, which is depicted hereunder:
Preparing our people for the future
Our transition into a digitally enabled, platform-based financial services organisation and to becoming truly digital and truly human requires a culture journey and a change of mindset among our people. There has been deployment of organisation-wide training programme, consisting of workshops and training sessions, to communicate and embed key behaviours and attitudes that align with the Group strategy.
• The Executive Committee and Board participated to specific leadership programmes as rolled out by the Group.
• Online training through enhanced learning management systems, namely Salesforce & Degreed to all our people across the Bank.
• The Standard Bank Group also delivered awareness training about Cyber Security to the Board of Directors.
Enabling the delivery of the Group’s new architecture
A change in the group’s architecture was announced in 2019 and is currently in progress of being deployed to the Bank. Some of the guiding principles have already been implemented and were socialised with the Board and executive committee members. The framework in which the decision rights will be applied has been clarified and will be embedded in 2021. The Key Strategic levers which will enable the new operating model are:
• Corporate Strategy
• Budgeting
• Job Description
• Appointment
• Termination
• Performance Contracting
• Performance Review & Evaluation
• Annual Review Reward
The new architecture will have implications on how the Bank’s team will be structured. Over the next coming years, the HC team will continue to work closely with the Group and Bank to devise a structure for each function that reflects Group-level guidelines, while remaining tailored to each team’s needs.
A human capital hub for the region
As part of the wider Group strategy to maximise our efficiency and leverage capabilities in different countries, transforming the Group into an integrated, agile workforce, we started planning in 2020 to make Mauritius a shared service hub for human capital. We are now providing services such as payroll management to Standard Bank in the Democratic Republic of Congo and aim to roll out our operational support capabilities to other Group entities in the future.
Employee engagement
Employee engagement is one of our Bank’s core strategic drivers. The Bank places strong emphasis on collaboration and seeks to ensure that its people feel empowered to offer up new ideas and engage with colleagues across different business units and at every level of seniority. This is monitored via Office Vibe, a digital feedback portal and the annual ‘Are you a fan’ survey. Key concerns from the survey remain training and learning opportunities, compensation and benefits and work-life balance.
Looking ForwardThe economic context will remain challenging in 2021 with the operating environment remaining subdued as business continue to be impacted by Covid-19. We will remain resilient and remain committed in supporting our customers, employees and communities during this difficult time. We will continue to deepen our existing client relationships and continue on our client acquisition plan.
Our future-ready transformation journey has been initiated this year and 2021 will see the implementation and embedment thereof. Our business transformation will be geared towards a relentless focus on offering the right solutions to our clients, anticipating their needs, while delivering exceptional service, through our people. As a result, our priorities remain unchanged in the delivery of the future-ready transformation journey, namely:
• Maintaining growth momentum of target client segments in Africa with service excellence and embed a market-based ecosystem approach;
• Improve client experience and increase the Digitisation momentum;
• Allocating resources to growth opportunities, within risk appetite, aligned to clear sector focus;
• Maintaining disciplined cost management;
• Adopt the Group architecture framework and create an agile workforce.
Underpinning and supporting these product areas to execute our strategic objectives are the following:
BUSINESS REVIEW MANAGEMENT DISCUSSION AND ANALYSIS CONTINUED 21STANDARD BANK (MAURITIUS) LIMITED Annual report 202020

Objectives 2020 Performance 2020 Objectives 2021
Return on Equity (ROE)
ROE expected to hover around 16.0%.
ROE was at 5.8% following decrease in operating income and the impact of increased levels of credit provisioning raised this year.
ROE expected to be around 13.5%.
Return on Average Assets (ROA)
ROA estimated to reduce to 1.4% on account of lower profitability.
Return on average asset decreased to 0.5% as a result of lower earnings.
ROA estimated to 0.8%.
Operating Income
NII is expected to decrease by 9% on account of lower margins. Non-interest income is expected to increase by 6%, driven by additional fees.
Operating income was down on target by 27.2% as a result of a lower net interest income driven by a declining interest rate environment, reduced yields and decreasing non-interest revenue due to lower volumes and margin contractions.
NII is expected to decrease by 1.1% on account of lower margins. Non-interest income is expected to increase by 13.2%, driven by additional fees and trading income.
Operating expenses
Operating cost is expected to increase by 9%, on account of additional IT support costs earmarked.
Operating costs improved against target by 23.5% following a rigorous cost containment.
Operating cost is expected to increase by 5.26%, on account of annual inflation rate increases and higher IT support costs.
Cost to IncomeThe cost to income ratio is expected to increase to 46% as a result of the lower budgeted operating income.
Cost to income closed at 48.3% in view of the lower income generated.
The cost to income ratio is expected to increase to 49%.
Loans & Advances Growth
The loan book growth expectation is 39%, on account of anticipated growth in client base.
Expected term disbursements took longer to materialise coupled with stricter lending environment resulted in the term asset book to be behind target by 39.0%.
The loan book growth expectation is 33%, on account of anticipated growth in client base.
Deposit GrowthDeposits are expected to increase by 19% from existing and new business.
Customer deposits was above target by 6.1%.
Deposits are expected to increase by 11.0% from existing and new business.
Portfolio Quality
NPL ratio is expected to be within the threshold of 2.8% to 3.7%.
The ratio of non-performing loans to gross loans has increased to 9.3%, following the deterioration of a credit facility.
NPL ratio is not expected to deteriorate further.
Capital Management
Capital adequacy ratio is targeted at 24.7% with CET 1 to be at 23.5%.
The capital adequacy ratio closed at 33.0%, with CET Tier I ratio at 32.2%.
Capital adequacy ratio is targeted at 25.4% with CET 1 to be at 24.8%.
Financial Review
Table 1: Performance against Objectives by key areas
Financial Review
With the onslaught of the Covid-19 pandemic, the impact was felt across all the economies in which the Bank operates. As part of measures to alleviate businesses and boost economies, interest rates have been slashed across all the major currencies. The first quarter saw the federal reserve (“FED”) cut its interest rate by 150bps, bringing the fed rate at an all-time low, ranging from 0-0.25% and this has adversely impacted the Bank’s earnings. The impact of Covid-19 on our IFRS 9 impairment assessment was also factored in, with an ongoing re-rating exercise being performed, which led to an additional credit impairment of USD9.7m. This translated into the Bank’s delivering a subdued financial performance with profit after tax of USD7.5m for the financial year 2020, a drop of 66.4% compared to prior year. This led to a lower annualised return on equity closing at 5.8% against 18.3% in 2019, whilst cost to income deteriorated from 39.7% in 2019 to 48.3% for the same period, attributable to lower revenues.
With the onset of Covid-19 and the resultant economic context, clients have adopted a prudent approach to investments, resulting in a lower loan book. However, the deposit book grew by 23.5% highlighting a strong funding and liquidity positions. The Bank remain well capitalised with a capital adequacy ratio closing at 33.0%, with CET Tier I ratio at 32.2%.
The waterfall hereunder details a summary of changes compared to prior year:
Analysis of Results
Revenue Total operating income decreased by 25.6%, with income declining across all revenue lines.
Net Interest Income (NII) Being principally a USD liability driven balance sheet, the Bank has remained highly exposed to a falling USD interest rate environment.
This was evidenced throughout the year, where a sharp reduction in the Bank’s net interest income (“NII”) of 29.7% from USD32.4m in 2019 to reach USD22.8m in December 2020 was witnessed. Earnings protection continued through the endowment hedge entered in the middle of last year, allowing the Bank to lock USD92m in US treasuries at higher yielding rates.
The market has been flushed with liquidity with many banks sitting on excess liquidity. Given the increased demand for money market placements from group entities, the rates associated with these instruments have dropped significantly over the course of the year. Even though the bank has seen increased volumes of deposit inflows, this pick-up was not reflected in the NII given the significant drop in the placement rates. To alleviate further dilution in earnings, the Bank extended long-term money market placements to tenors of up to 2 years at fixed interest rates.
Earnings dilution remained a concern during the year as higher yielding placements gradually matured and replaced by lower interest-bearing placements, translating into an adverse impact on NII.
Interest income from short term facilities fell as a result of early repayment of some term facilities and downward adjustment of interest rate, following the repricing of the loan advances. Lower utilisation of facilities was also witnessed as some clients had minimal levels of operations during the lockdown period. A reduced appetite for term advances was noted as clients adopted a prudent approach before committing to credit facilities.
As a result, the bank was severely impacted by the drop in yields with the net interest margin falling from 2.2% in 2019 to 1.42% in 2020.
Non-interest Revenue (NIR) Non-interest revenue reduced by 16.5% to USD12.0m, spurred by a decrease of 15.0% on net fees and commissions revenue, with trading income declining by 17.7%, and other income by 18.2%.
The 15% drop in net fees and commission witnessed was driven by lower transactional flows and reduced trade finance activities. Both transactional volumes and trade finance activities were adversely impacted by the lockdowns imposed by the Covid-19 pandemic. Trade activities came to a standstill on account of lockdowns implemented in jurisdictions where the Bank operates, which hampered the movement of documents as well as customers flows. As countries gradually came out of the lockdowns and business resumptions occurring, a slight pick-up was noted in the trade finance activities.
A pick-up in commitment fees was noted in light of the lower utilisation of credit facilities lines.
Trading Income Trading revenue fell by 17.7% from prior year to reach USD6.1m. The decline in revenue is mainly attributable to a drop in FX flows from key clients, coupled by margin compression emanating from a more competitive FX environment. Clients' demand for hedging solution and structured products was significantly lower than prior year. The money market trading desk reported a positive growth of 70% on the back of higher level of client swap activities. Given the market conditions and volatility prevailing, there was no demand for structured products this year.
Other revenue: The 18.2% reduction in other revenue is mainly due to devaluation of MUR against the USD and relate to recharges to the Standard Bank (Trust) Co Ltd.
Credit Impairment Credit impairment charges increased substantially by USD4.6m year-on-year, explained mainly by the increase in the non-performing loan portfolio and a general increase in provision levels on the performing book, as a result of heightened risks arising from Covid-19 impact. Provisions for credit impairments had a key impact on headline earnings this year. Substantial stage 3 provisions of USD 8.6m were raised on one group entity’s credit exposures during the year. Managing those particular assets and maintaining a high standard of prudence and pragmatism in our origination efforts going forward will remain critical.
During the year, one exposure amounting to USD0.3m impacted by Covid-19 had been restructured but was settled without any losses before year end 2020.
A detailed analysis of performing and non-performing loans is provided in the financial risk management report on page 121.
Operating Expenses Cost was well contained in 2020, as the Bank revisited its cost base with the advent of Covid-19, where further cost management was embedded, translating into operating costs improving by 9.4% year on year. In addition, the Bank beneficiated from a 11% depreciation on the Rupee rate against the US Dollar, as all the Bank’s expenses are US Dollar denominated.
0
2,000
4,000
6,000
8,000
10,000
12,000
14,000
16,000
18,000
20,000
18H1 18H2 19H1 19H2 20H1 20H2
Net Interest Income
0
500
1,000
1,500
2,000
2,500
3,000
3,500
4,000
4,500
Point of representation fees
Card based fees and commission
Knowledge based fees and commission
Electronic banking transaction fees
Foreign currency service fees
Documentation and administration fees
Other fees andcommission
YTD 2019/2020
YTD 19 YTD 20
0 1,000 2,000 3,000 4,000 5,000 6,000 7,000 8,000
FX Flow Trading
Structured Products
Money Markets Trading
Total Trading Revenue
Trading Revenue - USD’000
2019 2020
22,254
7,481
9,617
991 1,31761 4,558
8702,619
0
5,000
10,000
15,000
20,000
25,000
2019 Ni
l
Fees
& C
omm
s
Trad
ing R
even
ue
Othe
r Inc
ome
Impa
irmen
ts
Staff
Cos
ts
Othe
r Ope
x
Taxa
tion
2020USD 000
24
BUSINESS REVIEW MANAGEMENT DISCUSSION AND ANALYSIS CONTINUED 23STANDARD BANK (MAURITIUS) LIMITED Annual report 202022
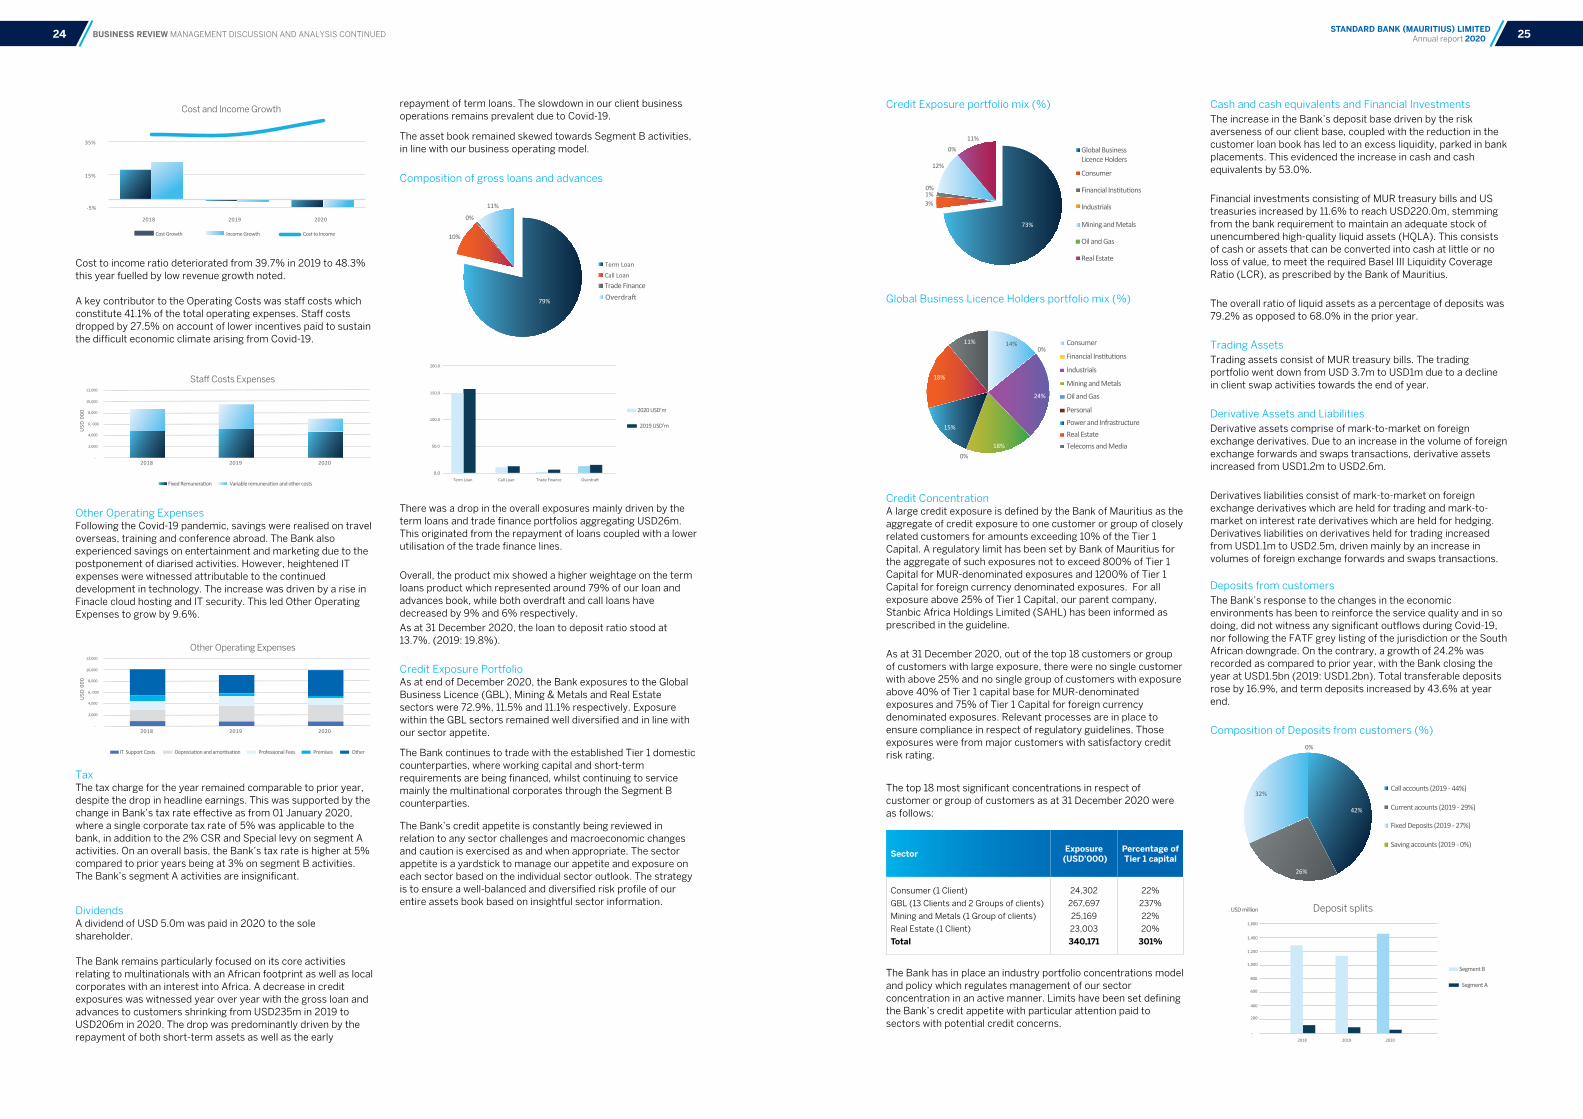
Cost to income ratio deteriorated from 39.7% in 2019 to 48.3% this year fuelled by low revenue growth noted. A key contributor to the Operating Costs was staff costs which constitute 41.1% of the total operating expenses. Staff costs dropped by 27.5% on account of lower incentives paid to sustain the difficult economic climate arising from Covid-19.
Other Operating Expenses Following the Covid-19 pandemic, savings were realised on travel overseas, training and conference abroad. The Bank also experienced savings on entertainment and marketing due to the postponement of diarised activities. However, heightened IT expenses were witnessed attributable to the continued development in technology. The increase was driven by a rise in Finacle cloud hosting and IT security. This led Other Operating Expenses to grow by 9.6%.
Tax The tax charge for the year remained comparable to prior year, despite the drop in headline earnings. This was supported by the change in Bank’s tax rate effective as from 01 January 2020, where a single corporate tax rate of 5% was applicable to the bank, in addition to the 2% CSR and Special levy on segment A activities. On an overall basis, the Bank’s tax rate is higher at 5% compared to prior years being at 3% on segment B activities. The Bank’s segment A activities are insignificant.
Dividends A dividend of USD 5.0m was paid in 2020 to the sole shareholder. The Bank remains particularly focused on its core activities relating to multinationals with an African footprint as well as local corporates with an interest into Africa. A decrease in credit exposures was witnessed year over year with the gross loan and advances to customers shrinking from USD235m in 2019 to USD206m in 2020. The drop was predominantly driven by the repayment of both short-term assets as well as the early
repayment of term loans. The slowdown in our client business operations remains prevalent due to Covid-19.
The asset book remained skewed towards Segment B activities, in line with our business operating model.
Composition of gross loans and advances
There was a drop in the overall exposures mainly driven by the term loans and trade finance portfolios aggregating USD26m. This originated from the repayment of loans coupled with a lower utilisation of the trade finance lines.
Overall, the product mix showed a higher weightage on the term loans product which represented around 79% of our loan and advances book, while both overdraft and call loans have decreased by 9% and 6% respectively.
As at 31 December 2020, the loan to deposit ratio stood at 13.7%. (2019: 19.8%).
Credit Exposure Portfolio As at end of December 2020, the Bank exposures to the Global Business Licence (GBL), Mining & Metals and Real Estate sectors were 72.9%, 11.5% and 11.1% respectively. Exposure within the GBL sectors remained well diversified and in line with our sector appetite.
The Bank continues to trade with the established Tier 1 domestic counterparties, where working capital and short-term requirements are being financed, whilst continuing to service mainly the multinational corporates through the Segment B counterparties.
The Bank’s credit appetite is constantly being reviewed in relation to any sector challenges and macroeconomic changes and caution is exercised as and when appropriate. The sector appetite is a yardstick to manage our appetite and exposure on each sector based on the individual sector outlook. The strategy is to ensure a well-balanced and diversified risk profile of our entire assets book based on insightful sector information.
Credit Exposure portfolio mix (%)
Global Business Licence Holders portfolio mix (%)
Credit ConcentrationA large credit exposure is defined by the Bank of Mauritius as the aggregate of credit exposure to one customer or group of closely related customers for amounts exceeding 10% of the Tier 1 Capital. A regulatory limit has been set by Bank of Mauritius for the aggregate of such exposures not to exceed 800% of Tier 1 Capital for MUR-denominated exposures and 1200% of Tier 1 Capital for foreign currency denominated exposures. For all exposure above 25% of Tier 1 Capital, our parent company, Stanbic Africa Holdings Limited (SAHL) has been informed as prescribed in the guideline.
As at 31 December 2020, out of the top 18 customers or group of customers with large exposure, there were no single customer with above 25% and no single group of customers with exposure above 40% of Tier 1 capital base for MUR-denominated exposures and 75% of Tier 1 Capital for foreign currency denominated exposures. Relevant processes are in place to ensure compliance in respect of regulatory guidelines. Those exposures were from major customers with satisfactory credit risk rating.
The top 18 most significant concentrations in respect of customer or group of customers as at 31 December 2020 were as follows:
The Bank has in place an industry portfolio concentrations model and policy which regulates management of our sector concentration in an active manner. Limits have been set defining the Bank’s credit appetite with particular attention paid to sectors with potential credit concerns.
Cash and cash equivalents and Financial InvestmentsThe increase in the Bank’s deposit base driven by the risk averseness of our client base, coupled with the reduction in the customer loan book has led to an excess liquidity, parked in bank placements. This evidenced the increase in cash and cash equivalents by 53.0%.
Financial investments consisting of MUR treasury bills and US treasuries increased by 11.6% to reach USD220.0m, stemming from the bank requirement to maintain an adequate stock of unencumbered high-quality liquid assets (HQLA). This consists of cash or assets that can be converted into cash at little or no loss of value, to meet the required Basel III Liquidity Coverage Ratio (LCR), as prescribed by the Bank of Mauritius.
The overall ratio of liquid assets as a percentage of deposits was 79.2% as opposed to 68.0% in the prior year.
Trading AssetsTrading assets consist of MUR treasury bills. The trading portfolio went down from USD 3.7m to USD1m due to a decline in client swap activities towards the end of year.
Derivative Assets and LiabilitiesDerivative assets comprise of mark-to-market on foreign exchange derivatives. Due to an increase in the volume of foreign exchange forwards and swaps transactions, derivative assets increased from USD1.2m to USD2.6m.
Derivatives liabilities consist of mark-to-market on foreign exchange derivatives which are held for trading and mark-to-market on interest rate derivatives which are held for hedging. Derivatives liabilities on derivatives held for trading increased from USD1.1m to USD2.5m, driven mainly by an increase in volumes of foreign exchange forwards and swaps transactions.
Deposits from customersThe Bank’s response to the changes in the economic environments has been to reinforce the service quality and in so doing, did not witness any significant outflows during Covid-19, nor following the FATF grey listing of the jurisdiction or the South African downgrade. On the contrary, a growth of 24.2% was recorded as compared to prior year, with the Bank closing the year at USD1.5bn (2019: USD1.2bn). Total transferable deposits rose by 16.9%, and term deposits increased by 43.6% at year end.
Composition of Deposits from customers (%)
14%0%
24%
18%
15%
18%
11% Consumer
Financial Institutions
Industrials
Mining and Metals
Oil and Gas
Personal
Power and InfrastructureReal EstateTelecoms and Media
0%
18%42%
26%
32%
0%
Call accounts (2019 - 44%)
Current acounts (2019 - 29%)
Fixed Deposits (2019 - 27%)
Saving accounts (2019 - 0%)
Deposit splits
-
400
200
800
600
1,200
1,000
1,400
1,600
2018 2019 2020
Segment B
USD million
Segment A
73%
3%1%0%
12%
0%
11%
Global Business Licence Holders
Consumer
Financial Institutions
Industrials
Mining and Metals
Oil and Gas
Real Estate
-5%
15%
35%
2018 2019 2020
Cost and Income Growth
Cost Growth Income Growth Cost to Income
79%
10%
0%
11%
Term Loan
Call LoanTrade FinanceOverdraft
-
2,000
4,000
6,-000
8,000
10,000
12,000
2018 2019 2020
USD
000
Other Operating Expenses
IT Support Costs Depreciation and amortisation Professional Fees Premises Other
0.0
50.0
100.0
150.0
200.0
Term Loan Call Loan Trade Finance Overdraft
2020 USD’m
2019 USD’m
-
2,000
4,000
6,-000
8,000
10,000
12,000
2018 2019 2020
USD
000
Staff Costs Expenses
Fixed Remuneration Variable remuneration and other costs
Sector Exposure (USD'000)
Percentage of Tier 1 capital
Consumer (1 Client)
GBL (13 Clients and 2 Groups of clients)
Mining and Metals (1 Group of clients)
Real Estate (1 Client)
Total
24,302
267,697
25,169
23,003
340,171
22%
237%
22%
20%
301%
BUSINESS REVIEW MANAGEMENT DISCUSSION AND ANALYSIS CONTINUED 25STANDARD BANK (MAURITIUS) LIMITED Annual report 202024

Deposits from banks Deposits from banks increased by 13.5% to reach USD100.4m, driven by regional treasury activities and deposits from local banks.
Other borrowed funds Other borrowed funds with Standard Bank of South Africa were repaid in June of this year, following the repayment of a term facility.
Balance Sheet Items Off-Balance Sheet exposure decreased from USD29.7m to USD23.1m in 2020 as a result of lower non-fund-based facilities to clients mainly in the Power & Infrastructure, Financial Institutions, Consumer and Oil & Gas sectors.
Off-Balance Sheet Exposure by geographical concentration
Credit Quality
With the advent of Covid-19 pandemic, the Bank has performed a deep drill exercise with the credit portfolio being reviewed using the latest available information on the counterparties and their respective sectors. Particular emphasis was given to sectors considered riskier, such as construction or retail. The ratings on counterparties having exposures fully cash secured, were kept unchanged given minimal impact from an IFRS9 perspective.
The difficult economic climate resulted in a deterioration in the probability of default, which translated in higher stage 1 and stage 2 credit impairment charges. As a result of the uncertainty around the timing of cash flows on a non- performing loan classified in December 2019, the bank adopted a prudent approach by elevating the provision to 100% for this exposure to USD11.1m, significantly impacting this year’s bank’s results.
The non-performing loans (NPLs) ratio to total loans remained at 9.3% as at end of December 2020. Stage 3 credit impairment provision at year end stood at USD16.0m. This in turn has driven the credit loss ratio to deteriorate further from 1.9% in 2019 to close at 3.8%. The total allowance for credit loan losses aggregated to USD18.3m under IFRS 9 for all financial assets subject to credit risk.
The level of provision on the performing book under IFRS 9 was lower than the 1% regulatory requirement provision, as per Bank of Mauritius Guideline on Credit Impairment and Income Recognition at year end. This required a provision of USD0.5m to be maintained under the statutory credit risk reserve.
A detailed analysis of performing and non-performing loans is provided in the financial risk management section on pages 118-129.
The quality of the lending book remains healthy despite the two credit exposures remaining classified as impaired, and duly provisioned for. Legal action is still in progress on the written-off client during the year. Our credit appetite on sector exposure is being managed within the Bank’s approved framework to ensure acceptable level of concentration of risk and cross border activities are managed under our country risk management policy and going forward, also under the Bank of Mauritius Guideline on Cross Border Exposures. This policy is in line with regulatory requirement and our business strategic deliverables as far as asset buildup is concerned.
During the year, the exposures aggregating USD49.0m to five counterparties have been restructured with three exposures being under a distressed scenario. Out of the five counterparties, three were restructured due to Covid-19 impact. The corresponding provision amount of USD14.3m was held.
It is to be highlighted that one exposure aggregating to USD0.3m which had been restructured in quarter 1 of 2020 due to Covid-19, was settled late in quarter 4 2020 with the corresponding provision amount of USD11,271 being released.
-
10,000
20,000
30,000
40,000
50,000
60,000
Q1 2020 Q2 2020 Q3 2020 Q4 2020
ECL
Amou
nt in
USD
‘000
s
IFRS 9 - Impairment Analysis 2020
Stage 1 Stage 2 Stage 3
1.81%
3.45%
3.80%
2020Q1 2020Q2 2020Q3 2020Q4
Credit Loss Ratio
3.19%
Off-Balance Sheet ItemsOff Balance Sheet Exposure per sector
2018 USD'000
2019 USD'000
2020 USD'000
Consumer
Financial Institutions
Industrials
Mining and Metals
Oil and Gas
Personal
Power and Infrastructure
Real Estate
Telecoms and Media
2,789
3,137
19,506
1,840
-
8
8,912
-
40
4,273
2,743
9,722
289
2,100
6
9,829
739
14
2,871
605
13,041
310
-
5
6,217
-
60
36,232 29,715 23,109
Country 2019USD'000
2020USD'000
Botswana
France
Ghana
Italy
Luxembourg
Mauritius
Netherlands
South Africa
UK
UAE
Grand Total
-
5,338
-
128
8,612
8,218
2,100
4,318
1,000
-
29,714
123-
123351
6,04313,635
-1,8341,000
-23,109
2020Q1 2020Q2 2020Q3 2020Q4
Non Performing Loan Ratio
8.37%
8.29%
8.39%
9.30%
BUSINESS REVIEW MANAGEMENT DISCUSSION AND ANALYSIS CONTINUED 27STANDARD BANK (MAURITIUS) LIMITED Annual report 202026

30 Risk and Capital Management Report
54 Corporate Governance Report
81 Sustainability Report
84 Statement of Compliance
ENSURING OUR SUSTAINABILITY
ENSURING OUR SUSTAINABILITY 29STANDARD BANK (MAURITIUS) LIMITED Annual report 202028

Risk & Capital Management Report Introduction Effective risk management is fundamental to the successful execution of the Bank’s strategy, as it pursues its vision to build the leading financial organisation in, for and across Africa. The role of the risk management function is to ensure that the full spectrum of risks faced by the Bank are properly identified, assessed, managed, monitored, measured and reported in the pursuit of its goals.
The Bank’s approach to managing risk is to adopt a risk and governance framework that enables management to maximise risk adjusted returns while remaining within the board-approved risk appetite and risk tolerance levels. This approach ultimately ensures the protection of the Bank’s reputation and is consistent with its objective of increasing shareholder value. The material types of risks the Bank’s faces are outlined below:
Compliance risk is therisk of legal or regulatorysanction, financial loss ordamage to reputationthat the Bank may sufferas a result of its failure tocomply with laws,regulations, codes ofconduct and standards ofgood practice applicableto its financial servicesactivities.
Credit risk is the risk of loss arising out of the failure of obligors to meet their financial or contractual obligations when due. It is composed of obligor risk, concentration risk and country risk.
Reputational risk isthe risk of potential oractual damage to theBank’s image whichmay impair theprofitability and/orsustainability of itsbusiness.
Operational risk is therisk of loss suffered as aresult of the inadequacyof, or failure in, internalprocesses, people and/orsystems or from externalevents.
Risk Governance The Bank’s approach to managing risk and capital is set out in the Bank’s risk management framework, which is endorsed by the Board of directors. The framework has two components:
Risk governance standards have been developed for all major risk types that the Bank is exposed to and ensure that all material risks to the Bank’s strategic and financial objectives are identified and managed proactively. The risk governance standards are part of the Group’s governance infrastructure, reflecting the expectations and requirements of the board and its committees in respect of key risk areas. The standards set out minimum control requirements and ensure alignment and consistency in the manner in which the major risk types and capital management metrics across the Group are dealt with, from identification to reporting.
Policies are developed where required on specific items as stated within the standards and are reviewed on a biennial basis or earlier if required. These policies are localised to recognise in-country laws and regulations.
Details with regards to the implementation of these policies within each particular business unit are set out in the processes and procedures manual. Compliance with the standards, policies and procedures is overseen by the risk management team through annual self-assessments by business units, backtesting and independent reviews by the third line of defence functions.
Governance documents compromise standards, frameworks and policies which set out the requirements for the identification, assessment, measurement, monitoring, managing and reporting of risks and the effective management of capital. Governance standards and framework are approved by the Board.
GOVERNANCEDOCUMENTS
Governance committees are in place at both a board and management level. These committees have mandates and delegated authorities that are regularly reviewed.
GOVERNANCECOMMITTEES
ENSURING OUR SUSTAINABILITY RISK AND CAPITAL MANAGEMENT REPORT
Com
plia
nce
Ris
k
Credit
RiskReputational
Business
Risk
Ope
ratio
nal
Risk
Market RiskFunding andLiquidity Risk
Country
Risk
Market risk is the risk of a changein the market value, actual oreffective earnings, or future cashflows of a portfolio of financialinstruments, including commodities,caused by adverse movements inmarket variables such as equity,bond and commodity prices,currency exchange and interestrates, credit spreads, recovery rates,correlations and implied volatilitiesin all of these variables.
Liquidity risk is defined as therisk that an entity, althoughsolvent, cannot maintain orgenerate sufficient cash resourcesto meet its payment obligations infull as they fall due, or can only doso at materially disadvantageousterms.
Country risk, also referredto as cross-border countryrisk, is the uncertainty thatobligors will be able to fulfilobligations given politicalor economic conditions inthe country.
Business risk is the riskof earnings variability,resulting in operatingrevenues not coveringoperating costs afterexcluding the effects ofmarket risk, credit risk,structural interest raterisk and operational risk.
31STANDARD BANK (MAURITIUS) LIMITED Annual report 202030

Board and Sub-Committees The Board of Directors of Standard Bank Mauritius Limited has ultimate responsibility for the oversight of risk. The Bank’s approach to managing risk is to adopt a risk and governance framework that enables Management to maximise risk adjusted returns while remaining within the Board-approved risk appetite and risk tolerance levels. As at 31 December 2020, the Board is satisfied that:
• The Bank’s risk and capital management controls and processes generally operated effectively;
• The Bank’s business activities have been managed within the board-approved risk appetite;
• The Bank is adequately funded and capitalised to support the execution of its strategy.
In the instances where gaps were identified or where the Bank incurred losses and breached risk appetite, the Board is satisfied that Management has taken appropriate remedial and timely action.
Executive CommitteesDetails of the Executive Committees are provided in the Corporate Governance Report section of this annual report. Other Executive Committees of the Bank are:
New Products Committee (NPC)The purpose of the New Products Committee (NPC) is to facilitate the introduction of new products, services, businesses, legal entities systems or processes in a coordinated and effective manner which is consistent with our overall strategic, business and risk management focus.
The objectives of the NPC are:
• To ensure that any significant risks that could arise from the introduction or amendment of businesses, products or services, systems and processes are properly identified and appropriately addressed by the relevant parties;
• To achieve greater consistency in decision-making through standardising the requirements for the approval process of new products;
• To ensure that feasible and viable support and control processes and systems are in place to support the deployment of new products;
• To ensure that risks from interdependencies associated with the roll-out of products are properly identified and mitigated in a coherent manner; and
• To ensure adequate control and effective maintenance of the NPC process itself.
The NPC, a sub-committee of EXCO, is chaired by the Chief Finance Officer and consists of a minimum of five EXCO members depending on the type of product/service being introduced. The NPC meets as and when required. Credit Committee
The Credit Committee is the senior management credit decision-making function with a defined delegated authority as determined by the Board of Directors through the Board Credit Committee from time to time. The purpose of the Credit Committee is:
• To exercise responsibility for the independent assessment, approval, review and monitoring of all credit risk assets relating to the Bank’s business; and
• To ensure that the origination and management of the assets in the portfolio is done in terms of the Group’s Credit Standard and any other guidance given to it by Group Governance Committees from time to time.
The Credit Committee, a sub-committee of EXCO, is chaired by the Head: Credit and comprises at least four core members. The Credit Committee meets at least monthly or more frequently as determined by business needs.
Information Governance Committee The Information Governance Committee (iGovco) has been established as a sub-Committee of the in-country Executive Committee and is mandated to set, track, monitor and report on the effective implementation of the Bank’s data and information strategy.
The main responsibilities of the Committee include, inter alia, the following:
• Setting the priorities and agreeing on the critical data and information scope for the Bank;
• Approving the Bank’s operating model for Data and Information;
• Making investment decisions on key data and information programmes; and
• Overseeing and supporting the delivery of strategic data and information projects.
The iGovco is chaired by the Head: Operations and meets at least on a monthly basis.
Client Risk CommitteeAs a cornerstone of good practice and in line with regulatory requirements, the Bank is required to determine its appetite for establishing or continuing a business relationship with a potential or existing customer classified as high risk. The Client Risk Committee, a sub-committee of EXCO, serves to give effect to the governance and control requirements of the Bank and is responsible for approving client relationships where that relationship may have adverse reputational risk implications for the Bank. Potential reputational risk may span over a wide spectrum with various parameters, e.g. country of operation, nature of business activity, connection with Politically Exposed Persons, adverse information, amongst others. The Bank, through the Client Risk Committee, ensures that a review process is in place for all relevant clients falling within this category.
The Client Risk Committee is currently chaired by the Head: Client Coverage and comprises six other EXCO members. The Committee meets weekly or as required depending on business requirements.
ENSURING OUR SUSTAINABILITY RISK AND CAPITAL MANAGEMENT REPORT CONTINUED
EXC
O
Chi
ef E
xecu
tive
Info
rmat
ion
Gov
erna
nce
Com
mit
tee
Clie
nt R
isk
Com
mit
tee
Cre
dit
Com
mit
tee
New
Pro
duct
s C
omm
itte
eIT
Ste
erin
g C
omm
itte
eC
redi
t R
isk
Man
agem
ent
Com
mit
tee
Ope
rati
onal
Ris
k an
d
Com
plia
nce
Com
mit
tee
Ass
et a
nd L
iabi
lity
Man
agem
ent
Com
mit
tee
Ris
k G
over
nanc
e S
truc
ture
BO
AR
D
Com
plia
nce
Inte
rnal
Aud
it
Ris
k M
anag
emen
t &
Con
duct
Rev
iew
Com
mit
tee
Aud
it C
omm
itte
eC
redi
t C
omm
itte
eTe
chno
logy
and
Info
rmat
ion
Com
mit
tee
Man
agem
ent
and
Ove
rsig
ht
of
Inte
rest
Rat
e R
isk
Liq
uid
ity
Ris
k
Mar
ket
Ris
k
Man
agem
ent
and
Ove
rsig
ht
of
Com
plia
nce
Ris
k
Lega
l Ris
k
Op
erat
ion
al R
isk
Rep
uta
tion
al R
isk
Man
agem
ent
and
Ove
rsig
ht
of
Cre
dit
Ris
k
Man
agem
ent
and
Ove
rsig
ht
of
Tec
hn
olog
y R
isk
Cyb
er R
isk
Info
rmat
ion
Ris
k
Man
agem
ent
and
Ove
rsig
ht
of
New
/Am
end
ed
Pro
du
cts
Ser
vice
s
Bu
sin
ess
Pro
cess
Cre
dit
Dec
isio
n-M
akin
g
& R
ecom
men
dat
ion
s
Man
agem
ent
and
Ove
rsig
ht
of
Dat
a &
Info
rmat
ion
Str
ateg
y
Dec
isio
n m
akin
g on
onb
oard
ing
and
rev
iew
of h
igh
ris
k cl
ien
t
rela
tion
ship
33STANDARD BANK (MAURITIUS) LIMITED Annual report 202032
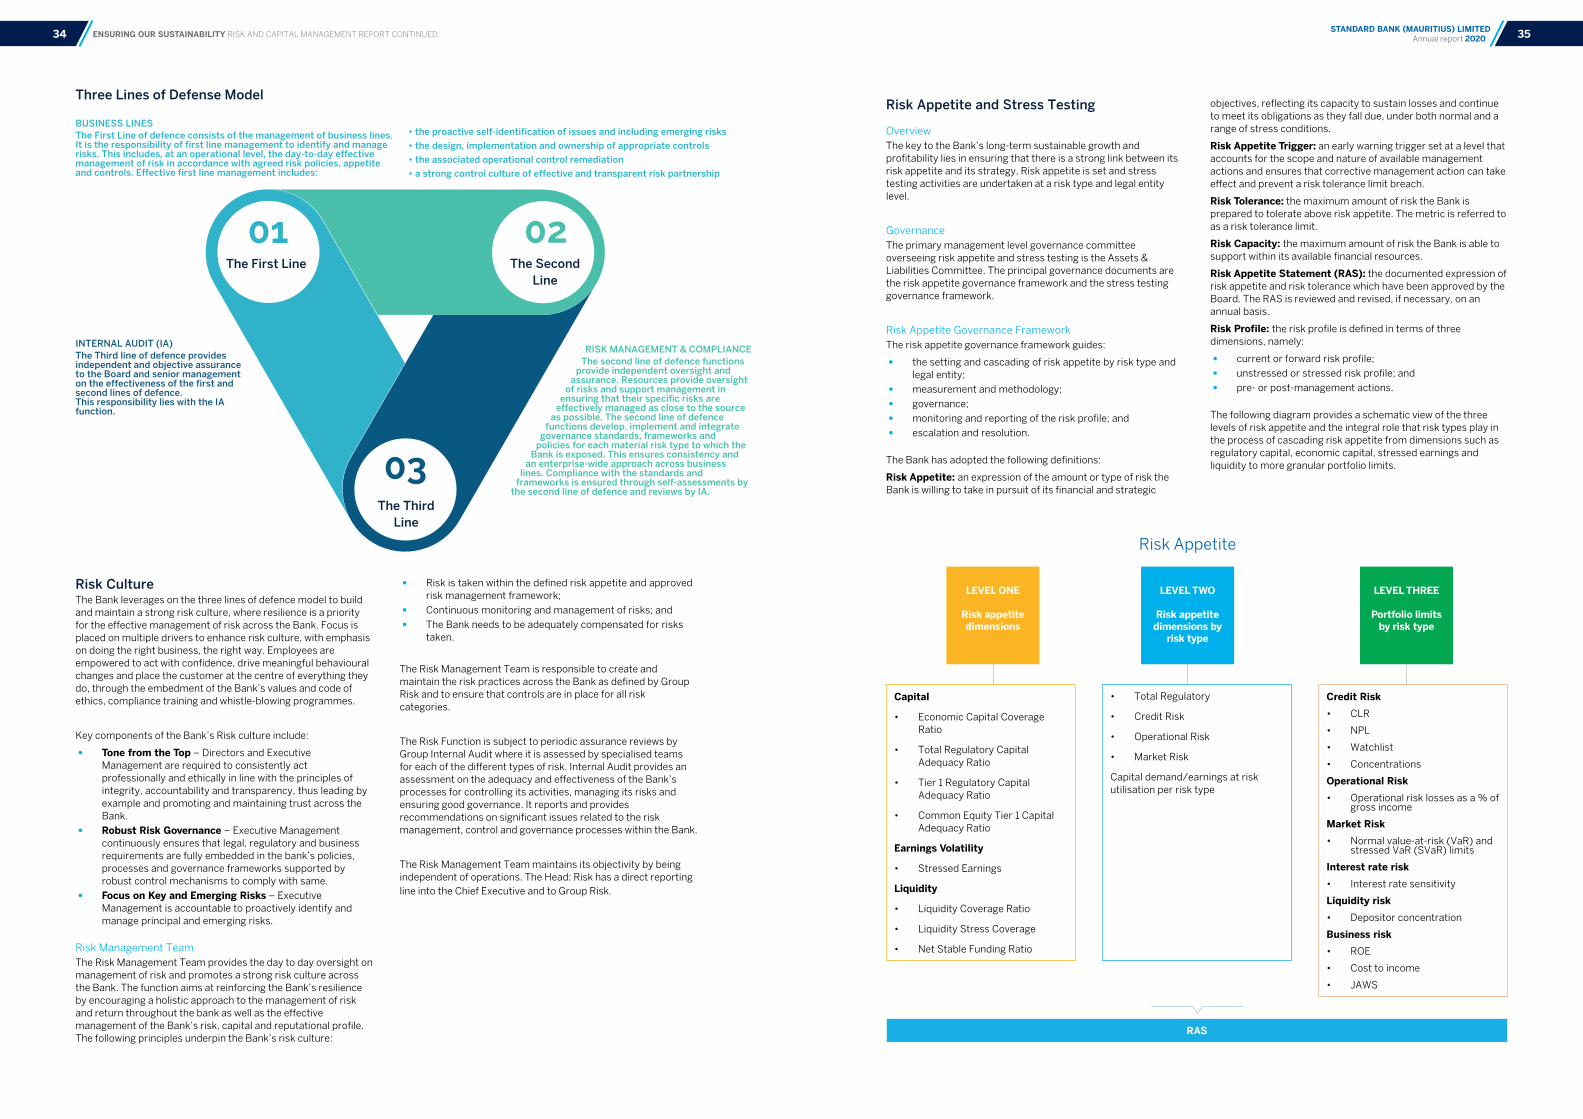
BUSINESS LINES The First Line of defence consists of the management of business lines. It is the responsibility of first line management to identify and manage risks. This includes, at an operational level, the day-to-day effective management of risk in accordance with agreed risk policies, appetite and controls. Effective first line management includes:
• the proactive self-identification of issues and including emerging risks
• the design, implementation and ownership of appropriate controls
• the associated operational control remediation
• a strong control culture of effective and transparent risk partnership
Risk Appetite and Stress Testing OverviewThe key to the Bank’s long-term sustainable growth and profitability lies in ensuring that there is a strong link between its risk appetite and its strategy. Risk appetite is set and stress testing activities are undertaken at a risk type and legal entity level.
GovernanceThe primary management level governance committee overseeing risk appetite and stress testing is the Assets & Liabilities Committee. The principal governance documents are the risk appetite governance framework and the stress testing governance framework.
Risk Appetite Governance FrameworkThe risk appetite governance framework guides:
• the setting and cascading of risk appetite by risk type and legal entity;
• measurement and methodology;
• governance;
• monitoring and reporting of the risk profile; and
• escalation and resolution.
The Bank has adopted the following definitions:
Risk Appetite: an expression of the amount or type of risk the Bank is willing to take in pursuit of its financial and strategic
objectives, reflecting its capacity to sustain losses and continue to meet its obligations as they fall due, under both normal and a range of stress conditions.
Risk Appetite Trigger: an early warning trigger set at a level that accounts for the scope and nature of available management actions and ensures that corrective management action can take effect and prevent a risk tolerance limit breach.
Risk Tolerance: the maximum amount of risk the Bank is prepared to tolerate above risk appetite. The metric is referred to as a risk tolerance limit.
Risk Capacity: the maximum amount of risk the Bank is able to support within its available financial resources.
Risk Appetite Statement (RAS): the documented expression of risk appetite and risk tolerance which have been approved by the Board. The RAS is reviewed and revised, if necessary, on an annual basis.
Risk Profile: the risk profile is defined in terms of three dimensions, namely:
• current or forward risk profile;
• unstressed or stressed risk profile; and
• pre- or post-management actions.
The following diagram provides a schematic view of the three levels of risk appetite and the integral role that risk types play in the process of cascading risk appetite from dimensions such as regulatory capital, economic capital, stressed earnings and liquidity to more granular portfolio limits.
Risk CultureThe Bank leverages on the three lines of defence model to build and maintain a strong risk culture, where resilience is a priority for the effective management of risk across the Bank. Focus is placed on multiple drivers to enhance risk culture, with emphasis on doing the right business, the right way. Employees are empowered to act with confidence, drive meaningful behavioural changes and place the customer at the centre of everything they do, through the embedment of the Bank’s values and code of ethics, compliance training and whistle-blowing programmes.
Key components of the Bank’s Risk culture include:
• Tone from the Top – Directors and Executive Management are required to consistently act professionally and ethically in line with the principles of integrity, accountability and transparency, thus leading by example and promoting and maintaining trust across the Bank.
• Robust Risk Governance – Executive Management continuously ensures that legal, regulatory and business requirements are fully embedded in the bank’s policies, processes and governance frameworks supported by robust control mechanisms to comply with same.
• Focus on Key and Emerging Risks – Executive Management is accountable to proactively identify and manage principal and emerging risks.
Risk Management TeamThe Risk Management Team provides the day to day oversight on management of risk and promotes a strong risk culture across the Bank. The function aims at reinforcing the Bank’s resilience by encouraging a holistic approach to the management of risk and return throughout the bank as well as the effective management of the Bank’s risk, capital and reputational profile. The following principles underpin the Bank’s risk culture:
• Risk is taken within the defined risk appetite and approved risk management framework;
• Continuous monitoring and management of risks; and
• The Bank needs to be adequately compensated for risks taken.
The Risk Management Team is responsible to create and maintain the risk practices across the Bank as defined by Group Risk and to ensure that controls are in place for all risk categories.
The Risk Function is subject to periodic assurance reviews by Group Internal Audit where it is assessed by specialised teams for each of the different types of risk. Internal Audit provides an assessment on the adequacy and effectiveness of the Bank’s processes for controlling its activities, managing its risks and ensuring good governance. It reports and provides recommendations on significant issues related to the risk management, control and governance processes within the Bank.
The Risk Management Team maintains its objectivity by being independent of operations. The Head: Risk has a direct reportingline into the Chief Executive and to Group Risk.
ENSURING OUR SUSTAINABILITY RISK AND CAPITAL MANAGEMENT REPORT CONTINUED
The First Line The Second Line
The Third Line
RISK MANAGEMENT & COMPLIANCE The second line of defence functions
provide independent oversight and assurance. Resources provide oversight
of risks and support management in ensuring that their specific risks are
effectively managed as close to the source as possible. The second line of defence
functions develop, implement and integrate governance standards, frameworks and
policies for each material risk type to which the Bank is exposed. This ensures consistency and
an enterprise-wide approach across business lines. Compliance with the standards and
frameworks is ensured through self-assessments by the second line of defence and reviews by IA.
INTERNAL AUDIT (IA) The Third line of defence provides independent and objective assurance to the Board and senior management on the effectiveness of the first and second lines of defence. This responsibility lies with the IA function.
LEVEL ONE
Risk appetite dimensions
LEVEL TWO
Risk appetite dimensions by
risk type
LEVEL THREE
Portfolio limits by risk type
Risk Appetite
Capital
• Economic Capital Coverage Ratio
• Total Regulatory Capital Adequacy Ratio
• Tier 1 Regulatory Capital Adequacy Ratio
• Common Equity Tier 1 Capital Adequacy Ratio
Earnings Volatility
• Stressed Earnings
Liquidity
• Liquidity Coverage Ratio
• Liquidity Stress Coverage
• Net Stable Funding Ratio
• Total Regulatory
• Credit Risk
• Operational Risk
• Market Risk
Capital demand/earnings at risk utilisation per risk type
RAS
Credit Risk
• CLR
• NPL
• Watchlist
• Concentrations
Operational Risk
• Operational risk losses as a % of gross income
Market Risk
• Normal value-at-risk (VaR) and stressed VaR (SVaR) limits
Interest rate risk
• Interest rate sensitivity
Liquidity risk
• Depositor concentration
Business risk
• ROE
• Cost to income
• JAWS
Three Lines of Defense Model
35STANDARD BANK (MAURITIUS) LIMITED Annual report 202034

In 2020, the Bank kick-started its Integrated Recovery Plan in order to identify credible recovery options; that can be implemented in the short or medium term; under a range of idiosyncratic and market-wide stress scenarios, addressing both capital shortfalls and liquidity pressures.
Severe stress scenarios proposed were primarily chosen in line with the Bank’s operating model and key target markets and also included top macroeconomic concerns on a global and country-specific level. Scenarios selected by the Bank were:
• Combined Stress: Extreme Covid-19 Impact
• Bank-Specific Stress: Impact of a cyber-attack on the Bank
• Systemic Stress: Impact of sanctions on Mauritius as a jurisdiction
The IRP highlighted circumstances in which capital and liquidity ratios and earnings may be impacted under severe stress conditions. A list of mitigating actions was identified and will be considered and activated as needed to recover financial strength and viability under severe stress.
Risk Type Stress TestingRisk type stress tests apply to individual risk types. Risk type stress testing could take the form of scenario or sensitivity analysis.
(Refer to ICAAP section under Capital Management)
1. Credit Risk*
Overview and DefinitionCredit risk is the risk of loss arising out of the failure of obligors to meet their financial or contractual obligations when due. It is composed of obligor risk, concentration risk and country risk.
Concentration RiskConcentration risk is the risk of loss arising from an excessive concentration of exposure to a single counterparty, an industry, a product, a geography, maturity, or collateral.
Approach to Managing Credit RiskCredit risk is managed in accordance with the Bank’s comprehensive credit risk management control framework. The Credit Standard sets out the principles and minimum control requirements under which the Bank is prepared to assume credit risk and is supported by multiple underlying policies and procedures.
Credit risk is managed through:
• Setting the appetite for credit risk with respect to counterparty, sector and country concentrations with regular monitoring to proactively adjust to changes in client’s economic environment. All countries to which the Bank is exposed are reviewed at least annually. Internal rating models are employed to determine ratings for jurisdiction, sovereign and transfer and convertibility risk;
• Maintaining a culture of responsible lending through a robust risk policy and control framework;
• Ensuring that there is expert scrutiny and approval of credit risk and its mitigation via a strong delegated authority framework, independently of the business functions;
• Identifying, assessing and measuring credit risk across the Bank, from an individual facility level through to an aggregate portfolio level;
• Monitoring the Bank’s credit risk exposure relative to approved customer limits, risk appetites, changes in economic environment (countries, sectors) and client state of affairs to identify early signs of weaknesses in the exposure which will enable the Bank to take prompt action
such as tightening of appetite for particular products, increase in collateral requirements or curtailing originations;
• Independent credit risk reviews by second and third lines of defence to assess quality of credit evaluation and adherence to credit risk standards;
• Defining, implementing and continually re-evaluating risk appetite under actual and stressed conditions.
Credit Risk MitigationWherever warranted, the Bank will attempt to mitigate credit risk to any counterparty, transaction, sector, or geographic region, to achieve the optimal balance between risk, cost, capital utilisation and reward. Risk mitigation may include the use of collateral, the imposition of financial or behavioural covenants, the acceptance of guarantees from parents or third parties, the recognition of parental support and the distribution of risk.
In the case of collateral where the Bank has an unassailable legal title, the Bank’s policy requires collateral to meet certain criteria including:
• being readily marketable and liquid;
• being legally perfected and enforceable;
• having a low valuation volatility;
• being readily realisable at minimum expense;
• having no material correlation to the obligor credit quality;
• having an active secondary market for resale.
The main types of collateral obtained by the Bank for its exposures include:
• cash collaterals;
• fixed charges over commercial and industrial properties;
• floating charges;
• pledges of receivables;
• corporate guarantees.
Classification of NPL accounts under sub-standard, doubtful and loss:1. Sub-standard credit
Credit that is currently performing but has weaknesses that throw doubt on the customer’s ability to comply with the terms and conditions of the credit, may warrant to be classified as a sub-standard. However, when it is impaired and is past due between 90 and 180 days, it must, as a minimum, be classified as sub-standard.
2. Doubtful credit Credit that is not in arrears or in arrears in less than 180 days but has weaknesses that make collection in full highly improbable, may warrant to be classified to doubtful. However, when it is impaired and in past due for a period exceeding 180 days but less than one year, it must, as a minimum, be classified as doubtful.
3. Loss Credit classified as loss and uncollectible although there may be some salvage or recovery value of security available. Such credit should not be kept on the financial institution’s book for the reason that there might be some recoveries in the long term. An impaired credit that is past due in excess of a year, must be classified as loss.
Managing Credit Risk in a Covid-19 driven environment The Covid-19 outbreak was declared a Public Health Emergency of International Concern on 30 January 2020 by the World Health Organisation. The pandemic took a toll on human life and brought major disruption to economic activity across the world. Covid-19 hit the African continent in a context of persistently weak growth and investment and declining commodity prices with the hardest impact on the oil exporting countries due to the low oil prices.
Risk Appetite Statement (RAS)Executive Management and the Board Risk Management & Conduct Review Committee are responsible for recommending the RAS for approval by the Board. In developing the RAS, Executive Management considers the Bank’s strategy and the desired balance between risk and return. The Board Risk Management & Conduct Review Committee reviews the Bank’s current risk profile on a quarterly basis and forward risk profile (both stressed and unstressed) at least annually.
Level one risk appetite dimensions can be either quantitative or qualitative.
Quantitative level one risk appetite dimensions relate to available financial resources and earnings volatility. The standardised quantitative dimensions used by the Bank are:
• stressed earnings;
• economic capital;
• regulatory capital; and
• liquidity.
The Bank’s qualitative RAS, set out below, serves as a guide for embedding the risk appetite framework to guide strategic and operational decision making across the Bank.
• Capital position: The Bank aims to have a strong capital adequacy position measured by regulatory and economic capital adequacy ratios. Capital levels are managed to support business growth, maintain depositor and creditor confidence, create value for shareholders and ensure regulatory compliance.
• Funding and liquidity management: The Bank’s approach to liquidity risk management is governed by prudence and is in accordance with the applicable laws, regulations and takes into account the competitive environment in which the bank operates. The Bank manages liquidity risk on a self-sufficient basis.
• Earnings volatility: The Bank aims to have sustainable and well diversified earning streams in order to minimise earnings volatility through business cycles.
• Reputation: The Bank has no appetite for compromising its legitimacy or for knowingly engaging in any business, activity or relationship which, in the absence of taking mitigating actions, could result in foreseeable reputational risk or damage to the Bank and Standard Bank Group.
• Conduct: The Bank has no appetite for unfair customer outcomes arising from inappropriate judgement and conduct in the execution of our business activities, or wilful breaches of regulatory requirements. The Bank strives to meet customers’ expectations for efficient and fair engagements by doing the right business the right way, thereby upholding the trust of our stakeholders.
Level two risk appetite represents the allocation of level one risk appetite to risk types. Specifically, the contribution of individual risk types to earnings volatility and overall capital demand (both economic and regulatory) is controlled through triggers and limits.
Level three consists of key metrics used to monitor the portfolio. Portfolio triggers and limits are required to be broadly congruent with level one and level two triggers and limits. These metrics are regularly monitored at a risk type level and ensure proactive risk management.
Stress Testing Stress Testing Governance FrameworkStress testing is a key management tool within the Bank and is used to evaluate the sensitivity of the current and forward risk
profile relative to different levels of risk appetite. Stress testing supports a number of business processes, including:
• strategic and financial planning;
• the Internal Capital Adequacy Assessment Process and the Integrated Recovery Plan, including capital planning and management, and the setting of capital buffers;
• liquidity planning and management;
• informing the setting of risk appetite;
• identifying and proactively mitigating risks through actions such as reviewing and changing limits, limiting exposures, and hedging; and
• facilitating the development of risk mitigation or contingency plans, including recovery plans, across a range of stressed conditions.
Stress testing within the Bank is subject to the Bank’s stress testing governance framework which sets out the responsibilities for and approaches to stress testing activities. Broadly aligned and fit-for-purpose stress testing programmes are implemented for the Bank to ensure appropriate coverage of the different risks.
Stress Testing ProgrammeThe Bank’s stress testing programme uses one or a combination of stress testing techniques, including scenario analysis and sensitivity analysis to perform stress testing for different purposes.
Macroeconomic Stress TestingMacroeconomic stress testing is conducted across all major risk types on an integrated basis for a range of economic scenarios varying in severity from mild to very severe but plausible macroeconomic shocks. The impact, after consideration of mitigating actions, on the Bank’s income statement, Statement of Financial Position and the Bank’s capital demand and supply is measured against the Bank’s risk appetite.
Macroeconomic stress testing for the Bank is performed, as a minimum, once a year for selected scenarios that are specifically designed to target the Bank’s risk profile, geographical presence and strategy. In 2020, the impact of the Global Pandemic was simulated. The results indicated that the Bank is well capitalised and able to handle the stress.
Macroeconomic stress testing results are presented at a board level in order to consider whether the Bank’s risk profile is consistent with the Bank’s risk appetite buffer. Macroeconomic stress testing results are submitted as part of the annual ICAAP.
Additional Stress TestingBank-wide macroeconomic stress testing results are supplemented with additional ad hoc stress testing at the Bank, that may be required from time-to-time for risk management or planning purposes. The purpose of this stress testing is to inform management of risks that may not yet form part of routine stress testing or where the focus is on a specific portfolio or business unit. Additional stress testing can take the form of either scenario analysis or sensitivity analysis.
Integrated Recovery Planning (IRP)Recovery and resolution planning is a global regulatory reform introduced to improve international financial stability and reduce the likelihood of the failure of systemically important financial institutions. The recovery plan identifies management actions which can be adopted during periods of severe stress to ensure the survival of our business and of the economy within which the Bank operates.
*Information in this section has been audited
ENSURING OUR SUSTAINABILITY RISK AND CAPITAL MANAGEMENT REPORT CONTINUED 37STANDARD BANK (MAURITIUS) LIMITED Annual report 202036
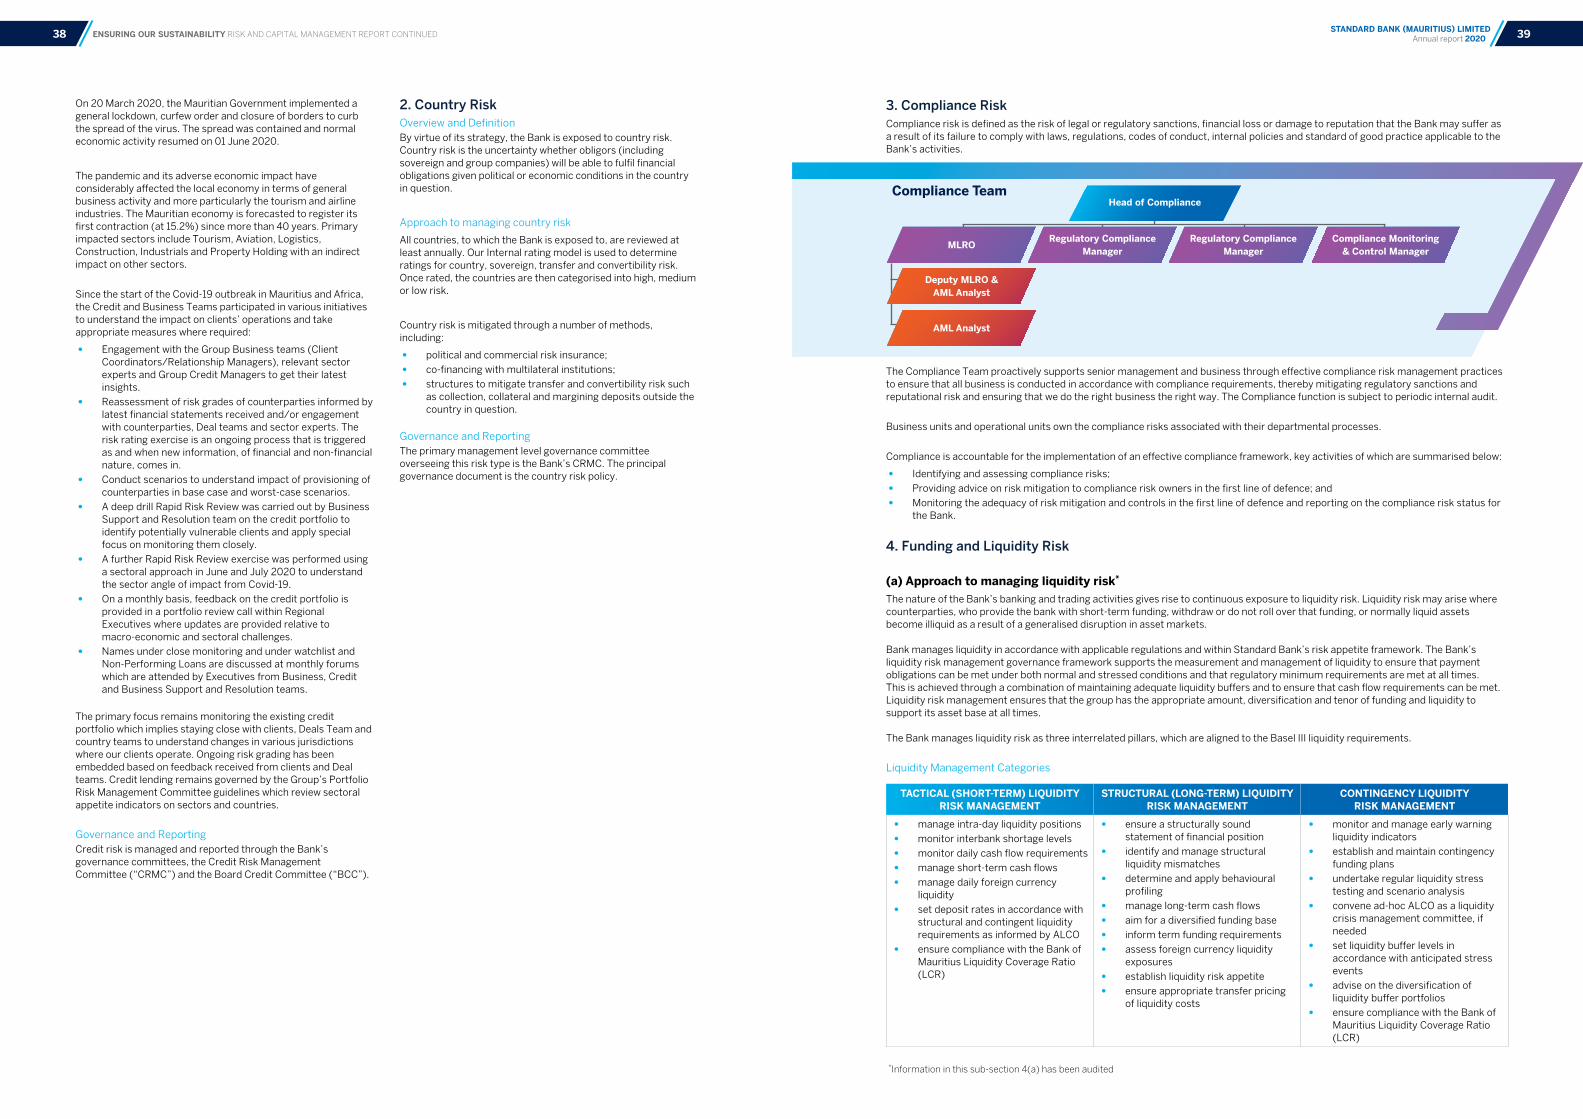
Compliance team
Compliance TeamHead of Compliance
MLRO
Deputy MLRO & AML Analyst
AML Analyst
Regulatory ComplianceManager
Regulatory ComplianceManager
Compliance Monitoring& Control Manager
On 20 March 2020, the Mauritian Government implemented a general lockdown, curfew order and closure of borders to curb the spread of the virus. The spread was contained and normal economic activity resumed on 01 June 2020.
The pandemic and its adverse economic impact have considerably affected the local economy in terms of general business activity and more particularly the tourism and airline industries. The Mauritian economy is forecasted to register its first contraction (at 15.2%) since more than 40 years. Primary impacted sectors include Tourism, Aviation, Logistics, Construction, Industrials and Property Holding with an indirect impact on other sectors.
Since the start of the Covid-19 outbreak in Mauritius and Africa, the Credit and Business Teams participated in various initiatives to understand the impact on clients’ operations and take appropriate measures where required:
• Engagement with the Group Business teams (Client Coordinators/Relationship Managers), relevant sector experts and Group Credit Managers to get their latest insights.
• Reassessment of risk grades of counterparties informed by latest financial statements received and/or engagement with counterparties, Deal teams and sector experts. The risk rating exercise is an ongoing process that is triggered as and when new information, of financial and non-financial nature, comes in.
• Conduct scenarios to understand impact of provisioning of counterparties in base case and worst-case scenarios.
• A deep drill Rapid Risk Review was carried out by Business Support and Resolution team on the credit portfolio to identify potentially vulnerable clients and apply special focus on monitoring them closely.
• A further Rapid Risk Review exercise was performed using a sectoral approach in June and July 2020 to understand the sector angle of impact from Covid-19.
• On a monthly basis, feedback on the credit portfolio is provided in a portfolio review call within Regional Executives where updates are provided relative to macro-economic and sectoral challenges.
• Names under close monitoring and under watchlist and Non-Performing Loans are discussed at monthly forums which are attended by Executives from Business, Credit and Business Support and Resolution teams.
The primary focus remains monitoring the existing credit portfolio which implies staying close with clients, Deals Team and country teams to understand changes in various jurisdictions where our clients operate. Ongoing risk grading has been embedded based on feedback received from clients and Deal teams. Credit lending remains governed by the Group’s Portfolio Risk Management Committee guidelines which review sectoral appetite indicators on sectors and countries.
Governance and ReportingCredit risk is managed and reported through the Bank’s governance committees, the Credit Risk Management Committee (“CRMC”) and the Board Credit Committee (“BCC”).
2. Country RiskOverview and DefinitionBy virtue of its strategy, the Bank is exposed to country risk. Country risk is the uncertainty whether obligors (including sovereign and group companies) will be able to fulfil financial obligations given political or economic conditions in the country in question.
Approach to managing country risk
All countries, to which the Bank is exposed to, are reviewed at least annually. Our Internal rating model is used to determine ratings for country, sovereign, transfer and convertibility risk. Once rated, the countries are then categorised into high, medium or low risk.
Country risk is mitigated through a number of methods, including:
• political and commercial risk insurance;
• co-financing with multilateral institutions;
• structures to mitigate transfer and convertibility risk such as collection, collateral and margining deposits outside the country in question.
Governance and ReportingThe primary management level governance committee overseeing this risk type is the Bank’s CRMC. The principal governance document is the country risk policy.
3. Compliance Risk Compliance risk is defined as the risk of legal or regulatory sanctions, financial loss or damage to reputation that the Bank may suffer as a result of its failure to comply with laws, regulations, codes of conduct, internal policies and standard of good practice applicable to the Bank’s activities.
The Compliance Team proactively supports senior management and business through effective compliance risk management practices to ensure that all business is conducted in accordance with compliance requirements, thereby mitigating regulatory sanctions and reputational risk and ensuring that we do the right business the right way. The Compliance function is subject to periodic internal audit.
Business units and operational units own the compliance risks associated with their departmental processes.
Compliance is accountable for the implementation of an effective compliance framework, key activities of which are summarised below:
• Identifying and assessing compliance risks;
• Providing advice on risk mitigation to compliance risk owners in the first line of defence; and
• Monitoring the adequacy of risk mitigation and controls in the first line of defence and reporting on the compliance risk status for the Bank.
4. Funding and Liquidity Risk
(a) Approach to managing liquidity risk*
The nature of the Bank’s banking and trading activities gives rise to continuous exposure to liquidity risk. Liquidity risk may arise where counterparties, who provide the bank with short-term funding, withdraw or do not roll over that funding, or normally liquid assets become illiquid as a result of a generalised disruption in asset markets. Bank manages liquidity in accordance with applicable regulations and within Standard Bank’s risk appetite framework. The Bank’s liquidity risk management governance framework supports the measurement and management of liquidity to ensure that payment obligations can be met under both normal and stressed conditions and that regulatory minimum requirements are met at all times. This is achieved through a combination of maintaining adequate liquidity buffers and to ensure that cash flow requirements can be met. Liquidity risk management ensures that the group has the appropriate amount, diversification and tenor of funding and liquidity to support its asset base at all times. The Bank manages liquidity risk as three interrelated pillars, which are aligned to the Basel III liquidity requirements.
Liquidity Management Categories
TACTICAL (SHORT-TERM) LIQUIDITY
RISK MANAGEMENTSTRUCTURAL (LONG-TERM) LIQUIDITY
RISK MANAGEMENTCONTINGENCY LIQUIDITY
RISK MANAGEMENT
• manage intra-day liquidity positions
• monitor interbank shortage levels
• monitor daily cash flow requirements
• manage short-term cash flows
• manage daily foreign currency liquidity
• set deposit rates in accordance with structural and contingent liquidity requirements as informed by ALCO
• ensure compliance with the Bank of Mauritius Liquidity Coverage Ratio (LCR)
• ensure a structurally sound statement of financial position
• identify and manage structural liquidity mismatches
• determine and apply behavioural profiling
• manage long-term cash flows
• aim for a diversified funding base
• inform term funding requirements
• assess foreign currency liquidity exposures
• establish liquidity risk appetite
• ensure appropriate transfer pricing of liquidity costs
• monitor and manage early warning liquidity indicators
• establish and maintain contingency funding plans
• undertake regular liquidity stress testing and scenario analysis
• convene ad-hoc ALCO as a liquidity crisis management committee, if needed
• set liquidity buffer levels in accordance with anticipated stress events
• advise on the diversification of liquidity buffer portfolios
• ensure compliance with the Bank of Mauritius Liquidity Coverage Ratio (LCR)
ENSURING OUR SUSTAINABILITY RISK AND CAPITAL MANAGEMENT REPORT CONTINUED
*Information in this sub-section 4(a) has been audited
39STANDARD BANK (MAURITIUS) LIMITED Annual report 202038

As at 31 December 2020, the Bank was within regulatory compliance with a MUR Liquidity Coverage Ratio (LCR) of 134%, a USD LCR of 133% and a consolidated LCR of 105%.
(c) GovernanceThe primary governance committee overseeing liquidity risk is the Asset and Liability Management Committee (ALCO).
(d) Liquidity characteristics and metricsOverview of Liquidity and Funding Metrics
(e) Liquidity Coverage Ratio (LCR) Disclosures:
1 The quarterly average of bimonthly observations for the period October 2020 to December 20202 The quarterly average of daily HQLA is based on close of day figures over the period 01 October 2020 to 31 December 2020
The LCR is a metric introduced by the BCBS to measure a bank’s ability to manage a sustained outflow of customer funds in an acute stress event over a 30-day period. The ratio is calculated by taking the Bank’s high-quality liquid assets (HQLA) and dividing it by net cash outflows. The LCR rule issued by the Bank of Mauritius became effective in Mauritius in November 2017 with the following transitional arrangements.
(b) LCR implementation timeline
Consolidated in USD
TOTAL UNWEIGHTED VALUE
(quarterly average of bimonthly observations)1
TOTAL WEIGHTED VALUE
(quarterly average of bimonthly observations)1
HIGH-QUALITY LIQUID ASSETS USD USD
Total high-quality liquid assets (HQLA) 255,002,326 255,002,326
CASH OUTFLOWS
Retail deposits and deposits from small business customers (Less Stable)
25,165,297 5,244,497
Unsecured wholesale funding (Non-operational deposits) 1,576,609,718 884,911,585
Outflows related to derivative exposures and other collateral requirements
1,078,333 1,078,333
Credit and liquidity facilities 169,921,110 21,809,187
Other contingent funding obligations 24,417,354 1,220,868
TOTAL CASH OUTFLOWS 1,797,191,812 914,264,470
CASH INFLOWS
Inflows from fully performing exposures 895,280,356 879,527,357
TOTAL CASH INFLOWS 895,280,356 879,527,357
TOTAL ADJUSTED VALUE
TOTAL HQLA 255,002,326
TOTAL NET CASH OUTFLOWS 228,296,534
LIQUIDITY COVERAGE RATIO (%) 112%
QUARTERLY AVERAGE OF DAILY HQLA2 234,500,605
As from 30 November 2017
As from 31 January 2018
As from 31 January 2019
As from 31 January 2020
LCR in Mauritian Rupee (MUR) 100% 100% 100% 100%
LCR in material foreign currencies 60% 70% 80% 100%
Consolidated LCR 60% 70% 80% 100%
2020 2019 2018
Total Liquidity Reserves (USDm) 1,377 1,065 1,188
Eligible BOM LCR HQLA (USDm) 237 204 165
Single depositor (MUR%) 17.98% 36.90% 34.65%
Top 10 depositors (MUR%) 49.98% 71.92% 70.15%
Single depositor (FCY%) 15.54% 5.10% 6.39%
Top 10 depositors (FCY%) 43.66% 29.42% 37.63%
BOM LCR (Quarterly average of monthly observations%) 112% 110% 88%
*Information in this section has been audited
(e) Liquidity Coverage Ratio (LCR) Disclosures (Continued)The high-quality liquid assets comprise mainly of investment in US Treasury Bills, Government of Mauritius Treasury Bills, Bank of Mauritius Bills, coins and bank notes and qualifying central bank reserves. The cash outflows represent the funding of the Bank categorised as per the Bank of Mauritius guideline on Liquidity Risk Management and weighted at the appropriate run-off rate (most conservative between internal data and the regulatory guideline). The Bank’s cash inflows comprise mainly of group placements maturing within the next 30 days.
The Bank seeks to exceed the minimum LCR requirement with a sufficient buffer to allow for funding flows volatility as determined by its internal liquidity risk appetite. A buffer is maintained above the minimum regulatory requirement to cater for balance sheet and market volatility.
(f) Contingency liquidity risk management(i) Contingency funding plans
Contingency funding plans are designed to protect stakeholder interests and maintain market confidence in the event of a liquidity crisis. The plans incorporate an early warning indicator process supported by clear crisis response strategies. Early warning indicators are monitored according to assigned frequencies and tolerance levels.
Crisis response strategies are formulated for the relevant crisis management structures and address internal and external communications and escalation processes, liquidity generation management actions and operations, and heightened and supplementary information requirements to address the crisis event. The updating of contingency funding plans, while considering budget forecasting, continues to be a focus area for the asset liability management team.
(ii) Liquidity stress testing and scenario analysis
Stress testing and scenario analysis are based on hypothetical and historical events. These are conducted on the Bank’s funding profiles and liquidity positions. The crisis impact is typically measured over a 30 calendar-day period as this is considered the most crucial time horizon for a liquidity event. This measurement period is also consistent with the LCR requirements.
Anticipated on and off-balance sheet cash flows are subjected to a variety of bank-specific and systemic stresses and scenarios to evaluate the impact of unlikely but plausible events on liquidity positions. The results are assessed against the liquidity buffer and contingency funding plans to provide assurance as to the Bank’s ability to maintain sufficient liquidity under adverse conditions.
Internal stress testing metrics are supplemented with the regulatory LCR in monitoring the Bank’s ability to survive severe stress scenarios.
(g) Structural liquidity mismatch
Maturity analysis of financial liabilities using behavioural profiling
With actual cash flows typically varying significantly from the contractual position, behavioural profiling is applied to assets, liabilities and off-balance sheet commitments, as well as to certain liquid assets. Behavioural profiling assigns probable maturities based on historical customer behaviour. This is used to identify significant additional sources of structural liquidity in the form of core deposits, such as current and savings accounts, which exhibit stable behaviour despite being repayable on demand or at short notice.
To highlight potential risks within the Bank’s defined liquidity risk thresholds, structural liquidity mismatch analysis are performed regularly to anticipate the mismatch between payment profiles of statement of financial position items.
5. Market Risk*
Overview and Definition
The Bank defines market risk as the risk of a change in market value, actual or effective earnings or future cash flows of a portfolio of financial instruments, including commodities, caused by adverse moves in market variables such as equity, bond and commodity prices, currency exchange rates and interest rates, credit spreads, recovery rates, correlations and implied volatilities in all of these variables. To ensure that all market risks are identified, all new products are required to be signed off by the New Products Committee where Market Risk Unit‘s input is mandatory.
Managing Market Risk
The market risk management framework applied in the Bank is consistent with the Group’s market risk management framework:
• The board-approved Market Risk Policy outlines the framework and principles designed to properly identify, measure, monitor, manage and report market risk in order to minimise the risk of financial loss.
• Board monitors compliance with the policy and ensures that an appropriately mandated Assets & Liabilities Committee (ALCO) is established to enforce compliance with the policy.
• Risk appetite is set and approved by the Board and is expressed in terms of the following compulsory and optional measures for the Bank’s trading operations:
• A Value at Risk (VaR) and Stressed VaR (SVaR) appetite (compulsory for trading portfolios and liquid investment portfolios).
• An appetite for loss under stress market conditions (compulsory).
• A regulatory or economic capital value (optional).
Market Risk Unit translates the risk appetite into limits and triggers and allocates these to individual trading desks in the form of trading limits and authorised product mandates. If the Bank enters a period of market volatility, stop loss procedures are in place to cap losses. Stop loss triggers are set to ensure that losses suffered in trading do not erode, or have the potential to erode, the income generated by the market making and sales activity. As such, the overall objective is to preserve the bank’s revenue.
A stop loss trigger alert can result in any or all of the following actions being taken:
• Risk position reduction;
• Risk limit(s) reduction;
• Transfer of positions out of the control of the relevant trader and into that of Management.
Market Risk Unit ensures that the trading portfolio is carried at fair value by ensuring that the market risk models used to mark-to-market are appropriate (model validation) and that the inputs into those models are relevant and reflective of current market conditions (price validation).
The Market Risk Management unit is independent of trading operations and accountable to ALCO.
ENSURING OUR SUSTAINABILITY RISK AND CAPITAL MANAGEMENT REPORT CONTINUED 41STANDARD BANK (MAURITIUS) LIMITED Annual report 202040

Market Risk Measurement
Market risk is measured under both normal and stressed market conditions.
Metric: VAR (Value at Risk)
Measurement of trading exposures under normal market conditions is based on Value at Risk (VaR). Normal VaR is calculated on a historical simulation basis with 250 days of market data and uses a 95% confidence interval and a one day holding period. This means that losses are not expected to exceed the projected number with a likelihood of 95% (or 19 days out of 20). The VaR calculation assumes no corrective action is taken during the assumed holding period.
Measurement of daily trading exposures under stress market conditions is based on VaR defined with a 10-day holding period, worst case and historical data for a period of 5 years. The quality of the VaR model is continuously monitored by back testing the VaR results for trading books. All back-testing exceptions and any exceptional revenues on the profit side of the VaR distribution are investigated. Stressed VaR is supplemented by cross market stress tests where the Bank measures the impact of abnormal exchange rate and interest rate movements.
Metric – FX Delta and PV01
Risk sensitivities highlight how exposed a portfolio is to certain market variables notably exchange rates and interest rates. FX risk is monitored through FX Delta, FX Delta being the present value of foreign currency positions reflecting how exposed the bank is to fluctuations in exchange rates. Interest Rate risk is monitored through PV01; PV01 being the change in the present value or mark-to-market value of the portfolio as a result of moving interest rates up by 1 basis point (0.01%).
Managing Market Risk in a Covid-19 environment
The Bank’s strategy for Global Markets remained unchanged post lock down. The product offering continued to focus on client forex flows though same curtailed in light of the forecast global recession. The Forex Desk runs MUR risk and has a natural short MUR position (i.e. long USD position) based on client flows.
All other flows are hedged and hence risk is marginal. The desk held onto the USD as MUR was expected to be under pressure. Bank of Mauritius supported the currency with regular interventions on the market. Interest rate risk on the trading book is marginal in light of an insignificant Money Market trading book. No significant change was witnessed in the risk profile.
Reporting
Exposures and excesses are monitored and reported daily to the Bank and Group, monthly to ALCO and quarterly to the Board Risk Management and Conduct Review Committee (BRMCRC). Where breaches in limits and triggers occur, actions are taken by the Market Risk Management unit to ensure that traders hedge exposures back in line with approved market risk appetite with such breaches being reported to Management, ALCO and BRMCRC.
In November 2020, the Market Risk Team rolled out a new cloud-based reporting tool and has since started the process of migrating excel based reports to Power BI which will provide stakeholders a better experience at analysing risk data.
Risk based supervision reporting was broadened in Q42020 to include Market Risk reporting and is now an integral part of the Bank’s set of regulatory returns. The bank has adequate systems in place to facilitate the compilation of the return.
6. Interest Rate Risk in the Banking BookInterest rate risk results from the different repricing characteristics of banking book assets and liabilities. The Bank’s IRRBB can be further divided into the following sub-risk types:
• Repricing risk: timing differences in the repricing of assets and liabilities;
• Yield curve risk shifts in the yield curve that have an adverse impact on the Bank’s income;
• Endowment risk: Exposure arising out of the net differential between interest rate insensitive assets such as on-earning assets and interest rate insensitive liabilities such as non-interest-bearing liabilities and equity.
Approach to managing interest rate risk
The adopted approach in mitigating IRRBB essentially involves managing the potential adverse effect of interest rate movements on the banking book.
A forward-looking net interest income forecast is used to quantify the Bank’s anticipated interest rate exposure. This approach involves the forecasting of both changing balance sheet structures and interest rate scenarios, to determine the effect these changes may have on future earnings. Balance sheet projections and the impact on net interest income due to rate changes cover a minimum of 12 months forecasting and is compared to the set limits. Desired changes to the interest rate risk profile are achieved through the restructuring of on-balance sheet repricing or maturity profiles.
7. Operational RiskOverview and Definition
Operational risk is the risk of loss suffered as a result of the inadequacy of or failure in internal processes, people and systems or from external events. Operational risks can arise from all the Bank’s activities. The Bank is exposed to operational risks in its day to day running of operations or whenever it accepts new business, originates new transactions, introduces new products, enters new markets, outsources activities or hires new staff.
Approach to Managing Operational Risk
The Bank recognises that operational risk exists in the natural course of business activity and adheres to the Group’s operational risk governance framework, which sets out the minimum standards for operational risk management adopted across all legal entities across the Standard Bank Group. This framework aligns to the Bank’s strategy by demonstrating that the purpose of operational risk management is not to eliminate all risks, which is not economically viable, but rather to enable Management to weigh the payoff between risk and reward. The framework also ensures that adequate and consistent governance is in place, guiding management to avoid unacceptable risks such as:
• breaking the law;
• damaging the group’s reputation;
• disrupting services to customers;
• wilful conduct failures;
• inappropriate market conduct;
• knowingly breaching regulatory requirements; and
• causing environmental damage.
The Bank’s approach to managing operational risk is to adopt fit-for-purpose operational risk practices that assist Line Management in understanding their residual risk and managing their risk profile within risk appetite. The management of operational risk primarily resides in first line, supported by second line with dedicated centres of excellence. The operational risk management function forms part of the second line of defence and reports to the Head: Risk.
The core capabilities of operational risk management ensure alignment and integration across:
• developing and maintaining the operational risk governance framework;
• facilitating the business’s adoption of the operational risk framework;
• providing guidance and advice to the frontline;
• regulatory oversight;
• monitoring and assurance; and
• reporting.
The well embedded operational risk framework sets out a structured, consistent approach for managing operational risk across the Bank and is based on the following core components:
Risk & Controls Self-Assessment (RCSA)
The Bank inculcates the culture of self-assessment whereby each business unit and corporate function is required to analyse its business activities and critical processes to identify the key operational risks to which it is exposed and assess the adequacy and effectiveness of its mitigating controls. For any area where Management concludes that the level of residual risk is beyond an acceptable level, it is required to define action plans to reduce the level of risk. These assessments are facilitated, monitored and challenged by the Operational Risk team at least annually.
Key Risk Indicators (KRIs)
KRIs are used to monitor the operational risk profile and alert the Bank to impending problems in a timely manner. Relevant risks and controls highlighted in the risk and control self-assessment are monitored through KRIs. The implementation of the Key Risk Indicators process is an integral element in providing an early warning indicator through trigger thresholds of a potential increase in risk exposure and/or a potential breakdown of controls.
KRIs enable the monitoring of the Bank’s control culture, business environment and trigger mitigating actions and facilitate the forward-looking management of operational risks based on early warning signals.
Incident Management & Reporting
Operational risk incidents are recorded and reported. The definition of operational risk incidents includes not only events resulting in actual loss, but those resulting in non-financial impacts and near misses. The continuous collection of operational risk loss events is a pre-requisite for operational risk management including analysis and provision of timely information to Management. Reporting and analysis is undertaken for operational risk loss events and near-misses.
This includes:
• Trends in previous events, near misses, losses and business environment where such incidents are occurring;
• Root cause analysis; and
• Review of control improvements and other actions to prevent or mitigate the recurrence.
Non-Financial Risk Subtypes
Non-Financial Risks are considered inherent in the operations of a business. They generally do not have a financial upside; they cannot always be measured in financial terms and can lead to severe reputational damage. The term Non-Financial Risk is usually used to define by exclusion, the traditional financial risks such as market, liquidity, credit risk that is well understood, measured and quantified. Non-Financial Risks cover such a broad spectrum of circumstances and events that it is now categorised into subtypes and managed by specialists’ functions. These include the following:
The following risks have a material impact, based on their estimated severity and likelihood and were thus identified for closer management, monitoring and reporting:
• Technology Risk
• Cyber Risk
• Compliance Risk
• Financial Crime Risk
• Information Risk
• People Risk
• Business Resilience Risk
• Third-Party Risk
• Conduct Risk
ENSURING OUR SUSTAINABILITY RISK AND CAPITAL MANAGEMENT REPORT CONTINUED
Business ResilienceRisk
Legal Risk
Model Risk
People Risk
Technology Risk
Third-party Risk
TransactionProcessing Risk
Physical Assets, Safety and SecurityRisk
Conduct Risk
Compliance Risk
Cyber Risk
Tax Risk
Financial Crime Risk
Information Risk
Financial AccountingRisk
Environmental, Socialand Governance Risk
43STANDARD BANK (MAURITIUS) LIMITED Annual report 202042

The above risks types are inherent in the Bank’s operations. Risks associated with these risk types were identified and assessed and no significant risk was found that required management focus at the enterprise level.
Technology Risk
Technology Risk is the inability to manage, develop and maintain secure, agile technology assets to support strategic objectives, operational efficiencies and robust risk management. Customer experience, as a strategic imperative, is directly and heavily influenced by effectiveness of technology in providing relevant, innovative, secure and stable digital as well as physical service offerings. The Bank’s strategic imperatives namely customer centricity and digitisation are all enabled by technology and the success or failure in achieving the technology goals will directly impact the achievement of business objectives. Technology risk is therefore a major factor in successful strategy execution.
Given the nature and scale of the Bank’s business, some interruption is inevitable and IT incidents and downtime cannot be completely avoided. Management focus and capability is placed on the ability to predict, prevent, detect and rapidly respond to, and manage the risks associated with incidents.
The Group is working towards a simple technology landscape that will enable the Bank to manage IT changes in response to business changes in an agile and efficient manner. Investment is being undertaken in the sourcing of new talent and in the development of existing employees with IT skills that support the Group’s digital and data strategic objectives.
In 2020, the Group continued to simplify the IT landscape which entailed reducing and consolidating systems as well as improving the quality of platforms. The Group continues to explore more opportunities to optimise transaction processing activities through the use of robotic process automation, application programming interfaces and AI.
Migrating IT platforms to the cloud is a critical component to the Group’s strategic journey to a fully digital organisation, which it continued to adapt to best serve our multi-faceted clients. The Group has established strategic relationships with prominent and reputable cloud service providers, and a cloud business council to fast-track this migration. To that effect, a regulatory webinar was organised by the Group in July 2020 whereby representatives of all Central Banks had been invited to attend.
In October 2020, a presentation, led by the Group Head, IT Governance, Risk & Compliance, was held with Bank of Mauritius representatives to explain the Bank’s Cloud Migration Strategy. Subsequent to the meeting, the Bank initiated regulatory approval processes for migration of material workloads.
The Group aims to further accelerate the execution of its secure cloud migration strategy to enhance its competitive advantage.
Cyber Risk
Cyber Risk is the risk of financial loss, disruption or damage to reputation from breaches or attacks on transaction sites, systems or networks. Cybercrime includes cyber fraud, data theft, extortion (ransomware) and malicious business disruption. The escalation in the scale and sophistication of cybercrime is amplified by the growing digitisation of businesses and the complexity of running ageing systems.
In response to the growing volume and sophistication of cybercrime incidents and attacks, the Bank has endorsed the Group’s IT cyber security strategy which is centred around the four key pillars of governance, culture, capability and community, all of which are crucial for an effective cyber defence strategy. 2020 saw a continued focus on improving cyber security capabilities including the following key initiatives:
• Proper controls, procedures and hardening of endpoints were applied to maintain cyber security hygiene to further strengthen the Bank’s holistic security posture.
• Vulnerability Management capabilities were enhanced.
• Migration of end-of-life systems.
• Improved Cyber Security Operations Centre (CSOC) monitoring across the Group. The CSOC houses a team responsible for monitoring and analysing the security posture on an ongoing basis. The team detects and responds to incidents using a number of solutions and a set of processes. This ensures that any security issue is promptly addressed once identified.
• Cyber-attack simulation was conducted to improve detection and remediation. The simulation was undertaken to exploit the vulnerabilities from a hacker’s viewpoint and test management response to such crisis following which remedial actions were taken to address identified loopholes.
Cyber risk continues to be recognised as one of the most important risks to the Bank. Focus on developing capabilities that can reduce attacks and raise the cost to attackers continued throughout the year. The escalation in the scale and sophistication of cyber-attacks is amplified by the growing digitisation of businesses and the complexity of running ageing systems. The Bank is cognisant of the mounting risk posed by cyber-attacks and significant investments have been made to enhance security capabilities and accelerate strategic directives.
As the Bank migrates its content digitally, more payments arebeing channelled through the Bank’s internet banking and application platforms, and more customers are favouring these channels. Customers are vulnerable to phishing attacks, whereby criminals fraudulently access their bankinginformation. At a Group Level, investment continues in anti-phishing and device profiling capabilities to frustrate fraudsters. The Group has partnered with world-class antiphishing experts to identify and shut down phishing sites masquerading as Standard Bank.
The Bank continues to operate with a zero tolerance for employee misconduct and independently investigates all allegations of employee misconduct. Employees are also provided with ongoing awareness and training and are provided with the appropriate tools for escalating and reporting misconduct anonymously through the independent
whistleblowing capability. The Group also has an incentivised staff program, FraudStop, to encourage employees to log genuine cases of external fraud for which they are financially rewarded.
Information Risk
Information Risk is the risk of accidental or intentional unauthorised use, access, modification, disclosure or destruction of information resources, which would compromise the confidentiality, integrity and availability of information and which would potentially harm the business. The Bank leverages on the Group’s Information Risk Management Framework to maintain the confidentiality, integrity and availability of information assets stored, processed and transmitted.
Information Risk Management falls under the aegis of the Risk Unit which is responsible for executing set policies and practices in relation to information security. A gap analysis has been conducted against the Information Risk Management Governance landscape as a first step towards managing and reducing Information Risk within the Bank. The gap analysis has allowed the Bank to identify areas of improvement and implement controls to drive the risk governance and processes required and ultimately enhance the control environment. An overall risk remediation plan is being maintained to record management's intent as well as track progress against it.
In an endeavour to address Information Risk gaps and mitigate ensuing threats, the Bank has invested in the following:
• Promoting continued awareness around protecting sensitive banking information and credentials.
• Focused campaigns which served as reminders for a consistent information protection culture.
• Continued improvement in data leakage prevention rules to enhance the ability to detect potential information leakage events.
• Improved end-point encryption systems which encrypt hard drives, secure information and prevent exploitation by external parties.
• Stronger authentication for high-risk and privileged user accounts.
• Enhanced logical access management controls.
Implementation of controls and policy implementation remained a focus area for 2020 including identification and classification of information assets, as part of the broader information risk management framework.
Managing Information Risk in a Covid-19 environment
Fan-outs were issued to sensitise employees on the need to exercise due diligence when it comes to the protection of the Bank’s information and data whilst working from home. Guidelines were issued around the following core areas:
• Physical Security: Staffs were requested to create workspace within a dedicated area of their house in order reduce the risk of disclosing and displaying sensitive information.
• Meetings: Employees were sensitised on elevated risk of eavesdropping on collaboration and conference calls conducted using the audio and video conferencing and to use only Group approved meeting applications like Microsoft Teams.
Fan-outs were also issued to caution staffs on prudential password management and to guard against increasing number of Covid-19 based phishing emails.
ENSURING OUR SUSTAINABILITY RISK AND CAPITAL MANAGEMENT REPORT CONTINUED
As the country went into lockdown in March 2020, the Bank reacted swiftly to enable Work From Home (WFH) arrangements with the main objective to keep the workforce safe while ensuring client service is not impacted. However, Work from Home arrangements also heightened existing risks such as Cyber Risk given that access was given to systems, peripherals and applications through Virtual Private Network. The following mitigating controls were established:
• All IT equipment used at home to access systems, applications and peripherals had to be bank-owned equipment with the standard security configurations.
• Access to systems, peripherals and applications were enabled through Citrix (secured VPN layer).
• McAfee Antivirus, Forcepoint DLP Endpoint and Windows 10 updates had to be kept up to date. End-users were educated on how to keep IT Security endpoint controls updated on their devices through fan-outs and IT Help Desk staffs assisted remotely for any required intervention.
• Daily tracking and monitoring of devices which were not up to date with the latest security patches by the IT Security Team followed by required remediation.
• Monitoring controls such as Q-radar and cyber-reason were re-inforced combined with CSOC Monitoring at Group Level for any potential attack or breach.
• Remote access to Finacle Core Banking System was strictly granted to critical users only.
Compliance Risk
Compliance Risk is the risk of legal or regulatory sanction, financial loss or damage to reputation that the Bank may suffer as a result of its failure to comply with laws, regulations, codes of conduct, internal policies and standards of good practice applicable to its financial services activities. Details on how the Bank manages Compliance Risk have been outlined in the Compliance Risk section above.
A financial crime is a regulatory, reputational, or monetary act or attempt against financial services institutions, corporations, governments, or individuals by internal or external agents to steal, defraud, manipulate, or circumvent established rules.
Financial Crime Risk is the risk of the bank’s processes, people and/or systems being used for money laundering, terrorist financing, proliferation financing, circumvention of financial sanctions violation, bribery and corruption, facilitation of tax evasion and fraud.
The Bank has no appetite for wilful misconduct and aims to limit fraud losses in the pursuit of its strategic objectives. The in-country Compliance Team leverages on the Group’s specialised intelligence team namely Group Investigation and Fraud Risk Unit to manage financial crime.
Risk Definition
Environmental, Social and Governance Risk
Risks to the Bank’s ability to achieve its strategy arising from its direct and indirect impacts on the environment, society, and governance.
Financial Accounting Risk
The risk of misstatement of financial statements.
Tax Risk The risk of failing to meet statutory reporting and tax payments/filing requirements.
Legal Risk The risk of financial or reputational loss that can result from lack of awareness or misunderstanding of, ambiguity in, or reckless indifference to, the way law and regulation apply to your business, its relationships, processes, products and services.
Model Risk Model risk arises from fundamental errors in models that may produce inaccurate outputs when viewed against the design objective and intended business uses, and the incorrect or inappropriate use of a model.
Transaction Processing Risk
Failure to process, manage and execute transactions and/or other processes (such as change programmes) correctly and or appropriately.
Physical Assets, Safety and Security Risk
The risk of damage to the organisation’s physical assets, client assets, or public assets for which the organisation is liable, and (criminal) injury to the organisation’s employees or affiliates.
Other Non-Financial Risks
45STANDARD BANK (MAURITIUS) LIMITED Annual report 202044
related to fraud and negative publicity. Periodic monitoring and checks are conducted on active critical suppliers/service providers including risk assessments on their financial performance, security policies, data privacy, amongst others.
Third-party risk continues to evolve in importance, due to reliance on third parties to provide services critical to the Bank’s operations. Third-party relationships may increase the Bank’s exposure to operational risk because the Bank may not have direct control of the activity performed by the third-party. Failure to manage these third-party risks can expose the Bank to regulatory sanction, financial loss, litigation and reputational damage, and may impair the Bank’s ability to deliver to its customers.
The risk is governed by the Third-Party Risk Management Framework which is underpinned by the implementation of a fit-for-purpose operating model, aligned to the Bank’s risk culture, and considers appropriate levels of accountability and responsibility across the Bank. The operating model will be deployed in a phased manner across all legal entities of the Group in 2021. The new third-party management framework and the third-party risk life-cycle management tool include a stringent due diligence process and enable regular analysis and risk profiling of top service providers to direct risk mitigation efforts.
Further to the Covid-19 outbreak, internal and external Service Providers proved their capability to continue servicing the Bank during the crisis. An assessment was done on all material outsourced arrangements in July 2020 and no shortcoming was reported.
Conduct Risk
Conduct Risk is the risk that detriment is caused to the Bank’s clients, the market or the Bank itself because of inappropriate execution of business activities. To effectively manage conduct risk, the Standard Bank Group has developed a conduct framework that follows a culture-led strategy to embed culture and manage conduct. The conduct framework including the establishment and embedment of the reporting architecture, i.e. metrics, management information and conduct reporting enables the Board and Executive Management in all legal entities across the Standard Bank Group to exercise oversight and evidence good conduct risk management. Governance structures ensure business ownership are in place to manage conduct risks. Conduct is closely monitored through the Executive Committee and the Board Risk Management & Conduct Review Committee. The conduct framework facilitates a continuous process to identify conduct risk, which allows the Bank to keep abreast of economic and regulatory development to meet regulatory expectations. Conduct reporting to Senior Management and the Board includes both quantitative and qualitative metrics. The conduct dashboards in fact take into consideration different reporting pillars, such as strategy, culture, governance, product, quality sales and advice.
Physical Assets, Safety and Security Risk
Physical Assets, Safety and Security Risk refers to the risk of damage to the Bank’s physical assets, client assets, or public assets for which the organisation is liable, and (criminal) injury to the organisation’s employees or affiliates.
Managing Physical Assets, Safety and Security Risk in a Covid-19 environment
Resumption of activities post the lock down was subject to prioritising health and safety of our employees, clients and stakeholders. As such, return of staffs on premises was undertaken in a phased approach. Deep cleaning of the premises was done prior to resumption. A rigorous cleaning of
workstations and frequently touched surfaces in the common areas was implemented once the first wave of staffs resumed work.
The following sanitary and social distancing measures were established:
• De-sanitisation of IT Equipment;
• Mandatory wear of masks;
• Body temperature screened before being granted access to workspace;
• Social distancing enforced in the office space, mess room and other common areas (2 metres to be observed at all times);
• Distribution of additional hand sanitisers, masks and gloves (where needed);
• Installation of additional hand sanitiser dispensers on the premises;
• Identification of isolation room whereby staffs showing flu symptoms would be re-directed until transported to hospital;
• Client and internal meetings to be virtually held;
• Visitors are required to wear mask and body temperature needs to be screened before access to the premises is allowed;
• Face to face functions, team buildings, team lunches, etc not allowed for the foreseeable future.
The Health & Safety Officer has been mandated to ensure that established safety protocols remain in force and escalate any breach thereto to the Chairperson of the Health & Safety Committee.
Governance and Reporting
The primary management level governance committee overseeing operational risks is the Operational Risk & Compliance Committee. The primary governance documents are the operational risk governance framework and the operational risk governance standard. Operational risk subtypes have governance documents applicable to each risk subtype. The governance of the main sub-risk is through the following Governance committees:
Risk-based supervision reporting was broadened in 2020 to include Operational Risk reporting and is now an integral part of the Bank’s set of regulatory returns.
People Risk
Our ability to differentiate Standard Bank as client-focused and digitally enabled organisation through the successful execution of our strategy by our people in an intensely competitive environment will be impacted negatively by an inability to attract and retain committed people and not creating an environment that enables our people to grow in order to remain relevant in a rapidly evolving world of work. The Bank tracks and monitors employee engagement with three key indicators, namely voluntary turnover rate, regrettable turnover and an annual employee net promoter score.
Over the years, the Bank has introduced a range of reward and recognition initiatives to support client centricity, retain top talent and ensure sustainable long-term performance. Additionally, the Bank has continued to provide staff with access to online learning platforms and digital libraries to ensure fit-for purpose learning anytime, anywhere and on any device. Top and senior management transformation reviews for all business units and corporate functions ensure a focus on the identification and development of diverse talent pools. The Bank has also rolled out an employee insights platform which enables the rapid deployment of surveys to gauge how staff think and feel about working for the Bank and to ask for their input when reshaping solutions that will directly impact them. The Bank has also delivered a range of health and wellness initiatives to employees across the Bank, including wellness days, medical assessments and counselling services, and offered a range of training initiatives to build personal resilience and coping skills.
During lockdown, digital recruitment strategies were initiated to attract the right talent and to shorten the time to hire.
In 2020, the Bank identified risks relating to scarce and in-demand skills, shifting skillsets and the impact of digitisation on its workforce. The Bank looks forward to shaping a workforce that is ready to meet our clients’ needs, now and in the future. As such, a range of specialised in-house learning academies and programmes were deployed with a focus on building scarce skills, specifically in areas where demand exceeds supply in the local markets. Work from Home Guidelines were issued in October 2020 as an employee value proposition to embrace new ways of working.
Business Resilience Risk
Business Resilience Risk is the risk of infrastructure failure, environmental impact or change failure disrupting the services to and of the Bank. Business continuity management is a process that identifies potential operational disruptions and provides a basis for planning for the mitigation of the negative impact from such disruptions. In addition, it promotes operational resilience and ensures an effective response that safeguards the interests of both the Bank’s and its stakeholders.
A comprehensive Business Resilience Policy and Standard are in place. They assist the Bank in effectively planning for and responding to incidents and business interruptions so that the Bank can resume critical activities within the briefest delay possible, thus safeguarding its reputation and the interests of key stakeholders. The bank’s business resilience framework encompasses emergency response preparedness and crisis management capabilities to manage the business through a crisis to full recovery. Each business unit is responsible for its own business continuity management plan, closely supported by the Risk Team, who will provide the governance, steer, oversight and reporting of the Bank’s status of readiness to maintain availability of the Bank’s critical business activities at acceptable pre-defined service levels. The Bank’s business resilience capabilities are evaluated by testing business continuity plans and conducting crisis simulations.
The Bank aims to achieve optimal Business Resilience performance, as defined in the Business Resilience Standard and evidenced through a demonstration of an implemented fit-for-purpose Business Resilience capability when critical services, functions and systems encounter business disruption. A Business Resilience Dashboard is prepared on a monthly basis and provides the minimum standard of what needs to be in place with regards to business continuity, tracks progress and highlights gaps in the Business Resilience programme. This report card is submitted on a monthly basis to Group and is also tabled at the relevant governance committees.
The Bank leverages on the following Group capabilities:
• Well-practiced and well-rehearsed IT security and cyber security incident response teams which convene on a regular basis either in response to real-life incidents or during simulation exercises.
• Documented cyber extortion response plan which details specific actions to be carried out during cyber incidents.
• Well-staffed 24/7 Cyber Security Operations Centre which monitors all cyber-vulnerabilities and attacks, including malware.
Managing Business Resilience Risk in a Covid-19 environment
As the country went into lockdown on 20 March 2020, the Bank reacted swiftly to enable Work From Home (WFH) arrangements with the main objective to keep the workforce safe while ensuring client service is not impacted. Within 1 week, the following actions were implemented enabling a 100% WFH workforce:
• Invocation of Crisis Management and Crisis Management Communication Plans.
• Emergency procurement of laptops and reshuffling of existing stock of laptops to ensure that users critical to service clients are equipped to continue working during the confinement period. The desk PCs were deployed to employees’ homes when the Bank ran out of laptops.
• User profiles configured and access to systems, peripherals and applications granted through Virtual Private Network.
• WIFI dongles and SIM cards procured to enable required employees to connect to required systems, applications and peripherals.
• Prioritisation of essential services and mission critical activities to ensure continuous service delivery to clients.
• Clear communication to staffs, clients, regulators and Group.
Third Party Risk
Third Party Risk refers to the risk of losses or disruptions due to ineffective management of third-party relationships. To that effect the following guidelines in respect of third-party management have been established for all entities of the Standard Bank Group:
• No appetite for entering into transactions with sanctioned suppliers;
• No tolerance for contractual agreements concluding outside the procurement process;
• No tolerance for procurement happening outside the governance process. This includes sourcing, purchasing and contracting processes.
Prior to establishing any relationship with third parties, it is the Bank’s policy to conduct background checks and due diligence on the concerned third parties. Service providers/suppliers undergo a stringent due diligence process before the Bank enters into a relationship with a service provider/supplier and before a service provider/supplier is onboarded. Enhanced due diligence process in place for high-risk suppliers/service providers which include adverse media checks and checks
ENSURING OUR SUSTAINABILITY RISK AND CAPITAL MANAGEMENT REPORT CONTINUED
Committee Operational Risk subtype
IT Steering Committee
Technology, Cyber, Information and Business Resilience
Operational Risk and Compliance Committee
Compliance, Financial Crime and Third Party
Executive Committee People and Conduct
47STANDARD BANK (MAURITIUS) LIMITED Annual report 202046

REPORTING
The Bank’s risk appetite, risk profile and risk exposures are reported on a regular basis to the Board and Senior Management through various governance committees. Risk management reports are tabled at the formalised governance structures at both Board and Management Risk Committees levels.
Risk Data Aggregation and Risk Reporting (RDARR)
In January 2013, the Basel Committee on Banking Supervisions (BCBS) published principles for effective RDARR with the aim of improving the quality of information that banks use in decision making, particularly as it pertains to risk management. The 14 principles, aimed at improving the risk data aggregation and risk reporting capabilities of banks, set out the criteria for governance, risk data aggregation, risk reporting practices and supervisory review as pictured below.
The programme was successfully completed during the course of 2018-2019, wherein the governance framework, processes and technological set up underpinning the governance, architecture, data aggregation and reporting principles were rolled out and embedded as part of the Bank’s “Business-As-Usual” operations. In 2020, Internal Audit performed an advisory review and concluded that the Bank is largely compliant with the principles and programme requirements.
Looking Ahead
Risk is everyone’s business and the Bank’s material risks are monitored, managed and mitigated through the three lines of defence model. Economic conditions are expected to remain challenging across the globe. Our portfolio is vulnerable to a combination of macro, sector and specific risks that we will manage effectively to deliver profitable growth. The top risks and emerging threats process provide for continuous assessment and monitoring of current risks and emerging threats, thereby equipping the Bank to proactively identify these potential risks and manage and mitigate them effectively. The Bank will continue
to instil conscious risk-taking, thereby making strategically informed risk decisions in pursuit of its identified growth opportunities. This consistent approach to risk helps ensure that the Bank manages its business and the associated risks in a manner that balances the interests of clients and other key stakeholders whilst protecting the safety and soundness of the Bank.
10. Capital Management*
Overview and Objectives
The Bank’s capital management function is designed to ensure that regulatory requirements are always met and that the Bank is capitalised in line with its risk appetite and target ratios, both of which are approved by the board.
It further aims to facilitate the allocation and use of capital, such that it generates a return that appropriately compensates shareholders for the risks incurred. Capital adequacy is actively managed and forms a key component of the bank’s forecasting process. The capital plan is tested under a range of stress scenarios as part of the bank’s annual internal capital adequacy assessment process (ICAAP) and Integrated Recovery Plan (IRP).
The capital management function is governed primarily by management level subcommittees that oversee the risks associated with capital management, namely ALCO. The principal governance documents are the capital management governance framework.
Regulatory Capital
The main regulatory requirements to be complied with are those specified in the Banking Act 2004 and related regulations, which are aligned to Basel III.
Basel III
Basel III aims to strengthen the regulation, supervision and risk management of the banking sector. The measures recommended aim to:
• improve the global banking sector’s ability to absorb shocks arising from financial and economic stress, whatever the source;
• improve risk management and governance; and
• strengthen Bank’s transparency and disclosures.
The Bank of Mauritius has adopted a phased approach to the implementation of Basel III with the issue of the Bank of Mauritius Guideline on Scope and Application of Basel III and Eligible Capital. Regulatory capital adequacy is measured through three risk-based ratios:
CET I (Common EQUITY Tier I): ordinary share capital, share premium, retained earnings, other reserves and qualifying non-controlling interest less impairments divided by total risk weighted assets (RWA).
Tier I: CET I plus perpetual, non-cumulative instruments with either contractual or statutory principal loss absorption features that comply with the Basel III rules divided by total RWA.
Total capital adequacy: tier I plus other items such as general credit impairments and subordinated debt with either contractual or statutory principal loss absorption features that comply with the Basel III rules divided by total RWA. The ratios are measured against internal targets and regulatory minimum requirements.
Insurance Cover
The Bank has contracted insurance covers to mitigate operational risk; these covers are reviewed on an annual basis. The Board, through the Risk function, ensures that an adequate insurance programme is in place designed to protect the Bank against loss resulting from its business activities. The principal insurance policies in place are outlined below:
8. Business RiskBusiness risk includes strategic risk. Strategic risk is the risk that the Bank’s future business plans and strategies may be inadequate to prevent financial loss or protect the Bank’s competitive position and shareholder returns. The Bank’s business plans and strategies are discussed and approved by Executive Management and the Board and, where appropriate, subjected to stress tests.
Business risk is usually caused by the following:
• inflexible cost structures;
• market-driven pressures, such as decreased demand; increased competition or cost increases;
• bank-specific causes, such as a poor choice of strategy, reputational damage or the decision to absorb costs or losses to preserve reputation.
The Bank mitigates business risk in a number of ways, including:
• detailed analysis of the business cases;
• the application of new product processes per business line through which the risks and mitigating controls for new and amended products and services are evaluated;
• stakeholder management to ensure favourable outcomes from external factors beyond the Bank’s control;
• monitoring the profitability of product lines and customer segments;
• maintaining tight control over the Bank’s cost base, including the management of its cost-to-income ratio, which allows for early intervention and management action to reduce costs;
• being alert and responsive to changes in market forces;
• a strong focus in the budgeting process on achieving headline earnings growth while containing cost growth and building contingency plans into the budget that allow for costs to be significantly reduced in the event that expected revenues do not materialise;
• increasing the ratio of variable costs to fixed costs which creates flexibility to reduce costs during an economic downturn;
• stress testing techniques applied to assess the resilience of the Bank’s planned earnings under macroeconomic downturn conditions.
The primary governance committee for overseeing this risk is the Assets & Liabilities Committee.
The Covid-19 pandemic translated into a severe impact on economic activity cutting across borders and economic sectors. The outlook for world economies in 2020 substantially worsened. The impact and duration of the Covid-19 led to higher expected credit losses and put pressure on revenue due to lower customer activity levels and reduced global interest rates. In light of that, coupled with the uncertainty that prevailed, the Bank did not achieve its intended budget for 2020. Whilst the Bank braced itself for a drop in profitability and a contraction in its balance sheet, Management remained committed to preserving the Bank’s earnings potential.
Prudential guidelines were established for an enhanced monitoring of existing exposures and to ensure that facilities are extended to creditworthy counterparties in order to limit risk of default and its ensuing impact on the Bank’s profitability. Concurrently, the pursuit of the Bank’s client acquisition strategy is in progress to further boost the Bank’s earnings potential. Overall asset and liability management is being closely tracked and monitored through the Assets & Liabilities Committee to ensure the most optimum and efficient allocation of the Bank’s financial resources. Prudent management of costs is high on the agenda.
9. Reputational RiskReputation is defined as what stakeholders say and think about the Bank, including its staff, customers and clients, investors, counterparties, regulators, policymakers, and society at large. The Bank’s reputation can be harmed from an actual or perceived failure to fulfil the expectations of its stakeholders due to a specific incident or from repeated breaches of trust.
Reputational harm can adversely affect the Bank’s ability to maintain existing business, generate new business relationships, access capital, enter new markets and secure regulatory licences and approvals.
Safeguarding and proactively managing the Bank’s reputation is of paramount importance. There is growing awareness of reputational risks arising from compliance breaches, social and environmental considerations, as well as from ethical considerations linked to countries, clients and sectors.
The Bank manages reputational risk from a tactical and reactive perspective as well as from a strategic and proactive perspective. In respect to crisis response, the Bank’s crisis management processes are designed to minimise the reputational impact of such events or developments. A Crisis Management Team is in place at Executive level. This includes ensuring that the Bank’s perspective is fairly represented in the media. In addition, more attention is being paid to leveraging opportunities to proactively bolster the Bank’s reputation among influential stakeholders through programmes, including stakeholder engagement, advocacy, sponsorships and corporate social initiatives.
The principal governance document is the reputational risk governance standard and the Bank’s qualitative Risk Appetite Statement includes a statement on reputation. The Bank’s code of ethics is an important reference point for all staff. The Bank has appointed an Ethics Officer whose role is to ensure an ethics framework is in place at the Bank together with a code of ethics and values embedded across the bank. The Ethics Officer reports on a quarterly basis on matters of ethics to Executive management and the Board Risk management and Conduct Review Committee.
• Crime Insurance • Professional Indemnity Insurance • Directors' & Officers' Liability Insurance • Cyber Protection Insurance
Banking (Financial Risks)
Non-Banking (Non-Financial
Risks)
• Assets All Risks including Business Interruption • Motor Vehicles • Employers Liability • Group Personal Accident • Public Liability • Political Riot and Terrorism
*Information in this section has been audited
ENSURING OUR SUSTAINABILITY RISK AND CAPITAL MANAGEMENT REPORT CONTINUED
3-6
12-14
7-11
Principles 1-2Overarching Governance
and Infrastructure
Principles 12-14Supervisory Review,
Tools and Cooperation
Prin
ciples 7-11
Risk R
eportin
gP
ractices
Pri
nci
ple
s 3
-6R
isk
Dat
a A
ggre
gati
on C
apab
iliti
es
The accountability and responsibility of Board members and Senior Management to exercise strong governance over Standard Bank's risk data aggregation, risk reporting and IT capabilities.
The accuracy, integrity completeness, timeliness and adaptability of aggregated risk data. Ability to slice and dice (aggregate and disaggregate) risk data in a timely manner to meet ad hoc requests and supervisory queries, in particular during stress periods.
The need for supervisors to review and evaluate a bank's compliance with these principles.
The accuracy, comprehensiveness, clarity, frequency and distribution of risk reports, i.e. do the risk reports enable us to make informed decisions quickly?
Effective Risk Data
Aggregation and Risk reporting
49STANDARD BANK (MAURITIUS) LIMITED Annual report 202048
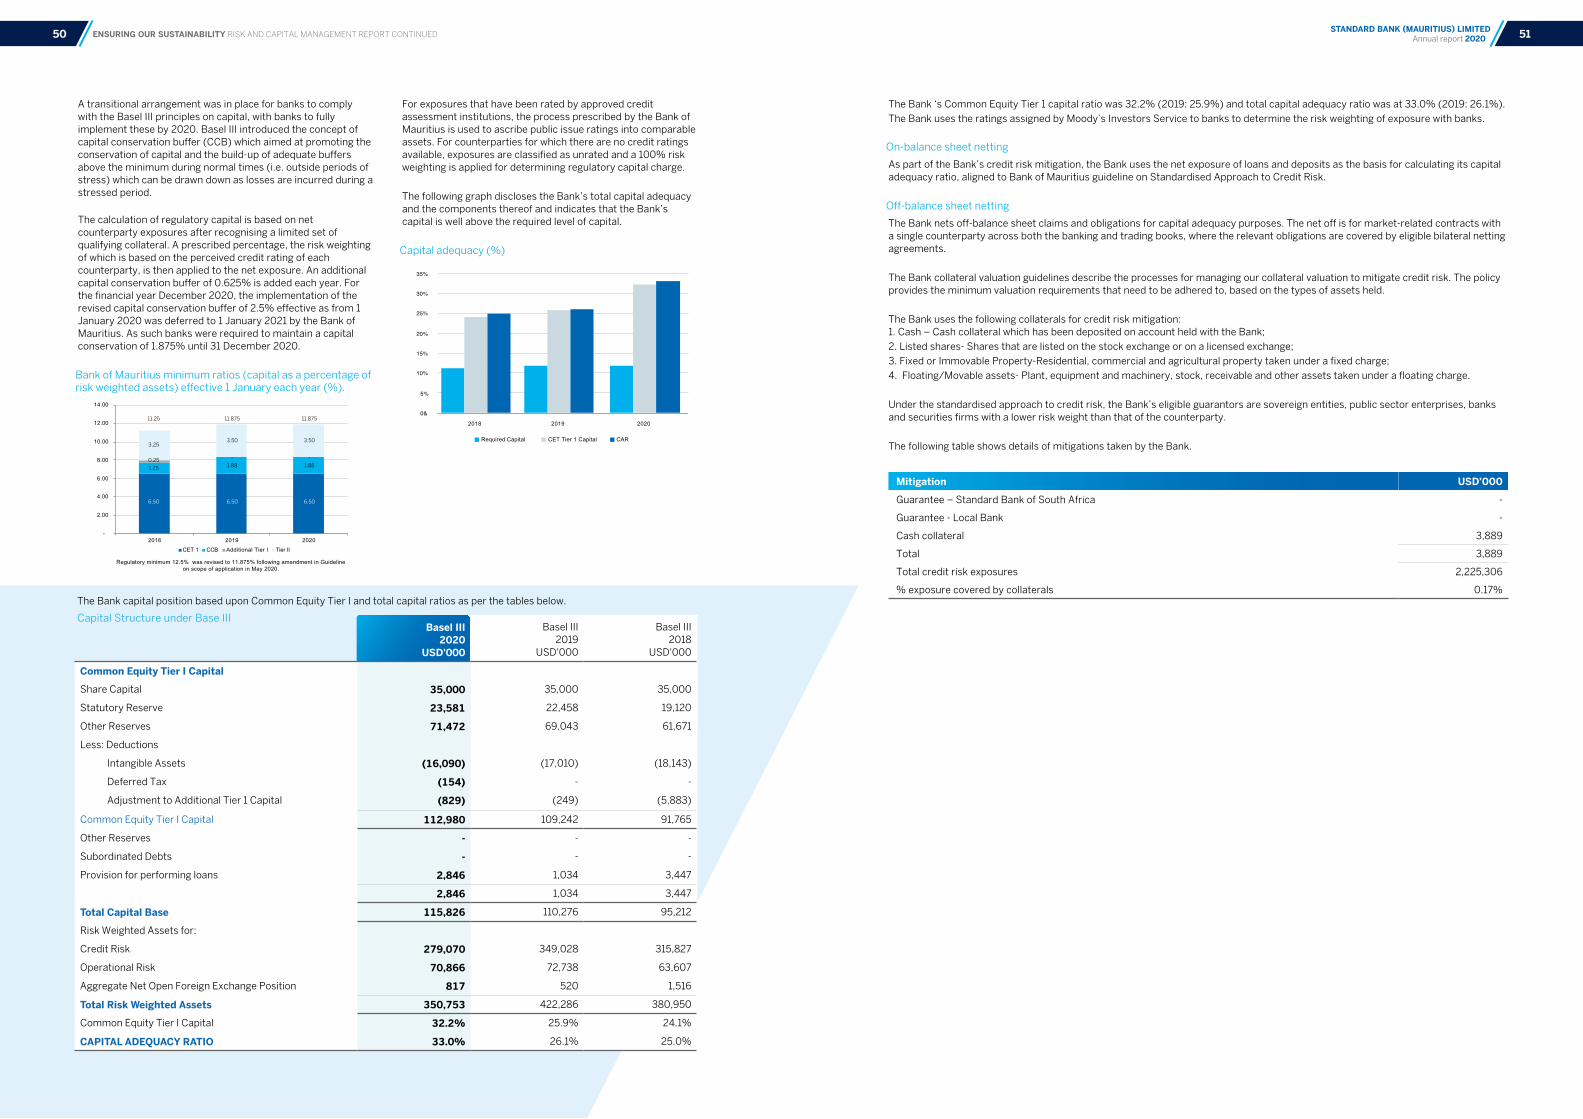
A transitional arrangement was in place for banks to comply with the Basel III principles on capital, with banks to fully implement these by 2020. Basel III introduced the concept of capital conservation buffer (CCB) which aimed at promoting the conservation of capital and the build-up of adequate buffers above the minimum during normal times (i.e. outside periods of stress) which can be drawn down as losses are incurred during a stressed period.
The calculation of regulatory capital is based on net counterparty exposures after recognising a limited set of qualifying collateral. A prescribed percentage, the risk weighting of which is based on the perceived credit rating of each counterparty, is then applied to the net exposure. An additional capital conservation buffer of 0.625% is added each year. For the financial year December 2020, the implementation of the revised capital conservation buffer of 2.5% effective as from 1 January 2020 was deferred to 1 January 2021 by the Bank of Mauritius. As such banks were required to maintain a capital conservation of 1.875% until 31 December 2020.
Bank of Mauritius minimum ratios (capital as a percentage of risk weighted assets) effective 1 January each year (%).
For exposures that have been rated by approved credit assessment institutions, the process prescribed by the Bank of Mauritius is used to ascribe public issue ratings into comparable assets. For counterparties for which there are no credit ratings available, exposures are classified as unrated and a 100% risk weighting is applied for determining regulatory capital charge.
The following graph discloses the Bank’s total capital adequacy and the components thereof and indicates that the Bank’s capital is well above the required level of capital.
Capital adequacy (%)
0&
5%
10%
15%
20%
25%
30%
35%
2018 2019 2020
Required Capital CET Tier 1 Capital CAR
ENSURING OUR SUSTAINABILITY RISK AND CAPITAL MANAGEMENT REPORT CONTINUED
Basel III 2020
USD'000
Basel III 2019
USD'000
Basel III 2018
USD'000
Common Equity Tier I Capital
Share Capital 35,000 35,000 35,000
Statutory Reserve 23,581 22,458 19,120
Other Reserves 71,472 69,043 61,671
Less: Deductions
Intangible Assets (16,090) (17,010) (18,143)
Deferred Tax (154) - -
Adjustment to Additional Tier 1 Capital (829) (249) (5,883)
Common Equity Tier I Capital 112,980 109,242 91,765
Other Reserves - - -
Subordinated Debts - - -
Provision for performing loans 2,846 1,034 3,447
2,846 1,034 3,447
Total Capital Base 115,826 110,276 95,212
Risk Weighted Assets for:
Credit Risk 279,070 349,028 315,827
Operational Risk 70,866 72,738 63,607
Aggregate Net Open Foreign Exchange Position 817 520 1,516
Total Risk Weighted Assets 350,753 422,286 380,950
Common Equity Tier I Capital 32.2% 25.9% 24.1%
CAPITAL ADEQUACY RATIO 33.0% 26.1% 25.0%
The Bank capital position based upon Common Equity Tier I and total capital ratios as per the tables below.
Capital Structure under Base III
The Bank ‘s Common Equity Tier 1 capital ratio was 32.2% (2019: 25.9%) and total capital adequacy ratio was at 33.0% (2019: 26.1%).
The Bank uses the ratings assigned by Moody’s Investors Service to banks to determine the risk weighting of exposure with banks.
On-balance sheet netting
As part of the Bank’s credit risk mitigation, the Bank uses the net exposure of loans and deposits as the basis for calculating its capital adequacy ratio, aligned to Bank of Mauritius guideline on Standardised Approach to Credit Risk.
Off-balance sheet netting
The Bank nets off-balance sheet claims and obligations for capital adequacy purposes. The net off is for market-related contracts with a single counterparty across both the banking and trading books, where the relevant obligations are covered by eligible bilateral netting agreements.
The Bank collateral valuation guidelines describe the processes for managing our collateral valuation to mitigate credit risk. The policy provides the minimum valuation requirements that need to be adhered to, based on the types of assets held.
The Bank uses the following collaterals for credit risk mitigation: 1. Cash – Cash collateral which has been deposited on account held with the Bank;
2. Listed shares- Shares that are listed on the stock exchange or on a licensed exchange;
3. Fixed or Immovable Property-Residential, commercial and agricultural property taken under a fixed charge;
4. Floating/Movable assets- Plant, equipment and machinery, stock, receivable and other assets taken under a floating charge.
Under the standardised approach to credit risk, the Bank’s eligible guarantors are sovereign entities, public sector enterprises, banks and securities firms with a lower risk weight than that of the counterparty.
The following table shows details of mitigations taken by the Bank.
Mitigation USD’000
Guarantee – Standard Bank of South Africa -
Guarantee - Local Bank -
Cash collateral 3,889
Total 3,889
Total credit risk exposures 2,225,306
% exposure covered by collaterals 0.17%
-
2.00
4.00
6.00
8.00
10.00
12.00
14.00
2018 2019 2020
CET 1 CCB Additional Tier I Tier II
Regulatory minimum 12.5% was revised to 11.875% following amendment in Guideline on scope of application in May 2020.
11.25 11.875
3.50
- -
1.88 1.88
3.50
11.875
3.25
0.25
1.25
6.50 6.50 6.50
51STANDARD BANK (MAURITIUS) LIMITED Annual report 202050

ENSURING OUR SUSTAINABILITY RISK AND CAPITAL MANAGEMENT REPORT CONTINUED
2020 2019 2018
Nominal Amount
USD 000Mitigation
Risk Weight
%
Risk Weighted Assets
USD 000CREDIT RISK
On Balance Sheet Assets
Cash Items 62 0-20 - - -
Claims on Sovereigns 220,171 0-100 - - -
Claims on Banks 1,290,385 20-100 33,214 73,229 46,897
Claims on Central Banks 21,022 0-150 - 13 -
Claims on PSE - 20-150 - - -
Claims on corporates 187,607 - 20-150 187,607 224,944 225,063
Claims secured on residential property - 35-125 - 178 212
Past due claims 15,998 50-150 10,423 7,444 419
Other Assets / Fixed Assets 11,705 100 11,705 11,558 4,700
Total 1,746,950 - 242,949 317,366 277,290
Non-market related off-balance sheet risk weighted assets
Direct Credit Substitute 19,431 15,943 20-100 15,943 16,658 23,116
Transaction-related contingent items 4,428 4,428 20-100 2,214 5,611 2,008
Trade Related Contingencies - - 20-100 - - 132
Other Commitments 182,662 182,662 20-100 12,812 6,422 10,131
Total 206,521 203,033 30,969 28,691 35,387
Market related off-balance sheet risk weighted assets
Interest Rate Contracts 17,845 - 21 89 89
Foreign exchange Contracts 253,990 - 5,131 2,882 3,061
Total 271,835 - 5,152 2,971 3,150
Total Credit Risk 2,225,306 203,033 279,070 349,028 315,827
Operational Risk 70,866 72,738 63,607
Aggregate Net Open Foreign Exchange Position
817 520 1,516
Total Risk Weighted Assets 2,225,306 203,033 350,753 422,285 380,950
Exposures subject to the Standardised approach per risk weighting as at 31 December 2020
Internal Capital Adequacy Assessment Process (ICAAP)ICAAP considers the qualitative capital management processes within the organisation and includes the organisation’s governance, risk management, capital management and financial planning standards and frameworks. Furthermore, the quantitative internal assessments of the organisation’s business models are used to assess capital requirements to be held against all risks the Bank is or may become exposed to, in order to meet current and future needs as well as to assess the Bank’s resilience under stressed conditions.
The Group has embedded sound internal capital adequacy assessment processes throughout the group and across all its subsidiaries. The Bank is aligned to the Group and has implemented the Bank of Mauritius Guideline on Supervisory Review Process since 2011. The ICAAP document is reviewed on an annual basis and is approved by the Board. Periodic reviews are made to ensure that the Bank remains well capitalised after considering all material risks.
The Bank consciously maintains a risk management culture and practices that are conservative and rigorous and considers that risk appetite is an integral part of the Bank’s strategy and business plans. As a result, all material risks are appropriately managed and mitigated and there are contingency plans that have been identified for execution should the capital levels of the Bank ever fall below levels deemed acceptable by the Board, Management or Bank of Mauritius.
Credit risk consumes approximately 80% of total regulatory capital usage as at 31 December 2020 and as such represents the largest source of risk that the Bank is exposed to. Such risk therefore attracts a high degree of management focus, with adequate resources assigned to ensure that the risk is mitigated.
Year under review - Stress Scenarios Economic headwinds, volatility in markets and competitive pressures accelerate the need to continuously assess the Bank’s forward-looking risk profile under normal and stressed conditions against the stated risk appetite. The appropriateness of the macroeconomic stress scenarios and the severity of the relevant scenarios are approved by the Board and Senior Management on an annual basis.
Stress testing is conducted using macroeconomic stress scenarios as well as bank specific scenarios based on the composition of the loan book and liquidity profile. Stress testing is performed annually as part of the Bank’s ICAAP process. Stress results are analysed and any departure from our risk appetite statement trigger mitigating actions.
During 2020, the Bank ran several stress tests to understand the impact that potential stress events would have on its profitability and capital position on a forward-looking basis. These events included Macro-economic scenarios such as “Impact of Global Pandemic” and Management Expertise scenario such as “Impact of Global Pandemic coupled with additional stress further to the downgrade in the sovereign rating of South Africa”.
While stress results for capital adequacy are within risk appetite, the Bank will nonetheless remain alert to possible deterioration of economic conditions to trigger a re-assessment of capital levels and initiate early remedial action should circumstances dictate. Stress results for the change in profit before tax were outside the Bank’s risk tolerance limit for both scenarios exacerbated by the negative influences brought on by the global pandemic adversely impacting the bank’s growth potential and profitability.
In instances, where the results of the stress tests breached risk appetite or tolerance, the Board ensured that Management has mitigating actions in place to minimise the impact.
For the purposes of ICAAP, the Bank maintained a capital buffer of 2% above the regulatory requirement.
11. Related Party TransactionsThe Bank’s Related Party Transaction Policy establishes and defines the framework for the governance, risk management, and reporting of related party transactions. The policy fulfils the requirements of the Bank of Mauritius Guideline on Related Party Transactions to effectively identify, monitor, control and report related party transactions within the Bank and to take appropriate steps to mitigate the risks arising from these transactions.
As per Bank of Mauritius Guideline on Related Party Transactions, a “related party” means:
• a person who has significant interest in the financial institution or the financial institution has significant interest in the person;
• a director or senior officer of the financial institution;
• close family members of the above;
• an entity that is controlled by a person described above;
• a person or class of persons who has been designated by the Bank of Mauritius as a related party.
Related party transactions include intragroup transactions as well as the following transactions:
• Credit, non-fund-based commitments such as documentary credits, guarantees on behalf of a related party, acquiring a loan made by a third party;
• Placements made by the Bank with the related party;
• Vendor agreements with related parties;
• Consulting or professional service contracts with directors and related parties;
• Investment in equity of a related party;
• Deposits placed by related parties with the Bank; and
• Acquisition, sale or lease of assets with related parties.
The Bank has policies and processes in place to avoid conflict of interest when carrying out related party transactions and to ensure that same are conducted at arm’s length. Transactions which are not at arm’s length are subject to prior approval by the Board Risk Management & Conduct Review Committee.
The Bank provides assurance to the Board Risk Management & Conduct Review Committee on a quarterly basis that where approval has not been sought, transactions have been conducted at arm’s length.
All credit exposures to related parties are reported to the Risk Management & Conduct Review Committee.
The Top 5 Related Party Exposures at end December 2020 are outlined below:
The Bank has exempt related party exposures with members of the Standard Bank Group as part of interbank transactions in relation to its treasury operations.
A detailed analysis of related party transactions is available in note 37.
Counterparty USD
The Standard Bank of South Africa Ltd
1,123,857,847
Stanbic Bank Kenya 5,657,371
Stanbic Bank Cote D'Ivoire 3,744
Stanbic Bank Uganda 1,477
Stanbic Bank Namibia 578
1,129,521,017
53STANDARD BANK (MAURITIUS) LIMITED Annual report 202052
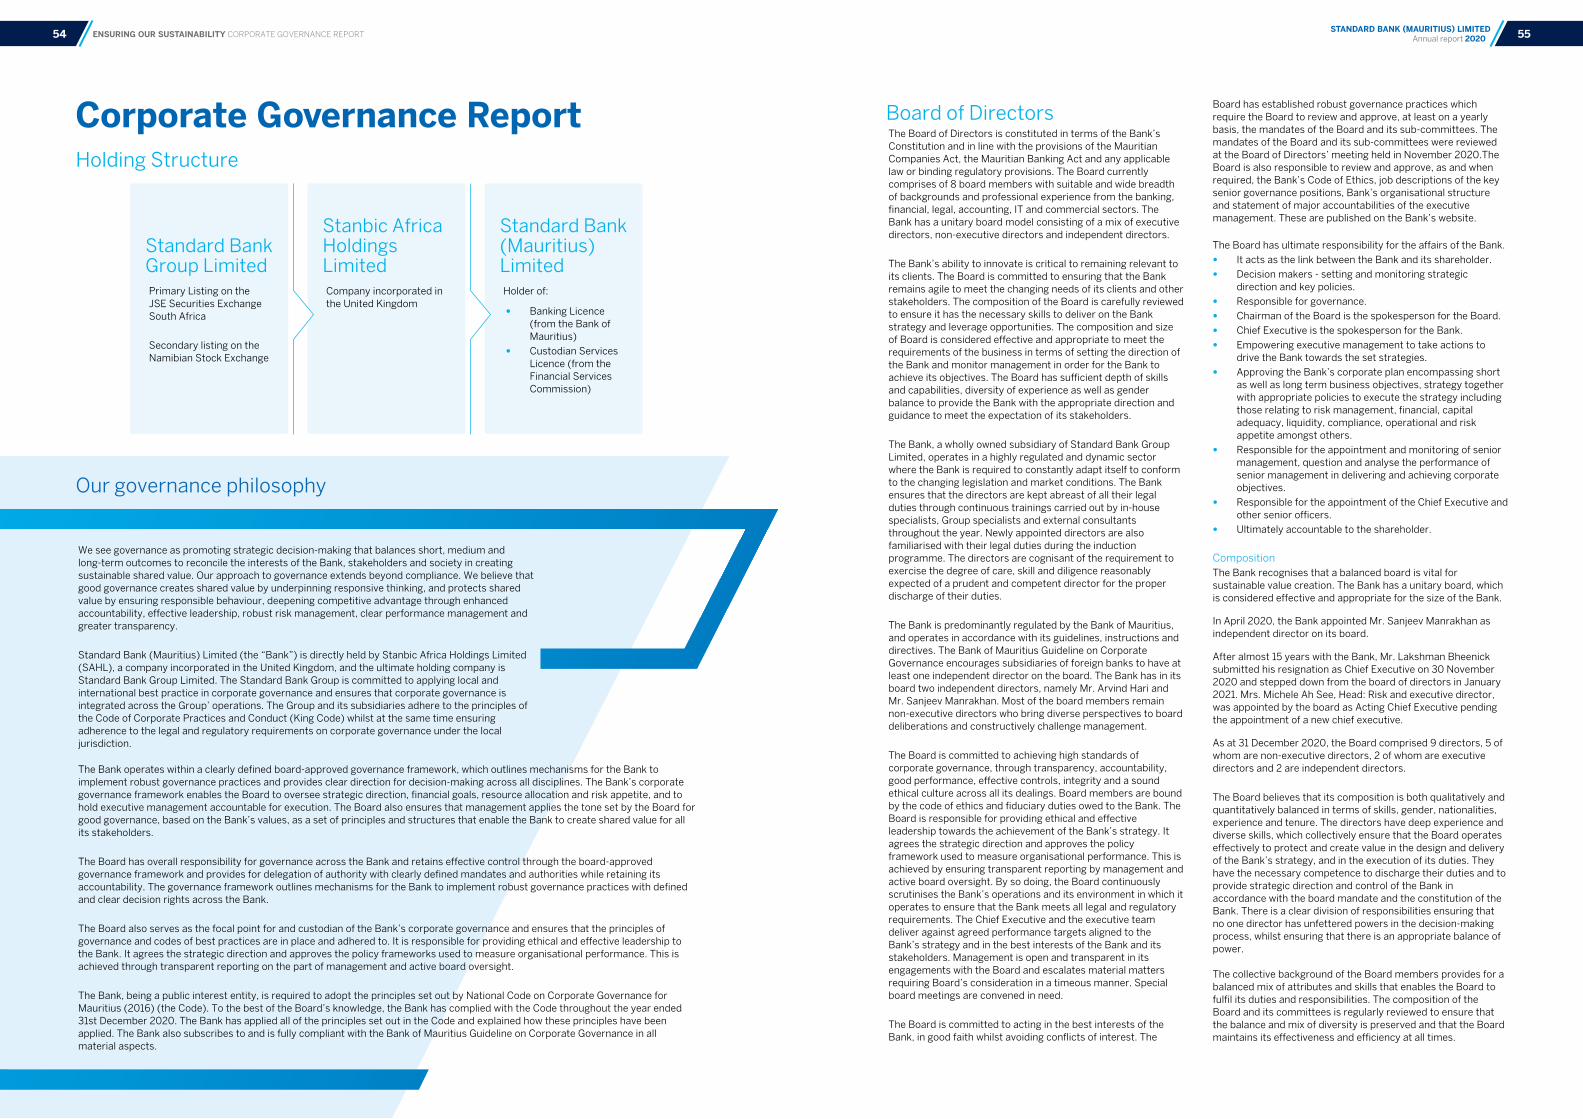
Standard Bank (Mauritius) Limited
Stanbic Africa Holdings Limited
Standard Bank Group LimitedPrimary Listing on the JSE Securities Exchange South Africa
Secondary listing on the Namibian Stock Exchange
Company incorporated in the United Kingdom
Holder of:
• Banking Licence (from the Bank of Mauritius)
• Custodian Services Licence (from the Financial Services Commission)
Corporate Governance ReportHolding Structure
Our governance philosophy
We see governance as promoting strategic decision-making that balances short, medium and long-term outcomes to reconcile the interests of the Bank, stakeholders and society in creating sustainable shared value. Our approach to governance extends beyond compliance. We believe that good governance creates shared value by underpinning responsive thinking, and protects shared value by ensuring responsible behaviour, deepening competitive advantage through enhanced accountability, effective leadership, robust risk management, clear performance management and greater transparency.
Standard Bank (Mauritius) Limited (the “Bank”) is directly held by Stanbic Africa Holdings Limited (SAHL), a company incorporated in the United Kingdom, and the ultimate holding company is Standard Bank Group Limited. The Standard Bank Group is committed to applying local and international best practice in corporate governance and ensures that corporate governance is integrated across the Group’ operations. The Group and its subsidiaries adhere to the principles of the Code of Corporate Practices and Conduct (King Code) whilst at the same time ensuring adherence to the legal and regulatory requirements on corporate governance under the local jurisdiction.
The Bank operates within a clearly defined board-approved governance framework, which outlines mechanisms for the Bank to implement robust governance practices and provides clear direction for decision-making across all disciplines. The Bank’s corporate governance framework enables the Board to oversee strategic direction, financial goals, resource allocation and risk appetite, and to hold executive management accountable for execution. The Board also ensures that management applies the tone set by the Board for good governance, based on the Bank’s values, as a set of principles and structures that enable the Bank to create shared value for all its stakeholders.
The Board has overall responsibility for governance across the Bank and retains effective control through the board-approved governance framework and provides for delegation of authority with clearly defined mandates and authorities while retaining its accountability. The governance framework outlines mechanisms for the Bank to implement robust governance practices with defined and clear decision rights across the Bank.
The Board also serves as the focal point for and custodian of the Bank’s corporate governance and ensures that the principles of governance and codes of best practices are in place and adhered to. It is responsible for providing ethical and effective leadership to the Bank. It agrees the strategic direction and approves the policy frameworks used to measure organisational performance. This is achieved through transparent reporting on the part of management and active board oversight.
The Bank, being a public interest entity, is required to adopt the principles set out by National Code on Corporate Governance for Mauritius (2016) (the Code). To the best of the Board’s knowledge, the Bank has complied with the Code throughout the year ended 31st December 2020. The Bank has applied all of the principles set out in the Code and explained how these principles have been applied. The Bank also subscribes to and is fully compliant with the Bank of Mauritius Guideline on Corporate Governance in all material aspects.
Board of DirectorsThe Board of Directors is constituted in terms of the Bank’s Constitution and in line with the provisions of the Mauritian Companies Act, the Mauritian Banking Act and any applicable law or binding regulatory provisions. The Board currently comprises of 8 board members with suitable and wide breadth of backgrounds and professional experience from the banking, financial, legal, accounting, IT and commercial sectors. The Bank has a unitary board model consisting of a mix of executive directors, non-executive directors and independent directors.
The Bank’s ability to innovate is critical to remaining relevant to its clients. The Board is committed to ensuring that the Bank remains agile to meet the changing needs of its clients and other stakeholders. The composition of the Board is carefully reviewed to ensure it has the necessary skills to deliver on the Bank strategy and leverage opportunities. The composition and size of Board is considered effective and appropriate to meet the requirements of the business in terms of setting the direction of the Bank and monitor management in order for the Bank to achieve its objectives. The Board has sufficient depth of skills and capabilities, diversity of experience as well as gender balance to provide the Bank with the appropriate direction and guidance to meet the expectation of its stakeholders.
The Bank, a wholly owned subsidiary of Standard Bank Group Limited, operates in a highly regulated and dynamic sector where the Bank is required to constantly adapt itself to conform to the changing legislation and market conditions. The Bank ensures that the directors are kept abreast of all their legal duties through continuous trainings carried out by in-house specialists, Group specialists and external consultants throughout the year. Newly appointed directors are also familiarised with their legal duties during the induction programme. The directors are cognisant of the requirement to exercise the degree of care, skill and diligence reasonably expected of a prudent and competent director for the proper discharge of their duties.
The Bank is predominantly regulated by the Bank of Mauritius, and operates in accordance with its guidelines, instructions and directives. The Bank of Mauritius Guideline on Corporate Governance encourages subsidiaries of foreign banks to have at least one independent director on the board. The Bank has in its board two independent directors, namely Mr. Arvind Hari and Mr. Sanjeev Manrakhan. Most of the board members remain non-executive directors who bring diverse perspectives to board deliberations and constructively challenge management.
The Board is committed to achieving high standards of corporate governance, through transparency, accountability, good performance, effective controls, integrity and a sound ethical culture across all its dealings. Board members are bound by the code of ethics and fiduciary duties owed to the Bank. The Board is responsible for providing ethical and effective leadership towards the achievement of the Bank’s strategy. It agrees the strategic direction and approves the policy framework used to measure organisational performance. This is achieved by ensuring transparent reporting by management and active board oversight. By so doing, the Board continuously scrutinises the Bank’s operations and its environment in which it operates to ensure that the Bank meets all legal and regulatory requirements. The Chief Executive and the executive team deliver against agreed performance targets aligned to the Bank’s strategy and in the best interests of the Bank and its stakeholders. Management is open and transparent in its engagements with the Board and escalates material matters requiring Board’s consideration in a timeous manner. Special board meetings are convened in need.
The Board is committed to acting in the best interests of the Bank, in good faith whilst avoiding conflicts of interest. The
Board has established robust governance practices which require the Board to review and approve, at least on a yearly basis, the mandates of the Board and its sub-committees. The mandates of the Board and its sub-committees were reviewed at the Board of Directors’ meeting held in November 2020.The Board is also responsible to review and approve, as and when required, the Bank’s Code of Ethics, job descriptions of the key senior governance positions, Bank’s organisational structure and statement of major accountabilities of the executive management. These are published on the Bank’s website.
The Board has ultimate responsibility for the affairs of the Bank.
• It acts as the link between the Bank and its shareholder.
• Decision makers - setting and monitoring strategic direction and key policies.
• Responsible for governance.
• Chairman of the Board is the spokesperson for the Board.
• Chief Executive is the spokesperson for the Bank.
• Empowering executive management to take actions to drive the Bank towards the set strategies.
• Approving the Bank’s corporate plan encompassing short as well as long term business objectives, strategy together with appropriate policies to execute the strategy including those relating to risk management, financial, capital adequacy, liquidity, compliance, operational and risk appetite amongst others.
• Responsible for the appointment and monitoring of senior management, question and analyse the performance of senior management in delivering and achieving corporate objectives.
• Responsible for the appointment of the Chief Executive and other senior officers.
• Ultimately accountable to the shareholder.
CompositionThe Bank recognises that a balanced board is vital for sustainable value creation. The Bank has a unitary board, which is considered effective and appropriate for the size of the Bank.
In April 2020, the Bank appointed Mr. Sanjeev Manrakhan as independent director on its board.
After almost 15 years with the Bank, Mr. Lakshman Bheenick submitted his resignation as Chief Executive on 30 November 2020 and stepped down from the board of directors in January 2021. Mrs. Michele Ah See, Head: Risk and executive director, was appointed by the board as Acting Chief Executive pending the appointment of a new chief executive.
As at 31 December 2020, the Board comprised 9 directors, 5 of whom are non-executive directors, 2 of whom are executive directors and 2 are independent directors.
The Board believes that its composition is both qualitatively and quantitatively balanced in terms of skills, gender, nationalities, experience and tenure. The directors have deep experience and diverse skills, which collectively ensure that the Board operates effectively to protect and create value in the design and delivery of the Bank’s strategy, and in the execution of its duties. They have the necessary competence to discharge their duties and to provide strategic direction and control of the Bank in accordance with the board mandate and the constitution of the Bank. There is a clear division of responsibilities ensuring that no one director has unfettered powers in the decision-making process, whilst ensuring that there is an appropriate balance of power. The collective background of the Board members provides for a balanced mix of attributes and skills that enables the Board to fulfil its duties and responsibilities. The composition of the Board and its committees is regularly reviewed to ensure that the balance and mix of diversity is preserved and that the Board maintains its effectiveness and efficiency at all times.
ENSURING OUR SUSTAINABILITY CORPORATE GOVERNANCE REPORT 55STANDARD BANK (MAURITIUS) LIMITED Annual report 202054

Board of Directors 7 Antonio Caroto COUTINHO
Personal Profile • Aged 53 • Holder of Bachelor of Commerce (Accounting)
from the University of Pretoria • Holder of a Diploma in Management from Henley
Business SchoolCurrent
• Appointed as Non-Executive Director in December 2018
• Currently Regional Chief Executive Africa Regions, Standard Bank Group
• Member of the Board Risk Management/Conduct Review Committee, Board Audit Committee, Board Technology and Information Committee and Board Credit Committee
Previous • Served as Chief Executive of Standard Bank Angola
until mid-2018 • Former Chief Executive of Standard Bank
Mozambique from 2004 to 2015.
8 Arvind HARI
Personal Profile • Aged 60 • Holder of a Bachelor in Commerce and Bachelor of
Accountancy from the University of Witwatersrand • Holder of a Master of Commerce from the
University of Pretoria • Member of the South African Institute of Chartered
Accountants, Independent Regulatory Board for Auditors of South Africa, and the Mauritian Institute of Directors
Current • Appointed as Independent Director in October
2018 • Chairman of Board Audit Committee • Member of the Board Technology and Information
Committee and Board Credit CommitteePrevious
• Served as Partner at KPMG Inc. in South Africa for 21 years
• Served as Member of KPMG’s Policy Board for 11 years
• Former Partner in Charge of the IT Audit and Advisory Business Unit of KPMG
• Former Executive Partner responsible for KPMG’s Finances, Executive Remuneration, People (Human Resources) and internal IT unit
9 Sanjeev MANRAKHAN
Personal Profile • Aged 50 • Holder of an MBA in Information Strategy from
l’École des Hautes Études Commerciales (EDHEC) in Nice, France
• Holder of a Post Graduate Certificate in Telecommunications from Bailbrook College in Bristol, United Kingdom
• Holder of a Bachelor of Business Science (BBusSc) degree in Services Marketing with sub-majors in Statistics and Economics from the University of Cape Town (UCT), South Africa
• Skilled in Business Analysis & Planning, Information & Financial Technologies, and Digital Transformation (Industrial Internet of Things, Big Data & Machine Learning Essentials)
Current • Appointed as Independent Director in April 2020 • Member of the Board Technology and Information
Committee and Board Audit CommitteePrevious
• Held various positions such as Head of Marketing and International Roaming with Mauritius Telecom (Cellular Division), Consultant to the GM of France Télécom (Mexico), Regional Director of Central, Eastern and Southern Africa with Gemalto (Telecom, Banking & ID), Advisor to the Chairman of Bharti-Airtel and Senior Advisor to the President of Huawei SSA (Networks) during the last 20 years
• Turned Serial Entrepreneur with a successful run in the technology and financial services industry with startups such as InfoSystems (IT), NanoBNK (Fintech) and DigiConsult (Proptech)
Ordinarily Resident in Mauritius
Executive Directors
Non-Executive Directors
Independent Directors
1 Duncan James WESTCOTT
Chairman Personal Profile
• Aged 71 • Holder of a BSc Economics from the University of
Wales • Fellow of the Institute of Chartered Accountants in
England and WalesCurrent
• Appointed as Independent Director in September 2010
• Appointed Chairman of Standard Bank (Mauritius) Limited since March 2019
Previous • Joined PricewaterhouseCoopers Inc. in South
Africa in 1975 and served as Partner from 1983 until June 2006
• Former Finance Manager and Director of Aspen Global Mauritius where he was in charge of the financial function from October 2008 to May 2010
• Former Chief Executive Officer of International Full Facility Services from June 2010 to May 2012 where he was responsible for the set-up of systems and procedures to effectively manage and control the initial start-up of this business, as well as the strategic direction and day to day management of the company
• Part time CFO of Shout It Now and Svenmill, both based in Cape Town, South Africa from 2012 to 2017
2 Lakshman BHEENICK Chief Executive
Personal Profile • Aged 47 • Holder of a BA (Hons) in Economics from
University of Manchester (England)Current
• Appointed as Executive Director in May 2010 and resigned as Director in January 2021
• Chief Executive of Standard Bank (Mauritius) Limited and Head: Corporate and Investment Banking until November 2020
• Joined Standard Bank (Mauritius) Limited in June 2006 as Head: Global Markets
Previous Worked for Barclays Bank Plc where he successfully led the Debt Capital Issuance in Mauritius and Botswana Ordinarily Resident in Mauritius
3 Michele AH SEE
Personal Profile • Aged 54 • Holder of a MA (ord) in Accountancy and
Economics from University of Aberdeen (Scotland) • Member of the Institute of Chartered Accountants
of England and WalesCurrent
• Appointed as Executive Director in February 2014 • Appointed as Acting Chief Executive in December
2020 pending the appointment of a new Chief Executive
• Joined Standard Bank (Mauritius) Limited in February 2009
• Occupies the post of Head: Risk in the BankPrevious
• Worked 10 years at the State Bank of Mauritius. Headed the Value Management Office, the Credit Underwriting Division and the Corporate Banking
Division • Worked for Somers Baker in UK and
PricewaterhouseCoopers Mauritius in AuditOrdinarily Resident in Mauritius
4 Clive Robert TASKER
Personal Profile • Aged 65 • Holder of a BA LLB from the University of Natal,
Pietermaritzburg • Advanced Management Programme from Wharton
Business School University of PennsylvaniaCurrent
• Appointed as Non-Executive Director in February 2016
• Chairman of the Board Risk Management/Conduct Review Committee and Board Technology and Information Committee
• Member of the Board Audit CommitteePrevious
• Joined the Standard Bank of South Africa Limited in November 2000
• Occupied various key positions within the Standard Bank Group including serving as Chief Executive of Standard Bank Africa from March 2008 to December 2011
• Former Head: Corporate Banking International, Corporate and Investment Banking of Standard Bank Group from January 2012 to December 2012
• Former Chief Executive Officer of Standard Advisory (China) Limited, a position he occupied from January 2013 until his retirement in September 2015
• Served as Director on the Board of various companies within the Standard Bank Group
5 Stephen Vincent
SCALIPersonal Profile
• Aged 48 • Holder of a Juris Doctor from Harvard Law School,
USA • Holder of a MA in Industrial Relations from the
University of Warwick, United Kingdom • Admitted to the New York State Bar in 2002 • Non-Practising Solicitor of England and Wales
Current • Appointed as Independent Director in June 2011 • Chairman of Board Credit Committee • Member of the Board Audit Committee and Board
Risk Management/Conduct Review CommitteePrevious
• Acted as in-house legal counsel at Vodafone Group Plc and Merrill Lynch
• Acted as Chief Executive of an investment management company, legal advisor, and director of leading Mauritius companies
Ordinarily Resident in Mauritius
6 Roderick Terner Forbes POOLEPersonal Profile
• Aged 59 • Holder of a Bachelor of Commerce from the
University of South AfricaCurrent
• Appointed as Non-Executive Director in November 2016
• Currently Head: Change and Business Transformation of Standard Bank Group
• Member of the Board Risk Management/Conduct Review Committee, Board Audit Committee, Board Technology and Information Committee and Board Credit Committee
Previous • Occupied various key positions in Finance, IT and
HR within the Standard Bank Group as from 1984 to 1991
• Former Head: Human Resources Corporate and Investment Banking at Standard Bank Plc, London, in 2007
• Former Head: Human Resources CIB, Standard Bank of South Africa in 2008
• Former Head: Human Capital, Marketing and Communications CIB of The Standard Bank of South Africa from 2012 to 2014
• Former Chief of Staff, Corporate and Investment Banking until November 2016
1 Mr. Duncan James WESTCOTT
(Chairman)
2 Mr. Lakshman BHEENICK *
(Chief Executive)
3 Mrs. Michele AH SEE
4 Mr. Clive Robert TASKER
5 Mr. Stephen Vincent SCALI
6 Mr. Roderick Terner Forbes POOLE
7 Mr. Antonio Caroto COUTINHO
8 Mr. Arvind HARI
9 Mr. Sanjeev MANRAKHAN **
ENSURING OUR SUSTAINABILITY CORPORATE GOVERNANCE REPORT CONTINUED
Male Female
18
The Executive Directors are members of the Board and in full time employment with the Bank.
57STANDARD BANK (MAURITIUS) LIMITED Annual report 202056

Assessing the Board’s effectivenessThe annual board evaluation provides an opportunity to consider views from all members, identify development areas, maximise strengths and explore ways to improve efficiencies for the Board to continuously improve its performance. The Chairman, with the support of the Company Secretary, leads the Board in considering and responding to the review of its effectiveness, which also includes a review of its sub-committees and an assessment of the contribution of individual directors through peer reviews. Performance evaluation of the Chairman is carried out by the Board, led by a non-executive or independent director. Any training needs are also identified, and the Company Secretary facilitates the holding of the such trainings during the course of the year.
The 2020 Board effectiveness review, led by the Chairman, was internally facilitated by the Company Secretary. The Board effectiveness review was assessed against the following main areas:
• Board strategy and execution
• Board composition, induction, succession planning
• Board operations and duties
• Effectiveness of Board committees
• Effectiveness of IT strategy, operations and controls
The process commenced in September 2020 whereby directors were asked to answer a web-based board effectiveness questionnaire. The questionnaire also allowed for free-text comments on the effectiveness of the Board and its committees, whilst requesting feedback on areas considered effective and areas requiring improvement. All directors were also invited to evaluate the individual performance of their peers. Individual results were shared with each director and the Chairman and one-on-one individual director feedback sessions were held between the Chairman and directors, where the results of the peer review were shared and discussed. The results of the Board effectiveness review, which were overall positive with no major concerns raised, were discussed by the Board at the November 2020 Board meeting. The recommendations on areas for improvement were noted and an action plan put in place.
Remuneration of DirectorsEffective governance is essential to ensure that the remuneration process is fair and supports the Bank’s strategy. The Bank of Mauritius has dispensed the Bank to establish a Nominations & Remuneration Committee at board level upon being satisfied that a suitably effective framework is in place at parent level to fulfil this role. The Group Directors’ Affairs Committee, set up at group level, is responsible amongst others to consider the remuneration of directors. The Group’s Director’s Affairs Committee ensures, through the Subsidiary Governance Framework and Principles of Standard Bank Group, that directors’ remuneration (including directors’ fees) promotes the long-term success of the group and applies best practices in determining director’s remuneration including annual review and benchmark against local peers.
Proposed fees are based on a carefully considered assessment of the directors’ responsibility, including the significant amount of work involved at committee level. The Board, and particularly its committees, chairs and committee members, spend a significant amount of time on in-depth analysis of matters relevant to the Bank’s performance and regulatory requirements. Once the proposed fees are considered by the Group Director’s Affairs Committee and the Board, a recommendation for approval is made to the shareholder by the Board at each annual meeting.
The Bank conducted, through an independent consultancy firm, an assessment of the remuneration of the Bank’s non-executive and independent directors against the market’s benchmark. The assessment demonstrated that the remuneration of the qualifying non-executive and independent directors was largely aligned to the market’s benchmark and appropriate adjustments were approved by the Shareholder upon recommendation of the Board. The fee structure was also amended to a fixed director’s fee structure, replacing a retainer and per meeting attendance fee in line with best practice.
Eligible non-executive and independent directors receive director’s fees for service on boards and board committees, payable on a quarterly basis. They do not receive annual incentive awards, nor do they participate in any of the bank’s or group’s long-term incentive schemes. For the remuneration of the executive directors, please refer to the statement of remuneration philosophy.
Changes in Board’s composition during the year*Mr. Lakshman Bheenick submitted his resignation as Chief Executive on 30 November 2020 and resigned as Director from the Board on 6 January 2021. Mrs. Michele Ah See has been appointed Acting Chief Executive in the interim pending the appointment of a new Chief Executive.
**On 13 April 2020, Mr. Sanjeev Manrakhan was appointed as Independent Director on the Board.
Chairman and Chief Executive
The role of Chairman is separate from that of the Chief Executive and there is a clear division of responsibilities. Care is taken to ensure that no single director has unfettered powers in the decision-making process. Whilst the Chairman and Chief Executive are collectively responsible for the leadership of the Bank and for promoting the highest standards of integrity and probity, these roles are carried out by two different persons. Each plays a distinctive role but complements each other to ensure that there is a balance of power and authority.
Chairman The Chairman leads the Board and is responsible for its overall effectiveness in directing the company. Role of the Chairman:
• sets the ethical tone for the Board and Bank;
• builds and maintains stakeholder trust and confidence;
• provides leadership and governance of the Board to create the conditions for overall Board’s and individual director’s effectiveness;
• ensures that all key and appropriate issues are discussed by the Board in a timely manner;
• ensures that all members of the Board are provided with timely, adequate and accurate information;
• ensures that the strategies and policies adopted by the Board are effectively implemented by the Chief Executive and management;
• conveys feedback in a balanced and accurate manner between the Board and the Chief Executive; and
• monitors the effectiveness of the Board and assesses individual performance of directors.
Chief Executive The Chief Executive is the face of the Bank and engages with material stakeholders including clients, regulators and employees on an ongoing basis.
Role of the Chief Executive:
• shoulders the responsibility for the execution of the day-to-day running of the Bank’s affairs;
• develops the Bank’s strategy and long-term plans for consideration and approval by the Board;
• runs the daily business supported by the executive committee which he chairs;
• establishes an organisational structure for the Bank which is appropriate for the execution of strategy;
• appoints and ensures proper succession planning of the executive team, and assesses their performance;
• reports to the Board on the performance of the Bank in line with the approved risk appetite, and its compliance with applicable laws and corporate governance principles; and
• sets the tone for ethical leadership, creating an ethical environment and ensures a culture that is based on the Bank’s values.
Appointment of DirectorsThe Board is responsible for the oversight of succession planning, the nomination process and the short listing of candidates. The Board has a formal and transparent process for the appointment of directors. Apart from a candidate’s skills, experience, availability and likely fit, the Board also considers the candidate’s demonstrated integrity, proven leadership as well as other directorships and commitments to ensure that they will have sufficient time to discharge their role properly. Due diligence is also conducted on the candidates and the Board considers and discusses the results thereof. The candidates are also required to satisfactorily meet the fit and proper test, as required by the Mauritian Banking Act. Additionally, the Directors’ Affairs Committee, a committee set up at the parent level of the Bank, reviews the recommendations for the appointment of the candidates. This committee considers the current Board skills matrix, a candidate’s skills, experience, availability, possible conflicts of interest and likely fit as well as demonstrated integrity, proven leadership and other time commitments. The salient terms and conditions of appointment of independent and non-executive directors are available on the Bank’s website.
As per the Bank’s Constitution, each director is required to retire annually from office and, if available and eligible, to stand for re-election at the annual meeting upon recommendation by the Board. Where the Board believes that a director is not discharging his/her duties and responsibilities to its satisfaction, it may consider the removal of the director. Once a decision is taken, the Board, through the Chairman, shall recommend the removal of the director to the shareholder or shall not recommend the director for re-election at the annual meeting, as the case may be.
The Chairman provides feedback on each individual director to the shareholder at each annual meeting, prior to the re-election of the directors. At the 2020 annual meeting, the Chairman has provided feedback on each individual director to the shareholder on whether the director’s performance continued to be effective, following which all directors who presented themselves for re-election were re-elected.
Directors’ induction and ongoing trainingNewly appointed directors are provided with the Bank’s governance manual which contains all relevant governance information, including the Bank’s founding documents, mandates, governance structures, significant reports, relevant legislation and policies. One-on-one meetings are organised with executive heads of department during which the director is introduced to the Bank and its operations. Site visits are also scheduled at the Bank’s premises and its disaster recovery sites. Meetings may also be scheduled with key executives at group level. The induction programme is tailored to each new director’s specific requirements.
Dates for training are scheduled in advance and form part of the board-approved annual calendar. Directors are kept abreast of applicable legislation and regulations, changes to rules, standards and codes, as well as relevant sector developments that could affect the Bank and its operations.
Topics considered in 2020 included:
• Anti-Financial Crime & Anti-Money Laundering
• Duties and Responsibilities of Directors
• Cyber Risk
• IFRS
• Blockchain
The above trainings were delivered by Standard Bank Group trainers through digital platforms.
ENSURING OUR SUSTAINABILITY CORPORATE GOVERNANCE REPORT CONTINUED
Bank’s constitution provides for annual re-election of all directors
Appointed by the shareholder at the annual meeting held in March every year
Directors’ remuneration is recommended by the Board to the shareholder for approval
After six years of tenure, a director no longer qualifies as an independent director
No limits on the number of times a director may stand for re-election, subject to continued satisfactory performance
Independent directors and qualifying non-executive directors receive fixed fees for service on Board and Board
committees
Director
Ensures the Board remains cognisant of its duties and responsibilities
Facilitates evaluation of Board and committee effectiveness
Oversees the induction of new directors
Ensures good information flows within the Board and its committees and between senior management and
non-executive/independent directors
Monitors compliance with regulations and inform Board of relevant changes in legislations and governance best
practices
Provides guidance to the Board
Training of directors
Company Secretary
59STANDARD BANK (MAURITIUS) LIMITED Annual report 202058

Board composition - Year 2020
Board
Lakshman BHEENICK* Michele AH SEE
Clive TASKER
Roderick POOLE
Duncan WESTCOTT(Chairman)
Executive Director Non-Executive Director Independent Director
*Resigned as director on 6 January 2021
Role and Duties of BoardThe Board oversees the Bank’s business strategy, internal organisation and governance structure, its risk management and compliance practices and key personnel decisions. The Board is collectively and ultimately responsible for the safety, soundness and long-term success of the Bank and delivery of sustainable shareholder value. It provides leadership to the Bank within a framework of prudent and effective controls enabling risks to be assessed and managed.
There is a clear demarcation of responsibilities and obligations between the Board and management. The Board is independent from management.
To effectively oversee the affairs of the Bank, the Board has delegated certain functions to its committees in line with the corporate governance framework and relevant legislation. Each committee has a board-approved mandate. In determining the composition of committees, the Board considers the skills and experience of its members, applicable regulations and the committee’s mandate. Committee chairmen are accountable for the effective functioning of the committees. They provide verbal updates to the Board of Directors on committee activities at each board meeting and highlight significant matters discussed at the committees for attention and consideration. The minutes of meetings are also included in the board packs for noting.
Board of Directors
Board Audit Committee Board Risk Management/Conduct Review Committee
Board Technology and Information Committee
Board Credit Committee
The Board reviews and approves their terms of reference on an annual basis. In 2020, the Board reviewed and approved the mandates of its sub-committees and its mandate.
Board and committees Responsibilities as at 31 December 2020Summary of key terms of reference of the Board of Directors
Strategy
• Maps out the Bank’s goals and plans for achieving those goals.
• Ensures that any action is aligned to the Bank’s values, performance and sustainability.
• Continuously monitors financial performance.
• Ensures that an adequate budget and planning process exists.
Corporate Governance
• Ensures that sound corporate governance practices are implemented within the Bank.
• Annual assessment of achievements against set objectives.
• Delegates power, authorities and discretions to the chief executive and sub-committees for efficient decision-making process.
• Proposes to the shareholder for approval, the remuneration of independent and non-executive directors.
• Recommends external auditor’s fees to the shareholder for approval following recommendation from the Board Audit Committee.
• Reviews matters such as code of ethics, environmental and social issues.
• The Board approves the Bank’s code of ethics and ensures that the highest set of standards for responsible business practice is adhered to by the Bank.
Board members’ appointment, and overall effectiveness and evaluation of Board
• The Board conducts a fit and proper assessment before recommending the appointment of directors to the shareholder.
• The Board approves the appointment of the Chairperson and membership of all Board committees on an annual basis.
• The Board assumes the responsibilities for succession planning and for the appointment and induction of new directors to the Board.
• Ongoing board education remains a focus for the Board to ensure that directors are kept abreast of all applicable legislations and regulations, changes to rules, standards and codes, as well as relevant sector developments that could affect the Bank and its operations.
• Annual assessment of the Board is conducted against set objectives to review and further the Board’s effectiveness.
Risk and Compliance
• Ensures proper and effective compliance and risk management policies and procedures are implemented.
• Implements policies and procedures to identify conflict of interest situations and steps to redress such situations.
Dividend Policy, Finance and Capital Funding
• Responsible for the preparation of accounts that fairly present the state of affairs of the organisation and which comply with international reporting standards.
• Ensures that policies and systems are in place to achieve a prudential balance between risks and returns to the shareholder.
• Approves dividends payments to the shareholder.
• Considers and approves capital expenditure recommended by the Executive Committee.
• Ensure an adequate budget and planning process exists, and that performance is measured against budgets and plans.
Access to information and Resources
• Regular interaction between Board and executive management.
• Directors have free and unrestricted access to management team and to Bank’s information.
• Directors are provided with the services of external legal advisors when required.
The year ahead
> Implement board succession plans.
> Consider the impact of regulatory changes.
> Measure progress against strategic objectives.
> Continue to monitor the Bank’s operational and financial performance.
ENSURING OUR SUSTAINABILITY CORPORATE GOVERNANCE REPORT CONTINUED
Antonio COUTINHOStephen SCALI
Sanjeev MANRAKHANArvind HARI
61STANDARD BANK (MAURITIUS) LIMITED Annual report 202060
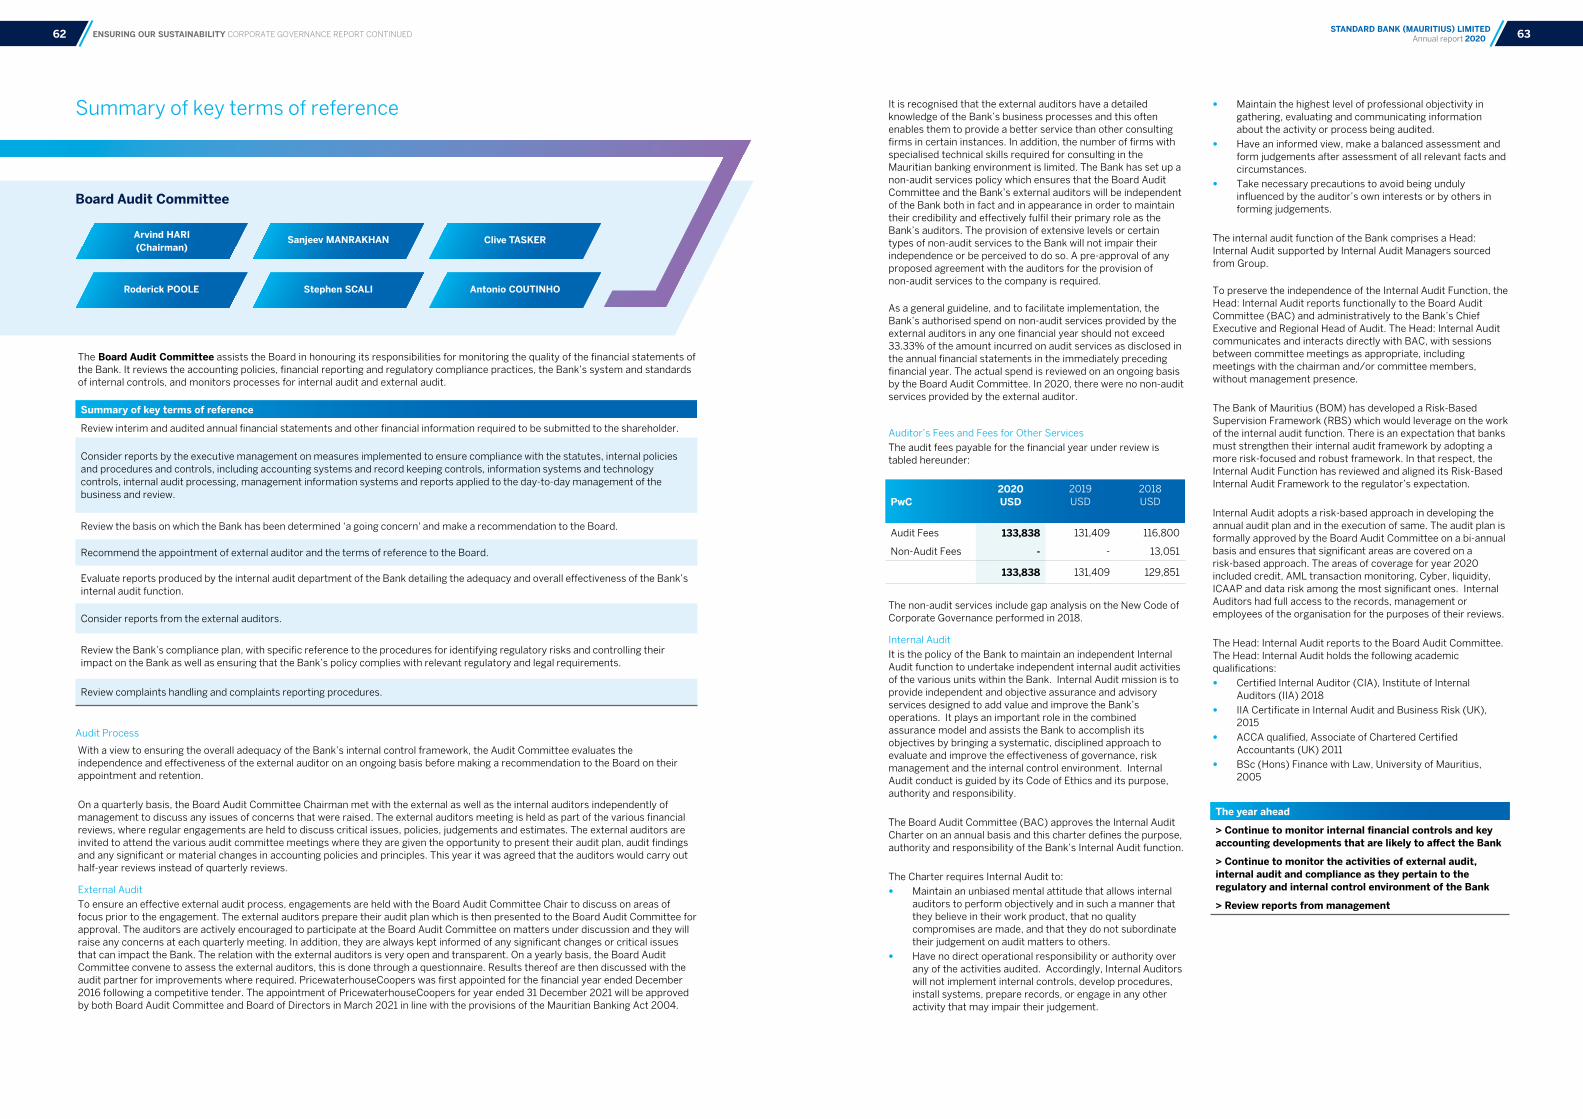
Board Audit Committee
Summary of key terms of reference
ENSURING OUR SUSTAINABILITY CORPORATE GOVERNANCE REPORT CONTINUED
Sanjeev MANRAKHAN
Roderick POOLE
Clive TASKER
Antonio COUTINHOStephen SCALI
Arvind HARI (Chairman)
The Board Audit Committee assists the Board in honouring its responsibilities for monitoring the quality of the financial statements of the Bank. It reviews the accounting policies, financial reporting and regulatory compliance practices, the Bank’s system and standards of internal controls, and monitors processes for internal audit and external audit.
Audit Process
With a view to ensuring the overall adequacy of the Bank’s internal control framework, the Audit Committee evaluates the independence and effectiveness of the external auditor on an ongoing basis before making a recommendation to the Board on their appointment and retention.
On a quarterly basis, the Board Audit Committee Chairman met with the external as well as the internal auditors independently of management to discuss any issues of concerns that were raised. The external auditors meeting is held as part of the various financial reviews, where regular engagements are held to discuss critical issues, policies, judgements and estimates. The external auditors are invited to attend the various audit committee meetings where they are given the opportunity to present their audit plan, audit findings and any significant or material changes in accounting policies and principles. This year it was agreed that the auditors would carry out half-year reviews instead of quarterly reviews.
External Audit
To ensure an effective external audit process, engagements are held with the Board Audit Committee Chair to discuss on areas of focus prior to the engagement. The external auditors prepare their audit plan which is then presented to the Board Audit Committee for approval. The auditors are actively encouraged to participate at the Board Audit Committee on matters under discussion and they will raise any concerns at each quarterly meeting. In addition, they are always kept informed of any significant changes or critical issues that can impact the Bank. The relation with the external auditors is very open and transparent. On a yearly basis, the Board Audit Committee convene to assess the external auditors, this is done through a questionnaire. Results thereof are then discussed with the audit partner for improvements where required. PricewaterhouseCoopers was first appointed for the financial year ended December 2016 following a competitive tender. The appointment of PricewaterhouseCoopers for year ended 31 December 2021 will be approved by both Board Audit Committee and Board of Directors in March 2021 in line with the provisions of the Mauritian Banking Act 2004.
Summary of key terms of reference
Review interim and audited annual financial statements and other financial information required to be submitted to the shareholder.
Consider reports by the executive management on measures implemented to ensure compliance with the statutes, internal policies and procedures and controls, including accounting systems and record keeping controls, information systems and technology controls, internal audit processing, management information systems and reports applied to the day-to-day management of the business and review.
Review the basis on which the Bank has been determined ‘a going concern' and make a recommendation to the Board.
Recommend the appointment of external auditor and the terms of reference to the Board.
Evaluate reports produced by the internal audit department of the Bank detailing the adequacy and overall effectiveness of the Bank’s internal audit function.
Consider reports from the external auditors.
Review the Bank’s compliance plan, with specific reference to the procedures for identifying regulatory risks and controlling their impact on the Bank as well as ensuring that the Bank’s policy complies with relevant regulatory and legal requirements.
Review complaints handling and complaints reporting procedures.
It is recognised that the external auditors have a detailed knowledge of the Bank’s business processes and this often enables them to provide a better service than other consulting firms in certain instances. In addition, the number of firms with specialised technical skills required for consulting in the Mauritian banking environment is limited. The Bank has set up a non-audit services policy which ensures that the Board Audit Committee and the Bank’s external auditors will be independent of the Bank both in fact and in appearance in order to maintain their credibility and effectively fulfil their primary role as the Bank’s auditors. The provision of extensive levels or certain types of non-audit services to the Bank will not impair their independence or be perceived to do so. A pre-approval of any proposed agreement with the auditors for the provision of non-audit services to the company is required.
As a general guideline, and to facilitate implementation, the Bank’s authorised spend on non-audit services provided by the external auditors in any one financial year should not exceed 33.33% of the amount incurred on audit services as disclosed in the annual financial statements in the immediately preceding financial year. The actual spend is reviewed on an ongoing basis by the Board Audit Committee. In 2020, there were no non-audit services provided by the external auditor.
Auditor’s Fees and Fees for Other Services
The audit fees payable for the financial year under review is tabled hereunder:
The non-audit services include gap analysis on the New Code of Corporate Governance performed in 2018.
Internal Audit
It is the policy of the Bank to maintain an independent Internal Audit function to undertake independent internal audit activities of the various units within the Bank. Internal Audit mission is to provide independent and objective assurance and advisory services designed to add value and improve the Bank’s operations. It plays an important role in the combined assurance model and assists the Bank to accomplish its objectives by bringing a systematic, disciplined approach to evaluate and improve the effectiveness of governance, risk management and the internal control environment. Internal Audit conduct is guided by its Code of Ethics and its purpose, authority and responsibility.
The Board Audit Committee (BAC) approves the Internal Audit Charter on an annual basis and this charter defines the purpose, authority and responsibility of the Bank’s Internal Audit function.
The Charter requires Internal Audit to:
• Maintain an unbiased mental attitude that allows internal auditors to perform objectively and in such a manner that they believe in their work product, that no quality compromises are made, and that they do not subordinate their judgement on audit matters to others.
• Have no direct operational responsibility or authority over any of the activities audited. Accordingly, Internal Auditors will not implement internal controls, develop procedures, install systems, prepare records, or engage in any other activity that may impair their judgement.
• Maintain the highest level of professional objectivity in gathering, evaluating and communicating information about the activity or process being audited.
• Have an informed view, make a balanced assessment and form judgements after assessment of all relevant facts and circumstances.
• Take necessary precautions to avoid being unduly influenced by the auditor’s own interests or by others in forming judgements.
The internal audit function of the Bank comprises a Head: Internal Audit supported by Internal Audit Managers sourced from Group.
To preserve the independence of the Internal Audit Function, the Head: Internal Audit reports functionally to the Board Audit Committee (BAC) and administratively to the Bank’s Chief Executive and Regional Head of Audit. The Head: Internal Audit communicates and interacts directly with BAC, with sessions between committee meetings as appropriate, including meetings with the chairman and/or committee members, without management presence.
The Bank of Mauritius (BOM) has developed a Risk-Based Supervision Framework (RBS) which would leverage on the work of the internal audit function. There is an expectation that banks must strengthen their internal audit framework by adopting a more risk-focused and robust framework. In that respect, the Internal Audit Function has reviewed and aligned its Risk-Based Internal Audit Framework to the regulator’s expectation.
Internal Audit adopts a risk-based approach in developing the annual audit plan and in the execution of same. The audit plan is formally approved by the Board Audit Committee on a bi-annual basis and ensures that significant areas are covered on a risk-based approach. The areas of coverage for year 2020 included credit, AML transaction monitoring, Cyber, liquidity, ICAAP and data risk among the most significant ones. Internal Auditors had full access to the records, management or employees of the organisation for the purposes of their reviews.
The Head: Internal Audit reports to the Board Audit Committee. The Head: Internal Audit holds the following academic qualifications:
• Certified Internal Auditor (CIA), Institute of Internal Auditors (IIA) 2018
• IIA Certificate in Internal Audit and Business Risk (UK), 2015
• ACCA qualified, Associate of Chartered Certified Accountants (UK) 2011
• BSc (Hons) Finance with Law, University of Mauritius, 2005
PwC2020USD
2019USD
2018USD
Audit Fees 133,838 131,409 116,800
Non-Audit Fees - - 13,051
133,838 131,409 129,851
The year ahead
> Continue to monitor internal financial controls and key accounting developments that are likely to affect the Bank
> Continue to monitor the activities of external audit, internal audit and compliance as they pertain to the regulatory and internal control environment of the Bank
> Review reports from management
63STANDARD BANK (MAURITIUS) LIMITED Annual report 202062
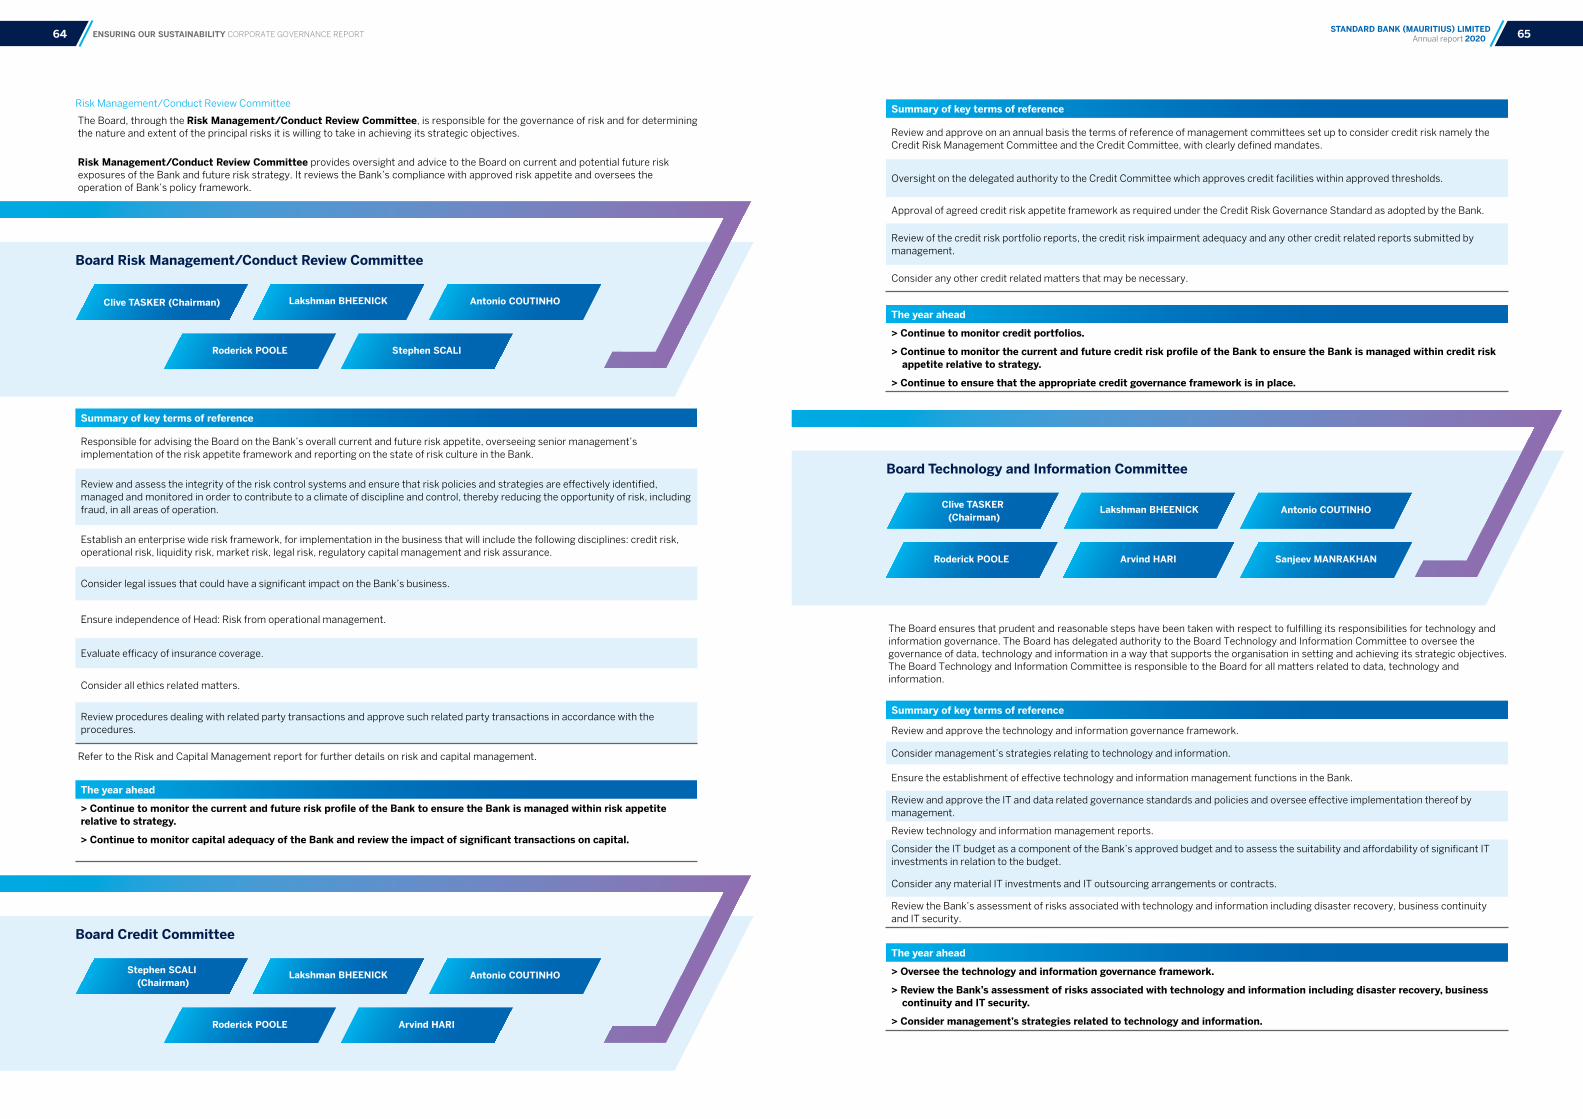
Board Technology and Information Committee
Lakshman BHEENICK
Roderick POOLE
Antonio COUTINHO
Arvind HARI Sanjeev MANRAKHAN
Clive TASKER (Chairman)
ENSURING OUR SUSTAINABILITY CORPORATE GOVERNANCE REPORT
Board Risk Management/Conduct Review Committee
Lakshman BHEENICK
Roderick POOLE
Antonio COUTINHO
Stephen SCALI
Clive TASKER (Chairman)
Summary of key terms of reference
Responsible for advising the Board on the Bank’s overall current and future risk appetite, overseeing senior management’s implementation of the risk appetite framework and reporting on the state of risk culture in the Bank.
Review and assess the integrity of the risk control systems and ensure that risk policies and strategies are effectively identified, managed and monitored in order to contribute to a climate of discipline and control, thereby reducing the opportunity of risk, including fraud, in all areas of operation.
Establish an enterprise wide risk framework, for implementation in the business that will include the following disciplines: credit risk, operational risk, liquidity risk, market risk, legal risk, regulatory capital management and risk assurance.
Consider legal issues that could have a significant impact on the Bank’s business.
Ensure independence of Head: Risk from operational management.
Evaluate efficacy of insurance coverage.
Consider all ethics related matters.
Review procedures dealing with related party transactions and approve such related party transactions in accordance with the procedures.
Summary of key terms of reference
Review and approve on an annual basis the terms of reference of management committees set up to consider credit risk namely the Credit Risk Management Committee and the Credit Committee, with clearly defined mandates.
Oversight on the delegated authority to the Credit Committee which approves credit facilities within approved thresholds.
Approval of agreed credit risk appetite framework as required under the Credit Risk Governance Standard as adopted by the Bank.
Review of the credit risk portfolio reports, the credit risk impairment adequacy and any other credit related reports submitted by management.
Consider any other credit related matters that may be necessary.
Summary of key terms of reference
Review and approve the technology and information governance framework.
Consider management’s strategies relating to technology and information.
Ensure the establishment of effective technology and information management functions in the Bank.
Review and approve the IT and data related governance standards and policies and oversee effective implementation thereof by management.
Review technology and information management reports.
Consider the IT budget as a component of the Bank’s approved budget and to assess the suitability and affordability of significant IT investments in relation to the budget.
Consider any material IT investments and IT outsourcing arrangements or contracts.
Review the Bank’s assessment of risks associated with technology and information including disaster recovery, business continuity and IT security.
Risk Management/Conduct Review Committee
The Board, through the Risk Management/Conduct Review Committee, is responsible for the governance of risk and for determining the nature and extent of the principal risks it is willing to take in achieving its strategic objectives.
Risk Management/Conduct Review Committee provides oversight and advice to the Board on current and potential future risk exposures of the Bank and future risk strategy. It reviews the Bank’s compliance with approved risk appetite and oversees the operation of Bank’s policy framework.
The Board ensures that prudent and reasonable steps have been taken with respect to fulfilling its responsibilities for technology and information governance. The Board has delegated authority to the Board Technology and Information Committee to oversee the governance of data, technology and information in a way that supports the organisation in setting and achieving its strategic objectives. The Board Technology and Information Committee is responsible to the Board for all matters related to data, technology and information.
Refer to the Risk and Capital Management report for further details on risk and capital management.
The year ahead
> Continue to monitor the current and future risk profile of the Bank to ensure the Bank is managed within risk appetite relative to strategy.
> Continue to monitor capital adequacy of the Bank and review the impact of significant transactions on capital.
The year ahead
> Continue to monitor credit portfolios.
> Continue to monitor the current and future credit risk profile of the Bank to ensure the Bank is managed within credit risk appetite relative to strategy.
> Continue to ensure that the appropriate credit governance framework is in place.
The year ahead
> Oversee the technology and information governance framework.
> Review the Bank’s assessment of risks associated with technology and information including disaster recovery, business continuity and IT security.
> Consider management’s strategies related to technology and information.
Board Credit Committee
Lakshman BHEENICK
Roderick POOLE
Antonio COUTINHO
Arvind HARI
Stephen SCALI (Chairman)
65STANDARD BANK (MAURITIUS) LIMITED Annual report 202064
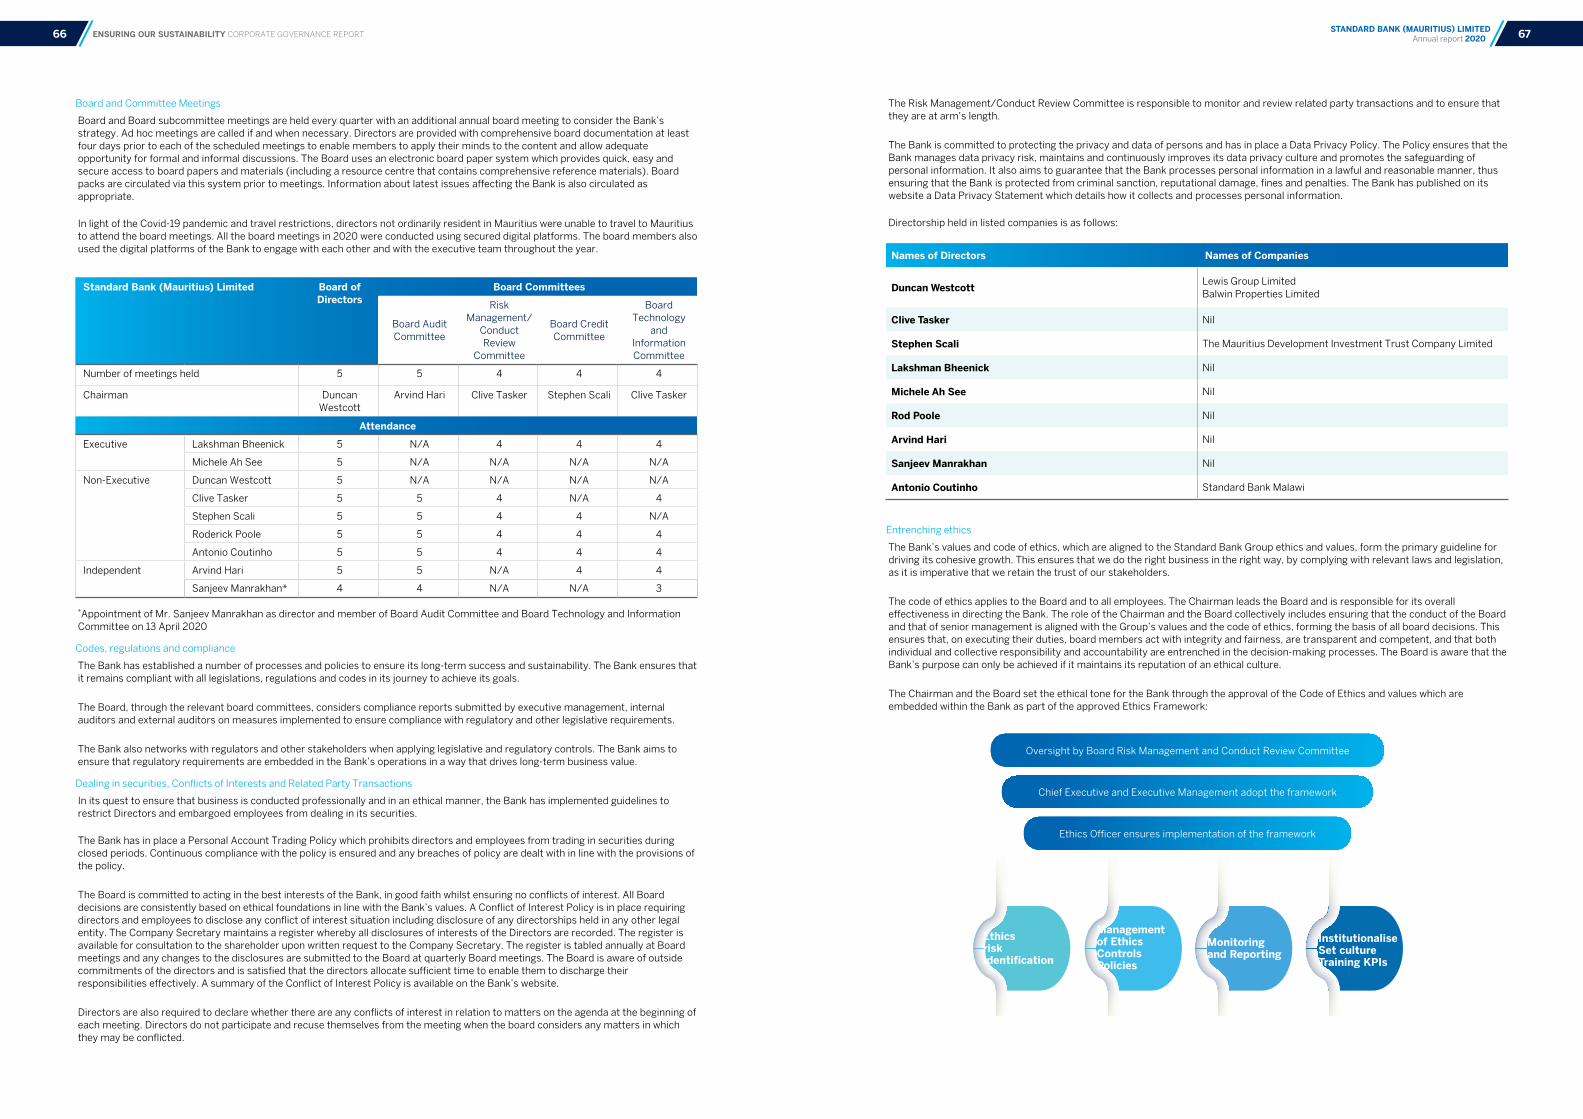
ENSURING OUR SUSTAINABILITY CORPORATE GOVERNANCE REPORT
Board and Committee Meetings
Board and Board subcommittee meetings are held every quarter with an additional annual board meeting to consider the Bank’s strategy. Ad hoc meetings are called if and when necessary. Directors are provided with comprehensive board documentation at least four days prior to each of the scheduled meetings to enable members to apply their minds to the content and allow adequate opportunity for formal and informal discussions. The Board uses an electronic board paper system which provides quick, easy and secure access to board papers and materials (including a resource centre that contains comprehensive reference materials). Board packs are circulated via this system prior to meetings. Information about latest issues affecting the Bank is also circulated as appropriate.
In light of the Covid-19 pandemic and travel restrictions, directors not ordinarily resident in Mauritius were unable to travel to Mauritius to attend the board meetings. All the board meetings in 2020 were conducted using secured digital platforms. The board members also used the digital platforms of the Bank to engage with each other and with the executive team throughout the year.
The Risk Management/Conduct Review Committee is responsible to monitor and review related party transactions and to ensure that they are at arm’s length.
The Bank is committed to protecting the privacy and data of persons and has in place a Data Privacy Policy. The Policy ensures that the Bank manages data privacy risk, maintains and continuously improves its data privacy culture and promotes the safeguarding of personal information. It also aims to guarantee that the Bank processes personal information in a lawful and reasonable manner, thus ensuring that the Bank is protected from criminal sanction, reputational damage, fines and penalties. The Bank has published on its website a Data Privacy Statement which details how it collects and processes personal information.
Directorship held in listed companies is as follows:
Entrenching ethics
The Bank’s values and code of ethics, which are aligned to the Standard Bank Group ethics and values, form the primary guideline for driving its cohesive growth. This ensures that we do the right business in the right way, by complying with relevant laws and legislation, as it is imperative that we retain the trust of our stakeholders.
The code of ethics applies to the Board and to all employees. The Chairman leads the Board and is responsible for its overall effectiveness in directing the Bank. The role of the Chairman and the Board collectively includes ensuring that the conduct of the Board and that of senior management is aligned with the Group’s values and the code of ethics, forming the basis of all board decisions. This ensures that, on executing their duties, board members act with integrity and fairness, are transparent and competent, and that both individual and collective responsibility and accountability are entrenched in the decision-making processes. The Board is aware that the Bank’s purpose can only be achieved if it maintains its reputation of an ethical culture.
The Chairman and the Board set the ethical tone for the Bank through the approval of the Code of Ethics and values which are embedded within the Bank as part of the approved Ethics Framework:
*Appointment of Mr. Sanjeev Manrakhan as director and member of Board Audit Committee and Board Technology and Information Committee on 13 April 2020
Codes, regulations and compliance
The Bank has established a number of processes and policies to ensure its long-term success and sustainability. The Bank ensures that it remains compliant with all legislations, regulations and codes in its journey to achieve its goals.
The Board, through the relevant board committees, considers compliance reports submitted by executive management, internal auditors and external auditors on measures implemented to ensure compliance with regulatory and other legislative requirements.
The Bank also networks with regulators and other stakeholders when applying legislative and regulatory controls. The Bank aims to ensure that regulatory requirements are embedded in the Bank’s operations in a way that drives long-term business value.
Dealing in securities, Conflicts of Interests and Related Party Transactions
In its quest to ensure that business is conducted professionally and in an ethical manner, the Bank has implemented guidelines to restrict Directors and embargoed employees from dealing in its securities.
The Bank has in place a Personal Account Trading Policy which prohibits directors and employees from trading in securities during closed periods. Continuous compliance with the policy is ensured and any breaches of policy are dealt with in line with the provisions of the policy.
The Board is committed to acting in the best interests of the Bank, in good faith whilst ensuring no conflicts of interest. All Board decisions are consistently based on ethical foundations in line with the Bank’s values. A Conflict of Interest Policy is in place requiring directors and employees to disclose any conflict of interest situation including disclosure of any directorships held in any other legal entity. The Company Secretary maintains a register whereby all disclosures of interests of the Directors are recorded. The register is available for consultation to the shareholder upon written request to the Company Secretary. The register is tabled annually at Board meetings and any changes to the disclosures are submitted to the Board at quarterly Board meetings. The Board is aware of outside commitments of the directors and is satisfied that the directors allocate sufficient time to enable them to discharge their responsibilities effectively. A summary of the Conflict of Interest Policy is available on the Bank’s website.
Directors are also required to declare whether there are any conflicts of interest in relation to matters on the agenda at the beginning of each meeting. Directors do not participate and recuse themselves from the meeting when the board considers any matters in which they may be conflicted.
Standard Bank (Mauritius) Limited Board of Directors
Board Committees
Board Audit Committee
Risk Management/
Conduct Review
Committee
Board Credit Committee
Board Technology
and Information Committee
Number of meetings held 5 5 4 4 4
Chairman Duncan Westcott
Arvind Hari Clive Tasker Stephen Scali Clive Tasker
Attendance
Executive Lakshman Bheenick 5 N/A 4 4 4
Michele Ah See 5 N/A N/A N/A N/A
Non-Executive Duncan Westcott 5 N/A N/A N/A N/A
Clive Tasker 5 5 4 N/A 4
Stephen Scali 5 5 4 4 N/A
Roderick Poole 5 5 4 4 4
Antonio Coutinho 5 5 4 4 4
Independent Arvind Hari 5 5 N/A 4 4
Sanjeev Manrakhan* 4 4 N/A N/A 3
Names of Directors Names of Companies
Duncan Westcott Lewis Group LimitedBalwin Properties Limited
Clive Tasker Nil
Stephen Scali The Mauritius Development Investment Trust Company Limited
Lakshman Bheenick Nil
Michele Ah See Nil
Rod Poole Nil
Arvind Hari Nil
Sanjeev Manrakhan Nil
Antonio Coutinho Standard Bank Malawi
Oversight by Board Risk Management and Conduct Review Committee
Chief Executive and Executive Management adopt the framework
Ethics Officer ensures implementation of the framework
Ethics risk Identification
Management of Ethics Controls Policies
Monitoring and Reporting
Institutionalise Set culture Training KPIs
67STANDARD BANK (MAURITIUS) LIMITED Annual report 202066
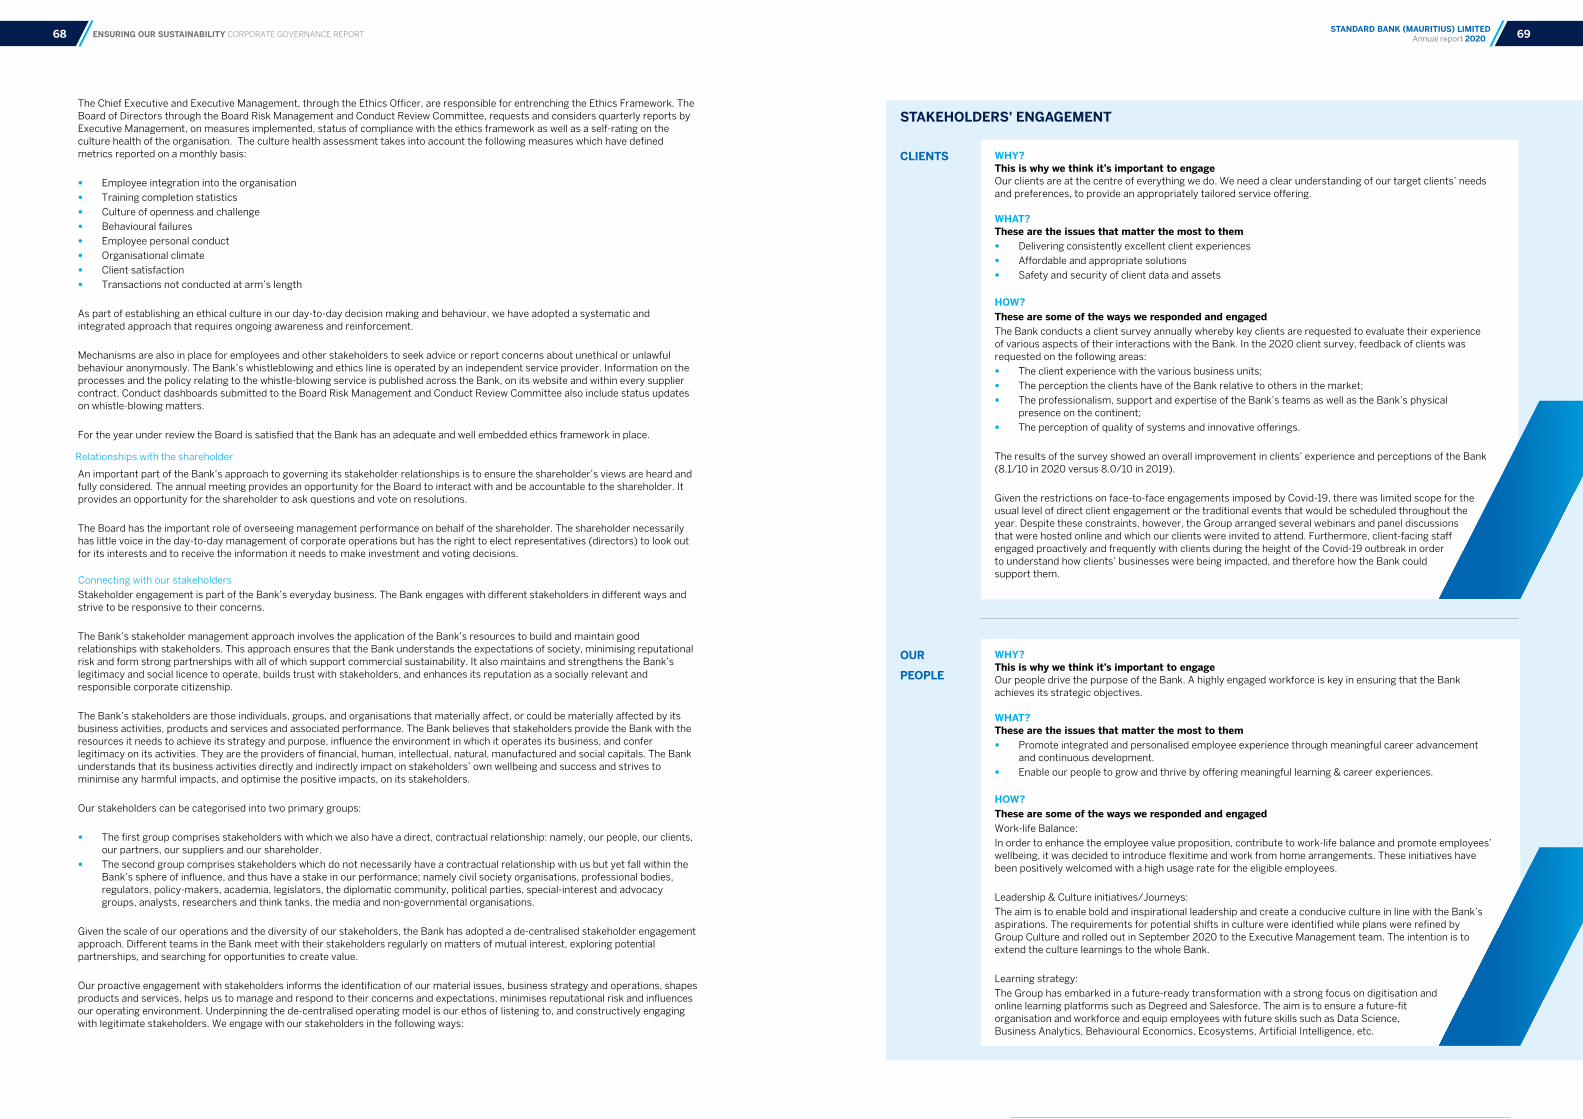
ENSURING OUR SUSTAINABILITY CORPORATE GOVERNANCE REPORT
The Chief Executive and Executive Management, through the Ethics Officer, are responsible for entrenching the Ethics Framework. The Board of Directors through the Board Risk Management and Conduct Review Committee, requests and considers quarterly reports by Executive Management, on measures implemented, status of compliance with the ethics framework as well as a self-rating on the culture health of the organisation. The culture health assessment takes into account the following measures which have defined metrics reported on a monthly basis:
• Employee integration into the organisation
• Training completion statistics
• Culture of openness and challenge
• Behavioural failures
• Employee personal conduct
• Organisational climate
• Client satisfaction
• Transactions not conducted at arm’s length
As part of establishing an ethical culture in our day-to-day decision making and behaviour, we have adopted a systematic and integrated approach that requires ongoing awareness and reinforcement.
Mechanisms are also in place for employees and other stakeholders to seek advice or report concerns about unethical or unlawful behaviour anonymously. The Bank’s whistleblowing and ethics line is operated by an independent service provider. Information on the processes and the policy relating to the whistle-blowing service is published across the Bank, on its website and within every supplier contract. Conduct dashboards submitted to the Board Risk Management and Conduct Review Committee also include status updates on whistle-blowing matters.
For the year under review the Board is satisfied that the Bank has an adequate and well embedded ethics framework in place.
Relationships with the shareholder
An important part of the Bank’s approach to governing its stakeholder relationships is to ensure the shareholder’s views are heard and fully considered. The annual meeting provides an opportunity for the Board to interact with and be accountable to the shareholder. It provides an opportunity for the shareholder to ask questions and vote on resolutions.
The Board has the important role of overseeing management performance on behalf of the shareholder. The shareholder necessarily has little voice in the day-to-day management of corporate operations but has the right to elect representatives (directors) to look out for its interests and to receive the information it needs to make investment and voting decisions.
Connecting with our stakeholders
Stakeholder engagement is part of the Bank’s everyday business. The Bank engages with different stakeholders in different ways and strive to be responsive to their concerns.
The Bank’s stakeholder management approach involves the application of the Bank’s resources to build and maintain good relationships with stakeholders. This approach ensures that the Bank understands the expectations of society, minimising reputational risk and form strong partnerships with all of which support commercial sustainability. It also maintains and strengthens the Bank’s legitimacy and social licence to operate, builds trust with stakeholders, and enhances its reputation as a socially relevant and responsible corporate citizenship.
The Bank’s stakeholders are those individuals, groups, and organisations that materially affect, or could be materially affected by its business activities, products and services and associated performance. The Bank believes that stakeholders provide the Bank with the resources it needs to achieve its strategy and purpose, influence the environment in which it operates its business, and confer legitimacy on its activities. They are the providers of financial, human, intellectual, natural, manufactured and social capitals. The Bank understands that its business activities directly and indirectly impact on stakeholders’ own wellbeing and success and strives to minimise any harmful impacts, and optimise the positive impacts, on its stakeholders.
Our stakeholders can be categorised into two primary groups:
• The first group comprises stakeholders with which we also have a direct, contractual relationship: namely, our people, our clients, our partners, our suppliers and our shareholder.
• The second group comprises stakeholders which do not necessarily have a contractual relationship with us but yet fall within the Bank’s sphere of influence, and thus have a stake in our performance; namely civil society organisations, professional bodies, regulators, policy-makers, academia, legislators, the diplomatic community, political parties, special-interest and advocacy groups, analysts, researchers and think tanks, the media and non-governmental organisations.
Given the scale of our operations and the diversity of our stakeholders, the Bank has adopted a de-centralised stakeholder engagement approach. Different teams in the Bank meet with their stakeholders regularly on matters of mutual interest, exploring potential partnerships, and searching for opportunities to create value.
Our proactive engagement with stakeholders informs the identification of our material issues, business strategy and operations, shapes products and services, helps us to manage and respond to their concerns and expectations, minimises reputational risk and influences our operating environment. Underpinning the de-centralised operating model is our ethos of listening to, and constructively engaging with legitimate stakeholders. We engage with our stakeholders in the following ways:
STAKEHOLDERS' ENGAGEMENT
WHY? This is why we think it’s important to engage Our clients are at the centre of everything we do. We need a clear understanding of our target clients’ needs and preferences, to provide an appropriately tailored service offering. WHAT? These are the issues that matter the most to them
• Delivering consistently excellent client experiences
• Affordable and appropriate solutions
• Safety and security of client data and assets
HOW?These are some of the ways we responded and engagedThe Bank conducts a client survey annually whereby key clients are requested to evaluate their experience of various aspects of their interactions with the Bank. In the 2020 client survey, feedback of clients was requested on the following areas:
• The client experience with the various business units;
• The perception the clients have of the Bank relative to others in the market;
• The professionalism, support and expertise of the Bank’s teams as well as the Bank’s physical presence on the continent;
• The perception of quality of systems and innovative offerings.
The results of the survey showed an overall improvement in clients’ experience and perceptions of the Bank (8.1/10 in 2020 versus 8.0/10 in 2019).
Given the restrictions on face-to-face engagements imposed by Covid-19, there was limited scope for the usual level of direct client engagement or the traditional events that would be scheduled throughout the year. Despite these constraints, however, the Group arranged several webinars and panel discussions that were hosted online and which our clients were invited to attend. Furthermore, client-facing staff engaged proactively and frequently with clients during the height of the Covid-19 outbreak in order to understand how clients’ businesses were being impacted, and therefore how the Bank could support them.
WHY? This is why we think it’s important to engage Our people drive the purpose of the Bank. A highly engaged workforce is key in ensuring that the Bank achieves its strategic objectives. WHAT? These are the issues that matter the most to them
• Promote integrated and personalised employee experience through meaningful career advancement and continuous development.
• Enable our people to grow and thrive by offering meaningful learning & career experiences.
HOW?These are some of the ways we responded and engagedWork-life Balance:
In order to enhance the employee value proposition, contribute to work-life balance and promote employees’ wellbeing, it was decided to introduce flexitime and work from home arrangements. These initiatives have been positively welcomed with a high usage rate for the eligible employees.
Leadership & Culture initiatives/Journeys:
The aim is to enable bold and inspirational leadership and create a conducive culture in line with the Bank’s aspirations. The requirements for potential shifts in culture were identified while plans were refined by Group Culture and rolled out in September 2020 to the Executive Management team. The intention is to extend the culture learnings to the whole Bank.
Learning strategy:
The Group has embarked in a future-ready transformation with a strong focus on digitisation and online learning platforms such as Degreed and Salesforce. The aim is to ensure a future-fit organisation and workforce and equip employees with future skills such as Data Science, Business Analytics, Behavioural Economics, Ecosystems, Artificial Intelligence, etc.
CLIENTS
OUR
PEOPLE
69STANDARD BANK (MAURITIUS) LIMITED Annual report 202068
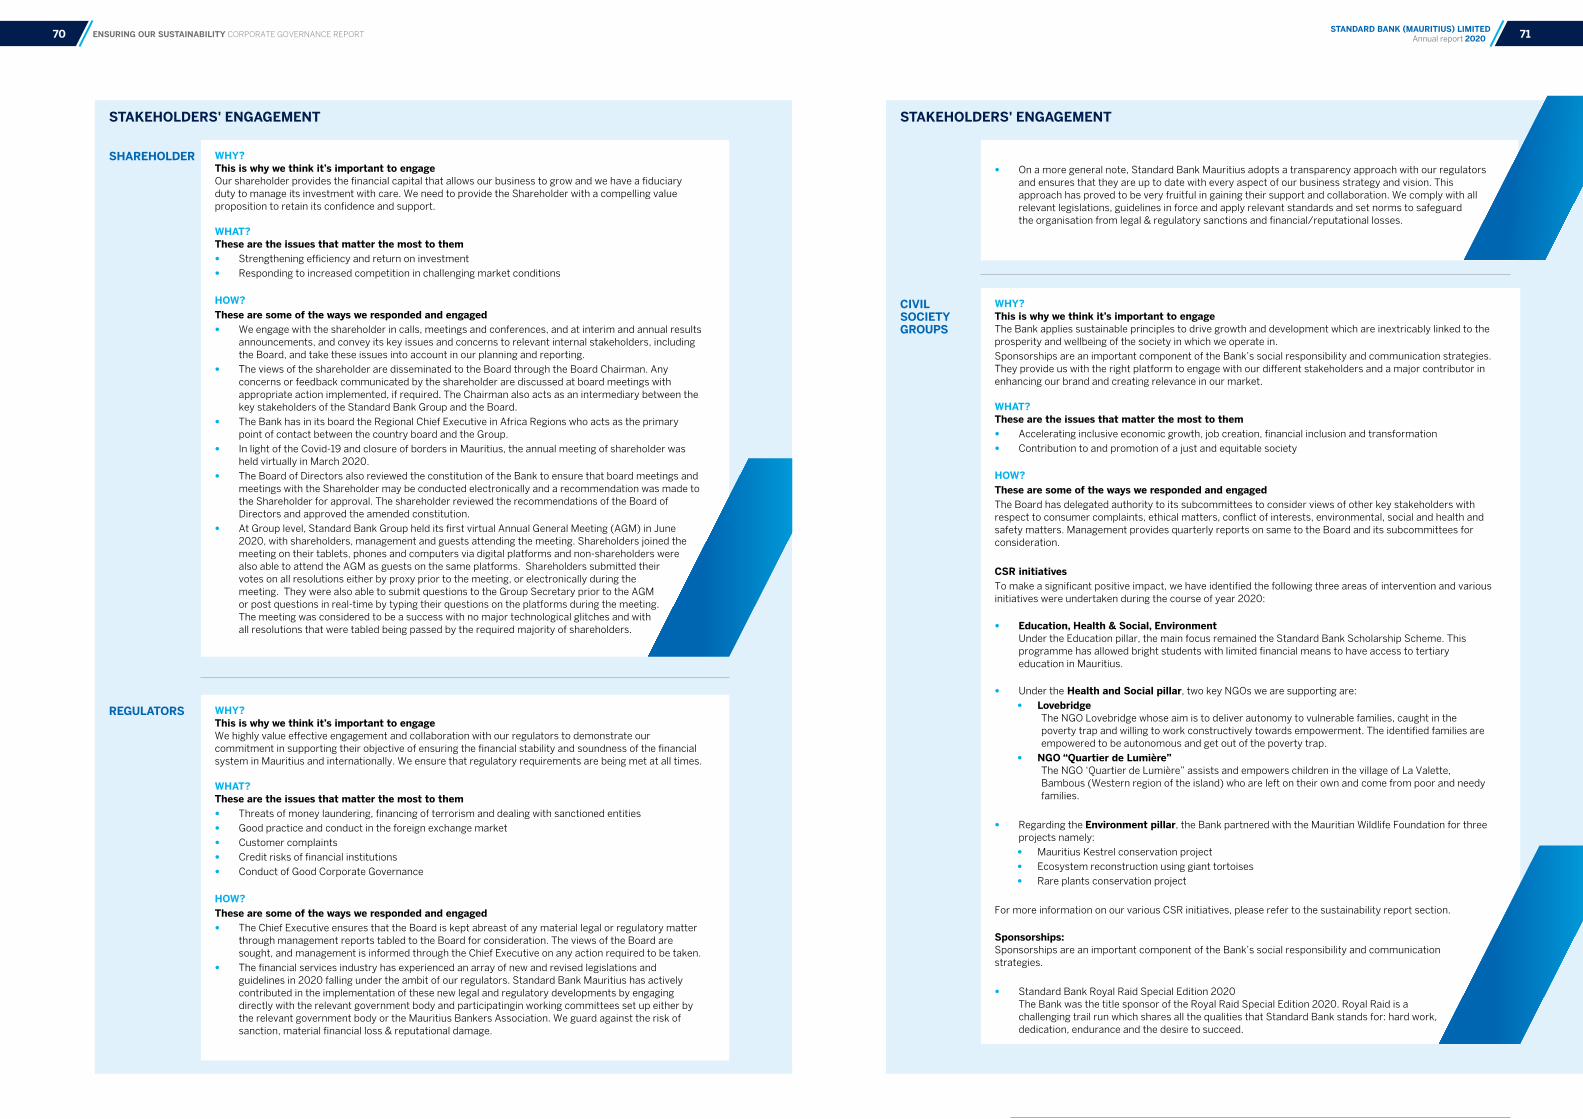
ENSURING OUR SUSTAINABILITY CORPORATE GOVERNANCE REPORT
STAKEHOLDERS' ENGAGEMENT
WHY? This is why we think it’s important to engage Our shareholder provides the financial capital that allows our business to grow and we have a fiduciary duty to manage its investment with care. We need to provide the Shareholder with a compelling value proposition to retain its confidence and support. WHAT? These are the issues that matter the most to them
• Strengthening efficiency and return on investment
• Responding to increased competition in challenging market conditions
HOW?These are some of the ways we responded and engaged
• We engage with the shareholder in calls, meetings and conferences, and at interim and annual results announcements, and convey its key issues and concerns to relevant internal stakeholders, including the Board, and take these issues into account in our planning and reporting.
• The views of the shareholder are disseminated to the Board through the Board Chairman. Any concerns or feedback communicated by the shareholder are discussed at board meetings with appropriate action implemented, if required. The Chairman also acts as an intermediary between the key stakeholders of the Standard Bank Group and the Board.
• The Bank has in its board the Regional Chief Executive in Africa Regions who acts as the primary point of contact between the country board and the Group.
• In light of the Covid-19 and closure of borders in Mauritius, the annual meeting of shareholder was held virtually in March 2020.
• The Board of Directors also reviewed the constitution of the Bank to ensure that board meetings and meetings with the Shareholder may be conducted electronically and a recommendation was made to the Shareholder for approval. The shareholder reviewed the recommendations of the Board of Directors and approved the amended constitution.
• At Group level, Standard Bank Group held its first virtual Annual General Meeting (AGM) in June 2020, with shareholders, management and guests attending the meeting. Shareholders joined the meeting on their tablets, phones and computers via digital platforms and non-shareholders were also able to attend the AGM as guests on the same platforms. Shareholders submitted their votes on all resolutions either by proxy prior to the meeting, or electronically during the meeting. They were also able to submit questions to the Group Secretary prior to the AGM or post questions in real-time by typing their questions on the platforms during the meeting. The meeting was considered to be a success with no major technological glitches and with all resolutions that were tabled being passed by the required majority of shareholders.
WHY? This is why we think it’s important to engage We highly value effective engagement and collaboration with our regulators to demonstrate our commitment in supporting their objective of ensuring the financial stability and soundness of the financial system in Mauritius and internationally. We ensure that regulatory requirements are being met at all times. WHAT? These are the issues that matter the most to them
• Threats of money laundering, financing of terrorism and dealing with sanctioned entities
• Good practice and conduct in the foreign exchange market
• Customer complaints
• Credit risks of financial institutions
• Conduct of Good Corporate Governance
HOW?These are some of the ways we responded and engaged
• The Chief Executive ensures that the Board is kept abreast of any material legal or regulatory matter through management reports tabled to the Board for consideration. The views of the Board are sought, and management is informed through the Chief Executive on any action required to be taken.
• The financial services industry has experienced an array of new and revised legislations and guidelines in 2020 falling under the ambit of our regulators. Standard Bank Mauritius has actively contributed in the implementation of these new legal and regulatory developments by engaging directly with the relevant government body and participatingin working committees set up either by the relevant government body or the Mauritius Bankers Association. We guard against the risk of sanction, material financial loss & reputational damage.
SHAREHOLDER
REGULATORS
STAKEHOLDERS' ENGAGEMENT
• On a more general note, Standard Bank Mauritius adopts a transparency approach with our regulators and ensures that they are up to date with every aspect of our business strategy and vision. This approach has proved to be very fruitful in gaining their support and collaboration. We comply with all relevant legislations, guidelines in force and apply relevant standards and set norms to safeguard the organisation from legal & regulatory sanctions and financial/reputational losses.
WHY? This is why we think it’s important to engage The Bank applies sustainable principles to drive growth and development which are inextricably linked to the prosperity and wellbeing of the society in which we operate in.
Sponsorships are an important component of the Bank’s social responsibility and communication strategies. They provide us with the right platform to engage with our different stakeholders and a major contributor in enhancing our brand and creating relevance in our market. WHAT? These are the issues that matter the most to them
• Accelerating inclusive economic growth, job creation, financial inclusion and transformation
• Contribution to and promotion of a just and equitable society
HOW?These are some of the ways we responded and engagedThe Board has delegated authority to its subcommittees to consider views of other key stakeholders with respect to consumer complaints, ethical matters, conflict of interests, environmental, social and health and safety matters. Management provides quarterly reports on same to the Board and its subcommittees for consideration.
CSR initiativesTo make a significant positive impact, we have identified the following three areas of intervention and various initiatives were undertaken during the course of year 2020:
• Education, Health & Social, Environment Under the Education pillar, the main focus remained the Standard Bank Scholarship Scheme. This programme has allowed bright students with limited financial means to have access to tertiary education in Mauritius.
• Under the Health and Social pillar, two key NGOs we are supporting are:
• Lovebridge The NGO Lovebridge whose aim is to deliver autonomy to vulnerable families, caught in the poverty trap and willing to work constructively towards empowerment. The identified families are empowered to be autonomous and get out of the poverty trap.
• NGO “Quartier de Lumière” The NGO ‘Quartier de Lumière” assists and empowers children in the village of La Valette, Bambous (Western region of the island) who are left on their own and come from poor and needy families.
• Regarding the Environment pillar, the Bank partnered with the Mauritian Wildlife Foundation for three projects namely:
• Mauritius Kestrel conservation project
• Ecosystem reconstruction using giant tortoises
• Rare plants conservation project
For more information on our various CSR initiatives, please refer to the sustainability report section.
Sponsorships: Sponsorships are an important component of the Bank’s social responsibility and communication strategies.
• Standard Bank Royal Raid Special Edition 2020 The Bank was the title sponsor of the Royal Raid Special Edition 2020. Royal Raid is a challenging trail run which shares all the qualities that Standard Bank stands for: hard work, dedication, endurance and the desire to succeed.
CIVIL SOCIETY GROUPS
71STANDARD BANK (MAURITIUS) LIMITED Annual report 202070
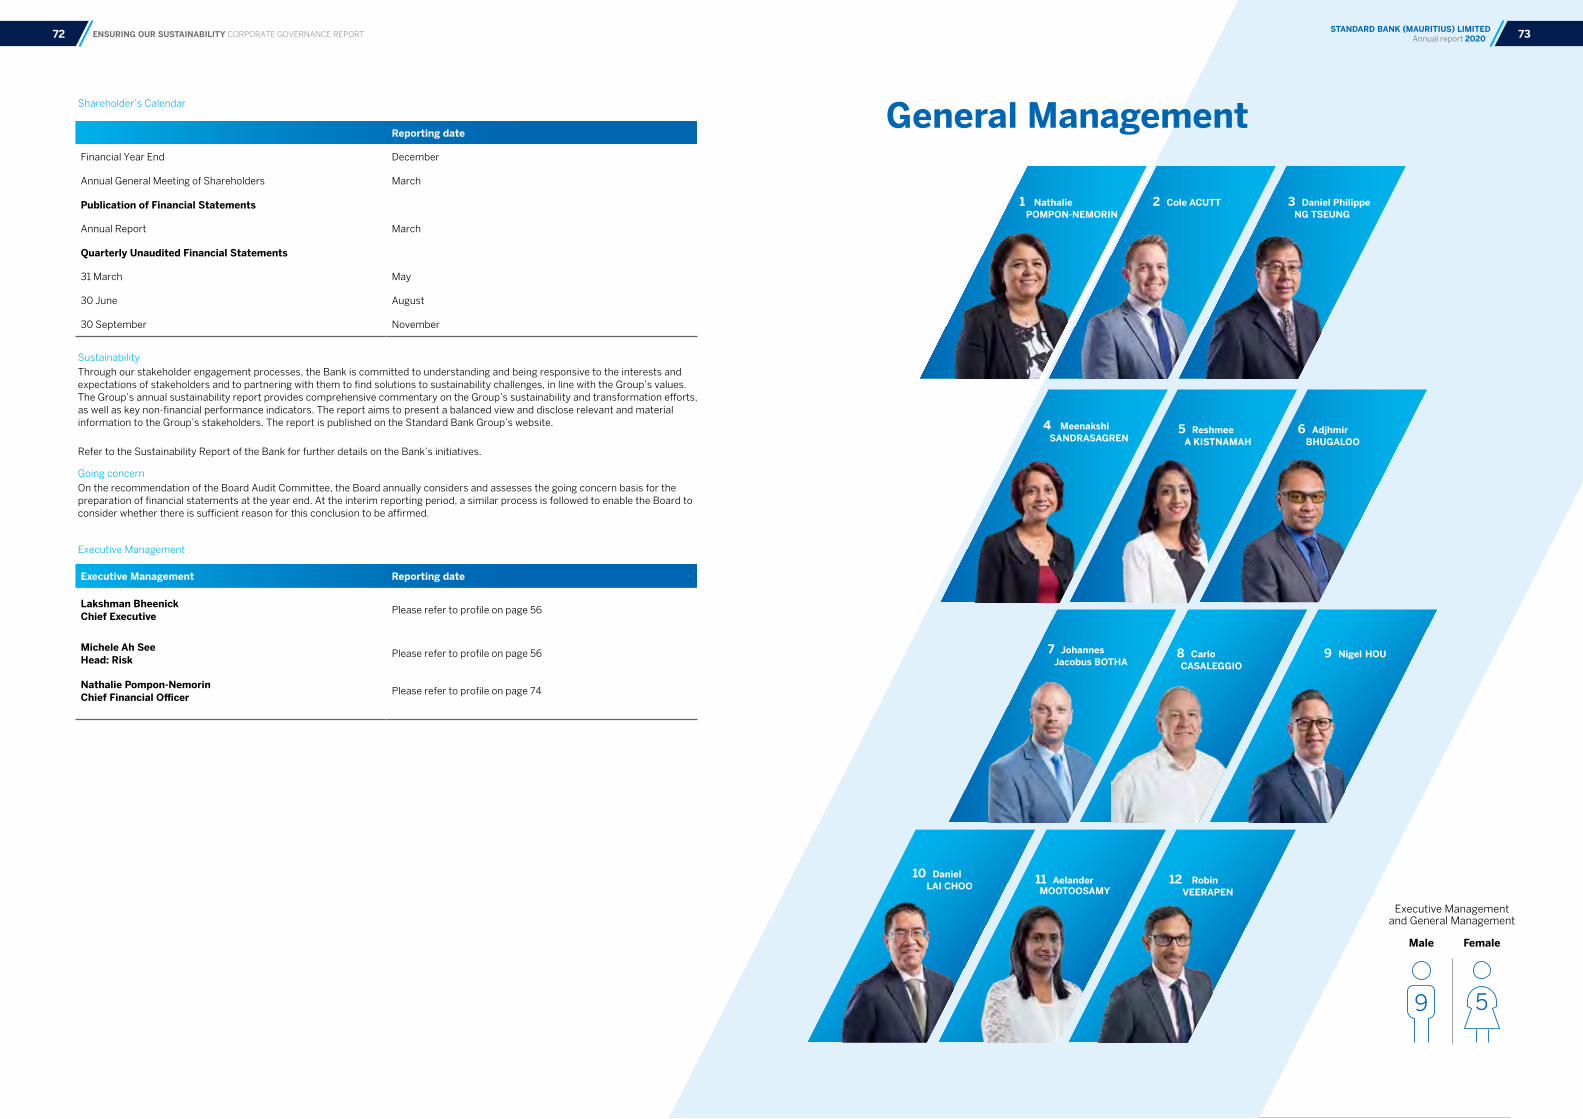
ENSURING OUR SUSTAINABILITY CORPORATE GOVERNANCE REPORT
Shareholder’s Calendar
Sustainability
Through our stakeholder engagement processes, the Bank is committed to understanding and being responsive to the interests and expectations of stakeholders and to partnering with them to find solutions to sustainability challenges, in line with the Group’s values. The Group’s annual sustainability report provides comprehensive commentary on the Group’s sustainability and transformation efforts, as well as key non-financial performance indicators. The report aims to present a balanced view and disclose relevant and material information to the Group’s stakeholders. The report is published on the Standard Bank Group’s website.
Refer to the Sustainability Report of the Bank for further details on the Bank’s initiatives.
Going concern
On the recommendation of the Board Audit Committee, the Board annually considers and assesses the going concern basis for the preparation of financial statements at the year end. At the interim reporting period, a similar process is followed to enable the Board to consider whether there is sufficient reason for this conclusion to be affirmed.
Executive Management
Reporting date
Financial Year End December
Annual General Meeting of Shareholders March
Publication of Financial Statements
Annual Report March
Quarterly Unaudited Financial Statements
31 March May
30 June August
30 September November
Executive Management Reporting date
Lakshman BheenickChief Executive
Please refer to profile on page 56
Michele Ah SeeHead: Risk
Please refer to profile on page 56
Nathalie Pompon-Nemorin Chief Financial Officer
Please refer to profile on page 74
General Management
2 Cole ACUTT 3 Daniel Philippe NG TSEUNG
1 Nathalie POMPON-NEMORIN
4 Meenakshi SANDRASAGREN
5 Reshmee A KISTNAMAH
6 Adjhmir BHUGALOO
11 Aelander MOOTOOSAMY
7 Johannes Jacobus BOTHA
8 Carlo CASALEGGIO
9 Nigel HOU
12 Robin VEERAPEN
10 Daniel LAI CHOO
Male
Executive Management and General Management
Female
59
73STANDARD BANK (MAURITIUS) LIMITED Annual report 202072
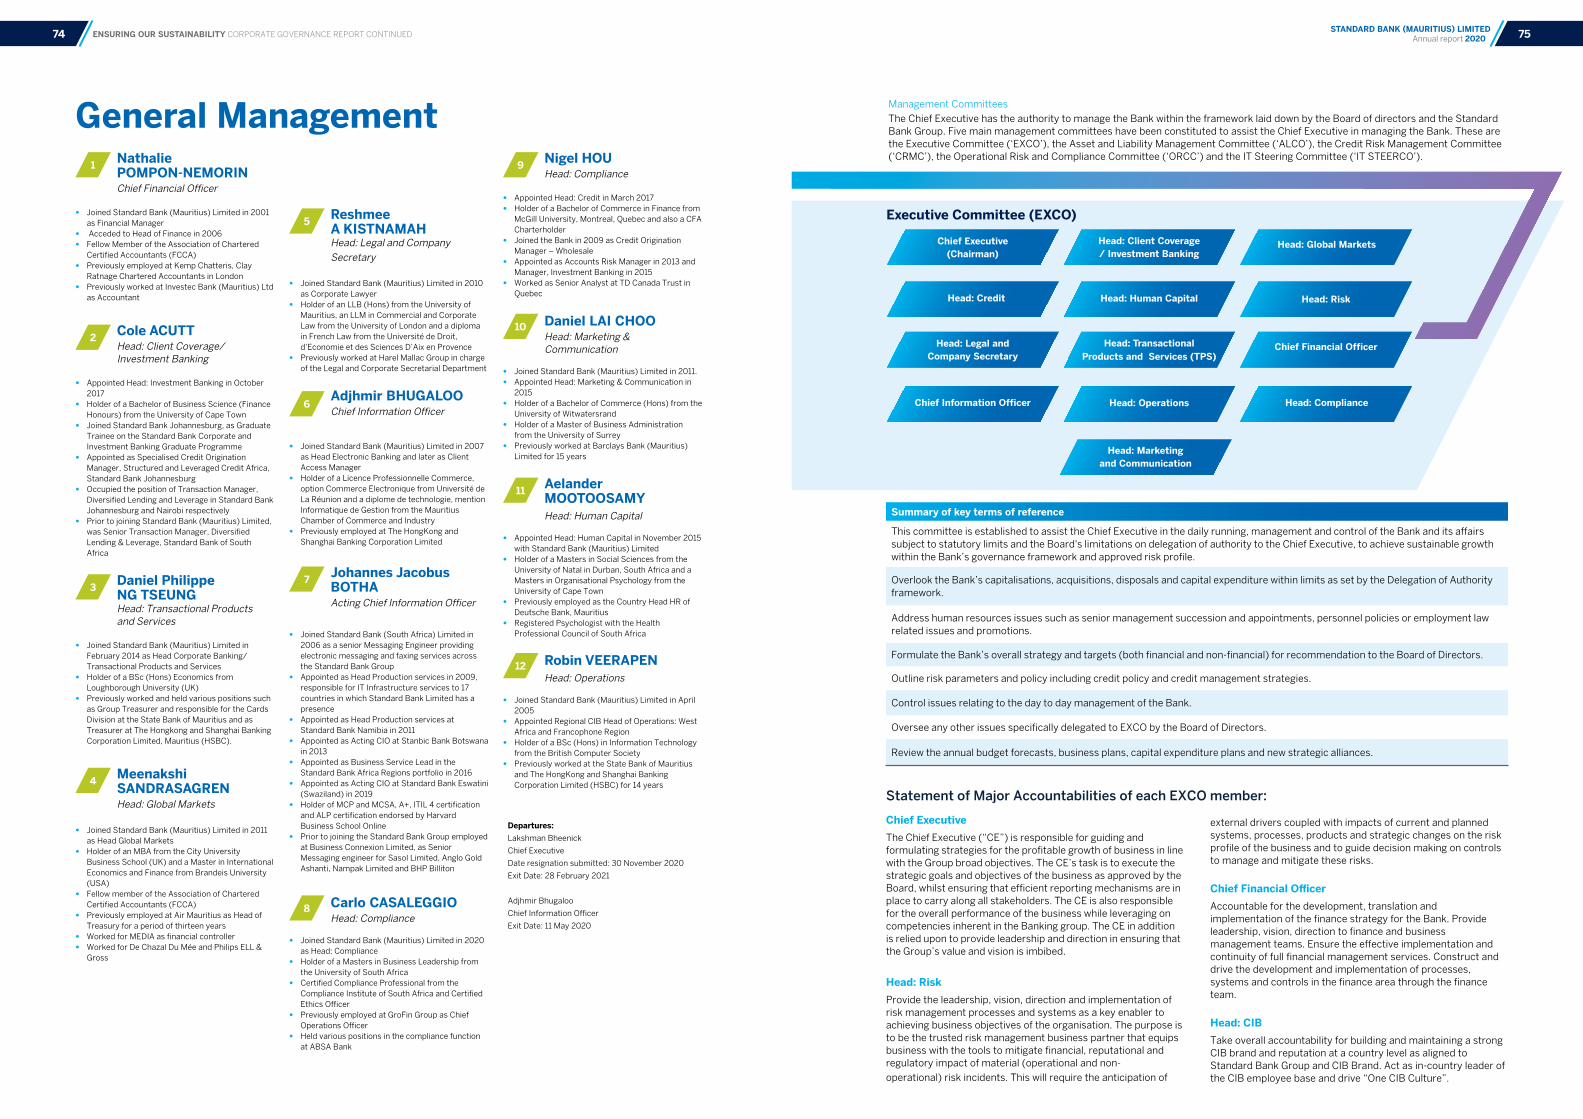
Management Committees
The Chief Executive has the authority to manage the Bank within the framework laid down by the Board of directors and the Standard Bank Group. Five main management committees have been constituted to assist the Chief Executive in managing the Bank. These are the Executive Committee (‘EXCO’), the Asset and Liability Management Committee (‘ALCO’), the Credit Risk Management Committee (‘CRMC’), the Operational Risk and Compliance Committee (‘ORCC’) and the IT Steering Committee (‘IT STEERCO’).
Executive Committee (EXCO)
Head: Client Coverage / Investment Banking
Head: Credit
Head: Legal and Company Secretary
Chief Information Officer Head: Compliance
Head: Human Capital
Head: Marketing and Communication
Chief Executive (Chairman)
Head: Global Markets
Head: Risk
Chief Financial Officer
General Management9 Nigel HOU
Head: Compliance
• Appointed Head: Credit in March 2017 • Holder of a Bachelor of Commerce in Finance from
McGill University, Montreal, Quebec and also a CFA Charterholder
• Joined the Bank in 2009 as Credit Origination Manager – Wholesale
• Appointed as Accounts Risk Manager in 2013 and Manager, Investment Banking in 2015
• Worked as Senior Analyst at TD Canada Trust in Quebec
10 Daniel LAI CHOO Head: Marketing & Communication
• Joined Standard Bank (Mauritius) Limited in 2011. • Appointed Head: Marketing & Communication in
2015 • Holder of a Bachelor of Commerce (Hons) from the
University of Witwatersrand • Holder of a Master of Business Administration
from the University of Surrey • Previously worked at Barclays Bank (Mauritius)
Limited for 15 years
11 Aelander MOOTOOSAMY Head: Human Capital
• Appointed Head: Human Capital in November 2015 with Standard Bank (Mauritius) Limited
• Holder of a Masters in Social Sciences from the University of Natal in Durban, South Africa and a Masters in Organisational Psychology from the University of Cape Town
• Previously employed as the Country Head HR of Deutsche Bank, Mauritius
• Registered Psychologist with the Health Professional Council of South Africa
12 Robin VEERAPEN Head: Operations
• Joined Standard Bank (Mauritius) Limited in April 2005
• Appointed Regional CIB Head of Operations: West Africa and Francophone Region
• Holder of a BSc (Hons) in Information Technology from the British Computer Society
• Previously worked at the State Bank of Mauritius and The HongKong and Shanghai Banking Corporation Limited (HSBC) for 14 years
5 Reshmee A KISTNAMAH Head: Legal and Company Secretary
• Joined Standard Bank (Mauritius) Limited in 2010 as Corporate Lawyer
• Holder of an LLB (Hons) from the University of Mauritius, an LLM in Commercial and Corporate Law from the University of London and a diploma in French Law from the Université de Droit, d’Economie et des Sciences D’Aix en Provence
• Previously worked at Harel Mallac Group in charge of the Legal and Corporate Secretarial Department
6 Adjhmir BHUGALOO
Chief Information Officer
• Joined Standard Bank (Mauritius) Limited in 2007 as Head Electronic Banking and later as Client Access Manager
• Holder of a Licence Professionnelle Commerce, option Commerce Electronique from Université de La Réunion and a diplome de technologie, mention Informatique de Gestion from the Mauritius Chamber of Commerce and Industry
• Previously employed at The HongKong and Shanghai Banking Corporation Limited
7 Johannes Jacobus BOTHA Acting Chief Information Officer
• Joined Standard Bank (South Africa) Limited in 2006 as a senior Messaging Engineer providing electronic messaging and faxing services across the Standard Bank Group
• Appointed as Head Production services in 2009, responsible for IT Infrastructure services to 17 countries in which Standard Bank Limited has a presence
• Appointed as Head Production services at Standard Bank Namibia in 2011
• Appointed as Acting CIO at Stanbic Bank Botswana in 2013
• Appointed as Business Service Lead in the Standard Bank Africa Regions portfolio in 2016
• Appointed as Acting CIO at Standard Bank Eswatini (Swaziland) in 2019
• Holder of MCP and MCSA, A+, ITIL 4 certification and ALP certification endorsed by Harvard Business School Online
• Prior to joining the Standard Bank Group employed at Business Connexion Limited, as Senior Messaging engineer for Sasol Limited, Anglo Gold Ashanti, Nampak Limited and BHP Billiton
8 Carlo CASALEGGIO Head: Compliance
• Joined Standard Bank (Mauritius) Limited in 2020 as Head: Compliance
• Holder of a Masters in Business Leadership from the University of South Africa
• Certified Compliance Professional from the Compliance Institute of South Africa and Certified Ethics Officer
• Previously employed at GroFin Group as Chief Operations Officer
• Held various positions in the compliance function at ABSA Bank
ENSURING OUR SUSTAINABILITY CORPORATE GOVERNANCE REPORT CONTINUED
Head: Transactional Products and Services (TPS)
1 Nathalie POMPON-NEMORIN Chief Financial Officer
• Joined Standard Bank (Mauritius) Limited in 2001 as Financial Manager
• Acceded to Head of Finance in 2006 • Fellow Member of the Association of Chartered
Certified Accountants (FCCA) • Previously employed at Kemp Chatteris, Clay
Ratnage Chartered Accountants in London • Previously worked at Investec Bank (Mauritius) Ltd
as Accountant
2 Cole ACUTT
Head: Client Coverage/ Investment Banking
• Appointed Head: Investment Banking in October 2017
• Holder of a Bachelor of Business Science (Finance Honours) from the University of Cape Town
• Joined Standard Bank Johannesburg, as Graduate Trainee on the Standard Bank Corporate and Investment Banking Graduate Programme
• Appointed as Specialised Credit Origination Manager, Structured and Leveraged Credit Africa, Standard Bank Johannesburg
• Occupied the position of Transaction Manager, Diversified Lending and Leverage in Standard Bank Johannesburg and Nairobi respectively
• Prior to joining Standard Bank (Mauritius) Limited, was Senior Transaction Manager, Diversified Lending & Leverage, Standard Bank of South Africa
3 Daniel Philippe NG TSEUNG
Head: Transactional Products and Services
• Joined Standard Bank (Mauritius) Limited in February 2014 as Head Corporate Banking/ Transactional Products and Services
• Holder of a BSc (Hons) Economics from Loughborough University (UK)
• Previously worked and held various positions such as Group Treasurer and responsible for the Cards Division at the State Bank of Mauritius and as Treasurer at The Hongkong and Shanghai Banking Corporation Limited, Mauritius (HSBC).
4 Meenakshi SANDRASAGREN Head: Global Markets
• Joined Standard Bank (Mauritius) Limited in 2011 as Head Global Markets
• Holder of an MBA from the City University Business School (UK) and a Master in International Economics and Finance from Brandeis University (USA)
• Fellow member of the Association of Chartered Certified Accountants (FCCA)
• Previously employed at Air Mauritius as Head of Treasury for a period of thirteen years
• Worked for MEDIA as financial controller • Worked for De Chazal Du Mée and Philips ELL &
Gross
Departures: Lakshman Bheenick
Chief Executive
Date resignation submitted: 30 November 2020
Exit Date: 28 February 2021
Adjhmir Bhugaloo
Chief Information Officer
Exit Date: 11 May 2020
Head: Operations
Summary of key terms of reference
This committee is established to assist the Chief Executive in the daily running, management and control of the Bank and its affairs subject to statutory limits and the Board's limitations on delegation of authority to the Chief Executive, to achieve sustainable growth within the Bank’s governance framework and approved risk profile.
Overlook the Bank’s capitalisations, acquisitions, disposals and capital expenditure within limits as set by the Delegation of Authority framework.
Address human resources issues such as senior management succession and appointments, personnel policies or employment law related issues and promotions.
Formulate the Bank’s overall strategy and targets (both financial and non-financial) for recommendation to the Board of Directors.
Outline risk parameters and policy including credit policy and credit management strategies.
Control issues relating to the day to day management of the Bank.
Oversee any other issues specifically delegated to EXCO by the Board of Directors.
Review the annual budget forecasts, business plans, capital expenditure plans and new strategic alliances.
Chief Executive The Chief Executive (“CE”) is responsible for guiding and formulating strategies for the profitable growth of business in line with the Group broad objectives. The CE’s task is to execute the strategic goals and objectives of the business as approved by the Board, whilst ensuring that efficient reporting mechanisms are in place to carry along all stakeholders. The CE is also responsible for the overall performance of the business while leveraging on competencies inherent in the Banking group. The CE in addition is relied upon to provide leadership and direction in ensuring that the Group’s value and vision is imbibed.
Head: Risk
Provide the leadership, vision, direction and implementation of risk management processes and systems as a key enabler to achieving business objectives of the organisation. The purpose is to be the trusted risk management business partner that equips business with the tools to mitigate financial, reputational and regulatory impact of material (operational and non-
operational) risk incidents. This will require the anticipation of
external drivers coupled with impacts of current and planned systems, processes, products and strategic changes on the risk profile of the business and to guide decision making on controls to manage and mitigate these risks.
Chief Financial Officer
Accountable for the development, translation and implementation of the finance strategy for the Bank. Provide leadership, vision, direction to finance and business management teams. Ensure the effective implementation and continuity of full financial management services. Construct and drive the development and implementation of processes, systems and controls in the finance area through the finance team.
Head: CIB
Take overall accountability for building and maintaining a strong CIB brand and reputation at a country level as aligned to Standard Bank Group and CIB Brand. Act as in-country leader of the CIB employee base and drive “One CIB Culture”.
Statement of Major Accountabilities of each EXCO member:
75STANDARD BANK (MAURITIUS) LIMITED Annual report 202074
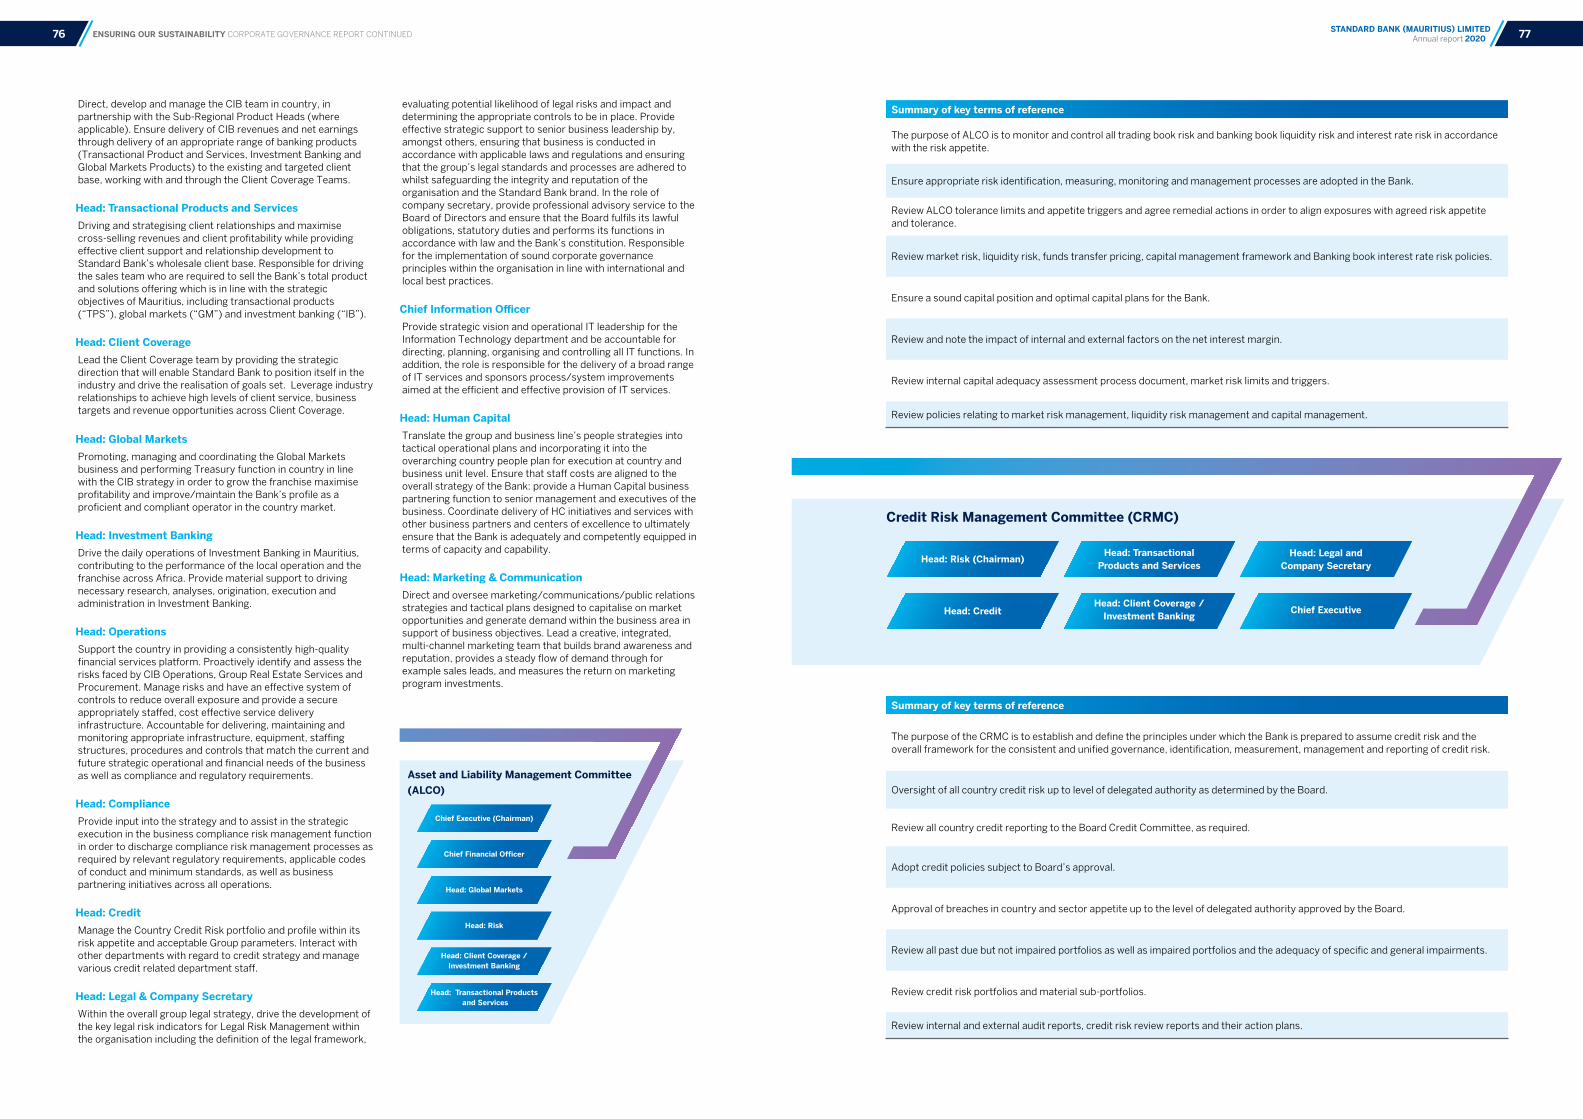
Summary of key terms of reference
The purpose of the CRMC is to establish and define the principles under which the Bank is prepared to assume credit risk and the overall framework for the consistent and unified governance, identification, measurement, management and reporting of credit risk.
Oversight of all country credit risk up to level of delegated authority as determined by the Board.
Review all country credit reporting to the Board Credit Committee, as required.
Adopt credit policies subject to Board’s approval.
Approval of breaches in country and sector appetite up to the level of delegated authority approved by the Board.
Review all past due but not impaired portfolios as well as impaired portfolios and the adequacy of specific and general impairments.
Review credit risk portfolios and material sub-portfolios.
Review internal and external audit reports, credit risk review reports and their action plans.
Direct, develop and manage the CIB team in country, in partnership with the Sub-Regional Product Heads (where applicable). Ensure delivery of CIB revenues and net earnings through delivery of an appropriate range of banking products (Transactional Product and Services, Investment Banking and Global Markets Products) to the existing and targeted client base, working with and through the Client Coverage Teams.
Head: Transactional Products and Services
Driving and strategising client relationships and maximise cross-selling revenues and client profitability while providing effective client support and relationship development to Standard Bank’s wholesale client base. Responsible for driving the sales team who are required to sell the Bank’s total product and solutions offering which is in line with the strategic objectives of Mauritius, including transactional products (“TPS”), global markets (“GM”) and investment banking (“IB”).
Head: Client Coverage
Lead the Client Coverage team by providing the strategic direction that will enable Standard Bank to position itself in the industry and drive the realisation of goals set. Leverage industry relationships to achieve high levels of client service, business targets and revenue opportunities across Client Coverage.
Head: Global Markets
Promoting, managing and coordinating the Global Markets business and performing Treasury function in country in line with the CIB strategy in order to grow the franchise maximise profitability and improve/maintain the Bank’s profile as a proficient and compliant operator in the country market.
Head: Investment Banking
Drive the daily operations of Investment Banking in Mauritius, contributing to the performance of the local operation and the franchise across Africa. Provide material support to driving necessary research, analyses, origination, execution and administration in Investment Banking.
Head: Operations
Support the country in providing a consistently high-quality financial services platform. Proactively identify and assess the risks faced by CIB Operations, Group Real Estate Services and Procurement. Manage risks and have an effective system of controls to reduce overall exposure and provide a secure appropriately staffed, cost effective service delivery infrastructure. Accountable for delivering, maintaining and monitoring appropriate infrastructure, equipment, staffing structures, procedures and controls that match the current and future strategic operational and financial needs of the business as well as compliance and regulatory requirements.
Head: Compliance
Provide input into the strategy and to assist in the strategic execution in the business compliance risk management function in order to discharge compliance risk management processes as required by relevant regulatory requirements, applicable codes of conduct and minimum standards, as well as business partnering initiatives across all operations.
Head: Credit
Manage the Country Credit Risk portfolio and profile within its risk appetite and acceptable Group parameters. Interact with other departments with regard to credit strategy and manage various credit related department staff.
Head: Legal & Company Secretary
Within the overall group legal strategy, drive the development of the key legal risk indicators for Legal Risk Management within the organisation including the definition of the legal framework,
evaluating potential likelihood of legal risks and impact and determining the appropriate controls to be in place. Provide effective strategic support to senior business leadership by, amongst others, ensuring that business is conducted in accordance with applicable laws and regulations and ensuring that the group’s legal standards and processes are adhered to whilst safeguarding the integrity and reputation of the organisation and the Standard Bank brand. In the role of company secretary, provide professional advisory service to the Board of Directors and ensure that the Board fulfils its lawful obligations, statutory duties and performs its functions in accordance with law and the Bank’s constitution. Responsible for the implementation of sound corporate governance principles within the organisation in line with international and local best practices.
Chief Information Officer
Provide strategic vision and operational IT leadership for the Information Technology department and be accountable for directing, planning, organising and controlling all IT functions. In addition, the role is responsible for the delivery of a broad range of IT services and sponsors process/system improvements aimed at the efficient and effective provision of IT services.
Head: Human Capital
Translate the group and business line’s people strategies into tactical operational plans and incorporating it into the overarching country people plan for execution at country and business unit level. Ensure that staff costs are aligned to the overall strategy of the Bank: provide a Human Capital business partnering function to senior management and executives of the business. Coordinate delivery of HC initiatives and services with other business partners and centers of excellence to ultimately ensure that the Bank is adequately and competently equipped in terms of capacity and capability.
Head: Marketing & Communication
Direct and oversee marketing/communications/public relations strategies and tactical plans designed to capitalise on market opportunities and generate demand within the business area in support of business objectives. Lead a creative, integrated, multi-channel marketing team that builds brand awareness and reputation, provides a steady flow of demand through for example sales leads, and measures the return on marketing program investments.
ENSURING OUR SUSTAINABILITY CORPORATE GOVERNANCE REPORT CONTINUED
Asset and Liability Management Committee (ALCO)
Chief Executive (Chairman)
Chief Financial Officer
Head: Global Markets
Head: Risk
Head: Client Coverage /Investment Banking
Head: Transactional Products and Services
Summary of key terms of reference
The purpose of ALCO is to monitor and control all trading book risk and banking book liquidity risk and interest rate risk in accordance with the risk appetite.
Ensure appropriate risk identification, measuring, monitoring and management processes are adopted in the Bank.
Review ALCO tolerance limits and appetite triggers and agree remedial actions in order to align exposures with agreed risk appetite and tolerance.
Review market risk, liquidity risk, funds transfer pricing, capital management framework and Banking book interest rate risk policies.
Ensure a sound capital position and optimal capital plans for the Bank.
Review and note the impact of internal and external factors on the net interest margin.
Review internal capital adequacy assessment process document, market risk limits and triggers.
Review policies relating to market risk management, liquidity risk management and capital management.
Credit Risk Management Committee (CRMC)
Head: Transactional Products and Services
Head: Client Coverage / Investment Banking
Head: Legal and Company Secretary
Chief Executive
Head: Risk (Chairman)
Head: Credit
77STANDARD BANK (MAURITIUS) LIMITED Annual report 202076
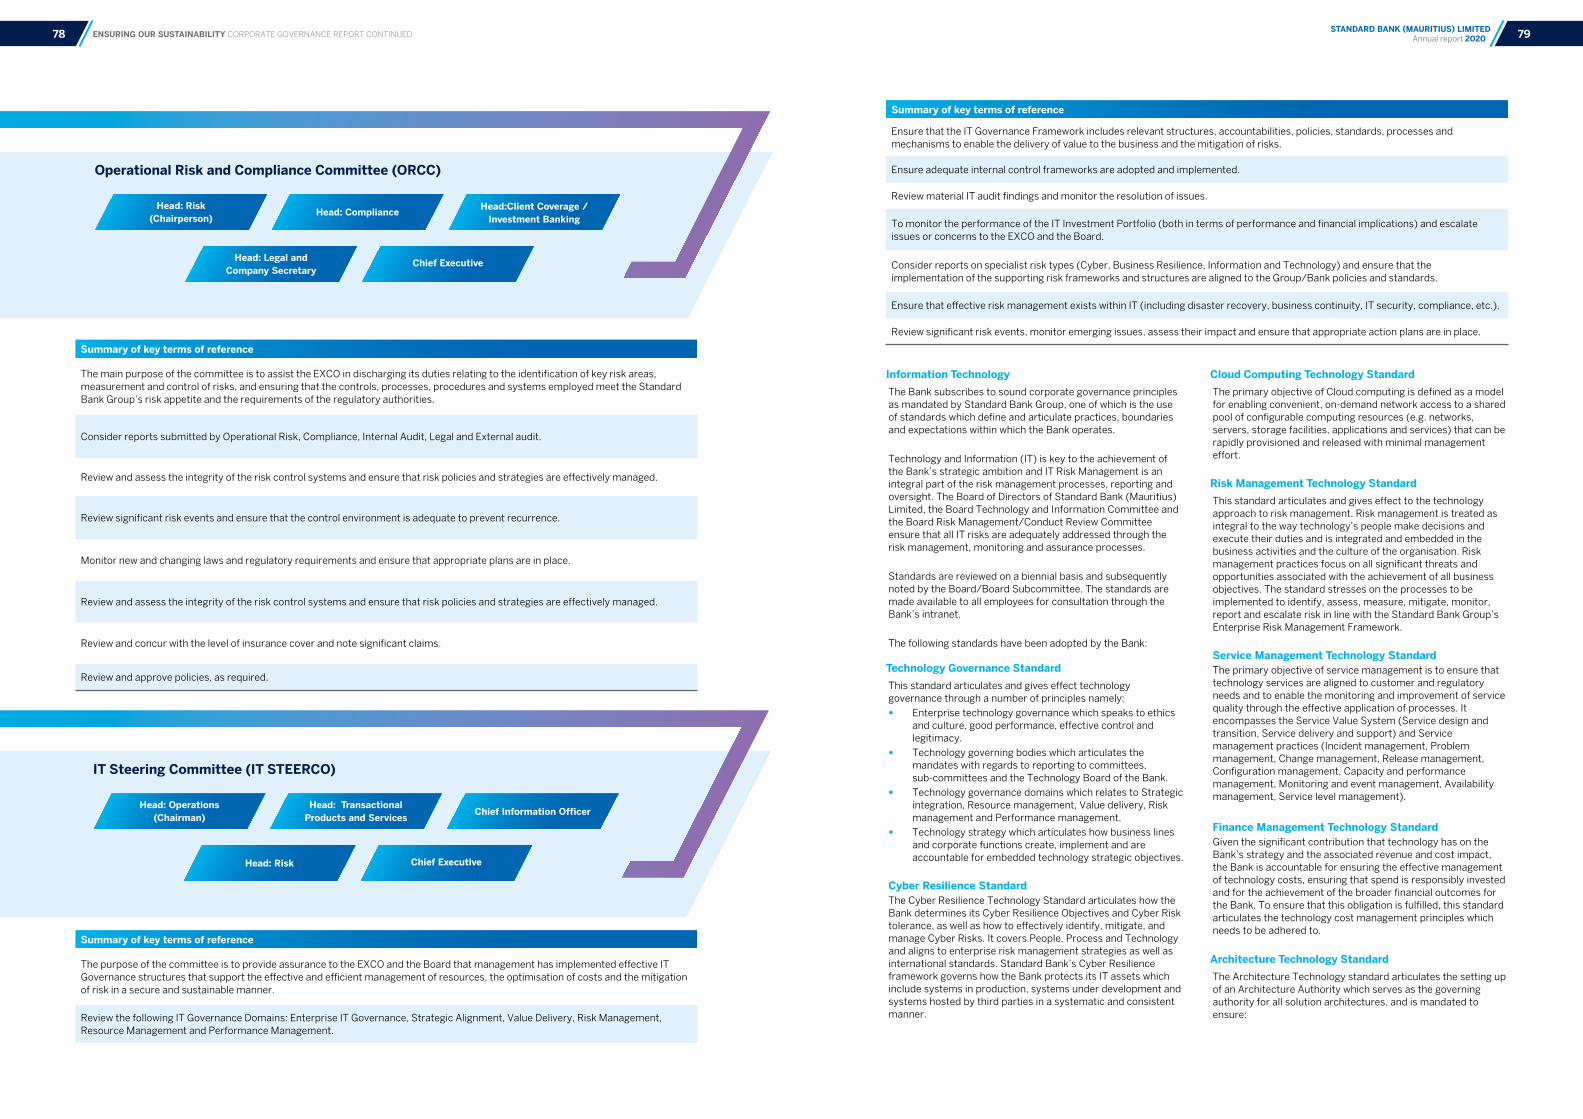
Summary of key terms of reference
Ensure that the IT Governance Framework includes relevant structures, accountabilities, policies, standards, processes and mechanisms to enable the delivery of value to the business and the mitigation of risks.
Ensure adequate internal control frameworks are adopted and implemented.
Review material IT audit findings and monitor the resolution of issues.
To monitor the performance of the IT Investment Portfolio (both in terms of performance and financial implications) and escalate issues or concerns to the EXCO and the Board.
Consider reports on specialist risk types (Cyber, Business Resilience, Information and Technology) and ensure that the implementation of the supporting risk frameworks and structures are aligned to the Group/Bank policies and standards.
Ensure that effective risk management exists within IT (including disaster recovery, business continuity, IT security, compliance, etc.).
Review significant risk events, monitor emerging issues, assess their impact and ensure that appropriate action plans are in place.
Information Technology
The Bank subscribes to sound corporate governance principles as mandated by Standard Bank Group, one of which is the use of standards which define and articulate practices, boundaries and expectations within which the Bank operates.
Technology and Information (IT) is key to the achievement of the Bank’s strategic ambition and IT Risk Management is an integral part of the risk management processes, reporting and oversight. The Board of Directors of Standard Bank (Mauritius) Limited, the Board Technology and Information Committee and the Board Risk Management/Conduct Review Committee ensure that all IT risks are adequately addressed through the risk management, monitoring and assurance processes.
Standards are reviewed on a biennial basis and subsequently noted by the Board/Board Subcommittee. The standards are made available to all employees for consultation through the Bank’s intranet.
The following standards have been adopted by the Bank:
Technology Governance Standard
This standard articulates and gives effect technology governance through a number of principles namely:
• Enterprise technology governance which speaks to ethics and culture, good performance, effective control and legitimacy.
• Technology governing bodies which articulates the mandates with regards to reporting to committees, sub-committees and the Technology Board of the Bank.
• Technology governance domains which relates to Strategic integration, Resource management, Value delivery, Risk management and Performance management.
• Technology strategy which articulates how business lines and corporate functions create, implement and are accountable for embedded technology strategic objectives.
Cyber Resilience StandardThe Cyber Resilience Technology Standard articulates how the Bank determines its Cyber Resilience Objectives and Cyber Risk tolerance, as well as how to effectively identify, mitigate, and manage Cyber Risks. It covers People, Process and Technology and aligns to enterprise risk management strategies as well as international standards. Standard Bank’s Cyber Resilience framework governs how the Bank protects its IT assets which include systems in production, systems under development and systems hosted by third parties in a systematic and consistent manner.
Cloud Computing Technology Standard
The primary objective of Cloud computing is defined as a model for enabling convenient, on-demand network access to a shared pool of configurable computing resources (e.g. networks, servers, storage facilities, applications and services) that can be rapidly provisioned and released with minimal management effort.
Risk Management Technology Standard
This standard articulates and gives effect to the technology approach to risk management. Risk management is treated as integral to the way technology’s people make decisions and execute their duties and is integrated and embedded in the business activities and the culture of the organisation. Risk management practices focus on all significant threats and opportunities associated with the achievement of all business objectives. The standard stresses on the processes to be implemented to identify, assess, measure, mitigate, monitor, report and escalate risk in line with the Standard Bank Group’s Enterprise Risk Management Framework.
Service Management Technology StandardThe primary objective of service management is to ensure that technology services are aligned to customer and regulatory needs and to enable the monitoring and improvement of service quality through the effective application of processes. It encompasses the Service Value System (Service design and transition, Service delivery and support) and Service management practices (Incident management, Problem management, Change management, Release management, Configuration management, Capacity and performance management, Monitoring and event management, Availability management, Service level management).
Finance Management Technology StandardGiven the significant contribution that technology has on the Bank’s strategy and the associated revenue and cost impact, the Bank is accountable for ensuring the effective management of technology costs, ensuring that spend is responsibly invested and for the achievement of the broader financial outcomes for the Bank. To ensure that this obligation is fulfilled, this standard articulates the technology cost management principles which needs to be adhered to.
Architecture Technology Standard
The Architecture Technology standard articulates the setting up of an Architecture Authority which serves as the governing authority for all solution architectures, and is mandated to ensure:
Summary of key terms of reference
The main purpose of the committee is to assist the EXCO in discharging its duties relating to the identification of key risk areas, measurement and control of risks, and ensuring that the controls, processes, procedures and systems employed meet the Standard Bank Group’s risk appetite and the requirements of the regulatory authorities.
Consider reports submitted by Operational Risk, Compliance, Internal Audit, Legal and External audit.
Review and assess the integrity of the risk control systems and ensure that risk policies and strategies are effectively managed.
Review significant risk events and ensure that the control environment is adequate to prevent recurrence.
Monitor new and changing laws and regulatory requirements and ensure that appropriate plans are in place.
Review and assess the integrity of the risk control systems and ensure that risk policies and strategies are effectively managed.
Review and concur with the level of insurance cover and note significant claims.
Review and approve policies, as required.
ENSURING OUR SUSTAINABILITY CORPORATE GOVERNANCE REPORT CONTINUED
Operational Risk and Compliance Committee (ORCC)
Head: Compliance Head:Client Coverage / Investment Banking
Chief Executive
Head: Risk(Chairperson)
Head: Legal and Company Secretary
IT Steering Committee (IT STEERCO)
Head: Transactional Products and Services
Chief Information Officer
Chief Executive
Head: Operations(Chairman)
Head: Risk
Summary of key terms of reference
The purpose of the committee is to provide assurance to the EXCO and the Board that management has implemented effective IT Governance structures that support the effective and efficient management of resources, the optimisation of costs and the mitigation of risk in a secure and sustainable manner.
Review the following IT Governance Domains: Enterprise IT Governance, Strategic Alignment, Value Delivery, Risk Management, Resource Management and Performance Management.
79STANDARD BANK (MAURITIUS) LIMITED Annual report 202078

ENSURING OUR SUSTAINABILITY CORPORATE GOVERNANCE REPORT CONTINUED
• Quality of all solutions architectures is maintained and improved by:
• Application of group-wide architecture and design standards;
• Compliance of architectures with the applicable standards, technology strategies and roadmaps;
• Correct utilisation of approved products and services;
• Maintenance of architectural and solution integrity.
• Productivity and efficiency is optimised and improved by:
• Ensuring IT investments are leveraged to their maximum by encouraging reuse of replicable solutions;
• Creation and retention of Architecture-related intellectual capital at a group-wide level through governance of Solution Architecture and Design Patterns.
• Solution architectures contribute to enhancing the value of IT and enabling business growth by ensuring that the business and IT strategies of the organisation are applied and enabled.
Statement of Remuneration Philosophy
As a subsidiary of Standard Bank Group, the Bank is aligned to the following four key objectives guiding its remuneration strategy:
1. Measure and reward for value delivered and adjust for risk assumed.
2. Aim to be competitive in remuneration in the global marketplace for skills.
3. Reward our people fairly, at both individual and shareholder level, while avoiding a bonus-centric culture
that distorts motivations and may encourage excessive and irresponsible risk taking.
4. Promote and reward teamwork.
The Bank aims to attract and retain sufficient, appropriately skilled people to fulfil strategic business objectives and that people are fairly rewarded by ensuring that:
• Remuneration is externally competitive and internally equitable;
• Base salaries are competitive within an appropriate market sector;
• Opportunities are given to our people to enhance total reward through performance-related bonus awards.
Our remuneration policy and structures are guided by the Group Remuneration Committee and focus on total reward and strive for the appropriate mix between fixed and variable pay for all our employees, depending on their roles.
The Group Remuneration Committee is mindful of its responsibilities to all stakeholders, especially our shareholders when assessing and reviewing the remuneration of Senior Executives of the Bank. The committee also reviews performance to ensure that earnings are not the result of one year’s work but rather the planned outcome of work done in the past years.
Chief Executive
The Chief Executive receives a remuneration package and qualifies for long-term incentives. He is not subject to a retention agreement.
Remuneration Structure
Executive Directors, Independent Director and Non-Executive Directors Fees
The following amount represents the sum paid to executive, non-executive and independent directors for the year under review:
USD
Duncan Westcott 27,289
Stephen Scali 25,004
Clive Tasker 27,500
Total Non-Executive Directors 79,793
Sanjeev Manrakhan 13,661
Arvind Hari 25,989
Total Independent Directors 39,650
Lakshman Bheenick 597,810
Marie-Michele Ah See 347,136
Total Executive Directors 944,946
Total Non-Executive & Executive Directors 1,064,389
The remuneration of both executive directors consists of the following:
• guaranteed remuneration - based on their market value and the role that they play;
• annual bonus incentive - used to incentivise the achievement of Bank objectives;
• pension - provides a competitive post-retirement benefit in line with Bank employees.
The Non-Executive Directors are not entitled to share options or bonuses associated with organisational performance. Additionally, as per Group policy, no fees are payable to directors who are employed by Group. Roderick Poole and Antonio Coutinho are employees of Group and hence are not remunerated by the Bank.
The full annual report is available on the Bank’s website: www.standardbank.mu
Managing our operational footprintOur impact on the environment arises mainly from energy use at our head office and service centre and, to a lesser extent, from water use and waste generation at these buildings and employee travel. We are committed to reducing these impacts across our country of operation.
We have identified the need to improve metering, data capture and analysis systems, to enable tracking of progress and assist in setting accurate and realistic reduction targets. This is a medium-term target, with considerable resource implications.
During the lockdown period from March to May 2020, 98 % of our employees worked from home and our Energy consumption use decreased, however, the reduction was less significant as the Data Centre was still operational.
Energy Consumption
Electricity comprises the major contributor to our carbon footprint. Our energy management system aligns the international standard designed to conserve resources, tackle climate change and save money.
The total energy consumed in 2020 was 830,720 KWh opposed to 933,579 KWh consumed in 2019. Our diesel consumption for the year was negligible.
The reduction was aided by:
• Incorporating behavioural change in our facilities;
• Retrofitting lighting systems which had not yet been replaced to LED;
• Lockdown period of 2 months.
Waste
We effectively manage our waste and what is sent to landfill sites, by reducing, reusing and recycling. Our waste includes paper, which is mostly recycled. We have reduced our paper waste from 3.68 tonnes to 2.41 tonnes.
Health and Safety
The Bank thrives to safeguard our employees’ health and wellbeing within their working environment through systematic risk identification and mitigation strategies. The COVID-19 pandemic has significantly impacted businesses and people throughout the world. The need to re-think our new normal is now more prevalent than ever. The Bank has adapted to this new context and has implemented appropriate control measures to mitigate risks by adopting Group best practices.
At a Group level, we provided:
• A Covid-19 Information Hub, from which employees could access accurate and up-to-date information;
• A Covid Connect App which employees were asked to use for a daily self-check and to log their work location;
• Employee training on the pandemic which played a crucial role in creating the necessary awareness on Covid-19.
Working from home became a new normal to limit the number of people within the office, hence minimising risk of contamination. The Bank also sought to safeguard its employees’ health and safety by:
• Monitoring access to office through contactless temperature scanners.
• Implementing social distancing measures within our premises. Workstations were reorganised to ensure a 2 metre distance between employees;
• Providing N95 face masks to employees;
• Implementing a new cleaning and disinfection regime for all workstations and other high touch surfaces;
• Holding meetings virtually eliminating the need for physical contact;
• Through these measures the Bank maintained its premises healthy and safe for all employees.
Environment sustainability
Efforts continued in the same vein as 2019 with environmentally friendly and ecological measures which contributed to preserving the environment and reducing our carbon footprint. The following measures were implemented in the office:
Energy efficiency
LED lights in our office space have helped the overall effect on the power on grid and the Bank and has stabilised a reduced light consumption as opposed to the conventional fluorescent lights.
RecyclingPaper recycling was enforced and weekly collection from recycled bins in the office space continued. We saw an increase in the recycling of paper from 2.41 tonnes in 2019 to 3.68 in 2020. This was due to more awareness and culture being instilled in the day-to-day operations.
Plastic Reduction Strategy
We have continued to eliminate the usage of plastic water bottles used for office and reception. Glass water bottles are being used for meetings and a central dispenser has been installed in the mess room for staff usage.
Sustainability Report
Metrics for Standard Bank’s operations
2020 2019
Indirect emissions from purchased electricity
Purchased electricity (USD)
187,790 225,363
Indirect emissions
Paper (Tonnes)
1.02 2.94
81STANDARD BANK (MAURITIUS) LIMITED Annual report 202080

ENSURING OUR SUSTAINABILITY SUSTAINABILITY REPORT CONTINUED
Mauritius – Corporate Social ResponsibilityChanging life | Building sustainability
During the year, we have identified the following areas of intervention for CSR activities, where USD240,070 (2019: USD292,824) were spent on initiatives.
Education Education is one of the main areas of intervention under the CSR initiatives. We have supported needy beneficiaries through our scholarship programme and also through different NGOs.
The Standard Bank Mauritius Scholarship Programme has allowed bright students with limited financial means to follow undergraduate courses in Mauritius. The aim is to give to those bright children an access to tertiary education and the means to change their world and future.
To contribute to the society in which we operate, Standard Bank Mauritius has partnered with the following NGOs to help them in their fight against social ills and poverty.
NGO “Rêve et Espoir” provides services to children and young adults with mental & physical disabilities. We supported a psychologist programme whose objectives are to improve the children’s development, increase their chances to become more independent and sustain progress. Through this partnership, we have helped 30 direct beneficiaries improve their concentration, memory, behaviour, attention span, improve their educational standards and learning abilities as well as promoting psychological wellbeing, social, emotional and behavioural development.
NGO “Quartier de Lumière” assists and empowers children in the village of La Valette, Bambous (Western region of the island) who are left on their own and come from poor and needy families. Our support has enabled the NGO to meet the following objectives:
• Ensure the integral development of the child be it physical, cognitive and moral;
• To see healthy, empowered children who are aware of their importance in society, having realised that success is the fruit of hard work and discipline;
• Care of the child from the youngest age;
• School support;
• Development of the children’s personality and an introduction to civic values.
Les amis de Zippy programme aims to improve the skills of young children aged 6 – 7 to develop coping mechanisms to cope with everyday difficulties. The programme is set up in primary schools and also required the training of teachers who will then share with the children. The Bank identified schools in underprivileged regions of the island namely Case Noyale, Chemin Grenier, Souillac, Baie du Cap and Chamarel.
Counselling support to teenagers, their parents as well as the teachers. Schools were identified in underprivileged regions on the island namely: Mahebourg, Bambous, Petite Rivière, Ste Croix and Rivière Noire.
Health and Social
LovebridgeThe Bank has funded the NGO Lovebridge whose aim is to deliver autonomy to vulnerable families, caught in the poverty trap, and willing to work constructively towards empowerment. The identified families are empowered to be autonomous and get out of the poverty trap.
Society for Aid to Children Inoperable in Mauritius (SACIM)SACIM is an NGO specialised in the care of inoperable children from low-income families in Mauritius. Those children suffer from illness that requires surgical intervention abroad and due to lack of funds, same cannot be done on time.
Covid-19 In this time of crisis, the Bank has a vital role to support the Government to ensure a sustained effort in the fight against the disease and to protect the most vulnerable within our society. As a responsible and caring corporate citizen, Standard Bank donated MUR4 million (Approx. USD100K) to the Covid-19 Solidarity Fund. EnvironmentMauritian Wildlife Foundation The Bank partnered with the Mauritian Wildlife Foundation (MWF) to support them on the following three projects. The MWF is an independent non-governmental organisation established in 1984 with the objective to protect and preserve endangered plant and animal species in Mauritius.
Mauritius Kestrel conservation projectThe Mauritius Kestrel is one of the nine endemic bird species left in Mauritius. However, a rapid degradation of the Mauritian native forests has contributed to a decline in the number of Mauritius kestrels. The aim is to prevent the population decline by attaining a viable, stable or increasing population and increase the distribution of the birds.
Ecosystem reconstruction using giant tortoisesWith the extinction of our endemic tortoise species, all the functional roles fulfilled by giant tortoises in the ecosystem have gone missing. To remediate this situation, MWF will use the Aldabra tortoise (a close relative of Mauritian giant tortoises) to replace lost ones. This will be used as substitutes to re-enact the lost ‘plant-tortoises’ interactions and help restore the native forest on Ile aux Aigrettes and Round Island.
Rare plants conservation projectMauritius is home to 691 native species of flowering plants. 281 are endemic and more than 90% are threatened. The project undertakes to propagate and plant endemic species to reintroduce them in the wild and in urban areas and to increase their numbers. This action will in the long term support the endemic fauna.
Wakashio Oil Spill and Ile Aux Aigrettes
The Bank was not insensible to the ecological disaster caused by the oil spill from the MV Wakashio to the south eastern coast of the island. Staff got engaged against the oil spill and provided the following:
• Absorbent cotton fabrics such as used clothes, towels, napkins, bedsheets;
• Dishwashing liquid to clean the rescued animals;
• Empty plastic bottles with their caps (1 litre and above) or washing detergent bottles.
Furthermore, staff supported the MWF by helping in transferring back about 2000 plants to Ile Aux Aigrettes.
MWF Christmas MarketThe MWF organised a Christmas Market for staff at the Bank’s premises for sale of MWF promotional and branded items. The funds collected were used to support MWF projects.
83STANDARD BANK (MAURITIUS) LIMITED Annual report 202082

(Section 75 (3) of the Financial Reporting Act)
Name of Public Interest Entity: Standard Bank (Mauritius) LimitedReporting Period: Year ended 31 December 2020
We, the directors of Standard Bank (Mauritius) Limited, confirm that to the best of our knowledge Standard Bank (Mauritius) Limited has complied with all of its obligations and requirements under the National Code of Corporate Governance for Mauritius (2016).
Chairman Acting Chief ExecutiveDuncan Westcott Michele Ah See
17 March 2021
ENSURING OUR SUSTAINABILITY STATEMENT OF COMPLIANCE
Statement of Compliance
85STANDARD BANK (MAURITIUS) LIMITED Annual report 202084

95 Statement of profit or loss and other comprehensive income
96 Statement of Cash Flows
97 Statement of Changes in Equity
98 Notes to and forming part of the Financial Statements
88 Statement of management's responsibility for financial reporting
89 Statement of directors' responsibilities in respect of the financial statements
90 Secretary's Certificate
91 Auditors' Report
94 Statement of Financial Position
ANNUAL FINANCIAL STATEMENTS
ANNUAL FINANCIAL
STATEMENTS
87STANDARD BANK (MAURITIUS) LIMITED Annual report 202086

The financial statements for the Bank’s operations in Mauritius presented in this Annual Report have been prepared by management, which is responsible for their integrity, consistency, objectivity and reliability. International Financial Reporting Standards as well as the requirements of the Banking Act 2004 and the guidelines issued thereunder have been applied and management has exercised its judgement and made best estimates where deemed necessary.
The Bank has designed and maintained its accounting systems, related internal controls and supporting procedures, to provide reasonable assurance that financial records are complete and accurate and that assets are safeguarded against loss from unauthorised use or disposal. These supporting procedures include careful selection and training of qualified staff, the implementation of organisation and governance structures providing a well-defined division of responsibilities, authorisation levels and accountability for performance, and the communication of the Bank’s policies, procedures manuals and guidelines of the Bank of Mauritius throughout the Bank.
The Bank’s Board of Directors, acting in part through the Board Audit Committee and the Risk Management Conduct Review Committee which comprise independent/non-executive directors who are not officers or employees of the Bank, oversees management’s responsibility for financial reporting, internal controls, assessment and control of major risk areas, and assessment of significant and related party transactions.
The Bank’s Internal Auditor, who has full and free access to the Audit Committee, conducts a well-designed programme of internal audits in coordination with the Bank’s external auditors. In addition, the Bank’s compliance function maintains policies, procedures and programmes directed at ensuring compliance with regulatory requirements.
Pursuant to the provisions of the Banking Act 2004, the Bank of Mauritius makes such examination and inquiry into the operations and affairs of the Bank as it deems necessary.
The Bank’s external auditors, PricewaterhouseCoopers, have full and free access to the Board of Directors and its committees to discuss the audit and matters arising therefrom, such as their observations and fairness of financial reporting and the adequacy of internal controls.
Chairman Director Acting Chief ExecutiveDuncan Westcott Arvind Hari Michele Ah See
17 March 2021
Company law requires the directors to prepare financial statements for each financial year which present fairly the financial position, financial performance and cash flows of the Bank. In preparing those financial statements, the directors are required to:
• select suitable accounting policies and then apply them consistently;
• make judgements and estimates that are reasonable and prudent;
• state whether International Financial Reporting Standards have been followed, subject to any material departures disclosed and explained in the financial statements; and
• prepare the financial statements on the going concern basis unless it is inappropriate to presume that the Bank will continue in business.
The directors confirm that they have complied with the above requirements in preparing the financial statements.
The directors are responsible for keeping proper accounting records which disclose with reasonable accuracy at any time the financial position of the Bank and to enable them to ensure that the financial statements comply with the Mauritian Companies Act 2001 and the requirements of the Mauritian Banking Act 2004 and the guidelines issued thereunder. They are also responsible for safeguarding the assets of the Bank and hence for taking reasonable steps for the prevention and detection of fraud and other irregularities.
Chairman Director Acting Chief ExecutiveDuncan Westcott Arvind Hari Michele Ah See
17 March 2021
ANNUAL FINANCIAL STATEMENTS STATEMENT OF MANAGEMENT 'S RESPONSIBILITY FOR FINANCIAL REPORTING
Statement of management’s responsibility for financial reporting
Statement of directors' responsibilities in respect of the financial statements
89STANDARD BANK (MAURITIUS) LIMITED Annual report 202088

In accordance with section 166 (d) of the Companies Act 2001, we certify that to the best of our knowledge and belief, the Bank has filed with the Registrar of Companies, all such returns as are required of the Bank under the Mauritian Companies Act 2001.
Company Secretary
17 March 2021
Secretary’s Certificate Independent Auditor’s Report To the Shareholder of Standard Bank (Mauritius) Limited
ANNUAL FINANCIAL STATEMENTS SECRETARY'S CERTIFICATE
Key audit matter How our audit addressed the key audit matter
Expected credit losses (‘ECL’)
The measurement of the ECL for financial assets measured at amortised cost and at Fair Value through Other Comprehensive Income (FVOCI) requires the use of complex models and significant assumptions about future economic conditions and credit behaviour. The key areas of significant management judgement within the ECL calculations include:
• Evaluation of significant increase in credit risk (“SICR”), taking the impact of Covid-19 into account;
• Assessing the impact of Covid-19 on the macro-economic inputs and forward-looking information into the assigned credit ratings;
• Assessment of ECL raised for Stage 3 exposures; and
• Input assumptions applied to estimate the probability of default (“PD”), exposure at default (“EAD”) and loss given default (“LGD”) within the ECL measurement.
Given the complexity of the model used for the ECL calculation, our internal experts assisted us in performing certain procedures.
We obtained an understanding and tested the relevant controls relating to the approval of credit facilities, subsequent monitoring and remediation of exposures, key system reconciliations and collateral management.
With the assistance of our internal experts, we assessed the input assumptions applied within the PD, LGD and EAD models (including forward looking information), giving specific consideration to the impact of Covid-19 pandemic and whether management judgemental adjustments were needed, in compliance with the requirements of IFRS 9 Financial Instruments. We developed an independent point estimate to quantify the impact of Covid-19 due to the increased estimation uncertainty. We compared the severity to past actual stress events and the ability of the ECL models to capture the full extent of the stress.
We selected a sample of Stage 1 and Stage 2 exposures and assessed whether the stage classification of these exposures was appropriate in terms of the Bank’s accounting policy for SICR at the reporting date since the origination date of these exposures, taking into consideration the impact of Covid-19. These procedures included the inspection of credit ratings at reporting date relative to origination date.
In addition, our procedures included assessing the appropriateness of the models through reperformance and validation procedures.
For stage 3 exposures, we considered the impairment indicators, uncertainties and assumptions applied by management in their assessment of the recoverability of the exposure. We independently recalculated the ECL based on our assessment of the expected cash flows and recoverability of collateral at an individual exposure level.
We also assessed the adequacy of the disclosures in the annual report in accordance with IFRS 9.
Report on the Audit of the Financial Statements Our OpinionIn our opinion, the financial statements give a true and fair view of the financial position of Standard Bank (Mauritius) Limited
(the “Bank”) as at 31 December 2020, and of its financial performance and its cash flows for the year then ended in accordance with International Financial Reporting Standards and in compliance with the Mauritian Companies Act 2001.
What we have auditedThe Standard Bank (Mauritius) Limited’s accompanying financial statements comprise:
• the statement of financial position as at 31 December 2020;
• the statement of profit or loss and other comprehensive income for the year then ended;
• the statement of cash flows for the year then ended;
• the statement of changes in equity for the year then ended; and
• the notes to the financial statements, which include significant accounting policies and other explanatory information.
Certain required disclosures have been presented elsewhere in the annual report rather than in the notes to the financial statements. These disclosures are cross-referenced from the financial statements and are identified as audited.
Basis for OpinionWe conducted our audit in accordance with International Standards on Auditing (ISAs). Our responsibilities under those standards are further described in the “Auditor’s Responsibilities for the Audit of the Financial Statements” section of our report.
We believe that the audit evidence we have obtained is sufficient and appropriate to provide a basis for our opinion.
IndependenceWe are independent of the Bank in accordance with the International Code of Ethics for Professional Accountants (including International Independence Standards) issued by the International Ethics Standards Board for Accountants (the “IESBA Code”).
We have fulfilled our other ethical responsibilities in accordance with the IESBA Code. Key Audit MattersKey audit matters are those matters that, in our professional judgement, were of most significance in our audit of the financial statements of the current period. These matters were addressed in the context of our audit of the financial statements as a whole, and in forming our opinion thereon, and we do not provide a separate opinion on these matters.
91STANDARD BANK (MAURITIUS) LIMITED Annual report 202090

Other InformationThe directors are responsible for the other information. The other information comprises the information included in the annual report but does not include the financial statements and our auditor’s report thereon.
Our opinion on the financial statements does not cover the other information and we do not express any form of assurance conclusion thereon.
In connection with our audit of the financial statements, our responsibility is to read the other information identified above and, in doing so, consider whether the other information is materially inconsistent with the financial statements or our knowledge obtained in the audit, or otherwise appears to be materially misstated.
If, based on the work we have performed on the other information, we conclude that there is a material misstatement of this other information, we are required to report that fact. We have nothing to report in this regard.
In addition to the responsibilities described above and our work undertaken in the course of the audit, the Mauritian Financial Reporting Act 2004 requires us to report certain matters as described below.
Corporate Governance ReportOur responsibility under the Mauritian Financial Reporting Act 2004 is to report on the compliance with the Code of Corporate Governance (“Code”) disclosed in the annual report and assess the explanations given for non-compliance with any requirement of the Code. From our assessment of the disclosures made on corporate governance in the annual report, the Bank has, pursuant to section 75 of the Mauritian Financial Reporting Act 2004, complied with the requirements of the Code.
Responsibilities of the Directors for the Financial Statements
The directors are responsible for the preparation and fair presentation of the financial statements in accordance with International Financial Reporting Standards and in compliance with the Mauritian Companies Act 2001, the Mauritian Banking Act 2004 and regulations and guidelines issued by the Bank of Mauritius and for such internal control as the directors determine is necessary to enable the preparation of financial statements that are free from material misstatement, whether due to fraud or error.
In preparing the financial statements, the directors are responsible for assessing the Bank’s ability to continue as a going concern, disclosing, as applicable, matters related to going concern and using the going concern basis of accounting unless the directors either intend to liquidate the Bank or to cease operations, or have no realistic alternative but to do so.
The directors are responsible for overseeing the financial reporting process.
Auditor’s Responsibilities for the Audit of the Financial Statements
Our objectives are to obtain reasonable assurance about whether the financial statements as a whole are free from material misstatement, whether due to fraud or error, and to issue an auditor’s report that includes our opinion. Reasonable assurance is a high level of assurance, but is not a guarantee that an audit conducted in accordance with ISAs will always detect a material misstatement when it exists. Misstatements can arise from fraud or error and are considered material if, individually or in the aggregate, they could reasonably be expected to influence the economic decisions of users taken on the basis of these financial statements.
As part of an audit in accordance with ISAs, we exercise professional judgement and maintain professional scepticism throughout the audit.
We also:
• Identify and assess the risks of material misstatement of the financial statements, whether due to fraud or error, design and perform audit procedures responsive to those risks, and obtain audit evidence that is sufficient and appropriate to provide a basis for our opinion. The risk of not detecting a material misstatement resulting from fraud is higher than for one resulting from error, as fraud may involve collusion, forgery, intentional omissions, misrepresentations, or the override of internal control.
• Obtain an understanding of internal control relevant to the audit in order to design audit procedures that are appropriate in the circumstances, but not for the purpose of expressing an opinion on the effectiveness of the internal control.
• Evaluate the appropriateness of accounting policies used and the reasonableness of accounting estimates and related disclosures made by the directors.
• Conclude on the appropriateness of the directors’ use of the going concern basis of accounting and, based on the audit evidence obtained, whether a material uncertainty exists related to events or conditions that may cast significant doubt on the Bank’s ability to continue as a going concern. If we conclude that a material uncertainty exists, we are required to draw attention in our auditor’s report to the related disclosures in the financial statements or, if such disclosures are inadequate, to modify our opinion. Our conclusions are based on the audit evidence obtained up to the date of our auditor’s report. However, future events or conditions may cause the Bank to cease to continue as a going concern.
• Evaluate the overall presentation, structure and content of the financial statements, including the disclosures, and whether the financial statements represent the underlying transactions and events in a manner that achieves fair presentation.
We communicate with the directors regarding, among other matters, the planned scope and timing of the audit and significant audit findings, including any significant deficiencies in internal control that we identify during our audit.
From the matters communicated with the directors, we determine those matters that were of most significance in the audit of the financial statements of the current period and are therefore the key audit matters. We describe these matters in our auditor’s report unless law or regulation precludes public disclosure about the matter or when, in extremely rare circumstances, we determine that a matter should not be communicated in our report because the adverse consequences of doing so would reasonably be expected to outweigh the public interest benefits of such communication.
Report on Other Legal and Regulatory Requirements
Mauritian Companies Act 2001The Mauritian Companies Act 2001 requires that in carrying out our audit we consider and report to you on the following matters. We confirm that:
(a) we have no relationship with or interests in the Bank other than in our capacity as auditor;
(b we have obtained all the information and explanations we have required; and
(c) in our opinion, proper accounting records have been kept by the Bank as far as appears from our examination of those records.
Mauritian Banking Act 2004The Mauritian Banking Act 2004 requires that in carrying out our audit we consider and report to you on the following matters. We confirm that:
(a) in our opinion, the financial statements have been prepared on a basis consistent with that of the preceding year and are complete, fair and properly drawn up and comply with the Mauritian Banking Act 2004 and regulations and guidelines issued by the Bank of Mauritius; and
(b) the explanations or information called for or given to us by the officers or agents of the Bank were satisfactory.
Other Matter
This report, including the opinion, has been prepared for and only for the Bank’s shareholder in accordance with Section 205 of the Mauritian Companies Act 2001 and for no other purpose. We do not, in giving this opinion, accept or assume responsibility for any other purpose or to any other person to whom this report is shown or into whose hands it may come save where expressly agreed by our prior consent in writing.
PricewaterhouseCoopers Gilles Beesoo, licensed by FRC
17 March 2021
ANNUAL FINANCIAL STATEMENTS AUDITOR'S REPORT CONTINUED 93STANDARD BANK (MAURITIUS) LIMITED Annual report 202092

ANNUAL FINANCIAL STATEMENTS STATEMENT OF FINANCIAL POSITION
Chairman Director Acting Chief ExecutiveDuncan Westcott Arvind Hari Michele Ah See
The notes on pages 98 to 191 form part of these financial statements.
Notes2020USD
2019USD
2018USD
AssetsCash and cash equivalentsTrading assetsDerivative assetsLoans and advances to banksLoans and advances to customersFinancial investments Property, plant and equipmentIntangible assetsRight of use assetsDeferred Tax AssetsOther assets
Total Assets
LiabilitiesDeposits from banksDeposits from customersDerivative liabilitiesOther borrowed fundsLease liabilitiesCurrent tax liabilitiesDeferred tax liabilitiesOther liabilities
Total Liabilities
Shareholder’s EquityShare capitalStatutory and other reservesRetained earnings
Total equity attributable to equity holder
Total Equity and Liabilities
789
1011121314151617
1819 92015211622
2335
1,050,583,0211,013,8642,591,021
259,159,883187,757,655
219,976,793 3,176,313 16,089,725
2,660,383 153,687
7,003,480
1,750,165,825
100,378,1911,504,343,412
3,232,991-
2,805,235222,769
-9,433,710
1,620,416,308
35,000,00023,277,81871,471,699
129,749,517
1,750,165,825
686,658,1193,690,943
1,151,716298,481,160227,004,114197,075,417
3,915,870 17,010,463 3,306,259
8,062,336
1,446,356,397
88,402,630 1,211,097,476
1,705,225 470,766
3,387,780 876,781435,000
12,123,660
1,318,499,318
35,000,000 23,813,752
69,043,327
127,857,079
1,446,356,397
875,019,5632,473,9611,278,203
301,895,689228,032,006147,364,470 3,177,587 18,143,248
- - -
9,785,646
1,587,170,373
34,716,399 1,387,631,188
1,671,872 1,412,299
- 673,262760,000
44,513,903
1,471,378,923
35,000,000 19,243,582 61,547,868
115,791,450
1,587,170,373
Approved by the Board of Directors and authorised for issue on 17 March 2021.
Notes2020USD
2019USD
2018USD
Interest incomeInterest expense
Net interest income
Fee and commission incomeFee and commission expense
Net fee and commission income
Net trading income Net income from other financial instruments carried at fair valueOther operating income
Operating income
Net impairment charge on financial assetsPersonnel expensesOperating lease expensesDepreciation on Right-of-use assetsDepreciation and amortisationOther expenses
Profit before income taxIncome tax expense
Profit for the year
Other comprehensive incomeItem that may be reclassified to profit or lossNet (loss)/gain on fair value of debt instruments
Item that will not be reclassified to profit or lossRemeasurement of defined benefit liabilities, net of tax
Other comprehensive income for the year
Total comprehensive income for the year
25
26
27
28 29
3031(a)
3215
13&1433
34
31(c)
27,799,694(5,016,964)
22,782,730
5,764,426(135,615)
5,628,811
6,068,459
54,846275,506
6,398,811
34,810,352
(9,718,156)(6,916,189)
(72,875)(645,876)
(2,254,273)(6,937,193)
(26,544,562)
8,265,790(784,727)
7,481,063
(8,905)
(579,720)
(588,625)
6,892,438
44,878,982 (12,478,849)
32,400,133
6,931,396 (311,241)
6,620,155
7,399,617
40,066 336,855
7,776,538
46,796,826
(5,160,591) (9,535,265)
(136,076)(705,556)
(2,069,810) (6,127,578)
(23,734,876)
23,061,950(808,253)
22,253,697
22,474
(249,421)
(226,947)
22,026,750
37,913,582 (9,208,582)
28,705,000
7,148,964 (407,468)
6,741,496
11,610,187
106,357 316,141
12,032,685
47,479,181
(1,455,341) (8,681,740)
(776,865)-
(1,970,598) (7,290,321)
(20,174,865)
27,304,316(1,731,418)
25,572,898
14,276
-
14,276
25,587,174
The notes on pages 98 to 191 form part of these financial statements.
Statement of Financial PositionAs at 31 December 2020
Statement of profit or loss and other comprehensive incomeFor the year ended 31 December 2020
95STANDARD BANK (MAURITIUS) LIMITED Annual report 202094

ANNUAL FINANCIAL STATEMENTS STATEMENT OF CASH FLOWS
Notes2020USD
2019USD
2018USD
Cash flows from operating activitiesProfit before income taxAdjusted for: Depreciation and amortisationLoss on plant and equipment written offNet foreign exchange differenceNet impairment charge on financial assets Retirement benefit costInterest incomeInterest expense
Changes in operating assets and liabilities Decrease/(increase) in trading assets Increase in derivative assets and liabilities Decrease in loans and advances to banks Decrease/(increase) in loans and advances to customers Decrease/(increase) in other assets Increase/(decrease) in deposits from banks Decrease in other borrowed fundsIncrease/(decrease) in deposits from customers (Decrease)/increase in other liabilities Decrease/(increase) in financial investments Interest receivedInterest paidIncome tax paid Benefit paid on defined benefit obligation
Net cash from/(used in) operating activities
Cash flows from investing activitiesCapital expenditure on property, plant and equipment Capital expenditure intangible assets Purchase of financial investments Financial investments maturedAcquisition of Right-of-use assets
Net cash used in investing activities
Cash flows from financing activitiesPrincipal portion of lease liability paidDividends paid
Net cash used in financing activities
Net increase/(decrease) in cash and cash equivalents Net foreign exchange differenceCash at the beginning of the year Effect of IFRS 9 impairment charge
Total cash at end of the year
13/14/15
1314121215
37(x)
7
8,265,790
2,900,149-
31,5419,746,560
119,136(27,799,694)
5,016,964
2,677,07988,461
40,811,15030,307,286
559,03912,137,269(470,766)
293,759,615(3,429,948)
1,155,93025,741,271
(5,692,352)(1,496,757)
(58,628)
394,369,095
(49,518)(544,460)
(128,031,108)103,900,036
-
(24,725,050)
(582,545)(5,000,000)
(5,582,545)
364,061,500(31,540)
686,658,119(105,058)
1,050,583,021
23,061,950
2,775,3662,862
648,3634,204,692
502,159(44,878,982)
12,478,849
(1,216,982)159,840
3,647,410(2,775,999)
1,577,22953,489,350
(941,533) (176,166,444)
(33,251,805)(780,959)
44,318,406(12,649,235)
(783,796)-
(126,579,259)
(1,422,579)(255,591)
(196,184,195)147,364,470
(44,819)
(50,542,714)
(579,023)(10,000,000)
(10,579,023)
(187,700,996)(648,363)
875,019,563(12,085)
686,658,119
27,304,316
1,970,598-
262,8211,452,910
-(37,913,582)
9,208,582
(1,724,327)715,216
122,847,183(107,621,745) (1,903,565)(26,174,549) (2,685,329)
283,508,75333,171,853
(70,747)36,194,281
(8,605,592)(787,866)
-
329,149,211
(1,724,098)(12,321)
(141,338,975)118,382,553
-
(24,692,841)
--
-
304,456,370(262,821)
570,823,6482,366
875,019,563
The notes on pages 98 to 191 form part of these financial statements.
Share capital
Statutory reserve
Other reserves
Retained earnings
Total equity attributable to equity holder
Balance at 01 January 2018USD
35,000,000USD
15,284,592USD
130,072USD
39,695,196USD
90,109,860
Profit for the yearOther comprehensive income:Net gain on fair value of debt instruments
Total comprehensive income for the year
Transfer to statutory reserveTransactions with owner of the Bank:Transfer from credit risk reserveShare based payments
Balance at 31 December 2018Impact of adoption of IFRS 16
Balance at 01 January 2019
Profit for the yearOther comprehensive income:Net gain on fair value of debt instrumentsRemeasurement of defined benefit liabilities
Total comprehensive income for the year
Transfer to statutory reserveTransfer to credit risk reserveTransactions with owner of the Bank:Dividend to equity holder (Note 37)Share based payments
Balance at 31 December 2019
Balance at 01 January 2020
Profit for the yearOther comprehensive income:Net loss on fair value of debt instrumentsRemeasurement of defined benefit liabilities
Total comprehensive income for the year
Transfer to statutory reserveTransfer from credit risk reserveTransactions with owner of the Bank:Dividend to equity holder (Note 37)Share based payments
Balance at 31 December 2020
Note
-
-
-
-
--
35,000,000-
35,000,000
-
--
-
--
--
35,000,000
35,000,000
-
--
-
--
--
35,000,000
23
-
-
-
3,835,935
--
19,120,527-
19,120,527
-
--
-
3,338,054-
--
22,458,581
22,458,581
-
--
-
1,122,160-
--
23,580,741
-
14,276
14,276
-
(115,666)94,373
123,055-
123,055
-
22,474 (249,421)
(226,947)
-1,456,926
-2,137
1,355,171
1,355,171
-
(8,905)(579,720)
(588,625)
-(943,599)
-(125,870)
(302,923)
35
25,572,898
-
25,572,898
(3,835,935)
115,66643
61,547,86836,742
61,584,610
22,253,697
--
22,253,697
(3,338,054)(1,456,926)
(10,000,000)-
69,043,327
69,043,327
7,481,063
--
7,481,063
(1,122,160)943,599
(5,000,000)125,870
71,471,699
25,572,898
14,276
25,587,174
-
-94,416
115,791,45036,742
115,828,192
22,253,697
22,474 (249,421)
22,026,750
--
(10,000,000)2,137
127,857,079
127,857,079
7,481,063
(8,905)(579,720)
6,892,438
--
(5,000,000)-
129,749,517
The notes on pages 98 to 191 form part of these financial statements.
Statement of Cash FlowsFor the year ended 31 December 2020
Statement of Changes in EquityFor the year ended 31 December 2020
97STANDARD BANK (MAURITIUS) LIMITED Annual report 202096
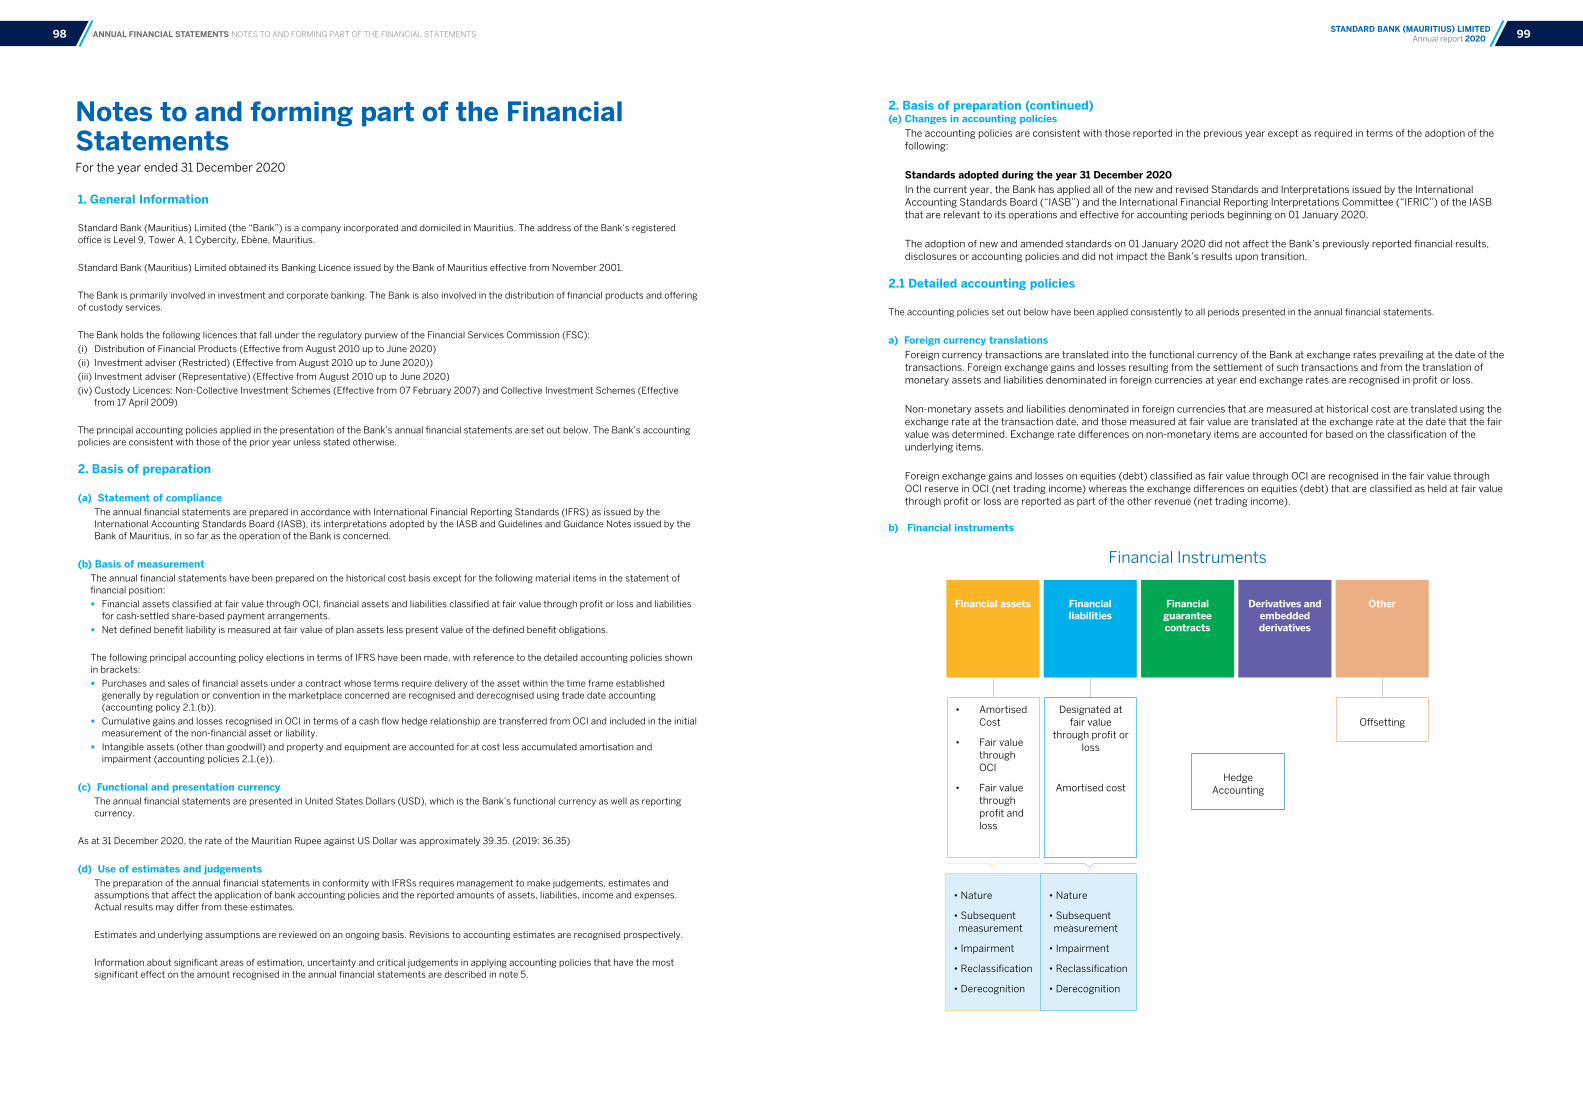
Notes to and forming part of the Financial Statements For the year ended 31 December 2020
ANNUAL FINANCIAL STATEMENTS NOTES TO AND FORMING PART OF THE FINANCIAL STATEMENTS
2. Basis of preparation (continued) (e) Changes in accounting policies
The accounting policies are consistent with those reported in the previous year except as required in terms of the adoption of the following:
Standards adopted during the year 31 December 2020In the current year, the Bank has applied all of the new and revised Standards and Interpretations issued by the International Accounting Standards Board (“IASB”) and the International Financial Reporting Interpretations Committee (“IFRIC”) of the IASB that are relevant to its operations and effective for accounting periods beginning on 01 January 2020.
The adoption of new and amended standards on 01 January 2020 did not affect the Bank’s previously reported financial results, disclosures or accounting policies and did not impact the Bank’s results upon transition.
2.1 Detailed accounting policies
The accounting policies set out below have been applied consistently to all periods presented in the annual financial statements.
a) Foreign currency translationsForeign currency transactions are translated into the functional currency of the Bank at exchange rates prevailing at the date of the transactions. Foreign exchange gains and losses resulting from the settlement of such transactions and from the translation of monetary assets and liabilities denominated in foreign currencies at year end exchange rates are recognised in profit or loss.
Non-monetary assets and liabilities denominated in foreign currencies that are measured at historical cost are translated using the exchange rate at the transaction date, and those measured at fair value are translated at the exchange rate at the date that the fair value was determined. Exchange rate differences on non-monetary items are accounted for based on the classification of the underlying items.
Foreign exchange gains and losses on equities (debt) classified as fair value through OCI are recognised in the fair value through OCI reserve in OCI (net trading income) whereas the exchange differences on equities (debt) that are classified as held at fair value through profit or loss are reported as part of the other revenue (net trading income).
b) Financial instruments
1. General Information
Standard Bank (Mauritius) Limited (the “Bank”) is a company incorporated and domiciled in Mauritius. The address of the Bank‘s registered office is Level 9, Tower A, 1 Cybercity, Ebène, Mauritius.
Standard Bank (Mauritius) Limited obtained its Banking Licence issued by the Bank of Mauritius effective from November 2001.
The Bank is primarily involved in investment and corporate banking. The Bank is also involved in the distribution of financial products and offering of custody services.
The Bank holds the following licences that fall under the regulatory purview of the Financial Services Commission (FSC):
(i) Distribution of Financial Products (Effective from August 2010 up to June 2020)
(ii) Investment adviser (Restricted) (Effective from August 2010 up to June 2020))
(iii) Investment adviser (Representative) (Effective from August 2010 up to June 2020)
(iv) Custody Licences: Non-Collective Investment Schemes (Effective from 07 February 2007) and Collective Investment Schemes (Effective from 17 April 2009)
The principal accounting policies applied in the presentation of the Bank’s annual financial statements are set out below. The Bank’s accounting policies are consistent with those of the prior year unless stated otherwise.
2. Basis of preparation
(a) Statement of complianceThe annual financial statements are prepared in accordance with International Financial Reporting Standards (IFRS) as issued by the International Accounting Standards Board (IASB), its interpretations adopted by the IASB and Guidelines and Guidance Notes issued by the Bank of Mauritius, in so far as the operation of the Bank is concerned.
(b) Basis of measurementThe annual financial statements have been prepared on the historical cost basis except for the following material items in the statement of financial position:
• Financial assets classified at fair value through OCI, financial assets and liabilities classified at fair value through profit or loss and liabilities for cash-settled share-based payment arrangements.
• Net defined benefit liability is measured at fair value of plan assets less present value of the defined benefit obligations.
The following principal accounting policy elections in terms of IFRS have been made, with reference to the detailed accounting policies shown in brackets:
• Purchases and sales of financial assets under a contract whose terms require delivery of the asset within the time frame established generally by regulation or convention in the marketplace concerned are recognised and derecognised using trade date accounting (accounting policy 2.1.(b)).
• Cumulative gains and losses recognised in OCI in terms of a cash flow hedge relationship are transferred from OCI and included in the initial measurement of the non-financial asset or liability.
• Intangible assets (other than goodwill) and property and equipment are accounted for at cost less accumulated amortisation and impairment (accounting policies 2.1.(e)).
(c) Functional and presentation currency The annual financial statements are presented in United States Dollars (USD), which is the Bank’s functional currency as well as reporting currency.
As at 31 December 2020, the rate of the Mauritian Rupee against US Dollar was approximately 39.35. (2019: 36.35)
(d) Use of estimates and judgementsThe preparation of the annual financial statements in conformity with IFRSs requires management to make judgements, estimates and assumptions that affect the application of bank accounting policies and the reported amounts of assets, liabilities, income and expenses. Actual results may differ from these estimates.
Estimates and underlying assumptions are reviewed on an ongoing basis. Revisions to accounting estimates are recognised prospectively.
Information about significant areas of estimation, uncertainty and critical judgements in applying accounting policies that have the most significant effect on the amount recognised in the annual financial statements are described in note 5.
Financial assets Financial liabilities
Financial guarantee contracts
Derivatives and embedded derivatives
Other
Financial Instruments
• Amortised Cost
• Fair value through OCI
• Fair value through profit and loss
Designated at fair value
through profit or loss
Amortised cost
Offsetting
Hedge
Accounting
• Nature
• Subsequent measurement
• Impairment
• Reclassification
• Derecognition
• Nature
• Subsequent measurement
• Impairment
• Reclassification
• Derecognition
99STANDARD BANK (MAURITIUS) LIMITED Annual report 202098
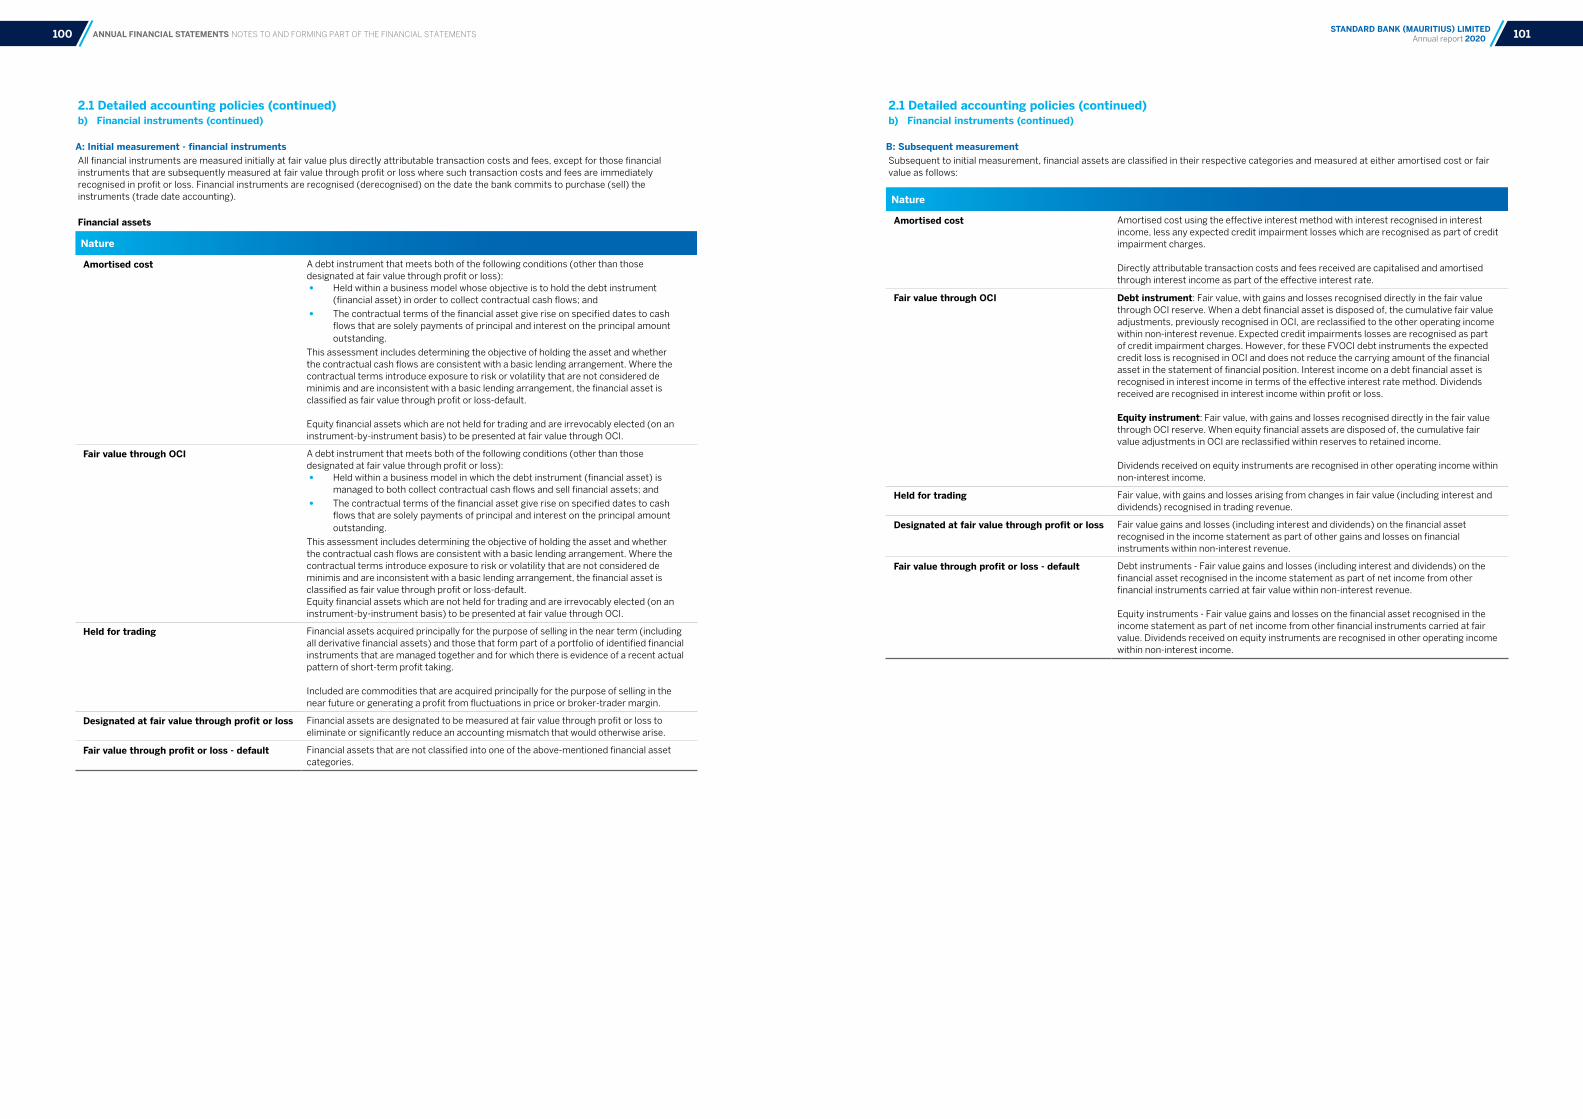
ANNUAL FINANCIAL STATEMENTS NOTES TO AND FORMING PART OF THE FINANCIAL STATEMENTS
2.1 Detailed accounting policies (continued)b) Financial instruments (continued) A: Initial measurement - financial instrumentsAll financial instruments are measured initially at fair value plus directly attributable transaction costs and fees, except for those financial instruments that are subsequently measured at fair value through profit or loss where such transaction costs and fees are immediately recognised in profit or loss. Financial instruments are recognised (derecognised) on the date the bank commits to purchase (sell) the instruments (trade date accounting).
Financial assets
2.1 Detailed accounting policies (continued)b) Financial instruments (continued) B: Subsequent measurementSubsequent to initial measurement, financial assets are classified in their respective categories and measured at either amortised cost or fair value as follows:
Nature
Amortised cost A debt instrument that meets both of the following conditions (other than those designated at fair value through profit or loss):
• Held within a business model whose objective is to hold the debt instrument (financial asset) in order to collect contractual cash flows; and
• The contractual terms of the financial asset give rise on specified dates to cash flows that are solely payments of principal and interest on the principal amount outstanding.
This assessment includes determining the objective of holding the asset and whether the contractual cash flows are consistent with a basic lending arrangement. Where the contractual terms introduce exposure to risk or volatility that are not considered de minimis and are inconsistent with a basic lending arrangement, the financial asset is classified as fair value through profit or loss-default. Equity financial assets which are not held for trading and are irrevocably elected (on an instrument-by-instrument basis) to be presented at fair value through OCI.
Fair value through OCI A debt instrument that meets both of the following conditions (other than those designated at fair value through profit or loss):
• Held within a business model in which the debt instrument (financial asset) is managed to both collect contractual cash flows and sell financial assets; and
• The contractual terms of the financial asset give rise on specified dates to cash flows that are solely payments of principal and interest on the principal amount outstanding.
This assessment includes determining the objective of holding the asset and whether the contractual cash flows are consistent with a basic lending arrangement. Where the contractual terms introduce exposure to risk or volatility that are not considered de minimis and are inconsistent with a basic lending arrangement, the financial asset is classified as fair value through profit or loss-default.Equity financial assets which are not held for trading and are irrevocably elected (on an instrument-by-instrument basis) to be presented at fair value through OCI.
Held for trading Financial assets acquired principally for the purpose of selling in the near term (including all derivative financial assets) and those that form part of a portfolio of identified financial instruments that are managed together and for which there is evidence of a recent actual pattern of short-term profit taking.
Included are commodities that are acquired principally for the purpose of selling in the near future or generating a profit from fluctuations in price or broker-trader margin.
Designated at fair value through profit or loss Financial assets are designated to be measured at fair value through profit or loss to eliminate or significantly reduce an accounting mismatch that would otherwise arise.
Fair value through profit or loss - default Financial assets that are not classified into one of the above-mentioned financial asset categories.
Nature
Amortised cost Amortised cost using the effective interest method with interest recognised in interest income, less any expected credit impairment losses which are recognised as part of credit impairment charges.
Directly attributable transaction costs and fees received are capitalised and amortised through interest income as part of the effective interest rate.
Fair value through OCI Debt instrument: Fair value, with gains and losses recognised directly in the fair value through OCI reserve. When a debt financial asset is disposed of, the cumulative fair value adjustments, previously recognised in OCI, are reclassified to the other operating income within non-interest revenue. Expected credit impairments losses are recognised as part of credit impairment charges. However, for these FVOCI debt instruments the expected credit loss is recognised in OCI and does not reduce the carrying amount of the financial asset in the statement of financial position. Interest income on a debt financial asset is recognised in interest income in terms of the effective interest rate method. Dividends received are recognised in interest income within profit or loss.
Equity instrument: Fair value, with gains and losses recognised directly in the fair value through OCI reserve. When equity financial assets are disposed of, the cumulative fair value adjustments in OCI are reclassified within reserves to retained income.
Dividends received on equity instruments are recognised in other operating income within non-interest income.
Held for trading Fair value, with gains and losses arising from changes in fair value (including interest and dividends) recognised in trading revenue.
Designated at fair value through profit or loss Fair value gains and losses (including interest and dividends) on the financial asset recognised in the income statement as part of other gains and losses on financial instruments within non-interest revenue.
Fair value through profit or loss - default Debt instruments - Fair value gains and losses (including interest and dividends) on the financial asset recognised in the income statement as part of net income from other financial instruments carried at fair value within non-interest revenue.
Equity instruments - Fair value gains and losses on the financial asset recognised in the income statement as part of net income from other financial instruments carried at fair value. Dividends received on equity instruments are recognised in other operating income within non-interest income.
101STANDARD BANK (MAURITIUS) LIMITED Annual report 2020100
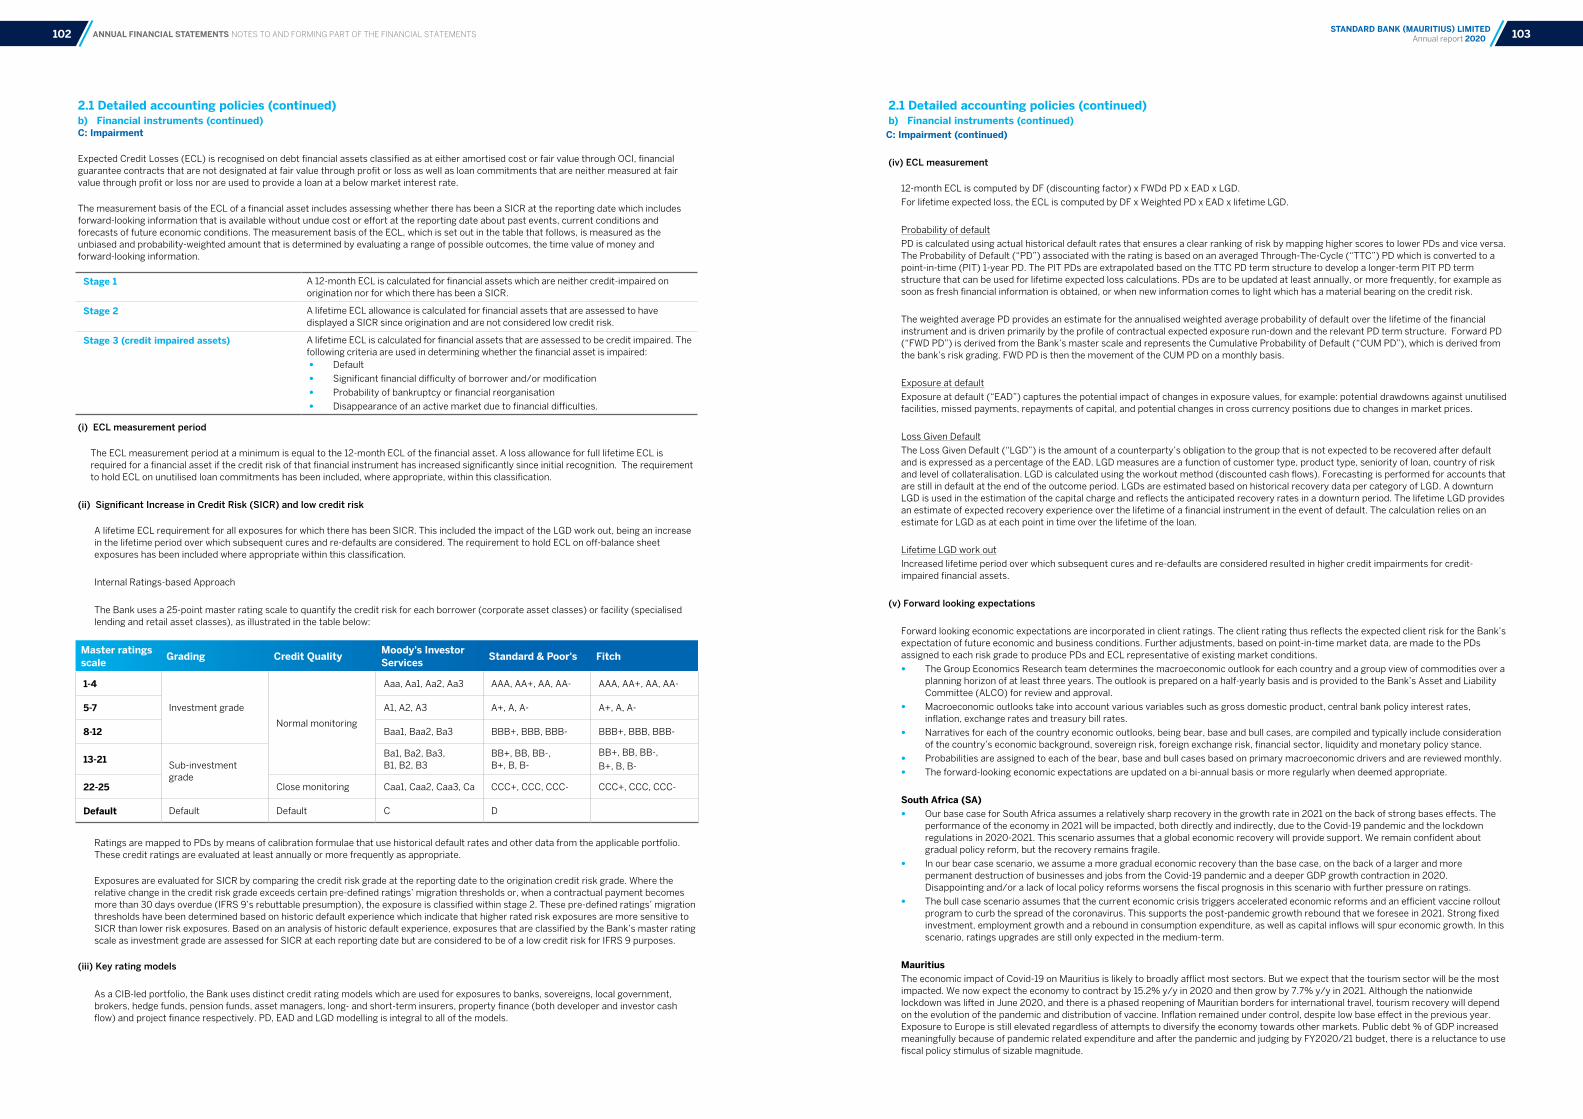
ANNUAL FINANCIAL STATEMENTS NOTES TO AND FORMING PART OF THE FINANCIAL STATEMENTS
2.1 Detailed accounting policies (continued)b) Financial instruments (continued) C: Impairment
Expected Credit Losses (ECL) is recognised on debt financial assets classified as at either amortised cost or fair value through OCI, financial guarantee contracts that are not designated at fair value through profit or loss as well as loan commitments that are neither measured at fair value through profit or loss nor are used to provide a loan at a below market interest rate.
The measurement basis of the ECL of a financial asset includes assessing whether there has been a SICR at the reporting date which includes forward-looking information that is available without undue cost or effort at the reporting date about past events, current conditions and forecasts of future economic conditions. The measurement basis of the ECL, which is set out in the table that follows, is measured as the unbiased and probability-weighted amount that is determined by evaluating a range of possible outcomes, the time value of money and forward-looking information.
(i) ECL measurement period
The ECL measurement period at a minimum is equal to the 12-month ECL of the financial asset. A loss allowance for full lifetime ECL is required for a financial asset if the credit risk of that financial instrument has increased significantly since initial recognition. The requirement to hold ECL on unutilised loan commitments has been included, where appropriate, within this classification.
(ii) Significant Increase in Credit Risk (SICR) and low credit risk
A lifetime ECL requirement for all exposures for which there has been SICR. This included the impact of the LGD work out, being an increase in the lifetime period over which subsequent cures and re-defaults are considered. The requirement to hold ECL on off-balance sheet exposures has been included where appropriate within this classification.
Internal Ratings-based Approach
The Bank uses a 25-point master rating scale to quantify the credit risk for each borrower (corporate asset classes) or facility (specialised lending and retail asset classes), as illustrated in the table below:
Ratings are mapped to PDs by means of calibration formulae that use historical default rates and other data from the applicable portfolio. These credit ratings are evaluated at least annually or more frequently as appropriate.
Exposures are evaluated for SICR by comparing the credit risk grade at the reporting date to the origination credit risk grade. Where the relative change in the credit risk grade exceeds certain pre-defined ratings’ migration thresholds or, when a contractual payment becomes more than 30 days overdue (IFRS 9’s rebuttable presumption), the exposure is classified within stage 2. These pre-defined ratings’ migration thresholds have been determined based on historic default experience which indicate that higher rated risk exposures are more sensitive to SICR than lower risk exposures. Based on an analysis of historic default experience, exposures that are classified by the Bank’s master rating scale as investment grade are assessed for SICR at each reporting date but are considered to be of a low credit risk for IFRS 9 purposes.
(iii) Key rating models
As a CIB-led portfolio, the Bank uses distinct credit rating models which are used for exposures to banks, sovereigns, local government, brokers, hedge funds, pension funds, asset managers, long- and short-term insurers, property finance (both developer and investor cash flow) and project finance respectively. PD, EAD and LGD modelling is integral to all of the models.
2.1 Detailed accounting policies (continued)b) Financial instruments (continued)C: Impairment (continued)
(iv) ECL measurement
12-month ECL is computed by DF (discounting factor) x FWDd PD x EAD x LGD.
For lifetime expected loss, the ECL is computed by DF x Weighted PD x EAD x lifetime LGD.
Probability of default
PD is calculated using actual historical default rates that ensures a clear ranking of risk by mapping higher scores to lower PDs and vice versa. The Probability of Default (“PD”) associated with the rating is based on an averaged Through-The-Cycle (“TTC”) PD which is converted to a point-in-time (PIT) 1-year PD. The PIT PDs are extrapolated based on the TTC PD term structure to develop a longer-term PIT PD term structure that can be used for lifetime expected loss calculations. PDs are to be updated at least annually, or more frequently, for example as soon as fresh financial information is obtained, or when new information comes to light which has a material bearing on the credit risk.
The weighted average PD provides an estimate for the annualised weighted average probability of default over the lifetime of the financial instrument and is driven primarily by the profile of contractual expected exposure run-down and the relevant PD term structure. Forward PD (“FWD PD”) is derived from the Bank’s master scale and represents the Cumulative Probability of Default (“CUM PD”), which is derived from the bank’s risk grading. FWD PD is then the movement of the CUM PD on a monthly basis.
Exposure at default
Exposure at default (“EAD”) captures the potential impact of changes in exposure values, for example: potential drawdowns against unutilised facilities, missed payments, repayments of capital, and potential changes in cross currency positions due to changes in market prices.
Loss Given Default
The Loss Given Default (“LGD”) is the amount of a counterparty’s obligation to the group that is not expected to be recovered after default and is expressed as a percentage of the EAD. LGD measures are a function of customer type, product type, seniority of loan, country of risk and level of collateralisation. LGD is calculated using the workout method (discounted cash flows). Forecasting is performed for accounts that are still in default at the end of the outcome period. LGDs are estimated based on historical recovery data per category of LGD. A downturn LGD is used in the estimation of the capital charge and reflects the anticipated recovery rates in a downturn period. The lifetime LGD provides an estimate of expected recovery experience over the lifetime of a financial instrument in the event of default. The calculation relies on an estimate for LGD as at each point in time over the lifetime of the loan.
Lifetime LGD work out
Increased lifetime period over which subsequent cures and re-defaults are considered resulted in higher credit impairments for credit-impaired financial assets.
(v) Forward looking expectations
Forward looking economic expectations are incorporated in client ratings. The client rating thus reflects the expected client risk for the Bank’s expectation of future economic and business conditions. Further adjustments, based on point-in-time market data, are made to the PDs assigned to each risk grade to produce PDs and ECL representative of existing market conditions.
• The Group Economics Research team determines the macroeconomic outlook for each country and a group view of commodities over a planning horizon of at least three years. The outlook is prepared on a half-yearly basis and is provided to the Bank’s Asset and Liability Committee (ALCO) for review and approval.
• Macroeconomic outlooks take into account various variables such as gross domestic product, central bank policy interest rates, inflation, exchange rates and treasury bill rates.
• Narratives for each of the country economic outlooks, being bear, base and bull cases, are compiled and typically include consideration of the country’s economic background, sovereign risk, foreign exchange risk, financial sector, liquidity and monetary policy stance.
• Probabilities are assigned to each of the bear, base and bull cases based on primary macroeconomic drivers and are reviewed monthly.
• The forward-looking economic expectations are updated on a bi-annual basis or more regularly when deemed appropriate.
South Africa (SA) • Our base case for South Africa assumes a relatively sharp recovery in the growth rate in 2021 on the back of strong bases effects. The
performance of the economy in 2021 will be impacted, both directly and indirectly, due to the Covid-19 pandemic and the lockdown regulations in 2020-2021. This scenario assumes that a global economic recovery will provide support. We remain confident about gradual policy reform, but the recovery remains fragile.
• In our bear case scenario, we assume a more gradual economic recovery than the base case, on the back of a larger and more permanent destruction of businesses and jobs from the Covid-19 pandemic and a deeper GDP growth contraction in 2020. Disappointing and/or a lack of local policy reforms worsens the fiscal prognosis in this scenario with further pressure on ratings.
• The bull case scenario assumes that the current economic crisis triggers accelerated economic reforms and an efficient vaccine rollout program to curb the spread of the coronavirus. This supports the post-pandemic growth rebound that we foresee in 2021. Strong fixed investment, employment growth and a rebound in consumption expenditure, as well as capital inflows will spur economic growth. In this scenario, ratings upgrades are still only expected in the medium-term.
Mauritius
The economic impact of Covid-19 on Mauritius is likely to broadly afflict most sectors. But we expect that the tourism sector will be the most impacted. We now expect the economy to contract by 15.2% y/y in 2020 and then grow by 7.7% y/y in 2021. Although the nationwide lockdown was lifted in June 2020, and there is a phased reopening of Mauritian borders for international travel, tourism recovery will depend on the evolution of the pandemic and distribution of vaccine. Inflation remained under control, despite low base effect in the previous year. Exposure to Europe is still elevated regardless of attempts to diversify the economy towards other markets. Public debt % of GDP increased meaningfully because of pandemic related expenditure and after the pandemic and judging by FY2020/21 budget, there is a reluctance to use fiscal policy stimulus of sizable magnitude.
Stage 1 A 12-month ECL is calculated for financial assets which are neither credit-impaired on origination nor for which there has been a SICR.
Stage 2 A lifetime ECL allowance is calculated for financial assets that are assessed to have displayed a SICR since origination and are not considered low credit risk.
Stage 3 (credit impaired assets) A lifetime ECL is calculated for financial assets that are assessed to be credit impaired. The following criteria are used in determining whether the financial asset is impaired:
• Default • Significant financial difficulty of borrower and/or modification
• Probability of bankruptcy or financial reorganisation
• Disappearance of an active market due to financial difficulties.
Master ratings scale Grading Credit Quality Moody's Investor
Services Standard & Poor's Fitch
1-4
Investment grade
Normal monitoring
Aaa, Aa1, Aa2, Aa3 AAA, AA+, AA, AA- AAA, AA+, AA, AA-
5-7 A1, A2, A3 A+, A, A- A+, A, A-
8-12 Baa1, Baa2, Ba3 BBB+, BBB, BBB- BBB+, BBB, BBB-
13-21Sub-investment grade
Ba1, Ba2, Ba3, B1, B2, B3
BB+, BB, BB-, B+, B, B-
BB+, BB, BB-,
B+, B, B-
22-25 Close monitoring Caa1, Caa2, Caa3, Ca CCC+, CCC, CCC- CCC+, CCC, CCC-
Default Default Default C D
103STANDARD BANK (MAURITIUS) LIMITED Annual report 2020102
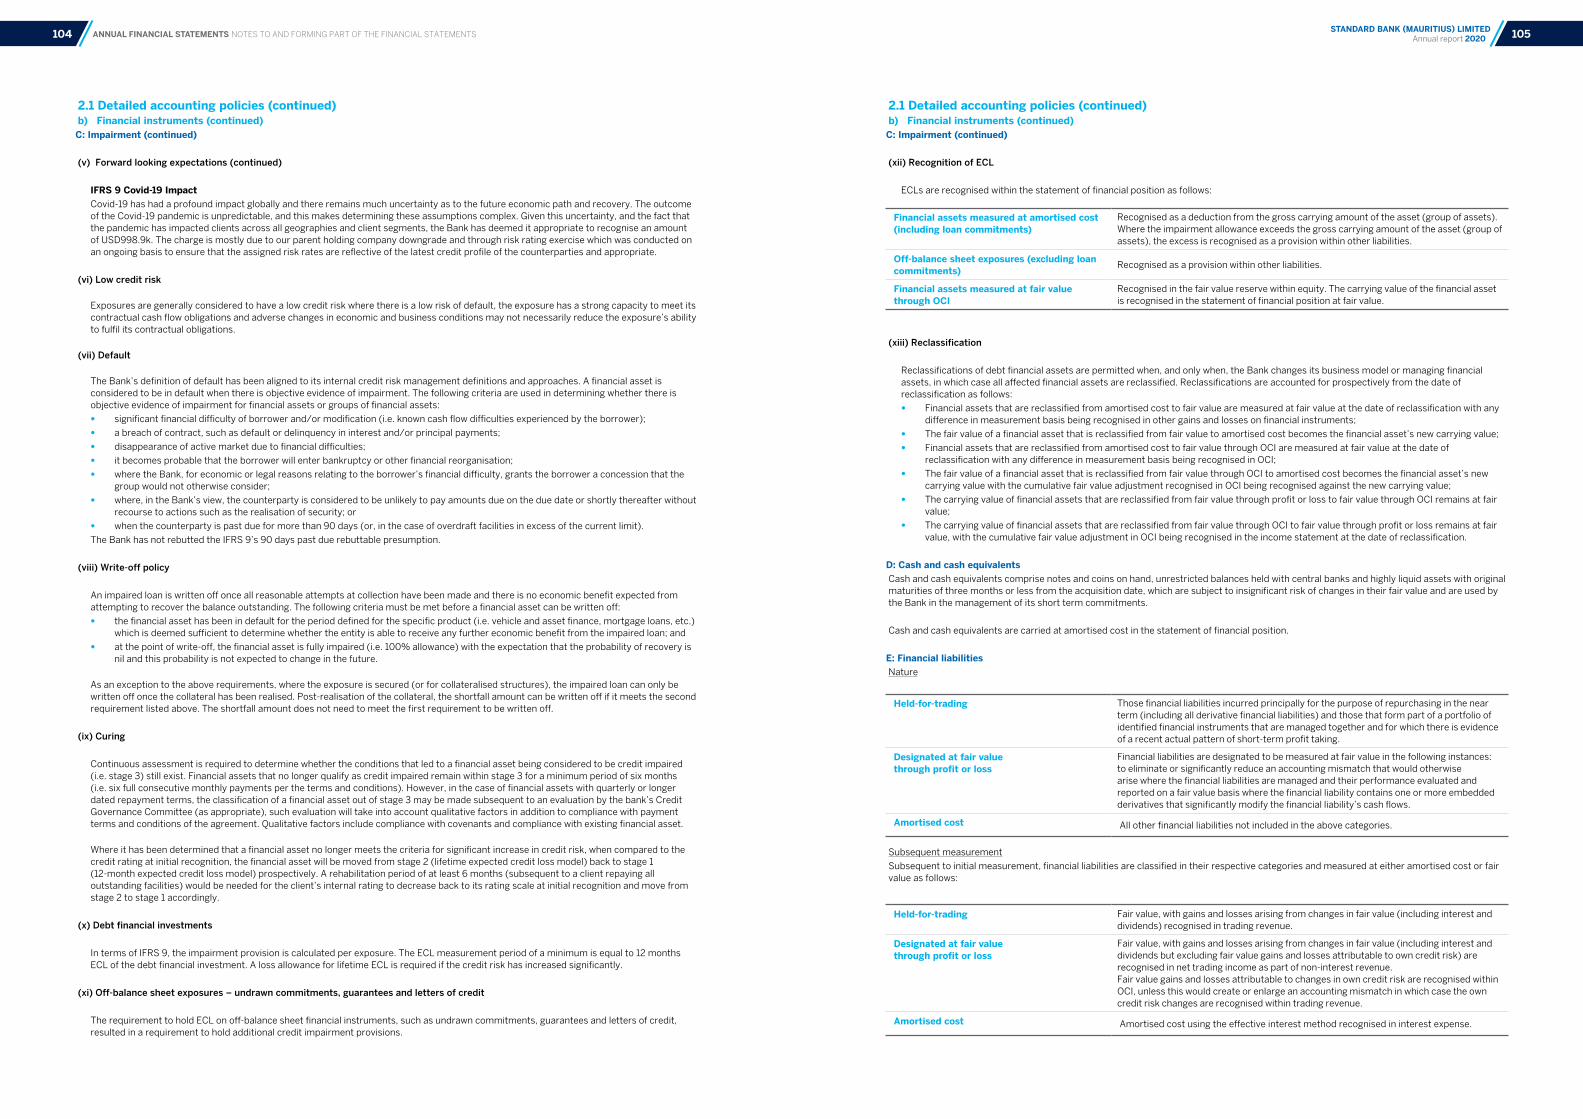
ANNUAL FINANCIAL STATEMENTS NOTES TO AND FORMING PART OF THE FINANCIAL STATEMENTS
2.1 Detailed accounting policies (continued)b) Financial instruments (continued)C: Impairment (continued)
(v) Forward looking expectations (continued)
IFRS 9 Covid-19 ImpactCovid-19 has had a profound impact globally and there remains much uncertainty as to the future economic path and recovery. The outcome of the Covid-19 pandemic is unpredictable, and this makes determining these assumptions complex. Given this uncertainty, and the fact that the pandemic has impacted clients across all geographies and client segments, the Bank has deemed it appropriate to recognise an amount of USD998.9k. The charge is mostly due to our parent holding company downgrade and through risk rating exercise which was conducted on an ongoing basis to ensure that the assigned risk rates are reflective of the latest credit profile of the counterparties and appropriate.
(vi) Low credit risk
Exposures are generally considered to have a low credit risk where there is a low risk of default, the exposure has a strong capacity to meet its contractual cash flow obligations and adverse changes in economic and business conditions may not necessarily reduce the exposure’s ability to fulfil its contractual obligations.
(vii) Default
The Bank’s definition of default has been aligned to its internal credit risk management definitions and approaches. A financial asset is considered to be in default when there is objective evidence of impairment. The following criteria are used in determining whether there is objective evidence of impairment for financial assets or groups of financial assets:
• significant financial difficulty of borrower and/or modification (i.e. known cash flow difficulties experienced by the borrower);
• a breach of contract, such as default or delinquency in interest and/or principal payments;
• disappearance of active market due to financial difficulties;
• it becomes probable that the borrower will enter bankruptcy or other financial reorganisation;
• where the Bank, for economic or legal reasons relating to the borrower’s financial difficulty, grants the borrower a concession that the group would not otherwise consider;
• where, in the Bank’s view, the counterparty is considered to be unlikely to pay amounts due on the due date or shortly thereafter without recourse to actions such as the realisation of security; or
• when the counterparty is past due for more than 90 days (or, in the case of overdraft facilities in excess of the current limit).
The Bank has not rebutted the IFRS 9’s 90 days past due rebuttable presumption.
(viii) Write-off policy
An impaired loan is written off once all reasonable attempts at collection have been made and there is no economic benefit expected from attempting to recover the balance outstanding. The following criteria must be met before a financial asset can be written off:
• the financial asset has been in default for the period defined for the specific product (i.e. vehicle and asset finance, mortgage loans, etc.) which is deemed sufficient to determine whether the entity is able to receive any further economic benefit from the impaired loan; and
• at the point of write-off, the financial asset is fully impaired (i.e. 100% allowance) with the expectation that the probability of recovery is nil and this probability is not expected to change in the future.
As an exception to the above requirements, where the exposure is secured (or for collateralised structures), the impaired loan can only be written off once the collateral has been realised. Post-realisation of the collateral, the shortfall amount can be written off if it meets the second requirement listed above. The shortfall amount does not need to meet the first requirement to be written off.
(ix) Curing
Continuous assessment is required to determine whether the conditions that led to a financial asset being considered to be credit impaired (i.e. stage 3) still exist. Financial assets that no longer qualify as credit impaired remain within stage 3 for a minimum period of six months (i.e. six full consecutive monthly payments per the terms and conditions). However, in the case of financial assets with quarterly or longer dated repayment terms, the classification of a financial asset out of stage 3 may be made subsequent to an evaluation by the bank’s Credit Governance Committee (as appropriate), such evaluation will take into account qualitative factors in addition to compliance with payment terms and conditions of the agreement. Qualitative factors include compliance with covenants and compliance with existing financial asset.
Where it has been determined that a financial asset no longer meets the criteria for significant increase in credit risk, when compared to the credit rating at initial recognition, the financial asset will be moved from stage 2 (lifetime expected credit loss model) back to stage 1 (12-month expected credit loss model) prospectively. A rehabilitation period of at least 6 months (subsequent to a client repaying all outstanding facilities) would be needed for the client’s internal rating to decrease back to its rating scale at initial recognition and move from stage 2 to stage 1 accordingly.
(x) Debt financial investments
In terms of IFRS 9, the impairment provision is calculated per exposure. The ECL measurement period of a minimum is equal to 12 months ECL of the debt financial investment. A loss allowance for lifetime ECL is required if the credit risk has increased significantly.
(xi) Off-balance sheet exposures – undrawn commitments, guarantees and letters of credit
The requirement to hold ECL on off-balance sheet financial instruments, such as undrawn commitments, guarantees and letters of credit, resulted in a requirement to hold additional credit impairment provisions.
2.1 Detailed accounting policies (continued)b) Financial instruments (continued)C: Impairment (continued)
(xii) Recognition of ECL
ECLs are recognised within the statement of financial position as follows:
(xiii) Reclassification
Reclassifications of debt financial assets are permitted when, and only when, the Bank changes its business model or managing financial assets, in which case all affected financial assets are reclassified. Reclassifications are accounted for prospectively from the date of reclassification as follows:
• Financial assets that are reclassified from amortised cost to fair value are measured at fair value at the date of reclassification with any difference in measurement basis being recognised in other gains and losses on financial instruments;
• The fair value of a financial asset that is reclassified from fair value to amortised cost becomes the financial asset’s new carrying value;
• Financial assets that are reclassified from amortised cost to fair value through OCI are measured at fair value at the date of reclassification with any difference in measurement basis being recognised in OCI;
• The fair value of a financial asset that is reclassified from fair value through OCI to amortised cost becomes the financial asset’s new carrying value with the cumulative fair value adjustment recognised in OCI being recognised against the new carrying value;
• The carrying value of financial assets that are reclassified from fair value through profit or loss to fair value through OCI remains at fair value;
• The carrying value of financial assets that are reclassified from fair value through OCI to fair value through profit or loss remains at fair value, with the cumulative fair value adjustment in OCI being recognised in the income statement at the date of reclassification.
D: Cash and cash equivalents Cash and cash equivalents comprise notes and coins on hand, unrestricted balances held with central banks and highly liquid assets with original maturities of three months or less from the acquisition date, which are subject to insignificant risk of changes in their fair value and are used by the Bank in the management of its short term commitments.
Cash and cash equivalents are carried at amortised cost in the statement of financial position.
E: Financial liabilitiesNature
Subsequent measurement
Subsequent to initial measurement, financial liabilities are classified in their respective categories and measured at either amortised cost or fair value as follows:
Financial assets measured at amortised cost (including loan commitments)
Recognised as a deduction from the gross carrying amount of the asset (group of assets). Where the impairment allowance exceeds the gross carrying amount of the asset (group of assets), the excess is recognised as a provision within other liabilities.
Off-balance sheet exposures (excluding loan commitments)
Recognised as a provision within other liabilities.
Financial assets measured at fair value through OCI
Recognised in the fair value reserve within equity. The carrying value of the financial asset is recognised in the statement of financial position at fair value.
Held-for-trading Those financial liabilities incurred principally for the purpose of repurchasing in the near term (including all derivative financial liabilities) and those that form part of a portfolio of identified financial instruments that are managed together and for which there is evidence of a recent actual pattern of short-term profit taking.
Designated at fair value through profit or loss
Financial liabilities are designated to be measured at fair value in the following instances:to eliminate or significantly reduce an accounting mismatch that would otherwise arise where the financial liabilities are managed and their performance evaluated and reported on a fair value basis where the financial liability contains one or more embedded derivatives that significantly modify the financial liability’s cash flows.
Amortised cost All other financial liabilities not included in the above categories.
Held-for-trading Fair value, with gains and losses arising from changes in fair value (including interest and dividends) recognised in trading revenue.
Designated at fair value through profit or loss
Fair value, with gains and losses arising from changes in fair value (including interest and dividends but excluding fair value gains and losses attributable to own credit risk) are recognised in net trading income as part of non-interest revenue.Fair value gains and losses attributable to changes in own credit risk are recognised within OCI, unless this would create or enlarge an accounting mismatch in which case the own credit risk changes are recognised within trading revenue.
Amortised cost Amortised cost using the effective interest method recognised in interest expense.
105STANDARD BANK (MAURITIUS) LIMITED Annual report 2020104
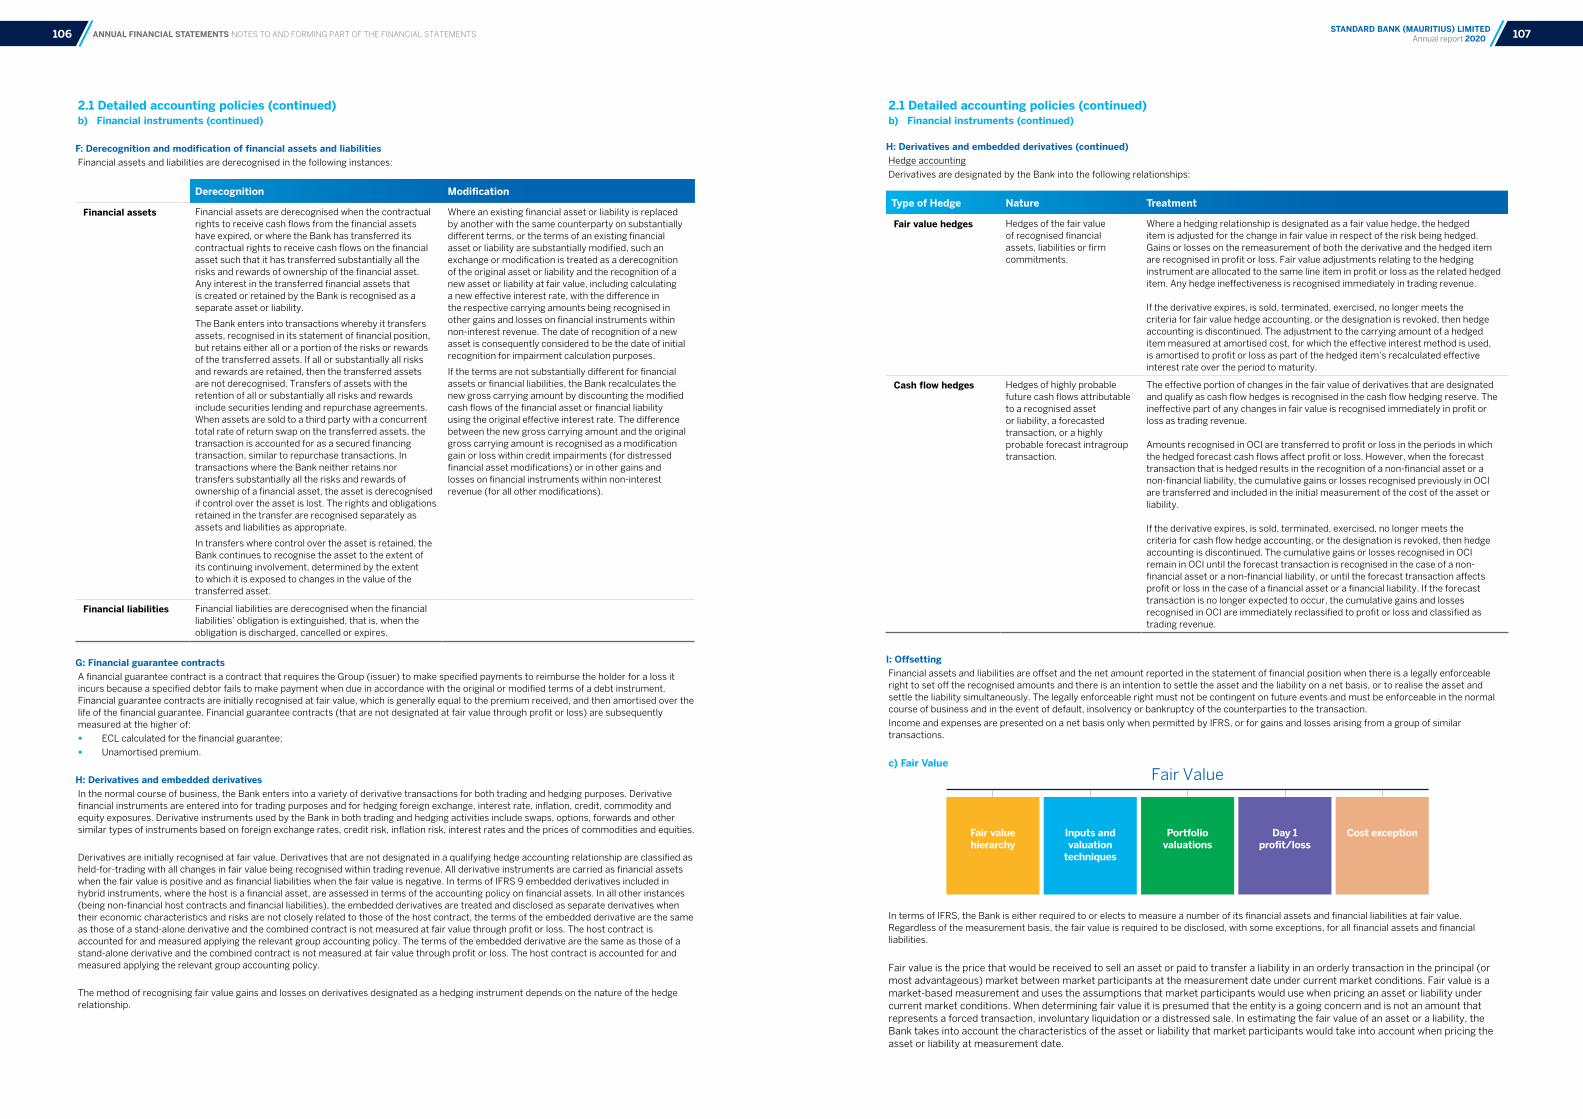
2.1 Detailed accounting policies (continued)b) Financial instruments (continued)
H: Derivatives and embedded derivatives (continued)Hedge accounting
Derivatives are designated by the Bank into the following relationships:
I: Offsetting
Financial assets and liabilities are offset and the net amount reported in the statement of financial position when there is a legally enforceable right to set off the recognised amounts and there is an intention to settle the asset and the liability on a net basis, or to realise the asset and settle the liability simultaneously. The legally enforceable right must not be contingent on future events and must be enforceable in the normal course of business and in the event of default, insolvency or bankruptcy of the counterparties to the transaction.
Income and expenses are presented on a net basis only when permitted by IFRS, or for gains and losses arising from a group of similar transactions.
c) Fair Value
In terms of IFRS, the Bank is either required to or elects to measure a number of its financial assets and financial liabilities at fair value. Regardless of the measurement basis, the fair value is required to be disclosed, with some exceptions, for all financial assets and financial liabilities.
Fair value is the price that would be received to sell an asset or paid to transfer a liability in an orderly transaction in the principal (or most advantageous) market between market participants at the measurement date under current market conditions. Fair value is a market-based measurement and uses the assumptions that market participants would use when pricing an asset or liability under current market conditions. When determining fair value it is presumed that the entity is a going concern and is not an amount that represents a forced transaction, involuntary liquidation or a distressed sale. In estimating the fair value of an asset or a liability, the Bank takes into account the characteristics of the asset or liability that market participants would take into account when pricing the asset or liability at measurement date.
Derecognition Modification
Financial assets Financial assets are derecognised when the contractual rights to receive cash flows from the financial assets have expired, or where the Bank has transferred its contractual rights to receive cash flows on the financial asset such that it has transferred substantially all the risks and rewards of ownership of the financial asset. Any interest in the transferred financial assets that is created or retained by the Bank is recognised as a separate asset or liability.
The Bank enters into transactions whereby it transfers assets, recognised in its statement of financial position, but retains either all or a portion of the risks or rewards of the transferred assets. If all or substantially all risks and rewards are retained, then the transferred assets are not derecognised. Transfers of assets with the retention of all or substantially all risks and rewards include securities lending and repurchase agreements.When assets are sold to a third party with a concurrent total rate of return swap on the transferred assets, the transaction is accounted for as a secured financing transaction, similar to repurchase transactions. In transactions where the Bank neither retains nor transfers substantially all the risks and rewards of ownership of a financial asset, the asset is derecognised if control over the asset is lost. The rights and obligations retained in the transfer are recognised separately as assets and liabilities as appropriate.
In transfers where control over the asset is retained, the Bank continues to recognise the asset to the extent of its continuing involvement, determined by the extent to which it is exposed to changes in the value of the transferred asset.
Where an existing financial asset or liability is replaced by another with the same counterparty on substantially different terms, or the terms of an existing financial asset or liability are substantially modified, such an exchange or modification is treated as a derecognition of the original asset or liability and the recognition of a new asset or liability at fair value, including calculating a new effective interest rate, with the difference in the respective carrying amounts being recognised in other gains and losses on financial instruments within non-interest revenue. The date of recognition of a new asset is consequently considered to be the date of initial recognition for impairment calculation purposes.
If the terms are not substantially different for financial assets or financial liabilities, the Bank recalculates the new gross carrying amount by discounting the modified cash flows of the financial asset or financial liability using the original effective interest rate. The difference between the new gross carrying amount and the original gross carrying amount is recognised as a modification gain or loss within credit impairments (for distressed financial asset modifications) or in other gains and losses on financial instruments within non-interest revenue (for all other modifications).
Financial liabilities Financial liabilities are derecognised when the financial liabilities’ obligation is extinguished, that is, when the obligation is discharged, cancelled or expires.
Type of Hedge Nature Treatment
Fair value hedges Hedges of the fair value of recognised financial assets, liabilities or firm commitments.
Where a hedging relationship is designated as a fair value hedge, the hedged item is adjusted for the change in fair value in respect of the risk being hedged. Gains or losses on the remeasurement of both the derivative and the hedged item are recognised in profit or loss. Fair value adjustments relating to the hedging instrument are allocated to the same line item in profit or loss as the related hedged item. Any hedge ineffectiveness is recognised immediately in trading revenue.
If the derivative expires, is sold, terminated, exercised, no longer meets the criteria for fair value hedge accounting, or the designation is revoked, then hedge accounting is discontinued. The adjustment to the carrying amount of a hedged item measured at amortised cost, for which the effective interest method is used, is amortised to profit or loss as part of the hedged item’s recalculated effective interest rate over the period to maturity.
Cash flow hedges Hedges of highly probable future cash flows attributable to a recognised asset or liability, a forecasted transaction, or a highly probable forecast intragroup transaction.
The effective portion of changes in the fair value of derivatives that are designated and qualify as cash flow hedges is recognised in the cash flow hedging reserve. The ineffective part of any changes in fair value is recognised immediately in profit or loss as trading revenue.
Amounts recognised in OCI are transferred to profit or loss in the periods in which the hedged forecast cash flows affect profit or loss. However, when the forecast transaction that is hedged results in the recognition of a non-financial asset or a non-financial liability, the cumulative gains or losses recognised previously in OCI are transferred and included in the initial measurement of the cost of the asset or liability.
If the derivative expires, is sold, terminated, exercised, no longer meets the criteria for cash flow hedge accounting, or the designation is revoked, then hedge accounting is discontinued. The cumulative gains or losses recognised in OCI remain in OCI until the forecast transaction is recognised in the case of a non-financial asset or a non-financial liability, or until the forecast transaction affects profit or loss in the case of a financial asset or a financial liability. If the forecast transaction is no longer expected to occur, the cumulative gains and losses recognised in OCI are immediately reclassified to profit or loss and classified as trading revenue.
ANNUAL FINANCIAL STATEMENTS NOTES TO AND FORMING PART OF THE FINANCIAL STATEMENTS
2.1 Detailed accounting policies (continued)b) Financial instruments (continued)
F: Derecognition and modification of financial assets and liabilitiesFinancial assets and liabilities are derecognised in the following instances:
G: Financial guarantee contractsA financial guarantee contract is a contract that requires the Group (issuer) to make specified payments to reimburse the holder for a loss it incurs because a specified debtor fails to make payment when due in accordance with the original or modified terms of a debt instrument. Financial guarantee contracts are initially recognised at fair value, which is generally equal to the premium received, and then amortised over the life of the financial guarantee. Financial guarantee contracts (that are not designated at fair value through profit or loss) are subsequently measured at the higher of:
• ECL calculated for the financial guarantee;
• Unamortised premium.
H: Derivatives and embedded derivatives In the normal course of business, the Bank enters into a variety of derivative transactions for both trading and hedging purposes. Derivative financial instruments are entered into for trading purposes and for hedging foreign exchange, interest rate, inflation, credit, commodity and equity exposures. Derivative instruments used by the Bank in both trading and hedging activities include swaps, options, forwards and other similar types of instruments based on foreign exchange rates, credit risk, inflation risk, interest rates and the prices of commodities and equities.
Derivatives are initially recognised at fair value. Derivatives that are not designated in a qualifying hedge accounting relationship are classified as held-for-trading with all changes in fair value being recognised within trading revenue. All derivative instruments are carried as financial assets when the fair value is positive and as financial liabilities when the fair value is negative. In terms of IFRS 9 embedded derivatives included in hybrid instruments, where the host is a financial asset, are assessed in terms of the accounting policy on financial assets. In all other instances (being non-financial host contracts and financial liabilities), the embedded derivatives are treated and disclosed as separate derivatives when their economic characteristics and risks are not closely related to those of the host contract, the terms of the embedded derivative are the same as those of a stand-alone derivative and the combined contract is not measured at fair value through profit or loss. The host contract is accounted for and measured applying the relevant group accounting policy. The terms of the embedded derivative are the same as those of a stand-alone derivative and the combined contract is not measured at fair value through profit or loss. The host contract is accounted for and measured applying the relevant group accounting policy.
The method of recognising fair value gains and losses on derivatives designated as a hedging instrument depends on the nature of the hedge relationship.
Fair value hierarchy
Inputs and valuation
techniques
Portfolio valuations
Day 1profit/loss
Cost exception
Fair Value
107STANDARD BANK (MAURITIUS) LIMITED Annual report 2020106

2.1 Detailed accounting policies (continued)c) Fair Value (continued) Inputs and valuation techniques (continued)
Portfolio valuations
The Bank has elected the portfolio exception to measure the fair value of certain groups of financial assets and financial liabilities. This exception permits the group of financial assets and financial liabilities to be measured at fair value on a net basis, with the net fair value being allocated to the financial assets and financial liabilities.
Day one profit or loss
For financial instruments, where the fair value of the financial instrument differs from the transaction price, the difference is commonly referred to as day one profit or loss. Day one profit or loss is recognised in profit or loss immediately where the fair value of the financial instrument is either evidenced by comparison with other observable current market transactions in the same instrument or is determined using valuation models with only observable market data as inputs. Day one profit or loss is deferred where the fair value of the financial instrument is not able to be evidenced by comparison with other observable current market transactions in the same instrument or is determined using valuation models that utilise non-observable market data as inputs.
The timing of the recognition of deferred day one profit or loss is determined individually depending on the nature of the instrument and availability of market observable inputs. It is either amortised over the life of the transaction, deferred until the instrument’s fair value can be determined using market observable inputs, or realised through settlement.
Item Description Valuation techniqueMain inputs and assumptions, (Levels 2 and 3 fair value hierarchy items)
Loans and advances to banks and customers
Loans and advances comprise: Loans and advances to banks: call loans, loans granted under resale agreements and balances held with other banks. Loans and advances to customers, other asset-based loans and other secured and unsecured loans, overdrafts, other demand lending, term lending).
For certain loans fair value may be determined from the market price of a recently occurring transaction adjusted for changes in risks and information between the transaction and valuation dates. Loans and advances are reviewed for observed and verified changes in credit risk and the credit spread is adjusted at subsequent dates if there has been an observable change in credit risk relating to a particular loan or advance. In the absence of an observable market for these instruments, discounted cash flow models are used to determine fair value. Discounted cash flow models incorporate parameter inputs for interest rate risk, foreign exchange risk, liquidity and credit risk, as appropriate. For credit risk, probability of default and loss given default parameters are determined using credit default swaps (CDS) markets, where available and appropriate, as well as the relevant terms of the loan and loan counterparty such as the industry classification and subordination of the loan.
For levels 2 and 3 fair value hierarchy items:
• discount rate*
Deposits and debt funding
Deposits from banks and customers comprise amounts owed to banks and customers.
For certain deposits, fair value may be determined from the market price on a recently occurring transaction adjusted for all changes in risks and information between the transaction and valuation dates. In the absence of an observable market for these instruments discounted cash flow models are used to determine fair value based on the contractual cash flows related to the instrument. The fair value measurement incorporates all market risk factors including a measure of the Bank’s credit risk relevant for that financial liability. The market risk parameters are valued consistently to similar instruments held as assets stated in the section above.
For levels 2 and 3 fair value hierarchy items:
• discount rate*
* Discount rates, where applicable, include the risk-free rate, risk premiums, liquidity spreads, credit risk (own and counterparty as appropriate), timing of settlement, storage/service costs, prepayment and surrender risk assumptions and recovery rates/loss given default.Item and Description Valuation Technique Main Inputs and
Assumptions
Derivative financial instrumentsDerivative financial instruments comprise foreign exchange and interest rate derivatives that are either held-for-trading or designated as hedging instruments in hedge relationships.
Standard derivative contracts are valued using market accepted models and quoted parameter inputs. More complex derivative contracts are modelled using more sophisticated modelling techniques applicable to the instrument.
Techniques include discounted cash flow model.
For levels 2 and 3 fair value hierarchy items:
• discount rate*
• spot prices of the underlying
• correlation factors
• volatilities
• dividend yields
• earnings yield
• valuation multiples.
Trading assets and trading liabilitiesTrading assets and liabilities comprise instruments which are part of the Bank’s underlying trading activities. These instruments primarily include sovereign and corporate debt.
Where there are no recent market transactions in the specific instrument, fair value is derived from the last available market price adjusted for changes in risks and information since that date. Where a proxy instrument is quoted in an active market, the fair value is determined by adjusting the proxy fair value for differences between the proxy instrument and the financial investment being fair valued. Where proxies are not available, the fair value is estimated using more complex modelling techniques. These techniques include discounted cash flow and Black-Scholes models using current market rates for credit, interest, liquidity, volatility and other risks. Combination techniques are used to value unlisted equity securities and include inputs such as earnings and dividend yields of the underlying entity.
Financial investmentsFinancial investments are non-trading financial assets and primarily comprise of sovereign debt.
ANNUAL FINANCIAL STATEMENTS NOTES TO AND FORMING PART OF THE FINANCIAL STATEMENTS
2.1 Detailed accounting policies (continued)c) Fair Value (continued)
Fair value hierarchy
The Bank’s financial instruments that are both carried at fair value and for which fair value is disclosed are categorised by level of fair value hierarchy. The different levels are based on the degree to which the inputs to the fair value measurements are observable and the significance of the inputs to the fair value measurement.
Hierarchy levels
The levels have been defined as follows:
Hierarchy transfer policy
Transfers of financial assets and financial liabilities between levels of the fair value hierarchy are deemed to have occurred at the end of the reporting period.
Inputs and valuation techniques
Fair value is measured based on quoted market prices or dealer price quotations for identical assets and liabilities that are traded in active markets, which can be accessed at the measurement date, and where those quoted prices represent fair value. If the market for an asset or liability is not active or the instrument is not quoted in an active market, the fair value is determined using other applicable valuation techniques that maximise the use of relevant observable inputs and minimise the use of unobservable inputs. These include the use of recent arm’s length transactions, discounted cash flow analyses, pricing models and other valuation techniques commonly used by market participants.
Fair value measurements are categorised into level 1, 2 or 3 within the fair value hierarchy based on the degree to which the inputs to the fair value measurements are observable and the significance of the inputs to the fair value measurement.
Where discounted cash flow analysis are used, estimated future cash flows are based on management’s best estimates and a market related discount rate at the reporting date for an asset or liability with similar terms and conditions.
If an asset or a liability measured at fair value has both a bid and an ask price, the price within the bid-ask spread that is most representative of fair value is used to measure fair value.
The Bank’s valuation control framework governs internal control standards, methodologies and procedures over its valuation processes, which include the following valuation techniques and main inputs and assumptions per type of instrument.
Level 1 Fair value is based on quoted market prices (unadjusted) in active markets for an identical financial asset or liability. An active market is a market in which transactions for the asset or liability take place with sufficient frequency and volume to provide pricing information on an ongoing basis.
Level 2 Fair value is determined through valuation techniques based on observable inputs, either directly, such as quoted prices, or indirectly, such as those derived from quoted prices. This category includes instruments valued using quoted market prices in active markets for similar instruments, quoted prices for identical or similar instruments in markets that are considered less than active or other valuation techniques where all significant inputs are directly or indirectly observable from market data.
Level 3 Fair value is determined through valuation techniques using significant unobservable inputs. This category includes all instruments where the valuation technique includes inputs not based on observable data and the unobservable inputs have a significant effect on the instrument’s valuation. This category includes instruments that are valued based on quoted prices for similar instruments where significant unobservable adjustments or assumptions are required to reflect differences between the instrument being valued and the similar instrument.
109STANDARD BANK (MAURITIUS) LIMITED Annual report 2020108

Type and Initial and Subsequent measurement
Useful lives, depreciation/amortisation method or fair value basis Impairment
Tangible assets (equipment, furniture and motor vehicles)
Equipment, furniture and fittings and motor
vehicles are measured at cost less accumulated
depreciation and accumulated impairment losses.
Cost includes expenditure that is directly
attributable to the acquisition of the asset.
Costs that are subsequently incurred are included
in the asset’s related carrying amount or are
recognised as a separate asset, as appropriate,
only when it is probable that future economic
benefits will flow to the Bank and the cost of the
item can be measured reliably.
Expenditure, which does not meet these criteria, is
recognised in operating expenses as incurred.
Where significant parts of an item of property or
equipment have different useful lives, they are
accounted for as separate major components of
property and equipment.
Property and equipment are depreciated on the
straight-line basis over estimated useful lives (see
below) of the assets to their residual values.
Computer equipment 3-5 years
Office equipment 5-10 years
Furniture & fittings 5-13 years
Motor Vehicles 4-5 years
The residual values, useful lives and the depreciation
method applied are reviewed, and adjusted if
appropriate, at each financial year end.
These assets are reviewed for impairment at each
reporting date and tested for impairment whenever
events or changes in circumstances indicate that the
carrying amount may not be recoverable.
An impairment loss is recognised in non-trading and
capital related items for the amount by which the asset’s
carrying amount exceeds its recoverable amount. The
recoverable amount is determined as the higher of an
asset’s fair value less costs to sell and value in use.
Fair value less costs to sell is determined by ascertaining
the current market value of an asset and deducting any
costs related to the realisation of the asset.
In assessing value in use, the estimated future cash
flows are discounted to their present value using a
pre-tax discount rate that reflects current market
assessments of the time value of money and the risks
specific to the asset.
For the purposes of assessing impairment, assets that
cannot be tested individually are grouped at the lowest
level for which there are separately identifiable cash
inflows from continuing use cash generating units
(CGUs).
Impairment losses recognised in respect of CGUs are
allocated first to reduce the carrying amount of any
goodwill allocated to the CGU, and then to reduce the
carrying amounts of the other assets in the CGU on a
pro rata basis. The carrying amount of these other
assets may, however, not be reduced below the higher of
the CGU’s fair value less costs to sell and its value in use.
Impairment losses recognised in prior periods are
assessed at each reporting date for any indications that
the loss has decreased or no longer exists. An
impairment loss is reversed if there has been a change in
the estimates used to determine the recoverable
amount. An impairment loss is reversed through
non-trading and capital related items only to the extent
that the asset’s carrying amount does not exceed the
carrying amount that would have been determined, net
of depreciation or amortisation, if no impairment loss
had been recognised.
Intangible assets (Computer software and other intangible assets)
Costs associated with developing or maintaining
computer software programmes and the
acquisition of software licences are generally
recognised as an expense as incurred.
However, direct computer software development
costs that are clearly associated with an
identifiable and unique system, which will be
controlled by the group and have a probable future
economic benefit beyond one year, are recognised
as intangible assets.
Intangible assets are carried at cost less
accumulated amortisation and accumulated
impairment losses from the date that the assets
are available for use. Expenditure subsequently
incurred on computer software is capitalised only
when it increases the future economic benefits
embodied in the specific asset to which it relates.
Amortisation is recognised in operating expenses
on a straight-line basis at rates appropriate to the
expected lives of the assets (2 to 15 years) from the
date that the asset is available for use.
Amortisation methods, useful lives and residual
values are reviewed at each financial year end and
adjusted, if necessary.
Intangible assets that have an indefinite useful life are
tested annually for impairment and additionally when an
indicator of impairment exists.
The accounting treatment for computer software and
other intangible assets is otherwise the same as for
tangible assets.
ANNUAL FINANCIAL STATEMENTS NOTES TO AND FORMING PART OF THE FINANCIAL STATEMENTS
2.1 Detailed accounting policies (continued)d) Employee Benefits The Bank operates a defined contribution plan
A defined contribution plan is a pension plan under which the Bank pays fixed contributions into a separate entity. The Bank provides retirement benefits for its employees through a defined contribution plan which is funded by contributions from the Bank. Under the defined contribution plan, the Bank has no legal or constructive obligation to contribute further to what has been contributed into the fund as defined in the rules of the scheme. Pension contributions are charged to the profit or loss in the year to which they relate. The Bank has an obligation under the current labour laws to pay a severance allowance on retirement of its employees and is allowed to deduct from this severance allowance up to five times the amount of any annual pension granted at retirement age from the said fund.
The present value of the severance allowance payable under the Workers’ Rights Act 2019 is calculated annually by independent actuaries using the projected unit credit method. The present value of the severance allowance is determined by the estimated future cash outflows using a discount rate by reference to current interest rates and the yield on bonds and treasury bills and recent corporate debenture issues. Where the present value of the severance allowance payable on retirement is greater than five years of pension payable under the pension plan, the additional severance allowance payable is recognised as a liability and disclosed as unfunded obligations under retirement benefits obligations.
State pension plan
Contributions to the National Pension Scheme (replaced by the ‘Contribution Sociale Generalisée’ scheme are recognised in profit or loss in the period in which they fall due.
Short-term employee benefits
Short-term employee benefit obligations are measured on an undiscounted basis and are expensed as the related service is provided. A liability is recognised for the amount expected to be paid under short-term cash bonus or profit sharing plans if the Bank has a present legal or constructive obligation to pay this amount as a result of past service provided by the employee and the obligation can be estimated reliably.
Termination benefits
Termination benefits are recognised when the Bank is committed, without realistic possibility of withdrawal, to a formal detailed plan to terminate employment before the normal retirement date, or to provide termination benefits as a result of an offer made to encourage voluntary redundancy when it is probable that the offer will be accepted, and the number of acceptances can be estimated reliably. A liability is recognised for the termination benefit representing the best estimate of the amount payable and the termination benefits are recognised as an expense.
e) Non-financial assets (Intangible assets and Property and equipment)
2.1 Detailed accounting policies (continued)e) Non-financial assets (Intangible assets and Property and equipment) (continued)
Derecognition
Non-financial assets are derecognised on disposal or when no future economic benefits are expected from their use or disposal. The gain or loss on derecognition is recognised in profit or loss and is determined as the difference between the net disposal proceeds and the carrying amount of the non-financial asset.
Tangible Assets Intangible Assets
Non-Financial Assets
Equipment
Furniture and Fittings
Motor Vehicles
Computer Software
Other Intangible Assets
111STANDARD BANK (MAURITIUS) LIMITED Annual report 2020110
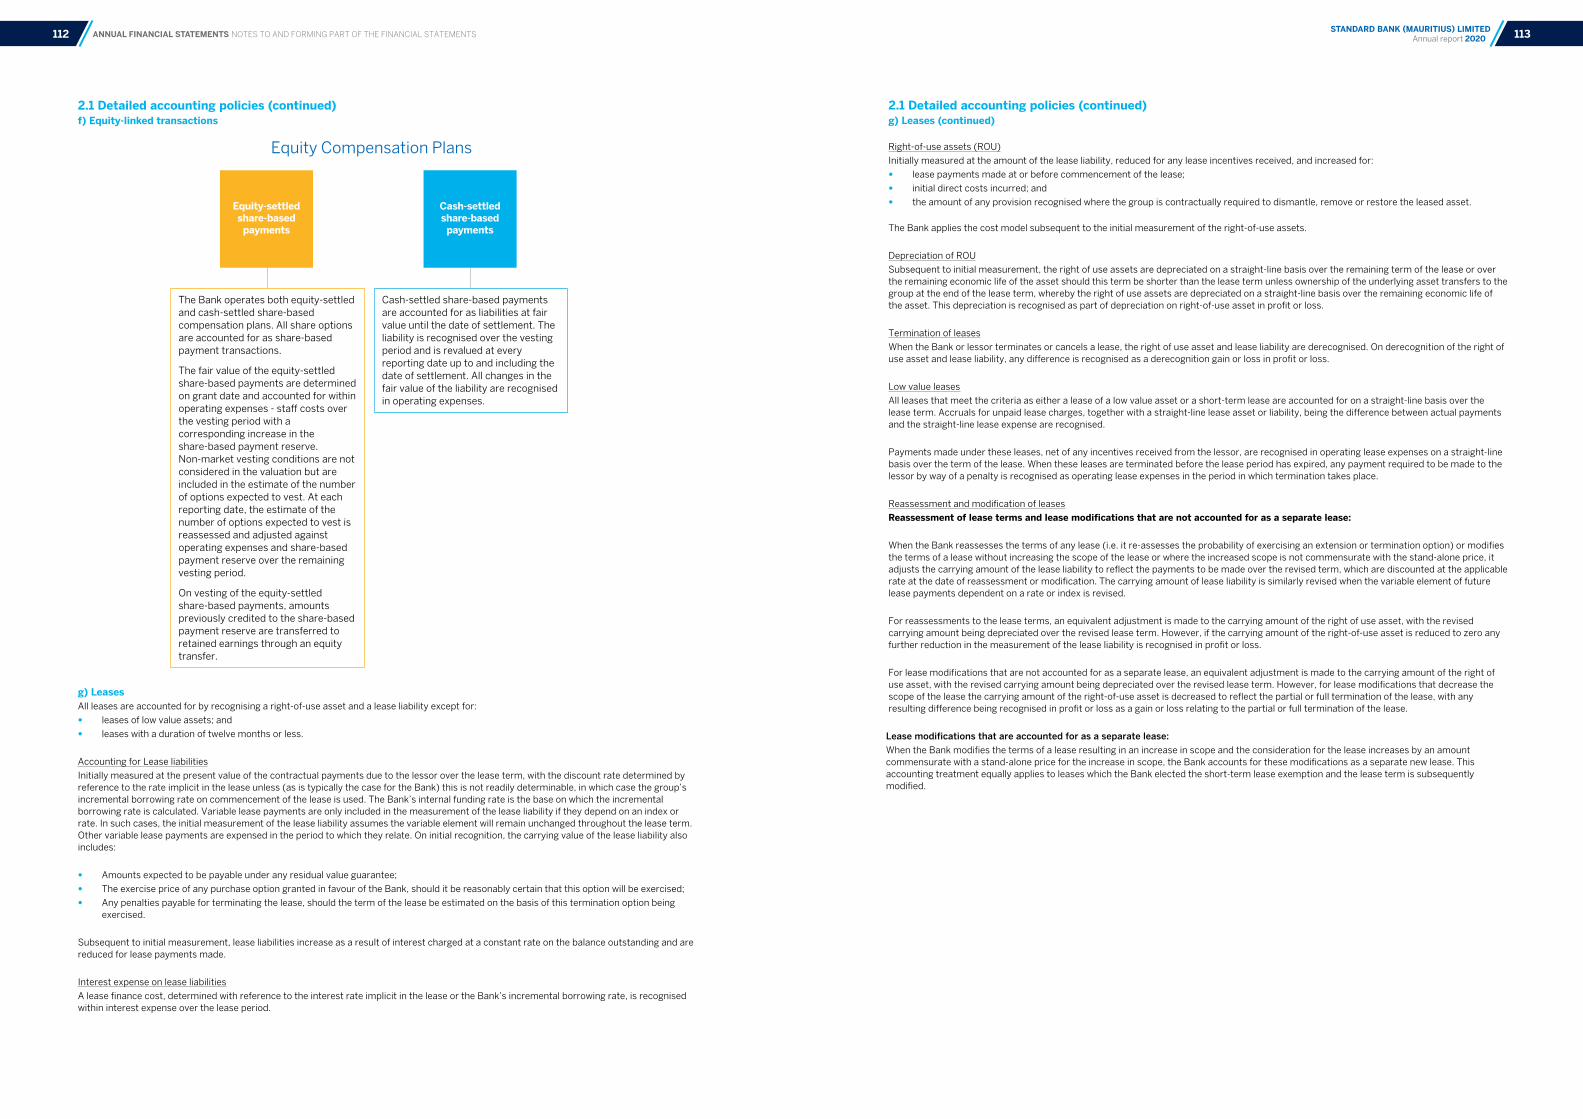
ANNUAL FINANCIAL STATEMENTS NOTES TO AND FORMING PART OF THE FINANCIAL STATEMENTS
Equity-settled share-based
payments
Cash-settled share-based
payments
Equity Compensation Plans
The Bank operates both equity-settled and cash-settled share-based compensation plans. All share options are accounted for as share-based payment transactions.
The fair value of the equity-settled share-based payments are determined on grant date and accounted for within operating expenses - staff costs over the vesting period with a corresponding increase in the share-based payment reserve. Non-market vesting conditions are not considered in the valuation but are included in the estimate of the number of options expected to vest. At each reporting date, the estimate of the number of options expected to vest is reassessed and adjusted against operating expenses and share-based payment reserve over the remaining vesting period.
On vesting of the equity-settled share-based payments, amounts previously credited to the share-based payment reserve are transferred to retained earnings through an equity transfer.
Cash-settled share-based payments are accounted for as liabilities at fair value until the date of settlement. The liability is recognised over the vesting period and is revalued at every reporting date up to and including the date of settlement. All changes in the fair value of the liability are recognised in operating expenses.
g) Leases All leases are accounted for by recognising a right-of-use asset and a lease liability except for:
• leases of low value assets; and
• leases with a duration of twelve months or less.
Accounting for Lease liabilities
Initially measured at the present value of the contractual payments due to the lessor over the lease term, with the discount rate determined by reference to the rate implicit in the lease unless (as is typically the case for the Bank) this is not readily determinable, in which case the group’s incremental borrowing rate on commencement of the lease is used. The Bank’s internal funding rate is the base on which the incremental borrowing rate is calculated. Variable lease payments are only included in the measurement of the lease liability if they depend on an index or rate. In such cases, the initial measurement of the lease liability assumes the variable element will remain unchanged throughout the lease term. Other variable lease payments are expensed in the period to which they relate. On initial recognition, the carrying value of the lease liability also includes:
• Amounts expected to be payable under any residual value guarantee;
• The exercise price of any purchase option granted in favour of the Bank, should it be reasonably certain that this option will be exercised;
• Any penalties payable for terminating the lease, should the term of the lease be estimated on the basis of this termination option being exercised.
Subsequent to initial measurement, lease liabilities increase as a result of interest charged at a constant rate on the balance outstanding and are reduced for lease payments made.
Interest expense on lease liabilities
A lease finance cost, determined with reference to the interest rate implicit in the lease or the Bank’s incremental borrowing rate, is recognised within interest expense over the lease period.
2.1 Detailed accounting policies (continued)g) Leases (continued)
Right-of-use assets (ROU)
Initially measured at the amount of the lease liability, reduced for any lease incentives received, and increased for:
• lease payments made at or before commencement of the lease;
• initial direct costs incurred; and
• the amount of any provision recognised where the group is contractually required to dismantle, remove or restore the leased asset.
The Bank applies the cost model subsequent to the initial measurement of the right-of-use assets.
Depreciation of ROU
Subsequent to initial measurement, the right of use assets are depreciated on a straight-line basis over the remaining term of the lease or over the remaining economic life of the asset should this term be shorter than the lease term unless ownership of the underlying asset transfers to the group at the end of the lease term, whereby the right of use assets are depreciated on a straight-line basis over the remaining economic life of the asset. This depreciation is recognised as part of depreciation on right-of-use asset in profit or loss.
Termination of leases
When the Bank or lessor terminates or cancels a lease, the right of use asset and lease liability are derecognised. On derecognition of the right of use asset and lease liability, any difference is recognised as a derecognition gain or loss in profit or loss.
Low value leases
All leases that meet the criteria as either a lease of a low value asset or a short-term lease are accounted for on a straight-line basis over the lease term. Accruals for unpaid lease charges, together with a straight-line lease asset or liability, being the difference between actual payments and the straight-line lease expense are recognised.
Payments made under these leases, net of any incentives received from the lessor, are recognised in operating lease expenses on a straight-line basis over the term of the lease. When these leases are terminated before the lease period has expired, any payment required to be made to the lessor by way of a penalty is recognised as operating lease expenses in the period in which termination takes place.
Reassessment and modification of leases
Reassessment of lease terms and lease modifications that are not accounted for as a separate lease:
When the Bank reassesses the terms of any lease (i.e. it re-assesses the probability of exercising an extension or termination option) or modifies the terms of a lease without increasing the scope of the lease or where the increased scope is not commensurate with the stand-alone price, it adjusts the carrying amount of the lease liability to reflect the payments to be made over the revised term, which are discounted at the applicable rate at the date of reassessment or modification. The carrying amount of lease liability is similarly revised when the variable element of future lease payments dependent on a rate or index is revised.
For reassessments to the lease terms, an equivalent adjustment is made to the carrying amount of the right of use asset, with the revised carrying amount being depreciated over the revised lease term. However, if the carrying amount of the right-of-use asset is reduced to zero any further reduction in the measurement of the lease liability is recognised in profit or loss.
For lease modifications that are not accounted for as a separate lease, an equivalent adjustment is made to the carrying amount of the right of use asset, with the revised carrying amount being depreciated over the revised lease term. However, for lease modifications that decrease the scope of the lease the carrying amount of the right-of-use asset is decreased to reflect the partial or full termination of the lease, with any resulting difference being recognised in profit or loss as a gain or loss relating to the partial or full termination of the lease.
Lease modifications that are accounted for as a separate lease:
When the Bank modifies the terms of a lease resulting in an increase in scope and the consideration for the lease increases by an amount commensurate with a stand-alone price for the increase in scope, the Bank accounts for these modifications as a separate new lease. This accounting treatment equally applies to leases which the Bank elected the short-term lease exemption and the lease term is subsequently modified.
2.1 Detailed accounting policies (continued)f) Equity-linked transactions
113STANDARD BANK (MAURITIUS) LIMITED Annual report 2020112
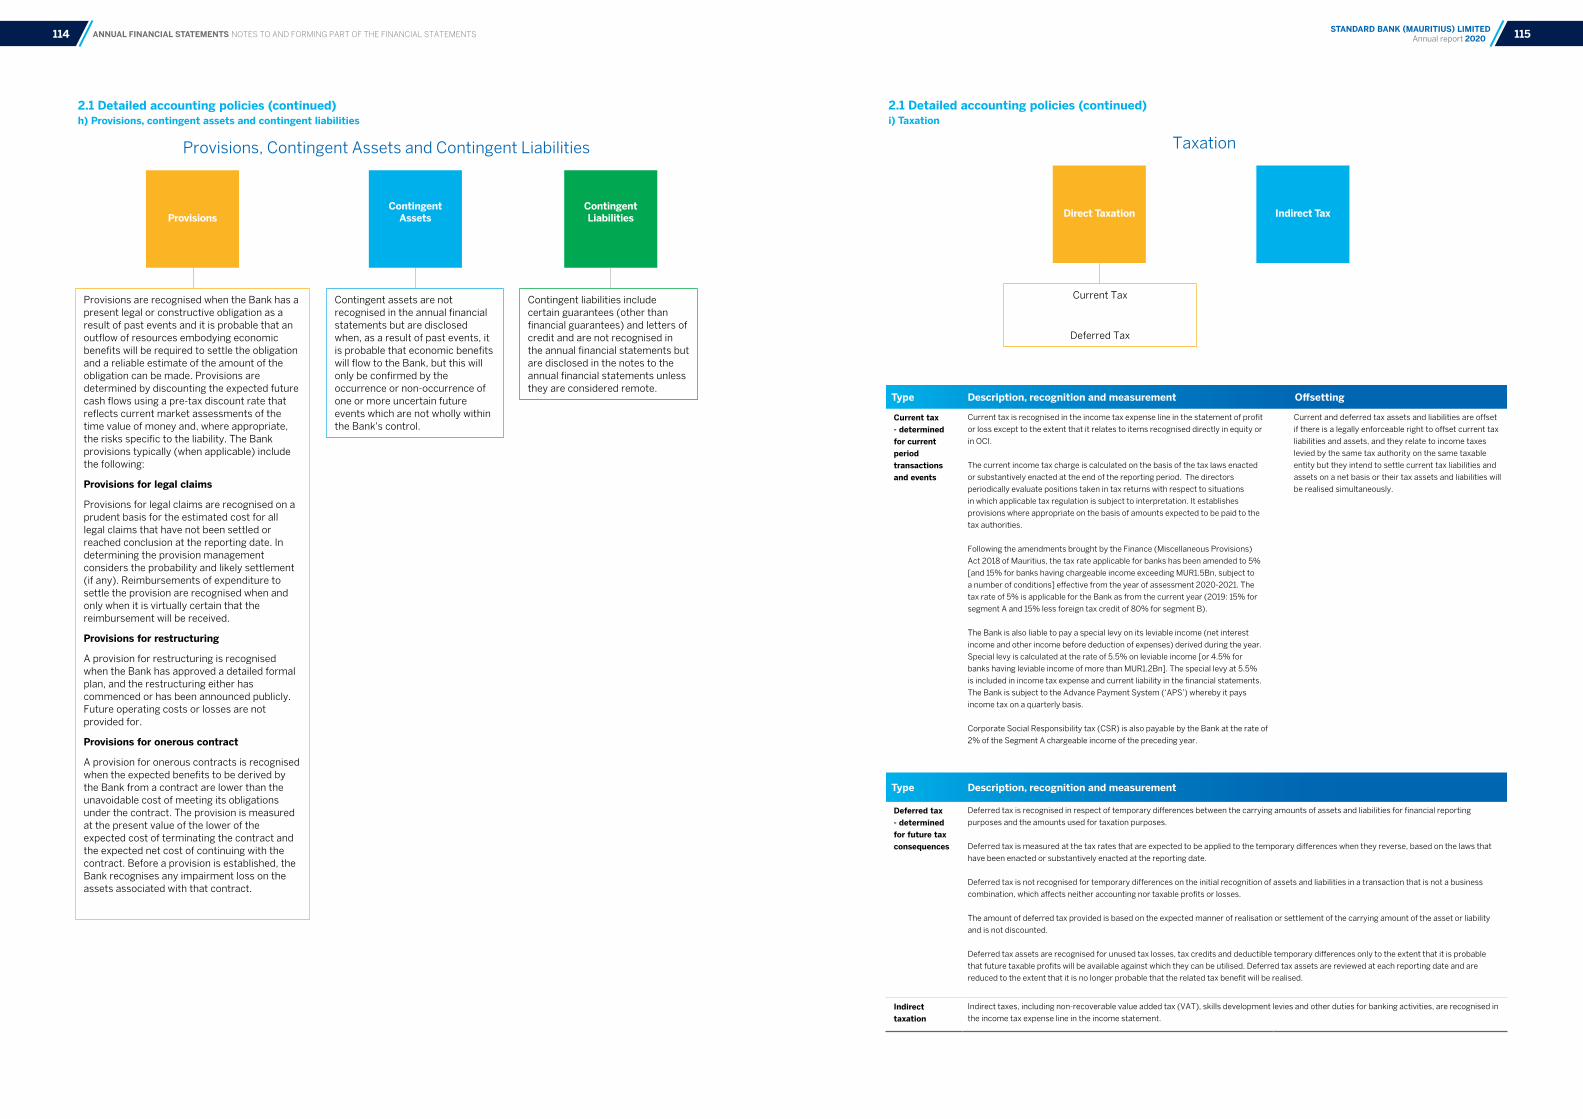
ANNUAL FINANCIAL STATEMENTS NOTES TO AND FORMING PART OF THE FINANCIAL STATEMENTS
ProvisionsContingent
Assets
Provisions, Contingent Assets and Contingent Liabilities
Provisions are recognised when the Bank has a present legal or constructive obligation as a result of past events and it is probable that an outflow of resources embodying economic benefits will be required to settle the obligation and a reliable estimate of the amount of the obligation can be made. Provisions are determined by discounting the expected future cash flows using a pre-tax discount rate that reflects current market assessments of the time value of money and, where appropriate, the risks specific to the liability. The Bank provisions typically (when applicable) include the following:
Provisions for legal claims
Provisions for legal claims are recognised on a prudent basis for the estimated cost for all legal claims that have not been settled or reached conclusion at the reporting date. In determining the provision management considers the probability and likely settlement (if any). Reimbursements of expenditure to settle the provision are recognised when and only when it is virtually certain that the reimbursement will be received.
Provisions for restructuring
A provision for restructuring is recognised when the Bank has approved a detailed formal plan, and the restructuring either has commenced or has been announced publicly. Future operating costs or losses are not provided for.
Provisions for onerous contract
A provision for onerous contracts is recognised when the expected benefits to be derived by the Bank from a contract are lower than the unavoidable cost of meeting its obligations under the contract. The provision is measured at the present value of the lower of the expected cost of terminating the contract and the expected net cost of continuing with the contract. Before a provision is established, the Bank recognises any impairment loss on the assets associated with that contract.
Contingent assets are not recognised in the annual financial statements but are disclosed when, as a result of past events, it is probable that economic benefits will flow to the Bank, but this will only be confirmed by the occurrence or non-occurrence of one or more uncertain future events which are not wholly within the Bank's control.
Contingent liabilities include certain guarantees (other than financial guarantees) and letters of credit and are not recognised in the annual financial statements but are disclosed in the notes to the annual financial statements unless they are considered remote.
2.1 Detailed accounting policies (continued)i) Taxation
2.1 Detailed accounting policies (continued)h) Provisions, contingent assets and contingent liabilities
Contingent Liabilities Direct Taxation Indirect Tax
Taxation
Current Tax
Deferred Tax
Type Description, recognition and measurement Offsetting
Current tax - determined for current period transactions and events
Current tax is recognised in the income tax expense line in the statement of profit
or loss except to the extent that it relates to items recognised directly in equity or
in OCI.
The current income tax charge is calculated on the basis of the tax laws enacted
or substantively enacted at the end of the reporting period. The directors
periodically evaluate positions taken in tax returns with respect to situations
in which applicable tax regulation is subject to interpretation. It establishes
provisions where appropriate on the basis of amounts expected to be paid to the
tax authorities.
Following the amendments brought by the Finance (Miscellaneous Provisions)
Act 2018 of Mauritius, the tax rate applicable for banks has been amended to 5%
[and 15% for banks having chargeable income exceeding MUR1.5Bn, subject to
a number of conditions] effective from the year of assessment 2020-2021. The
tax rate of 5% is applicable for the Bank as from the current year (2019: 15% for
segment A and 15% less foreign tax credit of 80% for segment B).
The Bank is also liable to pay a special levy on its leviable income (net interest
income and other income before deduction of expenses) derived during the year.
Special levy is calculated at the rate of 5.5% on leviable income [or 4.5% for
banks having leviable income of more than MUR1.2Bn]. The special levy at 5.5%
is included in income tax expense and current liability in the financial statements.
The Bank is subject to the Advance Payment System (‘APS’) whereby it pays
income tax on a quarterly basis.
Corporate Social Responsibility tax (CSR) is also payable by the Bank at the rate of
2% of the Segment A chargeable income of the preceding year.
Current and deferred tax assets and liabilities are offset
if there is a legally enforceable right to offset current tax
liabilities and assets, and they relate to income taxes
levied by the same tax authority on the same taxable
entity but they intend to settle current tax liabilities and
assets on a net basis or their tax assets and liabilities will
be realised simultaneously.
Type Description, recognition and measurement
Deferred tax - determined for future tax consequences
Deferred tax is recognised in respect of temporary differences between the carrying amounts of assets and liabilities for financial reporting
purposes and the amounts used for taxation purposes.
Deferred tax is measured at the tax rates that are expected to be applied to the temporary differences when they reverse, based on the laws that
have been enacted or substantively enacted at the reporting date.
Deferred tax is not recognised for temporary differences on the initial recognition of assets and liabilities in a transaction that is not a business
combination, which affects neither accounting nor taxable profits or losses.
The amount of deferred tax provided is based on the expected manner of realisation or settlement of the carrying amount of the asset or liability
and is not discounted.
Deferred tax assets are recognised for unused tax losses, tax credits and deductible temporary differences only to the extent that it is probable
that future taxable profits will be available against which they can be utilised. Deferred tax assets are reviewed at each reporting date and are
reduced to the extent that it is no longer probable that the related tax benefit will be realised.
Indirect taxation
Indirect taxes, including non-recoverable value added tax (VAT), skills development levies and other duties for banking activities, are recognised in
the income tax expense line in the income statement.
115STANDARD BANK (MAURITIUS) LIMITED Annual report 2020114

ANNUAL FINANCIAL STATEMENTS NOTES TO AND FORMING PART OF THE FINANCIAL STATEMENTS
Banking Activities
Revenue and Expenditure
Net Interest Income
Non-Interest Revenue
• Net fee and commission revenue
• Net trading income
• Net income from other financial instruments at FVTPL/OCI
• Other operating income
2.1 Detailed accounting policies (continued)k) Other significant accounting policies
l) New standards and interpretations not yet effective
Certain new accounting standards and interpretations have been published that are not mandatory for 31 December 2020 reporting periods and have not been early adopted by the Bank. Those Standards are not expected to have a material impact on the entity in the current or future reporting periods and on foreseeable future transactions.
2.1 Detailed accounting policies (continued)j) Revenue and Expenditure
Other Significant Accounting Policies
Segment Reporting A segment is a distinguishable component of the Bank that is engaged either in providing products or services (business segment), or in
providing products or services within a particular economic environment (geographical segment), which is subject to risks and rewards that
are different from those of other segments.
In accordance with the Bank of Mauritius Guideline on Segmental Reporting under a Single Banking Licence Regime, the Bank is required to
split into Segment A and Segment B.
• Segment B is essentially directed to the provision of international financial services that give rise to foreign source income. Such services
may be fund-based or non-fund based; and
• Segment A relates to banking business other than Segment B business.
Neither these guidelines nor IFRS mandate the application of IFRS 8 Operating segments to the financial statements of the Bank.
Statutory credit Reserve
Statutory requirements (one percent of the aggregate amount of portfolio assessed loans) that exceed the amounts to be provided under IFRS
9 are dealt with in the statutory credit reserve as an appropriation of retained earnings.
Statutory reserve represents accumulated transfers from retained earnings in accordance with local banking legislation. Those reserves are
not redistributable.
Related Parties For the purposes of these financial statements, parties are considered to be related to the Bank where:
(a) A person or a close member of that person's family is related to the Bank if that person
(i) has control or joint control over the Bank;
(ii) has significant influence over the Bank; or
(iii) is a member of the key management personnel of the Bank or of a parent of the Bank.
(b) An entity is related to the Bank if any of the following conditions applies:
(i) The entity and the Bank are members of the same group (which means that each parent, subsidiary and fellow subsidiary is related
to the others).
(ii) One entity is an associate or joint venture of the other entity (or an associate or joint venture of a member of a group of which the
other entity is a member).
(iii) Both entities are joint ventures of the same third party.
(iv) One entity is a joint venture of a third entity and the other entity is an associate of the third entity.
(v) The entity is a post-employment defined benefit plan for the benefit of employees of either the Bank or an entity related to the Bank.
If the Bank holds such a plan, the sponsoring employers are also related to the Bank.
(vi) The entity is controlled or jointly controlled by a person identified in (a).
(vii) A person identified in (a)(i) has significant influence over the entity or is a member of the key management personnel of the entity (or
of a parent of the entity).
(viii) The entity, or any member of a group of which it is a part, provides key management personnel services to the Bank or to the parent
of the Bank.
Comparatives Except when a standard or an interpretation permits or requires otherwise, all amounts are reported or disclosed when comparative
information. When IAS 8 applies, comparative figures have been adjusted to conform with changes in presentation in the current year.
Type Description Recognition and Measurement
Bank
Activities
Net Interest Income
Interest income and expense are recognised in net interest income using the effective interest method for all interest-bearing
financial instruments.
In terms of the effective interest method, interest is recognised at a rate that exactly discounts estimated future cash payments or
receipts through the expected life of the financial instrument or, where appropriate, a shorter period, to the net carrying amount of
the financial asset or financial liability. Direct incremental transaction costs incurred and origination fees received, including loan
commitment fees, as a result of bringing margin-yielding assets or liabilities into the statement of financial position, are capitalised to
the carrying amount of financial instruments that are not at fair value through profit or loss and amortised as interest income or
expense over the life of the asset or liability as part of the effective interest rate.
Where the estimates of payments or receipts on financial assets or financial liabilities are subsequently revised, the carrying amount
of the financial asset or financial liability is adjusted to reflect actual and revised estimated cash flows. The carrying amount is
calculated by computing the present value of the adjusted cash flows at the financial asset or financial liability’s original effective
interest rate. Any adjustment to the carrying value is recognised in net interest income.
When a financial asset is classified as specifically impaired interest income is calculated on the impaired value (gross carrying
amount less specific impairment) based on the original effective interest rate. The contractual interest income on the gross exposure
is suspended and is only recognised in interest income and other when the financial asset is reclassified out of Stage 3.
Net Fee and Commission Revenue
Fee and commission revenue, including transactional fees, account servicing fees, investment management fees, sales commissions
and placement fees are recognised as the related services are performed. Loan commitment fees for loans that are not expected to
be drawn down are recognised on a straight-line basis over the commitment period.
Loan syndication fees, where the Bank does not participate in the syndication or participates at the same effective interest rate for
comparable risk as other participants, are recognised as revenue when the syndication has been completed. Syndication fees that do
not meet these criteria are capitalised as origination fees and amortised to the statement of profit and loss as interest income.
The fair value of issued financial guarantee contracts on initial recognition is amortised as income over the term of the contract.
Fee and commission expenses, included in net fee and commission revenue, are mainly transaction and service fees relating to
financial instruments, which are expensed as the services are received. Expenditure is presented as fee and commission expenses
where the expenditure is linked to the production of fee and commission revenue.
Net Trading Income
Trading revenue comprises all gains and losses from changes in the fair value of trading assets and liabilities, together with related
interest income, expense and dividends.
Net Income from other financial instruments carried at fair value
Net Income from other financial instruments carried at fair value includes:
Fair value gains and losses on debt financial assets that are at fair value through profit or loss.
The gain or loss on the derecognition of a debt financial asset classified as at fair value through OCI.
Gains and losses arising from the derecognition of financial assets and financial liabilities classified as at amortised cost.
Gains and losses arising from the reclassification of a financial asset from amortised cost to fair value.
Gains and losses arising from the modification of a financial asset (which is not distressed) and financial liability as at amortised cost.
Fair value gains and losses on designated financial liabilities.
Other Operating Income
Other operating income comprises of expenses recharged to Standard Bank Trust.
Segment Reporting
Statutory Credit Risk
Reserve
Related Party
117STANDARD BANK (MAURITIUS) LIMITED Annual report 2020116

ANNUAL FINANCIAL STATEMENTS NOTES TO AND FORMING PART OF THE FINANCIAL STATEMENTS
3. Financial Risk Management
Introduction and OverviewThis note presents information about the Bank’s exposure to financial risks and the Bank’s management of capital.
The Bank has exposure to the following risk from financial instruments:
• credit risk;
• liquidity risk;
• market risk;
• interest rate risk; and
• capital risk management
(a) Credit RiskFor the definition of credit risk and information of how credit risk is managed by the Bank, please refer to pages 37 to 38 under the Risk and Capital Management section.
(i) Maximum Exposure to Credit Risk
The Bank credit exposure is spread across a broad range of asset classes, including trading assets, derivative assets, loans and advances to customers, loans and advances to banks and financial investments.
The following table presents the maximum exposure to credit risk from balance sheet and off-balance sheet financial instruments, before taking account of any collateral held or other credit enhancements (unless such credit enhancements meet accounting offsetting requirements). For financial assets recognised on the statement of financial position the maximum exposure to credit risk equals their carrying amount; for financial guarantees and similar contracts granted, it is the maximum amount that we would have to pay if the guarantees were called upon.
For loan commitments and other credit-related commitments that are irrevocable over the life of the respective facilities, it is generally the full amount of the committed facilities.
2020USD
2019USD
2018USD
Cash and cash equivalentsTrading assetsDerivative assetsLoans and advances to banksLoans and advances to customersFinancial InvestmentsOther assetsFinancial guarantees and other credit-related contingent liabilitiesLoan and other credit-related commitments
At 31 December
1,050,583,0211,013,8642,591,021
259,159,883187,757,655
219,976,7936,547,188
23,094,810182,306,932
1,933,031,167
686,658,1193,690,943
1,151,716298,481,160227,004,114197,075,417
7,330,86029,693,301
144,069,523
1,595,155,153
875,019,5632,473,9611,278,203
301,895,689228,032,006147,364,470
9,358,03336,197,673
102,959,206
1,704,578,804
Non-financial assets relating to prepayments and VAT amounting to USD456,292 were excluded from other assets as at 31 December
2020 (2019: USD 731,476; 2018: USD427,613).
Gro
ss C
arry
ing
amou
ntEC
LEC
L %
At
31 D
ecem
ber
2020
Sta
ge 1
Sta
ge 2
Sta
ge 3
Sta
ge 1
Sta
ge 2
Sta
ge 3
Sta
ge 1
Sta
ge 2
Sta
ge 3
Fina
ncia
l Ass
ets
US
D
US
D
US
D
US
D
US
D
US
D
Loan
s an
d ad
vanc
es t
o cu
stom
ers
159,
511,
921
24
,39
4,2
6722
,44
2,31
693
5,9
05
383,
573
15,9
97,5
800
.6%
1.6
%71
.3%
Loan
s an
d ad
vanc
es t
o ba
nks
259,
679,
814
-
-51
9,93
1-
-0
.2%
--
Cas
h an
d ca
sh e
quiv
alen
ts
1,0
50,7
04
,335
-
-12
1,31
4-
--
--
Fina
ncia
l Inv
estm
ents
- A
mor
tise
d21
3,6
44
,60
3 -
-3,
228
--
--
-
Fina
ncia
l Inv
estm
ents
– F
VO
CI
6,33
5,6
56-
-23
8-
--
--
Non
-Fun
ded
Faci
litie
s 17
8,29
6,74
9
27,4
73,7
81-
280
,729
88,0
59-
0.2
%.0
3%-
Tota
l1,
868,
173,
078
51,8
68,
04
822
,44
2,31
61,
861,
345
471
,632
15,9
97,5
800
.1%
0.9
%71
.3%
At
31
Dec
emb
er 2
019
Loan
s an
d a
dva
nce
s to
cu
stom
ers
213
,06
6,3
36
-2
2,0
61,
46
36
73,0
21
-7,
29
8,0
180
.3%
-3
3.1
%
Loan
s an
d a
dva
nce
s to
ban
ks2
98
,671
,63
4-
-19
0,4
74-
-0
.1%
--
Cas
h a
nd
cas
h e
qu
ival
ents
6
86
,674
,375
--
16,2
56
--
--
-
Fin
anci
al In
vest
men
ts -
Am
orti
sed
186
,75
7,3
01
--
1,6
63
--
--
-
Fin
anci
al In
vest
men
ts –
FV
OC
I10
,319
,85
3-
-74
--
--
-
Non
-Fu
nd
ed F
acili
ties
17
0,4
70,2
44
1,0
85
,73
62
,50
6,1
1315
2,7
31
34
014
6,1
98
--
5.8
%
Tot
al1,
56
5,9
59
,74
31,
08
5,7
36
24
,56
7,5
761,
03
4,2
193
40
7,4
44
,216
0.1
%-
30
.3%
3. F
inan
cial
Ris
k M
anag
emen
t (c
onti
nued
)(a
) C
redi
t R
isk
(con
tinu
ed)
(ii)
Ana
lysi
s of
cre
dit
qual
ity
EC
L on
Fin
anci
al A
sset
s
119STANDARD BANK (MAURITIUS) LIMITED Annual report 2020118
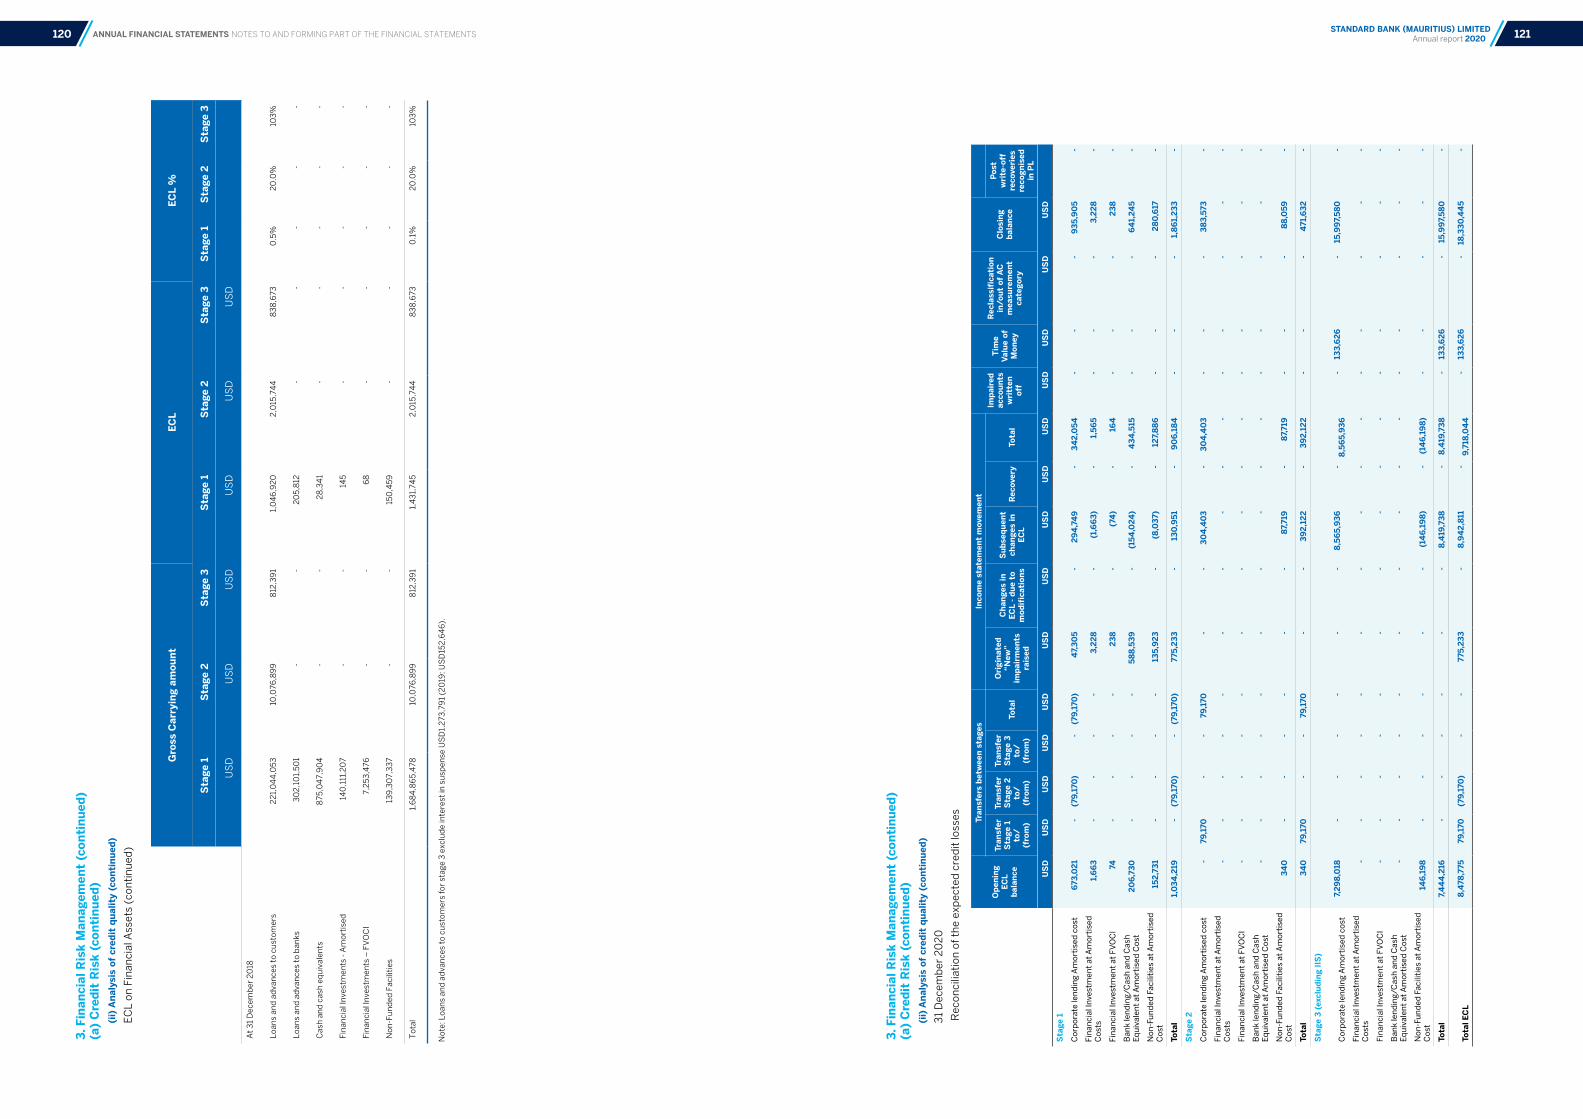
ANNUAL FINANCIAL STATEMENTS NOTES TO AND FORMING PART OF THE FINANCIAL STATEMENTS
3. F
inan
cial
Ris
k M
anag
emen
t (c
onti
nued
)(a
) C
redi
t R
isk
(con
tinu
ed)
(ii)
Ana
lysi
s of
cre
dit
qual
ity
(con
tinu
ed)
EC
L on
Fin
anci
al A
sset
s (c
onti
nu
ed)
3. F
inan
cial
Ris
k M
anag
emen
t (c
onti
nued
)(a
) C
redi
t R
isk
(con
tinu
ed)
(ii)
Ana
lysi
s of
cre
dit
qual
ity
(con
tinu
ed)
31
Dec
emb
er 2
02
0
Rec
onci
liati
on o
f th
e ex
pec
ted
cre
dit
loss
es
Ope
ning
EC
L ba
lanc
e
Tran
sfer
s be
twee
n st
ages
In
com
e st
atem
ent
mov
emen
tIm
pair
ed
acco
unts
w
ritt
en
off
Tim
e Va
lue
of
Mon
ey
Rec
lass
ific
atio
n in
/out
of
AC
m
easu
rem
ent
cate
gory
Clo
sing
ba
lanc
e Tr
ansf
er
Sta
ge 1
to
/(f
rom
)
Tran
sfer
S
tage
2
to/
(fro
m)
Tran
sfer
S
tage
3
to/
(fro
m)
Tota
l
Ori
gina
ted
“New
” im
pair
men
ts
rais
ed
Cha
nges
in
ECL
- du
e to
m
odif
icat
ions
Sub
sequ
ent
chan
ges
in
ECL
Rec
over
yTo
tal
Post
w
rite
-off
re
cove
ries
re
cogn
ised
in
PL
US
DU
SD
US
DU
SD
US
DU
SD
US
DU
SD
US
DU
SD
US
DU
SD
US
DU
SD
Sta
ge 1
Co
rpo
rate
len
din
g A
mo
rtis
ed c
ost
673
,021
-
(7
9,17
0)
-
(79,
170
) 4
7,30
5 -
2
94
,74
9
-
34
2,0
54
-
-
-
935
,90
5 -
Fin
anci
al In
vest
men
t at
Am
ort
ised
C
osts
1,6
63
-
-
-
-
3,2
28
-
(1,6
63)
-
1,5
65
-
-
-
3,2
28
-
Fin
anci
al In
vest
men
t at
FV
OC
I 7
4
-
-
-
-
238
-
(7
4)
-
16
4
-
-
-
238
-
Ban
k le
nd
ing/
Cas
h a
nd
Cas
h
Eq
uiv
alen
t at
Am
ort
ised
Cos
t 2
06,
730
-
-
-
-
5
88,5
39
-
(154
,024
) -
4
34,5
15
-
-
-
64
1,24
5 -
No
n-F
un
ded
Fac
iliti
es a
t A
mo
rtis
ed
Cos
t 1
52,7
31
-
-
-
-
135
,923
-
(8
,037
) -
1
27,8
86
-
-
-
280
,617
-
Tota
l 1
,034
,219
-
(7
9,17
0)
-
(79,
170
) 7
75,2
33
-
130
,951
-
9
06,
184
-
-
-
1
,86
1,23
3 -
Sta
ge 2
Co
rpo
rate
len
din
g A
mo
rtis
ed c
ost
-
79,
170
-
-
7
9,17
0
-
-
30
4,4
03
-
30
4,4
03
-
-
-
383
,573
-
Fin
anci
al In
vest
men
t at
Am
ort
ised
C
osts
-
-
-
-
-
-
-
-
-
-
-
-
-
-
-
Fin
anci
al In
vest
men
t at
FV
OC
I -
-
-
-
-
-
-
-
-
-
-
-
-
-
-
Ban
k le
nd
ing/
Cas
h a
nd
Cas
h
Eq
uiv
alen
t at
Am
ort
ised
Cos
t -
-
-
-
-
-
-
-
-
-
-
-
-
-
-
No
n-F
un
ded
Fac
iliti
es a
t A
mo
rtis
ed
Cos
t 3
40
-
-
-
-
-
-
8
7,71
9
-
87,
719
-
-
-
8
8,0
59
-
Tota
l 3
40
7
9,17
0
-
-
79,
170
-
-
3
92,
122
-
39
2,12
2 -
-
-
4
71,6
32
-
Sta
ge 3
(exc
ludi
ng II
S)
Co
rpo
rate
len
din
g A
mo
rtis
ed c
ost
7,2
98,
018
-
-
-
-
-
-
8
,56
5,93
6
-
8,
565,
936
-
1
33,6
26
-
15,
997
,580
-
Fin
anci
al In
vest
men
t at
Am
ort
ised
C
osts
-
-
-
-
-
-
-
-
-
-
-
-
-
-
-
Fin
anci
al In
vest
men
t at
FV
OC
I -
-
-
-
-
-
-
-
-
-
-
-
-
-
-
Ban
k le
nd
ing/
Cas
h a
nd
Cas
h
Eq
uiv
alen
t at
Am
ort
ised
Cos
t -
-
-
-
-
-
-
-
-
-
-
-
-
-
-
No
n-F
un
ded
Fac
iliti
es a
t A
mo
rtis
ed
Cos
t 1
46,
198
-
-
-
-
-
-
(14
6,19
8) -
(1
46,
198)
-
-
-
-
-
Tota
l 7
,44
4,2
16
-
-
-
-
-
-
8,4
19,7
38
-
8,4
19,7
38
-
133
,626
-
1
5,9
97,5
80
-
Tota
l EC
L 8
,478
,775
7
9,17
0
(79,
170
) -
-
7
75,2
33
-
8,9
42,
811
-
9,
718,
04
4
-
133
,626
-
1
8,33
0,4
45
-
Not
e: L
oan
s an
d a
dva
nce
s to
cu
stom
ers
for
stag
e 3
exc
lud
e in
tere
st in
su
spen
se U
SD
1,2
73,7
91
(20
19: U
SD
152
,64
6).
At
31
Dec
emb
er 2
018
Loan
s an
d a
dva
nce
s to
cu
stom
ers
22
1,0
44
,05
310
,076
,89
98
12,3
91
1,0
46
,92
02
,015
,74
48
38
,673
0.5
%2
0.0
%10
3%
Loan
s an
d a
dva
nce
s to
ban
ks3
02
,10
1,5
01
--
20
5,8
12-
--
--
Cas
h a
nd
cas
h e
qu
ival
ents
8
75,0
47,
90
4-
-2
8,3
41
--
--
-
Fin
anci
al In
vest
men
ts -
Am
orti
sed
140
,111
,20
7-
-14
5-
--
--
Fin
anci
al In
vest
men
ts –
FV
OC
I7,
25
3,4
76-
-6
8-
--
--
Non
-Fu
nd
ed F
acili
ties
13
9,3
07,
33
7-
-15
0,4
59
--
--
-
Tot
al1,
68
4,8
65
,478
10,0
76,8
99
812
,39
11,
43
1,74
52
,015
,74
48
38
,673
0.1
%2
0.0
%10
3%
Gro
ss C
arry
ing
amou
ntEC
LEC
L %
Sta
ge 1
Sta
ge 2
Sta
ge 3
Sta
ge 1
Sta
ge 2
Sta
ge 3
Sta
ge 1
Sta
ge 2
Sta
ge 3
US
D
US
D
US
D
US
D
US
D
US
D
121STANDARD BANK (MAURITIUS) LIMITED Annual report 2020120

ANNUAL FINANCIAL STATEMENTS NOTES TO AND FORMING PART OF THE FINANCIAL STATEMENTS
3. F
inan
cial
Ris
k M
anag
emen
t (c
onti
nued
)(a
) C
redi
t R
isk
(con
tinu
ed)
(ii)
Ana
lysi
s of
cre
dit
qual
ity
(con
tinu
ed)
31
Dec
emb
er 2
02
0
Cre
dit
exp
osu
re a
t am
orti
sed
cos
t
3. F
inan
cial
Ris
k M
anag
emen
t (c
onti
nued
)(a
) C
redi
t R
isk
(con
tinu
ed)
(ii)
Ana
lysi
s of
cre
dit
qual
ity
(con
tinu
ed)
31
Dec
emb
er 2
019
Rec
onci
liati
on o
f th
e ex
pec
ted
cre
dit
loss
es
Ope
ning
EC
L ba
l-an
ce
Tran
sfer
s be
twee
n st
ages
In
com
e st
atem
ent
mov
emen
t
Impa
ired
ac
coun
ts
wri
tten
off
Tim
e Va
lue
of
Mon
ey
Rec
lass
ifica
tion
in
/out
of
AC
m
easu
rem
ent
cate
gory
Clo
sing
bal
ance
Tr
ansf
er
Sta
ge
1 to
/(f
rom
)
Tran
sfer
S
tage
2 t
o/(f
rom
)
Tran
sfer
Sta
ge
3 to
/(fr
om)
Tota
l
Ori
gina
ted
“New
” im
-pa
irm
ents
ra
ised
Cha
nges
in
ECL
- due
to
mod
ifica
tion
s
Sub
sequ
ent
chan
ges
in
ECL
Tota
l
Post
wri
te-o
ff re
cove
ries
re
cogn
ised
in
PL
US
DU
SD
US
DU
SD
US
DU
SD
US
DU
SD
US
DU
SD
US
DU
SD
US
D
Sta
ge 1
Cor
por
ate
len
din
g A
mor
tise
d c
ost
1,0
46
,919
-
-
(2
5,2
21)
(25
,22
1) 1
58
,22
7 -
(5
06
,90
4)
(34
8,6
77)
-
-
-
673
,02
1 -
Fin
anci
al In
vest
men
t at
Am
orti
sed
C
osts
68
-
-
-
-
7
4
-
(68
) 6
-
-
-
7
4
-
Fin
anci
al In
vest
men
t at
FV
OC
I 1
45
-
-
-
-
1
,66
3
-
(14
5)
1,5
18
-
-
-
1,6
63
-
Ban
k le
nd
ing/
Cas
h a
nd
Cas
h
Eq
uiv
alen
t at
Am
orti
sed
Cos
t 2
34
,15
4
-
-
-
-
14
6,6
14
-
(174
,03
8)
(27,
42
4)
-
-
-
20
6,7
30
-
Non
-Fu
nd
ed F
acili
ties
at
Am
orti
sed
C
ost
15
0,4
59
-
-
-
-
2
3,3
43
-
(2
1,0
71)
2,2
72
-
-
-
15
2,7
31
-
Tota
l 1
,43
1,74
5
-
-
(25
,22
1)(2
5,2
21)
32
9,9
21
-
(70
2,2
26
)(3
72,3
05
) -
-
-
1
,03
4,2
19
-
Sta
ge 2
Cor
por
ate
len
din
g A
mor
tise
d c
ost
2,0
15,7
44
-
-
(2
,015
,74
4)
(2,0
15,7
44
) -
-
-
-
-
-
-
-
-
Fin
anci
al In
vest
men
t at
Am
orti
sed
C
osts
-
-
-
-
-
-
-
-
-
-
-
-
-
-
Fin
anci
al In
vest
men
t at
FV
OC
I -
-
-
-
-
-
-
-
-
-
-
-
-
Ban
k le
nd
ing/
Cas
h a
nd
Cas
h
Eq
uiv
alen
t at
Am
orti
sed
Cos
t -
-
-
-
-
-
-
-
-
-
-
-
-
-
Non
-Fu
nd
ed F
acili
ties
at
Am
orti
sed
C
ost
-
-
-
-
-
172
-
1
68
3
40
-
-
-
3
40
-
Tota
l 2
,015
,74
4
-
-
(2,0
15,7
44
)(2
,015
,74
4)
172
-
1
68
3
40
-
-
-
3
40
-
Sta
ge 3
(exc
ludi
ng II
S)
Cor
por
ate
len
din
g A
mor
tise
d c
ost
83
8,6
73
25
,22
1 2
,015
,74
4
-
2,0
40
,96
5
-
-
5,3
87,
128
5
,38
7,12
8
(83
7,0
47)
(13
1,70
1) -
7
,29
8,0
18
(770
)
Fin
anci
al In
vest
men
t at
Am
orti
sed
C
osts
-
-
-
-
-
-
-
-
-
-
-
-
-
-
Fin
anci
al In
vest
men
t at
FV
OC
I -
-
-
-
-
-
-
-
-
-
-
-
-
-
Ban
k le
nd
ing/
Cas
h a
nd
Cas
h
Eq
uiv
alen
t at
Am
orti
sed
Cos
t -
-
-
-
-
-
-
-
-
-
-
-
-
-
Non
-Fu
nd
ed F
acili
ties
at
Am
orti
sed
C
ost
-
-
-
-
-
-
-
14
6,1
98
1
46
,19
8
-
-
-
14
6,1
98
-
Tota
l 8
38
,673
2
5,2
21
2,0
15,7
44
-
2
,04
0,9
65
-
-
5
,53
3,3
26
5
,53
3,3
26
(8
37,
04
7)(1
31,
701)
-
7,4
44
,216
(7
70)
Tota
l EC
L 4
,28
6,1
62
2
5,2
21
2,0
15,7
44
(2
,04
0,9
65
) -
3
30
,09
3
-
4,8
31,
26
8
5,1
61,
36
1 (8
37,
04
7)(1
31,
701)
-
8,4
78,7
75
(770
)
Gro
ss C
arry
ing
valu
e
SB
1 -
12
S
B 1
3 -
20
SB
21
- 2
5S
tage
3
Tota
l gro
ss c
arry
ing
am
ount
of
non-
perf
orm
ing
loan
s
Inte
rest
in
susp
ense
Bal
ance
she
et
impa
irm
ents
for
no
n pe
rfor
min
g sp
ecif
ical
ly
impa
ired
loan
s (s
tage
3)
Sta
ge 1
Sta
ge 2
Sta
ge 1
Sta
ge 2
Sta
ge 1
Sta
ge 2
Sub
sta
ndar
d D
oubt
ful
US
DU
SD
US
DU
SD
US
DU
SD
US
DU
SD
US
DU
SD
US
D
On
-bal
ance
sh
eet
exp
osu
res
Cor
por
ate
len
din
g A
mor
tise
d c
ost
20
6,3
48
,50
44
0,9
01
,71
4 -
1
18
,61
0,2
07
9,2
39
,54
8 -
1
5,1
54
,71
91
2,0
08
,81
21
0,4
33
,50
42
2,4
42
,31
61
,27
3,7
91
15
,99
7,5
80
Fin
anci
al In
vest
men
t at
Am
orti
sed
Cos
ts2
13
,64
4,6
03
21
3,6
44
,60
3 -
-
-
-
-
-
-
-
-
-
Fin
anci
al In
vest
men
t at
FV
OC
I6
,33
5,6
56
6,3
35
,65
6 -
-
-
-
-
-
-
-
-
-
Ban
k le
nd
ing/
Cas
h a
nd
Cas
h
Eq
uiv
alen
t at
Am
orti
sed
Cos
t1
,31
0,3
84
,14
91
82
,96
9,7
61
-
1,1
27
,41
4,3
39
-
49
-
-
-
-
-
-
Off
-bal
ance
sh
eet
exp
osu
res
-
-
-
-
-
-
-
-
-
-
-
-
Non
Fu
nd
ed F
acili
ties
at
Am
orti
sed
Cos
t2
05
,77
0,5
30
89
,43
7,3
15
-
8
8,8
59
,43
4
22
,42
6,0
37
-
5
,04
7,7
44
-
-
-
-
-
Gro
ss c
arry
ing
valu
e of
fina
ncia
l ass
ets
subj
ect
to
cred
it r
isk
1,9
42
,48
3,4
42
Less
: Tot
al E
CL
for
finan
cial
asse
ts s
ub
ject
to
cred
it r
isk
(18
,33
0,4
45
)
Sta
ge 1
(1,8
61
,23
3)
Sta
ge 2
(47
1,6
32
)
Sta
ge 3
(15
,99
7,5
80
)
Inte
rest
In S
usp
ense
(IIS
)(1
,27
3,7
91
)
Net
car
ryin
g va
lue
of f
inan
cial
ass
ets
subj
ect
to c
redi
t ri
sk1
,92
2,8
79
,20
6
Loan
s an
d a
dva
nce
s in
clu
de
the
elem
ent
of M
TM
am
oun
tin
g U
SD
62
6,3
84
from
Hed
ge a
ccou
nti
ng.
123STANDARD BANK (MAURITIUS) LIMITED Annual report 2020122
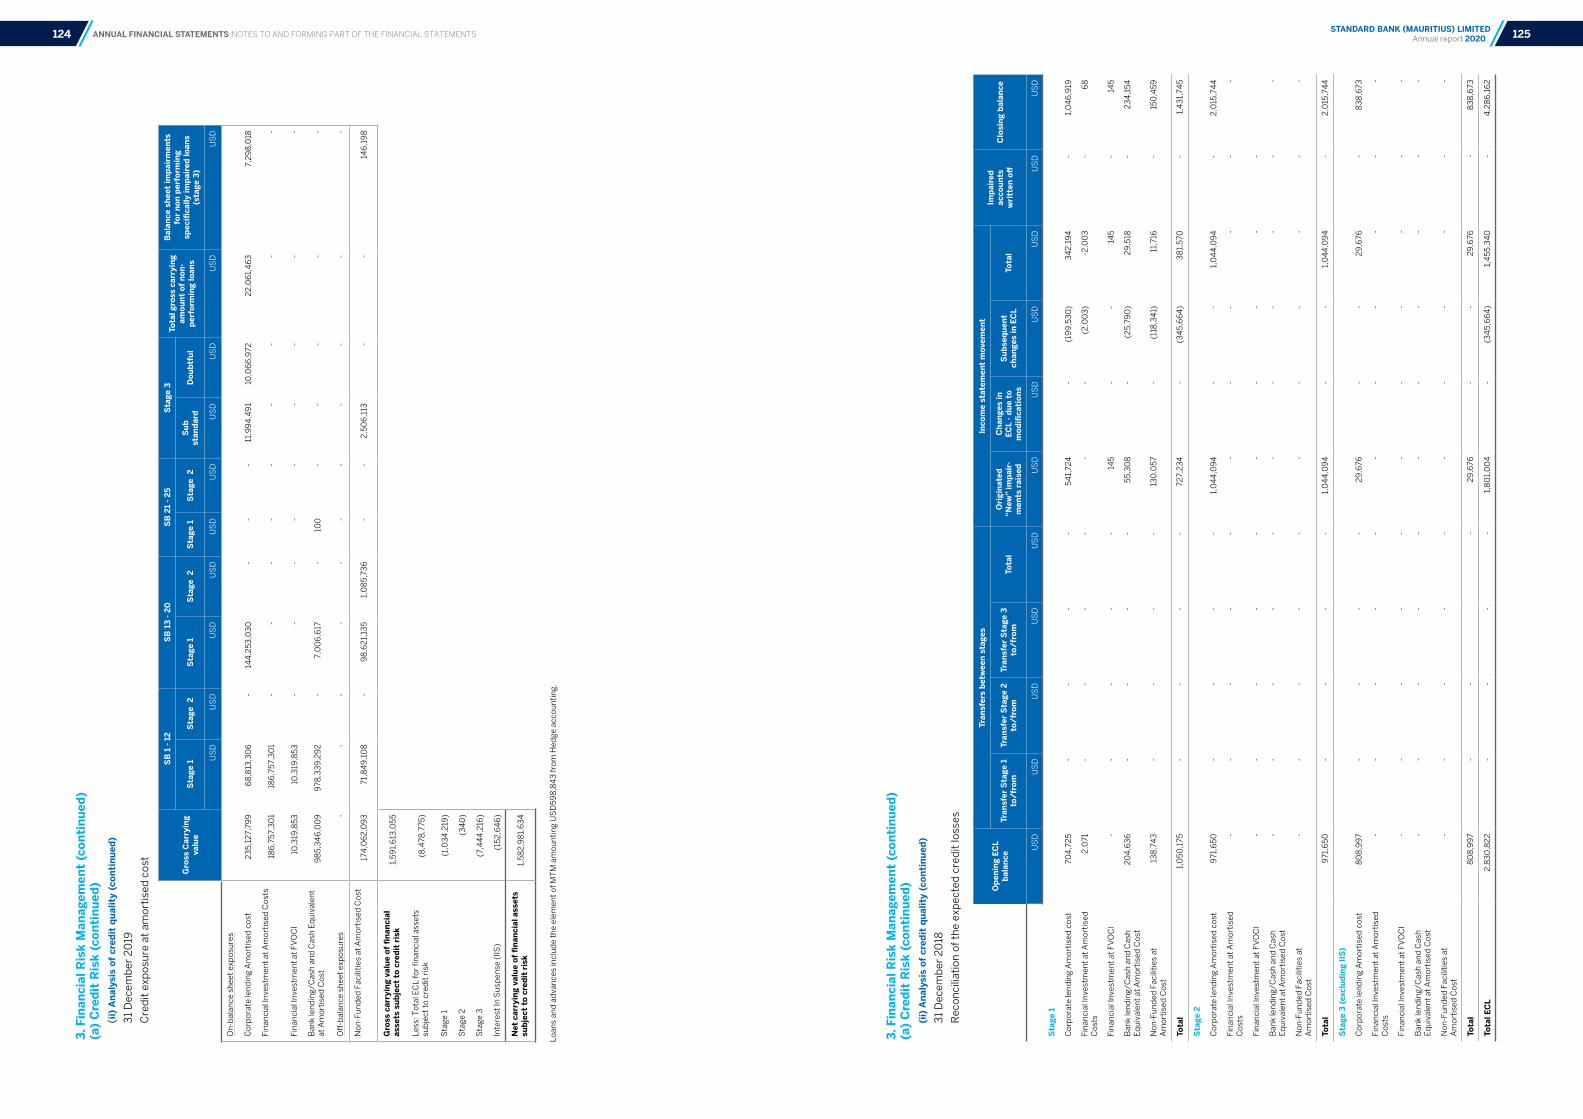
ANNUAL FINANCIAL STATEMENTS NOTES TO AND FORMING PART OF THE FINANCIAL STATEMENTS
3. F
inan
cial
Ris
k M
anag
emen
t (c
onti
nued
)(a
) C
redi
t R
isk
(con
tinu
ed)
(ii)
Ana
lysi
s of
cre
dit
qual
ity
(con
tinu
ed)
31
Dec
emb
er 2
019
Cre
dit
exp
osu
re a
t am
orti
sed
cos
t
3. F
inan
cial
Ris
k M
anag
emen
t (c
onti
nued
)(a
) C
redi
t R
isk
(con
tinu
ed)
(ii)
Ana
lysi
s of
cre
dit
qual
ity
(con
tinu
ed)
31
Dec
emb
er 2
018
Rec
onci
liati
on o
f th
e ex
pec
ted
cre
dit
loss
es
Ope
ning
EC
L ba
lanc
e
Tran
sfer
s be
twee
n st
ages
In
com
e st
atem
ent
mov
emen
tIm
pair
ed
acco
unts
w
ritt
en o
ffC
losi
ng b
alan
ce
Tran
sfer
Sta
ge 1
to
/fro
mTr
ansf
er S
tage
2
to/f
rom
Tran
sfer
Sta
ge 3
to
/fro
mTo
tal
Ori
gina
ted
“New
” im
pair
-m
ents
rai
sed
Cha
nges
in
ECL
- due
to
mod
ifica
tion
s
Sub
sequ
ent
chan
ges
in E
CL
Tota
l
US
DU
SD
US
DU
SD
US
DU
SD
US
DU
SD
US
DU
SD
US
D
Sta
ge 1
Cor
por
ate
len
din
g A
mor
tise
d c
ost
70
4,7
25
-
-
-
-
5
41,
724
-
(1
99
,53
0)
34
2,1
94
-
1
,04
6,9
19
Fin
anci
al In
vest
men
t at
Am
orti
sed
C
osts
2,0
71
-
-
-
-
-
-
(2,0
03
) -
2,0
03
-
6
8
Fin
anci
al In
vest
men
t at
FV
OC
I -
-
-
-
-
1
45
-
-
1
45
-
1
45
Ban
k le
nd
ing/
Cas
h a
nd
Cas
h
Eq
uiv
alen
t at
Am
orti
sed
Cos
t 2
04
,63
6
-
-
-
-
55
,30
8
-
(25
,79
0)
29
,518
-
2
34
,15
4
Non
-Fu
nd
ed F
acili
ties
at
Am
orti
sed
Cos
t 1
38
,74
3
-
-
-
-
13
0,0
57
-
(118
,34
1) 1
1,71
6
-
15
0,4
59
Tota
l 1
,05
0,1
75
-
-
-
-
72
7,2
34
-
(
34
5,6
64
) 3
81,
570
-
1
,43
1,74
5
Sta
ge 2
Cor
por
ate
len
din
g A
mor
tise
d c
ost
971
,65
0
-
-
-
-
1,0
44
,09
4
-
-
1,0
44
,09
4
-
2,0
15,7
44
Fin
anci
al In
vest
men
t at
Am
orti
sed
C
osts
-
-
-
-
-
-
-
-
-
-
-
Fin
anci
al In
vest
men
t at
FV
OC
I -
-
-
-
-
-
-
-
-
-
Ban
k le
nd
ing/
Cas
h a
nd
Cas
h
Eq
uiv
alen
t at
Am
orti
sed
Cos
t -
-
-
-
-
-
-
-
-
-
-
Non
-Fu
nd
ed F
acili
ties
at
Am
orti
sed
Cos
t -
-
-
-
-
-
-
-
-
-
-
Tota
l 9
71,6
50
-
-
-
-
1
,04
4,0
94
-
-
1
,04
4,0
94
-
2
,015
,74
4
Sta
ge 3
(exc
ludi
ng II
S)
Cor
por
ate
len
din
g A
mor
tise
d c
ost
80
8,9
97
-
-
-
-
29
,676
-
-
2
9,6
76
-
83
8,6
73
Fin
anci
al In
vest
men
t at
Am
orti
sed
C
osts
-
-
-
-
-
-
-
-
-
-
-
Fin
anci
al In
vest
men
t at
FV
OC
I -
-
-
-
-
-
-
-
-
-
-
Ban
k le
nd
ing/
Cas
h a
nd
Cas
h
Eq
uiv
alen
t at
Am
orti
sed
Cos
t -
-
-
-
-
-
-
-
-
-
-
Non
-Fu
nd
ed F
acili
ties
at
Am
orti
sed
Cos
t -
-
-
-
-
-
-
-
-
-
-
Tota
l 8
08
,99
7 -
-
-
2
9,6
76
-
-
29
,676
-
8
38
,673
Tota
l EC
L2
,83
0,8
22
-
-
-
-
1,8
01,
00
4 -
(
34
5,6
64
)1,
45
5,3
40
-
4,2
86
,16
2
Gro
ss C
arry
ing
valu
e
SB
1 -
12
SB
13
- 20
SB
21
- 25
Sta
ge 3
To
tal g
ross
car
ryin
g am
ount
of
non-
perf
orm
ing
loan
s
Bal
ance
she
et im
pair
men
ts
for
non
perf
orm
ing
spec
ifica
lly im
pair
ed lo
ans
(sta
ge 3
)S
tage
1S
tage
2S
tage
1S
tage
2S
tage
1S
tage
2S
ub
stan
dard
D
oubt
ful
US
DU
SD
US
DU
SD
US
DU
SD
US
DU
SD
US
DU
SD
On
-bal
ance
sh
eet
exp
osu
res
Cor
por
ate
len
din
g A
mor
tise
d c
ost
23
5,1
27,
799
68
,813
,30
6 -
14
4,2
53
,03
0 -
-
-
11
,99
4,4
91
10,0
66
,972
22
,06
1,4
63
7,2
98
,018
Fin
anci
al In
vest
men
t at
Am
orti
sed
Cos
ts18
6,7
57,
30
118
6,7
57,
30
1 -
-
-
-
-
-
-
-
-
Fin
anci
al In
vest
men
t at
FV
OC
I10
,319
,85
310
,319
,85
3 -
-
-
-
-
-
-
-
-
Ban
k le
nd
ing/
Cas
h a
nd
Cas
h E
qu
ival
ent
at A
mor
tise
d C
ost
98
5,3
46
,00
99
78,3
39
,29
2 -
7,
00
6,6
17 -
10
0 -
-
-
-
-
Off
-bal
ance
sh
eet
exp
osu
res
-
-
-
-
-
-
-
-
-
-
-
Non
-Fu
nd
ed F
acili
ties
at
Am
orti
sed
Cos
t17
4,0
62
,09
371
,84
9,1
08
-
98
,62
1,13
51,
08
5,7
36
-
-
2,5
06
,113
-
-
14
6,1
98
Gro
ss c
arry
ing
valu
e of
fina
ncia
l as
sets
sub
ject
to
cred
it r
isk
1,5
91,
613
,05
5
Less
: Tot
al E
CL
for
finan
cial
ass
ets
sub
ject
to
cred
it r
isk
(8,4
78,7
75)
Sta
ge 1
(1,0
34
,219
)
Sta
ge 2
(34
0)
Sta
ge 3
(7,4
44
,216
)
Inte
rest
In S
usp
ense
(IIS
)(1
52
,64
6)
Net
car
ryin
g va
lue
of fi
nanc
ial a
sset
s su
bjec
t to
cre
dit
risk
1,5
82
,98
1,6
34
Loan
s an
d a
dva
nce
s in
clu
de
the
elem
ent
of M
TM
am
oun
tin
g U
SD
59
8,8
43
from
Hed
ge a
ccou
nti
ng.
125STANDARD BANK (MAURITIUS) LIMITED Annual report 2020124

ANNUAL FINANCIAL STATEMENTS NOTES TO AND FORMING PART OF THE FINANCIAL STATEMENTS
3. F
inan
cial
Ris
k M
anag
emen
t (c
onti
nued
)(a
) C
redi
t R
isk
(con
tinu
ed)
(ii)
Ana
lysi
s of
cre
dit
qual
ity
(con
tinu
ed)
31
Dec
emb
er 2
018
Cre
dit
exp
osu
re a
t am
orti
sed
cos
t
3. Financial Risk Management (continued)(a) Credit Risk (coninued)(ii) Analysis of credit quality (continued)
Loans and Advances to Customers
Performing Loans to Customers
Non-Performing Loans to Customers
Loan
s an
d a
dva
nce
s in
clu
de
the
elem
ent
of M
TM
am
oun
tin
g U
SD
38
7,0
00
from
Hed
ge a
ccou
nti
ng.
`
Gro
ss C
arry
ing
valu
e
SB
1 -
12S
B 1
3 - 2
0S
B 2
1 - 2
5S
tage
3
Tota
l gro
ss
carr
ying
am
ount
of
non-
perf
orm
ing
loan
s
Sec
urit
ies
and
expe
cted
re
cove
ries
on
spec
ifica
lly
impa
ired
loan
sS
tage
1S
tage
2S
tage
1S
tage
2S
tage
1S
tage
2S
ub s
tand
-ar
d
US
DU
SD
US
DU
SD
US
DU
SD
US
DU
SD
US
DU
SD
On
-bal
ance
sh
eet
exp
osu
res
Cor
por
ate
len
din
g A
mor
tise
d c
ost
23
2,2
47,
65
6 4
6,8
78,7
23
-
1
74,1
65
,32
9
-
-
10
,076
,89
9
-
1,1
26
,70
5
812
,39
1
Fin
anci
al In
vest
men
t at
Am
orti
sed
Cos
ts14
0,1
11,2
07
14
0,1
11,2
07
-
-
-
-
-
-
-
-
Fin
anci
al In
vest
men
t at
FV
OC
I7,
25
3,4
76 7
,25
3,4
76
-
-
-
-
-
-
-
-
Ban
k le
nd
ing/
Cas
h a
nd
Cas
h E
qu
ival
ent
at A
mor
tise
d C
ost
1,16
0,8
43
,76
9 1
,15
2,2
04
,48
1 -
8
,63
9,2
88
-
-
-
-
-
-
Off
-bal
ance
sh
eet
exp
osu
res
-
-
-
-
-
-
-
-
-
-
Non
Fu
nd
ed F
acili
ties
at
Am
orti
sed
Cos
t13
9,3
07,
33
7 4
4,6
69
,89
9
-
94
,63
7,4
38
-
-
-
-
-
-
Gro
ss c
arry
ing
valu
e of
fina
ncia
l ass
ets
subj
ect
to c
redi
t ri
sk1,
679
,76
3,4
45
Less
: Tot
al E
CL
for
finan
cial
ass
ets
sub
ject
to
cre
dit
ris
k(4
,28
6,1
62
)
Sta
ge 1
(1,4
31,
745
)
Sta
ge 2
(2,0
15,7
44
)
Sta
ge 3
(83
8,6
73)
Inte
rest
In S
usp
ense
(IIS
)(3
14,3
14)
Net
car
ryin
g va
lue
of fi
nanc
ial a
sset
s su
bjec
t to
cre
dit
risk
1,6
75,1
62
,96
9
2020USD
2019USD
2018USD
Neither past due nor impairedPast due but not impairedIndividually Impaired
Total Gross Amount
Allowance for ImpairmentStage 3 ECL/IndividualStage 1&2 ECL Collective
Total Allowance for Impairment
Net Carrying Amount
183,906,188-
21,168,525*
205,074,713
(15,997,580)(1,319,478)
(17,317,058)
187,757,655
213,066,336
-21,908,817*
234,975,153
(7,298,018)(673,021)
(7,971,039)
227,004,114
231,120,951
-812,391*
231,933,342
(838,673)(3,062,663)
(3,901,336)
228,032,006
*Amount is net of interest in suspense of USD1,273,791 (2019: USD152,646 2018: USD314,314).
Other than loans and advances to customers disclosed above, all financial assets subject to credit risk were classified as neither past due nor impaired.
Total Gross advances
Normal Monitoring
Close Monitoring
USD USD USD
2020Neither past due nor impaired
2019Neither past due nor impaired
2018Neither past due nor impaired
183,906,188
213,066,336
231,120,951
174,724,650
212,766,206
221,044,052
9,181,538
300,130
10,076,899
Total Impaired
advances Sub-standard Doubtful Loss
USD USD USD USD
2020Individually Impaired
2019Individually Impaired
2018Individually Impaired
21,168,525
21,908,817
812,391
11,158,591
11,841,845
-
10,009,934
10,066,972
-
-
-
812,391
Close monitoring: These are exposures placed under watchlist showing early signs of potential future distress.
Normal monitoring: These are all performing loans to customers excluding those in close monitoring.
127STANDARD BANK (MAURITIUS) LIMITED Annual report 2020126
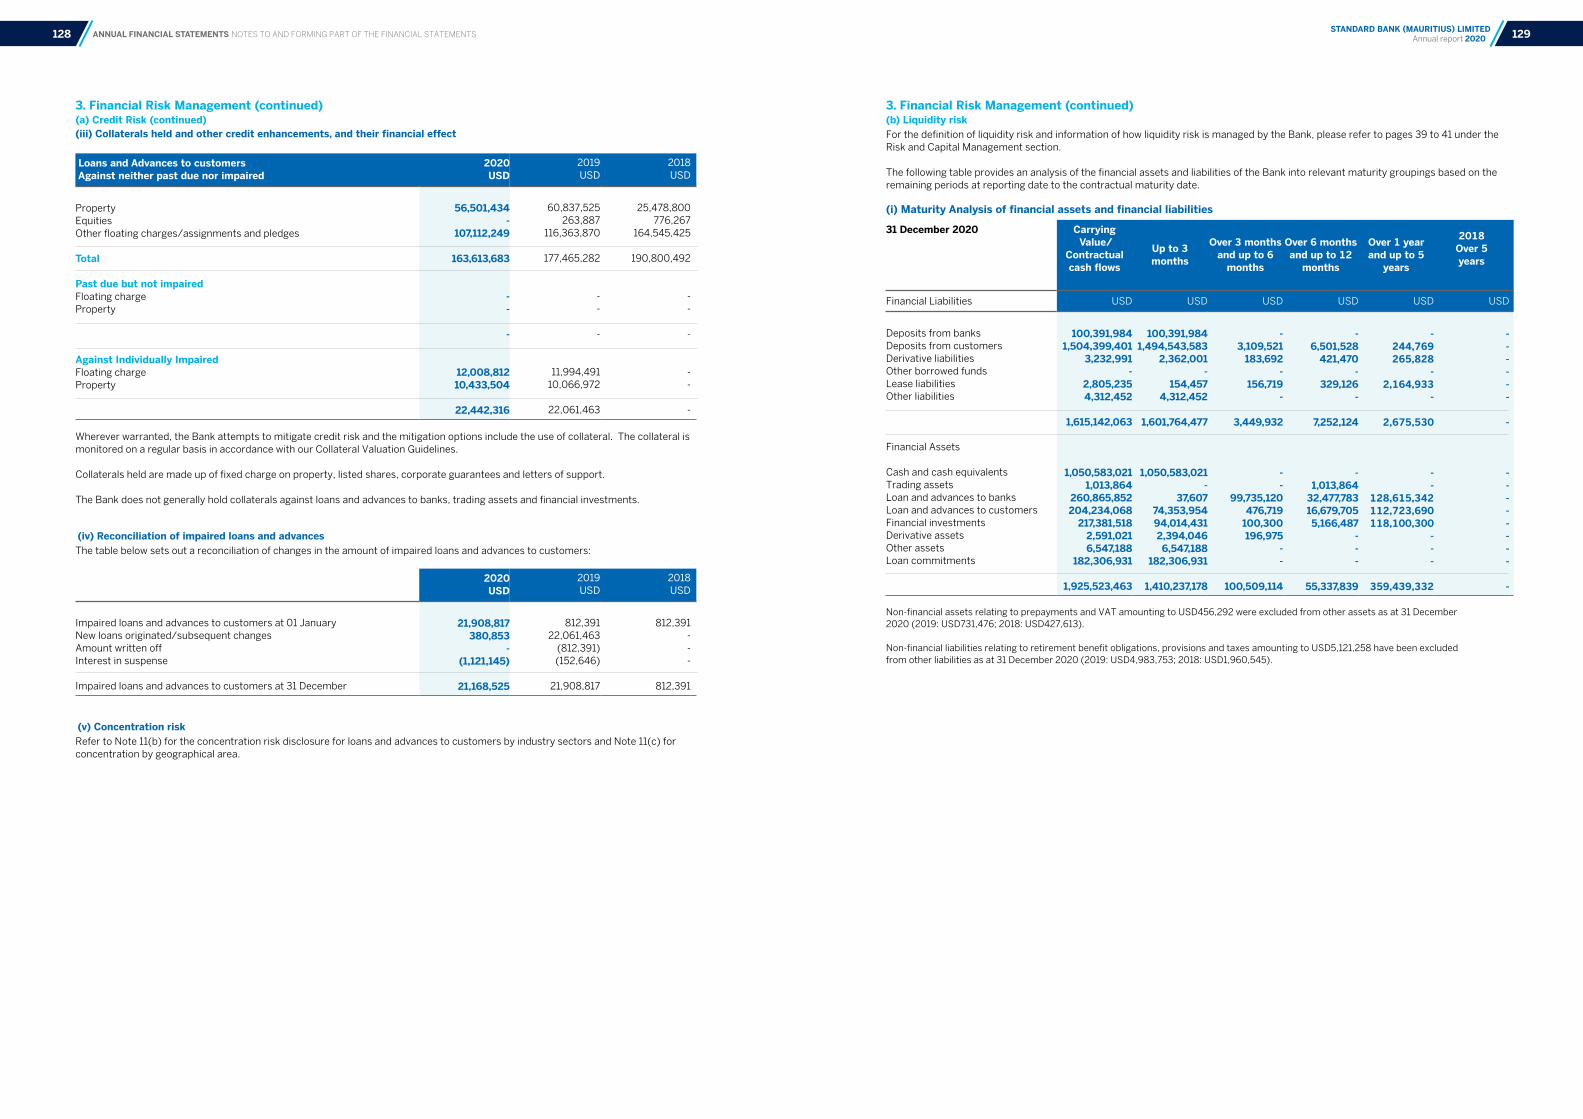
ANNUAL FINANCIAL STATEMENTS NOTES TO AND FORMING PART OF THE FINANCIAL STATEMENTS
3. Financial Risk Management (continued)(b) Liquidity riskFor the definition of liquidity risk and information of how liquidity risk is managed by the Bank, please refer to pages 39 to 41 under theRisk and Capital Management section.
The following table provides an analysis of the financial assets and liabilities of the Bank into relevant maturity groupings based on theremaining periods at reporting date to the contractual maturity date. (i) Maturity Analysis of financial assets and financial liabilities
3. Financial Risk Management (continued)(a) Credit Risk (continued)(iii) Collaterals held and other credit enhancements, and their financial effect
(iv) Reconciliation of impaired loans and advances The table below sets out a reconciliation of changes in the amount of impaired loans and advances to customers:
(v) Concentration risk Refer to Note 11(b) for the concentration risk disclosure for loans and advances to customers by industry sectors and Note 11(c) for concentration by geographical area.
31 December 2020 Carrying Value/
Contractual cash flows
Up to 3 months
Over 3 months and up to 6
months
Over 6 months and up to 12
months
Over 1 year and up to 5
years
2018Over 5 years
Financial Liabilities USD USD USD USD USD USD
Deposits from banksDeposits from customersDerivative liabilitiesOther borrowed fundsLease liabilities Other liabilities
Financial Assets
Cash and cash equivalentsTrading assetsLoan and advances to banksLoan and advances to customersFinancial investmentsDerivative assetsOther assetsLoan commitments
100,391,9841,504,399,401
3,232,991-
2,805,2354,312,452
1,615,142,063
1,050,583,0211,013,864
260,865,852204,234,068
217,381,5182,591,0216,547,188
182,306,931
1,925,523,463
100,391,9841,494,543,583
2,362,001 -
154,457 4,312,452
1,601,764,477
1,050,583,021-
37,60774,353,95494,014,4312,394,0466,547,188
182,306,931
1,410,237,178
- 3,109,521
183,692 -
156,719 -
3,449,932
- -
99,735,120476,719
100,300196,975
- -
100,509,114
- 6,501,528
421,470 -
329,126 -
7,252,124
- 1,013,864
32,477,78316,679,7055,166,487
- -
-
55,337,839
- 244,769 265,828
- 2,164,933
-
2,675,530
- - 128,615,342112,723,690
118,100,300 -
- -
359,439,332
-
- - - -
- -
- -
--- ---
-
Non-financial assets relating to prepayments and VAT amounting to USD456,292 were excluded from other assets as at 31 December2020 (2019: USD731,476; 2018: USD427,613).
Non-financial liabilities relating to retirement benefit obligations, provisions and taxes amounting to USD5,121,258 have been excludedfrom other liabilities as at 31 December 2020 (2019: USD4,983,753; 2018: USD1,960,545).
Loans and Advances to customers Against neither past due nor impaired
2020USD
2019USD
2018USD
Property Equities Other floating charges/assignments and pledges
Total
Past due but not impaired Floating charge Property
Against Individually Impaired Floating charge Property
56,501,434-
107,112,249
163,613,683
--
-
12,008,81210,433,504
22,442,316
60,837,525263,887
116,363,870
177,465,282
-- -
11,994,491
10,066,972
22,061,463
25,478,800
776,267 164,545,425
190,800,492
-- -
-- -
Wherever warranted, the Bank attempts to mitigate credit risk and the mitigation options include the use of collateral. The collateral is monitored on a regular basis in accordance with our Collateral Valuation Guidelines.
Collaterals held are made up of fixed charge on property, listed shares, corporate guarantees and letters of support.
The Bank does not generally hold collaterals against loans and advances to banks, trading assets and financial investments.
2020USD
2019USD
2018USD
Impaired loans and advances to customers at 01 JanuaryNew loans originated/subsequent changes Amount written offInterest in suspense
Impaired loans and advances to customers at 31 December
21,908,817380,853
-(1,121,145)
21,168,525
812,39122,061,463
(812,391)(152,646)
21,908,817
812,391---
812,391
129STANDARD BANK (MAURITIUS) LIMITED Annual report 2020128

ANNUAL FINANCIAL STATEMENTS NOTES TO AND FORMING PART OF THE FINANCIAL STATEMENTS
3. Financial Risk Management (continued)(b) Liquidity risk (continued)(i) Maturity Analysis of financial assets and financial liabilities (continued)
3. Financial Risk Management (continued)(c) Market risk For the definition of market risk and information of how market risk is managed by the Bank, please refer to pages 41 to 42 under Risk Management section.
(i) Assets and liabilities subject to market risk between trading and non-trading portfolios:31 December 2019 Carrying Value/
Contractual cash flows
Up to 3 months
Over 3 months and up to 6
months
Over 6 months and up to 12
months
Over 1 year and up to 5
years
2018Over 5 years
Financial Liabilities USD USD USD USD USD USD
Deposits from banksDeposits from customersDerivative liabilitiesOther borrowed fundsLease liabilities Other liabilities
Financial Assets
Cash and cash equivalentsTrading assetsLoan and advances to banksLoan and advances to customersFinancial investmentsDerivative assetsOther assetsLoan commitments
31 December 2018
Financial Liabilities Deposits from banksDeposits from customersDerivative liabilitiesOther borrowed fundsOther liabilities Financial Assets
Cash and cash equivalentsTrading assetsLoan and advances to banksLoan and advances to customersFinancial investmentsDerivative assetsOther assetsLoan commitments
88,402,6301,213,031,655
1,705,225470,766
3,387,7807,139,907
1,314,137,963
686,658,1193,690,943
304,455,945258,493,878197,574,391
1,151,7167,330,860
144,069,523
1,603,425,375
34,716,3991,387,631,188
1,671,8721,412,299
42,553,358
1,467,985,116
875,019,563
2,476,608301,918,540
259,368,970147,709,941
1,278,2029,358,033
102,959,205
1,700,089,062
88,402,6301,125,788,773
919,091-
156,8247,139,907
1,222,407,225
686,658,1193,690,943
456,329100,285,727
6,112,792990,697
7,330,860144,069,523
949,594,990
34,716,3991,343,926,674
1,132,515 -
42,553,358
1,422,328,946
875,019,563
2,476,6082,415,853
95,431,779145,516,959
1,100,6159,358,033
102,959,205
1,234,278,615
-
7,175,893 144,263
470,766 156,824
-
7,947,746
- -
70,967,3183,203,609
96,913,532161,019
--
171,245,478
- 17,526,263
125,464 - -
17,651,727
- -
56,974,22119,153,487
730,994176,633
- -
77,035,335
- 72,506,652
- -
313,648 -
72,820,300
- -
184,000,22016,705,795
1,513,067- --
202,219,082
- 21,584,165
611 - -
21,584,776
-
- 168,637,41722,730,325
1,461,988954
- -
192,830,684
-
7,560,337 641,871
- 2,760,484
-
10,962,692
- -
42,119,381137,926,89493,035,000
- --
273,081,275
-
4,594,086413,282
1,412,299 -
6,419,667
- - 65,721,499
121,630,686 -
- - -
187,352,185
- -
- - -
- -
- -
6,912,697371,853
- -
--
7,284,550
- - -
- - -
- -
8,169,550422,693
- -
- -
8,592,243
31 December 2020 USD USD USD
Assets subject to market risk Cash and cash equivalents Trading assets Derivative assetsLoans and advances to banks Loans and advances to customers Financial investmentsOther assets
Liabilities subject to market riskDeposits from banks Deposits from customersDerivative liabilitiesLease liabilities Other liabilities
31 December 2019
Assets subject to market risk Cash and cash equivalents Trading assets Derivative assetsLoans and advances to banks Loans and advances to customers Financial investmentsOther assets
Liabilities subject to market riskDeposits from banks Deposits from customersDerivative liabilitiesOther borrowed funds Lease liabilities Other liabilities
31 December 2018
Assets subject to market risk Cash and cash equivalents Trading assets Derivative assetsLoans and advances to banks Loans and advances to customers Financial investmentsOther assets
Liabilities subject to market riskDeposits from banks Deposits from customersDerivative liabilitiesOther borrowed funds Other liabilities
Carrying Amount1,050,583,021
1,013,8642,591,021
259,159,883187,757,655
219,976,7936,547,188
100,378,1911,504,343,412
3,232,991 2,805,2354,312,452
686,658,119 3,690,943
1,151,716298,481,160227,004,114197,075,417
7,330,860
88,402,6301,211,097,476
1,705,225 470,766
3,387,7807,139,907
875,019,563 2,473,9611,278,203
301,895,689228,032,006147,364,470
9,358,033
34,716,399 1,387,631,188
1,671,872 1,412,299
42,553,358
Trading Portfolios -
1,013,8642,591,021
- - - -
- -
3,232,991--
- 3,690,943
1,151,716- - - -
- -
1,705,225- --
- 2,473,9611,278,203
- - - -
- -
1,671,872- -
Non-trading portfolios1,050,583,021
- -
259,159,883187,757,655
219,976,7936,547,188
100,378,191 1,504,343,412
- 2,805,2354,312,452
686,658,119 -
- 298,481,160227,004,114197,075,417
7,330,860
88,402,630 1,211,097,476
- 470,766
3,387,7807,139,907
875,019,563 -
- 301,895,689228,032,006147,364,470
9,358,033
34,716,399 1,387,631,188
- 1,412,299
42,553,358
131STANDARD BANK (MAURITIUS) LIMITED Annual report 2020130

ANNUAL FINANCIAL STATEMENTS NOTES TO AND FORMING PART OF THE FINANCIAL STATEMENTS
3. Financial Risk Management (continued)(c) Market risk (continued)
(ii) Exposure to market risks – Value at riskVaR constitutes an integral part of the Bank’s market risk control regime and limits and triggers are established by the Board annually for all trading and non trading portfolios (fair valued only). VaR expresses the potential loss which can be incurred based on a certain confidence interval.
Normal VaR is calculated on a historical simulation basis with 250 days of market data and uses a 95% confidence interval and a one day holding period.
Diversified Normal VaR Exposures (USD'000)
3. Financial Risk Management (continued)(c) Market risk (continued)
(iii) Stress testsStress VaR uses a similar methodology to Normal VaR but is based on a period of financial stress and assumes a 10-day holding period and worst-case scenario.
Stress VaR Exposures (USD'000)
2020 Diversified Normal VaR (USD ‘000) – Trading Book
Desk Name Max Min Avg 31-Dec Limit
Bank-wideFX TradingInterest Rate Trading
183.3183.9
7.2
1.00.90.1
31.031.30.4
30.430.50.2
255.0250.030.0
2020 Diversified Normal VaR (USD ‘000) – Trading Book
Desk Name Max Min Avg 31-Dec Limit
Bank-wideFX TradingInterest Rate Trading
214.8214.547.8
2.21.90.6
64.064.63.9
47.847.26.7
1,180.01,020.0600.0
2019 Diversified Normal VaR (USD ‘000) – Trading Book
Desk Name Max Min Avg 31-Dec Limit
Bank-wideFX TradingInterest Rate Trading
117.0117.00.2
0.80.70.0
30.530.50.1
4.14.10.1
255.0250.030.0
2019 Diversified Normal VaR (USD ‘000) – Trading Book
Desk Name Max Min Avg 31-Dec Limit
Bank-wideFX TradingInterest Rate Trading
265.7265.5
6.4
1.91.60.9
73.574.02.9
56.256.41.8
1,180.01,020.0600.0
2018 Diversified Normal VaR (USD ‘000) – Trading Book
Desk Name Max Min Avg 31-Dec Limit
Bank-wideFX TradingInterest Rate Trading
159.9160.0
1.9
0.60.50.1
30.630.50.6
51.451.40.1
255.0250.030.0
2018 Diversified Normal VaR (USD ‘000) – Trading Book
Desk Name Max Min Avg 31-Dec Limit
Bank-wideFX TradingInterest Rate Trading
251.9253.111.0
3.71.11.2
61.360.45.3
117.4117.11.7
1,180.01,020.0600.0
Normal VaR (USD ‘000) - FVOCI
Desk Name Max Min Avg 31-Dec Limit
Money Markets Banking 6.8 0.5 0.9 1.1 88.0
Normal VaR (USD ‘000) - FVOCI
Desk Name Max Min Avg 31-Dec Limit
Money Markets Banking 67.3 12.7 23.7 43.8 465.0
Normal VaR (USD ‘000) - FVOCI
Desk Name Max Min Avg 31-Dec Limit
Money Markets Banking 1.3 0.3 0.8 0.7 88.0
Normal VaR (USD ‘000) - FVOCI
Desk Name Max Min Avg 31-Dec Limit
Money Markets Banking 50.9 9.5 30.9 29.3 465.0
Normal VaR (USD ‘000) - FVOCI
Desk Name Max Min Avg 31-Dec Limit
Money Markets Banking 4.9 0.6 2.1 0.8 88.0
Normal VaR (USD ‘000) - FVOCI
Desk Name Max Min Avg 31-Dec Limit
Money Markets Banking 42.8 9.5 25.4 17.6 465.0
133STANDARD BANK (MAURITIUS) LIMITED Annual report 2020132
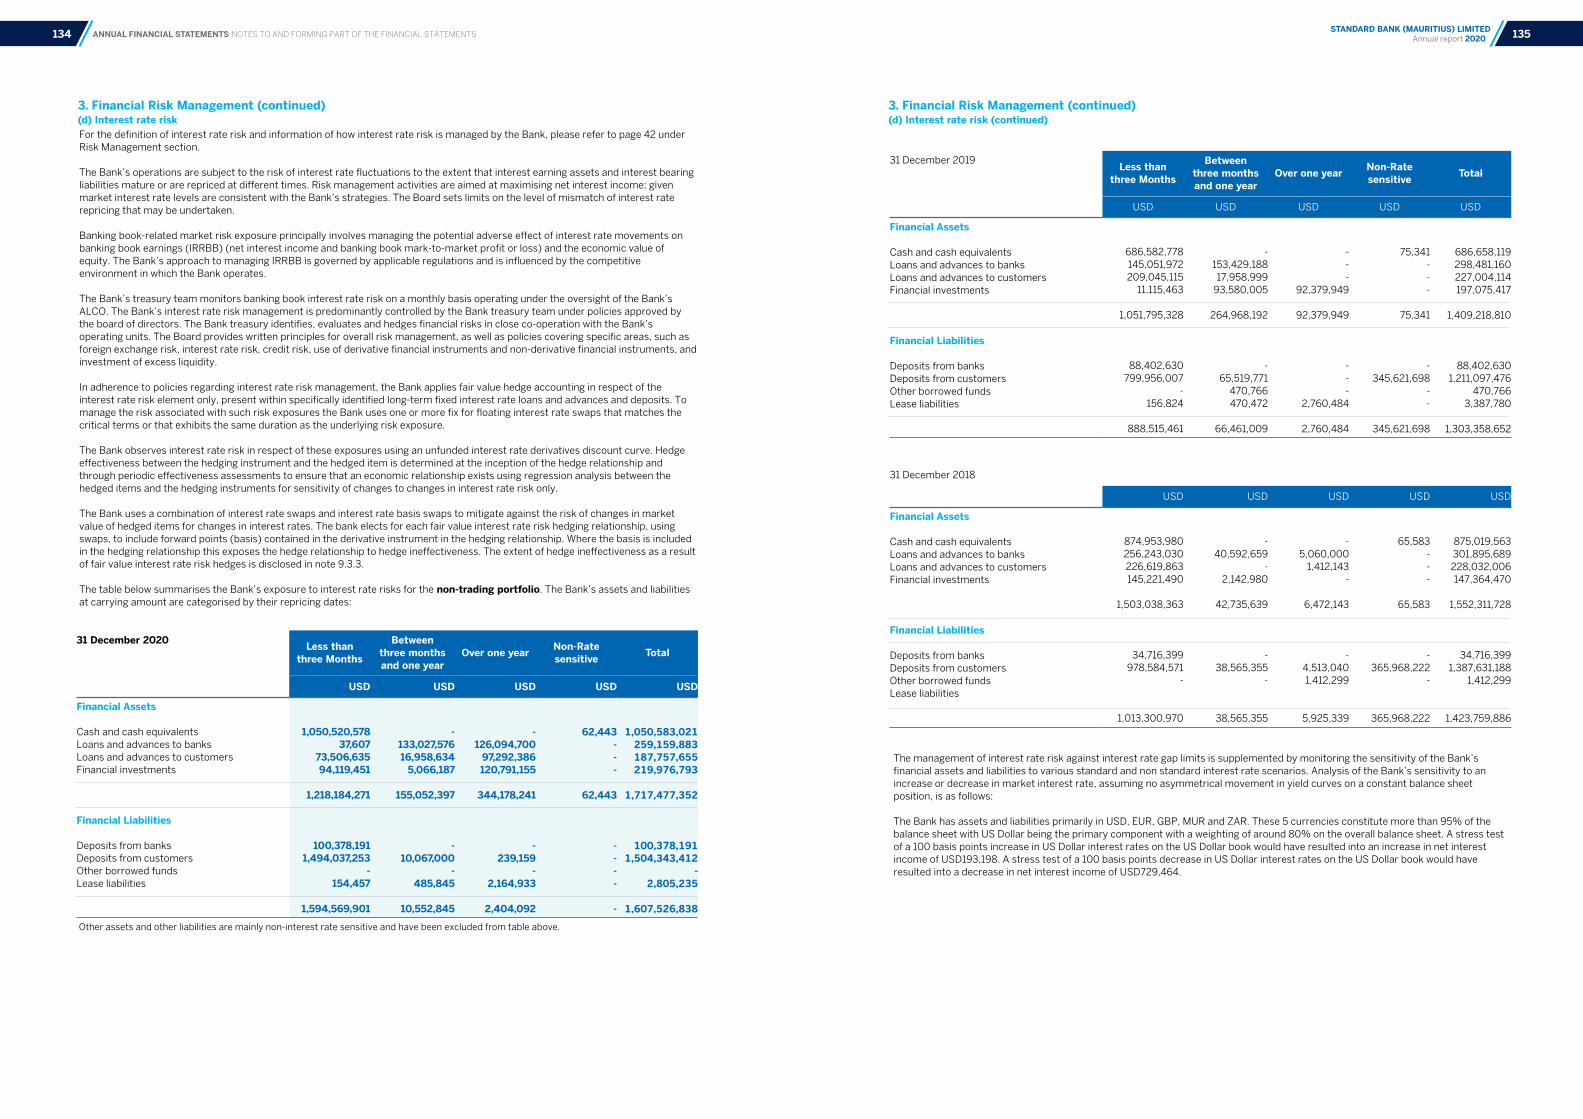
ANNUAL FINANCIAL STATEMENTS NOTES TO AND FORMING PART OF THE FINANCIAL STATEMENTS
3. Financial Risk Management (continued)(d) Interest rate risk For the definition of interest rate risk and information of how interest rate risk is managed by the Bank, please refer to page 42 under Risk Management section.
The Bank’s operations are subject to the risk of interest rate fluctuations to the extent that interest earning assets and interest bearing liabilities mature or are repriced at different times. Risk management activities are aimed at maximising net interest income; given market interest rate levels are consistent with the Bank’s strategies. The Board sets limits on the level of mismatch of interest rate repricing that may be undertaken.
Banking book-related market risk exposure principally involves managing the potential adverse effect of interest rate movements on banking book earnings (IRRBB) (net interest income and banking book mark-to-market profit or loss) and the economic value of equity. The Bank’s approach to managing IRRBB is governed by applicable regulations and is influenced by the competitive environment in which the Bank operates.
The Bank’s treasury team monitors banking book interest rate risk on a monthly basis operating under the oversight of the Bank’s ALCO. The Bank’s interest rate risk management is predominantly controlled by the Bank treasury team under policies approved by the board of directors. The Bank treasury identifies, evaluates and hedges financial risks in close co-operation with the Bank’s operating units. The Board provides written principles for overall risk management, as well as policies covering specific areas, such as foreign exchange risk, interest rate risk, credit risk, use of derivative financial instruments and non-derivative financial instruments, and investment of excess liquidity.
In adherence to policies regarding interest rate risk management, the Bank applies fair value hedge accounting in respect of the interest rate risk element only, present within specifically identified long-term fixed interest rate loans and advances and deposits. To manage the risk associated with such risk exposures the Bank uses one or more fix for floating interest rate swaps that matches the critical terms or that exhibits the same duration as the underlying risk exposure.
The Bank observes interest rate risk in respect of these exposures using an unfunded interest rate derivatives discount curve. Hedge effectiveness between the hedging instrument and the hedged item is determined at the inception of the hedge relationship and through periodic effectiveness assessments to ensure that an economic relationship exists using regression analysis between the hedged items and the hedging instruments for sensitivity of changes to changes in interest rate risk only.
The Bank uses a combination of interest rate swaps and interest rate basis swaps to mitigate against the risk of changes in market value of hedged items for changes in interest rates. The bank elects for each fair value interest rate risk hedging relationship, using swaps, to include forward points (basis) contained in the derivative instrument in the hedging relationship. Where the basis is included in the hedging relationship this exposes the hedge relationship to hedge ineffectiveness. The extent of hedge ineffectiveness as a result of fair value interest rate risk hedges is disclosed in note 9.3.3.
The table below summarises the Bank’s exposure to interest rate risks for the non-trading portfolio. The Bank’s assets and liabilities at carrying amount are categorised by their repricing dates:
The management of interest rate risk against interest rate gap limits is supplemented by monitoring the sensitivity of the Bank’s financial assets and liabilities to various standard and non standard interest rate scenarios. Analysis of the Bank’s sensitivity to an increase or decrease in market interest rate, assuming no asymmetrical movement in yield curves on a constant balance sheet position, is as follows:
The Bank has assets and liabilities primarily in USD, EUR, GBP, MUR and ZAR. These 5 currencies constitute more than 95% of the balance sheet with US Dollar being the primary component with a weighting of around 80% on the overall balance sheet. A stress test of a 100 basis points increase in US Dollar interest rates on the US Dollar book would have resulted into an increase in net interest income of USD193,198. A stress test of a 100 basis points decrease in US Dollar interest rates on the US Dollar book would have resulted into a decrease in net interest income of USD729,464.
3. Financial Risk Management (continued)(d) Interest rate risk (continued)
31 December 2020 Less than three Months
Between three months and one year
Over one year Non-Rate sensitive Total
USD USD USD USD USD
Financial Assets
Cash and cash equivalents Loans and advances to banks Loans and advances to customers Financial investments
Financial Liabilities
Deposits from banks Deposits from customers Other borrowed fundsLease liabilities
1,050,520,57837,607
73,506,635 94,119,451
1,218,184,271
100,378,1911,494,037,253
-154,457
1,594,569,901
- 133,027,576 16,958,634
5,066,187
155,052,397
-10,067,000
-485,845
10,552,845
- 126,094,700
97,292,386 120,791,155
344,178,241
-239,159
-2,164,933
2,404,092
62,443 - -
-
62,443
----
-
1,050,583,021259,159,883187,757,655219,976,793
1,717,477,352
100,378,1911,504,343,412
-2,805,235
1,607,526,838
Other assets and other liabilities are mainly non-interest rate sensitive and have been excluded from table above.
31 December 2019Less than
three Months
Between three months and one year
Over one year Non-Rate sensitive Total
USD USD USD USD USD
Financial Assets
Cash and cash equivalents Loans and advances to banks Loans and advances to customers Financial investments
Financial Liabilities
Deposits from banks Deposits from customers Other borrowed fundsLease liabilities
686,582,778145,051,972 209,045,115
11,115,463
1,051,795,328
88,402,630 799,956,007
- 156,824
888,515,461
- 153,429,18817,958,999
93,580,005
264,968,192
- 65,519,771
470,766 470,472
66,461,009
- - -
92,379,949
92,379,949
- - -
2,760,484
2,760,484
75,341- -
-
75,341
- 345,621,698
- -
345,621,698
686,658,119298,481,160227,004,114197,075,417
1,409,218,810
88,402,6301,211,097,476
470,7663,387,780
1,303,358,652
31 December 2018
USD USD USD USD USD
Financial Assets
Cash and cash equivalents Loans and advances to banks Loans and advances to customers Financial investments
Financial Liabilities
Deposits from banks Deposits from customers Other borrowed fundsLease liabilities
874,953,980 256,243,030
226,619,863 145,221,490
1,503,038,363
34,716,399 978,584,571
-
1,013,300,970
- 40,592,659
-2,142,980
42,735,639
- 38,565,355
-
38,565,355
- 5,060,000
1,412,143 -
6,472,143
- 4,513,040
1,412,299
5,925,339
65,583 - -
-
65,583
- 365,968,222
-
365,968,222
875,019,563301,895,689228,032,006147,364,470
1,552,311,728
34,716,3991,387,631,188
1,412,299
1,423,759,886
135STANDARD BANK (MAURITIUS) LIMITED Annual report 2020134
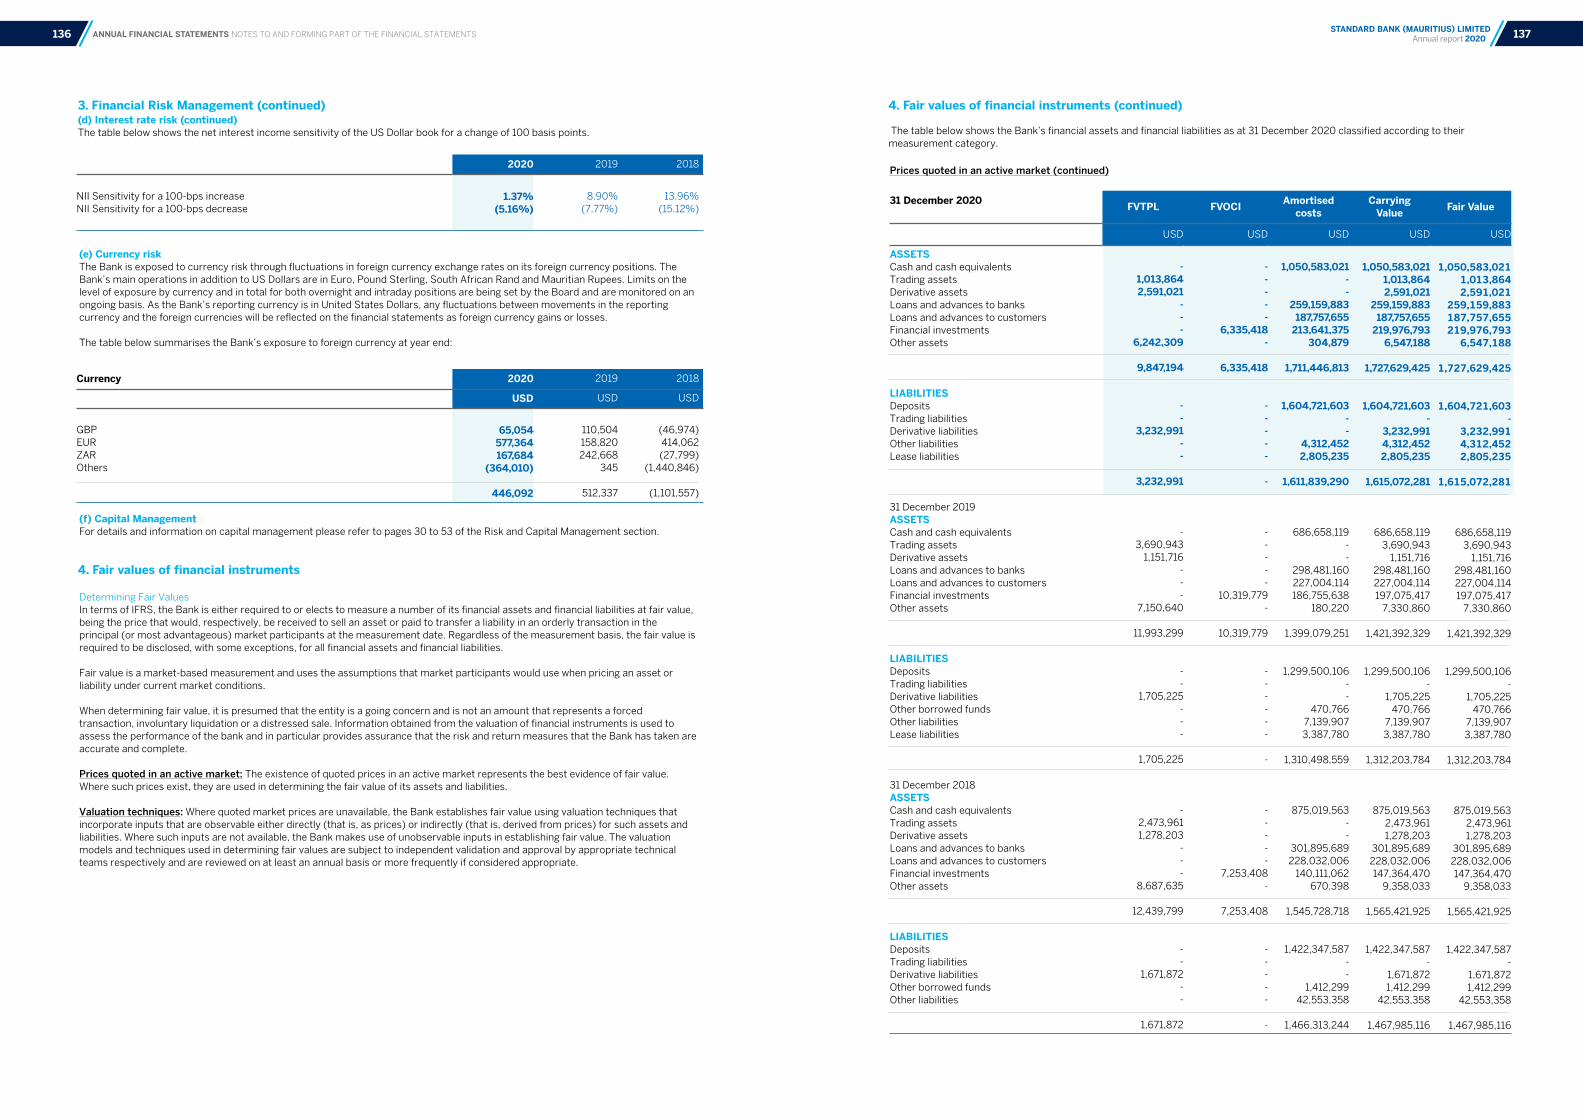
ANNUAL FINANCIAL STATEMENTS NOTES TO AND FORMING PART OF THE FINANCIAL STATEMENTS
3. Financial Risk Management (continued)(d) Interest rate risk (continued) The table below shows the net interest income sensitivity of the US Dollar book for a change of 100 basis points.
(e) Currency riskThe Bank is exposed to currency risk through fluctuations in foreign currency exchange rates on its foreign currency positions. The Bank’s main operations in addition to US Dollars are in Euro, Pound Sterling, South African Rand and Mauritian Rupees. Limits on the level of exposure by currency and in total for both overnight and intraday positions are being set by the Board and are monitored on an ongoing basis. As the Bank’s reporting currency is in United States Dollars, any fluctuations between movements in the reporting currency and the foreign currencies will be reflected on the financial statements as foreign currency gains or losses.
The table below summarises the Bank’s exposure to foreign currency at year end:
(f) Capital ManagementFor details and information on capital management please refer to pages 30 to 53 of the Risk and Capital Management section.
4. Fair values of financial instruments
Determining Fair ValuesIn terms of IFRS, the Bank is either required to or elects to measure a number of its financial assets and financial liabilities at fair value, being the price that would, respectively, be received to sell an asset or paid to transfer a liability in an orderly transaction in the principal (or most advantageous) market participants at the measurement date. Regardless of the measurement basis, the fair value is required to be disclosed, with some exceptions, for all financial assets and financial liabilities.
Fair value is a market-based measurement and uses the assumptions that market participants would use when pricing an asset or liability under current market conditions.
When determining fair value, it is presumed that the entity is a going concern and is not an amount that represents a forced transaction, involuntary liquidation or a distressed sale. Information obtained from the valuation of financial instruments is used to assess the performance of the bank and in particular provides assurance that the risk and return measures that the Bank has taken are accurate and complete.
Prices quoted in an active market: The existence of quoted prices in an active market represents the best evidence of fair value. Where such prices exist, they are used in determining the fair value of its assets and liabilities.
Valuation techniques: Where quoted market prices are unavailable, the Bank establishes fair value using valuation techniques that incorporate inputs that are observable either directly (that is, as prices) or indirectly (that is, derived from prices) for such assets and liabilities. Where such inputs are not available, the Bank makes use of unobservable inputs in establishing fair value. The valuation models and techniques used in determining fair values are subject to independent validation and approval by appropriate technical teams respectively and are reviewed on at least an annual basis or more frequently if considered appropriate.
4. Fair values of financial instruments (continued) The table below shows the Bank’s financial assets and financial liabilities as at 31 December 2020 classified according to their measurement category.
Prices quoted in an active market (continued)2020 2019 2018
NII Sensitivity for a 100-bps increase NII Sensitivity for a 100-bps decrease
1.37% (5.16%)
8.90% (7.77%)
13.96% (15.12%)
31 December 2020 FVTPL FVOCI Amortised costs
Carrying Value Fair Value
USD USD USD USD USD
ASSETS Cash and cash equivalents Trading assets Derivative assetsLoans and advances to banks Loans and advances to customers Financial investmentsOther assets
LIABILITIES DepositsTrading liabilities Derivative liabilitiesOther liabilitiesLease liabilities
31 December 2019ASSETS Cash and cash equivalents Trading assets Derivative assetsLoans and advances to banks Loans and advances to customers Financial investmentsOther assets
LIABILITIES DepositsTrading liabilities Derivative liabilitiesOther borrowed fundsOther liabilitiesLease liabilities
31 December 2018ASSETS Cash and cash equivalents Trading assets Derivative assetsLoans and advances to banks Loans and advances to customers Financial investmentsOther assets
LIABILITIES DepositsTrading liabilities Derivative liabilitiesOther borrowed fundsOther liabilities
- 1,013,8642,591,021
- - -
6,242,309
9,847,194
- -
3,232,991- -
3,232,991
- 3,690,943
1,151,716- - -
7,150,640
11,993,299
- -
1,705,225- - -
1,705,225
- 2,473,9611,278,203
- - -
8,687,635
12,439,799
- -
1,671,872- -
1,671,872
- - - - -
6,335,418-
6,335,418
- - - - -
-
- - - - -
10,319,779-
10,319,779
- - - - - -
-
- - - - -
7,253,408-
7,253,408
- - - - -
-
1,050,583,021- -
259,159,883187,757,655
213,641,375304,879
1,711,446,813
1,604,721,603- -
4,312,4522,805,235
1,611,839,290
686,658,119- -
298,481,160227,004,114186,755,638
180,220
1,399,079,251
1,299,500,106- -
470,7667,139,9073,387,780
1,310,498,559
875,019,563- -
301,895,689228,032,006
140,111,062670,398
1,545,728,718
1,422,347,587- -
1,412,29942,553,358
1,466,313,244
1,050,583,0211,013,8642,591,021
259,159,883187,757,655
219,976,7936,547,188
1,727,629,425
1,604,721,603-
3,232,9914,312,4522,805,235
1,615,072,281
686,658,1193,690,943
1,151,716298,481,160227,004,114197,075,417
7,330,860
1,421,392,329
1,299,500,106-
1,705,225470,766
7,139,9073,387,780
1,312,203,784
875,019,5632,473,9611,278,203
301,895,689228,032,006147,364,470
9,358,033
1,565,421,925
1,422,347,587-
1,671,8721,412,299
42,553,358
1,467,985,116
1,050,583,0211,013,8642,591,021
259,159,883187,757,655219,976,793
6,547,188
1,727,629,425
1,604,721,603-
3,232,9914,312,4522,805,235
1,615,072,281
686,658,1193,690,943
1,151,716298,481,160227,004,114197,075,417
7,330,860
1,421,392,329
1,299,500,106-
1,705,225470,766
7,139,9073,387,780
1,312,203,784
875,019,5632,473,9611,278,203
301,895,689228,032,006147,364,470
9,358,033
1,565,421,925
1,422,347,587-
1,671,8721,412,299
42,553,358
1,467,985,116
Currency 2020 2019 2018
USD USD USD
GBP EUR ZAR Others
65,054577,364167,684
(364,010)
446,092
110,504 158,820 242,668
345
512,337
(46,974) 414,062 (27,799)
(1,440,846)
(1,101,557)
137STANDARD BANK (MAURITIUS) LIMITED Annual report 2020136

ANNUAL FINANCIAL STATEMENTS NOTES TO AND FORMING PART OF THE FINANCIAL STATEMENTS
4. Fair values of financial instruments (continued)The tables that follow analyse the Bank’s financial assets and liabilities at the end of the reporting period, by level of fair value hierarchy as required by IFRS. The different levels are based on the extent to which observable market data and inputs are used in the calculation of the fair value of the financial assets and liabilities.
The levels of the hierarchy are defined in Note 2.1.
Fair value measurement disclosures – level 2
The valuation techniques used in determining the fair value of assets and liabilities classified within level 2 of the fair value hierarchy is the discounted cash flow model and other valuation techniques commonly used by market participants. Such models are populated using market parameters that are corroborated by reference to independent market data, where possible, or alternative sources such as third-party quotes, recent transaction prices or suitable proxies. The inputs used include discount rates (including credit spreads), liquidity discount rates, risk-free and volatility rates, risk premiums, volatilities and correlations.
Fair value measurement disclosures – level 3
The fair value of level 3 assets and liabilities is determined using valuation techniques which incorporate assumptions that are not supported by prices from observable current market transactions in the same asset or liability and are not based on available observable market data. Changes in these assumptions could affect the reported fair values of these financial assets and liabilities. Where discounted cash flow analysis are used, estimated future cash flows are based on management’s best estimates and a market-related discount rate at the reporting date for a financial asset or liability with similar terms and conditions.
Although the Bank believes that its estimates of fair values are appropriate, changing one or more of these assumptions to reasonably possible alternative values could impact the fair value of its assets and liabilities. The behaviour of the unobservable parameters used to fair value level 3 financial assets and liabilities is not necessarily independent and may often hold a relationship with other observable and unobservable market parameters. Where material and possible, such relationships are captured in the valuation by way of correlation factors, though these factors are, themselves, frequently unobservable. In such instances, the range of possible and reasonable fair value estimates is taken into account when determining appropriate model adjustments.
5. Use of estimates and judgement
Key sources of estimation uncertaintyIn preparing the annual financial statements, estimates and assumptions are made that could materially affect the reported amounts of assets and liabilities within the next financial year. Estimates and judgements are continually evaluated and are based on factors such as historical experience and current best estimates of uncertain future events that are believed to be reasonable under the circumstances. Unless otherwise stated, no material changes to assumptions have occurred during the year.Allowances for credit losses
Allowances for credit lossesThe measurement of the expected credit loss allowance for financial assets measured at amortised cost and FVOCI is an area that requires the use of complex models and significant assumptions about future economic conditions and credit behaviour (e.g. the likelihood of customers defaulting and the resulting losses). Explanations of inputs, assumptions and estimation techniques used in measuring ECL is further detailed in note 2.1b. A number of significant judgements are also required in applying the accounting requirements for measuring ECL, such as: • Determining the criteria for significant increase in credit risk;
• Choosing appropriate models and assumptions for measurement of ECL;
• Establishing the number and relative weightings of forward-looking scenarios for each type of product/market and the associated ECL.
Detailed information about the judgements and estimated made by the Bank in the above areas is set out in note 2.1b. Management assessed and considered the sensitivity of the IFRS 9 provision against the forward-looking economic conditions at a client level.
The reviews and ratings of each client are performed at least annually. This process entails credit analysts completing a credit scorecard and incorporating forward looking information. The weighting is reflected in both the determination of significant increase in credit risk as well as the measurement of the resulting IFRS 9 provision for the individual client. Therefore, the impact of forward-looking economic conditions is embedded into the total IFRS 9 provision for each CIB client and cannot be stressed or separated out of the overall IFRS 9 provision.
Retirement Benefit ObligationsThe present value of the retirement benefit obligations depends on a number of factors that are determined on an actuarial basis using a number of assumptions. Any changes in the assumptions will impact the carrying amount of pension obligations.
The assumptions used in determining the net cost (income) for pensions include the discount rate. The actuarial report determines the appropriate discount rate at the end of each year and which are validated by the Bank. This is the interest rate that should be used to determine the present value of estimated future cash outflows expected to be required to settle the pension obligations. In determining the appropriate discount rate, the actuary considers the interest rates of high-quality corporate bonds that are denominated in the currency in which the benefits will be paid and that have terms to maturity approximating the terms of the related pension liability. Other key assumptions for pension obligations are based in part on current market conditions.
The sensitivity analysis for the key assumptions are disclosed in Note 31(c).
31 December 2020 Level 1 Level 2 Level 3 Carrying Value Fair Value
USD USD USD USD USD
ASSETS Trading assets Derivative assetsFinancial investments through OCIOther assets
LIABILITIES Derivative liabilities
31 December 2019ASSETS Trading assets Derivative assetsFinancial investments through OCIOther assets
LIABILITIES Derivative liabilities
31 December 2018ASSETS Trading assets Derivative assetsFinancial investments through OCIOther assets
LIABILITIES Derivative liabilities
- - -
6,242,309
6,242,309
-
USD
- - -
7,150,640
7,150,640
-
- - -
8,687,635
8,687,635
-
1,013,8642,591,0216,335,418
-
9,940,303
3,232,991
USD
3,690,9431,151,716
10,319,779-
15,162,438
1,705,225
2,473,9611,278,203 7,253,408
-
11,005,572
1,671,872
- - -
-
-
USD
- - -
-
-
- - - -
-
-
1,013,8642,591,0216,335,4186,242,309
16,182,612
3,232,991
USD
3,690,9431,151,716
10,319,7797,150,640
22,313,078
1,705,225
2,473,9611,278,2037,253,4088,687,635
19,693,207
1,671,872
1,013,8642,591,0216,335,4186,242,309
16,182,612
3,232,991
USD
3,690,9431,151,716
10,319,7797,150,640
22,313,078
1,705,225
2,473,9611,278,2037,253,4088,687,635
19,693,207
1,671,872
There has been no transfer between the different fair value levels during the year.
139STANDARD BANK (MAURITIUS) LIMITED Annual report 2020138
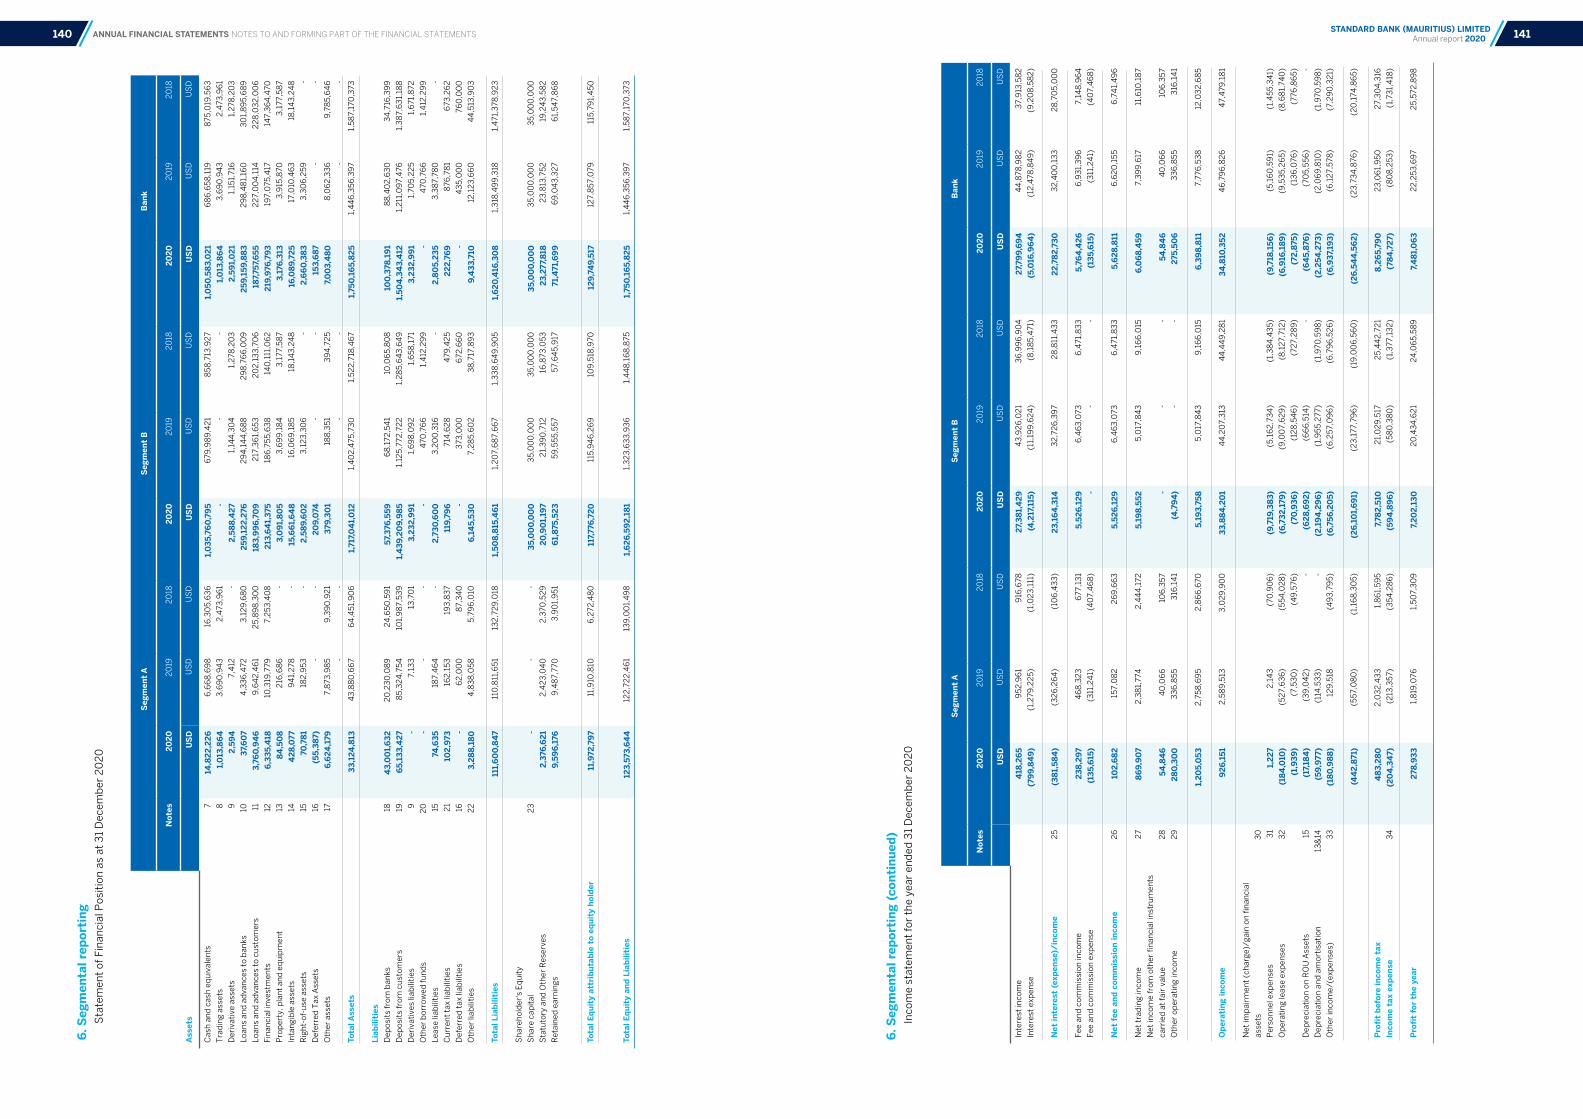
ANNUAL FINANCIAL STATEMENTS NOTES TO AND FORMING PART OF THE FINANCIAL STATEMENTS
6. S
egm
enta
l rep
orti
ng
Sta
tem
ent
of F
inan
cial
Pos
itio
n a
s at
31
Dec
emb
er 2
02
0
Seg
men
t A
S
egm
ent
BB
ank
Not
es20
202
019
20
1820
202
019
20
1820
202
019
20
18
Ass
ets
US
DU
SD
US
DU
SD
US
DU
SD
US
DU
SD
US
D
Cas
h a
nd
cas
h e
qu
ival
ents
Tra
din
g as
sets
Der
ivat
ive
asse
ts
Loan
s an
d a
dva
nce
s to
ban
ks
Loan
s an
d a
dva
nce
s to
cu
stom
ers
Fin
anci
al in
vest
men
ts
Pro
per
ty, p
lan
t an
d e
qu
ipm
ent
Inta
ngi
ble
ass
ets
Rig
ht-
of-u
se a
sset
s
Def
erre
d T
ax A
sset
s
Oth
er a
sset
s
Tota
l Ass
ets
Liab
iliti
esD
epos
its
from
ban
ks
Dep
osit
s fr
om c
ust
omer
s
Der
ivat
ives
liab
iliti
es
Oth
er b
orro
wed
fun
ds
Leas
e lia
bili
ties
Cu
rren
t ta
x lia
bili
ties
Def
erre
d t
ax li
abili
ties
Oth
er li
abili
ties
Tota
l Lia
bilit
ies
Sh
areh
old
er's
Eq
uit
y
Sh
are
cap
ital
Sta
tuto
ry a
nd
Oth
er R
eser
ves
Ret
ain
ed e
arn
ings
Tota
l Equ
ity
attr
ibut
able
to
equi
ty h
olde
r
Tota
l Equ
ity
and
Liab
iliti
es
7 8 9 10 11 12 13 14 15 16 17 18 19 9
20 15 21
16 22
23
14,8
22,2
261,
013
,86
42,
594
37,6
07
3,76
0,9
46
6,33
5,4
1884
,50
84
28,0
7770
,781
(55,
387)
6,6
24,1
79 33
,124
,813
43,
00
1,6
326
5,13
3,4
27- -
74,6
3510
2,97
3 -3,
288,
180
111,
60
0,8
47 -
2,37
6,6
219,
596,
176
11,9
72,7
97 12
3,57
3,6
44
6,6
68
,69
8
3,6
90
,94
3
7,4
12
4,3
36
,472
9,6
42
,46
1
10,3
19,7
79
216
,68
6
94
1,2
78
182
,95
3 -
7,8
73,9
85 -
43
,88
0,6
67
20
,23
0,0
89
85
,32
4,7
54
7,13
3 -
187,
46
4
162
,15
3
62
,00
0
4,8
38
,05
8
110
,811
,65
1 -
2,4
23
,04
0
9,4
87,
770
11,9
10,8
10
122
,72
2,4
61
16,3
05
,63
6
2,4
73,9
61 -
3,1
29
,68
0
25
,89
8,3
00
7,2
53
,40
8 - - - -
9,3
90
,92
1 -
64
,45
1,9
06
24
,65
0,5
91
101,
98
7,5
39
13,7
01 - -
193
,83
7
87,
34
0
5,7
96
,010
132
,72
9,0
18
-
2,3
70,5
29
3,9
01,
95
1
6,2
72,4
80
139
,00
1,4
98
1,0
35,7
60
,79
5 -2,
588,
427
259,
122,
276
183,
99
6,70
921
3,6
41,
375
3,0
91,
805
15,6
61,
64
82,
589,
60
220
9,0
7437
9,30
1
1,71
7,0
41,
012
57,3
76,5
591,
439
,20
9,9
853,
232,
99
1 -2,
730
,60
011
9,79
6 -6,
145,
530
1,50
8,81
5,4
61
35,0
00
,00
020
,90
1,19
76
1,87
5,52
3 11
7,77
6,72
0 1,
626
,59
2,18
1
679
,98
9,4
21 -
1,14
4,3
04
29
4,1
44
,68
8
217
,36
1,6
53
186
,75
5,6
38
3,6
99
,18
4
16,0
69
,18
5
3,1
23
,30
6 -
188
,35
1 -
1,4
02
,475
,73
0
68
,172
,54
1
1,12
5,7
72,7
22
1,6
98
,09
2
470
,76
6
3,2
00
,316
714
,62
8
373
,00
0
7,2
85
,60
2
1,2
07,
68
7,6
67
35
,00
0,0
00
21,
39
0,7
12
59
,55
5,5
57
115
,94
6,2
69
1,3
23
,63
3,9
36
85
8,7
13,9
27 -
1,2
78,2
03
29
8,7
66
,00
9
20
2,1
33
,70
6
140
,111
,06
2
3,1
77,5
87
18
,14
3,2
48 - -
39
4,7
25 -
1,5
22
,718
,46
7
10,0
65
,80
8
1,2
85
,64
3,6
49
1,6
58
,171
1,4
12,2
99 -
479
,42
5
672
,66
0
38
,717
,89
3
1,3
38
,64
9,9
05
35
,00
0,0
00
16,8
73,0
53
57,
64
5,9
17
109
,518
,970
1,4
48
,16
8,8
75
1,0
50,5
83,0
211,
013
,86
42,
591,
021
259,
159,
883
187,
757,
655
219,
976,
793
3,17
6,31
316
,089
,725
2,6
60
,383
153,
687
7,0
03,
480
1,75
0,1
65,
825
100
,378
,19
11,
504
,34
3,4
123,
232,
99
1 -2,
805,
235
222,
769 -
9,4
33,7
10
1,6
20,4
16,3
08
35,0
00
,00
023
,277
,818
71,4
71,6
99
129,
749,
517
1,75
0,1
65,
825
68
6,6
58
,119
3,6
90
,94
3
1,15
1,71
6
29
8,4
81,
160
22
7,0
04
,114
197,
075
,417
3,9
15,8
70
17,0
10,4
63
3,3
06
,25
9 -
8,0
62
,33
6 -
1,4
46
,35
6,3
97
88
,40
2,6
30
1,2
11,0
97,
476
1,7
05
,22
5
470
,76
6
3,3
87,
780
876
,78
1
43
5,0
00
12,1
23
,66
0
1,3
18,4
99
,318
35
,00
0,0
00
23
,813
,75
2
69
,04
3,3
27
127,
85
7,0
79
1,4
46
,35
6,3
97
875
,019
,56
3
2,4
73,9
61
1,2
78,2
03
30
1,8
95
,68
9
22
8,0
32
,00
6
147,
36
4,4
70
3,1
77,5
87
18,1
43
,24
8 - -
9,7
85
,64
6 -
1,5
87,
170
,373
34
,716
,39
9
1,3
87,
63
1,18
8
1,6
71,8
72
1,4
12,2
99
-
673
,26
2
760
,00
0
44
,513
,90
3
1,4
71,3
78,9
23
35
,00
0,0
00
19,2
43
,58
2
61,
54
7,8
68
115
,79
1,4
50
1,5
87,
170
,373
6. S
egm
enta
l rep
orti
ng (
cont
inue
d)In
com
e st
atem
ent
for
the
year
en
ded
31
Dec
emb
er 2
02
0
Seg
men
t A
S
egm
ent
BB
ank
Not
es20
202
019
20
1820
202
019
20
1820
202
019
20
18
US
DU
SD
US
DU
SD
US
DU
SD
US
DU
SD
US
D
Inte
rest
inco
me
Inte
rest
exp
ense
Net
inte
rest
(ex
pens
e)/i
ncom
e
Fee
and
com
mis
sion
inco
me
Fee
and
com
mis
sion
exp
ense
Net
fee
and
com
mis
sion
inco
me
Net
tra
din
g in
com
e
Net
inco
me
from
oth
er fi
nan
cial
inst
rum
ents
carr
ied
at
fair
val
ue
Oth
er o
per
atin
g in
com
e
Ope
rati
ng in
com
e
Net
imp
airm
ent
(ch
arge
)/ga
in o
n fi
nan
cial
asse
ts
Per
son
nel
exp
ense
s
Op
erat
ing
leas
e ex
pen
ses
Dep
reci
atio
n o
n R
OU
Ass
ets
Dep
reci
atio
n a
nd
am
orti
sati
on
Oth
er in
com
e/(e
xpen
ses)
Pro
fit
befo
re in
com
e ta
x In
com
e ta
x ex
pens
e
Pro
fit
for
the
year
25
26 27
28
29
30 31
32 15
13&
14 33
34
418
,26
5(7
99,
849
)
(3
81,5
84)
238,
297
(135
,615
)
10
2,6
82
869,
90
7
54,8
46
280
,30
0
1,
205,
053
926
,151
1,22
7(1
84,0
10)
(1,9
39)
(17,
184
)(5
9,97
7)(1
80,9
88)
(44
2,87
1)
483
,280
(20
4,3
47)
278,
933
95
2,9
61
(1,2
79,2
25
)
(32
6,2
64
)
46
8,3
23
(311
,24
1)
157,
08
2
2,3
81,
774
40
,06
6
33
6,8
55
2,7
58
,69
5
2,5
89
,513
2,1
43
(52
7,6
36
)
(7,5
30
)
(39
,04
2)
(114
,53
3)
129
,518
(55
7,0
80
)
2,0
32
,43
3
(213
,35
7)
1,8
19,0
76
916
,678
(1,0
23
,111
)
(10
6,4
33
)
677
,13
1
(40
7,4
68
)
26
9,6
63
2,4
44
,172
106
,35
7
316
,14
1
2,8
66
,670
3,0
29
,90
0
(70
,90
6)
(55
4,0
28
)
(49
,576
) - -
(49
3,7
95
)
(1,1
68
,30
5)
1,8
61,
59
5
(35
4,2
86
)
1,5
07,
30
9
27,3
81,4
29(4
,217
,115
) 23
,16
4,3
14 5,
526,
129
-
5,52
6,12
9 5,
198,
552
-
(4
,79
4)
5,19
3,75
8 33
,884
,20
1
(9,7
19,3
83)
(6,7
32,1
79)
(70
,936
)(6
28,6
92)
(2,1
94
,29
6)
(6,7
56,2
05)
(26,
101,
691)
7,78
2,51
0(5
94
,89
6)
7,20
2,13
0
43
,92
6,0
21
(11,
199
,62
4)
32
,72
6,3
97
6,4
63
,073
-
6,4
63
,073
5,0
17,8
43
-
-
5,0
17,8
43
44
,20
7,3
13
(5,1
62
,73
4)
(9,0
07,
62
9)
(12
8,5
46
)
(66
6,5
14)
(1,9
55
,277
)
(6,2
57,
09
6)
(23
,177
,79
6)
21,
02
9,5
17
(58
0,3
80
)
20
,43
4,6
21
36
,99
6,9
04
(8,1
85
,471
)
28
,811
,43
3
6,4
71,8
33
-
6,4
71,8
33
9,1
66
,015
-
-
9,1
66
,015
44
,44
9,2
81
(1,3
84
,43
5)
(8,1
27,
712
)
(72
7,2
89
) -
(1,9
70,5
98
)
(6,7
96
,52
6)
(19
,00
6,5
60
)
25
,44
2,7
21
(1,3
77,1
32
)
24
,06
5,5
89
2
7,79
9,69
4
(
5,0
16,9
64
)
22,7
82,7
30
5,76
4,4
26(1
35,6
15)
5,6
28,8
11
6,0
68,
459
54,8
46
275,
506
6,39
8,81
1
34,8
10,3
52
(9,7
18,1
56)
(6,9
16,1
89)
(72,
875)
(64
5,87
6)
(2,2
54,2
73)
(6,9
37,1
93)
(26,
544
,56
2)
8,26
5,79
0(7
84,7
27)
7,4
81,0
63
44
,878
,98
2
(12
,478
,84
9)
32
,40
0,1
33
6,9
31,
39
6
(311
,24
1)
6,6
20
,15
5
7,3
99
,617
40
,06
6
33
6,8
55
7,77
6,5
38
46
,79
6,8
26
(5,1
60
,59
1)
(9,5
35
,26
5)
(13
6,0
76)
(70
5,5
56
)
(2,0
69
,810
)
(6,1
27,
578
)
(23
,73
4,8
76)
23
,06
1,9
50
(80
8,2
53
)
22
,25
3,6
97
37,
913
,58
2
(9,2
08
,58
2)
28
,70
5,0
00
7,14
8,9
64
(40
7,4
68
)
6,7
41,
49
6
11,6
10,1
87
106
,35
7
316
,14
1
12,0
32
,68
5
47,
479
,18
1
(1,4
55
,34
1)
(8,6
81,
740
)
(776
,86
5) -
(1,9
70,5
98
)
(7,2
90
,32
1)
(20
,174
,86
5)
27,
30
4,3
16
(1,7
31,
418
)
25
,572
,89
8
141STANDARD BANK (MAURITIUS) LIMITED Annual report 2020140

ANNUAL FINANCIAL STATEMENTS NOTES TO AND FORMING PART OF THE FINANCIAL STATEMENTS
6. S
egm
enta
l rep
orti
ng (
cont
inue
d)S
tate
men
t of
pro
fit o
r lo
ss a
nd
oth
er c
omp
reh
ensi
ve In
com
e as
at
31
Dec
emb
er 2
02
0
Seg
men
t A
S
egm
ent
BB
ank
Not
es20
202
019
20
1820
202
019
20
1820
202
019
20
18
US
DU
SD
US
DU
SD
US
DU
SD
US
DU
SD
US
D
Pro
fit
for
the
year
Oth
er c
ompr
ehen
sive
Inco
me
Item
th
at m
ay b
e re
clas
sifie
d t
o p
rofit
or
loss
Net
(lo
ss)
/gai
n o
n fa
ir v
alu
e of
deb
t in
stru
men
ts
Item
th
at m
ay n
ot b
e re
clas
sifie
d t
o p
rofit
or
loss
Rem
easu
rem
ent
of d
efin
ed b
enef
it li
abili
ties
Oth
er c
ompr
ehen
sive
inco
me
for
the
year
Tota
l com
preh
ensi
ve in
com
e fo
r th
e ye
ar
278,
933 -
(8,9
05)
-(1
5,4
24)
(24
,329
)
254
,60
4
1,8
19,0
76
-
22
,474
-(1
3,8
02
)
8,6
72
1,8
27,
748
1,5
07,
30
9 -
14,2
76
- -
14,2
76
1,5
21,
58
5
7,20
2,13
0 - - -(5
64
,29
6)
(56
4,2
96
)
6,6
37,8
34
20
,43
4,6
21 - - -
(23
5,6
19)
(23
5,6
19)
20
,19
9,0
02
24
,06
5,5
89 - - - - -
24
,06
5,5
89
7,4
81,0
63 -
(8,9
05)
-(5
79,7
20)
(588
,625
)
6,89
2,4
38
22
,25
3,6
97 -
22
,474
-(2
49
,42
1)
(22
6,9
47)
22
,02
6,7
50
25
,572
,89
8 -
14,2
76
- -
14,2
76
25
,58
7,17
4
2020 2019 2018
Net debt reconciliationCash and cash equivalentsLease liabilities
At 31 December
1,050,583,021(2,805,235)
1,047,777,786
686,658,119(3,387,780)
683,270,339
875,019,563-
875,019,563
Cash Lease liabilities Total
Net debt analysis Net debt at 01 January 2020Cash flows (i)Net foreign exchange difference Other changes (ii)
Net changes to leases (iii)Net debt at 31 December 2020
Net debt at 31 December 2019Recognised on adoption of IFRS 16 (Note 15)Cash flows (i)Net foreign exchange difference
Other changes (ii)
Net changes to leases (iii)
Net debt at 31 December 2019
Net debt as at 01 January 2018Net foreign exchange differenceOther changes (ii)Cash flows
Net debt as at 31 December 2018
686,658,119
364,061,500(31,540)
(105,058)-
1,050,583,021
875,019,563-
(187,700,995)(648,363)
(12,086)-
686,658,119
570,823,648(262,821)
2,366304,456,370
875,019,563
(3,387,780)734,887
--
(152,342)
(2,805,235) -
(3,938,098)
783,525--
(233,207)
(3,387,780)
----
-
683,270,339364,796,387
(31,540)(105,058)
(152,342)
1,047,777,786
875,019,563(3,938,098)
(186,917,470)(648,363)
(12,086)(233,207)
683,270,339)
570,823,648(262,821)
2,366304,456,370
875,019,563
(i) Cashflows for lease liabilities include principal portion payment classified within financing activities and interest payment classified within operating activities.(ii) Other changes include effect of IFRS 9 impairment charge on cash and cash equivalents.(iii) Net changes to leases include non-cash movements relating to interest expense and acquisition of leases.
7. Cash and cash equivalents2020 2019 2018
USD USD USD
Bank TotalCash in handForeign currency notes and coinsUnrestricted balances with Central Bank Balances with local banksBalances with banks abroadLess Stage 1 ECL Collective Allowance
Segment ACash in handForeign currency notes and coinsUnrestricted balances with Central Bank Balance with local banksLess Stage 1 ECL Collective Allowance
Segment BBalances with banks abroadLess Stage 1 ECL Collective Allowance
54,7327,711
14,759,783-
1,035,882,109(121,314)
1,050,583,021
54,732 7,711 14,759,783
--
14,822,226 1,035,882,109 (121,314) 1,035,760,795
54,78420,558
6,203,320390,042
680,005,671(16,256)
686,658,119
54,78420,558
6,203,320390,042
(6)
6,668,698
680,005,671(16,250)
679,989,421
59,7666,459
16,239,411-
858,742,268(28,341)
875,019,563
59,7666,459
16,239,411--
16,305,636
858,742,268(28,341)
858,713,927
143STANDARD BANK (MAURITIUS) LIMITED Annual report 2020142
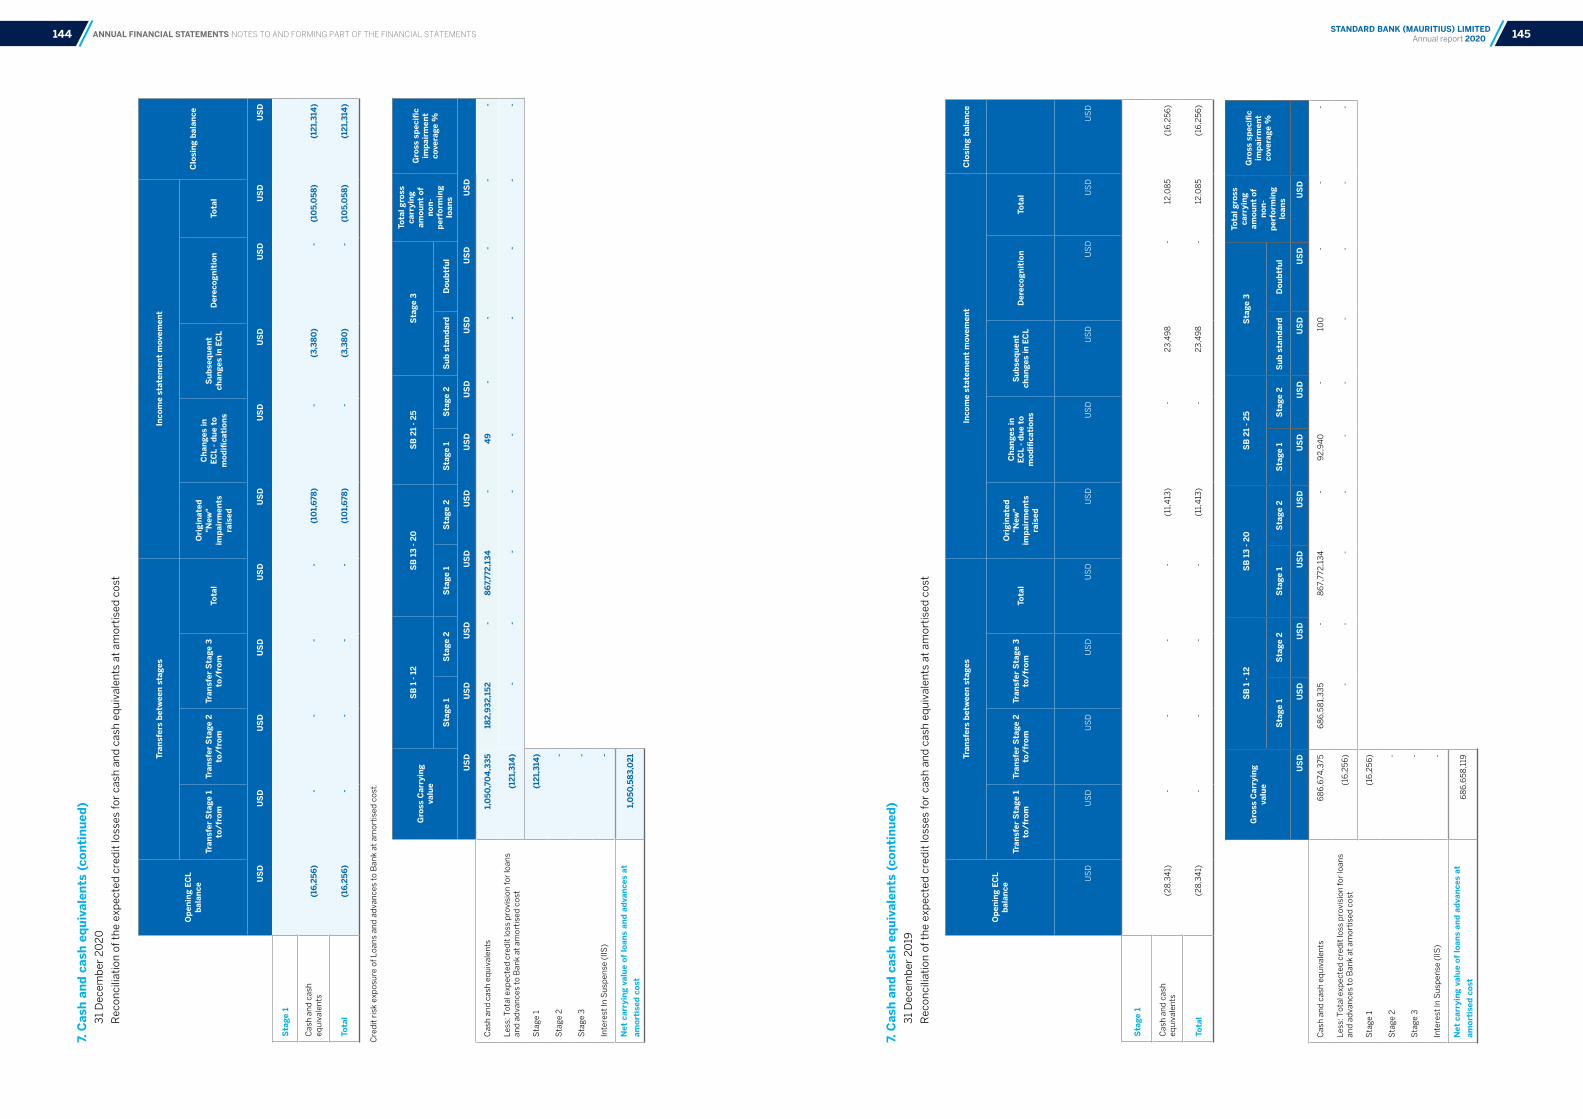
ANNUAL FINANCIAL STATEMENTS NOTES TO AND FORMING PART OF THE FINANCIAL STATEMENTS
7. C
ash
and
cash
equ
ival
ents
(co
ntin
ued)
31
Dec
emb
er 2
02
0
Rec
onci
liati
on o
f th
e ex
pec
ted
cre
dit
loss
es fo
r ca
sh a
nd
cas
h e
qu
ival
ents
at
amor
tise
d c
ost
7. C
ash
and
cash
equ
ival
ents
(co
ntin
ued)
31
Dec
emb
er 2
019
Rec
onci
liati
on o
f th
e ex
pec
ted
cre
dit
loss
es fo
r ca
sh a
nd
cas
h e
qu
ival
ents
at
amor
tise
d c
ost
Cre
dit
ris
k ex
pos
ure
of L
oan
s an
d a
dva
nce
s to
Ban
k at
am
orti
sed
cos
t.
Ope
ning
EC
L ba
lanc
e
Tran
sfer
s be
twee
n st
ages
Inco
me
stat
emen
t m
ovem
ent
Clo
sing
bal
ance
Tran
sfer
Sta
ge 1
to
/fro
mTr
ansf
er S
tage
2
to/f
rom
Tran
sfer
Sta
ge 3
to
/fro
mTo
tal
Ori
gina
ted
"New
" im
pair
men
ts
rais
ed
Cha
nges
in
ECL
- due
to
mod
ifica
tion
s
Sub
sequ
ent
chan
ges
in E
CL
Der
ecog
niti
onTo
tal
US
DU
SD
US
DU
SD
US
DU
SD
US
DU
SD
US
DU
SD
US
D
Sta
ge 1
Cas
h a
nd
cas
h
equ
ival
ents
(16,
256
)-
--
-(1
01,
678)
-(3
,380
)-
(10
5,0
58)
(121
,314
)
Tota
l (1
6,25
6)
--
--
(10
1,67
8)-
(3,3
80)
-(1
05,
058
)(1
21,3
14)
Ope
ning
EC
L ba
lanc
e
Tran
sfer
s be
twee
n st
ages
Inco
me
stat
emen
t m
ovem
ent
Clo
sing
bal
ance
Tran
sfer
Sta
ge 1
to
/fro
mTr
ansf
er S
tage
2
to/f
rom
Tran
sfer
Sta
ge 3
to
/fro
mTo
tal
Ori
gina
ted
"New
" im
pair
men
ts
rais
ed
Cha
nges
in
ECL
- due
to
mod
ifica
tion
s
Sub
sequ
ent
chan
ges
in E
CL
Der
ecog
niti
onTo
tal
US
DU
SD
US
DU
SD
US
DU
SD
US
DU
SD
US
DU
SD
US
D
Sta
ge 1
Cas
h a
nd
cas
h
equ
ival
ents
(28
,34
1)-
--
-(1
1,4
13)
-2
3,4
98
-12
,08
5(1
6,2
56
)
Tota
l (2
8,3
41)
--
--
(11,
413
)-
23
,49
8-
12,0
85
(16
,25
6)
Gro
ss C
arry
ing
valu
e
SB
1 -
12S
B 1
3 - 2
0S
B 2
1 - 2
5S
tage
3To
tal g
ross
ca
rryi
ng
amou
nt o
f no
n-
perf
orm
ing
loan
s
Gro
ss s
peci
fic
impa
irm
ent
cove
rage
%S
tage
1S
tage
2S
tage
1S
tage
2S
tage
1S
tage
2S
ub s
tand
ard
Dou
btfu
l
U
SD
US
DU
SD
US
DU
SD
US
DU
SD
US
DU
SD
US
D
Cas
h a
nd
cas
h e
qu
ival
ents
1,0
50,7
04
,335
182,
932,
152
-86
7,77
2,13
4-
49
--
--
-
Less
: Tot
al e
xpec
ted
cre
dit
loss
pro
visi
on fo
r lo
ans
and
ad
van
ces
to B
ank
at a
mor
tise
d c
ost
(121
,314
)-
--
--
--
--
Sta
ge 1
(121
,314
)
Sta
ge 2
-
Sta
ge 3
-
Inte
rest
In S
usp
ense
(IIS
)-
Net
car
ryin
g va
lue
of lo
ans
and
adva
nces
at
amor
tise
d co
st
1,0
50,5
83,0
21
Gro
ss C
arry
ing
valu
e
SB
1 -
12S
B 1
3 - 2
0S
B 2
1 - 2
5S
tage
3To
tal g
ross
ca
rryi
ng
amou
nt o
f no
n-
perf
orm
ing
loan
s
Gro
ss s
peci
fic
impa
irm
ent
cove
rage
%S
tage
1S
tage
2S
tage
1S
tage
2S
tage
1S
tage
2S
ub s
tand
ard
Dou
btfu
l
U
SD
US
DU
SD
US
DU
SD
US
DU
SD
US
DU
SD
US
D
Cas
h a
nd
cas
h e
qu
ival
ents
68
6,6
74,3
756
86
,58
1,3
35
-8
67,
772
,13
4-
92
,94
0
-10
0-
--
Less
: Tot
al e
xpec
ted
cre
dit
loss
pro
visi
on fo
r lo
ans
and
ad
van
ces
to B
ank
at a
mor
tise
d c
ost
(16
,25
6)
--
--
--
--
--
Sta
ge 1
(16
,25
6)
Sta
ge 2
-
Sta
ge 3
-
Inte
rest
In S
usp
ense
(IIS
)-
Net
car
ryin
g va
lue
of lo
ans
and
adva
nces
at
amor
tise
d co
st
68
6,6
58
,119
145STANDARD BANK (MAURITIUS) LIMITED Annual report 2020144

ANNUAL FINANCIAL STATEMENTS NOTES TO AND FORMING PART OF THE FINANCIAL STATEMENTS
7. C
ash
and
cash
equ
ival
ents
(co
ntin
ued)
31
Dec
emb
er 2
018
Rec
onci
liati
on o
f th
e ex
pec
ted
cre
dit
loss
es fo
r ca
sh a
nd
cas
h e
qu
ival
ents
at
amor
tise
d c
ost
Cre
dit
ris
k ex
pos
ure
of c
ash
an
d c
ash
eq
uiv
alen
ts a
t am
orti
sed
cos
t.
Ope
ning
EC
L ba
lanc
e
Tran
sfer
s be
twee
n st
ages
Inco
me
stat
emen
t m
ovem
ent
Clo
sing
bal
ance
Tran
sfer
Sta
ge 1
to
/fro
mTr
ansf
er S
tage
2
to/f
rom
Tran
sfer
Sta
ge 3
to
/fro
mTo
tal
Ori
gina
ted
"New
" im
pair
men
ts
rais
ed
Cha
nges
in
ECL
- due
to
mod
ifica
tion
s
Sub
sequ
ent
chan
ges
in E
CL
Der
ecog
niti
onTo
tal
US
DU
SD
US
DU
SD
US
DU
SD
US
DU
SD
US
DU
SD
US
D
Sta
ge 1
Ban
k le
nd
ing
(2
8,2
95
)-
--
- (
23
,93
2)
- 2
3,8
86
-
(4
6)
(2
8,3
41)
Tota
l (
28
,29
5)
--
--
(2
3,9
32
)-
23
,88
6
- (
46
) (
28
,34
1)
Gro
ss C
arry
ing
valu
e
SB
1 -
12S
B 1
3 - 2
0S
B 2
1 - 2
5S
tage
3To
tal g
ross
ca
rryi
ng
amou
nt
of n
on-
perf
orm
ing
loan
s
Gro
ss s
peci
fic
impa
irm
ent
cove
rage
%
Sta
ge 1
Sta
ge 2
Sta
ge 1
Sta
ge 2
Sta
ge 1
Sta
ge 2
Sub
sta
ndar
d D
oubt
ful
U
SD
US
DU
SD
US
DU
SD
US
DU
SD
US
DU
SD
US
D
Cor
por
ate
len
din
g8
75,0
47,
90
4 8
75,0
20
,515
-
27,
38
9
--
--
-0
%0
%
Sov
erei
gn le
nd
ing
-
Ban
k le
nd
ing
Inte
rcom
pan
y
Gro
ss c
arry
ing
valu
e of
cas
h an
d ca
sh
equi
vale
nts
875
,04
7,9
04
Less
: Tot
al e
xpec
ted
cre
dit
loss
pro
visi
on fo
r ca
sh
and
cas
h e
qu
ival
ents
at
amor
tise
d c
ost
(2
8,3
41)
Sta
ge 1
(2
8,3
41)
Sta
ge 2
-
Sta
ge 3
-
Inte
rest
In S
usp
ense
(IIS
)-
Net
car
ryin
g va
lue
of lo
ans
and
adva
nces
at
amor
tise
d co
st
875
,019
,56
3
8. Trading assets
Bank – Total & Segment A 2020 2019 2018
USD USD USD
Sovereign
Current
1,013,864
1,013,864
3,690,943
3,690,943
2,473,961
2,473,961
Fair value of assets Fair value of liabilities
2020 2019 2018 2020 2019 2018
USD USD USD USD USD USD
Bank TotalHeld-for-tradingHeld-for-hedging
Segment AHeld-for-trading
Segment BHeld-for-tradingHeld-for-hedging
Current
Non-current
2,591,021
-
2,591,021
2,594
2,594
2,588,427
-
2,588,427
2,591,021
-
1,151,716-
1,151,716
7,412
7,412
1,144,304 -
1,144,304
1,151,716
-
1,278,203 -
1,278,203
-
-
1,278,203 -
1,278,203
1,278,203
-
2,546,347686,644
3,232,991
-
-
2,546,347
686,644
3,232,991
2,967,163
265,828
1,063,354641,871
1,705,225
7,133
7,133
1,056,221
641,871
1,698,092
1,063,354
641,871
1,258,594413,278
1,671,872
13,701
13,701
1,244,893413,278
1,658,171
1,258,594
413,278
9. Derivative instruments All derivatives are classified as either derivatives held-for-trading or derivatives held-for-hedging. A summary of the fair values of the derivative assets and derivative liabilities is as follows:
147STANDARD BANK (MAURITIUS) LIMITED Annual report 2020146
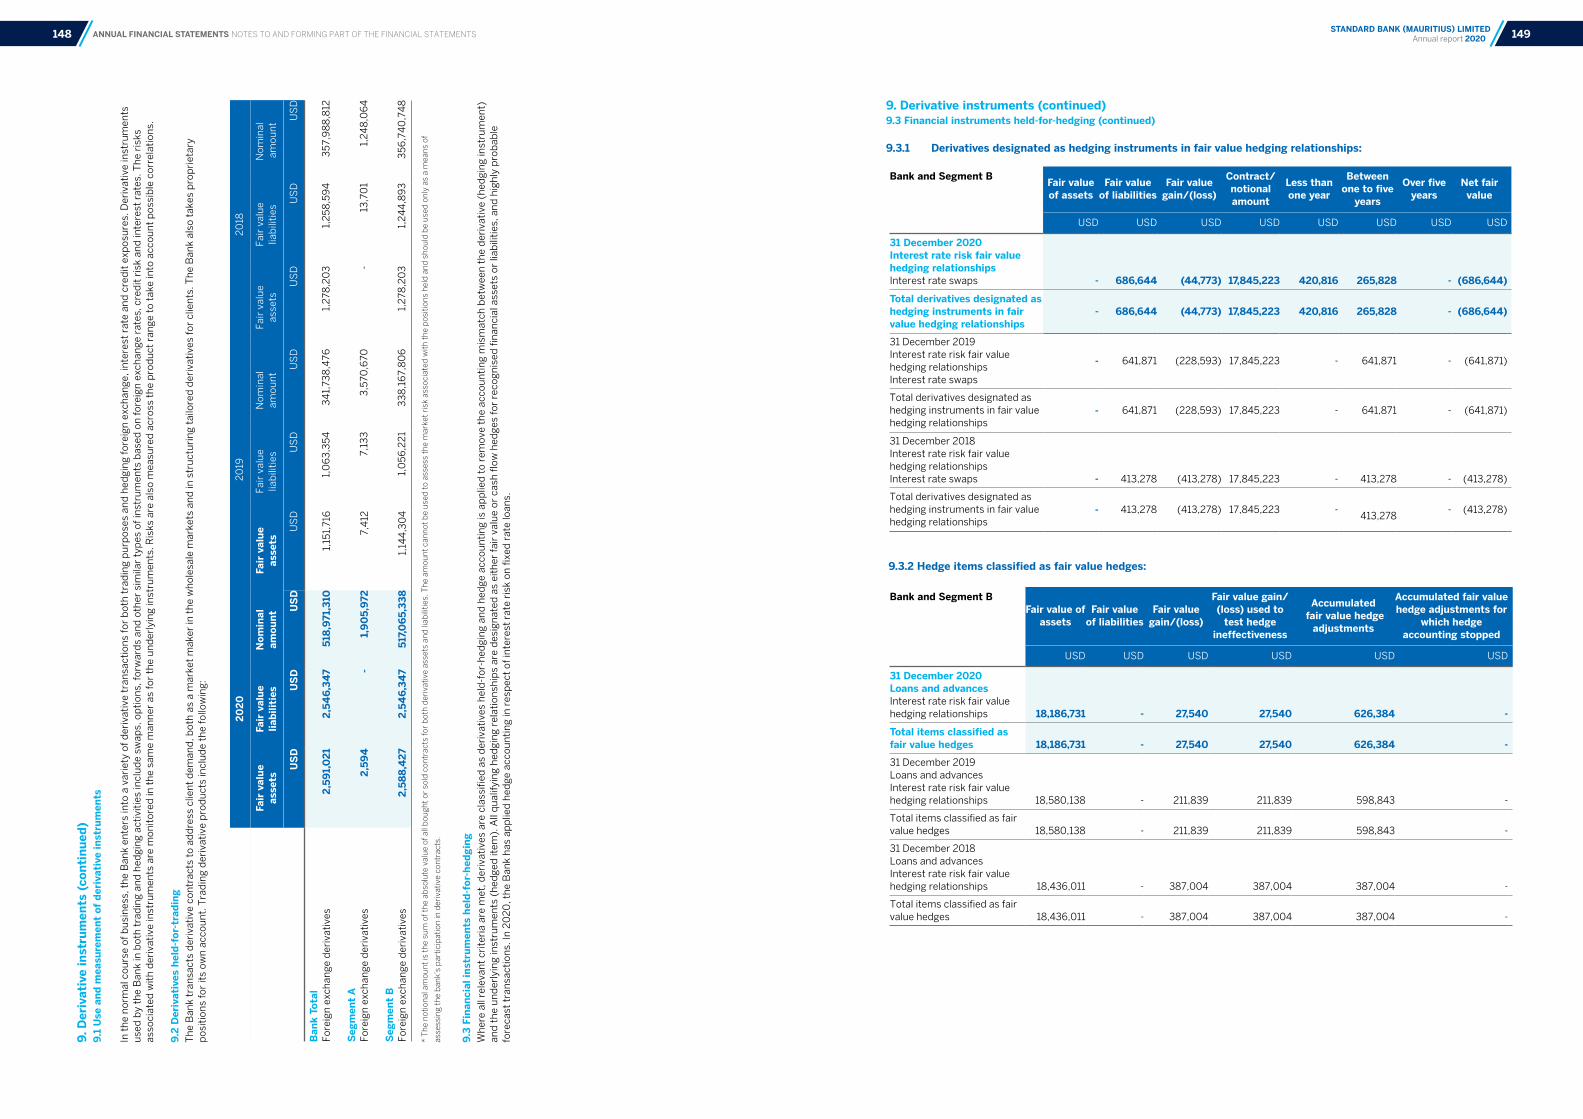
ANNUAL FINANCIAL STATEMENTS NOTES TO AND FORMING PART OF THE FINANCIAL STATEMENTS
9. D
eriv
ativ
e in
stru
men
ts (
cont
inue
d)
9.1
Use
and
mea
sure
men
t of
der
ivat
ive
inst
rum
ents
In t
he
nor
mal
cou
rse
of b
usi
nes
s, t
he
Ban
k en
ters
into
a v
arie
ty o
f der
ivat
ive
tran
sact
ion
s fo
r b
oth
tra
din
g p
urp
oses
an
d h
edgi
ng
fore
ign
exc
han
ge, i
nte
rest
rat
e an
d c
red
it e
xpos
ure
s. D
eriv
ativ
e in
stru
men
ts
use
d b
y th
e B
ank
in b
oth
tra
din
g an
d h
edgi
ng
acti
viti
es in
clu
de
swap
s, o
pti
ons,
forw
ard
s an
d o
ther
sim
ilar
typ
es o
f in
stru
men
ts b
ased
on
fore
ign
exc
han
ge r
ates
, cre
dit
ris
k an
d in
tere
st r
ates
. Th
e ri
sks
asso
ciat
ed w
ith
der
ivat
ive
inst
rum
ents
are
mon
itor
ed in
th
e sa
me
man
ner
as
for
the
un
der
lyin
g in
stru
men
ts. R
isks
are
als
o m
easu
red
acr
oss
the
pro
du
ct r
ange
to
take
into
acc
oun
t p
ossi
ble
cor
rela
tion
s.
9.2
Der
ivat
ives
hel
d-fo
r-tr
adin
gT
he
Ban
k tr
ansa
cts
der
ivat
ive
con
trac
ts t
o ad
dre
ss c
lien
t d
eman
d, b
oth
as
a m
arke
t m
aker
in t
he
wh
oles
ale
mar
kets
an
d in
str
uct
uri
ng
tailo
red
der
ivat
ives
for
clie
nts
. Th
e B
ank
also
tak
es p
rop
riet
ary
pos
itio
ns
for
its
own
acc
oun
t. T
rad
ing
der
ivat
ive
pro
du
cts
incl
ud
e th
e fo
llow
ing:
9.3
Fina
ncia
l ins
trum
ents
hel
d-fo
r-he
dgin
g W
her
e al
l rel
evan
t cr
iter
ia a
re m
et, d
eriv
ativ
es a
re c
lass
ified
as
der
ivat
ives
hel
d-f
or-h
edgi
ng
and
hed
ge a
ccou
nti
ng
is a
pp
lied
to
rem
ove
the
acco
un
tin
g m
ism
atch
bet
wee
n t
he
der
ivat
ive
(hed
gin
g in
stru
men
t)
and
th
e u
nd
erly
ing
inst
rum
ents
(h
edge
d it
em).
All
qu
alify
ing
hed
gin
g re
lati
onsh
ips
are
des
ign
ated
as
eith
er fa
ir v
alu
e or
cas
h fl
ow h
edge
s fo
r re
cogn
ised
fin
anci
al a
sset
s or
liab
iliti
es, a
nd
hig
hly
pro
bab
le
fore
cast
tra
nsa
ctio
ns.
In 2
02
0, t
he
Ban
k h
as a
pp
lied
hed
ge a
ccou
nti
ng
in r
esp
ect
of in
tere
st r
ate
risk
on
fixe
d r
ate
loan
s.
* T
he n
otio
nal a
mou
nt is
the
sum
of t
he a
bso
lute
val
ue o
f all
bou
ght
or s
old
con
trac
ts fo
r b
oth
der
ivat
ive
asse
ts a
nd li
abili
ties.
The
am
ount
can
not
be
used
to
asse
ss t
he m
arke
t ri
sk a
ssoc
iate
d w
ith t
he p
ositi
ons
held
and
sho
uld
be
used
onl
y as
a m
eans
of
asse
ssin
g th
e b
ank’
s p
artic
ipat
ion
in d
eriv
ativ
e co
ntra
cts.
20
20
20
192
018
Fair
val
ue
asse
tsFa
ir v
alue
lia
bilit
ies
Nom
inal
am
ount
Fair
val
ue
asse
tsFa
ir v
alu
e lia
bili
ties
Nom
inal
am
oun
tFa
ir v
alu
e as
sets
Fair
val
ue
liab
iliti
esN
omin
al a
mou
nt
US
DU
SD
US
DU
SD
US
DU
SD
US
DU
SD
US
D
Ban
k To
tal
Fore
ign
exc
han
ge d
eriv
ativ
es
Seg
men
t A
Fore
ign
exc
han
ge d
eriv
ativ
es
Seg
men
t B
Fore
ign
exc
han
ge d
eriv
ativ
es
2,59
1,0
21
2,5
94
2,58
8,4
27
2,54
6,34
7
-
2,54
6,34
7
518,
971,
310
1,9
05,
972
517,
06
5,33
8
1,15
1,71
6
7,4
12
1,14
4,3
04
1,0
63
,35
4
7,13
3
1,0
56
,22
1
34
1,73
8,4
76
3,5
70,6
70
33
8,1
67,
80
6
1,2
78,2
03
-
1,2
78,2
03
1,2
58
,59
4
13,7
01
1,2
44
,89
3
35
7,9
88
,812
1,2
48
,06
4
35
6,7
40
,74
8 9. Derivative instruments (continued)9.3 Financial instruments held-for-hedging (continued)
9.3.1 Derivatives designated as hedging instruments in fair value hedging relationships:
9.3.2 Hedge items classified as fair value hedges:
Bank and Segment B Fair value of assets
Fair value of liabilities
Fair value gain/(loss)
Contract/ notional amount
Less than one year
Between one to five
years
Over five years
Net fair value
USD USD USD USD USD USD USD USD
31 December 2020Interest rate risk fair value hedging relationshipsInterest rate swaps - 686,644 (44,773) 17,845,223 420,816 265,828 - (686,644)
Total derivatives designated as hedging instruments in fair value hedging relationships
- 686,644 (44,773) 17,845,223 420,816 265,828 - (686,644)
31 December 2019Interest rate risk fair value hedging relationshipsInterest rate swaps
- 641,871 (228,593) 17,845,223 - 641,871 - (641,871)
Total derivatives designated as hedging instruments in fair value hedging relationships
- 641,871 (228,593) 17,845,223 - 641,871 - (641,871)
31 December 2018Interest rate risk fair value hedging relationshipsInterest rate swaps - 413,278 (413,278) 17,845,223 -
413,278 - (413,278)
Total derivatives designated as hedging instruments in fair value hedging relationships
- 413,278 (413,278) 17,845,223 -
413,278- (413,278)
Bank and Segment BFair value of
assetsFair value
of liabilitiesFair value
gain/(loss)
Fair value gain/(loss) used to
test hedge ineffectiveness
Accumulated fair value hedge
adjustments
Accumulated fair value hedge adjustments for
which hedge accounting stopped
USD USD USD USD USD USD
31 December 2020Loans and advancesInterest rate risk fair value hedging relationships 18,186,731 - 27,540 27,540 626,384 -
Total items classified as fair value hedges 18,186,731 - 27,540 27,540 626,384 -
31 December 2019Loans and advancesInterest rate risk fair value hedging relationships 18,580,138 - 211,839 211,839 598,843 -
Total items classified as fair value hedges 18,580,138 - 211,839 211,839 598,843 -
31 December 2018Loans and advancesInterest rate risk fair value hedging relationships 18,436,011 - 387,004 387,004 387,004 -
Total items classified as fair value hedges 18,436,011 - 387,004 387,004 387,004 -
149STANDARD BANK (MAURITIUS) LIMITED Annual report 2020148

ANNUAL FINANCIAL STATEMENTS NOTES TO AND FORMING PART OF THE FINANCIAL STATEMENTS
10. Loans and advances to banks 9. Derivative instruments (continued)9.3 Financial instruments held-for-hedging (continued)
9.3.3 Hedge ineffectiveness recognised in profit or loss:
Bank and Segment B Trading revenue Other fair value movements Net interest income
USD USD USD
31 December 2020Fair value hedgesInterest rate risk fair value hedging relationships - - (39,038)
31 December 2019Fair value hedgesInterest rate risk fair value hedging relationships - - (2,491)
31 December 2018Fair value hedgesInterest rate risk fair value hedging relationships - - (679)
2020 2019 2018
USD USD USD
Bank TotalLoans and advances to banks Less Stage 1 ECL Collective Allowance
Segment ALoans and advances to banks Less Stage 1 ECL Collective Allowance
Segment BLoans and advances to banks Less Stage 1 ECL Collective Allowance
259,679,814(519,931)
259,159,883
37,608(1)
37,607
259,642,206(519,930)
259,122,276
298,671,634(190,474)
298,481,160
4,336,939(467)
4,336,472
294,334,695(190,007)
294,144,688
302,101,501(205,812)
301,895,689
3,129,842(162)
3,129,680
298,971,659(205,650)
298,766,009
Remaining term to maturity
Bank TotalUp to 3 monthsOver 3 months and up to 6 monthsOver 6 months and up to 12 monthsOver 1 year and up to 5 yearsOver 5 years
Remaining term to maturitySegment AUp to 3 months Over 3 months and up to 6 monthsOver 6 months and up to 12 months
Remaining term to maturity Segment BUp to 3 monthsOver 3 months and up to 6 monthsOver 6 months and up to 12 monthsOver 1 year and up to 5 yearsOver 5 years
Current assets
Non-current assets
37,60899,321,90033,873,187
126,447,119-
259,679,814
37,608--
37,608
-99,321,90033,873,187
126,447,119-
259,642,206
133,232,695
126,447,119
65,041
66,469,100184,647,869
40,575,9476,913,677
298,671,634
65,0414,271,898
-
4,336,939
- 62,197,202184,647,869
40,575,9476,913,677
294,334,695
251,182,010
47,489,624
2,415,737
56,925,966168,662,049
65,485,850 8,611,899
302,101,501
2,415,737512,764201,341
3,129,842
- 56,413,202168,460,708 65,485,850
8,611,899
298,971,659
228,003,752
74,097,749
151STANDARD BANK (MAURITIUS) LIMITED Annual report 2020150

ANNUAL FINANCIAL STATEMENTS NOTES TO AND FORMING PART OF THE FINANCIAL STATEMENTS
10. L
oans
and
adv
ance
s to
ban
ks (
cont
inue
d)
31
Dec
emb
er 2
02
0
Rec
onci
liati
on o
f th
e ex
pec
ted
cre
dit
loss
es fo
r lo
ans
and
ad
van
ces
to b
ank
at a
mor
tise
d c
ost
10. L
oans
and
adv
ance
s to
ban
ks (
cont
inue
d)
31
Dec
emb
er 2
019
R
econ
cilia
tion
of t
he
exp
ecte
d c
red
it lo
sses
for
loan
s an
d a
dva
nce
s to
ban
k at
am
orti
sed
cos
t
Cre
dit
ris
k ex
pos
ure
of l
oan
s an
d a
dva
nce
s to
Ban
k at
am
orti
sed
cos
t.
Ope
ning
EC
L ba
lanc
e
Tran
sfer
s be
twee
n st
ages
Inco
me
stat
emen
t m
ovem
ent
Impa
ired
ac
coun
ts w
ritt
en
off
Cur
renc
y tr
ansl
atio
n an
d ot
her
mov
emen
ts
Rec
lass
ifica
tion
in
/out
of
AC
m
easu
rem
ent
cate
gory
Clo
sing
ba
lanc
eTr
ansf
er
Sta
ge 1
to
/fro
m
Tran
sfer
S
tage
2
to/f
rom
Tran
sfer
S
tage
3 t
o/fr
omTo
tal
Ori
gina
ted
"New
" im
pair
men
ts
rais
ed
Cha
nges
in
ECL
- due
to
mod
ifica
tion
s
Sub
sequ
ent
chan
ges
in
ECL
Der
ecog
niti
onTo
tal
US
DU
SD
US
DU
SD
US
DU
SD
US
DU
SD
US
DU
SD
US
DU
SD
US
DU
SD
Sta
ge 1
Ban
k le
nd
ing
(20
5,8
12)
--
--
(13
5,2
01)
-15
0,5
39
-15
,33
8-
--
(19
0,4
74)
Tota
l (2
05
,812
)-
--
-(1
35
,20
1)-
150
,53
9-
15,3
38
--
- (
190
,474
)
Gro
ss
Car
ryin
g va
lue
SB
1 -
12S
B 1
3 - 2
0S
B 2
1 - 2
5S
tage
3To
tal g
ross
ca
rryi
ng
amou
nt
of n
on-
perf
orm
ing
loan
s
Sec
urit
ies
and
expe
cted
re
cove
ries
on
spec
ifica
lly
impa
ired
loan
s
Inte
rest
in
susp
ense
(e
nter
as
posi
tive
)
Bal
ance
she
et
impa
irm
ents
for
non
- pe
rfor
min
g sp
ecifi
cally
im
pair
ed lo
ans
(Sta
ge
3 an
d pu
rcha
sed
or o
rigi
nate
d cr
edit
im
pair
ed)
Gro
ss
spec
ific
impa
irm
ent
cove
rage
%
Non
- pe
rfor
min
g lo
ans
%S
tage
1S
tage
2S
tage
1S
tage
2S
tage
1S
tage
2S
ub
stan
dard
D
oubt
ful
U
SD
US
DU
SD
US
DU
SD
US
DU
SD
US
DU
SD
US
DU
SD
US
DU
SD
Ban
k le
nd
ing
259,
679,
814
37,6
08
-25
9,6
42,
206
--
--
--
--
--
-
Sov
erei
gn le
nd
ing
- -
--
--
--
--
--
--
-
Gro
ss c
arry
ing
valu
e of
lo
ans
and
adva
nces
259,
679,
814
--
--
--
--
--
--
--
Less
: Tot
al e
xpec
ted
cr
edit
loss
pro
visi
on a
t am
orti
sed
cos
t (5
19,9
31)
--
--
--
--
--
--
--
Sta
ge 1
(519
,931
)
Sta
ge 2
-
Sta
ge 3
-
Pu
rch
ased
/ori
gin
ated
cr
edit
imp
aire
d
Inte
rest
In S
usp
ense
(IIS
)-
Net
car
ryin
g va
lue
at
amor
tise
d co
st
259,
159,
883
Gro
ss
Car
ryin
g va
lue
SB
1 -
12S
B 1
3 - 2
0S
B 2
1 - 2
5S
tage
3To
tal g
ross
ca
rryi
ng
amou
nt
of n
on-
perf
orm
ing
loan
s
Sec
urit
ies
and
expe
cted
re
cove
ries
on
spec
ifica
lly
impa
ired
loan
s
Inte
rest
in
susp
ense
(e
nter
as
posi
tive
)
Bal
ance
she
et
impa
irm
ents
for
non
-pe
rfor
min
g sp
ecifi
cally
im
pair
ed lo
ans
(Sta
ge
3 an
d pu
rcha
sed
or o
rigi
nate
d cr
edit
im
pair
ed)
Gro
ss
spec
ific
impa
irm
ent
cove
rage
%
Non
- pe
rfor
min
g lo
ans
%S
tage
1S
tage
2S
tage
1S
tage
2S
tage
1S
tage
2S
ub
stan
dard
D
oubt
ful
U
SD
US
DU
SD
US
DU
SD
US
DU
SD
US
DU
SD
US
DU
SD
US
DU
SD
Ban
k le
nd
ing
29
8,6
71,6
34
29
1,75
7,9
57
-6
,913
,677
--
--
--
--
--
-
Gro
ss c
arry
ing
valu
e of
lo
ans
and
adva
nces
29
8,6
71,6
34
--
--
--
--
--
--
--
Less
: Tot
al e
xpec
ted
cr
edit
loss
pro
visi
on a
t am
orti
sed
cos
t (1
90
,474
)-
--
--
--
--
--
--
-
Sta
ge 1
(19
0,4
74)
Sta
ge 2
-
Sta
ge 3
-
Pu
rch
ased
/ori
gin
ated
cr
edit
imp
aire
d
Inte
rest
In S
usp
ense
(IIS
)-
Net
car
ryin
g va
lue
at
amor
tise
d co
st
29
8,4
81,
160
Ope
ning
EC
L ba
lanc
e
Tran
sfer
s be
twee
n st
ages
Inco
me
stat
emen
t m
ovem
ent
Impa
ired
ac
coun
ts
wri
tten
off
Cur
renc
y tr
ansl
atio
n an
d ot
her
mov
emen
ts
Rec
lass
ifica
tion
in
/out
of
AC
m
easu
rem
ent
cate
gory
Clo
sing
ba
lanc
eTr
ansf
er
Sta
ge 1
to/
from
Tran
sfer
S
tage
2 t
o/fr
om
Tran
sfer
S
tage
3 t
o/fr
omTo
tal
Ori
gina
ted
"New
" im
pair
men
ts
rais
ed
Cha
nges
in
ECL
- due
to
mod
ifica
tion
s
Sub
sequ
ent
chan
ges
in E
CL
Der
ecog
niti
onTo
tal
US
DU
SD
US
DU
SD
US
DU
SD
US
DU
SD
US
DU
SD
US
DU
SD
US
DU
SD
Sta
ge 1
Ban
k le
nd
ing
(19
0,4
74)
--
--
(486
,86
1)-
157,
40
4-
(329
,457
)
(519
,931
)
Tota
l (1
90
,474
)-
--
-(4
86,8
61)
-15
7,4
04
-(3
29,4
57)
(519
,931
)
Cre
dit
ris
k ex
pos
ure
of l
oan
s an
d a
dva
nce
s to
Ban
k at
am
orti
sed
cos
t.
153STANDARD BANK (MAURITIUS) LIMITED Annual report 2020152

ANNUAL FINANCIAL STATEMENTS NOTES TO AND FORMING PART OF THE FINANCIAL STATEMENTS
10. L
oans
and
adv
ance
s to
ban
ks (
cont
inue
d)
31
Dec
emb
er 2
018
Rec
onci
liati
on o
f th
e ex
pec
ted
cre
dit
loss
es fo
r lo
ans
and
ad
van
ces
to b
ank
at a
mor
tise
d c
ost
Cre
dit
ris
k ex
pos
ure
of l
oan
s an
d a
dva
nce
s to
Ban
k at
am
orti
sed
cos
t.
Ope
ning
EC
L ba
lanc
e
Tran
sfer
s be
twee
n st
ages
Inco
me
stat
emen
t m
ovem
ent
Impa
ired
ac
coun
ts
wri
tten
-off
Cur
renc
y tr
ansl
atio
n an
d ot
her
mov
emen
ts
Rec
lass
ifica
tion
in
/out
of
AC
m
easu
rem
ent
cate
gory
Clo
sing
bal
ance
Tran
sfer
S
tage
1 t
o/fr
om
Tran
sfer
S
tage
2 t
o/fr
om
Tran
sfer
S
tage
3 t
o/fr
omTo
tal
Ori
gina
ted
"New
" im
pair
men
ts
rais
ed
Cha
nges
in
ECL
- due
to
mod
ifica
tion
s
Sub
sequ
ent
chan
ges
in E
CL
Der
ecog
niti
onTo
tal
US
DU
SD
US
DU
SD
US
DU
SD
US
DU
SD
US
DU
SD
US
DU
SD
US
DU
SD
Sta
ge 1
Ban
k le
nd
ing
(17
6,3
40
)-
--
- (
168
,92
1)-
139
,44
9-
(2
9,4
72)
--
- (
20
5,8
12)
Tota
l (
176
,34
0)
--
--
(16
8,9
21)
-13
9,4
49
- (
29
,472
)-
--
(2
05
,812
)
Gro
ss
Car
ryin
g va
lue
SB
1 -
12S
B 1
3 - 2
0S
B 2
1 - 2
5S
tage
3To
tal g
ross
ca
rryi
ng
amou
nt
of n
on-
perf
orm
ing
loan
s
Sec
urit
ies
and
expe
cted
re
cove
ries
on
spec
ifica
lly
impa
ired
loan
s
Inte
rest
in
susp
ense
(e
nter
as
posi
tive
)
Bal
ance
she
et
impa
irm
ents
for
non
-pe
rfor
min
g sp
ecifi
cally
im
pair
ed lo
ans
(Sta
ge
3 an
d pu
rcha
sed
or o
rigi
nate
d cr
edit
im
pair
ed)
Gro
ss
spec
ific
impa
irm
ent
cove
rage
%
Non
- pe
rfor
min
g lo
ans
%S
tage
1S
tage
2S
tage
1S
tage
2S
tage
1S
tage
2S
ub
stan
dard
D
oubt
ful
U
SD
US
DU
SD
US
DU
SD
US
DU
SD
US
DU
SD
US
DU
SD
US
DU
SD
Cor
por
ate
len
din
g3
02
,10
1,5
01
29
3,4
89
,60
2-
8,6
11,8
99
--
--
--
--
-0
%0
%
Sov
erei
gn le
nd
ing
-
-
-
-
-
-
-
-
-
-
-
-
-
-
-
Ban
k le
nd
ing
-
-
-
-
-
-
-
-
-
-
-
-
-
-
-
Inte
rcom
pan
y -
-
-
-
-
-
-
-
-
-
-
-
-
-
-
Gro
ss c
arry
ing
valu
e of
lo
ans
and
adva
nces
30
2,1
01,
50
1
Less
: Tot
al e
xpec
ted
cr
edit
loss
pro
visi
on a
t am
orti
sed
cos
t -2
05
,812
Sta
ge 1
-20
5,8
12
Sta
ge 2
-
Sta
ge 3
-
Pu
rch
ased
/ori
gin
ated
cr
edit
imp
aire
d
Inte
rest
In S
usp
ense
(IIS
)-
Net
car
ryin
g va
lue
at
amor
tise
d co
st
30
1,8
95
,68
9
11. Loans and advances to customers
2020 2019 2018
USD USD USD
Bank-TotalPersonal LoansCorporate CustomersEntities outside Mauritius
Gross Loans and Advances to customers*Less stage 3 ECL/specific allowance Less stage 1&2 ECL collective allowance
* Amount is net of interest in suspense of USD1,273,791 (2019: USD152,646: 2018: USD314,414)
Segment APersonal LoansCorporate Customers
Less stage 3 ECL/specific allowance Less stage 1&2/ ECL collective allowance
Segment BPersonal LoansCorporate CustomersEntities outside Mauritius
Less stage 3 ECL/specific allowance Less stage 1&2 ECL/collective allowance
11.(a) Remaining term to maturity Bank TotalUp to 3 monthsOver 3 months and up to 6 monthsOver 6 months and up to 12 monthsOver 1 year and up to 5 yearsOver 5 years
Segment AUp to 3 monthsOver 3 months and up to 6 monthsOver 6 months and up to 12 monthsOver 1 year and up to 5 yearsOver 5 years
-152,972,887
52,101,826
205,074,713(15,997,580)
(1,319,478)
187,757,655
-3,765,017
3,765,017
-
3,760,946
-149,207,87052,101,826
201,309,696(15,997,580)
(1,315,407)
183,996,709
73,479,131535,156
18,266,676112,793,750
-
205,074,713
3,765,017----
3,765,017
574,422 184,948,696
49,452,035
234,975,153(7,298,018)
(673,021)
227,004,114
263,887 9,400,485
9,664,372-
(21,911)
9,642,461
310,535 175,548,21149,452,035
225,310,781(7,298,018)
(651,110)
217,361,653
90,360,964581,251
12,601,125131,121,278
310,535
234,975,153
9,400,485263,887
- -
-
9,664,372
1,164,085 178,813,375
51,955,882
231,933,342(838,673)
(3,062,663)
228,032,006
776,267 25,994,326
26,770,593(838,673)
(33,620)
25,898,300
387,818 152,819,049
51,955,882
205,162,749-
(3,029,043)
202,133,706
110,597,4161,877,335
15,291,721103,830,643
336,227
231,933,342
26,770,593-
- -
-
26,770,593
155STANDARD BANK (MAURITIUS) LIMITED Annual report 2020154
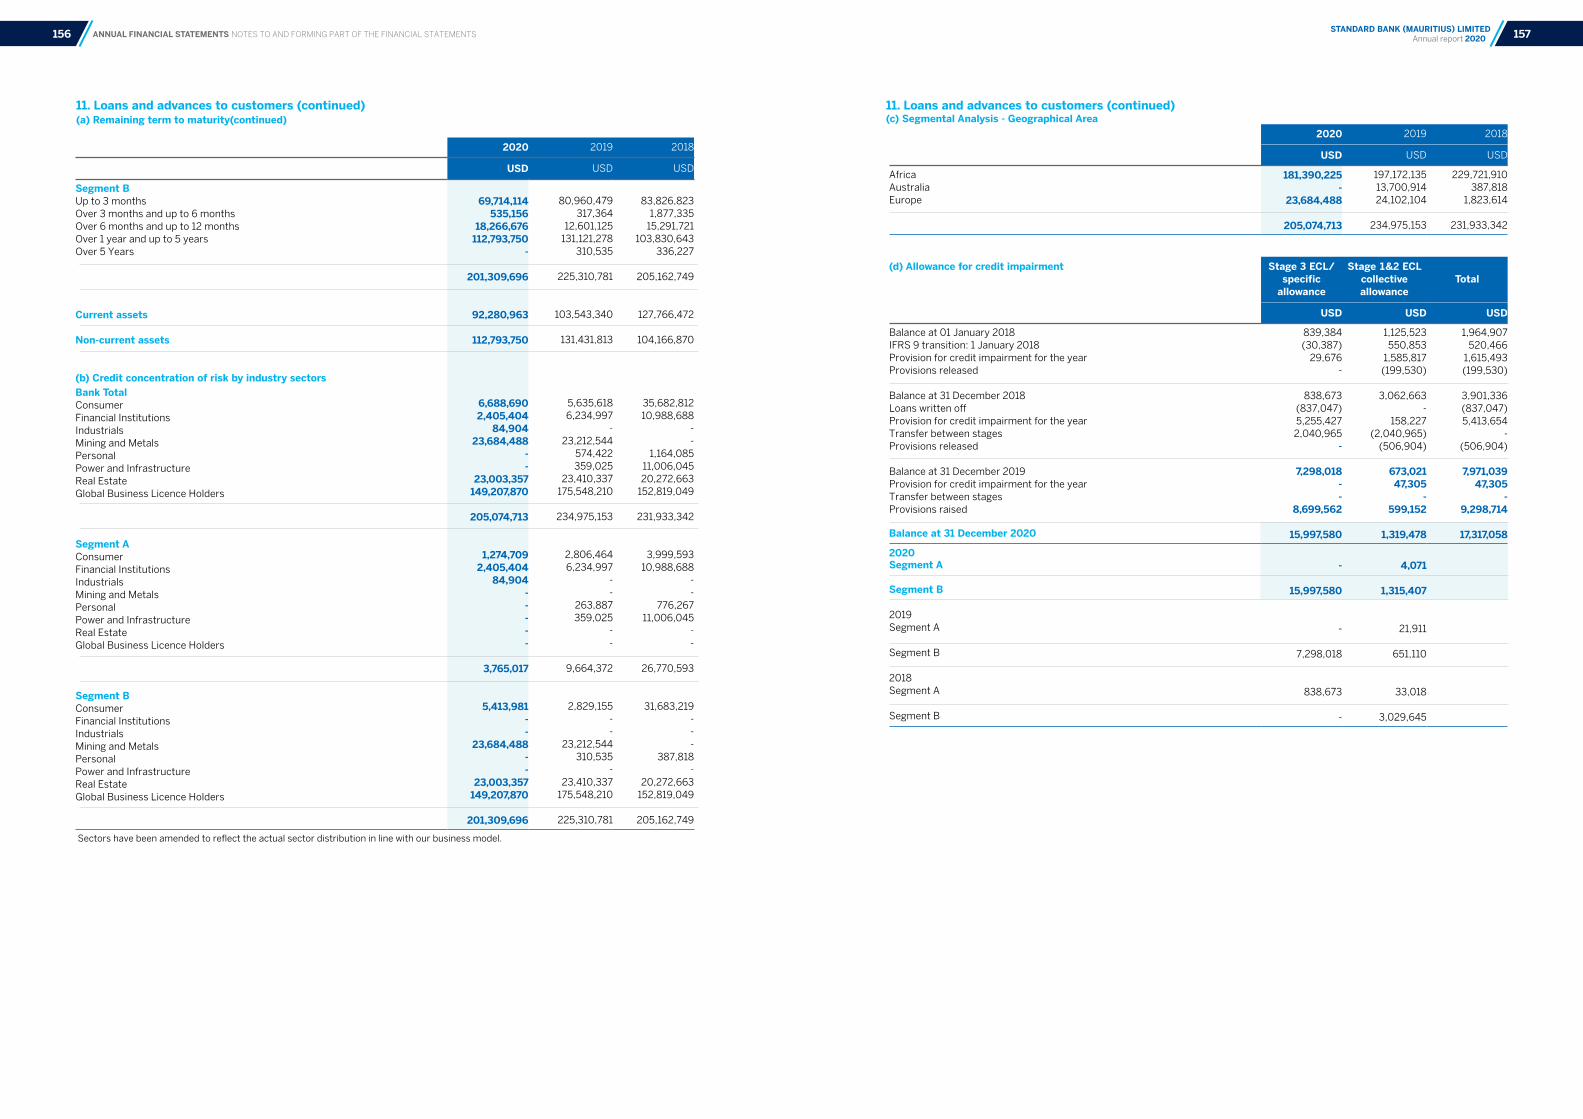
ANNUAL FINANCIAL STATEMENTS NOTES TO AND FORMING PART OF THE FINANCIAL STATEMENTS
11. Loans and advances to customers (continued) (c) Segmental Analysis - Geographical Area
11. Loans and advances to customers (continued)(a) Remaining term to maturity(continued)
2020 2019 2018
USD USD USD
AfricaAustraliaEurope
181,390,225-
23,684,488
205,074,713
197,172,13513,700,91424,102,104
234,975,153
229,721,910387,818
1,823,614
231,933,342
(d) Allowance for credit impairment Stage 3 ECL/specific
allowance
Stage 1&2 ECL collective allowance
Total
USD USD USD
Balance at 01 January 2018IFRS 9 transition: 1 January 2018Provision for credit impairment for the yearProvisions released
Balance at 31 December 2018Loans written off Provision for credit impairment for the yearTransfer between stagesProvisions released
Balance at 31 December 2019Provision for credit impairment for the yearTransfer between stagesProvisions raised
Balance at 31 December 2020
839,384 (30,387)
29,676 -
838,673(837,047)5,255,427
2,040,965 -
7,298,018--
8,699,562
15,997,580
1,125,523550,853
1,585,817 (199,530)
3,062,663-
158,227(2,040,965)
(506,904)
673,02147,305
-599,152
1,319,478
1,964,907 520,466
1,615,493 (199,530)
3,901,336 (837,047)5,413,654
- (506,904)
7,971,03947,305
-9,298,714
17,317,058
2020Segment A
Segment B
2019Segment A
Segment B
2018Segment A
Segment B
-
15,997,580
-
7,298,018
838,673
-
4,071
1,315,407
21,911
651,110
33,018
3,029,645
2020 2019 2018
USD USD USD
Segment BUp to 3 monthsOver 3 months and up to 6 monthsOver 6 months and up to 12 monthsOver 1 year and up to 5 yearsOver 5 Years
Current assets
Non-current assets
(b) Credit concentration of risk by industry sectors Bank TotalConsumerFinancial InstitutionsIndustrialsMining and MetalsPersonalPower and InfrastructureReal EstateGlobal Business Licence Holders
Segment AConsumerFinancial InstitutionsIndustrialsMining and MetalsPersonalPower and InfrastructureReal EstateGlobal Business Licence Holders
Segment BConsumerFinancial InstitutionsIndustrialsMining and MetalsPersonalPower and InfrastructureReal EstateGlobal Business Licence Holders
69,714,114535,156
18,266,676112,793,750
-
201,309,696
92,280,963
112,793,750
6,688,690 2,405,404
84,904 23,684,488
- -
23,003,357 149,207,870
205,074,713
1,274,709 2,405,404
84,904-----
3,765,017
5,413,981 - -
23,684,488 - -
23,003,357 149,207,870
201,309,696
80,960,479317,364
12,601,125131,121,278
310,535
225,310,781
103,543,340
131,431,813
5,635,6186,234,997
-23,212,544
574,422359,025
23,410,337175,548,210
234,975,153
2,806,4646,234,997
--
263,887359,025
--
9,664,372
2,829,155--
23,212,544310,535
-23,410,337
175,548,210
225,310,781
83,826,8231,877,335
15,291,721103,830,643
336,227
205,162,749
127,766,472
104,166,870
35,682,81210,988,688
--
1,164,08511,006,04520,272,663
152,819,049
231,933,342
3,999,59310,988,688
--
776,26711,006,045
--
26,770,593
31,683,219---
387,818-
20,272,663152,819,049
205,162,749
Sectors have been amended to reflect the actual sector distribution in line with our business model.
157STANDARD BANK (MAURITIUS) LIMITED Annual report 2020156

ANNUAL FINANCIAL STATEMENTS NOTES TO AND FORMING PART OF THE FINANCIAL STATEMENTS
11. Loans and advances to customers (continued)
2020 2019 2018
(e) Allowance for credit impairment by industry sectors
Gross amount of
loans
Impaired loans
Stage 3 ECL/specific
allowance
Stage 1&2 ECL
collective allowance
Total allowances for credit
impairment
Total allowances for credit
impairment
Total allowances for credit
impairment
Bank – Total USD USD USD USD USD USD USD
ConsumerFinancial InstitutionsIndustrialsMining and MetalsPersonalPower and InfrastructureReal EstateGlobal Business Licence Holders
Segment AConsumerFinancial InstitutionsIndustrialsMining and MetalsOil and GasPersonalPower and InfrastructureReal EstateGlobal Business Licence Holders
6,688,6902,405,404
84,90423,684,488
--
23,003,357149,207,870
205,074,713
1,274,709 2,405,404
84,904 ------
3,765,017
-------
21,168,525
21,168,525
- - - ------
-
-------
15,997,580
15,997,580
- - - ------
-
68,560 2,176
683 415
- -
5,629 1,242,015
1,319,478
1,212 2,176
683 ------
4,071
68,560 2,176
683 415
- -
5,629 17,239,595
17,317,058
1,212 2,176
683 ------
4,071
25,408 13,479
- 2,598 5,744
199 7,351
7,916,260
7,971,039
5,594 13,479
- --
2,639199
--
21,911
156,602 5,187
- -
2,819 842,361 179,374
2,714,993
3,901,336
21,928 5,187
- --
2,215842,361
--
871,691
Segment BConsumerFinancial InstitutionsIndustrialsMining and MetalsPersonalPower and InfrastructureReal EstateTelecoms and MediaGlobal Business Licence Holders
5,413,981 - -
23,684,488 - -
23,003,357 -
149,207,870
201,309,696
--------
21,168,525
21,168,525
--------
15,997,580
15,997,580
67,348 - -
415 - -
5,629 -
1,242,015
1,315,407
67,348--
415--
5,629-
17,239,595
17,312,987
19,814 - -
2,598 3,105
- 7,351
- 7,916,260
7,949,128
134,674 - - -
604 -
179,374 -
2,714,993
3,029,645
Impaired loans of USD21,168,525 as at 31 December 2020 (2019: 21,908,817) were from clients resident in Zimbabwe and Mozambique.
11. L
oans
and
adv
ance
s to
cus
tom
ers
(con
tinu
ed)
31
Dec
emb
er 2
02
0
Rec
onci
liati
on o
f th
e ex
pec
ted
cre
dit
loss
es fo
r lo
ans
and
ad
van
ces
at a
mor
tise
d c
ost
Ope
ning
EC
L ba
lanc
e
Tran
sfer
s be
twee
n st
ages
Inco
me
stat
emen
t m
ovem
ent
Tim
e Va
lue
of
Mon
ey
Clo
sing
ba
lanc
e Tr
ansf
er
Sta
ge 1
to
/fro
m
Tran
sfer
S
tage
2
to/
from
Tran
sfer
S
tage
3
to/f
rom
Tota
l
Ori
gina
ted
"New
" im
pair
men
ts
rais
ed
Cha
nges
in
ECL
- due
to
mod
ifica
tion
s
Sub
sequ
ent
chan
ges
in
ECL
Tota
l
US
DU
SD
US
DU
SD
US
DU
SD
US
DU
SD
US
DU
SD
US
D
Sta
ge 1
Cor
por
ate
len
din
g A
mor
tise
d
cost
673
,021
-
(79,
170
)-
(79,
170
) 4
7,30
5 -
29
4,7
49
3
42,
054
-
935
,90
5
Fin
anci
al In
vest
men
t at
A
mor
tise
d C
osts
1,6
63
--
--
3,2
28-
(1,6
63)
1,5
65
- 3
,228
Fin
anci
al In
vest
men
t at
FV
OC
I 7
4-
--
- 2
38-
(74
) 1
64
-23
8
Ban
k le
nd
ing/
Cas
h a
nd
Cas
h
Eq
uiv
alen
t at
Am
orti
sed
Cos
t20
6730
--
--
588
,539
-(1
54,0
24)
434
,515
- 6
41,
245
Non
-Fu
nd
ed F
acili
ties
at
Am
orti
sed
Cos
t 1
52,7
31-
--
- 1
35,9
23-
(8,0
37)
127
,886
- 2
80,6
17
Tota
l 1
,034
,219
-
(79,
170
)-
(79,
170
) 7
75,2
33
- 1
30,9
51
90
6,18
4
- 1
,86
1,23
3
Post
w
rite
-off
re
cove
ries
re
cogn
ised
in
PL
- - - - - -
Sta
ge 2
Cor
por
ate
len
din
g A
mor
tise
d
cost
- 7
9,17
0-
-79
,170
--
30
4,4
03
30
4,4
03
- 3
83,5
73
Fin
anci
al In
vest
men
t at
A
mor
tise
d C
osts
--
--
--
--
--
-
Fin
anci
al In
vest
men
t at
FV
OC
I-
--
--
--
--
--
Ban
k le
nd
ing/
Cas
h a
nd
Cas
h
Eq
uiv
alen
t at
Am
orti
sed
Cos
t-
--
--
--
--
--
Non
-Fu
nd
ed F
acili
ties
at
Am
orti
sed
Cos
t 3
40
-
--
--
- 8
7,71
9
87,
719
-
88,
059
Tota
l 3
40
79
,170
--
79,
170
--
392,
122
39
2,12
2 -
471
,632
- - - - - -
Sta
ge 3
(exc
ludi
ng II
S)
Cor
por
ate
len
din
g A
mor
tise
d
cost
7,2
98,
018
-
--
--
- 8
,56
5,93
6
8,5
65,
936
1
33,6
26
15,
997
,580
Fin
anci
al In
vest
men
t at
A
mor
tise
d C
osts
--
--
--
--
--
-
Fin
anci
al In
vest
men
t at
FV
OC
I-
--
--
--
--
--
Ban
k le
nd
ing/
Cas
h a
nd
Cas
h
Eq
uiv
alen
t at
Am
orti
sed
Cos
t-
--
--
--
--
--
Non
-Fu
nd
ed F
acili
ties
at
Am
orti
sed
Cos
t 1
46,
198
--
--
--
(14
6,19
8)(1
46,
198)
--
Tota
l 7
,44
4,2
16
--
- 7
9,17
0-
- 8
,419
,738
8
,419
,738
1
33,6
26
15,
997
,580
Tota
l EC
L8,
478
,775
79,1
70(7
9,17
0)
--
775
,233
- 8
,94
2,81
19,
718,
04
4 1
33,6
26
18,3
30,4
45
- - - - - - -
159STANDARD BANK (MAURITIUS) LIMITED Annual report 2020158
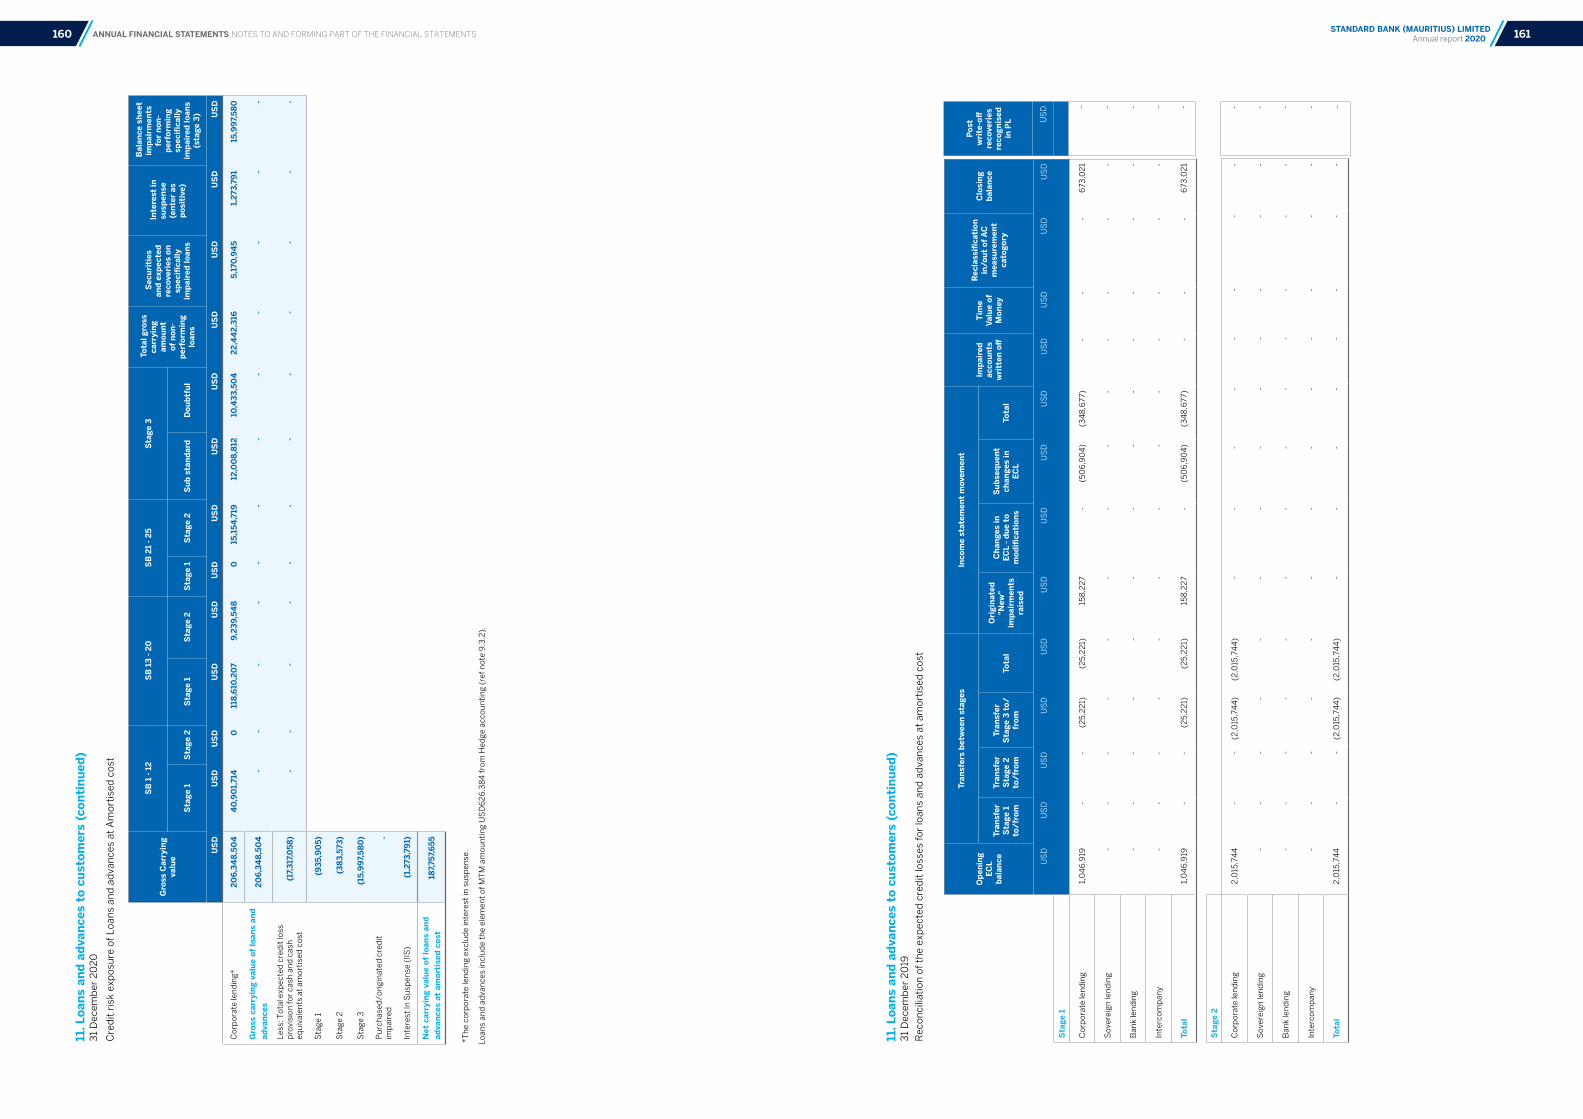
ANNUAL FINANCIAL STATEMENTS NOTES TO AND FORMING PART OF THE FINANCIAL STATEMENTS
11. L
oans
and
adv
ance
s to
cus
tom
ers
(con
tinu
ed)
31
Dec
emb
er 2
019
Rec
onci
liati
on o
f th
e ex
pec
ted
cre
dit
loss
es fo
r lo
ans
and
ad
van
ces
at a
mor
tise
d c
ost
11. L
oans
and
adv
ance
s to
cus
tom
ers
(con
tinu
ed)
31
Dec
emb
er 2
02
0
Cre
dit
ris
k ex
pos
ure
of L
oan
s an
d a
dva
nce
s at
Am
orti
sed
cos
t
Ope
ning
EC
L ba
lanc
e
Tran
sfer
s be
twee
n st
ages
Inco
me
stat
emen
t m
ovem
ent
Impa
ired
ac
coun
ts
wri
tten
off
Tim
e Va
lue
of
Mon
ey
Rec
lass
ifica
tion
in
/out
of
AC
m
easu
rem
ent
cato
gory
Clo
sing
ba
lanc
e Tr
ansf
er
Sta
ge 1
to
/fro
m
Tran
sfer
S
tage
2
to/f
rom
Tran
sfer
S
tage
3 t
o/fr
omTo
tal
Ori
gina
ted
"New
" im
pair
men
ts
rais
ed
Cha
nges
in
ECL
- due
to
mod
ifica
tion
s
Sub
sequ
ent
chan
ges
in
ECL
Tota
l
US
DU
SD
US
DU
SD
US
DU
SD
US
DU
SD
US
DU
SD
US
DU
SD
US
D
Sta
ge 1
Cor
por
ate
len
din
g 1
,04
6,9
19
--
(25
,22
1)(2
5,2
21)
15
8,2
27
-(5
06
,90
4)
(34
8,6
77)
--
- 6
73,0
21
Sov
erei
gn le
nd
ing
--
--
--
--
--
--
-
Ban
k le
nd
ing
--
--
--
--
--
--
-
Inte
rcom
pan
y-
--
--
--
--
--
--
Tota
l 1
,04
6,9
19
--
(25
,22
1)(2
5,2
21)
15
8,2
27
-(5
06
,90
4)
(34
8,6
77)
--
- 6
73,0
21
Post
w
rite
-off
re
cove
ries
re
cogn
ised
in
PL U
SD - - - - -
Sta
ge 2
Cor
por
ate
len
din
g 2
,015
,74
4
--
(2,0
15,7
44
)(2
,015
,74
4)
--
--
--
--
Sov
erei
gn le
nd
ing
--
--
--
--
--
--
-
Ban
k le
nd
ing
--
--
--
--
--
--
-
Inte
rcom
pan
y-
--
--
--
--
--
--
Tota
l 2
,015
,74
4
--
(2,0
15,7
44
)(2
,015
,74
4)
--
--
--
--
- - - - -
Gro
ss C
arry
ing
valu
e
SB
1 -
12S
B 1
3 - 2
0S
B 2
1 - 2
5S
tage
3 T
otal
gro
ss
carr
ying
am
ount
of
non
-pe
rfor
min
g lo
ans
Sec
urit
ies
and
expe
cted
re
cove
ries
on
spec
ifica
lly
impa
ired
loan
s
Inte
rest
in
susp
ense
(e
nter
as
posi
tive
)
Bal
ance
she
et
impa
irm
ents
fo
r no
n-pe
rfor
min
g sp
ecifi
cally
im
pair
ed lo
ans
(sta
ge 3
)S
tage
1S
tage
2S
tage
1S
tage
2S
tage
1S
tage
2S
ub s
tand
ard
Dou
btfu
l
US
DU
SD
US
DU
SD
US
DU
SD
US
DU
SD
US
DU
SD
US
DU
SD
US
D
Cor
por
ate
len
din
g* 2
06,
348,
504
4
0,9
01,
714
011
8,6
10,2
07
9,23
9,54
80
15,1
54,7
1912
,00
8,81
210
,433
,50
422
,44
2,31
6 5
,170
,94
5 1,
273,
791
15,
997
,580
Gro
ss c
arry
ing
valu
e of
loan
s an
d ad
vanc
es 2
06,
348,
504
-
--
--
--
--
--
-
Less
: Tot
al e
xpec
ted
cre
dit
loss
p
rovi
sion
for
cash
an
d c
ash
eq
uiv
alen
ts a
t am
orti
sed
cos
t(1
7,31
7,0
58)
--
--
--
--
--
--
Sta
ge 1
(935
,90
5)
Sta
ge 2
(383
,573
)
Sta
ge 3
(15,
997
,580
)
Pu
rch
ased
/ori
gin
ated
cre
dit
im
pai
red
-
Inte
rest
In S
usp
ense
(IIS
)(1
,273
,79
1)
Net
car
ryin
g va
lue
of lo
ans
and
adva
nces
at
amor
tise
d co
st
187,
757,
655
*T
he
corp
orat
e le
nd
ing
excl
ud
e in
tere
st in
su
spen
se.
Loan
s an
d a
dva
nce
s in
clu
de
the
elem
ent
of M
TM
am
oun
tin
g U
SD
62
6,3
84
from
Hed
ge a
ccou
nti
ng
(ref
not
e 9
.3.2
).
161STANDARD BANK (MAURITIUS) LIMITED Annual report 2020160
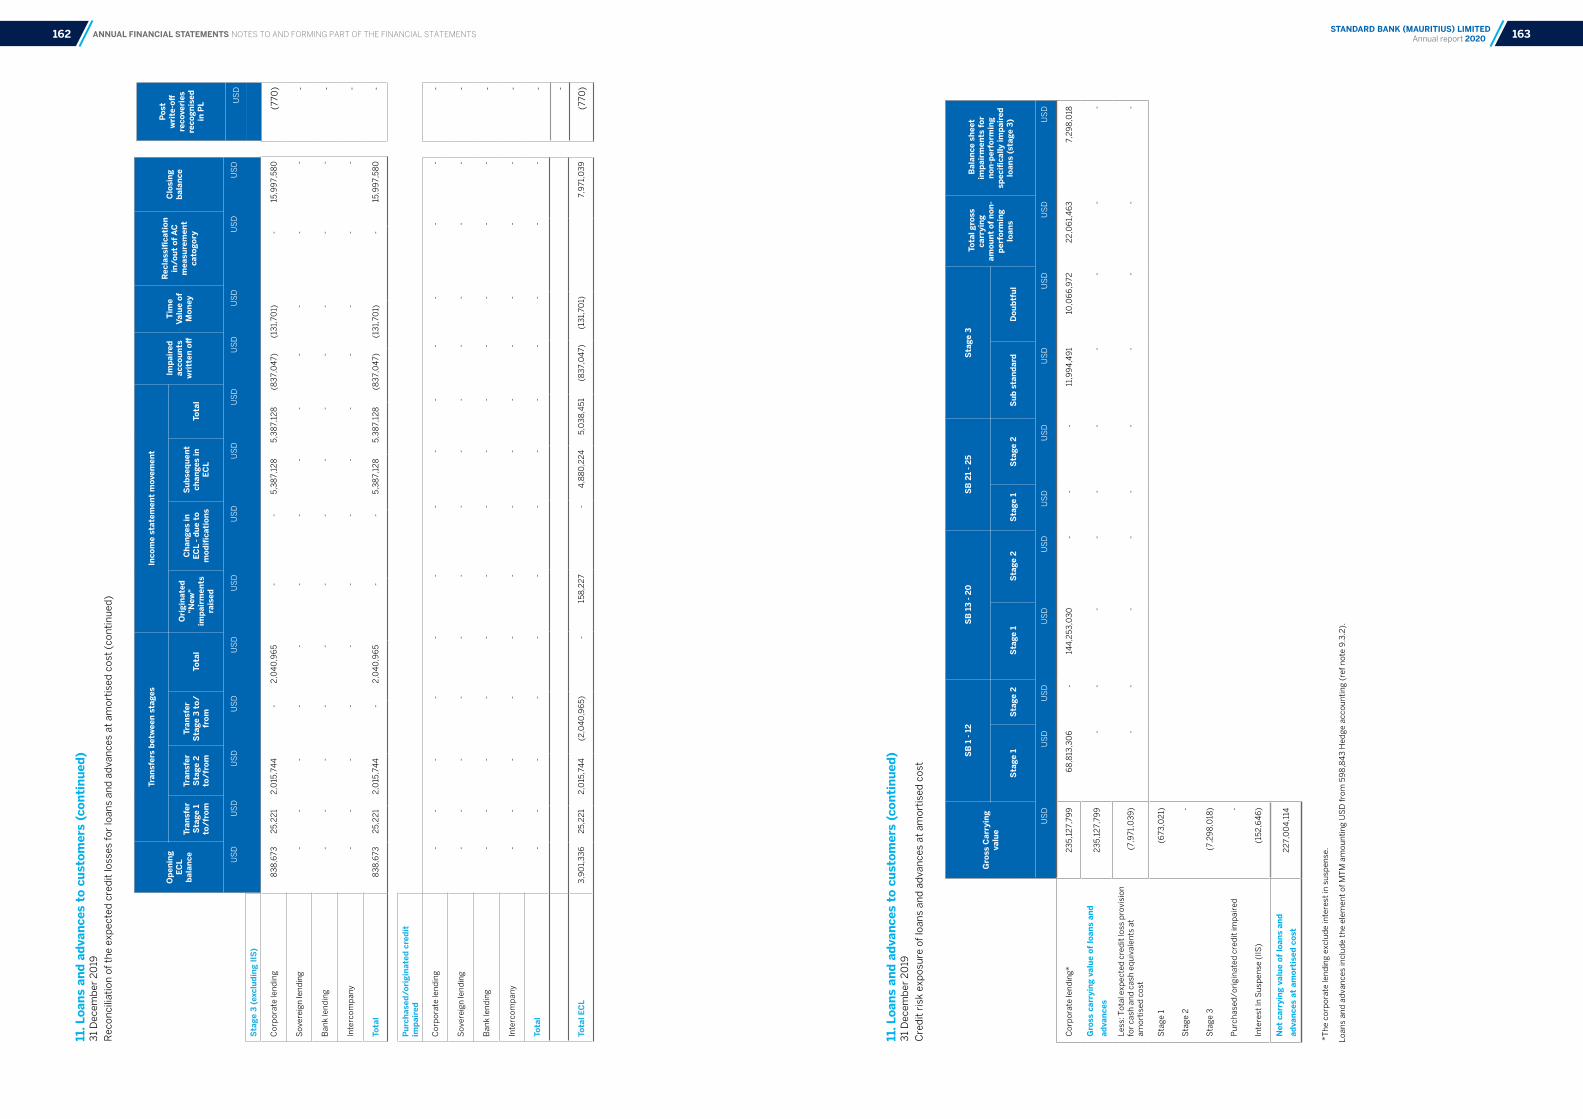
ANNUAL FINANCIAL STATEMENTS NOTES TO AND FORMING PART OF THE FINANCIAL STATEMENTS
11. L
oans
and
adv
ance
s to
cus
tom
ers
(con
tinu
ed)
31
Dec
emb
er 2
019
Cre
dit
ris
k ex
pos
ure
of l
oan
s an
d a
dva
nce
s at
am
orti
sed
cos
t
11. L
oans
and
adv
ance
s to
cus
tom
ers
(con
tinu
ed)
31
Dec
emb
er 2
019
Rec
onci
liati
on o
f th
e ex
pec
ted
cre
dit
loss
es fo
r lo
ans
and
ad
van
ces
at a
mor
tise
d c
ost
(con
tin
ued
)
Pur
chas
ed/o
rigi
nate
d cr
edit
im
pair
ed
Cor
por
ate
len
din
g-
--
--
--
--
--
--
Sov
erei
gn le
nd
ing
--
--
--
--
--
--
-
Ban
k le
nd
ing
--
--
--
--
--
--
-
Inte
rcom
pan
y-
--
--
--
--
--
--
Tota
l -
--
--
--
--
--
--
Tota
l EC
L3
,90
1,3
36
2
5,2
21
2,0
15,7
44
(2
,04
0,9
65
)-
15
8,2
27
- 4
,88
0,2
24
5
,03
8,4
51
(83
7,0
47)
(13
1,70
1) 7
,971
,03
9
- - - - - -
(770
)
Gro
ss C
arry
ing
valu
e
SB
1 -
12S
B 1
3 - 2
0S
B 2
1 - 2
5S
tage
3 T
otal
gro
ss
carr
ying
am
ount
of
non-
perf
orm
ing
loan
s
Bal
ance
she
et
impa
irm
ents
for
no
n-pe
rfor
min
g sp
ecifi
cally
impa
ired
lo
ans
(sta
ge 3
)S
tage
1S
tage
2S
tage
1S
tage
2S
tage
1S
tage
2S
ub s
tand
ard
Dou
btfu
l
US
DU
SD
US
DU
SD
US
DU
SD
US
DU
SD
US
DU
SD
US
D
Cor
por
ate
len
din
g* 2
35
,12
7,79
9
68
,813
,30
6
- 1
44
,25
3,0
30
-
--
11,
99
4,4
91
10
,06
6,9
72
22
,06
1,4
63
7
,29
8,0
18
Gro
ss c
arry
ing
valu
e of
loan
s an
d
adva
nces
23
5,1
27,
799
-
--
--
--
--
-
Less
: Tot
al e
xpec
ted
cre
dit
loss
pro
visi
on
for
cash
an
d c
ash
eq
uiv
alen
ts a
t
amor
tise
d c
ost
(7,9
71,0
39
)-
--
--
--
--
-
Sta
ge 1
(673
,02
1)
Sta
ge 2
-
Sta
ge 3
(7,2
98
,018
)
Pu
rch
ased
/ori
gin
ated
cre
dit
imp
aire
d-
Inte
rest
In S
usp
ense
(IIS
)(1
52
,64
6)
Net
car
ryin
g va
lue
of lo
ans
and
adva
nces
at
amor
tise
d co
st
22
7,0
04
,114
*T
he
corp
orat
e le
nd
ing
excl
ud
e in
tere
st in
su
spen
se.
Loan
s an
d a
dva
nce
s in
clu
de
the
elem
ent
of M
TM
am
oun
tin
g U
SD
from
59
8,8
43
Hed
ge a
ccou
nti
ng
(ref
not
e 9
.3.2
).
Sta
ge 3
(exc
ludi
ng II
S)
Cor
por
ate
len
din
g 8
38
,673
2
5,2
21
2,0
15,7
44
- 2
,04
0,9
65
-
- 5
,38
7,12
8
5,3
87,
128
(8
37,
04
7)(1
31,
701)
- 1
5,9
97,
58
0
Sov
erei
gn le
nd
ing
--
--
--
--
--
--
-
Ban
k le
nd
ing
--
--
--
--
--
--
-
Inte
rcom
pan
y-
--
--
--
--
--
--
Tota
l 8
38
,673
2
5,2
21
2,0
15,7
44
-
2,0
40
,96
5
--
5,3
87,
128
5
,38
7,12
8
(83
7,0
47)
(13
1,70
1)-
15
,99
7,5
80
(770
) - - - -
Ope
ning
EC
L ba
lanc
e
Tran
sfer
s be
twee
n st
ages
Inco
me
stat
emen
t m
ovem
ent
Impa
ired
ac
coun
ts
wri
tten
off
Tim
e Va
lue
of
Mon
ey
Rec
lass
ifica
tion
in
/out
of
AC
m
easu
rem
ent
cato
gory
Clo
sing
ba
lanc
e Tr
ansf
er
Sta
ge 1
to
/fro
m
Tran
sfer
S
tage
2
to/f
rom
Tran
sfer
S
tage
3 t
o/fr
omTo
tal
Ori
gina
ted
"New
" im
pair
men
ts
rais
ed
Cha
nges
in
ECL
- due
to
mod
ifica
tion
s
Sub
sequ
ent
chan
ges
in
ECL
Tota
l
US
DU
SD
US
DU
SD
US
DU
SD
US
DU
SD
US
DU
SD
US
DU
SD
US
D
Post
w
rite
-off
re
cove
ries
re
cogn
ised
in
PL U
SD
163STANDARD BANK (MAURITIUS) LIMITED Annual report 2020162

ANNUAL FINANCIAL STATEMENTS NOTES TO AND FORMING PART OF THE FINANCIAL STATEMENTS
12. F
inan
cial
inve
stm
ents
12.1
Mat
urit
y an
alys
is
Seg
men
t A
S
egm
ent
BB
ank
- Tot
al
2020
20
192
018
2020
20
192
018
2020
20
192
018
US
DU
SD
US
DU
SD
US
DU
SD
US
DU
SD
US
D
Com
pris
ing
ofS
over
eign
bon
ds
Cla
ssif
ied
as:
Net
deb
t fin
anci
al in
vest
men
ts m
easu
red
at
amor
tise
d c
ost
Gro
ss d
ebt
finan
cial
inve
stm
ents
mea
sure
d
at a
mor
tise
d c
ost
Less
: Exp
ecte
d c
red
it lo
sses
for
deb
t fin
anci
al
inve
stm
ents
mea
sure
d a
t am
orti
sed
cos
t (n
ote
12.4
) N
et d
ebt
finan
cial
inve
stm
ents
mea
sure
d a
t fa
ir v
alu
e th
rou
gh O
CI
Gro
ss d
ebt
finan
cial
inve
stm
ents
mea
sure
d
at fa
ir v
alu
e th
rou
gh O
CI
Less
: Exp
ecte
d c
red
it lo
sses
(E
CL)
for
deb
t fin
anci
al in
vest
men
ts m
easu
red
at
fair
val
ue
thro
ugh
OC
I
6,33
5,4
18
6,33
5,4
18
-
-
-
6,33
5,4
18
6,33
5,6
56
(238
)
10,3
19,7
79
10,3
19,7
79
-
-
-
10,3
19,7
79
10,3
19,8
53
(74
)
7,2
53
,40
8
7,2
53
,40
8 -
-
-
7,2
53
,40
8
7,2
53
,476
(68
)
213,
64
1,37
5
213,
64
1,37
5
213,
64
1,37
5
213,
64
4,6
03
(3,2
28)
-
-
-
186
,75
5,6
38
186
,75
5,6
38
186
,75
5,6
38
186
,75
7,3
01
(1,6
63
)
-
-
-
140
,111
,06
2
140
,111
,06
2
140
,111
,06
2
140
,111
,20
7
(14
5)
- - -
219,
976,
793
219,
976,
793
213,
64
1,37
5
213,
64
4,6
03
(3,2
28)
6,33
5,4
18
6,33
5,6
56
(238
)
197,
075
,417
197,
075
,417
186
,75
5,6
38
186
,75
7,3
01
(1,6
63
)
10,3
19,7
79
10,3
19,8
53
(74
)
147,
36
4,4
70
147,
36
4,4
70
140
,111
,06
2
140
,111
,20
7
(14
5)
7,2
53
,40
8
7,2
53
,476
(68
)
Seg
men
t A
S
egm
ent
BB
ank
- Tot
al
2020
20
192
018
2020
20
192
018
2020
20
192
018
US
DU
SD
US
DU
SD
US
DU
SD
US
DU
SD
US
D
Cur
rent
:U
p t
o 3
mon
ths
Ove
r 3
mon
ths
and
up
to
6 m
onth
sO
ver
6 m
onth
s an
d u
p t
o 12
mon
ths
Non
-cur
rent
:O
ver
1 ye
ar a
nd
up
to
5 y
ears
1,27
7,22
4
-
5,
058
,19
4
-
6,3
35,4
18
6
,09
8,9
62
2,7
28
,58
4
1
,49
2,2
33
-
10
,319
,779
5
,10
5,9
53
-
2
,14
7,4
55
-
7
,25
3,4
08
92,
851,
338
-
-
1
20,7
90
,037
2
13,6
41,
375
-
93
,33
3,6
39
-
9
3,4
21,
99
9
18
6,7
55
,63
8
14
0,1
11,0
62
-
-
-
140
,111
,06
2
94
,128
,56
2
-
5,0
58,1
94
120
,79
0,0
37
219
,976
,793
6
,09
8,9
62
96
,06
2,2
23
1,4
92
,23
3
93
,42
1,9
99
19
7,0
75,4
17
145
,217
,015
-
2
,14
7,4
55
-
14
7,3
64
,470
31 December 2018
Credit risk exposure of Loans and advances at amortised cost
11. Loans and advances to customers (continued) 31 December 2018
Reconciliation of the expected credit losses for loans and advances at amortised cost
Gross Carrying
value
SB 1 - 12 SB 13 - 20 SB 21 - 25 Stage 3 Total gross
carrying amount of non-
performing loans
Securities and expected recoveries on specifically
impaired loans
Interest in suspense (enter as positive)Stage 1 Stage
2 Stage 1 Stage 2
Stage 1 Stage 2 Sub
standard Doubtful
USD USD USD USD USD USD USD USD USD USD USD USD
Corporate lending* 232,247,656 46,878,723 - 174,165,329 - - 10,076,899 - 1,126,705 1,126,705 812,391 314,314
Sovereign lending - - - - - - - - - - - -
Bank lending - - - - - - - - - - - -
Intercompany - - - - - - - - - - - -
Gross carrying value of loans and advances 232,247,656
Less: Total expected credit loss provision for cash and cash equivalents at amortised cost
(3,901,336)
Stage 1 (1,046,919)
Stage 2 (2,015,744)
Stage 3 (838,673)
Purchased/originated credit impaired
-
Interest In Suspense (IIS) (314,314)
Net carrying value of loans and advances at amortised cost
228,032,006
Loans and advances include the element of MTM amounting USD387,004 from Hedge accounting (ref note 9.3.2).
Transfers between stages Income statement movement
Closing ECL Opening
balance
Transfer to/from Stage 1
Transfer to/from Stage 2
Transfer to/from Stage 3
Total
Originated "New"
impairments raised
Subsequent changes in
ECL
De- recognition Total
USD USD USD USD USD USD USD USD USD
Stage 1 Corporate lending (704,725) - - - - (541,724) 199,530 - (342,194) (1,046,919)Sovereign lending - - - - - - - - - - Bank lending - - - -
Intercompany - - - - - - - - - -
Total (704,725) - - - - (541,724) 199,530 - (342,194) (1,046,919)
Stage 2
Corporate lending (971,650) - - - - (1,044,094) - - (1,044,094) (2,015,744)
Sovereign lending - - - - - - - - - - Bank lending - - - - Intercompany - - - - - - - - - - Total (971,650) - - - - (1,044,094) - - (1,044,094) (2,015,744)
Stage 3 (excl IIS)
Corporate lending (808,997) - - - (29,676) - - (29,676) (838,673)Sovereign lending - - - - - - - - - - Bank lending - - - -
Intercompany - - - - - - - - - -
Total (808,997) - - - - (29,676) - - (29,676) (838,673)
Total ECL (2,485,372) - - - - (1,615,494) 199,530 - (1,415,964) (3,901,336)
165STANDARD BANK (MAURITIUS) LIMITED Annual report 2020164

ANNUAL FINANCIAL STATEMENTS NOTES TO AND FORMING PART OF THE FINANCIAL STATEMENTS
12. Financial investments (continued)12.2 Reconciliation of Financial investments measured at fair value through OCI
Segment A Segment B Total
2020 USD USD USD
Balance at 01 January 2020
Purchase of Financial Investments
Matured
Accrued Interest
Fair value movements
Impairment - ECL
Balance at 31 December 2020
2019
Balance at 01 January 2019
Purchase of Financial Investments
Matured
Accrued Interest
Fair value movements
Impairment - ECL
Balance at 31 December 2019
10,319,779
6,310,218
(10,319,779)
13,952
11,486
(238)
6,335,418
7,253,408
10,221,650
(7,253,408)
75,655
22,548
(74)
10,319,779
-
-
-
-
-
-
-
- -
-
-
-
-
-
10,319,779
6,310,218
(10,319,779)
13,952
11,486
(238)
6,335,418
7,253,408
10,221,650
(7,253,408)
75,655
22,548
(74)
10,319,779
2018
Balance at 01 January 2018
Purchase of Financial Investments
Matured
Accrued Interest
Fair value movements
Impairment - ECL
Balance at 31 December 2018
5,230,260
1,933,120
-
75,752
14,344
(68)
7,253,408
19,719,130
-
(19,719,130)
-
-
-
-
24,949,390
1,933,120
(19,719,130)
75,752
14,344
(68)
7,253,408
12. Financial investments (continued) 12.3 Reconciliation of Financial investments measured at amortised cost
Segment A Segment B Total
2020 USD USD USD
Balance at 01 January 2020
Purchase of Financial Investments
Matured
Accrued Interest
Fair value movements
Impairment - ECL
Balance at 31 December 2020
2019
Balance at 01 January 2019
Purchase of Financial Investments
Matured
Accrued Interest
Fair value movements
Impairment - ECL
Balance at 31 December 2019
-
-
-
-
-
-
-
-
-
-
-
-
-
-
186,755,638
121,720,890
(93,580,257)
(1,253,331)
-
(1,565)
213,641,375
140,111,062
185,962,545
(140,111,062)
794,756
-
(1,663)
186,755,638
186,755,638
121,720,890
(93,580,257)
(1,253,331)
-
(1,565)
213,641,375
140,111,062
185,962,545
(140,111,062)
794,756
-
(1,663)
186,755,638
2018
Balance at 01 January 2018
Purchase of Financial Investments
Matured
Accrued Interest
Fair value movements
Impairment - ECL
Balance at 31 December 2018
-
-
-
-
-
-
-
98,663,423
139,405,855
(98,663,423)
705,352
-
(145)
140,111,062
98,663,423
139,405,855
(98,663,423)
705,352
-
(145)
140,111,062
167STANDARD BANK (MAURITIUS) LIMITED Annual report 2020166
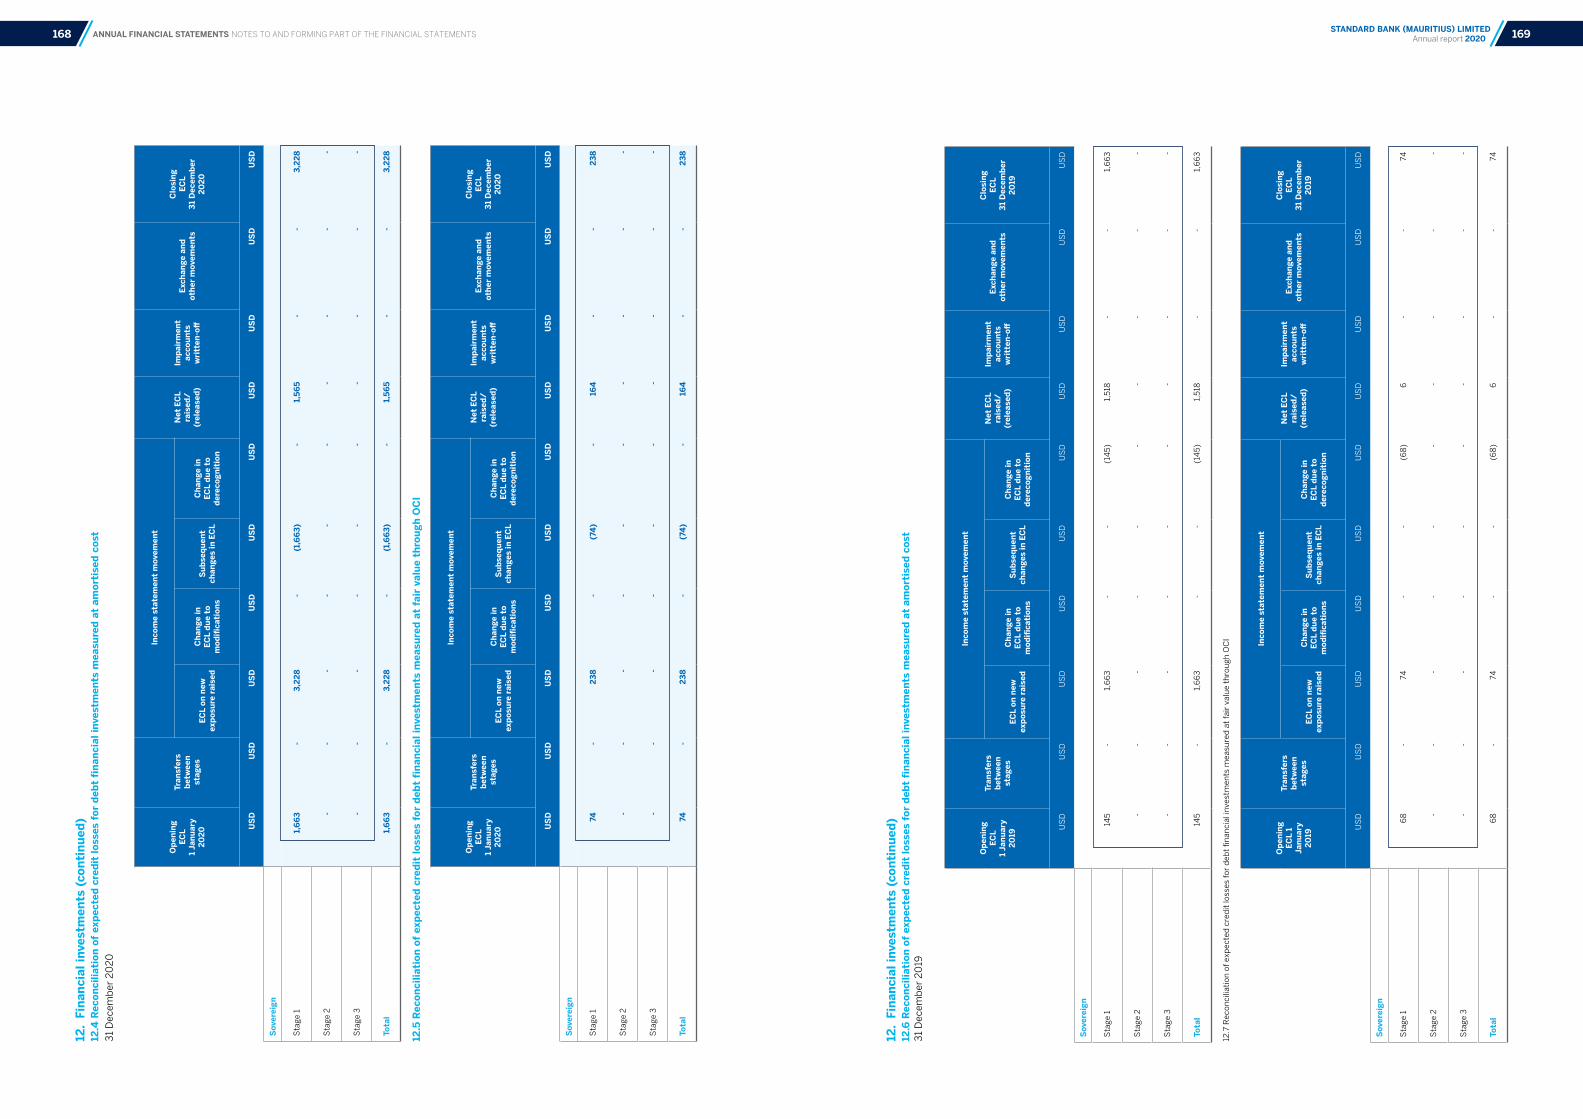
ANNUAL FINANCIAL STATEMENTS NOTES TO AND FORMING PART OF THE FINANCIAL STATEMENTS
12.
Fina
ncia
l inv
estm
ents
(co
ntin
ued)
12.4
Rec
onci
liati
on o
f ex
pect
ed c
redi
t lo
sses
for
deb
t fi
nanc
ial i
nves
tmen
ts m
easu
red
at a
mor
tise
d co
st3
1 D
ecem
ber
20
20
12.
Fina
ncia
l inv
estm
ents
(co
ntin
ued)
12.6
Rec
onci
liati
on o
f ex
pect
ed c
redi
t lo
sses
for
deb
t fi
nanc
ial i
nves
tmen
ts m
easu
red
at a
mor
tise
d co
st
31
Dec
emb
er 2
019
12.5
Rec
onci
liati
on o
f ex
pect
ed c
redi
t lo
sses
for
deb
t fi
nanc
ial i
nves
tmen
ts m
easu
red
at f
air
valu
e th
roug
h O
CI
12.7
Rec
onci
liati
on o
f exp
ecte
d c
red
it lo
sses
for
deb
t fin
anci
al in
vest
men
ts m
easu
red
at
fair
val
ue
thro
ugh
OC
I
Ope
ning
EC
L
1 Ja
nuar
y 20
20
Tran
sfer
s be
twee
n st
ages
Inco
me
stat
emen
t m
ovem
ent
Net
EC
L ra
ised
/ (r
elea
sed)
Impa
irm
ent
acco
unts
w
ritt
en-o
ff
Exch
ange
and
ot
her
mov
emen
ts
Clo
sing
ECL
31
Dec
embe
r
2020
ECL
on n
ew
expo
sure
rai
sed
Cha
nge
in
ECL
due
to
mod
ifica
tion
s
Sub
sequ
ent
chan
ges
in E
CL
Cha
nge
in
ECL
due
to
dere
cogn
itio
n
US
DU
SD
US
DU
SD
US
DU
SD
US
DU
SD
US
DU
SD
Sov
erei
gn
Sta
ge 1
1,
66
3 -
3,2
28
-(1
,66
3)-
1
,56
5 -
-
3,2
28
Sta
ge 2
-
--
--
--
--
-
Sta
ge 3
--
--
--
--
--
Tota
l 1,
66
3 -
3,2
28
-(1
,66
3)-
1
,56
5 -
-
3,2
28
Ope
ning
EC
L
1 Ja
nuar
y 20
19
Tran
sfer
s be
twee
n st
ages
Inco
me
stat
emen
t m
ovem
ent
Net
EC
L ra
ised
/ (r
elea
sed)
Impa
irm
ent
acco
unts
w
ritt
en-o
ff
Exch
ange
and
ot
her
mov
emen
ts
Clo
sing
ECL
31
Dec
embe
r
2019
ECL
on n
ew
expo
sure
rai
sed
Cha
nge
in
ECL
due
to
mod
ifica
tion
s
Sub
sequ
ent
chan
ges
in E
CL
Cha
nge
in
ECL
due
to
dere
cogn
itio
n
US
DU
SD
US
DU
SD
US
DU
SD
US
DU
SD
US
DU
SD
Sov
erei
gn
Sta
ge 1
14
5
-
1
,66
3
--
(14
5)
1
,518
-
-
1,6
63
Sta
ge 2
-
--
--
--
--
-
Sta
ge 3
--
--
--
--
--
Tota
l 14
5
-
1
,66
3
--
(14
5)
1
,518
-
-
1,6
63
Ope
ning
EC
L
1 Ja
nuar
y 20
20
Tran
sfer
s be
twee
n st
ages
Inco
me
stat
emen
t m
ovem
ent
Net
EC
L ra
ised
/ (r
elea
sed)
Impa
irm
ent
acco
unts
w
ritt
en-o
ff
Exch
ange
and
ot
her
mov
emen
ts
Clo
sing
ECL
31
Dec
embe
r
2020
ECL
on n
ew
expo
sure
rai
sed
Cha
nge
in
ECL
due
to
mod
ifica
tion
s
Sub
sequ
ent
chan
ges
in E
CL
Cha
nge
in
ECL
due
to
dere
cogn
itio
n
US
DU
SD
US
DU
SD
US
DU
SD
US
DU
SD
US
DU
SD
Sov
erei
gn
Sta
ge 1
74
-
238
-
(74
)-
1
64
-
-
238
Sta
ge 2
-
--
--
--
--
-
Sta
ge 3
--
--
--
--
--
Tota
l 74
-
238
-
(74
)-
1
64
-
-
238
Ope
ning
EC
L 1
Ja
nuar
y 20
19
Tran
sfer
s be
twee
n st
ages
Inco
me
stat
emen
t m
ovem
ent
Net
EC
L ra
ised
/ (r
elea
sed)
Impa
irm
ent
acco
unts
w
ritt
en-o
ff
Exch
ange
and
ot
her
mov
emen
ts
Clo
sing
ECL
31
Dec
embe
r
2019
ECL
on n
ew
expo
sure
rai
sed
Cha
nge
in
ECL
due
to
mod
ifica
tion
s
Sub
sequ
ent
chan
ges
in E
CL
Cha
nge
in
ECL
due
to
dere
cogn
itio
n
US
DU
SD
US
DU
SD
US
DU
SD
US
DU
SD
US
DU
SD
Sov
erei
gn
Sta
ge 1
6
8
-74
--
(6
8)
6
--
74
Sta
ge 2
-
--
--
--
--
-
Sta
ge 3
--
--
--
--
--
Tota
l 6
8
-74
--
(6
8)
6
--
74
169STANDARD BANK (MAURITIUS) LIMITED Annual report 2020168
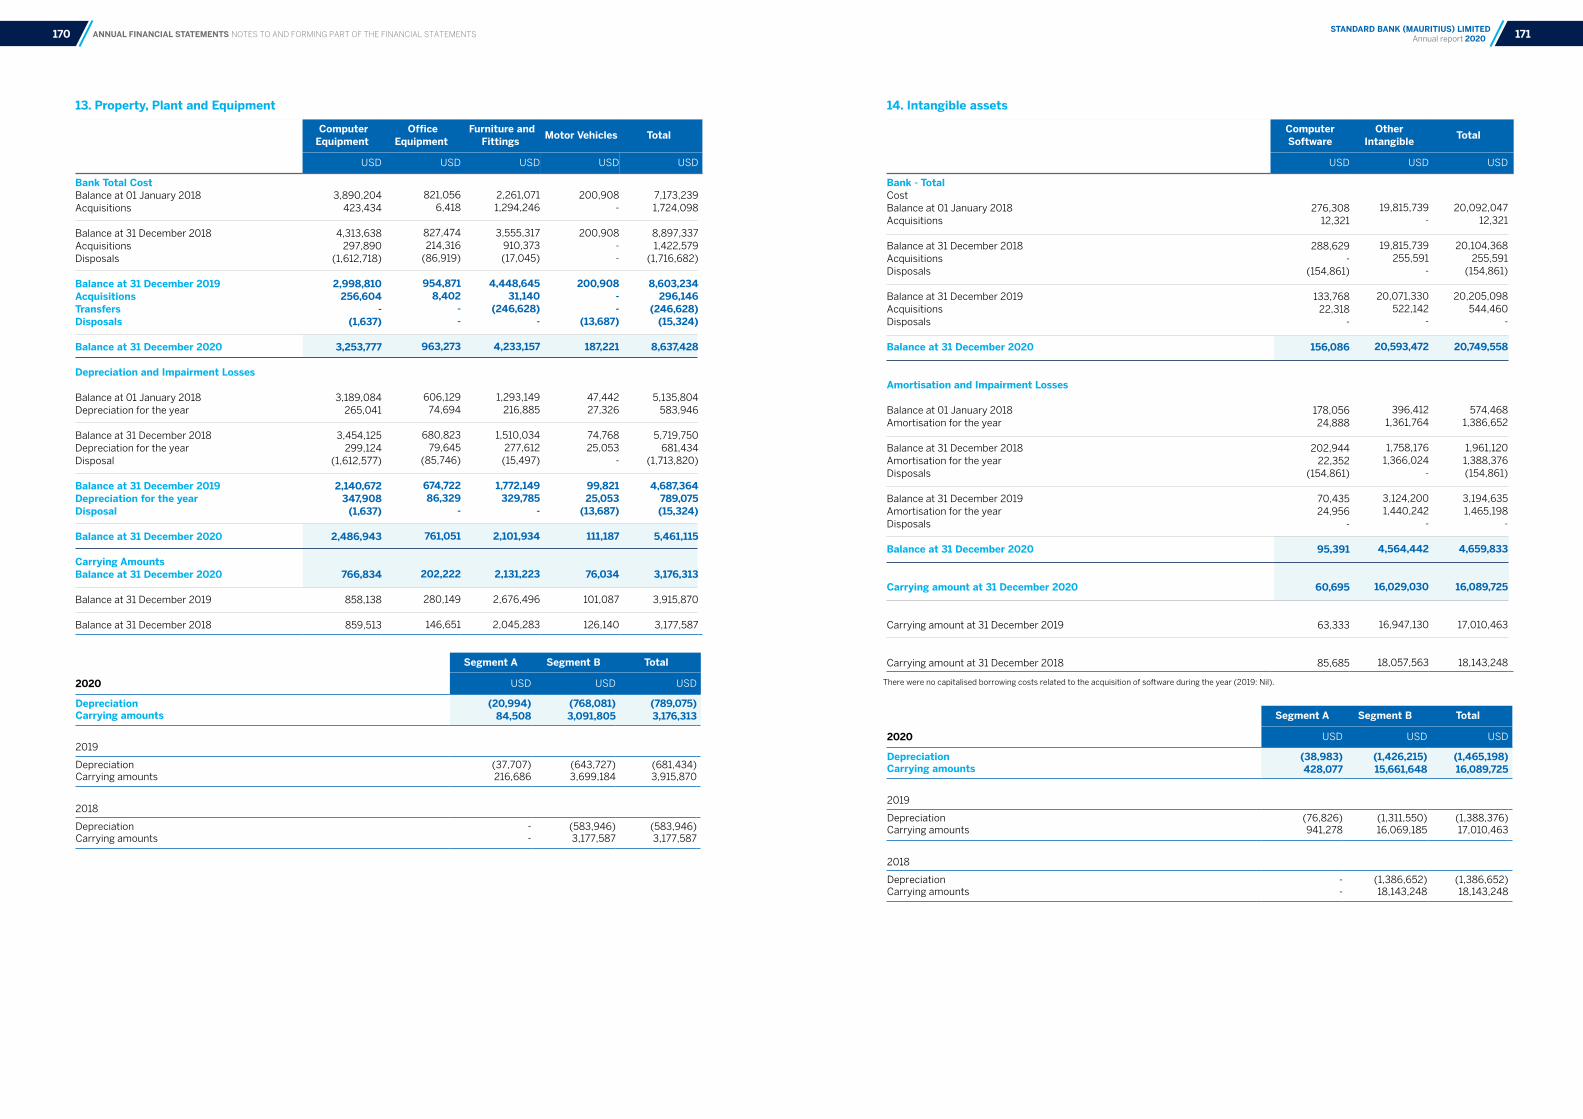
ANNUAL FINANCIAL STATEMENTS NOTES TO AND FORMING PART OF THE FINANCIAL STATEMENTS
13. Property, Plant and Equipment 14. Intangible assets
Computer Equipment
Office Equipment
Furniture and Fittings Motor Vehicles Total
USD USD USD USD USD
Bank Total CostBalance at 01 January 2018Acquisitions
Balance at 31 December 2018AcquisitionsDisposals
Balance at 31 December 2019AcquisitionsTransfersDisposals
Balance at 31 December 2020
Depreciation and Impairment Losses
Balance at 01 January 2018Depreciation for the year
Balance at 31 December 2018Depreciation for the yearDisposal
Balance at 31 December 2019Depreciation for the yearDisposal
Balance at 31 December 2020
Carrying AmountsBalance at 31 December 2020
Balance at 31 December 2019
Balance at 31 December 2018
3,890,204423,434
4,313,638
297,890(1,612,718)
2,998,810
256,604-
(1,637)
3,253,777
3,189,084265,041
3,454,125
299,124(1,612,577)
2,140,672347,908
(1,637)
2,486,943
766,834
858,138
859,513
821,0566,418
827,474214,316
(86,919)
954,8718,402
--
963,273
606,12974,694
680,823
79,645(85,746)
674,72286,329
-
761,051
202,222
280,149
146,651
2,261,0711,294,246
3,555,317
910,373(17,045)
4,448,645
31,140(246,628)
-
4,233,157
1,293,149216,885
1,510,034
277,612(15,497)
1,772,149
329,785-
2,101,934
2,131,223
2,676,496
2,045,283
200,908-
200,908
--
200,908
--
(13,687)
187,221
47,44227,326
74,76825,053
-
99,82125,053
(13,687)
111,187
76,034
101,087
126,140
7,173,2391,724,098
8,897,3371,422,579
(1,716,682)
8,603,234296,146
(246,628)(15,324)
8,637,428
5,135,804583,946
5,719,750
681,434(1,713,820)
4,687,364
789,075(15,324)
5,461,115
3,176,313
3,915,870
3,177,587
Computer Software
Other Intangible Total
USD USD USD
Bank - Total CostBalance at 01 January 2018Acquisitions
Balance at 31 December 2018AcquisitionsDisposals Balance at 31 December 2019AcquisitionsDisposals Balance at 31 December 2020
Amortisation and Impairment Losses
Balance at 01 January 2018Amortisation for the year Balance at 31 December 2018Amortisation for the yearDisposals Balance at 31 December 2019Amortisation for the yearDisposals
Balance at 31 December 2020 Carrying amount at 31 December 2020
Carrying amount at 31 December 2019 Carrying amount at 31 December 2018
276,308 12,321
288,629
- (154,861)
133,768
22,318-
156,086
178,05624,888
202,944
22,352(154,861)
70,43524,956
-
95,391
60,695
63,333
85,685
19,815,739 -
19,815,739
255,591 -
20,071,330
522,142-
20,593,472
396,4121,361,764
1,758,176
1,366,024-
3,124,2001,440,242
-
4,564,442
16,029,030
16,947,130
18,057,563
20,092,047 12,321
20,104,368
255,591 (154,861)
20,205,098
544,460-
20,749,558
574,4681,386,652
1,961,120
1,388,376(154,861)
3,194,6351,465,198
-
4,659,833
16,089,725
17,010,463
18,143,248
There were no capitalised borrowing costs related to the acquisition of software during the year (2019: Nil).
Segment A Segment B Total
2020 USD USD USD
DepreciationCarrying amounts
(20,994)84,508
(768,081)3,091,805
(789,075)3,176,313
2019
DepreciationCarrying amounts
(37,707)216,686
(643,727)3,699,184
(681,434)3,915,870
2018
DepreciationCarrying amounts
--
(583,946)3,177,587
(583,946)3,177,587
Segment A Segment B Total
2020 USD USD USD
DepreciationCarrying amounts
(38,983)428,077
(1,426,215)15,661,648
(1,465,198)16,089,725
2019
DepreciationCarrying amounts
(76,826)941,278
(1,311,550)16,069,185
(1,388,376)17,010,463
2018
DepreciationCarrying amounts
--
(1,386,652)18,143,248
(1,386,652)18,143,248
171STANDARD BANK (MAURITIUS) LIMITED Annual report 2020170
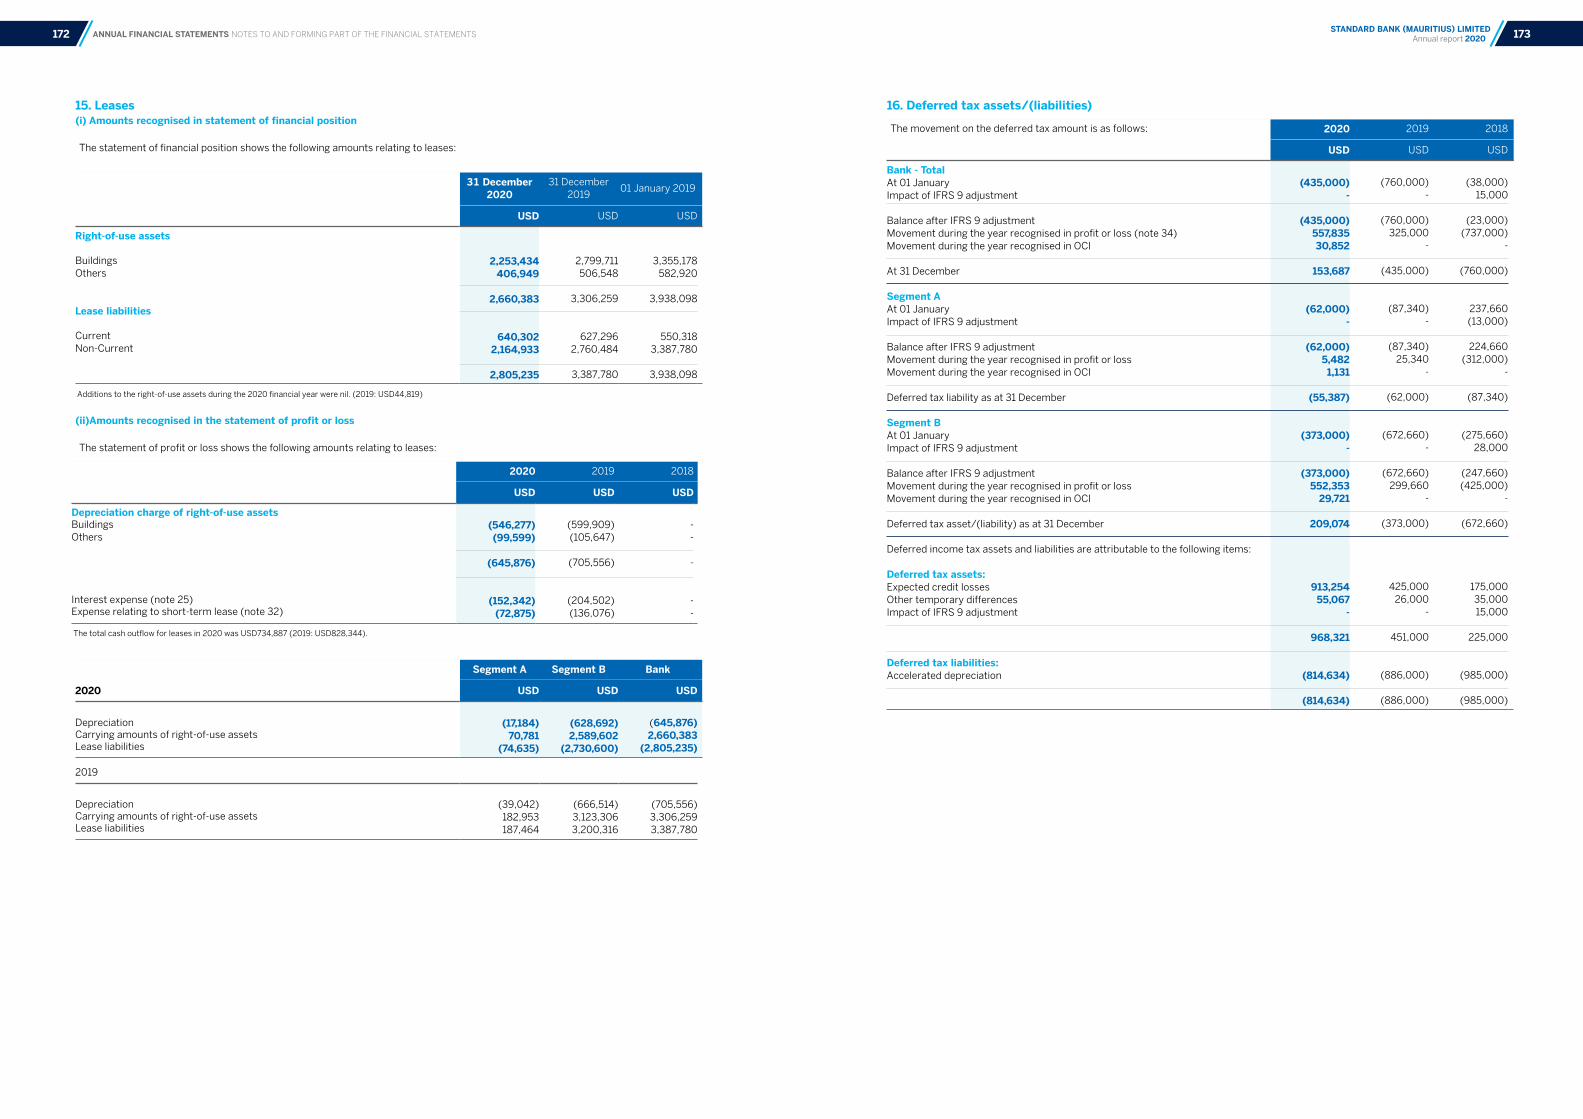
ANNUAL FINANCIAL STATEMENTS NOTES TO AND FORMING PART OF THE FINANCIAL STATEMENTS
15. Leases (i) Amounts recognised in statement of financial position
The statement of financial position shows the following amounts relating to leases:
(ii)Amounts recognised in the statement of profit or loss The statement of profit or loss shows the following amounts relating to leases:
16. Deferred tax assets/(liabilities)
31 December 2020
31 December 2019
01 January 2019
USD USD USD
Right-of-use assets BuildingsOthers
Lease liabilities
CurrentNon-Current
2,253,434406,949
2,660,383
640,3022,164,933
2,805,235
2,799,711506,548
3,306,259
627,296
2,760,484
3,387,780
3,355,178582,920
3,938,098
550,318
3,387,780
3,938,098
Additions to the right-of-use assets during the 2020 financial year were nil. (2019: USD44,819)
Segment A Segment B Bank
2020 USD USD USD
Depreciation Carrying amounts of right-of-use assetsLease liabilities
(17,184)70,781
(74,635)
(628,692)2,589,602
(2,730,600)
(645,876)2,660,383
(2,805,235)
2019
Depreciation Carrying amounts of right-of-use assetsLease liabilities
(39,042)182,953187,464
(666,514)3,123,3063,200,316
(705,556)3,306,2593,387,780
2020 2019 2018
USD USD USD
Depreciation charge of right-of-use assetsBuildingsOthers
Interest expense (note 25)Expense relating to short-term lease (note 32)
(546,277)(99,599)
(645,876)
(152,342)(72,875)
(599,909)(105,647)
(705,556)
(204,502)(136,076)
--
-
--
The total cash outflow for leases in 2020 was USD734,887 (2019: USD828,344).
The movement on the deferred tax amount is as follows: 2020 2019 2018
USD USD USD
Bank - TotalAt 01 JanuaryImpact of IFRS 9 adjustment
Balance after IFRS 9 adjustment Movement during the year recognised in profit or loss (note 34)Movement during the year recognised in OCI
At 31 December
Segment AAt 01 JanuaryImpact of IFRS 9 adjustment
Balance after IFRS 9 adjustmentMovement during the year recognised in profit or lossMovement during the year recognised in OCI
Deferred tax liability as at 31 December
Segment BAt 01 JanuaryImpact of IFRS 9 adjustment
Balance after IFRS 9 adjustmentMovement during the year recognised in profit or lossMovement during the year recognised in OCI
Deferred tax asset/(liability) as at 31 December
Deferred income tax assets and liabilities are attributable to the following items:
Deferred tax assets:Expected credit losses Other temporary differencesImpact of IFRS 9 adjustment
Deferred tax liabilities:Accelerated depreciation
(435,000)-
(435,000)557,83530,852
153,687
(62,000)-
(62,000)5,4821,131
(55,387)
(373,000)-
(373,000)552,353
29,721
209,074
913,25455,067
-
968,321
(814,634)
(814,634)
(760,000)
-
(760,000)325,000
-
(435,000)
(87,340)-
(87,340)25,340
-
(62,000)
(672,660)-
(672,660)299,660
-
(373,000)
425,00026,000
-
451,000
(886,000)
(886,000)
(38,000)
15,000
(23,000)(737,000)
-
(760,000)
237,660(13,000)
224,660
(312,000)-
(87,340)
(275,660)28,000
(247,660)(425,000)
-
(672,660)
175,00035,00015,000
225,000
(985,000)
(985,000)
173STANDARD BANK (MAURITIUS) LIMITED Annual report 2020172
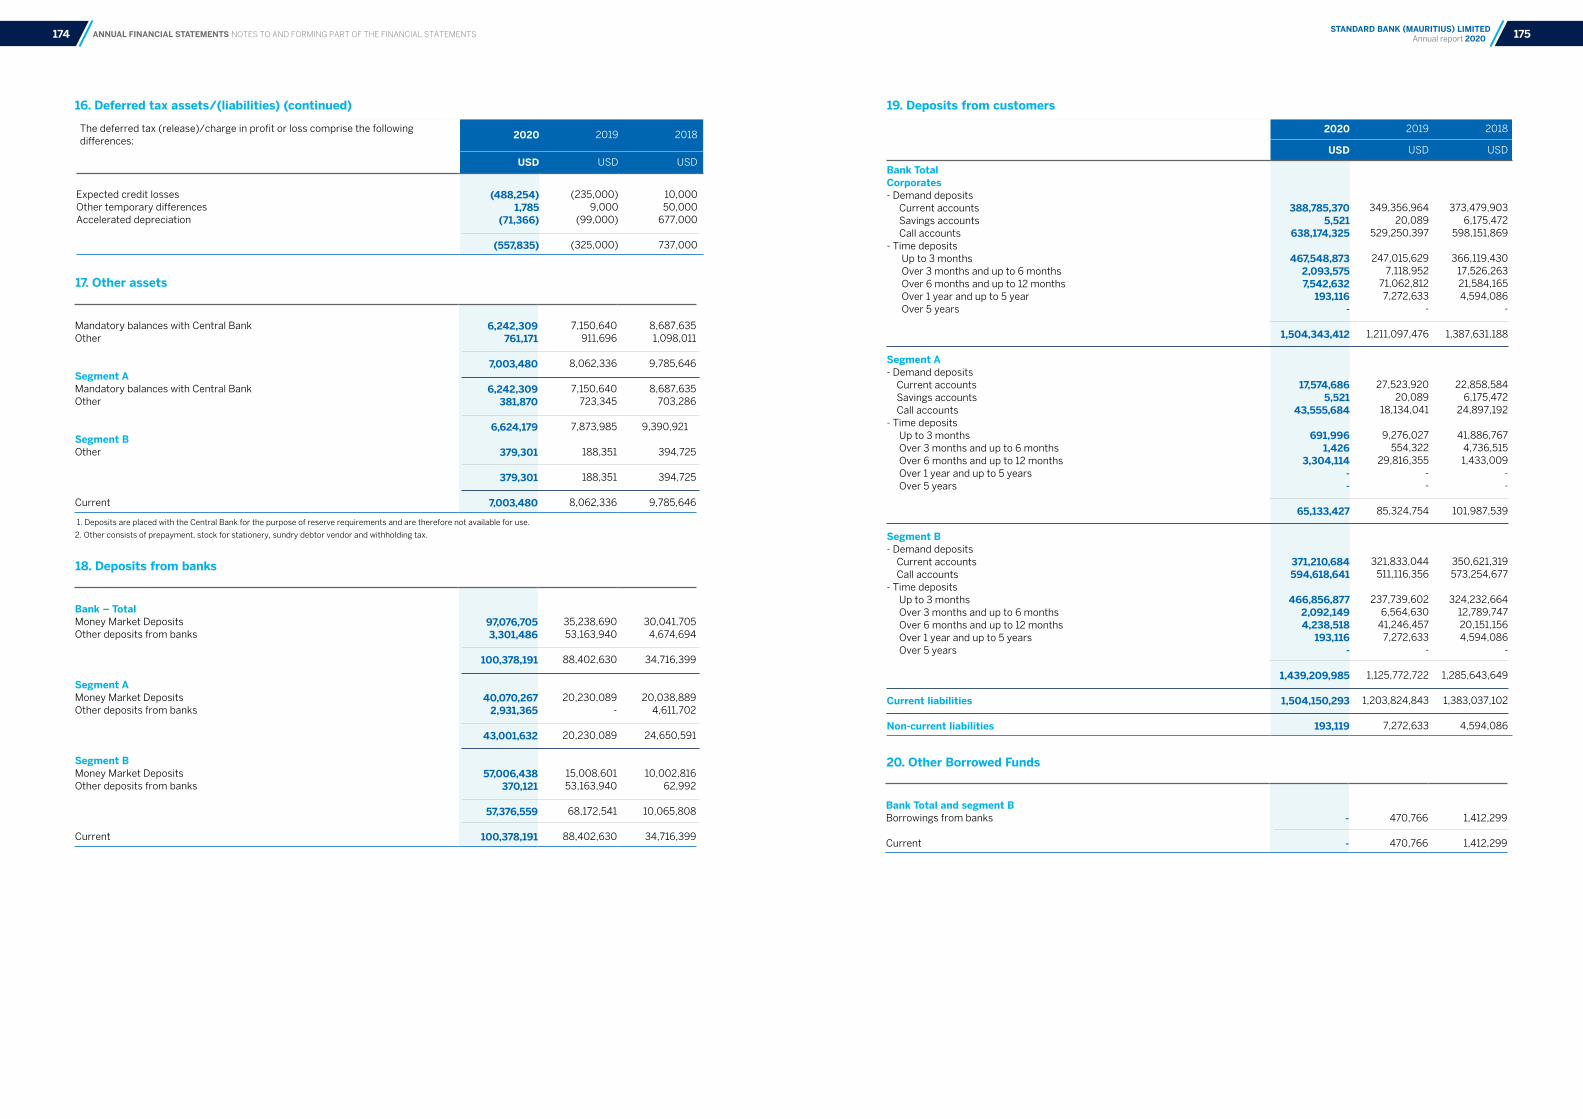
ANNUAL FINANCIAL STATEMENTS NOTES TO AND FORMING PART OF THE FINANCIAL STATEMENTS
19. Deposits from customers16. Deferred tax assets/(liabilities) (continued)
2020 2019 2018
USD USD USD
Bank TotalCorporates- Demand deposits Current accounts Savings accounts Call accounts- Time deposits Up to 3 months Over 3 months and up to 6 months Over 6 months and up to 12 months Over 1 year and up to 5 year Over 5 years
Segment A- Demand deposits Current accounts Savings accounts Call accounts- Time deposits Up to 3 months Over 3 months and up to 6 months Over 6 months and up to 12 months Over 1 year and up to 5 years Over 5 years
Segment B- Demand deposits Current accounts Call accounts- Time deposits Up to 3 months Over 3 months and up to 6 months Over 6 months and up to 12 months Over 1 year and up to 5 years Over 5 years
Current liabilities
Non-current liabilities
388,785,3705,521
638,174,325
467,548,8732,093,5757,542,632
193,116-
1,504,343,412
17,574,6865,521
43,555,684
691,9961,426
3,304,114--
65,133,427
371,210,684594,618,641
466,856,8772,092,1494,238,518
193,116-
1,439,209,985
1,504,150,293
193,119
349,356,964 20,089
529,250,397
247,015,6297,118,952
71,062,8127,272,633
-
1,211,097,476
27,523,92020,089
18,134,041
9,276,027554,322
29,816,355 - -
85,324,754
321,833,044511,116,356
237,739,6026,564,630
41,246,4577,272,633
-
1,125,772,722
1,203,824,843
7,272,633
373,479,903 6,175,472
598,151,869
366,119,430 17,526,263 21,584,165 4,594,086
-
1,387,631,188
22,858,584 6,175,472
24,897,192
41,886,767 4,736,515 1,433,009
- -
101,987,539
350,621,319 573,254,677
324,232,664 12,789,747 20,151,156 4,594,086
-
1,285,643,649
1,383,037,102
4,594,086
The deferred tax (release)/charge in profit or loss comprise the following differences:
2020 2019 2018
USD USD USD
Expected credit lossesOther temporary differencesAccelerated depreciation
(488,254)1,785
(71,366)
(557,835)
(235,000)9,000
(99,000)
(325,000)
10,00050,000
677,000
737,000
Mandatory balances with Central BankOther
Segment AMandatory balances with Central BankOther
Segment BOther
Current
6,242,309
761,171
7,003,480
6,242,309 381,870
6,624,179
379,301
379,301
7,003,480
7,150,640911,696
8,062,336
7,150,640723,345
7,873,985
188,351
188,351
8,062,336
8,687,6351,098,011
9,785,646
8,687,635703,286
9,390,921
394,725
394,725
9,785,646
1. Deposits are placed with the Central Bank for the purpose of reserve requirements and are therefore not available for use.
2. Other consists of prepayment, stock for stationery, sundry debtor vendor and withholding tax.
Bank – Total Money Market DepositsOther deposits from banks
Segment AMoney Market DepositsOther deposits from banks
Segment BMoney Market DepositsOther deposits from banks
Current
97,076,7053,301,486
100,378,191
40,070,2672,931,365
43,001,632
57,006,438370,121
57,376,559
100,378,191
35,238,69053,163,940
88,402,630
20,230,089-
20,230,089
15,008,60153,163,940
68,172,541
88,402,630
30,041,7054,674,694
34,716,399
20,038,8894,611,702
24,650,591
10,002,81662,992
10,065,808
34,716,399
Bank Total and segment BBorrowings from banks
Current
-
-
470,766
470,766
1,412,299
1,412,299
17. Other assets
18. Deposits from banks
20. Other Borrowed Funds
175STANDARD BANK (MAURITIUS) LIMITED Annual report 2020174
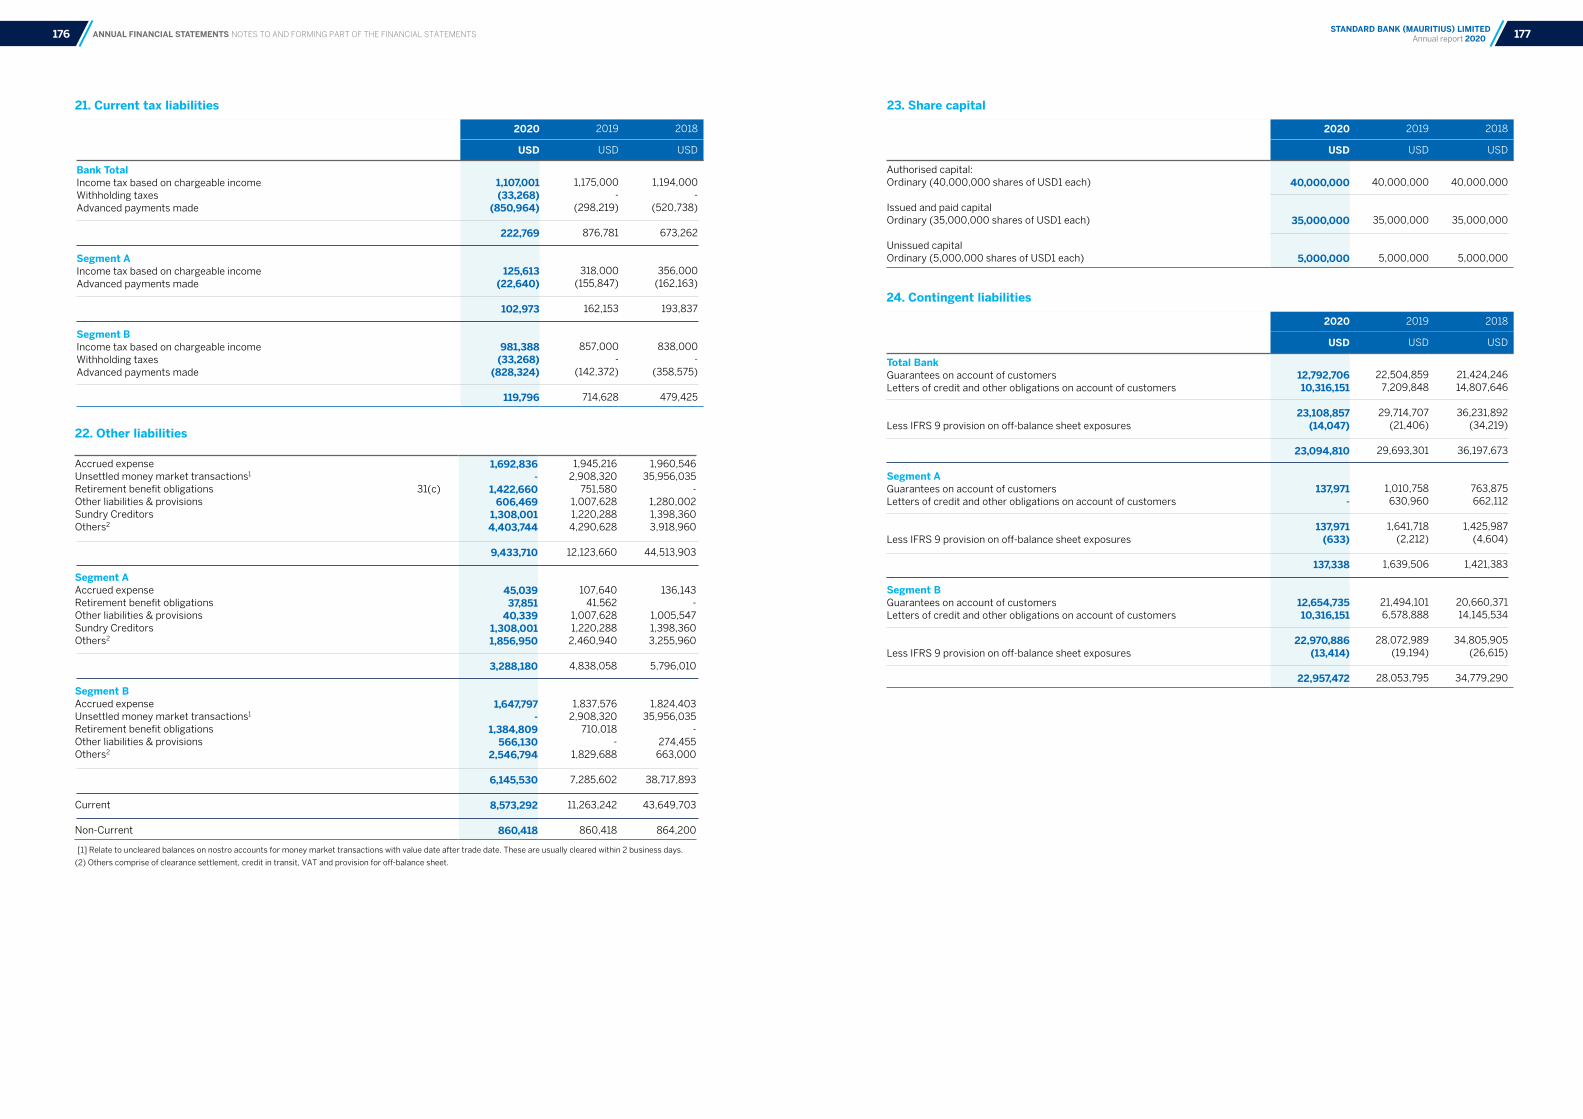
ANNUAL FINANCIAL STATEMENTS NOTES TO AND FORMING PART OF THE FINANCIAL STATEMENTS
23. Share capital
2020 2019 2018
USD USD USD
Authorised capital: Ordinary (40,000,000 shares of USD1 each)
Issued and paid capitalOrdinary (35,000,000 shares of USD1 each)
Unissued capitalOrdinary (5,000,000 shares of USD1 each)
40,000,000
35,000,000
5,000,000
40,000,000
35,000,000
5,000,000
40,000,000
35,000,000
5,000,000
2020 2019 2018
USD USD USD
Total BankGuarantees on account of customersLetters of credit and other obligations on account of customers
Less IFRS 9 provision on off-balance sheet exposures
Segment AGuarantees on account of customersLetters of credit and other obligations on account of customers
Less IFRS 9 provision on off-balance sheet exposures
Segment BGuarantees on account of customersLetters of credit and other obligations on account of customers
Less IFRS 9 provision on off-balance sheet exposures
12,792,70610,316,151
23,108,857(14,047)
23,094,810
137,971-
137,971(633)
137,338
12,654,73510,316,151
22,970,886(13,414)
22,957,472
22,504,8597,209,848
29,714,707(21,406)
29,693,301
1,010,758630,960
1,641,718(2,212)
1,639,506
21,494,1016,578,888
28,072,989(19,194)
28,053,795
21,424,24614,807,646
36,231,892(34,219)
36,197,673
763,875662,112
1,425,987(4,604)
1,421,383
20,660,37114,145,534
34,805,905(26,615)
34,779,290
2020 2019 2018
USD USD USD
Bank TotalIncome tax based on chargeable incomeWithholding taxesAdvanced payments made
Segment AIncome tax based on chargeable incomeAdvanced payments made
Segment BIncome tax based on chargeable incomeWithholding taxesAdvanced payments made
1,107,001(33,268)
(850,964)
222,769
125,613(22,640)
102,973
981,388(33,268)
(828,324)
119,796
1,175,000-
(298,219)
876,781
318,000(155,847)
162,153
857,000-
(142,372)
714,628
1,194,000-
(520,738)
673,262
356,000(162,163)
193,837
838,000-
(358,575)
479,425
Accrued expenseUnsettled money market transactions1
Retirement benefit obligations 31(c) Other liabilities & provisionsSundry CreditorsOthers2
Segment AAccrued expenseRetirement benefit obligationsOther liabilities & provisionsSundry CreditorsOthers2
Segment BAccrued expenseUnsettled money market transactions1
Retirement benefit obligationsOther liabilities & provisionsOthers2
Current
Non-Current
1,692,836-
1,422,660606,469
1,308,0014,403,744
9,433,710
45,03937,851
40,3391,308,0011,856,950
3,288,180
1,647,797-
1,384,809566,130
2,546,794
6,145,530
8,573,292
860,418
1,945,2162,908,320
751,5801,007,6281,220,2884,290,628
12,123,660
107,64041,562
1,007,6281,220,288
2,460,940
4,838,058
1,837,5762,908,320
710,018-
1,829,688
7,285,602
11,263,242
860,418
1,960,54635,956,035
-1,280,0021,398,3603,918,960
44,513,903
136,143-
1,005,5471,398,3603,255,960
5,796,010
1,824,40335,956,035
-274,455
663,000
38,717,893
43,649,703
864,200
[1] Relate to uncleared balances on nostro accounts for money market transactions with value date after trade date. These are usually cleared within 2 business days.
(2) Others comprise of clearance settlement, credit in transit, VAT and provision for off-balance sheet.
24. Contingent liabilities
22. Other liabilities
21. Current tax liabilities
177STANDARD BANK (MAURITIUS) LIMITED Annual report 2020176
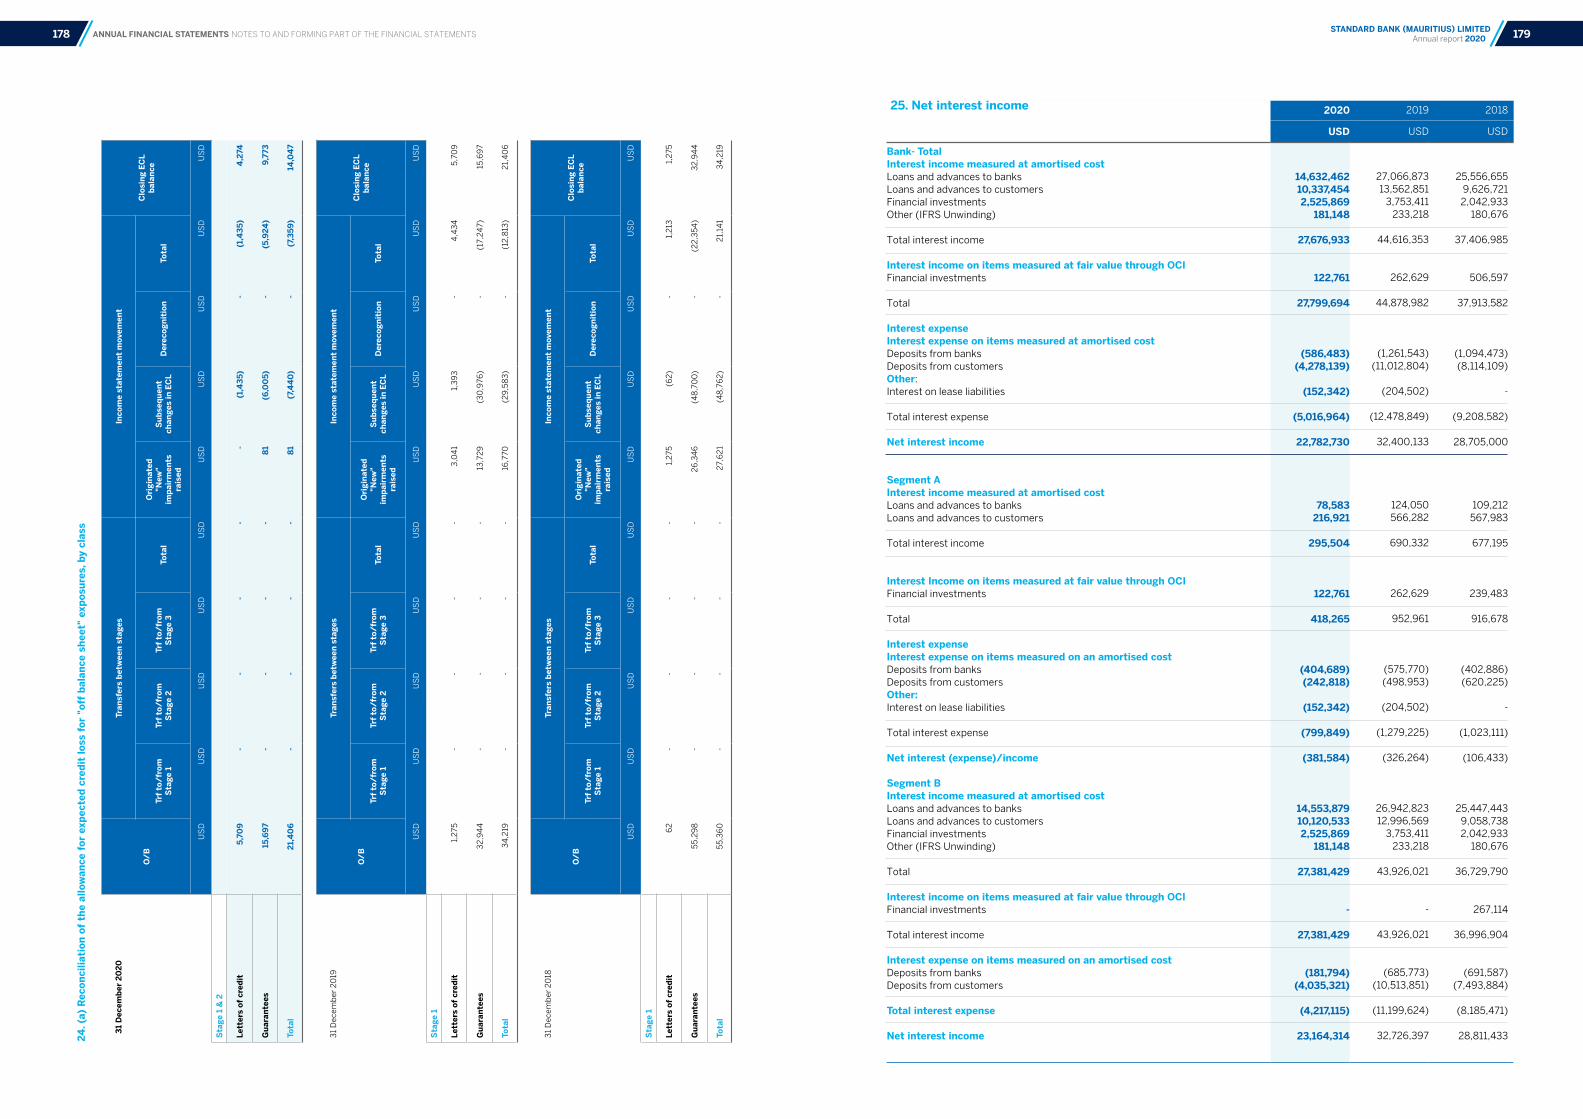
ANNUAL FINANCIAL STATEMENTS NOTES TO AND FORMING PART OF THE FINANCIAL STATEMENTS
24. (
a) R
econ
cilia
tion
of
the
allo
wan
ce f
or e
xpec
ted
cred
it lo
ss f
or "
off
bala
nce
shee
t" e
xpos
ures
, by
clas
s
31
Dec
embe
r 20
20
O/B
Tran
sfer
s be
twee
n st
ages
Inco
me
stat
emen
t m
ovem
ent
Clo
sing
EC
L ba
lanc
e Tr
f to
/fro
m
Sta
ge 1
Trf
to/f
rom
S
tage
2Tr
f to
/fro
m
Sta
ge 3
Tota
l
Ori
gina
ted
"New
" im
pair
men
ts
rais
ed
Sub
sequ
ent
chan
ges
in E
CL
Der
ecog
niti
onTo
tal
US
DU
SD
US
DU
SD
US
DU
SD
US
DU
SD
US
DU
SD
Sta
ge 1
& 2
Lett
ers
of c
redi
t5,
709
--
--
-(1
,435
)-
(1,4
35)
4,2
74
Gua
rant
ees
15,6
97-
--
-81
(6,0
05)
-(5
,924
)9,
773
Tota
l 21
,40
6-
--
-81
(7,4
40
)-
(7,3
59)
14,0
47
31
Dec
emb
er 2
019
O/B
Tran
sfer
s be
twee
n st
ages
Inco
me
stat
emen
t m
ovem
ent
Clo
sing
EC
L ba
lanc
e Tr
f to
/fro
m
Sta
ge 1
Trf
to/f
rom
S
tage
2Tr
f to
/fro
m
Sta
ge 3
Tota
l
Ori
gina
ted
"New
" im
pair
men
ts
rais
ed
Sub
sequ
ent
chan
ges
in E
CL
Der
ecog
niti
onTo
tal
US
DU
SD
US
DU
SD
US
DU
SD
US
DU
SD
US
DU
SD
Sta
ge 1
Lett
ers
of c
redi
t1,
275
--
--
3,0
41
1,3
93
-4
,43
45
,70
9
Gua
rant
ees
32
,94
4-
--
-13
,72
9(3
0,9
76)
-(1
7,2
47)
15,6
97
Tota
l 3
4,2
19-
--
-16
,770
(29
,58
3)
-(1
2,8
13)
21,
40
6
31
Dec
emb
er 2
018
O/B
Tran
sfer
s be
twee
n st
ages
Inco
me
stat
emen
t m
ovem
ent
Clo
sing
EC
L ba
lanc
e Tr
f to
/fro
m
Sta
ge 1
Trf
to/f
rom
S
tage
2Tr
f to
/fro
m
Sta
ge 3
Tota
l
Ori
gina
ted
"New
" im
pair
men
ts
rais
ed
Sub
sequ
ent
chan
ges
in E
CL
Der
ecog
niti
onTo
tal
US
DU
SD
US
DU
SD
US
DU
SD
US
DU
SD
US
DU
SD
Sta
ge 1
Lett
ers
of c
redi
t6
2-
--
-1,
275
(62
)-
1,2
131,
275
Gua
rant
ees
55
,29
8-
--
-2
6,3
46
(48
,70
0)
-(2
2,3
54
)3
2,9
44
Tota
l 5
5,3
60
--
--
27,
62
1(4
8,7
62
)-
21,
141
34
,219
2020 2019 2018
USD USD USD
Bank- TotalInterest income measured at amortised costLoans and advances to banksLoans and advances to customersFinancial investmentsOther (IFRS Unwinding)
Total interest income
Interest income on items measured at fair value through OCIFinancial investments
Total
Interest expenseInterest expense on items measured at amortised costDeposits from banksDeposits from customersOther:Interest on lease liabilities
Total interest expense
Net interest income
Segment AInterest income measured at amortised costLoans and advances to banksLoans and advances to customers
Total interest income
Interest Income on items measured at fair value through OCIFinancial investments
Total
Interest expenseInterest expense on items measured on an amortised costDeposits from banksDeposits from customersOther:Interest on lease liabilities
Total interest expense
Net interest (expense)/income
Segment BInterest income measured at amortised costLoans and advances to banksLoans and advances to customersFinancial investmentsOther (IFRS Unwinding)
Total
Interest income on items measured at fair value through OCIFinancial investments
Total interest income
Interest expense on items measured on an amortised costDeposits from banksDeposits from customers
Total interest expense
Net interest income
14,632,462 10,337,454
2,525,869181,148
27,676,933
122,761
27,799,694
(586,483)(4,278,139)
(152,342)
(5,016,964)
22,782,730
78,583216,921
295,504
122,761
418,265
(404,689)(242,818)
(152,342)
(799,849)
(381,584)
14,553,87910,120,533 2,525,869
181,148
27,381,429
-
27,381,429
(181,794)(4,035,321)
(4,217,115)
23,164,314
27,066,87313,562,851 3,753,411
233,218
44,616,353
262,629
44,878,982
(1,261,543) (11,012,804)
(204,502)
(12,478,849)
32,400,133
124,050 566,282
690,332
262,629
952,961
(575,770) (498,953)
(204,502)
(1,279,225)
(326,264)
26,942,823 12,996,569
3,753,411 233,218
43,926,021
-
43,926,021
(685,773) (10,513,851)
(11,199,624)
32,726,397
25,556,655 9,626,721
2,042,933 180,676
37,406,985
506,597
37,913,582
(1,094,473) (8,114,109)
-
(9,208,582)
28,705,000
109,212 567,983
677,195
239,483
916,678
(402,886)(620,225)
-
(1,023,111)
(106,433)
25,447,443 9,058,738 2,042,933 180,676
36,729,790
267,114
36,996,904
(691,587) (7,493,884)
(8,185,471)
28,811,433
25. Net interest income
179STANDARD BANK (MAURITIUS) LIMITED Annual report 2020178

Bank Total and Segment AGovernment Bonds/Treasury Bills Other
54,964(118)
54,846
40,066-
40,066
105,647710
106,357
Bank Total Loans and advances to customers* Loans and advances to banks & cash and cash equivalentsFinancial investmentsNon-funded facilities** Recoveries on loans and advances previously written off
Segment A Loans and advances to customers Loans and advances to banks & cash and cash equivalentsFinancial investmentsNon-funded facilitiesRecoveries on loans and advances previously written off
Segment BLoans and advances to customers Loans and advances to banks & cash and cash equivalentsFinancial investmentsNon-funded facilities
(9,212,393)(434,515)
(1,729)(69,519)
-
(9,718,156)
17,840472
(164)(16,921)
-
1,227
(9,230,233)(434,987)
(1,565)(52,598)
(9,719,383)
(5,038,450)27,423(1,524)
(148,810)770
(5,160,591)
12,551(311)
(6)(10,861)
770
2,143
(5,051,001)27,734(1,518)
(137,949)
(5,162,734)
(1,415,964)(29,518)
1,858(11,717)
-
(1,455,341)
(57,595)(146)
303(13,468)
-
(70,906)
(1,358,369)(29,372)
1,5551,751
(1,384,435)
* Loans and advanced to customers include unwind time value of money USD265,127.
** Impairment charge relates to off-balance sheet exposures.
ANNUAL FINANCIAL STATEMENTS NOTES TO AND FORMING PART OF THE FINANCIAL STATEMENTS
26. Net fee and commission income 29. Other operating income2020 2019 2018
USD USD USD
Fee and commission incomeCorporate banking customer fees Corporate banking credit-related fees Investment Banking fees Custody fees
Total fee and commission income Fee and commission expense
Net fee and commission income
Segment A Fee and commission incomeCorporate banking customer fees Corporate banking credit-related fees Custody fees
Total fee and commission income Fee and commission expense
Net fee and commission income
Segment BFee and commission incomeCorporate banking customer feesCorporate banking credit-related feesInvestment Banking fees
Total fee and commission income
Net fee and commission income
3,938,973
1,646,244 21,750 157,459
5,764,426 (135,615)
5,628,811
47,97732,861
157,459
238,297(135,615)
102,682
3,890,9961,613,383
21,750
5,526,129
5,526,129
4,570,726
1,728,839 295,304 336,527
6,931,396 (311,241)
6,620,155
71,595 60,201
336,527
468,323 (311,241)
157,082
4,499,1311,668,638
295,304
6,463,073
6,463,073
4,746,4721,791,748
33,284577,460
7,148,964 (407,468)
6,741,496
51,085 48,586
577,460
677,131 (407,468)
269,663
4,695,387 1,743,162
33,284
6,471,833
6,471,833
2020 2019 2018
USD USD USD
Bank Total Total other Income
Segment A Rental income and recharges
Segment B Currency Sell-off
275,506
280,300
(4,794)
336,855
336,855
-
316,141
316,141
-
27. Net trading income
Fixed Income/Money Market Foreign exchange Other
Segment A Fixed Income/Money Market Foreign exchange Other
Segment B Fixed Income/Money Market Foreign exchangeOther
46,3116,022,148
-
6,068,459
46,311823,596
869,907
5,198,552-
5,198,552
59,5577,331,860
8,200
7,399,617
59,557 2,322,217
-
2,381,774
-5,009,643
8,200
5,017,843
(434,531)11,980,973
63,745
11,610,187
(434,531) 2,814,958
63,745
2,444,172
-9,166,015
-
9,166,015
30. Net impairment (charge)/gain on financial assets
31. (a) Personnel expenses
Bank Total Wages and salaries Other personnel expenses Compulsory social security obligations Contributions to defined contribution plans Retirement benefit cost Share-based payment - cash settled
Segment A Wages and salaries Other personnel expenses Compulsory social security obligations Contributions to defined contribution plans Retirement benefit cost Share-based payment - cash settled
Segment BWages and salaries Other personnel expenses Compulsory social security obligations Contributions to defined contribution plans Retirement benefit costShare-based payment - cash settled
4,658,5171,535,154
16,112481,184119,136
106,086
6,916,189
123,94340,844
42912,802
3,1702,822
184,010
4,534,5741,494,310
15,683468,382115,966103,264
6,732,179
5,087,7523,051,083
23,060523,361 502,159347,850
9,535,265
281,532168,833
1,27628,960 27,78719,248
527,636
4,806,2202,882,250
21,784494,401 474,372328,602
9,007,629
4,880,0713,012,636
20,460 508,193
-260,380
8,681,740
311,423192,252
1,306 32,431
-16,616
554,028
4,568,6482,820,384
19,154 475,762
-243,764
8,127,712
28. Net income from other financial instruments carried at fair value
181STANDARD BANK (MAURITIUS) LIMITED Annual report 2020180

ANNUAL FINANCIAL STATEMENTS NOTES TO AND FORMING PART OF THE FINANCIAL STATEMENTS
31. (b) Share Based Payments (i) Share Incentive Scheme
(ii) Deferred bonus scheme (DBS)
In 2012, changes were made to the existing DBS to provide for a single global incentive deferral scheme across the regions. The purpose of the Deferred Bonus Scheme 2012 is to encourage a longer-term outlook in business decision-making and closer alignment of performance with long-term value creation.
All employees granted an annual performance award over a threshold have part of their award deferred. The award is indexed to the group's share price and accrues notional dividends during the vesting period, which are payable on vesting. The awards vest in three equal amounts at 18 months, 30 months and 42 months from the date of award. The final pay-out is determined with reference to the group's share price on vesting date.
The final value is calculated with reference to the number of units multiplied by the Standard Bank Group share price and is delivered in cash in Mauritius. The award also accrues notional dividends during the vesting period, payable at vesting.
The provision in respect of liabilities at 31 December 2020 and the amount charged for the year under the scheme amounts to USD185,715 (2019: USD257,129). Total expenses recognised in staff costs for 2020 was USD106,086 (2019: USD347,850).
31. (c) Retirement BenefitsThe Bank participates in a defined contribution pension plan. Its contribution for DC employees is expensed to the income statement and amounted to USD458,071 for December 2020 (2019: USD523,361).
The Bank has recognised a net defined liability of USD1,422,660 as at 31 December 2020 (2019: USD751,580) in respect of employees whose benefits from the DC plan are not expected to fully offset the Bank's retirement gratuity obligations under the Workers' Rights Act (WRA) 2019 and in respect of any retirement and death gratuities for employees who are not members of any pension plan.
The Bank is subject to an unfunded defined benefit plan for its employees. The plan exposes the Bank to normal risks described below:
Interest Risk: A decrease in the bond interest rate will increase the plan liability; however, this may be partially offset by an increase in the return on the DC plan debt’s investments and a decrease in inflationary pressures on salary and pension increases.
Salary Risk: The plan liability is calculated by reference to the future projected salaries of plan participants. As such, an increase in the salary of the plan participants above the assumed rate will increase the plan liability whereas an increase below the assumed rate will decrease the liability.
The Bank has a residual obligation imposed by WRA 2019 on top of its DC plan. It is therefore particularly exposed to investment under-performance of the DC plan.
There has been no plan amendment, curtailment or settlement during the year.(iii) Cash settled deferred bonus scheme (CSDBS)
Employees granted an annual performance award over a threshold have part of their award deferred. In addition, the Group makes special awards of CSDBS to qualifying employees.
The award units are denominated in employee's host countries' local currency, the value of which moves parallel to the changes in the price of the SBG shares listed on the JSE and accrue notional dividends over the vesting period which are payable on vesting.
Awards vest in three equal tranches at 18 months, 30 months and 42 months from the date of award. Final pay-out is determined with reference to SBG share price on vesting date.
(iii) Cash settled deferred bonus scheme (CSDBS) (continued)
31 December 2020
31 December 2019
31 December 2018
Option pricerange (cents)
Number of Options
2020 2019 2018
USD USD USD
Share Incentive Scheme reconciliationOptions outstanding at beginning of yearTransfers Exercised
Options outstanding at end of year
98.80
---
-
23,125-
(23,125)
-
26,188-
(3,063)
23,125
At 31 December 2020, the Bank issued nil (2019: 23,125) SBG shares to settle outstanding appreciated rights value.
Units
2020 2019 2018
Reconciliation USD USD USD
Units outstanding at beginning of year
GrantedTransferred outExercisedLapsed
Units outstanding at end of the year Weighted average fair value at grant date (R) Expected life (years) Risk-free interest rate (%)
-
9831,176
(458)-
1,701
152.642.51n/a
7,189
- -
(7,189)-
-
n/an/an/a
18,812
- -
(11,623)-
7,189
n/an/an/a
Weighted average fair
value at grant date
Expected life at grant date
(years)
Opening balance (Unit)
Granted (Unit)
Forfeited (Unit)
Exercised(Unit)
Transferred between group
companies (Unit)
Outstanding (Unit)Currency
MUR
UGX
152.64
-
2.51
-
115,342
-
51,269 (3,702) (52,932)
(15,085)
-
30,171
109,977
15,086
Weighted average fair
value at grant date
Expected life at grant date
(years)
Opening balance (Unit)
Granted (Unit)
Forfeited (Unit)
Exercised(Unit)
Transferred between group
companies (Unit)
Outstanding (Unit)Currency
MUR 182.43 2.51 80,379 66,189 - (32,358) 1,132 115,342
Weighted average fair
value at grant date
Expected life at grant date
(years)
Opening balance (Unit)
Granted (Unit)
Forfeited (Unit)
Exercised(Unit)
Transferred between group
companies (Unit)
Outstanding (Unit)Currency
MUR 220.97 2.51 46,745 49,214 - (15,580) - 80,379
183STANDARD BANK (MAURITIUS) LIMITED Annual report 2020182

Bank Total BuildingsLess than one yearBetween one and five years
Bank Total BuildingsLess than one yearBetween one and five years
5,199-
5,199
42,45239,925
82,377
6,140-
6,140
38,1094,489
42,598
907,4553,825,322
4,732,777
88,2217,411
95,632
From 01 January 2019, the Bank has recognised right of use assets for most of its operating lease. The operating lease commitments comprise mainly of rental of PC’s, laptops and photocopiers. The lease terms make provision for a yearly charge in the operating lease charges as per the rental agreement.
ANNUAL FINANCIAL STATEMENTS NOTES TO AND FORMING PART OF THE FINANCIAL STATEMENTS
31. (c) Retirement Benefits (continued) 32. Operating lease expenses
Operating lease commitmentsThe future minimum lease payments under non-cancellable operating lease are as follows:
2020 2019
USD USD
Reconciliation of Net Defined Benefit Liability Opening balanceAmount recognised in profit or loss Amount recognised in other comprehensive income*Less benefits paid
Closing Balance
Reconciliation of Present Value of Defined Benefit ObligationOpening balanceCurrent service costInterest expenseBenefits paidLiability experience lossLiability loss due to change in financial assumptions
Closing Balance
Components of amount recognised in profit or loss Current service costNet Interest on net defined benefit liability
Components of amount recognised in other comprehensive income Liability experience lossLiability loss due to change in financial assumptions
751,580119,136610,572
(58,628)
1,422,660
751,58082,74536,391
(58,628)49,098
561,474
1,422,660
82,74536,391
119,136
49,098561,474
610,572
-502,159249,421
-
751,580
-477,91324,246
-205,764
43,657
751,580
477,91324,246
502,159
205,76443,657
249,421
During the year, benefits paid for the unfunded scheme amounted to USD58,628 (2019: USD nil). The Bank anticipates to make payment of USD62,008 in the coming 12 months to employees reaching retirement age in the unfunded plan. One staff has been assumed to be retiring in the next reporting year.
2020 2019
Principal assumptions used at end of yearDiscount rateRate of salary increasesAverage retirement age (ARA)
Sensitivity analysis on defined benefit obligation at end of yearIncrease due to 1% decrease in discount rateDecrease due to 1% increase in discount rate
3.0%2.5%
60
USD
324,675283,025
5.6%2.8%
60
USD
225,175185,885
The above sensitivity analysis has been carried out by recalculating the present value of obligation at end of period after increasing or decreasing the discount rate while leaving all other assumptions unchanged. Any similar variation in the other assumptions would have shown smaller variations in the defined benefit obligation.
Future cashflowsThe funding policy is to pay benefits out of the reporting entity's cashflow as and when due.
Expected employer contribution for the next year
Weighted average duration of the defined benefit obligation
62,008
17 years
* Remeasurement of defined benefit liabilities net of tax amount to USD579,720.
2020 2019 2018
USD USD USD
Bank Total Operating lease expense
Segment A Operating lease expense
Segment B Operating lease expense
72,875
1,939
70,936
136,076
7,530
128,546
776,865
49,576
727,289
USD USD
185STANDARD BANK (MAURITIUS) LIMITED Annual report 2020184
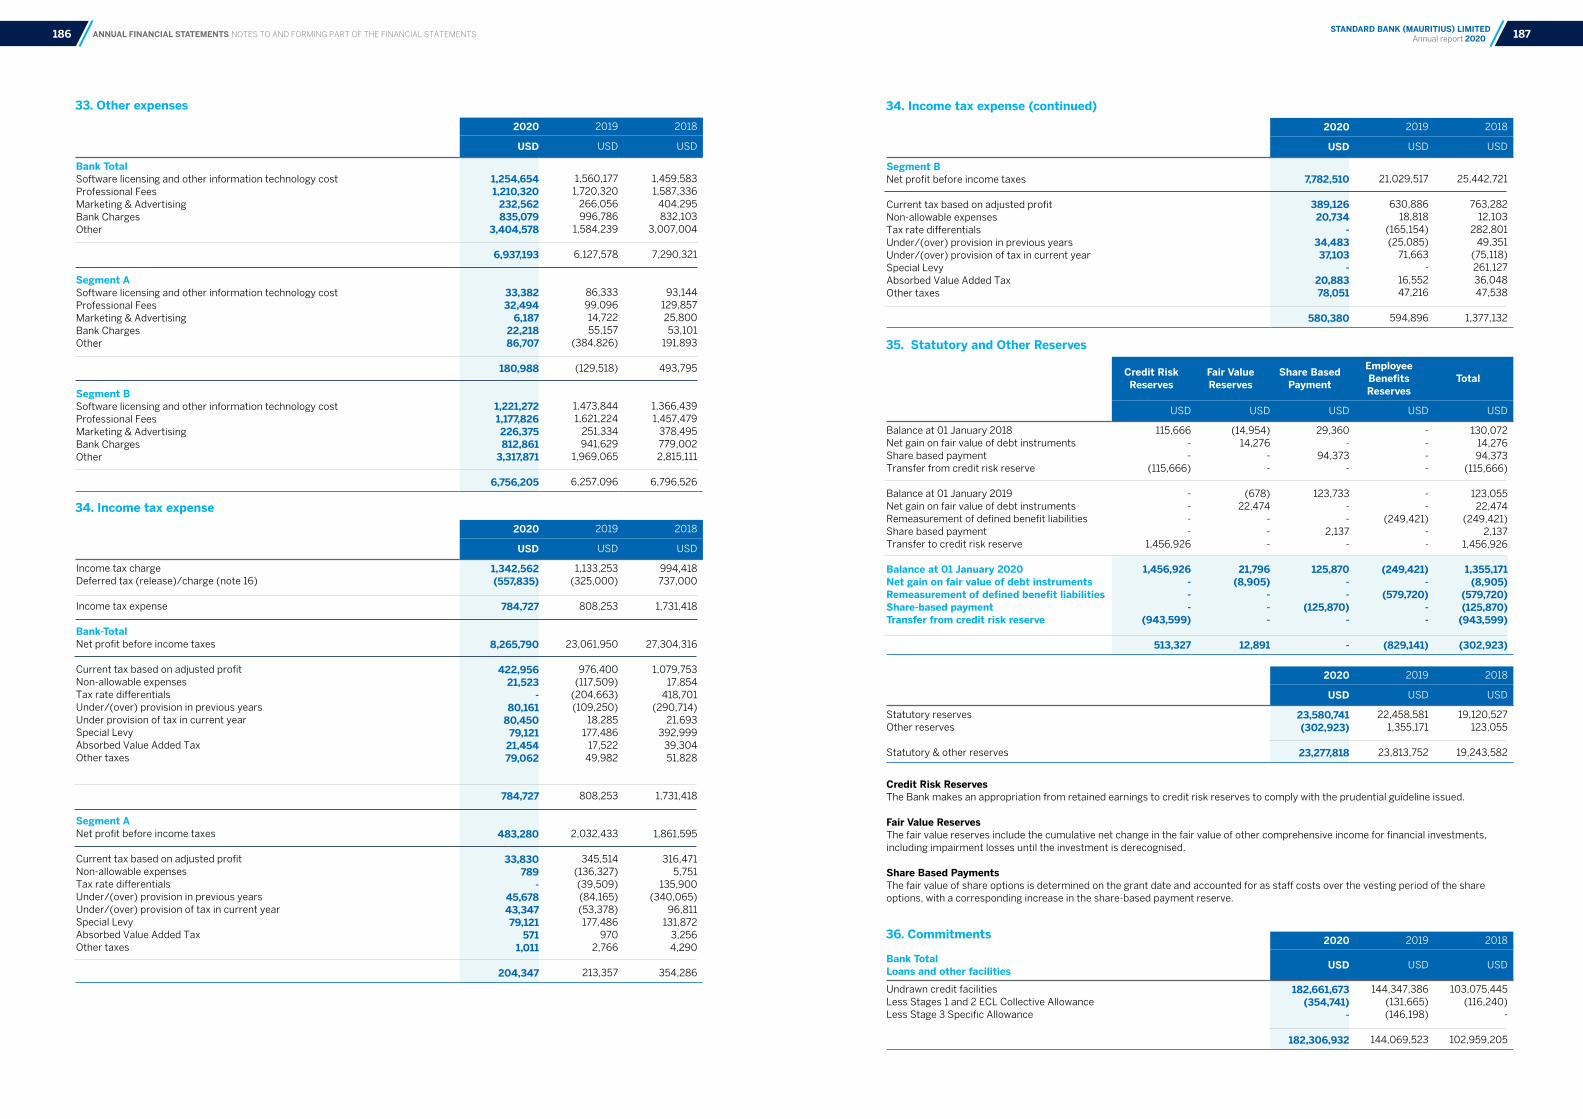
ANNUAL FINANCIAL STATEMENTS NOTES TO AND FORMING PART OF THE FINANCIAL STATEMENTS
34. Income tax expense (continued)
35. Statutory and Other Reserves
33. Other expenses
34. Income tax expense
2020 2019 2018
USD USD USD
Bank Total Software licensing and other information technology cost Professional FeesMarketing & AdvertisingBank ChargesOther
Segment A Software licensing and other information technology cost Professional FeesMarketing & AdvertisingBank ChargesOther
Segment B Software licensing and other information technology cost Professional FeesMarketing & AdvertisingBank ChargesOther
1,254,6541,210,320
232,562835,079
3,404,578
6,937,193
33,38232,494
6,18722,21886,707
180,988
1,221,2721,177,826226,375812,861
3,317,871
6,756,205
1,560,1771,720,320
266,056996,786
1,584,239
6,127,578
86,333 99,096
14,722 55,157
(384,826)
(129,518)
1,473,844 1,621,224
251,334 941,629
1,969,065
6,257,096
1,459,5831,587,336
404,295832,103
3,007,004
7,290,321
93,144 129,857
25,800 53,101
191,893
493,795
1,366,439 1,457,479
378,495 779,002 2,815,111
6,796,526
2020 2019 2018
USD USD USD
Income tax chargeDeferred tax (release)/charge (note 16)
Income tax expense
Bank-TotalNet profit before income taxes
Current tax based on adjusted profitNon-allowable expensesTax rate differentialsUnder/(over) provision in previous years Under provision of tax in current yearSpecial LevyAbsorbed Value Added TaxOther taxes
Segment ANet profit before income taxes
Current tax based on adjusted profitNon-allowable expensesTax rate differentialsUnder/(over) provision in previous years Under/(over) provision of tax in current yearSpecial LevyAbsorbed Value Added TaxOther taxes
1,342,562(557,835)
784,727
8,265,790
422,95621,523
-80,161
80,45079,121
21,45479,062
784,727
483,280
33,830789
-45,67843,34779,121
5711,011
204,347
1,133,253(325,000)
808,253
23,061,950
976,400(117,509)
(204,663)(109,250)
18,285177,486
17,52249,982
808,253
2,032,433
345,514 (136,327)
(39,509) (84,165)
(53,378) 177,486
970 2,766
213,357
994,418737,000
1,731,418
27,304,316
1,079,75317,854
418,701(290,714)
21,693392,999
39,30451,828
1,731,418
1,861,595
316,4715,751
135,900(340,065)
96,811131,872
3,2564,290
354,286
2020 2019 2018
USD USD USD
Segment BNet profit before income taxes
Current tax based on adjusted profitNon-allowable expensesTax rate differentials Under/(over) provision in previous years Under/(over) provision of tax in current yearSpecial Levy Absorbed Value Added TaxOther taxes
7,782,510
389,12620,734
-34,48337,103
-20,88378,051
580,380
21,029,517
630,886 18,818 (165,154)
(25,085) 71,663 -
16,552 47,216
594,896
25,442,721
763,28212,103
282,80149,351
(75,118)261,12736,04847,538
1,377,132
2020 2019 2018
USD USD USD
Statutory reservesOther reserves
Statutory & other reserves
23,580,741(302,923)
23,277,818
22,458,5811,355,171
23,813,752
19,120,527123,055
19,243,582
Credit Risk ReservesThe Bank makes an appropriation from retained earnings to credit risk reserves to comply with the prudential guideline issued.
Fair Value ReservesThe fair value reserves include the cumulative net change in the fair value of other comprehensive income for financial investments, including impairment losses until the investment is derecognised.
Share Based PaymentsThe fair value of share options is determined on the grant date and accounted for as staff costs over the vesting period of the share options, with a corresponding increase in the share-based payment reserve.
2020 2019 2018
Bank TotalLoans and other facilities USD USD USD
Undrawn credit facilitiesLess Stages 1 and 2 ECL Collective AllowanceLess Stage 3 Specific Allowance
182,661,673(354,741)
-
182,306,932
144,347,386(131,665)(146,198)
144,069,523
103,075,445(116,240)
-
102,959,205
Credit RiskReserves
Fair Value Reserves
Share Based Payment
EmployeeBenefits Reserves
Total
USD USD USD USD USD
Balance at 01 January 2018Net gain on fair value of debt instrumentsShare based paymentTransfer from credit risk reserve
Balance at 01 January 2019Net gain on fair value of debt instrumentsRemeasurement of defined benefit liabilitiesShare based paymentTransfer to credit risk reserve
Balance at 01 January 2020Net gain on fair value of debt instrumentsRemeasurement of defined benefit liabilitiesShare-based paymentTransfer from credit risk reserve
115,666 -
-(115,666)
----
1,456,926
1,456,926---
(943,599)
513,327
(14,954)14,276
--
(678)22,474
---
21,796(8,905)
---
12,891
29,360-
94,373-
123,733--
2,137-
125,870--
(125,870)-
-
----
--
(249,421)--
(249,421)-
(579,720)--
(829,141)
130,07214,27694,373
(115,666)
123,05522,474
(249,421)2,137
1,456,926
1,355,171(8,905)
(579,720)(125,870)
(943,599)
(302,923)
36. Commitments
187STANDARD BANK (MAURITIUS) LIMITED Annual report 2020186
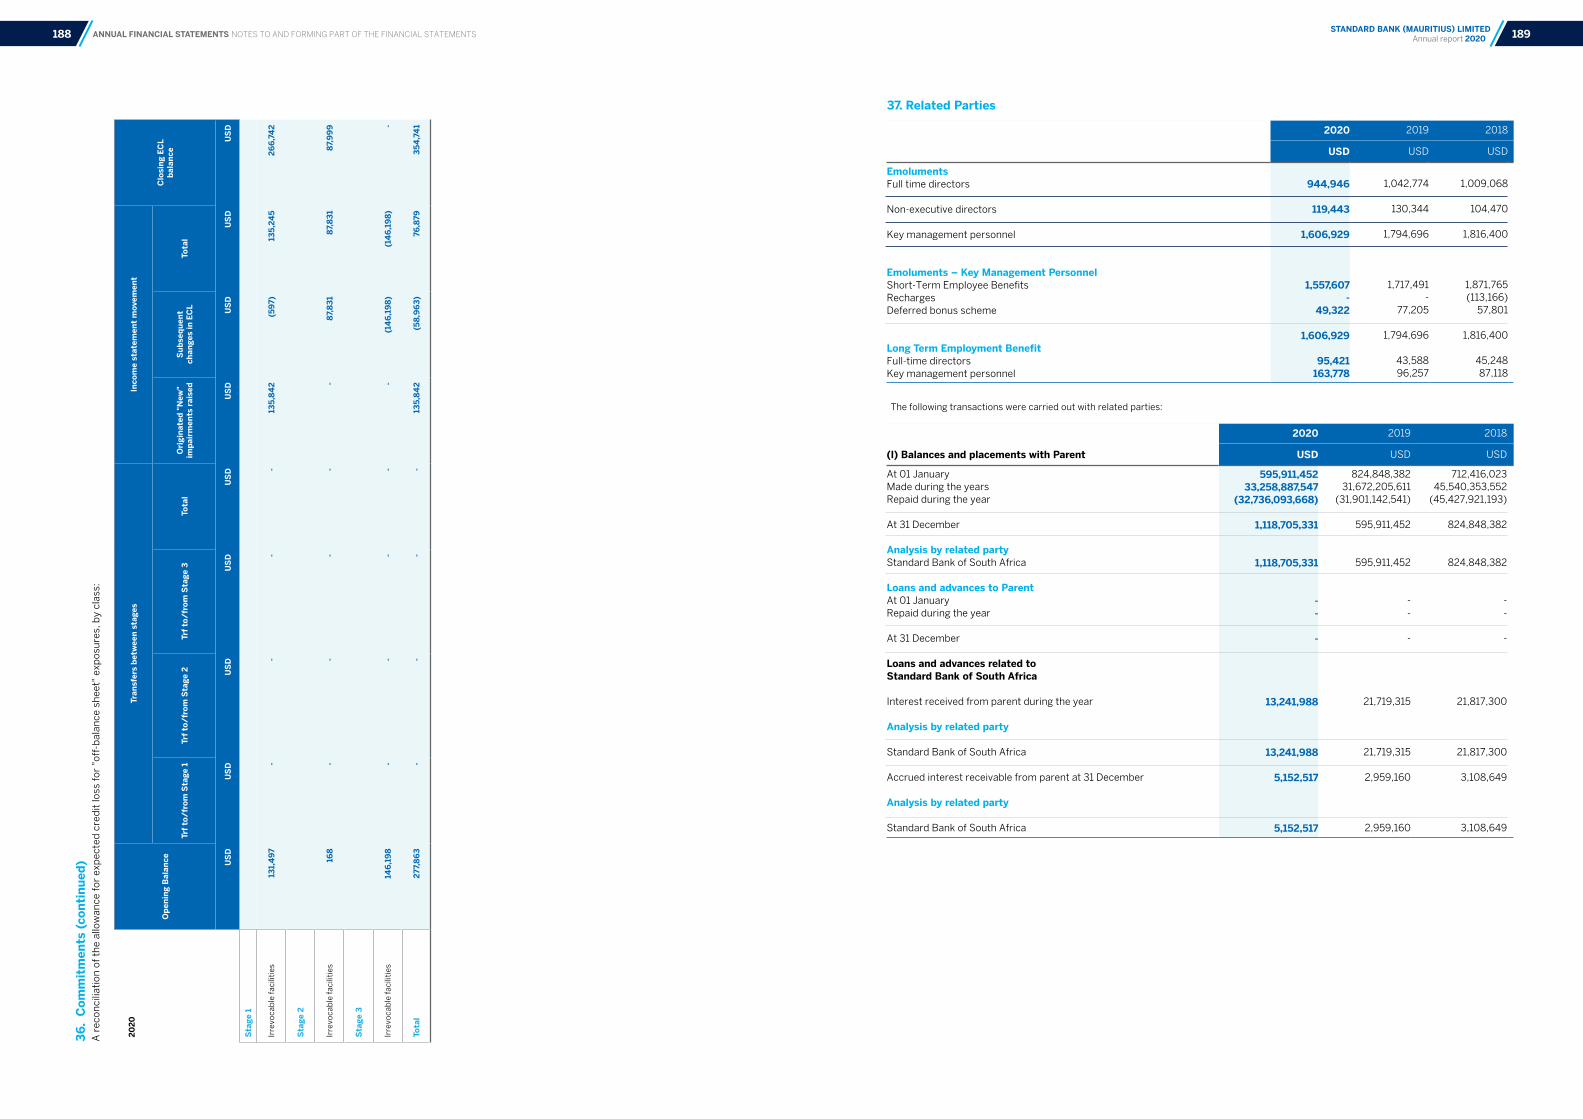
ANNUAL FINANCIAL STATEMENTS NOTES TO AND FORMING PART OF THE FINANCIAL STATEMENTS
36.
Com
mit
men
ts (
cont
inue
d)A
rec
onci
liati
on o
f th
e al
low
ance
for
exp
ecte
d c
red
it lo
ss fo
r "o
ff-b
alan
ce s
hee
t" e
xpos
ure
s, b
y cl
ass:
2020
Ope
ning
Bal
ance
Tran
sfer
s be
twee
n st
ages
Inco
me
stat
emen
t m
ovem
ent
Clo
sing
EC
L ba
lanc
e
Trf
to/f
rom
Sta
ge 1
Trf
to/f
rom
Sta
ge 2
Trf
to/f
rom
Sta
ge 3
Tota
lO
rigi
nate
d "N
ew"
impa
irm
ents
rai
sed
Sub
sequ
ent
chan
ges
in E
CL
Tota
l
US
DU
SD
US
DU
SD
US
DU
SD
US
DU
SD
US
D
Sta
ge 1
Irre
voca
ble
faci
litie
s13
1,4
97-
--
-13
5,84
2(5
97)
135,
245
266,
742
Sta
ge 2
Irre
voca
ble
faci
litie
s16
8-
--
--
87,8
3187
,831
87,9
99
Sta
ge 3
Irre
voca
ble
faci
litie
s14
6,19
8-
--
--
(14
6,19
8)(1
46,
198)
-
Tota
l 27
7,86
3-
--
-13
5,84
2 (5
8,9
63)
76
,879
35
4,7
41
37. Related Parties
The following transactions were carried out with related parties:
2020 2019 2018
USD USD USD
EmolumentsFull time directors
Non-executive directors
Key management personnel
Emoluments – Key Management PersonnelShort-Term Employee BenefitsRechargesDeferred bonus scheme
Long Term Employment BenefitFull-time directorsKey management personnel
944,946
119,443
1,606,929
1,557,607-
49,322
1,606,929
95,421163,778
1,042,774
130,344
1,794,696
1,717,491-
77,205
1,794,696
43,58896,257
1,009,068
104,470
1,816,400
1,871,765(113,166)
57,801
1,816,400
45,24887,118
2020 2019 2018
(I) Balances and placements with Parent USD USD USD
At 01 JanuaryMade during the yearsRepaid during the year
At 31 December
Analysis by related partyStandard Bank of South Africa
Loans and advances to ParentAt 01 JanuaryRepaid during the year
At 31 December
Loans and advances related to Standard Bank of South Africa
Interest received from parent during the year
Analysis by related party
Standard Bank of South Africa
Accrued interest receivable from parent at 31 December
Analysis by related party
Standard Bank of South Africa
595,911,45233,258,887,547
(32,736,093,668)
1,118,705,331
1,118,705,331
--
-
13,241,988
13,241,988
5,152,517
5,152,517
824,848,38231,672,205,611
(31,901,142,541)
595,911,452
595,911,452
--
-
21,719,315
21,719,315
2,959,160
2,959,160
712,416,02345,540,353,552
(45,427,921,193)
824,848,382
824,848,382
--
-
21,817,300
21,817,300
3,108,649
3,108,649
189STANDARD BANK (MAURITIUS) LIMITED Annual report 2020188

ANNUAL FINANCIAL STATEMENTS NOTES TO AND FORMING PART OF THE FINANCIAL STATEMENTS
37. Related Parties (continued)
(xi) Foreign Exchange transactionsThe Bank conducts foreign exchange transactions with Group entities, in the hedging of its currency risk.
(xii) The Bank did not have any non-performing related party exposure as at 31st December 2020 (2019: nil and 2018: nil)As at 31 December 2020, the Bank’s top five exposures to related parties was USD1,130m which was 10 times the Bank’s Tier I Capital.
38. Parent companiesThe immediate parent company is Stanbic Africa Holdings Ltd, a company incorporated in the United Kingdom and theultimate parent company is Standard Bank Group, a company incorporated in South Africa.
39. Subsequent event
The directors are not aware of any matter or circumstance arising since the end of the financial year to the date of this report which could significantly affect the financial position of the Bank at 31 December 2020.
37. Related Parties (continued)
None of the facilities provided during the year under review was non-performing.
Interest paid during the year relate to Standard Bank of South Africa.
2020 2019 2018
(ii) Balances and placements with Other Related parties USD USD USD
At 01 JanuaryRepaid during the year
At 31 December
Loans and advances to OtherRelated partiesAt 01 JanuaryRepaid during the year
At 31 December
Analysis by related partyStanbic Bank Kenya LimitedStanbic Bank Uganda Limited
Interest received from other related entities during the year
Analysis by related partyStanbic Bank Kenya LimitedStanbic Bank Uganda Limited
Accrued interest receivable from other related entities at 31 December
Analysis by related party
Stanbic Bank Kenya Limited
2,013,987(2,006,214)
7,773
6,912,697(1,256,854)
5,655,843
5,655,843-
5,655,843
272,915
272,915-
272,915
536
536
89,804,042(87,790,055)
2,013,987
8,169,551(1,256,854)
6,912,697
6,912,697-
6,912,697
438,389
438,389-
438,389
1,122
1,122
100,293,240(10,489,198)
89,804,042
65,740,618(57,571,067)
8,169,551
8,169,551-
8,169,551
1,090,569
758,769331,800
1,090,569
121,862
121,862
(iii) Borrowings from Parent
At 01 JanuaryRepaid during the year
At 31 December
Analysis by related partyStandard Bank of South Africa
Interest paid during the year
Interest payable at 31 December
470,714(470,714)
-
-
9,396
-
1,412,143(941,429)
470,714
470,714
47,082
52
2,595,414(1,183,271)
1,412,143
1,412,143
87,198
156
(iv) Deposits from other related parties
At 01 JanuaryReceived during the yearRepaid during the year
At 31 December
Interest paid on deposits
Interest payable at 31 December
66,597,1311,521,000,000
(1,530,565,077)
57,032,054
172,398
6,438
10,108,450790,000,000(733,511,319)
66,597,131
638,692
8,653
35,998,5221,288,000,000
(1,313,890,072)
10,108,450
604,389
2,972
2020 2019 2018
(v) Deposits from Parent USD USD USD
At 01 JanuaryReceived during the yearRepaid during the year
At 31 December
Interest paid on deposits
1,257,577-
(955,027)
302,550
-
1,790,188-
(532,611)
1,257,577
-
3,764,686-
(1,974,498)
1,790,188
-
Balances relate to vostro accounts from Standard Bank of South Africa.
(vi) Deposits from Directors
At 01 JanuaryReceived during the yearRepaid during the year
At 31 December
Interest paid during the year
---
-
-
266,185283,893
(550,078)
-
1,057
304,289638,665
(676,768)
266,186
5,542
(vii) Recharges
Recharges to other related entities
Recharges to parent
640,865
65,223
765,138
79,953
865,759
85,415
(viii) Expenses
Management fees paid to parentOther expenses paid to parentOther expenses paid to other related entities
1,044,1812,757,142
-3,801,323
1,403,9731,049,112
-2,453,085
1,424,2931,764,241
2,100 3,190,634
Most of the other expenses paid to parent relate to IT support costs.
(x) Dividend paid to owner 5,000,000 10,000,000 -
Dividend per share was USD0.14 for the year ended 31 December 2020 (2019: 0.29, 2018: nil).
(ix) Amounts accrued but not yet paid for services rendered by parent
Management feesIT Support servicesLicense feeOthers
227,4891,072,610
-7,902
1,308,001
319,974748,595148,564
2,6601,219,793
367,396875,843148,564
6,5601,398,363
191STANDARD BANK (MAURITIUS) LIMITED Annual report 2020190
Related Documents