ANNUAL REPORT 2015 NSW DEPARTMENT OF EDUCATION NSW Department of Education www.dec.nsw.gov.au

Welcome message from author
This document is posted to help you gain knowledge. Please leave a comment to let me know what you think about it! Share it to your friends and learn new things together.
Transcript

ANNUAL REPORT 2015NSW DEPARTMENT OF EDUCATION
NSW Department of Education www.dec.nsw.gov.au

LETTER OF SUBMISSION TO MINISTERS
The Hon. Adrian Piccoli, MP Minister for Education Level 18, 52 Martin Place Sydney NSW 2000
The Hon. Leslie Williams, MP Minister for Early Childhood Education, Minister for Aboriginal Affairs and Assistant Minister for Education Level 16, 52 Martin Place Sydney NSW 2000
Dear Ministers
In compliance with the terms of the Annual Reports (Departments) Act 1985, the Public Finance and Audit Act 1983 and Regulations under those Acts, I submit the 2015 NSW Department of Education Annual Report for your presentation to the NSW Parliament.
The report summarises our services, achievements and operational activities for 2015. This provides the NSW Parliament, the NSW Government and the community with information on our performance over the past year.
It covers our services in the areas of public schools, early childhood education and care and Aboriginal affairs. It also includes the operations of vocational education and training, volunteering, youth, and community and regional engagement until 30 June 2015.
In addition, the report contains the department’s audited financial statements for the financial year ended 30 June 2015 and appendices as required by legislation.
Yours sincerely
Peter Riordan ACTING SECRETARY DEPARTMENT OF EDUCATION April 2016
2 NSW Department of Education Annual Report 2015 | www.dec.nsw.gov.au

TABLE OF CONTENTS
Letter of submission to Ministers 2
Secretary’s foreword 4
About us 6
Our vision 6
Our outcomes 6
Our priorities 6
Our students 7
Our communities 7
Our organisation 9
Performance report: In early childhood 12
Our performance targets 12
Our priorities: In early childhood 13
High expectations, closing the gaps 13
Quality teaching and leadership 14
New and better ways of doing business 15
Performance report: At school 16
Our performance targets 16
Our priorities: At school 24
High expectations, closing the gaps 24
Quality teaching and leadership 30
New and better ways of doing business 32
Performance report: In tertiary education 36
Our performance targets 36
Our priorities: In tertiary education 41
High expectations, closing the gaps 41
Quality teaching and leadership 43
New and better ways of doing business 43
Performance report: In our communities 45
Our performance targets 45
Our priorities: In our communities 48
High expectations, closing the gaps 48
Stronger communities and leadership 50
Financial statements 52
Financial highlights 52
Financial statements 54
Appendices 85
3 NSW Department of Education Annual Report 2015 | www.dec.nsw.gov.au
Secretary’s foreword
SECRETARY’S FOREWORD
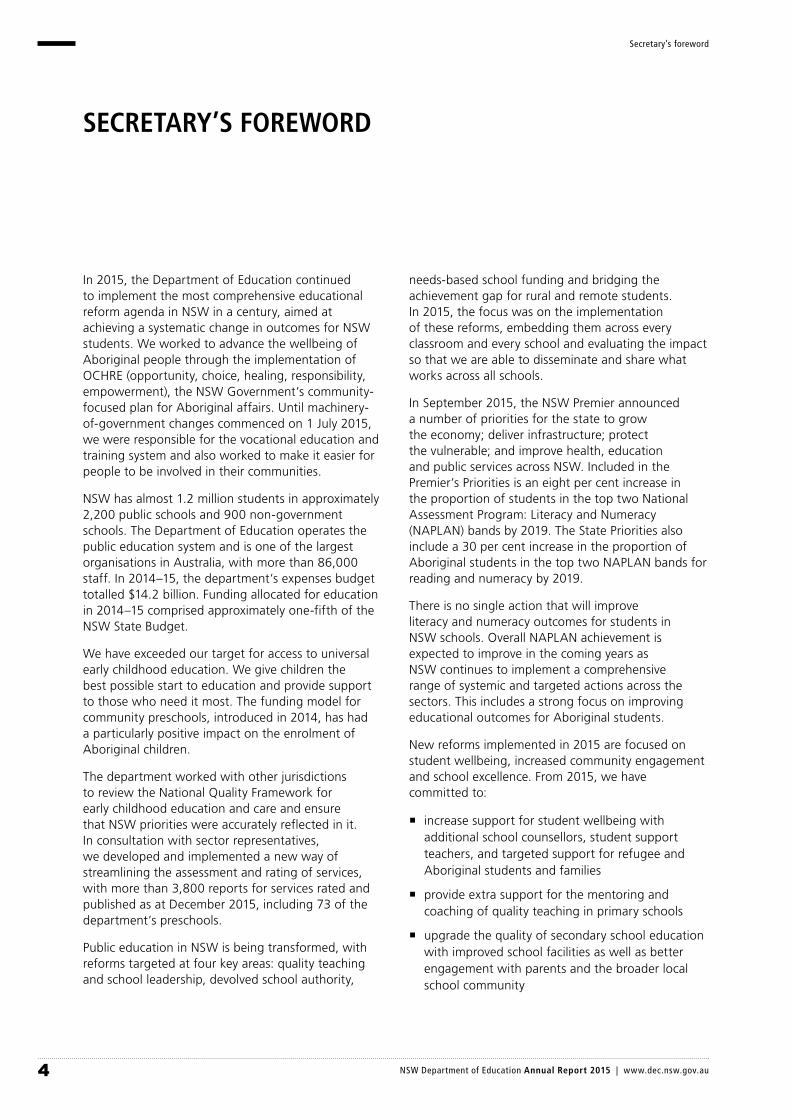
In 2015, the Department of Education continued to implement the most comprehensive educational reform agenda in NSW in a century, aimed at achieving a systematic change in outcomes for NSW students. We worked to advance the wellbeing of Aboriginal people through the implementation of OCHRE (opportunity, choice, healing, responsibility, empowerment), the NSW Government’s community-focused plan for Aboriginal affairs. Until machinery-of-government changes commenced on 1 July 2015, we were responsible for the vocational education and training system and also worked to make it easier for people to be involved in their communities.
NSW has almost 1.2 million students in approximately 2,200 public schools and 900 non-government schools. The Department of Education operates the public education system and is one of the largest organisations in Australia, with more than 86,000 staff. In 2014–15, the department’s expenses budget totalled $14.2 billion. Funding allocated for education in 2014–15 comprised approximately one-fifth of the NSW State Budget.
We have exceeded our target for access to universal early childhood education. We give children the best possible start to education and provide support to those who need it most. The funding model for community preschools, introduced in 2014, has had a particularly positive impact on the enrolment of Aboriginal children.
The department worked with other jurisdictions to review the National Quality Framework for early childhood education and care and ensure that NSW priorities were accurately reflected in it. In consultation with sector representatives, we developed and implemented a new way of streamlining the assessment and rating of services, with more than 3,800 reports for services rated and published as at December 2015, including 73 of the department’s preschools.
Public education in NSW is being transformed, with reforms targeted at four key areas: quality teaching and school leadership, devolved school authority,
needs-based school funding and bridging the achievement gap for rural and remote students. In 2015, the focus was on the implementation of these reforms, embedding them across every classroom and every school and evaluating the impact so that we are able to disseminate and share what works across all schools.
In September 2015, the NSW Premier announced a number of priorities for the state to grow the economy; deliver infrastructure; protect the vulnerable; and improve health, education and public services across NSW. Included in the Premier’s Priorities is an eight per cent increase in the proportion of students in the top two National Assessment Program: Literacy and Numeracy (NAPLAN) bands by 2019. The State Priorities also include a 30 per cent increase in the proportion of Aboriginal students in the top two NAPLAN bands for reading and numeracy by 2019.
There is no single action that will improve literacy and numeracy outcomes for students in NSW schools. Overall NAPLAN achievement is expected to improve in the coming years as NSW continues to implement a comprehensive range of systemic and targeted actions across the sectors. This includes a strong focus on improving educational outcomes for Aboriginal students.
New reforms implemented in 2015 are focused on student wellbeing, increased community engagement and school excellence. From 2015, we have committed to:
¡ increase support for student wellbeing with additional school counsellors, student support teachers, and targeted support for refugee and Aboriginal students and families
¡ provide extra support for the mentoring and coaching of quality teaching in primary schools
¡ upgrade the quality of secondary school education with improved school facilities as well as better engagement with parents and the broader local school community
4 NSW Department of Education Annual Report 2015 | www.dec.nsw.gov.au
Secretary’s foreword
¡ construct new state-of-the-art schools and transform existing classrooms so we provide more opportunities for teachers and students to collaborate in flexible, technology-rich learning spaces
¡ drive school improvement linked to new approaches to school planning, reporting and accountability.
In December 2015, Aboriginal Affairs published its Strategic Plan 2016–19, the core vision of which is Aboriginal people in NSW determining their own futures. The plan identifies key priority areas including culture and healing, leadership in government, growing NSW’s first economy, and strengthening governance and capacity.
Aboriginal Affairs and its government, industry, non-government and tertiary partners are implementing OCHRE initiatives with communities across the state. Achievements include the establishment of six Local Decision Making sites, the negotiation of three industry based agreements, and the establishment of four opportunity hubs and five Aboriginal Language and Culture Nests.
Until machinery-of-government changes in June 2015, when State Training Services transferred to the Department of Industry, Skills and Regional Development, the department was responsible for vocational education and training (VET). The Smart and Skilled Reforms to the NSW VET system commenced on 1 January 2015, providing eligible students with government-subsidised training in courses on the NSW Skills List to gain the skills they need to get a job and advance their career.
Until June 2015, the department also had responsibility for the Office of Communities. The department led community engagement initiatives such as Timebanking, an innovative volunteering program; Tackling Violence, aimed at stopping domestic violence; and Youth Frontiers, a youth mentoring program – programs aimed at increasing opportunities for communities to be involved in planning, influencing and implementing local actions.
While we still have much to achieve, we can be proud of our progress so far and can celebrate our achievements. NSW is recognised nationally and internationally for our reforms and evidence base. I would like to thank our staff for their leadership and commitment and our students, parents and communities for their engagement and support in 2015.
Peter RiordanACTING SECRETARYDEPARTMENT OF EDUCATION
5 NSW Department of Education Annual Report 2015 | www.dec.nsw.gov.au
ABOUT US
The Department of Education provides, funds and regulates education services for NSW students from early childhood to secondary school. We regulate and support the early childhood education and care sector. We deliver a world-class education to more than 772,000 students each year through our public schools and provide funding support to more than 409,000 students in non-government schools. We employ, develop and support teachers, leaders and other staff in public schools to deliver the best outcomes for students.
Through Aboriginal Affairs, we work with Aboriginal communities to promote social, economic and cultural wellbeing. Through OCHRE (opportunity, choice, healing, responsibility, empowerment), the NSW Government’s community-focused plan for Aboriginal affairs, we establish partnerships for economic prosperity, support effective Aboriginal community governance, and strengthen cultural identity and language.
OUR VISION
A highly skilled, educated, vibrant and inclusive NSW where all students are achieving their potential and contributing as informed citizens to our society.
Aboriginal people are determining their own futures.
OUR OUTCOMES
All children receive high-quality early childhood education and care to give them a great start in life and at school.
All primary and secondary students receive the teaching and support they need to learn, achieve and progress.
Aboriginal people have improved social, cultural and economic outcomes.
OUR PRIORITIES
We have high expectations for all and focus on closing gaps in achievement in areas of disadvantage. In September 2015, the NSW Premier announced a number of priorities for the state to grow the economy; deliver infrastructure; protect the vulnerable; and improve health, education and public services across NSW. Included in the Premier’s Priorities is an eight per cent increase in the proportion of students in the top two National Assessment Program: Literacy and Numeracy (NAPLAN) bands for reading and numeracy. The State Priorities also include a 30 per cent increase in the proportion of Aboriginal students in the top two NAPLAN bands for reading and numeracy.
Quality teaching and leadership are essential to the success of our students as well as improving the literacy and numeracy skills of children in our schools. We develop our teachers and leaders and increase their capacity to deliver these outcomes.
Aboriginal Affairs focuses on culture and healing, leadership in government, growing NSW’s first economy and strengthening governance and capacity.
We improve customer satisfaction with our services and find new and better ways of doing business. We innovate and respond to the changing needs of the people of NSW. We develop our staff and support them in delivering excellence. We form strong partnerships with parents and families, industry and community groups, education, training and other providers. We are open and accountable both in our day-to-day business and in delivering our strategic objectives.
6 NSW Department of Education Annual Report 2015 | www.dec.nsw.gov.au
About us
OUR STUDENTS
Preschool children
In the year before school, educational programs are provided in a range of settings including community preschools, Department of Education preschools and preschool programs within long day care services.
The department provides funding for 751 community-based preschools, 2,411 long day care services, 49 mobile preschools and 175 vacation care services. As at December 2015, the department was responsible for regulating 5,402 early childhood services. These services included 100 department-operated preschools.
Primary and secondary students
Our public schools provide an education for students from preschool through to Year 12. In 2015, more than 772,000 students were enrolled in 2,209 public schools. This represents about two-thirds of all NSW school students.
Our students reflect a diversity of cultural, linguistic and socioeconomic backgrounds from the inner city, outer suburbs of Sydney, regional centres, and rural and isolated communities across NSW.
Apprentices and trainees
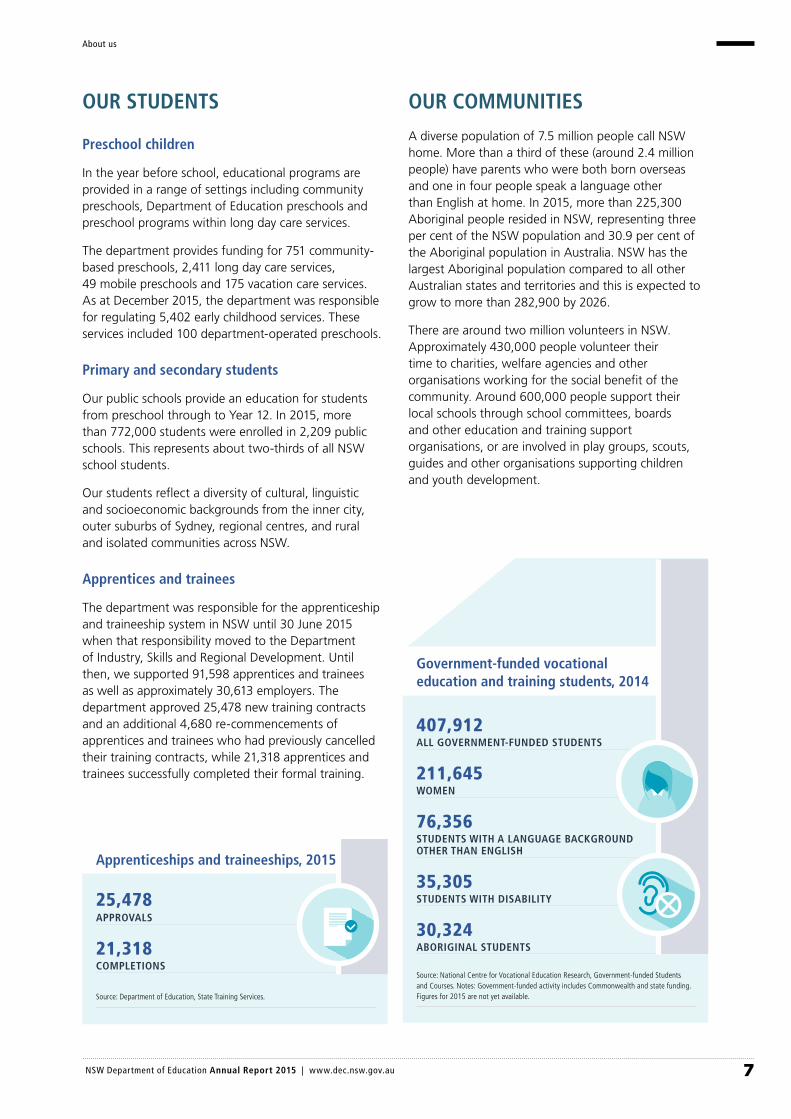
The department was responsible for the apprenticeship and traineeship system in NSW until 30 June 2015 when that responsibility moved to the Department of Industry, Skills and Regional Development. Until then, we supported 91,598 apprentices and trainees as well as approximately 30,613 employers. The department approved 25,478 new training contracts and an additional 4,680 re-commencements of apprentices and trainees who had previously cancelled their training contracts, while 21,318 apprentices and trainees successfully completed their formal training.
OUR COMMUNITIES
A diverse population of 7.5 million people call NSW home. More than a third of these (around 2.4 million people) have parents who were both born overseas and one in four people speak a language other than English at home. In 2015, more than 225,300 Aboriginal people resided in NSW, representing three per cent of the NSW population and 30.9 per cent of the Aboriginal population in Australia. NSW has the largest Aboriginal population compared to all other Australian states and territories and this is expected to grow to more than 282,900 by 2026.
There are around two million volunteers in NSW. Approximately 430,000 people volunteer their time to charities, welfare agencies and other organisations working for the social benefit of the community. Around 600,000 people support their local schools through school committees, boards and other education and training support organisations, or are involved in play groups, scouts, guides and other organisations supporting children and youth development.
Apprenticeships and traineeships, 2015
25,478APPROVALS
21,318COMPLETIONS
Source: Department of Education, State Training Services.
Government-funded vocational education and training students, 2014
407,912ALL GOVERNMENT-FUNDED STUDENTS
211,645WOMEN
76,356STUDENTS WITH A LANGUAGE BACKGROUND OTHER THAN ENGLISH
35,305STUDENTS WITH DISABILITY
30,324ABORIGINAL STUDENTS
Source: National Centre for Vocational Education Research, Government-funded Students and Courses. Notes: Government-funded activity includes Commonwealth and state funding. Figures for 2015 are not yet available.
7 NSW Department of Education Annual Report 2015 | www.dec.nsw.gov.au
About us

NSW public schools, 2015
2,209TOTAL NUMBER OF SCHOOLS
1,606PRIMARY SCHOOLS
401SECONDARY SCHOOLS
113SCHOOLS FOR SPECIFIC PURPOSES
66CENTRAL SCHOOLS
23ENVIRONMENTAL EDUCATION CENTRES
Notes: The total number of schools differs from figures published by the Australian Bureau of Statistics (ABS), which only counts schools that have permanent enrolments for four or more continuous weeks, and therefore environmental education centres, some schools for specific purposes and the Open High School are excluded. A multi-campus college is reported by the ABS as one school, but campuses are reported individually in the above table.
Student-to-teacher ratios in NSW public schools, 2015
14.3OVERALL STUDENT-TO-TEACHER RATIO
15.8PRIMARY STUDENT-TO-TEACHER RATIO
12.5SECONDARY STUDENT-TO-TEACHER RATIO
Note: The number of preschool students and children in early intervention classes is not included in the full-time equivalent total, consistent with Schools Australia.
Source: Department of Education mid-year census.
Note: Figures, except for total number of schools, are consistent with ABS Schools Australia (cat. 4221.0) counting rules and ratios are expressed as full-time equivalents.
NSW public school enrolments, 2015
772,794 TOTAL FULL-TIME AND PART-TIME PRIMARY AND SECONDARY STUDENTS
770,574FULL-TIME PRIMARY AND SECONDARY STUDENTS
467,815FULL-TIME PRIMARY STUDENTS
302,759FULL-TIME SECONDARY STUDENTS
4,278PRESCHOOL STUDENTS
2,220PART-TIME SECONDARY STUDENTS
710CHILDREN IN EARLY INTERVENTION CLASSES
Note: The number of preschool students and children in early intervention classes is not included in the full-time primary and secondary enrolments total, consistent with Schools Australia 2015.
NSW public school student profile, 2015
396,203MALE STUDENTS
375,775FEMALE STUDENTS
251,336STUDENTS WITH A LANGUAGE BACKGROUND OTHER THAN ENGLISH
54,150 ABORIGINAL STUDENTS
17,068 STUDENTS IN SUPPORT CLASSES
5,340 STUDENTS IN SCHOOLS FOR SPECIFIC PURPOSES
Notes: Student numbers for the student profile are counted as full-time equivalent (FTE), with the exception of students with a language background other than English, which is counted as the number of students (headcount). All Kindergarten to Year 10 students in NSW government schools are counted as full-time students, hence there is no difference between headcounts and FTEs when counting these students. Some students in years 11 and 12 are classed as part-time students, based on the total number of units studied.
8 NSW Department of Education Annual Report 2015 | www.dec.nsw.gov.au
About us
OUR ORGANISATION
The department
As a result of machinery-of-government changes, there were changes to the structure of the department, effective as at 1 July 2015:
¡ State Training Services transferred to the Department of Industry, Skills and Regional Development
¡ the Office of Communities (except Aboriginal Affairs) transferred to the Department of Family and Community Services.
As a result, this annual report includes the financial statements and operations of State Training Services and the Office of Communities up to 30 June 2015 only. State Training Services will be included in Industry, Skills and Regional Development’s 2015–16 annual report and the Office of Communities (except Aboriginal Affairs) will be included in Family and Community Services’ 2015–16 annual report.
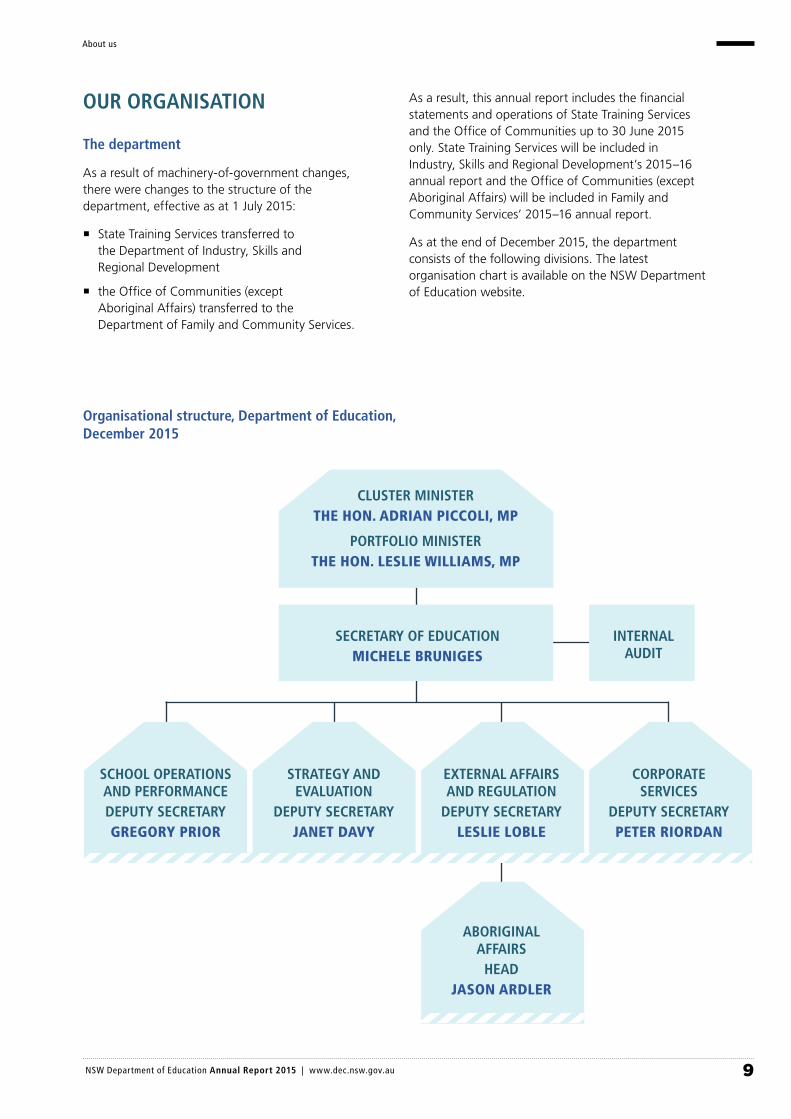
As at the end of December 2015, the department consists of the following divisions. The latest organisation chart is available on the NSW Department of Education website.
Organisational structure, Department of Education, December 2015
CLUSTER MINISTERTHE HON. ADRIAN PICCOLI, MP
PORTFOLIO MINISTERTHE HON. LESLIE WILLIAMS, MP
SECRETARY OF EDUCATIONMICHELE BRUNIGES
INTERNAL AUDIT
SCHOOL OPERATIONS AND PERFORMANCEDEPUTY SECRETARYGREGORY PRIOR
STRATEGY AND EVALUATION
DEPUTY SECRETARYJANET DAVY
EXTERNAL AFFAIRS AND REGULATION
DEPUTY SECRETARYLESLIE LOBLE
CORPORATE SERVICES
DEPUTY SECRETARYPETER RIORDAN
ABORIGINAL AFFAIRS
HEADJASON ARDLER
9 NSW Department of Education Annual Report 2015 | www.dec.nsw.gov.au
About us
School Operations and Performance
School Operations and Performance runs the 2,209 public schools across NSW, helping young people grow into literate, numerate and well-educated citizens. The division also operates 100 preschools attached to primary and central schools. Government preschools provide an educational preschool program for children in the year before they are enrolled in Kindergarten, with a particular focus on services for disadvantaged communities.
Students in public schools have access to a rich and varied curriculum, delivered by quality teachers and dedicated school leaders. Schools provide a firm foundation in both literacy and numeracy. Extensive science and technology, cultural, arts and sports programs further develop and enrich students’ knowledge and skills. School Operations and Performance has partnerships with a number of tertiary institutions to help inform innovative approaches to teaching and learning.
The division supports students with disability, those learning English as a second language, Aboriginal education and training, regional communities and early childhood education. It works closely with key stakeholders, including principals’ associations, the Aboriginal Education Consultative Group, parents and citizens’ associations, the Disability Council, and other organisations with interests in equity and access to education.
External Affairs and Regulation
External Affairs and Regulation strengthens educational and community outcomes by leading strategic reform initiatives, securing national and state funding for education services, distributing funding to non-government schools and preschool providers, advising on strategic policy in higher education and promoting high-quality standards for early childhood education.
The division supports ministers in strategic discussions with the Commonwealth and other jurisdictions and leads negotiations over funding arrangements. In early childhood, it regulates services across the state and is responsible for funding preschool service providers as well as advising on early childhood policies and projects.
Aboriginal Affairs
Aboriginal Affairs works with Aboriginal communities to promote social, economic and cultural wellbeing through opportunity, choice, healing, responsibility and empowerment.
Aboriginal Affairs leads policy debate and reform within government to address complex cross-sectoral issues. As the NSW Government agency focused on Aboriginal community wellbeing, it provides Aboriginal communities with a voice into government. It has a unique role in bringing together the full range of Aboriginal peoples’ interests and supporting a deeper understanding of Aboriginal culture and aspirations within government, business, non-government and tertiary sectors.
Strategy and Evaluation
Strategy and Evaluation supports the work of divisions and schools through leadership of major education reforms, education research and evaluation, program management, and communication and engagement.
It is the central point of contact for the department’s divisions and ministers, providing consistent, high-quality and timely advice, briefings, correspondence and support of parliamentary operations. It monitors and shares research on emerging educational trends from early childhood through to higher education and is responsible for corporate planning, performance reporting and enterprise risk management.
The Centre for Education Statistics and Evaluation, an innovative education data hub in the division, provides education research and evaluation to improve the effectiveness, efficiency and accountability of education in NSW.
The division delivers strategic communications, media relations, school and department websites, public school promotion and community engagement. It is also responsible for monitoring savings, benefits management, efficiency targets and related reforms.
Corporate Services
Corporate Services supports the work of divisions and the delivery of high-quality teaching in schools by ensuring a skilled, productive workforce and efficient operating environment. The division is responsible for:
¡ recruiting and placing teachers, school administrative and support staff, and corporate staff
¡ developing and negotiating industrial awards and agreements as well as providing industrial relations advice
10 NSW Department of Education Annual Report 2015 | www.dec.nsw.gov.au
About us

¡ providing legal support and advice to schools and the wider department
¡ investigating and managing employee conduct and performance issues
¡ coordinating the allocation, monitoring, reporting and management of financial resources across the department
¡ planning and delivering capital works, maintenance and infrastructure projects across the state
¡ ensuring value and efficiency in purchasing and compliance with procurement requirements
¡ providing information and communication technologies to students, teachers and staff in schools
¡ supporting schools and workplaces to achieve safe working and learning environments for students, staff and visitors
¡ providing support to schools to protect our assets and manage security-related incidents.
Internal Audit
Internal Audit provides an independent and objective review and advisory service to the Secretary and the Audit and Risk Committee. It provides assurance that the department’s financial and operational controls, designed to manage the organisation’s risks and achieve its objectives, are operating in an efficient, effective and ethical manner.
Internal Audit assists management to improve the business performance of the department. It advises on fraud and corruption risks as well as on internal controls over business functions and processes.
Our governance structure
The executive is the strategic governing forum for the department and supports the Secretary’s responsibilities as the accountable officer. The executive has three main functions:
¡ determine the strategic direction of the department
– defining, guiding and reviewing corporate strategy related to election commitments, departmental and whole-of-government priorities
– ensuring the department is responsive to changing community needs and government priorities
¡ strategic management of the department’s performance
– monitoring performance against the department’s fiscal strategy
– monitoring the department’s service delivery, including its whole-of-government priorities for policy and strategic direction
– monitoring, identifying and controlling risks that may impact on the achievement of departmental objectives
– considering evaluation findings
– ensuring adequate processes are in place to comply with legislative and financial management requirements
– fostering an appropriate corporate culture consistent with the NSW Public Service Commission’s Ethical Framework and Code of Ethics and Conduct
¡ strategic oversight of key projects.
Members of the executive team
In 2015, the executive consisted of seven members who met on a fortnightly basis:
¡ Michele Bruniges, Secretary (Chair) (PhD Ed Measurement, MEd, Dip Ed Studies, Dip Teach)
¡ Gregory Prior, Deputy Secretary, School Operations and Performance (MEd, BEd, Dip Teach)
¡ Janet Davy, Deputy Secretary, Strategy and Evaluation (MEd, BEd)
¡ Leslie Loble, Deputy Secretary, External Affairs and Regulation (MPA, BSc)
¡ Peter Riordan, Deputy Secretary, Corporate Services (MBA, MLLR, BCom)
¡ Jason Ardler, Head of Aboriginal Affairs (BEc)
¡ Philip West, Chief Financial Officer (MCom, Grad Dip Bus, Dip Bus).
11 NSW Department of Education Annual Report 2015 | www.dec.nsw.gov.au
About us
Performance report: In early childhood
PERFORMANCE REPORT: IN EARLY CHILDHOOD
OUR PERFORMANCE TARGETS
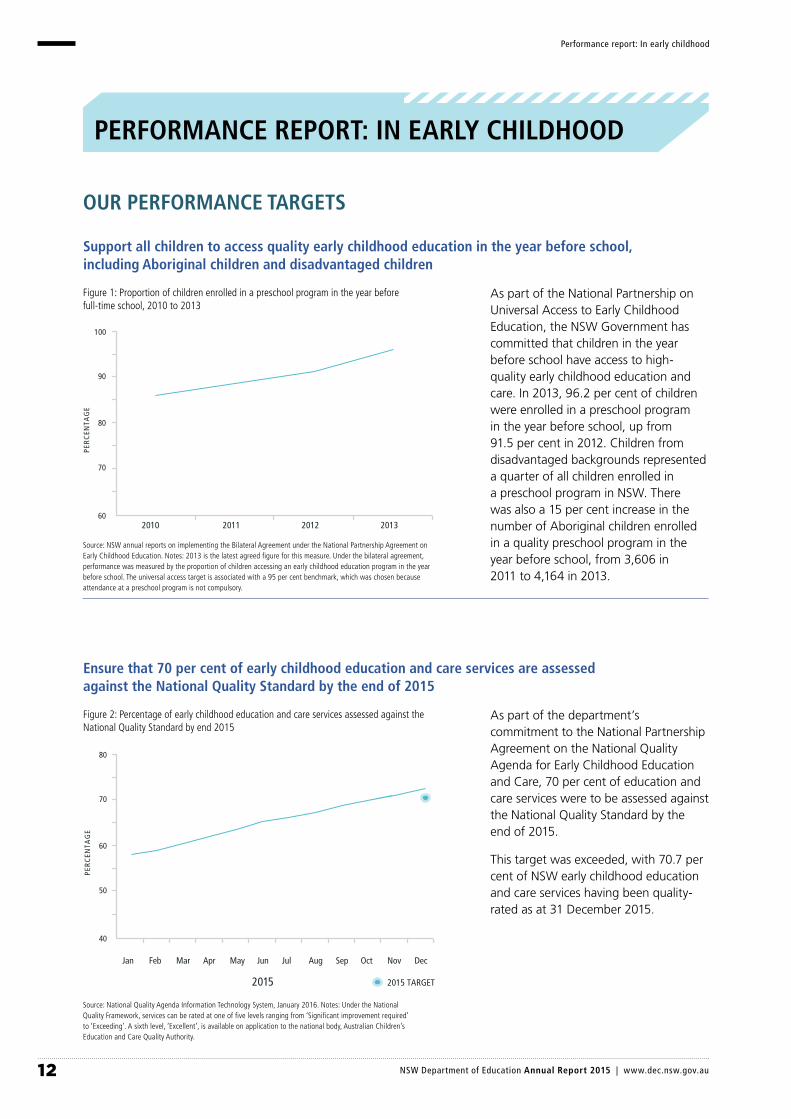
Support all children to access quality early childhood education in the year before school, including Aboriginal children and disadvantaged children
As part of the National Partnership on Universal Access to Early Childhood Education, the NSW Government has committed that children in the year before school have access to high-quality early childhood education and care. In 2013, 96.2 per cent of children were enrolled in a preschool program in the year before school, up from 91.5 per cent in 2012. Children from disadvantaged backgrounds represented a quarter of all children enrolled in a preschool program in NSW. There was also a 15 per cent increase in the number of Aboriginal children enrolled in a quality preschool program in the year before school, from 3,606 in 2011 to 4,164 in 2013.
Figure 1: Proportion of children enrolled in a preschool program in the year before full-time school, 2010 to 2013
Source: NSW annual reports on implementing the Bilateral Agreement under the National Partnership Agreement on Early Childhood Education. Notes: 2013 is the latest agreed figure for this measure. Under the bilateral agreement, performance was measured by the proportion of children accessing an early childhood education program in the year before school. The universal access target is associated with a 95 per cent benchmark, which was chosen because attendance at a preschool program is not compulsory.
Ensure that 70 per cent of early childhood education and care services are assessed against the National Quality Standard by the end of 2015
As part of the department’s commitment to the National Partnership Agreement on the National Quality Agenda for Early Childhood Education and Care, 70 per cent of education and care services were to be assessed against the National Quality Standard by the end of 2015.
This target was exceeded, with 70.7 per cent of NSW early childhood education and care services having been quality-rated as at 31 December 2015.
Figure 2: Percentage of early childhood education and care services assessed against the National Quality Standard by end 2015
Source: National Quality Agenda Information Technology System, January 2016. Notes: Under the National Quality Framework, services can be rated at one of five levels ranging from ‘Significant improvement required’ to ‘Exceeding’. A sixth level, ‘Excellent’, is available on application to the national body, Australian Children’s Education and Care Quality Authority.
20132010 2011 2012
PER
CEN
TAG
E
100
90
80
70
60
Jan Feb Mar Apr May Jun
2015
Jul Aug Sep Oct Nov Dec
2015 TARGET
PER
CEN
TAG
E
70
80
60
50
40
12 NSW Department of Education Annual Report 2015 | www.dec.nsw.gov.au

Our priorities: In early childhood
OUR PRIORITIES: IN EARLY CHILDHOOD
HIGH EXPECTATIONS, CLOSING THE GAPS
Increasing access to preschool
Consistent with the National Partnership on Universal Access to Early Childhood Education, children are supported to access high-quality early childhood education for 600 hours in the year before school.
The Preschool Funding Model (PFM), which came into effect in 2014, introduced increased base rates for children in the year before school, as well as for Aboriginal children and children from low-income families.
The PFM One Year On Report, published in 2015, showed the funding model had a positive impact on enrolments. Overall, enrolments of children in their year before school increased by two per cent following the introduction of the funding model and enrolments of Aboriginal children and children from low-income families increased by five per cent. In rural and remote areas, these figures increased by two and three per cent, respectively.
During 2015, in recognition that long day care is the preferred option for many working families, the department made up to $20 million available through the Long Day Care National Partnership Grants Program. This provided funding to support a preschool program in more than 2,000 long day care services across NSW.
The new Preschool Disability Support Program, rolled out in 2015, has provided targeted funding for more than 3,000 children with disability.
In 2015, the department provided more than $1.3 million to preschools in rural and remote communities with a high level of need for more preschool places. The grants are used to extend existing buildings or construct new, purpose-built facilities. In total, the program will deliver 362 new preschool places across rural and remote areas of the state.
Giving young children the best start at school
The Best Start initiative is an ongoing commitment in all government schools. It is designed to identify the literacy and numeracy skills and understanding that each child brings to Kindergarten. In 2015, the Best Start Kindergarten Assessment was conducted in all NSW public schools, involving 70,774 children and more than 3,700 teachers. The department’s Planning Literacy and Numeracy software enables Kindergarten to Year 8 teachers to track student learning throughout the school years against the literacy and numeracy continuums. In 2015, 89 per cent of Kindergarten students achieved Level 1 or higher on at least one aspect of the numeracy assessment and 79 per cent achieved Level 1 or higher on at least one aspect of the literacy assessment.
Early learning initiatives were supported through reading recovery, provided to more than 10,000 students who experienced serious difficulty in learning to read and write; continued implementation of the Targeted Early Numeracy intervention program, which aims to support students experiencing substantial difficulty in numeracy in the early years; and the continued implementation of Language, Learning and Literacy, which supports teachers of students at risk of not achieving expected literacy levels in the early years.
A positive transition to school is important for children. To support NSW public schools in this, the department provided professional development opportunities for staff in early childhood settings and schools. These included the Talking Transitions Conference, involving more than 400 participants from across NSW; and the Conversations: Transition to School Project, in which teachers in early childhood settings and schools engaged in professional learning, reciprocal shadowing and reflection on practice and planning to ensure a successful and positive transition process.
The Transition to School Statement also provides a common format for early childhood educators and families to provide information to schools. The statement summarises a child’s strengths, identifies their interests and approaches to learning, and suggests ways they can be supported.
13 NSW Department of Education Annual Report 2015 | www.dec.nsw.gov.au
In 2015, the Centre for Education Statistics and Evaluation completed an evaluation of the statement’s first year of operation, with the key findings overwhelmingly positive:
¡ Eighty-six per cent of parents agreed that having a statement provided better support to help their child’s transition to school.
¡ Eighty-seven per cent of school principals and 90 per cent of teachers said they would use the statements, if received, for Kindergarten students starting in 2016.
¡ Ninety-five per cent of parents said they would like to have a statement if they had another child starting school in the future.
The evaluation recommended simplifying the statement and supporting its further implementation across NSW. It also highlighted the need for ongoing support strategies to strengthen connections between early childhood settings and schools.
Implementing the National Quality Framework
The National Quality Framework aims to improve the quality and consistency of early childhood education and care across Australia through an integrated approach to the approval, quality assessment and compliance of services within a national framework. It applies to around 5,200 services in NSW, including long day care, preschool, family day care and outside school hours care services.
In 2015, the department worked with other jurisdictions to review the National Quality Framework and ensure that NSW priorities were accurately reflected in it.
The department, in consultation with sector representatives, developed and implemented a new way of streamlining the assessment and rating of services. This included an integrated technological system to improve the collection of evidence, which increased efficiency and consistency of the assessment and rating process.
As of December 2015, the department had rated and published reports for more than 3,800 services. This included 73 of the department’s preschools.
The department also monitors compliance with legislative requirements, investigates complaints and responds to incidents. In 2015, these activities involved some 3,300 visits to service providers, 28,800 telephone enquiries, 13,500 email enquiries and dealing with 13,000 service provider matters.
QUALITY TEACHING AND LEADERSHIP
Building the knowledge and skills of early childhood educators
The department continues to support early childhood educators to improve their skills and qualifications and to elevate the standing of early childhood teachers as professionals in their field.
Throughout 2015, the department worked with the Board of Studies, Teaching and Educational Standards (BOSTES) to include early childhood teachers within the accreditation system, recognising their professionalism and standing. It has worked to ensure that the unique service settings of the sector are reflected in the policies developed by BOSTES to support early childhood education and care teachers in achieving the recognition they deserve.
In 2015, the department established the Rural and Remote Early Childhood Teaching Scholarship program. The scholarships provide financial assistance to early childhood educators in regional and remote areas to upgrade diploma qualifications to a four-year bachelor’s degree. Scholarships were awarded to 30 scholars who are due to start their studies in 2016.
In 2013 and 2014, the department awarded 102 teaching scholarships to early childhood educators. Three scholars graduated during 2014 and 2015, with a further 10 expected to graduate in 2016. In 2015, 12 scholarships were awarded to teachers to undertake an appropriate graduate certificate or master’s degree program to support the inclusion of children with disability in preschool education.
Our priorities: In early childhood
14 NSW Department of Education Annual Report 2015 | www.dec.nsw.gov.au

NEW AND BETTER WAYS OF DOING BUSINESS
Reforming the funding of early childhood education and care
The NSW Government’s priority is to support children to access quality early childhood education for 600 hours in the year before school, in line with the National Partnership on Universal Access to Early Childhood Education.
During 2015, the department worked with the sector towards the shared goal of universal access to high-quality early childhood education. This included the Community Preschool Operational Support program, which helps eligible community preschools develop effective business skills with the aim of ensuring their sustainability over the longer term. This followed the successful introduction of the needs-based Preschool Funding Model for community preschools in 2014, which targets funding to those children who need it most.
In November 2015, the Minister for Early Childhood Education announced that the NSW Government would invest $83.5 million in the sector over the next four years. To support 600 hours of access to preschool education, a number of initiatives were developed for introduction in 2016. These include:
¡ Preschools for Sustainable Communities Program
¡ Community Preschool 600 Hours Incentive
¡ 2.5 per cent increase in base funding and loadings
¡ community outreach grants
¡ local partnerships to enhance preschool participation of low-income and Aboriginal families
¡ improved data collection
¡ capital works grants to increase preschool places.
In 2015, as part of the National Partnership, the Long Day Care National Partnership Grants program made available $20 million in funding to long day care services for preschool programs in the year before school. The program provided funding to support a preschool program in more than 2,000 long day care services across NSW.
Preschool partnership pilot
In 2015, the NSW Government announced a Preschool Partnership Pilot to provide additional support for public schools to partner with early childhood providers in two geographical locations – Tamworth (Hillvue) and the inner west of Sydney.
The establishment of the Hillvue Public School Early Learning Engagement Centre will encourage professional collaboration and connection between early childhood and primary school teachers and a range of community services.
The Inner West Virtual Community of Practice will encourage professional collaboration and connection between a range of early childhood and community services. A project coordinator will work directly with parents/carers, preschool providers and other community stakeholders to trial resources or strategies. It will also include a web presence.
These multi-agency collaborations will support transition to preschool and school in NSW and facilitate the use of the NSW Transition to School Statement. The Inner West Virtual Community of Practice will also facilitate information sharing between families, services and preschools/schools.
In 2015, both pilots were in the development phase with implementation planned for Term 4, 2016.
Before and after school care fund
The NSW Government created the $20 million Before and After School Care Fund in 2015 to help establish up to 45,000 additional out of school hours care (OSHC) places in government and non-government schools. The fund is administered by the department and guided by a cross-sectoral steering committee, which includes representatives from the Catholic Education Commission NSW and the Association of Independent Schools of NSW.
Principals and providers used funding to increase the number of approved OSHC places by creating a new service. NSW schools were successful in their grant applications when there was a demonstrated community demand supporting the establishment of an OSHC service, where an appropriate site meeting requirements was available and when they could demonstrate progress in securing an approved OSHC provider. Funds were used for site modification and fit-out costs, project management (including tendering or regulatory costs), or to pay for necessary equipment to support additional places.
Our priorities: In early childhood
15 NSW Department of Education Annual Report 2015 | www.dec.nsw.gov.au
Performance report: At school
PERFORMANCE REPORT: AT SCHOOL
OUR PERFORMANCE TARGETS
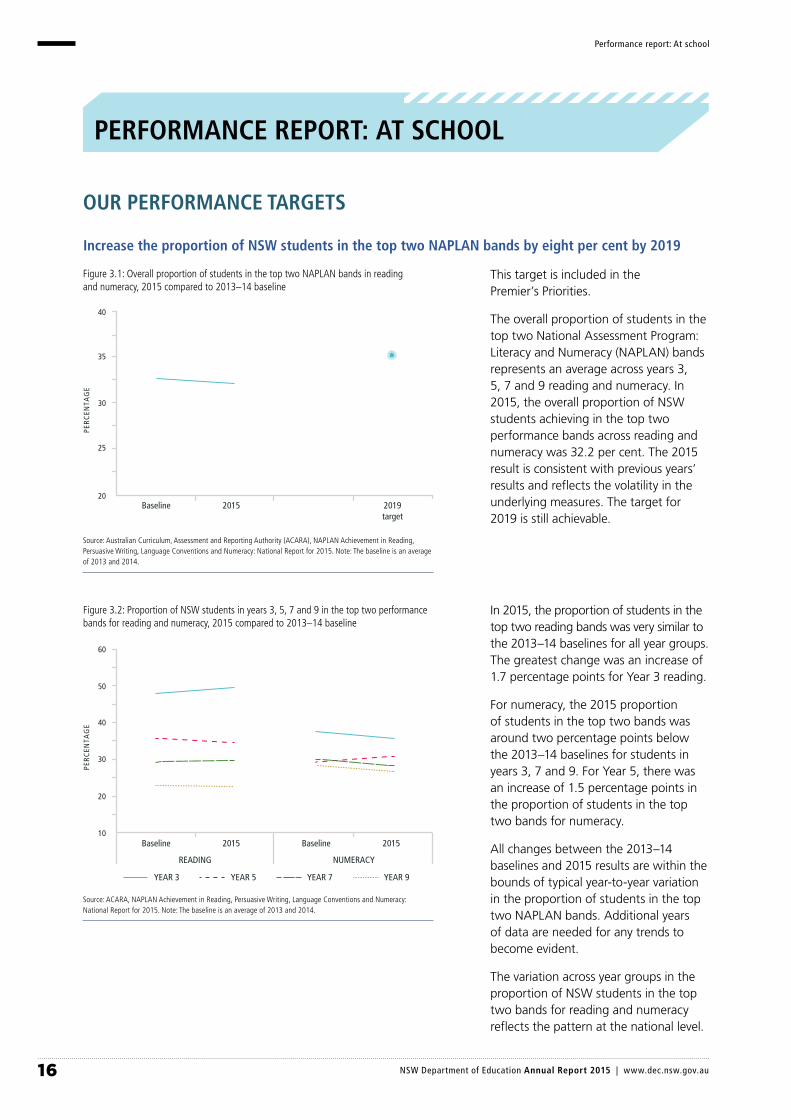
Increase the proportion of NSW students in the top two NAPLAN bands by eight per cent by 2019
This target is included in the Premier’s Priorities.
The overall proportion of students in the top two National Assessment Program: Literacy and Numeracy (NAPLAN) bands represents an average across years 3, 5, 7 and 9 reading and numeracy. In 2015, the overall proportion of NSW students achieving in the top two performance bands across reading and numeracy was 32.2 per cent. The 2015 result is consistent with previous years’ results and reflects the volatility in the underlying measures. The target for 2019 is still achievable.
Figure 3.1: Overall proportion of students in the top two NAPLAN bands in reading and numeracy, 2015 compared to 2013–14 baseline
Source: Australian Curriculum, Assessment and Reporting Authority (ACARA), NAPLAN Achievement in Reading, Persuasive Writing, Language Conventions and Numeracy: National Report for 2015. Note: The baseline is an average of 2013 and 2014.
In 2015, the proportion of students in the top two reading bands was very similar to the 2013–14 baselines for all year groups. The greatest change was an increase of 1.7 percentage points for Year 3 reading.
For numeracy, the 2015 proportion of students in the top two bands was around two percentage points below the 2013–14 baselines for students in years 3, 7 and 9. For Year 5, there was an increase of 1.5 percentage points in the proportion of students in the top two bands for numeracy.
All changes between the 2013–14 baselines and 2015 results are within the bounds of typical year-to-year variation in the proportion of students in the top two NAPLAN bands. Additional years of data are needed for any trends to become evident.
The variation across year groups in the proportion of NSW students in the top two bands for reading and numeracy reflects the pattern at the national level.
Figure 3.2: Proportion of NSW students in years 3, 5, 7 and 9 in the top two performance bands for reading and numeracy, 2015 compared to 2013–14 baseline
Source: ACARA, NAPLAN Achievement in Reading, Persuasive Writing, Language Conventions and Numeracy: National Report for 2015. Note: The baseline is an average of 2013 and 2014.
2019target
Baseline 2015
PER
CEN
TAG
E
40
35
30
25
20
NUMERACYREADING
PER
CEN
TAG
E 40
50
60
30
20
10
YEAR 5YEAR 3 YEAR 9YEAR 7
Baseline 2015 Baseline 2015
16 NSW Department of Education Annual Report 2015 | www.dec.nsw.gov.au
Performance report: At school
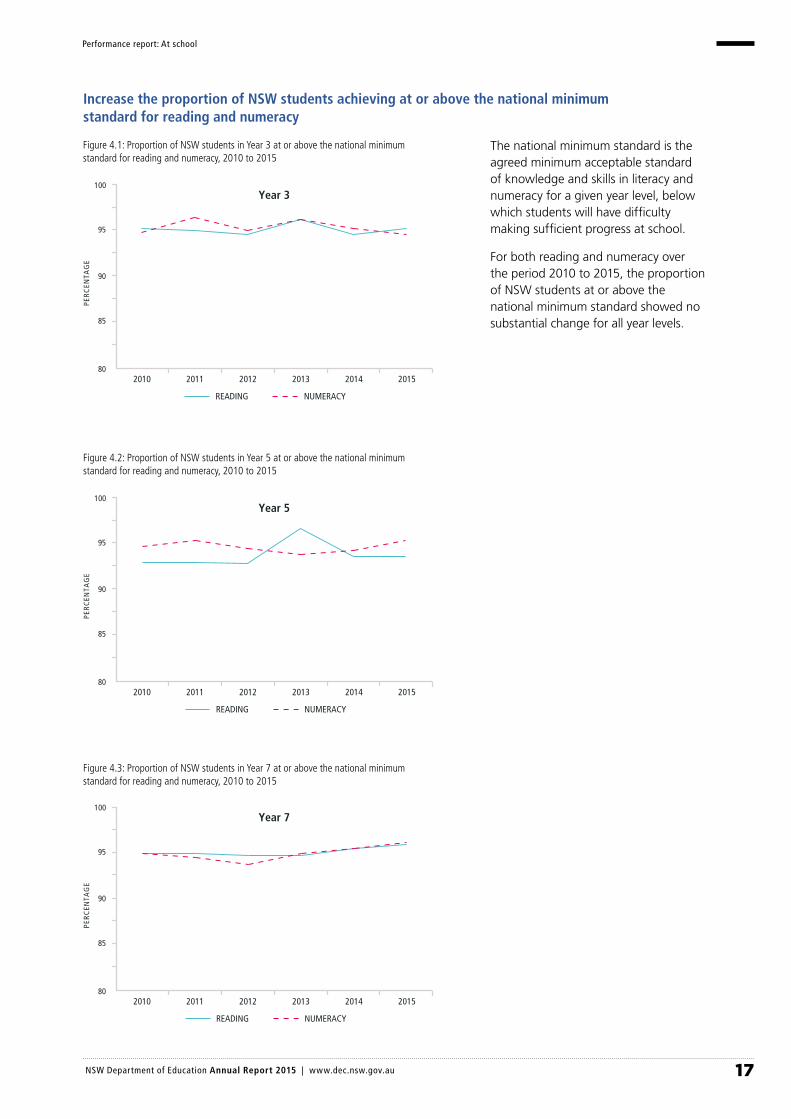
Increase the proportion of NSW students achieving at or above the national minimum standard for reading and numeracy
The national minimum standard is the agreed minimum acceptable standard of knowledge and skills in literacy and numeracy for a given year level, below which students will have difficulty making sufficient progress at school.
For both reading and numeracy over the period 2010 to 2015, the proportion of NSW students at or above the national minimum standard showed no substantial change for all year levels.
Figure 4.1: Proportion of NSW students in Year 3 at or above the national minimum standard for reading and numeracy, 2010 to 2015
Figure 4.2: Proportion of NSW students in Year 5 at or above the national minimum standard for reading and numeracy, 2010 to 2015
Figure 4.3: Proportion of NSW students in Year 7 at or above the national minimum standard for reading and numeracy, 2010 to 2015
2010 2011 2012 2013 2014 2015
Year 3
PER
CEN
TAG
E
95
100
90
85
80
NUMERACYREADING
2010 2011 2012 2013 2014 2015
Year 5
PER
CEN
TAG
E
95
100
90
85
80
NUMERACYREADING
2010 2011 2012 2013 2014 2015
Year 7
PER
CEN
TAG
E
95
100
90
85
80
NUMERACYREADING
17 NSW Department of Education Annual Report 2015 | www.dec.nsw.gov.au
Performance report: At school
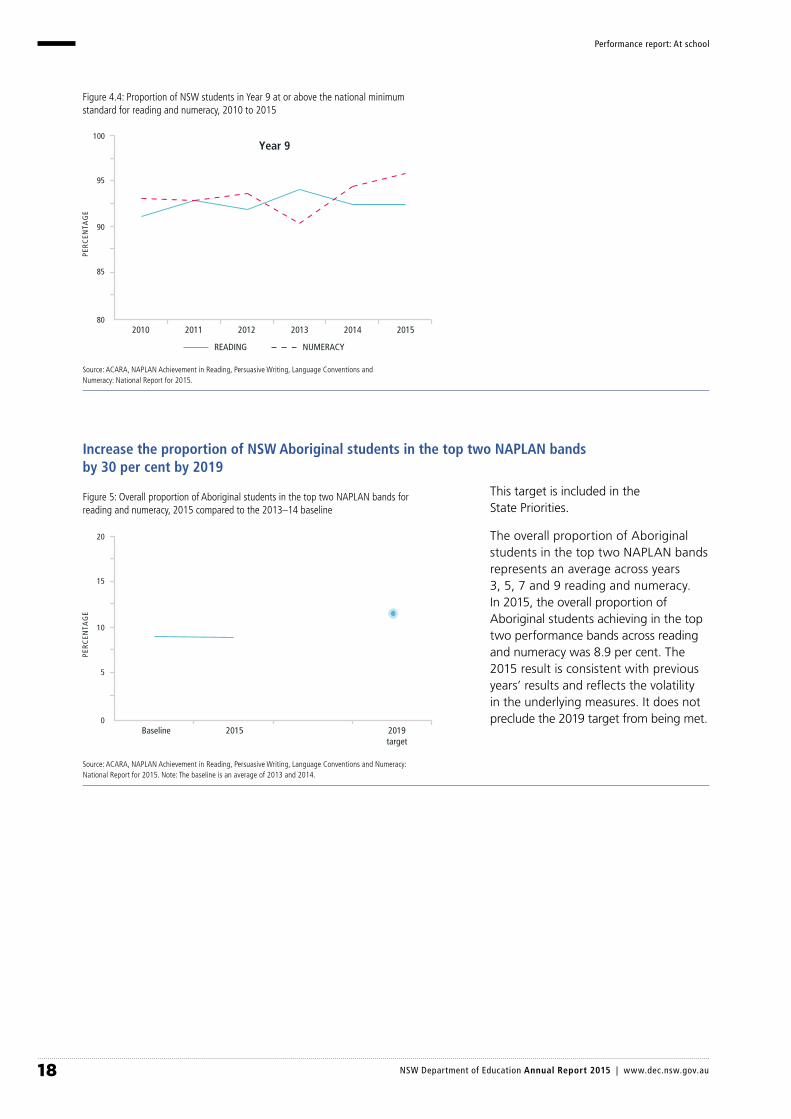
Figure 4.4: Proportion of NSW students in Year 9 at or above the national minimum standard for reading and numeracy, 2010 to 2015
Source: ACARA, NAPLAN Achievement in Reading, Persuasive Writing, Language Conventions and Numeracy: National Report for 2015.
Increase the proportion of NSW Aboriginal students in the top two NAPLAN bands by 30 per cent by 2019
This target is included in the State Priorities.
The overall proportion of Aboriginal students in the top two NAPLAN bands represents an average across years 3, 5, 7 and 9 reading and numeracy. In 2015, the overall proportion of Aboriginal students achieving in the top two performance bands across reading and numeracy was 8.9 per cent. The 2015 result is consistent with previous years’ results and reflects the volatility in the underlying measures. It does not preclude the 2019 target from being met.
Figure 5: Overall proportion of Aboriginal students in the top two NAPLAN bands for reading and numeracy, 2015 compared to the 2013–14 baseline
Source: ACARA, NAPLAN Achievement in Reading, Persuasive Writing, Language Conventions and Numeracy: National Report for 2015. Note: The baseline is an average of 2013 and 2014.
Baseline 2015 2019target
PER
CEN
TAG
E
15
20
10
5
0
2010 2011 2012 2013 2014 2015
Year 9
PER
CEN
TAG
E
95
100
90
85
80
NUMERACYREADING
18 NSW Department of Education Annual Report 2015 | www.dec.nsw.gov.au

Performance report: At school
Halve the gap between Aboriginal and non-Aboriginal students in reading and numeracy by 2018
This is a Council of Australian Governments (COAG) target.
For reading, over the period 2008 to 2015, the proportion of NSW Aboriginal students meeting or exceeding the national minimum standard showed no statistically significant change for years 3 and 5, an increase for Year 7 and a decrease for Year 9.
The proportion of NSW Aboriginal Year 7 and Year 9 students meeting or exceeding the national minimum standard for reading changed. However, there was no comparable change in the proportion of NSW non-Aboriginal students for those year levels.
The 2015 results are consistent with previous years’ results and reflect the volatility in the underlying measures.
For numeracy, over the period 2008 to 2015, the proportion of NSW Aboriginal students meeting or exceeding the national minimum standard showed no statistically significant change for years 3 and 7, and an increase for years 5 and 9.
The increase in the proportion of NSW Aboriginal Year 5 and Year 9 students meeting or exceeding the national minimum standard for numeracy was not evident for NSW non-Aboriginal students.
The 2015 results are consistent with previous years’ results and reflect the volatility in the underlying measures.
Figure 6.1: Proportion of NSW Aboriginal students in Year 3 achieving at or above the national minimum standard in reading and numeracy, 2008 to 2015
Figure 6.2: Proportion of NSW Aboriginal students in Year 5 achieving at or above the national minimum standard in reading and numeracy, 2008 to 2015
Figure 6.3: Proportion of NSW Aboriginal students in Year 7 achieving at or above the national minimum standard in reading and numeracy, 2008 to 2015
Year 3
2011 201220092008 2010 20152013 2014 2018target
PER
CEN
TAG
E
90
100
80
70
60
NUMERACYREADING
Year 5
2011 201220092008 2010 20152013 2014 2018target
PER
CEN
TAG
E
90
100
80
70
60
NUMERACYREADING
Year 7
2011 201220092008 2010 20152013 2014 2018target
PER
CEN
TAG
E
90
100
80
70
60
NUMERACYREADING
19 NSW Department of Education Annual Report 2015 | www.dec.nsw.gov.au

Performance report: At school
2010 201120082007 2009 2014 20152012 2013 2016target
PER
CEN
TAG
E
90
100
80
70
60
Figure 6.4: Proportion of NSW Aboriginal students in Year 9 achieving at or above the national minimum standard in reading and numeracy, 2008 to 2015
Year 9
2011 201220092008 2010 20152013 2014 2018target
PER
CEN
TAG
E
90
100
80
70
60
NUMERACYREADING
Source: ACARA, NAPLAN Achievement in Reading, Persuasive Writing, Language Conventions and Numeracy: National Report for 2015.
Ensure that 90 per cent of young people have attained a Year 12 or AQF qualification at certificate II or above by 2015
This is a COAG target.
In 2015, the proportion of young people who had completed Year 12 or an Australian Qualifications Framework (AQF) qualification at certificate II or above increased to 88.8 per cent.
Figure 7: Proportion of 20-to-24-year-olds who have attained a Year 12 or AQF qualification at certificate II or above, 2007 to 2015
Source: Australian Bureau of Statistics (ABS), Survey of Education and Work (cat. 6227.0). Notes: Care needs to be taken with the interpretation of survey data as high standard errors can mean differences from year to year are not statistically significant. Following amendments to the 2015 ABS publication, the ABS data for the period 2007 to 2014 have been amended and are different from figures published in the 2014 Annual Report.
20 NSW Department of Education Annual Report 2015 | www.dec.nsw.gov.au

Performance report: At school
AUSTRALIANSW
2010 201120082007 2009 20142012 2013
PER
CEN
TAG
E 65
75
70
60
55
50
RURAL AND REGIONAL NSWALL NSW
2010 201120082007 2009 2014 20152012 2013 2020target
PER
CEN
TAG
E
90
100
80
70
60
Ensure that 90 per cent of young people have attained a Year 12 or AQF qualification at certificate III or above by 2020, including those in regional NSW
This is a COAG target.
The overall proportion of young people who had completed a Year 12 or an AQF qualification at certificate III or above increased to 88.2 per cent in 2015. The proportion of young people living in rural and regional NSW who had attained an equivalent qualification has remained relatively constant since 2007.
Figure 8: Proportion of 20-to-24-year-olds who have attained a Year 12 or AQF qualification at certificate III or above, 2007 to 2015
Source: ABS, Survey of Education and Work (cat. 6227.0). Notes: Rural and regional attainment data are calculated from a sample survey for which there is a known standard error. The ABS has advised that year-to-year fluctuations are to be expected due to sampling variability. Care needs to be taken with the interpretation of survey data as high standard errors can mean differences from year to year are not statistically significant. Following amendments to the 2015 ABS publication, the ABS data for the period 2007 to 2014 have been amended and are different from figures published in the 2014 Annual Report.
Improve Year 12 completion rates for students in disadvantaged areas
Since 2007, the proportion of NSW students living in low-socioeconomic areas who have completed Year 12 has increased from 63 per cent to 69 per cent. Over the same period, the national average has increased to 67 per cent.
Figure 9: Year 12 completion rates for students living in low-socioeconomic areas, 2007 to 2014
Source: Productivity Commission, Report on Government Services (2015), Steering Committee for the Review of Government Service Provision. Notes: 2015 data are not available until 2016. Following amendments to the 2015 ABS publication, the ABS data for the period 2007 to 2014 have been amended and are different from figures published in the 2014 Annual Report.
21 NSW Department of Education Annual Report 2015 | www.dec.nsw.gov.au

ABORIGINAL STUDENTSNON-ABORIGINAL STUDENTS
2010 20112008 2009 2015 2020target
20142012 2013
PER
CEN
TAG
E
60
100
80
40
20
Current gap 29.5 percentage points
Baseline gap 34.0 percentage points
Halve the gap in Year 12 or equivalent attainment for Aboriginal students by 2020
This is a COAG target.
In 2011, 55.9 per cent of young Aboriginal people had attained Year 12 or an equivalent qualification. While this is an increase of more than six percentage points between the 2006 and 2011 census collections, significant and sustained effort is required if we are to achieve the 2020 target of 66.8 per cent.
Figure 10: The gap in Year 12 or equivalent attainment for Aboriginal 20-to-24-year-olds, 2006 to 2015
Sources: 2006 and 2011 data for Aboriginal and non-Aboriginal young people from the five-yearly Census of Population and Housing, ABS, as sourced from the Productivity Commission Report on Government Services (2015). All student data sourced from the annual ABS Survey of Education and Work (cat. 6227.0). Note: Following amendments to the 2015 ABS publication, the ABS data for the period 2007 to 2014 have been amended and are different from figures published in the 2014 Annual Report.
Since the school leaving age was raised to 17 in 2010, school retention rates have increased for all NSW students across years 7 to 12. The retention rate for Aboriginal students increased from 32.2 per cent in 2008 to 48.4 per cent in 2014 then declined to 46.5 per cent in 2015. While significant progress has been made towards the 2020 target of 49.2 per cent, further work is required to ensure NSW meets the halving the gap target for Aboriginal student retention rates by 2020.
Figure 11: Year 7 to Year 12 apparent retention for Aboriginal and non-Aboriginal students, 2008 to 2015
Source: ABS Schools Australia (cat. 4221.0). Notes: Apparent retention measures the extent to which students in NSW public schools progress to their final year of schooling. The term ‘apparent’ is used because the measurement is based on the total number of students in each year level compared to the number in an early year, rather than by tracking the retention of individual students.
ABORIGINAL 20-TO-24-YEAR-OLDS ALL 20-TO-24-YEAR-OLDS
2010 2011200820072006
Baseline gap 33.9 percentage points
Gap in 2011 27.6 percentage points
2009 2015 2020target
20142012 2013
PER
CEN
TAG
E 60
100
80
40
20
0
49.855.9
66.8
Performance report: At school
22 NSW Department of Education Annual Report 2015 | www.dec.nsw.gov.au

Government recurrent expenditure on staff per full-time equivalent student in government schools
Reporting on efficiency trends is a recommendation of the 2015 Performance Audit Report – Identifying Productivity in the Public Sector.
Data outlined in the Report on Government Services identifies that the amount of employee-related expenditure per full-time equivalent (FTE) student has increased over the past four years.
The report also indicates that over the same period, employee-related expenditure per FTE student is decreasing as a proportion of total expenditure per FTE student.
Figure 12: Government recurrent expenditure on staff per FTE student in NSW Government schools, 2010–11 to 2013–14
Source: Tables 4A.14 2016, 2015, 2014 and 2013 Report on Government Services – Chapter 4 School Education. Note: Nominal values, expressed in dollars of the subject year.
Government recurrent expenditure per full-time equivalent student in government schools
Reporting on efficiency trends is a recommendation of the 2015 Performance Audit Report – Identifying Productivity in the Public Sector.
The 2016 Report on Government Services indicates that real expenditure per NSW public school student is increasing. In 2013–14, expenditure per FTE student in NSW public schools exceeded the Australian average.
Figure 13: Government recurrent expenditure per FTE student in NSW Government schools, 2010–11 to 2013–14
Source: Table 4A.12 2016 Report on Government Services – Chapter 4 School Education (Tables 4A.6–7; Education Council NSSC financial collection [unpublished]). Note: Expenditure includes user cost of capital and in-school and out-of-school expenditure.
TOTAL EXPENDITURETOTAL EMPLOYEE-RELATED EXPENDITURE
2010–11 2011–12 2012–13 2013–14
EXPE
ND
ITU
RE
10,000
20,000
15,000
5000
−
AUSTRALIANSW
2010–11 2011–12 2012–13 2013–14
EXPE
ND
ITU
RE
15,500
17,500
16,500
14,500
13,500
Performance report: At school
23 NSW Department of Education Annual Report 2015 | www.dec.nsw.gov.au
Our priorities: At school
OUR PRIORITIES: AT SCHOOL
HIGH EXPECTATIONS, CLOSING THE GAPS
School excellence
School excellence is at the core of all work in public education across NSW and our focus on continuous school improvement. It encompasses all areas of school planning, ongoing self-assessment, reporting and external validation.
The School Excellence Framework supports all NSW public schools by providing a clear description of the key elements of high-quality practice across the three areas: how children learn, how teachers teach and how schools are led.
The School Excellence Framework is based on a review of national and international practice at the system, school and classroom levels, and includes the National School Improvement Tool developed by the Australian Council for Educational Research. It meets an obligation under the Commonwealth National Education Reform Agreement for each state and territory to implement a model of school improvement that includes standards for delivering high-quality education.
Schools develop their own plans by consulting with their communities to create a shared vision. They then self-assess and report annually on their progress using the School Excellence Framework. The framework helps schools make informed and consistent judgements when self-assessing their progress and provides the basis on which schools have their self-assessments validated by an external panel within a five-year cycle.
In 2015, all public schools across the state undertook their first self-assessment using the School Excellence Framework and will report their progress using the framework to their communities. A representative sample of 89 public schools also participated in a pilot of the external validation process. Feedback from the pilot will be used to inform the process for the first cycle of validations of every school across NSW, which will commence in 2016 and be completed in 2020.
Ensuring the safety, welfare and wellbeing of our students
The Wellbeing Framework for Schools was released in May 2015 and takes a strengths-based approach to enhancing student wellbeing. The framework supports schools implementing overall positive approaches to wellbeing, along with more personalised approaches to individual need. A professional learning module on the framework was developed and released to principals to promote the new approach.
The Supported Students, Successful Students initiative was announced in March 2015 and provides a comprehensive package of support for public schools, along with an increased investment of $167 million over four years, to enhance the wellbeing of students in our schools. The initiative includes an additional 236 school counselling positions, scholarships to boost the recruitment of school counselling staff, additional wellbeing funding equivalent to approximately 200 student support officer positions, resources to support healing and wellbeing for Aboriginal students and their families, and support for refugee students who have experienced trauma.
The department has commenced recruitment of school counsellors and the promotion of initial scholarships as part of an initiative to increase the overall number of school counsellors.
The Positive Behaviour for Learning framework helps schools design systems and practices to provide safe, supportive and responsive learning environments in their own local context. In 2015, positive behaviour for learning teams were established within the four educational services teams to support schools implementing the framework. These teams have delivered professional learning modules with 843 schools since July 2015. An information package is available to engage schools in adopting this approach to learning and wellbeing.
Networked Specialist Centres bring together coordinated interagency health and wellbeing services through the expertise of specialist departmental staff, who also work in collaboration with other government and non-government agencies. This service enhances what is already available in schools to support students and their families and forms part of a networked service system. Twenty-one centres have been established in rural, regional and metropolitan NSW.
24 NSW Department of Education Annual Report 2015 | www.dec.nsw.gov.au
Our priorities: At school
The department’s Child Wellbeing unit continues to build the capacity of schools to respond to child protection issues. In 2014–15, the unit responded to more than 12,300 contacts. It worked in partnership with health, police, community services and non-government organisations to identify students who were most at risk and coordinated responses across agencies.
Supporting students with disability, learning and behavioural difficulties
More than 90,000 students enrolled in NSW public schools receive additional support or adjustments for learning because of disability. In 2015, every regular school received an equity loading under the Resource Allocation Model. The equity loading for low-level adjustment for disability provides schools with access to a specialist teacher and flexible funding based on need. It enables schools to respond in a timely way to the needs of all students, including those with or without a formal diagnosis of disability. In 2015, $239 million was allocated to schools to support the additional learning needs of students through the equity loading for low-level adjustment for disability.
In 2015, more than 2,700 specialist support classes were provided in regular and special schools, supporting more than 20,000 students. The department provided additional assistance for more than 7,800 students in regular classes through the Integration Funding Support program. More than 62,000 additional students were supported with specialist resources provided to NSW public schools.
The department’s specialist itinerant teachers supported more than 2,300 students with vision or hearing impairment. In addition, the Braille and Large Print Service continues to support more than 450 vision-impaired students.
In 2015, all NSW public schools participated in the Nationally Consistent Collection of Data (NCCD) on School Students with Disability for the first time. This captures the work of teachers in personalising learning and support for students with disability in consultation with their parents and carers. Students are counted in the NCCD where schools have evidence of personalised learning and support being provided. School data about students receiving personalised learning and support was provided by an electronic data recording system, developed specifically for the data collection.
Initiatives under the Every Student, Every School strategy have continued to focus on helping schools meet the needs of their students. In 2015, there has
been a strong focus on building the capabilities of teachers in personalised learning and support for students with disability, learning and behaviour difficulties.
During 2015, 12,141 staff completed accredited training on the Disability Standards for Education 2005. More than 66,000 individual courses have been completed by school staff since 2013. These courses aim to strengthen understanding of schools’ obligations towards students with disability, as well as their parents and carers.
The department offers seven specialist tutor-supported online learning courses that address educational support for students with disability. This includes a new course introduced in 2015, which focuses on personalised learning and support for students with disability. More than 4,200 teachers undertook a course in 2015, representing 51,600 accredited training hours. More than 27,600 individual courses have been completed by over 18,000 teachers since their introduction in 2009.
Scholarships for teachers to undertake further tertiary study for students with disability continue to be offered through Every Student, Every School. Since 2012, the department has received 321 applications from teachers and executive teachers. Of these, 108 are current scholars and 119 have completed a master’s degree following sponsorship through this scholarship program.
The Personalised Learning and Support Signposting Tool (PLASST) was released to all NSW public schools to help teachers and school teams support students with additional learning needs. The unique student profile created by the PLASST assists teachers and school teams understand the strengths and needs of individual students. The PLASST student profile has also proven itself as an effective adjunct for conversations with parents and carers.
The department is actively supporting the transition of the specialist disability service system in NSW to the National Disability Insurance Scheme (NDIS). This includes supporting the NDIS trial in the Hunter Region, the early transition in the Nepean and Blue Mountains that commenced in July 2015 and preparing for the broader transition, which commences in July 2016. The focus of this work is to ensure that schools understand the new system and are able to support students with disability though the transition to the NDIS.
25 NSW Department of Education Annual Report 2015 | www.dec.nsw.gov.au

THE GAP IN OUTCOMES BETWEEN ABORIGINAL AND OTHER STUDENTS CAN ONLY BE CLOSED BY WORKING IN GENUINE PARTNERSHIP WITH THE ABORIGINAL COMMUNITY.
Closing the gap in educational outcomes for Aboriginal students
The NSW Government is committed to closing the education gap between Aboriginal students and all students in NSW. The primary Aboriginal education goal of the department, stated in its Aboriginal Education and Training Policy, is for Aboriginal and Torres Strait Islander student outcomes to match or better the outcomes of the broader student population.
The department understands that the gap in outcomes between Aboriginal and other students can only be closed by working in genuine partnership with the Aboriginal community and continues to value and uphold its partnership agreement with the NSW Aboriginal Education Consultative Group.
In 2015, every public school in NSW with Aboriginal students enrolled received funding through the Aboriginal equity loading under the Resource Allocation Model. This helps support schools to meet the learning needs of their Aboriginal students, providing principals and school communities with the flexibility to develop and fund strategies tailored to suit the specific needs of their students. In 2015, $50 million was allocated to 1,980 public schools to support the learning needs of Aboriginal students.
In 2015, the department continued to implement Norta Norta to support the learning outcomes of Aboriginal students. Under Norta Norta’s National Assessment Program: Literacy and Numeracy (NAPLAN) component, approximately 753 schools, including eight educational training units in juvenile justice centres, were funded to provide tuition support for 2,494 Aboriginal students. Under Norta Norta’s individual sponsorships component, 4,134 Year 11 and Year 12 Aboriginal students were provided with tutorial assistance. In total, approximately $16 million was provided to schools in 2015.
The department’s collaboration with the Clontarf Foundation continues to support Aboriginal boys through the establishment of a number of Clontarf academies in various locations throughout NSW. These academies aim to improve the education, life skills, wellbeing and employment prospects of participants.
The department continues to work with the Commonwealth and other states and territories to implement national Aboriginal and Torres Strait Islander education initiatives. The National Aboriginal and Torres Strait Islander Education Strategy was endorsed in September 2015 and the department’s approach to Aboriginal education is consistent with its principles and priorities.
Connected Communities
Connected Communities is an innovative strategy to improve educational and social outcomes, particularly for Aboriginal students but also for all young people. It has been implemented in 15 schools in some of the most complex and diverse communities in NSW. At each site, Connected Communities schools work in partnership with local Aboriginal leaders and the community, putting schools at the heart of the community by positioning them as community hubs.
In 2015, Taree High School employed an Elder-in-residence who advises teaching staff and the Aboriginal Education Officer on local Biripi perspectives across all subjects. The Toomelah School Adult Learning Centre is now available to community members, for TAFE NSW courses and for the Centacare weekly parent support group. A wellbeing centre, based in Coonamble High School, provides a hub for the community and has led to an annual community wellbeing day, Warranggal.
Connected Communities involves tailoring programs to meet local needs. A school-based Local School Reference Group, chaired by the local Aboriginal Education Consultative Group, provides advice about
Our priorities: At school
26 NSW Department of Education Annual Report 2015 | www.dec.nsw.gov.au
initiatives to strengthen partnerships between staff, students, local Aboriginal leaders and the community. Examples of local initiatives include:
¡ Wilcannia Central School has a Paakantji language program from preschool to Year 7, which includes trips on country.
¡ Bourke High School formed a healing team after all staff completed specialised trauma awareness training. Healing lessons are held weekly, attended by staff and students, Elders, community members and outside agencies.
¡ Coonamble Public School employed a clinical psychologist to work with students, staff and families on grief and loss, trauma and anxiety following concerns by the Local School Reference Group.
¡ Following extensive consultation and feedback, Moree East Public School trialled earlier starting and finishing times over 12 months to maximise student learning.
¡ An Education Field Day at Coonamble in September 2015 brought together staff, students and community representatives from all 15 Connected Communities schools and broader afield to share their experiences, showcase their work and discuss joint opportunities for future growth.
Now in its third year, implementation of the strategy has seen a range of improvements in the 15 schools. These include finalisation of school leadership and governance structures, improvements in student behaviour, increased focus on Aboriginal languages and culture in schools, the establishment of schools as service hubs, physical improvements in schools through capital works programs, a focus on early years and more positive transitions to school.
The strategy is being formally evaluated by the Centre for Education Statistics and Evaluation. The 2015 interim evaluation reviewed progress to midpoint in the development of the strategy and found that since 2012, the attendance rate of Aboriginal primary students across Connected Communities schools increased by 2.6 percentage points. Over this period, the gap in attendance between primary students across Connected Communities schools and all primary students across NSW Government schools has closed from 8.9 percentage points to 7.7 percentage points (-1.2 percentage points).
In 2016, the department will focus on extending interagency support for the strategy, broadening the service hub model and the further rollout of the Connected Communities Healing and Wellbeing Model, aimed at bolstering counselling support.
The department will also aim to consolidate services to support teacher wellbeing and increase training and professional development opportunities for local Aboriginal people in community services courses.
Supporting students learning English as an additional language
Each year, public schools help to develop the English language proficiency of recently arrived students from language backgrounds other than English by providing English as an additional language or dialect education. In 2015, 1,250 schools received additional resources to support 145,000 students.
In addition, approximately 4,800 students received intensive English support through the New Arrivals Program, intensive English centres and the Intensive English High School.
In 2015, 2,854 refugee students in 396 primary and secondary schools were assisted through specialist teaching support and targeted support programs including homework and tutorial support, mentoring, career and transition support, and work-readiness programs.
More than 2,000 teachers and leaders participated in professional learning courses to help them cater for the needs of students in culturally diverse classrooms. A leadership program for 52 experienced English as an additional language or dialect teachers provided an opportunity for them to deliver professional learning in their schools and teacher networks. This helped increase the capacity of their colleagues to support the language and settlement needs of English language learners.
Supporting students from rural, remote and disadvantaged communities
The department has now been implementing the strategies in the Rural and Remote Education: A Blueprint for Action for two years. The blueprint is a detailed plan to improve student learning in rural and remote public schools across NSW.
Aurora College, NSW’s first virtual school, commenced classes in February 2015. The college offers a mix of online and residential school classes to public high school students in rural and remote communities across the state. The school is providing innovative and flexible learning in a whole new context by allowing students to connect locally and learn globally. Aurora students connect with their teachers and classmates in timetabled lessons through a cutting-edge virtual learning environment.
Our priorities: At school
27 NSW Department of Education Annual Report 2015 | www.dec.nsw.gov.au
Our priorities: At school
The college offers selective classes in English, mathematics and science to gifted and talented year 7 to 10 students from rural and remote areas across NSW. Application for entry is via the NSW selective high school placement process. The college also gives students in years 11 and 12 in public high schools the opportunity to study subjects not available in their home school. Aurora’s first Year 12 cohort will complete the Higher School Certificate in 2016.
In 2015, a specialist preschool centre in the Sydney metropolitan area provided ongoing professional learning and mentor support for distance education preschool teachers. Through video conferencing and reciprocal visits, teachers observed and were provided with access to quality face-to-face preschool classrooms that demonstrated best practice reflecting the National Early Years Learning Framework.
A Technology and Applied Studies leadership network has been established to provide mentoring and support to teachers in schools. Nineteen experienced leaders completed two days of training. Following this, they supported more than 65 teachers, many of whom are from isolated and rural schools where they are the only teacher in their subject area.
In 2015, the department led Kindergarten to Year 10 Working Mathematically workshops to support teachers in rural and remote locations. More than 150 primary and secondary mathematics teachers from 55 rural and remote schools participated in the workshops, building knowledge of syllabus content and effective teaching strategies.
The department initiated transition projects in mathematics and history, helping schools develop processes for transitioning students from primary to secondary school. The project teams have created strong collegial networks and created and shared quality assessment tasks and teaching programs.
In 2015, in response to the recommendation of the Pratley Review of Agriculture and Training in NSW, the department established seven lighthouse schools for teaching about agriculture and primary industries, providing mentoring and support to teachers and school leaders across NSW.
Improving basic literacy and numeracy standards
The Early Action for Success strategy is helping to improve the literacy and numeracy performance of students in the early years of school. In 2015, the number of schools taking part in the strategy increased from 199 to 310, supported by 224 instructional leaders. The schools regularly collect data and monitor student progress against the department’s literacy
and numeracy continuums that map the learning development of students. Teachers and instructional leaders work together to tailor programs of learning for each student.
For the 195 schools that have been involved with the initiative for more than 12 months, the proportion of Kindergarten students at the lowest level for reading, comprehension and writing reduced from 57.9 per cent in February 2015 to 4.0 per cent in June 2015. For early number learning, the percentage of Kindergarten students not able to count to 10, identify numbers or count objects reduced from 22.5 per cent to 2.4 per cent over the same period.
In 2015, the department released the Numeracy Skills Framework. Copies were distributed to all primary and secondary schools in NSW, with further support available through the framework’s website. Online professional learning modules were also released to support the initiative.
Encouraging students to stay in school and transition to further education, training and employment
In 2015, the department provided $9 million to the Links to Learning Community Grants Program to fund NSW-based, not-for-profit, non-government organisations and local government authorities to deliver targeted projects to school students in years 6 to 11. Projects targeted students who had been identified as being at risk of disengaging with learning and/or leaving school early.
Forty-six funded organisations worked with more than 2,017 partner schools to develop innovative ways to keep students engaged in learning and remain at school. In 2015, the department also supported the seven schools within NSW juvenile justice centres to help young people make a transition, either back into school or to other post-school options.
To ensure that students have access to different avenues for education and training, the department allocated more than $2.76 million for students in years 9 and 10 to undertake vocational education and training courses. In 2015, there were 466 school-based apprentices and 2,636 school-based trainees in public schools across NSW. Trade skills centres, trade training centres and trade schools in more than 340 schools provided students with access to industry-standard training facilities. This encouraged more students to complete their schooling and helped to fill local skills shortages.
28 NSW Department of Education Annual Report 2015 | www.dec.nsw.gov.au
Our priorities: At school
In 2015, the NSW Government committed $27 million over four years to fund the coordination of mandatory work placements for more than 40,000 public school students who each year enrol in vocational education and training courses as part of their Higher School Certificate. Procurement of work placement service providers for the next four years was completed in November 2015 in readiness for Term 1, 2016.
The department trained 53 teachers as transition advisers in 2015, bringing the total trained to 375 since 2005. These teachers help at-risk students engage with learning, plan their long-term goals and prepare for their transition from school. The department also allocated $2.9 million to support school-to-work activities and innovative, whole-school initiatives to ensure that students are able to establish the foundations for their future career pathways.
Improving student attendance
At the beginning of 2015, the department released a revised School Attendance Policy to provide more explicit information on school attendance requirements and processes for dealing with unsatisfactory attendance. The new policy and procedures strengthen understanding that attendance issues are often related to student learning and support needs and family issues. The documents provide advice on coordinating services with other agencies to better support children and families.
More than 115 home school liaison officers and Aboriginal student liaison officers received training in 2015 to ensure schools, parents and students receive expert support to resolve chronic non-attendance issues. The evaluation of the Keep Them Safe Child Protection Strategy published in 2015 indicated that the liaison officers were highly valued by schools and contributed to improved school attendance, student progress and attitudes to school.
Since 2011, there have been notable improvements on the attendance rates of students in years 10, 11 and 12, indicating that initiatives introduced following the raising of the school leaving age are having a positive impact.
The 2012 Audit Office of NSW’s Performance Audit – Impact of the Raised School Leaving Age examined how well the department monitors and supports young people at school or on an approved alternate pathway until they reach 17 years.
In response to recommendations in the report, the department prepared reports on the destinations and expectations of school leavers. The 2015 report was published by the Centre for Education Statistics and Evaluation.
The recommendation to undertake a literature review and an evaluation of the quality and appropriateness of career advice provided in government schools is close to completion. The University of Melbourne is expected to deliver the survey work and recommendations for the evaluation in March 2016.
Physical activity in government primary schools
The department has developed and implemented a variety of processes, programs and resources to address the recommendations made by the 2012 Auditor-General’s report, Physical Activity in Government Primary Schools, including:
¡ introducing a revised Sport and Physical Activity Policy that increases weekly mandatory physical activity for all Kindergarten to Year 10 students from 120 to 150 minutes and ensures each school must have a localised operating manual for sport and physical activity
¡ developing the NSW Physical Literacy continuum Kindergarten to Year 10, which identifies the knowledge, understandings, skills and attitudes regarded as critical to success in physical activity and maps the development of critical aspects throughout the years of schooling by describing key markers of expected student achievement
¡ developing the Physically Active Schools website, which provides schools and teachers with resources to implement quality physical activity in schools
¡ increasing practical and online teacher professional learning in sport and physical activity across NSW.
The department is currently investigating options to report physical activity to parents. This will ensure that all actions associated with the report’s recommendations will have been addressed.
29 NSW Department of Education Annual Report 2015 | www.dec.nsw.gov.au

Our priorities: At school
QUALITY TEACHING AND LEADERSHIP
Strengthened initial teacher education
Great Teaching, Inspired Learning (GTIL) is the NSW Government’s plan to improve the quality of teaching in NSW schools. The department is progressively delivering a range of GTIL actions to drive quality, continuous improvement and high standards across all the crucial stages of a teacher’s career – from initial teacher education through to school leadership.
In 2015, the department entered into individual professional experience agreements with NSW-based initial teacher education providers to ensure high-quality professional experience in our schools and greater consistency in the placement process for both schools and universities. The agreements outline the key expectations, roles and responsibilities of initial teacher education providers, the department and NSW public schools in the implementation of professional experience placements.
In addition, 11 professional experience hub schools were established. These schools work with their partner university to develop, demonstrate and share high-quality professional practice. Materials are available to support teachers supervising professional experience placements and these agreements reflect the requirement for professional learning by these teachers.
Attracting and recruiting the highest- quality teachers
In 2015, 6,684 new applicants were approved to teach in NSW public schools and the department filled 3,497 classroom teacher positions. After incentive transfers and Aboriginal employment applicants were appointed, 59.7 per cent of classroom teacher positions were filled by schools using their chosen recruitment method.
In 2015, up to 50 teach.Rural scholarships, 20 cadetships and 20 internships were available under the GTIL reforms to attract the best and brightest into teaching. Forty-three applicants were offered a teach.Rural scholarship, 20 applicants a cadetship and 20 applicants an internship.
Under the Rural and Remote Education initiative, the department offers further incentives to attract and retain teachers and school leaders in hard-to-staff schools. In 2015, 56 classroom teachers, 22 executive staff and six principals were appointed through incentive transfers.
Since the introduction of the Teacher Education Scholarship program in 2002, 1,926 high-quality teachers, including 353 Aboriginal teachers, have been appointed to areas of workforce need. In 2015, 248 new applicants, including 75 Aboriginal students, were awarded a scholarship.
Incentive scholarships aim to attract high-quality graduates in their final year of study. In 2015, the department appointed 11 mathematics, three science (physics) and 11 special education teachers to NSW public schools. In 2015, 61 teachers completed their sponsored training in mathematics, physics, school counselling, special education and teacher librarianship.
In 2015, the NSW Government introduced new initiatives to encourage more students to study mathematics and science at the highest possible level at school. Over the next four years, 320 public school teachers will also have an opportunity to specialise in mathematics and science, increasing the supply of highly trained teachers to schools across NSW. Eighty scholarships are available each year to current teachers to study to become qualified mathematics and science teachers. In 2015, 80 teachers were offered a scholarship, with 49 teachers to retrain in mathematics and 31 to retrain in science.
The NSW Auditor-General’s performance audit, Management of Casual Teachers, examined the department’s effectiveness at managing the supply, availability and performance of casual teachers. Six key recommendations were given in relation to process and system improvements for enlistment and management of casual teachers. Four of these have been actioned and the remaining two are scheduled for implementation by the end of Term 1, 2016.
During 2015, the department implemented the Auditor-General’s recommendation to improve monitoring for a school’s ability to access casual teachers in order to determine whether additional assistance is required. A review of Casual.Direct requests from schools for a casual teacher during 2015 was undertaken and analysed to identify the top 20 metropolitan and regional schools that had a low success rate in filling vacancies.
The report’s recommendation on encouraging schools to provide feedback on the performance of casual teachers will continue in early 2016, with consultation involving the Primary Principals’ Association and the Secondary Principals’ Council. An initial report has been developed identifying schools that are high users of Casual.Direct services and also provide a low response rate to the existing performance feedback process for casual assignments.
30 NSW Department of Education Annual Report 2015 | www.dec.nsw.gov.au
Our priorities: At school
THE DEPARTMENT REMAINS COMMITTED TO THE PROFESSIONAL DEVELOPMENT OF TEACHERS TO ENHANCE QUALITY TEACHING AND LEARNING IN ALL NSW PUBLIC SCHOOLS.
Accreditation and professional development for our school teachers and principals
The department remains committed to the professional development of teachers to enhance quality teaching and learning in all NSW public schools. During 2015, the department continued to support improved induction processes and provide beginning teachers and their supervisors with targeted support under the GTIL reforms.
Permanent, casual and temporary teachers are able to access better induction support through Strong Start, Great Teachers, the department’s new online resource that provides a wealth of information to help schools create meaningful induction programs.
The department continued to provide funding for permanently appointed beginning teachers, to allow release from face-to-face teaching and the support of an experienced teacher to provide mentoring support. Release time was used for studies, coaching, mentoring and any other activity that supported professional development and attaining accreditation.
In 2015, $37 million was distributed to schools for beginning teacher support funding, $28 million for first-year payments and $9 million for second-year payments. In addition, temporary beginning teachers continued to be supported by eight teacher mentor positions, four in metropolitan and four in rural locations.
By 2018, all teachers will need to be accredited and will have five years (if employed full-time) or seven years (if part-time or casual) in which to demonstrate maintenance of their accreditation.
To support this, the new Performance and Development Framework for Principals, Executives and Teachers began operating this year, with the first performance and development cycle completed in December 2015. Teachers develop their goals and identify professional learning needs, focusing on achieving or maintaining accreditation against the Australian Professional Standards for Teachers.
A new website, Teaching Standards in Action, was also developed to provide clear, concise support for the teaching standards, highlighting critical messages and linking teachers to up-to-date, relevant policy information. The website and a suite of registered courses will be accessible by permanent, temporary and casual teachers in 2016.
Under the Quality Teaching, Successful Students initiative, the department will provide an additional staffing allocation for all NSW public schools with primary students enrolled. This will be used to improve the quality of classroom teaching. For example, the resource may be used to support mentoring and coaching for an individual teacher or collaborative practices in a school or across a number of schools. Funding began in Term 3, 2015, for 1,141 schools.
During 2015, the MyPL@Edu professional learning management system recorded 476,167 individual enrolments across 16,662 scheduled events for professional learning.
The NSW Government’s School Leadership Strategy was released this year, bringing together initiatives to identify, develop and support the current and next generation of school leaders in NSW public schools. In 2015, the department’s achievements under this strategy included:
¡ employing 50 full-time equivalent principals, school leadership to support leadership capacity-building for principals across the state, particularly focusing on school excellence
¡ delivering the Leadership Pathways online resources to provide professional development support for aspiring and current school leaders
¡ developing the new NSW Public Schools Leadership and Management Credential, for first-time principals; from 2016, all first-time school principals will be required to complete the credential and will be provided with a coach to support them for the first year of their appointment.
31 NSW Department of Education Annual Report 2015 | www.dec.nsw.gov.au
Recognising and sharing excellence in teaching
The department is committed to ensuring that excellence in teaching is recognised and rewarded.
From 2016, a teacher’s salary will be based on accreditation status achieved against the Australian Professional Standards for Teachers. These standards identify the professional competence expected of all teachers, who must maintain their accreditation in order to successfully progress through standards-based remuneration. Teachers who achieve Highly Accomplished or Lead Teacher accreditation will receive a salary in excess of $100,000. As at 31 December 2015, the department currently has 30 teachers with Highly Accomplished accreditation and 51 teachers with Lead Teacher accreditation.
The Rural and Remote Education initiative reimburses accreditation fees to teachers who spent 75 per cent of their time completing their accreditation in a rural or remote school. Since 2014, three teachers have claimed this reimbursement.
Local Schools, Local Decisions gives principals more opportunities for recognising and rewarding excellence in teaching. Schools may use their flexible resources to create additional executive or teaching positions that support the strategies identified in the school plan.
The department is also committed to ensuring that excellence in teaching is shared.
Under the GTIL reforms, the department has partnered with the University of Newcastle to conduct research on Quality Teaching Rounds in a number of NSW public schools. Twenty-four schools participated in this research to identify ways teachers can learn through observing the practice of others. The data collection was completed in Term 3, 2015, and the final report is being prepared by the university.
ClassMovies and ClassMovies TV provide avenues for schools to share their classroom practice with others. As at the end of 2015, nearly 600 schools have registered to participate, with 134 video documentaries produced and another 63 in production. There have been over 25,700 video views on the department’s ClassMovies TV site. To continue this collaboration, the department’s contract with the documentary provider has been extended to 2018.
Implementing the Australian curriculum
Through the development and delivery of professional learning resources, the department supports the implementation of the new NSW syllabuses for the Australian curriculum in English, mathematics, science and technology, history and geography.
In 2015, this included face-to-face workshops and SyllabusPLUS webinars. More than 4,530 NSW public school teachers have also participated in a range of online modules.
In 2015, the department developed a suite of professional learning and support for the implementation of the new Geography K–10 NSW Syllabus for the Australian curriculum. This includes syllabus familiarisation, courses that develop geographical knowledge and skills, ideas for planning a geographical inquiry classroom, as well as sample geography K–10 teaching and learning sequences developed and reviewed by teachers in a number of communities of schools.
NEW AND BETTER WAYS OF DOING BUSINESS
National Education Reform Agreement
As part of the National Education Reform Agreement, additional funding has been distributed to public and non-government schools in 2015 via a needs-based funding approach. The agreement signed by NSW provided an additional $5 billion between 2014 and 2019. Under the agreement, loadings have been provided to government schools with students who face additional educational disadvantage.
This investment by the NSW and Commonwealth governments will allow the department to extend and accelerate the innovative reforms already underway throughout the state. These include Great Teaching, Inspired Learning; the Literacy and Numeracy Action Plan; Local Schools, Local Decisions; the Rural and Remote Education blueprint; and Connected Communities.
Increasing local decision-making and reforming the way we finance and staff our schools
A key initiative of the NSW Government’s Local Schools, Local Decisions reform is the implementation of the needs-based Resource Allocation Model (RAM) for allocating funding to public schools. Based on identified student and school need, the model is fairer and more transparent.
32 NSW Department of Education Annual Report 2015 | www.dec.nsw.gov.au

Components of the Resource Allocation Model explained
2014 2015 2016+
1. TARGETED FUNDING
INDIVIDUAL
STUDENT FUNDING
2. EQUITY LOADINGSSOCIOECONOMIC BACKGROUND
ABORIGINAL BACKGROUND
ENGLISH LANGUAGE PROFICIENCY
LOW LEVEL ADJUSTMENT FOR DISABILITY
3. BASE SCHOOL ALLOCATION LOCATION
SCHOOL BUILDINGS AND FACILITIES
CLIMATE
PER CAPITA FUNDING
SCHOOL TYPE
The RAM includes a base school allocation, which is the largest component and reflects the core cost of educating each student and school operation. This is supplemented by equity loadings to address student needs in schools, as well as targeted funding for students with more complex learning and support needs. The RAM has been implemented in phases, with targeted funding and half the equity loadings released in 2014.
In 2015, schools received the remaining two of the four equity loadings through the RAM. These four equity loadings provide additional resources to address student need in schools, including support for Aboriginal students, students from low-socioeconomic backgrounds, students with low-level disability, and students learning English as an additional language or dialect. Geographically remote or isolated schools also received a location loading in recognition of the additional support needed.
In 2016, the base school allocation will be delivered. The base includes enhanced professional learning funding and a new per capita allocation, enabling greater operational flexibility.
Improving our school facilities and infrastructure
The department continued to improve its teaching and learning environments through capital works and asset acquisition programs. In 2014–15, 12 public school major works projects were completed, with 22 major public school projects ongoing and a further 16 begun. Planning and design work for 41 projects was undertaken under the Commonwealth’s Trade Training Centres Program. Delivery of these will begin during the next financial year. The department also reviewed its asset planning approach to align it with the Department of Planning and Environment’s regions and districts, as well as updated its demographic projects.
The department began planning for major capital works projects announced under the Rebuilding NSW State Infrastructure Strategy 2014. It also began working on a School Assets Strategic Plan in response to the NSW Government’s commitment to invest $1 billion of Rebuilding NSW funds in school infrastructure. This investment will deliver the NSW Government’s Innovative Education, Successful Students package, which is expected to see new and upgraded schools designed as future-focused learning environments.
33 NSW Department of Education Annual Report 2015 | www.dec.nsw.gov.au

Our priorities: At school
Planning has commenced on the Secondary Schools Renewal Program, which will improve the amenity and functionality at nearly 60 high schools.
The Educational Facilities Standards and Guidelines were successfully launched and are being used to create facilities able to support learning into the future. As part of the Resource Efficiency Program, energy performance contracts have been entered into for 28 of the least energy efficient public schools in NSW in order to reduce energy consumption. These projects have seen a reduction in energy costs of $550,000 per annum.
Supporting technology and innovation in learning
In January 2015, Microsoft Office 365 and Google Apps for Education were made available to all staff and students through their respective portals. This has provided a safe, managed environment where teachers and students can learn collaboratively. The department developed and published online resources and information to support teachers to make effective use of these online learning tools in the classroom.
In 2015, the department began to implement a new library system for all public schools. The Oliver library system will greatly improve the capacity of school libraries and teacher librarians to support effective student learning. More than 750 schools now have the system operating at their school.
The department continues to work with Education Services Australia in providing access to national online services. All staff have access to Scootle, a national resource discovery tool linking to more than 50,000 digital teaching and learning resources. Teachers and students also have access to the Language Learning Space and Improve, high-quality digital tools to support student learning. The department also continued to work closely with the Australian Securities and Investments Commission in the digitisation of its MoneySmart financial literacy resources.
The department continues to evaluate and trial new and emerging technologies and innovation in the classroom. Aurora College has participated in a pilot program using iSee technology to enable students in isolated locations to participate interactively in both the classroom and playground. iSee is a voice and video technology that emulates a face-to-face meeting and supports simultaneous conversations using live webcam videos and high-fidelity spatial audio.
In 2015, the college worked collaboratively with iSee to design three-dimensional immersive Aurora College environments, including a playground and college reception featuring a live video feed to the coordinating office, a lecture theatre, a teachers’ lounge and a multipurpose centre. In these spaces, users are able to move freely and naturally about the environment and engage in conversations with individuals or groups, much like they would in a physical space.
The Futures Learning Unit, which became operational in August 2015, drives innovation in learning and teaching and leveraging flexible learning spaces and technology. A number of professional learning events, including Design Thinking for Leading Learning and Flexible Learning Spaces by Design, have taken place in 2015 to build teacher and principal capacity to transform teaching practice.
The Integrated Science, Technology, Engineering and Mathematics (STEM) project provides secondary schools with the opportunity to evaluate teaching and learning practice, with the aim of improving student learning in STEM subjects. Overall, 150 teachers from 28 schools across NSW were involved, with teachers planning and collaborating across faculty areas to develop and implement integrated units of learning across mathematics, science and technology. This project is helping teachers to change the way that science and mathematics are taught, by introducing project and inquiry-based learning. The illustrations of practice will be shared with schools across NSW via a STEM website. Teaching programs, resources and videos will all be made available on this website.
Improving administrative and information management systems
The Learning Management and Business Reform (LMBR) program is one of the largest public-sector business reform programs in Australia, with a major technology component at its core. The program’s central aim is to support the NSW Government’s broader reform program and deliver improved educational outcomes and services to school communities.
Now in its final stage, LMBR is preparing to deploy finance, student administration and learning management solutions to nearly 2,000 remaining public schools during 2016 and 2017.
34 NSW Department of Education Annual Report 2015 | www.dec.nsw.gov.au

Our priorities: At school
The deployment, training and change management approach developed during 2015 for this implementation incorporates the many lessons learned from earlier deployments. This work is being reviewed and validated by experienced school staff, including staff from the 229 pilot implementation schools.
A number of detailed external program reviews were carried out over the past 18 months. Among these was the NSW Auditor General’s 2014 Report – Performance Audit of the Learning Management and Business Reform Program, which examined the program’s achievements against earlier expectations and provided valuable insights into further improving governance, benefits realisation, risk and program management. The department has actioned all of the audit’s 10 recommendations.
Identifying productivity in the public sector
In July 2015 the Acting Auditor General of NSW released a report on productivity in the NSW public sector, Performance Audit – Identifying Productivity in the Public Sector.
The report examined selected areas of government activity, such as primary and secondary school public education, NSW Health, Transport for NSW, the NSW Police Force, the Department of Justice and NSW Treasury, to identify and assess changes in productivity.
During 2015, the department worked towards meeting the recommendations outlined in the report:
¡ developing a sophisticated, value-added methodology to help measure the effectiveness of schooling in improving the learning outcomes of students that takes into account the context of the school and its students
¡ reporting the same efficiency trends currently reported in the Report on Government Services (see figures 12 and 13 on page 23 of this report)
¡ scheduling the evaluation of major programs and initiatives to better measure the quality and effectiveness of investments in education.
The department also noted the recommendation made in relation to assessing and reporting on the return of additional investments in education, such as smaller class sizes. The Class Size Reduction program was comprehensively evaluated when it was implemented in 2004 to 2007 and the department advised the Audit Office that a further evaluation will not be undertaken.
Purchasing and procurement
During 2015, the department acted on recommendations from the NSW Auditor General’s 2014 performance audit – Use of Purchasing Cards and Electronic Payment Methods, issued in June 2014. Four recommendations were made for all NSW Government agencies, including the establishment of purchasing card adoption targets and benefits realisation programs, revising policy and procedures and improving data capture for monitoring and reporting. Action has been completed for all four recommendations. Revised policy, guidelines and procedures will be released in early 2016 in conjunction with the implementation of an expense management system to support electronic acquittal of purchasing card transactions.
The Making the Most of Government Purchasing Power – Telecommunications Performance Audit report noted the department is performing above the government benchmark rates in a number of areas. These include managing data services and procuring fixed voice and mobile services. The seven recommendations arising from this report relate to implementation of improvements in procurement and contact management, developing strategic plans for future telecommunications services and improving processes for managing telecommunications expenditure. The department has completed all actions relating to these recommendations. New contractual arrangements for fixed voice and mobile services were finalised during 2015 and work is progressing towards unified communications strategies for the future.
35 NSW Department of Education Annual Report 2015 | www.dec.nsw.gov.au

PERFORMANCE REPORT: IN TERTIARY EDUCATION
OUR PERFORMANCE TARGETS
Fifty per cent increase in the proportion of people with qualifications at AQF certificate III and above by 2020
The achievement of higher-level qualifications enables people to develop the skills needed to participate effectively in the labour market, secure rewarding jobs and contribute to the state’s economic growth by meeting the needs of industry.
In 2015, 60.2 per cent of people aged between 20 and 64 years in NSW held an AQF qualification at certificate III or above, an increase of 4.4 percentage points from 2010, the agreed baseline for the target.
Figure 14: Proportion of NSW people aged between 20 and 64 years with an AQF qualification at certificate III or above, 2006 to 2015
Source: Australian Bureau of Statistics (ABS), Education and Work, Australia (cat. 6227). Notes: 2013 and 2014 data have been revised to include people who are permanently unable to work. Therefore, care needs to be taken when comparing data with years before 2013, although the impact of including this population is minimal. Care also should be taken with interpreting survey data as high standard errors can mean that differences from year to year are not significant.
One hundred per cent increase in the number of higher-level qualifications at diploma and above by 2020
A focus on lifting the achievement of higher-level qualifications responds to the need for a skilled and productive workforce that can support consistent economic growth into the future in all industries.
Preliminary data for 2014 show 22,567 completions at diploma qualification level and above, an increase of 41 per cent from the baseline of 16,013 completions in 2009.
Figure 15: Number of completions at diploma qualification and above in NSW, 2006 to 2014
Source: Productivity Commission Report on Government Services (2015), Table 5A, 24. Notes: The 2014 data are preliminary and will be revised following the annual data submission to the 2015 National VET Provider Collection. Final figures will be released by the National Centre for Vocational Education Research (NCVER) in July 2016. Data are not yet available for 2015.
PER
CEN
TAG
E
80
100
60
40
202006 2007 2008 2009 2010 2011 2012 2013 2014 2015 2020
target
NU
MB
ER
30,000
40,000
20,000
10,000
02006 2007 2008 2009 2010 2011 2012 2013 2014 2020
target
Performance report: In tertiary education
36 NSW Department of Education Annual Report 2015 | www.dec.nsw.gov.au

Twenty per cent increase in the number of women, regional and Aboriginal students completing higher-level qualifications at AQF certificate III and above by 2020
The number of higher-level qualification completions by women, regional and Aboriginal students is progressing over time toward the department’s 2020 targets.
The number of women completing higher-level qualifications at certificate III or above was 61,705 in 2013, which is lower than 2012 and just below the 2020 target of 62,232 completions.
Figure 16.1: Number of completions at AQF qualification certificate III or above for women, 2006 to 2013
Source: National Centre for Vocational Education Research (NCVER), Government-funded Students and Courses. Note: Data are not yet available for 2014 and 2015.
While completion numbers in rural and regional NSW continue to increase over time, numbers fell slightly to 32,879 completions in 2013 compared with 2012.
Figure 16.2: Number of completions at AQF qualification certificate III or above for regional students, 2006 to 2013
Source: NCVER, National VET Provider Collection. Note: Data are not yet available for 2014 and 2015.
Performance report: In tertiary education
NU
MB
ER
30,000
40,000
20,000
10,000
02006 2007 2008 2009 2010 2011 2012 2013 2020
target
NU
MB
ER
60,000
70,000
50,000
40,000
30,0002006 2007 2008 2009 2010 2011 2012 2013 2020
target
37 NSW Department of Education Annual Report 2015 | www.dec.nsw.gov.au

NU
MB
ER
6,000
8,000
4,000
2,000
02006 2007 2008 2009 2010 2011 2012 2013 2020
target
The number of Aboriginal students completing qualifications at certificate III or above continues to exceed the department’s target of 2,760 by 2020, with 3,634 completions in 2013.
Figure 16.3: Number of completions at AQF qualification certificate III or above for Aboriginal students, 2006 to 2013
Source: NCVER, National VET Provider Collection; Productivity Commission, 2015 Report on Government Services Table 5A.25. Notes: Data are not yet available for 2014 and 2015. Final figures will be released by NCVER in July 2016.
Increase the proportion of young people with a bachelor degree or above to 44 per cent by 2025
In 2015, 40.5 per cent of young people in NSW held a bachelor degree or higher. This proportion has increased from 31.7 per cent in 2006. This increase supports NSW efforts to build an educated and skilled workforce to meet the growing demands of industry, provide improved employment and deliver strong economic growth for NSW.
NSW remains on track to increase the proportion of 25-to-34-year-olds holding a bachelor degree or above to 44 per cent by 2025.
Figure 17: Proportion of 25-to-34-year-olds in NSW holding a bachelor-level qualification or above, 2006 to 2015
Source: ABS, Education and Work, Australia, (cat. 6227), additional data cubes. Note: Care needs to be taken with the interpretation of survey data as high standard errors can mean that differences from year to year are not significant.
PER
CEN
TAG
E
50
60
40
30
202006 2007 2008 2009 2010 2011 2012 2013 2014 2015 2025
target
Performance report: In tertiary education
38 NSW Department of Education Annual Report 2015 | www.dec.nsw.gov.au
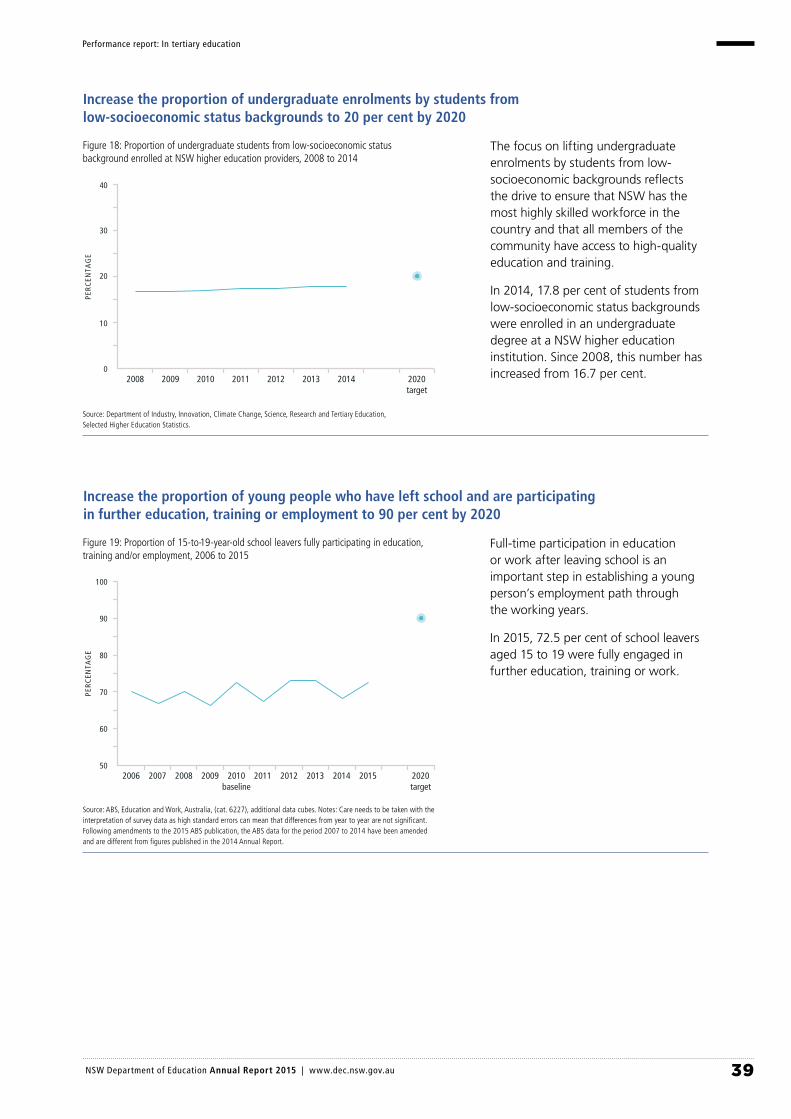
Increase the proportion of undergraduate enrolments by students from low-socioeconomic status backgrounds to 20 per cent by 2020
The focus on lifting undergraduate enrolments by students from low-socioeconomic backgrounds reflects the drive to ensure that NSW has the most highly skilled workforce in the country and that all members of the community have access to high-quality education and training.
In 2014, 17.8 per cent of students from low-socioeconomic status backgrounds were enrolled in an undergraduate degree at a NSW higher education institution. Since 2008, this number has increased from 16.7 per cent.
Figure 18: Proportion of undergraduate students from low-socioeconomic status background enrolled at NSW higher education providers, 2008 to 2014
Source: Department of Industry, Innovation, Climate Change, Science, Research and Tertiary Education, Selected Higher Education Statistics.
Increase the proportion of young people who have left school and are participating in further education, training or employment to 90 per cent by 2020
Full-time participation in education or work after leaving school is an important step in establishing a young person’s employment path through the working years.
In 2015, 72.5 per cent of school leavers aged 15 to 19 were fully engaged in further education, training or work.
Figure 19: Proportion of 15-to-19-year-old school leavers fully participating in education, training and/or employment, 2006 to 2015
Source: ABS, Education and Work, Australia, (cat. 6227), additional data cubes. Notes: Care needs to be taken with the interpretation of survey data as high standard errors can mean that differences from year to year are not significant. Following amendments to the 2015 ABS publication, the ABS data for the period 2007 to 2014 have been amended and are different from figures published in the 2014 Annual Report.
PER
CEN
TAG
E 80
90
100
70
60
50200820072006 2009 2010
baseline2011 2012 2013 2014 2015 2020
target
PER
CEN
TAG
E
30
40
20
10
02008 2009 2010 2011 2012 2013 2014 2020
target
Performance report: In tertiary education
39 NSW Department of Education Annual Report 2015 | www.dec.nsw.gov.au

Increase the number of apprenticeship and traineeship completions by 10 per cent by 2016
Increasing apprenticeship and traineeship completion rates is a key initiative for the government’s plan to develop a highly skilled workforce to support NSW’s growing economy.
In 2015, 38,400 apprentices and trainees completed their apprenticeship or traineeship. There was a decline of 13 per cent in comparison with 2014. This was consistent with national trends, and is mainly attributed to Commonwealth changes to incentives from 1 July 2012 that affected existing worker traineeship commencements. The NSW Government has a range of strategies for improving apprenticeship and traineeship completion rates and is building on strategies already in place.
Figure 20: NSW apprenticeships and traineeships completion estimates, 2006 to 2015
Source: NCVER, VOCSTATS (September 2015 quarter estimates). Note: Annual figures are based on 12 months to end of September.
NU
MB
ER
60,000
70,000
50,000
40,000
30,000200820072006 2009 2010 2011 2012 2013 2014 2015
Performance Report: In tertiary education
40 NSW Department of Education Annual Report 2015 | www.dec.nsw.gov.au

Our priorities: In tertiary education
OUR PRIORITIES: IN TERTIARY EDUCATION
HIGH EXPECTATIONS, CLOSING THE GAPS
Creating opportunities for people facing barriers
The Smart and Skilled reforms to the NSW vocational education and training system, which commenced on 1 January 2015, provide eligible students with government-subsidised training in courses on the NSW Skills List to gain the skills they need to get a job and advance their career.
The initiative provides fee exemptions and concessions for disadvantaged students and those with special needs, particularly students with disability, Aboriginal students, and Commonwealth welfare recipients in regional and remote locations.
The Smart and Skilled Adult and Community Education Community Service Obligation Program is promoting access and increased training outcomes for those who experience significant barriers to training and employment. For the period January to June 2015, the program delivered training to a total of 3,262 students, of whom 2,519 were disadvantaged.
State Training Services, which transferred to the Department of Industry, Skills and Regional Development on 1 July 2015, is managing the development of two initiatives under the Reskilling NSW strategy including:
¡ $48 million in fee-free scholarships (200,000 over four years) for concession-eligible 15-to-30-year-olds, with priority given to people in social housing or on the waiting list to undertake government-subsidised training, which was implemented in July 2015
¡ the $8 million Regional Vocational Education and Training (VET) Pathways Program, which will provide viable pathways into education, training and/or work for disengaged young people in regional areas with high levels of youth unemployment and limited support services, will be implemented in 2016.
State Training Services is also developing the Jobs for Tomorrow scholarship program for students who enrol in vocational qualifications related to science, technology, engineering and mathematics. This will see $25 million invested into 25,000 scholarships over four years.
In the first half of 2015, applications opened for the Bert Evans Apprentice Scholarships to assist apprentices
facing extreme hardship and who face significant challenges in completing their apprenticeship. The scholarships are available to apprentices who were disability, are country-based, are Aboriginal or are female in non-traditional trades.
Ensuring equal opportunities for people with disability
Under Smart and Skilled, students with disability were exempt from paying fees for the first qualification in a calendar year. A concession applies for any subsequent courses the student commences in the same year, up to certificate IV.
In the period January to June 2015, 28,300 students with disability enrolled in vocational education and training in NSW. As at 30 June 2015, there were 2,162 apprentices and trainees with disability.
The Adult and Community Education Community Service Obligation Program delivered training to 838 students with disability in the first six months of 2015.
Improving business and career opportunities for Aboriginal people
Under the Smart and Skilled reforms, which commenced in 2015, Aboriginal students are fee-exempt for government-subsidised qualifications. Training providers also receive a 15 per cent loading on top of the price for the qualification to help meet the learning needs of Aboriginal students.
The Elsa Dixon Aboriginal Employment Program funded state and local government agencies for 109 Aboriginal school-based traineeship positions to increase Higher School Certificate completion rates and to help students successfully transition from school into work.
In the first half of 2015, more than 300 Aboriginal apprentices and trainees were provided with guidance, mentoring, counselling and support services under the Our Way Ahead for Aboriginal People program. State Training Services continued to provide free business advisory support to Aboriginal people wishing to establish their own business through the Aboriginal Enterprise Development Officer program. For the period January to June 2015, the program assisted 139 clients and successfully created 19 new Aboriginal businesses.
In addition, the New Careers for Aboriginal People program provided advisory services for more than 454
41 NSW Department of Education Annual Report 2015 | www.dec.nsw.gov.au
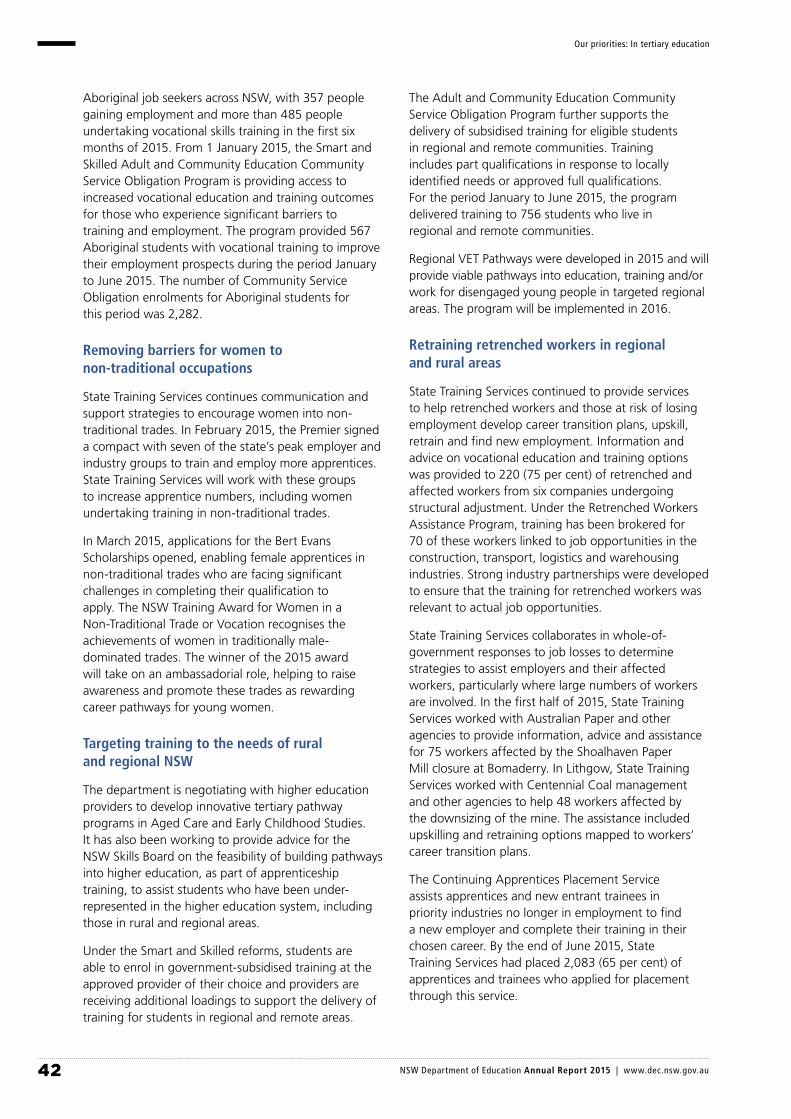
Aboriginal job seekers across NSW, with 357 people gaining employment and more than 485 people undertaking vocational skills training in the first six months of 2015. From 1 January 2015, the Smart and Skilled Adult and Community Education Community Service Obligation Program is providing access to increased vocational education and training outcomes for those who experience significant barriers to training and employment. The program provided 567 Aboriginal students with vocational training to improve their employment prospects during the period January to June 2015. The number of Community Service Obligation enrolments for Aboriginal students for this period was 2,282.
Removing barriers for women to non-traditional occupations
State Training Services continues communication and support strategies to encourage women into non-traditional trades. In February 2015, the Premier signed a compact with seven of the state’s peak employer and industry groups to train and employ more apprentices. State Training Services will work with these groups to increase apprentice numbers, including women undertaking training in non-traditional trades.
In March 2015, applications for the Bert Evans Scholarships opened, enabling female apprentices in non-traditional trades who are facing significant challenges in completing their qualification to apply. The NSW Training Award for Women in a Non-Traditional Trade or Vocation recognises the achievements of women in traditionally male-dominated trades. The winner of the 2015 award will take on an ambassadorial role, helping to raise awareness and promote these trades as rewarding career pathways for young women.
Targeting training to the needs of rural and regional NSW
The department is negotiating with higher education providers to develop innovative tertiary pathway programs in Aged Care and Early Childhood Studies. It has also been working to provide advice for the NSW Skills Board on the feasibility of building pathways into higher education, as part of apprenticeship training, to assist students who have been under-represented in the higher education system, including those in rural and regional areas.
Under the Smart and Skilled reforms, students are able to enrol in government-subsidised training at the approved provider of their choice and providers are receiving additional loadings to support the delivery of training for students in regional and remote areas.
The Adult and Community Education Community Service Obligation Program further supports the delivery of subsidised training for eligible students in regional and remote communities. Training includes part qualifications in response to locally identified needs or approved full qualifications. For the period January to June 2015, the program delivered training to 756 students who live in regional and remote communities.
Regional VET Pathways were developed in 2015 and will provide viable pathways into education, training and/or work for disengaged young people in targeted regional areas. The program will be implemented in 2016.
Retraining retrenched workers in regional and rural areas
State Training Services continued to provide services to help retrenched workers and those at risk of losing employment develop career transition plans, upskill, retrain and find new employment. Information and advice on vocational education and training options was provided to 220 (75 per cent) of retrenched and affected workers from six companies undergoing structural adjustment. Under the Retrenched Workers Assistance Program, training has been brokered for 70 of these workers linked to job opportunities in the construction, transport, logistics and warehousing industries. Strong industry partnerships were developed to ensure that the training for retrenched workers was relevant to actual job opportunities.
State Training Services collaborates in whole-of-government responses to job losses to determine strategies to assist employers and their affected workers, particularly where large numbers of workers are involved. In the first half of 2015, State Training Services worked with Australian Paper and other agencies to provide information, advice and assistance for 75 workers affected by the Shoalhaven Paper Mill closure at Bomaderry. In Lithgow, State Training Services worked with Centennial Coal management and other agencies to help 48 workers affected by the downsizing of the mine. The assistance included upskilling and retraining options mapped to workers’ career transition plans.
The Continuing Apprentices Placement Service assists apprentices and new entrant trainees in priority industries no longer in employment to find a new employer and complete their training in their chosen career. By the end of June 2015, State Training Services had placed 2,083 (65 per cent) of apprentices and trainees who applied for placement through this service.
Our priorities: In tertiary education
42 NSW Department of Education Annual Report 2015 | www.dec.nsw.gov.au

THE NSW QUALITY FRAMEWORK SETS THE QUALITY BENCHMARK FOR SMART AND SKILLED TRAINING PROVIDERS.
QUALITY TEACHING AND LEADERSHIP
Improving the quality of vocational education and training
The NSW Quality Framework sets the quality benchmark for Smart and Skilled training providers. Under the framework, providers are assessed on their capacity, capability and performance. Performance monitoring is one of nine principles outlined and incorporates a risk-based approach, coordinated monitoring and performance reviews.
To ensure compliance with the NSW Quality Framework, State Training Services is carrying out performance monitoring on all Smart and Skilled providers. Monitoring includes a review of enrolment data, telephone interviews with past and current students, site visits to training premises to ensure the appropriateness of training facilities and equipment and a review of student records and the complaints process. For the period January to June 2015, State Training Services carried out performance monitoring and site visits for more than 150 Smart and Skilled providers. Appropriate action, including the suspension or termination of contracts, will be taken for Smart and Skilled providers that fail to meet contract standards.
The Adult and Community Education Teaching and Leadership program supported organisations to implement new requirements under Smart and Skilled, with the delivery of eight projects in metropolitan and regional NSW to support adult and community education capability development.
NEW AND BETTER WAYS OF DOING BUSINESS
Smart and Skilled
The Smart and Skilled initiative gives people the opportunity to gain the skills they need to find a job and advance their careers. Around 340 high-quality training providers were contracted following a robust provider application process to deliver quality training in priority skills areas across NSW.
In June 2015, changes were announced that provided employers with a greater choice of providers and increased the flexibility for 259 training providers to deliver training across different geographical regions. Providers were also approved to deliver apprenticeships and traineeships in all regions where they have demand. Contract offers were made to a number of new providers for the delivery of apprenticeships and traineeships, bringing the number of Smart and Skilled providers to more than 400.
The Smart and Skilled website provides a central hub of information on available courses and providers for students and assistance for employers and training providers.
Partnering with industry to meet local skills needs
In 2015, State Training Services reviewed and updated the NSW Skills List, ensuring that priority qualifications for the NSW economy are eligible for funding under Smart and Skilled in 2016. Feedback from industry representatives, peak provider bodies and other stakeholders was considered in the review.
Streamlining apprenticeships and traineeships
State Training Services continued to work with the Commonwealth, states and territories to harmonise apprenticeship and traineeship policy and regulations. This will ensure uniformity across an array of administrative and regulatory requirements.
Our priorities: In tertiary education
43 NSW Department of Education Annual Report 2015 | www.dec.nsw.gov.au
Our priorities: In tertiary education
For the period January to the end of June 2015, more than 21,318 apprentices and trainees completed their training contracts with more than 53 per cent finishing early through competency-based completion.
State Training Services continued to develop industry engagement strategies to improve completion rates for apprentices and trainees in NSW.
In February the Premier signed an apprenticeship compact with seven key industry stakeholders. The compact is a key plan of the NSW Government’s Reskilling NSW strategy to develop a highly skilled workforce. Through the compact, the NSW Government is partnering with industry to encourage more businesses to take on apprentices and trainees, increase apprenticeship and traineeship completion rates and create a more streamlined and accessible apprenticeship and traineeship system for employers and learners. Compact members include the NSW Business Chamber, Australian Industry (Ai) Group (NSW), Civil Contractors Federation, Australian Constructors Association, Master Builders Association (NSW), Housing Industry Association and Motor Traders Association of NSW. Individual strategic delivery plans are being developed for each compact stakeholder. It is expected the plans will be finalised by mid-September 2016.
Building an effective and coordinated tertiary education system
The department is continuing to work with industry representatives, employers and tertiary education providers to develop innovative pathway programs leading to higher education qualifications in Aged Care and Early Childhood Studies as well as to innovative apprenticeships. These pathways will provide effective, work-related entry pathways to higher education as an alternative to direct entry from the Higher School Certificate and build links between the vocational and higher education systems. The pathways will benefit students across the state including those disadvantaged by their socioeconomic background or by rural and regional isolation.
44 NSW Department of Education Annual Report 2015 | www.dec.nsw.gov.au
Performance report: In our communities
PERFORMANCE REPORT: IN OUR COMMUNITIES
OUR PERFORMANCE TARGETS
Increase support for Aboriginal communities’ participation in decision making
In 2015, the number of Aboriginal community governance bodies participating in Local Decision Making increased from five to six: Murdi Paaki Regional Assembly (far western NSW), Illawarra/Wingecarribee Alliance Aboriginal Corporation, Regional Aboriginal Development Alliance (North Coast), Barang Aboriginal Regional Partnership (Central Coast), Three Rivers Regional Assembly (central west) and, most recently, the Northern Region Aboriginal Alliance (north west). Aboriginal Affairs is also supporting communities in the Riverina Murray and Newcastle Port Stephens areas to develop their regional governance structures.
In February 2015 an accord was signed between the NSW Government and the Murdi Paaki Regional Assembly, which represents Aboriginal communities in far western NSW. This was the first accord negotiated under Local Decision Making.
Increase partnerships for Aboriginal economic participation
Aboriginal Affairs supported the increase in economic participation of Aboriginal people by entering into a third industry based agreement with the Civil Contractors Federation, which aims to leverage the significant infrastructure investment being made by the NSW Government. An existing agreement with the Minerals Council has delivered two forums between the mining industry and Aboriginal businesses. The agreement with the Master Builders Association has seen the recruitment and retention of 16 Aboriginal apprentices and trainees and the development of nine fact sheets to support Aboriginal people who are working or want to work in the construction industry.
Increase access for people to learn Aboriginal languages
Five Aboriginal Language and Culture Nests have been established in partnership with the NSW Aboriginal Education Consultative Group and local Aboriginal language groups. They are the North West Wiradjuri, Gumbaynggirr, Bundjalung, Paakantji and Gamilaraay/Yuwaalaraay/Yuwaalayaay Aboriginal Language and Culture Nests.
The number of students studying an Aboriginal language in schools covered by the five Aboriginal Language and Culture Nests has steadily increased, from approximately 1,950 students in December 2014 to approximately 4,000 students in December 2015.
Increase number of opportunities for cultural participation
Aboriginal Affairs has increased the number of opportunities for participation in cultural activities and events by delivering small grants to support more than 100 NAIDOC week events in NSW. This reflects an increase of nearly 20 per cent on the number of events supported in 2014. In 2014–15, Aboriginal Affairs provided $154,455 to support a range of significant regional cultural events, including the Yabun, Tamworth Country Music (Cultural Showcase) and Saltwater Freshwater festivals.
In early 2015, Aboriginal Affairs established a new language initiative, Our Languages, Our Way, to fund community-based projects to strengthen community ownership and participation in language revitalisation projects. Grants totalling $163,560 were allocated to six applicants.
45 NSW Department of Education Annual Report 2015 | www.dec.nsw.gov.au
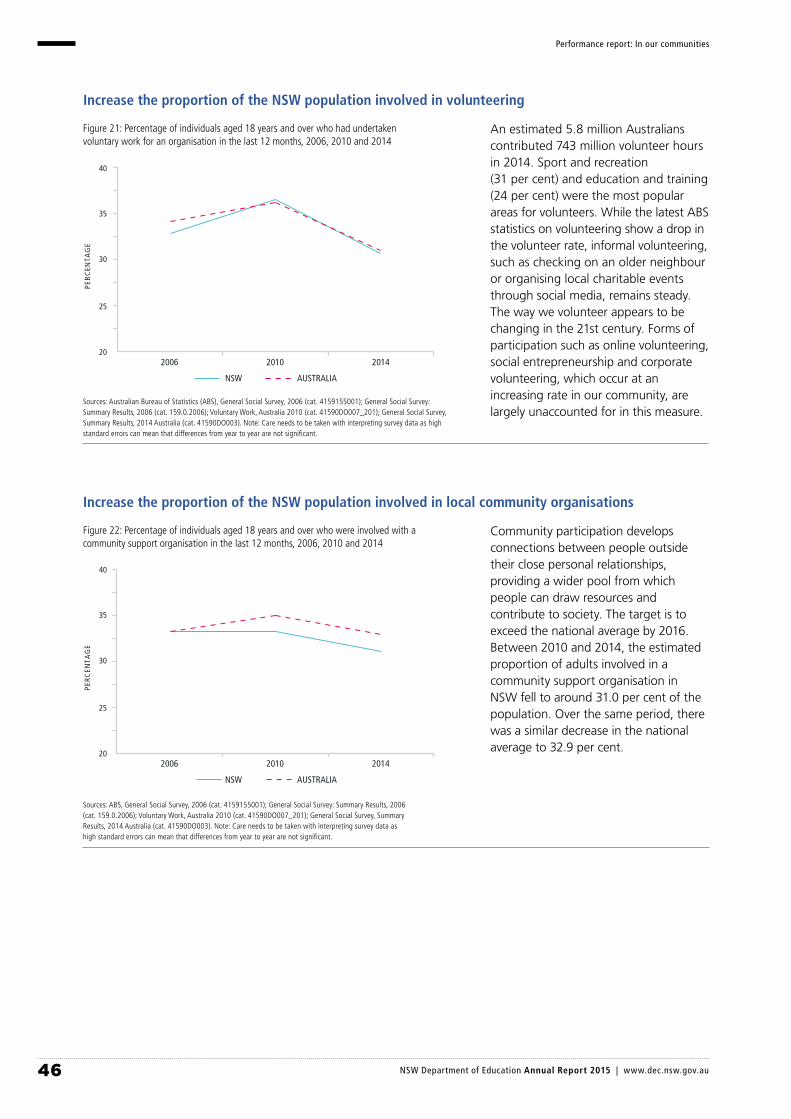
Increase the proportion of the NSW population involved in volunteering
An estimated 5.8 million Australians contributed 743 million volunteer hours in 2014. Sport and recreation (31 per cent) and education and training (24 per cent) were the most popular areas for volunteers. While the latest ABS statistics on volunteering show a drop in the volunteer rate, informal volunteering, such as checking on an older neighbour or organising local charitable events through social media, remains steady. The way we volunteer appears to be changing in the 21st century. Forms of participation such as online volunteering, social entrepreneurship and corporate volunteering, which occur at an increasing rate in our community, are largely unaccounted for in this measure.
Figure 21: Percentage of individuals aged 18 years and over who had undertaken voluntary work for an organisation in the last 12 months, 2006, 2010 and 2014
Sources: Australian Bureau of Statistics (ABS), General Social Survey, 2006 (cat. 4159155001); General Social Survey: Summary Results, 2006 (cat. 159.0.2006); Voluntary Work, Australia 2010 (cat. 41590DO007_201); General Social Survey, Summary Results, 2014 Australia (cat. 41590DO003). Note: Care needs to be taken with interpreting survey data as high standard errors can mean that differences from year to year are not significant.
Increase the proportion of the NSW population involved in local community organisations
Community participation develops connections between people outside their close personal relationships, providing a wider pool from which people can draw resources and contribute to society. The target is to exceed the national average by 2016. Between 2010 and 2014, the estimated proportion of adults involved in a community support organisation in NSW fell to around 31.0 per cent of the population. Over the same period, there was a similar decrease in the national average to 32.9 per cent.
Figure 22: Percentage of individuals aged 18 years and over who were involved with a community support organisation in the last 12 months, 2006, 2010 and 2014
Sources: ABS, General Social Survey, 2006 (cat. 4159155001); General Social Survey: Summary Results, 2006 (cat. 159.0.2006); Voluntary Work, Australia 2010 (cat. 41590DO007_201); General Social Survey, Summary Results, 2014 Australia (cat. 41590DO003). Note: Care needs to be taken with interpreting survey data as high standard errors can mean that differences from year to year are not significant.
Performance report: In our communities
PER
CEN
TAG
E
35
40
30
25
2020102006 2014
AUSTRALIANSW
PER
CEN
TAG
E
35
40
30
25
2020102006 2014
AUSTRALIANSW
46 NSW Department of Education Annual Report 2015 | www.dec.nsw.gov.au

Increase the proportion of the NSW population who feel they have someone to turn to in times of crisis
Levels of social attachment can be measured by the ability of people to get support in an emergency. The target is to exceed the national average by 2016. In 2014, an estimated 94.1 per cent of adults in NSW reported that in a time of crisis, they could get support from outside their household. There has been a rise in the proportion since 2006 consistent with the national average.
Figure 23: Percentage of individuals aged 18 years and over who were able to get support in a time of crisis 2006, 2010 and 2014
Sources: ABS, General Social Survey, 2006 (cat. 4159155001); General Social Survey: Summary Results, 2006 (cat. 159.0.2006); Voluntary Work, Australia 2010 (cat. 41590DO007_201); General Social Survey, Summary Results, 2014 Australia (cat. 41590DO003). Note: Care needs to be taken with interpreting survey data as high standard errors can mean that differences from year to year are not significant.
Performance report: In our communities
PER
CEN
TAG
E
95
100
90
85
8020102006 2014
AUSTRALIANSW
47 NSW Department of Education Annual Report 2015 | www.dec.nsw.gov.au
Our priorities: In our communities
OUR PRIORITIES: IN OUR COMMUNITIES
HIGH EXPECTATIONS, CLOSING THE GAPS
The NSW Government plan for Aboriginal affairs (OCHRE)
OCHRE (opportunity, choice, healing, responsibility, empowerment) is the NSW Government’s community-focused plan for Aboriginal affairs in NSW. Released in 2013, the plan has education, employment and accountability at its heart. Aboriginal Affairs and its government, industry, non-government and tertiary partners are implementing OCHRE initiatives with communities across the state.
OCHRE: An Approach to Evaluation has been published, committing the government to ethical and participatory practice. A framework to monitor, evaluate, report and improve OCHRE initiatives has also been completed, including draft measures of success. Independent evaluators have been engaged to analyse the major initiatives.
OCHRE has a number of components, including Local Decision Making, industry based agreements, economic development, Aboriginal employment in the public service, leadership in government, opportunity hubs, and increasing support for learning Aboriginal language and revitalisation. Achievements in these areas are outlined below.
Local Decision Making
Six Local Decision Making sites have been established, with the first accord between the NSW Government and a regional alliance negotiated with the Murdi Paaki Regional Assembly. Local Decision Making contributed to the state priority included in the Premier’s Priorities, to improve customer satisfaction with government services by ensuring Aboriginal people have genuine input into decisions about the services they receive. A review of the accord negotiation process was completed, with results informing further negotiations in 2016. A Premier’s Memorandum was released by the Hon. Mike Baird, MP, in March 2015 to encourage innovation.
Industry based agreements and economic development
Three industry based agreements are operational with the mining, construction and civil contractor industries. The NSW Minerals Council has demonstrated strong leadership by extending its agreement with government despite a downturn in the sector.
In September 2015, Aboriginal Affairs convened a roundtable discussion on Aboriginal economic development in NSW. The roundtable brought together key industry, community and government representatives, with participants agreeing to take action and to share responsibility for enduring Aboriginal economic prosperity in NSW.
The NSW Government’s commitment to Aboriginal economic development is reflected in the most recent data from the Office of Finance and Services showing government spending of $58.3 million over the past two years on products and services provided by Aboriginal businesses.
Aboriginal employment in the public service
The 12 Premier’s Priorities include doubling the number of Aboriginal people in senior leadership roles in the government sector in the next 10 years. The NSW Public Sector Aboriginal Employment Strategy 2014–2017 has been released by the NSW Public Service Commission. The first ever aspirational target of 1.8 per cent has been set for under-represented salary bands to challenge the pyramid effect of Aboriginal over-representation in lower grades. Forty-four Aboriginal employees have graduated from the Public Service Commission’s Aboriginal Career and Leadership Development Programs, with 20 per cent of these employees offered career development opportunities including acting opportunities and promotions into more senior roles.
48 NSW Department of Education Annual Report 2015 | www.dec.nsw.gov.au
Leadership in government
The Head of Aboriginal Affairs has declared three solution brokerage projects, which require NSW Government agencies to work together to find practical solutions on issues that might otherwise fall between the cracks:
¡ resolution of long-standing land and economic development issues with the Eden Local Aboriginal Land Council area
¡ an integrated early childhood service model for the Murdi Paaki region
¡ resolution of planning and infrastructure management on Aboriginal lands to enable economic development of assets, which is being led by Aboriginal Affairs in conjunction with the Department of Planning and Environment.
Opportunity hubs
Opportunity hubs coordinate and broker services that support young Aboriginal people to stay at school and progress to further education, training and employment. Four hubs are now operating in Dubbo, Upper Hunter, Tamworth and Campbelltown.
By December 2015, 89 schools and 1,584 Aboriginal students in years 5 to 12 were actively engaged with the hubs, which help students to gain an understanding and appreciation of the career pathways and opportunities available to them. Hubs also provide mentoring and other support to pursue those opportunities and help students link aspirations to learning plans and real jobs. Ninety employers were active partners, and 164 jobs and training opportunities were banked.
Increasing access to Aboriginal languages
Aboriginal Language and Culture Nests in NSW are fundamental to the department’s efforts to increase access to Aboriginal languages. The five nests were established in 2013 and 2014 in partnership with the NSW Aboriginal Education Consultative Group. and local Aboriginal language groups. They are North West Wiradjuri, Gumbaynggirr, Bundjalung, Paakantji and Gamilaraay/Yuwaalaraay/Yuwaalayaay Language and Culture Nests.
The nests provide communities with opportunities to revitalise, reclaim and maintain their languages in partnership with schools, TAFE NSW, universities and other community language programs. They support Aboriginal and non-Aboriginal students to learn Aboriginal languages in schools so that Aboriginal languages are preserved and used. They provide a critical conduit to community empowerment, cultural self-determination, cultural reconnection/connection and cultural health and wellbeing.
Each Aboriginal Language and Culture Nest also includes a keeping place where language resources and materials are accessible to schools and the community through community consultation. A long-term keeping place for the Gamilaraay/Yuwaalaraay/Yuwaalayaay nest has been identified at Goondee Aboriginal Keeping Place, Lightning Ridge. Temporary keeping places for the other nests are at Gnibi Southern Cross University, Lismore; Wilcannia Central School, Wilcannia; Yarradamarra; TAFE Western, Dubbo; and Coffs Harbour Education Campus.
The number of students studying an Aboriginal language in schools covered by the five nests has steadily increased, rising from approximately 1,950 students in December 2014 to around 4,000 students in December 2015. Aboriginal Language and Culture Nest teacher positions are located at the base school in each Aboriginal Language and Culture Nest. They have a key role in supporting schools to implement local Aboriginal language programs.
In addition, the department continued to support schools outside of the Aboriginal Language and Culture Nests to teach an Aboriginal language. In 2015, 32 additional schools were provided with specific funding to implement locally negotiated Aboriginal language programs.
Learning Aboriginal languages broadens career pathways and employment opportunities for Aboriginal students and people, as well as helping to build identity, self-esteem and resilience amongst Aboriginal students.
Our priorities: In our communities
49 NSW Department of Education Annual Report 2015 | www.dec.nsw.gov.au

Aboriginal Centre for Excellence
In March 2015, the NSW Government made a commitment of $20 million for the establishment of an Aboriginal Centre for Excellence in western Sydney. Western Sydney has a significant Aboriginal population and is one of the fastest-growing economies in NSW.
A key objective of the centre will be to deliver programs and services that equip local Aboriginal people, and particularly young people, to seize opportunities stemming from the region’s economic growth, especially with the business and corporate sectors. This initiative will complement existing services and amplify the positive work already happening in the community. Aboriginal Affairs supported a first round of community consultation that was completed in early December 2015 to ensure the centre reflects the needs, interests and aspirations of Aboriginal people in western Sydney. In addition to an online survey and a social media campaign targeting young people, more than 80 participants attended a facilitated community workshop.
STRONGER COMMUNITIES AND LEADERSHIP
Making volunteering easier and more rewarding
The department made significant progress in implementing the NSW Volunteering Strategy, which aims to make it easier for people to volunteer.
The Statement of Principles for the Recognition of Volunteers aims to ensure that volunteers are treated with respect, dignity and fairness. The statement has been endorsed by more than 355 organisations representing more than 762,000 volunteers. One-third of volunteers in NSW now enjoy this additional protection and support. An evaluation of the statement in 2014 found that organisations that had adopted the statement reported improved practices in volunteer management and recognition.
Timebanking is a free community program that allows the voluntary exchange of services between members. Members can earn time credits for volunteering their time and sharing their skills to help other members. They can then use these credits to secure services from other members, including internet coaching, house cleaning, language tuition and babysitting. Up to 30 June 2015, Timebanking members have exchanged almost 19,300 hours of support since 2012, including 4,000 hours in 2015. In addition, 4,900 people and 478 organisations have joined Timebanking, with one-third of members new to volunteering. An evaluation found that the program is one of the largest in the world, attracting new people to volunteering, creating social networks and a sense of community, and improving the quality of life for those involved.
In 2015, the department provided subsidised police checks for 500 volunteers in aged care, bringing to 4,000 the total number of reduced-price checks since 2012. The department also contributed $35,000 to support the Volunteer of the Year Awards and a regional awards program in 20 locations across NSW. Up to 30 June 2015, more than 150,000 people visited the website (volunteering.nsw.gov.au), with more than 800 people downloading the free risk management resource and more than 500 people accessing the new social media toolkit.
Our priorities: In our communities
50 NSW Department of Education Annual Report 2015 | www.dec.nsw.gov.au

In February 2015, the NSW Premier, the Hon. Mike Baird, MP, launched the new Premier’s Volunteer Recognition Program and the associated student volunteering campaign, Shape Your Future NSW. This program provides recognition certificates for student and adult volunteers, including for those who have given 25 and 40 years of service.
Strengthening youth leadership
Youth Opportunities provides funding to youth organisations and local government for mentoring and other projects to help young people lead and participate in community development activities. In February 2015, the Premier launched the Youth Frontiers youth mentoring program. During 2015, a total of 1,200 Year 8 and Year 9 students across NSW were mentored. We also supported Youth Week 2015 from 10 to 19 April 2015. Almost 100,000 young people participated in more than 750 local activities and events. More than 120 young people from across NSW attended the Youth Week forum at Parliament House.
In January 2015, responsibility for administrative support for the Youth Advisory Council transferred to the NSW Advocate for Children and Young People, consistent with the repeal of the Youth Advisory Council Act 1989. The activities of the council will be reported in the Advocate for Children and Young People annual report.
Making our communities stronger
In 2015, the department provided community engagement expertise as well as advice and support for initiatives aimed at increasing communities’ capacity and opportunities to be involved in planning, influencing and implementing local actions. For example:
¡ The department worked with other government and community organisations and volunteers in undertaking the innovative Ask Illawarra Shoalhaven exercise, accessing a rich base of community knowledge to inform future strengths-based, collaborative approaches.
¡ The department’s regional coordinators have been active partners in Collective NSW, an innovative approach to community engagement involving government, community and business in a number of districts across NSW.
The department also supported innovative programs in regional and remote communities, including the successful Tackling Violence program. This program engages men and boys through 19 rugby league clubs and high schools in predominately rural and regional communities. It includes education programs for players and local high school students, as well as a TV ad against domestic violence and a social marketing campaign. Club players and officials sign a code of conduct that penalises players for domestic violence offences. An evaluation in 2014 confirmed the program’s effectiveness in raising awareness as well as changing attitudes and behaviours to domestic violence in some of NSW’s most disadvantaged communities.
The Gallipoli 2015 School Tour was a major initiative in the NSW Centenary of Anzac program. It enabled 128 NSW school students and supervising teachers to represent their schools, communities and state at the official 100th anniversary Anzac Day commemorative services at Gallipoli. The tour provided participants with a life-changing experience that was completed safely and efficiently. Participants continue to deliver the Government’s Centenary of Anzac message throughout their communities.
Our priorities: In our communities
51 NSW Department of Education Annual Report 2015 | www.dec.nsw.gov.au
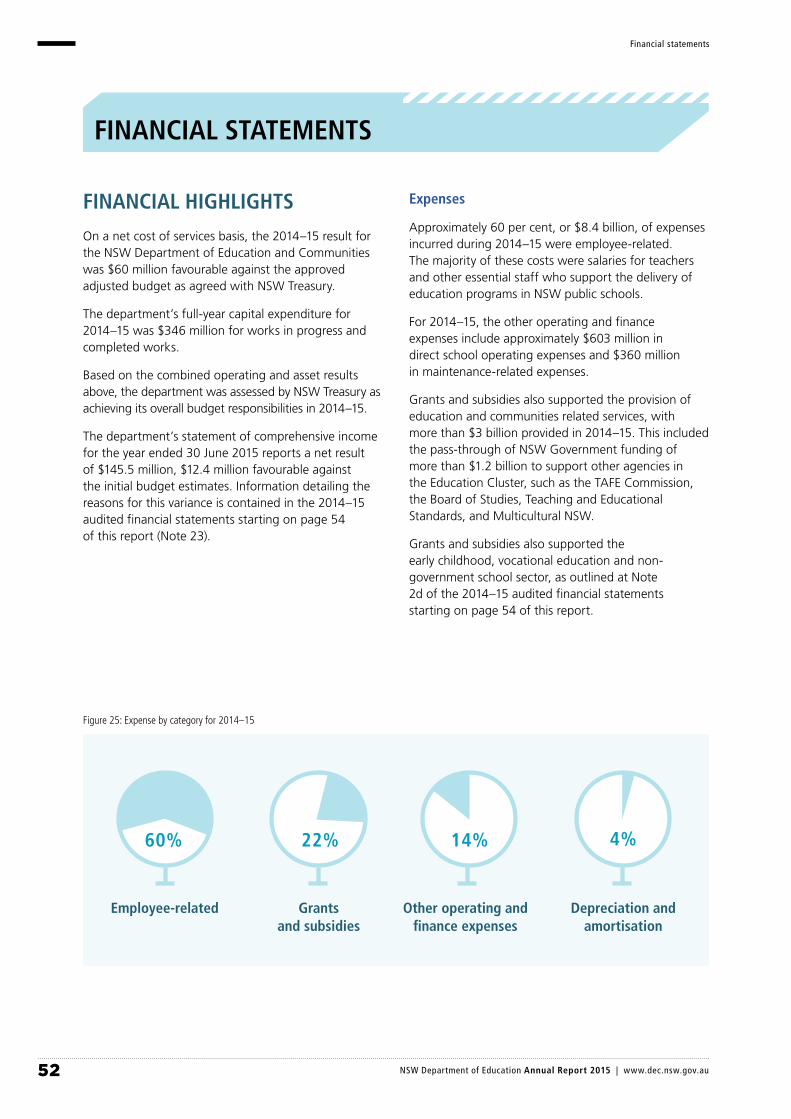
FINANCIAL STATEMENTS
FINANCIAL HIGHLIGHTS
On a net cost of services basis, the 2014–15 result for the NSW Department of Education and Communities was $60 million favourable against the approved adjusted budget as agreed with NSW Treasury.
The department’s full-year capital expenditure for 2014–15 was $346 million for works in progress and completed works.
Based on the combined operating and asset results above, the department was assessed by NSW Treasury as achieving its overall budget responsibilities in 2014–15.
The department’s statement of comprehensive income for the year ended 30 June 2015 reports a net result of $145.5 million, $12.4 million favourable against the initial budget estimates. Information detailing the reasons for this variance is contained in the 2014–15 audited financial statements starting on page 54 of this report (Note 23).
Expenses
Approximately 60 per cent, or $8.4 billion, of expenses incurred during 2014–15 were employee-related. The majority of these costs were salaries for teachers and other essential staff who support the delivery of education programs in NSW public schools.
For 2014–15, the other operating and finance expenses include approximately $603 million in direct school operating expenses and $360 million in maintenance-related expenses.
Grants and subsidies also supported the provision of education and communities related services, with more than $3 billion provided in 2014–15. This included the pass-through of NSW Government funding of more than $1.2 billion to support other agencies in the Education Cluster, such as the TAFE Commission, the Board of Studies, Teaching and Educational Standards, and Multicultural NSW.
Grants and subsidies also supported the early childhood, vocational education and non-government school sector, as outlined at Note 2d of the 2014–15 audited financial statements starting on page 54 of this report.
Figure 25: Expense by category for 2014–15
Employee-related
60%
Grants and subsidies
22%
Other operating and finance expenses
14%
Depreciation and amortisation
4%
Financial statements
52 NSW Department of Education Annual Report 2015 | www.dec.nsw.gov.au

Revenue
Revenue for the department is derived mostly from recurrent ($12.1 billion) and capital ($347 million) appropriations provided by NSW Treasury. Together, these sources represent more than 90 per cent of the department’s total revenue in 2014–15.
Approximately six per cent of the department’s total revenue in 2014–15 was derived from the sale of goods and services, investment revenue, grants and contributions, and for Crown-accepted employee benefits.
Other revenue sources represent three per cent of the department’s total revenue in 2014–15 and relate mostly to revenue generated by schools to support the delivery of education programs.
Information detailing revenue sources for the department is outlined at Note 3 of the 2014–15 audited financial statements starting on page 54 of this report.
Net assets
The department’s net assets as at 30 June 2015 are $20.6 billion. This is made up of total assets of $22.2 billion partly offset by total liabilities of $1.6 billion. The net assets are represented by accumulated funds of $13.7 billion and an asset revaluation reserve of $6.9 billion.
The audited financial statements for the NSW Department of Education and Communities for 2014–15 are provided starting on page 54 of this report.
Figure 26: Revenue sources for 2014–15
Recurrent appropriation
88%
Capital appropriation
3%
Sale of goods and services
1%
Investment revenue
0.2%
Grants and contributions
1%
Acceptance by the Crown Entity of employee benefits
4%
Other revenue
3%
Financial statements
53 NSW Department of Education Annual Report 2015 | www.dec.nsw.gov.au
54 NSW Department of Education Annual Report 2015 | www.dec.nsw.gov.au
Financial statementsFinancial statements
DEP
AR
TMEN
T O
F ED
UC
ATI
ON
AN
D C
OM
MU
NIT
IES
Fina
ncia
l Sta
tem
ents
For t
he y
ear e
nded
30
June
201
5
Con
tent
s In
depe
nden
t Aud
it R
epor
t St
atem
ent b
y th
e Se
cret
ary
Pr
imar
y Fi
nanc
ial S
tate
men
ts
Sta
tem
ent o
f Com
preh
ensi
ve In
com
e S
tate
men
t of F
inan
cial
Pos
ition
S
tate
men
t of C
hang
es in
Equ
ity
Sta
tem
ent o
f Cas
h Fl
ows
Supp
lem
enta
ry F
inan
cial
Sta
tem
ents
S
ervi
ce G
roup
Sta
tem
ents
S
umm
ary
of C
ompl
ianc
e w
ith F
inan
cial
Dire
ctiv
es
Not
es to
and
form
ing
part
of t
he F
inan
cial
Sta
tem
ents
G
ener
al
1.
Sum
mar
y of
Sig
nific
ant A
ccou
ntin
g P
olic
ies
2.
Exp
ense
s E
xclu
ding
Los
ses
3.
Rev
enue
4.
G
ain/
(Los
s) o
n D
ispo
sal
5.
Oth
er G
ains
/(Los
ses)
6.
C
ondi
tions
on
Con
tribu
tions
7.
S
ervi
ce G
roup
s of
the
Dep
artm
ent
Cur
rent
/Non
-Cur
rent
Ass
ets
8.
Cas
h an
d C
ash
Equ
ival
ents
9.
R
ecei
vabl
es
10.
Oth
er F
inan
cial
Ass
ets
11.
Pro
perty
, Pla
nt a
nd E
quip
men
t 12
. In
tang
ible
Ass
ets
13.
Non
-Cur
rent
Ass
ets
(or D
ispo
sal G
roup
s) H
eld
for S
ale
14.
Fair
Val
ue M
easu
rem
ent o
f Non
-Fin
anci
al A
sset
s 15
. R
estri
cted
Ass
ets
Cur
rent
/Non
-Cur
rent
Lia
bilit
ies
16.
Paya
bles
17
. B
orro
win
gs
18.
Prov
isio
ns
19.
Oth
er
Equi
ty
20. I
ncre
ase/
(Dec
reas
e) in
Net
Ass
ets
from
Equ
ity T
rans
fers
Oth
ers
21.
Com
mitm
ents
for E
xpen
ditu
re
22.
Con
tinge
nt L
iabi
litie
s an
d C
ontin
gent
Ass
ets
23.
Bud
get R
evie
w
24.
Rec
onci
liatio
n of
Cas
h Fl
ows
from
Ope
ratin
g A
ctiv
ities
to N
et R
esul
t 25
. N
on-C
ash
Fina
ncin
g an
d In
vest
ing
Act
iviti
es
26.
Fina
ncia
l Ins
trum
ents
27
. Pr
ovis
ion
for S
uper
annu
atio
n 28
. E
vent
s af
ter t
he R
epor
ting
Per
iod

55 NSW Department of Education Annual Report 2015 | www.dec.nsw.gov.au
Financial statementsFinancial statements

56 NSW Department of Education Annual Report 2015 | www.dec.nsw.gov.au
Financial statements
DE
PA
RTM
EN
T O
F E
DU
CA
TIO
N A
ND
CO
MM
UN
ITIE
S
Pag
e3
of 6
0
Star
t of A
udite
d Fi
nanc
ial S
tate
men
ts
Stat
emen
t of c
ompr
ehen
sive
inco
me
for t
he y
ear e
nded
30
June
201
5
Act
ual
Bud
get
Act
ual
2015
2015
20
14
Not
es$’
000
$’00
0 $’
000
Expe
nses
exc
ludi
ng lo
sses
O
pera
ting
expe
nses
E
mpl
oyee
rela
ted
2(a)
8,
393,
323
8,31
3,69
0 9,
522,
020
Oth
er o
pera
ting
expe
nses
2(
b)
1,95
4,61
9 1,
988,
927
2,20
6,33
8 D
epre
ciat
ion
and
amor
tisat
ion
2(c)
55
0,29
0 53
0,33
7 67
4,02
5 G
rant
s an
d su
bsid
ies
2(d)
3,
011,
020
3,35
8,21
3 1,
765,
556
Fina
nce
cost
s 2(
e)
19,5
34
18,4
15
19,5
90
Tota
l Exp
ense
s ex
clud
ing
loss
es
13,9
28,7
86
14,2
09,5
82
14,1
87,5
29
Rev
enue
R
ecur
rent
app
ropr
iatio
n
3(a)
12
,113
,950
12
,432
,057
11
,637
,281
C
apita
l app
ropr
iatio
n
3(a)
34
6,62
8 38
1,32
9 49
3,37
5 Sa
le o
f goo
ds a
nd s
ervi
ces
3(b)
19
4,78
7 29
4,43
7 52
0,23
9 In
vest
men
t rev
enue
3(
c)
27,3
84
43,8
08
38,2
17
Gra
nts
and
cont
ribut
ions
3(
d)
108,
498
450,
638
143,
393
Acc
epta
nce
by th
e C
row
n E
ntity
of e
mpl
oyee
be
nefit
s an
d ot
her l
iabi
litie
s 3(
e)
539,
153
446,
377
599,
674
Oth
er re
venu
e 3(
f) 45
9,58
8 2,
929
359,
192
Per
sonn
el s
ervi
ces
reve
nue
3(g)
--
-- 28
,806
To
tal R
even
ue
13,7
89,9
88
14,0
51,5
75
13,8
20,1
77
G
ain/
(Los
s) o
n di
spos
al
4 (6
,206
) --
(11,
699)
O
ther
gai
ns/(l
osse
s)
5 (4
96)
64
932
(6,7
02)
64
(10,
767)
Net
resu
lt 24
(1
45,5
00)
(157
,943
) (3
78,1
19)
Oth
er c
ompr
ehen
sive
inco
me
Item
s th
at w
ill n
ot b
e re
clas
sifie
d to
net
resu
lt
N
et in
crea
se/(d
ecre
ase)
in p
rope
rty, p
lant
and
eq
uipm
ent r
eval
uatio
n su
rplu
s 11
57
6,06
1 --
241,
241
Sup
eran
nuat
ion
actu
aria
l gai
ns/(l
osse
s)
27
-- --
2,69
7
Tota
l Oth
er c
ompr
ehen
sive
inco
me
576,
061
--24
3,93
8
TOTA
L C
OM
PREH
ENSI
VE IN
CO
ME
430,
561
(157
,943
)(1
34,1
81)
The
acco
mpa
nyin
g no
tes
form
par
t of t
hese
fina
ncia
l sta
tem
ents
.
DE
PA
RTM
EN
T O
F E
DU
CA
TIO
N A
ND
CO
MM
UN
ITIE
S
Pag
e4
of 6
0
Stat
emen
t of f
inan
cial
pos
ition
as
at 3
0 Ju
ne 2
015
A
ctua
l B
udge
t A
ctua
l
2015
20
15
2014
Not
es$’
000
$’00
0 $’
000
A
SSET
S
Cur
rent
Ass
ets
C
ash
and
cash
equ
ival
ents
8
775,
263
519,
054
1,12
5,56
1
Rec
eiva
bles
9
70,0
28
76,6
56
131,
878
O
ther
fina
ncia
l ass
ets
10
18,6
28
303
22,1
76
86
3,91
9 59
6,01
3 1,
279,
615
N
on-c
urre
nt a
sset
s he
ld fo
r sal
e 13
77
9 4,
296
1,61
0
Tota
l Cur
rent
Ass
ets
864,
698
600,
309
1,28
1,22
5
Non
-Cur
rent
Ass
ets
R
ecei
vabl
es
9 8,
429
2,47
4 14
,147
Oth
er fi
nanc
ial a
sset
s 10
--
4,71
9 44
6
Pro
perty
, pla
nt a
nd e
quip
men
t 11
-
Lan
d
7,
537,
030
7,67
8,74
8 7,
676,
772
-
Bui
ldin
gs
13
,285
,307
12
,805
,709
17
,311
,180
- P
lant
and
equ
ipm
ent
19
9,69
5 10
1,37
9 26
9,40
1
Tota
l pro
perty
, pla
nt a
nd e
quip
men
t
21,0
22,0
32
20,5
85,8
36
25,2
57,3
53
In
tang
ible
ass
ets
12
330,
930
351,
953
428,
013
To
tal N
on-C
urre
nt A
sset
s21
,361
,391
20
,944
,982
25
,699
,959
Tota
l Ass
ets
22,2
26,0
89
21,5
45,2
91
26,9
81,1
84
LI
AB
ILIT
IES
C
urre
nt L
iabi
litie
s
Paya
bles
16
52
7,88
9 43
1,49
4 88
8,58
4
Borro
win
gs
17
6,04
6 6,
045
146,
281
Pr
ovis
ions
18
70
0,96
5 35
8,04
3 86
5,13
1
Oth
er
19
26,9
07
39,1
05
18,1
12
To
tal C
urre
nt L
iabi
litie
s 1,
261,
807
834,
687
1,91
8,10
8
Non
-Cur
rent
Lia
bilit
ies
Borro
win
gs
17
316,
573
176,
029
182,
118
Pr
ovis
ions
18
28
,253
28
9,72
0 21
,300
Oth
er
19
2,47
3 4,
594
3,53
5
Tota
l Non
-Cur
rent
Lia
bilit
ies
347,
299
470,
343
206,
953
To
tal L
iabi
litie
s1,
609,
106
1,30
5,03
0 2,
125,
061
N
et A
sset
s20
,616
,983
20
,240
,261
24
,856
,123
EQU
ITY
Res
erve
s6,
888,
523
6,10
7,07
49,
118,
968
Acc
umul
ated
fund
s
13,7
28,3
35
14,1
33,1
87
15,7
36,9
77
A
mou
nts
reco
gnis
ed in
equ
ity re
latin
g to
as
sets
hel
d fo
r sal
e 13
12
5 --
178
To
tal E
quity
20,6
16,9
8320
,240
,261
24,8
56,1
23
The
acco
mpa
nyin
g no
tes
form
par
t of t
hese
fina
ncia
l sta
tem
ents
.

57 NSW Department of Education Annual Report 2015 | www.dec.nsw.gov.au
Financial statements
DE
PA
RTM
EN
T O
F E
DU
CA
TIO
N A
ND
CO
MM
UN
ITIE
S
Pag
e5
of 6
0
The
acco
mpa
nyin
g no
tes
form
par
t of t
hese
fina
ncia
l sta
tem
ents
.
Stat
emen
t of c
hang
es in
equ
ity fo
r the
yea
r end
ed 3
0 Ju
ne 2
015
Acc
umul
ated
Fu
nds
Ass
etR
eval
uatio
n Su
rplu
s
Ass
et H
eld
for S
ale
Res
erve
To
tal
N
otes
$’00
0 $’
000
$’00
0 $’
000
Bal
ance
at 1
Jul
y 20
14
15
,736
,977
9,
118,
968
178
24,8
56,1
23
Net
resu
lt fo
r the
yea
r (1
45,5
00)
----
(145
,500
)
Oth
er c
ompr
ehen
sive
inco
me
Net
incr
ease
/(dec
reas
e) in
pro
perty
, pla
nt a
nd
equi
pmen
t 11
--
576,
061
--57
6,06
1 To
tal o
ther
com
preh
ensi
ve in
com
e
-- 57
6,06
1 --
576,
061
Tota
l com
preh
ensi
ve in
com
e fo
r the
yea
r (1
45,5
00)
576,
061
--43
0,56
1
Tran
sact
ions
with
ow
ners
in th
eir c
apac
ity
as o
wne
rsIn
crea
se/(D
ecre
ase)
in n
et a
sset
s fro
m e
quity
tra
nsfe
rs20
(1,9
01,4
86)
(2,8
06,6
46)
--(4
,708
,132
) D
istri
butio
n to
ow
ners
--
--
--
--
AM
ES
Pilla
r Sup
er a
djus
tmen
t 38
,431
----
38,4
31
Tota
l tra
nsac
tions
with
ow
ners
in th
eir
capa
city
as
owne
rs
(1,8
63,0
55)
(2,8
06,6
46)
-- (4
,669
,701
)
Tran
sfer
s w
ithin
equ
ity
Ass
et re
valu
atio
n re
serv
e ba
lanc
e tra
nsfe
rred
w
ithin
equ
ity
(87)
140
(53)
--B
alan
ce a
t 30
June
201
5
13,7
28,3
35
6,88
8,52
3 12
5 20
,616
,983
Bal
ance
at 1
Jul
y 20
13
16
,279
,857
8,
871,
833
622
25,1
52,3
12
Cor
rect
ion
of e
rror
s (1
34,3
80)
-- --
(134
,380
)
Res
tate
d to
tal e
quity
at 1
Jul
y 20
13
16,1
45,4
77
8,87
1,83
3 62
2 25
,017
,932
Net
resu
lt fo
r the
yea
r
(378
,119
) --
-- (3
78,1
19)
Oth
er c
ompr
ehen
sive
inco
me
Net
incr
ease
/(dec
reas
e) in
pro
perty
, pla
nt a
nd
equi
pmen
t 11
--24
1,24
1--
241,
241
Supe
rann
uatio
n ac
tuar
ial g
ains
/(los
ses)
27
2,69
7--
--2,
697
Tota
l oth
er c
ompr
ehen
sive
inco
me
2,
697
241,
241
-- 24
3,93
8To
tal c
ompr
ehen
sive
inco
me
for t
he y
ear
(375
,422
)24
1,24
1--
(134
,181
)
Tran
sact
ions
with
ow
ners
in th
eir c
apac
ity
as o
wne
rs
Incr
ease
/(Dec
reas
e) in
net
ass
ets
from
equ
ity
trans
fers
20
(4,6
41)
----
(4,6
41)
Oth
er4,
057
----
4,05
7 To
tal t
rans
actio
ns w
ith o
wne
rs in
thei
r ca
paci
ty a
s ow
ners
(5
84)
-- --
(584
)
Tran
sfer
with
in e
quity
Tr
ansf
er fr
om a
ccum
ulat
ed fu
nd to
ass
et
reva
luat
ion
surp
lus
(36,
488)
9,44
4--
(27,
044)
A
sset
reva
luat
ion
rese
rve
bala
nce
trans
ferr
ed
with
in e
quity
3,99
4(3
,550
)(4
44)
--B
alan
ce a
t 30
June
201
4
15,7
36,9
77
9,11
8,96
8 17
8 24
,856
,123
DE
PA
RTM
EN
T O
F E
DU
CA
TIO
N A
ND
CO
MM
UN
ITIE
S
Pag
e6
of 6
0
Stat
emen
t of c
ash
flow
s fo
r the
yea
r end
ed 3
0 Ju
ne 2
015
A
ctua
l B
udge
t A
ctua
l
2015
20
15
2014
N
otes
$’
000
$’00
0 $’
000
CA
SH F
LOW
S FR
OM
OPE
RA
TIN
G A
CTI
VITI
ES
Pa
ymen
ts
E
mpl
oyee
rela
ted
(7
,889
,517
) (7
,913
,729
) (8
,875
,442
) G
rant
s an
d su
bsid
ies
(3
,138
,653
) (3
,357
,613
) (1
,886
,544
) Fi
nanc
e co
sts
(1
9,53
4)
(18,
415)
(1
9,38
0)
Oth
er
(2
,058
,464
) (2
,025
,669
) (2
,322
,959
) To
tal P
aym
ents
(13,
106,
168)
(1
3,31
5,42
6)
(13,
104,
325)
Rec
eipt
s
R
ecur
rent
app
ropr
iatio
n
12,1
22,7
46
12,4
32,0
57
11,6
30,4
42
Cap
ital a
ppro
pria
tion
34
6,62
8 38
1,32
9 47
5,16
5 Sa
le o
f goo
ds a
nd s
ervi
ces
20
2,04
5 17
8,83
4 62
4,26
8 In
tere
st re
ceiv
ed
32
,147
43
,808
39
,826
G
rant
s an
d co
ntrib
utio
ns
90
,127
43
6,54
8 13
4,41
2 O
ther
725,
526
219,
769
661,
811
Tota
l Rec
eipt
s
13,5
19,2
19
13,6
92,3
45
13,5
65,9
24
NET
CA
SH F
LOW
S FR
OM
OPE
RA
TIN
G A
CTI
VITI
ES24
41
3,05
1 37
6,91
9 46
1,59
9
CA
SH F
LOW
S FR
OM
INVE
STIN
G A
CTI
VITI
ES
P
roce
eds
from
sal
e of
land
and
bu
ildin
gs a
nd p
lant
and
equ
ipm
ent
2,65
0 13
,457
10
,606
A
dvan
ce re
paym
ents
rece
ived
-- 29
3 --
Pro
ceed
s fro
m s
ale
of in
vest
men
ts
3,
548
-- 24
,295
Pu
rcha
ses
of la
nd a
nd b
uild
ings
, and
pl
ant a
nd e
quip
men
t (3
39,3
84)
(390
,142
) (4
96,9
87)
Pur
chas
e of
inve
stm
ents
--
--
(22,
176)
A
dvan
ces
mad
e
-- (2
,003
) --
Oth
er
--
(308
,098
) --
NET
CA
SH F
LOW
S FR
OM
INVE
STIN
G
AC
TIVI
TIES
(333
,186
) (6
86,4
93)
(484
,262
)
C
ASH
FLO
WS
FRO
M F
INA
NC
ING
AC
TIVI
TIES
Rep
aym
ent o
f bor
row
ings
and
adv
ance
s
(5,7
81)
(146
,304
) (5
,507
) N
ET C
ASH
FLO
WS
FRO
M F
INA
NC
ING
A
CTI
VITI
ES(5
,781
) (1
46,3
04)
(5,5
07)
N
ET IN
CR
EASE
/(DEC
REA
SE) I
N C
ASH
74,0
84
(455
,878
) (2
8,17
0)O
peni
ng c
ash
and
cash
equ
ival
ents
1,12
5,56
1 97
4,93
2 1,
156,
538
Cas
h tra
nsfe
rs th
roug
h ad
min
istra
tive
rest
ruct
ures
20
(4
24,3
82)
-- (2
,807
) C
LOSI
NG
CA
SH A
ND
CA
SH
EQU
IVA
LEN
TS
877
5,26
3 51
9,05
4 1,
125,
561
The
acco
mpa
nyin
g no
tes
form
par
t of t
hese
fina
ncia
l sta
tem
ents
.
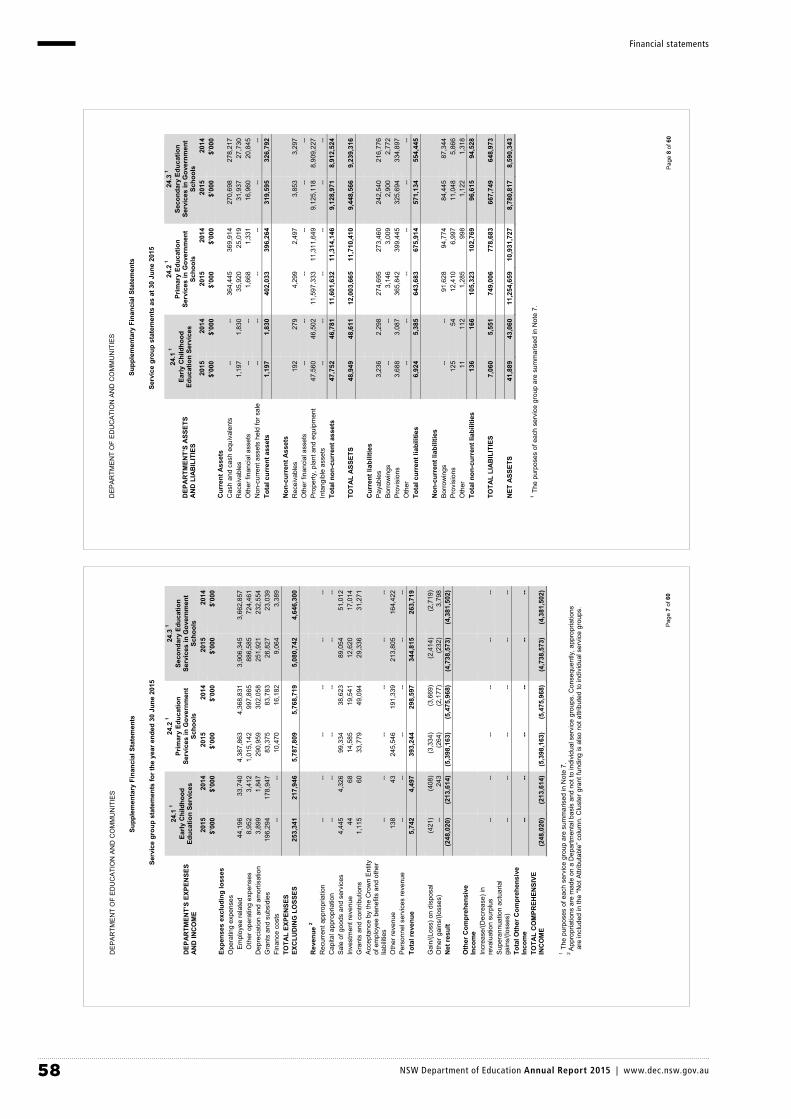
58 NSW Department of Education Annual Report 2015 | www.dec.nsw.gov.au
Financial statements
DE
PA
RTM
EN
T O
F E
DU
CA
TIO
N A
ND
CO
MM
UN
ITIE
S
Supp
lem
enta
ry F
inan
cial
Sta
tem
ents
Pag
e7
of 6
0
Serv
ice
grou
p st
atem
ents
for t
heye
ar e
nded
30
June
201
5
DEP
AR
TMEN
T’S
EXPE
NSE
S A
ND
INC
OM
E
24.1
1
Early
Chi
ldho
od
Educ
atio
n Se
rvic
es
24.2
1
Prim
ary
Educ
atio
n Se
rvic
es in
Gov
ernm
ent
Scho
ols
24.3
1
Seco
ndar
y Ed
ucat
ion
Serv
ices
in G
over
nmen
t Sc
hool
s 20
15
2014
20
15
2014
20
15
2014
$’
000
$’00
0 $’
000
$’00
0 $’
000
$’00
0 Ex
pens
es e
xclu
ding
loss
es
Ope
ratin
g ex
pens
es
E
mpl
oyee
rela
ted
44,1
96
33,7
40
4,38
7,86
3 4,
368,
831
3,90
6,34
5 3,
662,
857
Oth
er o
pera
ting
expe
nses
8,
952
3,41
2 1,
015,
142
997,
865
886,
585
724,
461
Dep
reci
atio
n an
d am
ortis
atio
n 3,
899
1,84
7 29
0,95
9 30
2,05
8 25
1,92
1 23
2,55
4 G
rant
s an
d su
bsid
ies
196,
294
178,
947
83,3
75
83,7
83
26,8
27
23,0
39
Fina
nce
cost
s --
-- 10
,470
16
,182
9,
064
3,38
9 TO
TAL
EXPE
NSE
S
EXC
LUD
ING
LO
SSES
253,
341
217,
946
5,78
7,80
9 5,
768,
719
5,08
0,74
2 4,
646,
300
R
even
ue 2
R
ecur
rent
app
ropr
iatio
n
----
--
--
--
--C
apita
l app
ropr
iatio
n
----
--
--
--
--Sa
le o
f goo
ds a
nd s
ervi
ces
4,44
5 4,
326
99,3
34
38,6
23
89,0
54
51,0
12
Inve
stm
ent r
even
ue
44
68
14,5
85
19,5
41
12,6
20
17,0
14
Gra
nts
and
cont
ribut
ions
1,
115
60
33,7
79
49,0
94
29,3
36
31,2
71
Acce
ptan
ce b
y th
e C
row
n En
tity
of e
mpl
oyee
ben
efits
and
oth
er
liabi
litie
s
----
--
--
--
--O
ther
reve
nue
138
43
245,
546
191,
339
213,
805
164,
422
Per
sonn
el s
ervi
ces
reve
nue
----
--
--
--
--To
tal r
even
ue5,
742
4,49
7 39
3,24
4 29
8,59
7 34
4,81
5 26
3,71
9
Gai
n/(L
oss)
on
disp
osal
(4
21)
(408
) (3
,334
) (3
,669
) (2
,414
) (2
,719
) O
ther
gai
ns/(l
osse
s)
--24
3 (2
64)
(2,1
77)
(232
) 3,
798
Net
resu
lt (2
48,0
20)
(213
,614
)(5
,398
,163
)(5
,475
,968
) (4
,738
,573
)(4
,381
,502
)
Oth
er C
ompr
ehen
sive
In
com
e
Incr
ease
/(Dec
reas
e) in
re
valu
atio
n su
rplu
s --
--
--
--
----
Supe
rann
uatio
n ac
tuar
ial
gain
s/(lo
sses
) --
--
--
--
----
Tota
l Oth
er C
ompr
ehen
sive
In
com
e--
-- --
-- --
--TO
TAL
CO
MPR
EHEN
SIVE
IN
CO
ME
(248
,020
) (2
13,6
14)
(5,3
98,1
63)
(5,4
75,9
68)
(4,7
38,5
73)
(4,3
81,5
02)
1 The
pur
pose
s of
eac
h se
rvic
e gr
oup
are
sum
mar
ised
in N
ote
7.
2A
ppro
pria
tions
are
mad
e on
a D
epar
tmen
tal b
asis
and
not
to in
divi
dual
ser
vice
gro
ups.
Con
sequ
ently
, app
ropr
iatio
ns
ar
e in
clud
ed in
the
“Not
Attr
ibut
able
” col
umn.
Clu
ster
gra
nt fu
ndin
g is
als
o no
t attr
ibut
ed to
indi
vidu
al s
ervi
ce g
roup
s.
DE
PA
RTM
EN
T O
F E
DU
CA
TIO
N A
ND
CO
MM
UN
ITIE
S
Supp
lem
enta
ry F
inan
cial
Sta
tem
ents
Pag
e8
of 6
0
Serv
ice
grou
p st
atem
ents
as a
t 30
June
201
5
DEP
AR
TMEN
T’S
ASS
ETS
AN
D L
IAB
ILIT
IES
24.1
1
Early
Chi
ldho
od
Educ
atio
n Se
rvic
es
24.2
1
Prim
ary
Educ
atio
n Se
rvic
es in
Gov
ernm
ent
Scho
ols
24.3
1
Seco
ndar
y Ed
ucat
ion
Serv
ices
in G
over
nmen
t Sc
hool
s 20
15
2014
20
15
2014
20
15
2014
$’
000
$’00
0 $’
000
$’00
0 $’
000
$’00
0 C
urre
nt A
sset
s
Cas
h an
d ca
sh e
quiv
alen
ts
----
364,
445
369,
914
27
0,69
8 27
8,21
7 R
ecei
vabl
es
1,19
71,
830
35,9
20
25,0
19
31,9
37
27,7
30
Oth
er fi
nanc
ial a
sset
s --
-- 1,
668
1,33
1
16,9
60
20,8
45
Non
-cur
rent
ass
ets
held
for s
ale
----
--
--
--
--To
tal c
urre
nt a
sset
s 1,
197
1,83
0 40
2,03
3 39
6,26
4
319,
595
326,
792
N
on-c
urre
nt A
sset
s
Rec
eiva
bles
19
227
9 4,
299
2,49
7
3,85
33,
297
Oth
er fi
nanc
ial a
sset
s --
--
--
--
----
Pro
perty
, pla
nt a
nd e
quip
men
t 47
,560
46
,502
11
,597
,333
11
,311
,649
9,
125,
118
8,90
9,22
7 In
tang
ible
ass
ets
----
--
--
--
--To
tal n
on-c
urre
nt a
sset
s 47
,752
46
,781
11
,601
,632
11
,314
,146
9,
128,
971
8,91
2,52
4
TOTA
L A
SSET
S 48
,949
48
,611
12
,003
,665
11
,710
,410
9,
448,
566
9,23
9,31
6
Cur
rent
liab
ilitie
s
Pay
able
s 3,
236
2,29
8 27
4,69
5 27
3,46
0
242,
540
216,
776
Bor
row
ings
--
-- 3,
146
3,00
9
2,90
02,
772
Prov
isio
ns
3,68
83,
087
365,
842
399,
445
32
5,69
4 33
4,89
7 O
ther
----
--
--
--
--To
tal c
urre
nt li
abili
ties
6,92
45,
385
643,
683
675,
914
57
1,13
4 55
4,44
5
Non
-cur
rent
liab
ilitie
s
Bor
row
ings
--
-- 91
,628
94
,774
84
,445
87
,344
Pr
ovis
ions
12
554
12
,410
6,
997
11
,048
5,
866
Oth
er11
112
1,28
5 99
8
1,12
21,
318
Tota
l non
-cur
rent
liab
ilitie
s 13
616
6 10
5,32
3 10
2,76
9
96,6
15
94,5
28
TO
TAL
LIA
BIL
ITIE
S 7,
060
5,55
1 74
9,00
6 77
8,68
3
667,
749
648,
973
N
ET A
SSET
S 41
,889
43
,060
11
,254
,659
10
,931
,727
8,
780,
817
8,59
0,34
3
1 The
pur
pose
s of
eac
h se
rvic
e gr
oup
are
sum
mar
ised
in N
ote
7.
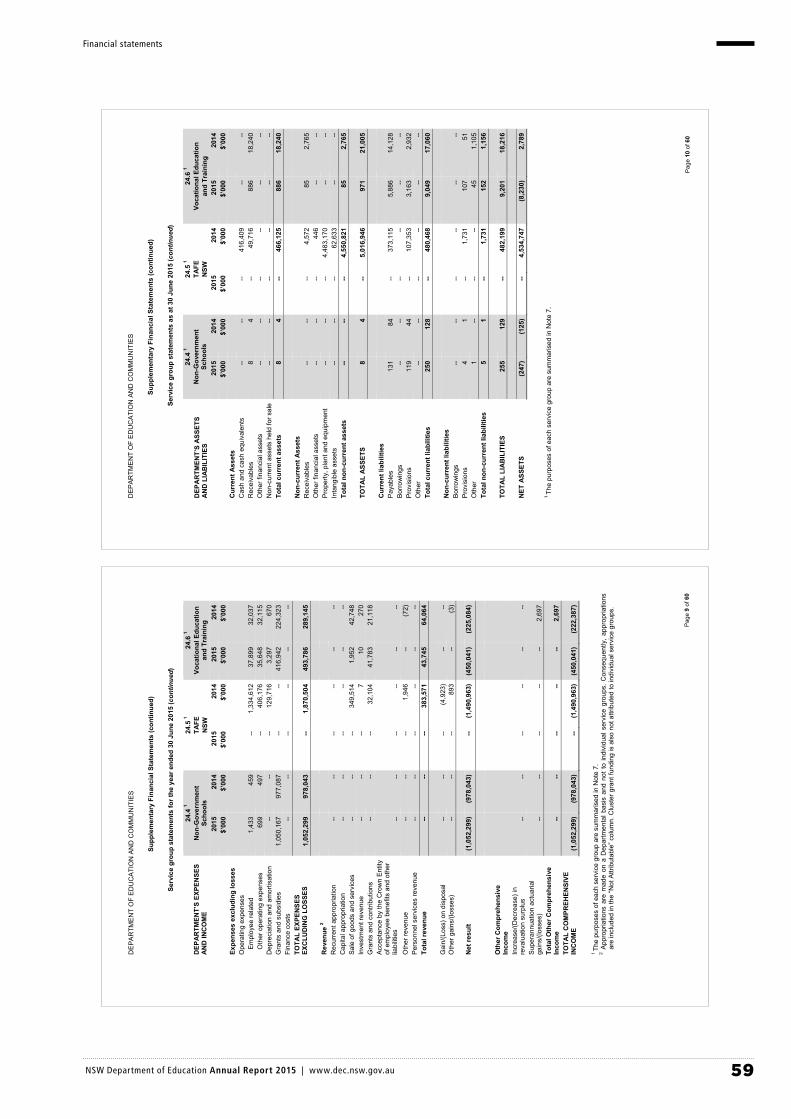
59 NSW Department of Education Annual Report 2015 | www.dec.nsw.gov.au
Financial statements
DE
PA
RTM
EN
T O
F E
DU
CA
TIO
N A
ND
CO
MM
UN
ITIE
S
Supp
lem
enta
ry F
inan
cial
Sta
tem
ents
(con
tinue
d)
Pag
e9
of 6
0
Serv
ice
grou
p st
atem
ents
for t
heye
ar e
nded
30
June
201
5(c
ontin
ued)
DEP
AR
TMEN
T’S
EXPE
NSE
S A
ND
INC
OM
E
24.4
1
Non
-Gov
ernm
ent
Scho
ols
24.5
1
TAFE
N
SW
24.6
1
Voca
tiona
l Edu
catio
n an
d Tr
aini
ng
2015
20
14
2015
20
14
2015
20
14
$’00
0 $’
000
$’00
0 $’
000
$’00
0 $’
000
Expe
nses
exc
ludi
ng lo
sses
O
pera
ting
expe
nses
Em
ploy
ee re
late
d 1,
433
459
-- 1,
334,
612
37,8
99
32,0
37
Oth
er o
pera
ting
expe
nses
69
9 49
7 --
406,
176
35,6
48
32,1
15
Dep
reci
atio
n an
d am
ortis
atio
n --
--
--
129,
716
3,29
7 67
0 G
rant
s an
d su
bsid
ies
1,05
0,16
7 97
7,08
7 --
--
41
6,94
2 22
4,32
3 Fi
nanc
e co
sts
----
--
--
--
--TO
TAL
EXPE
NSE
S EX
CLU
DIN
G L
OSS
ES1,
052,
299
978,
043
--1,
870,
504
493,
786
289,
145
R
even
ue 2
R
ecur
rent
app
ropr
iatio
n
----
--
--
--
--C
apita
l app
ropr
iatio
n
----
--
--
--
--Sa
le o
f goo
ds a
nd s
ervi
ces
----
--
34
9,51
4 1,
952
42,7
48
Inve
stm
ent r
even
ue
----
-- 7
10
270
Gra
nts
and
cont
ribut
ions
--
--
--
32,1
04
41,7
83
21,1
18
Acce
ptan
ce b
y th
e C
row
n En
tity
of e
mpl
oyee
ben
efits
and
oth
er
liabi
litie
s
----
----
----
Oth
er re
venu
e --
--
--
1,94
6 --
(72)
P
erso
nnel
ser
vice
s re
venu
e --
--
--
--
----
Tota
l rev
enue
----
-- 38
3,57
1 43
,745
64
,064
Gai
n/(L
oss)
on
disp
osal
--
-- --
(4,9
23)
----
Oth
er g
ains
/(los
ses)
--
--
--
893
--(3
)
Net
resu
lt(1
,052
,299
)(9
78,0
43)
--(1
,490
,963
) (4
50,0
41)
(225
,084
)
Oth
er C
ompr
ehen
sive
In
com
e
Incr
ease
/(Dec
reas
e) in
re
valu
atio
n su
rplu
s--
--
--
--
----
Supe
rann
uatio
n ac
tuar
ial
gain
s/(lo
sses
)--
--
--
--
--2,
697
Tota
l Oth
er C
ompr
ehen
sive
In
com
e--
-- --
-- --
2,69
7 TO
TAL
CO
MPR
EHEN
SIVE
IN
CO
ME
(1,0
52,2
99)
(978
,043
)--
(1,4
90,9
63)
(450
,041
) (2
22,3
87)
1Th
e pu
rpos
es o
f eac
h se
rvic
e gr
oup
are
sum
mar
ised
in N
ote
7.
2 A
ppro
pria
tions
are
mad
e on
a D
epar
tmen
tal b
asis
and
not
to
indi
vidu
al s
ervi
ce g
roup
s. C
onse
quen
tly,
appr
opria
tions
ar
e in
clud
ed in
the
“Not
Attr
ibut
able
” col
umn.
Clu
ster
gra
nt f u
ndin
g is
als
o no
t attr
ibut
ed to
indi
vidu
al s
ervi
ce g
roup
s.
DE
PA
RTM
EN
T O
F E
DU
CA
TIO
N A
ND
CO
MM
UN
ITIE
S
Supp
lem
enta
ry F
inan
cial
Sta
tem
ents
(con
tinue
d)
Pag
e10
of 6
0
Serv
ice
grou
p st
atem
ents
as a
t 30
June
201
5(c
ontin
ued)
DEP
AR
TMEN
T’S
ASS
ETS
AN
D L
IAB
ILIT
IES
24.4
1
Non
-Gov
ernm
ent
Scho
ols
24.5
1
TAFE
N
SW
24.6
1
Voca
tiona
l Edu
catio
n an
d Tr
aini
ng
2015
20
14
2015
20
14
2015
20
14
$’00
0 $’
000
$’00
0 $’
000
$’00
0 $’
000
Cur
rent
Ass
ets
C
ash
and
cash
equ
ival
ents
--
-- --
416,
409
--
--R
ecei
vabl
es
84
-- 49
,716
88
618
,240
O
ther
fina
ncia
l ass
ets
----
--
--
--
--N
on-c
urre
nt a
sset
s he
ld fo
r sal
e --
--
--
--
----
Tota
l cur
rent
ass
ets
84
-- 46
6,12
5
886
18,2
40
N
on-c
urre
nt A
sset
s
Rec
eiva
bles
--
-- --
4,57
2
852,
765
Oth
er fi
nanc
ial a
sset
s --
-- --
446
--
--P
rope
rty, p
lant
and
equ
ipm
ent
----
-- 4,
483,
170
--
--In
tang
ible
ass
ets
----
-- 62
,633
--
--To
tal n
on-c
urre
nt a
sset
s --
-- --
4,55
0,82
1
852,
765
TO
TAL
ASS
ETS
84
-- 5,
016,
946
97
121
,005
Cur
rent
liab
ilitie
s
Pay
able
s 13
184
--
373,
115
5,
886
14,1
28
Bor
row
ings
--
--
--
--
----
Prov
isio
ns
119
44
-- 10
7,35
3
3,16
32,
932
Oth
er--
--
--
--
----
Tota
l cur
rent
liab
ilitie
s 25
012
8 --
480,
468
9,
049
17,0
60
N
on-c
urre
nt li
abili
ties
B
orro
win
gs
----
--
--
--
--Pr
ovis
ions
4
1 --
1,73
1
107
51O
ther
1--
--
--
45
1,10
5To
tal n
on-c
urre
nt li
abili
ties
51
-- 1,
731
15
21,
156
TO
TAL
LIA
BIL
ITIE
S 25
512
9 --
482,
199
9,
201
18,2
16
N
ET A
SSET
S (2
47)
(125
) --
4,53
4,74
7
(8,2
30)
2,78
9
1Th
e pu
rpos
es o
f eac
h se
rvic
e gr
oup
are
sum
mar
ised
in N
ote
7.
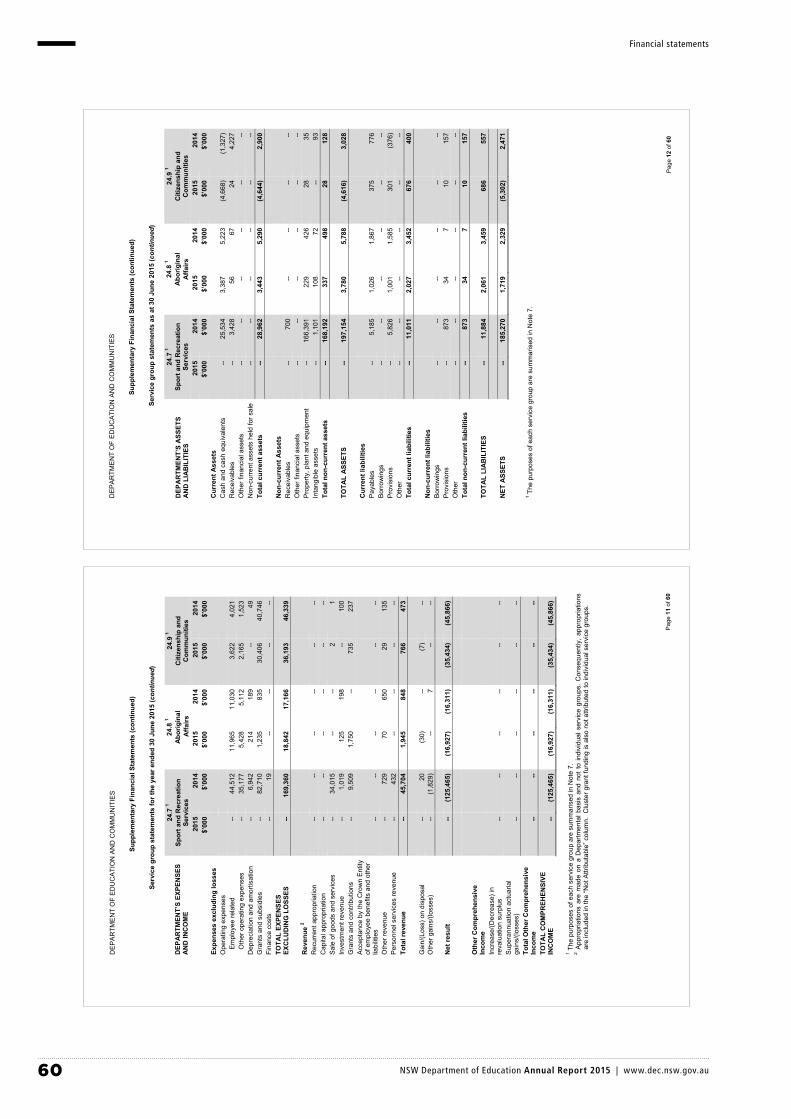
60 NSW Department of Education Annual Report 2015 | www.dec.nsw.gov.au
Financial statements
DE
PA
RTM
EN
T O
F E
DU
CA
TIO
N A
ND
CO
MM
UN
ITIE
S
Supp
lem
enta
ry F
inan
cial
Sta
tem
ents
(con
tinue
d)
Pag
e11
of 6
0
Serv
ice
grou
p st
atem
ents
for t
heye
ar e
nded
30
June
201
5(c
ontin
ued)
DEP
AR
TMEN
T’S
EXPE
NSE
S A
ND
INC
OM
E
24.7
1
Spor
t and
Rec
reat
ion
Serv
ices
24.8
1
Abo
rigin
al
Affa
irs
24.9
1
Citi
zens
hip
and
Com
mun
ities
20
15
2014
20
15
2014
20
15
2014
$’
000
$’00
0 $’
000
$’00
0 $’
000
$’00
0 Ex
pens
es e
xclu
ding
loss
esO
pera
ting
expe
nses
E
mpl
oyee
rela
ted
--44
,512
11
,965
11
,030
3,
622
4,02
1 O
ther
ope
ratin
g ex
pens
es
--35
,177
5,
428
5,11
2 2,
165
1,52
3 D
epre
ciat
ion
and
amor
tisat
ion
--6,
942
214
189
--49
G
rant
s an
d su
bsid
ies
--82
,710
1,
235
835
30,4
06
40,7
46
Fina
nce
cost
s --
19
--
--
----
TOTA
L EX
PEN
SES
EXC
LUD
ING
LO
SSES
--16
9,36
0 18
,842
17
,166
36
,193
46
,339
Rev
enue
2
Rec
urre
nt a
ppro
pria
tion
--
--
--
--
----
Cap
ital a
ppro
pria
tion
--
--
--
--
----
Sale
of g
oods
and
ser
vice
s --
34,0
15
--
--
21
Inve
stm
ent r
even
ue
--1,
019
125
198
--10
0 G
rant
s an
d co
ntrib
utio
ns
--9,
509
1,75
0 --
735
237
Acce
ptan
ce b
y th
e C
row
n En
tity
of e
mpl
oyee
ben
efits
and
oth
er
liabi
litie
s
----
--
--
--
--O
ther
reve
nue
--72
9 70
65
0 29
13
5 P
erso
nnel
ser
vice
s re
venu
e --
432
--
--
----
Tota
l rev
enue
--45
,704
1,
945
848
766
473
Gai
n/(L
oss)
on
disp
osal
--
20
(30)
--
(7)
--O
ther
gai
ns/(l
osse
s)
--(1
,829
) --
7 --
--
Net
resu
lt--
(125
,465
)(1
6,92
7)(1
6,31
1)
(35,
434)
(4
5,86
6)
Oth
er C
ompr
ehen
sive
In
com
eIn
crea
se/(D
ecre
ase)
in
reva
luat
ion
surp
lus
----
--
--
--
--Su
pera
nnua
tion
actu
aria
l ga
ins/
(loss
es)
----
--
--
--
--To
tal O
ther
Com
preh
ensi
ve
Inco
me
----
-- --
----
TOTA
L C
OM
PREH
ENSI
VE
INC
OM
E--
(125
,465
) (1
6,92
7)
(16,
311)
(3
5,43
4)
(45,
866)
1 The
pur
pose
s of
eac
h se
rvic
e gr
oup
are
sum
mar
ised
in N
ote
7.
2 App
ropr
iatio
ns a
re m
ade
on a
Dep
artm
enta
l bas
is a
nd n
ot t
o in
divi
dual
ser
vice
gro
ups.
Con
sequ
ently
, ap
prop
riatio
ns
are
incl
uded
in th
e “N
ot A
ttrib
utab
le” c
olum
n. C
lust
er g
rant
fund
ing
is a
lso
not a
ttrib
uted
to in
divi
dual
ser
vice
gro
ups.
DE
PA
RTM
EN
T O
F E
DU
CA
TIO
N A
ND
CO
MM
UN
ITIE
S
Supp
lem
enta
ry F
inan
cial
Sta
tem
ents
(con
tinue
d)
Pag
e12
of 6
0
Serv
ice
grou
p st
atem
ents
as a
t 30
June
201
5(c
ontin
ued)
DEP
AR
TMEN
T’S
ASS
ETS
AN
D L
IAB
ILIT
IES
24.7
1
Spor
t and
Rec
reat
ion
Serv
ices
24.8
1
Abo
rigin
al
Affa
irs
24.9
1
Citi
zens
hip
and
Com
mun
ities
20
15
2014
20
15
2014
20
15
2014
$’
000
$’00
0 $’
000
$’00
0 $’
000
$’00
0 C
urre
nt A
sset
s
Cas
h an
d ca
sh e
quiv
alen
ts
--25
,534
3,
387
5,22
3
(4,6
68)
(1,3
27)
Rec
eiva
bles
--
3,42
8 56
67
24
4,22
7O
ther
fina
ncia
l ass
ets
----
--
--
--
--N
on-c
urre
nt a
sset
s he
ld fo
r sal
e --
--
--
--
----
Tota
l cur
rent
ass
ets
--28
,962
3,
443
5,29
0
(4,6
44)
2,90
0
Non
-cur
rent
Ass
ets
R
ecei
vabl
es
--70
0 --
--
----
Oth
er fi
nanc
ial a
sset
s --
--
--
--
----
Pro
perty
, pla
nt a
nd e
quip
men
t --
166,
391
229
426
28
35In
tang
ible
ass
ets
--1,
101
108
72
--93
Tota
l non
-cur
rent
ass
ets
--16
8,19
2 33
7 49
8
2812
8
TOTA
L A
SSET
S --
197,
154
3,78
0 5,
788
(4
,616
) 3,
028
C
urre
nt li
abili
ties
P
ayab
les
--5,
185
1,02
6 1,
867
37
577
6B
orro
win
gs
----
--
--
--
--Pr
ovis
ions
--
5,82
6 1,
001
1,58
5
301
(376
) O
ther
----
--
--
--
--To
tal c
urre
nt li
abili
ties
--11
,011
2,
027
3,45
2
676
400
N
on-c
urre
nt li
abili
ties
B
orro
win
gs
----
--
--
--
--Pr
ovis
ions
--
873
34
7
1015
7O
ther
----
--
--
--
--To
tal n
on-c
urre
nt li
abili
ties
--87
3 34
7
10
157
TO
TAL
LIA
BIL
ITIE
S --
11,8
84
2,06
1 3,
459
68
655
7
NET
ASS
ETS
--18
5,27
0 1,
719
2,32
9
(5,3
02)
2,47
1
1 The
pur
pose
s of
eac
h se
rvic
e gr
oup
are
sum
mar
ised
in N
ote
7.

61 NSW Department of Education Annual Report 2015 | www.dec.nsw.gov.au
Financial statements
DE
PA
RTM
EN
T O
F E
DU
CA
TIO
N A
ND
CO
MM
UN
ITIE
S
Supp
lem
enta
ry F
inan
cial
Sta
tem
ents
(con
tinue
d)
Pag
e13
of 6
0
Serv
ice
grou
p st
atem
ents
for t
heye
ar e
nded
30
June
201
5(c
ontin
ued)
DEP
AR
TMEN
T’S
EXPE
NSE
S A
ND
INC
OM
E
24.1
01
Pers
onne
l Se
rvic
es
24.1
11
Clu
ster
Gra
ntFu
ndin
g
Not
Attr
ibut
able
To
tal
2015
20
14
2015
20
14
2015
20
14
2015
20
14
$’00
0 $’
000
$’00
0 $’
000
$’00
0 $’
000
$’00
0 $’
000
Expe
nses
exc
ludi
ng lo
sses
Ope
ratin
g ex
pens
es
Em
ploy
ee re
late
d --
29,6
98
--
--
--22
3 8,
393,
323
9,52
2,02
0 O
ther
ope
ratin
g ex
pens
es
----
--
--
--
-- 1,
954,
619
2,20
6,33
8 D
epre
ciat
ion
and
amor
tisat
ion
----
--
--
--
-- 55
0,29
0 67
4,02
5 G
rant
s an
d su
bsid
ies
----
1,20
5,77
4 15
4,08
6 --
-- 3,
011,
020
1,76
5,55
6 Fi
nanc
e co
sts
----
--
--
--
-- 19
,534
19
,590
TO
TAL
EXPE
NSE
S EX
CLU
DIN
G L
OSS
ES--
29,6
98
1,20
5,77
4 15
4,08
6 --
223
13,9
28,7
86
14,1
87,5
29
Rev
enue
2
R
ecur
rent
app
ropr
iatio
n
----
--
--
12
,113
,950
11
,637
,281
12
,113
,950
11
,637
,281
C
apita
l app
ropr
iatio
n
----
--
--
34
6,62
8 49
3,37
5 34
6,62
8 49
3,37
5 Sa
le o
f goo
ds a
nd s
ervi
ces
----
--
--
--
-- 19
4,78
7 52
0,23
9 In
vest
men
t rev
enue
--
--
--
--
----
27,3
84
38,2
17
Gra
nts
and
cont
ribut
ions
--
--
--
--
----
108,
498
143,
393
Acce
ptan
ce b
y th
e C
row
n E
ntity
of e
mpl
oyee
ben
efits
an
d ot
her l
iabi
litie
s
----
----
539,
153
599,
674
539,
153
599,
674
Oth
er re
venu
e --
--
--
--
----
459,
588
359,
192
Per
sonn
el s
ervi
ces
reve
nue
--28
,374
--
--
--
--
--
28,8
06
Tota
l rev
enue
--28
,374
--
-- 12
,999
,731
12
,730
,330
13
,789
,988
13
,820
,177
G
ain/
(Los
s) o
n di
spos
al
----
--
--
--
-- (6
,206
) (1
1,69
9)
Oth
er g
ains
/(los
ses)
--
--
--
--
----
(496
) 93
2
Net
resu
lt--
(1,3
24)
(1,2
05,7
74)
(154
,086
)12
,999
,731
12
,730
,107
(1
45,5
00)
(378
,119
)
Oth
er C
ompr
ehen
sive
In
com
e
Incr
ease
/(Dec
reas
e) in
re
valu
atio
n su
rplu
s--
----
--57
6,06
1 24
1,24
1 57
6,06
1 24
1,24
1 Su
pera
nnua
tion
actu
aria
l ga
ins/
(loss
es)
----
----
----
--2,
697
Tota
l Oth
er C
ompr
ehen
sive
In
com
e--
----
--57
6,06
1 24
1,24
1 57
6,06
1 24
3,93
8TO
TAL
CO
MPR
EHEN
SIVE
IN
CO
ME
--(1
,324
) (1
,205
,774
) (1
54,0
86)
13,5
75,7
92
12,9
71,3
48
430,
561
(134
,181
)
1Th
e pu
rpos
es o
f eac
h se
rvic
e gr
oup
are
sum
mar
ised
in N
ote
7.
2 App
ropr
iatio
ns a
re m
ade
on a
Dep
artm
enta
l bas
is a
nd n
ot to
indi
vidu
al s
ervi
ce g
roup
s. C
onse
quen
tly, a
ppro
pria
tions
are
incl
uded
in
the
“Not
Attr
ibut
able
” col
umn.
Clu
ster
gra
nt fu
ndin
g is
als
o no
t attr
ibut
ed to
indi
vidu
al s
ervi
ce g
roup
s.
DE
PA
RTM
EN
T O
F E
DU
CA
TIO
N A
ND
CO
MM
UN
ITIE
S
Supp
lem
enta
ry F
inan
cial
Sta
tem
ents
(con
tinue
d)
Pag
e14
of 6
0
Serv
ice
grou
p st
atem
ents
as a
t 30
June
201
5(c
ontin
ued)
DEP
AR
TMEN
T’S
ASS
ETS
AN
D L
IAB
ILIT
IES
24.1
01
Pers
onne
l Se
rvic
es
24.1
11
Clu
ster
Gra
nt
Fund
ing
Not
Attr
ibut
able
To
tal
2015
20
14
2015
20
14
2015
20
14
2015
20
14
$’00
0 $’
000
$’00
0 $’
000
$’00
0 $’
000
$’00
0 $’
000
Cur
rent
Ass
ets
Cas
h an
d ca
sh e
quiv
alen
ts
--2,
043
-- --
141,
401
29,5
48
775,
263
1,12
5,56
1 R
ecei
vabl
es
--1,
617
-- --
----
70,0
28
131,
878
Oth
er fi
nanc
ial a
sset
s --
--
--
--
----
18,6
28
22,1
76
Non
-cur
rent
ass
ets
held
for
sale
----
----
779
1,61
077
91,
610
Tota
l cur
rent
ass
ets
--3,
660
-- --
142,
180
31,1
58
864,
698
1,28
1,22
5
Non
-cur
rent
Ass
ets
Rec
eiva
bles
--
37
-- --
----
8,42
9 14
,147
O
ther
fina
ncia
l ass
ets
----
--
--
--
----
446
Pro
perty
, pla
nt a
nd e
quip
men
t --
--
--
--
251,
764
339,
953
21
,022
,032
25
,257
,353
In
tang
ible
ass
ets
----
--
--
33
0,82
2 36
4,11
4
330,
930
428,
013
Tota
l non
-cur
rent
ass
ets
--37
--
-- 58
2,58
6 70
4,06
7
21,3
61,3
91
25,6
99,9
59
TOTA
L A
SSET
S --
3,69
7 --
-- 72
4,76
6 73
5,22
5
22,2
26,0
89
26,9
81,1
84
C
urre
nt li
abili
ties
Pay
able
s --
895
-- --
----
527,
889
888,
584
Bor
row
ings
--
--
--
--
--14
0,50
0
6,04
6 14
6,28
1 Pr
ovis
ions
--
2,44
7 --
-- 1,
157
7,89
170
0,96
5 86
5,13
1 O
ther
----
--
--
26
,907
18
,112
26
,907
18
,112
To
tal c
urre
nt li
abili
ties
--3,
342
-- --
28,0
64
166,
503
1,
261,
807
1,91
8,10
8
Non
-cur
rent
liab
ilitie
s B
orro
win
gs
----
--
--
14
0,50
0 --
316,
573
182,
118
Prov
isio
ns
--29
0 --
-- 4,
515
5,27
328
,253
21
,300
O
ther
----
--
--
9
22,
473
3,53
5 To
tal n
on-c
urre
nt li
abili
ties
--29
0 --
-- 14
5,02
4 5,
275
34
7,29
9 20
6,95
3
TOTA
L LI
AB
ILIT
IES
--3,
632
-- --
173,
088
171,
778
1,
609,
106
2,12
5,06
1
NET
ASS
ETS
--65
--
-- 55
1,67
8 56
3,47
7 20
,616
,983
24
,856
,123
1Th
e pu
rpos
es o
f eac
h se
rvic
e gr
oup
are
sum
mar
ised
in N
ote
7.
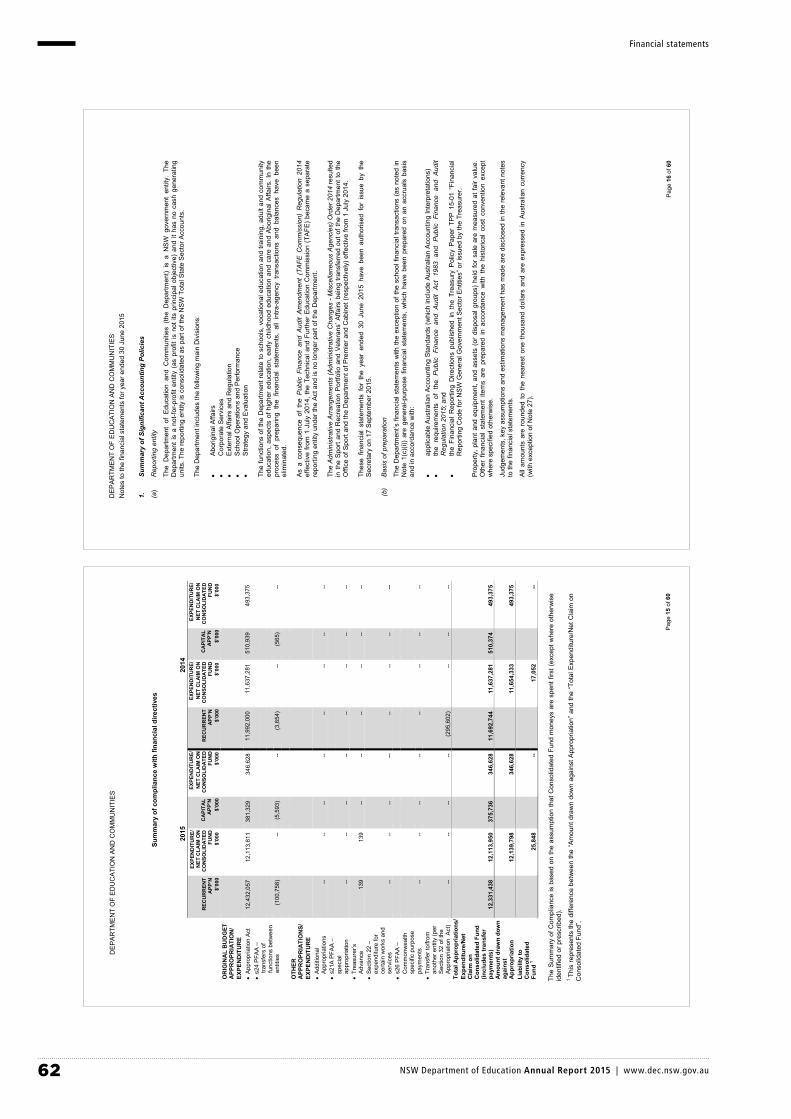
62 NSW Department of Education Annual Report 2015 | www.dec.nsw.gov.au
Financial statements
DE
PA
RTM
EN
T O
F E
DU
CA
TIO
N A
ND
CO
MM
UN
ITIE
S
Pag
e15
of 6
0
Sum
mar
y of
com
plia
nce
with
fina
ncia
l dire
ctiv
es
2015
20
14
REC
UR
REN
TA
PP’N
EXPE
ND
ITU
RE/
NET
CLA
IM O
N
CO
NSO
LID
ATE
D
FUN
D
CA
PITA
L A
PP’N
EXPE
ND
ITU
RE/
NET
CLA
IM O
N
CO
NSO
LID
ATE
D
FUN
DR
ECU
RR
ENT
APP
’N
EXPE
ND
ITU
RE/
NET
CLA
IM O
N
CO
NSO
LID
ATE
D
FUN
D
CA
PITA
L A
PP’N
EXPE
ND
ITU
RE/
NET
CLA
IM O
N
CO
NSO
LID
ATE
D
FUN
D
$’0
00
$’00
0
$’00
0
$
’000
$
’000
$’0
00
$’
000
$’0
00
OR
IGIN
AL
BU
DG
ET
APP
RO
PRIA
TIO
N/
EXPE
ND
ITU
RE
A
ppro
pria
tion
Act
12
,432
,057
12
,113
,811
38
1,32
9 34
6,62
811
,992
,000
11
,637
,281
51
0,93
9 49
3,37
5
s24
PFA
A –
tra
nsfe
rs o
f fu
nctio
ns b
etw
een
en
titie
s (1
00,7
58)
--
(5,5
93)
--(3
,654
) --
(5
65)
--
OTH
ER
APP
RO
PRIA
TIO
NS/
EX
PEN
DIT
UR
E
Add
ition
al
App
ropr
iatio
ns
--
--
--
----
--
--
--
s21A
PFA
A –
sp
ecia
lap
prop
riatio
n --
--
--
--
--
--
--
--
Tr
easu
rer’s
A
dvan
ce13
9 13
9 --
--
--
--
--
--
S
ectio
n 22
–
expe
nditu
re fo
r ce
rtain
wor
ks a
nd
serv
ices
--
--
--
--
--
--
--
--
s26
PFA
A –
C
omm
onw
ealth
sp
ecifi
c pu
rpos
e pa
ymen
ts
--
--
--
----
--
--
--
Tran
sfer
to/fr
om
anot
her e
ntity
(per
S
ectio
n 32
of t
he
App
ropr
iatio
n A
ct)
--
--
--
--(2
95,6
02)
--
--
--
Tota
l App
ropr
iatio
ns/
Expe
nditu
re/N
et
Cla
im o
n C
onso
lidat
ed F
und
(incl
udes
tran
sfer
pa
ymen
ts)
12,3
31,4
38
12,1
13,9
50
375,
736
346,
628
11,6
92,7
44
11,6
37,2
81
510,
374
493,
375
Am
ount
dra
wn
dow
n ag
ains
t A
ppro
pria
tion
12
,139
,798
34
6,62
811
,654
,333
49
3,37
5 Li
abili
ty to
C
onso
lidat
ed
Fund
125
,848
--
17,0
52--
The
Sum
mar
y of
Com
plia
nce
is b
ased
on
the
assu
mpt
ion
that
Con
solid
ated
Fun
d m
oney
s ar
e sp
ent f
irst (
exce
pt w
here
oth
erw
ise
iden
tifie
d or
pre
scrib
ed).
1Th
is re
pres
ents
the
diffe
renc
e be
twee
n th
e “A
mou
nt d
raw
n do
wn
agai
nst A
ppro
pria
tion”
and
the
“Tot
al E
xpen
ditu
re/N
et C
laim
on
Con
solid
ated
Fun
d”.
DE
PA
RTM
EN
T O
F E
DU
CA
TIO
N A
ND
CO
MM
UN
ITIE
SN
otes
to th
e fin
anci
al s
tate
men
ts fo
r yea
r end
ed 3
0 Ju
ne 2
015
Pag
e16
of 6
0
1.
Sum
mar
y of
Sig
nific
ant A
ccou
ntin
g Po
licie
s
(a)
Rep
ortin
g en
tity
The
Dep
artm
ent
of E
duca
tion
and
Com
mun
ities
(th
e D
epar
tmen
t) is
a N
SW
gov
ernm
ent
entit
y. T
he
Dep
artm
ent i
s a
not-f
or-p
rofit
ent
ity (
as p
rofit
is n
ot it
s pr
inci
pal o
bjec
tive)
and
it h
as n
o ca
sh g
ener
atin
g un
its. T
he re
porti
ng e
ntity
is c
onso
lidat
ed a
s pa
rt of
the
NS
W T
otal
Sta
te S
ecto
r Acc
ount
s.
The
Dep
artm
ent i
nclu
des
the
follo
win
g m
ain
Div
isio
ns:
A
borig
inal
Affa
irs
C
orpo
rate
Ser
vice
s
Exte
rnal
Affa
irs a
nd R
egul
atio
n
Sch
ool O
pera
tions
and
Per
form
ance
Stra
tegy
and
Eva
luat
ion
The
func
tions
of t
he D
epar
tmen
t rel
ate
to s
choo
ls, v
ocat
iona
l edu
catio
n an
d tra
inin
g, a
dult
and
com
mun
ity
educ
atio
n, a
spec
ts o
f hig
her
educ
atio
n, e
arly
chi
ldho
od e
duca
tion
and
care
and
Abo
rigin
al A
ffairs
. In
the
proc
ess
of p
repa
ring
the
finan
cial
sta
tem
ents
, al
l in
tra-a
genc
y tra
nsac
tions
and
bal
ance
s ha
ve b
een
elim
inat
ed.
As
a co
nseq
uenc
e of
the
Pub
lic F
inan
ce a
nd A
udit
Am
endm
ent
(TA
FE C
omm
issi
on)
Reg
ulat
ion
2014
effe
ctiv
e fro
m 1
Jul
y 20
14, t
he T
echn
ical
and
Fur
ther
Edu
catio
n C
omm
issi
on (
TAFE
) be
cam
e a
sepa
rate
re
porti
ng e
ntity
und
er th
e A
ct a
nd is
no
long
er p
art o
f the
Dep
artm
ent.
The
Adm
inis
trativ
e A
rran
gem
ents
(Adm
inis
trativ
e C
hang
es -
Mis
cella
neou
s A
genc
ies)
Ord
er 2
014
resu
lted
in th
e S
port
and
Rec
reat
ion
Por
tfolio
and
Vet
eran
s’ A
ffairs
bei
ng tr
ansf
erre
d ou
t of t
he D
epar
tmen
t to
the
Offi
ce o
f Spo
rt an
d th
e D
epar
tmen
t of P
rem
ier a
nd C
abin
et (r
espe
ctiv
ely)
effe
ctiv
e fro
m 1
Jul
y 20
14.
Thes
e fin
anci
al s
tate
men
ts f
or t
he y
ear
ende
d 30
Jun
e 20
15 h
ave
been
aut
horis
ed f
or i
ssue
by
the
Secr
etar
y on
17
Sept
embe
r 201
5.
(b)
Bas
is o
f pre
para
tion
The
Dep
artm
ent’s
fina
ncia
l sta
tem
ents
with
the
exce
ptio
n of
the
scho
ol fi
nanc
ial t
rans
actio
ns (
as n
oted
in
Not
e 1(
c)(i)
) ar
e ge
nera
l-pur
pose
fin
anci
al s
tate
men
ts,
whi
ch h
ave
been
pre
pare
d on
an
accr
uals
bas
is
and
in a
ccor
danc
e w
ith:
ap
plic
able
Aus
tralia
n A
ccou
ntin
g S
tand
ards
(whi
ch in
clud
e A
ustra
lian
Acc
ount
ing
Inte
rpre
tatio
ns)
th
e re
quire
men
ts o
f th
e P
ublic
Fin
ance
and
Aud
it A
ct 1
983
and
Pub
lic F
inan
ce a
nd A
udit
Reg
ulat
ion
2015
; and
the
Fina
ncia
l R
epor
ting
Dire
ctio
ns p
ublis
hed
in t
he T
reas
ury
Pol
icy
Pap
er T
PP 1
5-01
“Fi
nanc
ial
Rep
ortin
g C
ode
for N
SW
Gen
eral
Gov
ernm
ent S
ecto
r Ent
ities
” or i
ssue
d by
the
Trea
sure
r.
Prop
erty
, pla
nt a
nd e
quip
men
t, an
d as
sets
(or
dis
posa
l gro
ups)
hel
d fo
r sa
le a
re m
easu
red
at fa
ir va
lue.
O
ther
fin
anci
al s
tate
men
t ite
ms
are
prep
ared
in
acco
rdan
ce w
ith t
he h
isto
rical
cos
t co
nven
tion
exce
pt
whe
re s
peci
fied
othe
rwis
e.
Judg
emen
ts, k
ey a
ssum
ptio
ns a
nd e
stim
atio
ns m
anag
emen
t has
mad
e ar
e di
sclo
sed
in th
e re
leva
nt n
otes
to
the
finan
cial
sta
tem
ents
.
All a
mou
nts
are
roun
ded
to t
he n
eare
st o
ne t
hous
and
dolla
rs a
nd a
re e
xpre
ssed
in A
ustra
lian
curr
ency
(w
ith e
xcep
tion
of N
ote
27).
63 NSW Department of Education Annual Report 2015 | www.dec.nsw.gov.au
Financial statements
DE
PA
RTM
EN
T O
F E
DU
CA
TIO
N A
ND
CO
MM
UN
ITIE
SN
otes
to th
e fin
anci
al s
tate
men
ts fo
r yea
r end
ed 3
0 Ju
ne 2
015
Pag
e17
of 6
0
1.
Sum
mar
y of
Sig
nific
ant A
ccou
ntin
g Po
licie
s (c
ontin
ued)
(c)
(i)
Scho
ol F
inan
cial
Tra
nsac
tions
Th
e D
epar
tmen
t’s fi
nanc
ial s
tate
men
ts in
clud
e al
l sch
ool f
inan
cial
tran
sact
ions
.
A
s pa
rt of
a m
ajor
bus
ines
s re
form
, the
Dep
artm
ent h
as re
plac
ed it
s m
ain
finan
cial
sys
tem
. Thi
s ha
s be
en
unde
rtake
n in
a s
tage
d pr
oces
s an
d cu
rren
tly t
he D
epar
tmen
t’s c
orpo
rate
are
as a
nd 2
29 s
choo
ls h
ave
been
tran
sitio
ned
to th
e ne
w fi
nanc
e sy
stem
.
The
rem
aini
ng s
choo
ls’ f
inan
cial
tran
sact
ions
are
co n
solid
ated
into
the
Dep
artm
ent’s
fina
ncia
l sta
tem
ents
ba
sed
on t
he s
choo
ls’
Nov
embe
r 20
14 S
tate
men
t of
Rec
eipt
s an
d Pa
ymen
ts a
nd M
ay 2
015
Fina
ncia
l S
tate
men
t R
etur
n, f
ollo
win
g th
e el
imin
atio
n of
all
inte
rnal
tra
nsac
tions
bet
wee
n sc
hool
s an
d ot
her
area
s w
ithin
the
Dep
artm
ent
durin
g th
e fin
anci
al y
ear
and
30 J
une
actu
al c
ash
bala
nces
. Th
e co
nsol
idat
ion
incl
udes
a d
egre
e of
est
imat
ion
and
the
trans
actio
ns r
ecog
nise
d fo
r th
ese
scho
ols
in t
he f
inan
cial
st
atem
ents
are
ther
efor
e im
prec
ise.
(ii)
Trus
t Fun
ds
The
scho
ols
hold
mon
ey in
Tru
st o
n be
half
of th
ird p
artie
s, s
uch
as c
harit
able
don
atio
ns.
For
the
229
scho
ols
that
hav
e be
en in
tegr
ated
into
the
Dep
artm
ent’s
mai
n fin
anci
al s
yste
m, t
he v
alue
of
mon
ies
held
on
beha
lf of
third
par
ties
by th
ese
scho
ols
is d
iscl
osed
as
both
a r
estri
cted
ass
et a
nd a
third
pa
rty li
abili
ty, r
efer
Not
e 15
.
For
the
rem
aini
ng s
choo
ls,
the
bala
nce
of t
hird
par
ty m
onie
s is
not
con
solid
ated
into
the
Dep
artm
ent’s
fin
anci
al s
tate
men
ts.
The
bala
nce
of t
hird
par
ty m
onie
s he
ld b
y th
ese
scho
ols
as a
t 30
Jun
e 20
15 w
as
$45.
9m (2
014:
$42
.5m
).
(d)
Sta
tem
ent o
f com
plia
nce
The
finan
cial
sta
tem
ents
and
not
es c
ompl
y w
ith A
ustra
lian
Acc
ount
ing
Sta
ndar
ds, w
hich
incl
ude
Aus
tralia
n A
ccou
ntin
g In
terp
reta
tions
.
The
accr
ual
basi
s of
acc
ount
ing
and
all
appl
icab
le a
ccou
ntin
g st
anda
rds
have
bee
n ad
opte
d w
ith t
he
exce
ptio
n of
sch
ool f
inan
cial
tran
sact
ions
.
(e)
Bor
row
ing
cost
s
Borro
win
g co
sts
are
reco
gnis
ed a
s ex
pens
es in
the
perio
d in
whi
ch th
ey a
re in
curre
d, in
acc
orda
nce
with
Tr
easu
ry’s
Man
date
to n
ot-fo
r-pro
fit g
ener
al g
over
nmen
t sec
tor a
genc
ies.
(f)
Insu
ranc
e
The
Dep
artm
ent’s
insu
ranc
e ac
tiviti
es a
re c
ondu
cted
thro
ugh
the
NSW
Tre
asur
y M
anag
ed F
und
Sche
me
of s
elf-i
nsur
ance
for
Gov
ernm
ent a
genc
ies.
The
exp
ense
(pr
emiu
m)
is d
eter
min
ed b
y th
e Fu
nd M
anag
er
base
d on
pas
t cla
ims
expe
rienc
e.
(g)
Acc
ount
ing
for t
he G
oods
and
Ser
vice
s Ta
x (G
ST)
Inco
me,
exp
ense
s an
d as
sets
are
reco
gnis
ed n
et o
f the
am
ount
of G
ST,
exc
ept t
hat t
he:
A
mou
nt o
f G
ST
incu
rred
by t
he D
epar
tmen
t as
a p
urch
aser
tha
t is
not
rec
over
able
fro
m t
he
Aus
tralia
n Ta
xatio
n O
ffice
is r
ecog
nise
d as
par
t of
an
asse
t’s c
ost
of a
cqui
sitio
n or
as
part
of a
n ite
m o
f exp
ense
; and
rece
ivab
les
and
paya
bles
are
sta
ted
with
the
amou
nt o
f GS
T in
clud
ed.
Cas
h flo
ws
are
incl
uded
in th
e st
atem
ent o
f cas
h flo
ws
on a
gro
ss b
asis
. How
ever
, the
GS
T co
mpo
nent
s of
cas
h flo
ws
aris
ing
from
inve
stin
g an
d fin
anci
ng a
ctiv
ities
whi
ch a
re r
ecov
erab
le fr
om o
r pa
yabl
e to
, the
A
ustra
lian
Taxa
tion
Offi
ce a
re c
lass
ified
as
oper
atin
g ca
sh fl
ows.
DE
PA
RTM
EN
T O
F E
DU
CA
TIO
N A
ND
CO
MM
UN
ITIE
SN
otes
to th
e fin
anci
al s
tate
men
ts fo
r yea
r end
ed 3
0 Ju
ne 2
015
Pag
e18
of 6
0
1.
Sum
mar
y of
Sig
nific
ant A
ccou
ntin
g Po
licie
s (c
ontin
ued)
(h)
Inco
me
reco
gniti
on
Inco
me
is m
easu
red
at th
e fa
ir va
lue
of th
e co
nsid
erat
ion
or c
ontri
butio
n re
ceiv
ed o
r rec
eiva
ble.
Add
ition
al
com
men
ts re
gard
ing
the
acco
untin
g po
licie
s fo
r the
reco
gniti
on o
f inc
ome
are
disc
usse
d be
low
.
(i)
Parli
amen
tary
app
ropr
iatio
ns a
nd c
ontri
butio
ns
Exce
pt a
s sp
ecifi
ed b
elow
, pa
rliam
enta
ry a
ppro
pria
tions
and
con
tribu
tions
fro
m o
ther
bod
ies
(incl
udin
g gr
ants
and
don
atio
ns)
are
reco
gnis
ed a
s in
com
e w
hen
the
Dep
artm
ent
obta
ins
cont
rol o
ver
the
asse
ts
com
pris
ing
the
appr
opria
tions
/con
tribu
tions
. C
ontro
l ov
er a
ppro
pria
tions
and
con
tribu
tions
is
norm
ally
ob
tain
ed u
pon
the
rece
ipt o
f cas
h.
App
ropr
iatio
ns a
re n
ot re
cogn
ised
as
inco
me
in th
e fo
llow
ing
circ
umst
ance
:
U
nspe
nt a
ppro
pria
tions
are
rec
ogni
sed
as li
abili
ties
rath
er th
an in
com
e, a
s th
e au
thor
ity to
spe
nd
the
mon
ey la
pses
and
the
unsp
ent a
mou
nt m
ust b
e re
paid
to th
e C
onso
lidat
ed F
und.
The
liabi
lity
is d
iscl
osed
in N
ote
19 a
s pa
rt of
‘Cur
rent
Lia
bilit
ies
– O
ther
’. Th
e am
ount
will
be
repa
id a
nd
the
liabi
lity
will
be
extin
guis
hed
next
fina
ncia
l yea
r.
(ii)
Sal
e of
goo
ds
Rev
enue
from
the
sale
of g
oods
is r
ecog
nise
d as
rev
enue
whe
n th
e D
epar
tmen
t tra
nsfe
rs th
e si
gnifi
cant
ris
ks a
nd re
war
ds o
f ow
ners
hip
of th
e as
sets
.
(iii)
Ren
derin
g of
ser
vice
s
Rev
enue
is re
cogn
ised
whe
n th
e se
rvic
e is
pro
vide
d or
by
refe
renc
e to
the
stag
e of
com
plet
ion
(bas
ed o
n la
bour
hou
rs in
curre
d to
dat
e).
(iv)
Inve
stm
ent r
even
ue
Inte
rest
rev
enue
is
reco
gnis
ed u
sing
the
effe
ctiv
e in
tere
st m
etho
d as
set
out
in
AA
SB
139
Fin
anci
al
Inst
rum
ents
: R
ecog
nitio
n an
d M
easu
rem
ent.
Ren
tal
reve
nue
from
ope
ratin
g le
ases
is
reco
gnis
ed i
n ac
cord
ance
with
AA
SB
117
Lea
ses
on a
stra
ight
-line
bas
is o
ver t
he le
ase
term
.
(v)
Gra
nts
and
Con
tribu
tions
Rev
enue
from
gra
nts
and
cont
ribut
ions
are
gen
eral
ly re
cogn
ised
upo
n re
ceip
t.
(vi)
Ass
et s
ales
The
Dep
artm
ent
reco
gnis
es s
ale
of l
and
and
build
ings
upo
n fin
al s
ettle
men
t ex
cept
for
tho
se s
ales
in
volv
ing
term
inst
alm
ent
paym
ents
, w
hich
are
rec
ogni
sed
on e
xcha
nge.
Gai
ns o
r lo
sses
on
disp
osal
of
fixed
ass
ets
are
take
n in
to a
ccou
nt in
det
erm
inin
g th
e ne
t res
ult f
or th
e ye
ar.
(vii)
O
ther
reve
nue
Oth
er re
venu
es a
re re
cogn
ised
as
they
acc
rue.
(i)A
sset
s
(i)
Acq
uisi
tions
of a
sset
s
Ass
ets
acqu
ired
are
initi
ally
reco
gnis
ed a
t cos
t. C
ost i
s th
e am
ount
of c
ash
or c
ash
equi
vale
nts
paid
or t
he
fair
valu
e of
the
othe
r con
side
ratio
n gi
ven
to a
cqui
re th
e as
set a
t the
tim
e of
its
acqu
isiti
on o
r con
stru
ctio
n or
, whe
re a
pplic
able
, the
am
ount
attr
ibut
ed to
that
ass
et w
hen
initi
ally
rec
ogni
sed
in a
ccor
danc
e w
ith th
e re
quire
men
ts o
f oth
er A
ustra
lian
Acc
ount
ing
Sta
ndar
ds.
Ass
ets
acqu
ired
at n
o co
st, o
r fo
r no
min
al c
onsi
dera
tion,
are
initi
ally
rec
ogni
sed
at th
eir
fair
valu
e at
the
date
of a
cqui
sitio
n.
Fair
valu
e is
the
pric
e th
at w
ould
be
rece
ived
if a
n as
set w
as s
old
in a
n or
derly
tran
sact
ion
betw
een
mar
ket
parti
cipa
nts
at m
easu
rem
ent d
ate.
Whe
re p
aym
ent f
or a
n as
set i
s de
ferre
d be
yond
nor
mal
cre
dit t
erm
s, it
s co
st is
the
cash
pric
e eq
uiva
lent
, i.e
. the
def
erre
d pa
ymen
t am
ount
is e
ffect
ivel
y di
scou
nted
ove
r the
per
iod
of c
redi
t.
64 NSW Department of Education Annual Report 2015 | www.dec.nsw.gov.au
Financial statements
DE
PA
RTM
EN
T O
F E
DU
CA
TIO
N A
ND
CO
MM
UN
ITIE
SN
otes
to th
e fin
anci
al s
tate
men
ts fo
r yea
r end
ed 3
0 Ju
ne 2
015
Pag
e19
of 6
0
1.
Sum
mar
y of
Sig
nific
ant A
ccou
ntin
g Po
licie
s (c
ontin
ued)
(i)
Ass
ets
(con
tinue
d)
(ii)
Cap
italis
atio
n th
resh
olds
Prop
erty
, pla
nt a
nd e
quip
men
t cos
ting
$10,
000
and
abov
e in
divi
dual
ly (o
r for
min
g pa
rt of
a n
etw
ork
cost
ing
mor
e th
an $
10,0
00)
are
capi
talis
ed.
The
thre
shol
d fo
r in
tang
ible
s is
$50
,000
. C
apita
lisat
ion
thre
shol
ds
rem
ain
unch
ange
d fro
m th
e pr
ior y
ear.
(iii)
Rev
alua
tion
of p
rope
rty, p
lant
and
equ
ipm
ent
Phy
sica
l non
-cur
rent
ass
ets
are
valu
ed in
acc
orda
n ce
with
the
NSW
Tre
asur
y “V
alua
tion
of P
hysi
cal N
on-
Cur
rent
Ass
ets
at F
air
Valu
e” P
olic
y an
d G
uide
lines
Pap
er (
TPP
14-0
1).
This
pol
icy
adop
ts f
air
valu
e in
ac
cord
ance
with
AA
SB
13
Fair
Val
ue M
easu
rem
ent,
AA
SB
116
Pro
perty
, Pla
nt a
nd E
quip
men
t and
AA
SB
140
Inve
stm
ent P
rope
rty.
Pro
perty
, pl
ant
and
equi
pmen
t is
mea
sure
d at
the
hig
hest
and
bes
t us
e by
mar
ket
parti
cipa
nts
that
is
phys
ical
ly p
ossi
ble,
lega
lly p
erm
issi
ble
and
finan
cial
ly fe
asib
le. T
he h
ighe
st a
nd b
est u
se m
ust b
e av
aila
ble
at a
per
iod
that
is
not
rem
ote
and
take
int
o ac
coun
t th
e ch
arac
teris
tics
of t
he a
sset
bei
ng m
easu
red,
in
clud
ing
any
soci
o-po
litic
al r
estri
ctio
ns im
pose
d by
gov
ernm
ent.
In m
ost c
ases
, afte
r ta
king
into
acc
ount
th
ese
cons
ider
atio
ns,
the
high
est
and
best
use
is t
he e
xist
ing
use.
In
limite
d ci
rcum
stan
ces,
the
hig
hest
an
d be
st u
se m
ay b
e a
feas
ible
alte
rnat
ive
use,
whe
re th
ere
are
no r
estri
ctio
ns o
n us
e or
whe
re th
ere
is
feas
ible
hig
her r
estri
cted
alte
rnat
ive
use.
Fair
valu
e of
pro
perty
, pla
nt a
nd e
quip
men
t is
base
d on
a m
arke
t par
ticip
ants
’ per
spec
tive,
usi
ng v
alua
tion
tech
niqu
es (m
arke
t app
roac
h, c
ost a
ppro
ach,
inco
me
appr
oach
) tha
t max
imis
e re
leva
nt o
bser
vabl
e in
puts
an
d m
inim
ise
unob
serv
able
inpu
ts. R
efer
Not
e 11
and
Not
e 14
for f
urth
er in
form
atio
n re
gard
ing
fair
valu
e.
The
Dep
artm
ent
reva
lues
eac
h cl
ass
of p
rope
rty,
plan
t an
d eq
uipm
ent
at le
ast
ever
y fiv
e ye
ars
or w
ith
suffi
cien
t reg
ular
ity to
ens
ure
that
the
carr
ying
am
ount
of e
ach
asse
t in
the
clas
s do
es n
ot d
iffer
mat
eria
lly
from
its
fair
valu
e at
rep
ortin
g da
te. R
eval
uatio
n of
land
was
com
plet
ed a
t 31
Mar
ch 2
015;
rev
alua
tion
of
build
ings
was
com
plet
ed a
t 31
Dec
embe
r 201
2, a
nd re
valu
atio
n of
resi
dent
ial p
rope
rties
was
com
plet
ed a
t 30
Jun
e 20
12. T
hese
reva
luat
ions
wer
e co
nduc
ted
usin
g ex
tern
al in
depe
nden
t ass
essm
ents
.
Non
-spe
cial
ised
ass
ets
with
sho
rt us
eful
liv
es a
re m
easu
red
at d
epre
ciat
ed h
isto
rical
cos
t, as
an
appr
oxim
atio
n fo
r fa
ir va
lue.
The
Dep
artm
ent
has
asse
ssed
tha
t an
y di
ffere
nce
betw
een
fair
valu
e an
d de
prec
iate
d hi
stor
ical
cos
t is
unlik
ely
to b
e m
ater
ial.
Whe
n re
valu
ing
non-
curr
ent
asse
ts
usin
g th
e co
st
appr
oach
, th
e gr
oss
amou
nt
and
the
rela
ted
accu
mul
ated
dep
reci
atio
n ar
e se
para
tely
rest
ated
.
For o
ther
ass
ets
valu
ed u
sing
oth
er v
alua
tion
tech
niqu
es, a
ny b
alan
ces
of a
ccum
ulat
ed d
epre
ciat
ion
at th
e re
valu
atio
n da
te in
resp
ect o
f tho
se a
sset
s ar
e cr
edite
d to
the
asse
t acc
ount
s to
whi
ch th
ey re
late
. The
net
as
set a
ccou
nts
are
then
incr
ease
d or
dec
reas
ed b
y th
e re
valu
atio
n in
crem
ents
or d
ecre
men
ts.
Rev
alua
tion
incr
emen
ts a
re c
redi
ted
dire
ctly
to
reva
luat
ion
surp
lus,
exc
ept
that
, to
the
ext
ent
that
an
incr
emen
t rev
erse
s a
reva
luat
ion
decr
emen
t in
resp
ect o
f tha
t cla
ss o
f ass
et p
revi
ousl
y re
cogn
ised
as
an
expe
nse
in th
e ne
t res
ult,
the
incr
emen
t is
reco
gnis
ed im
med
iate
ly a
s re
venu
e in
the
net r
esul
t.
Rev
alua
tion
decr
emen
ts a
re r
ecog
nise
d im
med
iate
ly a
s ex
pens
es i
n th
e ne
t re
sult,
exc
ept
that
, to
the
ex
tent
that
a c
redi
t bal
ance
exi
sts
in th
e re
valu
atio
n su
rplu
s in
res
pect
of t
he s
ame
clas
s of
ass
ets,
they
ar
e de
bite
d di
rect
ly to
the
reva
luat
ion
surp
lus.
As
a no
t-for
-pro
fit e
ntity
, rev
alua
tion
incr
emen
ts a
nd d
ecre
men
ts a
re o
ffset
aga
inst
one
ano
ther
with
in a
cl
ass
of n
on-c
urre
nt a
sset
s, b
ut n
ot o
ther
wis
e.
Whe
re a
n as
set t
hat h
as p
revi
ousl
y be
en re
valu
ed is
dis
pose
d of
, any
bal
ance
rem
aini
ng in
the
reva
luat
ion
surp
lus
in re
spec
t of t
hat a
sset
is tr
ansf
erre
d to
acc
umul
ated
fund
s.
DE
PA
RTM
EN
T O
F E
DU
CA
TIO
N A
ND
CO
MM
UN
ITIE
SN
otes
to th
e fin
anci
al s
tate
men
ts fo
r yea
r end
ed 3
0 Ju
ne 2
015
Pag
e20
of 6
0
1.
Sum
mar
y of
Sig
nific
ant A
ccou
ntin
g Po
licie
s (c
ontin
ued)
(i)
Ass
ets
(con
tinue
d)
(iii)
Rev
alua
tion
of p
rope
rty, p
lant
and
equ
ipm
ent (
cont
inue
d)
2013
reva
luat
ion
of b
uild
ings
Gen
eral
ly, s
choo
l bui
ldin
gs a
re d
esig
ned
for a
spe
cific
lim
ited
purp
ose.
In m
ost c
ases
thes
e bu
ildin
gs a
nd
the
land
on
whi
ch th
ey s
it ha
ve n
o fe
asib
le a
ltern
ativ
e us
e. In
acc
orda
nce
with
TP
P 1
4-01
the
Dep
artm
ent
dete
rmin
es th
e fa
ir va
lue
of it
s bu
ildin
g as
sets
usi
ng th
e de
prec
iate
d re
plac
emen
t cos
t met
hod,
as
ther
e is
no
mar
ket-b
ased
evi
denc
e of
fair
valu
e.
The
2013
rev
alua
tion
of b
uild
ings
was
con
duct
ed a
s at
31
Dec
embe
r 20
12 u
sing
a m
ass
valu
atio
n m
etho
dolo
gy a
nd c
ost a
ppro
ach,
con
sist
ent w
ith th
e re
quire
men
ts o
f Aus
tralia
n Ac
coun
ting
Stan
dard
s an
d N
SW T
reas
ury
requ
irem
ents
. U
nder
thi
s m
etho
dolo
gy,
the
repl
acem
ent
cost
of
each
bui
ldin
g w
as
calc
ulat
ed b
y de
term
inin
g th
e lo
wes
t co
st i
n cu
rrent
pric
es,
to r
epla
ce t
he b
uild
ing
with
a m
oder
n eq
uiva
lent
to c
urre
nt fa
cilit
y st
anda
rds,
hav
ing
rega
rd to
the
build
ing
cons
truct
ion
type
and
cha
ract
eris
tics,
th
e ar
ea o
f the
stru
ctur
e, th
e sp
ecifi
c fu
nctio
nalit
y of
the
build
ing’
s ro
oms
and
the
loca
lity
of th
e pr
oper
ty.
The
depr
ecia
ted
repl
acem
ent c
ost m
etho
d ap
plie
d as
sign
s va
lues
to th
e sp
ecifi
c co
mpo
nent
s of
bui
ldin
g sh
ell,
fit-o
ut,
furn
iture
, an
d si
te s
ervi
ces
for
each
Sch
ool b
uild
ing
and
land
scap
ing
for
each
site
. Th
ese
com
pone
nts
are
then
dep
reci
ated
sep
arat
ely
in a
ccor
danc
e w
ith th
e de
prec
iatio
n po
licy
and
usef
ul li
ves
of
asse
ts. T
he b
uild
ing
shel
l com
pone
nts
of b
uild
ings
of
Stat
e H
erita
ge s
igni
fican
ce a
re n
ot d
epre
ciat
ed,
in
acco
rdan
ce w
ith N
SW T
reas
ury
polic
y.
The
Dep
artm
ent e
ngag
ed q
ualif
ied
quan
tity
surv
eyor
s fro
m th
e O
ffice
of F
inan
ce a
nd S
ervi
ces
to p
rovi
de
repl
acem
ent
cost
det
ails
for
sch
ool
build
ings
at
31 D
ecem
ber
2012
. Te
nder
doc
umen
ts,
cons
truct
ion
cont
ract
s an
d in
dust
ry d
ata
wer
e us
ed t
o ca
lcul
ate
the
repl
acem
ent
cost
rat
es.
In a
dditi
on,
a sa
mpl
e of
re
plac
emen
t co
st r
ates
wer
e te
sted
aga
inst
rep
lace
men
t co
st r
ates
pro
vide
d by
ind
epen
dent
ext
erna
l qu
antit
y su
rvey
ors.
The
Dep
artm
ent
eval
uate
d th
e co
mpe
tenc
ies,
cap
abili
ties
and
obje
ctiv
ity o
f th
e va
luat
ion
serv
ice
prov
ider
s pr
ior t
o en
gage
men
t.
A p
roje
ct t
eam
was
for
med
to
cond
uct
the
2013
rev
alua
tion
of b
uild
ings
. Th
e te
am w
as o
vers
een
by a
st
eerin
g co
mm
ittee
com
pris
ing
of s
enio
r rep
rese
ntat
ives
of t
he D
epar
tmen
t, N
SW
Tre
asur
y an
d th
e O
ffice
of
Fin
ance
and
Ser
vice
s. T
he s
teer
ing
com
mitt
ee w
as r
espo
nsib
le fo
r ov
ersi
ght o
f all
deci
sion
s re
late
d to
th
e bu
ildin
g re
valu
atio
n. A
dditi
onal
ove
rsig
ht w
as p
rovi
ded
by th
e D
epar
tmen
t’s A
udit
and
Ris
k C
omm
ittee
.
Asse
ssm
ent o
f the
bui
ldin
g fa
ir va
lue
mov
emen
ts b
etw
een
Dec
embe
r 201
2 an
d Ju
ne 2
015
was
con
duct
ed
by t
he D
epar
tmen
t an
d co
nclu
ded
that
the
re h
as b
een
no m
ater
ial
mov
emen
t in
val
ues
sinc
e th
e re
valu
atio
n da
te,
as it
was
less
tha
n a
10%
incr
ease
in v
alue
. Th
e as
sess
men
t pe
rform
ed r
elie
d on
the
B
uild
ing
Pric
e In
dex
(BP
I), w
hich
was
pro
vide
d by
NS
W P
ublic
Wor
ks i
n th
e O
ffice
of
Fina
nce
and
Ser
vice
s.
2015
reva
luat
ion
of la
nd
Qua
lifie
d va
luer
s w
ere
enga
ged
thro
ugh
the
Offi
ce o
f Fi
nanc
e an
d S
ervi
ces
to u
nder
take
val
uatio
ns f
or
Scho
ol l
and
and
surp
lus
site
s as
at
31 M
arch
201
5 co
nsis
tent
with
the
req
uire
men
ts o
f A
ustra
lian
Acco
untin
g St
anda
rds
and
NS
W T
reas
ury
requ
irem
ents
.
The
requ
irem
ent f
or p
rovi
sion
of s
ervi
ce d
eliv
ery
by S
choo
ls im
pose
s re
stric
tions
on
the
use
of la
nd a
nd it
is
con
side
red
to h
ave
no fe
asib
le a
ltern
ativ
e us
e.
Ther
efor
e, S
choo
l lan
d ha
s be
en v
alue
d at
fai
r va
lue
base
d on
exi
stin
g us
e. T
he v
alue
rs u
sed
mar
ket
evid
ence
to d
eter
min
e th
e hi
ghes
t and
bes
t use
land
val
ues
and
appl
ied
a di
scou
nt fa
ctor
ave
ragi
ng 1
9%
to t
hese
val
ues,
to
adju
st f
or t
he r
estri
cted
use
of
the
land
. Th
e va
luat
ion
estim
ates
of
land
val
ues
are
supp
orte
d by
mar
ket b
ased
sal
es e
vide
nce.
Whe
n S
choo
l lan
d be
com
es s
urpl
us it
is th
en a
vaila
ble
for f
easi
ble
alte
rnat
ive
uses
. In
this
cas
e th
e si
tes
are
valu
ed a
t fai
r val
ue b
ased
on
the
high
est a
nd b
est u
se.
A p
roje
ct te
am w
as fo
rmed
to c
ondu
ct th
e 20
15 re
valu
atio
n of
land
. The
team
was
ove
rsee
n by
a s
teer
ing
com
mitt
ee a
nd p
roje
ct c
ontro
l gro
up c
ompr
isin
g of
sen
ior r
epre
sent
ativ
es o
f the
Dep
artm
ent.
The
stee
ring
com
mitt
ee a
nd p
roje
ct c
ontro
l gr
oup
was
res
pons
ible
for
ove
rsig
ht o
f al
l de
cisi
ons
rela
ted
to t
he l
and
reva
luat
ion.
Add
ition
al o
vers
ight
was
pro
vide
d by
the
Dep
artm
ent’s
Aud
it an
d R
isk
Com
mitt
ee.
Asse
ssm
ent o
f the
land
fair
valu
e m
ovem
ents
bet
wee
n M
arch
201
5 an
d Ju
ne 2
015
was
con
duct
ed b
y an
in
depe
nden
t val
uer
who
con
clud
ed th
at th
ere
has
been
no
mat
eria
l mov
emen
t in
valu
es s
ince
reva
luat
ion
date
. The
ass
essm
ent p
erfo
rmed
rel
ied
on th
e va
luer
’s a
naly
sis
of m
arke
t bas
ed m
ovem
ents
, whi
ch w
as
prov
ided
by
Land
and
Pro
perty
Info
rmat
ion
in th
e O
ffice
of F
inan
ce a
nd S
ervi
ces.
65 NSW Department of Education Annual Report 2015 | www.dec.nsw.gov.au
Financial statements
DE
PA
RTM
EN
T O
F E
DU
CA
TIO
N A
ND
CO
MM
UN
ITIE
SN
otes
to th
e fin
anci
al s
tate
men
ts fo
r yea
r end
ed 3
0 Ju
ne 2
015
Pag
e21
of 6
0
1.
Sum
mar
y of
Sig
nific
ant A
ccou
ntin
g Po
licie
s (c
ontin
ued)
(i)
Ass
ets
(con
tinue
d)
(iv)
Impa
irmen
t of p
rope
rty, p
lant
and
equ
ipm
ent
As
a no
t-for
-pro
fit e
ntity
with
no
cash
gen
erat
ing
units
, im
pairm
ent u
nder
AA
SB
136
Impa
irmen
t of A
sset
sis
unl
ikel
y to
aris
e. A
s pr
oper
ty,
plan
t an
d eq
uipm
ent
is c
arrie
d at
fai
r va
lue
or a
n am
ount
tha
t ap
prox
imat
es fa
ir va
lue,
impa
irmen
t can
onl
y ar
ise
in th
e ra
re c
ircum
stan
ces
whe
re th
e co
sts
of d
ispo
sal
are
mat
eria
l. S
peci
fical
ly, i
mpa
irmen
t is
unlik
ely
for n
ot-fo
r-pro
fit e
ntiti
es g
iven
that
AA
SB
136
mod
ifies
the
reco
vera
ble
amou
nt te
st fo
r no
n-ca
sh g
ener
atin
g as
sets
of n
ot-fo
r-pro
fit e
ntiti
es to
the
high
er o
f fai
r va
lue
less
cos
ts o
f dis
posa
l and
dep
reci
ated
rep
lace
men
t cos
t, w
here
dep
reci
ated
rep
lace
men
t cos
t is
also
fair
valu
e.
(v)
Dep
reci
atio
n of
pro
perty
, pla
nt a
nd e
quip
men
t
Exc
ept f
or c
erta
in h
erita
ge a
sset
s, d
epre
ciat
ion
is p
r ovi
ded
for
on a
stra
ight
-line
bas
is fo
r al
l dep
reci
able
as
sets
so
as to
writ
e of
f the
dep
reci
able
am
ount
of e
ach
asse
t as
it is
con
sum
ed o
ver i
ts u
sefu
l life
to th
e D
epar
tmen
t.
A
ll m
ater
ial i
dent
ifiab
le c
ompo
nent
s of
ass
ets
are
depr
ecia
ted
sepa
rate
ly o
ver t
heir
usef
ul li
ves.
Land
is
not
a de
prec
iabl
e as
set.
Cer
tain
her
itage
ass
ets
incl
udin
g he
ritag
e bu
ildin
gs m
ay n
ot h
ave
a lim
ited
usef
ul li
fe b
ecau
se a
ppro
pria
te p
rese
rvat
ion
polic
ies
are
adop
ted.
Suc
h as
sets
are
not
sub
ject
to
depr
ecia
tion.
The
dec
isio
n no
t to
reco
gnis
e de
prec
iatio
n fo
r the
se a
sset
s is
revi
ewed
ann
ually
.
The
expe
cted
use
ful l
ife r
ange
s fo
r as
sets
rem
aine
d un
chan
ged
from
201
3-14
and
are
list
ed b
elow
. The
ac
tual
use
ful l
ife m
ay b
e gr
eate
r tha
n th
e ex
pect
ed u
sefu
l life
for b
uild
ing
asse
ts. T
he D
epar
tmen
t ado
pts
a m
inim
um re
mai
ning
use
ful l
ife o
f 10
year
s fo
r bui
ldin
g as
sets
that
hav
e be
en re
valu
ed.
The
Pub
lic F
inan
ce a
nd A
udit
Am
endm
ent
(TA
FE C
omm
issi
on)
Reg
ulat
ion
2014
too
k ef
fect
fro
m 1
Jul
y 20
14 w
hich
led
to s
epar
atio
n of
TA
FE fr
om th
e D
epar
tmen
t. Th
e co
mpa
rativ
e ex
pect
ed u
sefu
l life
ran
ge
liste
d be
low
incl
uded
ass
ets
unde
r th
e co
ntro
l of
TAFE
for
the
fin
anci
al y
ear
ende
d 30
Jun
e 20
14.
This
do
es n
ot h
ave
any
finan
cial
impa
cts
on th
e D
epar
tmen
t’s fi
nanc
ial s
tate
men
ts fo
r the
yea
r end
ed 3
0 Ju
ne
2015
.
2015
20
14
Ass
et
Expe
cted
Use
ful L
ife R
ange
Ex
pect
ed U
sefu
l Life
Ran
ge
Build
ings
20
to 1
05 y
ears
20
to 1
05 y
ears
Leas
ehol
d Im
prov
emen
ts
Term
of t
he le
ase
Term
of t
he le
ase
Her
itage
Bui
ldin
gs
Inde
finite
In
defin
ite
Plan
t and
Equ
ipm
ent
3 to
15
year
s 3
to 4
3 ye
ars
(vi)
Maj
or in
spec
tion
cost
s
Whe
n ea
ch m
ajor
insp
ectio
n is
per
form
ed,
the
labo
ur c
ost
of p
erfo
rmin
g m
ajor
insp
ectio
ns f
or f
aults
is
reco
gnis
ed in
the
car
ryin
g am
ount
of
an a
sset
as
a re
plac
emen
t of
a p
art,
if th
e re
cogn
ition
crit
eria
are
sa
tisfie
d.
(vii)
R
esto
ratio
n co
sts
The
estim
ated
cos
t of d
ism
antli
ng a
nd re
mov
ing
an a
sset
and
rest
orin
g th
e si
te is
incl
uded
in th
e co
st o
f an
ass
et, t
o th
e ex
tent
it is
reco
gnis
ed a
s a
liabi
lity.
(viii)
M
aint
enan
ce
Day
-to-d
ay s
ervi
cing
cos
ts o
r mai
nten
ance
are
cha
rged
as
expe
nses
as
incu
rred,
exc
ept w
here
they
rela
te
to t
he r
epla
cem
ent
of a
par
t or
com
pone
nt o
f an
ass
et,
in w
hich
cas
e th
e co
sts
are
capi
talis
ed a
nd
depr
ecia
ted.
(ix)
Leas
ed a
sset
s
A d
istin
ctio
n is
mad
e be
twee
n fin
ance
lea
ses
whi
ch e
ffect
ivel
y tra
nsfe
r fro
m t
he l
esso
r to
the
les
see
subs
tant
ially
all
the
risks
and
rew
ards
inci
dent
al to
ow
ners
hip
of th
e le
ased
ass
ets,
and
ope
ratin
g le
ases
un
der w
hich
the
less
or d
oes
not t
rans
fer s
ubst
antia
lly a
ll th
e ris
ks a
nd re
war
ds.
Whe
re a
non
-cur
rent
ass
et is
acq
uire
d by
mea
ns o
f a fi
nanc
e le
ase,
at t
he c
omm
ence
men
t of t
he le
ase
term
, th
e as
set
is r
ecog
nise
d at
its
fai
r va
lue
or,
if lo
wer
, th
e pr
esen
t va
lue
of t
he m
inim
um l
ease
pa
ymen
ts,
at t
he in
cept
ion
of t
he le
ase.
The
cor
resp
ondi
ng li
abili
ty is
est
ablis
hed
at t
he s
ame
amou
nt.
Leas
e pa
ymen
ts
are
allo
cate
d be
twee
n th
e pr
inci
pal
com
pone
nt
and
the
inte
rest
ex
pens
e.
DE
PA
RTM
EN
T O
F E
DU
CA
TIO
N A
ND
CO
MM
UN
ITIE
SN
otes
to th
e fin
anci
al s
tate
men
ts fo
r yea
r end
ed 3
0 Ju
ne 2
015
Pag
e22
of 6
0
1.
Sum
mar
y of
Sig
nific
ant A
ccou
ntin
g Po
licie
s (c
ontin
ued)
(i)A
sset
s (c
ontin
ued)
(ix)
Leas
ed a
sset
s (c
ontin
ued)
Ope
ratin
g le
ase
paym
ents
are
reco
gnis
ed a
s an
exp
ense
on
a st
raig
ht li
ne b
asis
ove
r the
leas
e te
rm.
The
Dep
artm
ent h
as e
nter
ed in
to tw
o P
ublic
Priv
ate
Par
tner
ship
pro
ject
s fo
r co
nstru
ctio
n, d
esig
n, fi
nanc
e an
d m
aint
enan
ce o
f 20
sch
ools
. Th
e re
late
d m
onth
ly s
ervi
ce f
ees,
whi
ch c
ompr
ise
liabi
lity
redu
ctio
n,
finan
cing
and
ope
ratin
g co
sts,
are
acc
ount
ed fo
r con
sist
ent w
ith th
e N
SW T
reas
ury
Pol
icy
Pap
er T
PP 0
6-8
“Acc
ount
ing
for P
rivat
ely
Fina
nced
Pro
ject
s” fo
r the
se ty
pes
of a
rrang
emen
ts.
(x)
Inta
ngib
le a
sset
s
The
Dep
artm
ent r
ecog
nise
s in
tang
ible
ass
ets
only
if it
is p
roba
ble
that
futu
re e
cono
mic
ben
efits
will
flow
to
the
Dep
artm
ent
and
the
cost
of
the
asse
t ca
n be
mea
sure
d re
liabl
y. I
ntan
gibl
e as
sets
are
mea
sure
d in
itial
ly a
t cos
t. W
here
an
asse
t is
acqu
ired
at n
o or
nom
inal
cos
t, th
e co
st is
its
fair
valu
e as
at t
he d
ate
of
acqu
isiti
on.
All
rese
arch
cos
ts a
re e
xpen
sed.
Dev
elop
men
t cos
ts a
re o
nly
capi
talis
ed w
hen
certa
in c
riter
ia a
re m
et.
The
usef
ul li
ves
of in
tang
ible
ass
ets
are
asse
ssed
to b
e fin
ite.
Inta
ngib
le a
sset
s ar
e su
bseq
uent
ly m
easu
red
at fa
ir va
lue
only
if th
ere
is a
n ac
tive
mar
ket.
As
ther
e is
no
activ
e m
arke
t for
the
Dep
artm
ent’s
inta
ngib
le a
sset
s, th
e as
sets
are
car
ried
at c
ost l
ess
any
accu
mul
ated
am
ortis
atio
n an
d im
pairm
ent l
osse
s.
The
Dep
artm
ent’s
inta
ngib
le a
sset
s ar
e am
ortis
ed u
sing
the
stra
ight
-line
met
hod
over
a p
erio
d of
thre
e to
15
yea
rs.
Inta
ngib
le a
sset
s ar
e te
sted
for
im
pairm
ent
whe
re a
n in
dica
tor
of i
mpa
irmen
t ex
ists
. If
the
reco
vera
ble
amou
nt is
less
than
its
carr
ying
am
ount
, the
car
ryin
g am
ount
is r
educ
ed to
rec
over
able
am
ount
and
the
redu
ctio
n is
reco
gnis
ed a
s an
impa
irmen
t los
s.
(xi)
Loan
s an
d re
ceiv
able
s
Loan
s an
d re
ceiv
able
s ar
e no
n-de
rivat
ive
finan
cial
ass
e ts
with
fixe
d or
det
erm
inab
le p
aym
ents
that
are
not
qu
oted
in a
n ac
tive
mar
ket.
Thes
e fin
anci
al a
sset
s ar
e re
cogn
ised
initi
ally
at f
air
valu
e, u
sual
ly b
ased
on
the
trans
actio
n co
st o
r fa
ce v
alue
. S
ubse
quen
t m
easu
rem
ent
is a
t am
ortis
ed c
ost
usin
g th
e ef
fect
ive
inte
rest
met
hod,
less
an
allo
wan
ce fo
r an
y im
pairm
ent o
f rec
eiva
bles
. Any
cha
nges
are
rec
ogni
sed
in th
e ne
t res
ult f
or th
e ye
ar w
hen
impa
ired,
der
ecog
nise
d or
thro
ugh
the
amor
tisat
ion
proc
ess.
Sho
rt-te
rm re
ceiv
able
s w
ith n
o st
ated
inte
rest
rate
are
mea
sure
d at
the
orig
inal
invo
ice
amou
nt w
here
the
effe
ct o
f dis
coun
ting
is im
mat
eria
l.
(xii)
In
vent
orie
s
The
Dep
artm
ent
hold
s in
vent
ory
of t
each
ing
and
reso
urce
mat
eria
ls t
hat
are
cons
umed
dire
ctly
in
the
deliv
ery
of e
duca
tiona
l co
urse
s. I
nven
tory
is
expe
nsed
as
it is
acq
uire
d. T
he D
epar
tmen
t do
es n
ot
capi
talis
e in
vent
orie
s as
hol
ding
s ar
e hi
gh tu
rnov
er it
ems
that
are
cha
ract
eris
ed b
y lo
w s
tock
leve
ls t
hat
are
not o
f a m
ater
ial n
atur
e.
(xiii
) In
vest
men
ts
Inve
stm
ents
are
initi
ally
rec
ogni
sed
at fa
ir va
lue
plus
, in
the
case
of i
nves
tmen
ts n
ot a
t fai
r va
lue
thro
ugh
prof
it or
loss
, tra
nsac
tion
cost
s. T
he D
epar
tmen
t det
erm
ines
the
clas
sific
atio
n of
its
finan
cial
ass
ets
afte
r in
itial
reco
gniti
on a
nd, w
hen
allo
wed
and
app
ropr
iate
, re-
eval
uate
s th
is a
t eac
h fin
anci
al y
ear e
nd.
66 NSW Department of Education Annual Report 2015 | www.dec.nsw.gov.au
Financial statements
DE
PA
RTM
EN
T O
F E
DU
CA
TIO
N A
ND
CO
MM
UN
ITIE
SN
otes
to th
e fin
anci
al s
tate
men
ts fo
r yea
r end
ed 3
0 Ju
ne 2
015
Pag
e23
of 6
0
1.
Sum
mar
y of
Sig
nific
ant A
ccou
ntin
g Po
licie
s (c
ontin
ued)
(i)A
sset
s (c
ontin
ued)
(xiii
) In
vest
men
ts (c
ontin
ued)
Fa
ir va
lue
thro
ugh
prof
it or
loss
- Th
e D
epar
tmen
t sub
sequ
ently
mea
sure
s in
vest
men
ts c
lass
ified
as
“hel
d fo
r tra
ding
” or d
esig
nate
d up
on in
itial
reco
gniti
on “a
t fai
r val
ue th
roug
h pr
ofit
or lo
ss” a
t fai
r va
lue.
Fin
anci
al a
sset
s ar
e cl
assi
fied
as “
held
for
tra
ding
” if
they
are
acq
uire
d fo
r th
e pu
rpos
e of
se
lling
in t
he n
ear
term
. G
ains
or
loss
es o
n th
ese
asse
ts a
re r
ecog
nise
d in
the
net
res
ult
for
the
year
.
The
Hou
r-Gla
ss I
nves
tmen
t Fa
cilit
ies
are
desi
gnat
ed a
t fa
ir va
lue
thro
ugh
prof
it or
loss
usi
ng t
he
seco
nd le
g of
the
fair
valu
e op
tion
unde
r AA
SB 1
39.9
(b)(i
i) i.
e. th
ese
finan
cial
ass
ets
are
man
aged
an
d th
eir
perfo
rman
ce i
s ev
alua
ted
on a
fai
r va
lue
basi
s in
acc
orda
nce
with
a d
ocum
ente
d ris
k m
anag
emen
t stra
tegy
, and
info
rmat
ion
abou
t the
se a
sset
s is
pro
vide
d in
tern
ally
on
that
bas
is to
the
Dep
artm
ent’s
key
man
agem
ent p
erso
nnel
.
The
mov
emen
t in
the
fai
r va
lue
of t
he H
our-
Gla
ss I
nves
tmen
t Fa
cilit
ies
inco
rpor
ates
dis
tribu
tions
re
ceiv
ed a
s w
ell a
s un
real
ised
mov
emen
ts in
fair
valu
e an
d is
rep
orte
d in
the
line
item
‘inv
estm
ent
reve
nue’
.
H
eld-
to-m
atur
ity
inve
stm
ents
- N
on-d
eriv
ativ
e fin
anci
al
asse
ts
with
fix
ed
or
dete
rmin
able
pa
ymen
ts a
nd f
ixed
mat
urity
tha
t th
e D
epar
tmen
t ha
s th
e po
sitiv
e in
tent
ion
and
abili
ty t
o ho
ld t
o m
atur
ity a
re c
lass
ified
as
“hel
d to
mat
urity
”. Th
ese
inve
stm
ents
are
mea
sure
d at
am
ortis
ed c
ost
usin
g th
e ef
fect
ive
inte
rest
met
hod.
Cha
nges
are
rec
ogni
sed
in t
he n
et r
esul
t fo
r th
e ye
ar w
hen
impa
ired,
der
ecog
nise
d or
thro
ugh
the
amor
tisat
ion
proc
ess.
A
vaila
ble-
for-
sale
inve
stm
ents
- A
ny r
esid
ual i
nves
tmen
ts th
at d
o no
t fal
l int
o an
y ot
her
cate
gory
ar
e ac
coun
ted
for a
s av
aila
ble-
for-s
ale
inve
stm
ents
and
mea
sure
d at
fair
valu
e. G
ains
or l
osse
s on
av
aila
ble-
for-s
ale
inve
stm
ents
are
rec
ogni
sed
in o
ther
com
preh
ensi
ve i
ncom
e un
til d
ispo
sed
or
impa
ired,
at
whi
ch ti
me
the
cum
ulat
ive
gain
or
loss
pre
viou
sly
reco
gnis
ed in
oth
er c
ompr
ehen
sive
in
com
e is
rec
ogni
sed
in th
e ne
t res
ult f
or th
e ye
ar. H
owev
er, i
nter
est c
alcu
late
d us
ing
the
effe
ctiv
e in
tere
st m
etho
d an
d di
vide
nds
are
reco
gnis
ed in
the
net r
esul
t for
the
year
.
Pur
chas
es o
r sa
les
of in
vest
men
ts u
nder
con
tract
that
req
uire
del
iver
y of
the
asse
t with
in th
e tim
e fra
me
esta
blis
hed
by c
onve
ntio
n or
reg
ulat
ion
are
reco
gnis
ed o
n th
e tra
de d
ate
i.e.
the
date
the
Dep
artm
ent
com
mits
to p
urch
ase
or s
ell t
he a
sset
.
The
fair
valu
e of
inve
stm
ents
that
are
trad
ed a
t fai
r val
ue in
an
activ
e m
arke
t is
dete
rmin
ed b
y re
fere
nce
to
quot
ed c
urre
nt b
id p
rices
at t
he c
lose
of b
usin
ess
on th
e st
atem
ent o
f fin
anci
al p
ositi
on d
ate.
(xiv
) Im
pairm
ent o
f fin
anci
al a
sset
s
All
finan
cial
ass
ets,
exc
ept t
hose
mea
sure
d at
fair
valu
e th
roug
h pr
ofit
and
loss
, are
sub
ject
to a
n an
nual
re
view
for
impa
irmen
t. A
n al
low
ance
for
impa
irmen
t is
esta
blis
hed
whe
n th
ere
is o
bjec
tive
evid
ence
that
th
e D
epar
tmen
t will
not
be
able
to c
olle
ct a
ll am
ount
s du
e.
For
finan
cial
ass
ets
carri
ed a
t am
ortis
ed c
ost,
the
amou
nt o
f the
allo
wan
ce is
the
diffe
renc
e be
twee
n th
e as
set’s
car
ryin
g am
ount
and
the
pres
ent v
alue
of e
stim
ated
futu
re c
ash
flow
s, d
isco
unte
d at
the
effe
ctiv
e in
tere
st ra
te. T
he a
mou
nt o
f the
impa
irmen
t los
s is
reco
gnis
ed in
the
net r
esul
t for
the
year
.
Whe
n an
ava
ilabl
e fo
r sal
e fin
anci
al a
sset
is im
paire
d, th
e am
ount
of t
he c
umul
ativ
e lo
ss is
rem
oved
from
eq
uity
and
rec
ogni
sed
in th
e ne
t res
ult f
or th
e ye
ar, b
ased
on
the
diffe
renc
e be
twee
n th
e ac
quis
ition
cos
t (n
et o
f an
y pr
inci
pal
repa
ymen
t an
d am
ortis
atio
n) a
nd c
urre
nt f
air
valu
e, l
ess
any
impa
irmen
t lo
ss
prev
ious
ly re
cogn
ised
in th
e ne
t res
ult f
or th
e ye
ar.
Any
rev
ersa
ls o
f im
pairm
ent
loss
es a
re r
ever
sed
thro
ugh
the
net
resu
lt fo
r th
e ye
ar,
whe
re t
here
is
obje
ctiv
e ev
iden
ce.
How
ever
, re
vers
als
of i
mpa
irmen
t lo
sses
on
an i
nves
tmen
t in
an
equi
ty i
nstru
men
t cl
assi
fied
as “
avai
labl
e-fo
r-sal
e” m
ust
be m
ade
thro
ugh
the
reva
luat
ion
surp
lus.
Rev
ersa
ls o
f im
pairm
ent
loss
es o
f fin
anci
al a
sset
s ca
rrie
d at
am
ortis
ed c
ost c
anno
t res
ult i
n a
carr
ying
am
ount
that
exc
eeds
wha
t th
e ca
rryi
ng a
mou
nt w
ould
hav
e be
en h
ad th
ere
been
no
impa
irmen
t los
s.
DE
PA
RTM
EN
T O
F E
DU
CA
TIO
N A
ND
CO
MM
UN
ITIE
SN
otes
to th
e fin
anci
al s
tate
men
ts fo
r yea
r end
ed 3
0 Ju
ne 2
015
Pag
e24
of 6
0
1.
Sum
mar
y of
Sig
nific
ant A
ccou
ntin
g Po
licie
s (c
ontin
ued)
(i)A
sset
s (c
ontin
ued)
(xv)
D
erec
ogni
tion
of fi
nanc
ial a
sset
s an
d fin
anci
al li
abili
ties
A fi
nanc
ial a
sset
is d
erec
ogni
sed
whe
n th
e co
ntra
ctua
l rig
hts
to th
e ca
sh fl
ows
from
the
finan
cial
ass
ets
expi
re; o
r if t
he D
epar
tmen
t tra
nsfe
rs th
e fin
anci
al a
sset
:
W
here
sub
stan
tially
all
the
risks
and
rew
ards
hav
e be
en tr
ansf
erre
d; o
r
Whe
re th
e D
epar
tmen
t has
not
tran
sfer
red
subs
tant
ially
all
the
risks
and
rew
ards
, if t
he D
epar
tmen
t ha
s no
t ret
aine
d co
ntro
l.
Whe
re t
he D
epar
tmen
t ha
s ne
ither
tra
nsfe
rred
nor
reta
ined
sub
stan
tially
all
the
risk
and
rew
ards
or
trans
ferre
d co
ntro
l, th
e as
set i
s re
cogn
ised
to th
e ex
tent
of t
he D
epar
tmen
t’s c
ontin
uing
invo
lvem
ent i
n th
e as
set.
A fin
anci
al li
abili
ty is
der
ecog
nise
d w
hen
the
oblig
atio
n sp
ecifi
ed in
the
cont
ract
is d
isch
arge
d or
can
celle
d or
exp
ires.
(xvi
) N
on-c
urre
nt a
sset
s (o
r dis
posa
l gro
ups)
hel
d fo
r sal
e
The
Dep
artm
ent h
as c
erta
in n
on-c
urre
nt a
sset
s (o
r dis
pos a
l gro
ups)
cla
ssifi
ed a
s he
ld fo
r sal
e, w
here
thei
r ca
rryi
ng a
mou
nt w
ill b
e re
cove
red
prin
cipa
lly th
roug
h a
sale
tran
sact
ion,
not
thro
ugh
cont
inui
ng u
se. N
on-
curre
nt a
sset
s (o
r di
spos
al g
roup
s) h
eld
for
sale
are
rec
ogni
sed
at th
e lo
wer
of c
arry
ing
amou
nt a
nd fa
ir va
lue
less
cos
ts o
f dis
posa
l. Th
ese
asse
ts a
re n
ot d
epre
ciat
ed w
hile
they
are
cla
ssifi
ed a
s he
ld fo
r sal
e.
(j)
Liab
ilitie
s
(i)
Pay
able
s
Thes
e am
ount
s re
pres
ent l
iabi
litie
s fo
r goo
ds a
nd s
ervi
ces
prov
ided
to th
e D
epar
tmen
t and
oth
er a
mou
nts.
Pa
yabl
es a
re r
ecog
nise
d in
itial
ly a
t fa
ir va
lue,
usu
ally
bas
ed o
n th
e tra
nsac
tion
cost
or
face
val
ue.
Subs
eque
nt m
easu
rem
ent
is a
t am
ortis
ed c
ost
usin
g th
e ef
fect
ive
inte
rest
met
hod.
Sho
rt-te
rm p
ayab
les
with
no
stat
ed in
tere
st ra
te a
re m
easu
red
at th
e or
igin
al in
voic
e am
ount
whe
re th
e ef
fect
of d
isco
untin
g is
im
mat
eria
l.
(ii)
Bor
row
ings
Loan
s ar
e no
t he
ld f
or t
radi
ng o
r de
sign
ated
at
fair
valu
e th
roug
h pr
ofit
or l
oss
and
are
reco
gnis
ed a
t am
ortis
ed c
ost u
sing
the
effe
ctiv
e in
tere
st ra
te m
etho
d. G
ains
or l
osse
s ar
e re
cogn
ised
in th
e ne
t res
ult f
or
the
year
on
de-r
ecog
nitio
n.
Fina
nce
leas
e lia
bilit
ies
are
dete
rmin
ed in
acc
orda
nce
with
AAS
B 11
7 Le
ases
.
(iii)
Fina
ncia
l gua
rant
ees
A f
inan
cial
gua
rant
ee c
ontra
ct i
s a
cont
ract
tha
t re
quire
s th
e is
suer
to
mak
e sp
ecifi
c pa
ymen
ts t
o re
imbu
rse
the
hold
er f
or a
loss
it in
curs
bec
ause
a s
peci
fied
debt
or f
ails
to
mak
e pa
ymen
t w
hen
due
in
acco
rdan
ce w
ith th
e or
igin
al o
r mod
ified
term
s of
a d
ebt i
nstru
men
t.
Fina
ncia
l gua
rant
ee c
ontra
cts
are
reco
gnis
ed a
s a
liabi
lity
at th
e tim
e th
e gu
aran
tee
is is
sued
and
initi
ally
re
cogn
ised
at
fair
valu
e pl
us,
in t
he c
ase
of f
inan
cial
gua
rant
ees
not
at f
air
valu
e th
roug
h pr
ofit
or lo
ss,
dire
ctly
attr
ibut
able
tra
nsac
tion
cost
s, w
here
mat
eria
l. A
fter
initi
al r
ecog
nitio
n, t
he li
abili
ty is
mea
sure
d at
th
e hi
gher
of t
he a
mou
nt d
eter
min
ed in
acc
orda
nce
with
AAS
B 13
7 P
rovi
sion
s, C
ontin
gent
Lia
bilit
ies
and
Con
tinge
nt A
sset
s an
d th
e am
ount
initi
ally
reco
gnis
ed, l
ess
accu
mul
ated
am
ortis
atio
n, w
here
app
ropr
iate
.
The
Dep
artm
ent h
as r
evie
wed
its
finan
cial
gua
rant
ees
and
dete
rmin
ed th
at th
ere
is n
o m
ater
ial l
iabi
lity
to
be re
cogn
ised
for f
inan
cial
gua
rant
ee c
ontra
cts
as a
t 30
June
201
5 an
d at
30
June
201
4. H
owev
er, r
efer
to
Not
e 22
rega
rdin
g di
sclo
sure
s on
con
tinge
nt li
abili
ties.
(iv)
Em
ploy
ee b
enef
its a
nd o
ther
pro
visi
ons
(a)
Sal
arie
s an
d w
ages
, ann
ual l
eave
, sic
k le
ave
and
on-c
osts
Sala
ries
and
wag
es (i
nclu
ding
non
-mon
etar
y be
nefit
s), a
nd p
aid
sick
leav
e th
at a
re e
xpec
ted
to b
e se
ttled
who
lly w
ithin
12
mon
ths
afte
r th
e en
d of
the
per
iod
in w
hich
the
em
ploy
ees
rend
er t
he
serv
ice
are
reco
gnis
ed a
nd m
easu
red
at t h
e un
disc
ount
ed a
mou
nts
of th
e be
nefit
s.
67 NSW Department of Education Annual Report 2015 | www.dec.nsw.gov.au
Financial statements
DE
PA
RTM
EN
T O
F E
DU
CA
TIO
N A
ND
CO
MM
UN
ITIE
SN
otes
to th
e fin
anci
al s
tate
men
ts fo
r yea
r end
ed 3
0 Ju
ne 2
015
Pag
e25
of 6
0
1.
Sum
mar
y of
Sig
nific
ant A
ccou
ntin
g Po
licie
s (c
ontin
ued)
(j)Li
abili
ties
(con
tinue
d)
(iv)
E
mpl
oyee
ben
efits
and
oth
er p
rovi
sion
s (c
ontin
ued)
(a)
Sal
arie
s an
d w
ages
, ann
ual l
eave
, sic
k le
ave
and
on-c
osts
(con
tinue
d)
Annu
al le
ave
is n
ot e
xpec
ted
to b
e se
ttled
who
lly b
efor
e tw
elve
mon
ths
afte
r the
end
of t
he a
nnua
l re
porti
ng p
erio
d in
whi
ch t
he e
mpl
oyee
s re
nder
the
rel
ated
ser
vice
. A
s su
ch,
it is
req
uire
d to
be
mea
sure
d at
pre
sent
val
ue in
acc
orda
nce
with
AAS
B 11
9 E
mpl
oyee
Ben
efits
(al
thou
gh s
hort-
cut
met
hods
are
per
mitt
ed).
Act
uaria
l adv
ice
obta
ined
by
Trea
sury
has
con
firm
ed t
hat
the
use
of a
n ap
proa
ch u
sing
nom
inal
ann
ual l
eave
plu
s an
nual
leav
e on
the
nom
inal
liab
ility
(us
ing
7.9%
of t
he
nom
inal
val
ue o
f ann
ual l
eave
) ca
n be
use
d to
app
roxi
mat
e th
e pr
esen
t val
ue o
f the
ann
ual l
eave
lia
bilit
y.
The
Dep
artm
ent
has
asse
ssed
th
e ac
tuar
ial
advi
ce
base
d on
th
e D
epar
tmen
t’s
circ
umst
ance
s an
d ha
s de
term
ined
that
the
effe
ct o
f dis
coun
ting
is im
mat
eria
l to
annu
al le
ave.
Unu
sed
non-
vest
ing
sick
leav
e do
es n
ot g
ive
rise
to a
liab
ility,
as
it is
not
con
side
red
prob
able
that
si
ck le
ave
take
n in
the
futu
re w
ill b
e gr
eate
r tha
n th
e be
nefit
s ac
crue
d in
the
futu
re.
In 2
015,
NS
W T
reas
ury
Circ
ular
TC
15/0
9 m
odifi
es th
e lo
ng s
ervi
ce le
ave
onco
st fa
ctor
s:
S
uper
annu
atio
n - d
efin
ed b
enef
its to
1.2
% (2
014:
2.4
%) a
nd
Su
pera
nnua
tion
- def
ined
con
tribu
tion
to 3
.8%
(201
4: 3
.15%
).
Thes
e ch
ange
s eq
uate
to
appr
oxim
atel
y $1
3.1m
inc
reas
e in
em
ploy
ee r
elat
ed e
xpen
ses
and
rela
ted
prov
isio
ns fo
r em
ploy
ee b
enef
its.
(b)
Long
ser
vice
leav
e an
d su
pera
nnua
tion
The
Dep
artm
ent’s
liab
ilitie
s fo
r lon
g se
rvic
e le
ave
and
defin
ed b
enef
it su
pera
nnua
tion
are
assu
med
by
the
Cro
wn
Ent
ity.
The
Dep
artm
ent
acco
unts
for
the
lia
bilit
y as
hav
ing
been
ext
ingu
ishe
d re
sulti
ng in
the
amou
nt a
ssum
ed b
eing
sho
wn
as p
art o
f the
non
-mon
etar
y re
venu
e ite
m d
escr
ibed
as
“Acc
epta
nce
by th
e C
row
n E
ntity
of e
mpl
oyee
ben
efits
and
oth
er li
abili
ties”
.
Long
ser
vice
leav
e is
mea
sure
d at
pre
sent
val
ue in
acc
orda
nce
with
AA
SB
119
Em
ploy
ee B
enef
its.
This
is b
ased
on
the
appl
icat
ion
of c
erta
in fa
ctor
s (s
peci
fied
in N
SW
Tre
asur
y C
ircul
ar T
C15
/09)
to
empl
oyee
s w
ith f
ive
or m
ore
year
s of
ser
vice
usi
ng c
urre
nt r
ates
of
pay.
The
se f
acto
rs w
ere
dete
rmin
ed b
ased
on
actu
aria
l rev
iew
to a
ppro
xim
ate
pres
ent v
alue
.
The
valu
e of
the
liabi
lity
for l
ong
serv
ice
leav
e fo
r cas
ual t
each
ers
has
not b
een
brou
ght t
o ac
coun
t as
the
spec
ific
crite
ria fo
r elig
ibilit
y is
con
side
red
to re
sult
in a
n im
mat
eria
l am
ount
.
The
supe
rann
uatio
n ex
pens
e fo
r the
fina
ncia
l yea
r is
dete
rmin
ed b
y us
ing
the
form
ulae
spe
cifie
d in
th
e Tr
easu
rer’s
Dire
ctio
ns.
The
expe
nse
for
defin
ed b
enef
it su
pera
nnua
tion
sche
mes
(i.e
. B
asic
B
enef
it an
d Fi
rst
Sta
te S
uper
) is
cal
cula
ted
as a
per
cent
age
of t
he e
mpl
oyee
s’ s
alar
y. F
or o
ther
su
pera
nnua
tion
sche
mes
(i.e
. Sta
te S
uper
annu
atio
n Sc
hem
e an
d St
ate
Auth
oriti
es S
uper
annu
atio
n S
chem
e), t
he e
xpen
se is
cal
cula
ted
as a
mul
tiple
of t
he e
mpl
oyee
s’ s
uper
annu
atio
n co
ntrib
utio
ns.
Con
tribu
tions
to th
e de
fined
con
tribu
tion
plan
s ar
e ex
pens
ed w
hen
incu
rred
.
The
Cro
wn
acce
pted
lia
bilit
y fo
r th
e de
fined
ben
efit
supe
rann
uatio
n an
d lo
ng s
ervi
ce l
eave
for
em
ploy
ees
of th
e A
dult
Mig
rant
Eng
lish
Ser
vice
(A
ME
S)
effe
ctiv
e fro
m 2
6 A
ugus
t 201
4 so
that
all
empl
oyee
s w
ithin
the
Dep
artm
ent
are
now
con
sist
ently
tre
ated
and
fun
ded
for
long
ser
vice
leav
e an
d de
fined
ben
efit
supe
rann
uatio
n. P
rior
to th
at d
ate,
the
liabi
litie
s of
the
Dep
artm
ent r
elat
ing
to
AM
ES
em
ploy
ees
for l
ong
serv
ice
leav
e an
d su
pera
nnua
tion
wer
e di
sclo
sed
sepa
rate
ly.
For
2013
-14,
the
lon
g se
rvic
e le
ave
bene
fits
owin
g to
AM
ES
em
ploy
ees
at b
alan
ce d
ate
wer
e id
entif
ied
as c
urre
nt l
iabi
litie
s an
d ar
e in
clud
ed w
ithin
Not
e 18
. Th
e C
orre
spon
ding
am
ount
s re
imbu
rsab
le f
rom
the
Tre
asur
y ar
e sh
own
as c
urre
nt a
sset
s w
ithin
“R
ecei
vabl
es”
in N
ote
9.
Dis
clos
ure
of s
uper
annu
atio
n in
Not
e 27
is re
late
d to
AM
ES
for 2
013-
14.
AMES
sup
eran
nuat
ion
liabi
lity
for
2013
-14,
in r
espe
ct t
o th
e th
ree
defin
ed b
enef
it sc
hem
es w
ere
calc
ulat
ed s
epar
atel
y. T
he a
ctua
rial
valu
atio
ns
wer
e ca
rried
out
at
30 J
une
2014
by
Pill
ar
Adm
inis
tratio
n us
ing
the
proj
ecte
d un
it cr
edit
met
hod.
Th
e de
fined
be
nefit
ob
ligat
ion
was
di
scou
nted
to d
eter
min
e its
pre
sent
val
ue a
nd th
e fa
ir va
lue
of a
ny s
chem
e as
sets
was
ded
ucte
d an
d th
en a
djus
ted
for
unre
cogn
ised
pas
t se
rvic
e co
sts.
The
dis
coun
t ra
te w
as t
he y
ield
at
the
repo
rting
dat
e on
Com
mon
wea
lth G
over
nmen
t bon
ds th
at h
ave
mat
urity
dat
es a
ppro
xim
atin
g to
the
term
s of
AM
ES
’ obl
igat
ions
.
Whe
re th
e pr
esen
t val
ue o
f the
def
ined
ben
efit
oblig
atio
n in
resp
ect o
f a s
chem
e ex
ceed
ed th
e fa
ir va
lue
of t
he s
chem
e’s
asse
ts,
a lia
bilit
y fo
r th
e di
ffere
nce
was
rec
ogni
sed
in t
he s
tate
men
t of
fin
anci
al p
ositi
on.
Whe
re t
he f
air
valu
e of
a s
chem
e’s
asse
ts e
xcee
ds t
he p
rese
nt v
alue
of
the
defin
ed b
enef
it ob
ligat
ion
for
that
sch
eme,
an
asse
t w
as r
ecog
nise
d in
the
sta
tem
ent
of f
inan
cial
po
sitio
n.
DE
PA
RTM
EN
T O
F E
DU
CA
TIO
N A
ND
CO
MM
UN
ITIE
SN
otes
to th
e fin
anci
al s
tate
men
ts fo
r yea
r end
ed 3
0 Ju
ne 2
015
Pag
e26
of 6
0
1.
Sum
mar
y of
Sig
nific
ant A
ccou
ntin
g Po
licie
s(c
ontin
ued)
(j)
Liab
ilitie
s (c
ontin
ued)
(iv)
Em
ploy
ee b
enef
its a
nd o
ther
pro
visi
ons
(con
tinue
d)
(b)
Long
ser
vice
leav
e an
d su
pera
nnua
tion
(con
tinue
d)
Actu
aria
l gai
ns a
nd lo
sses
aris
ing
in c
alcu
latin
g th
e ob
ligat
ion
are
reco
gnis
ed d
irect
ly in
equ
ity in
th
e pe
riod
in w
hich
they
occ
ur a
nd a
re p
rese
nted
as
othe
r com
preh
ensi
ve in
com
e in
the
stat
emen
t of
com
preh
ensi
ve in
com
e. R
efer
Not
e 27
.
(c)
Teac
hers
’ ann
ual a
nd n
on te
rm le
ave
prov
isio
n
Teac
hers
’ ann
ual a
nd n
on te
rm le
ave
prov
isio
n is
est
imat
ed b
ased
on
the
num
ber o
f wor
kday
s fro
m
the
star
t of s
choo
l ter
m 1
to th
e re
porti
ng d
ate.
The
pro
visi
on is
redu
ced
whe
n te
ache
rs ta
ke a
nnua
l le
ave
and
durin
g st
uden
t vac
atio
ns. R
elat
ed c
onse
quen
tial o
n-co
sts,
incl
udin
g pa
yrol
l tax
, wor
kers
’ co
mpe
nsat
ion
and
supe
rann
uatio
n ar
e al
so r
ecog
nise
d as
par
t of
the
pro
visi
on a
nd e
mpl
oyee
re
late
d ex
pens
es.
(d)
Con
sequ
entia
l on-
cost
s
C
onse
quen
tial c
osts
to e
mpl
oym
ent a
re re
cogn
ised
as
liabi
litie
s an
d ex
pens
es w
here
the
empl
oyee
be
nefit
s to
whi
ch th
ey r
elat
e ha
ve b
een
reco
gnis
ed.
This
incl
udes
out
stan
ding
am
ount
s of
pay
roll
tax,
wor
kers
’ com
pens
atio
n in
sura
nce
prem
ium
s an
d fri
nge
bene
fits
tax.
(v)
Oth
er p
rovi
sion
s
Oth
er p
rovi
sion
s ex
ist
whe
n th
e D
epar
tmen
t ha
s a
pres
ent
lega
l or
con
stru
ctiv
e ob
ligat
ion
as a
re
sult
of a
pas
t ev
ent;
it is
pro
babl
e th
at a
n ou
tflow
of
reso
urce
s w
ill b
e re
quire
d to
set
tle t
he
oblig
atio
n; a
nd a
relia
ble
estim
ate
can
be m
ade
of th
e am
ount
of t
he o
blig
atio
n.
Any
pro
visi
ons
for
rest
ruct
urin
g ar
e re
cogn
ised
onl
y w
hen
the
Dep
artm
ent
has
a de
taile
d fo
rmal
pl
an a
nd th
e D
epar
tmen
t has
rais
ed a
val
id e
xpec
tatio
n in
thos
e af
fect
ed b
y th
e re
stru
ctur
ing
that
it
will
car
ry o
ut th
e re
stru
ctur
ing
by s
tarti
ng to
impl
emen
t the
pla
n or
ann
ounc
ing
its m
ain
feat
ures
to
thos
e af
fect
ed.
In r
elat
ion
to p
rovi
sion
for
mak
e go
od o
f bui
ldin
g op
erat
ing
leas
es, t
he D
epar
tmen
t has
app
lied
a di
scou
nt ra
te o
f 2.4
5% fo
r the
yea
r end
ed o
n 30
Jun
e 20
15.
(k)
Fair
valu
e hi
erar
chy
A n
umbe
r of t
he D
epar
tmen
t’s a
ccou
ntin
g po
licie
s an
d di
sclo
sure
s re
quire
the
mea
sure
men
t of f
air v
alue
s,
for
both
fin
anci
al a
nd n
on-fi
nanc
ial
asse
ts a
nd l
iabi
litie
s. W
hen
mea
surin
g fa
ir va
lue,
the
val
uatio
n te
chni
que
used
max
imis
es th
e us
e of
rel
evan
t obs
erva
ble
inpu
ts a
nd m
inim
ises
the
use
of u
nobs
erva
ble
inpu
ts.
Und
er A
AS
B 1
3, t
he D
epar
tmen
t ca
tego
rises
, fo
r di
sclo
sure
pur
pose
s, t
he v
alua
tion
tech
niqu
es
base
d on
the
inpu
ts u
sed
in th
e va
luat
ion
tech
niqu
es a
s fo
llow
s:
Le
vel
1 –
quot
ed p
rices
in
activ
e m
arke
ts f
or i
dent
ical
ass
ets/
liabi
litie
s th
at t
he D
epar
tmen
t ca
n ac
cess
at t
he m
easu
rem
ent d
ate.
Le
vel 2
– in
puts
oth
er th
an q
uote
d pr
ices
incl
uded
with
in L
evel
1 th
at a
re o
bser
vabl
e, e
ither
dire
ctly
or
indi
rect
ly.
Le
vel 3
– in
puts
that
are
not
bas
ed o
n ob
serv
able
mar
ket d
ata
(uno
bser
vabl
e in
puts
).
If th
e in
puts
use
d to
mea
sure
the
fair
valu
e of
an
asse
t or a
liab
ility
mig
ht b
e ca
tego
rised
in d
iffer
ent l
evel
s of
the
fair
valu
e hi
erar
chy,
then
the
fair
valu
e m
easu
rem
ent i
s ca
tego
rised
in it
s en
tiret
y in
the
sam
e le
vel
of th
e fa
ir va
lue
hier
arch
y as
the
low
est l
evel
inpu
t tha
t is
sign
ifica
nt to
the
entir
e m
easu
rem
ent.
The
Dep
artm
ent r
ecog
nise
s tra
nsfe
rs b
etw
een
leve
ls o
f the
fair
valu
e hi
erar
chy
at th
e en
d of
the
repo
rting
pe
riod
durin
g w
hich
the
chan
ge h
as o
ccur
red.
Ref
er N
ote
14 a
nd N
ote
26 fo
r fur
ther
dis
clos
ures
rega
rdin
g fa
ir va
lue
mea
sure
men
ts o
f fin
anci
al a
nd n
on-
finan
cial
ass
ets.
68 NSW Department of Education Annual Report 2015 | www.dec.nsw.gov.au
Financial statements
DE
PA
RTM
EN
T O
F E
DU
CA
TIO
N A
ND
CO
MM
UN
ITIE
SN
otes
to th
e fin
anci
al s
tate
men
ts fo
r yea
r end
ed 3
0 Ju
ne 2
015
Pag
e27
of 6
0
1.
Sum
mar
y of
Sig
nific
ant A
ccou
ntin
g Po
licie
s(c
ontin
ued)
(l)
Equ
ity a
nd re
serv
es
(i)
Rev
alua
tion
surp
lus
The
reva
luat
ion
surp
lus
is u
sed
to r
ecor
d in
crem
ents
and
dec
rem
ents
on
the
reva
luat
ion
of n
on-c
urre
nt
asse
ts. T
his
acco
rds
with
the
Dep
artm
ent’s
pol
icy
on th
e re
valu
atio
n of
pro
perty
, pla
nt a
nd e
quip
men
t as
disc
usse
d in
Not
e 1(
i)(iii
).
(ii)
Acc
umul
ated
fund
s
The
cate
gory
“Acc
umul
ated
Fun
ds” i
nclu
des
all c
urre
nt a
nd p
rior p
erio
d re
tain
ed fu
nds.
(iii)
Oth
er re
serv
es
Sepa
rate
res
erve
acc
ount
s ar
e re
cogn
ised
in th
e fin
anci
al s
tate
men
ts o
nly
if su
ch a
ccou
nts
are
requ
ired
by s
peci
fic le
gisl
atio
n or
Aus
tralia
n A
ccou
ntin
g S
tand
ards
(e.g
. rev
alua
tion
surp
lus)
.
(m)
Equ
ity tr
ansf
ers
The
trans
fer
of n
et a
sset
s be
twee
n ag
enci
es a
s a
resu
lt of
an
adm
inis
trativ
e re
stru
ctur
e, t
rans
fers
of
prog
ram
s/fu
nctio
ns a
nd p
arts
ther
eof b
etw
een
NS
W p
ublic
sec
tor a
genc
ies
and
‘equ
ity a
ppro
pria
tions
’ are
de
sign
ated
or
requ
ired
by th
e Au
stra
lian
Acc
ount
ing
Stan
dard
s to
be
treat
ed a
s co
ntrib
utio
ns b
y ow
ners
an
d re
cogn
ised
as
an a
djus
tmen
t to
“Acc
umul
ated
Fun
ds”.
This
trea
tmen
t is
cons
iste
nt w
ith A
AS
B 1
004
Con
tribu
tions
and
Aus
tralia
n A
ccou
ntin
g In
terp
reta
tion
1038
Con
tribu
tions
by
Ow
ners
Mad
e to
Who
lly-
Ow
ned
Pub
lic S
ecto
r Ent
ities
.
Tran
sfer
s ar
isin
g fro
m a
n ad
min
istra
tive
rest
ruct
ure
invo
lvin
g no
t-for
-pro
fit a
nd f
or-p
rofit
gov
ernm
ent
agen
cies
are
rec
ogni
sed
at t
he a
mou
nt a
t w
hich
the
ass
ets
and
liabi
litie
s w
ere
reco
gnis
ed b
y th
e tra
nsfe
ror
imm
edia
tely
prio
r to
the
res
truct
ure.
Sub
ject
to
belo
w,
in m
ost
inst
ance
s th
is w
ill a
ppro
xim
ate
fair
valu
e.
All
othe
r equ
ity tr
ansf
ers
are
reco
gnis
ed a
t fai
r val
ue, e
xcep
t for
inta
ngib
les.
Whe
re a
n in
tang
ible
has
bee
n re
cogn
ised
at (
amor
tised
) cos
t by
the
trans
fero
r bec
ause
ther
e is
no
activ
e m
arke
t, th
e ag
ency
reco
gnis
es
the
asse
t at t
he tr
ansf
eror
’s c
arry
ing
amou
nt. W
here
the
trans
fero
r is
proh
ibite
d fro
m re
cogn
isin
g in
tern
ally
ge
nera
ted
inta
ngib
les,
the
agen
cy d
oes
not r
ecog
nise
that
ass
et.
Det
ails
of
chan
ges
to a
sset
s/lia
bilit
ies
of t
he D
epar
tmen
t re
late
d to
the
tra
nsfe
r ou
t of
TA
FE,
now
a
sepa
rate
repo
rting
ent
ity, a
nd p
arts
of t
he O
ffice
of C
omm
uniti
es tr
ansf
erre
d to
the
Dep
artm
ent o
f Pre
mie
r an
d C
abin
et a
nd th
e O
ffice
of S
port
are
prov
ided
in N
ote
20.
(n)
Bud
gete
d am
ount
s
The
budg
eted
am
ount
s ar
e dr
awn
from
the
orig
inal
bud
gete
d fin
anci
al s
tate
men
ts p
rese
nted
to P
arlia
men
t in
res
pect
of
the
repo
rting
per
iod.
Sub
sequ
ent
amen
dmen
ts t
o th
e or
igin
al b
udge
t (e
.g.
adju
stm
ent
for
trans
fer o
f fun
ctio
ns b
etw
een
entit
ies
as a
resu
lt of
Adm
inis
trativ
e A
rrang
emen
ts O
rder
s) a
re n
ot re
flect
ed
in th
e bu
dget
ed a
mou
nts.
Maj
or v
aria
nces
bet
wee
n th
e or
igin
al b
udge
ted
amou
nts
and
the
actu
al a
mou
nts
disc
lose
d in
the
prim
ary
finan
cial
sta
tem
ents
are
exp
lain
ed in
Not
e 23
.
(o)
Com
para
tive
info
rmat
ion
In 2
014-
15, t
he fo
llow
ing
item
s ha
ve b
een
recl
assi
fied
and
the
com
para
tives
for
2013
-14
adju
sted
to
be
cons
iste
nt w
ith th
e cu
rrent
yea
r pre
sent
atio
n:
(i)
Effe
ctiv
e fro
m
1 Ju
ly
2014
pu
rsua
nt
to
the
Pub
lic
Fina
nce
and
Aud
it A
men
dmen
t (T
AFE
C
omm
issi
on)
Reg
ulat
ion
2014
, TA
FE is
a s
epar
ate
repo
rting
ent
ity a
nd p
arts
of
the
Dep
artm
ent
have
tra
nsfe
rred
to
the
Offi
ce o
f S
port
and
the
Dep
artm
ent
of P
rem
ier
and
Cab
inet
ref
er t
o N
ote
1(a)
and
Not
e 1(
m).
Com
para
tive
info
rmat
ion
will
con
tain
bal
ance
s fo
r th
e fo
rmer
par
ts o
f th
e D
epar
tmen
t tha
t hav
e tra
nsfe
rred
out a
s w
ell a
s th
e el
imin
atio
n of
intra
-age
ncy
trans
actio
ns. D
etai
ls
of th
e as
sets
and
liab
ilitie
s tra
nsfe
rred
out a
re in
clud
ed in
Not
e 20
. In
2013
-14,
tota
l rev
enue
and
ex
pens
es fo
r the
par
ts tr
ansf
erre
d ou
t tot
alle
d $2
.1m
and
$1.
9m re
spec
tivel
y.
(ii)
Payr
oll T
ax o
n Ac
crue
d S
alar
ies
and
wag
es, a
nd W
orke
rs C
ompe
nsat
ion
on A
ccru
ed S
alar
y an
d W
ages
hav
e be
en r
ecla
ssifi
ed f
rom
Not
e 18
“C
urre
nt li
abilit
ies
- P
rovi
sion
s” t
o N
ote
16 “
Cur
rent
lia
bilit
ies
– Pa
yabl
es”.
The
recl
assi
ficat
ion
refle
cts
the
corre
ct r
epor
ting
cate
gory
of
this
fin
anci
al
item
and
res
ults
in a
red
uctio
n of
$14
.8m
in “
Cur
rent
liab
ilitie
s –
Prov
isio
ns”
and
an in
crea
se o
f $1
4.8m
in “C
urre
nt li
abili
ties
– P
ayab
les”
.
DE
PA
RTM
EN
T O
F E
DU
CA
TIO
N A
ND
CO
MM
UN
ITIE
SN
otes
to th
e fin
anci
al s
tate
men
ts fo
r yea
r end
ed 3
0 Ju
ne 2
015
Pag
e28
of 6
0
1.
Sum
mar
y of
Sig
nific
ant A
ccou
ntin
g Po
licie
s (c
ontin
ued)
(o)
Com
para
tive
info
rmat
ion
(con
tinue
d)
(iii)
In 2
013-
14,
Cas
h an
d ca
sh e
quiv
alen
ts d
iscl
osur
e w
as s
plit
betw
een
cash
hel
d in
sch
ool
bank
ac
coun
ts a
nd c
ash
held
cen
trally
. As
the
Dep
artm
ent i
s tra
nsiti
onin
g sc
hool
ban
k ac
coun
ts in
to a
ce
ntra
lised
sys
tem
, thi
s se
para
te d
iscl
osur
e is
no
long
er a
ppro
pria
te. R
efer
Not
e 8.
(iv)
In 2
014-
15,
the
Dep
artm
ent
redi
strib
uted
som
e as
set
and
liabi
lity
item
s in
the
Ser
vice
Gro
up
Stat
emen
t due
to b
ette
r ava
ilabi
lity
of d
ata
refle
ctin
g m
ore
accu
rate
ly th
e re
leva
nt s
ervi
ce c
osts
and
ac
hiev
emen
ts o
n ac
tiviti
es o
f eac
h in
divi
dual
ser
vice
gro
up. T
he r
elat
ed c
ompa
rativ
es in
201
4 ar
e al
so a
men
ded
to im
prov
e co
mpa
rabi
lity
of th
e S
tate
men
t.
(p)
Cha
nge
in a
ccou
ntin
g po
licy,
incl
udin
g ne
w o
r rev
ised
Aus
tralia
n A
ccou
ntin
g S
tand
ards
(i)
Effe
ctiv
e fo
r the
firs
t tim
e in
201
4-15
The
acco
untin
g po
licie
s ap
plie
d in
201
4-15
are
con
sist
ent w
ith th
ose
of th
e pr
evio
us fi
nanc
ial y
ear e
xcep
t as
a re
sult
of th
e fo
llow
ing
new
or r
evis
ed A
ustra
lian
Acco
untin
g St
anda
rds
that
hav
e be
en a
pplie
d fo
r the
fir
st ti
me
in 2
014-
15.
Rev
ised
sta
ndar
ds r
elev
ant t
o no
t-for
-pro
fit e
ntiti
es in
clud
e, A
AS
B 1
0 C
onso
lidat
ion,
AA
SB
12
Dis
clos
ure
of In
tere
sts
in O
ther
Ent
ities
, and
AA
SB
127
Sep
arat
e Fi
nanc
ial S
tate
men
ts.
The
Dep
artm
ent
has
revi
ewed
and
ass
esse
d th
e ab
ove
acco
untin
g st
anda
rds
and
is o
f th
e op
inio
n th
at
they
are
not
app
licab
le.
AA
SB
105
5 B
udge
tary
Rep
ortin
g re
quire
s th
at b
udge
ted
amou
nts
disc
lose
d in
the
finan
cial
sta
tem
ents
are
as
per
the
orig
inal
bud
gete
d fin
anci
al s
tate
men
ts p
rese
nted
to
Par
liam
ent.
Not
e 1(
n) a
nd N
ote
23 h
ave
been
am
ende
d ac
cord
ingl
y.
AA
SB
201
5-7
Am
endm
ents
to A
ustra
lian
Acc
ount
ing
Sta
ndar
ds –
Fai
r V
alue
Dis
clos
ures
of N
ot-fo
r-P
rofit
P
ublic
Sec
tor
Ent
ities
pro
vide
s re
lief
for
not-f
or-p
rofit
pub
lic s
ecto
r en
titie
s fro
m m
akin
g ce
rtain
spe
cifie
d di
sclo
sure
s ab
out t
he fa
ir va
lue
mea
sure
men
t of a
sset
s w
ithin
the
scop
e of
AA
SB
116
Pro
perty
, Pla
nt a
nd
Equ
ipm
ent,
whi
ch a
re p
rimar
ily h
eld
for
thei
r cu
rrent
ser
vice
pot
entia
l rat
her
than
to
gene
rate
fut
ure
net
cash
inflo
ws.
The
Sta
ndar
d ap
plie
s to
ann
ual r
epor
ting
perio
ds b
egin
ning
on
or a
fter
1 Ju
ly 2
016.
Bot
h A
ustra
lian
Acc
ount
ing
Sta
ndar
d B
oard
and
NS
W T
reas
ury
perm
it ea
rly a
dopt
ion.
The
Dep
artm
ent
has
elec
ted
not t
o ea
rly a
dopt
this
Sta
ndar
d fo
r 201
4-15
.
(ii)
Issu
ed b
ut n
ot y
et e
ffect
ive
NS
W p
ublic
sec
tor a
genc
ies
are
not p
erm
itted
to e
arly
ado
pt n
ew A
ustra
lian
Acc
ount
ing
Sta
ndar
ds, u
nles
s Tr
easu
ry d
eter
min
es o
ther
wis
e.
The
follo
win
g ne
w A
ccou
ntin
g S
tand
ards
hav
e no
t be
en a
pplie
d an
d ar
e no
t ye
t ef
fect
ive.
Man
agem
ent
cann
ot d
eter
min
e th
e ac
tual
impa
ct o
f th
ese
Sta
ndar
ds in
the
Dep
artm
ent’s
fin
anci
al s
tate
men
ts in
the
pe
riod
of th
eir i
nitia
l app
licat
ion.
AA
SB
9 F
inan
cial
Inst
rum
ents
(effe
ctiv
e 2
018-
19);
AA
SB
15
Rev
enue
from
Con
tract
s w
ith C
usto
mer
s (e
ffect
ive
2017
-18)
;
AA
SB
201
0-7
Am
endm
ents
to
Aus
tralia
n A
ccou
ntin
g S
tand
ards
aris
ing
from
AA
SB
9(D
ecem
ber
2010
) (e
ffect
ive
2018
-19)
;
AA
SB
201
3-9
Am
endm
ents
to A
ustra
lian
Acc
ount
ing
Sta
ndar
ds –
Con
cept
ual F
ram
ewor
k, M
ater
ialit
y an
d Fi
nanc
ial I
nstru
men
ts [P
art C
Fin
anci
al In
stru
men
ts] (
effe
ctiv
e 20
15-1
6);
AA
SB
201
4-1
Am
endm
ents
to
Aus
tralia
n A
ccou
ntin
g S
tand
ards
– P
art
D r
egar
ding
Con
sequ
entia
l A
men
dmen
ts a
risin
g fro
m A
AS
B 1
4 R
egul
ator
y D
efer
ral A
ccou
nts
(effe
ctiv
e 20
16-1
7);
AA
SB
201
4-1
Am
endm
ents
to A
ustra
lian
Acc
ount
ing
Sta
ndar
ds –
Par
t E r
egar
ding
Fin
anci
al In
stru
men
ts(e
ffect
ive
2018
-19)
;
AA
SB
201
4-4
Am
endm
ents
to A
ustra
lian
Acc
ount
ing
Sta
ndar
ds –
Cla
rific
atio
n of
Acc
epta
ble
Met
hods
of
Dep
reci
atio
n an
d A
mor
tisat
ion
(effe
ctiv
e 20
16-1
7);
AA
SB
201
4-5
Am
endm
ents
to A
ustra
lian
Acc
ount
ing
Sta
ndar
ds a
risin
g fro
m A
AS
B 1
5 (e
ffect
ive
2017
-18)
;

69 NSW Department of Education Annual Report 2015 | www.dec.nsw.gov.au
Financial statements
DE
PA
RTM
EN
T O
F E
DU
CA
TIO
N A
ND
CO
MM
UN
ITIE
SN
otes
to th
e fin
anci
al s
tate
men
ts fo
r yea
r end
ed 3
0 Ju
ne 2
015
Pag
e29
of 6
0
1.
Sum
mar
y of
Sig
nific
ant A
ccou
ntin
g Po
licie
s (c
ontin
ued)
(p)
Cha
nge
in a
ccou
ntin
g po
licy,
incl
udin
g ne
w o
r rev
ised
Aus
tralia
n A
ccou
ntin
g S
tand
ards
(con
tinue
d)
(ii)
Issu
ed b
ut n
ot y
et e
ffect
ive
(con
tinue
d)
AA
SB
201
4-7
Am
endm
ents
to
Aus
tralia
n A
ccou
ntin
g S
tand
ards
aris
ing
from
AA
SB
9 (
Dec
embe
r 20
14)
(effe
ctiv
e 20
18-1
9);
AA
SB
201
4-8
Am
endm
ents
to A
ustra
lian
Acc
ount
ing
Sta
ndar
ds a
risin
g fro
m A
AS
B 9
(D
ecem
ber
2014
) –
App
licat
ion
of A
AS
B 9
(Dec
embe
r 200
9) a
nd A
AS
B 9
(Dec
embe
r 201
0) (e
ffect
ive
2015
-16)
;
AA
SB
201
5-1
Am
endm
ents
to
Aus
tralia
n A
ccou
ntin
g S
tand
ards
– A
nnua
l Im
prov
emen
ts t
o A
ustra
lian
Acco
untin
g St
anda
rds
2012
-201
4 C
ycle
(effe
ctiv
e 20
16-1
7);
AA
SB
201
5-2
Am
endm
ents
to
Aus
tralia
n A
ccou
ntin
g S
tand
ards
– D
iscl
osur
e In
itiat
ive:
Am
endm
ents
to
AA
SB
101
(effe
ctiv
e 20
16-1
7);
AASB
201
5-3
Am
endm
ents
to A
ustra
lian
Acc
ount
ing
Sta
ndar
ds a
risin
g fro
m th
e W
ithdr
awal
of A
AS
B 1
031
Mat
eria
lity
(effe
ctiv
e 20
15-1
6);
AA
SB
201
5-6
Am
endm
ents
to A
ustra
lian
Acc
ount
ing
Sta
ndar
ds –
Ext
endi
ng R
elat
ed P
arty
Dis
clos
ures
to
Not
-for-
Pro
fit P
ublic
Sec
tor E
ntiti
es (e
ffect
ive
2016
-17)
.
DE
PA
RTM
EN
T O
F E
DU
CA
TIO
N A
ND
CO
MM
UN
ITIE
SN
otes
to th
e fin
anci
al s
tate
men
ts fo
r yea
r end
ed 3
0 Ju
ne 2
015
Pag
e30
of 6
0
2.
Expe
nses
Exc
ludi
ng L
osse
s 20
1520
14$’
000
$’00
0(a
) E
mpl
oyee
rela
ted
expe
nses
Sala
ries
and
wag
es (i
nclu
ding
ann
ual l
eave
) 1 6,
728,
590
7,65
9,58
2
Supe
rann
uatio
n –
defin
ed b
enef
it pl
ans
144,
838
188,
889
Su
pera
nnua
tion
– de
fined
con
tribu
tion
plan
s 57
2,82
761
9,68
5
Long
ser
vice
leav
e 38
6,47
540
2,27
8
Wor
kers
’ com
pens
atio
n in
sura
nce
12
0,27
312
0,19
1
Pay
roll
tax
and
fring
e be
nefit
tax
429,
807
486,
127
R
edun
danc
y pa
ymen
ts
10,5
1344
,840
O
ther
--
428
8,39
3,32
3 9,
522,
020
1 An
amou
nt o
f $1
.8m
(20
14:
$2.3
m)
for
empl
oyee
rel
ated
exp
ense
s w
as c
apita
lised
du
ring
the
year
.
(b)
Oth
er o
pera
ting
expe
nses
incl
ude
the
follo
win
g:
A
udito
r’s re
mun
erat
ion
1
-
audi
t of t
he fi
nanc
ial s
tate
men
ts
1,21
61,
175
Cle
anin
g 26
5,74
6 30
2,81
2 C
onsu
ltant
s 33
8 24
7 C
ontra
ctor
s2
60,1
48
97,2
87
Fees
for s
ervi
ces
rend
ered
23
9,75
3 29
3,38
1 In
tern
et a
nd re
late
d ex
pens
es
59,9
27
65,5
55
Insu
ranc
e 50
,787
59
,590
M
aint
enan
ce 3
360,
137
386,
693
Min
or s
tore
s, p
rovi
sion
s, p
lant
and
com
putin
g 43
,559
13
3,31
7 O
pera
tiona
l lea
se re
ntal
exp
ense
- m
inim
um le
ase
paym
ents
46
,309
52,0
63
Post
age
and
tele
phon
e 25
,780
32
,549
Prin
ting
18,0
54
28,4
65
Sc
hool
ope
ratin
g ex
pens
es
603,
288
503,
170
Tr
avel
ling
and
sust
enan
ce
20,8
42
33,3
06
U
tiliti
es
99,9
82
129,
597
O
ther
58
,753
87
,131
1,
954,
619
2,20
6,33
8
1 The
aud
it fe
es a
re d
iscl
osed
bas
ed o
n se
rvic
es p
rovi
ded
up t
o 30
Jun
e 20
15.
The
enga
gem
ent f
ee fo
r the
aud
it of
201
4-15
fina
nci a
l sta
tem
ents
is $
1.2m
(201
4: $
1.8m
).
2 An
amou
nt o
f $19
.4m
(20
14: $
16.1
m)
for
cont
ract
or e
xpen
ses
was
cap
italis
ed d
urin
g th
e ye
ar.
3 Rec
onci
liatio
n –
Tota
l mai
nten
ance
M
aint
enan
ce e
xpen
se –
con
tract
ed la
bour
and
oth
er
(non
-em
ploy
ee re
late
d), a
s ab
ove
360,
137
386,
693
To
tal m
aint
enan
ce e
xpen
ses
incl
uded
in N
ote
2(b)
36
0,13
7 38
6,69
3
70 NSW Department of Education Annual Report 2015 | www.dec.nsw.gov.au
Financial statements
DE
PA
RTM
EN
T O
F E
DU
CA
TIO
N A
ND
CO
MM
UN
ITIE
SN
otes
to th
e fin
anci
al s
tate
men
ts fo
r yea
r end
ed 3
0 Ju
ne 2
015
Pag
e31
of 6
0
2.Ex
pens
es E
xclu
ding
Los
ses
(con
tinue
d)20
1520
14$’
000
$’00
0(c
) D
epre
ciat
ion
and
amor
tisat
ion
expe
nse
D
epre
ciat
ion:
Build
ings
and
impr
ovem
ents
42
3,49
3 53
6,87
2
Plan
t and
equ
ipm
ent
87,7
48
94,5
85
511,
241
631,
457
A
mor
tisat
ion:
Inta
ngib
les
39,0
49
42,5
68
550,
290
674,
025
(d)
Gra
nts
and
subs
idie
s
Gov
ernm
ent s
ecto
r:
Gra
nts
to C
lust
er A
genc
ies
1,20
5,77
4 15
4,06
6
Oth
er
231,
682
66,9
68
N
on-G
over
nmen
t sch
ool s
ecto
r:
Non
-Gov
ernm
ent s
choo
ls p
er c
apita
pay
men
ts
910,
260
868,
836
In
tere
st s
ubsi
dies
47
,224
50
,073
Supe
rvis
or s
ubsi
dies
35
,724
33
,788
Oth
er
577
504
O
ther
sec
tor:
Ea
rly C
hild
hood
Edu
catio
n an
d C
are
203,
640
190,
057
G
rant
s fo
r Voc
atio
nal E
duca
tion
and
Trai
ning
10
6,28
7 11
8,05
7
Ass
iste
d S
choo
l Tra
vel P
rogr
am
126,
575
115,
788
C
atho
lic E
duca
tion
Com
mis
sion
23
,540
21
,411
The
Ass
ocia
tion
of In
depe
nden
t Sch
ools
14
,937
9,
851
O
ther
10
4,80
0 13
6,15
7 3,
011,
020
1,76
5,55
6
(e)
Fina
nce
cost
s
In
tere
st e
xpen
se fr
om fi
nanc
ial l
iabi
litie
s no
t at f
air v
alue
th
roug
h pr
ofit
or lo
ss
19,5
34
19,3
81
U
nwin
ding
of d
isco
unt r
ate
--
209
19,5
34
19,5
90
DE
PA
RTM
EN
T O
F E
DU
CA
TIO
N A
ND
CO
MM
UN
ITIE
SN
otes
to th
e fin
anci
al s
tate
men
ts fo
r yea
r end
ed 3
0 Ju
ne 2
015
Pag
e32
of 6
0
3.
Rev
enue
2015
2014
(a
) A
ppro
pria
tions
$’
000
$’00
0R
ecur
rent
app
ropr
iatio
ns
Tota
l rec
urre
nt d
raw
-dow
ns fr
om N
SW
Tre
asur
y
(per
Sum
mar
y of
com
plia
nce)
12
,139
,798
11
,654
,333
Less
: Lia
bilit
y to
Con
solid
ated
Fun
d
(per
Sum
mar
y of
com
plia
nce)
(2
5,84
8)
(17,
052)
12
,113
,950
11
,637
,281
C
ompr
isin
g:
R
ecur
rent
app
ropr
iatio
ns
(p
er S
tate
men
t of c
ompr
ehen
sive
inco
me)
12
,113
,950
11
,637
,281
12,1
13,9
50
11,6
37,2
81
Cap
ital a
ppro
pria
tions
To
tal c
apita
l dra
w-d
owns
from
NS
W T
reas
ury
(p
er S
umm
ary
of c
ompl
ianc
e)
346,
628
493,
375
346,
628
493,
375
C
ompr
isin
g:
C
apita
l app
ropr
iatio
ns
(p
er S
tate
men
t of c
ompr
ehen
sive
inco
me)
34
6,62
8 49
3,37
534
6,62
8 49
3,37
5
(b)
Sal
e of
goo
ds a
nd s
ervi
ces
R
ende
ring
of s
ervi
ces
69,4
96
17,0
88
C
ours
e fe
es
615
170,
699
A
dmin
istra
tion
char
ges
-- 73
,090
Ove
rsea
s st
uden
t fee
s 68
,780
92
,537
Fees
and
cha
rges
18
,636
12
3,07
0
Oth
er
37,2
60
43,7
55
194,
787
520,
239
(c)
Inve
stm
ent r
even
ue
In
tere
st re
venu
e fro
m fi
nanc
ial a
sset
s no
t at f
air v
alue
th
roug
h pr
ofit
or lo
ss
27,3
84
38,2
17
27,3
84
38,2
17

71 NSW Department of Education Annual Report 2015 | www.dec.nsw.gov.au
Financial statements
DE
PA
RTM
EN
T O
F E
DU
CA
TIO
N A
ND
CO
MM
UN
ITIE
SN
otes
to th
e fin
anci
al s
tate
men
ts fo
r yea
r end
ed 3
0 Ju
ne 2
015
Pag
e33
of 6
0
3.
Rev
enue
(con
tinue
d)
2015
2014
$’00
0$’
000
(d)
Gra
nts
and
cont
ribut
ions
Oth
er P
ublic
Sec
tor a
genc
ies
13,5
02
60,5
20
Com
mon
wea
lth G
over
nmen
t 24
,209
26
,105
C
ontri
butio
ns o
f ass
ets
16,7
46
13
Don
atio
ns a
nd in
dust
ry c
ontri
butio
ns
54,0
41
56,7
5510
8,49
8 14
3,39
3
(e)
Acc
epta
nce
by th
e C
row
n E
ntity
of
em
ploy
ee b
enef
its a
nd o
ther
liab
ilitie
s
The
follo
win
g lia
bilit
ies
and/
or e
xpen
ses
have
bee
n
assu
med
by
the
Cro
wn
Ent
ity o
r oth
er g
over
nmen
t en
titie
s:
Su
pera
nnua
tion
– de
fined
ben
efit
144,
838
187,
365
Lo
ng s
ervi
ce le
ave
38
6,47
5 40
2,20
4
Pay
roll
tax
7,84
0 10
,105
539,
153
599,
674
(f)
Oth
er re
venu
e
Scho
ol g
ener
ated
reve
nue
425,
760
346,
905
O
ther
33
,828
12
,287
45
9,58
8 35
9,19
2
(g)
Per
sonn
el s
ervi
ces
reve
nue
-- 28
,806
--
28,8
06
4.G
ain/
(Los
s) o
n D
ispo
sal
P
rope
rty, p
lant
and
equ
ipm
ent
P
roce
eds
from
dis
posa
l --
25
2
Writ
ten
dow
n va
lue
(6
,206
) (1
1,95
1)
Gai
n/(L
oss)
on
disp
osal
(6
,206
) (1
1,69
9)
5.
Oth
er G
ains
/(Los
ses)
Dis
posa
l of n
on-c
urre
nt a
sset
s he
ld fo
r sal
e (2
35)
187
Fo
reig
n cu
rren
cy g
ain/
(loss
) --
5
Im
pairm
ent o
f rec
eiva
bles
(2
61)
740
(496
) 93
2
DE
PA
RTM
EN
T O
F E
DU
CA
TIO
N A
ND
CO
MM
UN
ITIE
SN
otes
to th
e fin
anci
al s
tate
men
ts fo
r yea
r end
ed 3
0 Ju
ne 2
015
Pag
e34
of 6
0
6.
Con
ditio
ns o
n C
ontr
ibut
ions
Con
tribu
tors
can
pla
ce r
estri
ctio
ns o
n th
e ap
plic
atio
n of
fund
s to
ass
ist i
n en
surin
g th
at th
e in
tend
ed o
utco
mes
of
the
parti
cula
r pro
gram
are
met
. Exa
mpl
es o
f suc
h co
nditi
ons
are
the
requ
irem
ent t
o pr
ovid
e an
nual
acq
uitta
ls
of e
xpen
ditu
re o
r to
retu
rn fu
nds
at th
e en
d of
a s
peci
fic p
erio
d.
In t
he 2
014-
15 f
inan
cial
yea
r co
ntrib
utio
ns a
mou
ntin
g to
$31
.8m
(20
14:
$35.
0m)
wer
e re
ceiv
ed b
y th
e D
epar
tmen
t for
pro
gram
s w
here
suc
h co
nditi
ons
wer
e in
pla
ce.
Uns
pent
fun
ds f
rom
the
se c
ontri
butio
ns f
or 2
014-
15,
incl
udin
g ba
lanc
es b
roug
ht f
orw
ard
from
prio
r ye
ars,
to
talle
d $2
1.9m
(201
4: $
10.5
m).
7.
Serv
ice
Gro
ups
of th
e D
epar
tmen
t
Follo
win
g is
a li
st o
f the
Ser
vice
Gro
ups
of th
e D
epar
tmen
t. In
ord
er to
com
ply
with
the
requ
irem
ents
of
AA
SB
105
2 D
isag
greg
ated
Dis
clos
ures
, the
Dep
artm
ent d
eter
min
ed th
at s
ome
asse
ts a
nd li
abili
ties
coul
d be
attr
ibut
ed t
o S
ervi
ce G
roup
s w
hile
, w
ith th
e lim
itat io
n of
cur
rent
fina
ncia
l sys
tem
s, s
ome
asse
ts a
nd
liabi
litie
s w
ere
appo
rtion
ed o
n a
pro
rata
bas
is.
The
rem
aini
ng a
sset
s an
d lia
bilit
ies
that
cou
ld n
ot b
e re
liabl
y at
tribu
ted
have
bee
n di
sclo
sed
as “
Not
Attr
ibut
able
” in
acc
orda
nce
with
Tre
asur
y P
olic
y Pa
per
TPP
15-0
1.
Serv
ice
G
roup
24.
1 Ea
rly C
hild
hood
Edu
catio
n Se
rvic
es
Obj
ectiv
e(s)
To p
rovi
de a
nd re
gula
te e
arly
chi
ldho
od e
duca
tion
and
care
, inc
ludi
ng p
resc
hool
s.
Serv
ice
Gro
up 2
4.2
Prim
ary
Educ
atio
n Se
rvic
es in
Gov
ernm
ent S
choo
ls
Obj
ectiv
e(s)
To s
taff
and
supp
ort 1
,617
prim
ary
scho
ols,
67
cent
ral s
choo
ls a
nd 1
14 s
choo
ls fo
r sp
ecia
l pur
pose
s an
d en
viro
nmen
tal e
duca
t ion
cent
res
to d
eliv
er q
ualit
y ed
ucat
ion
serv
ices
that
mee
t the
div
erse
nee
ds o
f all
stud
ents
.
Serv
ice
G
roup
24.
3 Se
cond
ary
Educ
atio
n Se
rvic
es in
Gov
ernm
ent S
choo
ls
Obj
ectiv
e(s)
To s
taff
and
supp
ort 3
98 s
econ
dary
sch
ools
and
env
ironm
enta
l edu
catio
n ce
ntre
s to
de
liver
qua
lity
educ
atio
n ai
med
at i
ncre
asin
g th
e at
tain
men
t of s
tude
nts
and
mee
ting
thei
r div
erse
nee
ds.
Serv
ice
G
roup
24.
4 N
on-G
over
nmen
t Sch
ools
Obj
ectiv
e(s)
To
prov
ide
fund
ing
to
non-
gove
rnm
ent
scho
ols
to
impr
ove
stud
ent
lear
ning
ou
tcom
es a
nd a
ssis
t the
m to
suc
cess
fully
com
plet
e Y
ear 1
2 or
VE
T eq
uiva
lent
.
Serv
ice
G
roup
24.
5TA
FE N
SW
Obj
ectiv
e(s)
In
acc
orda
nce
with
the
Pub
lic F
inan
ce a
nd A
udit
Am
endm
ent
(TA
FE C
omm
issi
on)
Reg
ulat
ion
2014
, TA
FE
sepa
rate
d fro
m
the
Dep
artm
ent
of
Educ
atio
n an
d C
omm
uniti
es fr
om 1
Jul
y 20
14.
Obj
ectiv
es h
ave
been
pro
vide
d fo
r prio
r yea
r com
para
tive
purp
oses
onl
y.
To d
eliv
er c
ost-e
ffici
ent t
rain
ing
serv
ices
thr
ough
TA
FE N
SW
Inst
itute
s, o
nlin
e an
d in
wor
kpla
ces,
to im
prov
e sk
ills,
incr
ease
hig
her q
ualif
icat
ion
leve
ls a
mon
g th
e N
SW
popu
latio
n, b
oth
rura
l and
urb
an, a
nd s
uppo
rt w
orkf
orce
dev
elop
men
t.
Serv
ice
G
roup
24.
6 Vo
catio
nal E
duca
tion
and
Trai
ning
Obj
ectiv
e(s)
To d
evel
op a
nd p
rom
ote
a qu
ality
voc
atio
nal
educ
atio
n an
d tra
inin
g sy
stem
tha
t en
hanc
es s
kills
for
indu
stry
and
indi
vidu
als.
The
Sm
art
and
Ski
lled
refo
rms
of t
he
NS
W
voca
tiona
l ed
ucat
ion
and
train
ing
syst
em
intro
duce
d an
en
title
men
t to
go
vern
men
t sub
sidi
sed
entry
leve
l tra
inin
g up
to C
ertif
icat
e III
from
1 J
anua
ry 2
015.

72 NSW Department of Education Annual Report 2015 | www.dec.nsw.gov.au
Financial statements
DE
PA
RTM
EN
T O
F E
DU
CA
TIO
N A
ND
CO
MM
UN
ITIE
SN
otes
to th
e fin
anci
al s
tate
men
ts fo
r yea
r end
ed 3
0 Ju
ne 2
015
Pag
e35
of 6
0
7.Se
rvic
e G
roup
s of
the
Dep
artm
ent (
cont
inue
d)
Serv
ice
G
roup
24.
7Sp
ort a
nd R
ecre
atio
n Se
rvic
es
Obj
ectiv
e(s)
In
acc
orda
nce
with
the
Adm
inis
trativ
e A
rran
gem
ents
(A
dmin
istra
tive
Cha
nges
-
Mis
cella
neou
s A
genc
ies)
Ord
er 2
014
this
fun
ctio
n w
as t
rans
ferr
ed t
o th
e O
ffice
of
Spo
rt fro
m 1
Jul
y 20
14.
Obj
ectiv
es h
ave
been
pro
vide
d fo
r prio
r yea
r com
para
tive
purp
oses
onl
y.
To d
eliv
er s
port
and
recr
eatio
n pr
ogra
ms,
inc
ludi
ng i
mpl
emen
tatio
n of
pol
icy
and
regu
lato
ry f
ram
ewor
ks,
con
duct
of
com
plia
nce
and
educ
atio
n pr
ogra
ms
and
to
prov
ide
gran
ts t
o pe
ak s
porti
ng b
odie
s; t
o ad
min
iste
r gr
ants
pro
gram
s to
ass
ist
in
deve
lopi
ng c
omm
unity
spo
rting
and
rec
reat
iona
l ven
ues
and
faci
litie
s an
d m
anag
e go
vern
men
t-ow
ned
or c
ontro
lled
spor
ting
and
recr
eatio
n fa
cilit
ies.
Serv
ice
G
roup
24.
8A
borig
inal
Affa
irs
Obj
ectiv
e(s)
W
orks
in
pa
rtner
ship
w
ith
Abo
rigin
al
peop
le
to
stre
ngth
en
thei
r ca
paci
ty
and
incr
ease
thei
r acc
ess
to o
ppor
tuni
ties
by im
plem
entin
g O
CH
RE
(opp
ortu
nity
, cho
ice,
he
alin
g, re
spon
sibi
lity,
em
pow
erm
ent)
- the
Gov
ernm
ent's
pla
n fo
r Abo
rigin
al A
ffairs
; es
tabl
ishi
ng
partn
ersh
ips
for
econ
omic
de
velo
pmen
t; su
ppor
ting
effe
ctiv
e co
mm
unity
gov
erna
nce;
and
stre
ngth
enin
g cu
ltura
l ide
ntity
and
lang
uage
.
Serv
ice
G
roup
24.
9C
itize
nshi
p an
d C
omm
uniti
es
Obj
ectiv
e(s)
D
eliv
ers
initi
ativ
es w
ithin
the
NS
W V
olun
teer
ing
Stra
tegy
, fac
ilitat
es o
ppor
tuni
ties
to
empo
wer
you
ng p
eopl
e, a
nd s
uppo
rts c
omm
unity
eng
agem
ent
activ
ities
. It
also
pr
ovid
es a
n ad
voca
cy r
ole
for
child
ren
and
youn
g pe
ople
and
pro
vide
s ad
vice
on
child
and
you
th r
elat
ed m
atte
rs t
o go
vern
men
t an
d no
n-go
vern
men
t ag
enci
es i
n N
ew S
outh
Wal
es.
In p
rior
year
, th
e ob
ject
ives
of
this
ser
vice
gro
up a
lso
supp
orte
d co
mm
emor
ativ
e ac
tivity
to
hono
ur t
he s
ervi
ce a
nd s
acrif
ice
of v
eter
ans.
In
acco
rdan
ce w
ith t
he
Adm
inis
trativ
e A
rran
gem
ents
(A
dmin
istra
tive
Cha
nges
- M
isce
llane
ous
Age
ncie
s)
Ord
er 2
014,
this
func
tion
was
tran
sfer
red
to th
e D
epar
tmen
t of P
rem
ier a
nd C
abin
et
from
1 J
uly
2014
.
Serv
ice
G
roup
24.
10Pe
rson
nel S
ervi
ces
Obj
ectiv
e(s)
In
ac
cord
ance
w
ith
the
Adm
inis
trativ
e A
rran
gem
ents
(A
dmin
istra
tive
Cha
nges
- M
isce
llane
ous
Age
ncie
s) O
rder
201
4 th
is fu
nctio
n tra
nsfe
rred
to th
e O
ffice
of S
port
from
1 J
uly
2014
.
Obj
ectiv
es h
ave
been
pro
vide
d fo
r prio
r yea
r com
para
tive
purp
oses
onl
y.
To p
rovi
de p
erso
nnel
ser
vice
s to
the
follo
win
g ag
enci
es:
C
omba
t Spo
rts A
utho
rity
of N
SW
Ven
ues
NS
W
Syd
ney
Oly
mpi
c P
ark
Aut
horit
y
Serv
ice
G
roup
24.
11C
lust
er G
rant
Fun
ding
Obj
ectiv
e(s)
To
pro
vide
gra
nt fu
ndin
g to
age
ncie
s w
ithin
the
Edu
catio
n an
d C
omm
uniti
es c
lust
er.
This
inc
lude
s fu
ndin
g to
Mul
ticul
tura
l N
ew S
outh
Wal
es,
the
Boar
d of
Stu
dies
, Te
achi
ng a
nd E
duca
tiona
l S
tand
ards
, th
e S
ydne
y O
lym
pic
Par
k A
utho
rity
and
TAFE
.
An
adm
inis
trativ
e re
stru
ctur
e to
ok e
ffect
, whi
ch le
d to
cha
nges
to th
e D
epar
tmen
t’s
clus
ter
fund
ing
arra
ngem
ents
. Fr
om 1
Jul
y 20
14,
the
Dep
artm
ent
only
pro
vide
s fu
ndin
g to
Mul
ticul
tura
l N
ew S
outh
Wal
es,
the
Boa
rd o
f S
tudi
es,
Teac
hing
and
Ed
ucat
iona
l Sta
ndar
ds, a
nd T
AFE
.
DE
PA
RTM
EN
T O
F E
DU
CA
TIO
N A
ND
CO
MM
UN
ITIE
SN
otes
to th
e fin
anci
al s
tate
men
ts fo
r yea
r end
ed 3
0 Ju
ne 2
015
Pag
e36
of 6
0
8.
Cur
rent
Ass
ets
– C
ash
and
Cas
h Eq
uiva
lent
s 20
15
2014
$’
000
$’00
0
Cas
h at
ban
k an
d on
han
d
775,
263
1,12
5,56
1 77
5,26
3 1,
125,
561
Fo
r the
pur
pose
s of
the
stat
emen
t of c
ash
flow
s, c
ash
and
cash
equ
ival
ents
incl
ude
cash
at b
ank,
cas
h on
han
d, s
hort
term
dep
osits
and
ban
k ov
erdr
aft.
Cas
h an
d ca
sh e
quiv
alen
t as
sets
rec
ogni
sed
in t
he s
tate
men
t of
fin
anci
al p
ositi
on
are
reco
ncile
d at
the
end
of
the
finan
cial
yea
r to
the
sta
tem
ent
of c
ash
flow
s as
fo
llow
s:
C
ash
and
cash
equ
ival
ents
(p
er s
tate
men
t of f
inan
cial
pos
ition
) 77
5,26
3 1,
125,
561
C
losi
ng c
ash
and
cash
equ
ival
ents
(per
sta
tem
ent o
f cas
h flo
ws)
77
5,26
3 1,
125,
561
Ref
er N
ote
26 f
or d
etai
ls r
egar
ding
cre
dit
risk,
liqu
idity
ris
k an
d m
arke
t ris
k ar
isin
g fro
m fi
nanc
ial i
nstru
men
ts.
9.C
urre
nt/N
on-C
urre
nt A
sset
s –
Rec
eiva
bles
Cur
rent
:
Sa
le o
f goo
ds a
nd s
ervi
ces
11,3
72
25,5
95
Le
ss: A
llow
ance
for i
mpa
irmen
t (5
,742
) (6
,561
)
Per
sonn
el s
ervi
ces
rece
ivab
le
-- 3,
622
O
ther
deb
tors
30
,956
59
,687
Prep
aym
ents
21
,953
16
,250
Acc
rued
inco
me
11,4
89
33,2
85
70,0
28
131,
878
Non
-Cur
rent
:
Long
term
leas
e pr
epai
d --
4,57
2
Oth
er d
ebto
rs
8,42
9 9,
575
8,42
9 14
,147
M
ovem
ent i
n th
e al
low
ance
for i
mpa
irmen
t:
Bala
nce
at 1
Jul
y (6
,561
) (7
,525
)
Oth
er a
djus
tmen
t (ad
min
istra
tive
rest
ruct
ure)
89
2 --
A
mou
nts
writ
ten
off d
urin
g th
e ye
ar
190
224
A
mou
nts
reco
vere
d du
ring
the
year
63
1,
270
(Incr
ease
)/Dec
reas
e in
allo
wan
ce re
cogn
ised
in p
rofit
or
loss
(3
26)
(530
)
Bala
nce
at 3
0 Ju
ne
(5,7
42)
(6,5
61)
Ref
er N
ote
26 fo
r det
ails
rega
rdin
g cr
edit
risk,
liqu
idity
risk
and
mar
ket r
isk
aris
ing
from
fina
ncia
l ins
trum
ents
.

73 NSW Department of Education Annual Report 2015 | www.dec.nsw.gov.au
Financial statements
DE
PA
RTM
EN
T O
F E
DU
CA
TIO
N A
ND
CO
MM
UN
ITIE
SN
otes
to th
e fin
anci
al s
tate
men
ts fo
r yea
r end
ed 3
0 Ju
ne 2
015
Pag
e37
of 6
0
10.
Cur
rent
/Non
-Cur
rent
Ass
ets
– O
ther
Fin
anci
al A
sset
s20
15
2014
$’
000
$’00
0
Cur
rent
:
Hel
d to
mat
urity
inve
stm
ents
18
,628
22
,176
18
,628
22,1
76
N
on-C
urre
nt:
E
quity
acc
ount
ed -
Ads
kill
Sdn
Bhd
Sha
res
at c
ost
-- 55
Sha
re o
f ret
aine
d pr
ofit
on in
vest
men
t --
105
To
tal e
quity
acc
ount
ed
--16
0
O
ther
loan
s an
d de
posi
ts:
Fi
xed
inte
rest
dep
osit
1 --
11
1
Sha
res
in C
offs
Har
bour
Tec
hnol
ogy
Par
k Lt
d --
175
-- 28
6
--
446
Ref
er N
ote
26 fo
r det
ails
rega
rdin
g cr
edit
risk,
liqu
idity
risk
and
mar
ket r
isk
aris
ing
from
fina
ncia
l ins
trum
ents
.
1In
2013
-14,
the
non-
curre
nt fi
xed
inte
rest
dep
osit
was
par
t of r
estri
cted
ass
ets.
R
efer
Not
e 15
.
11.
Non
-Cur
rent
Ass
ets
– Pr
oper
ty, P
lant
and
Equ
ipm
ent
Land
B
uild
ings
Pl
ant a
nd
Equi
pmen
t To
tal
$’
000
$’00
0$’
000
$’00
0A
t 1 J
uly
2014
– fa
ir va
lue
G
ross
car
ryin
g am
ount
7,
676,
772
32,9
03,4
56
884,
970
41,4
65,1
98
Ac
cum
ulat
ed d
epre
ciat
ion
and
impa
irmen
t --
(15,
592,
276)
(6
15,5
69)
(16,
207,
845)
Net
car
ryin
g am
ount
7,
676,
772
17,3
11,1
80
269,
401
25,2
57,3
53
At 3
0 Ju
ne 2
015
– fa
ir va
lue
G
ross
car
ryin
g am
ount
7,
537,
030
26,4
69,7
21
747,
786
34,7
54,5
37
Ac
cum
ulat
ed d
epre
ciat
ion
and
impa
irmen
t --
(13,
184,
414)
(5
48,0
91)
(13,
732,
505)
Net
car
ryin
g am
ount
7,
537,
030
13,2
85,3
07
199,
695
21,0
22,0
32
At 1
Jul
y 20
13 –
fair
valu
e
Gro
ss c
arry
ing
amou
nt
7,64
6,63
5 32
,468
,403
83
4,91
7 40
,949
,955
Accu
mul
ated
dep
reci
atio
n an
d im
pairm
ent
-- (1
5,18
1,68
7)
(526
,792
) (1
5,70
8,47
9)
N
et c
arry
ing
amou
nt
7,64
6,63
5 17
,286
,716
308,
125
25,2
41,4
76
A
t 30
June
201
4 –
fair
valu
e
Gro
ss c
arry
ing
amou
nt7,
676,
772
32,9
03,4
5688
4,97
041
,465
,198
Ac
cum
ulat
ed d
epre
ciat
ion
and
impa
irmen
t --
(15,
592,
276)
(6
15,5
69)
(16,
207,
845)
Net
car
ryin
g am
ount
7,
676,
772
17,3
11,1
8026
9,40
125
,257
,353
DE
PA
RTM
EN
T O
F E
DU
CA
TIO
N A
ND
CO
MM
UN
ITIE
SN
otes
to th
e fin
anci
al s
tate
men
ts fo
r yea
r end
ed 3
0 Ju
ne 2
015
Pag
e38
of 6
0
11.
Non
-Cur
rent
Ass
ets
– Pr
oper
ty, P
lant
and
Equ
ipm
ent (
cont
inue
d)
Rec
onci
liatio
n
A re
conc
iliat
ion
of th
e ca
rryi
ng a
mou
nt o
f eac
h cl
ass
of p
rope
rty, p
lant
and
equ
ipm
ent a
t the
beg
inni
ng a
nd
end
of th
e cu
rren
t rep
ortin
g pe
riod
is s
et o
ut b
elow
:
Land
B
uild
ings
Plan
t and
Eq
uipm
ent
Tota
lYe
ar e
nded
30
June
201
5 $’
000
$’00
0$’
000
$’00
0
Net
car
ryin
g am
ount
at s
tart
of y
ear
7,67
6,77
2 17
,311
,180
26
9,40
1 25
,257
,353
R
ecla
ssifi
catio
n 3,
577
(3,6
30)
53
--
Addi
tions
47
,429
23
7,51
3 70
,099
35
5,04
1
Tran
sfer
s to
Ass
ets
held
for s
ale
(1,0
48)
(970
) (2
9)
(2,0
47)
D
ispo
sals
(6
) (6
,205
) (1
) (6
,212
)
Net
reva
luat
ion
1 57
6,06
1 --
-- 57
6,06
1
Tran
sfer
s th
roug
h ad
min
istra
tive
rest
ruct
ures
(7
64,1
27)
(3,8
28,5
66)
(52,
080)
(4
,644
,773
)
Tran
sfer
s to
oth
er g
over
nmen
t age
ncie
s (1
,628
) (5
22)
-- (2
,150
)
Dep
reci
atio
n ex
pens
e --
(423
,493
) (8
7,74
8)
(511
,241
)
Net
car
ryin
g am
ount
at e
nd o
f yea
r 7,
537,
030
13
,285
,307
19
9,69
5 21
,022
,032
Fu
rther
det
ails
rega
rdin
g th
e fa
ir va
lue
mea
sure
men
t of p
rope
rty, p
lant
and
equ
ipm
ent a
re d
iscl
osed
in N
ote
14.
1 A c
ompr
ehen
sive
reva
luat
ion
of la
nd w
as u
nder
take
n fo
r yea
r end
ed 3
0 Ju
ne 2
015.
Thi
s pr
oces
s ha
s re
sulte
d in
an
incr
ease
to th
e ca
rryi
ng a
mou
nt o
f lan
d of
$57
6.1m
for y
ear e
nded
30
June
201
5, re
flect
ed a
s an
incr
ease
of
$57
6.1m
to th
e A
sset
Rev
alua
tion
Sur
plus
.
Rec
onci
liatio
n
A re
conc
iliat
ion
of th
e ca
rryi
ng a
mou
nt o
f ea
ch c
lass
of
prop
erty
, pla
nt a
nd e
quip
men
t at t
he b
egin
ning
and
en
d of
the
prio
r rep
ortin
g pe
riod
is s
et o
ut b
elow
:
La
nd
Bui
ldin
gsPl
ant a
nd
Equi
pmen
t To
tal
Ye
ar e
nded
30
June
201
4 $’
000
$’00
0$’
000
$’00
0
Net
car
ryin
g am
ount
at s
tart
of y
ear
7,64
6,63
5 17
,286
,716
308,
125
25,2
41,4
76A
dditi
ons
41,2
11
346,
732
56,7
6744
4,71
0Tr
ansf
er to
Ass
ets
held
for s
ale
(11,
074)
--
--(1
1,07
4)D
ispo
sals
--
(26,
443)
(794
)(2
7,23
7)O
ther
1 --
241,
241
--24
1,24
1Tr
ansf
ers
thro
ugh
adm
inis
trativ
e re
stru
ctur
es
-- (1
94)
(112
)(3
06)
Dep
reci
atio
n ex
pens
e --
(536
,872
)(9
4,58
5)(6
31,4
57)
Net
car
ryin
g am
ount
at e
nd o
f yea
r 7,
676,
772
17,3
11,1
8026
9,40
1 25
,257
,353
Furth
er d
etai
ls re
gard
ing
the
fair
valu
e m
easu
rem
ent o
f pro
perty
, pla
nt a
nd e
quip
men
t are
dis
clos
ed in
Not
e 14
.
1 A c
ompr
ehen
sive
rev
alua
tion
of l
and
and
build
ings
was
und
erta
ken
for
the
year
end
ed 3
0 Ju
ne 2
013.
A
revi
ew o
f th
e bu
ildin
g re
valu
atio
n m
odel
and
rea
lignm
ent
of t
he u
nder
lyin
g as
set
regi
ster
s w
ith t
he g
ener
al
ledg
er a
s at
30
June
201
4 w
as p
erfo
rmed
. Thi
s pr
oces
s ha
s re
sulte
d in
an
incr
ease
of $
241.
2m fo
r th
e ye
ar
ende
d 30
Jun
e 20
14.

74 NSW Department of Education Annual Report 2015 | www.dec.nsw.gov.au
Financial statements
DE
PA
RTM
EN
T O
F E
DU
CA
TIO
N A
ND
CO
MM
UN
ITIE
SN
otes
to th
e fin
anci
al s
tate
men
ts fo
r yea
r end
ed 3
0 Ju
ne 2
015
Pag
e39
of 6
0
12.
Inta
ngib
le A
sset
s20
15
$’00
0 20
14
$’00
0
Softw
are
A
t 1 J
uly
C
ost (
gros
s ca
rryi
ng a
mou
nt)
684,
740
629,
501
A
ccum
ulat
ed a
mor
tisat
ion
and
impa
irmen
t (2
56,7
27)
(214
,179
)
Net
car
ryin
g am
ount
42
8,01
3 41
5,32
2
At 3
0 Ju
ne
C
ost (
gros
s ca
rryi
ng a
mou
nt)
555,
563
684,
740
A
ccum
ulat
ed a
mor
tisat
ion
and
impa
irmen
t (2
24,6
33)
(256
,727
)
Net
car
ryin
g am
ount
33
0,93
0 42
8,01
3
Year
end
ed 3
0 Ju
ne
N
et c
arry
ing
amou
nt a
t sta
rt of
yea
r 42
8,01
3 41
5,32
2
Add
ition
s (fr
om in
tern
al d
evel
opm
ent)
5,69
9 55
,259
Tran
sfer
s th
roug
h ad
min
istra
tive
rest
ruct
ures
(6
3,73
3)
--
Am
ortis
atio
n ex
pens
e (3
9,04
9)
(42,
568)
Net
car
ryin
g am
ount
at e
nd o
f yea
r 33
0,93
0 42
8,01
3
13.
Non
-Cur
rent
Ass
ets
(or D
ispo
sal G
roup
s) H
eld
for S
ale
Ass
ets
held
for s
ale
La
nd a
nd b
uild
ings
77
9 1,
610
779
1,61
0
Am
ount
s re
cogn
ised
in o
ther
com
preh
ensi
ve
inco
me
rela
ting
to a
sset
s he
ld fo
r sal
e
Pro
perty
, pla
nt a
nd e
quip
men
t ass
et re
valu
atio
n in
crem
ents
/(dec
rem
ents
)12
5 17
8
125
178
The
asse
ts h
eld
for s
ale
cons
ist p
rimar
ily o
f lan
d an
d so
me
build
ings
whi
ch h
ave
beco
me
surp
lus
to th
e D
epar
tmen
t’s re
quire
men
ts. I
t is
inte
nded
that
thes
e be
dis
pose
d by
way
of
sale
. Ste
ps h
ave
been
take
n fo
r th
is p
urpo
se a
nd it
is li
kely
that
the
disp
osal
s w
ill o
ccur
w
ithin
the
next
12
mon
ths.
Furth
er d
etai
ls re
gard
ing
fair
valu
e m
easu
rem
ent a
re d
iscl
osed
in N
ote
14.
DE
PA
RTM
EN
T O
F E
DU
CA
TIO
N A
ND
CO
MM
UN
ITIE
SN
otes
to th
e fin
anci
al s
tate
men
ts fo
r yea
r end
ed 3
0 Ju
ne 2
015
Pag
e40
of 6
0
14.
Fair
valu
e m
easu
rem
ent o
f non
-fina
ncia
l ass
ets
(a)
Fair
valu
e hi
erar
chy
Leve
l 1
Leve
l 2
Leve
l 3
Tota
l fai
r va
lue
20
15$’
000
$’00
0 $’
000
$’00
0
Pro
perty
(Not
e 11
)
Land
--
-- 7,
523,
965
7,52
3,96
5
Bui
ldin
gs
-- --
13,1
15,2
7113
,115
,271
Res
iden
ces
-- 21
,249
--
21,2
49
Non
-cur
rent
ass
ets
(or
disp
osal
gr
oups
) hel
d fo
r sal
e (N
ote
13)
--
779
--
779
--22
,028
20,6
39,2
3620
,661
,264
Th
ere
wer
e no
tran
sfer
s be
twee
n Le
vel 1
or 2
dur
ing
the
year
.
Leve
l 1
Leve
l 2
Leve
l 3
Tota
l fai
r va
lue
20
14$’
000
$’00
0 $’
000
$’00
0
Pro
perty
(Not
e 11
)
Land
--
-- 7,
676,
772
7,67
6,77
2
Bui
ldin
gs
-- --
16,8
95,6
9516
,895
,695
Res
iden
ces
-- 23
,429
--
23,4
29
--23
,429
24,5
72,4
6724
,595
,896
Th
ere
wer
e no
tran
sfer
s be
twee
n Le
vel 1
or 2
dur
ing
the
year
.
(b)
Valu
atio
n te
chni
ques
, inp
uts
and
proc
esse
s
The
follo
win
g ta
ble
show
s th
e va
luat
ion
tech
niqu
es u
sed
in m
easu
ring
the
fair
valu
e of
pro
perty
for L
evel
2
fair
valu
es.
Leve
l 2 –
Res
iden
tial p
rope
rtie
s Va
luat
ion
tech
niqu
e an
d in
puts
Mar
ket v
alue
: Qua
lifie
d va
luer
s fro
m th
e A
ustra
lian
Val
uatio
n O
ffice
wer
e en
gage
d by
the
Teac
her H
ousi
ng
Auth
ority
of
NS
W,
who
man
ages
the
Dep
artm
ent’s
tea
cher
res
iden
ces,
to
carr
y ou
t th
e va
luat
ions
of
resi
dent
ial p
rope
rties
. The
val
ue fo
r re
side
nces
is d
eter
min
ed b
y an
alys
ing
curre
nt m
arke
t sal
es e
vide
nce
with
in t
he t
own
loca
lity.
Adj
ustm
ents
are
mad
e fo
r lo
catio
n, c
ondi
tion
and
com
para
bilit
y di
ffere
nces
be
twee
n th
e sa
les
evid
ence
and
the
resi
dent
ial p
rope
rties
.
Leve
l 2 –
Non
-cur
rent
ass
ets
held
for s
ale
Valu
atio
n te
chni
que
and
inpu
tsM
arke
t va
lue:
Qua
lifie
d va
luer
s w
ere
enga
ged
thro
ugh
the
Offi
ce o
f Fi
nanc
e an
d S
ervi
ces
to u
nder
take
va
luat
ions
for
non-
curre
nt a
sset
s he
ld fo
r sa
le. F
or th
ese
land
site
s th
ere
are
no s
uch
rest
rictio
ns a
nd th
e m
arke
t val
ue is
det
erm
ined
by
anal
ysin
g cu
rrent
mar
ket s
ales
evi
denc
e.

75 NSW Department of Education Annual Report 2015 | www.dec.nsw.gov.au
Financial statements
DE
PA
RTM
EN
T O
F E
DU
CA
TIO
N A
ND
CO
MM
UN
ITIE
SN
otes
to th
e fin
anci
al s
tate
men
ts fo
r yea
r end
ed 3
0 Ju
ne 2
015
Pag
e41
of 6
0
14.
Fair
valu
e m
easu
rem
ent o
f non
-fina
ncia
l ass
ets
(con
tinue
d)
(b)
Valu
atio
n te
chni
ques
, inp
uts
and
proc
esse
s (c
ontin
ued)
The
follo
win
g ta
ble
show
s th
e va
luat
ion
tech
niqu
es u
sed
in m
easu
ring
the
fair
valu
e of
pro
perty
as
wel
l as
th
e si
gnifi
cant
uno
bser
vabl
e in
puts
use
d fo
r Lev
el 3
fair
valu
es.
Leve
l 3 –
Sch
ool b
uild
ings
and
spe
cial
ised
pro
pert
ies
Valu
atio
n te
chni
que
Sign
ifica
nt u
nobs
erva
ble
inpu
ts
Sens
itivi
ty o
f the
fa
ir va
lue
mea
sure
men
t to
chan
ges
in
unob
serv
able
in
puts
Dep
reci
ated
repl
acem
ent c
ost:
Scho
ol b
uild
ings
D
ue to
the
size
of t
he s
choo
l bu
ildin
g po
rtfol
io a
mas
s ap
prai
sal t
echn
ique
was
use
d fo
r th
e re
valu
atio
n.
Rep
lace
men
t cos
t rat
es fo
r the
as
set c
ompo
nent
s w
ere
prov
ided
by
the
Offi
ce o
f Fin
ance
and
S
ervi
ces.
The
repl
acem
ent c
ost
rate
s w
ere
dete
rmin
ed b
ased
on
the
cost
of r
ecen
tly b
uilt
build
ings
w
hich
wer
e re
pres
enta
tive
of th
e re
mai
nder
of t
he p
ortfo
lio. T
hese
re
plac
emen
t cos
t rat
es w
ere
test
ed a
gain
st ra
tes
prov
ided
by
inde
pend
ent e
xter
nal q
uant
ity
surv
eyor
s. In
ord
er to
det
erm
ine
the
repl
acem
ent c
ost o
f an
indi
vidu
al b
uild
ing,
adj
ustm
ents
to
the
repl
acem
ent c
ost r
ates
are
m
ade
for l
ocat
ion
and
spec
ial
need
requ
irem
ents
. M
anag
emen
t det
erm
ined
the
usef
ul li
ves
and
depr
ecia
tion
rate
s ba
sed
on in
tern
al a
naly
sis,
co
nsul
tatio
n w
ith O
ffice
of
Fina
nce
and
Serv
ices
and
re
cogn
ised
indu
stry
pub
licat
ions
.
Scho
ol b
uild
ings
:
Rep
lace
men
t cos
t per
squ
are
met
re
(line
ar m
etre
for f
enci
ng) f
or th
e fo
llow
ing
asse
t com
pone
nts:
A
sset
com
pone
nt
Ran
ge
(wei
ghte
d av
erag
e)
Bui
ldin
g sh
ell
$350
- $2
,638
($
1,25
4)
Roo
m fi
t-out
$3
45 -
$2,6
08
($70
3)
Ext
erna
l ser
vice
s $1
94 -
$330
($
260)
So
ft la
ndsc
apin
g $1
8 - $
24 ($
22)
Har
d la
ndsc
apin
g $2
63 -
$287
($
275)
Fe
ncin
g $1
18 -
$206
($
155)
D
emou
ntab
les
$183
- $4
,869
($
1,75
7)
O
ther
inpu
ts:
Inpu
t W
eigh
ted
aver
age
rem
aini
ng u
sefu
l lif
e
56
year
s
Tota
l Gro
ss fl
oor
area
8
,964
,440
sqm
Land
scap
ing
squa
re m
etre
s pe
r gr
oss
floor
are
a of
bu
ildin
gs
4.5
Tota
l per
imet
er fo
r al
l site
s 1
,765
,611
m
The
estim
ated
fair
valu
e w
ould
in
crea
se/(d
ecre
ase)
if
the
repl
acem
ent c
ost
per s
quar
e m
etre
for
the
asse
t co
mpo
nent
s w
ere
high
er/(l
ower
).
DE
PA
RTM
EN
T O
F E
DU
CA
TIO
N A
ND
CO
MM
UN
ITIE
SN
otes
to th
e fin
anci
al s
tate
men
ts fo
r yea
r end
ed 3
0 Ju
ne 2
015
Pag
e42
of 6
0
14.
Fair
valu
e m
easu
rem
ent o
f non
-fina
ncia
l ass
ets
(con
tinue
d)
(b)
Valu
atio
n te
chni
ques
, inp
uts
and
proc
esse
s (c
ontin
ued)
The
follo
win
g ta
ble
show
s th
e va
luat
ion
tech
niqu
es u
sed
in m
easu
ring
the
fair
valu
e of
pro
perty
as
wel
l as
the
sign
ifica
nt u
nobs
erva
ble
inpu
ts u
sed
for L
evel
3 fa
ir va
lues
(con
tinue
d).
Leve
l 3 –
Sch
ool b
uild
ings
and
spe
cial
ised
pro
pert
ies
Valu
atio
n te
chni
que
Sign
ifica
nt u
nobs
erva
ble
inpu
ts
Sens
itivi
ty o
f the
fa
ir va
lue
mea
sure
men
t to
chan
ges
in
unob
serv
able
inpu
ts
Dep
reci
ated
repl
acem
ent c
ost:
Oth
er b
uild
ings
Q
ualif
ied
valu
ers
of th
e O
ffice
of
Fina
nce
and
Serv
ices
per
form
ed
the
valu
atio
n of
the
spec
ialis
ed
build
ings
for D
EC
. The
cur
rent
m
arke
t val
ue c
anno
t be
obse
rved
fo
r the
se s
peci
alis
ed a
sset
s th
us
the
othe
r bui
ldin
gs a
re m
easu
red
by it
s de
prec
iate
d re
plac
emen
t co
st.
Oth
er b
uild
ings
: A
sset
com
pone
nt
Ran
ge
(wei
ghte
d av
erag
e)
Rep
lace
men
t cos
t pe
r squ
are
met
re
$7
,056
sqm
($
7,05
6/sq
m)
To
tal g
ross
floo
r are
a –
28,5
00 s
qm
W
eigh
ted
aver
age
rem
aini
ng u
sefu
l life
–
n/a
(her
itage
bui
ldin
g)
The
estim
ated
fair
valu
e w
ould
incr
ease
/ (d
ecre
ase)
if th
e re
plac
emen
t cos
t per
sq
uare
met
re fo
r the
as
set c
ompo
nent
s w
ere
high
er/(l
ower
).
Leve
l 3 –
Lan
d
Valu
atio
n te
chni
que
Sign
ifica
nt u
nobs
erva
ble
inpu
ts
Sens
itivi
ty o
f the
fa
ir va
lue
mea
sure
men
t to
chan
ges
in
unob
serv
able
in
puts
M
arke
t val
ue:
Qua
lifie
d va
luer
s w
ere
enga
ged
thro
ugh
the
Offi
ce o
f Fin
ance
and
S
ervi
ces
to u
nder
take
val
uatio
ns
for S
choo
l and
sur
plus
site
s la
nd.
For S
choo
l lan
d, th
e hi
ghes
t and
be
st u
se is
the
curre
nt u
se d
ue to
th
e re
stric
tions
pla
ced
on th
e la
nd. T
he v
alue
rs u
sed
curr
ent
mar
ket s
ales
evi
denc
e to
de
term
ine
the
mar
ket v
alue
of t
he
land
with
out r
estri
ctio
ns a
nd th
en
appl
ied
an a
vera
ge d
isco
unt
fact
or o
f 19%
to th
ese
valu
es, t
o ad
just
for t
he re
stric
ted
use
of th
e la
nd. T
he d
isco
unt f
acto
r is
depe
nden
t upo
n th
e zo
ning
of t
he
surro
undi
ng la
nd a
nd is
impa
cted
by
rele
vant
Aus
tralia
n ca
se la
w
and
prof
essi
onal
judg
emen
t of t
he
valu
er.
For s
urpl
us s
ites
land
ther
e ar
e no
suc
h re
stric
tions
and
the
mar
ket v
alue
is d
eter
min
ed b
y an
alys
ing
curr
ent m
arke
t sal
es
evid
ence
.
Land
: In
put –
Sch
ools
site
s A
sset
com
pone
nt
Ran
ge
(wei
ghte
d av
erag
e)
Mar
ket v
alue
per
sq
uare
met
re
$0
.03/
sqm
- $3
,200
/sqm
($
164/
sqm
)
O
ther
inpu
ts:
Inpu
t D
isco
unt f
acto
r 0%
-20%
(19%
) To
tal a
rea
of la
nd
84,6
46,0
06 s
qm
The
estim
ated
fair
valu
e w
ould
incr
ease
/ (d
ecre
ase)
if th
e va
lue
per s
quar
e m
etre
wer
e hi
gher
/ (lo
wer
).
The
estim
ated
fair
valu
e w
ould
incr
ease
/ (d
ecre
ase)
if th
e di
scou
nt fa
ctor
wer
e lo
wer
/(hig
her)
.

76 NSW Department of Education Annual Report 2015 | www.dec.nsw.gov.au
Financial statements
DE
PA
RTM
EN
T O
F E
DU
CA
TIO
N A
ND
CO
MM
UN
ITIE
SN
otes
to th
e fin
anci
al s
tate
men
ts fo
r yea
r end
ed 3
0 Ju
ne 2
015
Pag
e43
of 6
0
14.
Fair
valu
e m
easu
rem
ent o
f non
-fina
ncia
l ass
ets
(con
tinue
d)
Rec
onci
liatio
n of
recu
rrin
g Le
vel 3
fair
valu
e m
easu
rem
ents
The
follo
win
g ta
ble
show
s a
reco
ncili
atio
n fro
m th
e op
enin
g ba
lanc
es to
the
clos
ing
bala
nces
for L
evel
3 fa
ir va
lues
.
Year
end
ed 3
0 Ju
ne 2
015
Land
B
uild
ings
Tota
l R
ecur
ring
Leve
l 3
Fair
valu
e
$’
000
$’00
0 $’
000
Fair
valu
e as
at 1
Jul
y 20
14
7,67
6,77
2 16
,895
, 695
24
,572
,467
Rec
lass
ifica
tion
-- (5
3)
(53)
Addi
tions
39
,238
37
4,41
6 41
3,65
4
Net
reva
luat
ion
(Not
e 11
) 57
6,06
1 --
57
6,06
1
Dis
posa
ls
(6)
(6,2
05)
(6,2
11)
D
epre
ciat
ion
expe
nse
-- (4
14,7
68)
(414
,768
)
Tran
sfer
s to
Ass
ets
held
for s
ale
(1,0
48)
(58)
(1
,106
)
Tran
sfer
s th
roug
h ad
min
istra
tive
rest
ruct
ures
(7
64,1
27)
(3,7
32,9
93)
(4,4
97,1
20)
Tr
ansf
ers
to o
ther
gov
ernm
ent a
genc
ies
(1,6
28)
(522
) (2
,150
)
Oth
er
(1,2
97)
(241
) (1
,538
)
Fair
valu
e as
at 3
0 Ju
ne 2
015
7,52
3,96
513
,115
,271
20,6
39,2
36
R
efer
to N
ote
1(k)
for t
he D
epar
tmen
t’s p
olic
y fo
r det
erm
inin
g w
hen
trans
fers
are
dee
med
to h
ave
occu
rred.
Year
end
ed 3
0 Ju
ne 2
014
Land
B
uild
ings
Tota
l R
ecur
ring
Leve
l 3
Fair
valu
e
$’
000
$’00
0 $’
000
Fair
valu
e as
at 1
Jul
y 20
13
7,64
6,63
5 17
,032
,560
24
,679
,195
Addi
tions
41
,211
17
3,49
1 21
4,70
2
Net
reva
luat
ion
(Not
e 11
) --
241,
241
241,
241
D
ispo
sals
--
(24,
906)
(2
4,90
6)
D
epre
ciat
ion
expe
nse
-- (5
26,6
91)
(526
,691
)
Tran
sfer
s to
Ass
ets
held
for s
ale
(11,
074)
--
(1
1,07
4)
Fa
ir va
lue
as a
t 30
June
201
4 7,
676,
772
16,8
95,6
9524
,572
,467
Ref
er to
Not
e 1(
k) fo
r the
Dep
artm
ent’s
pol
icy
for d
eter
min
ing
whe
n tra
nsfe
rs a
re d
eem
ed to
hav
e oc
curre
d.
15.
Res
tric
ted
Ass
ets
As
at 3
0 Ju
ne 2
015,
the
Dep
artm
ent
held
$6.
3m (
2014
: $6
.1m
) in
an
inte
rest
-bea
ring
bank
acc
ount
for
m
onth
ly s
ervi
ce p
aym
ents
to th
e pr
ivat
e se
rvic
e pr
ovid
er o
f 11
scho
ols
(201
4: 1
1 sc
hool
s). O
nly
the
priv
ate
serv
ice
prov
ider
can
dra
w th
e fu
nds
held
.
The
Dep
artm
ent a
lso
reco
gnis
ed $
1.6m
(201
4: $
1.7m
) as
mon
ies
held
by
scho
ols
on b
ehal
f of t
hird
par
ties.
Th
ese
fund
s in
clud
e ch
arita
ble
dona
t ions
and
rep
rese
nt f
unds
tha
t ar
e co
llect
ed b
y sc
hool
s on
beh
alf
of
othe
r org
anis
atio
ns. T
he s
choo
ls o
btai
n no
ben
efit
from
the
fund
s.
DE
PA
RTM
EN
T O
F E
DU
CA
TIO
N A
ND
CO
MM
UN
ITIE
SN
otes
to th
e fin
anci
al s
tate
men
ts fo
r yea
r end
ed 3
0 Ju
ne 2
015
Pag
e44
of 6
0
16.
Cur
rent
Lia
bilit
ies
– Pa
yabl
es20
15
2014
$’
000
$’00
0
A
ccru
ed s
alar
ies,
wag
es a
nd o
n-co
sts
217,
809
244,
749
C
redi
tors
18
7,54
1 27
0,31
1
Une
arne
d re
venu
e 29
,886
25
3,26
8
Gro
up p
ayro
ll an
d fri
nge
bene
fits
tax
33,4
97
38,4
07
O
ther
59
,156
81
,849
52
7,88
9 88
8,58
4
Det
ails
rega
rdin
g cr
edit
risk,
liqu
idity
risk
and
mar
ket r
isk,
incl
udin
g a
mat
urity
ana
lysi
s of
th
e ab
ove
paya
bles
are
dis
clos
ed in
Not
e 26
.
17.
Cur
rent
/Non
-Cur
rent
Lia
bilit
ies
- Bor
row
ings
Cur
rent
:
Pr
ivat
ely
Fund
ed P
roje
cts
Sch
ools
(Not
e 21
(c))
6,04
6 5,
781
Tr
easu
ry A
dvan
ces
-- 14
0,50
0 6,
046
146,
281
Non
-Cur
rent
:
Priv
atel
y Fu
nded
Pro
ject
s S
choo
ls (N
ote
21(c
))17
6,07
3 18
2,11
8
Trea
sury
Adv
ance
s
140,
500
--
316,
573
182,
118
322,
619
328,
399
Det
ails
rega
rdin
g cr
edit
risk,
liqu
idity
risk
and
mar
ket r
isk,
incl
udin
g a
mat
urity
ana
lysi
s of
th
e ab
ove
borr
owin
gs a
re d
iscl
osed
in N
ote
26.
18.
Cur
rent
/Non
-Cur
rent
Lia
bilit
ies
– Pr
ovis
ions
Cur
rent
:
E
mpl
oyee
ben
efits
and
rela
ted
on-c
osts
:
Annu
al le
ave
47,0
43
92,2
92
Te
ache
rs a
nnua
l and
non
term
leav
e 28
5,58
0 32
0,18
1
Payr
oll t
ax o
n an
nual
leav
e
18,1
28
21,5
75
Su
pera
nnua
tion
pool
ed fu
nd
-- 39
,392
Annu
al le
ave
on lo
ng s
ervi
ce le
ave
78,1
04
83,6
01
W
orke
rs c
ompe
nsat
ion
on lo
ng s
ervi
ce le
ave
18,5
96
19,9
05
Pa
yrol
l tax
on
long
ser
vice
leav
e 10
5,60
6 11
3,92
1
Supe
rann
uatio
n on
long
ser
vice
leav
e
70,6
66
62,7
01
Su
pera
nnua
tion
on a
nnua
l lea
ve
30,8
83
36,9
00
An
nual
leav
e lo
adin
g 38
,955
46
,570
Oth
er
6,23
725
,335
699,
798
862,
373
Oth
er P
rovi
sion
:
Mak
e go
od (b
uild
ing
leas
es)
1,16
72,
758
1,16
72,
758
Tota
l Pro
visi
ons
- Cur
rent
700,
965
865,
131

77 NSW Department of Education Annual Report 2015 | www.dec.nsw.gov.au
Financial statements
DE
PA
RTM
EN
T O
F E
DU
CA
TIO
N A
ND
CO
MM
UN
ITIE
SN
otes
to th
e fin
anci
al s
tate
men
ts fo
r yea
r end
ed 3
0 Ju
ne 2
015
Pag
e45
of 6
0
18.
Cur
rent
/Non
-Cur
rent
Lia
bilit
ies
– Pr
ovis
ions
(con
tinue
d)
2015
2014
$’
000
$’00
0 N
on-C
urre
nt:
Em
ploy
ee b
enef
its a
nd re
late
d on
-cos
ts:
Pa
yrol
l tax
on
long
ser
vice
leav
e 9,
183
5,99
6
Annu
al le
ave
on lo
ng s
ervi
ce le
ave
6,79
2 4,
400
W
orke
rs c
ompe
nsat
ion
on lo
ng s
ervi
ce le
ave
1,61
7 1,
048
Su
pera
nnua
tion
on lo
ng s
ervi
ce le
ave
6,14
5 3,
300
O
ther
2
326
23
,739
15
,070
Oth
er P
rovi
sion
:
Mak
e go
od (b
uild
ing
leas
es)
4,51
4 6,
230
Tota
l Pro
visi
ons
– N
on C
urre
nt
28,2
53
21,3
00
Agg
rega
te e
mpl
oyee
ben
efits
and
rela
ted
on-
cost
s:
Pro
visi
ons
– cu
rrent
699,
798
862,
373
P
rovi
sion
s –
non-
curr
ent
23,7
39
15,0
70
Acc
rued
sal
arie
s, w
ages
and
on-
cost
s (N
ote
16)
217,
809
244,
749
94
1,34
6 1,
122,
192
Mov
emen
t in
prov
isio
ns (o
ther
than
em
ploy
ee
bene
fits)
Mov
emen
ts in
eac
h cl
ass
of p
rovi
sion
dur
ing
the
finan
cial
yea
r, ot
her t
han
empl
oyee
ben
efits
, are
se
t out
bel
ow:
M
ake
good
(bui
ldin
g le
ases
)
Car
ryin
g am
ount
at t
he b
egin
ning
of y
ear
8,98
8 77
1
Addi
tiona
l pro
visi
ons
reco
gnis
ed-
9,86
1
Am
ount
s us
ed
(3,3
07)
(1,6
44)
Car
ryin
g am
ount
at e
nd o
f ye
ar
5,68
1 8,
988
The
prov
isio
n is
the
Net
Pre
sent
Val
ue (N
PV
) of f
utur
e lia
bilit
y fo
r res
tora
tion.
19.
Cur
rent
/Non
-Cur
rent
Lia
bilit
ies
- Oth
er
Cur
rent
:
Leas
e in
cent
ive
1,05
9 1,
060
Liab
ility
to C
onso
lidat
ed F
und
25,8
48
17,0
5226
,907
18
,112
Non
-Cur
rent
:
Leas
e in
cent
ive
2,47
3 3,
535
2,47
3 3,
535
DE
PA
RTM
EN
T O
F E
DU
CA
TIO
N A
ND
CO
MM
UN
ITIE
SN
otes
to th
e fin
anci
al s
tate
men
ts fo
r yea
r end
ed 3
0 Ju
ne 2
015
Pag
e46
of 6
0
20.
Incr
ease
/(Dec
reas
e) in
Net
Ass
ets
from
Equ
ity T
rans
fers
(a)
Tran
sfer
s th
roug
h ad
min
istra
tive
rest
ruct
ures
The
follo
win
g ta
ble
disc
lose
s th
e in
crea
se/(d
ecre
ase)
in
net
asse
ts r
elat
ive
to t
he S
ervi
ce G
roup
s tra
nsfe
rred
out f
rom
the
Dep
artm
ent f
rom
1 J
uly
2014
.
Des
crip
tion
of o
bjec
tives
of t
he b
elow
ser
vice
gro
ups
is in
Not
e 7.
20
15Tr
ansf
eree
Age
ncy
TAFE
N
SWO
ffice
of
Spor
tD
epar
tmen
tof
Pre
mie
r an
d C
abin
et
Offi
ce o
f Sp
ort
Tota
l
Serv
ice
Gro
up 2
4.5
Serv
ice
Gro
up 2
4.7
Serv
ice
Gro
up 2
4.9
Serv
ice
Gro
up 2
4.10
$’00
0$’
000
$’00
0$’
000
$’00
0C
urre
nt A
sset
s
C
ash
and
cash
eq
uiva
lent
s (4
16,4
09)
(5,9
30)
-- (2
,043
) (4
24,3
82)
R
ecei
vabl
es
(55,
003)
(7
,206
) (5
5)
(1,6
17)
(63,
881)
To
tal c
urre
nt a
sset
s(4
71,4
12)
(13,
136)
(55)
(3,6
60)
(488
,263
)
Non
-cur
rent
Ass
ets
Rec
eiva
bles
(4,5
72)
(700
) --
(37)
(5
,309
)
Oth
er fi
nanc
ial a
sset
s (4
46)
-- --
-- (4
46)
La
nd
(720
,592
) (4
3,53
5)
-- --
(764
,127
)
Bui
ldin
gs
(3,7
25,0
36)
(103
,530
) --
-- (3
,828
,566
)
Plan
t and
equ
ipm
ent
(37,
542)
(1
4,53
8)
-- --
(52,
080)
Tota
l pro
perty
, pla
nt a
nd
equi
pmen
t (4
,483
,170
) (1
61,6
03)
-- --
(4,6
44,7
73)
In
tang
ible
s (6
2,63
3)
(1,1
00)
-- --
(63,
733)
To
tal n
on-c
urre
nt
asse
ts(4
,550
,821
) (1
63,4
03)
-- (3
7)
(4,7
14,2
61)
TO
TAL
ASS
ETS
(5,0
22,2
33)
(176
,539
)(5
5)(3
,697
) (5
,202
,524
)
Cur
rent
Lia
bilit
ies
Pay
able
s37
1,33
8 4,
963
28
880
377,
209
Pr
ovis
ions
10
9,19
3 4,
671
94
2,48
9 11
6,44
7 To
tal c
urre
nt li
abili
ties
480,
531
9,63
412
23,
369
493,
656
Non
-cur
rent
Lia
bilit
ies
Prov
isio
ns
1,73
1 86
3 2
290
2,88
6 To
tal n
on-c
urre
nt
liabi
litie
s1,
731
863
2 29
0 2,
886
TO
TAL
LIA
BIL
ITIE
S 48
2,26
210
,497
124
3,65
9 49
6,54
2
Equi
ty
Res
erve
s (2
,806
,646
) --
-- --
(2,8
06,6
46)
Accu
mul
ated
Fun
ds
(1,7
33,3
25)
(166
,042
) 69
(3
8)
(1,8
99,3
36)
TOTA
L EQ
UIT
Y(4
,539
,971
)(1
66,0
42)
69(3
8)(4
,705
,982
)
Incr
ease
/(Dec
reas
e) in
ne
t ass
ets
(4
,539
,971
) (1
66,0
42)
69
(38)
(4
,705
,982
)
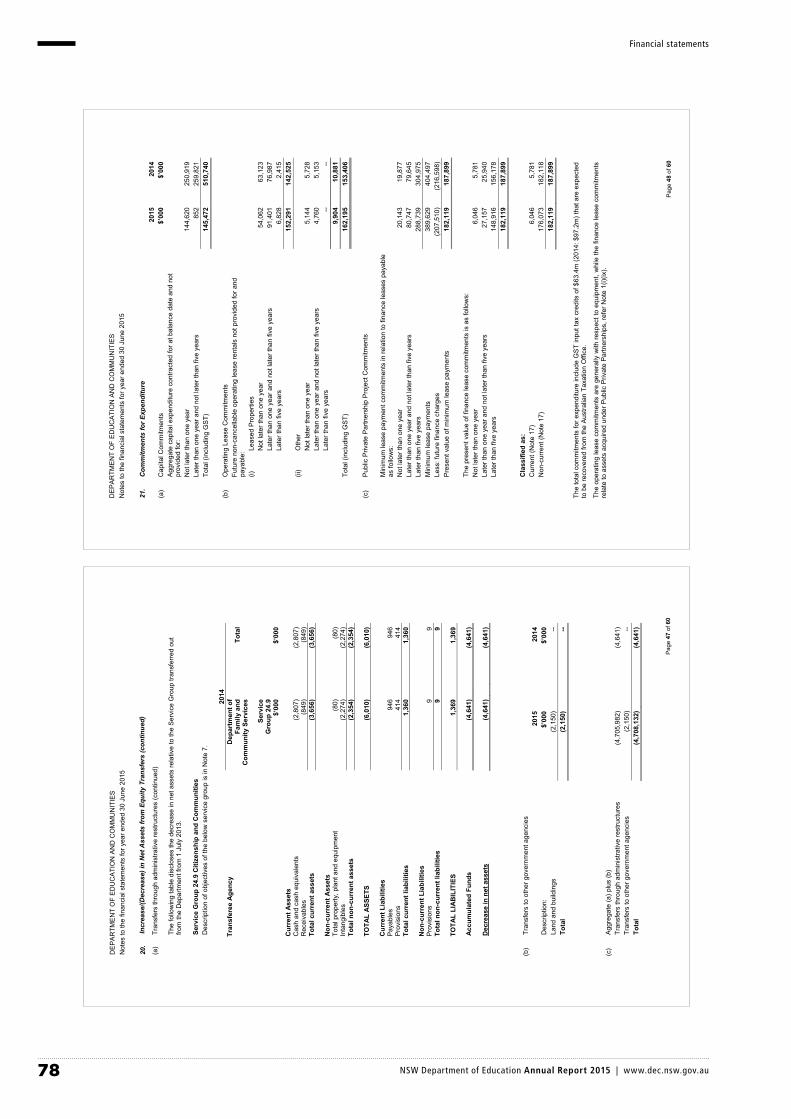
78 NSW Department of Education Annual Report 2015 | www.dec.nsw.gov.au
Financial statements
DE
PA
RTM
EN
T O
F E
DU
CA
TIO
N A
ND
CO
MM
UN
ITIE
SN
otes
to th
e fin
anci
al s
tate
men
ts fo
r yea
r end
ed 3
0 Ju
ne 2
015
Pag
e47
of 6
0
20.
Incr
ease
/(Dec
reas
e) in
Net
Ass
ets
from
Equ
ity T
rans
fers
(con
tinue
d)
(a)
Tran
sfer
s th
roug
h ad
min
istra
tive
rest
ruct
ures
(con
tinue
d)
The
follo
win
g ta
ble
disc
lose
s th
e de
crea
se in
net
ass
ets
rela
tive
to th
e S
ervi
ce G
roup
tran
sfer
red
out
from
the
Dep
artm
ent f
rom
1 J
uly
2013
.
Serv
ice
Gro
up 2
4.9
Citi
zens
hip
and
Com
mun
ities
Des
crip
tion
of o
bjec
tives
of t
he b
elow
ser
vice
gro
up is
in N
ote
7.
2014
Tra
nsfe
ree
Age
ncy
Dep
artm
ent o
f Fa
mily
and
C
omm
unity
Ser
vice
s To
tal
Serv
ice
Gro
up 2
4.9
$‘00
0
$‘00
0
Cur
rent
Ass
ets
Cas
h an
d ca
sh e
quiv
alen
ts
(2,8
07)
(2
,807
)
Rec
eiva
bles
(8
49)
(8
49)
Tota
l cur
rent
ass
ets
(3,6
56)
(3
,656
)
Non
-cur
rent
Ass
ets
Tota
l pro
perty
, pla
nt a
nd e
quip
men
t (8
0)
(8
0)
In
tang
ible
s (2
,274
)
(2,2
74)
Tota
l non
-cur
rent
ass
ets
(2,3
54)
(2
,354
)
TOTA
L A
SSET
S (6
,010
)
(6,0
10)
C
urre
nt L
iabi
litie
s
P
ayab
les
946
94
6
Prov
isio
ns
414
41
4 To
tal c
urre
nt li
abili
ties
1,36
0
1,36
0
Non
-cur
rent
Lia
bilit
ies
Prov
isio
ns
9
9 To
tal n
on-c
urre
nt li
abili
ties
9
9
TOTA
L LI
AB
ILIT
IES
1,36
9
1,36
9
Acc
umul
ated
Fun
ds
(4,6
41)
(4,6
41)
Dec
reas
e in
net
ass
ets
(4
,641
)(4
,641
)
(b)
Tran
sfer
s to
oth
er g
over
nmen
t age
ncie
s
20
15
2014
Des
crip
tion:
$’
000
$’00
0
Land
and
bui
ldin
gs
(2,1
50)
-- To
tal
(2,1
50)
--
(c)
Agg
rega
te (a
) plu
s (b
)
Tran
sfer
s th
roug
h ad
min
istra
tive
rest
ruct
ures
(4
,705
,982
) (4
,641
)
Tran
sfer
s to
oth
er g
over
nmen
t age
ncie
s
(2,1
50)
-- To
tal
(4,7
08,1
32)
(4,6
41)
DE
PA
RTM
EN
T O
F E
DU
CA
TIO
N A
ND
CO
MM
UN
ITIE
SN
otes
to th
e fin
anci
al s
tate
men
ts fo
r yea
r end
ed 3
0 Ju
ne 2
015
Pag
e48
of 6
0
21.
Com
mitm
ents
for E
xpen
ditu
re
2015
20
14
(a)
Cap
ital C
omm
itmen
ts
$’00
0 $’
000
Agg
rega
te c
apita
l exp
endi
ture
con
tract
ed fo
r at b
alan
ce d
ate
and
not
prov
ided
for:
Not
late
r tha
n on
e ye
ar14
4,62
0 25
0,91
9 L
ater
than
one
yea
r and
not
late
r tha
n fiv
e ye
ars
852
259,
821
Tot
al (i
nclu
ding
GST
) 14
5,47
2 51
0,74
0
(b)
Ope
ratin
g Le
ase
Com
mitm
ents
Fu
ture
non
-can
cella
ble
oper
atin
g le
ase
rent
als
not p
rovi
ded
for a
nd
paya
ble:
(
i) Le
ased
Pro
perti
es
Not
late
r tha
n on
e ye
ar
54,0
62
63,1
23
Late
r tha
n on
e ye
ar a
nd n
ot la
ter t
han
five
year
s 91
,401
76
,987
La
ter t
han
five
year
s 6,
828
2,41
5
152,
291
142,
525
(ii)
O
ther
N
ot la
ter t
han
one
year
5,
144
5,72
8
La
ter t
han
one
year
and
not
late
r tha
n fiv
e ye
ars
4,76
0 5,
153
Late
r tha
n fiv
e ye
ars
-- --
9,90
4 10
,881
T
otal
(inc
ludi
ng G
ST)
162,
195
153,
406
(c)
Pub
lic P
rivat
e P
artn
ersh
ip P
roje
ct C
omm
itmen
ts
Min
imum
leas
e pa
ymen
t com
mitm
ents
in re
latio
n to
fina
nce
leas
es p
ayab
le
as fo
llow
s:
Not
late
r tha
n on
e ye
ar
20,1
43
19,8
77
Lat
er th
an o
ne y
ear a
nd n
ot la
ter t
han
five
year
s 80
,747
79
,645
L
ater
than
five
yea
rs
288,
739
304,
975
Min
imum
leas
e pa
ymen
ts
389,
629
404,
497
Les
s: fu
ture
fina
nce
char
ges
(207
,510
) (2
16,5
98)
Pre
sent
val
ue o
f min
imum
leas
e pa
ymen
ts
182,
119
187,
899
The
pre
sent
val
ue o
f fin
ance
leas
e co
mm
itmen
ts is
as
follo
ws:
N
ot la
ter t
han
one
year
6,
046
5,78
1 L
ater
than
one
yea
r and
not
late
r tha
n fiv
e ye
ars
27,1
57
25,9
40
Lat
er th
an fi
ve y
ears
14
8,91
6 15
6,17
8 18
2,11
9 18
7,89
9
Cla
ssifi
ed a
s:
Cur
rent
(Not
e 17
) 6,
046
5,78
1 N
on-c
urre
nt (N
ote
17)
176,
073
182,
118
182,
119
187,
899
The
tota
l com
mitm
ents
for e
xpen
ditu
re in
clud
e G
ST
inpu
t tax
cre
dits
of $
63.4
m (2
014:
$97
.2m
) tha
t are
exp
ecte
d to
be
reco
vere
d fro
m th
e A
ustra
lian
Taxa
tion
Offi
ce.
The
oper
atin
g le
ase
com
mitm
ents
are
gen
eral
ly w
ith re
spec
t to
equi
pmen
t, w
hile
the
finan
ce le
ase
com
mitm
ents
re
late
to a
sset
s ac
quire
d un
der P
ublic
Priv
ate
Par
tner
ship
s, re
fer N
ote
1(i)(
ix).

79 NSW Department of Education Annual Report 2015 | www.dec.nsw.gov.au
Financial statements
DE
PA
RTM
EN
T O
F E
DU
CA
TIO
N A
ND
CO
MM
UN
ITIE
SN
otes
to th
e fin
anci
al s
tate
men
ts fo
r yea
r end
ed 3
0 Ju
ne 2
015
Pag
e49
of 6
0
22.
Con
tinge
nt L
iabi
litie
s an
d C
ontin
gent
Ass
ets
Con
tinge
nt li
abili
ties
A bu
ildin
g su
b-co
ntra
ctor
invo
lved
in th
e B
uild
ing
the
Edu
catio
n R
evol
utio
n pr
ogra
m m
ay ta
ke le
gal p
roce
edin
gs
agai
nst t
he D
epar
tmen
t for
a c
laim
of m
oney
ow
ed to
them
by
the
cont
ract
or e
ngag
ed b
y th
e D
epar
tmen
t. Th
e D
epar
tmen
t can
not a
ccur
atel
y de
term
ine
the
liabi
lity
beca
use
the
clai
man
t has
not
initi
ated
any
pro
ceed
ings
.
The
Dep
artm
ent
is c
urre
ntly
invo
lved
in a
lega
l dis
pute
with
a lo
cal e
duca
tiona
l ins
titut
ion.
The
Dep
artm
ent
is
unab
le to
qua
ntify
the
amou
nt o
f the
pot
entia
l lia
bilit
y.
The
Dep
artm
ent
is n
ot a
war
e of
oth
er k
now
n ca
ses
whe
re t
he D
epar
tmen
t co
uld
be l
iabl
e fo
r m
ater
ial
com
pens
atio
n pa
ymen
ts r
elat
ing
to m
atte
rs,
whi
ch a
re t
he s
ubje
ct o
f lit
igat
ion
and
that
are
not
cov
ered
by
the
NSW
Tre
asur
y M
anag
ed F
und.
Con
tinge
nt a
sset
s Th
e D
epar
tmen
t is
not a
war
e of
any
oth
er c
ontin
gent
ass
ets.
23.
Bud
get R
evie
w
Net
resu
lt
The
Dep
artm
ent’s
net
res
ult
was
$12
.4m
fav
oura
ble
com
pare
d ag
ains
t th
e bu
dget
. Th
e va
rianc
e co
nsis
ts o
f a
redu
ctio
n in
exp
ense
s of
$28
0.8m
, red
uctio
n in
reve
nues
of $
261.
6m a
nd a
n in
crea
se in
loss
es o
f $6.
8m.
The
varia
nce
in e
xpen
ses
was
mai
nly
attri
buta
ble
to th
e fo
llow
ing:
(a)
A $
186.
1m re
duct
ion
for t
he tr
ansf
er o
ut o
f the
Offi
ce o
f Spo
rt an
d R
ecre
atio
n;
(b)
A $
255.
1m re
duct
ion
for c
hang
es to
tim
ing
of im
plem
enta
tion
of v
ario
us C
omm
onw
ealth
Nat
iona
l Par
tner
ship
pr
ogra
ms,
par
ticul
arly
in re
latio
n to
ear
ly c
hild
hood
edu
catio
n an
d sk
ills tr
aini
ng;
(c)
A $
128.
3m in
crea
se in
long
ser
vice
leav
e ex
pens
es d
ue to
Com
mon
wea
lth b
ond
rate
mov
emen
ts; a
nd
(d)
An in
crea
se o
f $26
.0m
in d
epre
ciat
ion
as th
e bu
dget
did
not
inco
rpor
ate
the
full
impa
ct o
f the
reva
luat
ion
of
build
ings
that
occ
urre
d in
201
3.
The
varia
nce
in re
venu
es w
as m
ainl
y at
tribu
tabl
e to
the
follo
win
g:
(a)
Rec
urre
nt a
ppro
pria
tions
from
the
budg
et w
ere
$318
.1m
low
er th
an b
udge
t as
a re
sult
of th
e tra
nsfe
r of
the
Offi
ce o
f Spo
rt an
d un
ders
pend
s in
Nat
iona
l Par
tner
ship
pro
gram
s, p
artia
lly o
ffset
by
addi
tiona
l fun
ds fr
om
the
Nat
iona
l Edu
catio
n R
efor
m A
gree
men
t; (b
) A
fur
ther
red
uctio
n of
$77
.3m
in
reve
nues
res
ultin
g fro
m t
he t
rans
fer
out
of t
he O
ffice
of
Spo
rt an
d R
ecre
atio
n;
(c)
An
incr
ease
of $
92.8
m in
Cro
wn
acce
ptan
ce o
f lia
bilit
ies
stem
min
g fro
m h
ighe
r lon
g se
rvic
e le
ave
and
low
er
supe
rann
uatio
n; a
nd
(d)
An
incr
ease
of $
41.0
m in
oth
er d
epar
tmen
tal r
even
ues.
The
incr
ease
s in
loss
es c
ompa
red
with
bud
get o
f $6.
8m re
late
mai
nly
to p
rope
rty d
ispo
sals
.
DE
PA
RTM
EN
T O
F E
DU
CA
TIO
N A
ND
CO
MM
UN
ITIE
SN
otes
to th
e fin
anci
al s
tate
men
ts fo
r yea
r end
ed 3
0 Ju
ne 2
015
Pag
e50
of 6
0
23.
Bud
get R
evie
w (c
ontin
ued)
Ass
ets
and
Liab
ilitie
s
The
Dep
artm
ent’s
net
ass
ets
wer
e $3
76.7
m h
ighe
r th
an b
udge
t, co
nsis
ting
of $
680.
8m h
ighe
r as
sets
and
$3
04.1
m h
ighe
r lia
bilit
ies.
The
varia
nce
in a
sset
s w
as m
ainl
y at
tribu
tabl
e to
the
follo
win
g:
(a)
The
reva
luat
ion
of la
nd a
sset
s, in
crea
sing
pro
perty
ass
ets
by $
576.
1m; a
nd
(b)
The
defe
rral
of t
he r
epay
men
t of
the
$14
0.5m
adv
ance
fro
m t
he C
row
n En
tity,
lea
ding
to
high
er c
ash
asse
ts.
The
varia
nce
in li
abili
ties
was
mai
nly
attri
buta
ble
to th
e fo
llow
ing:
(a)
The
defe
rral o
f the
repa
ymen
t of t
he $
140.
5m a
dvan
ce fr
om th
e C
row
n E
ntity
, mai
ntai
ning
a h
ighe
r lia
bilit
y;
(b)
Hig
her e
mpl
oyee
leav
e an
d on
cost
pro
visi
ons
than
bud
gete
d, a
mou
ntin
g to
$83
.5m
; (c
) H
ighe
r lev
els
of p
ayab
les,
am
ount
ing
to $
94.3
m.
Cas
h flo
ws
The
net
incr
ease
/(dec
reas
e) i
n ca
sh p
ositi
on w
as $
105.
6m f
avou
rabl
e co
mpa
red
agai
nst
the
budg
et,
afte
r ad
just
ing
for t
he c
ash
trans
fers
out
resu
lting
from
adm
inis
trativ
e st
ruct
ures
. Thi
s va
rianc
e w
as m
ainl
y at
tribu
tabl
e to
def
erra
l of t
he r
epay
men
t of t
he $
140.
5m a
dvan
ce fr
om th
e C
row
n E
ntity
and
low
er p
roce
eds
from
pro
perty
sa
les.
24.
Rec
onci
liatio
n of
Cas
h Fl
ows
from
Ope
ratin
g A
ctiv
ities
to N
et R
esul
t
2015
20
14
$’00
0 $’
000
Net
cas
h us
ed in
ope
ratin
g ac
tiviti
es
413,
051
461,
599
D
epre
ciat
ion
and
amor
tisat
ion
(550
,290
) (6
74,0
25)
Al
low
ance
for i
mpa
irmen
t (2
61)
964
D
ecre
ase/
(Incr
ease
) in
prov
isio
ns
(551
) (1
7,13
7)
In
crea
se/(D
ecre
ase)
in p
repa
ymen
ts a
nd o
ther
ass
ets
1,89
2 23
,943
Dec
reas
e/(In
crea
se) i
n cr
edito
rs
(20,
627)
(1
78,8
88)
N
et g
ain/
(loss
) on
sale
of p
lant
and
equ
ipm
ent
(6,4
41)
(11,
513)
Don
ated
ass
ets
16,7
46
13
O
ther
98
1 16
,925
N
et re
sult
(145
,500
) (3
78,1
19)
25.
Non
-cas
h Fi
nanc
ing
and
Inve
stin
g A
ctiv
ities
Ass
ets
rece
ived
by
dona
tion
16,7
46
13
Liab
ilitie
s an
d ex
pens
es a
ssum
ed b
y th
e C
row
n En
tity
(539
,153
) (5
99,6
74)
(522
,407
) (5
99,6
61)
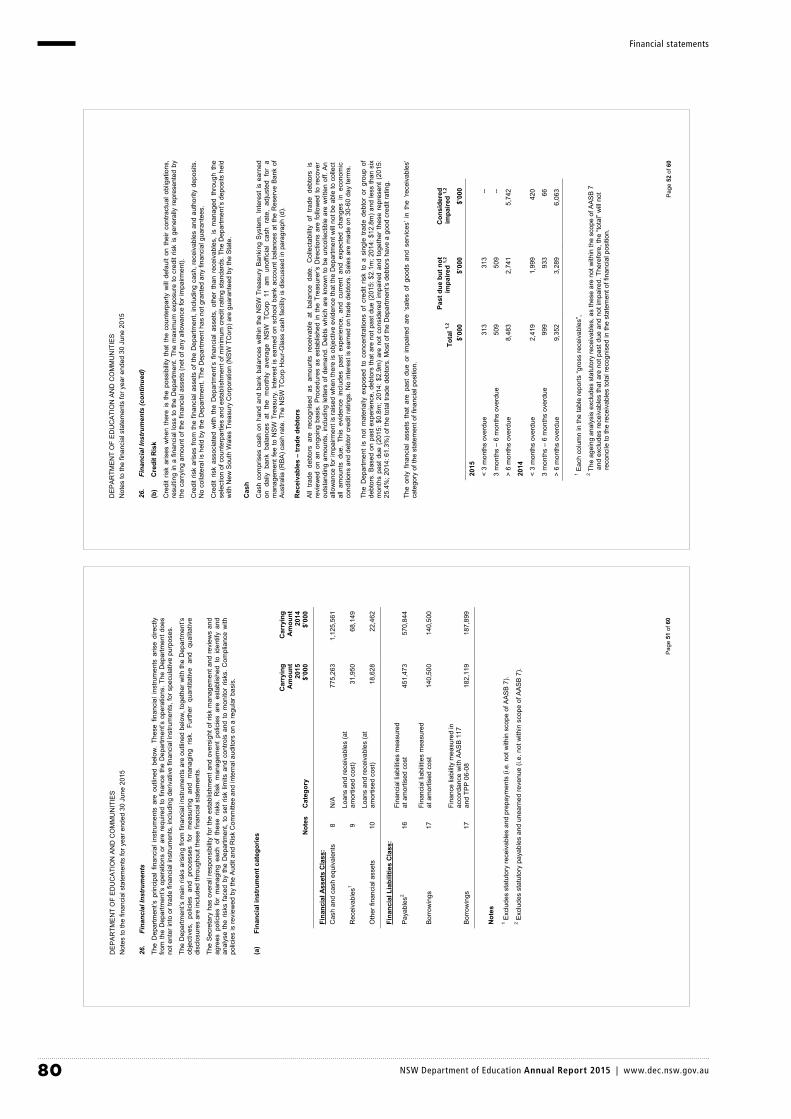
80 NSW Department of Education Annual Report 2015 | www.dec.nsw.gov.au
Financial statements
DE
PA
RTM
EN
T O
F E
DU
CA
TIO
N A
ND
CO
MM
UN
ITIE
SN
otes
to th
e fin
anci
al s
tate
men
ts fo
r yea
r end
ed 3
0 Ju
ne 2
015
Pag
e51
of 6
0
26.
Fina
ncia
l Ins
trum
ents
The
Dep
artm
ent’s
prin
cipa
l fin
anci
al i
nstru
men
ts a
re o
utlin
ed b
elow
. Th
ese
finan
cial
ins
trum
ents
aris
e di
rect
ly
from
the
Dep
artm
ent’s
ope
ratio
ns o
r ar
e re
quire
d to
fina
nce
the
Dep
artm
ent’s
ope
ratio
ns. T
he D
epar
tmen
t doe
s no
t ent
er in
to o
r tra
de fi
nanc
ial i
nstru
men
ts, i
nclu
ding
der
ivat
ive
finan
cial
inst
rum
ents
, for
spe
cula
tive
purp
oses
.
The
Dep
artm
ent’s
mai
n ris
ks a
risin
g fro
m fi
nanc
ial i
nstru
men
ts a
re o
utlin
ed b
elow
, tog
ethe
r with
the
Dep
artm
ent’s
ob
ject
ives
, po
licie
s an
d pr
oces
ses
for
mea
surin
g an
d m
anag
ing
risk.
Fur
ther
qua
ntita
tive
and
qual
itativ
e di
sclo
sure
s ar
e in
clud
ed th
roug
hout
thes
e fin
anci
al s
tate
men
ts.
The
Secr
etar
y ha
s ov
eral
l res
pons
ibili
ty fo
r the
est
ablis
hmen
t and
ove
rsig
ht o
f ris
k m
anag
emen
t and
revi
ews
and
agre
es p
olic
ies
for
man
agin
g ea
ch o
f th
ese
risks
. R
isk
man
agem
ent
polic
ies
are
esta
blis
hed
to i
dent
ify a
nd
anal
yse
the
risks
face
d by
the
Dep
artm
ent,
to s
et r
isk
limits
and
con
trols
and
to m
onito
r ris
ks. C
ompl
ianc
e w
ith
polic
ies
is re
view
ed b
y th
e A
udit
and
Ris
k C
omm
ittee
and
inte
rnal
aud
itors
on
a re
gula
r bas
is.
(a)
Fina
ncia
l ins
trum
ent c
ateg
orie
s Not
es
Cat
egor
y
Car
ryin
g
Am
ount
20
15
$’00
0
Car
ryin
g A
mou
nt
2014
$’
000
Fina
ncia
l Ass
ets
Cla
ss:
Cas
h an
d ca
sh e
quiv
alen
ts
8 N
/A
775,
263
1,12
5,56
1
Rec
eiva
bles
19
Loan
s an
d re
ceiv
able
s (a
t am
ortis
ed c
ost)
31,9
50
68,1
49
Oth
er fi
nanc
ial a
sset
s 10
Lo
ans
and
rece
ivab
les
(at
amor
tised
cos
t) 18
,628
22
,462
Fina
ncia
l Lia
bilit
ies
Cla
ss:
Pay
able
s2 16
Fi
nanc
ial l
iabi
litie
s m
easu
red
at a
mor
tised
cos
t 45
1,47
3 57
0,84
4
Borro
win
gs
17
Fina
ncia
l lia
bilit
ies
mea
sure
d at
am
ortis
ed c
ost
140,
500
140,
500
Borro
win
gs
17
Fina
nce
liabi
lity
mea
sure
d in
ac
cord
ance
with
AA
SB
117
an
d TP
P 06
-08
182,
119
187,
899
Not
es
1 Exc
lude
s st
atut
ory
rece
ivab
les
and
prep
aym
ents
(i.e
. not
with
in s
cope
of A
AS
B 7
).2 E
xclu
des
stat
utor
y pa
yabl
es a
nd u
near
ned
reve
nue
(i.e.
not
with
in s
cope
of A
AS
B 7
).
DE
PA
RTM
EN
T O
F E
DU
CA
TIO
N A
ND
CO
MM
UN
ITIE
SN
otes
to th
e fin
anci
al s
tate
men
ts fo
r yea
r end
ed 3
0 Ju
ne 2
015
Pag
e52
of 6
0
26.
Fina
ncia
l Ins
trum
ents
(con
tinue
d)
(b)
Cre
dit R
isk
Cre
dit
risk
aris
es w
hen
ther
e is
the
pos
sibi
lity
that
the
cou
nter
party
will
def
ault
on t
heir
cont
ract
ual o
blig
atio
ns,
resu
lting
in a
fina
ncia
l los
s to
the
Dep
artm
ent.
The
max
imum
exp
osur
e to
cre
dit r
isk
is g
ener
ally
rep
rese
nted
by
the
carr
ying
am
ount
of t
he fi
nanc
ial a
sset
s (n
et o
f any
allo
wan
ce fo
r im
pairm
ent).
Cre
dit r
isk
aris
es fr
om th
e fin
anci
al a
sset
s of
the
Dep
artm
ent,
incl
udin
g ca
sh, r
ecei
vabl
es a
nd a
utho
rity
depo
sits
. N
o co
llate
ral i
s he
ld b
y th
e D
epar
tmen
t. Th
e D
epar
tmen
t has
not
gra
nted
any
fina
ncia
l gua
rant
ees.
Cre
dit
risk
asso
ciat
ed w
ith t
he D
epar
tmen
t’s f
inan
cial
ass
ets,
oth
er t
han
rece
ivab
les,
is
man
aged
thr
ough
the
se
lect
ion
of c
ount
erpa
rties
and
est
ablis
hmen
t of m
inim
um c
redi
t rat
ing
stan
dard
s. T
he D
epar
tmen
t’s d
epos
its h
eld
with
New
Sou
th W
ales
Tre
asur
y C
orpo
ratio
n (N
SW
TC
orp)
are
gua
rant
eed
by th
e S
tate
.
Cas
h
Cas
h co
mpr
ises
cas
h on
han
d an
d ba
nk b
alan
ces
with
in th
e N
SW
Tre
asur
y B
anki
ng S
yste
m. I
nter
est i
s ea
rned
on
dai
ly b
ank
bala
nces
at
the
mon
thly
ave
rage
NSW
TC
orp
11 a
m u
noffi
cial
cas
h ra
te,
adju
sted
for
a
man
agem
ent f
ee to
NS
W T
reas
ury.
Inte
rest
is e
arne
d on
sch
ool b
ank
acco
unt b
alan
ces
at th
e R
eser
ve B
ank
of
Aus
tralia
(RB
A) c
ash
rate
. The
NS
W T
Cor
p H
our-G
lass
cas
h fa
cilit
y is
dis
cuss
ed in
par
agra
ph (d
).
Rec
eiva
bles
– tr
ade
debt
ors
All
trade
deb
tors
are
rec
ogni
sed
as a
mou
nts
rece
ivab
le a
t ba
lanc
e da
te.
Col
lect
abilit
y of
tra
de d
ebto
rs i
s re
view
ed o
n an
ong
oing
bas
is. P
roce
dure
s as
est
ablis
hed
in th
e Tr
easu
rer’s
Dire
ctio
ns a
re fo
llow
ed to
rec
over
ou
tsta
ndin
g am
ount
s, in
clud
ing
lette
rs o
f dem
and.
Deb
ts w
hich
are
kno
wn
to b
e un
colle
ctib
le a
re w
ritte
n of
f. A
n al
low
ance
for i
mpa
irmen
t is
rais
ed w
hen
ther
e is
obj
ectiv
e ev
iden
ce th
at th
e D
epar
tmen
t will
not
be
able
to c
olle
ct
all
amou
nts
due.
Thi
s ev
iden
ce i
nclu
des
past
exp
erie
nce,
and
cur
rent
and
exp
ecte
d ch
ange
s in
eco
nom
ic
cond
ition
s an
d de
btor
cre
dit r
atin
gs. N
o in
tere
st is
ear
ned
on tr
ade
debt
ors.
Sal
es a
re m
ade
on 3
0-60
day
term
s.
The
Dep
artm
ent
is n
ot m
ater
ially
exp
osed
to
conc
entra
tions
of
cred
it ris
k to
a s
ingl
e tra
de d
ebto
r or
gro
up o
f de
btor
s. B
ased
on
past
exp
erie
nce,
deb
tors
that
are
not
pas
t due
(201
5: $
2.1m
; 201
4: $
12.8
m) a
nd le
ss th
an s
ix
mon
ths
past
due
(20
15: $
0.8m
; 201
4: $
2.9m
) ar
e no
t con
side
red
impa
ired
and
toge
ther
thes
e re
pres
ent (
2015
: 25
.4%
; 201
4: 6
1.3%
) of t
he to
tal t
rade
deb
tors
. Mos
t of t
he D
epar
tmen
t’s d
ebto
rs h
ave
a go
od c
redi
t rat
ing.
The
only
fin
anci
al a
sset
s th
at a
re p
ast
due
or i
mpa
ired
are
‘sal
es o
f go
ods
and
serv
ices
’ in
the
‘re
ceiv
able
s’
cate
gory
of t
he s
tate
men
t of f
inan
cial
pos
ition
.
Tota
l 1,2
$’00
0
Past
due
but
not
im
paire
d1,
2
$’00
0
Con
side
red
impa
ired
1,2
$’00
0
2015
< 3
mon
ths
over
due
313
313
--
3 m
onth
s –
6 m
onth
s ov
erdu
e 50
9 50
9 --
> 6
mon
ths
over
due
8,48
3 2,
741
5,74
2
2014
< 3
mon
ths
over
due
2,41
9 1,
999
420
3 m
onth
s –
6 m
onth
s ov
erdu
e 99
9 93
3 66
> 6
mon
ths
over
due
9,35
2 3,
289
6,06
3
1 Eac
h co
lum
n in
the
tabl
e re
ports
“gro
ss re
ceiv
able
s”,
2 The
age
ing
anal
ysis
exc
lude
s st
atut
ory
rece
ivab
les,
as
thes
e ar
e no
t with
in th
e sc
ope
of A
AS
B 7
a
nd e
xclu
des
rece
ivab
les
that
are
not
pas
t due
and
not
impa
ired.
The
refo
re, t
he “t
otal
” will
not
re
conc
ile to
the
rece
ivab
les
tota
l rec
ogni
sed
in th
e st
atem
ent o
f fin
anci
al p
ositi
on.

81 NSW Department of Education Annual Report 2015 | www.dec.nsw.gov.au
Financial statements
DE
PA
RTM
EN
T O
F E
DU
CA
TIO
N A
ND
CO
MM
UN
ITIE
SN
otes
to th
e fin
anci
al s
tate
men
ts fo
r yea
r end
ed 3
0 Ju
ne 2
015
Pag
e53
of 6
0
26.
Fina
ncia
l Ins
trum
ents
(con
tinue
d)
(c)
Liqu
idity
risk
Liqu
idity
ris
k is
the
risk
that
the
Dep
artm
ent
will
be
unab
le to
mee
t its
pay
men
t obl
igat
ions
whe
n th
ey fa
ll du
e.
The
Dep
artm
ent
cont
inuo
usly
man
ages
ris
k th
roug
h m
onito
ring
futu
re c
ash
flow
s an
d m
atur
ities
pla
nnin
g to
en
sure
ade
quat
e ho
ldin
g of
hig
h qu
ality
liqu
id a
sset
s. T
he o
bjec
tive
is to
mai
ntai
n a
bala
nce
betw
een
cont
inui
ty
of fu
ndin
g an
d fle
xibi
lity
thro
ugh
the
use
of o
verd
rafts
, loa
ns a
nd o
ther
adv
ance
s.
Dur
ing
the
curr
ent a
nd p
rior y
ear,
ther
e w
ere
no d
efau
lts o
n an
y lo
ans
paya
ble.
No
asse
ts h
ave
been
ple
dged
as
colla
tera
l. Th
e D
epar
tmen
t’s e
xpos
ure
to li
quid
ity r
isk
is d
eem
ed in
sign
ifica
nt b
ased
on
prio
r pe
riods
’ dat
a an
d cu
rren
t ass
essm
ent o
f ris
k.
The
liabi
litie
s ar
e re
cogn
ised
for a
mou
nts
due
to b
e pa
id in
the
futu
re fo
r goo
ds o
r ser
vice
s re
ceiv
ed, w
heth
er o
r no
t inv
oice
d. A
mou
nts
owin
g to
sup
plie
rs (w
hich
are
uns
ecur
ed) a
re s
ettle
d in
acc
orda
nce
with
the
polic
y se
t out
in
NS
W T
reas
ury
Circ
ular
11/
12. F
or s
mal
l bus
ines
s su
pplie
rs, w
here
term
s ar
e no
t spe
cifie
d, p
aym
ent i
s m
ade
not l
ater
than
30
days
from
dat
e of
rece
ipt o
f a c
orre
ctly
ren
dere
d in
voic
e. F
or o
ther
sup
plie
rs, i
f tra
de te
rms
are
not s
peci
fied,
pay
men
t is
mad
e no
late
r th
an th
e en
d of
the
mon
th fo
llow
ing
the
mon
th in
whi
ch a
n in
voic
e or
a
stat
emen
t is
rece
ived
. For
sm
all b
usin
ess
supp
liers
, whe
re p
aym
ent i
s no
t mad
e w
ithin
the
spec
ified
tim
e pe
riod,
si
mpl
e in
tere
st i
s pa
id a
utom
atic
ally
unl
ess
an e
xist
ing
cont
ract
spe
cifie
s ot
herw
ise.
For
pay
men
ts t
o ot
her
supp
liers
, th
e Se
cret
ary
of t
he D
epar
tmen
t (o
r a
pers
on a
ppoi
nted
by
the
Sec
reta
ry o
f th
e D
epar
tmen
t) m
ay
auto
mat
ical
ly p
ay th
e su
pplie
r sim
ple
inte
rest
.
The
tabl
e be
low
sum
mar
ises
the
mat
urity
pro
file
of th
e D
epar
tmen
t’s fi
nanc
ial l
iabi
litie
s, to
geth
er w
ith th
e in
tere
st
rate
exp
osur
e.
Mat
urity
ana
lysi
s an
d in
tere
st ra
te e
xpos
ure
of fi
nanc
ial l
iabi
litie
s ($
’000
)
W
eigh
ted
Ave
rage
E
ffect
ive
Int.
Rat
e
In
tere
st R
ate
Exp
osur
e M
atur
ity D
ates
Nom
inal
Am
ount
1
Fixe
d In
tere
stR
ate
Var
iabl
eIn
tere
stR
ate
Non
-in
tere
st
bear
ing
< 1
yr
1-5
yrs
> 5
yrs
2015
P
ayab
les:
Acc
rued
sal
arie
s,
wag
es a
nd o
n-co
sts
--
215,
763
--
--
215,
763
215,
763
--
-- C
redi
tors
--
235,
710
-- --
235,
710
235,
710
-- --
Bor
row
ings
:
Tr
easu
ry a
dvan
ces
5.04
%
140,
500
140,
500
-- --
-- 14
0,50
0 --
Priv
ate
Pub
lic
Par
tner
ship
s2 8.
07%
35
4,20
8 --
354,
208
-- 18
,312
73
,407
26
2,48
9 20
14
Pay
able
s:
Acc
rued
sal
arie
s,
wag
es a
nd o
n-co
sts
--
229,
919
--
--
229,
919
229,
919
--
-- C
redi
tors
--
340,
925
-- --
340,
925
340,
925
-- --
Bor
row
ings
:
Tr
easu
ry a
dvan
ces
5.04
%
140,
500
140,
500
-- --
140,
500
-- --
Priv
ate
Pub
lic
Par
tner
ship
s 7.
73%
36
7,72
5 --
367,
725
-- 18
,070
72
,405
27
7,25
0 N
otes
: 1 T
he a
mou
nts
disc
lose
d ar
e th
e co
ntra
ctua
l und
isco
unte
d ca
sh fl
ows
of e
ach
clas
s of
fina
ncia
l lia
bilit
ies
base
d on
the
ear
liest
dat
e on
whi
ch th
e D
epar
tmen
t can
be
requ
ired
to p
ay. T
he ta
ble
incl
udes
bot
h in
tere
st a
nd p
rinci
pal c
ash
flow
s
and
ther
efor
e w
ill n
ot re
conc
ile to
the
stat
emen
t of f
inan
cial
pos
ition
. 2 O
f the
$18
.3m
dis
clos
ed in
the
2015
“Pub
lic P
rivat
e P
artn
ersh
ips
borro
win
gs” t
ime
band
<1
yr, t
he D
epar
tmen
t int
ends
to p
ay $
1.5m
in th
e fir
st q
uarte
r of 2
016.
DE
PA
RTM
EN
T O
F E
DU
CA
TIO
N A
ND
CO
MM
UN
ITIE
SN
otes
to th
e fin
anci
al s
tate
men
ts fo
r yea
r end
ed 3
0 Ju
ne 2
015
Pag
e54
of 6
0
26.
Fina
ncia
l Ins
trum
ents
(con
tinue
d)
(d)
Mar
ket r
isk
Mar
ket r
isk
is th
e ris
k th
at th
e fa
ir va
lue
or fu
ture
cas
h flo
ws
of a
fina
ncia
l ins
trum
ent w
ill fl
uctu
ate
beca
use
of c
hang
es in
mar
ket p
rices
. The
Dep
artm
ent’s
exp
osur
es to
mar
ket r
isk
are
prim
arily
thro
ugh
inte
rest
rate
ris
k on
the
Dep
artm
ent’s
bor
row
ings
and
oth
er p
rice
risks
ass
ocia
ted
with
the
mov
emen
t in
the
unit
pric
e of
the
Hou
r- G
lass
Inve
stm
ent
Faci
litie
s. T
he D
epar
tmen
t ha
s m
inim
al e
xpos
ure
to fo
reig
n cu
rren
cy r
isk
and
does
not
ent
er in
to c
omm
odity
con
tract
s.
The
effe
ct o
n pr
ofit
and
equi
ty d
ue t
o a
reas
onab
ly p
ossi
ble
chan
ge i
n ris
k va
riabl
e is
out
lined
in
the
info
rmat
ion
belo
w, f
or in
tere
st r
ate
risk
and
othe
r pr
ice
risk.
A r
easo
nabl
y po
ssib
le c
hang
e in
ris
k va
riabl
e ha
s be
en d
eter
min
ed a
fter
taki
ng i
nto
acco
unt
the
econ
omic
env
ironm
ent
in w
hich
the
Dep
artm
ent
oper
ates
and
the
time
fram
e fo
r the
ass
essm
ent (
i.e. u
ntil
the
end
of th
e ne
xt a
nnua
l rep
ortin
g pe
riod)
. The
se
nsiti
vity
ana
lysi
s is
bas
ed o
n ris
k ex
posu
res
in e
xist
ence
at t
he s
tate
men
t of f
inan
cial
pos
ition
dat
e. T
he
anal
ysis
is p
erfo
rmed
on
the
sam
e ba
sis
as f
or 2
013-
14.
The
anal
ysis
ass
umes
tha
t al
l oth
er v
aria
bles
re
mai
n co
nsta
nt.
Inte
rest
rate
risk
E
xpos
ure
to in
tere
st ra
te ri
sk a
rises
prim
arily
thro
ugh
the
Dep
artm
ent’s
inte
rest
bea
ring
liabi
litie
s. T
his
risk
is m
inim
ised
by
unde
rtaki
ng m
ainl
y fix
ed ra
te b
orro
win
gs, p
rimar
ily w
ith N
SW
TC
orp.
The
Dep
artm
ent d
oes
not
acco
unt
for
any
fixed
rat
e fin
anci
al in
stru
men
ts a
t fa
ir va
lue
thro
ugh
prof
it or
loss
or
as a
vaila
ble
for
sale
. The
refo
re fo
r th
ese
finan
cial
inst
rum
ents
a c
hang
e in
inte
rest
rat
es w
ould
not
affe
ct p
rofit
or
loss
or
equi
ty.
A re
ason
ably
pos
sibl
e ch
ange
of
+/-
1% is
use
d, c
onsi
sten
t w
ith c
urre
nt t
rend
s in
inte
rest
rat
es
(bas
ed o
n of
ficia
l RB
A in
tere
st r
ate
vola
tility
ove
r th
e la
st fi
ve y
ears
). Th
e ba
sis
will
be
revi
ewed
ann
ually
an
d am
ende
d w
here
ther
e is
a s
truct
ural
cha
nge
in th
e le
vel o
f int
eres
t rat
e vo
latil
ity.
The
Dep
artm
ent’s
exp
osur
e to
inte
rest
rate
risk
is s
et o
ut b
elow
.
$’
000
Car
ryin
g A
mou
nt
-1%
+1%
Prof
it
Equi
ty
Prof
it
Equi
ty
2015
Fina
ncia
l ass
ets:
Cas
h an
d ca
sh e
quiv
alen
ts
775,
263
(7,7
53)
(7,7
53)
7,75
3 7,
753
Rec
eiva
bles
31
,950
(3
20)
(320
) 32
0 32
0 O
ther
fina
ncia
l ass
ets
18,6
28
(186
) (1
86)
186
186
Fina
ncia
l lia
bilit
ies:
Pay
able
s 45
1,47
3 4,
515
4,51
5 (4
,515
) (4
,515
) B
orro
win
gs
322,
619
3,22
6 3,
226
(3,2
26)
(3,2
26)
2014
Fina
ncia
l ass
ets:
Cas
h an
d ca
sh e
quiv
alen
ts
1,12
5,56
1 (1
1,25
6)
(11,
256)
11
,256
11
,256
R
ecei
vabl
es
68,1
49
(681
) (6
81)
681
681
Oth
er fi
nanc
ial a
sset
s 22
,462
(2
25)
(225
) 22
5 22
5 Fi
nanc
ial l
iabi
litie
s:
P
ayab
les
570,
844
5,70
8 5,
708
(5,7
08)
(5,7
08)
Bor
row
ings
32
8,40
0 3,
284
3,28
4 (3
,284
) (3
,284
)
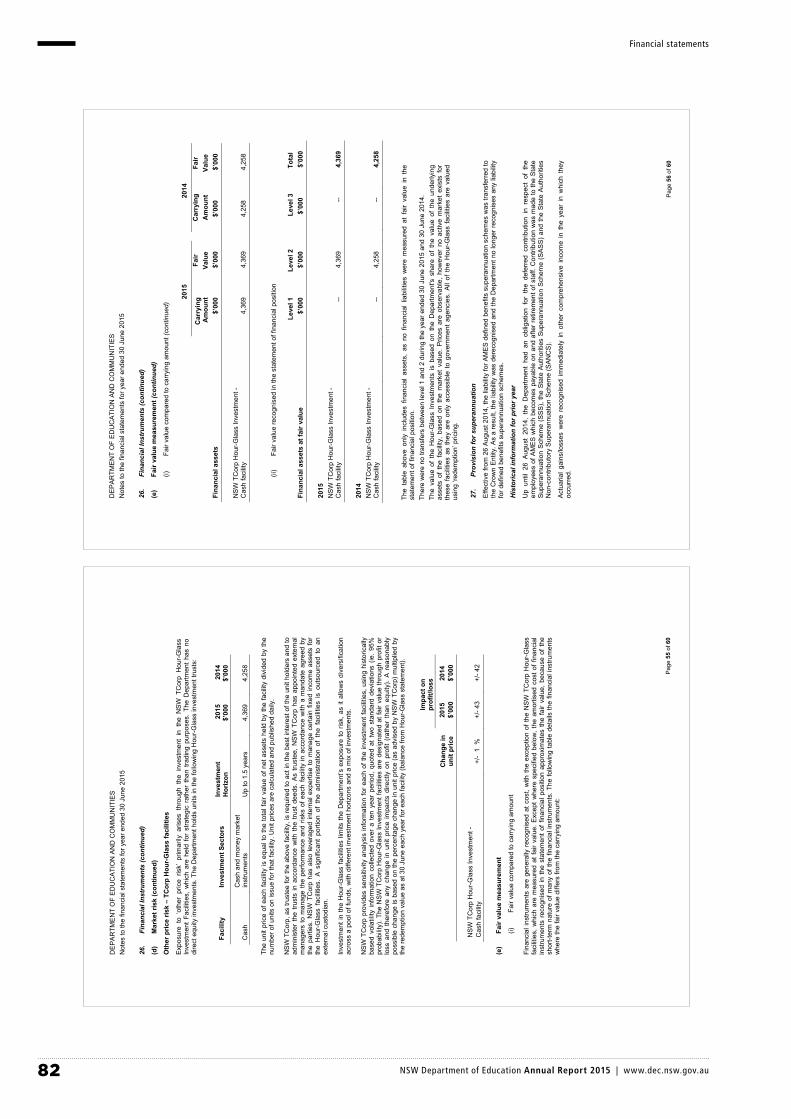
82 NSW Department of Education Annual Report 2015 | www.dec.nsw.gov.au
Financial statements
DE
PA
RTM
EN
T O
F E
DU
CA
TIO
N A
ND
CO
MM
UN
ITIE
SN
otes
to th
e fin
anci
al s
tate
men
ts fo
r yea
r end
ed 3
0 Ju
ne 2
015
Pag
e55
of 6
0
26.
Fina
ncia
l Ins
trum
ents
(con
tinue
d)
(d)
Mar
ket r
isk
(con
tinue
d)
Oth
er p
rice
risk
– TC
orp
Hou
r-G
lass
faci
litie
s
Expo
sure
to
‘oth
er p
rice
risk’
prim
arily
aris
es t
hrou
gh t
he i
nves
tmen
t in
the
NSW
TC
orp
Hou
r-Gla
ss
Inve
stm
ent
Faci
litie
s, w
hich
are
hel
d fo
r st
rate
gic
rath
er t
han
tradi
ng p
urpo
ses.
The
Dep
artm
ent
has
no
dire
ct e
quity
inve
stm
ents
. The
De p
artm
ent h
olds
uni
ts in
the
follo
win
g H
our-G
lass
inve
stm
ent t
rust
s:
Faci
lity
Inve
stm
ent S
ecto
rsIn
vest
men
t H
oriz
on20
15
$’00
0 20
14
$’00
0
Cas
h
Cas
h an
d m
oney
mar
ket
inst
rum
ents
U
p to
1.5
yea
rs
4,36
9 4,
258
The
unit
pric
e of
eac
h fa
cilit
y is
equ
al to
the
tota
l fai
r va
lue
of n
et a
sset
s he
ld b
y th
e fa
cilit
y di
vide
d by
the
num
ber o
f uni
ts o
n is
sue
for t
hat f
acilit
y. U
nit p
rices
are
cal
cula
ted
and
publ
ishe
d da
ily.
NS
W T
Cor
p, a
s tru
stee
for t
he a
bove
faci
lity,
is re
quire
d to
act
in th
e be
st in
tere
st o
f the
uni
t hol
ders
and
to
adm
inis
ter
the
trust
s in
acc
orda
nce
with
the
trust
dee
ds. A
s tru
stee
, NS
W T
Cor
p ha
s ap
poin
ted
exte
rnal
m
anag
ers
to m
anag
e th
e pe
rform
ance
and
ris
ks o
f eac
h fa
cilit
y in
acc
orda
nce
with
a m
anda
te a
gree
d by
th
e pa
rties
. NS
W T
Cor
p ha
s al
so le
vera
ged
inte
rnal
exp
ertis
e to
man
age
certa
in fi
xed
inco
me
asse
ts fo
r th
e H
our-G
lass
fac
ilitie
s. A
sig
nific
ant
porti
on o
f th
e ad
min
istra
tion
of t
he f
acilit
ies
is o
utso
urce
d to
an
exte
rnal
cus
todi
an.
Inve
stm
ent i
n th
e H
our-G
lass
faci
litie
s lim
its th
e D
epar
tmen
t’s e
xpos
ure
to r
isk,
as
it al
low
s di
vers
ifica
tion
acro
ss a
poo
l of f
unds
, with
diff
eren
t inv
estm
ent h
oriz
ons
and
a m
ix o
f inv
estm
ents
.
NS
W T
Cor
p pr
ovid
es s
ensi
tivity
ana
lysi
s in
form
atio
n fo
r ea
ch o
f the
inve
stm
ent f
acilit
ies,
usi
ng h
isto
rical
ly
base
d vo
latil
ity in
form
atio
n co
llect
ed o
ver
a te
n ye
ar p
erio
d, q
uote
d at
tw
o st
anda
rd d
evia
tions
(ie
. 95
%
prob
abili
ty).
The
NS
W T
Cor
p H
our-G
lass
Inve
stm
ent f
acilit
ies
are
desi
gnat
ed a
t fai
r val
ue th
roug
h pr
ofit
or
loss
and
the
refo
re a
ny c
hang
e in
uni
t pr
ice
impa
cts
dire
ctly
on
prof
it (r
athe
r th
an e
quity
). A
rea
sona
bly
poss
ible
cha
nge
is b
ased
on
the
perc
enta
ge c
hang
e in
uni
t pric
e (a
s ad
vise
d by
NSW
TC
orp)
mul
tiplie
d by
th
e re
dem
ptio
n va
lue
as a
t 30
June
eac
h ye
ar fo
r eac
h fa
cilit
y (b
alan
ce fr
om H
our-
Gla
ss s
tate
men
t).
Impa
ct o
n pr
ofit/
loss
Cha
nge
in
unit
pric
e
2015
2014
$’00
0$’
000
NS
W T
Cor
p H
our-G
lass
Inve
stm
ent -
C
ash
faci
lity
+/-
1 %
+/
- 43
+/- 4
2
(e)
Fair
valu
e m
easu
rem
ent
(i)
Fair
valu
e co
mpa
red
to c
arry
ing
amou
nt
Fina
ncia
l ins
trum
ents
are
gen
eral
ly r
ecog
nise
d at
cos
t, w
ith th
e ex
cept
ion
of th
e N
SW
TC
orp
Hou
r-Gla
ss
faci
litie
s, w
hich
are
mea
sure
d at
fair
valu
e. E
xcep
t whe
re s
peci
fied
belo
w, t
he a
mor
tised
cos
t of f
inan
cial
in
stru
men
ts r
ecog
nise
d in
the
stat
emen
t of
finan
cial
pos
ition
app
roxi
mat
es th
e fa
ir va
lue,
bec
ause
of
the
shor
t-ter
m n
atur
e of
man
y of
the
finan
cial
inst
rum
ents
. The
follo
win
g ta
ble
deta
ils th
e fin
anci
al in
stru
men
ts
whe
re th
e fa
ir va
lue
diffe
rs fr
om th
e ca
rryi
ng a
mou
nt:
DE
PA
RTM
EN
T O
F E
DU
CA
TIO
N A
ND
CO
MM
UN
ITIE
SN
otes
to th
e fin
anci
al s
tate
men
ts fo
r yea
r end
ed 3
0 Ju
ne 2
015
Pag
e56
of 6
0
26.
Fina
ncia
l Ins
trum
ents
(con
tinue
d)
(e)
Fair
valu
e m
easu
rem
ent (
cont
inue
d)
(i)
Fair
valu
e co
mpa
red
to c
arry
ing
amou
nt (c
ontin
ued)
2015
2014
Car
ryin
g A
mou
nt
Fai r
Valu
e
Car
ryin
g A
mou
nt
Fair
Valu
eFi
nanc
ial a
sset
s $’
000
$’00
0
$’00
0$’
000
N
SW
TC
orp
Hou
r-Gla
ss In
vest
men
t -C
ash
faci
lity
4,
369
4,36
9 4,
258
4,25
8
(ii)
Fair
valu
e re
cogn
ised
in th
e st
atem
ent o
f fin
anci
al p
ositi
on
Leve
l 1
Leve
l 2
Leve
l 3
Tota
l Fi
nanc
ial a
sset
s at
fair
valu
e $’
000
$’00
0
$’00
0$’
000
2015
N
SW
TC
orp
Hou
r-Gla
ss In
vest
men
t -C
ash
faci
lity
--
4,36
9 --
4,36
9
2014
N
SW
TC
orp
Hou
r-Gla
ss In
vest
men
t -C
ash
faci
lity
--
4,25
8 --
4,25
8
The
tabl
e ab
ove
only
inc
lude
s fin
anci
al a
sset
s, a
s no
fin
anci
al l
iabi
litie
s w
ere
mea
sure
d at
fai
r va
lue
in t
he
stat
emen
t of f
inan
cial
pos
ition
. Th
ere
wer
e no
tran
sfer
s be
twee
n le
vel 1
and
2 d
urin
g th
e ye
ar e
nded
30
June
201
5 an
d 30
Jun
e 20
14.
The
valu
e of
the
Hou
r-Gla
ss I
nves
tmen
ts i
s ba
sed
on t
he D
epar
tmen
t's s
hare
of
the
valu
e of
the
und
erly
ing
asse
ts o
f th
e fa
cilit
y, b
ased
on
the
mar
ket
valu
e. P
rices
are
obs
erva
ble,
how
ever
no
activ
e m
arke
t ex
ists
for
th
ese
faci
litie
s as
the
y ar
e on
ly a
cces
sibl
e to
gov
ernm
ent
agen
cies
. A
ll of
the
Hou
r-Gla
ss f
acilit
ies
are
valu
ed
usin
g ‘re
dem
ptio
n’ p
ricin
g.
27.
Prov
isio
n fo
r sup
eran
nuat
ion
Effe
ctiv
e fro
m 2
6 A
ugus
t 201
4, th
e lia
bilit
y fo
r AM
ES
def
ined
ben
efits
sup
eran
nuat
ion
sche
mes
was
tran
sfer
red
to
the
Cro
wn
Ent
ity. A
s a
resu
lt, th
e lia
bilit
y w
as d
erec
ogni
sed
and
the
Dep
artm
ent n
o lo
nger
reco
gnis
es a
ny li
abilit
y fo
r def
ined
ben
efits
sup
eran
nuat
ion
sche
mes
.
His
toric
al in
form
atio
n fo
r prio
r yea
r
Up
until
26
Aug
ust
2014
, th
e D
epar
tmen
t ha
d an
obl
igat
i on
for
the
defe
rred
cont
ribut
ion
in r
espe
ct o
f th
e em
ploy
ees
of A
ME
S w
hich
bec
omes
pay
able
on
and
afte
r ret
irem
ent o
f sta
ff. C
ontri
butio
n w
as m
ade
to th
e S
tate
Su
pera
nnua
tion
Sche
me
(SS
S),
the
Stat
e A
utho
ritie
s S
uper
annu
atio
n S
chem
e (S
AS
S)
and
the
Sta
te A
utho
ritie
s N
on-c
ontri
buto
ry S
uper
annu
atio
n S
chem
e (S
AN
CS
).
Actu
aria
l gai
ns/lo
sses
wer
e re
cogn
ised
im
med
iate
ly i
n ot
her
com
preh
ensi
ve in
com
e in
the
yea
r in
whi
ch t
hey
occu
rred
.

83 NSW Department of Education Annual Report 2015 | www.dec.nsw.gov.au
Financial statements
DE
PA
RTM
EN
T O
F E
DU
CA
TIO
N A
ND
CO
MM
UN
ITIE
SN
otes
to th
e fin
anci
al s
tate
men
ts fo
r yea
r end
ed 3
0 Ju
ne 2
015
Pag
e57
of 6
0
27.
Prov
isio
n fo
r sup
eran
nuat
ion
(con
tinue
d)
Fund
info
rmat
ion
The
Poo
led
Fund
hol
ds in
trus
t the
inve
stm
ents
of t
he c
lose
d N
SW
pub
lic s
ecto
r sup
eran
nuat
ion
sche
mes
:
S
tate
Aut
horit
ies
Sup
eran
nuat
ion
Sche
me
(SAS
S);
S
tate
Sup
eran
nuat
ion
Sch
eme
(SS
S);
P
olic
e S
uper
annu
atio
n S
chem
e (P
SS
); an
d
Sta
te A
utho
ritie
s N
on-c
ontri
buto
ry S
uper
annu
atio
n S
chem
e (S
AN
CS
).
Thes
e sc
hem
es a
re a
ll de
fined
ben
efit
sche
mes
– a
t le
ast
a co
mpo
nent
of
the
final
ben
efit
is d
eriv
ed f
rom
a
mul
tiple
of
mem
ber
sala
ry a
nd y
ears
of
mem
bers
hip.
Mem
bers
rec
eive
lum
p su
m o
r pe
nsio
n be
nefit
s on
re
tirem
ent,
deat
h, d
isab
lem
ent a
nd w
ithdr
awal
.
All
thes
e sc
hem
es a
re c
lose
d to
new
mem
bers
.
Des
crip
tion
of th
e re
gula
tory
fram
ewor
k
The
sche
mes
in th
e Po
oled
Fun
d ar
e es
tabl
ishe
d an
d go
vern
ed b
y th
e fo
llow
ing
NSW
legi
slat
ions
:
S
uper
annu
atio
n A
ct 1
916;
S
tate
Aut
horit
ies
Sup
eran
nuat
ion
Act
198
7;
Pol
ice
Reg
ulat
ion
(Sup
eran
nuat
ion)
Act
190
6;
Sta
te A
utho
ritie
s N
on-c
ontri
buto
ry S
uper
annu
atio
n A
ct 1
987;
and
thei
r ass
ocia
ted
regu
latio
ns.
The
sche
mes
in th
e Po
oled
Fun
d ar
e ex
empt
pub
lic s
ecto
r su
pera
nnua
tion
sche
mes
und
er th
e C
omm
onw
ealth
S
uper
annu
atio
n In
dust
ry
(Sup
ervi
sion
) A
ct
1993
(S
IS).
The
SIS
Le
gisl
atio
n tre
ats
exem
pt
publ
ic
sect
or
supe
rann
uatio
n fu
nds
as c
ompl
ying
fund
s fo
r con
cess
iona
l tax
atio
n an
d su
pera
nnua
tion
guar
ante
e pu
rpos
es.
Und
er a
Hea
ds o
f G
over
nmen
t ag
reem
ent,
the
New
Sou
th W
ales
Gov
ernm
ent
unde
rtake
s to
ens
ure
that
the
P
oole
d Fu
nd w
ill c
onfo
rm w
ith t
he p
rinci
ples
of
the
Com
mon
wea
lth’s
ret
irem
ent
inco
mes
pol
icy
rela
ting
to
pres
erva
tion,
ves
ting
and
repo
rting
to m
embe
rs a
nd th
at m
embe
rs’ b
enef
its a
re a
dequ
atel
y pr
otec
ted.
The
New
Sou
th W
ales
Gov
ernm
ent
prud
entia
lly m
onito
rs a
nd a
udits
the
Poo
led
Fund
and
the
Tru
stee
Boa
rd
activ
ities
in
a m
anne
r co
nsis
tent
with
the
pru
dent
ial
cont
rols
of
the
SIS
leg
isla
tion.
The
se p
rovi
sion
s ar
e in
ad
ditio
n to
oth
er l
egis
lativ
e ob
ligat
ions
on
the
Trus
tee
Boar
d an
d in
tern
al p
roce
sses
tha
t m
onito
r th
e Tr
uste
e B
oard
’s a
dher
ence
to th
e pr
inci
ples
of t
he C
omm
onw
ealth
’s re
tirem
ent i
ncom
es p
olic
y.
An a
ctua
rial i
nves
tigat
ion
of th
e Po
oled
Fun
d is
per
form
ed e
very
thre
e ye
ars.
The
last
act
uaria
l inv
estig
atio
n w
as
perfo
rmed
as
at 3
0 Ju
ne 2
012.
Des
crip
tion
of o
ther
ent
ities
’ res
pons
ibili
ties
for t
he g
over
nanc
e of
the
fund
The
Fund
's T
rust
ee is
resp
onsi
ble
for t
he g
over
nanc
e of
the
Fund
. The
Tru
stee
has
a le
gal o
blig
atio
n to
act
sol
ely
in th
e be
st in
tere
sts
of fu
nd b
enef
icia
ries.
The
Tru
stee
has
the
follo
win
g ro
les:
A
dmin
istra
tion
of th
e fu
nd a
nd p
aym
ent t
o th
e be
nefic
iarie
s fro
m fu
nd a
sset
s w
hen
requ
ired
in
acco
rdan
ce w
ith th
e fu
nd ru
les;
Man
agem
ent a
nd in
vest
men
t of t
he fu
nd a
sset
s; a
nd
C
ompl
ianc
e w
ith o
ther
app
licab
le re
gula
tions
.
Des
crip
tion
of ri
sks
Ther
e ar
e a
num
ber o
f ris
ks to
whi
ch th
e Fu
nd e
xpos
e th
e D
epar
tmen
t. Th
e m
ore
sign
ifica
nt r
isks
rel
atin
g to
the
defin
ed b
enef
its a
re:
In
vest
men
t ris
k - T
he ri
sk th
at in
vest
men
t ret
urns
will
be
low
er th
an a
ssum
ed a
nd th
e E
mpl
oyer
will
need
to in
crea
se c
ontri
butio
ns to
offs
et th
is s
hortf
all
Pe
nsio
n in
dexa
tion
risk
- Th
e ris
k th
at p
ensi
ons
will
incr
ease
at a
rate
gre
ater
than
ass
umed
,
incr
easi
ng fu
ture
pen
sion
s.
Sa
lary
gro
wth
risk
- Th
e ris
k th
at w
ages
or s
alar
ies
(on
whi
ch fu
ture
ben
efit
amou
nts
for a
ctiv
e
mem
bers
will
be
base
d) w
ill ri
se m
ore
rapi
dly
than
ass
umed
, inc
reas
ing
defin
ed b
enef
it am
ount
s an
d
ther
eby
requ
iring
add
ition
al e
mpl
oyer
con
tribu
tions
.
Legi
slat
ive
risk
- The
risk
is th
at le
gisl
ativ
e ch
ange
s co
uld
be m
ade
whi
ch in
crea
se th
e co
st o
f pro
vidi
ng
the
defin
ed b
enef
its.
The
defin
ed b
enef
it fu
nd a
sset
s ar
e in
vest
ed w
ith in
depe
nden
t fun
d m
anag
ers
and
have
a d
iver
sifie
d as
set m
ix.
The
Fund
has
no
sign
ifica
nt c
once
ntra
tion
of in
vest
men
t ris
k or
liqu
idity
risk
.
DE
PA
RTM
EN
T O
F E
DU
CA
TIO
N A
ND
CO
MM
UN
ITIE
SN
otes
to th
e fin
anci
al s
tate
men
ts fo
r yea
r end
ed 3
0 Ju
ne 2
015
Pag
e58
of 6
0
27.
Prov
isio
n fo
r sup
eran
nuat
ion
(con
tinue
d)
D
escr
iptio
n of
sig
nific
ant e
vent
s
Ther
e w
ere
no fu
nd a
men
dmen
ts, c
urta
ilmen
ts o
r set
tlem
ents
dur
ing
the
year
.
Rec
onci
liatio
n of
the
Net
Ben
efit
Liab
ility
/(Ass
et)
Oth
er C
ompr
ehen
sive
Inco
me
Fina
ncia
l yea
r to
30 J
une
2014
SA
SS$
SAN
CS $
SSS $
Tota
l $
Act
uaria
l (ga
ins)
/loss
es o
n lia
bilit
ies
3,31
4 (1
25,1
72)
2,19
3,51
9 2,
071,
661
Act
ual r
etur
n on
Fun
ded
asse
ts le
ss
inte
rest
inco
me
(8,2
18)
(51,
285)
(4
,709
,244
) (4
,768
,747
) To
tal r
emea
sure
men
t in
Oth
er
Com
preh
ensi
ve In
com
e(4
,904
) (1
76,4
57)
(2,5
15,7
25)
(2,6
97,0
86)
Fina
ncia
l yea
r to
30 J
une
2014
SA
SS$
SAN
CS $
SSS $
Tota
l $N
et D
efin
ed B
enef
it Li
abili
ty/(A
sset
) at s
tart
of y
ear
(122
,955
) (6
28,2
78)
40,3
61,0
72
39,6
09,8
39
Cur
rent
ser
vice
cos
t --
1,81
4 12
,572
14
,386
N
et In
tere
st o
n th
e ne
t def
ined
be
nefit
liab
ility/
(ass
et)
(4,6
72)
(23,
875)
1,
533,
721
1,50
5,17
4 A
ctua
l ret
urn
on F
und
asse
ts le
ss
Inte
rest
inco
me
(8,2
18)
(51,
285)
(4
,709
,244
) (4
,768
,747
) A
ctua
rial (
gain
s)/lo
sses
aris
ing
from
ch
ange
s in
fina
ncia
l ass
umpt
ions
--
3,92
5 2,
929,
597
2,93
3,52
2 A
ctua
rial (
gain
s)/lo
sses
aris
ing
from
lia
bilit
y ex
perie
nce
3,31
4 (1
29,0
97)
(736
,078
) (8
61,8
61)
Net
Def
ined
Ben
efit
Liab
ility
/(Ass
et) a
t end
of y
ear
(132
,531
) (8
26,7
96)
39,3
91,6
40
38,4
32,3
13

84 NSW Department of Education Annual Report 2015 | www.dec.nsw.gov.au
Financial statements
DE
PA
RTM
EN
T O
F E
DU
CA
TIO
N A
ND
CO
MM
UN
ITIE
SN
otes
to th
e fin
anci
al s
tate
men
ts fo
r yea
r end
ed 3
0 Ju
ne 2
015
Pag
e59
of 6
0
27.
Prov
isio
n fo
r sup
eran
nuat
ion
(con
tinue
d)
Impa
ct o
f new
AA
SB 1
19 w
ith re
spec
t to
the
Fina
ncia
l Yea
r to
30 J
une
2014
1 Thi
s ite
m is
the
actu
al re
turn
on
asse
ts in
exc
ess
of e
xpec
ted
retu
rn o
n as
sets
und
er th
e pr
evio
us A
AS
B
119
stan
dard
, an
d in
exc
ess
of i
nter
est
inco
me
unde
r th
e cu
rrent
Acc
ount
ing
Sta
ndar
d A
AS
B 1
19
Em
ploy
ee B
enef
its.
Impa
ct o
f new
AA
SB 1
19 o
n th
e st
atem
ent o
f fin
anci
al p
ositi
on a
s at
30
June
201
4
Prev
ious
AA
SB 1
19
C
urre
nt
AA
SB 1
19
SASS
SAN
CS
SSS
Tota
l
Tota
l$
$$
$
$
Ser
vice
cos
t --
1,56
6 7,
061
8,62
7
14,3
87
Net
Inte
rest
(c
urre
nt A
AS
B 1
19
only
) n/
a n/
a n/
a n/
a 1,
505,
174
Inte
rest
Exp
ense
(p
revi
ous
AA
SB
11
9 on
ly)
-- 1,
357
3,27
5,45
9 3,
276,
816
n/a
Expe
cted
retu
rn o
n as
sets
(pre
viou
s A
AS
B 1
19 o
nly)
(8
,988
) (4
8,96
6)
(4,4
50,4
99)
(4,5
08,4
53)
n/a
Supe
rann
uatio
n ex
pens
e/(in
com
e)
in P
&L
(8,9
88)
(46,
043)
(1
,167
,979
) (1
,223
,010
) 1,
519,
561
Act
uaria
l (g
ains
)/los
ses
on
liabi
litie
s 4,
050
(98,
715)
2,
573,
406
2,47
8,74
1 2,
071,
661
Ret
urn
on a
sset
s ex
clud
ing
amou
nts
incl
uded
in P
&L1
(3,2
01)
(23,
956)
(2
,225
,675
) (2
,252
,832
) (4
,768
,747
) A
mou
nt
reco
gnis
ed in
ot
her
com
preh
ensi
ve
inco
me
(OC
I) 84
9 (1
22,6
71)
347,
731
225,
909
(2,6
97,0
86)
Tota
l rec
ogni
sed
in P
&L
and
OC
I (8
,139
) (1
68,7
14)
(820
,248
) (9
97,1
01)
(1,1
77,5
25)
Prev
ious
AA
SB 1
19
C
urre
nt
AA
SB 1
19
SASS
SAN
CS
SSS
Tota
l
Tota
l$
$$
$
$N
et D
efin
ed B
enef
it Li
abili
tyN
et D
efin
ed
Ben
efit
Liab
ility
(112
,651
) (7
02,3
79)
33,6
26,0
60
32,8
11,0
30
38,4
32,3
13
DE
PA
RTM
EN
T O
F E
DU
CA
TIO
N A
ND
TR
AIN
ING
N
otes
to a
nd fo
rmin
g pa
rt of
the
Fina
ncia
l Sta
tem
ents
Pag
e60
of 6
0
28.
Even
ts a
fter t
he R
epor
ting
Perio
d
The
Adm
inis
trativ
e A
rran
gem
ents
(A
dmin
istra
tive
Cha
nges
– P
ublic
Ser
vice
Age
ncie
s) O
rder
(N
o 2)
201
5 to
ok
effe
ct o
n 1
July
201
5 an
d ha
s th
e fo
llow
ing
effe
cts
on th
e D
epar
tmen
t;
ch
ange
of n
ame
from
Dep
artm
ent o
f Edu
catio
n an
d C
omm
uniti
es to
Dep
artm
ent o
f Edu
catio
n;
tra
nsfe
r of t
he O
ffice
of C
omm
uniti
es (e
xcep
t the
Offi
ce o
f Abo
rigin
al A
ffairs
) to
the
Dep
artm
ent o
f Fam
ily
and
Com
mun
ity S
ervi
ces;
and
trans
fer
of S
tate
Tra
inin
g Se
rvic
es to
the
new
ly e
stab
lishe
d D
epar
tmen
t of I
ndus
try, S
kills
and
Reg
iona
l D
evel
opm
ent.
The
sepa
ratio
n of
bot
h O
ffice
of
Com
mun
ities
(ex
cept
the
Offi
ce o
f A
borig
inal
Affa
irs)
and
Sta
te T
rain
ing
Serv
ices
doe
s no
t re
sult
in a
ny im
pact
on
the
Dep
artm
ent’s
fin
anci
al s
tate
men
ts f
or t
he y
ear
ende
d 30
Jun
e 20
15.
End
of a
udite
d fin
anci
al s
tate
men
ts
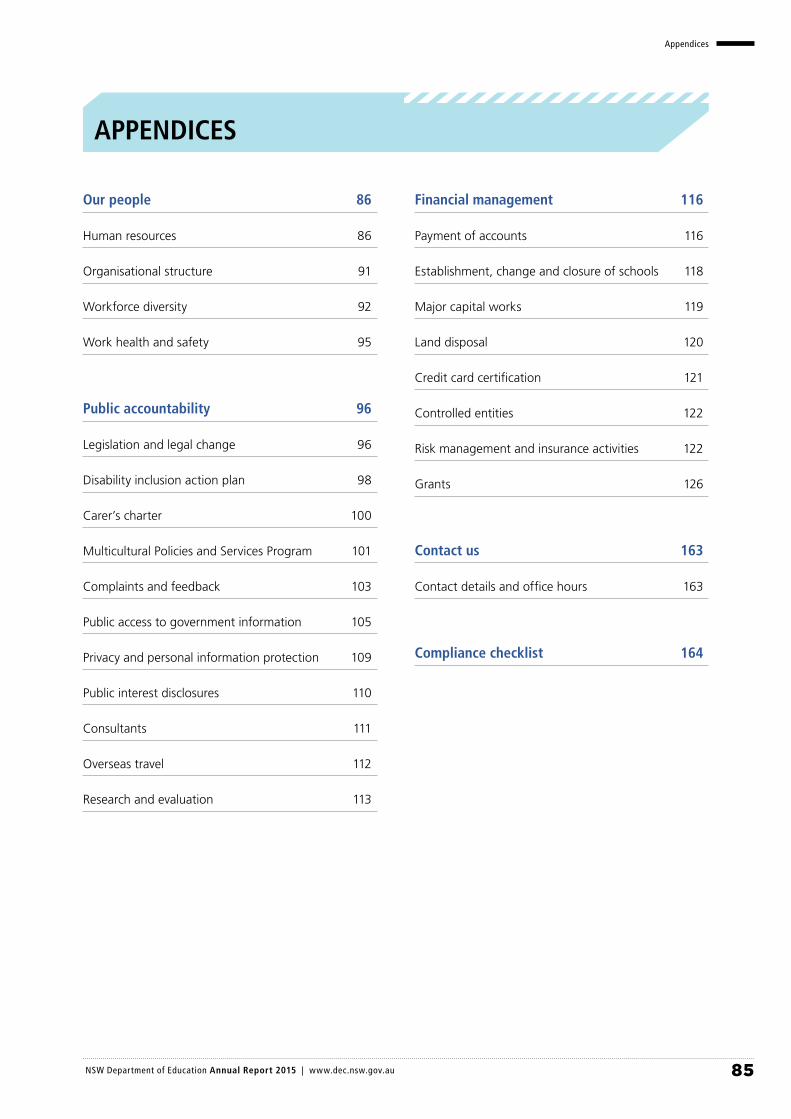
85 NSW Department of Education Annual Report 2015 | www.dec.nsw.gov.au
Appendices
APPENDICES
Our people 86
Human resources 86
Organisational structure 91
Workforce diversity 92
Work health and safety 95
Public accountability 96
Legislation and legal change 96
Disability inclusion action plan 98
Carer’s charter 100
Multicultural Policies and Services Program 101
Complaints and feedback 103
Public access to government information 105
Privacy and personal information protection 109
Public interest disclosures 110
Consultants 111
Overseas travel 112
Research and evaluation 113
Financial management 116
Payment of accounts 116
Establishment, change and closure of schools 118
Major capital works 119
Land disposal 120
Credit card certification 121
Controlled entities 122
Risk management and insurance activities 122
Grants 126
Contact us 163
Contact details and office hours 163
Compliance checklist 164

86 NSW Department of Education Annual Report 2015 | www.dec.nsw.gov.au
Our people
OUR PEOPLE
HUMAN RESOURCES
This section provides data on the number of staff employed by the department, commentary on our personnel policy and practices, and movement in wages.
In June 2015, the department employed 86,031 full-time equivalent (FTE) staff. More than 73 per cent were teachers in NSW public schools. The decrease in the number of staff since 2014 is primarily due to the transition of TAFE NSW from the department.
Table 1: Number of full-time equivalent staff, 2012 to 2015
30 June 2012
30 June 2013
30 June 2014
30 June 2015
Teachers (schools) 61,664 61,904 62,169 63,274
Educational support (schools) 18,330 18,176 18,507 18,917
Educational support (state and regional offices) 3,386 3,173 2,947 2,688
Corporate services (core and non-core) 2,124 2,052 2,053 997
Educational support (TAFE NSW) 4,161 3,896 3,611 0
Teachers (TAFE NSW) 10,234 9,642 8,853 0
Adult Migrant English Service and National Art School
29 20 20 16
Office of Communities 922 903 813 139
Total 100,849 99,766 98,973 86,031
Source: NSW Public Sector Workforce Profile as at 30 June each year. Notes: Includes FTE permanent, temporary and casual staff. Due to rounding, figures may not add up to the totals shown. From 2015, figures for the Office of Communities include Multicultural NSW and the Advocate for Children and Young People, but do not include Aboriginal Affairs and Communities Policy and Programs (these are now incorporated into the department figures). Sport and Recreation, Sydney Olympic Park Authority, Venues NSW, Veteran’s Affairs and TAFE NSW are no longer under the department due to machinery-of-government changes and their data are excluded. The decrease in the corporate services (core and non-core) group from 2014 to 2015 is primarily due to TAFE NSW being excluded.

87 NSW Department of Education Annual Report 2015 | www.dec.nsw.gov.au
Our people
Female Male Total
Number % of total
% of total at
this level
Number % of total
% of total at
this level
Number % of grand total
Classroom teachers 15,878 78.4 84.2 2,986 66.0 15.8 18,864 76.2
Assistant principals 2,889 14.3 79.8 731 16.1 20.2 3,620 14.6
Deputy principals 429 2.1 79.2 113 2.5 20.8 542 2.2
Primary principals class 6 134 0.7 81.2 31 0.7 18.8 165 0.7
Primary principals class 5 290 1.4 64.9 157 3.5 35.1 447 1.8
Primary principals class 4 250 1.2 57.7 183 4.0 42.3 433 1.7
Primary principals class 3 182 0.9 55.3 147 3.2 44.7 329 1.3
Primary principals class 2 148 0.7 54.6 123 2.7 45.4 271 1.1
Primary principals class 1 41 0.2 43.6 53 1.2 56.4 94 0.4
Executive principals (Connected Communities)
3 0.0 50.0 3 0.1 50.0 6 0.0
Total 20,244 100.0 81.7 4,527 100.0 18.3 24,771 100.0
Total primary principals 1,048 5.2 60.1 697 15.4 39.9 1,745 7.0
Total promoted 4,366 21.6 73.9 1,541 34.0 26.1 5,907 23.8
Source: NSW Public Sector Workforce Profile as at 30 June 2015. Notes: Teachers on leave without pay for 12 months or more are not included in the table. Total promoted includes all executive level positions within a school including principal, deputy and assistant principal, head teacher and Highly Accomplished teacher.
Female Male Total
Number % of total
% of total at
this level
Number % of total
% of total at
this level
Number % of grand total
Classroom teachers 10,426 80.1 59.7 7,032 75.1 40.3 17,458 78.0
Head teachers/district guidance officers 2,084 16.0 55.2 1,694 18.1 44.8 3,778 16.9
Deputy principals 329 2.5 44.8 406 4.3 55.2 735 3.3
Secondary principals class 2 98 0.8 41.9 136 1.5 58.1 234 1.0
Secondary principals class 1 73 0.6 46.5 84 0.9 53.5 157 0.7
Executive principals (Connected Communities)
3 0.0 30.0 7 0.1 70.0 10 0.0
Total 13,013 100.0 58.2 9,359 100.0 41.8 22,372 100.0
Total secondary principals 174 1.3 43.4 227 2.4 56.6 401 1.8
Total promoted 2,587 19.9 52.6 2,327 24.9 47.4 4,914 22.0
Source: NSW Public Sector Workforce Profile as at 30 June 2015. Notes: Teachers on leave without pay for 12 months or more are not included in the table. Total promoted includes all executive level positions within a school including principal, deputy and assistant principal, head teacher and Highly Accomplished teacher.
Primary school teachersTable 2: Teaching service staff – Primary teachers in NSW public schools, 2015
Secondary school teachersTable 3: Teaching service staff – Secondary teachers in NSW public schools, 2015

88 NSW Department of Education Annual Report 2015 | www.dec.nsw.gov.au
Our people
Primary and secondary school teachersTable 4: Teaching service staff – Primary and secondary teachers in NSW public schools, 2015
Part-time school teachersTable 5: Part-time school teachers in NSW public schools, 2015
Human resources strategic planning
The department’s Strategic Human Resources Plan 2012–2017 aligns human resources planning with both the departmental strategic plan and NSW Government priorities. Support tools, including the implementation guide, provide business units with guidance on ways to implement the plan.
Government Sector Employment Act 2013
The Government Sector Employment Act 2013 (GSEA) commenced in February 2014, replacing the Public Sector Employment and Management Act 2002 and
introducing reforms to the structure and management of the NSW public sector. It is the centrepiece of a suite of reforms that provide the foundation for a modern, capable and high-performing workforce delivering excellent customer service and building rewarding careers.
Two important areas of reform include changes to the executive structure of the public service and changes to the employment arrangements and workforce management practices that apply more generally to non-executive employees of the department.
Female Male Total
Number % of total
% of total at
this level
Number % of total
% of total at
this level
Number % of grand total
Total teaching staff 33,257 100.0 70.5 13,886 100.0 29.5 47,143 100.0
Total principals 1,222 3.7 56.9 924 6.7 43.1 2,146 4.6
Total promoted 6,953 20.9 64.3 3,868 27.9 35.7 10,821 23.0
Source: NSW Public Sector Workforce Profile as at 30 June 2015. Notes: Teachers on leave without pay for 12 months or more are not included in the table. Highly Accomplished teachers are temporary appointments but are included in the total promoted category. Total promoted includes all executive level positions within a school including principal, deputy and assistant principal, head teacher and Highly Accomplished teacher.
Female Male Total
Number and %
of total
FTE Average FTE
Number and %
of total
FTE Average FTE
Totaland %
FTE Average FTE
Primary classroom teachers10,691
92.3%5,647.0 0.5
8937.7%
493.8 0.611,584
100%6,140.7 0.5
Primary promoted teachers535
93.9%329.8 0.6
356.1%
19.5 0.6570
100%349.3 0.6
Total primary11,22692.4%
5,976.8 0.5928
7.6%513.9 0.6
12,154100%
6,490.7 0.5
Secondary classroom teachers
4,62380.5%
2,693.8 0.61,11819.5%
664.2 0.65,741100%
3,358.1 0.6
Secondary promoted teachers
20282.8%
132.8 0.742
17.2%26.9 0.6
244100%
159.7 0.7
Total secondary4,82580.6%
2,826.7 0.61,16019.4%
691.1 0.65,985100%
3,517.8 0.6
Grand total16,05188.5%
8,803.4 0.52,08811.5%
1,205.0 0.618,139
100%10,008.5 0.6
Source: NSW Public Sector Workforce Profile as at 30 June 2015. Notes: Teachers on leave without pay for 12 months or more are not included in the table. Average FTE (rounded to one decimal place) is calculated by dividing the total FTE by the number of teachers.

89 NSW Department of Education Annual Report 2015 | www.dec.nsw.gov.au
Our people
The GSEA enables staggered implementation dates and transition periods for some of the larger areas of change, including implementation of the NSW Public Sector Capability Framework and senior executive reform. The department is also working closely with the NSW Public Service Commission to ensure new systems and processes comply with, and are aligned to, the intention of the Act.
The Act requires the new executive structures to be completed by 23 February 2017. The department is approaching executive reform in three phases. The first two phases, which included 28 directorates, were completed as at 30 June 2015 and 27 November 2015 respectively. Corporate Services transitioned during phase two. The remaining divisions will transition in 2016.
Capability development
The NSW Public Sector Capability Framework describes the capabilities and associated behaviours expected of all NSW public sector employees, from entry-level to executive staff. The department is continuing to embed the framework across a range of workforce management and professional development activities and ensure recruitment processes are compliant with the GSEA and are capability-focused. To facilitate this, the department:
¡ produced online resources to support hiring managers to carry out recruitment processes compliant with the GSEA
¡ provided advice and guidance for hiring managers on comparative assessment, suitability assessment, and creating and using talent pools
¡ delivered briefing sessions to 443 hiring managers, including 93 senior executives, on key features of the GSEA reforms, the NSW Public Sector Capability Framework and comparative assessments in merit selection.
The NSW Public Sector Performance Development Framework sets the approach for managing all aspects of employee performance in the NSW public sector. The department has aligned existing performance management systems and processes with the framework, developed resources and updated procedures to support the implementation. The framework will also complement the wide-ranging reforms of the Great Teaching, Inspired Learning initiative, which were introduced in 2013.
There are a number of performance and development schemes within the department that apply to different categories of staff, including school teachers, executive and corporate staff.
The performance development process for corporate staff, including senior executives, has been promoted for implementation in the 2015–16 planning cycle. Resources were reviewed and enhanced to closely align with the sector-wide performance and development strategy as well as to progressively meet the accessibility requirements for online resources. Ten information sessions about performance and development were delivered.
A new Performance and Development Framework for Principals, Executives and Teachers, developed jointly by the department and the NSW Teachers Federation, was implemented in 2015. It aims to support the ongoing improvement of student outcomes through continuous development of a skilled, effective and professional teaching workforce.
Flexible work practices
The department offers a wide range of flexible work practices to help staff balance their work and other responsibilities more effectively. This is also recognised as an important means to address work–life balance for staff with carer responsibilities and work-related adjustment needs for staff with disability.
During 2015, 58,480 staff (84.1 per cent of whom were women) accessed flexible work options, including permanent and temporary part-time work, job sharing, leave without pay and varying flexible hour arrangements. An additional 47,431 staff (77.5 per cent of whom were women) took short-term absences for family and community responsibilities.
Organisational change
In 2015, 125 staff accepted offers of voluntary redundancy. No excess employees were made forcibly redundant under the government’s Managing Excess Employees Policy. The department coordinated support for employees through a dedicated change coordination unit and support to increase placement opportunities. Support for excess employees included development of individual redeployment plans and provision of case-management services to assist in the search for redeployment opportunities.
Leave administration
Directors and managers worked with staff towards reducing all recreation leave balances to less than 30 days.
The department’s Human Resources directorate wrote to school principals regarding atypical sick leave patterns for around 8,052 school teachers.

90 NSW Department of Education Annual Report 2015 | www.dec.nsw.gov.au
Our people
By the end of 2015, 1.2 per cent of identified teachers were assessed as requiring further action. Where the principal determined it appropriate, staff were requested to provide a medical certificate for all future periods of sick leave taken in a 12-month period.
Staff performance and conduct
The department supported supervisors to effectively manage the performance and conduct of staff through training, advice and oversighting improvement programs. During 2015, the Employee Performance and Conduct directorate investigated allegations of misconduct including corrupt conduct, financial and academic fraud and maladministration, and child protection allegations.
Wages and salaries
Teachers, principals, executives and other related staff received an increase of 2.27 per cent, effective from January 2015, under the Crown Employees (Teachers in Schools and Related Employees) Salaries and Conditions Award 2014.
In February 2015, Adult Migrant English Service teachers and related employees received an increase of 2.25 per cent, effective from January 2015, under the Crown Employees NSW Adult Migrant English Service (Teachers and Related Employees) Award 2014.
In February 2015, chief education officers received an increase of 2.25 per cent, effective from January 2015, under the Crown Employees (Chief Education Officers – Department of Education and Communities) Salaries and Conditions Award 2014.
Public service and school administrative and support staff received an increase of 2.5 per cent, effective from July 2015, under the Crown Employees (Public Sector – Salaries 2015) Award.
Public service and senior executive service
The Statutory and Other Officers Remuneration Tribunal (SOORT) made its annual determinations in relation to Public Service Senior Executive and Senior Executive Service remuneration packages in June 2015. SOORT determined a 2.5 per cent increase for all public service senior executives and senior executive services officers, effective from July 2015.
Number of senior executive service officers
Table 6 details the number of Public Service Senior Executives (PSSEs) employed in each band and assigned to roles within the department, including transitional former senior executive services officers who are deemed PSSEs under the GSEA, pending implementation of senior executive reform.
Table 6: Number of Public Service Senior Executives employed in each band, as at 30 June 2014 and 2015
Band 30 June 2014 30 June 2015 Average remuneration
Female Male Female MaleRange
$30 June 2014
$30 June 2015
$
Band 4 (Secretary) 1 0 1 0 430,451 – 497,300 531,100 540,300
Band 3 (Deputy Secretary)
3 4 2 3 305,401 – 430,450 371,726 376,210
Band 2 (Executive Director)
20 19 14 12 242,801 – 305,400 261,871 266,852
Band 1 (Director) *12 *22 101 113 170,250 – 242,800 *217,778 186,523
Totals 36 45 118 128
Source: Department of Education, People and Services (PEPS HR Payroll System). Notes: The average remuneration includes the amount payable as a recruitment allowance to approved executives in addition to their remuneration within the band range. *Data provided for 2014 did not include employees under senior officer grades 1–3 as transitional former senior executives within Band 1.

91 NSW Department of Education Annual Report 2015 | www.dec.nsw.gov.au
Our people
ORGANISATIONAL STRUCTURE
Department of Education organisational chart as at 31 December 2015
SECRETARYDEPARTMENT OF EDUCATION
DIRECTOROFFICE OF THE SECRETARY
DIRECTOR
AUDIT
DEPUTY SECRETARYEXTERNAL AFFAIRS AND REGULATION
HEAD ABORIGINAL AFFAIRS
EXECUTIVE DIRECTOR
EARLY CHILDHOOD EDUCATION
EXECUTIVE DIRECTOR
EXTERNAL RELATIONS POLICY
DIRECTOR
FINANCE EXTERNAL AFFAIRS AND REGULATION
DIRECTOR
NATIONAL INITIATIVES AND PERFORMANCE
DIRECTOR
HIGHER EDUCATION
DIRECTOR
EXTERNAL AFFAIRS AND REGULATION
DEPUTY SECRETARYSCHOOL OPERATIONS AND PERFORMANCE
DIRECTOR
SCHOOL OPERATIONS AND PERFORMANCE
DIRECTOR
STRATEGIC COORDINATION
EXECUTIVE DIRECTOR
PUBLIC SCHOOLS NSW
EXECUTIVE DIRECTOR
PUBLIC SCHOOLS NSW
EXECUTIVE DIRECTOR
PUBLIC SCHOOLS NSW
EXECUTIVE DIRECTOR
PUBLIC SCHOOLS NSW
EXECUTIVE DIRECTOR
LEARNING AND TEACHING
EXECUTIVE DIRECTOR
LEARNING AND WELLBEING
EXECUTIVE DIRECTOR
LEARNING AND BUSINESS SYSTEMS
EXECUTIVE DIRECTOR
LEADERSHIP AND HIGH PERFORMANCE
EXECUTIVE DIRECTOR
LEARNING MANAGEMENT AND BUSINESS REFORM
EXECUTIVE DIRECTOR
ABORIGINAL EDUCATION AND COMMUNITIES
DEPUTY SECRETARYCORPORATE
SERVICES
CHIEF FINANCIAL OFFICER
EXECUTIVE DIRECTOR
EMPLOYEE PERFORMANCE AND CONDUCT
GROUP DIRECTOR
WORK HEALTH AND SAFETY
DIRECTOR
INDUSTRIAL RELATIONS
EXECUTIVE DIRECTOR
PEOPLE AND SERVICES
CHIEF PROCUREMENT OFFICER
DIRECTOR
SAFETY AND SECURITY
EXECUTIVE DIRECTOR ASSET MANAGEMENT
CHIEF INFORMATION OFFICER
GENERAL COUNSEL
EXECUTIVE DIRECTOR
SHARED SERVICES
DIRECTOR
CORPORATE SERVICES
DIRECTOR
CORPORATE SERVICES
DEPUTY SECRETARYSTRATEGY AND
EVALUATION
DIRECTOR
PROGRAM MANAGEMENT OFFICE
EXECUTIVE DIRECTOR
COMMUNICATION AND ENGAGEMENT
EXECUTIVE DIRECTOR
CENTRE FOR EDUCATION STATISTICS
AND EVALUATION
DIRECTOR
STRATEGIC DELIVERY
MEMBERS OF THE DEPARTMENT’S EXECUTIVE

92 NSW Department of Education Annual Report 2015 | www.dec.nsw.gov.au
Our people
WORKFORCE DIVERSITY
This section provides a summary of achievements of the department’s workforce diversity programs and initiatives implemented in 2015, including those specifically relating to the teaching service. The department promotes equal employment opportunities initiatives to all staff. The Workforce Diversity Plan 2012–2017 and the Aboriginal Human Resources Development Plan 2012–2017 will continue to be promoted across the department.
The Workforce Diversity Plan 2012–2017 provides a strategic framework for building a workforce that reflects the diversity of students, families and communities. The department’s vision is for an organisation free from all discrimination, recruited and promoted on merit and representative of the wider NSW community.
Diversity in the department primarily refers to the groups that tend to be under-represented in the workforce, including:
¡ women in senior leadership roles
¡ Aboriginal people
¡ people with disability
¡ people from non-English speaking backgrounds and members of racial, ethnic and ethno-religious minority groups
¡ young people under the age of 25.
In 2015, women made up 77 per cent of the (permanent and temporary) workforce.
Aboriginal employees represented 3.6 per cent of the workforce, exceeding the NSW Government benchmark of 2.6 per cent.
The representation of people with disability requiring work-related adjustments has declined slightly to 0.7 per cent. However, data on the number of people with disability employed in the workforce can be unreliable as employees may choose not to disclose information about disability.
In 2015, 10.8 per cent of employees were from non-English speaking backgrounds.
Table 7: Trends in representation of equal employment opportunity groups as a proportion of the total number of staff, 2011 to 2015
NSW Government
benchmark2011 2012 2013 2014 2015
Women 50.0% 73.2% 73.4% 74.1% 74.7% 76.9%
Aboriginal people 2.6% 2.8% 3.2% 3.2% 3.4% 3.6%
People whose first language spoken as a child was not English
19.0% 11.1% 11.2% 11.3% 11.4% 10.8%
People with disability N/A 3.6% 3.5% 3.4% 3.2% 3.0%
People with disability requiring adjustment at work
1.5% 1.0% 1.0% 0.9% 0.8% 0.7%
Total number of staff - 99,891 101,644 101,563 100,964 92,023
Source: NSW Public Sector Workforce Profile as at 30 June each year. Notes: Figures for 2012 to 2015 include the Office of Communities, which became part of the department in April 2011. From 2015, figures for the Office of Communities include Multicultural NSW and Advocate for Children and Young People, but do not include Aboriginal Affairs and Communities Policy and Programs (these are now incorporated into the department figures). Sport and Recreation, Sydney Olympic Park Authority, Venues NSW, Veteran’s Affairs and TAFE NSW are no longer under the department due to machinery-of-government changes and their data are excluded. Changes in figures for 2015 are primarily due to the changes described above. Representation of equal employment opportunity (EEO) groups is calculated as the estimated number of staff in each group divided by the total number of staff. These statistics, except those for women, have been weighted to estimate the representation of EEO groups in the workforce, where EEO survey response rates were less than 100 per cent. The total number of staff is based on a headcount of permanent and temporary employees.

93 NSW Department of Education Annual Report 2015 | www.dec.nsw.gov.au
Our people
Table 8: Trends in distribution of equal employment opportunity groups, 2011 to 2015
Creating opportunities for women
NSW has set targets to increase the proportion of women in senior leadership roles to 50 per cent. In 2015, approximately 47 per cent of senior executive roles were held by women. The department continues to implement a range of leadership development initiatives to achieve this goal, including:
¡ encouraging and supporting women to participate in centrally coordinated leadership and executive development programs, such as the NSW Leadership Academy programs and the Springboard Women’s Development Program; in 2015, 25 women participated in the Springboard Development Program
¡ supporting the Women in Educational Leadership Network, an incorporated body that provides a forum for women in teaching and learning roles to develop leadership skills and progress their careers
¡ supporting flexible work arrangements, such as job-share, to support ongoing career development for women.
Creating opportunities for Aboriginal employees
The department actively supports the recruitment and retention of Aboriginal people through the use of identified positions and by providing a culturally safe workplace. Achievements in 2015 included the following:
¡ Within Aboriginal Affairs, more than 50 per cent of staff identify as Aboriginal or Torres Strait Islander, most staff directly engaged in regional delivery with Aboriginal communities are Aboriginal and two thirds of the Executive Committee are Aboriginal.
¡ The department appointed 106 Aboriginal teachers to permanent positions and offered 73 scholarships in 2015 to Aboriginal students to train as school teachers.
¡ There are designated school administrative and support staff positions for Aboriginal people in schools with significant Aboriginal enrolments. By the end of 2015, the department had identified and filled 157 positions.
¡ Five Yarn Up information sessions and four Aboriginal Education Officer networking workshops were delivered across NSW, including in Dubbo, Wagga Wagga, Tamworth and Western Sydney.
¡ In partnership with representatives of the Secondary Principals’ Council, the department developed and implemented an inaugural two-day leadership forum in Sydney in July 2015 with current school principals and aspiring Aboriginal secondary teachers and executives.
NSW Government
benchmark
Index*
2011 2012 2013 2014 2015
Women 100 91 92 92 92 91
Aboriginal people 100 78 77 80 80 80
People whose first language spoken as a child was not English
100 103 103 103 103 105
People with disability 100 99 98 98 98 98
People with disability requiring adjustment at work
100 104 104 104 104 104
Source: NSW Public Sector Workforce Profile as at 30 June each year. Notes: Figures for 2012 to 2015 include the Office of Communities, which became part of the department in April 2011. From 2015, figures for the Office of Communities include Multicultural NSW and Advocate for Children and Young People, but do not include Aboriginal Affairs and Communities Policy and Programs (these are now incorporated into the department figures). Sport and Recreation, Sydney Olympic Park Authority, Venues NSW, Veteran’s Affairs and TAFE NSW are no longer under the department due to machinery-of-government changes and their data are excluded. Changes in figures for 2015 are primarily due to the changes described above. A distribution index of 100 indicates that the centre of the distribution of the EEO groups across salary levels is equivalent to that of other staff. *Values less than 100 mean that the EEO group tends to be more concentrated at lower salary levels than is the case for other staff. The more pronounced this tendency, the lower the index will be. In some cases the index may be more than 100, indicating that the EEO group is less concentrated at lower salary levels. A distribution index based on an EEO survey response rate of less than 80 per cent may not be completely accurate. The 2015 EEO survey response rate was around 74 per cent.

94 NSW Department of Education Annual Report 2015 | www.dec.nsw.gov.au
Our people
¡ Twenty-three Aboriginal teachers completed the Aboriginal Teacher Leadership program, which supports and develops leadership aspirations of current permanent Aboriginal teachers through career planning and professional learning.
Creating opportunities for employees from non-English speaking backgrounds
The diversity of the department’s workforce allows it to deliver teaching and other services that meet the needs of a diverse NSW community. In 2015, the department undertook a number of initiatives to attract people from diverse backgrounds and perspectives into its workforce and to create pathways for them to progress their careers, including:
¡ providing curriculum and support materials to assist overseas-trained teachers prepare for employment in NSW public schools; more than 100 candidates passed the Professional English Assessment Test
¡ supporting 67 bilingual and community language teachers to undertake the community languages fluency test.
Creating opportunities for young employees
The department recognises the value of a multigenerational workforce that provides a broad range of knowledge, skills and perspectives.
From April 2014 to July 2015, the department employed 37 graduates in corporate roles and provided structured learning and development support, including an induction and networking session as well as a capability development workshop.
The department supports a Young Professionals Network for employees aged 34 years and under, providing professional development and a mechanism for networking within the department and across the public sector. Members of the network attended the CEO and Young Professionals Breakfast, which was hosted by the Institute of Public Administration Australia (IPAA) NSW, the IPAA National Conference, as well as a tour of the Transport Management Centre at Eveleigh, strengthening ties with other government agencies.
Creating opportunities for people with disability
Information on supporting employees with disability is detailed in the report on the department’s disability action plan under the appendix on public accountability starting on page 98 of this report.
Equity and diversity awareness activities
The department promoted and celebrated a number of corporate events, including Reconciliation Week, NAIDOC Week, Carers Week, World Refugee Week, International Women’s Day, Harmony Day and International Day of People with Disability, to raise diversity awareness and to encourage inclusive practices. Individual work areas and schools involved students and community members in the celebrations to raise awareness of equity and diversity.
Future directions
The GSEA provides an enhanced focus on workforce diversity across the NSW public sector and ensures that it is integrated into broader workforce planning processes.
In 2016, the department will continue to create a workplace that is fair and inclusive and to promote a workforce that reflects the diversity of students, parents/carers and the NSW community, as outlined in the Workforce Diversity Plan and Implementation Guide 2012–2017.
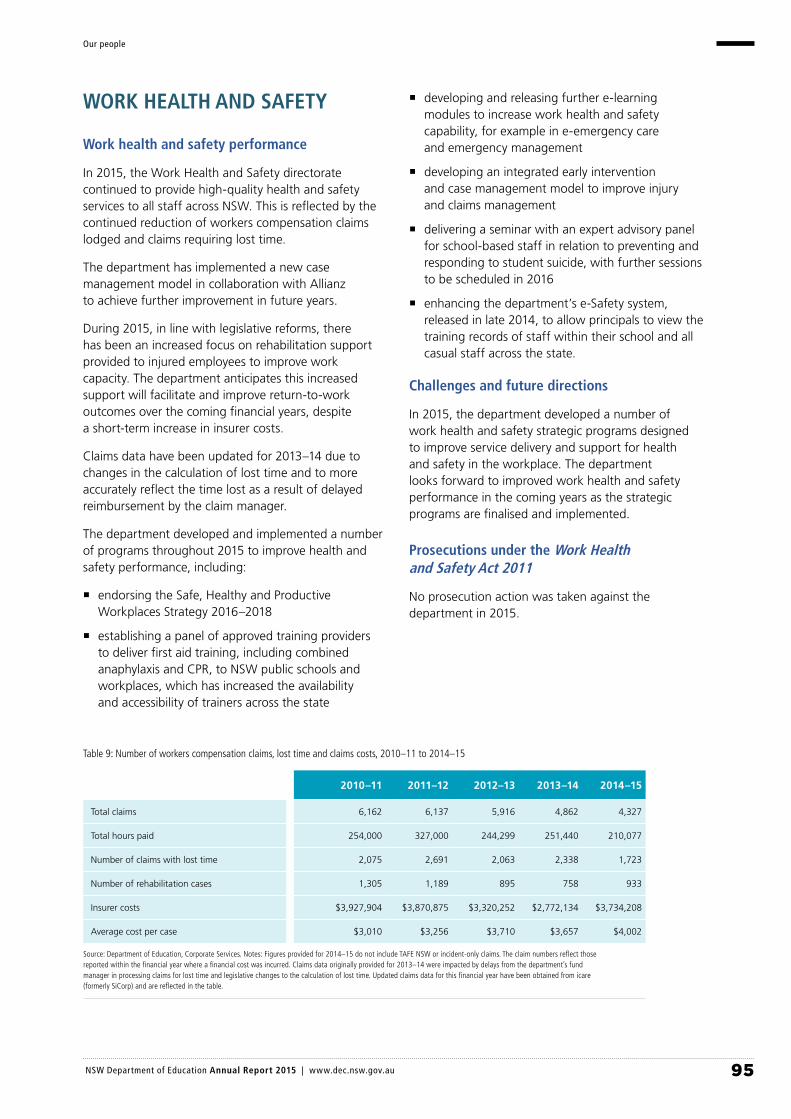
95 NSW Department of Education Annual Report 2015 | www.dec.nsw.gov.au
Our people
WORK HEALTH AND SAFETY
Work health and safety performance
In 2015, the Work Health and Safety directorate continued to provide high-quality health and safety services to all staff across NSW. This is reflected by the continued reduction of workers compensation claims lodged and claims requiring lost time.
The department has implemented a new case management model in collaboration with Allianz to achieve further improvement in future years.
During 2015, in line with legislative reforms, there has been an increased focus on rehabilitation support provided to injured employees to improve work capacity. The department anticipates this increased support will facilitate and improve return-to-work outcomes over the coming financial years, despite a short-term increase in insurer costs.
Claims data have been updated for 2013–14 due to changes in the calculation of lost time and to more accurately reflect the time lost as a result of delayed reimbursement by the claim manager.
The department developed and implemented a number of programs throughout 2015 to improve health and safety performance, including:
¡ endorsing the Safe, Healthy and Productive Workplaces Strategy 2016–2018
¡ establishing a panel of approved training providers to deliver first aid training, including combined anaphylaxis and CPR, to NSW public schools and workplaces, which has increased the availability and accessibility of trainers across the state
¡ developing and releasing further e-learning modules to increase work health and safety capability, for example in e-emergency care and emergency management
¡ developing an integrated early intervention and case management model to improve injury and claims management
¡ delivering a seminar with an expert advisory panel for school-based staff in relation to preventing and responding to student suicide, with further sessions to be scheduled in 2016
¡ enhancing the department’s e-Safety system, released in late 2014, to allow principals to view the training records of staff within their school and all casual staff across the state.
Challenges and future directions
In 2015, the department developed a number of work health and safety strategic programs designed to improve service delivery and support for health and safety in the workplace. The department looks forward to improved work health and safety performance in the coming years as the strategic programs are finalised and implemented.
Prosecutions under the Work Health and Safety Act 2011
No prosecution action was taken against the department in 2015.
Table 9: Number of workers compensation claims, lost time and claims costs, 2010–11 to 2014–15
2010–11 2011–12 2012–13 2013–14 2014–15
Total claims 6,162 6,137 5,916 4,862 4,327
Total hours paid 254,000 327,000 244,299 251,440 210,077
Number of claims with lost time 2,075 2,691 2,063 2,338 1,723
Number of rehabilitation cases 1,305 1,189 895 758 933
Insurer costs $3,927,904 $3,870,875 $3,320,252 $2,772,134 $3,734,208
Average cost per case $3,010 $3,256 $3,710 $3,657 $4,002
Source: Department of Education, Corporate Services. Notes: Figures provided for 2014–15 do not include TAFE NSW or incident-only claims. The claim numbers reflect those reported within the financial year where a financial cost was incurred. Claims data originally provided for 2013–14 were impacted by delays from the department’s fund manager in processing claims for lost time and legislative changes to the calculation of lost time. Updated claims data for this financial year have been obtained from icare (formerly SiCorp) and are reflected in the table.
96 NSW Department of Education Annual Report 2015 | www.dec.nsw.gov.au
Public accountability
PUBLIC ACCOUNTABILITY
LEGISLATION AND LEGAL CHANGE
This section sets out the Acts administered by the Minister for Education, the Minister for Early Childhood Education and the Minister for Aboriginal Affairs as at 31 December 2015. It also sets out the Acts administered by the Minister for Education relating to vocational education and training and the Minister for Citizenship and Communities as at 30 June 2015. The Office of Communities (except Aboriginal Affairs) was transferred to the Department of Family and Communities, effective 1 July 2015. State Training Services was transferred to the Department of Industry, Skills and Regional Development, effective 1 July 2015.
Subordinate legislation is not listed. All Acts, Regulations and other statutory instruments can be accessed via the NSW Government’s legislation website (legislation.nsw.gov.au).
Education
The Minister for Education administers the following Acts:
¡ Australian Catholic University Act 1990
¡ Board of Studies, Teaching and Educational Standards Act 2013
¡ Charles Sturt University Act 1989
¡ Education Act 1990
¡ Education (School Administrative and Support Staff) Act 1987
¡ Higher Education Act 2001
¡ Higher Education (Amalgamation) Act 1989
¡ Macquarie University Act 1989
¡ Moree and District War Memorial Educational Centre Act 1962
¡ Parents and Citizens Associations Incorporation Act 1976
¡ Saint Andrew’s College Act 1998
¡ Sancta Sophia College Incorporation Act 1929
¡ Southern Cross University Act 1993
¡ Teacher Accreditation Act 2004
¡ Teaching Service Act 1980
¡ Universities Governing Bodies Act 2011
¡ University of New England Act 1993
¡ University of New South Wales Act 1989
¡ University of Newcastle Act 1989
¡ University of Sydney Act 1989
¡ University of Technology, Sydney, Act 1989
¡ University of Western Sydney Act 1997
¡ University of Wollongong Act 1989
¡ West Scholarships Act 1930
¡ Women’s College Act 1902.
The Apprenticeship and Traineeship Act 2001, the Skills Board Act 2013, the Technical and Further Education Act 1990, the Technical Education and Trust Funds Act 1967 and the Vocational Education and Training (Commonwealth Powers) Act 2010, which were formerly administered by the Minister for Education, were allocated to the Minister for Skills effective 1 July 2015.
The Children (Education and Care Services National Law Application) Act 2010, Children (Education and Care Services) National Law (NSW) and Children (Education and Care Services) Supplementary Provisions Act 2011, which were formerly administered by the Minister for Education, were allocated to the Minister for Early Childhood Education effective 1 July 2015.
No amendments were made to these Acts in the period 1 January 2015 to 30 June 2015.
The following Acts were amended during 2015:
¡ The Board of Studies, Teaching and Educational Standards Act 2013 was amended by the Teacher Accreditation Amendment Act 2014 to include references to early childhood centres.
¡ The Education Act 1990 was amended by the Regulatory Reform and Other Legislative Repeals Act 2015 to include provisions consequent on the repeal of the West Scholarships Act 1930.
¡ The Higher Education Act 2001, the Universities Governing Bodies Act 2011 and the University of Technology Sydney Act 1989 were amended by the Statute Law (Miscellaneous Provisions) Act 2015 to reflect a minor change in the name of the University of Technology Sydney.

97 NSW Department of Education Annual Report 2015 | www.dec.nsw.gov.au
Public accountability
¡ The Statute Law (Miscellaneous Provisions) Act (No 2) 2014 amended:
– the Parents and Citizens Associations Incorporation Act 1976 to include references to affiliate parents and citizens associations
– the Teaching Service Act 1980 to insert a missing word into subsections 93T(2)(a) and (c).
¡ The Southern Cross University Act 1993 was amended by the Universities Governing Bodies (Southern Cross University) Order 2015 to displace the replaceable provisions of the Act with the standard governing provisions set out in Schedule 1 of the Universities Governing Bodies Act 2001.
¡ The Teacher Accreditation Act 2004 was amended by the Teacher Accreditation Amendment Act 2014 to update its definitions, require all early childhood teachers to become accredited and make a range of consequential changes.
¡ The University of Western Sydney Act 1997 was amended by the Statute Law (Miscellaneous Provisions) Act 2015 to remove the requirement for an appointed or elected member of the Board of Trustees of the University of Western Sydney to reside in NSW or the ACT.
Early childhood education
The Minister for Early Childhood Education administers the following Acts:
¡ Children (Education and Care Services National Law Application) Act 2010
¡ Children (Education and Care Services) National Law (NSW)
¡ Children (Education and Care Services) Supplementary Provisions Act 2011.
Citizenship and communities
The Minister for Citizenship and Communities administered the Multicultural NSW Act 2000 (jointly with the Premier) for the Department of Education and Communities as at 30 June 2015. From 1 July 2015, this Act was jointly administered by the Premier and Minister for Multiculturalism.
The Commission for Children and Young People Act 1998 and the Youth Advisory Council Act 1989 were repealed by the Advocate for Children and Young People Act 2014, which commenced in 2015.
Aboriginal affairs
The Minister for Aboriginal Affairs administers the Aboriginal Land Rights Act 1983. Minor amendments were made to this Act by the Statute Law (Miscellaneous Provisions) Act 2015 to: require a resolution approving a Local Aboriginal Land Council’s community land and business plan to be passed by not less than 80 per cent of the voting members of the council present at the meeting; remove the requirement for a resolution for the transfer or disposal of an asset or termination of certain arrangements for the transfer or disposal of an asset by the NSW Aboriginal Land Council to be approved by a resolution of not less than 80 per cent of the members of the council; and make it clear the functions of the Registrar appointed under the principal Act include keeping and maintaining a register of Aboriginal Land Agreements.
Judicial decisions
There were no judicial decisions involving the Department of Education during 2015 that had a significant new impact on its operations.
98 NSW Department of Education Annual Report 2015 | www.dec.nsw.gov.au
Public accountability
DISABILITY INCLUSION ACTION PLAN
The department is strongly committed to supporting and improving services for students, staff and parents with disability in accordance with its legislative obligations.
The department’s Disability Action Plan 2011–2015 was developed in accordance with NSW Ageing, Disability and Home Care’s Guidelines for Disability Action Planning by NSW government agencies. The department developed a draft plan in accordance with the NSW Disability Inclusion Act 2014 and related guidelines issued by the Department of Family and Community Services. The draft plan will be published in early 2016.
Identifying and removing barriers to services for people with disability
The Every Student, Every School initiative has continued to strengthen support for students whose learning is affected by disability. In 2015, the department expanded the range of specialist professional learning courses with a new course to support personalised learning in schools. In total, more than 3,575 staff members completed more than 71,500 hours of registered training across seven specialist courses. In addition, teachers profiled the learning needs and strengths of 5,416 students, using the new Personalised Learning and Support Signposting Tool released to all NSW public schools at the beginning of 2015.
The number of staff undertaking training on the Disability Discrimination Act 1992 and Disability Standards for Education 2005 continues to increase. During 2015, 12,141 staff completed accredited training, with more than 65,000 staff members completing training since 2013.
All schools took part in the national disability data collection for the first time in 2015, validating the provision of personalised learning and support for students with disability and further strengthening teachers’ understanding of their obligations under the disability standards.
The Child Wellbeing unit continued to support mandatory reporters within the department to be aware of their obligations under the Disability Discrimination Act 1992 and the disability standards.
Professional learning and resources were provided to principals to ensure school planning processes meet the needs of all students, including students with disability.
As part of the needs-based Resource Allocation Model, all regular schools receive an equity loading to support students requiring low levels of adjustment for disability. This allocation is in addition to targeted funding for individual students requiring moderate to high levels of adjustment and specialist support classes. To support this, the department promoted 26 case studies highlighting the use of equity loading to meet the needs of students with disability.
In 2015, the Preschool Disability Support Program, managed by Northcott Society, supported 530 NSW preschools to ensure the meaningful participation of 3,000 children with disability and provided a universal disability loading to all NSW preschools to support the inclusion of children with disability.
Through the Intervention Support Program, the department provided funding for more than 4,000 children with disability attending 74 specialist early childhood intervention services and 95 child care centres across NSW. This funding supports the participation of children with disability in early childhood settings and transition to school.
More than 200 students with disability participated in the 2015 Schools Spectacular. A performance in Australian sign language involved a choir of more than 2,000 students and approximately 30 students from rural and remote areas.
99 NSW Department of Education Annual Report 2015 | www.dec.nsw.gov.au
Public accountability
Providing information and services in a range of formats that are accessible to people with disability
In 2015, the department’s Braille and Large Print Service supported more than 500 NSW public school students who are blind or have low vision. It provided a Braille format of textbooks, National Assessment Program: Literacy and Numeracy (NAPLAN), the Higher School Certificate and the Best Start Kindergarten Assessment as well as large print resources.
New functionalities have been introduced to increase accessibility for students participating in the online Validation of Assessment for Learning and Individual Development science tests for years 6, 8 and 10.
Information about the enrolment of, and services for, school students with disability has been translated into 35 community languages.
A range of accessibility training strategies and professional learning resources has been developed and made available to staff across the department to meet the new World Wide Web Consortium’s (W3C) Web Content Accessibility Guidelines, which became operational in 2015. Ongoing training will ensure resources published on departmental web pages are accessible to people with disability.
To create a community of practice around accessible content, the department has consulted with other public sector agencies, sharing and benchmarking best practice. A design team supported schools and advised the department on alternative formats and content types to better meet accessibility standards.
The establishment of an accessibility group on the department’s internal microblogging platform, Yammer, has served as a forum for staff seeking solutions and sharing information about the creation of accessible content.
Revision of the design and structure of the department’s branding and templates will further assist schools and corporate units in developing compliant publications.
Making government buildings and facilities physically accessible to people with disability
The department’s Access Review Tool is used to identify and prioritise projects in schools in order to meet the access needs of students and staff. Asset management units work with school principals, parents and school learning and support teams to ensure works are delivered in line with agreed support plans.
In 2015, the department undertook more than 300 integration assets projects to enable access to school facilities for students with disability. These include installing lifts, access ramps, accessible toilets, high-visibility markings and bollards.
The School Facilities Standards are compliant with Australian Standard 1428: Design for access and mobility. All room plans comply with the Building Code of Australia, which includes the Disability (Access to Premises – Buildings) Standards 2010.
Assisting people with disability to participate in the department’s public consultations and to apply for and participate on advisory boards and committees
The department meets regularly with an extensive range of disability representative organisations, including parent and carer groups, to discuss issues related to the education of students with disability.
In 2015, a Disability Employee Network was established, providing a forum for consultation and feedback on organisational strategies and policies that may affect employees with disability. The network currently has 120 members.
Increasing employment participation of people with disability in the department
The department’s Workforce Diversity Plan 2012–2017 outlines its commitment to inclusive work practices.
It is a member of the Australian Network on Disability (AND) and a member of the AND Sydney Roundtable. In 2015, the AND delivered a workshop on running a successful disability employee network and on disability inclusion action planning.
The department continued to be a major sponsor of the NSW Don’t DIS my ABILITY campaign, developing a short video about employees with disability across the department and hosting an International Day of People with Disability event.

100 NSW Department of Education Annual Report 2015 | www.dec.nsw.gov.au
Public accountability
Using government decision-making, programs and operations to influence other agencies and sectors to improve community participation and quality of life for people with disability
The National Disability Insurance Scheme is a significant national reform to the way services are accessed by people with disability. The department participates in transition planning through a range of local and state-wide forums. Internally, it has established a Project Control Group to oversee implementation of its transition activities.
Providing quality specialist and adapted services where mainstream services are not responsive or adequate to meet the needs of people with disability
In 2015, more than 20,000 students with confirmed disability were enrolled in specialist support classes in both regular schools and schools for specific purposes. A further 7,900 students with confirmed disability were supported in regular classes through the Integration Funding Support Program. Itinerant teachers supported more than 2,200 students with hearing or vision impairment in special schools.
The Child Wellbeing unit provided advice to NSW public schools about internal and external services for students with disability experiencing safety, welfare or wellbeing concerns.
The Assisted School Travel Program provided individualised transport services for 10,500 students with disability from home to school each school day during 2015.
CARER’S CHARTER
The department’s action plan to implement the NSW Carers (Recognition) Act 2010 also reflects the principles of the NSW Carers Charter in business activities. There is a dedicated page on the department’s intranet, providing information, online resources and useful links for staff who are carers or who work with people who have carer responsibilities.
The Young Carers fact sheet continues to be posted on the Public Schools NSW website. The fact sheet, developed collaboratively with Carers NSW, provides information and links to support services for school communities. The Being a Carer, Being a Student and Being a Kid resources, which were launched in 2011, are posted on the department’s intranet. They provide information for staff in schools about supporting students who are young carers.
The department is represented on the NSW Carers Strategy project management group and has established partnerships with NSW Family and Community Services, NSW Railcorp, Carers NSW and other organisations to network and consult on policy and program development.
The department provides a number of flexible working options that staff with carer responsibilities are able to access, including part-time work, job sharing, leave without pay and varying flexible hour arrangements. These were accessed by 58,480 staff in 2015, with an additional 47,431 taking short-term absences for family and community responsibilities. Staff with carer responsibilities are also able to access the Employee Assistance Program, an independent, confidential and free professional counselling service to support the health and wellbeing of employees.
The department continues to consider options to improve the collection of data on employees who are carers and ensure information is available for monitoring workplace initiatives and public reporting.

101 NSW Department of Education Annual Report 2015 | www.dec.nsw.gov.au
Public accountability
MULTICULTURAL POLICIES AND SERVICES PROGRAM
The department’s Multicultural Plan 2012–2015 outlines its commitment to meeting the education and training needs of a culturally and linguistically diverse NSW. The plan is implemented across the department.
In NSW public schools, the Multicultural Education Policy provides the framework for activity outlined in the multicultural plan. Schools include multicultural education strategies in their individual school plans and report on their achievements in annual school reports.
Detailed information on the progress of the plan is provided every two years in the Multicultural Policies and Services Program: Implementation Report, the most recent one for 2013–14. Highlights of the department’s activities in 2015 are included below.
Quality teaching and leadership
The department’s objective is to ensure that teachers and leaders have the knowledge and skills to deliver high-quality teaching programs and services that meet the needs of students and clients from culturally diverse backgrounds. During 2015, the department undertook the following activities:
¡ English as an additional language or dialect (EALD) teachers assisted students to develop proficiency in English in schools across the state.
¡ Staff in intensive English centres and the Intensive English High School provided support to newly arrived secondary students. Specialist teachers provided intensive English and transition support, counsellors provided specialist counselling and school learning support officers provided first language support.
¡ Trained school-based anti-racism contact officers (ARCOs) promoted anti-racism education and assisted with complaints about racism.
¡ School-based community liaison officers supported the engagement of culturally diverse communities in school activities and practices.
¡ Bilingual employees provided assistance in a range of community languages to school communities.
¡ Teachers and leaders participated in professional learning courses to help them cater for the needs of students in culturally diverse classrooms.
¡ Experienced EALD teachers led professional learning and networks to increase the capacity of teachers in meeting the needs of English language learners in their classrooms.
¡ Teachers and school leaders participated in professional learning on Aboriginal English and standard Australian English to improve learning outcomes for Aboriginal students who speak Aboriginal English as their home dialect.
¡ Bilingual and community language teachers undertook the Community Languages Fluency Test in 15 languages for approval to teach a community language.
¡ Online ARCO training was delivered to more than 600 teachers by ARCO tutors, who provided ongoing professional support at the local level.
¡ Teachers, support staff and school counsellors were trained in using the Promoting Positive Behaviour and Learning – Assisting Refugee Students at School program.
¡ EALD teacher mentors supported teachers in non-metropolitan schools with significant numbers of EALD, newly arrived and refugee students.
¡ Curriculum advisers supported teacher professional networks and the sharing of resources and expertise across communities of schools.
¡ Professional learning support materials were published on a range of departmental websites to assist in the delivery of multicultural, Aboriginal and languages education.

102 NSW Department of Education Annual Report 2015 | www.dec.nsw.gov.au
Public accountability
High expectations, closing the gaps
Our objective under the Multicultural Plan 2012–2015 is that high expectations for all and targeted programs serve to close educational gaps so that students from all backgrounds and communities can achieve their potential and participate fully in society. During 2015, the department undertook the following activities:
¡ Approximately 4,800 newly arrived students received intensive English support through the New Arrivals Program, intensive English centres and the Intensive English High School.
¡ Specialist teaching and targeted programs provided support for refugee students in primary and secondary schools, including homework and tutorial support, mentoring, career and transition support, and work-readiness programs.
¡ The Galuwa sponsorship program provided 40 scholarships to Aboriginal students to help them complete secondary schooling and plan vocational pathways.
¡ The Nanga Mai Awards celebrated the educational achievements of Aboriginal students and recognised strategies promoting respect and understanding between Aboriginal and non-Aboriginal communities.
¡ Approximately 3,500 students in years 7 to 12 studied community languages at the Saturday School of Community Languages.
¡ Approximately 43,000 students in primary schools across the state studied community languages through the Community Languages Program K–6.
¡ Community languages were taught out of school hours in more than 450 locations across the state through the NSW Community Languages Schools Program.
¡ The Beginning School Well program for refugee families and young children was implemented across participating schools in NSW to support the transition of refugee children and their families into the school community.
¡ Almost 2,000 students participated in the Multicultural Perspectives Public Speaking Competition culminating in state finals for two divisions: years 3 and 4, and years 5 and 6.
¡ Students from language backgrounds other than English in years 8 to 11 participated in the Multicultural Playwright Program, building self-esteem and developing skills in social interaction, literacy and drama.
¡ Students in schools across the state recognised and celebrated national and international events to foster and enhance intercultural understanding and community harmony, including Reconciliation Week, NAIDOC celebrations, Harmony Day and Refugee Week.
¡ Resources to increase knowledge of Australia’s cultural diversity were published on the department’s websites including Roads to Refuge and Racism. No way.
¡ The Calendar for Cultural Diversity and accompanying teachers’ handbook assisted teachers to develop inclusive teaching and learning activities.
¡ Departmental documents for parents and community members were translated in up to 35 different languages and published on the NSW Public Schools website.
¡ Onsite and telephone interpreters were engaged to assist schools communicate with parents or carers who do not speak English well, are deaf, or have a hearing or speech impairment.
New and better ways of doing business
Our objective under the Multicultural Plan 2012–2015 is that innovative educational delivery based on evidence and in partnership with families, communities and business meets the changing needs of a culturally and linguistically diverse NSW. During 2015, the department undertook the following activities:
¡ The equity loading for English language proficiency distributed staffing and flexible funding resources to schools according to student need through the Resource Allocation Model (RAM) as part of the Local Schools, Local Decisions reform. In 2015, EALD students in 1,250 schools received support.
¡ The School Planning Equity Funding Support Package assisted schools in the strategic use of these resources.
¡ The Resource Allocation Model targeted (individual student) funding component provided resources to schools to support refugee and newly arrived students.

103 NSW Department of Education Annual Report 2015 | www.dec.nsw.gov.au
Public accountability
¡ The EALD School Evaluation Framework was developed to support and guide schools in planning, monitoring and delivering EALD programs.
¡ The anti-racism education guidelines supported leaders in implementing the Anti-Racism Policy.
¡ The annual Census of Students from Language Backgrounds Other Than English, the EALD Annual Survey and two New Arrivals Program Surveys were conducted to inform planning and provisions for students.
¡ A quantitative analysis of the learning needs, outcomes and pathways of Aboriginal students who speak Standard Australian English as a dialect, as assessed by the EALD learning progression tool, was undertaken.
¡ The Australian Curriculum, Assessment and Reporting Authority’s EALD learning progression tool was trialled and validated for possible use as a measure of standard Australian English language proficiency for Aboriginal students.
¡ The Multicultural Education Advisory Group continued to provide advice on matters relating to multicultural education and training.
¡ The Aboriginal Education and Training Reference Group provided advice on key issues relating to Aboriginal education and training.
¡ The department continued to work closely with a range of community, educational and other government partners on multicultural issues, including the NSW Aboriginal Education Consultative Group, Multicultural NSW, Australian Human Rights Commission, and the Board of Studies, Teaching and Educational Standards.
COMPLAINTS AND FEEDBACK
The department’s website provides access to information for people wanting to make a complaint or provide feedback. It includes advice about how and where to make a complaint and answers questions about confidentiality, anonymity and what complainants can expect after lodging a complaint. The web page provides access to the Complaints Handling Policy Guidelines for more detailed information and a complaints and compliments form. Links to the NSW Ombudsman and the NSW Anti-Discrimination Board have also been included.
Early childhood education and care
The Early Childhood Education and Care directorate is the statutory regulatory authority for the early childhood education and care sector in NSW. The sector comprises approximately 5,400 approved services, including long day care, preschools, family day care, mobile and outside of school hours care services. The directorate receives complaints about services direct from parents as well as from the services themselves, which are obliged to notify the department of all complaints.
In 2015, there were very few complaints about services. The complaint rate was less than 0.002 per cent proportionate to the total number of children in attendance. There was one prosecution in 2015 originating from complaints.
All complaints are investigated to determine whether regulatory action is required. The majority of complaints and notifications relate to child illnesses or injuries. In the majority of cases, action includes a direction to the service to amend an aspect of its procedures, followed by further monitoring.
Information from complaints helps the department improve compliance strategies and informs the development of targeted campaigns, spot-checks on services or groups of services, communications with the sector and reporting. For example, the department conducted joint compliance audits with the Commonwealth Department of Education and Training (responsible for the administration of the Child Care Benefit program) into selected family day care services, focusing on child protection, home safety checks and records.
104 NSW Department of Education Annual Report 2015 | www.dec.nsw.gov.au
Public accountability
The data for complaints are collected through the National Quality Agenda IT System, designed and managed by the Australian Children’s Education and Care Quality Authority (ACECQA). In collaboration with other states and territories, the department continues to work with ACECQA to improve the way data are gathered and reported so that it can help to refine compliance strategies.
NSW public schools
Parents, students, employees, suppliers and members of the public are encouraged to contact schools in the first instance if they have a complaint. Most complaints can be resolved quickly and informally by the teacher or the principal. Complaints covered by a particular policy or legislation (such as work health and safety law or anti-discrimination policies) are directed to the relevant area of the department. The department has developed a fact sheet, Making a Complaint: A guide for parents, carers and students, for schools to download and display. This has been translated into 35 languages and all versions are available on the NSW Public Schools website.
State Training Services
Smart and Skilled was implemented on 1 January 2015. It introduced a new provider application and assessment process to support the government’s priorities for vocational education and training, ensuring high-quality training, greater competition and choice for consumers.
More than 300 providers were offered contracts in the 2014 Smart and Skilled provider application process. In 2015, approximately 60 applicants requested feedback on their application from the department. Individualised feedback reports were designed to help providers understand the evaluation process and the outcomes of their applications.
A formal independent complaints committee was established to address complaints regarding the provider application process. This was in addition to the department providing direct feedback and advice to providers. Up to 30 June 2015, 30 complaints were managed by this committee.
Approximately 70 complaints were received from the public regarding various issues such as student fees, delivery in regional locations and fee exemptions. In June, changes were made to Smart and Skilled that increased the flexibility for 259 training providers to deliver training across different geographical regions. Providers are now able to deliver apprenticeships and traineeships in all regions where they had demand. In addition, more than 50 new providers with a demonstrated regional track record or capacity to meet specific industry needs have been contracted for the delivery of apprenticeships and traineeships under Smart and Skilled.
Aboriginal Affairs
Aboriginal Affairs is bound by the department’s Complaints Handling Policy Guidelines. In addition, the Ombudsman Act 1974 was amended in 2014 providing for the creation of a Deputy Ombudsman (Aboriginal Programs). The Deputy Ombudsman monitors and assesses Aboriginal programs listed in the Regulations of the Ombudsman Act. OCHRE, the NSW Government’s community-focused plan for Aboriginal affairs, is the first program to be independently reviewed.
105 NSW Department of Education Annual Report 2015 | www.dec.nsw.gov.au
Public accountability
PUBLIC ACCESS TO GOVERNMENT INFORMATION
This section provides information about the operation of the Government Information (Public Access) Act 2009 (GIPA Act) from 1 January 2015 until 31 December 2015. It includes the Office of Communities and State Training Services for the period 1 January to 30 June 2015 only.
Accessing records held by the department
In compliance with the GIPA Act, the department makes information it holds available in several ways, including providing open-access information on the website.
The department’s information guide is updated regularly and published on the website at www.dec.nsw.gov.au/about-us/information-access. It describes the structure and functions of the department, how these functions affect the public, information that is freely available and how to access other available information not published on the website. Details about applying for access to information, with links to relevant legislation and related agencies, can also be found on the department’s website. For further assistance, contact:
Manager, Information Access UnitNSW Department of Education Level 7, 35 Bridge StreetSydney NSW 2000Telephone: (02) 9561 8100Facsimile: (02) 9561 1157Email: [email protected]
Proactive release of government information
The department reviews its program for the proactive release of information annually in accordance with section 7(3) of the Act. Information is made publicly available, except where there is an overriding public interest against disclosure or where doing so imposes unreasonable additional costs on the department.
During the reporting year, 91 items were proactively released, providing the public with the most current information on topics relating to the department’s operations. This comprised 64 new and updated policy documents and 27 other items.
The department’s disclosure log records formally released information that the department considers may be of interest to the general public. The log is published as part of the agency information guide and 26 new matters were added in 2015.
Access applications received and decided in 2015
Data about completed access applications received by the department in 2015 are provided in tables 10 to 17 on the pages that follow (GIPA Regulation 2009, Schedule 2, tables A to I) and comply with clause 7(d) and Schedule 2 of the GIPA Regulation 2009. Note that the tables include data about applications for Office of Communities and State Training Services for the period 1 January to 30 June 2015.
The department completed 294 access applications, including withdrawn applications but not including invalid applications. This included 31 matters received in the previous reporting period and completed in 2015. Twenty-seven matters were received but not completed in 2015 and these have been carried forward to 2016.
During 2015, the department refused 70 access applications, either wholly or partly, because the application was for access to information to which there is conclusive presumption of overriding public interest against disclosure. Access was refused in full three times and in part 67 times for this reason (see Table 13). More than one reason for refusal may apply to a particular application.
In addition, access was refused in full nine times and in part 287 times for one or more identified public interest reasons because there was an overriding balance of public interest against disclosing the information (see Table 14). Again, more than one reason for refusal may apply to an application.

106 NSW Department of Education Annual Report 2015 | www.dec.nsw.gov.au
Public accountability
Table 10: Number of access applications by type of applicant and outcome* (completed and discontinued valid applications), 2015
Table 11: Number of access applications by type of application and outcome, 2015
TABLE A (GIPA Regulation 2009, Schedule 2)
Access granted
in full
Access granted
in part
Access refused
in full
Information not held
Information already
available
Refuse to deal with
application
Refuse to confirm/ deny whether
information is held
Media 5 6 0 0 0 0 0
Members of Parliament 4 2 1 0 0 1 0
Private sector business 0 2 0 0 0 0 0
Not-for-profit organisations or community groups
3 1 1 1 0 0 0
Members of the public (application by legal representative)
25 80 1 13 0 0 0
Members of the public (other) 23 93 6 10 0 2 0
Total 60 184 9 24 0 3 0
Application withdrawn (excluding
invalid applications)
Invalid application withdrawn
Invalid never
validated
Transferred to other agency
Total
Media 2 0 0 0 13
Members of Parliament 0 1 0 2 11
Private sector business 0 0 0 0 2
Not-for-profit organisations or community groups
0 0 0 0 6
Members of the public (application by legal representative)
2 4 6 1 132
Members of the public (other) 6 2 7 1 150
Total 10 7 13 4 314
Notes: *Applications completed or discontinued, including 31 applications received in 2014 reporting year and completed or discontinued in 2015. More than one decision can be made in respect of a particular access application. If so, a recording must be made in relation to each such decision.
TABLE B (GIPA Regulation 2009, Schedule 2)
Access granted in
full
Access granted in
part
Access refused in
full
Information not held
Information already
available
Refuse to deal with
application
Refuse to confirm/ deny whether
information is held
Personal information applications* 41 159 4 21 0 0 0
Access applications (other than personal information applications)
19 24 5 3 0 3 0
Access applications that are partly personal information applications and partly other
0 1 0 0 0 0 0
Application withdrawn (excluding
invalid applications)
Invalid application withdrawn
Invalid never
validated
Transferred to other agency
Total
Personal information applications* 4 1 11 1 242
Access applications (other than personal information applications)
5 6 2 3 70
Access applications that are partly personal information applications and partly other
1 0 0 0 2
Notes: *A personal information application is an access application for personal information (as defined in clause 4 of Schedule 4 to the Act) about the applicant (the applicant being an individual). More than one decision can be made in respect of a particular access application. If so, a recording must be made in relation to each such decision.

107 NSW Department of Education Annual Report 2015 | www.dec.nsw.gov.au
Public accountability
Table 12: Invalid applications, 2015
Table 13: Conclusive presumption of overriding public interest against disclosure: matters listed in Schedule 1 of the Act, 2015
Table 14: Other public interest considerations against disclosure: matters listed in table to section 14 of the GIPA Act, 2015
TABLE C (GIPA Regulation 2009, Schedule 2)
Reason for invalidity Number of applications
Application does not comply with formal requirements (section 41 of the Act) 68
Application is for excluded information of the agency (section 43 of the Act) 0
Application contravenes restraint order (section 110 of the Act) 0
Total number of invalid applications received 68
Invalid applications received that subsequently became valid applications 48
Note: Invalid applications received in reporting year, including invalid applications carried forward from 2014.
TABLE D (GIPA Regulation 2009, Schedule 2)
Number of times consideration used
Overriding secrecy laws 0
Cabinet information 2
Executive council information 0
Contempt 5
Legal professional privilege 50
Excluded information 1
Documents affecting law enforcement and public safety 0
Transport safety 0
Adoption 0
Care and protection of children 12
Ministerial code of conduct 0
Aboriginal and environmental heritage 0
Note: More than one public interest consideration may apply in relation to a particular access application and, if so, each such consideration is to be recorded (but only once per application).
TABLE E (GIPA Regulation 2009, Schedule 2)
Number of occasions whenapplicant was not successful
Responsible and effective government 115
Law enforcement and security 4
Individual rights, judicial processes and natural justice 169
Business interests of agencies and other persons 8
Environment, culture, economy and general matters 0
Secrecy provisions 0
Exempt documents under interstate freedom of information legislation 0
Note: More than one public interest consideration may apply in relation to a particular access application and, if so, each such consideration is to be recorded (but only once per application).
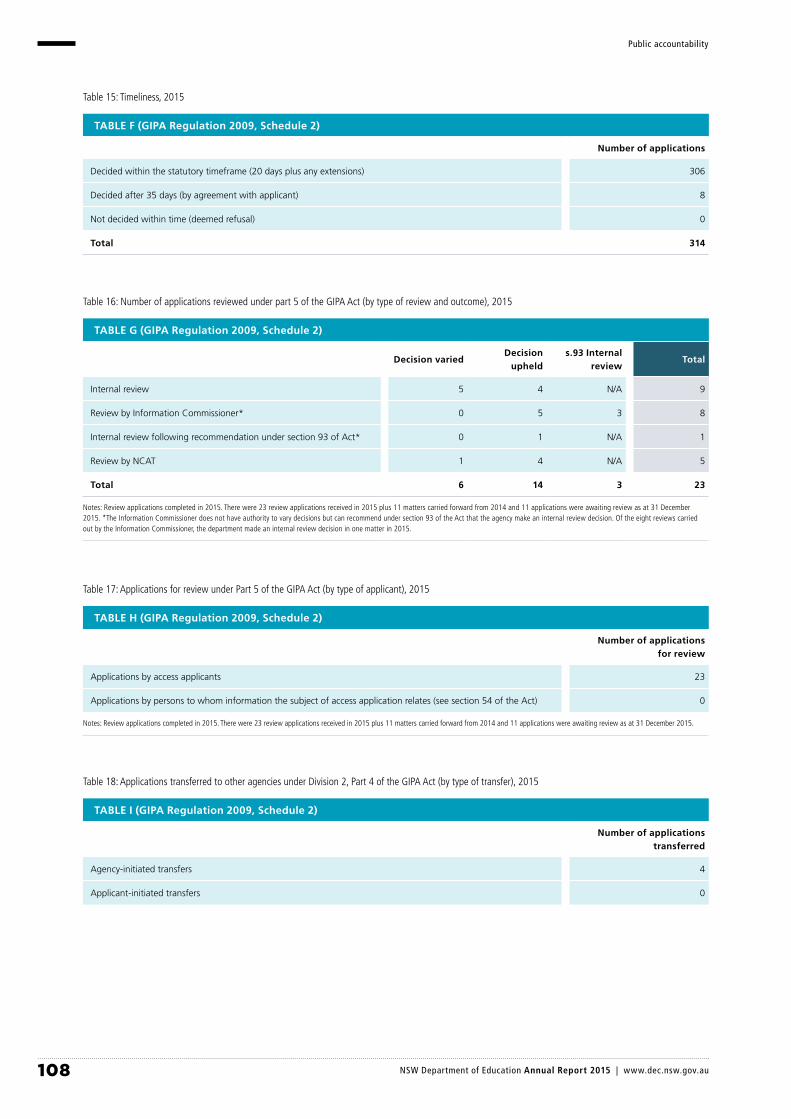
108 NSW Department of Education Annual Report 2015 | www.dec.nsw.gov.au
Public accountability
Table 15: Timeliness, 2015
Table 16: Number of applications reviewed under part 5 of the GIPA Act (by type of review and outcome), 2015
Table 17: Applications for review under Part 5 of the GIPA Act (by type of applicant), 2015
Table 18: Applications transferred to other agencies under Division 2, Part 4 of the GIPA Act (by type of transfer), 2015
TABLE H (GIPA Regulation 2009, Schedule 2)
Number of applications for review
Applications by access applicants 23
Applications by persons to whom information the subject of access application relates (see section 54 of the Act) 0
Notes: Review applications completed in 2015. There were 23 review applications received in 2015 plus 11 matters carried forward from 2014 and 11 applications were awaiting review as at 31 December 2015.
TABLE I (GIPA Regulation 2009, Schedule 2)
Number of applications transferred
Agency-initiated transfers 4
Applicant-initiated transfers 0
TABLE F (GIPA Regulation 2009, Schedule 2)
Number of applications
Decided within the statutory timeframe (20 days plus any extensions) 306
Decided after 35 days (by agreement with applicant) 8
Not decided within time (deemed refusal) 0
Total 314
TABLE G (GIPA Regulation 2009, Schedule 2)
Decision variedDecision
uphelds.93 Internal
review Total
Internal review 5 4 N/A 9
Review by Information Commissioner* 0 5 3 8
Internal review following recommendation under section 93 of Act* 0 1 N/A 1
Review by NCAT 1 4 N/A 5
Total 6 14 3 23
Notes: Review applications completed in 2015. There were 23 review applications received in 2015 plus 11 matters carried forward from 2014 and 11 applications were awaiting review as at 31 December 2015. *The Information Commissioner does not have authority to vary decisions but can recommend under section 93 of the Act that the agency make an internal review decision. Of the eight reviews carried out by the Information Commissioner, the department made an internal review decision in one matter in 2015.

109 NSW Department of Education Annual Report 2015 | www.dec.nsw.gov.au
Public accountability
PRIVACY AND PERSONAL INFORMATION PROTECTION
The department has reporting obligations under the Privacy and Personal Information Protection Act 1998 and the Health Records and Information Privacy Act 2002.
The department’s Privacy Management Plan and other resources explaining how the department meets its obligations under privacy legislation are available to the public on the department’s website. Staff can access information about their obligations and rights from the privacy intranet. Legal Services provides training and information sessions and conducts the telephone advice service.
For the period 1 January to 30 June 2015, there was no activity for the Office of Communities and State Training Services. The department’s activity is outlined below.
Applications for internal review
In 2015, the department received 18 applications for internal review. Of these, 15 applications were made by parents on their own behalf and on behalf of their children who attended NSW public schools. Seven of these were made by members of three families from the one school community and one parent lodged four applications on behalf of the family, including two children. There was also one application each from an employee, a former student and a student teacher.
During 2015, 13 internal reviews were completed. Five reviews found that the conduct did not contravene privacy legislation and one did not meet the requirements of a competent application.
A breach of privacy legislation was found to have occurred in respect of the conduct complained about by the three families in the one school community. The conduct involved publication of personal and health information in a teacher’s personal blog. The blog and additional information about the students and their families were subsequently printed and distributed within the community by unknown person/s. The review determined that publication of the blog in electronic and hard copy was conduct extraneous to any purpose of the department so was not a breach of the disclosure provisions of privacy legislation. However, the department was found to have breached privacy legislation by failing to take reasonable safeguards to protect information recorded on the school’s student welfare database from misuse. The department offered each applicant an apology and compensation. In addition, it was recommended that future review of social media
policies and the Code of Conduct consider the Privacy Commissioner’s suggestion that they include a clear prohibition on the inappropriate disclosure of personal information. A recommendation was also made that the matter be referred for consideration of possible disciplinary action.
Requests for access to and alteration of personal information
Three requests for access to personal information were received in 2015. Information was released in response to two. The third application was withdrawn and replaced with an application under the Government Information (Public Access) Act 2009. One request for alteration of information was received. The requested amendment was refused because the information was exempt under a clause of the department’s Privacy Code of Practice.
Applications for review by the NSW Civil and Administrative Tribunal
Three applications for external review were filed with the NSW Civil and Administrative Tribunal during the year. One was withdrawn and dismissed. The other two were recently filed by the one applicant and are in the initial stages of review.
The NSW Civil and Administrative Decisions Tribunal Appeal published its decisions in BDK v Department of Education and Communities [2015] NSWCATAP129 (3 July 2015). This was an appeal from the decision of the tribunal to summarily dismiss as vexatious, proceedings brought by a parent of a student at a NSW public school. The Appeal Panel held that the tribunal had the power to summarily dismiss vexatious proceedings under the Civil and Administrative Tribunal Act 2013. The Appeal Panel made an order for costs in favour of the department, noting that an appeal from a summary dismissal order effectively undermined the value of the original decision for the department.
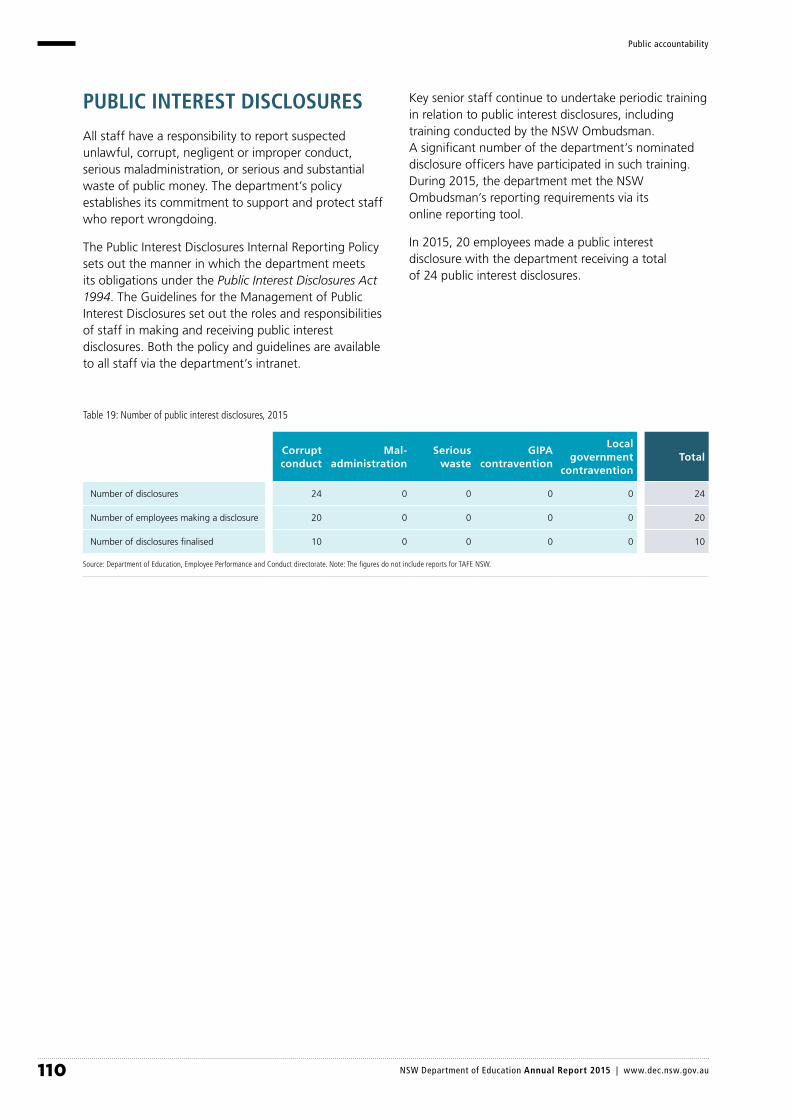
110 NSW Department of Education Annual Report 2015 | www.dec.nsw.gov.au
Public accountability
PUBLIC INTEREST DISCLOSURES
All staff have a responsibility to report suspected unlawful, corrupt, negligent or improper conduct, serious maladministration, or serious and substantial waste of public money. The department’s policy establishes its commitment to support and protect staff who report wrongdoing.
The Public Interest Disclosures Internal Reporting Policy sets out the manner in which the department meets its obligations under the Public Interest Disclosures Act 1994. The Guidelines for the Management of Public Interest Disclosures set out the roles and responsibilities of staff in making and receiving public interest disclosures. Both the policy and guidelines are available to all staff via the department’s intranet.
Key senior staff continue to undertake periodic training in relation to public interest disclosures, including training conducted by the NSW Ombudsman. A significant number of the department’s nominated disclosure officers have participated in such training. During 2015, the department met the NSW Ombudsman’s reporting requirements via its online reporting tool.
In 2015, 20 employees made a public interest disclosure with the department receiving a total of 24 public interest disclosures.
Table 19: Number of public interest disclosures, 2015
Corrupt conduct
Mal-administration
Serious waste
GIPA contravention
Local government
contraventionTotal
Number of disclosures 24 0 0 0 0 24
Number of employees making a disclosure 20 0 0 0 0 20
Number of disclosures finalised 10 0 0 0 0 10
Source: Department of Education, Employee Performance and Conduct directorate. Note: The figures do not include reports for TAFE NSW.
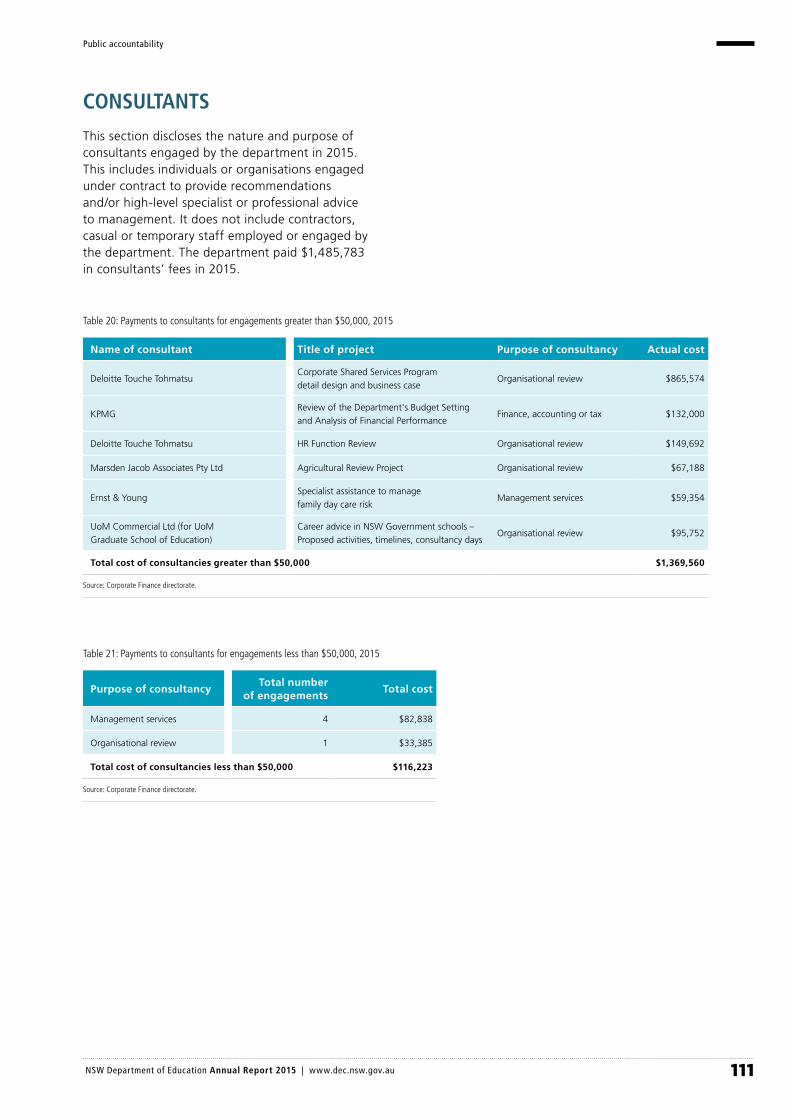
111 NSW Department of Education Annual Report 2015 | www.dec.nsw.gov.au
Public accountability
CONSULTANTS
This section discloses the nature and purpose of consultants engaged by the department in 2015. This includes individuals or organisations engaged under contract to provide recommendations and/or high-level specialist or professional advice to management. It does not include contractors, casual or temporary staff employed or engaged by the department. The department paid $1,485,783 in consultants’ fees in 2015.
Table 20: Payments to consultants for engagements greater than $50,000, 2015
Table 21: Payments to consultants for engagements less than $50,000, 2015
Name of consultant Title of project Purpose of consultancy Actual cost
Deloitte Touche TohmatsuCorporate Shared Services Program detail design and business case
Organisational review $865,574
KPMGReview of the Department's Budget Setting and Analysis of Financial Performance
Finance, accounting or tax $132,000
Deloitte Touche Tohmatsu HR Function Review Organisational review $149,692
Marsden Jacob Associates Pty Ltd Agricultural Review Project Organisational review $67,188
Ernst & YoungSpecialist assistance to manage family day care risk
Management services $59,354
UoM Commercial Ltd (for UoM Graduate School of Education)
Career advice in NSW Government schools – Proposed activities, timelines, consultancy days
Organisational review $95,752
Total cost of consultancies greater than $50,000 $1,369,560
Source: Corporate Finance directorate.
Purpose of consultancyTotal number
of engagementsTotal cost
Management services 4 $82,838
Organisational review 1 $33,385
Total cost of consultancies less than $50,000 $116,223
Source: Corporate Finance directorate.

112 NSW Department of Education Annual Report 2015 | www.dec.nsw.gov.au
Public accountability
OVERSEAS TRAVEL
This section presents the number of overseas visits undertaken by officers and employees of the department and the main purpose of these visits.
Table 22: Number of overseas visits undertaken by officers and employees, 2015
Purpose of visit Description Number of visits
Number of commercial
or externally funded visits
Number of self- or
community- funded visits
Number of visits funded
by the department
Total number of
staff
Conferences and professional development
Staff members who travel overseas to attend and/or present at conferences or participate in study tours
10 (1P) 23 12 45
Educational exportsStaff members who travel overseas to manage partnerships, contracts, programs, quality assurance or assessment of students
9 (5D) (1P) 0 3 12
Exchange programsStaff members who travel overseas on a professional or teacher exchange program
0 23 1 24
International student recruitment
Staff members who travel overseas to recruit inbound full-fee-paying international students to the NSW school sector
2 (1D) 0 20 22
Market development and client engagement
Staff members who travel overseas for international marketing purposes, development of business relationships, engagement with clients and contract management
0 0 0 0
Professional scholarship programs
Staff members awarded scholarships to further their professional skills and knowledge
16 (14D) 1 0 17
Student excursionsStaff members who accompany students on excursions overseas to increase cultural understanding or attend commemoration ceremonies
110 (4D) (10P) 334 0 444
Source: People and Services directorate. Notes: Figures only include Office of Communities and State Training Services for the period January 1 to June 30 2015. Figures within the brackets indicate the number of trips where a contribution to the cost was made by the department (D) or a private source (P). Due to the separation of Office of Communities and State Training Services, data may not be comparable with previous years.
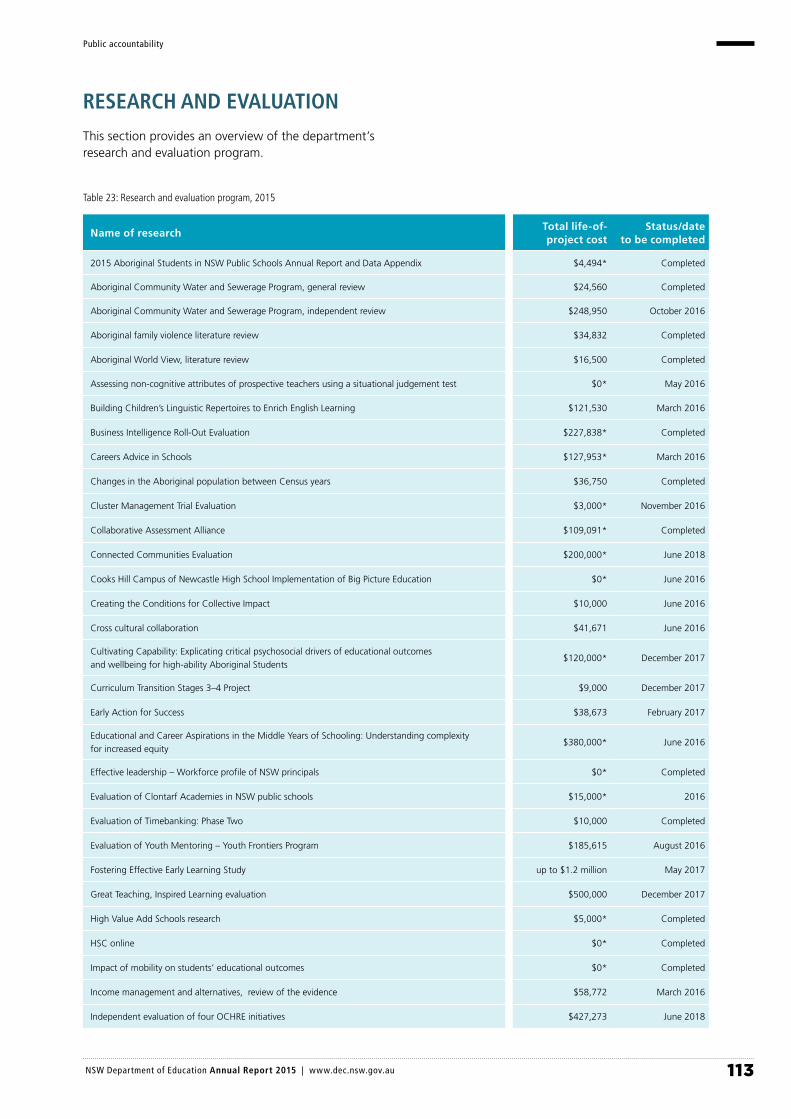
113 NSW Department of Education Annual Report 2015 | www.dec.nsw.gov.au
Public accountability
RESEARCH AND EVALUATION
This section provides an overview of the department’s research and evaluation program.
Table 23: Research and evaluation program, 2015
Name of researchTotal life-of-project cost
Status/date to be completed
2015 Aboriginal Students in NSW Public Schools Annual Report and Data Appendix $4,494* Completed
Aboriginal Community Water and Sewerage Program, general review $24,560 Completed
Aboriginal Community Water and Sewerage Program, independent review $248,950 October 2016
Aboriginal family violence literature review $34,832 Completed
Aboriginal World View, literature review $16,500 Completed
Assessing non-cognitive attributes of prospective teachers using a situational judgement test $0* May 2016
Building Children’s Linguistic Repertoires to Enrich English Learning $121,530 March 2016
Business Intelligence Roll-Out Evaluation $227,838* Completed
Careers Advice in Schools $127,953* March 2016
Changes in the Aboriginal population between Census years $36,750 Completed
Cluster Management Trial Evaluation $3,000* November 2016
Collaborative Assessment Alliance $109,091* Completed
Connected Communities Evaluation $200,000* June 2018
Cooks Hill Campus of Newcastle High School Implementation of Big Picture Education $0* June 2016
Creating the Conditions for Collective Impact $10,000 June 2016
Cross cultural collaboration $41,671 June 2016
Cultivating Capability: Explicating critical psychosocial drivers of educational outcomes and wellbeing for high-ability Aboriginal Students
$120,000* December 2017
Curriculum Transition Stages 3–4 Project $9,000 December 2017
Early Action for Success $38,673 February 2017
Educational and Career Aspirations in the Middle Years of Schooling: Understanding complexity for increased equity
$380,000* June 2016
Effective leadership – Workforce profile of NSW principals $0* Completed
Evaluation of Clontarf Academies in NSW public schools $15,000* 2016
Evaluation of Timebanking: Phase Two $10,000 Completed
Evaluation of Youth Mentoring – Youth Frontiers Program $185,615 August 2016
Fostering Effective Early Learning Study up to $1.2 million May 2017
Great Teaching, Inspired Learning evaluation $500,000 December 2017
High Value Add Schools research $5,000* Completed
HSC online $0* Completed
Impact of mobility on students’ educational outcomes $0* Completed
Income management and alternatives, review of the evidence $58,772 March 2016
Independent evaluation of four OCHRE initiatives $427,273 June 2018

114 NSW Department of Education Annual Report 2015 | www.dec.nsw.gov.au
Public accountability
Innovative Learning Environments and Teacher Change $0* December 2019
Integrated Science, Technology, Engineering and Mathematics (STEM) Stage 4 Project $12,500 August 2016
Kids in Communities ARC Linkage project $16,500* December 2016
Literacy and Numeracy Action Plan evaluation $820,652* February 2017
Literacy and Numeracy Progression in the Early Years of School: Identifying what works $0* Completed
Material Deprivation and Social Exclusion among young Australians – A child focus approach $0* December 2017
Monitoring, Evaluation, Reporting and Improvement framework for OCHRE $163,800 Completed
Murdi Paaki Regional Assembly Accord Negotiation Process Evaluation $31,818 June 2016
NSW Child Development Study $0* December 2016
NSW Child Wellbeing Units – Contextual analyses, program logics and outcome measures (Australian Centre for Child Protection)
$121,145 January 2016
NSW Long Day Care survey $102,023* 2016
Policy options and challenges for Aboriginal affairs, literature and data review $74,762 Completed
Propensity to identify as Aboriginal in administrative data collections $785,585 Completed
Quality Interactions Study $99,700 Ongoing
Reading Recovery evaluation $0* Completed
Re-assessing assessment $0* Completed
Research identifying the key drivers of improved school performance in schools $0* Completed
Research on student engagement, wellbeing and effective teaching strategies (Tell Them From Me student survey, Partners in Learning parent survey, Focus on Learning teacher surveys)
$421,678* June 2017
Researching with Aboriginal community, research study $54,546 June 2016
Riverina Access Program $13,000 July 2016
Rural and Remote Education evaluation $500,000 December 2017
School assets and student outcomes – literature review $0* Completed
School Staff Health and Wellbeing Grant Pilot Program $0* Completed
Smarter Schools National Partnership – Improving Teacher Quality state evaluation $693,400 Completed
Smarter Schools National Partnership – Low SES state evaluation – Staffing, Management and Accountability
$498,300 Completed
Smarter Schools National Partnerships – Low SES NP Evaluation School External Partnerships $643,225 July 2017
Special Religious Education/Special Education in Ethics $300,000 Completed
State of Education in NSW – 2016 report $0* August 2016
State of the NSW teaching profession 2015 $0* Completed
Standing up to Racism and Racial Bullying Among Australian School Students $120,000* December 2017
Student engagement and wellbeing in NSW, 2015 $0* Completed
Students Participation in Schools $75,000* December 2017

115 NSW Department of Education Annual Report 2015 | www.dec.nsw.gov.au
Public accountability
Student Wellbeing – literature review $0* Completed
Survey of Secondary Students' Post-School Destinations, 2014–2016 $1,500,000* February 2017
The effectiveness of tutoring interventions in mathematics for disadvantaged students $0* Completed
The Role of Education in Intergenerational Economic Mobility in Australia $77,330 Completed
Transition to School Statement Initiative Evaluation $126,180* Completed
Trial of English as an additional language or dialect (EALD) for Aboriginal students $0* June 2016
User Experience Testing for Timebanking Software (interim report) $7,500 Completed
What works best: Evidence-based practices to help improve NSW student performance $0* Completed
Workforce profile of the NSW teaching profession $0* February 2016
Notes: Only includes the Office of Communities and State Training Services research and evaluation program up to June 2015. *Indicates there is also an in-kind contribution.
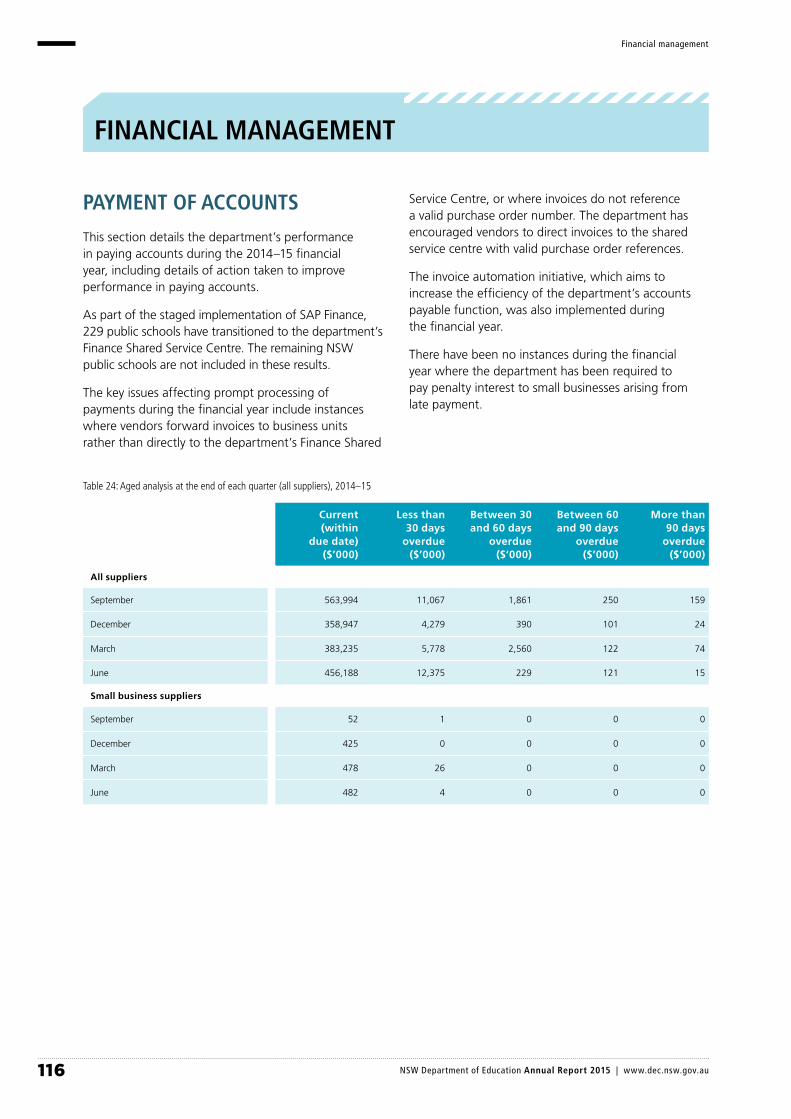
116 NSW Department of Education Annual Report 2015 | www.dec.nsw.gov.au
Financial management
FINANCIAL MANAGEMENT
PAYMENT OF ACCOUNTS
This section details the department’s performance in paying accounts during the 2014–15 financial year, including details of action taken to improve performance in paying accounts.
As part of the staged implementation of SAP Finance, 229 public schools have transitioned to the department’s Finance Shared Service Centre. The remaining NSW public schools are not included in these results.
The key issues affecting prompt processing of payments during the financial year include instances where vendors forward invoices to business units rather than directly to the department’s Finance Shared
Service Centre, or where invoices do not reference a valid purchase order number. The department has encouraged vendors to direct invoices to the shared service centre with valid purchase order references.
The invoice automation initiative, which aims to increase the efficiency of the department’s accounts payable function, was also implemented during the financial year.
There have been no instances during the financial year where the department has been required to pay penalty interest to small businesses arising from late payment.
Table 24: Aged analysis at the end of each quarter (all suppliers), 2014–15
Current (within
due date) ($’000)
Less than 30 days
overdue ($’000)
Between 30 and 60 days
overdue ($’000)
Between 60 and 90 days
overdue ($’000)
More than 90 days
overdue ($’000)
All suppliers
September 563,994 11,067 1,861 250 159
December 358,947 4,279 390 101 24
March 383,235 5,778 2,560 122 74
June 456,188 12,375 229 121 15
Small business suppliers
September 52 1 0 0 0
December 425 0 0 0 0
March 478 26 0 0 0
June 482 4 0 0 0
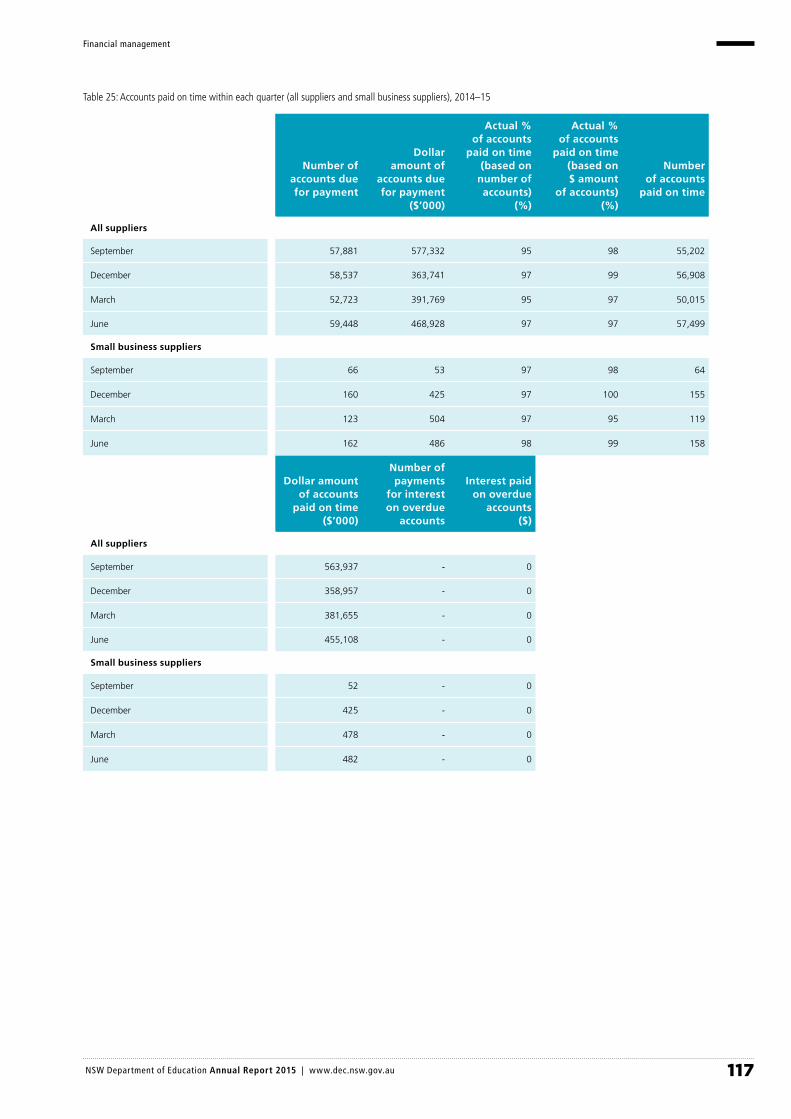
117 NSW Department of Education Annual Report 2015 | www.dec.nsw.gov.au
Financial management
Table 25: Accounts paid on time within each quarter (all suppliers and small business suppliers), 2014–15
Number of accounts due for payment
Dollar amount of
accounts due for payment
($’000)
Actual % of accounts
paid on time (based on
number of accounts)
(%)
Actual % of accounts
paid on time (based on $ amount
of accounts) (%)
Number of accounts
paid on time
All suppliers
September 57,881 577,332 95 98 55,202
December 58,537 363,741 97 99 56,908
March 52,723 391,769 95 97 50,015
June 59,448 468,928 97 97 57,499
Small business suppliers
September 66 53 97 98 64
December 160 425 97 100 155
March 123 504 97 95 119
June 162 486 98 99 158
Dollar amount of accounts
paid on time ($’000)
Number of payments
for interest on overdue
accounts
Interest paid on overdue
accounts ($)
All suppliers
September 563,937 - 0
December 358,957 - 0
March 381,655 - 0
June 455,108 - 0
Small business suppliers
September 52 - 0
December 425 - 0
March 478 - 0
June 482 - 0

118 NSW Department of Education Annual Report 2015 | www.dec.nsw.gov.au
Financial management
ESTABLISHMENT, CHANGE AND CLOSURE OF SCHOOLS
This section lists all public schools that have been newly established, closed or otherwise changed. During 2015, six schools were established, three schools were closed or merged and three schools were relocated.
Table 26: Establishment, closure and changes to schools and campuses, 2015
School nameABS statistical
area 4 groupingRegion Date
New schools or campuses established
Cammeraygal High School Sydney–North Sydney and Hornsby Northern Sydney 27 January 2015
Lake Cathie Public School Mid North Coast North Coast 27 January 2015
Riverbank Public School Sydney–Blacktown Western Sydney 27 January 2015
The Ponds High School Sydney–Blacktown Western Sydney 27 January 2015
Victoria Avenue Public School Sydney–Inner West South Western Sydney 27 January 2015
Aurora College Sydney–Ryde Northern Sydney 27 January 2015
Schools or campuses re-opened
None
Schools or campuses closed or merged
Spencer Public School Central Coast, Newcastle Hunter/Central Coast 2 March 2015
George Anderson Walpole School Central Coast, Newcastle Hunter/Central Coast 22 May 2015
Bibbenluke Public School South East NSW Illawarra and South East 14 July 2015
Closures gazetted but not previously listed
None
Schools or campuses relocated
Wangee Park School Sydney–South South Western Sydney 27 January 2015
The Ponds School Sydney–West Western Sydney 27 January 2015
Bradfield College Sydney–North Sydney and Hornsby Northern Sydney 27 January 2015
Schools or campuses with a name change
Urana Public School (formerly Urana Central School) South West NSW Riverina 28 January 2015
Tibooburra Outback Public School (formerly Tibooburra Outback School of the Air)
North West NSW Western NSW 27 January 2015
Umina Beach Public School (formerly Umina Public School) Central Coast, Newcastle Hunter/Central Coast 16 February 2015
Hastings Secondary College, Port Macquarie Campus (formerly Port Macquarie High School)
North East NSW North Coast 17 April 2015
Hastings Secondary College, Westport Campus (formerly Westport High School)
North East NSW North Coast 17 April 2015
Bardia Public School (formerly Ingleburn North Public School) South West South Western Sydney 5 May 2015
The Rivers Secondary College, Lismore High Campus (formerly Lismore High School)
North East NSW North Coast 12 August 2015
The Rivers Secondary College, Kadina High Campus (formerly Kadina High School)
North East NSW North Coast 12 August 2015
The Rivers Secondary College, Richmond River High Campus (for-merly Richmond River High School)
North East NSW North Coast 12 August 2015
Source: Department of Education, Centre for Education Statistics and Evaluation. Note: This table records the date at which changes in operational status became effective.

119 NSW Department of Education Annual Report 2015 | www.dec.nsw.gov.au
Financial management
MAJOR CAPITAL WORKS
This section lists major works in progress, including the cost of those works to date and the estimated dates of completion. It also includes details of any significant delays, cancellations or cost overruns in major works.
Table 27: Major capital works, 2014–15
Project description and locationExpenditure
2014–15 ($’000)
Estimated total cost
($’000)
Completion date (actual
or estimated)
Delays, cancellations or
cost overruns
School facilities, upgrades and refurbishment – new work 2014–15
Bellevue Hill Public School upgrade Market sensitive Market sensitive 30/06/2017 -
Bourke Street Public School upgrade 412 5,220 23/12/2016 -
Bowral Public School upgrade 297 4,600 30/09/2016 -
Brewarrina Central School upgrade 632 3,000 29/02/2016 -
Glenmore Park School (new school) 450 15,300 20/12/2016 -
Harbord Public School upgrade 760 9,800 30/01/2017 -
Hunter Sports High School upgrade Market sensitive Market sensitive 29/01/2018Significant design changes required
Lucas Gardens School upgrade 1,072 16,000 27/01/2017 -
Manly Vale Public School upgrade Market sensitive Market sensitive 14/11/2017 -
Moree East Public School upgrade 1,033 15,000 14/10/2016 -
Narrabri Public School upgrade 210 2,100 29/07/2016 -
Cammeraygal High School (new school) 6,921 8,750 12/10/2015 Completed
Point Clare Public School upgrade 677 9,220 23/12/2016 -
Ultimo Public School relocation Market sensitive Market sensitive 5/06/2019Delays due to
selection of school site
Walgett Community College High School upgrade 776 7,641 19/10/2016 -
Wilton Public School upgrade 372 4,145 12/02/2016 -
School facilities, upgrades and refurbishment – work in progress
Cabramatta High School upgrade (stage 3) 5,760 7,451 17/07/2015 Completed
Cairnsfoot School relocation 103 16,776 6/06/2016 -
Victoria Avenue Public School (new school) 13,008 34,723 27/02/2015 Completed
Collarenebri Central School upgrade 1,159 5,451 9/10/2014 Completed
Connected Communities Program 2,699 7,500 19/10/2016 -
Dension College of Secondary Education Bathurst High Campus upgrade and new gym
2,220 8,387 12/01/2015 Completed
Illawarra Industry Training College 1,420 5,451 8/10/2014 Completed
Lake Cathie Public School (new school) 5,925 6,434 22/01/2015 Completed
Anzac Park Public School (new school) 6,798 24,978 19/07/2016 -
Mowbray Public School upgrade 6,058 20,700 11/04/2016 -
Northern Sydney Primary Schools upgrade (stage 1) 1,599 4,434 2/12/2014 Completed

120 NSW Department of Education Annual Report 2015 | www.dec.nsw.gov.au
Financial management
LAND DISPOSAL
In 2014–15, gross proceeds from the disposal of 11 school properties amounted to approximately $2.7 million.
There were no businesses or family connections between buyers and departmental staff. Disposed properties were either surplus to the department’s operational requirements or were compulsorily acquired by other authorities for purposes such as road widening. The net proceeds from the sale of surplus assets are used for the maintenance and upgrading of school facilities.
An application for access to documents concerning details of properties disposed of during the reporting year may be made in accordance with the Government Information (Public Access) Act 2009.
Oran Park Public School (new school) 470 14,983 17/01/2014 Completed
Parry School relocation 2,787 3,486 16/07/2015 Completed
Rutherford High School upgrade and Maitland Tutorial Centre relocation
8,664 19,997 26/04/2016 -
Spring Farm Public School (new school) 5,304 13,248 11/03/2016 -
The Ponds High School (new school) 12,595 29,436 6/01/2015 Completed
Riverbank Public School (new school) 5,002 13,205 6/01/2015 Completed
The Ponds School (new school) 5,070 12,699 4/12/2014 Completed
Wangee Park School relocation 903 9,999 18/09/2015 Completed
Wentworth Point Public School (new school) 600 19,336 28/07/2017 -
Yeoval Central School upgrade Market sensitive Market sensitive 20/07/2015 Completed
121 NSW Department of Education Annual Report 2015 | www.dec.nsw.gov.au
Financial management
CREDIT CARD CERTIFICATION
122 NSW Department of Education Annual Report 2015 | www.dec.nsw.gov.au
Financial management
CONTROLLED ENTITIES
All of the departments and statutory bodies listed in schedules 2 and 3 of the Public Finance and Audit Act 1983 prepare their own annual reports. The department does not have any controlled entities.
RISK MANAGEMENT AND INSURANCE ACTIVITIES
The department is committed to ethical and transparent practices, continuous improvement, quality assurance and risk management in its delivery of services to the people of NSW.
An established governance and risk framework ensures the visibility of significant risks and an increased focus on emerging threats and opportunities. This framework ensures that the department continues to manage its risks effectively and that risk management is embedded throughout the organisation.
Governance processes include the regular review of all risks on the executive and division risk registers and an annual review of the risk management framework by the Executive. The department actively managed its enterprise risk register in 2015, providing updates to the Audit and Risk Committee, the Ministers and the Executive on a quarterly basis.
The department has business continuity plans in place for all identified critical business functions. Best practice guides and self-assessment tools are available on our intranet to help staff in all areas of risk management. An e-learning module in risk management is also available to further help staff become familiar with risk management and the risk assessment process. Training in enterprise risk management and business continuity management is offered to staff on a regular basis.
The NSW Treasury Managed Fund (TMF) provides cover for all asset and liability exposures (other than compulsory third-party insurance) faced by general NSW government sector budget dependent agencies. The Department of Education has been a member of the fund since its introduction in 1989 and remains one of the top five largest agencies within the scheme.
NSW Treasury provides budget dependent agencies with incentivised funding to assist meeting the cost of contributions for workers compensation, property, motor vehicle, liability and other risks. The department continues to perform well within the scheme and had surplus funding provided by Treasury within the reporting period.
123 NSW Department of Education Annual Report 2015 | www.dec.nsw.gov.au
Financial management
Internal Audit and Risk Management Statement disclosure
Internal audit
The department’s Audit directorate is responsible for assurance services and corruption prevention for the department and related agencies. In 2015, Audit:
¡ undertook audits of 455 selected schools, comprising 150 of the 229 schools that implemented the Learning Management and Business Reform (LMBR) systems and 305 OASIS schools, to which LMBR will be rolled out in 2016; audits focused on high-risk areas: child protection, enrolments, student attendance, work health and safety, assets management, and key financial and administrative operations, as well as providing guidance on the rollover from OASIS to LMBR
¡ conducted reviews of the NSW regional conservatoriums, grants to the Sydney Conservatorium and the University of Newcastle Conservatorium, the Ultimo and Tamworth/Coffs Harbour operational directorates and the non-HR component of the school Resource Allocation Model
¡ completed finance end-to-end control framework updates for the SAP Green environment
¡ implemented the continuous audit regime with the ongoing development of Computer Assisted Audit Techniques for most SAP modules
¡ concentrated on SAP purchase-to-pay and revenue accounting functionality when performing continuous audits, in particular duplicate payments and integrity of SAP master data

124 NSW Department of Education Annual Report 2015 | www.dec.nsw.gov.au
Financial management
¡ implemented continuous audit philosophy for the departmental payroll with the annual updates of risk assessments and continuous testing of payroll transactions
¡ undertook audits on work health and safety, including workers compensation claims, records management, and asset management planning and delivery
¡ assessed the governance of the Smart and Skilled program and provided advice on the tender application process to ensure probity requirements were met
¡ conducted risk assessment of the department’s procurement processes and tested its compliance with the Procurement Policy Framework to meet the department’s procurement accreditation
¡ audited general and travel expense claims and corporate credit card expenditures
¡ conducted performance audits of Early Action for Success, Implementation of Government Sector Employee Reforms and Assisted School Travel, with recommendations made to improve management systems and operations
¡ as part of the LMBR initiative, conducted reviews covering data migration, interfaces, user acceptance testing, user training, change management, deployment and cutover phases for the core releases of TAFE NSW payroll across all institutes and student wellbeing for schools; post-implementation reviews of SAP security and the Governance, Risk and Control module across the SAP finance systems were also conducted
¡ completed reviews over key IT technology programs and processes including infrastructure security, Bring Your Own Device, cloud computing and the department’s IT strategy
¡ regularly updated the central register of gifts and benefits on the department’s website and reconciled statements of pecuniary and private interest
¡ conducted a health check of the Smart and Skilled projects to ensure operational readiness
¡ developed end-to-end internal control framework for budget process, funds management, and early childhood education and care, including a review of the Early Childhood Contracts and Management System
¡ Implemented the one recommendation from the 2015 NSW Auditor-General’s Performance Audit Report – Implementing Performance Audit Recommendations by using the Audit Office’s better practice checklist to implement audit recommendations; this includes providing progress against performance audit recommendations in the department’s annual report.
Audit and Risk Committee
The department’s Audit and Risk Committee consists of an independent chair and two independent members. The committee oversees and monitors the department’s governance, risk and control frameworks and its external accountability requirements. In 2015, the committee undertook its duties and responsibilities as prescribed by the Internal Audit and Risk Management Policy for the NSW Public Sector.
Seven meetings were held in 2015:
¡ 5 February
¡ 1 April
¡ 25 May
¡ 21 July
¡ 18 August
¡ 14 September
¡ 25 November.
A sub-committee was established for the department’s LMBR project and held its last meeting in March 2015.
Table 28: Attendance at Department of Education Audit and Risk Committee, 2015
Name Title Meetings attended
Jim Mitchell Independent Chair 7
Christine Feldmanis Independent member 7
Garry Dinnie Independent member 5

125 NSW Department of Education Annual Report 2015 | www.dec.nsw.gov.au
Financial management
Digital Information Security Annual Attestation Statement

126 NSW Department of Education Annual Report 2015 | www.dec.nsw.gov.au
Financial management
GRANTS
This appendix outlines the nature and purpose of each grant program and lists all grants the department disbursed under each program in 2014–15.
Grant programSum of grants,
2014–15Aboriginal Education Grants $1,242,000
Adult and Community Education (ACE) Program Grants
$8,697,648
Apprenticeship and Traineeship Training Program Grants
$39,021,725
Community Building Partnership Program 2014–15 (2009)
$124,000
Community Building Partnership Program 2014–15 (2010)
$202,283
Community Building Partnership Program 2014–15 (2011)
$504,104
Community Building Partnership Program 2014–15 (2012)
$1,528,643
Community Building Partnership Program 2014–15 (2013)
$6,450,038
Community Building Partnership Program 2014–15 (2014)
$17,757,953
Community Languages Grants $4,338,527
Cultural Events and Festivals $104,455
Early Childhood Education and Care Grants $189,767,116
Educational Support Grant Program $1,319,904
Elsa Dixon Aboriginal Employment Program $2,121,576
Emerging Priorities Program $1,183,021
Intervention Support Grants: Young people with disabilities
$12,358,641
Minister for Aboriginal Affairs Discretionary Grants $14,136
Minister for Education Discretionary Grants $500,000
Miscellaneous Education Grants $1,125,269
NAIDOC $125,000
National Partnerships, National Quality Agenda for Early Childhood Education and Care
$2,077,740
National Partnerships, Helping Our Kids Understand Finances – Money Smart Teaching Project
$92,223
National Partnerships, Literacy and Numeracy Action Plan
$14,627,369
National Partnerships, National School Chaplaincy Programme
$10,049,315
National Partnerships, Programs Supporting Disengaged Youth
$600,000
NSW Reconciliation Council $245,000
Our Languages, Our Way $163,560
Productivity Places Program Grants $473,072
Regional Conservatorium of Music Grants $6,118,602
Skills Reform Program $67,841,965
Strategic Skills Program Grants $7,252,682
VET in Schools Consortium Grants $1,429,380
Youth Assistance Strategies Grants $7,426,482
GRAND TOTAL $406,883,429
Aboriginal Education Grants
Improving the educational and employment outcomes of young Aboriginal people.
Clontarf Foundation $1,242,000
Total paid in 2014–15 $1,242,000
Adult and Community Education (ACE) Program Grants
Delivering accredited and non-accredited vocational education and training.
ACE – North Coast Inc. $445,713
Albury Wodonga Community College Ltd $107,377
Alstonville-Ballina Community College $253,010
Bankstown Community College Inc. $201,103
Byron Region Community College Inc. $254,853
Camden Haven Community College Inc. $198,771
Central Coast Community College $361,487
City East Community College Inc. $170,783
Coffs Coast Community College Inc. $161,654
Community College-Northern Inland Inc. $353,651
Hornsby Ku-Ring-Gai Community College Inc. $119,704
Kiama Community College Inc. $294,487
Macarthur Community College Inc. $216,264
Macquarie Community College $307,698
Murwillumbah Adult Education Centre Inc. $156,386
Nepean Community College Inc. $247,226
New England Community College Inc. $79,783
Northern Beaches Community College Inc. $342,472
Port Macquarie Community College Inc. $287,729
Riverina Community College Ltd $377,446
Robinson Education Centre Inc. $235,672
Singleton Community College Inc. $78,508
St George & Sutherland Community College Inc. $169,574
Sydney Community College Ltd $111,060
Tamworth Community College Inc. $161,043
Tenterfield Community College Inc. $20,156
The Deaf Society of NSW $172,964
The Eurobodalla Adult Education Centre Inc. $160,426
The Parramatta College Inc. $499,232
Tomaree Community College Inc. $137,882
Tuggerah Lakes Community College Inc. $281,390
Verto Ltd $377,641
Western College Inc. $336,337
Western Riverina Community College Inc. $145,926
Workers Educational Association $872,240
Total paid in 2014–15 $8,697,648
127 NSW Department of Education Annual Report 2015 | www.dec.nsw.gov.au
Financial management
Apprenticeship and Traineeship Training Program Grants
Supporting the delivery of training that leads to apprenticeships and traineeships, as well as the provision of preliminary vocational skills training.
3-AAA Training & Consulting Pty Ltd $21,345
5 Star Training & Consulting Pty Ltd $1,127
A H F B Pty Ltd $9,777
AAMC Training Group Pty Ltd $2,746
Above & Below Adventure Company Pty Ltd $4,654
Academy Holdings Pty Ltd $32,602
Academy of Training Pty Ltd $78,111
Access Community Group Ltd $8,627
Access Group Training Ltd $596,573
Access Training & Logistics Pty Ltd $85,929
Access Training Institute Pty Ltd $10,478
ACE Community Colleges Ltd $33,443
Active Industry Training Ltd $999,957
AD1 College Pty Ltd $23,906
Alan Bartlett Consulting Pty Ltd $53,537
All Automotive Training Services Pty Ltd $89,134
Anglican Youth and Education Diocese of Sydney $7,442
Anglicare Canberra & Goulburn $28,337
Applied Training Solutions Pty Ltd $46,299
Apprentices Trainees Employment Ltd $460,086
Ash Pty Ltd $406,868
Aspire Training & Development Pty Ltd $32,969
ATC Western Sydney Ltd $131,919
Atkinson Training & Development Pty Ltd $39,608
ATS Training Systems Pty Ltd $8,315
Aurora Training and Professional Services Pty Ltd $25,169
Ausgrid $202,538
Austrain Academy Pty Ltd $199,010
Australian Academy Pty Ltd $54,981
Australian Airline Pilot Academy Pty Ltd $33,080
Australian Business Skills Pty Ltd $208,945
Australian Careers Business College Pty Ltd $1,368
Australian Centre for Environmental Compliance Pty Ltd
$24,033
Australian Child Care Career Options (ACCCO) Pty Ltd $147,375
Australian College of Commerce and Management Pty Ltd
$1,347,517
Australian College of Professionals Pty Ltd $168,672
Australian Community Education College Pty Ltd $83,089
Australian Construction Training Services Pty Ltd $166,054
Australian Industry Group Training Services Pty Ltd $2,077
Australian Institute of Personal Trainers Pty Ltd $15,703
Australian Institute of Workplace Learning Pty Ltd $57,002
Australian Retailers Association $38,128
Australian Salesmasters Training Co Pty Ltd $201,609
Australian Training Company Ltd $148,739
Australian Vocational Education College Pty Ltd $18,481
Australian Vocational Training Academy Pty Ltd $137,243
Auswide Projects Ltd $6,747
Automotive Academy Pty Ltd $1,188
Automotive Group Training (NSW) $182,434
Avana Learning Pty Ltd $346,953
Ballina Region Community College Inc. $11,823
Bannister Technical Pty Ltd $28,992
Barrington Training Services Pty Ltd $59,518
Belelmo Pty Ltd $206,840
Benchmark OHS Consulting Pty Ltd $9,637
Benchmark Resources Pty Ltd $477,667
Booroongen Djugun Aboriginal Corporation $48,978
Border Express Pty Ltd $12,797
Brainwave Learning Centre Pty Ltd $334,155
Break Thru People Solutions $5,559
Bridgeworks Personnel Ltd $208,872
BSA Ltd $1,759
Business Success Group Pty Ltd $528
C E Training Consultants Pty Ltd $3,365
Camden Haven Community College Inc. $129,618
Canterbury-Hurlstone Park RSL Club Ltd $45,749
Careers Australia Education Institute Pty Ltd $2,102
Careers Australia Institute of Training Pty Ltd $161,448
Cerebral Palsy Alliance $57,962
Chalcedony Investments Pty Ltd $288
Challenge Disability Services $72,161
Challenger Training Pty Ltd $170,055
City-Wide Building and Training Services Pty Ltd $203,333
Civil Contractors Federation $8,429
CLB Training & Development Pty Ltd $87,597
Coates Hospitality Services Pty Ltd $182,146
Comet Training Pty Ltd $2,556
Community Child Care Co-operative Ltd $45,591
Community College-Northern Inland Inc. $16,015
Congia Enterprises Pty Ltd $178,789
Contour Systems Pty Ltd $64,624
Cottonsoft Software Pty Ltd $2,393
Customer Focus Group Training Company of NSW Pty Ltd
$68,111
D P Training Pty Ltd $2,049
Dental Assistant Training Solutions Pty Ltd $59,859
Dental Assistants Professional Association Inc. $42,954
Designer Training Pty Ltd $549
Develup & Know Pty Ltd $18,164
Diversity Skills Training Pty Ltd $57,334
Dynomyte Solutions Pty Ltd $317
Eagle Wing Education and Training Pty Ltd $106,159
East West Training Solutions Pty Ltd $260,945
Education Training & Employment Australia Pty Ltd $32,619
Emma’s Secret Investments Pty Ltd $83,483
Employment & Training Australia Inc. $87,441
Empowerment Options Pty Ltd $177,285
Endeavour Industries Ltd $14,584
Engineering Training Australia Pty Ltd $24,371
Enhanced Training Services Pty Ltd $17,088
Enterprise & Training Company Ltd $207,310
Equalis Pty Ltd $247,144
Equals International (Aust) Pty Ltd $34,383
Essential Energy $153,214
Esset Group Pty Ltd $41,543
Ferngood Pty Ltd $49,921
First Impressions Resources Pty Ltd $76,042
Five Star Training Pty Ltd $145,495
Fletcher International Exports Pty Ltd $82,409
Flexible Training Solutions Pty Ltd $63,395
Focus Training Solutions Pty Ltd $28,433

128 NSW Department of Education Annual Report 2015 | www.dec.nsw.gov.au
Financial management
Ford Motor Company of Australia Ltd $19,160
Forsythes IT & Training Pty Ltd $24,279
Foundation Education Pty Ltd $5,985
Frankyln Scholar (Australia) Pty Ltd $1,291,213
Furnishing Industry Association of Australia Ltd $723,095
Future Academy Pty Ltd $141,661
GL Marketing & Distribution Pty Ltd $94,007
Goodstart Early Learning Ltd $27,632
Gow Learning International Pty Ltd $7,026
Greenacres Disability Services $2,500
Griffith Skills Training Centre Inc. $42,597
H&H Accredited Training Australasia Inc. $174,945
Hammond Institute Pty Ltd $11,042
HCR Constructions Pty Ltd $3,234
Honora Pty Ltd $6,339
Hornsby Ku-Ring-Gai Community College Inc. $833
Horticultural Training Pty Ltd $11,485
House With No Steps $30,503
HPC Holdings Pty Ltd $997
Hume Learning Institute Pty Ltd $15,841
Hunter Councils Inc. $51,262
Hunter Plant Operator Training School Ltd $16,697
Hunter Valley Training Company Pty Ltd $139,255
Hyundai Motor Company Australia Pty Ltd $41,164
Illawarra Area Child Care Ltd $982,198
Illawarra Retirement Trust $34,903
Impact Training & Development Solutions Pty Ltd $12,061
Impact Training Institute Pty Ltd $128,461
Inner West Skills Centre Inc. $5,438
Innovative Learning Solutions Pty Ltd $10,874
Insight Training Group Australia Pty Ltd $90,792
Institute of Financial Services Inc. $104,772
Institute of Strategic Management Pty Ltd $12,029
Intercept Group Pty Ltd $116,906
International Child Care College Pty Ltd $484,509
Interwork Ltd $702
Into Training Australia Pty Ltd $162,353
ISA Kiama Pty Ltd $29,415
J2S Training Solutions Pty Ltd $6,941
Jamie Hammond $1,943
JB Hunter Technology Pty Ltd $47,423
JBS Australia Pty Ltd $14,751
JKR Training for Business Pty Ltd $47,386
Joblink Plus Ltd $80,686
JPS & Associates Pty Ltd $94,010
Julie Reid Management Pty Ltd $80,097
Just Careers Training Pty Ltd $10,451
K.S. Training Pty Ltd $56,106
Kaplan Education Pty Ltd $160,736
Karben Training Solutions $508,979
Kiama Community College Inc. $119,590
Kings International College Ltd $6,063
Kirana Training Pty Ltd $122,619
Kogarah Rockdale Training Scheme Inc. $80,359
KRTS Pty Ltd $2,428
Labtech Training Pty Ltd $31,619
LDO Group Training Pty Ltd $17,789
Leadership Management Australia Pty Ltd $7,459
Learning Collaborative Pty Ltd $20,541
Learning Sphere Training Solutions Pty Ltd $50,485
Lennox Institute Pty Ltd $174,779
Lewelmo Pty Ltd $1,186
Lexon Industries Pty Ltd $30,380
Lianrick Pty Ltd $36,962
Life Without Barriers $10,719
Link Employment & Training Inc. $11,103
Linked Training Group Pty Ltd $944
Logan Workforce Solutions Pty Ltd $387
Macarthur Community College Inc. $214,188
MacArthur Disability Services Ltd $42,344
Macleay Valley Workplace Learning Centre Inc. $4,973
Macquarie Employment Training Service Inc. $699,434
Maddisson Employment Pty Ltd $53,322
Mai-Wel Ltd $17,316
Management Consultancy International Pty Ltd $189,324
Management Institute of Australia No.1 Pty Ltd $236,312
Management Institute of Australia No.2 Pty Ltd $221,873
Mantra Training & Development Pty Ltd $35,453
Mardo Group Pty Ltd $880
Marshall, Kristen $27,378
Mask Academy Pty Ltd $527,453
Maxwells Services Pty Ltd $105,479
MBC Training & Development Pty Ltd $4,733
McDonald’s Australia Ltd $859,225
McElvenny Ware Pty Ltd $22,264
MEGT (Australia) Ltd $228,786
Mental Health Co-ordinating Council Inc. $36,153
Milcom Communications Pty Ltd $78,366
Mint Training Pty Ltd $17,573
Motor Traders’ Association of NSW $702,333
Murray Mallee Training Company Ltd $323,937
My Freight Career Pty Ltd $38,662
National College Australia Pty Ltd $92,031
National Insurance Brokers Association of Australia $10,342
National Training Group Pty Ltd $19,415
National Training Organisation Pty Ltd $489,628
National Training Pty Ltd $2,264
Nationwide Training Solutions Pty Ltd $5,280
Newskills Ltd $5,674
Norman Chee & Thu Tram Chee Pty Ltd $17,598
Nortec Employment & Training Ltd $77,753
Northern Beaches Community College Inc. $40,623
Northnet Inc. $8,898
Novaskill $815,129
NSW Fishing Industry Training Committee Ltd $38,497
Nursing Group Pty Ltd $4,759
OCTEC Ltd $59,958
On Time Resources Pty Ltd $162,522
On-Focus Inc. $61,328
Online Consultancy & Investments Pty Ltd $21,485
Origin Human Resources Pty Ltd $485
OZ Skills Careers College Pty Ltd $20,677

129 NSW Department of Education Annual Report 2015 | www.dec.nsw.gov.au
Financial management
Paradigm Training Services Pty Ltd $8,950
Penrith Skills For Jobs Ltd $86,169
Pentrans Consulting Pty Ltd $7,255
Perceptum Training Partners Pty Ltd $677
Performance Edge Systems Pty Ltd $85,553
Performis Pty Ltd $138,603
Pharmaceutical Society of Australia $40,487
Pivotal Training & Development Pty Ltd $7,434
Port Macquarie Community College Inc. $13,203
Precise Training Pty Ltd $20,006
Precision Training Australia Pty Ltd $3,268
Primary Training Institute Pty Ltd $33,828
Professional Training Partners Pty Ltd $51,541
Property Training Solutions Pty Ltd $58,326
Proteen for Teens Inc. $8,485
Provet Pty Ltd $26,016
Ramsden Telecommunications Training Pty Ltd $101,715
Reach for Training Pty Ltd $12,542
Real Corporate Partners Pty Ltd $574,592
Real Estate Institute of NSW Ltd $84,543
Real Estate Training Solutions Pty Ltd $171,417
Real E-Training Pty Ltd $6,822
Rebel Group Ltd $18,400
Recognition First Pty Ltd $279,856
Response Consulting Australia Pty Ltd $111,487
Rise Education & Training Pty Ltd $95,151
Riverina Community College Ltd $20,724
Robinson Education Centre Inc. $1,207
Royal Rehabilitation Centre Sydney $15,655
RTV Consultancy Pty Ltd $1,992
SAL Consulting Pty Ltd $2,461
SCA Hair & Beauty Academy Pty Ltd $38,930
Selmar Holdings Pty Ltd $542,667
Singleton Community College Inc. $2,049
Skilled Group Ltd $265,617
Skills Training Australia Group Pty Ltd $221,290
Skillset Ltd $3,169
Skillstrain Pty Ltd $164,024
Southern Training Organisation Pty Ltd $11,476
Southside Community Services Inc. $4,632
St George & Sutherland Community College Inc. $298,614
Stanborough Wemyss Contracting Pty Ltd $267,939
Statewide Business Training Pty Ltd $74,233
Steven Millard & Associates Pty Ltd $36,399
Strategic Training Solutions Pty Ltd $2,043
Strategix Training Group Pty Ltd $107,191
Subway Development of NSW & ACT Pty Ltd $11,753
Sureway Skills Training Pty Ltd $18,093
Sustainable Learning Australasia Pty Ltd $3,316
Sutherland Shire Council $35,870
Sydney School of Business and Technology Pty Ltd $11,369
Tactical Training Group Pty Ltd $1,078,387
Tamworth Community College Inc. $21,578
Tandem College Pty Ltd $10,157
Targett Retail Training Pty Ltd $223,963
TexSkill Ltd $42,332
The Angelsea Complex Pty Ltd $68,582
The Association of Superannuation Funds of Australia Ltd
$42,842
The Change Network Pty Ltd $157,042
The Crusader Union of Australia $16,241
The Daniels Associates of Australasia Pty Ltd $262,533
The Design Works College of Design Pty Ltd $12,201
The Eurobodalla Adult Education Centre Inc. $36,656
The Fletcher Family Trust Trissig Pty Ltd $281,551
The Group Training Association of NSW & ACT $50,000
The Hospitals Contribution Fund of Australia Ltd $1,980
The Illawarra ITeC Ltd $60,296
The LDC Group Asia Pacific Pty Ltd $124,852
The Management Edge Pty Ltd $28,592
The Master Plumbers & Mechanical Contractors Association of NSW
$512,229
The ORS Group Pty Ltd $133,333
The Pharmacy Guild of Australia $175,771
The Quality Training Company Pty Ltd $121,402
The Uniting Church in Australia Property Trust (NSW) $49,519
Tilly’s Play & Development Pty Ltd $1,075
Timber Training Creswick Ltd $19,323
TLC Training Solutions Pty Ltd $63,311
Toni & Guy Australia Pty Ltd $144,576
Total Training Solutions Pty Ltd $27,123
Train Australia Pty Ltd $217,213
Trainer Assessor Group Pty Ltd $79,681
Training & Development Australia Pty Ltd $125,835
Training Beyond 2000 Pty Ltd $135,858
Training Education & Management Services Pty Ltd $69,226
Training Experts Australia Pty Ltd $515,840
Training Services 4 You Pty Ltd $289
Training Specialists (Australia) Pty Ltd $569,867
Training Synergies Pty Ltd $400,366
Transqual Pty Ltd $181,881
Tursa Employment & Training Inc. $7,193
UNE Partnerships Pty Ltd $40,660
UPC Pty Ltd $3,212
Upskilled Pty Ltd $12,091
Vantage Automotive Pty Ltd $245,707
Verto Ltd $216,250
Vision Training Institute Pty Ltd $252,378
Vital Training Solutions Pty Ltd $301
Vocational Institute of Australia Pty Ltd $29,683
Vocational Training Australia Pty Ltd $474,876
W G Learning Pty Ltd $314,430
Wentworth College Pty Ltd $445,084
Western College Inc. $1,382
Westrac Pty Ltd $129,171
Wetherill Park Training Centre Pty Ltd $41,796
Wise Group Ltd Partnership $201,729
Work Savvy Pty Ltd $148,705
Workers Educational Association $23,355
Worktrain Pty Ltd $48,896
Workventures Ltd $43,490
WPC Group Ltd $24,365
X-Seed Education & Development $69,252
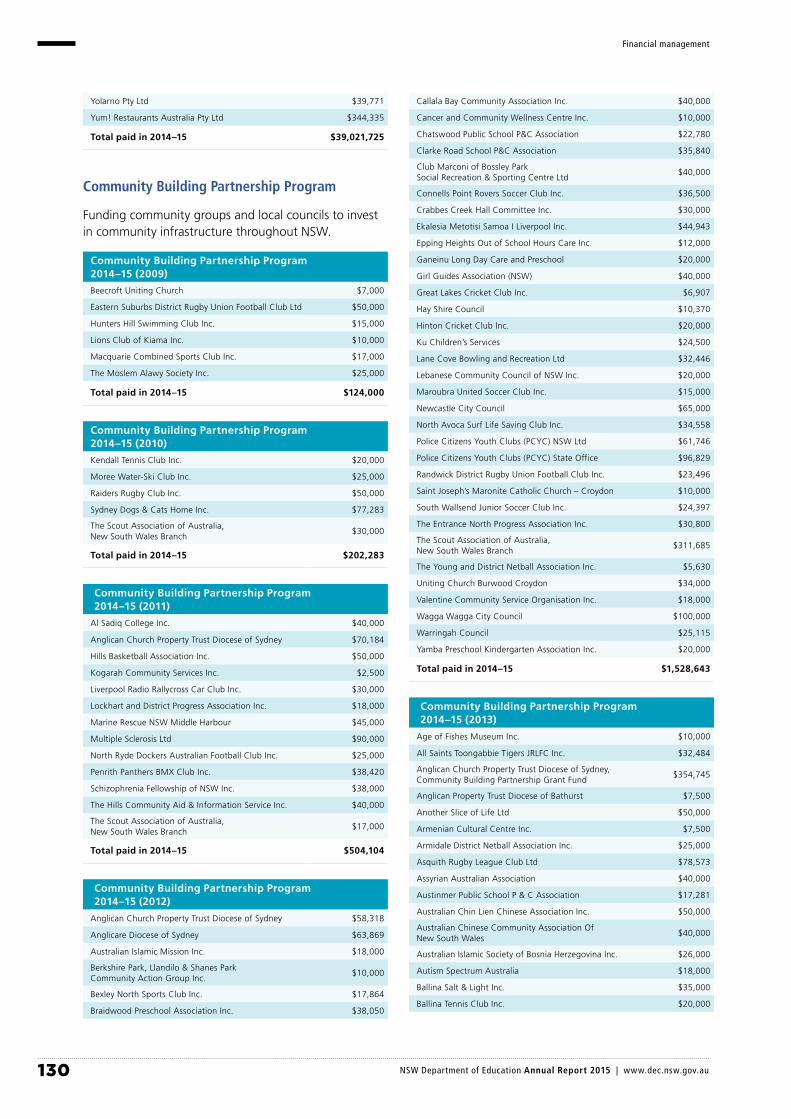
130 NSW Department of Education Annual Report 2015 | www.dec.nsw.gov.au
Financial management
Yolarno Pty Ltd $39,771
Yum! Restaurants Australia Pty Ltd $344,335
Total paid in 2014–15 $39,021,725
Community Building Partnership Program
Funding community groups and local councils to invest in community infrastructure throughout NSW.
Community Building Partnership Program 2014–15 (2009)
Beecroft Uniting Church $7,000
Eastern Suburbs District Rugby Union Football Club Ltd $50,000
Hunters Hill Swimming Club Inc. $15,000
Lions Club of Kiama Inc. $10,000
Macquarie Combined Sports Club Inc. $17,000
The Moslem Alawy Society Inc. $25,000
Total paid in 2014–15 $124,000
Community Building Partnership Program 2014–15 (2010)
Kendall Tennis Club Inc. $20,000
Moree Water-Ski Club Inc. $25,000
Raiders Rugby Club Inc. $50,000
Sydney Dogs & Cats Home Inc. $77,283
The Scout Association of Australia, New South Wales Branch
$30,000
Total paid in 2014–15 $202,283
Community Building Partnership Program 2014–15 (2011)
Al Sadiq College Inc. $40,000
Anglican Church Property Trust Diocese of Sydney $70,184
Hills Basketball Association Inc. $50,000
Kogarah Community Services Inc. $2,500
Liverpool Radio Rallycross Car Club Inc. $30,000
Lockhart and District Progress Association Inc. $18,000
Marine Rescue NSW Middle Harbour $45,000
Multiple Sclerosis Ltd $90,000
North Ryde Dockers Australian Football Club Inc. $25,000
Penrith Panthers BMX Club Inc. $38,420
Schizophrenia Fellowship of NSW Inc. $38,000
The Hills Community Aid & Information Service Inc. $40,000
The Scout Association of Australia, New South Wales Branch
$17,000
Total paid in 2014–15 $504,104
Community Building Partnership Program 2014–15 (2012)
Anglican Church Property Trust Diocese of Sydney $58,318
Anglicare Diocese of Sydney $63,869
Australian Islamic Mission Inc. $18,000
Berkshire Park, Llandilo & Shanes Park Community Action Group Inc.
$10,000
Bexley North Sports Club Inc. $17,864
Braidwood Preschool Association Inc. $38,050
Callala Bay Community Association Inc. $40,000
Cancer and Community Wellness Centre Inc. $10,000
Chatswood Public School P&C Association $22,780
Clarke Road School P&C Association $35,840
Club Marconi of Bossley Park Social Recreation & Sporting Centre Ltd
$40,000
Connells Point Rovers Soccer Club Inc. $36,500
Crabbes Creek Hall Committee Inc. $30,000
Ekalesia Metotisi Samoa I Liverpool Inc. $44,943
Epping Heights Out of School Hours Care Inc. $12,000
Ganeinu Long Day Care and Preschool $20,000
Girl Guides Association (NSW) $40,000
Great Lakes Cricket Club Inc. $6,907
Hay Shire Council $10,370
Hinton Cricket Club Inc. $20,000
Ku Children’s Services $24,500
Lane Cove Bowling and Recreation Ltd $32,446
Lebanese Community Council of NSW Inc. $20,000
Maroubra United Soccer Club Inc. $15,000
Newcastle City Council $65,000
North Avoca Surf Life Saving Club Inc. $34,558
Police Citizens Youth Clubs (PCYC) NSW Ltd $61,746
Police Citizens Youth Clubs (PCYC) State Office $96,829
Randwick District Rugby Union Football Club Inc. $23,496
Saint Joseph’s Maronite Catholic Church – Croydon $10,000
South Wallsend Junior Soccer Club Inc. $24,397
The Entrance North Progress Association Inc. $30,800
The Scout Association of Australia, New South Wales Branch
$311,685
The Young and District Netball Association Inc. $5,630
Uniting Church Burwood Croydon $34,000
Valentine Community Service Organisation Inc. $18,000
Wagga Wagga City Council $100,000
Warringah Council $25,115
Yamba Preschool Kindergarten Association Inc. $20,000
Total paid in 2014–15 $1,528,643
Community Building Partnership Program 2014–15 (2013)
Age of Fishes Museum Inc. $10,000
All Saints Toongabbie Tigers JRLFC Inc. $32,484
Anglican Church Property Trust Diocese of Sydney, Community Building Partnership Grant Fund
$354,745
Anglican Property Trust Diocese of Bathurst $7,500
Another Slice of Life Ltd $50,000
Armenian Cultural Centre Inc. $7,500
Armidale District Netball Association Inc. $25,000
Asquith Rugby League Club Ltd $78,573
Assyrian Australian Association $40,000
Austinmer Public School P & C Association $17,281
Australian Chin Lien Chinese Association Inc. $50,000
Australian Chinese Community Association Of New South Wales
$40,000
Australian Islamic Society of Bosnia Herzegovina Inc. $26,000
Autism Spectrum Australia $18,000
Ballina Salt & Light Inc. $35,000
Ballina Tennis Club Inc. $20,000
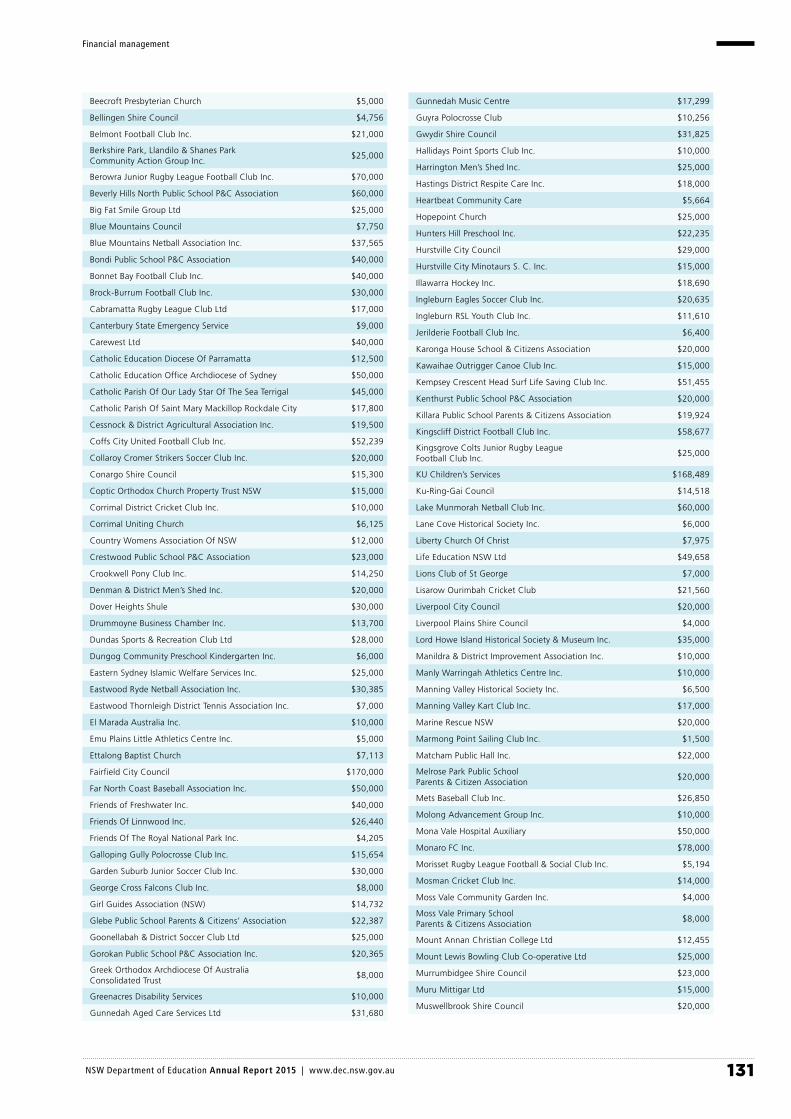
131 NSW Department of Education Annual Report 2015 | www.dec.nsw.gov.au
Financial management
Beecroft Presbyterian Church $5,000
Bellingen Shire Council $4,756
Belmont Football Club Inc. $21,000
Berkshire Park, Llandilo & Shanes Park Community Action Group Inc.
$25,000
Berowra Junior Rugby League Football Club Inc. $70,000
Beverly Hills North Public School P&C Association $60,000
Big Fat Smile Group Ltd $25,000
Blue Mountains Council $7,750
Blue Mountains Netball Association Inc. $37,565
Bondi Public School P&C Association $40,000
Bonnet Bay Football Club Inc. $40,000
Brock-Burrum Football Club Inc. $30,000
Cabramatta Rugby League Club Ltd $17,000
Canterbury State Emergency Service $9,000
Carewest Ltd $40,000
Catholic Education Diocese Of Parramatta $12,500
Catholic Education Office Archdiocese of Sydney $50,000
Catholic Parish Of Our Lady Star Of The Sea Terrigal $45,000
Catholic Parish Of Saint Mary Mackillop Rockdale City $17,800
Cessnock & District Agricultural Association Inc. $19,500
Coffs City United Football Club Inc. $52,239
Collaroy Cromer Strikers Soccer Club Inc. $20,000
Conargo Shire Council $15,300
Coptic Orthodox Church Property Trust NSW $15,000
Corrimal District Cricket Club Inc. $10,000
Corrimal Uniting Church $6,125
Country Womens Association Of NSW $12,000
Crestwood Public School P&C Association $23,000
Crookwell Pony Club Inc. $14,250
Denman & District Men’s Shed Inc. $20,000
Dover Heights Shule $30,000
Drummoyne Business Chamber Inc. $13,700
Dundas Sports & Recreation Club Ltd $28,000
Dungog Community Preschool Kindergarten Inc. $6,000
Eastern Sydney Islamic Welfare Services Inc. $25,000
Eastwood Ryde Netball Association Inc. $30,385
Eastwood Thornleigh District Tennis Association Inc. $7,000
El Marada Australia Inc. $10,000
Emu Plains Little Athletics Centre Inc. $5,000
Ettalong Baptist Church $7,113
Fairfield City Council $170,000
Far North Coast Baseball Association Inc. $50,000
Friends of Freshwater Inc. $40,000
Friends Of Linnwood Inc. $26,440
Friends Of The Royal National Park Inc. $4,205
Galloping Gully Polocrosse Club Inc. $15,654
Garden Suburb Junior Soccer Club Inc. $30,000
George Cross Falcons Club Inc. $8,000
Girl Guides Association (NSW) $14,732
Glebe Public School Parents & Citizens’ Association $22,387
Goonellabah & District Soccer Club Ltd $25,000
Gorokan Public School P&C Association Inc. $20,365
Greek Orthodox Archdiocese Of Australia Consolidated Trust
$8,000
Greenacres Disability Services $10,000
Gunnedah Aged Care Services Ltd $31,680
Gunnedah Music Centre $17,299
Guyra Polocrosse Club $10,256
Gwydir Shire Council $31,825
Hallidays Point Sports Club Inc. $10,000
Harrington Men’s Shed Inc. $25,000
Hastings District Respite Care Inc. $18,000
Heartbeat Community Care $5,664
Hopepoint Church $25,000
Hunters Hill Preschool Inc. $22,235
Hurstville City Council $29,000
Hurstville City Minotaurs S. C. Inc. $15,000
Illawarra Hockey Inc. $18,690
Ingleburn Eagles Soccer Club Inc. $20,635
Ingleburn RSL Youth Club Inc. $11,610
Jerilderie Football Club Inc. $6,400
Karonga House School & Citizens Association $20,000
Kawaihae Outrigger Canoe Club Inc. $15,000
Kempsey Crescent Head Surf Life Saving Club Inc. $51,455
Kenthurst Public School P&C Association $20,000
Killara Public School Parents & Citizens Association $19,924
Kingscliff District Football Club Inc. $58,677
Kingsgrove Colts Junior Rugby League Football Club Inc.
$25,000
KU Children’s Services $168,489
Ku-Ring-Gai Council $14,518
Lake Munmorah Netball Club Inc. $60,000
Lane Cove Historical Society Inc. $6,000
Liberty Church Of Christ $7,975
Life Education NSW Ltd $49,658
Lions Club of St George $7,000
Lisarow Ourimbah Cricket Club $21,560
Liverpool City Council $20,000
Liverpool Plains Shire Council $4,000
Lord Howe Island Historical Society & Museum Inc. $35,000
Manildra & District Improvement Association Inc. $10,000
Manly Warringah Athletics Centre Inc. $10,000
Manning Valley Historical Society Inc. $6,500
Manning Valley Kart Club Inc. $17,000
Marine Rescue NSW $20,000
Marmong Point Sailing Club Inc. $1,500
Matcham Public Hall Inc. $22,000
Melrose Park Public School Parents & Citizen Association
$20,000
Mets Baseball Club Inc. $26,850
Molong Advancement Group Inc. $10,000
Mona Vale Hospital Auxiliary $50,000
Monaro FC Inc. $78,000
Morisset Rugby League Football & Social Club Inc. $5,194
Mosman Cricket Club Inc. $14,000
Moss Vale Community Garden Inc. $4,000
Moss Vale Primary School Parents & Citizens Association
$8,000
Mount Annan Christian College Ltd $12,455
Mount Lewis Bowling Club Co-operative Ltd $25,000
Murrumbidgee Shire Council $23,000
Muru Mittigar Ltd $15,000
Muswellbrook Shire Council $20,000

132 NSW Department of Education Annual Report 2015 | www.dec.nsw.gov.au
Financial management
Newcastle City Council $90,000
North Epping Bowling And Community Club Ltd $9,000
North Wollongong Surf Life Saving Inc. $25,000
Northern Agricultural Association Inc. $10,000
Northmead Bowling, Recreation and Sporting Club Ltd $19,650
Nundle District Lions Club Inc. $35,252
Nymagee Progress Association Inc. $5,000
Parkes Early Childhood Centre Inc. $21,622
Peakhurst Public School Parents and Citizens Association
$25,234
Penrith Valley Regional Sports Centre Ltd $6,500
Petersham Rugby Union Football Club Inc. $15,609
Picton District Agricultural, Horticultural and Industrial Society Inc.
$17,000
Pole Depot Community Centre Inc. $4,017
Police Citizens Youth Clubs (PCYC) NSW Ltd $260,210
Police Citizens Youth Clubs (PCYC) State Office $85,380
Port Macquarie Community Preschool Ltd $5,290
Quakers Hill Public School P&C $50,000
Queanbeyan and District Preschool Association Inc. $4,720
Racing Orange Ltd $12,000
Randwick Presbyterian Church $1,637
Riverwood Community Centre Ltd $36,364
Roo Theatre Company Inc. $30,000
Rotary Club Of Armidale Inc. $20,000
Rotary Club Of Broken Hill South Inc. $15,375
Rotary Club Of Narrabri Inc. $30,316
Royal Life Saving Society – Head Office NSW $25,000
Sawtell/Toormina Sports And Recreation Club Ltd $21,500
Shoalhaven Heads Public School P&C Assn $2,500
Singleton Golf Club Co-operative Ltd $11,000
Singleton Rugby Club Ltd $10,000
Sir Joseph Banks High School $15,000
Snowy Mountains Neighbourhood Centre Inc. $40,220
Soldier Point Tennis Club Inc. $12,142
Southern Districts Soccer Football Association Inc. $31,213
Sridurgadevi Devasthanam $27,081
St Euphemia College $28,200
St Francis Social Services $6,170
St George Australian Football Club Inc. $15,000
St Patricks Rugby Club Strathfield $14,000
Stuart Town Advancement Association Inc. $8,000
Sunnyfield $40,000
Surf Life Saving Central Coast Inc. $101,320
Sutherland Shire Canoe Club Inc. $5,100
Tahmoor Baptist Church $15,000
Tamworth Junior Riding and Pony Club Inc. $19,000
Temora Junior Australian Football Association Inc. $15,000
Terrigal-Avoca Australian Football Club Inc. $40,000
The Association Of Bhanin El Mineh Australian Arabic Community Welfare Centre Inc.
$35,000
The Cross Media Project $10,000
The Entrance Rugby Club Inc. $9,470
The Hills Rugby Union Football Club Inc. $19,250
The Junction Neighbourhood Centre Inc. $20,000
The Lebanese Moslem Association $25,000
The Lions Club Of Lugarno Inc. $4,500
The National Trust Of Australia (NSW) $8,000
The Rotary Club Of Springwood Inc. $12,880
The Salvation Army Property Trust $10,000
The Scout Association of Australia, New South Wales Branch
$653,607
The Town & Country Club Ltd $50,000
Touriandi Ltd $14,950
Towns With Heart Inc. $19,500
Trunkey Creek Show Society Inc. $15,870
Tumut Rodeo Club Inc. $30,000
Tweed Coast Junior AFL Club $21,594
UCA – Wayside Chapel $54,750
UCA – Windsor Congregation $13,600
Umina Surf Life Saving Club Inc. $7,527
Uniting Church Orange Parish $5,817
UnitingCare Forestville Preschool $10,000
Urana Shire Council $3,000
Wagga Swans Junior Australian Rules Football & Netball Club Inc.
$20,000
Wakool Preschool Inc. $5,506
Walcha Council $20,000
Wallarah Rural Fire Brigade $6,500
Wanda Surf Life Saving Club Inc. $73,000
Wanderers Rugby Football Club Inc. $25,000
Wandsworth Progress Association Inc. $6,970
Warilla Wanderers Junior Soccer Club Inc. $26,110
Warnervale Regional Uniting Church $15,000
Wesley Mission $30,000
West Pennant Hills Community Church $37,130
West Pennant Hills Public School P&C Association Inc. $10,000
West Pymble Bowling Club Ltd $16,049
West Ryde Public School P&C Association $25,500
West Wyalong Little Athletics Association $7,000
Western City Tigers Junior Rugby League Inc. $78,949
Western Suburbs District Cricket Club Inc. $15,000
Windale Junior Rugby League Inc. $4,000
Wingecarribee Headquarters Bush Fire Brigade $10,000
Wingello Village Association Inc. $3,000
Witmore Enterprises Inc. $10,000
Woodburn Chamber Of Commerce $30,000
Woonona Bowling & Recreation Club Ltd $4,000
Wyong Neighbourhood Centre Inc. $30,000
Wyong Shire Council $39,500
Yates Avenue P&C Association $17,787
Young Men’s Christian Association (YMCA) Of Sydney $7,203
Total paid in 2014–15 $6,450,038
Community Building Partnership Program 2014–15 (2014)
3Bridges Community Inc. $23,440
Aberdeen Junior Rugby League Football Club Inc. $8,000
Access Community Education Services (ACES) Inc. $15,000
ACON Health Ltd $33,550
Addison Road Centre for Arts, Culture, Community and Environment Ltd
$24,000
Advance Ganmain Committee $2,888
Albury Tennis Association Inc. $4,104
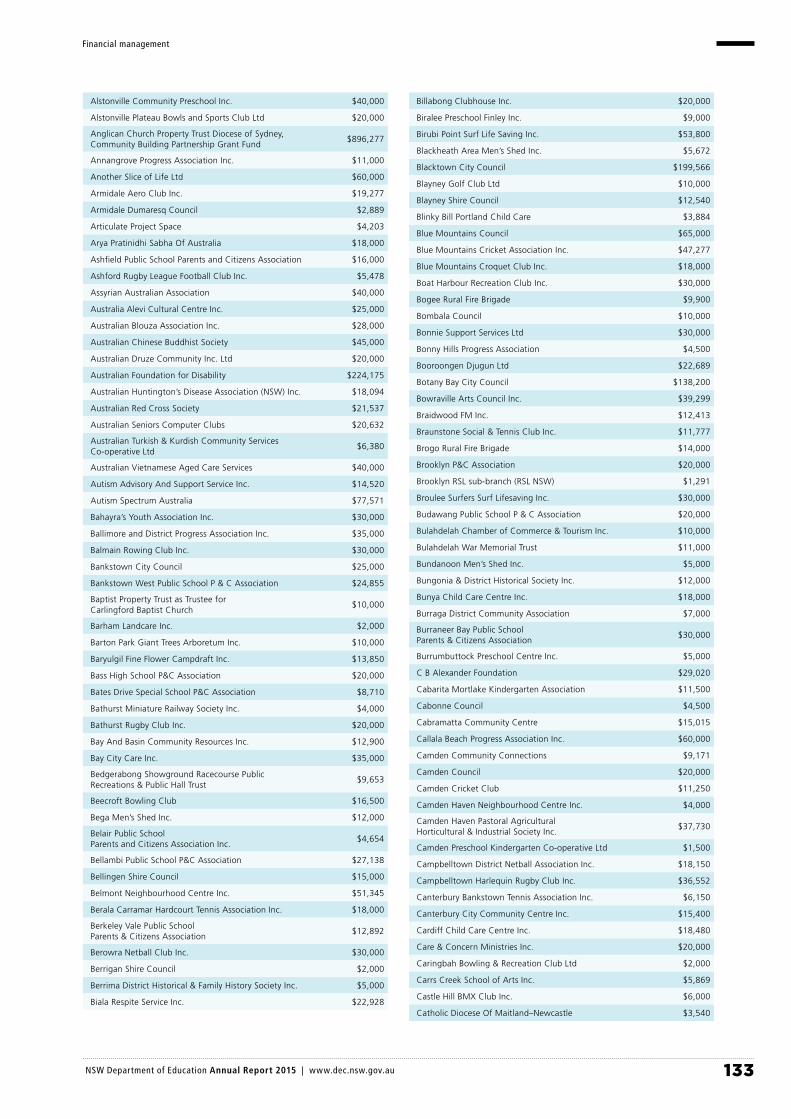
133 NSW Department of Education Annual Report 2015 | www.dec.nsw.gov.au
Financial management
Alstonville Community Preschool Inc. $40,000
Alstonville Plateau Bowls and Sports Club Ltd $20,000
Anglican Church Property Trust Diocese of Sydney, Community Building Partnership Grant Fund
$896,277
Annangrove Progress Association Inc. $11,000
Another Slice of Life Ltd $60,000
Armidale Aero Club Inc. $19,277
Armidale Dumaresq Council $2,889
Articulate Project Space $4,203
Arya Pratinidhi Sabha Of Australia $18,000
Ashfield Public School Parents and Citizens Association $16,000
Ashford Rugby League Football Club Inc. $5,478
Assyrian Australian Association $40,000
Australia Alevi Cultural Centre Inc. $25,000
Australian Blouza Association Inc. $28,000
Australian Chinese Buddhist Society $45,000
Australian Druze Community Inc. Ltd $20,000
Australian Foundation for Disability $224,175
Australian Huntington’s Disease Association (NSW) Inc. $18,094
Australian Red Cross Society $21,537
Australian Seniors Computer Clubs $20,632
Australian Turkish & Kurdish Community Services Co-operative Ltd
$6,380
Australian Vietnamese Aged Care Services $40,000
Autism Advisory And Support Service Inc. $14,520
Autism Spectrum Australia $77,571
Bahayra’s Youth Association Inc. $30,000
Ballimore and District Progress Association Inc. $35,000
Balmain Rowing Club Inc. $30,000
Bankstown City Council $25,000
Bankstown West Public School P & C Association $24,855
Baptist Property Trust as Trustee for Carlingford Baptist Church
$10,000
Barham Landcare Inc. $2,000
Barton Park Giant Trees Arboretum Inc. $10,000
Baryulgil Fine Flower Campdraft Inc. $13,850
Bass High School P&C Association $20,000
Bates Drive Special School P&C Association $8,710
Bathurst Miniature Railway Society Inc. $4,000
Bathurst Rugby Club Inc. $20,000
Bay And Basin Community Resources Inc. $12,900
Bay City Care Inc. $35,000
Bedgerabong Showground Racecourse Public Recreations & Public Hall Trust
$9,653
Beecroft Bowling Club $16,500
Bega Men’s Shed Inc. $12,000
Belair Public School Parents and Citizens Association Inc.
$4,654
Bellambi Public School P&C Association $27,138
Bellingen Shire Council $15,000
Belmont Neighbourhood Centre Inc. $51,345
Berala Carramar Hardcourt Tennis Association Inc. $18,000
Berkeley Vale Public School Parents & Citizens Association
$12,892
Berowra Netball Club Inc. $30,000
Berrigan Shire Council $2,000
Berrima District Historical & Family History Society Inc. $5,000
Biala Respite Service Inc. $22,928
Billabong Clubhouse Inc. $20,000
Biralee Preschool Finley Inc. $9,000
Birubi Point Surf Life Saving Inc. $53,800
Blackheath Area Men’s Shed Inc. $5,672
Blacktown City Council $199,566
Blayney Golf Club Ltd $10,000
Blayney Shire Council $12,540
Blinky Bill Portland Child Care $3,884
Blue Mountains Council $65,000
Blue Mountains Cricket Association Inc. $47,277
Blue Mountains Croquet Club Inc. $18,000
Boat Harbour Recreation Club Inc. $30,000
Bogee Rural Fire Brigade $9,900
Bombala Council $10,000
Bonnie Support Services Ltd $30,000
Bonny Hills Progress Association $4,500
Booroongen Djugun Ltd $22,689
Botany Bay City Council $138,200
Bowraville Arts Council Inc. $39,299
Braidwood FM Inc. $12,413
Braunstone Social & Tennis Club Inc. $11,777
Brogo Rural Fire Brigade $14,000
Brooklyn P&C Association $20,000
Brooklyn RSL sub-branch (RSL NSW) $1,291
Broulee Surfers Surf Lifesaving Inc. $30,000
Budawang Public School P & C Association $20,000
Bulahdelah Chamber of Commerce & Tourism Inc. $10,000
Bulahdelah War Memorial Trust $11,000
Bundanoon Men’s Shed Inc. $5,000
Bungonia & District Historical Society Inc. $12,000
Bunya Child Care Centre Inc. $18,000
Burraga District Community Association $7,000
Burraneer Bay Public School Parents & Citizens Association
$30,000
Burrumbuttock Preschool Centre Inc. $5,000
C B Alexander Foundation $29,020
Cabarita Mortlake Kindergarten Association $11,500
Cabonne Council $4,500
Cabramatta Community Centre $15,015
Callala Beach Progress Association Inc. $60,000
Camden Community Connections $9,171
Camden Council $20,000
Camden Cricket Club $11,250
Camden Haven Neighbourhood Centre Inc. $4,000
Camden Haven Pastoral Agricultural Horticultural & Industrial Society Inc.
$37,730
Camden Preschool Kindergarten Co-operative Ltd $1,500
Campbelltown District Netball Association Inc. $18,150
Campbelltown Harlequin Rugby Club Inc. $36,552
Canterbury Bankstown Tennis Association Inc. $6,150
Canterbury City Community Centre Inc. $15,400
Cardiff Child Care Centre Inc. $18,480
Care & Concern Ministries Inc. $20,000
Caringbah Bowling & Recreation Club Ltd $2,000
Carrs Creek School of Arts Inc. $5,869
Castle Hill BMX Club Inc. $6,000
Catholic Diocese Of Maitland–Newcastle $3,540
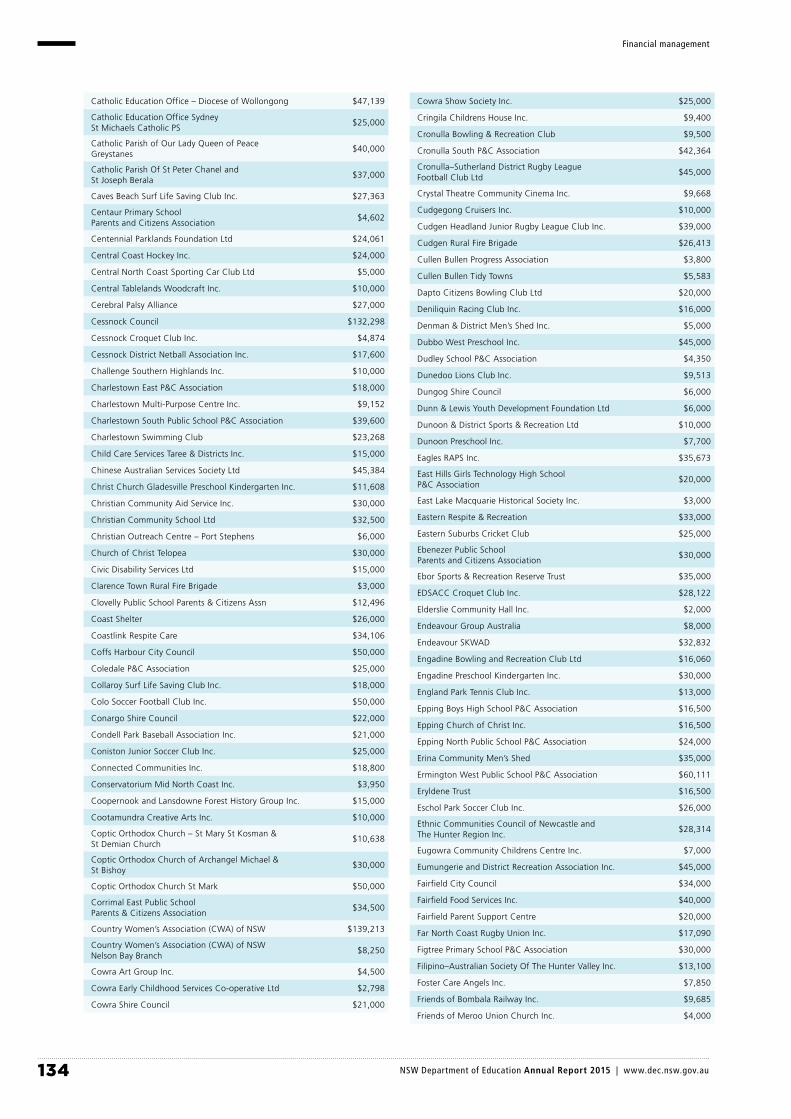
134 NSW Department of Education Annual Report 2015 | www.dec.nsw.gov.au
Financial management
Catholic Education Office – Diocese of Wollongong $47,139
Catholic Education Office Sydney St Michaels Catholic PS
$25,000
Catholic Parish of Our Lady Queen of Peace Greystanes
$40,000
Catholic Parish Of St Peter Chanel and St Joseph Berala
$37,000
Caves Beach Surf Life Saving Club Inc. $27,363
Centaur Primary School Parents and Citizens Association
$4,602
Centennial Parklands Foundation Ltd $24,061
Central Coast Hockey Inc. $24,000
Central North Coast Sporting Car Club Ltd $5,000
Central Tablelands Woodcraft Inc. $10,000
Cerebral Palsy Alliance $27,000
Cessnock Council $132,298
Cessnock Croquet Club Inc. $4,874
Cessnock District Netball Association Inc. $17,600
Challenge Southern Highlands Inc. $10,000
Charlestown East P&C Association $18,000
Charlestown Multi-Purpose Centre Inc. $9,152
Charlestown South Public School P&C Association $39,600
Charlestown Swimming Club $23,268
Child Care Services Taree & Districts Inc. $15,000
Chinese Australian Services Society Ltd $45,384
Christ Church Gladesville Preschool Kindergarten Inc. $11,608
Christian Community Aid Service Inc. $30,000
Christian Community School Ltd $32,500
Christian Outreach Centre – Port Stephens $6,000
Church of Christ Telopea $30,000
Civic Disability Services Ltd $15,000
Clarence Town Rural Fire Brigade $3,000
Clovelly Public School Parents & Citizens Assn $12,496
Coast Shelter $26,000
Coastlink Respite Care $34,106
Coffs Harbour City Council $50,000
Coledale P&C Association $25,000
Collaroy Surf Life Saving Club Inc. $18,000
Colo Soccer Football Club Inc. $50,000
Conargo Shire Council $22,000
Condell Park Baseball Association Inc. $21,000
Coniston Junior Soccer Club Inc. $25,000
Connected Communities Inc. $18,800
Conservatorium Mid North Coast Inc. $3,950
Coopernook and Lansdowne Forest History Group Inc. $15,000
Cootamundra Creative Arts Inc. $10,000
Coptic Orthodox Church – St Mary St Kosman & St Demian Church
$10,638
Coptic Orthodox Church of Archangel Michael & St Bishoy
$30,000
Coptic Orthodox Church St Mark $50,000
Corrimal East Public School Parents & Citizens Association
$34,500
Country Women’s Association (CWA) of NSW $139,213
Country Women’s Association (CWA) of NSW Nelson Bay Branch
$8,250
Cowra Art Group Inc. $4,500
Cowra Early Childhood Services Co-operative Ltd $2,798
Cowra Shire Council $21,000
Cowra Show Society Inc. $25,000
Cringila Childrens House Inc. $9,400
Cronulla Bowling & Recreation Club $9,500
Cronulla South P&C Association $42,364
Cronulla–Sutherland District Rugby League Football Club Ltd
$45,000
Crystal Theatre Community Cinema Inc. $9,668
Cudgegong Cruisers Inc. $10,000
Cudgen Headland Junior Rugby League Club Inc. $39,000
Cudgen Rural Fire Brigade $26,413
Cullen Bullen Progress Association $3,800
Cullen Bullen Tidy Towns $5,583
Dapto Citizens Bowling Club Ltd $20,000
Deniliquin Racing Club Inc. $16,000
Denman & District Men’s Shed Inc. $5,000
Dubbo West Preschool Inc. $45,000
Dudley School P&C Association $4,350
Dunedoo Lions Club Inc. $9,513
Dungog Shire Council $6,000
Dunn & Lewis Youth Development Foundation Ltd $6,000
Dunoon & District Sports & Recreation Ltd $10,000
Dunoon Preschool Inc. $7,700
Eagles RAPS Inc. $35,673
East Hills Girls Technology High School P&C Association
$20,000
East Lake Macquarie Historical Society Inc. $3,000
Eastern Respite & Recreation $33,000
Eastern Suburbs Cricket Club $25,000
Ebenezer Public School Parents and Citizens Association
$30,000
Ebor Sports & Recreation Reserve Trust $35,000
EDSACC Croquet Club Inc. $28,122
Elderslie Community Hall Inc. $2,000
Endeavour Group Australia $8,000
Endeavour SKWAD $32,832
Engadine Bowling and Recreation Club Ltd $16,060
Engadine Preschool Kindergarten Inc. $30,000
England Park Tennis Club Inc. $13,000
Epping Boys High School P&C Association $16,500
Epping Church of Christ Inc. $16,500
Epping North Public School P&C Association $24,000
Erina Community Men’s Shed $35,000
Ermington West Public School P&C Association $60,111
Eryldene Trust $16,500
Eschol Park Soccer Club Inc. $26,000
Ethnic Communities Council of Newcastle and The Hunter Region Inc.
$28,314
Eugowra Community Childrens Centre Inc. $7,000
Eumungerie and District Recreation Association Inc. $45,000
Fairfield City Council $34,000
Fairfield Food Services Inc. $40,000
Fairfield Parent Support Centre $20,000
Far North Coast Rugby Union Inc. $17,090
Figtree Primary School P&C Association $30,000
Filipino–Australian Society Of The Hunter Valley Inc. $13,100
Foster Care Angels Inc. $7,850
Friends of Bombala Railway Inc. $9,685
Friends of Meroo Union Church Inc. $4,000

135 NSW Department of Education Annual Report 2015 | www.dec.nsw.gov.au
Financial management
George Cross Falcon Club Inc. $6,000
Georges Hall Public School P&C Association $20,000
Gerringong Uniting Church $13,860
Gilgandra Mens Shed Inc. $1,050
Girl Guides Association (NSW) $285,014
Gladesville Occasional Child Care Centre Inc. $10,000
Gladesville RSL & Community Club Ltd $50,000
Glencoe Community Group Inc. $17,980
Glendon Brook Hall Inc. $5,000
Glenquarry Peace Memorial Hall Inc. $2,000
Gloucester District Tennis Association Inc. $5,000
Goonellabah Preschool Inc. $20,117
Gosford City Council $160,249
Goulburn Dog Training & Kennel Club Inc. $15,000
Goulburn Golf Club Ltd $5,000
Grafton Clay Target Club Inc. $10,234
Grafton Estate Tenants and Recreation Committee Inc. $13,157
Grafton Sporting Car Club Inc. $14,519
Granite Borders Landcare Committee $11,903
Grays Point Preschool Kindergarten Association Inc. $15,000
Great Lakes Historical Cooperative Society Ltd $15,000
Great Lakes United Football Club Inc. $15,000
Greater Taree City Council $17,000
Greek Orthodox Archdiocese of Australia Consolidated Trust Parish of St Stephanos Hurlstone Park Child Care Centre
$20,000
Greek Welfare Centre $8,000
Grenfell Gunyah Craft Shop Inc. $9,900
Greystanes Cricket Club Inc. $12,000
Griffith Local Aboriginal Land Council $6,744
Griffith Senior Citizens Club Inc. $20,000
Gumnut Community Preschool Inc. $10,761
Gundagai Racecourse and Showground Trust $18,338
Gunnedah Meals on Wheels Association Inc. $15,000
Gunnedah Rural Museum Inc. $31,700
Gunnedah Services & Bowling Club $7,065
Gunnedah Shire Council $6,500
Guyra Shire Council $5,000
Gymea United Football Club Inc. $45,000
Hamilton Community Preschool Inc. $3,658
Harrington Crowdy Head Chamber of Commerce Industry & Tourism Inc.
$8,000
Harry Meyn Foundation Ltd $30,000
Hastings Baseball Inc. $15,000
Hastings District Flying Club Inc. $15,000
Hastings Valley Miniature Railway Society Inc. $42,500
Hastings Wood Workers Guild Inc. $6,866
Hawkesbury City Council $30,000
Hawkesbury District Agricultural Association $22,000
Hawkesbury District Concert Band Inc. $11,699
Hawkesbury Riding Club Inc. $5,000
Hawkesbury Sports Council Inc. $14,053
Hay Football Club Inc. $6,140
Hazelbrook Football Club Inc. $29,700
Henty And District Lifestyle Centre Inc. $12,000
Henty Men’s Shed Inc. $5,000
Hills District Netball Association Inc. $25,000
Hilltop Road School Parents & Citizens Association $25,000
Holroyd City Council $169,930
Horizon Theatre Co Ltd $20,000
Hornsby Heights Sports Club Inc. $100,000
Howe Park Tennis Club Singleton Inc. $4,000
Hunter Care Ltd $4,467
Hunter District Cycling Club Inc. $30,000
Hunter Region Working Women’s Group Ltd $20,000
Hunters Hill Council $30,000
Hurstville City Council $12,000
Hurstville Community Food Services $25,000
Hurstville Public School Parents & Citizens Association $75,000
Ilford Recreational Reserve Trust $23,000
Illabo Show Society Inc. $10,500
Illawarra Aboriginal Corporation $6,000
Illawarra Area Child Care Ltd $85,622
Illawarra Community Housing Trust $25,000
Illawarra Live Steamers Co-op Ltd $8,000
Illawarra Multicultural Services Inc. $6,000
Illawarra Sports Stadium Ltd $5,000
Illawong Public School Parents And Citizens Association
$5,000
Iluka Football Club Inc. $16,000
Imaginenations Church Inc. $17,005
Inspire Community Services Inc. $35,888
Inverell Community Men’s Shed Inc. $10,000
Inverell Pipe Band Inc. $14,519
Inverell Shire Council $36,433
Italian Social Welfare Organisation of Wollongong Ltd $20,000
Jesuit Social Services Ltd $22,000
Jewish House Ltd $40,000
Jubilee Community Services Inc. $22,500
Junction Hill Tennis Club Inc. $30,000
Junee Golf Club Ltd $16,500
Kariong Neighbourhood Centre Inc. $27,310
Karuah Public School P&C Association $7,900
Kearsley Public School P&C Association $16,440
Kegworth Public School P&C Association $30,000
Keira Cricket Club Inc. $22,000
Kiama Netball Association Inc. $50,000
Kiama Uniting Church Men’s Shed $16,000
Killarney Vale Australian Football Club Inc. $13,960
Killarney Vale Public School P&C Assn $35,000
King Tomislav Croatian Club Ltd $30,000
Kingsgrove Colts Junior Rugby League Football Club Inc.
$50,000
Kogarah City Council $42,700
Kogarah Community Services Inc. $44,759
Koinonia Ministries Ltd $20,000
Krambach School Of Arts Inc. $3,000
KU Children’s Services $101,198
Kulchajam Inc. $24,744
Kurrajong Waratah $20,000
Kurri Kurri Speedway Club Inc. $8,000
Kyogle Council $12,000
Lake Macquarie and District Historical Society Inc. $27,500
Lake Macquarie Landcare $7,196
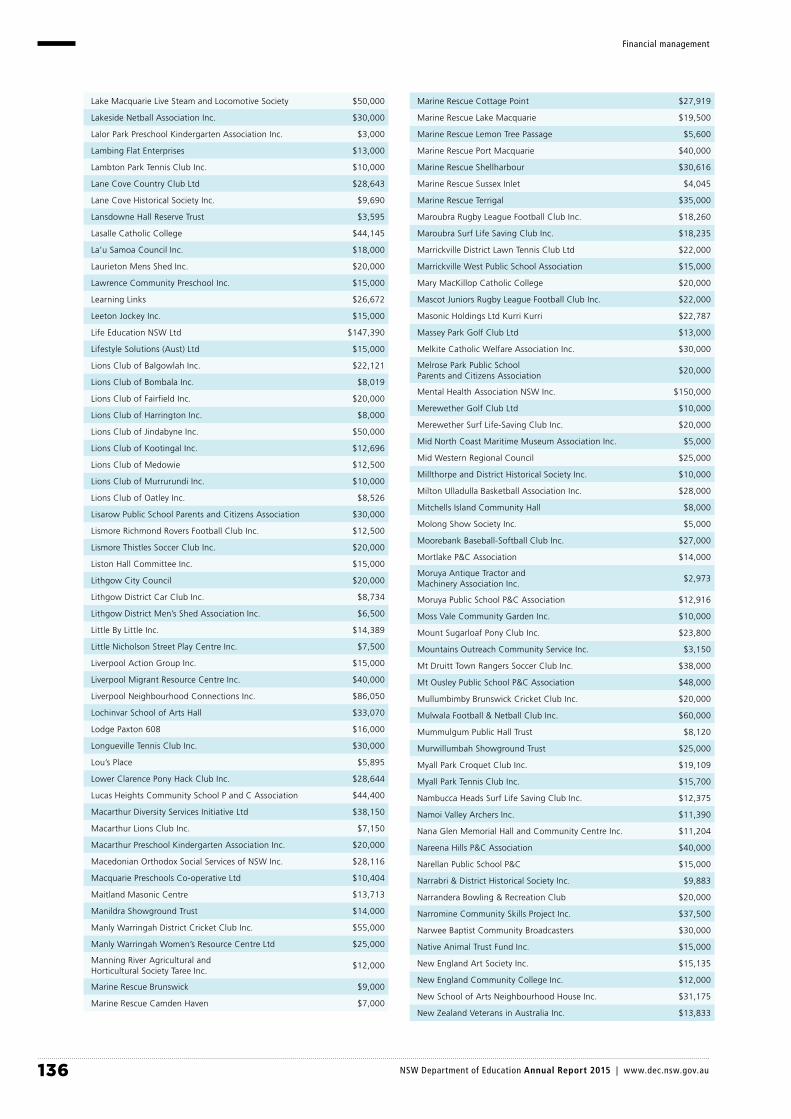
136 NSW Department of Education Annual Report 2015 | www.dec.nsw.gov.au
Financial management
Lake Macquarie Live Steam and Locomotive Society $50,000
Lakeside Netball Association Inc. $30,000
Lalor Park Preschool Kindergarten Association Inc. $3,000
Lambing Flat Enterprises $13,000
Lambton Park Tennis Club Inc. $10,000
Lane Cove Country Club Ltd $28,643
Lane Cove Historical Society Inc. $9,690
Lansdowne Hall Reserve Trust $3,595
Lasalle Catholic College $44,145
La’u Samoa Council Inc. $18,000
Laurieton Mens Shed Inc. $20,000
Lawrence Community Preschool Inc. $15,000
Learning Links $26,672
Leeton Jockey Inc. $15,000
Life Education NSW Ltd $147,390
Lifestyle Solutions (Aust) Ltd $15,000
Lions Club of Balgowlah Inc. $22,121
Lions Club of Bombala Inc. $8,019
Lions Club of Fairfield Inc. $20,000
Lions Club of Harrington Inc. $8,000
Lions Club of Jindabyne Inc. $50,000
Lions Club of Kootingal Inc. $12,696
Lions Club of Medowie $12,500
Lions Club of Murrurundi Inc. $10,000
Lions Club of Oatley Inc. $8,526
Lisarow Public School Parents and Citizens Association $30,000
Lismore Richmond Rovers Football Club Inc. $12,500
Lismore Thistles Soccer Club Inc. $20,000
Liston Hall Committee Inc. $15,000
Lithgow City Council $20,000
Lithgow District Car Club Inc. $8,734
Lithgow District Men’s Shed Association Inc. $6,500
Little By Little Inc. $14,389
Little Nicholson Street Play Centre Inc. $7,500
Liverpool Action Group Inc. $15,000
Liverpool Migrant Resource Centre Inc. $40,000
Liverpool Neighbourhood Connections Inc. $86,050
Lochinvar School of Arts Hall $33,070
Lodge Paxton 608 $16,000
Longueville Tennis Club Inc. $30,000
Lou’s Place $5,895
Lower Clarence Pony Hack Club Inc. $28,644
Lucas Heights Community School P and C Association $44,400
Macarthur Diversity Services Initiative Ltd $38,150
Macarthur Lions Club Inc. $7,150
Macarthur Preschool Kindergarten Association Inc. $20,000
Macedonian Orthodox Social Services of NSW Inc. $28,116
Macquarie Preschools Co-operative Ltd $10,404
Maitland Masonic Centre $13,713
Manildra Showground Trust $14,000
Manly Warringah District Cricket Club Inc. $55,000
Manly Warringah Women’s Resource Centre Ltd $25,000
Manning River Agricultural and Horticultural Society Taree Inc.
$12,000
Marine Rescue Brunswick $9,000
Marine Rescue Camden Haven $7,000
Marine Rescue Cottage Point $27,919
Marine Rescue Lake Macquarie $19,500
Marine Rescue Lemon Tree Passage $5,600
Marine Rescue Port Macquarie $40,000
Marine Rescue Shellharbour $30,616
Marine Rescue Sussex Inlet $4,045
Marine Rescue Terrigal $35,000
Maroubra Rugby League Football Club Inc. $18,260
Maroubra Surf Life Saving Club Inc. $18,235
Marrickville District Lawn Tennis Club Ltd $22,000
Marrickville West Public School Association $15,000
Mary MacKillop Catholic College $20,000
Mascot Juniors Rugby League Football Club Inc. $22,000
Masonic Holdings Ltd Kurri Kurri $22,787
Massey Park Golf Club Ltd $13,000
Melkite Catholic Welfare Association Inc. $30,000
Melrose Park Public School Parents and Citizens Association
$20,000
Mental Health Association NSW Inc. $150,000
Merewether Golf Club Ltd $10,000
Merewether Surf Life-Saving Club Inc. $20,000
Mid North Coast Maritime Museum Association Inc. $5,000
Mid Western Regional Council $25,000
Millthorpe and District Historical Society Inc. $10,000
Milton Ulladulla Basketball Association Inc. $28,000
Mitchells Island Community Hall $8,000
Molong Show Society Inc. $5,000
Moorebank Baseball-Softball Club Inc. $27,000
Mortlake P&C Association $14,000
Moruya Antique Tractor and Machinery Association Inc.
$2,973
Moruya Public School P&C Association $12,916
Moss Vale Community Garden Inc. $10,000
Mount Sugarloaf Pony Club Inc. $23,800
Mountains Outreach Community Service Inc. $3,150
Mt Druitt Town Rangers Soccer Club Inc. $38,000
Mt Ousley Public School P&C Association $48,000
Mullumbimby Brunswick Cricket Club Inc. $20,000
Mulwala Football & Netball Club Inc. $60,000
Mummulgum Public Hall Trust $8,120
Murwillumbah Showground Trust $25,000
Myall Park Croquet Club Inc. $19,109
Myall Park Tennis Club Inc. $15,700
Nambucca Heads Surf Life Saving Club Inc. $12,375
Namoi Valley Archers Inc. $11,390
Nana Glen Memorial Hall and Community Centre Inc. $11,204
Nareena Hills P&C Association $40,000
Narellan Public School P&C $15,000
Narrabri & District Historical Society Inc. $9,883
Narrandera Bowling & Recreation Club $20,000
Narromine Community Skills Project Inc. $37,500
Narwee Baptist Community Broadcasters $30,000
Native Animal Trust Fund Inc. $15,000
New England Art Society Inc. $15,135
New England Community College Inc. $12,000
New School of Arts Neighbourhood House Inc. $31,175
New Zealand Veterans in Australia Inc. $13,833

137 NSW Department of Education Annual Report 2015 | www.dec.nsw.gov.au
Financial management
Newcastle City Council $75,795
Newcastle National Park Croquet Club Inc. $3,000
North Ryde Public School Parents and Citizens Association
$19,890
North Sydney Council $20,000
North Wagga Residents Association Inc. $13,000
Northbridge Progress Association Inc. $20,000
Northern Agricultural Association Inc. $10,000
Northern Lakes Power AFL Inc. $50,000
Northern Suburbs Football Association Inc. $3,400
NSW Spanish and Latin American Association For Social Assistance Inc.
$10,000
Nymboida Canoeing Ltd $8,600
Oberon Golf Club Ltd $20,000
Oberon Junior Rugby League Inc. $10,000
Oberon Show Society Inc. $20,000
Old Junee Progress & Hall Association Inc. $6,230
Oran Park Public School P&C Association $15,000
Orange District Cricket Association Inc. $10,000
Orange Grove P&C Association $24,505
Orange High School P&C Association $25,000
Orange Little Athletics Centre Inc. $6,000
Orange Regional Conservatorium Inc. $13,500
Orara Valley Progress Association Inc. $22,162
Outback Dragons Dubbo Inc. $16,957
Oxley Island Literary Institute Inc. $10,000
Pagewood Botany Football Club Inc. $20,000
Panania North P&C Association $12,000
Parkes Shire Council $30,000
Parramatta City Council $30,000
Parramatta District Men’s Shed Inc. $9,000
Paterson Historical Society Inc. $8,000
Pennant Hills Australian Football Club Inc. $16,000
Pennant Hills High School P & C Association $25,000
Penrith City Council $92,000
Penrith City Softball Association Inc. $28,679
Penrith District Cricket Club Inc. $50,000
Penrith Valley Community Care Inc. $12,847
Phoenix Charlestown Baseball Club Inc. $11,830
Pied Piper Preschool Association (Wallerawang) Inc. $12,940
Pitt Town Parents and Citizens Association $40,000
Police Citizens Youth Clubs (PCYC) State Office $459,938
Polish Association Of Cabramatta Inc. $10,000
Polish Association of Newcastle Inc. $20,000
Port Stephens Church of Christ $6,080
Portland District Motor Sports Club Association Inc. $11,000
Portland Tidy Towns $10,000
Possums’ Den Coffs Harbour Inc. $17,000
Pottsville Beach Primary School P&C Association $89,718
Presbyterian Social Services $10,000
Qbn FM Inc. $35,000
Quest for Life Foundation $5,000
Quirindi Rural Heritage Village Inc. $2,000
Quirindi Tennis Club Ltd $7,000
Radio Skid Row Ltd $17,843
Rebels Netball Club Inc. $11,250
Red Point Artists Association Inc. $10,000
Regional Youth Support Services Inc. $11,992
Resourceful Australian–Indian Network Inc. $30,000
Returned Services League of Australia Branxton Sub Branch
$34,354
Returned Services League of Australia City of Lismore Sub Branch
$25,000
Revesby Public School Parents and Citizens Association $27,000
Rhythm Hut Inc. $7,350
Richmond Branch of the RSL $23,565
Richmond River Gun Club Inc. $6,146
Richmond River Riders Inc. $15,000
Riding For The Disabled Association (NSW) – The Kendall Centre
$2,500
Riding For The Disabled Association (NSW) Young Centre
$15,000
Ringrose Public School Parents and Citizens’ Association
$27,500
Riversmart Australia Ltd $50,000
Riverwood Community Centre Ltd $40,000
Riverwood Squadron, Australian Air League Inc. $45,000
Rockdale Council $87,500
Ronald McDonald Forster Retreat $18,000
Ronald McDonald House Tamworth $13,000
Rose Bay RSL Club Co-op Ltd $50,000
Rosies Place Inc. $10,284
Rotary Club of Concord Inc. $54,210
Rotary Club of Kurrajong North Richmond Inc. $11,225
Rotary Club of Newcastle Enterprise Inc. $11,270
Rotary Club of Taree Inc. $20,000
Rotary Club of Wagga Kooringal Inc. $28,471
Rozelle Public School Parents & Citizens Association $29,949
RSL Young Sub Branch $10,000
Ruse Football Club Inc. $23,430
Russian Orthodox Church (NSW) Property Trust $23,000
Ryde Area Supported Accommodation for Intellectually Disabled (R.A.S.A.I.D.) Inc.
$30,000
Ryde Secondary College Parents and Citizens Association Inc.
$18,000
Sailability NSW Inc. $10,000
Salt Church Inc. $10,000
Sapphire City Concert Band Inverell Inc. $7,937
Sawtell & Districts BMX Club Inc. $30,000
Senior Italian Australian Community Inc. $534
Seventh-Day Adventist Church (North New South Wales Conference) Ltd
$2,438
Seventh-Day Adventist Church North New South Wales Conference
$8,532
Shellharbour Surf Lifesaving Club Inc. $6,000
Sikh Mission Centre Sydney Inc. $33,000
Singleton Clay Target Club Inc. $5,000
Singleton Historical Society and Museum Inc. $5,000
Singleton Men’s Shed Association Inc. $8,000
Sir Roden and Lady Cutler Foundation Inc. $25,000
Smithfield Baptist Church $25,000
Snowy River Shire Council $15,000
Softball Campbelltown Inc. $28,160
Soldiers Point Public School P&C Association $55,500
South Eastern Sydney Medicare Local Ltd $27,720
South Maroubra Surf Life Saving Club Inc. $27,595
Southern Highlands Botanic Gardens Ltd $20,000

138 NSW Department of Education Annual Report 2015 | www.dec.nsw.gov.au
Financial management
Southern Highlands Christian School Ltd $5,380
Southlakes Carers Inc. $10,000
Spring Plains Public Hall Trust $7,850
Springdale Heights Preschool Inc. $20,000
Sridurgadevi Devasthanam $16,483
St Agathas Catholic Primary School Pennant Hills $9,550
St Anthony’s Family Care $43,772
St Bernadette’s Catholic Church Dundas Valley $25,000
St Bernadette’s Primary School $15,000
St Clair Junior Cricket Club Inc. $27,542
St Clair United Soccer Club Inc. $15,000
St Davids Uniting Church Haberfield $9,878
St Declans Catholic Church Penshurst $10,000
St Euphemia College $40,000
St George Maronite Catholic Parish Thornleigh $8,750
St John the Baptist Serbian $30,000
St Joseph’s Primary School $10,000
St Marys Rugby League Club Ltd $45,540
St Peter & Paul Antiochian Orthodox Church $83,047
St Peters Anglican Church East Maitland $4,840
St Vincent De Paul Society NSW $35,000
St. George Preschool (Marsfield) Inc. $8,500
Stockton Tennis Club Inc. $10,000
Stuarts Point & District Tennis Club Inc. $27,765
Sunnyfield $112,588
Surf Life Saving Illawarra Inc. $24,000
Sussex Inlet Men’s Shed Inc. $18,080
Sutherland Shire Netball Association Inc. $60,000
Sutton & District Community Association Inc. $5,000
Swansea RSL Sub Branch $25,000
Sydney Jewish Museum $28,157
Sylvania Heights Public School Parents & Citizens Association
$30,000
Sylvanvale Foundation $11,925
Tacoma Public School P&C Association $26,196
Tamarama Surf Life Saving Club Inc. $60,000
Tamworth Community Men’s Shed Inc. $11,915
Tamworth Regional Council $15,000
Tanilba Bay Sailing Club Inc. $20,280
Taralga Sports Club Ltd $6,620
Taree Amateur Swimming Club Inc. $4,000
Tea Gardens Hawks Nest Meals on Wheels Inc. $1,796
Temora Lutheran Community Church $10,000
Tennis Club of Yerong Creek Inc. $40,000
Tennis New South Wales Ltd $20,000
Terrigal Trojan Rugby Club Inc. $14,498
The Australasian Order Of Old Bastards $9,500
The Benevolent Society $30,000
The Berrima Court House Trust $20,000
The Botany Golf Club Ltd $30,000
The Burdekin Association Inc. $35,000
The Disability Trust $20,000
The Forest Clay Target Club Inc. $19,790
The Greek Community of Newcastle Ltd $20,000
The Greek Orthodox Community Of NSW Ltd $40,000
The Hellenic Orthodox Community of Parramatta and Districts
$35,000
The Joseph Varga School $40,000
The Judge Rainbow Memorial Fund Inc. $17,438
The Junction Neighbourhood Centre Inc. $20,162
The Junction Works Ltd $44,310
The Lakes Surf Life Saving Club Ltd $30,000
The Nambucca Valley Arts Council Inc. $12,000
The National Trust Of Australia (NSW) $26,311
The North Coast National Agricultural and Industrial Society Inc.
$35,000
The Old Bar Soldiers’ Memorial Hall Inc. $5,500
The Pastoral & Agricultural Society of Deniliquin Ltd $9,772
The Point Preschool Inc. $15,130
The Rock Yerong Creek Football Netball Club Inc. $35,000
The Salvation Army Property Trust $23,000
The Scout Association Of Australia, New South Wales Branch
$423,573
The Shepherd Centre $40,395
The Ted Noffs Foundation Inc. $23,000
The Toukley & District Senior Citizens Club Inc. $11,637
Thornleigh Soccer Club $9,000
Tinonee Historical Society Inc. $6,000
Tirkandi Inaburra Cultural & Development Centre Inc. $20,000
Toronto Croquet Club Inc. $5,530
Tribal Warrior Association Inc. $20,000
Tripoli & Mena Association Ltd $25,000
Trustees of Bunnan Memorial Hall $2,000
Trustees of Church Property for the Diocese of Newcastle
$36,373
Trustees of the Marist Fathers Province of Australia $40,000
Trustees Of The Roman Catholic Church For The Diocese Of Broken Bay
$27,500
Tuggerah Lakes Secondary College Berkeley Vale Campus Parents & Citizens’ Association
$25,000
Tuggerah Public School Parents and Citizens Association
$32,000
Tuggerawong Public School P&C Association $28,000
Tuross Head Men’s Shed Inc. $6,000
Tweed Heads Croquet Club Inc. $10,000
Tweed Heads Tennis Club Inc. $17,094
Tweed United Football Club Inc. $56,243
Tweed Valley Neighbourhood Watch Inc. $1,426
Twin Towns Radio Yacht Club Inc. $19,800
Twyford Hall Inc. $50,000
Tyalgum Community Hall Association Inc. $5,000
Tyringham Rural Fire Service $10,500
UCA – Holroyd Church $50,000
UCA – Lismore Regional Mission $8,000
UCA – Orange Parish $10,000
UCA – Quakers Hill $23,000
UCA – Sydney Cheil Uniting Church $25,000
UCA – Tahmoor/Yanderra $10,000
UCA Campsie Earlwood Parish $20,000
UCA Lifeline Newcastle & Hunter $16,445
UCA St Johns Child Care Centre $20,000
Ulmarra Show Society and Campdraft Committee $18,000
Ungarie War Memorial Hall Inc. $7,600
United Hospital Auxiliaries of NSW Inc. $7,742
Uniting Church In Australia Camden $15,000
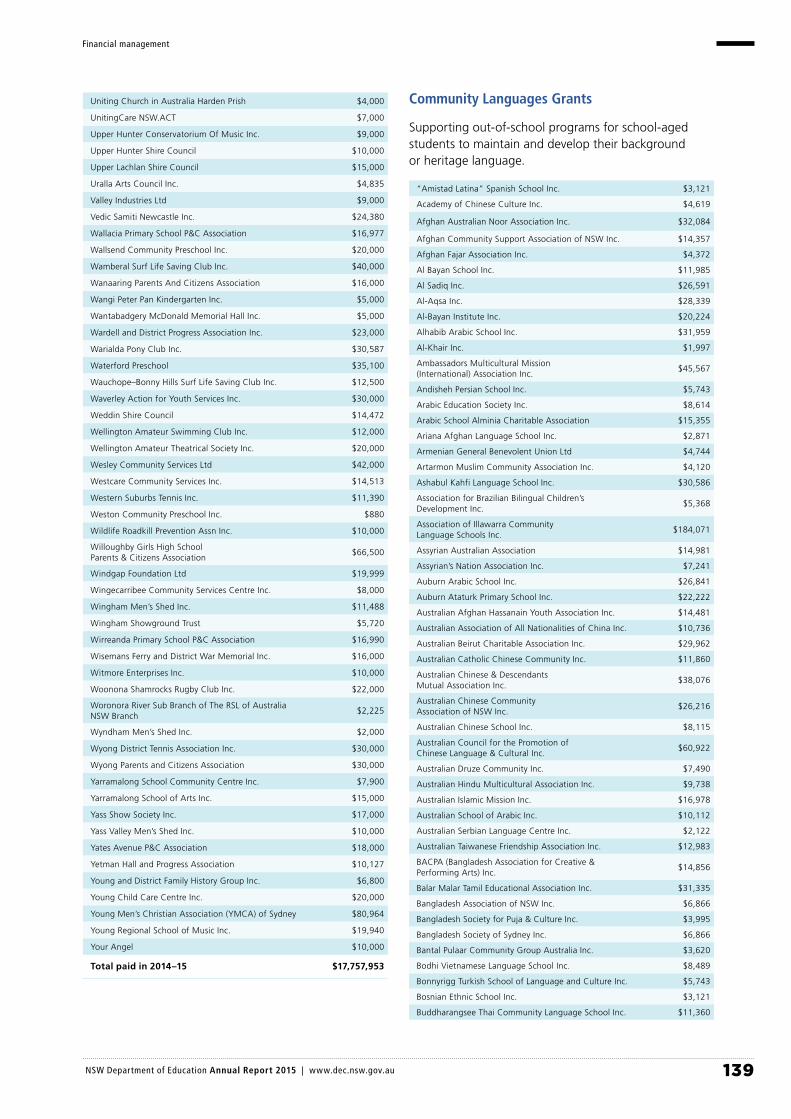
139 NSW Department of Education Annual Report 2015 | www.dec.nsw.gov.au
Financial management
Uniting Church in Australia Harden Prish $4,000
UnitingCare NSW.ACT $7,000
Upper Hunter Conservatorium Of Music Inc. $9,000
Upper Hunter Shire Council $10,000
Upper Lachlan Shire Council $15,000
Uralla Arts Council Inc. $4,835
Valley Industries Ltd $9,000
Vedic Samiti Newcastle Inc. $24,380
Wallacia Primary School P&C Association $16,977
Wallsend Community Preschool Inc. $20,000
Wamberal Surf Life Saving Club Inc. $40,000
Wanaaring Parents And Citizens Association $16,000
Wangi Peter Pan Kindergarten Inc. $5,000
Wantabadgery McDonald Memorial Hall Inc. $5,000
Wardell and District Progress Association Inc. $23,000
Warialda Pony Club Inc. $30,587
Waterford Preschool $35,100
Wauchope–Bonny Hills Surf Life Saving Club Inc. $12,500
Waverley Action for Youth Services Inc. $30,000
Weddin Shire Council $14,472
Wellington Amateur Swimming Club Inc. $12,000
Wellington Amateur Theatrical Society Inc. $20,000
Wesley Community Services Ltd $42,000
Westcare Community Services Inc. $14,513
Western Suburbs Tennis Inc. $11,390
Weston Community Preschool Inc. $880
Wildlife Roadkill Prevention Assn Inc. $10,000
Willoughby Girls High School Parents & Citizens Association
$66,500
Windgap Foundation Ltd $19,999
Wingecarribee Community Services Centre Inc. $8,000
Wingham Men’s Shed Inc. $11,488
Wingham Showground Trust $5,720
Wirreanda Primary School P&C Association $16,990
Wisemans Ferry and District War Memorial Inc. $16,000
Witmore Enterprises Inc. $10,000
Woonona Shamrocks Rugby Club Inc. $22,000
Woronora River Sub Branch of The RSL of Australia NSW Branch
$2,225
Wyndham Men’s Shed Inc. $2,000
Wyong District Tennis Association Inc. $30,000
Wyong Parents and Citizens Association $30,000
Yarramalong School Community Centre Inc. $7,900
Yarramalong School of Arts Inc. $15,000
Yass Show Society Inc. $17,000
Yass Valley Men’s Shed Inc. $10,000
Yates Avenue P&C Association $18,000
Yetman Hall and Progress Association $10,127
Young and District Family History Group Inc. $6,800
Young Child Care Centre Inc. $20,000
Young Men’s Christian Association (YMCA) of Sydney $80,964
Young Regional School of Music Inc. $19,940
Your Angel $10,000
Total paid in 2014–15 $17,757,953
Community Languages Grants
Supporting out-of-school programs for school-aged students to maintain and develop their background or heritage language.
“Amistad Latina” Spanish School Inc. $3,121
Academy of Chinese Culture Inc. $4,619
Afghan Australian Noor Association Inc. $32,084
Afghan Community Support Association of NSW Inc. $14,357
Afghan Fajar Association Inc. $4,372
Al Bayan School Inc. $11,985
Al Sadiq Inc. $26,591
Al-Aqsa Inc. $28,339
Al-Bayan Institute Inc. $20,224
Alhabib Arabic School Inc. $31,959
Al-Khair Inc. $1,997
Ambassadors Multicultural Mission (International) Association Inc.
$45,567
Andisheh Persian School Inc. $5,743
Arabic Education Society Inc. $8,614
Arabic School Alminia Charitable Association $15,355
Ariana Afghan Language School Inc. $2,871
Armenian General Benevolent Union Ltd $4,744
Artarmon Muslim Community Association Inc. $4,120
Ashabul Kahfi Language School Inc. $30,586
Association for Brazilian Bilingual Children’s Development Inc.
$5,368
Association of Illawarra Community Language Schools Inc.
$184,071
Assyrian Australian Association $14,981
Assyrian’s Nation Association Inc. $7,241
Auburn Arabic School Inc. $26,841
Auburn Ataturk Primary School Inc. $22,222
Australian Afghan Hassanain Youth Association Inc. $14,481
Australian Association of All Nationalities of China Inc. $10,736
Australian Beirut Charitable Association Inc. $29,962
Australian Catholic Chinese Community Inc. $11,860
Australian Chinese & Descendants Mutual Association Inc.
$38,076
Australian Chinese Community Association of NSW Inc.
$26,216
Australian Chinese School Inc. $8,115
Australian Council for the Promotion of Chinese Language & Cultural Inc.
$60,922
Australian Druze Community Inc. $7,490
Australian Hindu Multicultural Association Inc. $9,738
Australian Islamic Mission Inc. $16,978
Australian School of Arabic Inc. $10,112
Australian Serbian Language Centre Inc. $2,122
Australian Taiwanese Friendship Association Inc. $12,983
BACPA (Bangladesh Association for Creative & Performing Arts) Inc.
$14,856
Balar Malar Tamil Educational Association Inc. $31,335
Bangladesh Association of NSW Inc. $6,866
Bangladesh Society for Puja & Culture Inc. $3,995
Bangladesh Society of Sydney Inc. $6,866
Bantal Pulaar Community Group Australia Inc. $3,620
Bodhi Vietnamese Language School Inc. $8,489
Bonnyrigg Turkish School of Language and Culture Inc. $5,743
Bosnian Ethnic School Inc. $3,121
Buddharangsee Thai Community Language School Inc. $11,360

140 NSW Department of Education Annual Report 2015 | www.dec.nsw.gov.au
Financial management
Bulgarian Cultural and Social Association “Rodina” Inc.
$2,497
Cabramatta West Spanish School Inc. $2,996
Campbelltown Bangla School Inc. $11,735
Carlingford Chinese Language School Inc. $8,115
Central Council of Croatian Ethnic Schools of NSW Inc.
$29,587
Chanh Phap Vietnamese Buddist Youth Association of NSW Inc.
$6,866
Chen Feng Chinese Language College Inc. $2,750
Cherrybrook Chinese Community Association Inc. $8,364
Chinese Australian Services Society Ltd $25,842
Chinese Catholic Community Inc. $17,977
Chinese Language & Literature Association $1,997
Clemton Park School Chinese Language and Culture Association Inc.
$6,492
Co. As. It. Italian Association of Assistance $38,700
Community Education & Services Centre Inc. $8,364
Czech and Slovak School of Sydney Inc. $4,245
Darfur Community Social and Cultural Association in NSW Inc.
$2,500
Darr Al Nour Inc. $17,602
Datong Chinese School Eastern Suburbs Inc. $4,120
Datong Chinese School Inc. $47,939
De Nederlandse School De Kangoeroe Inc. $19,725
Der-Huy Chinese School Inc. $13,982
Disciples Church Joyful Korean Language School Inc. $5,243
Dundas Chinese School Inc. $4,245
Eastern Suburbs Russian School Inc. $5,118
Eastlakes Saturday Turkish School Inc. $5,867
Eastwood Tamil Study Centre Inc. $7,366
Escuela Latinoamericana Central Oeste (Latin American School of the Inner West) Inc.
$1,623
Fairfield Heights Vietnamese Parent Committee Inc. $4,369
Forest Japanese School Inc. $2,500
Free Serbian Orthodox Church St George Cabramatta $12,609
Free Serbian Orthodox Church St John the Baptist $8,377
GDPT Bo Be Minh Quang The Vietnamese Buddhist Youth of NSW Australia Inc.
$12,734
German Saturday School Sydney Inc. $3,995
Goulburn Chinese Language School Inc. $1,873
Grace Chinese Christian Church Ltd $7,990
Greek Community of Mascot and District Inc. $6,367
Greek Orthodox Archdiocese of Australia $47,564
Greek Orthodox Church & Community of Bankstown District St Euphemia Ltd
$8,115
Greek Orthodox Church & Community of Leichhardt & District of St Gerasimos
$14,481
Greek Orthodox Community of Albury District Inc. $749
Greek Orthodox Community of NSW Ltd $69,161
Greek Orthodox Parish & Community of Belmore & District All Saints Ltd
$6,991
Greek Orthodox Parish & Community Of Kogarah & District
$45,317
Greek Orthodox Parish of Northern & Western Suburbs $14,856
Greek Orthodox Parish of St George Rose Bay $4,994
Greek Orthodox Parish of St Nicholas of Marrickville $7,366
Greek Sunday School of Canterbury & Surrounding Districts Inc.
$2,122
Hamazkaine Armenian Educational and Cultural Society Regional Committee Inc.
$30,586
Hanaro Korean School Inc. $3,745
Hanyulink Chinese Language School Inc. $2,500
Happy Chinese Language Association Inc. $9,113
Hellenic Centre For Language & Culture Of Australia Inc.
$20,848
Hellenic Orthodox Community of Kingsgrove Bexley North Beverley Hills & Districts Ltd
$22,721
Hellenic Orthodox Community of Parramatta and Districts
$4,245
Hellenic Orthodox Parish & Community of Blacktown & District Ltd
$9,363
Hornsby Chinese Education Centre Inc. $14,107
Hornsby Chinese Language and Culture School Inc. $43,694
Hornsby Japanese School Inc. $4,994
Hua Xia Chinese Culture School Inc. $25,967
Hungarian School Flemington Inc. $5,368
Huyen Quang Buddhist Youth Association Inc. $8,614
I.S. Educational Association Inc. $13,982
Illawarra Islamic Social Association Inc. $7,241
Illawarra Japanese School Inc. $2,500
Illawarra Persian Language School Inc. $2,500
Imam Ali Arabic School Inc. $32,084
Inderjeet Singh Virdi Australian Sikh Association Inc. $26,092
Indo-Australia Balbharati Vidyalaya Hindi School Inc. $10,915
International Youth Fellowship Inc. $1,873
Iranian Educational and Cultural Centre Inc. $5,618
Islamic Charity Projects Association Inc. $61,172
Islamic Women’s Welfare Association Inc. $25,842
Japan Club of Sydney (JCS) Inc. $23,345
Japanese Sunday School Inc. $9,987
Kandiah Nithiyananthan Newcastle Tamil Sangam Inc. $2,122
Khmer Adventist Language School Association Inc. $7,615
Khmer Community of NSW Inc. $14,606
Korean Catholic Language School Inc. $33,832
Korean Chaplaincy of Diocese of Parramatta $7,241
Lakemba Bangladesh School Inc. $7,366
Lao Community Advancement NSW Co-Operative Ltd $9,862
Lebanese Arabic School Inc. $92,007
Lindfield Korean School Inc. $25,093
Liverpool Polish Saturday School Inc. $6,242
Looyce Armenian School Inc. $2,746
Macedonian School Council of NSW Inc. $16,604
Maltese Community Council of NSW Inc. $2,122
Maroubra Chinese School Inc. $9,238
Maroubra Russian School Inc. $5,992
Marrickville West Turkish School Inc. $6,117
Matraville Saturday Turkish Ethnic School Inc. $2,871
Ming-Der Chinese School Inc. $69,661
Minghui School Inc. $5,618
Moslem Alawy Society Ltd $13,358
Mount Druitt Tamil Study Centre $10,112
Muhammadi Welfare Association Inc. $2,500
Muslim Women’s Association $23,345
Nan Tien Temple $5,368
Nepean Turkish School Inc. $2,996
North Shore Japanese School Inc. $5,368
NSW Board Of Jewish Education $17,977
NSW Federation of Community Language Schools Inc. $108,489
NSW Indo-China Chinese Association Inc. $56,428
NSW Japanese School Inc. $9,238
NSW Turkish Educational & Cultural Association Inc. $12,859
NSW Vinh Khang Chinese School Inc. $34,206
Parramatta Hanguel School Inc. $6,117
Parramatta Persian Primary & High School Inc. $6,871

141 NSW Department of Education Annual Report 2015 | www.dec.nsw.gov.au
Financial management
Pei Ji Chinese School Inc. $23,220
Pelangi Indonesia – Indonesian Language School Program
$3,870
Phap Bao Buddhist Youth Language School Inc. $10,736
Philippine Language and Cultural Association of Australia, Inc.
$1,124
Polish Educational Society in NSW Inc. $8,988
Portuguese Community Schools of Sydney Inc. $9,862
Portuguese Ethnic Schools Association of Australia Inc. $4,245
Presbyterian Church (NSW) Property Trust $25,592
Preserving The Arabic Language In Australia (PAL) Inc. $6,242
Qing Hua Chinese Language School Inc. $99,872
Queanbeyan Community Chinese Language School $1,623
Sabdamala – Nepalese Language School Inc. $5,743
SAE Soon Korean School $36,204
Sanatan Religious & Cultural Association NSW Inc. $12,109
School of Vedic Sciences (Aust) Inc. $5,992
Seventh-Day Adventist Church (Greater Sydney Conference) Ltd
$2,500
Sikh Khalsa Mission Inc. $3,371
Sikh Mission Centre Sydney Inc. $3,371
Somang Korean Language School Inc. $3,496
South Coast Portuguese Association Ltd $1,873
Sri Guru Singh Sabah Sydney (The Sik Association of Sydney) Inc.
$12,359
St Alexander Nevsky Russian School Inc. $18,355
St Andrew Bogolubsky Russian Ethnic School Inc. $4,369
St Andrews Ukrainian Ethnic School $5,867
St Charbel’s Ethnic School $5,992
St George School of Russian Association Inc. $2,247
St George Spanish School Inc. $3,745
St Lazarus Serbian Orthodox Church $13,982
St Nicholas Antiochian Orthodox Church $12,484
St Nicholas School of Russian Association Inc. $8,739
St Raphael’s Greek Orthodox Parish of Liverpool and District Ltd
$8,489
St Sava Serbian Orthodox Church School – Flemington $4,744
St Seraphim Russian Community School Hornsby Inc. $5,992
St Thomas the Apostle Chaldean Catholic Church $25,717
Sunshine Chinese School Inc. $5,992
Sutherland Shire Chinese Language School Inc. $10,237
Swedish School In Sydney Inc. $14,232
SWS Childrens Chinese School Association $3,995
Sydney Cheil Church Korean School Inc. $7,366
Sydney Chinese School Inc. $51,933
Sydney Elite Chinese School Inc. $31,585
Sydney Full Gospel Church Properties Inc. $37,327
Sydney Juan Church Language School Inc. $2,996
Sydney Korean Church Korean Language School Inc. $12,609
Sydney Korean Uniting Church $5,743
Sydney Latvian Society Ltd $3,246
Sydney Punjabi Society Inc. $2,497
Sydney Saturday School of Japanese Inc. $36,828
Sydney Suomi-Koulu/Sydney Finnish School Inc. $2,372
Sydney Yu Cai Chinese Language School Inc. $53,681
Tamil Civic Centre (TCC) Inc. $3,121
Tamil Study Centre Homebush Inc. $38,956
Telugu Association Inc. $1,499
Teng Fei Chinese Language Institute $9,238
Thai Education Centre of Australia $4,869
The Arabic Australian Education Centre Inc. $18,102
The Association of Bhanin El-Minieh Welfare Centre Inc.
$26,965
The Australia Korean School Inc. $21,348
The Australian Arabic Association of Western Sydney Inc.
$13,108
The Australian Confucius-Mencius Morality Society Inc. $5,618
The Fraternal Society of Tripoli Andmena Districts Ltd $16,479
The Greek Orthodox Church and Society of the City of Greater Wollongong
$5,368
The Greek Orthodox Parish & Community of Burwood & District of St. Nectarios Ltd
$7,241
The Greek Orthodox Parish of South East Sydney $10,487
The Hills Chinese School Inc. $24,843
The Hunter Parents and Teachers Association of Community Language Schools Inc.
$131,997
The Lebanese Moslem Association $120,845
The Polish Association in Wollongong Inc. $2,122
The Polish School of Sydney Inc. $5,743
The Sabian Mandaean Association in Australia Ltd $8,988
The Sinhalese Cultural Forum of NSW Australia Inc. $24,968
The Tue Thanh Viet Tu Alumni Association Aust. Inc. $5,493
Tibetan Community of Australia (NSW) Inc. $4,494
Timor Chinese Association of NSW $4,994
Tongan Language School Inc. $4,619
Trustees of the Roman Catholic Church for the Diocese of St. Maroun Sydney
$28,588
Tzu-Chi Academy Australia Inc. $14,981
United Ethnic Education Centre Inc. $6,242
Uruguay School of Spanish Language Inc. $4,494
Victory Mandarin School Association Inc. $5,992
Vietnamese Community in Wollongong Inc. $3,745
Vietnamese Cultural Schools Association Inc. $250,928
Vietnamese Parents & Citizens Association Inc. $75,279
Vietnamese Parents’ Committee Green Valley Inc. $33,956
Vishva Hindu Parishad of Australia Inc. $13,483
Wentworthville Tamil Study Centre Inc. $51,809
Western Sydney Chinese School Inc. $8,614
Western Sydney Somaliland Community Inc. $7,990
Western Sydney Urdu School Inc. $6,741
Woo-Ri Full Gospel Church Inc. $10,112
Wubuli Maimati $2,124
Yagoona Arabic School Inc. $16,104
Yiu Wah Chinese School Inc. $10,487
Total paid in 2014–15 $4,338,527
Cultural Events and Festivals
A range of cultural festivals, events and activities that support Aboriginal cultural expression, increase community awareness and appreciation of Aboriginal culture and history, and help reconciliation between Aboriginal and non-Aboriginal communities.
Aboriginal Disability Network NSW Inc. $3,000
Australian Indigenous Oztag Association Inc. $15,000
Bogan River Peak Hill Wiradjuri Aboriginal Corporation $5,000
Gadigal Information Service Aboriginal Corporation $15,000
Illawarra Local Aboriginal Land Council $3,000
Mudgin-Gal Aboriginal Corporation $2,727

142 NSW Department of Education Annual Report 2015 | www.dec.nsw.gov.au
Financial management
National Aboriginal & Islander Skills Development Association (NAISDA) Ltd
$22,727
Nowra Youth Services Inc. $3,000
Police Citizens Youth Clubs (PCYC) NSW Ltd Mt Druitt $5,000
Saltwater Freshwater Arts Alliance Aboriginal Corporation
$15,000
Tamworth Local Aboriginal Land Council $5,000
Wellington Health Service $10,000
Total paid in 2014–15 $104,455
Early Childhood Education and Care Grants
Providing support for preschools, long day care, vacation care, occasional care, early childhood services, sector development and support for children with additional needs.
3Bridges Community Inc. $15,370
Abbotsford Community Centre Inc. $7,511
Abbotsford Long Day Care Centre Inc. $35,254
Abercrombie Street Child Care Ltd $46,505
Aberdare Preschool Inc. $306,910
Aberdeen Preschool Association Inc. $202,016
Adamstown Community Early Learning and Preschool Inc.
$36,079
Adelong Preschool Inc. $170,129
Adventureland Preschool Inc. $143,728
Aid Migrants of Spanish Speaking Co Operative Ltd $22,088
Albury City Council $107,165
Albury Occasional Childcare and Early Learning Centre Association Inc.
$83,027
Albury Preschool Inc. $304,343
Alcheringa Preschool Association Inc. $278,428
All Saints Preschool Albion Park Inc. $149,190
Alstonville Community Preschool Inc. $387,665
Amy Hurd Early Learning Centre Inc. $31,579
Anglicare Canberra and Goulburn $292,057
Annandale North Out of School Hours Care Association
$9,498
Annettte’s Place Inc. $168,080
Anzac Village Preschool Association Inc. $231,789
Arabic Australian Child Care Centre $31,683
Arden Anglican Preschool Kindergarten $75,534
Ariah Park Preschool Association Inc. $110,036
Armidale and Region Aboriginal Cultural Centre and Keeping Place Inc.
$10,219
Armidale Community Preschool Inc. $266,328
Armidale Ex-Services Memorial Club $28,164
Armidale Montessori Preschool Inc. $94,999
Armidale Toy Library Inc. $25,479
Arncliffe Preschool Inc. $265,196
Arndu St Paul’s Preschool Association Inc. $232,974
Ashfield Baptist Childcare Inc. $17,321
Ashmont Preschool Inc. $37,610
Auburn City Council $53,512
Austral Community Preschool Inc. $188,022
Australian Anatolian Community Services Co-op Ltd $41,690
Auswide Services Ltd $7,350
Avalon School Parents & Citizens Association Inc. $12,262
Awabakal Ltd $358,975
Bain Park Community Preschool Inc. $15,348
Ballina Fox Street Preschool Inc. $347,948
Ballina River Street Children’s Centre Inc. $312,340
Balmain Children’s Centre Ltd $41,857
Balmain East Out of School Care Inc. $6,476
Balranald Early Learning Centre Inc. $37,487
Bambi Kindergarten Association Inc. $228,281
Bangalow Community Children’s Centre Inc. $56,263
Bankstown Community Resource Group Inc. $217,633
Bankstown Handicapped Childrens Centre Association (BHCCA) Inc.
$39,892
Bankstown Montessori Association Inc. $115,446
Baradine Preschool Inc. $108,454
Barham Preschool Association Inc. $184,106
Barnardos Australia $48,785
Barraba Preschool Inc. $189,239
Bathurst Regional Council $74,221
Batlow Apple Tree Learning Centre Co-operative Ltd $29,575
Baulkham Hills Before & After and Vacation Care $16,833
Baulkham Hills Preschool Kindergarten Inc. $146,844
Beacon Hill Community Kindergarten Association Ltd $182,876
Bega Preschool Association Inc. $408,797
Bega Valley Shire Council $548,627
Bellbird Preschool Inc. $168,423
Bellingen Preschool Inc. $233,954
Belmont North Preschool Inc. $252,177
Bendemeer Preschool Inc. $35,723
Bentley Community Preschool Inc. $62,481
Berala Jack & Jill Preschool Kindergarten Inc. $401,337
Beresfield Community Children’s Education Centre $44,345
Berkeley Vale Neighbourhood Centre Inc. $12,299
Berkeley Vale Preschool Kindergarten Inc. $384,757
Bermagui Preschool Co-Operative Society Ltd $225,111
Berrigan Children’s Centre Association Inc. $26,737
Berry Community Preschool Inc. $132,807
Betty Spears Child Care Centre Ltd $68,925
Bexley Jack & Jill Preschool Inc. $251,321
Big Fat Smile Group Ltd $2,861,826
Bilambil Community Preschool & OOSH Inc. $187,032
Binnaway Preschool Inc. $55,692
Binnowee Kindergarten Co-operative Society Ltd $150,948
Biralee Preschool Finley Inc. $412,886
Birrahlee Kindergarten $346,528
Birralee Longday Care Centre Inc. $40,825
Birrelee Multi Functional Aboriginal Children’s Service Aboriginal Corp
$33,859
Birubi Point Community Preschool Inc. $180,211
Blackheath Area Neighbourhood Centre Inc. $5,633
Blackheath Kookaburra Kindergarten Inc. $218,614
Blacktown Anglican Child Care Centre Inc. $37,312
Blacktown Bunyip Inc. $175,563
Blacktown City Council $1,369,450
Blacktown South Children’s Activities Centre Inc. $12,609
Bland Shire Council $461,580
Blaxland Preschool Kindergarten $275,514
Blayney Preschool Inc. $217,347
Bligh Park Community Services Inc. $15,255
Blinky Bill Portland Child Care Centre Inc. $146,656
Blue Gum Montessori Children’s House Inc. $107,983
Blue Mountains Steiner Wattle Glow Preschool $86,792

143 NSW Department of Education Annual Report 2015 | www.dec.nsw.gov.au
Financial management
Bolton Point Child Care Centre Inc. $36,648
Bombala Preschool Inc. $122,378
Bondi Beach Cottage Inc. $77,079
Boolaroo-Speers Point Community Kindergarten Inc. $287,365
Boori Preschool Aboriginal Corporation $84,323
Boorowa Preschool Centre Inc. $207,979
Botany Bay City Council $76,862
Bourke & District Children’s Services Inc. $337,762
Bowraville Community Preschool Inc. $227,751
Bradbury Preschool Kindergarten Association Inc. $334,312
Braidwood Preschool Association Inc. $178,042
Branxton Preschool Inc. $322,018
Brayside Community Preschool Inc. $328,429
Brewarrina Shire Council $16,351
Broken Hill Happy Day Preschool Kindergarten Inc. $358,598
Bronte Activity Centre Inc. $9,255
Budgewoi Halekulani Preschool Kindergarten Inc. $302,274
Bulahdelah Preschool Inc. $142,387
Bundarra Preschool Kindergarten Association Inc. $89,639
Bundeena Maianbar Preschool and Children’s Services Inc.
$107,429
Bundgeam Preschool Inc. $61,472
Bungendore Preschool Association Inc. $168,420
Bunya Child Care Centre Inc. $34,525
Bunyip Preschool Harden Inc. $93,231
Burren Junction Preschool Association Inc. $67,644
Burrumbuttock Preschool Centre Inc. $95,056
Burwood Neighbourhood Child Care Co-op Ltd $32,227
Byron Bay Preschool Inc. $452,491
Byron Shire Council $71,175
Cabarita Mortlake Kindergarten Association Inc. $162,239
Cabramatta Community Centre Inc. $223,290
Calrossy Anglican School Board $164,811
Camden Community Connections Inc. $35,112
Camden Council $65,054
Camden Preschool Kindergarten Co-operative Ltd $200,793
Cameragal Montessori School $113,696
Campbell Page Ltd $145,412
Campbell Street Children’s Centre $46,081
Campbelltown City Council $541,745
Campbelltown Community Preschool Inc. $258,789
Campbelltown Presbyterian Community Child Care Centre
$35,056
Camperdown Child Care Centre $38,899
Canowindra Preschool Kindergarten Inc. $220,246
Canterbury Children’s Cottage $28,722
Canterbury City Council $255,636
Canterbury Community Child Care Centre Inc. $192,839
Cardiff Community Preschool Inc. $161,681
Cardiff Early Education & Care Centre Inc. $43,498
CareWest Ltd $1,687,514
Carinya Neighbourhood Children’s Centre Inc. $87,970
Carlingford West Kindergarten Inc. $106,373
Carlingford West OOSH Centre Inc. $16,833
Casino Baptist Church Christian Community Preschool $392,750
Castle Hill Preschool Kindergarten Inc. $155,192
Caterpillar House Occasional Child Care Association Inc.
$85,854
Catherine Field Preschool Kindergarten Inc. $145,558
Catholic Education Office Diocese of Parramatta $940,898
CatholicCare $64,735
CatholicCare, Diocese of Broken Bay $763,720
Cawongla Playhouse Inc. $121,337
Centipede at Glebe School Inc. $24,649
Central Shoalhaven Mobile Preschool Unit Inc. $304,515
Central West Family Support Group Inc. $4,961
Cessnock Multi Purpose Children’s Centre Ltd $124,571
Channon Children’s Centre $93,246
Charlestown Child Care & Early Learning Centre $33,265
Chatswood Occasional Child Care Centre Inc. $63,721
Cherrybrook Community Preschool Inc. $97,974
Chester Hill Neighbourhood Centre Inc. $17,721
Child and Family Services Wyong Shire Inc. $38,381
Children First Inc. $1,637,583
Children’s House Montessori School $95,014
Children’s Services Community Management Ltd $373,296
Chillingham and Tyalgum Community Preschool Inc. $138,474
Chinese Australian Services Society Ltd $48,075
Christ Church Gladesville Preschool Kindergarten Inc. $274,963
Christ Church St Ives Preschool Inc. $131,005
Church of England Childrens Homes $81,376
City of Sydney Council $552,541
Clarence Valley Council $13,380
Clovelly Child Care Centre Inc. $39,782
Clovelly Out of School Care $8,406
Clunes Community Preschool Association Inc. $135,201
Coastwide Child & Family Services Inc. $51,175
Cobar Mobile Children’s Services Inc. $296,653
Cobar Preschool Association Inc. $341,573
Cobargo Preschool Inc. $176,200
Coffs Harbour Preschool Association Inc. $292,714
Coldstream Community Preschool Inc. $198,864
Coleambally Preschool Association Kindergarten Inc. $200,715
Collarenebri Preschool Inc. $116,177
Collaroy Plateau Community Kindergarten Inc. $183,572
Comboyne Community Preschool Kindergarten Inc. $57,435
Community Activities Lake Macquarie Inc. $8,437
Community Child Care Co-operative Ltd $568,559
Community Connections Solutions Australia Inc. $87,116
Community First Step $280,000
Community Programs Inc. $81,228
Como Preschool Kindergarten Association Inc. $174,168
Concord Kindergarten Association Inc. $201,446
Concord Occasional Child Care Inc. (Concord Cubby) $49,132
Concord West-Rhodes Preschool Inc. $209,033
Condobolin Preschool Kindergarten Inc. $224,954
Connect Child and Family Services Inc. $164,359
Coogee Care Centre $4,332
Coogee Synagogue Batory Kindergarten Inc. $16,694
Cooks Hill Community Preschool Inc. $92,193
Coolah Preschool Kindergarten Inc. $183,314
Coolamon Preschool Association Inc. $174,913
Coolamon Shire Council $80,233
Cooloon Children’s Centre Inc. $34,263
Cooma Lambie Street Preschool Association Inc. $287,817
Cooma North Preschool Association Inc. $242,707
Coonamble Children’s Services Inc. $22,411
Coonamble Preschool Association Inc. $265,272
Coonamble Shire Council $6,076
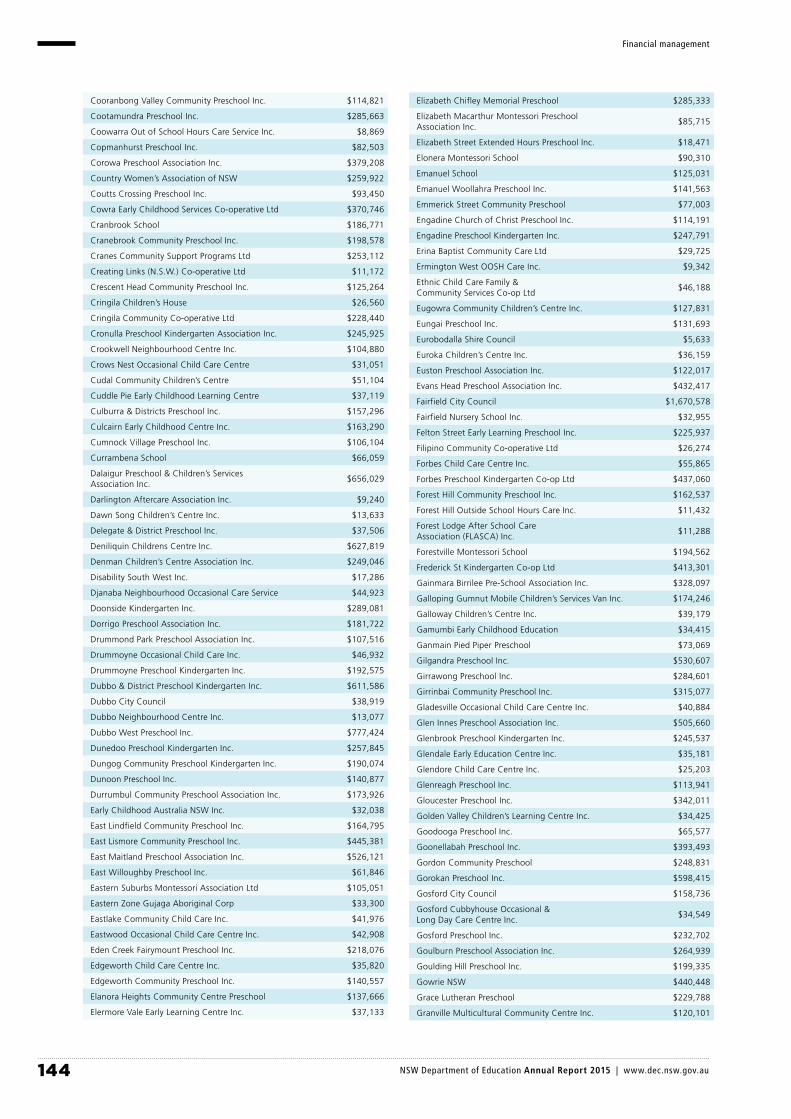
144 NSW Department of Education Annual Report 2015 | www.dec.nsw.gov.au
Financial management
Cooranbong Valley Community Preschool Inc. $114,821
Cootamundra Preschool Inc. $285,663
Coowarra Out of School Hours Care Service Inc. $8,869
Copmanhurst Preschool Inc. $82,503
Corowa Preschool Association Inc. $379,208
Country Women’s Association of NSW $259,922
Coutts Crossing Preschool Inc. $93,450
Cowra Early Childhood Services Co-operative Ltd $370,746
Cranbrook School $186,771
Cranebrook Community Preschool Inc. $198,578
Cranes Community Support Programs Ltd $253,112
Creating Links (N.S.W.) Co-operative Ltd $11,172
Crescent Head Community Preschool Inc. $125,264
Cringila Children’s House $26,560
Cringila Community Co-operative Ltd $228,440
Cronulla Preschool Kindergarten Association Inc. $245,925
Crookwell Neighbourhood Centre Inc. $104,880
Crows Nest Occasional Child Care Centre $31,051
Cudal Community Children’s Centre $51,104
Cuddle Pie Early Childhood Learning Centre $37,119
Culburra & Districts Preschool Inc. $157,296
Culcairn Early Childhood Centre Inc. $163,290
Cumnock Village Preschool Inc. $106,104
Currambena School $66,059
Dalaigur Preschool & Children’s Services Association Inc.
$656,029
Darlington Aftercare Association Inc. $9,240
Dawn Song Children’s Centre Inc. $13,633
Delegate & District Preschool Inc. $37,506
Deniliquin Childrens Centre Inc. $627,819
Denman Children’s Centre Association Inc. $249,046
Disability South West Inc. $17,286
Djanaba Neighbourhood Occasional Care Service $44,923
Doonside Kindergarten Inc. $289,081
Dorrigo Preschool Association Inc. $181,722
Drummond Park Preschool Association Inc. $107,516
Drummoyne Occasional Child Care Inc. $46,932
Drummoyne Preschool Kindergarten Inc. $192,575
Dubbo & District Preschool Kindergarten Inc. $611,586
Dubbo City Council $38,919
Dubbo Neighbourhood Centre Inc. $13,077
Dubbo West Preschool Inc. $777,424
Dunedoo Preschool Kindergarten Inc. $257,845
Dungog Community Preschool Kindergarten Inc. $190,074
Dunoon Preschool Inc. $140,877
Durrumbul Community Preschool Association Inc. $173,926
Early Childhood Australia NSW Inc. $32,038
East Lindfield Community Preschool Inc. $164,795
East Lismore Community Preschool Inc. $445,381
East Maitland Preschool Association Inc. $526,121
East Willoughby Preschool Inc. $61,846
Eastern Suburbs Montessori Association Ltd $105,051
Eastern Zone Gujaga Aboriginal Corp $33,300
Eastlake Community Child Care Inc. $41,976
Eastwood Occasional Child Care Centre Inc. $42,908
Eden Creek Fairymount Preschool Inc. $218,076
Edgeworth Child Care Centre Inc. $35,820
Edgeworth Community Preschool Inc. $140,557
Elanora Heights Community Centre Preschool $137,666
Elermore Vale Early Learning Centre Inc. $37,133
Elizabeth Chifley Memorial Preschool $285,333
Elizabeth Macarthur Montessori Preschool Association Inc.
$85,715
Elizabeth Street Extended Hours Preschool Inc. $18,471
Elonera Montessori School $90,310
Emanuel School $125,031
Emanuel Woollahra Preschool Inc. $141,563
Emmerick Street Community Preschool $77,003
Engadine Church of Christ Preschool Inc. $114,191
Engadine Preschool Kindergarten Inc. $247,791
Erina Baptist Community Care Ltd $29,725
Ermington West OOSH Care Inc. $9,342
Ethnic Child Care Family & Community Services Co-op Ltd
$46,188
Eugowra Community Children’s Centre Inc. $127,831
Eungai Preschool Inc. $131,693
Eurobodalla Shire Council $5,633
Euroka Children’s Centre Inc. $36,159
Euston Preschool Association Inc. $122,017
Evans Head Preschool Association Inc. $432,417
Fairfield City Council $1,670,578
Fairfield Nursery School Inc. $32,955
Felton Street Early Learning Preschool Inc. $225,937
Filipino Community Co-operative Ltd $26,274
Forbes Child Care Centre Inc. $55,865
Forbes Preschool Kindergarten Co-op Ltd $437,060
Forest Hill Community Preschool Inc. $162,537
Forest Hill Outside School Hours Care Inc. $11,432
Forest Lodge After School Care Association (FLASCA) Inc.
$11,288
Forestville Montessori School $194,562
Frederick St Kindergarten Co-op Ltd $413,301
Gainmara Birrilee Pre-School Association Inc. $328,097
Galloping Gumnut Mobile Children’s Services Van Inc. $174,246
Galloway Children’s Centre Inc. $39,179
Gamumbi Early Childhood Education $34,415
Ganmain Pied Piper Preschool $73,069
Gilgandra Preschool Inc. $530,607
Girrawong Preschool Inc. $284,601
Girrinbai Community Preschool Inc. $315,077
Gladesville Occasional Child Care Centre Inc. $40,884
Glen Innes Preschool Association Inc. $505,660
Glenbrook Preschool Kindergarten Inc. $245,537
Glendale Early Education Centre Inc. $35,181
Glendore Child Care Centre Inc. $25,203
Glenreagh Preschool Inc. $113,941
Gloucester Preschool Inc. $342,011
Golden Valley Children’s Learning Centre Inc. $34,425
Goodooga Preschool Inc. $65,577
Goonellabah Preschool Inc. $393,493
Gordon Community Preschool $248,831
Gorokan Preschool Inc. $598,415
Gosford City Council $158,736
Gosford Cubbyhouse Occasional & Long Day Care Centre Inc.
$34,549
Gosford Preschool Inc. $232,702
Goulburn Preschool Association Inc. $264,939
Goulding Hill Preschool Inc. $199,335
Gowrie NSW $440,448
Grace Lutheran Preschool $229,788
Granville Multicultural Community Centre Inc. $120,101

145 NSW Department of Education Annual Report 2015 | www.dec.nsw.gov.au
Financial management
Grays Point Preschool Kindergarten Association $108,856
Great Lakes Children’s Centre Inc. $194,233
Greek Orthodox Archdiocese of Australia $22,395
Greek Orthodox Community of NSW Ltd $48,181
Greenacre Church of Christ $214,775
Greenhills Child Care Centre Inc. $35,958
Grenfell Preschool and Long Day Care Centre Inc. $288,069
Griffith Child Care Centre Inc. $271,986
Griffith East Preschool Inc. $527,235
Griffith Preschool Kindergarten Inc. $301,020
Griffith Wiradjuri Aboriginal Preschool Inc. $266,782
Gubi Gabun Children’s Mobile $62,288
Gulargambone Preschool Inc. $137,409
Gulgong Preschool Inc. $268,708
Gulpa Preschool Inc. $130,652
Gummyaney Aboriginal Corporation $212,809
Gumnut Bowral Memorial Preschool Inc. $220,205
Gumnut Community Preschool Inc. $122,208
Gumnut Cottage Inc. $34,904
Gundagai Neighbourhood Centre Inc. $7,724
Gundagai Preschool Kindergarten Inc. $190,349
Gunnedah Baptist Child Care Association Ltd $386,802
Gunnedah Family & Children’s Service Inc. $31,036
Gunnedah Preschool Kindergarten Association Inc. $538,893
Gunning & District Preschool Inc. $26,970
Guyra Shire Council $28,824
Gwydir Mobile Children’s Services Inc. $251,123
Gwydir Shire Council $183,496
Gyndarna Preschool Inc. $271,862
Haberfield Baptist Church Preschool Ltd $170,402
Hamilton Child Care Centre Inc. $27,250
Hamilton Community Preschool Inc. $167,730
Happy Days Kindergarten Society Inc. $191,972
Harbord Kindergarten Inc. $231,390
Hastings Preschool and Long Day Care Centre Inc. $32,936
Hawkesbury City Council $109,979
Hawkesbury Community Outreach Services Inc. $159,246
Hawkesbury Early Childhood Intervention Service Inc. $86,925
Hawkesbury River Child Care Inc. $40,390
Hay Mobile Children’s Service Inc. $310,996
Hay Plains Childcare Centre Inc. $22,603
Hay Preschool Kindergarten Inc. $209,430
Heathdene Community Services Inc. $304,421
Henry Street Community Preschool Association Inc. $99,495
Henty Early Childhood Association Inc. $199,271
Hibiscus Children’s Centre $173,908
Highfields Preparatory & Kindergarten School Ltd $129,272
Hills Montessori Society $98,922
Hillston Billylids Inc. $27,214
Hobartville Long Day Preschool Inc. $35,622
Holbrook Early Learning Centre Inc. $53,566
Holroyd City Council $274,468
Holroyd/Parramatta Mobile Minders Inc. $115,439
Holsworthy Long Day & Occasional Care Centre $31,209
Holsworthy Preschool Parents Association Inc. $204,789
Holy Trinity Preschool (Beacon Hill) Inc. $106,176
Hopepoint Preschool Centre $302,772
Hornsby Ku-ring-gai Montessori Society $20,038
Hornsby Shire Council $128,148
Howlong Preschool Association Inc. $209,043
Hunter Region Working Women’s Group Ltd $45,380
Hunter Valley Grammar School Early Learning Centre $190,673
Hunters Hill Preschool Inc. $249,762
Hurstville City Council $69,565
Illawarra Aboriginal Corporation $181,030
Illawarra Area Child Care Ltd $398,151
Illawarra Christian School $251,040
Illawarra Multicultural Services $36,938
Illawarra Toy Library Association Inc. $123,899
Iluka Preschool Inc. $237,778
Inaburra Preschool $223,765
Infants Home Ashfield $337,427
Inner City Care Child Care Centre $40,106
Inner Sydney Montessori Association $38,277
Integricare $1,500,680
Intereach Ltd $16,808
Inverell Disability Services Inc. $225,362
Inverell District Family Services Inc. $1,394,364
Ivanhoe Preschool Centre $45,195
Jacaranda Preschool Centre Inc. $350,679
Jack & Jill Pre-School Association (Lithgow) Inc. $334,686
Jannali Preschool Kindergarten Inc. $147,097
Jarjum Centre Inc. $188,952
Jerilderie Preschool Kindergarten Inc. $123,143
Jesmond Community Preschool Association Inc. $288,020
Jesmond Early Education Centre Inc. $54,806
Jindera Preschool Association Inc. $226,744
Joey’s Pouch Early Years Educational & Preschool Centre Inc.
$31,991
Jumbunna Children’s Centre Ltd $47,862
Jumbunna Community Preschool & Early Intervention Centre Inc.
$1,094,547
Jumping Jacks Community Preschool Inc. $208,654
Junee RSL Memorial Preschool Inc. $429,209
Kangaroo Valley Preschool Inc. $106,580
Kapooka Early Childhood Centre Inc. $176,160
KARI Aboriginal Resource Inc. $12,290
Karingal Preschool Nelson Bay Inc. $201,992
Karuah Pre-School Association Inc. $156,039
Katoomba Childrens Cottage Inc. $41,629
Katoomba Leura Preschool Association Inc. $315,590
Katoomba Neighbourhood Centre Inc. $8,610
Keiraville Community Preschool Inc. $185,442
Kellys Place Children’s Centre $40,735
Kellyville After School Care Inc. $7,407
Kellyville Preschool Inc. $208,484
Kemblawarra Child & Family Centre Inc. $18,887
Kempsey Children’s Services Co-operative Ltd $170,999
Kempsey Respite Services Inc. $22,881
Kenthurst Before & After School Care Inc. $16,726
Kenthurst Preschool Kindergarten Inc. $189,130
Keymer Child Care Centre Inc. – Child Care $63,111
Khancoban & District Children’s Resource Centre $59,053
Kiama Preschool Inc. $389,561
Kids Korner Combined Occasional Care Centre Inc. $34,149
Kids of the Castle Occasional Care Centre Inc. $53,242
Kidsafe NSW Inc. $90,117
Killarney Vale Preschool Kindergarten Inc. $258,775
Kinburra Preschool Inc. $226,601

146 NSW Department of Education Annual Report 2015 | www.dec.nsw.gov.au
Financial management
Kindamindi Co-Op Ltd $28,809
Kindilan Early Childhood Centre Inc. $99,118
King Street Community Preschool East Maitland Inc. $210,283
Kingscliff Mini School Inc. $205,531
Kinma Ltd $81,488
Koala Child Care Centre $46,861
Kogarah City Council $222,849
Kogarah Community Services Inc. $5,636
Kogil Street Preschool Association Inc. $25,467
Koninderie Community Based Preschool Inc. $208,181
Kookaburra Korner Early Education Centre Inc. $40,862
Koolyangarra Preschool Aboriginal Corporation $344,909
Koonawarra Area Residents Association Inc. $1,576
Koorana Child & Family Services Inc. $817,406
Kootingal & District Preschool Inc. $249,486
KU Children’s Services $16,509,528
Kubby House Child Care Centre Inc. $14,372
Kulai Preschool Aboriginal Corporation $397,516
Kunghur Community Preschool Inc. $64,299
Ku-ring-gai Council $45,326
Kurnell Preschool Kindergarten Inc. $112,809
Kurri Early Childhood Centre Inc. $69,523
Kurri Kurri and District Preschool Kindergarten Inc. $521,962
Kurri Kurri Community Centre Inc. $7,881
Kyogle Preschool & Outside School Hours Care Association Inc.
$196,385
Lachlan Shire Council $120,781
Lady Game Community Kindergarten Inc. $116,963
Lake Cargelligo District Community Children’s Centre Association Inc.
$181,401
Lake Macquarie City Council $63,311
Lalor Park Preschool Kindergarten Association Inc. $297,814
Lane Cove Council $50,551
Lane Cove Occasional Child Care Inc. $53,368
Lane Cove Out of School Inc. $12,322
Lapstone Out of School Hours Inc. $13,611
Lapstone Preschool Kindergarten Association Inc. $238,220
Larool Preschool Inc. $130,034
Lawrence Community Preschool Inc. $61,361
Lawson Community Preschool Association Inc. $208,230
Learning Links $316,395
Leeton Preschool Association Inc. $523,358
Leeton Shire Council $14,472
Leeton Shire Council – Child Care Centre $33,734
Leichhardt Municipal Council $104,632
Leichhardt Out Of School Hours Care Inc. $10,933
Lennox Head Community Preschool Inc. $331,406
Lightning Ridge Preschool Centre Inc. $262,746
Lilly Pilly Community Preschool Inc. $277,359
Lindfield Montessori Society Inc. $44,875
Lismore Neighbourhood Centre Inc. $34,137
Lismore Parish Centre Preschool Inc. $220,641
Lismore Preschool Inc. $491,278
Little Bear Child Care Cottage Inc. $28,622
Little Yuin Preschool Family Centre Aboriginal Corporation
$100,703
Liverpool City Council $439,402
Liverpool Neighbourhood Connections Inc. $120,015
Lockhart Preschool Kindergarten Inc. $65,468
Long Flat Preschool Association Inc. $57,519
Long Jetty Preschool Inc. $263,610
Lower Bucca Community Preschool Inc. $122,910
Lower Hunter Children’s Activity Van Association Inc. $305,024
Lower Hunter Temporary Care Inc. $19,743
Lower Macleay Preschool Inc. $328,120
Lyrebird Preschool Kindergarten Nowra East Inc. $349,762
Macarthur Multicultural Children’s Services Association Inc.
$60,724
Macarthur Preschool Kindergarten Association Inc. $267,371
Macedonian Orthodox Community Church St Petka Inc.
$20,538
Macksville Preschool Childcare Centre Ltd $35,997
Maclean Community Preschool Inc. $243,539
Macquarie Hills Community Preschool Inc. $229,611
Macquarie Preschools Co-Operative Ltd $465,302
Maitland Baptist Church Child Care Inc. $32,000
Maitland Child Care Centre Inc. $38,412
Maitland Nursery School Inc. $347,654
Malabar Occasional Child Care Centre Inc. $37,887
Malabar/Chifley Parent Co-operative Ltd $27,153
Mallee Family Care Inc. $56,494
Manilla Community Preschool Inc. $273,703
Manly Council $295,051
Manly Vale Community Kindergarten Inc. $133,158
Manly Warringah Montessori Society $91,712
Marayong House Neighbourhood $102,070
Marayong Preschool Kindergarten Inc. $299,019
Maronite Sisters of the Holy Family $230,036
Maroubra Junction Before & After School Care $8,171
Maroubra Neighbourhood Children’s Centre Co-operative Ltd
$25,925
Marrickville Council $594,335
Maryland Care & Early Education Centre Inc. $53,838
Maryland OOSH Inc. $17,372
Mathoura Preschool Inc. $72,273
Mayfield Central Community Preschool Kindergarten Ltd
$276,705
McGraths Hill Children’s Centre Inc. $34,622
Medowie Community Preschool Inc. $199,192
Mendooran Preschool Inc. $93,193
Menindee Children’s Centre $173,276
Menindee Preschool Association $639,971
Merindah Children’s Centre Inc. $22,353
Merriwa Preschool Kindergarten Association Inc. $239,187
Merrydays Kindergarten Society Inc. $32,140
Merrylands Christian Preschool Association Inc. $347,306
Metford Child Care Centre Ltd $39,393
Mid Mountains Out of School Hours Service Inc. $5,636
Milton-Ulladulla Preschool Association Inc. $251,414
Mindaribba Local Aboriginal Land Council $110,807
Minimbah Preschool, Primary School Aboriginal Corporation
$433,643
Minooka Preschool Centre Inc. $202,083
Miranda Kindergarten Association Inc. $335,210
Mission Australia $986,227
Mitchell Early Learning Centre Inc. $34,538
Mittagong Preschool Kindergarten Inc. $266,771
Moama & District Preschool Centre Inc. $287,224
Mobile Childrens Services Association $336,271
Molong District Preschool Inc. $183,642
Monaro Early Intervention Service Inc. $25,567
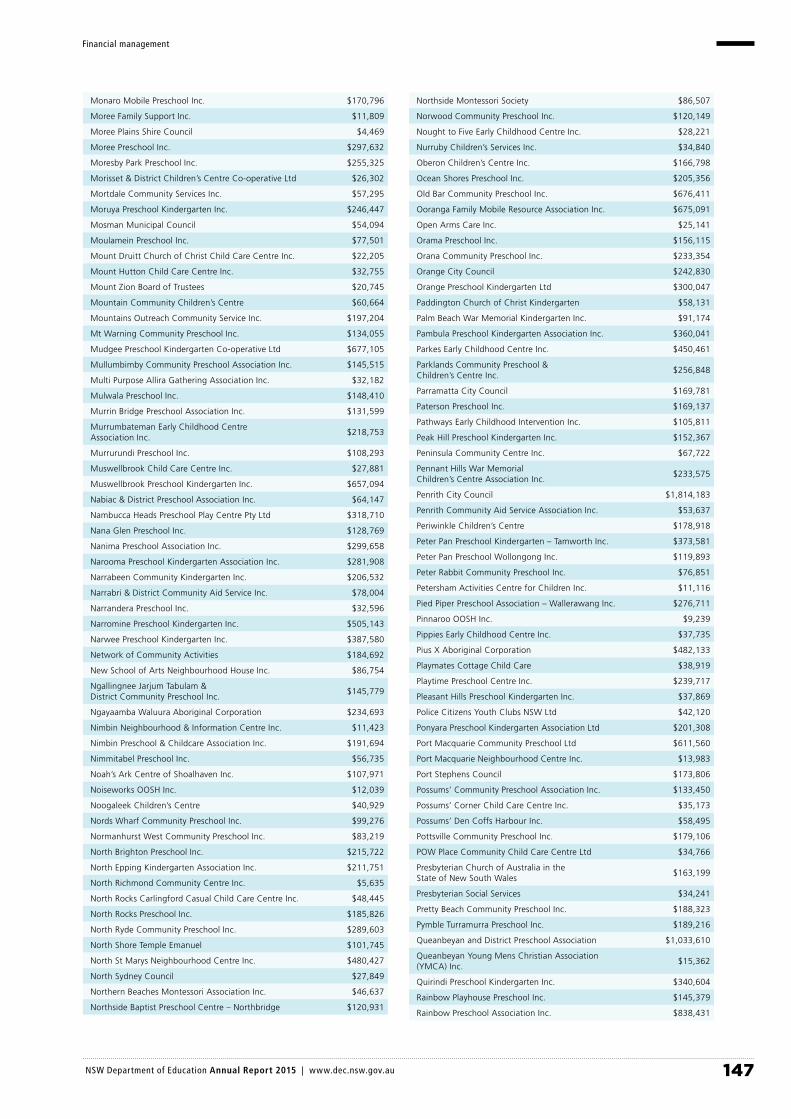
147 NSW Department of Education Annual Report 2015 | www.dec.nsw.gov.au
Financial management
Monaro Mobile Preschool Inc. $170,796
Moree Family Support Inc. $11,809
Moree Plains Shire Council $4,469
Moree Preschool Inc. $297,632
Moresby Park Preschool Inc. $255,325
Morisset & District Children’s Centre Co-operative Ltd $26,302
Mortdale Community Services Inc. $57,295
Moruya Preschool Kindergarten Inc. $246,447
Mosman Municipal Council $54,094
Moulamein Preschool Inc. $77,501
Mount Druitt Church of Christ Child Care Centre Inc. $22,205
Mount Hutton Child Care Centre Inc. $32,755
Mount Zion Board of Trustees $20,745
Mountain Community Children’s Centre $60,664
Mountains Outreach Community Service Inc. $197,204
Mt Warning Community Preschool Inc. $134,055
Mudgee Preschool Kindergarten Co-operative Ltd $677,105
Mullumbimby Community Preschool Association Inc. $145,515
Multi Purpose Allira Gathering Association Inc. $32,182
Mulwala Preschool Inc. $148,410
Murrin Bridge Preschool Association Inc. $131,599
Murrumbateman Early Childhood Centre Association Inc.
$218,753
Murrurundi Preschool Inc. $108,293
Muswellbrook Child Care Centre Inc. $27,881
Muswellbrook Preschool Kindergarten Inc. $657,094
Nabiac & District Preschool Association Inc. $64,147
Nambucca Heads Preschool Play Centre Pty Ltd $318,710
Nana Glen Preschool Inc. $128,769
Nanima Preschool Association Inc. $299,658
Narooma Preschool Kindergarten Association Inc. $281,908
Narrabeen Community Kindergarten Inc. $206,532
Narrabri & District Community Aid Service Inc. $78,004
Narrandera Preschool Inc. $32,596
Narromine Preschool Kindergarten Inc. $505,143
Narwee Preschool Kindergarten Inc. $387,580
Network of Community Activities $184,692
New School of Arts Neighbourhood House Inc. $86,754
Ngallingnee Jarjum Tabulam & District Community Preschool Inc.
$145,779
Ngayaamba Waluura Aboriginal Corporation $234,693
Nimbin Neighbourhood & Information Centre Inc. $11,423
Nimbin Preschool & Childcare Association Inc. $191,694
Nimmitabel Preschool Inc. $56,735
Noah’s Ark Centre of Shoalhaven Inc. $107,971
Noiseworks OOSH Inc. $12,039
Noogaleek Children’s Centre $40,929
Nords Wharf Community Preschool Inc. $99,276
Normanhurst West Community Preschool Inc. $83,219
North Brighton Preschool Inc. $215,722
North Epping Kindergarten Association Inc. $211,751
North Richmond Community Centre Inc. $5,635
North Rocks Carlingford Casual Child Care Centre Inc. $48,445
North Rocks Preschool Inc. $185,826
North Ryde Community Preschool Inc. $289,603
North Shore Temple Emanuel $101,745
North St Marys Neighbourhood Centre Inc. $480,427
North Sydney Council $27,849
Northern Beaches Montessori Association Inc. $46,637
Northside Baptist Preschool Centre – Northbridge $120,931
Northside Montessori Society $86,507
Norwood Community Preschool Inc. $120,149
Nought to Five Early Childhood Centre Inc. $28,221
Nurruby Children’s Services Inc. $34,840
Oberon Children’s Centre Inc. $166,798
Ocean Shores Preschool Inc. $205,356
Old Bar Community Preschool Inc. $676,411
Ooranga Family Mobile Resource Association Inc. $675,091
Open Arms Care Inc. $25,141
Orama Preschool Inc. $156,115
Orana Community Preschool Inc. $233,354
Orange City Council $242,830
Orange Preschool Kindergarten Ltd $300,047
Paddington Church of Christ Kindergarten $58,131
Palm Beach War Memorial Kindergarten Inc. $91,174
Pambula Preschool Kindergarten Association Inc. $360,041
Parkes Early Childhood Centre Inc. $450,461
Parklands Community Preschool & Children’s Centre Inc.
$256,848
Parramatta City Council $169,781
Paterson Preschool Inc. $169,137
Pathways Early Childhood Intervention Inc. $105,811
Peak Hill Preschool Kindergarten Inc. $152,367
Peninsula Community Centre Inc. $67,722
Pennant Hills War Memorial Children’s Centre Association Inc.
$233,575
Penrith City Council $1,814,183
Penrith Community Aid Service Association Inc. $53,637
Periwinkle Children’s Centre $178,918
Peter Pan Preschool Kindergarten – Tamworth Inc. $373,581
Peter Pan Preschool Wollongong Inc. $119,893
Peter Rabbit Community Preschool Inc. $76,851
Petersham Activities Centre for Children Inc. $11,116
Pied Piper Preschool Association – Wallerawang Inc. $276,711
Pinnaroo OOSH Inc. $9,239
Pippies Early Childhood Centre Inc. $37,735
Pius X Aboriginal Corporation $482,133
Playmates Cottage Child Care $38,919
Playtime Preschool Centre Inc. $239,717
Pleasant Hills Preschool Kindergarten Inc. $37,869
Police Citizens Youth Clubs NSW Ltd $42,120
Ponyara Preschool Kindergarten Association Ltd $201,308
Port Macquarie Community Preschool Ltd $611,560
Port Macquarie Neighbourhood Centre Inc. $13,983
Port Stephens Council $173,806
Possums’ Community Preschool Association Inc. $133,450
Possums’ Corner Child Care Centre Inc. $35,173
Possums’ Den Coffs Harbour Inc. $58,495
Pottsville Community Preschool Inc. $179,106
POW Place Community Child Care Centre Ltd $34,766
Presbyterian Church of Australia in the State of New South Wales
$163,199
Presbyterian Social Services $34,241
Pretty Beach Community Preschool Inc. $188,323
Pymble Turramurra Preschool Inc. $189,216
Queanbeyan and District Preschool Association $1,033,610
Queanbeyan Young Mens Christian Association (YMCA) Inc.
$15,362
Quirindi Preschool Kindergarten Inc. $340,604
Rainbow Playhouse Preschool Inc. $145,379
Rainbow Preschool Association Inc. $838,431

148 NSW Department of Education Annual Report 2015 | www.dec.nsw.gov.au
Financial management
Rainbow Street Childcare Centre Inc. $34,761
Randwick Open Care For Kids Inc. $35,336
Randwick Out of School Hours Care Centre $4,075
Raymond Terrace Community Preschool Inc. $358,753
Raymond Terrace Early Education Inc. $37,154
Reachout Mobile Resource Unit Inc. $50,427
Redhead Community Preschool Inc. $142,904
Resource & Toy Library Broken Hill & Western Region Inc.
$112,490
Revesby Now ‘N’ Then Occasional Child Care Centre Inc.
$36,404
Richmond Before & After Care Association Inc. $11,473
Richmond Hill Community Preschool Inc. $76,772
Richmond Preschool Kindergarten Association Inc. $308,598
Richmond Valley Care-Ring Association Inc. $44,829
Riverina Children’s Activity Van Inc. $268,927
Riverside Preschool Inc. $151,912
Riverwood Community Centre Inc. $206,377
Rocky Hall Preschool Association $64,484
Rooty Hill Outside of School Hours Care Centre Inc. $6,765
Rose Bay Out of School Care Centre Inc. $5,635
Rosebank Community Preschool Inc. $94,587
Rosebery Child Care Centre $33,576
Rosellas Community Preschool Inc. $314,111
Ross Circuit Preschool Centre Inc. $362,948
Rowena Preschool Inc. $32,924
Royal Institute for Deaf and Blind Children $586,431
Royal Society for the Welfare of Mothers & Babies $27,474
Rozelle Child Care Centre Ltd $68,769
Rylstone Kandos Preschool Inc. $234,403
Salamander Bay Childcare Centre Inc. $52,127
Samaritans Foundation Diocese of Newcastle $1,568,144
Sans Souci Community Preschool Association Inc. $392,980
Scone & District Preschool Inc. $429,491
SDN Child & Family Services Pty Ltd $1,109,275
SDN Children’s Services $1,209,707
Seven Hills North P & C Association $11,741
Share Care Inc. $15,657
SHARE Co-operative Society Ltd $11,904
Shellharbour City Council $27,685
Shine For Kids Co-operative Ltd $18,738
Shoalhaven Community Preschool Inc. $377,805
Silverlea Early Childhood Services Inc. $28,134
Singleton Council $208,877
Singleton Heights Preschool Inc. $417,085
Singleton Preschool Inc. $366,822
Snugglepot Day Care Centre Inc. $97,910
SOS Preschool $284,524
South West Rocks Preschool $347,442
Southlake Community Services Inc. $8,090
Southside Montessori Society $86,889
Springdale Heights Preschool Inc. $217,809
Springwood and District Preschool Kindergarten Association Inc.
$313,266
Springwood Neighbourhood Centre Co-operative Ltd $9,504
St Andrew’s Children’s Neighbourhood Centre Inc. $20,172
St Andrews Church Community Preschool Inc. $101,277
St Andrew’s Kindergarten Abbotsford Inc. $169,955
St Anthony’s Family Care $23,063
St Demiana & St Athanasious Coptic Orthodox Church $5,852
St Dunstan’s Preschool Kindergarten Inc. $299,042
St George Preschool (Marsfield) Inc. $182,321
St Ives Occasional Care $49,387
St Ives Preschool Kindergarten Association $144,514
St John’s North Ryde Preschool Inc. $204,062
St John’s Preschool Ashfield Inc. $315,233
St Lukes Preschool $182,243
St Lukes Preschool Dapto Inc. $322,511
St Lukes Preschool Northmead Inc. $139,701
St Mark’s Brighton-le-Sands Preschool Kindergarten Inc.
$141,662
St Mark’s Child Care Centre Oakhurst Inc. $31,228
St Mark’s Northbridge Kindergarten Inc. $152,944
St Mark’s Preschool Kindergarten Inc. $148,173
St Mark’s Vacation Care Centre $11,222
St Mary & St Mina’s Vacation Care $6,101
St Mary’s Child Care Centre Ltd $32,636
St Mary’s Community Preschool Casino Ltd $321,896
St Marys District Baptist Church Out Of School Hours Care St Clair
$13,376
St Mary’s Guildford Preschool Inc. $258,459
St Mary’s North Tamworth Preschool Inc. $286,102
St Mary’s Rainbow Preschool $170,921
St Paul’s Lutheran Kindergarten Inc. $20,390
St Peters Community Preschool Inc. $180,846
St Peters Preschool Ltd $228,869
St Peter’s Preschool Tamworth Inc. $435,487
St Stephen’s Belrose Kindergarten Inc. $192,439
St Stephens Preschool Kindergarten Inc. $167,560
St Therese Community Preschool Inc. $60,683
St Thomas’ Preschool Ltd $105,830
St Thomas Rozelle Child Care Centre $29,801
St Vincent De Paul Society NSW $91,759
Strathfield & District Hebrew Congregation $138,806
Strathfield One Stop Child Care Service Inc. $62,519
Stroud Neighbourhood Children’s Co-operative Ltd $123,063
Stuarts Point Preschool Association Inc. $222,113
Styles Street Children’s Community Long Day Care Centre Inc.
$46,118
Sun Valley Preschool Kindergarten Inc. $97,751
Sunny Corner Toy Library Inc. $27,042
Surry Hills Neighbourhood Centre Inc. $46,319
Sutherland Shire Council $476,047
Swansea Community Cottage Inc. $36,247
Sydney Anglican Schools Corporation $260,673
Sydney Local Health District $8,135
Sydney Montessori Society $117,935
Sydney South West Area Health $24,404
Sydney University Settlement $23,318
Sylvanvale Foundation $122,267
Tamworth Montessori Association Inc. $125,438
Tamworth Toy Library Inc. $12,343
Tarago Preschool Association Inc. $98,836
Taree & District Preschool Ltd $302,547
Tathra Children’s Services Inc. $249,181
Tea Gardens Hawks Nest Preschool Kindergarten Inc. $115,910
Temora Preschool and Out of School Hours Inc. $422,157
Tenterfield Child Care Centre Inc. $31,793
Tenterfield Preschool Kindergarten Inc. $263,111
Terrey Hills Community Kindergarten Inc. $100,789

149 NSW Department of Education Annual Report 2015 | www.dec.nsw.gov.au
Financial management
Thankakali Aboriginal Corporation $6,765
Tharawal Aboriginal Corporation $38,687
The Armidale Waldorf School Ltd $89,920
The Benevolent Society $53,727
The Creativity Centre Inc. $16,922
The Cubbyhouse Preschool & Occasional Care Centre Inc.
$49,886
The Entrance Preschool Kindergarten Association Inc. $334,070
The Factory Community Centre Inc. $207,808
The Grace Child Care Centre Inc. $74,998
The Greta Community Preschool Inc. $123,992
The Guardian Angel Preschool Kindergarten Inc. $19,420
The Gymea Nursery School and Kindergarten Co-operative Society Ltd
$298,527
The Hills Community Kindergarten Inc. $243,984
The Hills Shire Council $218,140
The Illawarra Disability Trust $10,768
The Jack & Jill Kindergarten – Hornsby $246,299
The John Wycliffe Christian Education Association Ltd $74,075
The Junction Works Ltd $53,696
The Killarney School Ltd $77,090
The Little School Preschool Inc. $72,372
The Mountain Preschool Lowanna Inc. $52,654
The Northern Nursery School Ltd $253,406
The Oaks Preschool Kindergarten Co-operative Ltd $197,295
The Point Preschool Inc. $67,216
The Rainbow Children’s Centre Inc. $40,981
The Rock Preschool Inc. $114,349
The Salvation Army $34,133
The Scots School Albury $137,716
The Shepherd Centre – For Deaf Children $163,403
The Trangie Preschool Kindergarten Association Ltd $148,622
The Tumut Pre-School Co-operative Society Ltd $424,926
Thredbo Early Childhood Centre Inc. $18,241
Thurgoona Preschool Inc. $290,657
Tibooburra Multi Purpose Centre Inc. $82,159
Tocumwal Preschool Kindergarten Inc. $194,488
Tooleybuc Preschool Association Inc. $130,217
Toongabbie Before & After School Care & Vacation Care Inc.
$9,267
Toongabbie Christian School OOSH $12,655
Tooraweenah Preschool Association Inc. $29,254
Toormina Community Preschool Inc. $255,273
Toronto Community Child Care Centre Inc. $37,842
Tottenham Preschool Kindergarten Association Inc. $88,109
Toukley Preschool Kindergarten Inc. $334,903
Tower Preschool Inc. $49,837
Towri Aboriginal Corporation $29,057
Toxteth Kindergarten Inc. $17,024
Tregear Presbyterian Kindergarten $457,658
Trinity Preschool Orange Inc. $600,423
Trundle Children’s Centre Inc. $67,848
Trustees Of The Christian Brothers $179,248
Trustees Roman Catholic Church Diocese of Lismore $551,001
Tullamore Preschool & Child Care Centre Inc. $64,541
Tumbarumba Shire Council $60,443
Tuntable Falls Early Childhood Centre Inc. $76,555
Tweed Heads Community Preschool Inc. $116,460
Tweed Shire Vacation Care Inc. $21,450
U@MQ Ltd $53,986
Ulladulla Children’s Centre Inc. $35,448
UnitingCare Burnside $165,782
UnitingCare NSW.ACT $4,843,842
University of New England $13,930
University of New South Wales $126,746
Upper Hunter Community Services Inc. $190,045
Upper Macleay Preschool Inc. $92,573
Uralla Preschool Kindergarten Inc. $275,450
Urana Shire Council $175,674
Uranquinty Preschool Association Inc. $59,308
Urunga Community Preschool Inc. $232,034
UTS Child Care Inc. $47,316
Valla Community Preschool Inc. $393,417
Valley Preschool Inc. $55,129
Wagga Wagga East Before & After School Care Centre Inc.
$6,183
Wakool Preschool Inc. $47,849
Walcha Council $309,165
Walgett Preschool and Long Day Care Centre Inc. $70,836
Walgett Shire Council $33,210
Wallsend Community Preschool $233,815
Wallum Community Preschool and Family Centre Inc. $268,784
Wangi Peter Pan Kindergarten Inc. $251,692
Warialda Preschool Inc. $153,983
Warilla Baptist Church Preschool $229,633
Warners Bay Early Learning & Care Centre Inc. $47,074
Warragamba Preschool Inc. $290,950
Warren Preschool Kindergarten Inc. $363,847
Warren Shire Council $6,194
Warringah Council $299,173
Warrumbungle Shire Council $565,592
Wauchope Preschool Kindergarten Inc. $263,974
Waverley Community Out of School Care Inc. $13,975
Waverley Council $112,014
Wee Waa & District Pre-School Association Inc. $220,926
Wellington Community Children’s Centre Inc. $392,046
Wentworth District Preschool Play Centre Inc. $166,623
Wentworth Falls Preschool Kindergarten Inc. $208,967
Werris Creek & District Preschool Association Inc. $220,511
Wesley Community Services Ltd $7,141
Wesley Mission $30,050
West Albury Preschool Centre Inc. $278,782
West Bathurst Preschool Inc. $578,693
West Epping Preschool Association Inc. $224,958
West Ryde Neighbourhood Children’s Centre $30,327
Western Sydney Local Health District $12,283
Westlawn Preschool Inc. $237,771
Weston Community Preschool Inc. $221,070
Wilberforce Early Learning Centre Inc. $34,839
Wilberforce Preschool Kindergarten Inc. $138,567
Williamtown Preschool Inc. $127,780
Willoughby City Council $96,274
Willoughby Community Preschool Inc. $62,565
Willow Tree Preschool Inc. $75,957
Wilsons Creek Community Preschool Inc. $85,994
Windsor Presbyterian Preschool Kindergarten $84,280
Windsor Preschool Association Inc. $349,700
Wingham & District Preschool Kindergarten Ltd $707,764
Winmalee Community Preschool Inc. $222,450
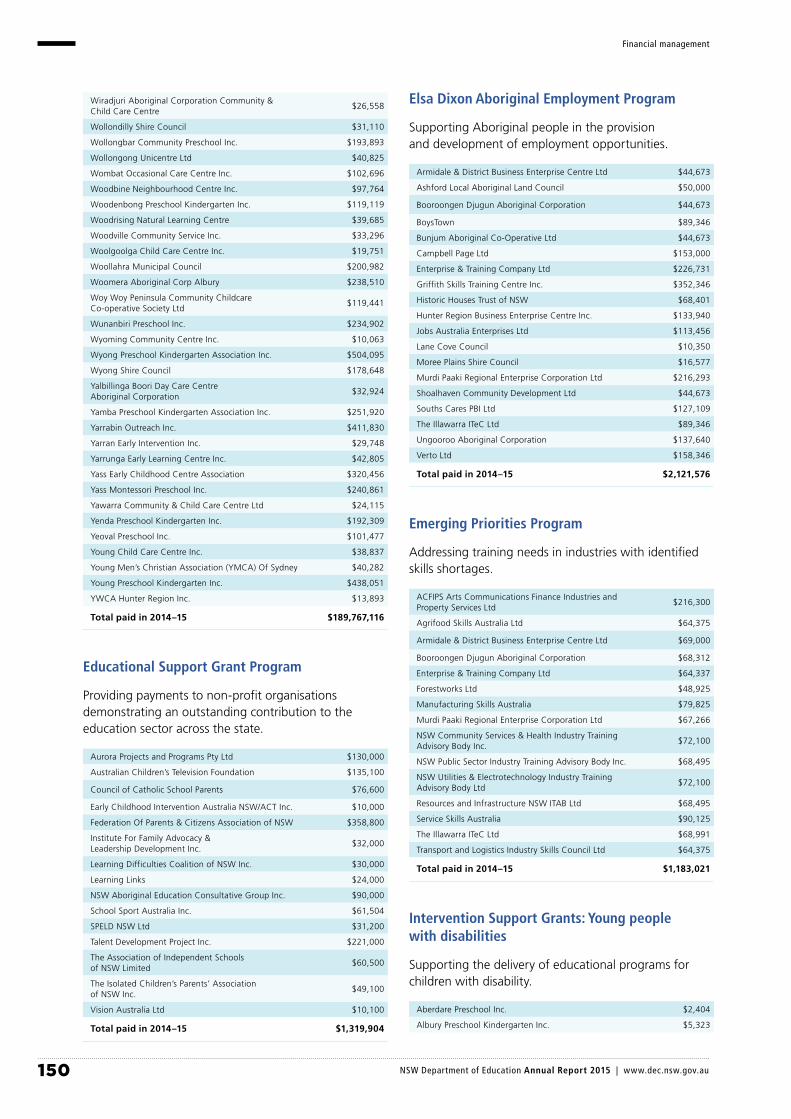
150 NSW Department of Education Annual Report 2015 | www.dec.nsw.gov.au
Financial management
Wiradjuri Aboriginal Corporation Community & Child Care Centre
$26,558
Wollondilly Shire Council $31,110
Wollongbar Community Preschool Inc. $193,893
Wollongong Unicentre Ltd $40,825
Wombat Occasional Care Centre Inc. $102,696
Woodbine Neighbourhood Centre Inc. $97,764
Woodenbong Preschool Kindergarten Inc. $119,119
Woodrising Natural Learning Centre $39,685
Woodville Community Service Inc. $33,296
Woolgoolga Child Care Centre Inc. $19,751
Woollahra Municipal Council $200,982
Woomera Aboriginal Corp Albury $238,510
Woy Woy Peninsula Community Childcare Co-operative Society Ltd
$119,441
Wunanbiri Preschool Inc. $234,902
Wyoming Community Centre Inc. $10,063
Wyong Preschool Kindergarten Association Inc. $504,095
Wyong Shire Council $178,648
Yalbillinga Boori Day Care Centre Aboriginal Corporation
$32,924
Yamba Preschool Kindergarten Association Inc. $251,920
Yarrabin Outreach Inc. $411,830
Yarran Early Intervention Inc. $29,748
Yarrunga Early Learning Centre Inc. $42,805
Yass Early Childhood Centre Association $320,456
Yass Montessori Preschool Inc. $240,861
Yawarra Community & Child Care Centre Ltd $24,115
Yenda Preschool Kindergarten Inc. $192,309
Yeoval Preschool Inc. $101,477
Young Child Care Centre Inc. $38,837
Young Men’s Christian Association (YMCA) Of Sydney $40,282
Young Preschool Kindergarten Inc. $438,051
YWCA Hunter Region Inc. $13,893
Total paid in 2014–15 $189,767,116
Educational Support Grant Program
Providing payments to non-profit organisations demonstrating an outstanding contribution to the education sector across the state.
Aurora Projects and Programs Pty Ltd $130,000
Australian Children’s Television Foundation $135,100
Council of Catholic School Parents $76,600
Early Childhood Intervention Australia NSW/ACT Inc. $10,000
Federation Of Parents & Citizens Association of NSW $358,800
Institute For Family Advocacy & Leadership Development Inc.
$32,000
Learning Difficulties Coalition of NSW Inc. $30,000
Learning Links $24,000
NSW Aboriginal Education Consultative Group Inc. $90,000
School Sport Australia Inc. $61,504
SPELD NSW Ltd $31,200
Talent Development Project Inc. $221,000
The Association of Independent Schools of NSW Limited
$60,500
The Isolated Children’s Parents’ Association of NSW Inc.
$49,100
Vision Australia Ltd $10,100
Total paid in 2014–15 $1,319,904
Elsa Dixon Aboriginal Employment Program
Supporting Aboriginal people in the provision and development of employment opportunities.
Armidale & District Business Enterprise Centre Ltd $44,673
Ashford Local Aboriginal Land Council $50,000
Booroongen Djugun Aboriginal Corporation $44,673
BoysTown $89,346
Bunjum Aboriginal Co-Operative Ltd $44,673
Campbell Page Ltd $153,000
Enterprise & Training Company Ltd $226,731
Griffith Skills Training Centre Inc. $352,346
Historic Houses Trust of NSW $68,401
Hunter Region Business Enterprise Centre Inc. $133,940
Jobs Australia Enterprises Ltd $113,456
Lane Cove Council $10,350
Moree Plains Shire Council $16,577
Murdi Paaki Regional Enterprise Corporation Ltd $216,293
Shoalhaven Community Development Ltd $44,673
Souths Cares PBI Ltd $127,109
The Illawarra ITeC Ltd $89,346
Ungooroo Aboriginal Corporation $137,640
Verto Ltd $158,346
Total paid in 2014–15 $2,121,576
Emerging Priorities Program
Addressing training needs in industries with identified skills shortages.
ACFIPS Arts Communications Finance Industries and Property Services Ltd
$216,300
Agrifood Skills Australia Ltd $64,375
Armidale & District Business Enterprise Centre Ltd $69,000
Booroongen Djugun Aboriginal Corporation $68,312
Enterprise & Training Company Ltd $64,337
Forestworks Ltd $48,925
Manufacturing Skills Australia $79,825
Murdi Paaki Regional Enterprise Corporation Ltd $67,266
NSW Community Services & Health Industry Training Advisory Body Inc.
$72,100
NSW Public Sector Industry Training Advisory Body Inc. $68,495
NSW Utilities & Electrotechnology Industry Training Advisory Body Ltd
$72,100
Resources and Infrastructure NSW ITAB Ltd $68,495
Service Skills Australia $90,125
The Illawarra ITeC Ltd $68,991
Transport and Logistics Industry Skills Council Ltd $64,375
Total paid in 2014–15 $1,183,021
Intervention Support Grants: Young people with disabilities
Supporting the delivery of educational programs for children with disability.
Aberdare Preschool Inc. $2,404
Albury Preschool Kindergarten Inc. $5,323
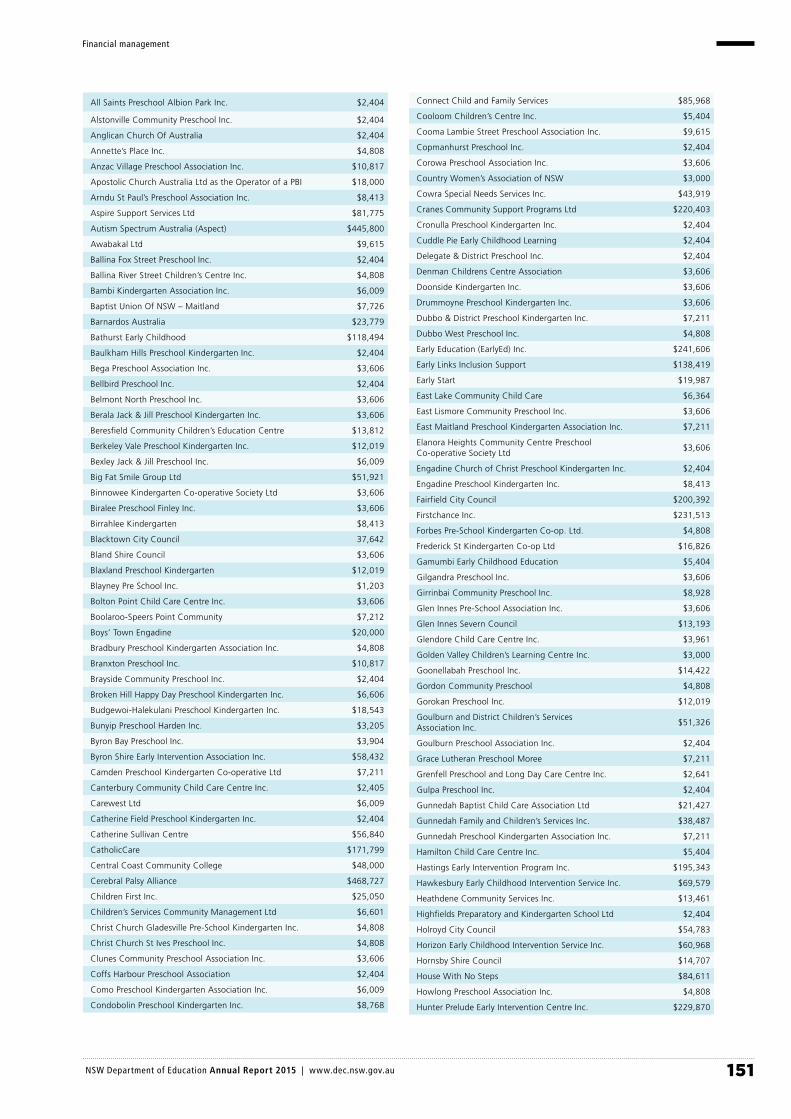
151 NSW Department of Education Annual Report 2015 | www.dec.nsw.gov.au
Financial management
All Saints Preschool Albion Park Inc. $2,404
Alstonville Community Preschool Inc. $2,404
Anglican Church Of Australia $2,404
Annette’s Place Inc. $4,808
Anzac Village Preschool Association Inc. $10,817
Apostolic Church Australia Ltd as the Operator of a PBI $18,000
Arndu St Paul’s Preschool Association Inc. $8,413
Aspire Support Services Ltd $81,775
Autism Spectrum Australia (Aspect) $445,800
Awabakal Ltd $9,615
Ballina Fox Street Preschool Inc. $2,404
Ballina River Street Children’s Centre Inc. $4,808
Bambi Kindergarten Association Inc. $6,009
Baptist Union Of NSW – Maitland $7,726
Barnardos Australia $23,779
Bathurst Early Childhood $118,494
Baulkham Hills Preschool Kindergarten Inc. $2,404
Bega Preschool Association Inc. $3,606
Bellbird Preschool Inc. $2,404
Belmont North Preschool Inc. $3,606
Berala Jack & Jill Preschool Kindergarten Inc. $3,606
Beresfield Community Children’s Education Centre $13,812
Berkeley Vale Preschool Kindergarten Inc. $12,019
Bexley Jack & Jill Preschool Inc. $6,009
Big Fat Smile Group Ltd $51,921
Binnowee Kindergarten Co-operative Society Ltd $3,606
Biralee Preschool Finley Inc. $3,606
Birrahlee Kindergarten $8,413
Blacktown City Council 37,642
Bland Shire Council $3,606
Blaxland Preschool Kindergarten $12,019
Blayney Pre School Inc. $1,203
Bolton Point Child Care Centre Inc. $3,606
Boolaroo-Speers Point Community $7,212
Boys’ Town Engadine $20,000
Bradbury Preschool Kindergarten Association Inc. $4,808
Branxton Preschool Inc. $10,817
Brayside Community Preschool Inc. $2,404
Broken Hill Happy Day Preschool Kindergarten Inc. $6,606
Budgewoi-Halekulani Preschool Kindergarten Inc. $18,543
Bunyip Preschool Harden Inc. $3,205
Byron Bay Preschool Inc. $3,904
Byron Shire Early Intervention Association Inc. $58,432
Camden Preschool Kindergarten Co-operative Ltd $7,211
Canterbury Community Child Care Centre Inc. $2,405
Carewest Ltd $6,009
Catherine Field Preschool Kindergarten Inc. $2,404
Catherine Sullivan Centre $56,840
CatholicCare $171,799
Central Coast Community College $48,000
Cerebral Palsy Alliance $468,727
Children First Inc. $25,050
Children’s Services Community Management Ltd $6,601
Christ Church Gladesville Pre-School Kindergarten Inc. $4,808
Christ Church St Ives Preschool Inc. $4,808
Clunes Community Preschool Association Inc. $3,606
Coffs Harbour Preschool Association $2,404
Como Preschool Kindergarten Association Inc. $6,009
Condobolin Preschool Kindergarten Inc. $8,768
Connect Child and Family Services $85,968
Cooloom Children’s Centre Inc. $5,404
Cooma Lambie Street Preschool Association Inc. $9,615
Copmanhurst Preschool Inc. $2,404
Corowa Preschool Association Inc. $3,606
Country Women’s Association of NSW $3,000
Cowra Special Needs Services Inc. $43,919
Cranes Community Support Programs Ltd $220,403
Cronulla Preschool Kindergarten Inc. $2,404
Cuddle Pie Early Childhood Learning $2,404
Delegate & District Preschool Inc. $2,404
Denman Childrens Centre Association $3,606
Doonside Kindergarten Inc. $3,606
Drummoyne Preschool Kindergarten Inc. $3,606
Dubbo & District Preschool Kindergarten Inc. $7,211
Dubbo West Preschool Inc. $4,808
Early Education (EarlyEd) Inc. $241,606
Early Links Inclusion Support $138,419
Early Start $19,987
East Lake Community Child Care $6,364
East Lismore Community Preschool Inc. $3,606
East Maitland Preschool Kindergarten Association Inc. $7,211
Elanora Heights Community Centre Preschool Co-operative Society Ltd
$3,606
Engadine Church of Christ Preschool Kindergarten Inc. $2,404
Engadine Preschool Kindergarten Inc. $8,413
Fairfield City Council $200,392
Firstchance Inc. $231,513
Forbes Pre-School Kindergarten Co-op. Ltd. $4,808
Frederick St Kindergarten Co-op Ltd $16,826
Gamumbi Early Childhood Education $5,404
Gilgandra Preschool Inc. $3,606
Girrinbai Community Preschool Inc. $8,928
Glen Innes Pre-School Association Inc. $3,606
Glen Innes Severn Council $13,193
Glendore Child Care Centre Inc. $3,961
Golden Valley Children’s Learning Centre Inc. $3,000
Goonellabah Preschool Inc. $14,422
Gordon Community Preschool $4,808
Gorokan Preschool Inc. $12,019
Goulburn and District Children’s Services Association Inc.
$51,326
Goulburn Preschool Association Inc. $2,404
Grace Lutheran Preschool Moree $7,211
Grenfell Preschool and Long Day Care Centre Inc. $2,641
Gulpa Preschool Inc. $2,404
Gunnedah Baptist Child Care Association Ltd $21,427
Gunnedah Family and Children’s Services Inc. $38,487
Gunnedah Preschool Kindergarten Association Inc. $7,211
Hamilton Child Care Centre Inc. $5,404
Hastings Early Intervention Program Inc. $195,343
Hawkesbury Early Childhood Intervention Service Inc. $69,579
Heathdene Community Services Inc. $13,461
Highfields Preparatory and Kindergarten School Ltd $2,404
Holroyd City Council $54,783
Horizon Early Childhood Intervention Service Inc. $60,968
Hornsby Shire Council $14,707
House With No Steps $84,611
Howlong Preschool Association Inc. $4,808
Hunter Prelude Early Intervention Centre Inc. $229,870

152 NSW Department of Education Annual Report 2015 | www.dec.nsw.gov.au
Financial management
Hunter Region Working Women’s Group Ltd $5,404
Hunters Hill Pre School Inc. $9,615
Illawarra Area Child Care Ltd $19,608
Inaburra Preschool $7,211
Infants Home Ashfield $34,501
Integricare $23,730
Inverell Disability Services Inc. $37,115
Inverell District Family Services Inc. $ 9,852
Jacaranda Preschool Centre Inc. $12,019
Jannali Preschool Kindergarten Inc. $3,606
Jesmond Community Preschool Association Inc. $6,010
Jumbunna Community Preschool and Early Intervention Centre Inc.
$86,086
Kapooka Early Childhood Centre Inc. $4,808
Karingal Preschool Nelson Bay Inc. $3,606
Karuah Preschool Association Inc. $2,404
Katoomba Childrens Cottage Inc. $7,566
Keiraville Community Preschool Inc. $2,404
Kellyville Preschool Inc. $6,010
Kempsey Children’s Services Co-operative Ltd $11,738
Kempsey Early Intervention Program Inc. $80,135
Kenthurst Preschool Kindergarten Inc. $11,015
Kiama Preschool Inc. $8,413
Kindilan Early Childhood Centre Inc. $7,684
Kingscliff Mini School Incorporated $4,808
Koorana Child and Family Services Inc. $167,276
KU Children’s Services $658,375
Kurnell Preschool Kindergarten Inc. $3,606
Kurrajong Waratah $502,156
Kurri Kurri and District Preschool Kindergarten Inc. $13,221
Lalor Park Preschool Kindergarten Association Inc. $2,404
Lambing Flat Enterprises Ltd $31,476
Lapstone Preschool Kindergarten Association Inc. $247,252
Learning Links $100,727
Lennox Head Community Preschool Inc. $3,606
Lifestart Co-operative Ltd $457,457
Lindfield Montessori Society Inc. $2,404
Lindisfarne Anglican School $2,404
Lismore Parish Centre Preschool Inc. $3,606
Lismore Preschool Inc. $8,413
Liverpool City Council $38,836
Long Jetty Preschool Inc. $6,009
Lower Macleay Preschool Inc. $4,808
Lyrebird Preschool Kindergarten Nowra East Inc. $2,404
Macarthur Preschool Kindergarten Association Inc. $4,808
Macksville Preschool Childcare Centre Ltd $2,641
Macquarie Hills Community Preschool Inc. $6,009
Macquarie Preschools Co-operative Ltd $7,211
Manilla Community Preschool Inc. $4,808
Manly Council $10,807
Manly Vale Community Kindergarten Inc. $3,606
Manning and Great Lakes Early Intervention Inc. $143,336
Marayong Preschool Kindergarten Inc. $13,221
Marrickville Council $5,609
Mater Dei $307,906
Mayfield Central Community Preschool Kindergarten Ltd
$2,404
Medowie Community Preschool Inc. $3,606
Merindah Children’s Centre Inc. $5,838
Merriwa Preschool Kindergarten Association Inc. $2,404
Merrydays Kindergarten Society Inc. $7,566
Mikayla Children’s Centre Inc. $11,000
Minooka Preschool Centre Inc. $2,404
Miranda Kindergarten Association Inc. $13,221
Mission Australia $174,746
Mittagong Preschool Kindergarten Inc. $7,211
Moama and District Preschool Centre Inc. $2,404
Molong District Preschool Inc. $2,404
Monaro Early Intervention Service Inc. $93,344
Moree Preschool Inc. $31,074
Moresby Park Preschool Inc. $4,808
Moriah War Memorial College Association $8,919
Morisset & District Children’s Centre Co-operative Ltd $4,808
Moruya Preschool Kindergarten Inc. $2,404
Mount Hutton Child Care Centre Inc. $8,081
Mudgee Preschool Kindergarten Co-operative Ltd $8,413
Murrumbateman Early Childhood Centre Association Inc.
$3,606
Musicians Making a Difference Inc. $32,400
Muswellbrook Child Care Centre Inc. $5,404
Muswellbrook Preschool Kindergarten Inc. $8,413
Nambucca Heads Pre-School Play Centre Pty Ltd $4,121
Nambucca Valley Children’s Group Inc. $32,626
Narrabeen Community Kindergarten Inc. $9,615
Noah’s Ark Centre of Shoalhaven Inc. $86,891
North Brighton Preschool Inc. $4,808
North Ryde Community Preschool Inc. $3,606
North St Marys Neighbourhood Centre Inc. $4,808
Norwood Community Preschool Inc. $3,606
Nurruby Children’s Services Inc. $11,881
Oberon Children’s Centre Inc. $1,803
Ocean Shores Preshcool Inc. $2,404
Old Bar Community Preschool Inc. $3,606
Open Arms Care Inc. $4,327
Orana Community Preschool Inc. $3,606
Orana Early Childhood Intervention and Education Project Inc.
$177,827
Orange District Early Education Program Inc. $127,985
Pacific Hills Christian Education Ltd $3,606
Pambula Preschool Kindergarten Association Inc. $6,010
Parkes Early Childhood Centre Inc. $8,928
Parklands Community Preschool and Children’s Centre Inc.
$3,606
Paterson Preschool Inc. $3,606
Pathways – Early Childhood $116,272
PEDAL Early Childhood Intervention Service Inc. $89,666
Pennant Hills War Memorial Children’s Centre Association Inc.
$4,808
Penrith City Council $71,860
Peter Rabbit Community Preschool Inc. $2,404
Pied Piper Preschool Association (Wallerawang) Inc. $2,404
PlayAbility Inc. $40,741
Ponyara Preschool Kindergarten Association Ltd $1,203
Port Macquarie Community Preschool Ltd $4,808
Pottsville Community Preschool Inc. $3,606
Presbyterian Social Services $44,275
Pymble Turramurra Preschool Inc. $4,808
Queanbeyan and District Preschool Association Inc. $21,634
Queanbeyan Children’s Special Needs Group Inc. $62,805
Rainbow Preschool Association Broken Hill Inc. $6,009
Raymond Terrace Community Preschool Inc. $4,808

153 NSW Department of Education Annual Report 2015 | www.dec.nsw.gov.au
Financial management
Richmond Preschool Kindergarten Association Inc. $7,211
Rosellas Community Preschool Inc. $3,606
Ross Circuit Preschool Centre Inc. $3,606
Royal Institute for Deaf and Blind Children $813,838
Salamander Bay Childcare Centre Inc. $7,448
Sans Souci Community Preschool Association Inc. $10,817
Scone and District Preschool Inc. $7,211
SDN Child and Family Services Pty Ltd $196,774
SDN Children’s Services $106,797
Shoalhaven Community Preschool Inc. $7,211
Silverlea Early Childhood Services Inc. $5,769
Singleton Heights Preschool Inc. $6,009
Singleton Preschool Kindergarten Inc. $4,808
Snugglepot Day Care Centre Inc. $27,849
Southern Cross University Children’s Centre $3,206
Special Needs Support Group Inc. $141,249
Springdale Heights Preschool Inc. $3,606
St Andrew’s Kindergarten Abbotsford Inc. $3,606
St Anthony’s Family Care $53,478
St Dunstan’s Preschool Kindergarten Inc. $7,211
St Ives Preschool Kindergarten Association $6,009
St Luke’s Preschool Dapto Inc. $2,404
St Luke’s Preschool Northmead Inc. $3,606
St Mark’s Brighton-le-Sands Preschool Kindergarten Inc.
$2,404
St Mark’s Preschool Kindergarten Inc. $3,606
St Peters Community Preschool Inc. $2,404
St Stephen’s Preschool Kindergarten Inc. $3,606
St. George Preschool (Marsfield) Inc. $2,404
Stepping Stones Early Learning Ltd $14,029
Summerland Early Intervention Program Inc. $108,353
Sutherland Shire Council $78,342
Sydney Community College Ltd $9,000
Sylvanvale Foundation $63,314
Taree & District Preschool Ltd $3,606
Tathra Children’s Services Inc. $3,606
The Entrance Preschool Kindergarten Association Inc. $16,139
The Gymea Nursery School and Kindergarten Co-operative Society Ltd
$8,413
The Hills Community Kindergarten Inc. $7,211
The Jack and Jill Kindergarten $6,010
The Killarney School Ltd $2,404
The Northcott Society $39,550
The Northern Nursery School Ltd $3,606
The Oaks Preschool Kindergarten Co-operative Ltd $2,404
The Rainbow Children’s Centre Inc. $72,604
The Shepherd Centre – For Deaf Children 517,586
The SOS Preschool Ltd $10,817
The STaR Inclusive Early Childhood Association Inc. $83,017
The Toybox Centre Inc. $117,693
The Trustees of the Roman Catholic Church for the Diocese of Parramatta
$3,000
Thurgoona Preschool Inc. $3,606
Toukley Preschool Kindergarten Inc. $4,808
Trinity Preschool Orange Inc. $10,817
Trustees of the Christian Brothers – Waverley College $8,413
Trustees of the Roman Catholic Church for the Diocese of Broken Bay
$9,798
Trustees of the Roman Catholic Church for the Diocese of Lismore – Parish of St Francis Xavier
$25,504
Tweed Heads Community Preschool Inc. $2,405
Tweed Valley Early Childhood Intervention Service Inc. $161,264
UnitingCare NSW.ACT $117,801
Uralla Preschool Kindergarten Inc. $3,606
Uranquinty Preschool Association Inc. $3,606
Valla Community Preschool Inc. $3,606
Vision Australia Ltd $230,382
Walcha Council $8,869
Walgett Preschool and Long Daycare Centre Inc. $1,886
Wallsend Community Preschool Inc. $3,606
Wallum Community Preschool and Family Centre Inc. $6,009
Wangi Peter Pan Kindergarten Inc. $4,808
Warrumbungle Shire Council $6,246
Wauchope Preschool Kindergarten Inc. $3,606
Werris Creek and District Preschool Association Inc. $2,404
West Bathurst Preschool Inc. $6,010
Westlawn Preschool Inc. $3,606
Willoughby Community Preschool Inc. $3,606
Windsor Preschool Association Inc. $7,211
Wingham & District Pre-School Kindergarten Ltd $4,808
Winmalee Community Preschool Inc. $6,009
Wollongbar Community Preschool Inc. $3,606
Woodrising Community Preschool and Childcare Centre Inc.
$2,404
Woodrising Natural Learning Centre Inc. $3,961
Woy Woy Peninsula Community Childcare Co-operative Society Ltd
$12,729
Wyong Preschool Kindergarten Association Inc. $8,413
Yalbillinga Boori Day Care Centre Aboriginal Corporation
$3,606
Yamba Preschool Kindergarten Association Inc. $3,606
Yarran Early Intervention Services Inc. $298,054
Yass Early Childhood Centre Association Inc. $2,404
Yeoval Preschool Inc. $4,808
Young Men’s Christian Association (YMCA) of Sydney $9,000
Total paid in 2014–15 $12,358,641
Minister for Aboriginal Affairs Discretionary Grants
Supporting events and activities identified by regional staff and consistent with NSW Government policy and Aboriginal Affairs strategic directions.
BE Centre $2,265
Nepean Community & Neighbourhood Services $6,792
Police Citizens Youth Clubs (PCYC) NSW Ltd Mt Druitt/Blacktown
$3,024
South Coast Women’s Health and Welfare Aboriginal Corporation
$1,000
West Tamworth League Club Ltd $1,055
Total paid in 2014–15 $14,136
Minister for Education Discretionary Grants
Enabling the Minister to provide grants to support the delivery of education programs.
Ballina Fox Street Pre-School Inc. $5,000
Ballina River Street Children’s Centre Inc. $5,000

154 NSW Department of Education Annual Report 2015 | www.dec.nsw.gov.au
Financial management
Baradine Pre-School Inc. $5,000
Bega Valley Shire Council $5,000
Big Fat Smile $5,000
Binnaway Pre-School $5,000
Bowraville Community Pre-School Inc. $5,000
Broken Hill Happy Day Pre-School Kindergarten Inc. $5,000
Bundgeam Pre-School Inc. $5,000
Bunyip Pre-School Harden Inc. $5,000
Cabramatta Community Centre Inc. $5,000
Casino Baptist Church Christian Community Pre-School
$5,000
Catholic Education Office Diocese of Parramatta $5,000
Cawongla Playhouse Inc. $5,000
Coldstream Community Pre-School Inc. $5,000
Coonamble Pre-School Association Inc. $5,000
Copmanhurst Pre-School $5,000
Country Women’s Association of NSW $5,000
Cranes Community Support Programs Ltd $5,000
Cringila Community Co-operative $5,000
Dalaigur Pre-School & Children’s Services Association Inc.
$10,000
Fairfield City Council $25,000
Felton Street Early Learning Pre-School Inc. $5,000
Gainmara Birrilee Pre-School Association Inc. $5,000
Gilgandra Pre-School Inc. $5,000
Girrawong Pre-School Inc. $5,000
Glen Innes Pre-School Association Inc. $5,000
Goodooga Pre-School Inc. $5,000
Gorokan Pre-School Inc. $5,000
Gyndarna Pre-School $5,000
Hibiscus Children’s Centre Inc. $5,000
Illawarra Aboriginal Corporation $5,000
Illawarra Area Child Care Ltd $5,000
Iluka Pre-School Inc. $5,000
Integricare $5,000
Inverell District Family Services Inc. $10,000
Jumbunna Community Pre-School & Early Intervention Centre Inc.
$5,000
Kempsey Children’s Services Co-operative Ltd $10,000
Koolyangarra Pre-School Aboriginal Corporation $5,000
Koorana Child & Family Services Inc. $5,000
KU Children’s Services $40,000
Kunghur Community Pre-School Inc. $5,000
Kurri Kurri and District Pre-School Kindergarten Inc. $5,000
Lightning Ridge Pre-School $5,000
Lismore Parish Centre Pre-School Inc. $5,000
Lismore Preschool Inc. $5,000
Lower Macleay Pre-School Inc. $5,000
Lyrebird Pre-School Kindergarten $5,000
Manilla Community Pre-School Inc. $5,000
Mission Australia $5,000
Moresby Park Pre-School Inc. $5,000
Mountain Pre-School Lowanna Inc. $5,000
Nambucca Heads Pre-School Play Centre Pty Ltd $5,000
Nanima Pre-School Association Inc. $5,000
Ngallingnee Jarjum Tabulam & District Community Preschool Inc.
$5,000
Ngayaamba Waluura Aboriginal Corporation $5,000
Nimbin Pre-School & Child Care Association Inc. $5,000
North St Marys Neighbourhood Centre Inc. $5,000
Peak Hill Pre-School Kindergarten Inc. $5,000
Playtime Pre-School Centre Inc. $5,000
Port Stephens Council $5,000
Rainbow Pre-School Association Inc. $10,000
Raymond Terrace Community Pre-School Inc. $5,000
Riverwood Community Centre Inc. $5,000
Rylstone Kandos Pre-School Inc. $5,000
Shoalhaven Community Pre-School Inc. $5,000
Southside Montessori Pre-School $5,000
St Mary’s Community Pre-School Casino Inc. $5,000
St Mary’s Guildford Pre-School $5,000
Stuarts Point Pre-School Association Inc. $5,000
Taree & District Pre-School Ltd $5,000
The Entrance Pre-School Kindergarten Association Inc. $5,000
Toormina Community Pre-School Incorporated $5,000
Toukley Pre-School Kindergarten Inc. $5,000
Tregear Presbyterian Kindergarten $5,000
Trustees Roman Catholic Church Diocese of Lismore $5,000
Tuntable Falls Early Childhood Centre Inc. $5,000
Upper Macleay Pre-School Inc. $5,000
Walgett Pre-School and Long Day Care Centre Inc. $5,000
Warilla Baptist Pre-School $5,000
Wauchope Pre-School Kindergarten Inc. $5,000
Weston Community Pre-School Inc. $10,000
Wingham & District Pre-School Kindergarten Ltd $5,000
Wyong Preschool Kindergarten Association Inc. $5,000
Total paid in 2014–15 $500,000
Miscellaneous Education Grants
Supporting non-government organisations making outstanding contributions to educational outcomes in NSW.
Australian Braille Authority $1,000
NSW Primary Principals’ Association Inc. $371,000
NSW Secondary Principals’ Council Inc. $190,203
Professional Teachers’ Council, NSW $308,178
School Administrative and Support Staff Professional Association (SASSPA) NSW Inc.
$27,738
Stewart House $227,150
Total paid in 2014–15 $1,125,269
NAIDOC Grants
Providing funding to celebrate the history, culture and achievements of Aboriginal and Torres Strait Islander peoples. NAIDOC Week is celebrated not only in Aboriginal communities but throughout Australia in schools, local councils and workplaces.
Aboriginal Medical Service Co-operative Ltd $1,000
Aged and Community Services NSW & ACT $1,000
Amaroo Local Aboriginal Land Council $700
Anaiwan Local Aboriginal Land Council $1,000
Anglicare Riverina $500
Armajun Aboriginal Health Service Inc. $1,000

155 NSW Department of Education Annual Report 2015 | www.dec.nsw.gov.au
Financial management
Armidale Dumaresq Council $2,000
Ashford Local Aboriginal Land Council $1,500
Bahtabah Local Aboriginal Land Council $2,000
Bankstown City Council $1,750
Barkuma Neighbourhood Centre Inc. $700
Barnardos Australia $800
Bathurst Local Aboriginal Land Council $1,000
Bega Local Aboriginal Land Council $1,500
BEST Employment Ltd $1,750
Birpai Local Aboriginal Land Council $2,000
Birrang Enterprise Development Company Ltd $2,500
Black Cockatoo Arts Inc. $2,200
Blacktown City Council $2,000
Booroongen Djugun Ltd $500
Bunyah Local Aboriginal Land Council $1,000
Coonabarabran Local Aboriginal Land Council $2,000
Cowra Information & Neighbourhood Centre Inc. $500
Deniliquin Local Aboriginal Land Council $1,000
Dubbo City Council $1,500
Edmund Rice College $2,000
Families Sharing Culture Aboriginal Corporation $1,000
First Hand Solutions Aboriginal Corporation $2,000
Forbes Preschool Kindergarten Co-op. Ltd. $500
Gloucester Worimi First Peoples Aboriginal Corporation
$1,500
Grafton Ngerrie Local Aboriginal Land Council $1,000
Growing Potential Ltd $2,000
Gurehlgam Corporation Ltd $1,000
Guthrie House Cooperative Inc. $1,250
Guyra Local Aboriginal Land Council $500
Henschke Primary School $500
Holy Spirit School $500
Holy Trinity Catholic Primary School $500
Illawarra Aboriginal Corporation $2,500
Illawarra Koori Men’s Support Group Inc. $990
Interrelate Ltd $2,000
James Sheahan Catholic High School $500
Jarjum Centre Inc. $1,000
Kamilaroi Ageing & Disability services $500
Karuah Preschool Association Inc. $800
Koori Kids $2,000
Kurrachee Co-operative Society Ltd $500
Kurranulla Aboriginal Corporation $1,500
La Salle Academy – Lithgow $500
Lower Hunter Aboriginal Inc. $750
MacKillop College – Bathurst $500
Merana Community Association for the Hawkesbury Inc.
$1,500
Mingaan Wiradjuri Aboriginal Corporation $1,500
Mingaletta Aboriginal & Torres Strait Islander Corporation
$1,750
Miyay Birray Youth Service Inc. $2,000
Multi-Purpose Allira Gathering Association $500
NAIDOC Westlakes Inc. $2,000
Namoi House Inc. $1,000
Narrabri Shire Council $500
National Centre of Indigenous Excellence Ltd $2,000
Ngambaga Bindarry Girrwaa Community Service Aboriginal Corporation
$500
Ngarru Mayin Elders Aboriginal Corporation $1,000
Nimbin Health and Welfare Association Inc. $1,000
Nyngan Local Aboriginal Land Council $1,500
Parkes & District Neighbourhood & Community Information Centre Inc.
$1,000
Pius X Aboriginal Corporation $1,500
Sandhills Foundation For Aboriginal Affairs (Aboriginal Corporation)
$1,000
Seventh-Day Adventist Schools (North New South Wales) Ltd
$2,500
SHINE for Kids Cooperative Ltd $500
Shoalhaven City Council $2,500
Snowy River Shire Council $860
South Coast Women’s Health and Welfare Aboriginal Corporation
$1,000
South Eastern Aboriginal Regional Management Service Cooperative Ltd
$2,500
Southern Women’s Group Inc. $1,000
St Francis Xavier School $2,500
St Joseph’s Primary School $500
St Mary’s Catholic School Wellington $500
St Vincent’s Hospital Ltd $500
Tamworth Regional Council $2,000
Taree Indigenous Development and Employment Ltd $2,500
Tharawal Local Aboriginal Land Council $1,500
The Assumption Catholic School Bathurst $500
Thiyama-Li Family Violence Service Inc. $1,500
Towri Aboriginal Corporation $500
Trustees of the Diocese of Wagga Wagga as Trustee for Kildare Catholic College
$500
Trustees of the Roman Catholic as Trustee for St Johns Primary Dubbo
$500
Tweed Byron Local Aboriginal Land Council $500
Twofold Aboriginal Corporation $3,000
Waddi Housing and Advancement Corporation Ltd $1,000
Wagga Wagga City Council $2,750
Walgett Local Aboriginal Land Council $1,500
Walla Mulla Family and Community Support Ltd $1,500
Wanaruah Local Aboriginal Land Council $700
Warren Macquarie Local Aboriginal Land Council $1,500
Wellington Council $1,000
Werin Aboriginal Corporation Medical Clinic $500
Winanga-Li Aboriginal Child and Family Centre Ltd $1,250
Wollondilly Shire Council $500
Woodville Community Services Inc. $1,500
Yalbillinga Boori Day Care Centre Aboriginal Corporation
$1,500
Total paid in 2014–15 $125,000
National Partnerships, National Quality Agenda for Early Childhood Education and Care
Formal partnerships between NSW and the Commonwealth Government in the areas of literacy and numeracy, low-socioeconomic-status school communities, rewards for great teachers, national quality framework, helping our kids understand finances and improving teacher quality.
Australian Children’s Education and Care Quality Authority
$2,077,740
Total paid in 2014–15 $2,077,740
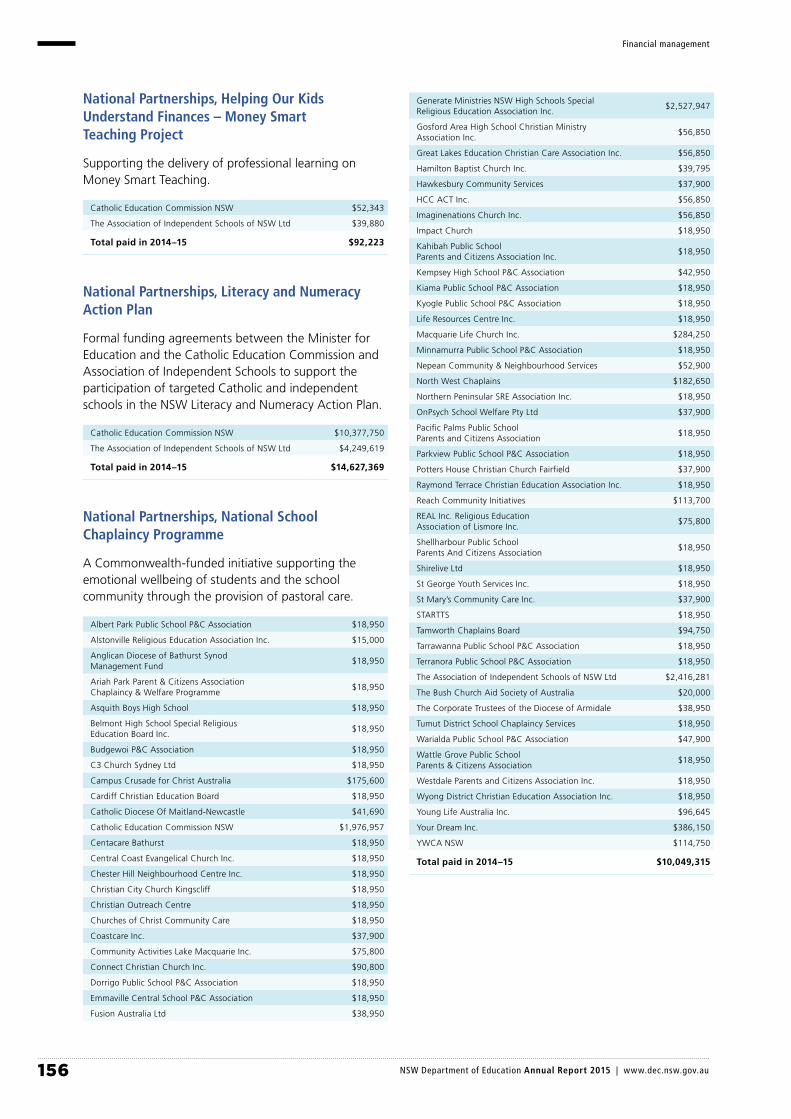
156 NSW Department of Education Annual Report 2015 | www.dec.nsw.gov.au
Financial management
National Partnerships, Helping Our Kids Understand Finances – Money Smart Teaching Project
Supporting the delivery of professional learning on Money Smart Teaching.
Catholic Education Commission NSW $52,343
The Association of Independent Schools of NSW Ltd $39,880
Total paid in 2014–15 $92,223
National Partnerships, Literacy and Numeracy Action Plan
Formal funding agreements between the Minister for Education and the Catholic Education Commission and Association of Independent Schools to support the participation of targeted Catholic and independent schools in the NSW Literacy and Numeracy Action Plan.
Catholic Education Commission NSW $10,377,750
The Association of Independent Schools of NSW Ltd $4,249,619
Total paid in 2014–15 $14,627,369
National Partnerships, National School Chaplaincy Programme
A Commonwealth-funded initiative supporting the emotional wellbeing of students and the school community through the provision of pastoral care.
Albert Park Public School P&C Association $18,950
Alstonville Religious Education Association Inc. $15,000
Anglican Diocese of Bathurst Synod Management Fund
$18,950
Ariah Park Parent & Citizens Association Chaplaincy & Welfare Programme
$18,950
Asquith Boys High School $18,950
Belmont High School Special Religious Education Board Inc.
$18,950
Budgewoi P&C Association $18,950
C3 Church Sydney Ltd $18,950
Campus Crusade for Christ Australia $175,600
Cardiff Christian Education Board $18,950
Catholic Diocese Of Maitland-Newcastle $41,690
Catholic Education Commission NSW $1,976,957
Centacare Bathurst $18,950
Central Coast Evangelical Church Inc. $18,950
Chester Hill Neighbourhood Centre Inc. $18,950
Christian City Church Kingscliff $18,950
Christian Outreach Centre $18,950
Churches of Christ Community Care $18,950
Coastcare Inc. $37,900
Community Activities Lake Macquarie Inc. $75,800
Connect Christian Church Inc. $90,800
Dorrigo Public School P&C Association $18,950
Emmaville Central School P&C Association $18,950
Fusion Australia Ltd $38,950
Generate Ministries NSW High Schools Special Religious Education Association Inc.
$2,527,947
Gosford Area High School Christian Ministry Association Inc.
$56,850
Great Lakes Education Christian Care Association Inc. $56,850
Hamilton Baptist Church Inc. $39,795
Hawkesbury Community Services $37,900
HCC ACT Inc. $56,850
Imaginenations Church Inc. $56,850
Impact Church $18,950
Kahibah Public School Parents and Citizens Association Inc.
$18,950
Kempsey High School P&C Association $42,950
Kiama Public School P&C Association $18,950
Kyogle Public School P&C Association $18,950
Life Resources Centre Inc. $18,950
Macquarie Life Church Inc. $284,250
Minnamurra Public School P&C Association $18,950
Nepean Community & Neighbourhood Services $52,900
North West Chaplains $182,650
Northern Peninsular SRE Association Inc. $18,950
OnPsych School Welfare Pty Ltd $37,900
Pacific Palms Public School Parents and Citizens Association
$18,950
Parkview Public School P&C Association $18,950
Potters House Christian Church Fairfield $37,900
Raymond Terrace Christian Education Association Inc. $18,950
Reach Community Initiatives $113,700
REAL Inc. Religious Education Association of Lismore Inc.
$75,800
Shellharbour Public School Parents And Citizens Association
$18,950
Shirelive Ltd $18,950
St George Youth Services Inc. $18,950
St Mary’s Community Care Inc. $37,900
STARTTS $18,950
Tamworth Chaplains Board $94,750
Tarrawanna Public School P&C Association $18,950
Terranora Public School P&C Association $18,950
The Association of Independent Schools of NSW Ltd $2,416,281
The Bush Church Aid Society of Australia $20,000
The Corporate Trustees of the Diocese of Armidale $38,950
Tumut District School Chaplaincy Services $18,950
Warialda Public School P&C Association $47,900
Wattle Grove Public School Parents & Citizens Association
$18,950
Westdale Parents and Citizens Association Inc. $18,950
Wyong District Christian Education Association Inc. $18,950
Young Life Australia Inc. $96,645
Your Dream Inc. $386,150
YWCA NSW $114,750
Total paid in 2014–15 $10,049,315

157 NSW Department of Education Annual Report 2015 | www.dec.nsw.gov.au
Financial management
National Partnerships, Programs Supporting Disengaged Youth
Supporting disadvantaged youth. The service includes educational programs such as the delivery of the Making Up for Lost Time in Literacy (MultiLIT) program as well as MiniLit and self-paced learning programs for disengaged youth.
The Exodus Foundation $600,000
Total paid in 2014–15 $600,000
NSW Reconciliation Council
Building relationships between Aboriginal and non-Aboriginal people in NSW, increase the profile of NAIDOC week and Reconciliation week and promote awareness of initiatives such as healing that support reconciliation.
NSW State Reconciliation Council $245,000
Total paid in 2014–15 $245,000
Our Languages, Our Way
Supporting Aboriginal community ownership and participation in Aboriginal language revitalisation.
Bega Aboriginal Education Consultative Group $27,220
Eastern Zone Gujaga Aboriginal Corporation $28,447
Eden Local Aboriginal Land Council $26,620
Murdi Paaki Regional Enterprise Corporation Ltd $29,173
Muurrbay Aboriginal Language and Culture Co-operative Ltd
$52,100
Total paid in 2014–15 $163,560
Productivity Places Program Grants
Providing training to upskill industry sectors and workers, as well as supporting job seekers to develop the necessary skills to gain employment.
Access Group Training Ltd $1,412
Access Training Institute Pty Ltd $12,540
ACE Community Colleges Ltd $16,170
Active Industry Training Ltd $8,813
Applied Training Solutions Pty Ltd $24,933
Atkinson Training & Development Pty Ltd $1,665
Australian College of Commerce and Management Pty Ltd
$1,561
Auswide Projects Ltd $924
Bannister Technical Pty Ltd $14,784
Benchmark Resources Pty Ltd $36,510
Coates Hospitality Services Pty Ltd $16,513
Employment & Training Australia Inc. $11,998
Enterprise & Training Company Ltd $6,534
Equalis Pty Ltd $2,873
Forsythes IT & Training Pty Ltd $80,640
House With No Steps $8,879
Illawarra Area Child Care Ltd $12,433
Illawarra Retirement Trust $26,136
International Child Care College Pty Ltd $1,245
Julie Reid Management Pty Ltd $2,189
Karben Training Solutions $14,281
Kreate Pty Ltd $12,882
Lianrick Pty Ltd $23,004
M.B.H. Management Pty Ltd $12,147
Macquarie Employment Training Service Inc. $5,445
Mental Health Co-ordinating Council Inc. $7,987
OCTEC Ltd $2,224
Ramsden Telecommunications Training Pty Ltd $1,285
Recognition First Pty Ltd $7,623
Royal Rehabilitation Centre Sydney $18,905
Southern Pathology Services Pty Ltd $1,911
Tamworth Community College Inc. $3,799
Taronga Conservation Society Australia $18,716
The Association of Superannuation Funds of Australia Ltd
$2,888
The Illawarra ITeC Ltd $1,315
The Quality Training Company Pty Ltd $13,194
UNE Partnerships Pty Ltd $9,148
Workers Educational Association $27,566
Total paid in 2014–15 $473,072
Regional Conservatorium of Music Grants
Providing operating funding to conservatoriums to offer a comprehensive range of music-educational activities for students and community members.
Association of NSW Regional Conservatoriums Inc. $60,000
Central Coast Conservatorium Inc. $397,034
Clarence Valley Conservatorium Inc. $452,517
Coffs Harbour Regional Conservatorium Ltd $356,459
Conservatorium Mid North Coast Inc. $75,000
Goulburn Regional Conservatorium Inc. $356,459
Gunnedah Conservatorium Inc. $149,157
Macquarie Conservatorium of Music Inc. $356,459
Mitchell Conservatorium Inc. $422,034
Murray Conservatorium Inc. $401,746
New England Conservatorium of Music Ltd $407,034
Northern Rivers Conservatorium Arts Centre Inc. $336,171
Orange Regional Conservatorium Inc. $260,400
Riverina Conservatorium of Music Ltd $403,534
South West Music Inc. $197,901
Tamworth Regional Conservatorium Of Music Inc. $356,459
Upper Hunter Conservatorium of Music Inc. $376,746
Wollongong Conservatorium Of Music Ltd $397,034
Young Regional School Of Music Inc. $356,459
Total paid in 2014–15 $6,118,602

158 NSW Department of Education Annual Report 2015 | www.dec.nsw.gov.au
Financial management
Skills Reform Program
Delivering a productive and highly skilled workforce that contributes to Australia’s economic future and enables all working-age Australians to develop the skills and qualifications needed to participate effectively in the labour market.
A H F B Pty Ltd $7,337
Aboriginal Health and Medical Research Council of NSW
$259,438
Above & Below Adventure Company Pty Ltd $114,999
Acacia Group Ltd $469,443
Academy Holdings Pty Ltd $135,888
Access Community Group Ltd $7,927
Access Group Training Ltd $320,849
Access Training Institute Pty Ltd $88,457
ACE – North Coast Inc. $883,120
ACE Community Colleges Ltd $198,014
Active Career College Pty Ltd $19,760
Active Industry Training Ltd $96,134
Advanced Education Australia Pty Ltd $288,288
Alan Bartlett Consulting Pty Ltd $1,280
Albury Wodonga Community College Ltd $229,566
Alstonville–Ballina Community College $586,160
Anglicare Canberra & Goulburn $53,048
Apex Training Solutions Pty Ltd $570,971
Applied Training Solutions Pty Ltd $410,092
Ash Pty Ltd $32,217
Astute Training Pty Ltd $250,470
Atkinson Training & Development Pty Ltd $21,093
Aurora Training and Professional Services Pty Ltd $140,851
Austrain Academy Pty Ltd $102,505
Australian Airline Pilot Academy Pty Ltd $184,800
Australian Child Care Career Options (ACCCO) Pty Ltd $17,909
Australian College of Commerce and Management Pty Ltd
$1,248,854
Australian College of Management Studies Pty Ltd $102,373
Australian College of Professionals Pty Ltd $95,737
Australian Construction Training Services Pty Ltd $33,445
Australian Education & Training Solutions Pty Ltd $135,432
Australian Employment & Training Solutions Pty Ltd $15,414
Australian Forensic Services Pty Ltd $63,924
Australian Health Professional Training Solutions Pty Ltd
$50,385
Australian Industry GroupTraining Services Pty Ltd $13,865
Australian Institute of Workplace Learning Pty Ltd $171,785
Australian Integrated Training $3,058
Australian Red Cross Society $26,101
Australian Retailers Association $720,505
Australian Salesmasters Training Co Pty Ltd $71,227
Australian Training Company Ltd $66,627
Australian Vocational Training Academy Pty Ltd $33,396
Auswide Projects Ltd $49,333
Avana Learning Pty Ltd $36,816
Ballina Region Community College Inc. $41,057
Bankstown Community College Inc. $54,669
Bannister Technical Pty Ltd $540,447
Barrington Training Services Pty Ltd $627,927
BBT Training Australia Pty Ltd $358,970
BCA National Training Group Pty Ltd $331,053
Belelmo Pty Ltd $4,205
Benchmark Resources Pty Ltd $565,233
Blended Learning International Pty Ltd $9,654
Blue Visions Management Pty Ltd $427,210
Booroongen Djugun Aboriginal Corporation $3,845
Brainwave Learning Centre Pty Ltd $30,349
Break Thru People Solutions $131,454
Bridgeworks Personnel Ltd $274,043
Brucemac Pty Ltd $167,300
Byron Region Community College Inc. $738,045
C E Training Consultants Pty Ltd $646,539
Camden Haven Community College Inc. $587,346
Careers Australia Institute of Training Pty Ltd $17,558
Central Coast Community College $1,001,653
Cerebral Palsy Alliance $183,817
Challenger Training Pty Ltd $12,770
City East Community College Inc. $388,189
City-Wide Building and Training Services Pty Ltd $62,048
Club Sail Pty Ltd $11,884
Coates Hospitality Services Pty Ltd $400,405
Coffs Coast Community College Inc. $365,126
College of Transformation Education & Training Pty Ltd $47,612
Comet Training Pty Ltd $75,940
Community Child Care Co-operative Ltd $120,438
Community College–Northern Inland Inc. $1,150,269
Community Colleges Australia Ltd $87,500
Congia Enterprises Pty Ltd $6,608
Contour Systems Pty Ltd $19,437
Co-operative for Aborigines Ltd $16,345
Co-operative Learning Ltd $90,000
Dental Assistants Professional Association Inc. $9,569
Diversity Skills Training Pty Ltd $7,290
Donna Mere Morrell-Pullin $131,393
East West Training Solutions Pty Ltd $61,318
Education Training & Employment Australia Pty Ltd $25,616
Educational Living Pty Ltd $6,553
Emma’s Secret Investments Pty Ltd $3,770
Employment & Training Australia Inc. $489,940
Endeavour Industries Ltd $13,513
Enterprise & Training Company Ltd $432,871
Equalis Pty Ltd $71,826
Equals International (Aust) Pty Ltd $3,338
Essential Personnel Association Inc. $19,620
F.A.C.T.S. (Geelong) Pty Ltd $13,056
Ferngood Pty Ltd $21,973
First Impressions Resources Pty Ltd $77,851
Five Star Training Pty Ltd $39,426
Ford Motor Company of Australia Ltd $2,512
Fork Skills Operations Pty Ltd $200,655
Forsythes IT & Training Pty Ltd $735,946
Foundation Education Pty Ltd $1,364
Frankyln Scholar (Australia) Pty Ltd $367,283
Furnishing Industry Association of Australia Ltd $38,548
GL Marketing & Distribution Pty Ltd $40,963
Glen Charles Knight $21,965
Griffith Skills Training Centre Inc. $68,914
Group314 Pty Ltd $231,125
H&H Accredited Training Australasia Inc. $540,585
Health & Safety Advisory Services Pty Ltd $55,103
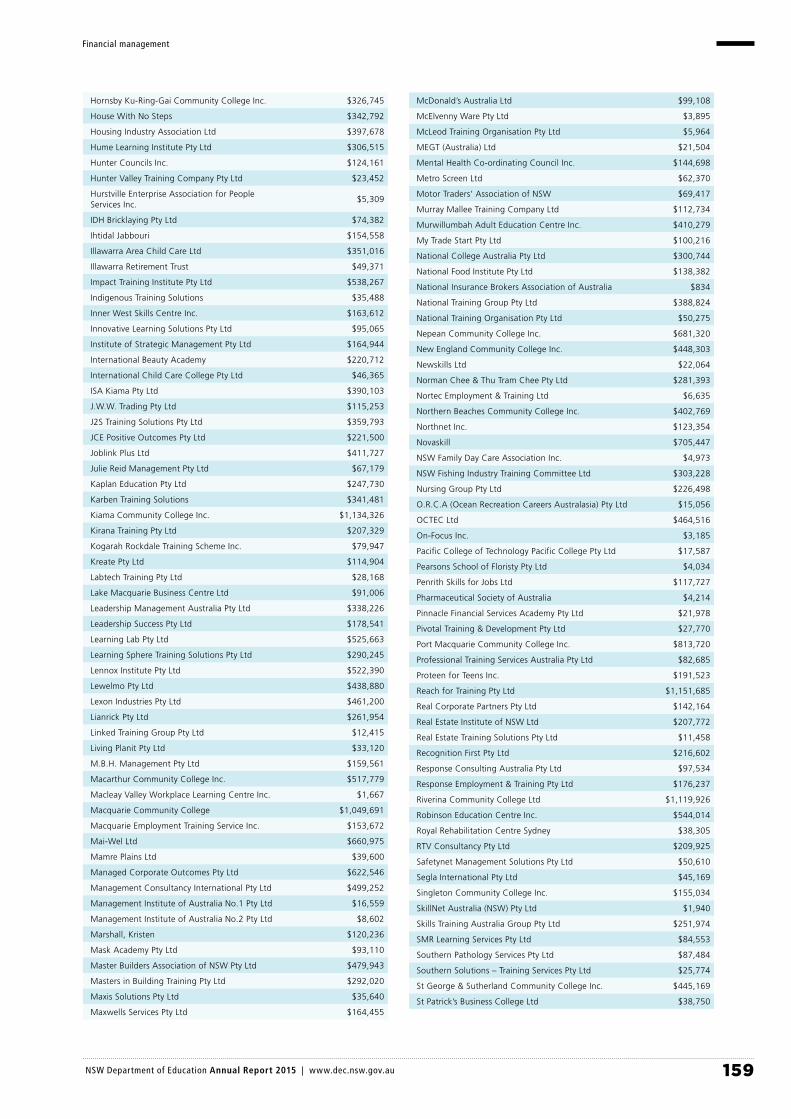
159 NSW Department of Education Annual Report 2015 | www.dec.nsw.gov.au
Financial management
Hornsby Ku-Ring-Gai Community College Inc. $326,745
House With No Steps $342,792
Housing Industry Association Ltd $397,678
Hume Learning Institute Pty Ltd $306,515
Hunter Councils Inc. $124,161
Hunter Valley Training Company Pty Ltd $23,452
Hurstville Enterprise Association for People Services Inc.
$5,309
IDH Bricklaying Pty Ltd $74,382
Ihtidal Jabbouri $154,558
Illawarra Area Child Care Ltd $351,016
Illawarra Retirement Trust $49,371
Impact Training Institute Pty Ltd $538,267
Indigenous Training Solutions $35,488
Inner West Skills Centre Inc. $163,612
Innovative Learning Solutions Pty Ltd $95,065
Institute of Strategic Management Pty Ltd $164,944
International Beauty Academy $220,712
International Child Care College Pty Ltd $46,365
ISA Kiama Pty Ltd $390,103
J.W.W. Trading Pty Ltd $115,253
J2S Training Solutions Pty Ltd $359,793
JCE Positive Outcomes Pty Ltd $221,500
Joblink Plus Ltd $411,727
Julie Reid Management Pty Ltd $67,179
Kaplan Education Pty Ltd $247,730
Karben Training Solutions $341,481
Kiama Community College Inc. $1,134,326
Kirana Training Pty Ltd $207,329
Kogarah Rockdale Training Scheme Inc. $79,947
Kreate Pty Ltd $114,904
Labtech Training Pty Ltd $28,168
Lake Macquarie Business Centre Ltd $91,006
Leadership Management Australia Pty Ltd $338,226
Leadership Success Pty Ltd $178,541
Learning Lab Pty Ltd $525,663
Learning Sphere Training Solutions Pty Ltd $290,245
Lennox Institute Pty Ltd $522,390
Lewelmo Pty Ltd $438,880
Lexon Industries Pty Ltd $461,200
Lianrick Pty Ltd $261,954
Linked Training Group Pty Ltd $12,415
Living Planit Pty Ltd $33,120
M.B.H. Management Pty Ltd $159,561
Macarthur Community College Inc. $517,779
Macleay Valley Workplace Learning Centre Inc. $1,667
Macquarie Community College $1,049,691
Macquarie Employment Training Service Inc. $153,672
Mai-Wel Ltd $660,975
Mamre Plains Ltd $39,600
Managed Corporate Outcomes Pty Ltd $622,546
Management Consultancy International Pty Ltd $499,252
Management Institute of Australia No.1 Pty Ltd $16,559
Management Institute of Australia No.2 Pty Ltd $8,602
Marshall, Kristen $120,236
Mask Academy Pty Ltd $93,110
Master Builders Association of NSW Pty Ltd $479,943
Masters in Building Training Pty Ltd $292,020
Maxis Solutions Pty Ltd $35,640
Maxwells Services Pty Ltd $164,455
McDonald’s Australia Ltd $99,108
McElvenny Ware Pty Ltd $3,895
McLeod Training Organisation Pty Ltd $5,964
MEGT (Australia) Ltd $21,504
Mental Health Co-ordinating Council Inc. $144,698
Metro Screen Ltd $62,370
Motor Traders’ Association of NSW $69,417
Murray Mallee Training Company Ltd $112,734
Murwillumbah Adult Education Centre Inc. $410,279
My Trade Start Pty Ltd $100,216
National College Australia Pty Ltd $300,744
National Food Institute Pty Ltd $138,382
National Insurance Brokers Association of Australia $834
National Training Group Pty Ltd $388,824
National Training Organisation Pty Ltd $50,275
Nepean Community College Inc. $681,320
New England Community College Inc. $448,303
Newskills Ltd $22,064
Norman Chee & Thu Tram Chee Pty Ltd $281,393
Nortec Employment & Training Ltd $6,635
Northern Beaches Community College Inc. $402,769
Northnet Inc. $123,354
Novaskill $705,447
NSW Family Day Care Association Inc. $4,973
NSW Fishing Industry Training Committee Ltd $303,228
Nursing Group Pty Ltd $226,498
O.R.C.A (Ocean Recreation Careers Australasia) Pty Ltd $15,056
OCTEC Ltd $464,516
On-Focus Inc. $3,185
Pacific College of Technology Pacific College Pty Ltd $17,587
Pearsons School of Floristy Pty Ltd $4,034
Penrith Skills for Jobs Ltd $117,727
Pharmaceutical Society of Australia $4,214
Pinnacle Financial Services Academy Pty Ltd $21,978
Pivotal Training & Development Pty Ltd $27,770
Port Macquarie Community College Inc. $813,720
Professional Training Services Australia Pty Ltd $82,685
Proteen for Teens Inc. $191,523
Reach for Training Pty Ltd $1,151,685
Real Corporate Partners Pty Ltd $142,164
Real Estate Institute of NSW Ltd $207,772
Real Estate Training Solutions Pty Ltd $11,458
Recognition First Pty Ltd $216,602
Response Consulting Australia Pty Ltd $97,534
Response Employment & Training Pty Ltd $176,237
Riverina Community College Ltd $1,119,926
Robinson Education Centre Inc. $544,014
Royal Rehabilitation Centre Sydney $38,305
RTV Consultancy Pty Ltd $209,925
Safetynet Management Solutions Pty Ltd $50,610
Segla International Pty Ltd $45,169
Singleton Community College Inc. $155,034
SkillNet Australia (NSW) Pty Ltd $1,940
Skills Training Australia Group Pty Ltd $251,974
SMR Learning Services Pty Ltd $84,553
Southern Pathology Services Pty Ltd $87,484
Southern Solutions – Training Services Pty Ltd $25,774
St George & Sutherland Community College Inc. $445,169
St Patrick’s Business College Ltd $38,750

160 NSW Department of Education Annual Report 2015 | www.dec.nsw.gov.au
Financial management
Statewide Business Training Pty Ltd $104,328
Steven Millard & Associates Pty Ltd $87,892
Study Group Australia Pty Ltd $52,470
Sureway Skills Training Pty Ltd $583,547
Swimming Pool & Spa Association of NSW Ltd $20,319
Sydney Community College Ltd $140,000
Sydneylearning Pty Ltd $3,993
Tactical Training Group Pty Ltd $555,808
Tamworth Community College Inc. $672,376
Taronga Conservation Society Australia $17,396
The Association of Superannuation Funds of Australia Ltd
$257,575
The Centre for Volunteering $10,692
The Change Network Pty Ltd $487,873
The College of Nursing $3,722
The Crusader Union of Australia $4,480
The Deaf Society of NSW $488,791
The Design Works College of Design Pty Ltd $1,789
The Eurobodalla Adult Education Centre Inc. $638,491
The Illawarra ITeC Ltd $464,169
The LDC Group Asia Pacific Pty Ltd $11,083
The Meetings Industry Association of Australia Ltd $203,693
The ORS Group Pty Ltd $4,620
The Parramatta College Inc. $398,729
The Pharmacy Guild of Australia $9,440
The Quality Training Company Pty Ltd $853,773
The Uniting Church in Australia Property Trust (NSW) $1,369,532
Tomaree Community College Inc. $418,704
Train Australia Pty Ltd $11,700
Traineeship Management Australia Pty Ltd $812,908
Training Beyond 2000 Pty Ltd $70,781
Training Education & Management Services Pty Ltd $8,263
Training Experts Australia Pty Ltd $12,896
Training Specialists (Australia) Pty Ltd $310,936
Transformed Pty Ltd $10,598
Transqual Pty Ltd $2,596
Trustee for The Salvation Army (NSW) Property Trust $326,233
Tuggerah Lakes Community College Inc. $702,437
Tursa Employment & Training Inc. $26,599
UNE Partnerships Pty Ltd $756,057
United World College Pty Ltd $259,327
UPC Pty Ltd $251,023
Upskilled Pty Ltd $216,910
Verto Ltd $1,573,681
Vijia Chain $175,184
Vision Training Institute Pty Ltd $694,275
Vocational Institute of Australia Pty Ltd $4,870
Vocational Training Australia Pty Ltd $25,410
W G Learning Pty Ltd $39,994
Waverly Action for Youth Services Inc. $18,350
Western College Inc. $858,650
Western Riverina Community College Inc. $411,836
Westrac Pty Ltd $45,441
Wise Group Ltd Partnership $340,289
Work Savvy Pty Ltd $274,906
Workers Educational Association $2,749,618
WPC Group Ltd $8,077
Yarnteen College Inc. $26,992
Total paid in 2014–15 $67,841,965
Strategic Skills Program Grants
Providing training to upskill workers and support job seekers in developing the necessary skills to gain employment.
Academy of Training Pty Ltd $1,454
Access Group Training Ltd $22,326
ACE Community Colleges Ltd $8,133
Active Industry Training Ltd $67,205
Agrifood Skills Australia Ltd $35,188
Applied Training Solutions Pty Ltd $15,206
Association of Childrens Welfare Agencies Inc. $2,287
Atkinson Training & Development Pty Ltd $2,534
Aurora Training and Professional Services Pty Ltd $7,339
Austrain Academy Pty Ltd $19,608
Australian College of Commerce and Management Pty Ltd
$18,269
Australian Forensic Services Pty Ltd $12,830
Australian Health Professional Training Solutions Pty Ltd
$33,399
Australian Institute of Management NSW & ACT Training Centre Ltd
$15,316
Australian Institute of Workplace Learning Pty Ltd $2,306
Australian Retailers Association $114,152
Australian Training Company Ltd $111,409
Bannister Technical Pty Ltd $33,345
Barrington Training Services Pty Ltd $85,598
BBT Training Australia Pty Ltd $24,665
BCA National Training Group Pty Ltd $40,545
Benchmark Resources Pty Ltd $155,505
Blue Visions Management Pty Ltd $69,027
Bridgeworks Personnel Ltd $13,162
Canterbury–Hurlstone Park RSL Club Ltd $93,022
Centre for Excellence in Rail Training Pty Ltd $2,807
Century Group Pty Ltd $31,647
Cerebral Palsy Alliance $123,218
Coates Hospitality Services Pty Ltd $2,905
Community College–Northern Inland Inc. $69,839
Congia Enterprises Pty Ltd $4,925
Co-operative for Aborigines Ltd $632,071
CTPM Australasia Pty Ltd $43,898
Donna Mere Morrell-Pullin $75,971
Eagle Wing Education and Training Pty Ltd $140,769
Education Training & Employment Australia Pty Ltd $9,000
Employment & Training Australia Inc. $263,848
Endeavour Industries Ltd $11,034
Enterprise & Training Company Ltd $7,380
Equalis Pty Ltd $38,449
Equals International (Aust) Pty Ltd $17,484
Essential Personnel Association Inc. $21,910
Five Star Training Pty Ltd $101,200
Forestworks Ltd $28,500
Forsythes IT & Training Pty Ltd $461,189
Franklyn Scholar (Australia) Pty Ltd $17,343
Hammond Institute Pty Ltd $88,391
House With No Steps $100,247
Hume Learning Institute Pty Ltd $56,298
IDH Bricklaying Pty Ltd $146,562
Illawarra Area Child Care Ltd $10,589
Illawarra Retirement Trust $38,776

161 NSW Department of Education Annual Report 2015 | www.dec.nsw.gov.au
Financial management
Impact Training Institute Pty Ltd $115,325
Indigenous Training Solutions $74,658
Institute of Strategic Management Pty Ltd $194,760
International Child Care College Pty Ltd $1,023
ISA Kiama Pty Ltd $10,204
JCE Positive Outcomes Pty Ltd $12,750
Joblink Plus Ltd $1,318
John Joseph Norton $25,567
Julie Reid Management Pty Ltd $12,764
Karben Training Solutions $122,621
Kogarah Rockdale Training Scheme Inc. $25,729
Learning Sphere Training Solutions Pty Ltd $114,972
Lennox Institute Pty Ltd $18,401
Lewelmo Pty Ltd $25,780
Lexon Industries Pty Ltd $11,015
Lianrick Pty Ltd $137,446
M.B.H. Management Pty Ltd $4,562
Mai-Wel Ltd $269,438
Management Consultancy International Pty Ltd $163,895
Manufacturing Skills Australia $46,500
Master Builders Association of NSW Pty Ltd $24,219
McElvenny Ware Pty Ltd $29,515
Metro Screen Ltd $22,453
Mobile Plant Operator Training Services Pty Ltd $9,504
National Aboriginal & Islander Skills Development Association (NAISDA) Inc.
$98,899
National College Australia Pty Ltd $4,570
National Food Institute Pty Ltd $3,493
Nortec Employment & Training Ltd $16,638
Northern Beaches Community College Inc. $12,524
Novaskill $56,260
NSW Community Services & Health Industry Training Advisory Body Inc.
$30,000
NSW Fishing Industry Training Committee Ltd $97,662
NSW Public Sector Industry Training Advisory Body Inc. $28,500
NSW Utilities & Electrotechnology Industry Training Advisory Body Ltd
$30,000
Nursing Group Pty Ltd $104,469
O.R.C.A (Ocean Recreation Careers Australasia) Pty Ltd $66,387
Pegasus Management Pty Ltd $47,553
Penrith Skills For Jobs Ltd $46,985
Pivotal Training & Development Pty Ltd $2,856
Precision Training Australia Pty Ltd $29,249
Professional Training Services Australia Pty Ltd $73,080
Reach for Training Pty Ltd $130,505
Real Estate Institute of NSW $17,325
Recognition First Pty Ltd $3,190
Resources and Infrastructure NSW ITAB Ltd $24,935
Riverina Community College Ltd $28,805
RTV Consultancy Pty Ltd $3,787
Service Skills Australia $52,500
Skills Training Australia Group Pty Ltd $27,648
Southern Pathology Services Pty Ltd $990
Southern Training Organisation Pty Ltd $13,283
St George & Sutherland Community College Inc. $78,800
St Patrick’s Business College Ltd $13,871
Study Group Australia Pty Ltd $18,480
Sureway Skills Training Pty Ltd $35,664
Tamworth Community College Inc. $67,741
Taronga Conservation Society Australia $66,839
The Association of Superannuation Funds of Australia Ltd
$34,848
The Centre for Volunteering $18,349
The Deaf Society of NSW $77,683
The Eurobodalla Adult Education Centre Inc. $9,979
The Illawarra ITeC Ltd $23,623
The Pharmacy Guild of Australia $1,565
The Uniting Church in Australia Property Trust (NSW) $98,613
Training Beyond 2000 Pty Ltd $50,047
Transport and Logistics Industry Skills Council Ltd $37,500
Trustee for The Salvation Army (NSW) Property Trust $37,714
UNE Partnerships Pty Ltd $79,725
UPC Pty Ltd $22,379
Upskilled Pty Ltd $43,400
Verto Ltd $30,845
Waverly Action for Youth Services Inc. $140,350
Work Savvy Pty Ltd $29,845
Workers Educational Association $158,234
Total paid in 2014–15 $7,252,682
VET in Schools Consortium Grants
Purchasing externally delivered vocational education and training (VET) courses for secondary students.
Catholic Education Commission NSW $866,544
The Association of Independent Schools of NSW Ltd $562,836
Total paid in 2014–15 $1,429,380
Youth Assistance Strategies Grants
Developing programs designed to prevent youth from disengaging from educational opportunities.
3Bridges Community Inc. $78,155
Access Community Group Ltd $167,930
Albury/Wodonga Youth Emergency Services Ltd $60,000
Anglicare Canberra & Goulburn $143,252
Arab Council of Australia Inc. $2,324
Auswide Projects Ltd $24,711
Backtrack Youth Works Jobs Australia Enterprises Ltd $177,135
Bellambi Neighbourhood Centre Inc. $131,928
Blacktown Youth Services Association Inc. $1,657
Break Thru People Solutions $110,227
Byron Youth Service Inc. $42,768
Campbell Page Ltd $79,220
Capital Country Industry Education Partnership (CCIEP) Inc.
$282,620
Careers Network Inc. $210,000
Centacare Diocese of Wilcannia – Forbes $74,096
Central Coast Community College $76,398
Cessnock District Learning Centre Inc. $50,966
Coffs Coast Community College Inc. $105,142
Coolamon Shire Council $65,450
Employment & Training Australia Inc. $53,015
Enterprise & Training Company Ltd $24,458
Granville Multicultural Community Centre Inc. $108,294
Heaps Decent Ltd $35,000
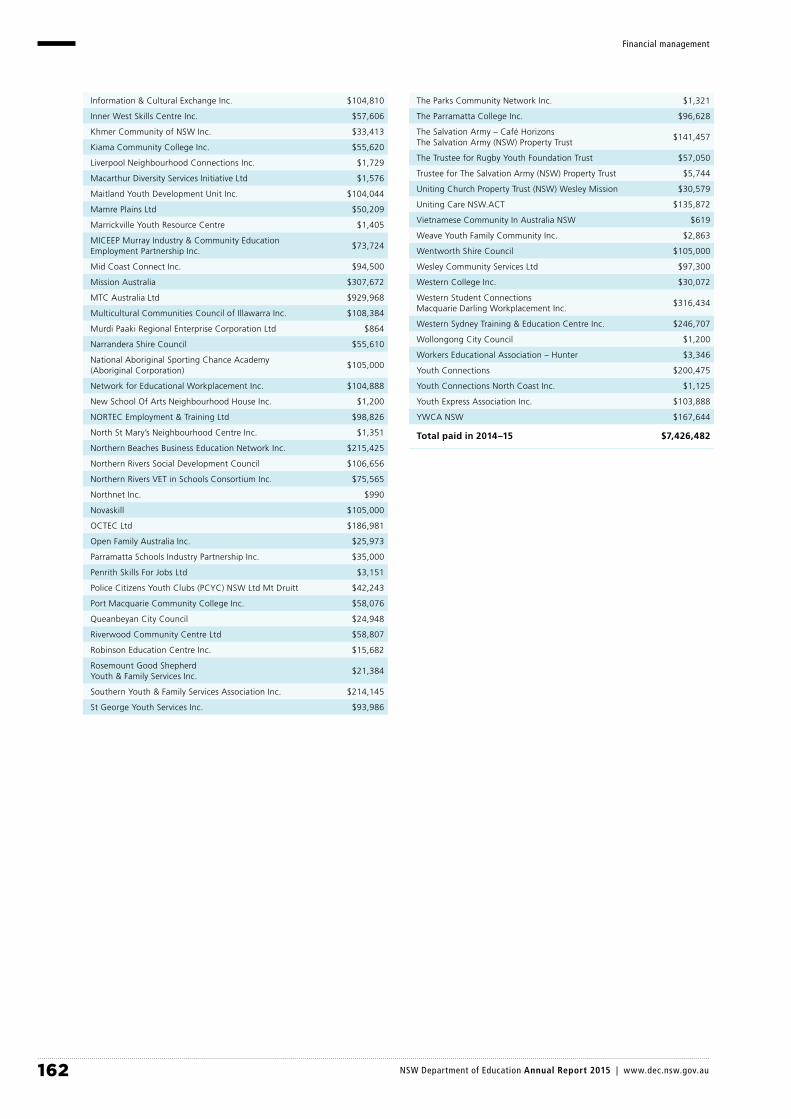
162 NSW Department of Education Annual Report 2015 | www.dec.nsw.gov.au
Financial management
Information & Cultural Exchange Inc. $104,810
Inner West Skills Centre Inc. $57,606
Khmer Community of NSW Inc. $33,413
Kiama Community College Inc. $55,620
Liverpool Neighbourhood Connections Inc. $1,729
Macarthur Diversity Services Initiative Ltd $1,576
Maitland Youth Development Unit Inc. $104,044
Mamre Plains Ltd $50,209
Marrickville Youth Resource Centre $1,405
MICEEP Murray Industry & Community Education Employment Partnership Inc.
$73,724
Mid Coast Connect Inc. $94,500
Mission Australia $307,672
MTC Australia Ltd $929,968
Multicultural Communities Council of Illawarra Inc. $108,384
Murdi Paaki Regional Enterprise Corporation Ltd $864
Narrandera Shire Council $55,610
National Aboriginal Sporting Chance Academy (Aboriginal Corporation)
$105,000
Network for Educational Workplacement Inc. $104,888
New School Of Arts Neighbourhood House Inc. $1,200
NORTEC Employment & Training Ltd $98,826
North St Mary’s Neighbourhood Centre Inc. $1,351
Northern Beaches Business Education Network Inc. $215,425
Northern Rivers Social Development Council $106,656
Northern Rivers VET in Schools Consortium Inc. $75,565
Northnet Inc. $990
Novaskill $105,000
OCTEC Ltd $186,981
Open Family Australia Inc. $25,973
Parramatta Schools Industry Partnership Inc. $35,000
Penrith Skills For Jobs Ltd $3,151
Police Citizens Youth Clubs (PCYC) NSW Ltd Mt Druitt $42,243
Port Macquarie Community College Inc. $58,076
Queanbeyan City Council $24,948
Riverwood Community Centre Ltd $58,807
Robinson Education Centre Inc. $15,682
Rosemount Good Shepherd Youth & Family Services Inc.
$21,384
Southern Youth & Family Services Association Inc. $214,145
St George Youth Services Inc. $93,986
The Parks Community Network Inc. $1,321
The Parramatta College Inc. $96,628
The Salvation Army – Café Horizons The Salvation Army (NSW) Property Trust
$141,457
The Trustee for Rugby Youth Foundation Trust $57,050
Trustee for The Salvation Army (NSW) Property Trust $5,744
Uniting Church Property Trust (NSW) Wesley Mission $30,579
Uniting Care NSW.ACT $135,872
Vietnamese Community In Australia NSW $619
Weave Youth Family Community Inc. $2,863
Wentworth Shire Council $105,000
Wesley Community Services Ltd $97,300
Western College Inc. $30,072
Western Student Connections Macquarie Darling Workplacement Inc.
$316,434
Western Sydney Training & Education Centre Inc. $246,707
Wollongong City Council $1,200
Workers Educational Association – Hunter $3,346
Youth Connections $200,475
Youth Connections North Coast Inc. $1,125
Youth Express Association Inc. $103,888
YWCA NSW $167,644
Total paid in 2014–15 $7,426,482
163 NSW Department of Education Annual Report 2015 | www.dec.nsw.gov.au
Contact us
CONTACT US
The Department of Education is located at:
35 Bridge Street Sydney NSW 2000
Phone: 1300 679 332
Office hours: 8.30am to 5.00pm
Website: dec.nsw.gov.au
Email address: [email protected]
NSW public schools
The department operates more than 2,200 schools across NSW. Addresses and contact details for all public schools are available on the website: www.schools.nsw.edu.au/schoolfind
Aboriginal Affairs
Website: aboriginalaffairs.nsw.gov.au
Contact details for Aboriginal Affairs regional offices: aboriginalaffairs.nsw.gov.au/contact
State Training Services
As part of machinery-of-government changes that came into effect on 1 July 2015, the functions of State Training Services transferred to the Department of Industry, Skills and Regional Development. State Training Services head office is located at:
Level 12, 1 Oxford Street Darlinghurst NSW 2010
Phone: (02) 9561 8000
Website: training.nsw.gov.au
Locations and contact details for regional offices are available on the website.
Office of Communities
As part of machinery-of-government changes that came into effect on 1 July 2015, the functions of Communities Policy and Programs, Office of Communities, transferred to the Department of Family and Community Services. The functions are now part of the Participation and Inclusion directorate in the Programs and Service Delivery division, located at:
223–229 Liverpool Rd Ashfield NSW 2131
Information on Participation and Inclusion is on the Family and Community Services website: facs.nsw.gov.au/participation-and-inclusion
Volunteering website: volunteering.nsw.gov.au
Youth website: youth.nsw.gov.au
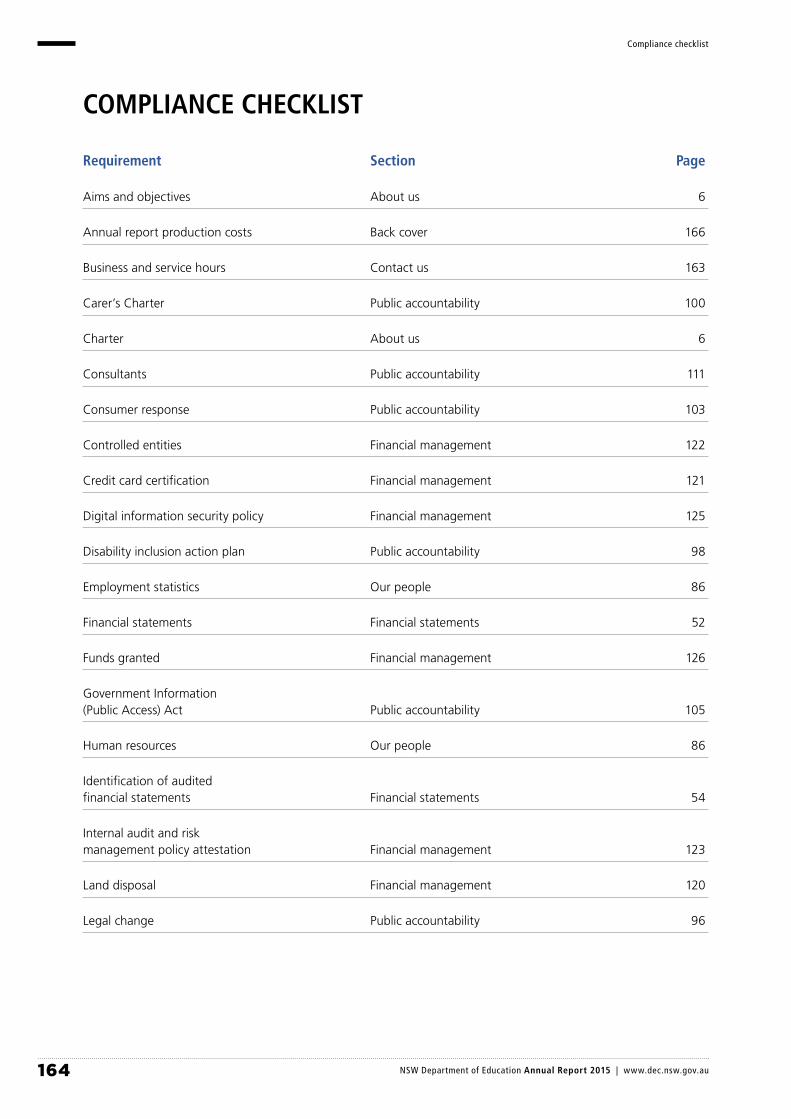
164 NSW Department of Education Annual Report 2015 | www.dec.nsw.gov.au
Compliance checklist
COMPLIANCE CHECKLIST
Requirement Section Page
Aims and objectives About us 6
Annual report production costs Back cover 166
Business and service hours Contact us 163
Carer’s Charter Public accountability 100
Charter About us 6
Consultants Public accountability 111
Consumer response Public accountability 103
Controlled entities Financial management 122
Credit card certification Financial management 121
Digital information security policy Financial management 125
Disability inclusion action plan Public accountability 98
Employment statistics Our people 86
Financial statements Financial statements 52
Funds granted Financial management 126
Government Information (Public Access) Act Public accountability 105
Human resources Our people 86
Identification of audited financial statements Financial statements 54
Internal audit and risk management policy attestation Financial management 123
Land disposal Financial management 120
Legal change Public accountability 96
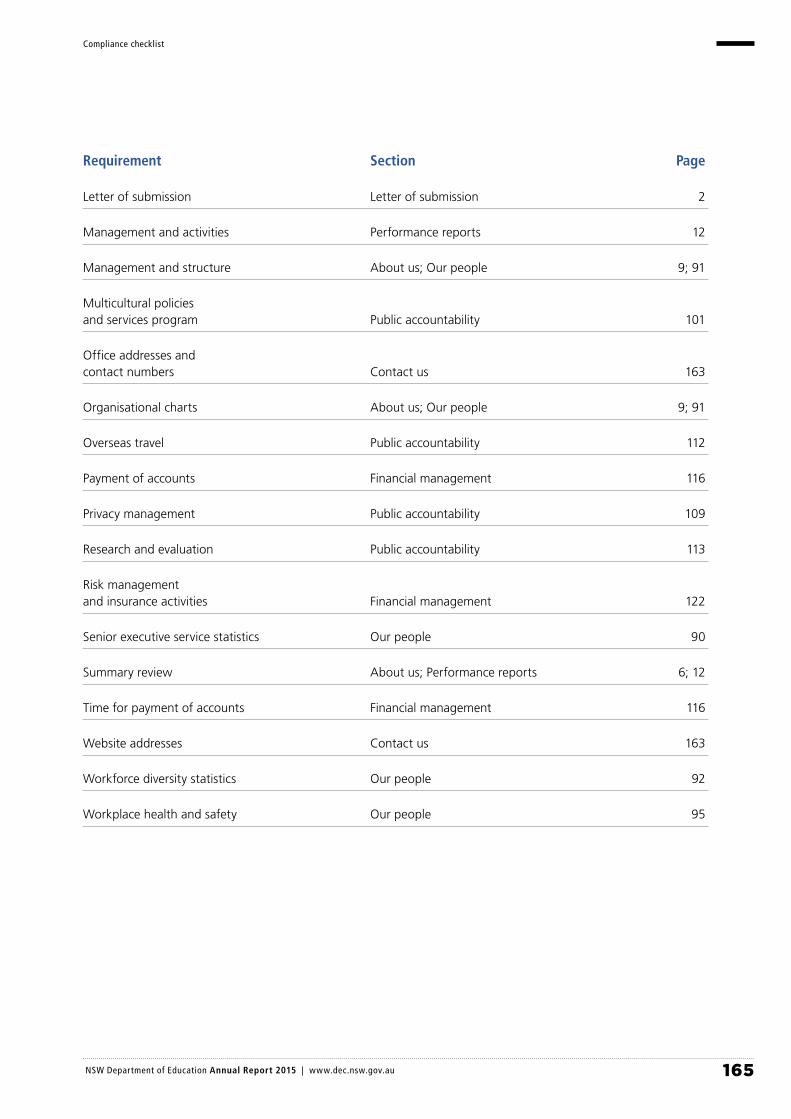
165 NSW Department of Education Annual Report 2015 | www.dec.nsw.gov.au
Compliance checklist
Requirement Section Page
Letter of submission Letter of submission 2
Management and activities Performance reports 12
Management and structure About us; Our people 9; 91
Multicultural policies and services program Public accountability 101
Office addresses and contact numbers Contact us 163
Organisational charts About us; Our people 9; 91
Overseas travel Public accountability 112
Payment of accounts Financial management 116
Privacy management Public accountability 109
Research and evaluation Public accountability 113
Risk management and insurance activities Financial management 122
Senior executive service statistics Our people 90
Summary review About us; Performance reports 6; 12
Time for payment of accounts Financial management 116
Website addresses Contact us 163
Workforce diversity statistics Our people 92
Workplace health and safety Our people 95

The Department of Education Annual Report 2015 can be accessed on the department’s website: dec.nsw.gov.au.
The department will endeavour to make the report available in other formats on request.
The department has not incurred any external costs in producing the report.
GPO Box 33Sydney NSW 2001Phone: 9561 8000
© April 2016NSW Department of Education
NSW Department of Education Annual Report 2015 | www.dec.nsw.gov.au
Related Documents