Annual Report 2014 VOLUME 1

Welcome message from author
This document is posted to help you gain knowledge. Please leave a comment to let me know what you think about it! Share it to your friends and learn new things together.
Transcript
Annual Report 2014VOLUME 1
2 Macquarie University Annual Report 2014
Contact usLocation: Balaclava Road, North Ryde, Sydney, Australia Postal address: Macquarie University, New South Wales, 2109, Australia Business hours: Monday – Friday, 9am – 5pm
T: +61 2 9850 7111 F: +61 2 9850 7433 mq.edu.au
External costs incurred in the production of this report totalled $830.00 (exc GST)
ISSN 0728–9480
© Macquarie University 2015
For copies of the Annual Report contact the Marketing unit on +61 2 9850 7378 or email [email protected]
The report is also available on the University’s website at mq.edu.au/about/how_mq_works/reports.html
CRICOS Provider 00002J
Photography by Chris Stacey unless otherwise noted.
Letter of submission 3
Letter of submissionFor the period 1 January 2014 to 31 December 2014
The Hon Adrian Piccoli, BEc, LLB MPMinister for EducationParliament House, Sydney
Dear Minister,
The Council of Macquarie University has the honour to submit the Annual Report of Macquarie University for the year ended 31 December 2014. The report has been prepared for presentation to Parliament in accordance with the Annual Reports (Statutory Bodies) Act 1984 and the Public Finance and Audit Act 1983.
Yours sincerely,
The Hon Michael EganChancellor
Professor S Bruce DowtonVice-Chancellor and President
4 Macquarie University Annual Report 2014
Message from the Vice-Chancellor
PHOT
O: P
AUL
WRI
GH
T
Macquarie University has continued to grow and accelerate during 2014.
This has been a remarkable year for the University, as we celebrated our golden jubilee, fifty years from the proclamation in the New South Wales Parliament of the Act that formally created Macquarie University. Half a century later, we celebrated this historic occasion with a year-long calendar of events and activities reflecting on our achievements, looking to our future, and recognising that throughout we have remained true to the vision of our founders.
We are still different.
Emerging from humble beginnings on the site of market gardens in North Ryde, today we have 40,000 students on our campus, each with unique talents and the potential to do remarkable things. Ours is a world full of possibilities where no two days – and no two students – are ever the same. It is an extraordinary privilege to lead a university where not only could anything happen, but where we actively try to make sure that it does.
Anniversaries are not only times for reflection but also for renewal and rebirth, and in 2014 we unveiled a new identity for our University, at once returning us to our roots and propelling us to a bright new future. The reintroduction of the Macquarie Lighthouse as the symbol of the University was central to the new, vibrant visual identity for our community. It represents not only our past, but our core mission and our hope for the future: to light the way for our students to steer their own course.
Our new identity is just one of the many changes announced last year. In July, we launched the Faculty of Medicine and Health Sciences, and the establishment of Australia’s only Academic Health Sciences Centre, accelerating our quest for distinction at the intersection between medical research, healthcare and higher education.
In November, we welcomed the Australian Institute of Health Innovation into the new faculty after many successful years at the University of New South Wales. The AIHI is one of the world’s leading research centres in healthcare innovation and a major national resource for strengthening health systems, organisations and services.
Following extensive consultation within the University and far
beyond, we launched our Strategic Research Framework as the year drew to a close. This document outlines the future of research activity at the University, and focuses on five key areas that will have a profound impact on the world in the future. Healthy people, resilient societies, prosperous economies, a secure planet and innovative technologies will be at the heart of tomorrow’s world, and our framework outlines the steps we will take to address some of the most pressing issues we will face in the next decade.
Work also began on our Learning and Teaching Plan, to be unveiled in 2015, detailing how we will instil in future generations the knowledge, skills and attributes needed to meet the challenges the world will face after they graduate.
We have welcomed new members to our leadership team, and farewelled others over the past 12 months, and across the University we have celebrated the successes not only of 2014, but also of our 50-year history. We have made new friends and reconnected with those of long standing. We have reminisced about our past and, in knowing where we have been, fixed our gaze firmly upon our future.
Like the light on the hill, we will guide our students as they make their way toward their own futures, free from fear, full of wonder, and armed for success.
I commend to you this report, this University, all who have helped us to achieve so much, and all whose time is yet to come.
Professor S Bruce Dowton Vice-Chancellor and President
Contents 5
ContentsResearch 6
Learning and teaching 10
Engagement and advancement 14
Equity, diversity and inclusion 15
Sustainability 19
Staff 21
Governance and management 30
Infrastructure 37
Operations 38
Financial performance 45
Financial statements 48
Independent auditor’s report 50
Statement of appointed officers 52
Income statement 53
Statement of comprehensive income 54
Statement of financial position 55
Statement of changes in equity 56
Statement of cash flows 57
Notes to the financial statements 58
Index 132
6 Macquarie University Annual Report 2014
Research Macquarie continues to be one of the country’s leading research universities, bringing together the best minds to conduct cutting-edge research that crosses traditional disciplinary boundaries and addresses the big issues and substantial problems facing the world.
The celebration of Macquarie’s 50th anniversary in 2014 marked a number of important milestones for research. The University developed its first 10-year Strategic Research Framework – World-Leading Research; World-Changing Impact. The framework, which was the result of 12 months of University-wide consultation, comprises two components that identify the areas of research Macquarie University will excel in over the coming decade and the strategies that will support achievement of our vision for research excellence. The framework outlines 14 research themes proposed by the faculties and supported by a number of research streams. These research themes have been aggregated at a higher level to identify five future-shaping research priorities – Healthy people, Resilient societies, Prosperous economies, Secure planet, and Innovative technologies. The four key research objectives – Accelerate world-leading performance, Prepare world-ready higher degree research candidates, Engage as a world-recognised research collaborator of choice, and Deliver research with world-changing impact – are supported by a suite of research goals, targets and strategies that will guide our path to the achievement of the 2024 research targets.
In its first 50 years of research excellence, Macquarie has built a reputation for being one of Australia’s leading research-intensive universities. The 2014 publication 50 Years: World-Leading Research, World-Changing Impact features unique discoveries and innovations made by Macquarie researchers in the first 50 years of research at the University. From the significant finds in Ancient Egyptian history to innovations in wireless technology, this publication is a testament to the innovation and impact of research at Macquarie and was a significant element of celebrating Macquarie’s 50th anniversary.
Additionally, in 2014 Macquarie University worked to firmly establish itself as a leader in both research integrity practices and research commercialisation and innovation. The Macquarie University Code for the Responsible Conduct of Research is based on outlining standards of best practice and helping researchers meet those standards, rather than compliance and sanctions. Macquarie is working to weave the principles of research integrity into all aspects of the University, including ensuring all higher degree research candidates integrate best practice into their research projects. As the importance of commercialisation and innovation of research increases for Australian universities, Macquarie put itself on the front foot in 2014 by adopting an updated intellectual property policy that will allow for greater flexibility and agility within this sphere.
Research quality and acceleration The 2013 release of the Australian Research Council’s (ARC) Benefits Realisation Review of Excellence in Research for Australia (ERA) affirmed ERA’s instrumental role in identifying the research strengths of Australian universities, and their capacity to deliver outcomes to Australian society that are at world standard – or better – from publicly funded research activity.
For Macquarie, this report underscores the return on investment it generates by developing its research strengths, with Macquarie’s ERA 2012 results contributing significantly to the Government’s ERA-based identification of national strengths in research.
Of the 20 national research strengths, determined by 10 or more universities rating above world standard (ERA rating 4 or 5), Macquarie contributed to eight areas: astronomical and space sciences, ecology, environmental science and management, evolutionary biology, geology, historical studies, law, and plant biology.
As testament to the quality of our researchers, one of the University’s most eminent researchers, Professor Marion Maddox from the Faculty of Arts’ Department of Modern History, Politics and International Relations, was appointed to serve on the ARC College of Experts. The ARC College of Experts assesses and ranks ARC grant applications submitted under the National Competitive Grants Program, makes funding recommendations to the ARC and provides strategic advice to the ARC on emerging disciplines and interdisciplinary developments.
The University invested heavily in research acceleration by establishing the new Faculty of Medicine and Health Sciences; this new faculty will enable Macquarie to be more competitive in the medical research disciplines and National Health and Medical Research Council (NHMRC) funding opportunities. In addition to the establishment of this faculty, the University welcomed the Australian Institute of Health Innovation (AIHI) in 2014. The AIHI brings together three well-established and successful research centres that work in the separate but related areas of clinical governance, health informatics, and health systems and safety, and will be a part of the new faculty. The AIHI is one example from many where the University has made significant inroads into strategic research appointments to ensure accelerated research performance across a range of disciplines.
Research publicationsPublications by Macquarie researchers published in 2013 (reported in 2014) increased by 2 per cent over 2012.
This included an increase of almost 10 per cent in peer-reviewed research articles with a 15 per cent reduction in conference-based publications. Analysing research productivity based on reported publications per academic full-time equivalent (FTE) shows Macquarie outperforming all non-Group of Eight (Go8) universities and all but three Go8 universities.
The Faculty of Science (now the Faculty of Science and Engineering) generated 43 per cent of published research outputs reported by the University, while the Faculty of Human Sciences had the largest increase in output – up 16 per cent from the previous year.
During 2014, Macquarie ranked consistently among the Top 50 institutions and ranked seventh among Australian universities in the Nature Publishing Index Asia–Pacific ranking of research institutions. The Nature Publishing Index Asia–Pacific tracks on a weekly basis research published in Nature and/or Nature monthly research journals authored by researchers from more than 700 institutions based in Asia-Pacific countries.
Macquarie University’s international reputation for world-leading research in environmental science was repeated in 2014 with the University placed in the top 30 research institutions in the world for cited research papers in environment/ecology (Thomson Reuters Essential Science Indicators). By the end of 2014, Macquarie’s cited environmental research was outperforming the cited research produced by Stanford, NASA and the Smithsonian Institute, as well as Ivy League universities such as Brown, Harvard and Yale.
The scope of Macquarie University’s research collaboration is growing nationally and internationally. In 2014, Macquarie researchers co-authored with researchers based in more than 70 countries, resulting in 49 per cent of research articles involving international collaboration. At the national level, 45 per cent were co-authored with researchers from another Australian university
Research 7
or institution. One in five research articles published in 2014 by Macquarie researchers involved collaboration with both Australian and overseas institutions (Source: Scopus).
The CWTS Leiden Ranking for 2014 indicates the strength of Macquarie’s international collaboration and the impact of its scientific scholarship. Overall, Macquarie was ranked sixth in Australia for proportion of publications co-authored with researchers from another country. Macquarie’s international collaboration in Earth and environmental sciences is the second highest in Australia and 21st in the world; in mathematics, computer science and engineering Macquarie is third highest in Australia and 20th in the world; and in life sciences is fourth highest in Australia and 159th in the world. In terms of the proportion of research papers in the top 10 per cent of citation impact in their field, Macquarie was ranked third in Australia and 80th in the world in Earth and environmental sciences; and fifth in Australia and 164th in the world in natural sciences.
Higher degree research enrolments and completionsMacquarie’s higher degree research (HDR) training program is strategically focused to ensure high-achieving applicants receive candidature places and scholarships. The University’s targeted HDR scholarships are also used to support candidates and researchers working in priority areas.
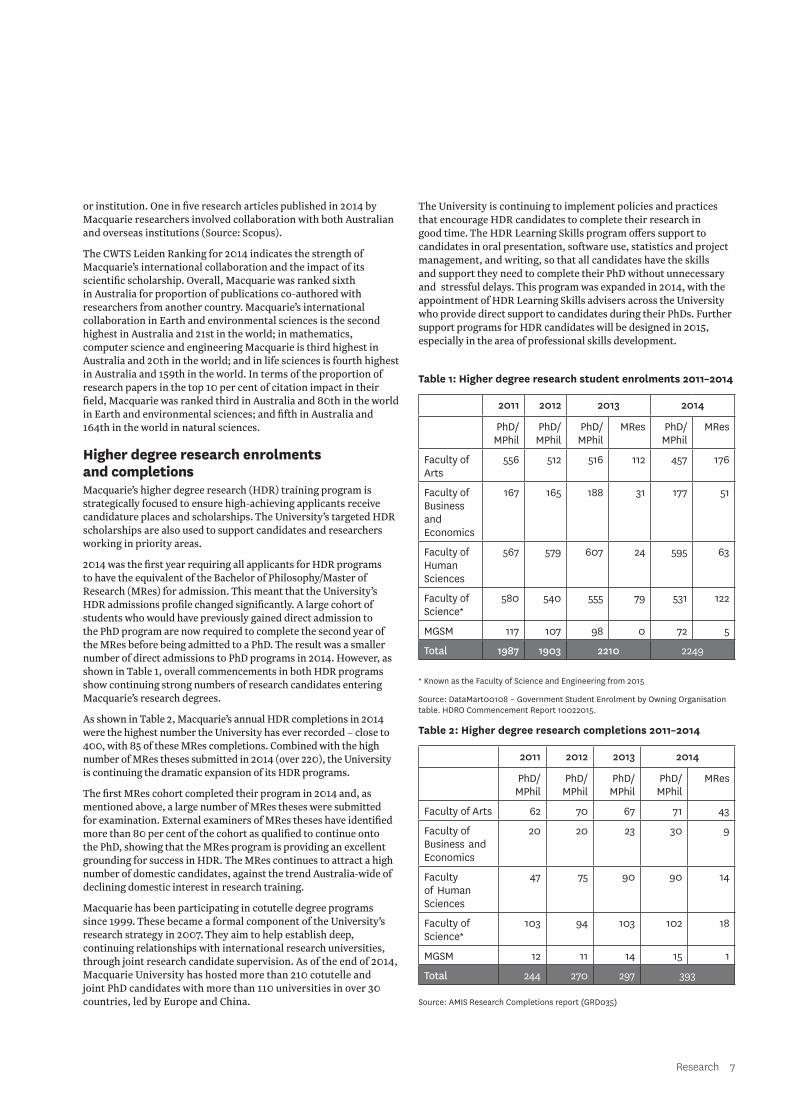
2014 was the first year requiring all applicants for HDR programs to have the equivalent of the Bachelor of Philosophy/Master of Research (MRes) for admission. This meant that the University’s HDR admissions profile changed significantly. A large cohort of students who would have previously gained direct admission to the PhD program are now required to complete the second year of the MRes before being admitted to a PhD. The result was a smaller number of direct admissions to PhD programs in 2014. However, as shown in Table 1, overall commencements in both HDR programs show continuing strong numbers of research candidates entering Macquarie’s research degrees.
As shown in Table 2, Macquarie’s annual HDR completions in 2014 were the highest number the University has ever recorded – close to 400, with 85 of these MRes completions. Combined with the high number of MRes theses submitted in 2014 (over 220), the University is continuing the dramatic expansion of its HDR programs.
The first MRes cohort completed their program in 2014 and, as mentioned above, a large number of MRes theses were submitted for examination. External examiners of MRes theses have identified more than 80 per cent of the cohort as qualified to continue onto the PhD, showing that the MRes program is providing an excellent grounding for success in HDR. The MRes continues to attract a high number of domestic candidates, against the trend Australia-wide of declining domestic interest in research training.
Macquarie has been participating in cotutelle degree programs since 1999. These became a formal component of the University’s research strategy in 2007. They aim to help establish deep, continuing relationships with international research universities, through joint research candidate supervision. As of the end of 2014, Macquarie University has hosted more than 210 cotutelle and joint PhD candidates with more than 110 universities in over 30 countries, led by Europe and China.
The University is continuing to implement policies and practices that encourage HDR candidates to complete their research in good time. The HDR Learning Skills program offers support to candidates in oral presentation, software use, statistics and project management, and writing, so that all candidates have the skills and support they need to complete their PhD without unnecessary and stressful delays. This program was expanded in 2014, with the appointment of HDR Learning Skills advisers across the University who provide direct support to candidates during their PhDs. Further support programs for HDR candidates will be designed in 2015, especially in the area of professional skills development.
Table 1: Higher degree research student enrolments 2011–2014
2011 2012 2013 2014
PhD/MPhil
PhD/MPhil
PhD/MPhil
MRes PhD/ MPhil
MRes
Faculty of Arts
556 512 516 112 457 176
Faculty of Business and Economics
167 165 188 31 177 51
Faculty of Human Sciences
567 579 607 24 595 63
Faculty of Science*
580 540 555 79 531 122
MGSM 117 107 98 0 72 5
Total 1987 1903 2210 2249
* Known as the Faculty of Science and Engineering from 2015
Source: DataMart00108 – Government Student Enrolment by Owning Organisation table. HDRO Commencement Report 10022015.
Table 2: Higher degree research completions 2011–2014
2011 2012 2013 2014
PhD/MPhil
PhD/MPhil
PhD/MPhil
PhD/MPhil
MRes
Faculty of Arts 62 70 67 71 43
Faculty of Business and Economics
20 20 23 30 9
Faculty of Human Sciences
47 75 90 90 14
Faculty of Science*
103 94 103 102 18
MGSM 12 11 14 15 1
Total 244 270 297 393TSource: AMIS Research Completions report (GRD035)
8 Macquarie University Annual Report 2014
Research continued Research excellence recognisedOne of the world’s most influential ecologists, Professor Mark Westoby, was named NSW Scientist of the Year at the 2014 New South Wales Science and Engineering Awards. An ARC Laureate Fellow, Distinguished Professor of Biology and leader of the Genes to Geoscience Research Centre, Westoby is a pioneer of ‘trait-based ecology’.
Professor Catriona Mackenzie, Faculty of Arts Associate Dean (Research), was elected as a Fellow of the Australian Academy of the Humanities in recognition of the excellence and impact of her scholarship in the field of philosophy, and contributions to the humanities throughout her career. Professor Mackenzie, Director of the Macquarie University Research Centre for Agency, Values and Ethics (CAVE) was recognised by the Academy as ‘a philosopher with an international reputation for her research in moral psychology, applied ethics, social philosophy and feminist philosophy’.
Dr Yingjie Yang, Dr Ian Wright and Dr Melanie Bishop were recognised with prestigious Australian Academy of Science Awards. Yang, an early career researcher from the Department of Earth and Planetary Sciences, received an Anton Hales Medal for distinguished research in the Earth sciences for early- to mid-career researchers. Plant ecologist Wright, from the Department of Biological Sciences, received the Fenner Medal, which recognises distinguished research in biology for early- to mid-career researchers. The Department of Biological Sciences’ Bishop is part of a team that received recognition from the Thomas Davies Research Fund for Marine, Soil and Plant Biology to develop indicators of seagrass carbon storage. The Fund offers annual science grants of up to $10,000 each to early- and mid-career researchers in the field of marine, soil and plant biology.
Dr Sonia Allan from Macquarie Law School, Professor Trevor Johnston from the Department of Linguistics, and PhD student Emma Nile from the Department of Cognitive Science were individually recognised as ‘Tomorrow Makers’ at the 2014 AMP Tomorrow Fund gala dinner. They received three of the 47 awards in total, chosen from 5600 applicants.
Eminent geologist Distinguished Professor Sue O’Reilly was elected to the Australian Academy of Science Council where she will represent the physical sciences. O’Reilly commences in her position in May 2015.
The Academy of the Social Sciences in Australia awarded the Paul Bourke Award for Early Career Research to Associate Professor Anina Rich for her research on synaesthesia. The award honours Australians in the early part of their career who have achieved excellence in scholarship in one or more fields of the social sciences.
PhD student Emma Gray became one of 15 women from around the world to be awarded one of 2014’s $20,000 UNESCO-L’Oréal for Women in Science International Fellowships, which support talented young women scientists to take up research positions in other countries.
Associate Professor Michelle Arrow from the Department of Modern History, Politics and International Relations is part of a team that received the 2014 NSW Premier’s History Awards – Multimedia History Prize for its radio production Public Intimacies: The 1974 Royal Commission on Human Relationships.
Research partnershipsMacquarie’s capacity for collaboration extends to its research partnerships as well. The University is closely involved in the development of a medical technology knowledge hub (precinct), together with Cochlear Ltd, the Medical Technology Association of Australia, and many other commercial and research organisations. This long-term strategic partnership seeks to increase the size and scope of the medical technology industry in Australia, linking commercial entities with research in technology and other relevant fields, including business, marketing, psychology, regulation and workforce management. This development aligns both with the New South Wales Government’s 2014 priorities for economic development in NSW and with the Commonwealth Government’s industry precincts initiative.
Macquarie University researchers will spearhead Australia’s role in the international Yeast 2.0 project, tasked with creating the world’s first-ever synthetic complex organism. This project will open the door for more robust synthetic biology research at the University, with end-user applications, including the environmentally friendly production of biofuels and better targeted medication. It is partnered by the Australian Wine Research Institute and backed by funding from the New South Wales Government and Bioplatforms Australia.
Associate Professor Ian Blair will leverage the work completed in 2014 on Project MinE for applications for future NHMRC funding. Project MinE is a global consortium working to sequence the genomes of 15,000 amyotropic lateral sclerosis (ALS) patients worldwide. Blair is one of the leading Australian researchers on Project MinE.
Macquarie’s capacity to develop rich research collaborations with a broad range of research end users is evidenced by the University’s excellent result in the ARC Linkage Projects round in 2014. Nine projects, with ARC contributions of almost $3 million, and cash and in-kind partner contributions of more than $4.9 million, were supported by the ARC from a total of 11 proposals:
• Associate Professor Culum Brown is leading a team studying sharks as vital components of marine ecosystems with partners Sonotronics, Taronga Conservation Society Australia, New South Wales Department of Primary Industry – Fishing and Aquaculture, and Bimini Biological Field Station
• Associate Professor Michael Fine is leading a team investigating the level of care required to maintain older people at home with partners Aged & Community Services NSW & ACT, KinCare Community Services, New South Wales Community Options Projects Inc, and Baptist Community Services – NSW and ACT
• Professor Michael Heimlich is leading a team that aims to revolutionise electronic packaging and provide cheaper and more energy-efficient applications with partners M/A-COM Technology Solutions Holdings, Inc, and Lintek
• Associate Professor Jin Dayong is leading a team to enable rapid DNA-based pathogen diagnostics with partner AusDiagnostics
• Dr Andrew Lee is leading a team developing practical and robust terahertz radiation systems opening up the potential for revolutionary applications in fields ranging from biomedicine to counterterrorism with partner M Squared Lasers
• Professor Andrew Lepone leads a team to investigate the impact of high frequency trading on financial market quality and is partnered with the Australian Securities Exchange
Research 9
• Associate Professor Belinda Medlyn leads a team to calculate the risk of drought mortality for key tree species, developing risk profiles that are fundamental to conservation planning and land management with the NSW Office of Environment and Heritage
• Associate Professor Marina Papic leads a team to engage the community in collaborative planning and implementation with an innovative mathematics and science program for Indigenous children in remote New South Wales together with partners Maari Ma Health and Gowrie NSW
• Associate Professor Vladimir Strezov leads a team that aims to help expand the mining potential of currently unviable iron ore deposits in partnership with Hamersley Iron.
Research fundingMacquarie University researchers attract significant funding through competitive research grants. In 2014, the University reported $48.64 million of competitive external funding earned during 2013. In addition, the University was awarded $35.88 million in research block grant funding from the federal government in 2014. Initial analysis of research income received in 2014 indicates that the University will have achieved a higher level of funding than that received in 2013.
The University aims to continue to increase its research income and has established strategies and measurable targets in the Strategic Research Framework to ensure this objective is achieved. While Macquarie has seen annual increases in the past five years in Category 1 funding (Australian Competitive Grants), the University will look to increase funding from Category 2 (other public sector research income), Category 3 (industry and other research income) and Category 4 (Cooperative Research Centre (CRC) research income). Similarly, in addition to increasing the funding we are awarded by the ARC and NHMRC, we are working to further increase our Category 1 funding by targeting other opportunities on the Australian Competitive Grants Register. The diversification of research income will ensure long-term success of Macquarie’s forward-thinking research agenda.
ARC AND NHRMCProfessor Ian Paulsen from the Department of Chemistry and Biomolecular Sciences was awarded an ARC Laureate Fellowship in August 2014. The Laureate Fellowship scheme is designed to support outstanding research leaders in their conduct of urgent and complex research into issues of importance to Australia and the world. Paulsen aims to establish a new understanding of complex biological systems through the development of computational models of single cells and global ecosystems. Models created from the integration of data from genetic, biochemical and physiological studies will be used in combination with biomonitoring technologies that will be developed, enabling assessment of the health of Australia’s marine ecosystems.
During 2014, three prestigious ARC Future Fellowships were also awarded to Macquarie researchers:
• Associate Professor Andrew Barron, from the Department of Biological Sciences, who works on the grand challenge of truly understanding how the brain works. By studying the honey bee, his project aims to reveal how the brain makes complex decisions, to establish key principles and foundational studies for comprehending larger and more complex brains, thus yielding new approaches to machine learning.
• Dr Colin Klein, from the Department of Philosophy, aims to link neuroimaging to facts about manipulable relationships between the brain and the mind, providing a bridge between neuroimaging and complementary technologies for directly intervening on the brain. This platform will facilitate
exploration of the theoretical and ethical consequences of direct brain manipulation.
• Dr Robert Lanfear, from the Department of Biological Sciences, will study somatic mutations. Although these mutations have important consequences for the plant industry and conservation, almost nothing is known about them because they are so hard to measure. By developing new methods and software to detect, analyse, and compare the genome-wide history of somatic mutation in individual plants, this project aims to provide the first insights into the genome-wide causes and consequences of somatic mutation in plants.
The 2014 recipients of ARC Discovery Early Career Researcher Awards for funding commencing in 2015 are:
• Dr Andrea Guiliani, who will join Macquarie’s Earth sciences team, aims to develop new understanding of the constraints on melting processes and recycling of crustal material in the deep mantle
• Dr Celia Harris, working in the area of cognitive sciences, will investigate the influences on the benefits of ‘collaborative remembering’, the phenomenon that older couples remember more together than apart
• Dr Diep Nguyen, who aims to improve radio spectrum utilisation by harvesting temporarily unused spectrum holes to accommodate future traffic, thus reducing the costs of the radio spectrum, allowing cheaper and better mobile data services for the Australian public
• Dr Michael Proctor, who uses state-of-the-art articulatory methods to examine the difficult-to-master ‘l’ and ‘r’ sounds in speech, who is laying the foundations for future work on remediation and instruction in four typologically distinct languages
• Dr Sasha Tetu, who aims to provide the first account of how common chemical pollutants (for example, herbicides) affect key groups of marine photosynthetic bacteria in a new application of gene monitoring techniques to ocean conservation.
Dr Kelly Williams was awarded an NHMRC Early Career Fellowship. Williams aims to identify epigenetic factors that cause the variation in disease onset and duration seen among motor neurone disease patients, and will continue to lead gene discovery efforts in this disease. These studies will provide tools for identifying novel therapeutic and diagnostic targets, and pave the way for research efforts to identify treatments for this devastating disease.
Several researchers from the Faculty of Medicine and Health Sciences, established in July 2014, were awarded project grants from the NHRMC:
• Associate Professor Julie Atkin will investigate the disruption to intracellular trafficking as a central pathogenic mechanism in amyotrophic lateral sclerosis (ALS)
• Professor Marcus Stoodley will develop and test pro-thrombotic conjugates for brain arteriovenous malformations (AVM).
10 Macquarie University Annual Report 2014
Learning and teaching at Macquarie has undergone significant structural change and rethinking in 2014. In a new executive structure, a Deputy Vice-Chancellor (Academic) (DVC-A) was appointed in September to oversee the management of planning, quality and delivery of education provided to Macquarie’s undergraduate and postgraduate students.
The DVC-A is Macquarie’s chief academic officer and engages with external regulatory and statutory authorities involved in the teaching and learning mission of the University.
The DVC-A is responsible for:
• overseeing and planning the delivery of the University’s undergraduate and postgraduate teaching programs
• developing and implementing strategies aimed at improving the quality of learning and teaching as well as capacity and capability
• developing and implementing strategies aimed at increasing quality assurance in the delivery of teaching programs
• developing and implementing strategies aimed at increasing academic leadership capability and academic staff engagement
• reviewing, implementing and managing academic policies, processes, structures and resources aimed at ensuring excellence in teaching, learning and scholarship
• managing Indigenous Strategy, the Macquarie University Library and the Macquarie University Art Gallery.
The Pro Vice-Chancellor (Learning and Teaching), known as the PVC (L&T), also falls within this portfolio and is responsible for the Learning and Teaching Centre, the Centre for Open Education and PACE (Professional and Community Engagement).
In 2014, working with the DVC-A, the PVC (L&T) embarked on broad consultation across academic and professional staff and students to inform the new Learning and Teaching Strategy 2015 – 2020, which will set out a strategic approach for the core business of learning and teaching at the University for the next five years.
The strategy is being designed to create a culture of transformative learning that enables and empowers students to achieve their goals, with a Green Paper anticipated in March 2015.
During the year, the PVC (L&T) also provided strategic direction and management of a number of priority initiatives including:
• developing early entry pathways for undergraduate offerings, including the Global Leadership Entry Program (GLEP) and Schools Recommendation Scheme (SRS)
• curriculum planning and programming for the Macquarie University International College
• Open Universities Australia (OUA) program development and support, including instigating an OUA pilot to investigate academic and student-facing learning analytics
• the Student Engagement for Success strategic initiative, including the cross-faculty rollout of KickStart, which created 20 online modules designed to improve student preparation by providing early access to unit materials, supporting transition into learning, and supporting a positive student experience through introductions to convenors and students enrolled in the same unit
• ongoing support for the Big History initiative
• development of the online-only Handbook of Undergraduate Studies following release of the online Handbook of Postgraduate Coursework Studies in 2013
• development and implementation of new student policies, including a new Student Code of Conduct.
PACE PACE is Macquarie University’s signature transformative learning program. As an integral part of our undergraduate curriculum, PACE develops the capabilities of students to actively contribute to the wellbeing of other people and the planet. People and Planet units are included in all undergraduate programs and provide students with an opportunity to learn about contemporary world issues and to develop capacity to become engaged and ethical local and global citizens. PACE units build on this experience by giving students the opportunity to work on real-world projects with local, regional and international partner organisations.
Through PACE, Macquarie produces graduates who are work-ready and equipped with the skills and experience sought by employers.
The University is expanding PACE as a signature transformative learning program that distinguishes Macquarie University in learning and teaching. As a result, it is anticipated that the number of students enrolling in PACE units will continue to increase, with up to 10,000 annual enrolments once the program is fully implemented. From 2016, all new students commencing their degree will complete a PACE unit as part of their program of study.
Other highlights of 2014 included a number of awards, grants and citations.
AUSTRALIA DAY HONOURS• Chancellor The Hon Michael Egan FAICD was appointed as
Officer of the Order of Australia for distinguished service to the Parliament of New South Wales through a range of senior ministerial roles, to tertiary education administration and medical research, and to the community.
• Emeritus Professor Anthony Blackshield was recognised for distinguished service to the law as an academic, to legal education and scholarship, as a contributor to leading professional publications, and as an author and commentator.
• Distinguished Professor David Throsby was appointed as Officer of the Order of Australia for distinguished service to the community as a leading cultural economist, to the promotion and preservation of Australian arts and heritage, and to tertiary education.
AMP TOMORROW MAKERS 2014 AWARDS• Dr Sonia Allan, a senior lecturer at Macquarie Law School,
received an AMP Tomorrow Fund grant for research and development of an online resource that provides information to the community about health law.
Learning and teaching Macquarie strives to motivate and inspire students, engender a command of a field of study, foster independent learning, respect students as individuals and encourage participation in scholarly activities to enhance learning and teaching.
Learning and teaching 11
• Professor Trevor Johnston from the Department of Linguistics has been instrumental in researching, teaching, documenting and promoting Auslan (Australian Sign Language). AMP’s support will help him integrate an Auslan dictionary and archive into a website.
• Emma Nile from the Department of Cognitive Science was awarded $30,000 to further develop, test and roll out her Our Stories program, a reminiscence program for older adults living in care. This work forms part of her PhD in cognitive science.
YOUNG TALL POPPY SCIENCE AWARDSTwo researchers were recognised among New South Wales’ best young scientists at the Young Tall Poppy Science Awards.
• Astronomer Dr Lee Spitler received the award for his research that pushes current telescope technology to its limits.
• Volcanologist Dr Heather Handley received the award for her research on the development of new methodologies for accurate dating of soils and sediments that will deliver a novel approach for understanding climate-led landscape changes.
Teaching excellenceIn 2014, Macquarie’s academic staff were recognised for their excellence in a number of national awards and grants.
NATIONAL LEARNING AND TEACHING GRANTS AND AWARDSOffice of Learning and Teaching (OLT) Fellowship• Dr Marina Harvey for Quality learning and teaching with
sessional staff – systematising national standards.
Strategic Priority Grants• Associate Professor Greg Downey and colleagues for Classroom
of many cultures: Co-creating support curriculum with international community partners and students.
Extension Grants• Professor Leigh Wood and colleagues for Embedding and building
teamwork capabilities in business under the Promotion of excellence in learning and teaching in higher education program.
• Dr Marina Harvey for Recognising and rewarding good learning and teaching practice with sessional staff.
• Professor Chris Patel and colleagues for Building discipline-specific communication skills in accounting.
Office of Learning and Teaching (OLT) Citations• Dr Diane Hughes was recognised for an outstanding contribution
to facilitating student engagement and learning through the design of innovative contemporary music curricula.
• Dr Jane Messer was recognised for support of student engagement with graduate capabilities through the design of an innovative curriculum and resources that promote student motivation, resourcefulness and creativity.
• Professor David Wilkinson was recognised for Australian Medical Assessment Collaboration: From proof of concept to proof of sustainability.
• Professor David Wilkinson was also recognised for From proof of concept towards implementation: nationwide collaborative assessment of Australian medical students.
• Dr Theresa Winchester-Seeto was recognised for Building institutional capacity to enhance access, participation and progression in work integrated learning.
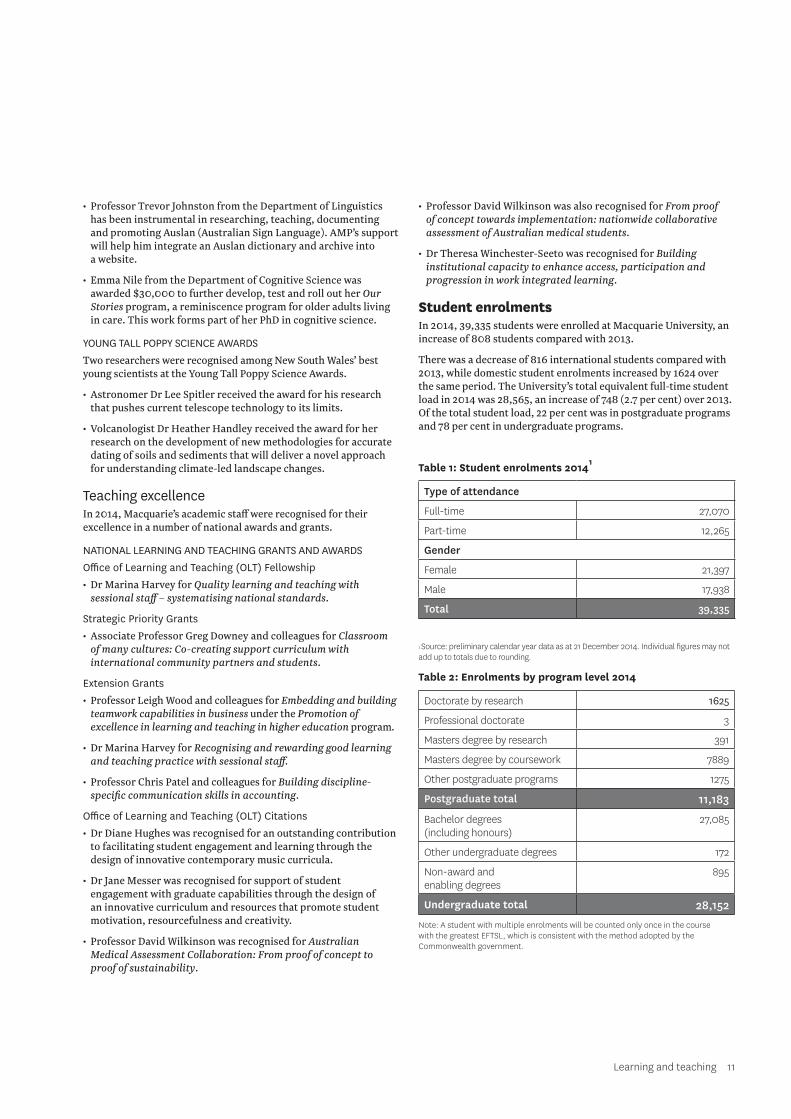
Student enrolmentsIn 2014, 39,335 students were enrolled at Macquarie University, an increase of 808 students compared with 2013.
There was a decrease of 816 international students compared with 2013, while domestic student enrolments increased by 1624 over the same period. The University’s total equivalent full-time student load in 2014 was 28,565, an increase of 748 (2.7 per cent) over 2013. Of the total student load, 22 per cent was in postgraduate programs and 78 per cent in undergraduate programs.
Table 1: Student enrolments 20141
Type of attendance
Full-time 27,070
Part-time 12,265
Gender
Female 21,397
Male 17,938
Total 39,335
1 Source: preliminary calendar year data as at 21 December 2014. Individual figures may not add up to totals due to rounding.
Table 2: Enrolments by program level 2014
Doctorate by research 1625
Professional doctorate 3
Masters degree by research 391
Masters degree by coursework 7889
Other postgraduate programs 1275
Postgraduate total 11,183
Bachelor degrees (including honours)
27,085
Other undergraduate degrees 172
Non-award and enabling degrees
895
Undergraduate total 28,152Note: A student with multiple enrolments will be counted only once in the course with the greatest EFTSL, which is consistent with the method adopted by the Commonwealth government.
12 Macquarie University Annual Report 2014
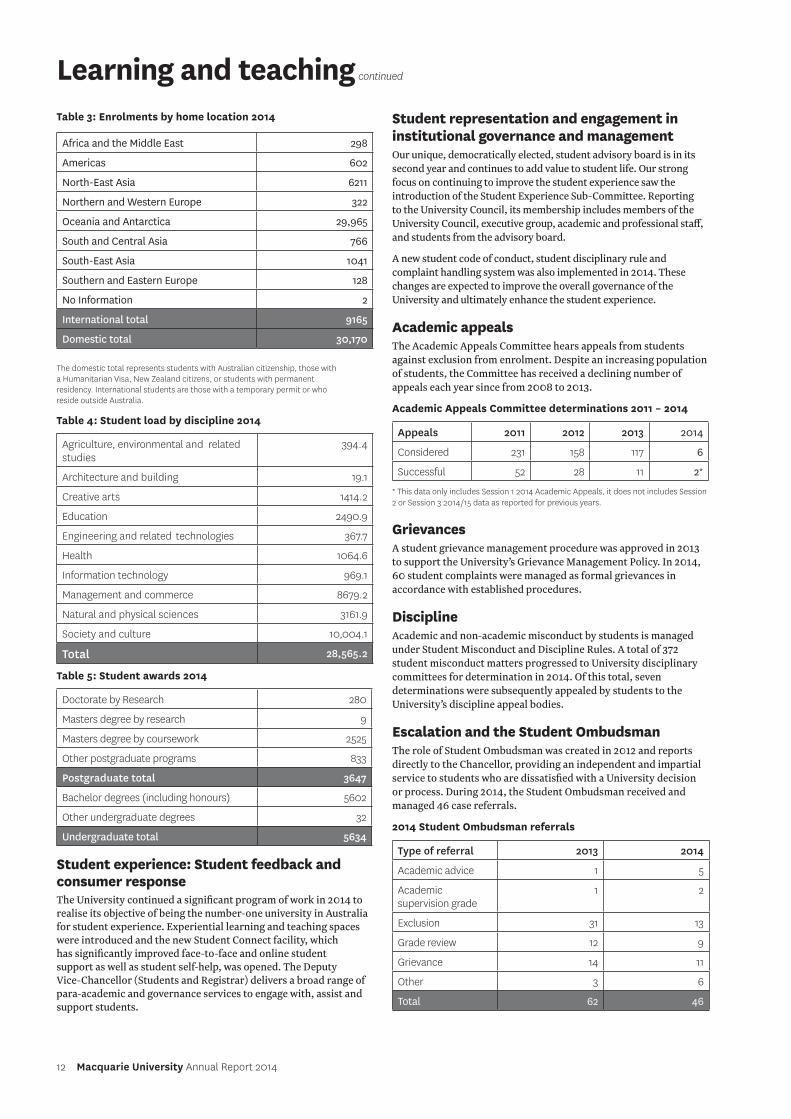
Table 3: Enrolments by home location 2014
Africa and the Middle East 298
Americas 602
North-East Asia 6211
Northern and Western Europe 322
Oceania and Antarctica 29,965
South and Central Asia 766
South-East Asia 1041
Southern and Eastern Europe 128
No Information 2
International total 9165
Domestic total 30,170
The domestic total represents students with Australian citizenship, those with a Humanitarian Visa, New Zealand citizens, or students with permanent residency. International students are those with a temporary permit or who reside outside Australia.
Table 4: Student load by discipline 2014
Agriculture, environmental and related studies
394.4
Architecture and building 19.1
Creative arts 1414.2
Education 2490.9
Engineering and related technologies 367.7
Health 1064.6
Information technology 969.1
Management and commerce 8679.2
Natural and physical sciences 3161.9
Society and culture 10,004.1
Total 28,565.2
Table 5: Student awards 2014
Doctorate by Research 280
Masters degree by research 9
Masters degree by coursework 2525
Other postgraduate programs 833
Postgraduate total 3647
Bachelor degrees (including honours) 5602
Other undergraduate degrees 32
Undergraduate total 5634
Student experience: Student feedback and consumer response The University continued a significant program of work in 2014 to realise its objective of being the number-one university in Australia for student experience. Experiential learning and teaching spaces were introduced and the new Student Connect facility, which has significantly improved face-to-face and online student support as well as student self-help, was opened. The Deputy Vice-Chancellor (Students and Registrar) delivers a broad range of para-academic and governance services to engage with, assist and support students.
Student representation and engagement in institutional governance and management Our unique, democratically elected, student advisory board is in its second year and continues to add value to student life. Our strong focus on continuing to improve the student experience saw the introduction of the Student Experience Sub-Committee. Reporting to the University Council, its membership includes members of the University Council, executive group, academic and professional staff, and students from the advisory board.
A new student code of conduct, student disciplinary rule and complaint handling system was also implemented in 2014. These changes are expected to improve the overall governance of the University and ultimately enhance the student experience.
Academic appeals The Academic Appeals Committee hears appeals from students against exclusion from enrolment. Despite an increasing population of students, the Committee has received a declining number of appeals each year since from 2008 to 2013.
Academic Appeals Committee determinations 2011 – 2014
Appeals 2011 2012 2013 2014
Considered 231 158 117 6
Successful 52 28 11 2*
* This data only includes Session 1 2014 Academic Appeals, it does not includes Session 2 or Session 3 2014/15 data as reported for previous years.
Grievances A student grievance management procedure was approved in 2013 to support the University’s Grievance Management Policy. In 2014, 60 student complaints were managed as formal grievances in accordance with established procedures.
DisciplineAcademic and non-academic misconduct by students is managed under Student Misconduct and Discipline Rules. A total of 372 student misconduct matters progressed to University disciplinary committees for determination in 2014. Of this total, seven determinations were subsequently appealed by students to the University’s discipline appeal bodies.
Escalation and the Student Ombudsman The role of Student Ombudsman was created in 2012 and reports directly to the Chancellor, providing an independent and impartial service to students who are dissatisfied with a University decision or process. During 2014, the Student Ombudsman received and managed 46 case referrals.
2014 Student Ombudsman referrals
Type of referral 2013 2014
Academic advice 1 5
Academic supervision grade
1 2
Exclusion 31 13
Grade review 12 9
Grievance 14 11
Other 3 6
Total 62 46
Learning and teaching continued
Internationalisation The continuing strength of the University’s international reputation was reflected in the Times Higher Education (THE) rankings that placed Macquarie 18th among the most international universities in the world.
The list was compiled using THE’s international outlook indicator, which examines a university’s international student numbers, its percentage of international staff and the proportion of its research papers published with a co-author from at least one other country.
There were approximately 8900 full degree international students studying at Macquarie University North Ryde and City campuses in 2014, equivalent to 22.4 per cent of the student population and representing 116 countries. Of those, approximately 3850 students commenced their studies at Macquarie in 2014. Additionally, 335 students were enrolled in the University’s offshore programs in China, Hong Kong, Korea and Singapore in 2014.
Macquarie offered 202 scholarships to commencing international students, including 22 full scholarships and 180 partial scholarships.
Some 4000 students were enrolled in 57 PACE units, offered across the four active faculties, and worked with over 1200 partner organisations. One hundred and sixty-five students participated in PACE international projects in India, Borneo, Peru, Vietnam, Cambodia and the Philippines. Five hundred and fifty-five students travelled overseas on exchange or short-term overseas study in 2014, and the University welcomed 305 inbound exchange and study abroad students.
Macquarie’s world-leading cotutelle program grew, with 24 new student agreements executed in 2014. Since the program’s inception, more than 210 doctoral students from over 30 countries have benefitted from the collaborative research opportunities it offers, with a currently enrolled cohort of over 90 candidates.
Macquarie also finalised 38 international agreements. Of those, 18 were renewals (including 16 student exchange agreements, one study abroad agreement and one Memorandum of Understanding – MOU), and 20 were new (including four student exchange agreements, one staff exchange and one study abroad agreement, 12 MOUs, one dual degree agreement and one letter of intent). New partnership countries include Iceland, Pakistan and Nepal.
GLOBAL LEADERSHIP PROGRAMIn 2014, the Macquarie Global Leadership Program (GLP) provided a 30-hour structured extracurricular program for 2800 students to develop cross-cultural understanding through elective workshops focusing on global issues and skills development.
The GLP also offered a flexible experiential component, an annual Distinguished Speaker event hosting 1000 students, and 12 optional events ranging from consular seminars to international symposia.
Participants come from a broad cross-section of the University community – undergraduate and postgraduate, HDR, domestic, international and study aboard/exchange students.
During the year, Macquarie also launched the Global Leadership Entry Program (GLEP) for Year 12 high school students. Based on their previous academic results as well as demonstrated leadership and community service engagement, the program offered them a place in one of nine undergraduate Macquarie degrees before completing their HSC.
Learning and teaching 13
PHOT
O: F
J G
AYLO
R
14 Macquarie University Annual Report 2014
In 2014, the University’s 50th anniversary, the portfolio of Corporate Engagement and Advancement, including marketing, corporate engagement, and advancement (incorporating alumni relations), supported the delivery of the University’s strategic framework.
Office of Advancement The Office of Advancement (formerly the Foundation Office) continued to build relationships with individual donors and supporters, delivering a 50 per cent increase in philanthropic income. Expanding core fundraising activities and support services resulted in successful appeals seeing much-needed support for Motor Neurone Disease research and assistance in the form of equity scholarships for students in need.
The University also welcomed 11 new patrons of the Joan and John Lincoln Society at the annual society lunch hosted by the Chancellor The Hon Michael Egan AO and Vice-Chancellor and President Professor S Bruce Dowton.
Alumni relations The University increased its alumni outreach activities in 2014. Alumni around the world celebrated the University’s Jubilee with events in Sydney, New York, London, Hong Kong, Beijing, Shanghai and Singapore, while a comprehensive survey of alumni affinity yielded nearly 5000 responses. These informed the development of a revamped alumni program and provided greater opportunities for segmented programming. Enhanced communications, new event streams and revised benefit offerings helped achieve a 15 per cent increase in total alumni engagement. By year end, the University’s alumni community had grown to more than 156,000 from more than 140 countries.
Office of Corporate Engagement A number of significant corporate engagement outcomes were achieved during 2014. Relationship agreement partnerships grew from five at the start of the year to 12, and now include global companies such as Microsoft, Abbott Australasia, and Johnson & Johnson ( J&J) Medical. Active engagement arrangements are in place with more than 30 companies, up from 13 at the end of 2013.
More than $250,000 in revenue was generated from corporate partners in 2014, including funding from Google for the March 2015 FIRST Robotics regional event, leadership symposia conducted for SingTel and Optus, and training programs commissioned by J&J Medical. A proposal to manage the Optus cadetship program was also successful, and will commence in July 2015.
Marketing unitIn 2014, Macquarie developed and launched ‘Our Shared Identity’, a project that reinvigorates the Macquarie University brand. With the brand proposition ‘Nurtured to break free’, the initiative ensures that the brand aligns with the strategic direction, vision, values and mission of the University – both in its visual form, and in the way we talk about the University to our many target audiences worldwide; clearly differentiates Macquarie in a cluttered and homogeneous marketplace; and is experienced by our staff, students and other key stakeholders in ways that are consistent with our values and vision for the University.
The University is continuing to build relationships with both community and alumni as well as increasing philanthropic support from donors and industry. Together, these strengthen opportunities for enterprise and innovation, and contribute to the growth of the broader community.
Engagement and advancement
Equity, diversity and inclusion 15
Macquarie is one of only three Australian universities with National White Ribbon Workplace Accreditation, and in 2014 hosted a precinct forum for business leaders to promote the accreditation program.
The Vice-Chancellor and many of the University executive are White Ribbon Ambassadors, and this year, Macquarie successfully implemented the Corporate Champions project, a federally driven initiative to raise awareness and combat age discrimination in the workplace.
Once again, Macquarie was named in Australia’s top 20 employers at the Pride in Diversity Awards for support of gay, lesbian, bisexual, transgender and intersex staff.
The University retained its national accreditation from the Australian Breastfeeding Association, which involved provision of paid lactation breaks and specially equipped parenting rooms across campus.
During 2014, Macquarie signed as a supporter of the national ‘Racism. It Stops With Me’ campaign, and set up a Multicultural Advisory and Student Ambassador Program.
Student and staff-led cultural events remained varied and exciting.
Progressing the Disability Action Plan 2012–2017 engaged both staff and students, with the mid-term review scheduled for 2015.
During the year, the Mentors@Macquarie program continued to support a smooth transition to university for new students through peer mentoring. The generous Macquarie equity scholarship scheme supported the enrolment, participation and retention of students from disadvantaged backgrounds. The LEAP Program (Learning, Education, Aspiration, Participation) provided outreach to students from low socio-economic backgrounds to build their aspiration to attend and succeed at university.
Access and inclusion initiativesALTERNATIVE PATHWAYS TO UNIVERSITY Macquarie’s Centre for Open Education continued to offer an entry pathway via non-award courses to all domestic students able to pay tuition fees and who met the more flexible entry requirements. Applications were assessed on a case-by-case basis with consideration also given to non-academic factors. In 2014, there were 336 successful non-award pathway applications: 57.4 per cent had no previous tertiary study, 9.5 per cent had incomplete undergraduate study, 33 per cent held TAFE or other post-secondary study, and 35.7 per cent were mature age.
One hundred and three Bachelor of Arts and 43 Bachelor of Science places were offered by direct entry in 2014. An additional 407 new places were offered in other external undergraduate degrees by UAC application. These included students with incomplete tertiary study, those living in low socio-economic or regional areas, mature age students and incarcerated students.
Open Universities Australia continued to offer an alternative entry pathway for non-award undergraduate admission in 2014, with access to a Bachelor of Arts after successful completion of four units at pass grade (GPA 2.0). There were 11,551 unit enrolments in the online programs (10,767 undergraduate and 784 postgraduate) in 2014. From voluntary disclosure, 1.6 per cent identified as Indigenous Australians, one per cent lived in remote areas, nine per cent had a disability, 5.6 per cent spoke a language other than English and 12 per cent had not completed Year 12.
The following alternative pathways (which considered academic and non-academic factors) were also offered by Macquarie in 2014:
• Lighthouse Scheme, for students whose disadvantage seriously affected their senior schooling
• Mature Age Jubilee Scheme, for applicants over 21 years of age who have not previously undertaken any university study
• Warawara Alternative Entry Program, for Indigenous Australian applicants
• Next Step program, for students whose UAI/ATAR rank was not sufficient to gain an offer and for mature age students
• Rural Bonus Scheme, for students from rural and regional Australia.
Equity, diversity and inclusion Macquarie University is a diverse, vibrant and innovative university, committed to equity, diversity and inclusion in education and employment. In our Jubilee year, we saw many successful initiatives and further embedding of principles of equity, diversity and inclusion into usual practice at the University.
16 Macquarie University Annual Report 2014
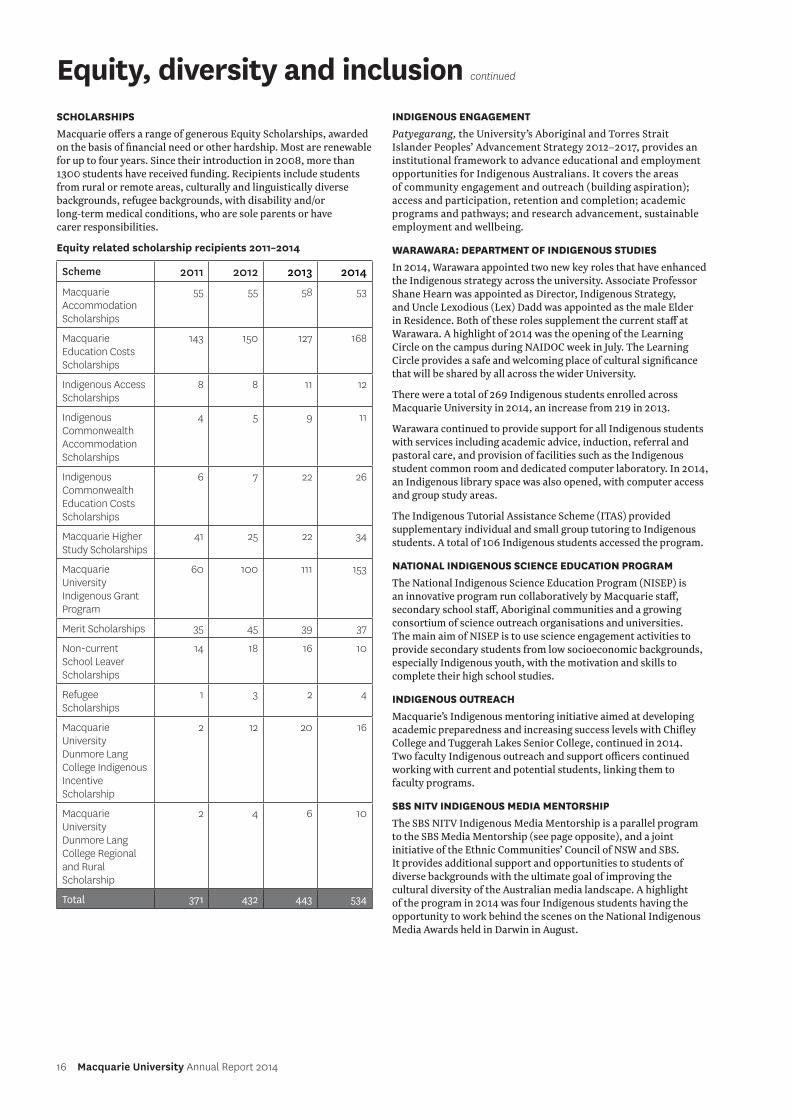
SCHOLARSHIPSMacquarie offers a range of generous Equity Scholarships, awarded on the basis of financial need or other hardship. Most are renewable for up to four years. Since their introduction in 2008, more than 1300 students have received funding. Recipients include students from rural or remote areas, culturally and linguistically diverse backgrounds, refugee backgrounds, with disability and/or long-term medical conditions, who are sole parents or have carer responsibilities.
Equity related scholarship recipients 2011–2014
Scheme 2011 2012 2013 2014
Macquarie Accommodation Scholarships
55 55 58 53
Macquarie Education Costs Scholarships
143 150 127 168
Indigenous Access Scholarships
8 8 11 12
Indigenous Commonwealth Accommodation Scholarships
4 5 9 11
Indigenous Commonwealth Education Costs Scholarships
6 7 22 26
Macquarie Higher Study Scholarships
41 25 22 34
Macquarie University Indigenous Grant Program
60 100 111 153
Merit Scholarships 35 45 39 37
Non-current School Leaver Scholarships
14 18 16 10
Refugee Scholarships
1 3 2 4
Macquarie University Dunmore Lang College Indigenous Incentive Scholarship
2 12 20 16
Macquarie University Dunmore Lang College Regional and Rural Scholarship
2 4 6 10
Total 371 432 443 534
INDIGENOUS ENGAGEMENTPatyegarang, the University’s Aboriginal and Torres Strait Islander Peoples’ Advancement Strategy 2012–2017, provides an institutional framework to advance educational and employment opportunities for Indigenous Australians. It covers the areas of community engagement and outreach (building aspiration); access and participation, retention and completion; academic programs and pathways; and research advancement, sustainable employment and wellbeing.
WARAWARA: DEPARTMENT OF INDIGENOUS STUDIES In 2014, Warawara appointed two new key roles that have enhanced the Indigenous strategy across the university. Associate Professor Shane Hearn was appointed as Director, Indigenous Strategy, and Uncle Lexodious (Lex) Dadd was appointed as the male Elder in Residence. Both of these roles supplement the current staff at Warawara. A highlight of 2014 was the opening of the Learning Circle on the campus during NAIDOC week in July. The Learning Circle provides a safe and welcoming place of cultural significance that will be shared by all across the wider University.
There were a total of 269 Indigenous students enrolled across Macquarie University in 2014, an increase from 219 in 2013.
Warawara continued to provide support for all Indigenous students with services including academic advice, induction, referral and pastoral care, and provision of facilities such as the Indigenous student common room and dedicated computer laboratory. In 2014, an Indigenous library space was also opened, with computer access and group study areas.
The Indigenous Tutorial Assistance Scheme (ITAS) provided supplementary individual and small group tutoring to Indigenous students. A total of 106 Indigenous students accessed the program.
NATIONAL INDIGENOUS SCIENCE EDUCATION PROGRAMThe National Indigenous Science Education Program (NISEP) is an innovative program run collaboratively by Macquarie staff, secondary school staff, Aboriginal communities and a growing consortium of science outreach organisations and universities. The main aim of NISEP is to use science engagement activities to provide secondary students from low socioeconomic backgrounds, especially Indigenous youth, with the motivation and skills to complete their high school studies.
INDIGENOUS OUTREACHMacquarie’s Indigenous mentoring initiative aimed at developing academic preparedness and increasing success levels with Chifley College and Tuggerah Lakes Senior College, continued in 2014. Two faculty Indigenous outreach and support officers continued working with current and potential students, linking them to faculty programs.
SBS NITV INDIGENOUS MEDIA MENTORSHIPThe SBS NITV Indigenous Media Mentorship is a parallel program to the SBS Media Mentorship (see page opposite), and a joint initiative of the Ethnic Communities’ Council of NSW and SBS. It provides additional support and opportunities to students of diverse backgrounds with the ultimate goal of improving the cultural diversity of the Australian media landscape. A highlight of the program in 2014 was four Indigenous students having the opportunity to work behind the scenes on the National Indigenous Media Awards held in Darwin in August.
Equity, diversity and inclusion continued
Equity, diversity and inclusion 17
INDIGENOUS CADETSHIPS AT MACQUARIEThe Macquarie Indigenous Cadetship program continued in 2014. The program is a Macquarie University initiative supported by central funding. There are 15 cadets employed across all divisions of the University in professional and academic environments. Cadets complete 60 days per year in an area related to their study and interests to gain professional experience and build networks, as well as work skills and confidence. Cadetships can have an academic or professional focus, and cadets receive mentoring, pastoral support and professional development opportunities.
INDIGENOUS STAFF DEVELOPMENT FUND This fund continued to provide top-up funding for Indigenous staff to attend or present at conferences, participate and host national meetings and undertake further professional development.
Multicultural Policies and Services ProgramMacquarie University values the cultural diversity of its community, and is committed to ensuring that people from culturally and linguistically diverse backgrounds (CALD) have equal opportunity to participate fully in University life.
During 2014, the Equity and Diversity Unit reviewed the University’s multicultural plan under the new Community Relations Commission University Guidelines, and established a Multicultural Advisory Group (staff and students) for stakeholder engagement. Comprehensive CALD staff and student data across a range of parameters continued to be collected and analysed, to ensure that initiatives were supported by evidence, and specific needs identified.
Macquarie teaches and undertakes research across a broad range of multicultural areas; for example, Literacy in a Multicultural Society (EDUC373); Migration, Human Rights and Diversity (SOC297); and Cross Cultural Management (BBA340). Postgraduate programs also offer a range of units exploring multicultural topics, and staff publish in fields grouped under ‘Multicultural, Intercultural and Cross-Cultural Studies’.
ASPIRATION AND CAPACITY BUILDING ACROSS DIVERSE COMMUNITIES
Macquarie University continued to engage with students, teachers, parents and communities in 2014 through the LEAP (Learning, Education, Aspiration, Participation) suite of programs. LEAP aims to increase knowledge and awareness of higher education, build capacity to access higher education and increase educational confidence and motivation among students from communities under-represented in higher education, many of whom are from migrant and refugee backgrounds.
Collectively, the Widening Participation initiative reached over 9300 primary and high school students, 320 teachers and 210 parents at 65 schools across New South Wales in 2014. Programs included Advancement via Individual Determination (AVID); Community of Schools (Auburn); Environmental Science Curriculum Enrichment (Broken Hill); Macquarie Mentoring (Refugee Mentoring); Macquarie Tutoring Program; Robotics for 9 to 16 year old students; the highly acclaimed National Indigenous Science Education Program and the Rural Students University Experience, in partnership with the Country Education Foundation of Australia.
SUPPORTING DIVERSITY OF STUDENTS AND STAFFIn 2014, Macquarie continued to increase access and participation for students from diverse backgrounds and provide a range of services and social programs.
The Learning Skills program expanded its range of academic literacy resources to assist coursework students to transition
into university and develop their academic reading and writing skills. It delivered 108 academic literacy workshops to a total of 1873 students, and provided 710 face-to-face or online individual consultations to students to assist in the development of their academic language and learning. The StudyWISE iLearn unit was also launched in 2014 to introduce students to the expectations of academic culture and help them to become self-directed and lifelong learners. This resource proved incredibly popular with students, with a total of 18,818 enrolled users and 12,883 total views in 2014.
Macquarie University provides a range of support services to students from diverse backgrounds, including medical, counselling, triage, welfare (including financial scholarship advice), disability support, advocacy, chaplaincy and career advice. Demand for these services increased by 34 per cent in 2014, with a focus on triage and referral of students requiring support. There were 1252 students seeking disability support, 1068 seeking counselling, 162 seeking welfare support, 2352 seeking advocacy support, and 3549 seeking careers support. The 24-hour helpline (1800 CARE MQ) provided immediate response to over 1250 students in 2014.
The University signed as an official supporter for the national ‘Racism. It Stops With Me’ (RISWM) campaign to empower the Macquarie community to prevent and respond effectively to racism. 2014 activities included workshops exploring issues of race and racism and its impact on individuals and communities, Indigenous Learning Circles for staff and students with Elder in Residence Uncle Lex Dadd, the establishment of a Multicultural Advisory Group and the development of the Student Ambassador Program for the RISWM campaign.
Macquarie also continued to provide facilities, services and amenities such as a multi-faith prayer room, chaplaincy service, access to housing, on-campus childcare, a dedicated Women’s Room, QueerSpace and social spaces.
With 45 cultural and faith-based student groups, activities were many and varied. ‘Big Brunches’ on campus brought international and domestic students together to share culture with regular attendances of more than 500.
Macquarie’s Buddy Program, which offers peer support for international students, involved 45 volunteers and over 6000 students participated in welcome lunches, social events and day trips in 2014.
In partnership with SBS and the Ethnic Communities’ Council of NSW, Macquarie continued offering its SBS Media Mentorship Program. This three-year program offers a suite of skills development workshops, mentoring and work placements for media students from culturally and linguistically diverse backgrounds. In 2014, the program recruited a new group of six students from migrant and refugee backgrounds, and offered work placements at SBS for the first cohort of third-year mentees.
Macquarie also supports staff from CALD backgrounds by offering career advancement, a free and confidential 24/7 Employee Assistance Program, paid education leave to undertake approved English language courses, cultural leave, a suite of professional development workshops, postgraduate study scholarships, and the postgraduate MGSM Scholarship Scheme. The Equity and Diversity Unit continued to offer free Auslan classes to staff and students to raise awareness of deaf culture and language.
CALD ENGAGEMENT ACTIVITIES Macquarie continued its involvement with UN Women in 2014, ensuring representation and participation in a range of events including the International Women’s Day UN Women’s Breakfast.
18 Macquarie University Annual Report 2014
With an emphasis on diversity, women were also invited to participate in the Macquarie Women initiative, guiding the development of the gender equity strategy for the University, and sponsored to attend external workshops and conferences. A Harmony Day Symposium was held, hosted by the Faculty of Business and Economics’ Cultural Diversity Research Network, with guest speakers including the Vice-Chancellor and the Australian Race Discrimination Commissioner. Staff also held a range of Harmony Day initiatives in their work areas across the University.
Macquarie continued to offer students and staff Diversity Grants for projects supporting inclusion and diversity. Funded projects included:
• The Importance of Libraries in Africa – co-hosted by library staff, the African Students Association and community group Saidia-Australia, it was attended by staff, students and esteemed Sudanese community members. A keynote from the University librarian was followed by cultural performances, food and dancing.
• The Africa Game Night and Think Africa lecture featured a keynote presentation by Associate Professor Andre Renzaho (from Monash University), cultural trivia games and performances.
• A Pakistani Kite Flying Festival was attended by more than 200 students, staff and community members.
• Japanese language and culture sessions (Nippon Kissa) involved a series of informal Japanese conversation sessions for interested students and staff to promote spoken Japanese on campus and introduce Japanese culture.
• A student-led conference on asylum seekers and refugees, which was a full-day conference with over 200 students, staff, and representatives from a range of not-for-profit and community organisations. The highlights of this comprehensive and thought-provoking conference program were: a panel discussion on refugee policy and issues with Senators Sam Dastyari and Lee Rhiannon, and Lucy Morgan, Refugee Council of Australia representative; the personal story of Maxvell Vanday, a Macquarie alumnus and former refugee; and a moving Treehouse Theatre performance by young refugees.
Other culturally affiliated student group activities included a Chinese food festival, Diwali night, Latino night, Sikh awareness day, Islamic awareness week and an International night.
MULTICULTURAL POLICIES AND SERVICES PROGRAM GOALS FOR 2015• consolidate the Multicultural Advisory Group and develop a set
of priorities and activities for 2015 in line with the reviewed Multicultural Plan 2015–2017
• consolidate the Student Ambassadors Program for the ‘Racism. It Stops with Me’ campaign
• focus on methods of strengthening staff cultural awareness and competency through smaller group facilitated discussions about race and racism
• focus on methods to strengthen student cultural awareness and competency through student engagement and student groups
• continue outreach programs for students from disadvantaged backgrounds through Widening Participation and LEAP initiatives
• continue the provision of language and literacy programs for CALD students and staff, monitor usage rates and identify specific needs based on direct feedback
• encourage collaborations with external partners such as the Australian Human Rights Commission, Multicultural NSW, the Community Relations Commission of NSW, SBS Broadcasting, UN Women and White Ribbon Australia
• strengthen the mechanisms that allow CALD staff and students to participate fully in academic and campus life, and have a voice in decision making
• support career advancement, professional opportunities and visibility of CALD staff
• ensure that University policy and procedures support, respect and value CALD staff and students
• monitor University and student publications to ensure balanced representation for CALD students and staff in content and images.
Equity, diversity and inclusion continued
Sustainability 19
SustainabilityUniversities educate most of the world’s future leaders, decision-makers and teachers, while advancing the boundaries of knowledge. Macquarie University is constantly seeking to meet its responsibility and exemplify sustainability best practice through both core business and supportive services.
Vision The University’s sustainability vision is to be ecologically sound, socially just and economically viable in all its activities. Macquarie aims to:
• function as a sustainable community, embodying responsible consumption of energy, water, food, products and transport
• support sustainability in the local community and region
• ensure students leave the University prepared to contribute as working citizens to an environmentally healthy and equitable society
• meet changing social, environmental and economic conditions to reduce the impact of climate change upon the environment
• embed sustainability in all that we do.
Demonstrating leadership A joint staff and student campaign focusing on reducing the use of disposable plastic bottles saw the University receive the Student Engagement Award at the annual Green Gown Awards Australasia. The Tap It campaign successfully recruited more than 700 members of the campus community who pledged to choose tap over bottled water, developed a campus wide ‘tap map’, handed out over 1500 reusable bottles made in Australia from renewable sugar cane, and hosted a popular Bottled Water Free Day.
Partnership and engagement To continue encouraging staff members to take advantage of their volunteer leave, the sustainability team held a volunteering expo to help staff engage with a variety of charities and not-for-profit organisations, to make partnering up as easy as possible.
Building on the success of the ‘M-power’ staff engagement program launched in 2013, four new quarterly sustainability themes provided an engaging and simple structure and suite of resources for the Sustainability Representative Network (SRN) to utilise across their departments.
This year the SRN celebrated its fifth birthday, indicating the strength of the network’s ability to build community through facilitating engagement across departments. Three SRN Awards of Excellence were presented: an overall winner for professional (Sidsel Sorensen, Faculty of Human Sciences); overall winner for academic (Dr Peter Keegan, Faculty of Arts); and a Highly Commended award (Meg Woods, Gumnut Cottage).
Participation in the sixth annual Department Sustainability Challenge (DSC) grew with 41 departments getting involved. The DSC encourages actions across four different categories, including the introduction of ‘Target Sustainability’, a new approach to understanding and measuring holistic sustainability within departments to help improve sustainability performance and identify outstanding gaps for actions. A heated competition saw Human Resources and the Department of Ancient History winning the Most Sustainable Department (Professional and Academic) titles, while the Faculty of Human Sciences took out the Most Sustainable Faculty award. Thirty-two departments achieved over 15 stars, for which a tree was planted in critical koala habitat, while 16 departments achieved over 30 stars, for which they received Oxfam sponsorship of a piglet for a family in Vietnam.
To encourage more staff and students to commute by bicycle, the sustainability team held its seventh annual Ride2Uni Day Breakfast in October, attracting over 100 attendees and partnerships with Bicycle NSW, BikeNorth and Chain Reaction Cycles. Macquarie University continues to strengthen its relationships with the wider community through representation on the City of Ryde bike advisory committee.
The University began the development of an iPad tour application aimed at engaging the community with sustainability initatives on campus. The application provides a resource for developing tours of any kind, and can be utilised by other departments across campus.
The Arboretum continued to attract crowds with 12 tours conducted, including school, corporate and community groups. Staff and students also joined in with dedicated walks on campus. The Arboretum continued to expand with the completion of the Indian Spice Garden, a collaborative project with the Faculty of Arts. Explanatory signs were also installed in the Bush Tucker Garden, the Indian Spice Garden, and by the lake, with 80 individual plant labels installed across campus. More interpretive signage was added to the Arboretum, the Earth Sciences and Biological Sciences gardens, enabling greater engagement with staff, students and the community. Guided tours continue to be a successful community engagement activity, with strong positive feedback, and the clear enjoyment of visitors.
Learning, teaching and research Embedding sustainability thoughout the curriculum remained a focus in 2014, with one program from each faculty involved in identifying and connecting with sustainability literacy. Utilising a framework developed by Macquarie colleagues with input from national and international sector representatives, program and unit conveners mapped locations where learning is already occurring, to make implicit connections more explicit.
Green Steps (BIOL392) was again delivered as a Session 2 PACE unit. The unit was run at capacity with good engagement and feedback from students.
The Arboretum continued to be a resource for staff and students, as both an outdoor learning space and a teaching resource. Teaching gardens were expanded with additional plants added to the Bush Tucker Garden, the Indian Spice Garden, and the Earth Sciences (Proteaceae) Garden.
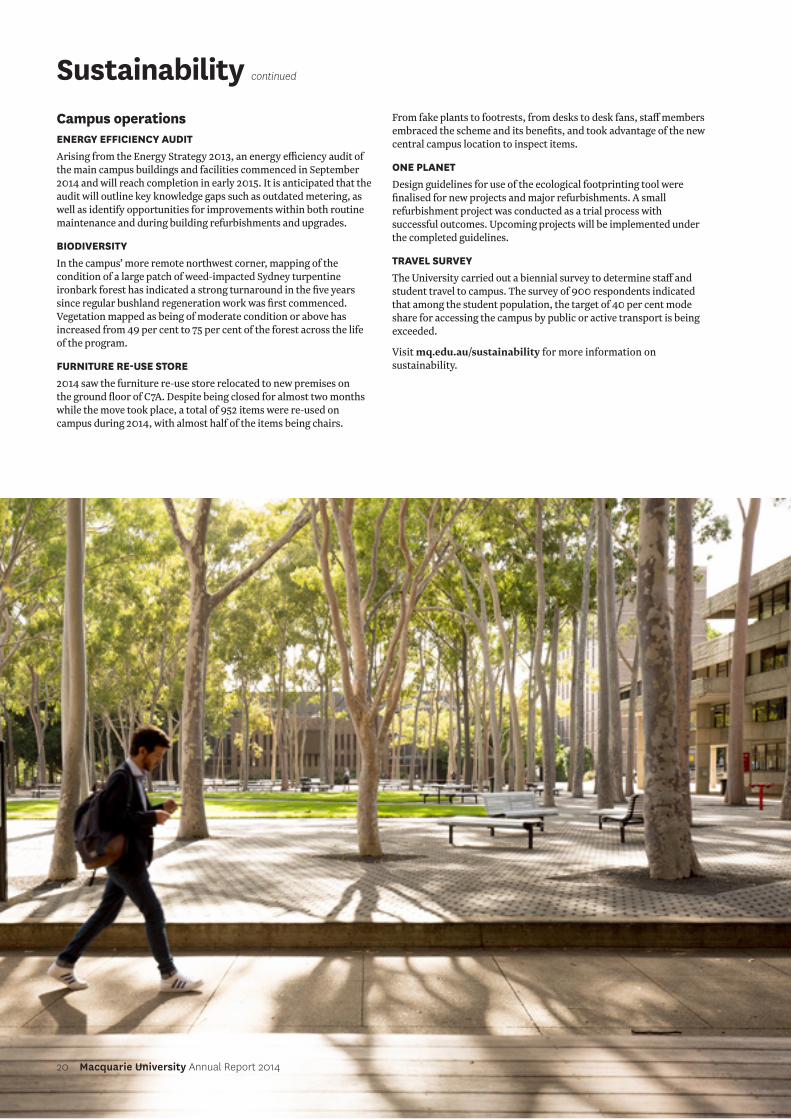
20 Macquarie University Annual Report 2014
Campus operations ENERGY EFFICIENCY AUDITArising from the Energy Strategy 2013, an energy efficiency audit of the main campus buildings and facilities commenced in September 2014 and will reach completion in early 2015. It is anticipated that the audit will outline key knowledge gaps such as outdated metering, as well as identify opportunities for improvements within both routine maintenance and during building refurbishments and upgrades.
BIODIVERSITYIn the campus’ more remote northwest corner, mapping of the condition of a large patch of weed-impacted Sydney turpentine ironbark forest has indicated a strong turnaround in the five years since regular bushland regeneration work was first commenced. Vegetation mapped as being of moderate condition or above has increased from 49 per cent to 75 per cent of the forest across the life of the program.
FURNITURE RE-USE STORE2014 saw the furniture re-use store relocated to new premises on the ground floor of C7A. Despite being closed for almost two months while the move took place, a total of 952 items were re-used on campus during 2014, with almost half of the items being chairs.
From fake plants to footrests, from desks to desk fans, staff members embraced the scheme and its benefits, and took advantage of the new central campus location to inspect items.
ONE PLANETDesign guidelines for use of the ecological footprinting tool were finalised for new projects and major refurbishments. A small refurbishment project was conducted as a trial process with successful outcomes. Upcoming projects will be implemented under the completed guidelines.
TRAVEL SURVEYThe University carried out a biennial survey to determine staff and student travel to campus. The survey of 900 respondents indicated that among the student population, the target of 40 per cent mode share for accessing the campus by public or active transport is being exceeded.
Visit mq.edu.au/sustainability for more information on sustainability.
Sustainability continued
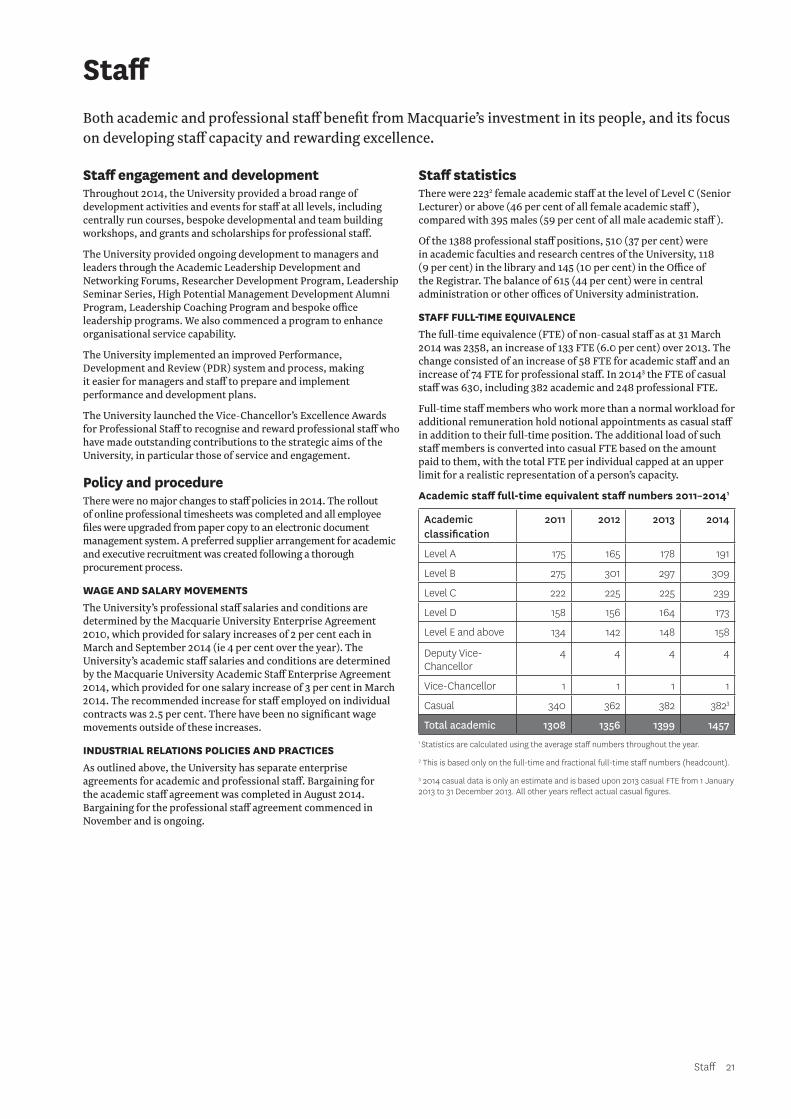
Staff 21
Staff engagement and development Throughout 2014, the University provided a broad range of development activities and events for staff at all levels, including centrally run courses, bespoke developmental and team building workshops, and grants and scholarships for professional staff.
The University provided ongoing development to managers and leaders through the Academic Leadership Development and Networking Forums, Researcher Development Program, Leadership Seminar Series, High Potential Management Development Alumni Program, Leadership Coaching Program and bespoke office leadership programs. We also commenced a program to enhance organisational service capability.
The University implemented an improved Performance, Development and Review (PDR) system and process, making it easier for managers and staff to prepare and implement performance and development plans.
The University launched the Vice-Chancellor’s Excellence Awards for Professional Staff to recognise and reward professional staff who have made outstanding contributions to the strategic aims of the University, in particular those of service and engagement.
Policy and procedureThere were no major changes to staff policies in 2014. The rollout of online professional timesheets was completed and all employee files were upgraded from paper copy to an electronic document management system. A preferred supplier arrangement for academic and executive recruitment was created following a thorough procurement process.
WAGE AND SALARY MOVEMENTS The University’s professional staff salaries and conditions are determined by the Macquarie University Enterprise Agreement 2010, which provided for salary increases of 2 per cent each in March and September 2014 (ie 4 per cent over the year). The University’s academic staff salaries and conditions are determined by the Macquarie University Academic Staff Enterprise Agreement 2014, which provided for one salary increase of 3 per cent in March 2014. The recommended increase for staff employed on individual contracts was 2.5 per cent. There have been no significant wage movements outside of these increases.
INDUSTRIAL RELATIONS POLICIES AND PRACTICES As outlined above, the University has separate enterprise agreements for academic and professional staff. Bargaining for the academic staff agreement was completed in August 2014. Bargaining for the professional staff agreement commenced in November and is ongoing.
Staff statistics There were 2232 female academic staff at the level of Level C (Senior Lecturer) or above (46 per cent of all female academic staff ), compared with 395 males (59 per cent of all male academic staff ).
Of the 1388 professional staff positions, 510 (37 per cent) were in academic faculties and research centres of the University, 118 (9 per cent) in the library and 145 (10 per cent) in the Office of the Registrar. The balance of 615 (44 per cent) were in central administration or other offices of University administration.
STAFF FULL-TIME EQUIVALENCE The full-time equivalence (FTE) of non-casual staff as at 31 March 2014 was 2358, an increase of 133 FTE (6.0 per cent) over 2013. The change consisted of an increase of 58 FTE for academic staff and an increase of 74 FTE for professional staff. In 20143 the FTE of casual staff was 630, including 382 academic and 248 professional FTE.
Full-time staff members who work more than a normal workload for additional remuneration hold notional appointments as casual staff in addition to their full-time position. The additional load of such staff members is converted into casual FTE based on the amount paid to them, with the total FTE per individual capped at an upper limit for a realistic representation of a person’s capacity.
Academic staff full-time equivalent staff numbers 2011–20141
Academic classification
2011 2012 2013 2014
Level A 175 165 178 191
Level B 275 301 297 309
Level C 222 225 225 239
Level D 158 156 164 173
Level E and above 134 142 148 158
Deputy Vice-Chancellor
4 4 4 4
Vice-Chancellor 1 1 1 1
Casual 340 362 382 3823
Total academic 1308 1356 1399 14571 Statistics are calculated using the average staff numbers throughout the year.
2 This is based only on the full-time and fractional full-time staff numbers (headcount).
3 2014 casual data is only an estimate and is based upon 2013 casual FTE from 1 January 2013 to 31 December 2013. All other years reflect actual casual figures.
Staff Both academic and professional staff benefit from Macquarie’s investment in its people, and its focus on developing staff capacity and rewarding excellence.
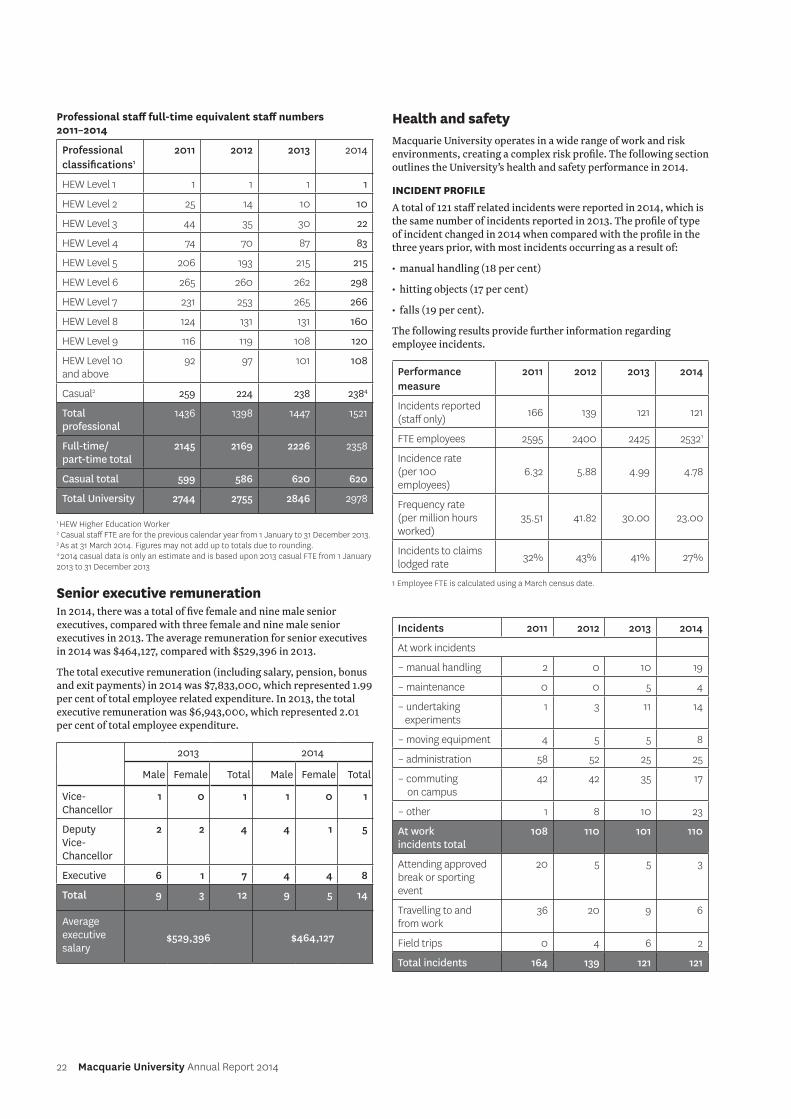
22 Macquarie University Annual Report 2014
Professional staff full-time equivalent staff numbers 2011–2014
Professional classifications1
2011 2012 2013 2014
HEW Level 1 1 1 1 1
HEW Level 2 25 14 10 10
HEW Level 3 44 35 30 22
HEW Level 4 74 70 87 83
HEW Level 5 206 193 215 215
HEW Level 6 265 260 262 298
HEW Level 7 231 253 265 266
HEW Level 8 124 131 131 160
HEW Level 9 116 119 108 120
HEW Level 10 and above
92 97 101 108
Casual2 259 224 238 2384
Total professional
1436 1398 1447 1521
Full-time/ part-time total
2145 2169 2226 2358
Casual total 599 586 620 620
Total University 2744 2755 2846 2978
1 HEW Higher Education Worker
2 Casual staff FTE are for the previous calendar year from 1 January to 31 December 2013. 3 As at 31 March 2014. Figures may not add up to totals due to rounding. 4 2014 casual data is only an estimate and is based upon 2013 casual FTE from 1 January 2013 to 31 December 2013
Senior executive remunerationIn 2014, there was a total of five female and nine male senior executives, compared with three female and nine male senior executives in 2013. The average remuneration for senior executives in 2014 was $464,127, compared with $529,396 in 2013.
The total executive remuneration (including salary, pension, bonus and exit payments) in 2014 was $7,833,000, which represented 1.99 per cent of total employee related expenditure. In 2013, the total executive remuneration was $6,943,000, which represented 2.01 per cent of total employee expenditure.
2013 2014
Male Female Total Male Female Total
Vice-Chancellor
1 0 1 1 0 1
Deputy Vice-Chancellor
2 2 4 4 1 5
Executive 6 1 7 4 4 8
Total 9 3 12 9 5 14
Average executive salary
$529,396 $464,127
Health and safety Macquarie University operates in a wide range of work and risk environments, creating a complex risk profile. The following section outlines the University’s health and safety performance in 2014.
INCIDENT PROFILE A total of 121 staff related incidents were reported in 2014, which is the same number of incidents reported in 2013. The profile of type of incident changed in 2014 when compared with the profile in the three years prior, with most incidents occurring as a result of:
• manual handling (18 per cent)
• hitting objects (17 per cent)
• falls (19 per cent).
The following results provide further information regarding employee incidents.
Performance measure
2011 2012 2013 2014
Incidents reported (staff only) 166 139 121 121
FTE employees 2595 2400 2425 25321
Incidence rate (per 100 employees)
6.32 5.88 4.99 4.78
Frequency rate (per million hours worked)
35.51 41.82 30.00 23.00
Incidents to claims lodged rate 32% 43% 41% 27%
1 Employee FTE is calculated using a March census date.
Incidents 2011 2012 2013 2014
At work incidents
– manual handling 2 0 10 19
– maintenance 0 0 5 4
– undertaking experiments
1 3 11 14
– moving equipment 4 5 5 8
– administration 58 52 25 25
– commuting on campus
42 42 35 17
– other 1 8 10 23
At work incidents total
108 110 101 110
Attending approved break or sporting event
20 5 5 3
Travelling to and from work
36 20 9 6
Field trips 0 4 6 2
Total incidents 164 139 121 121
Staff continued
Staff 23
Workers’ compensation A total of 33 claims for workers’ compensation were lodged in 2014, compared with 50 claims in 2013. This represents a 34 per cent reduction in reported claims between the years. The University’s claim lodgement rate fell to 1.30 (per 100 FTE) compared with 2.06 in 2013. The University’s performance in managing risk and claims continues to demonstrate significant improvement, with ongoing reductions in the number of claims lodged, in the number of claims with lost time and in the average cost per claim. There were no fatalities reported in 2014.
Health and Safety unit The unit plans, coordinates and administers the health and safety system across the University and its controlled entities. The unit consists of 10 staff, and works closely with faculty-based specialists and over 100 health and safety representatives across the faculties and offices of the University.
The unit’s focus in 2014 was to:
• further cement the system of workplace safety inspections
• embed and further develop risk profiles across the University
• implement risk management plans in key areas of the University
• strengthen consultative structures between management and employees.
Retro-Paid Loss Premium model (workers’ compensation) In 2011, the University Group became a participant in the Retro-Paid Loss Premium model in respect of its workers’ compensation insurance. This model is driven largely by claims costs and provides incentives for employers with strong performance in workplace health and safety, injury management and return to work.
Continued strong claims and injury management practices has realised ongoing savings to the Macquarie University Group (Macquarie University and all of its controlled entities) premium. The University Group’s 2014 minimum premium was calculated at $1,252,551. This represents a saving to the University Group of $2,020,872 when compared with what would have been paid under the conventional premium model calculation. Details of claims can be found on the following page.
Notifiable incidents Two notifiable incidents occurred in the reporting period. These matters were notified to WorkCover NSW, investigated internally, remediation actions put into place and the matters have been closed.
PHOT
O: H
OLI
MAG
E
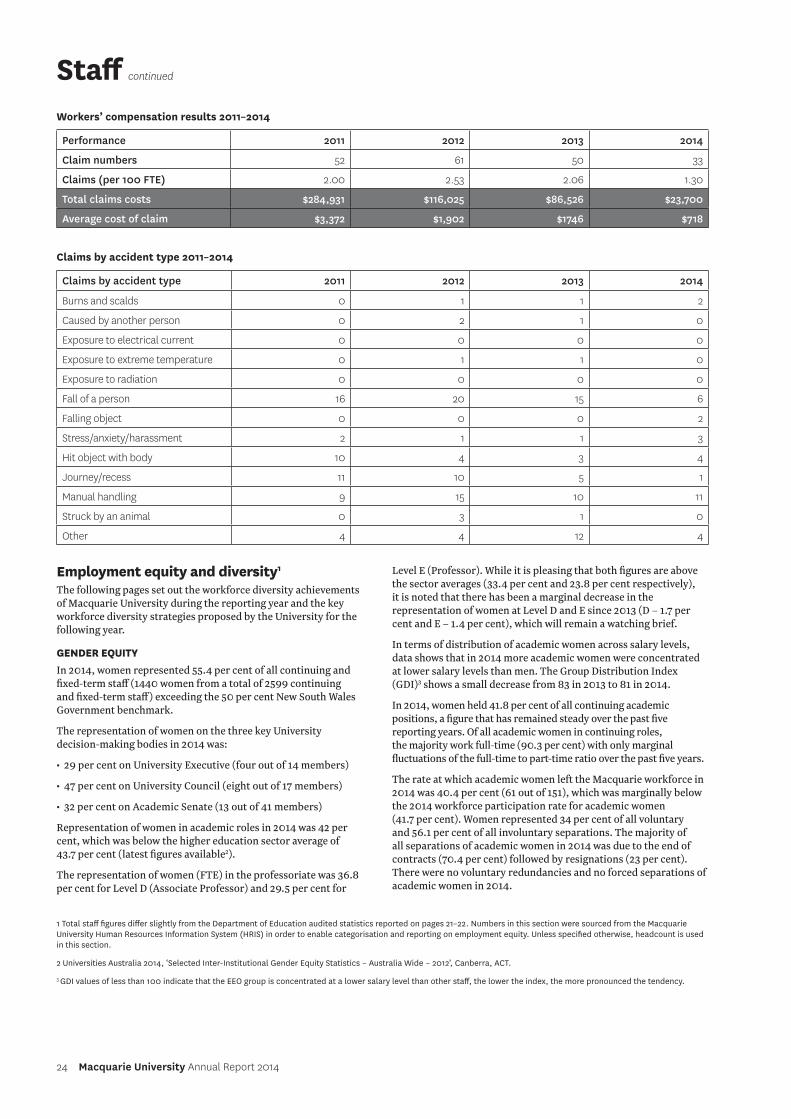
24 Macquarie University Annual Report 2014
Employment equity and diversity1
The following pages set out the workforce diversity achievements of Macquarie University during the reporting year and the key workforce diversity strategies proposed by the University for the following year.
GENDER EQUITYIn 2014, women represented 55.4 per cent of all continuing and fixed-term staff (1440 women from a total of 2599 continuing and fixed-term staff) exceeding the 50 per cent New South Wales Government benchmark.
The representation of women on the three key University decision-making bodies in 2014 was:
• 29 per cent on University Executive (four out of 14 members)
• 47 per cent on University Council (eight out of 17 members)
• 32 per cent on Academic Senate (13 out of 41 members)
Representation of women in academic roles in 2014 was 42 per cent, which was below the higher education sector average of 43.7 per cent (latest figures available2).
The representation of women (FTE) in the professoriate was 36.8 per cent for Level D (Associate Professor) and 29.5 per cent for
Level E (Professor). While it is pleasing that both figures are above the sector averages (33.4 per cent and 23.8 per cent respectively), it is noted that there has been a marginal decrease in the representation of women at Level D and E since 2013 (D – 1.7 per cent and E – 1.4 per cent), which will remain a watching brief.
In terms of distribution of academic women across salary levels, data shows that in 2014 more academic women were concentrated at lower salary levels than men. The Group Distribution Index (GDI)3 shows a small decrease from 83 in 2013 to 81 in 2014.
In 2014, women held 41.8 per cent of all continuing academic positions, a figure that has remained steady over the past five reporting years. Of all academic women in continuing roles, the majority work full-time (90.3 per cent) with only marginal fluctuations of the full-time to part-time ratio over the past five years.
The rate at which academic women left the Macquarie workforce in 2014 was 40.4 per cent (61 out of 151), which was marginally below the 2014 workforce participation rate for academic women (41.7 per cent). Women represented 34 per cent of all voluntary and 56.1 per cent of all involuntary separations. The majority of all separations of academic women in 2014 was due to the end of contracts (70.4 per cent) followed by resignations (23 per cent). There were no voluntary redundancies and no forced separations of academic women in 2014.
Workers’ compensation results 2011–2014
Performance 2011 2012 2013 2014
Claim numbers 52 61 50 33
Claims (per 100 FTE) 2.00 2.53 2.06 1.30
Total claims costs $284,931 $116,025 $86,526 $23,700
Average cost of claim $3,372 $1,902 $1746 $718
Claims by accident type 2011–2014
Claims by accident type 2011 2012 2013 2014
Burns and scalds 0 1 1 2
Caused by another person 0 2 1 0
Exposure to electrical current 0 0 0 0
Exposure to extreme temperature 0 1 1 0
Exposure to radiation 0 0 0 0
Fall of a person 16 20 15 6
Falling object 0 0 0 2
Stress/anxiety/harassment 2 1 1 3
Hit object with body 10 4 3 4
Journey/recess 11 10 5 1
Manual handling 9 15 10 11
Struck by an animal 0 3 1 0
Other 4 4 12 4
Staff continued
1 Total staff figures differ slightly from the Department of Education audited statistics reported on pages 21–22. Numbers in this section were sourced from the Macquarie University Human Resources Information System (HRIS) in order to enable categorisation and reporting on employment equity. Unless specified otherwise, headcount is used in this section.
2 Universities Australia 2014, ‘Selected Inter-Institutional Gender Equity Statistics – Australia Wide – 2012’, Canberra, ACT.
3 GDI values of less than 100 indicate that the EEO group is concentrated at a lower salary level than other staff, the lower the index, the more pronounced the tendency.
Staff 25
As at 31 March 2014, women represented 26.2 of the 42 Concentration of Research Excellence (CORE) appointments, which is a 2.8 per cent increase since 2013. As CORE appointments are at senior levels C, D and E, this appointment rate remains significantly below women’s workforce representation at these levels.
The percentage of women applying to participate in the Outside Studies Program in 2014 was 44.9 per cent (35 out of 78). Women’s success rate was 94.3 per cent, as compared with an 83.7 per cent success rate for male applicants. Women represented 55.6 per cent of all applicants for New Staff and Staff Returning from Parental Leave Research Grants in 2014 and their success rate was 53.3 per cent.
In 2014, 45.2 per cent of all applications for academic promotion were from women (33 out of 73).
For promotion to Level B, 58.3 per cent of all applicants (seven out of 12) and 54.5 per cent of all promotions (six out of 11) were women. Of all female applicants 85.7 per cent (six out of 7) were promoted, as compared with 100 per cent success rate of their male counterparts.
For promotion to Level C, 38.5 per cent of all applicants (10 out of 26) and 41.7 per cent of promotions (10 out of 24) were women. Of all female applicants, 100 per cent (10 out of 10) were promoted, as compared with an 87.5 per cent success rate for men at this level.
For promotion to Level D, 41.7 per cent of applicants (10 out of 24) and 50 per cent of all promotions (eight out of 16) were women. Both the application and promotion rates are significantly higher than women’s workforce representation (36.8 per cent) and the sector average at this level (33.4 per cent). Of all female applicants, 80 per cent (eight out of 10) were promoted, as compared to a 57.1 per cent success rate of their male counterparts.
For promotion to Level E, 54.5 per cent of all applications (6 out of 11) and 60 per cent of all promotions (6 out of 10) were women. It is pleasing that all female applicants (6 out of 6) were promoted to this higher level of academia. Eighty per cent of male applicants were promoted. Both the application and promotion rates are significantly higher than women’s workforce participation rates (29.5 per cent) and the sector average at this level (23.8 per cent).
In 2014, the workforce participation rate of women on professional staff was 65.3 per cent. Women remained clustered in mid-range employment levels. Representation of FTE professional women in management roles (HEW 10 and above) was 50.1 per cent, which is on par with the government benchmark. Women’s Group Distribution Index (GDI) during the reporting period was 91, two points higher than the previous year (89 in 2013).
Women held 65.5 per cent of all continuing professional staff positions in 2014, with the majority employed in full-time roles (79 per cent). Both these figures have remained steady over the past five reporting years. The significant over-representation of professional women in part-time contract positions (82.5 per cent) remains a watching brief.
During the year, professional women left the Macquarie University workforce at a rate of 66.2 per cent (147 out of 222), which is consistent with their workforce representation. Women represented 64.4 per cent of all involuntary and 67.1 per cent of all voluntary professional staff separations. In 2014, the majority (57.3 per cent) of professional women separated from the University due to resignations. This was followed by separations due to the end of contracts (22.6 per cent). Professional women represented 45.5 per cent of forced separations in 2014.
The University continues to have comprehensive and generous parental leave provisions allowing four weeks’ paid leave on the
child’s birth (for birth mother and partner) and up to 22 weeks of paid leave for the primary carer. The University recognises same sex parents, adoption, and fostering of children. In 2014, 152 staff (65.8 per cent of whom were women and 34.2 per cent men) took parental leave. Of the number of days taken, 8.8 per cent were taken by men.
During the year, the Macquarie Women’s Brains Trust continued to meet face to face and through email. This diverse group of women (academic/professional/junior/senior) come together to advise on the progress of the University’s Gender Equity Strategy. In 2014, the University sponsored 17 women to attend the Macquarie Women, Work and Management Conference, and supported women to attend the Universities Australia Executive Women Workshops, and a range of networking events on campus. It is exciting that the new Strategic Research Framework 2015–2024 clearly articulates the desire for a ‘step change in gender equity’ at Macquarie over the next 10 years.
In 2014, the University continued to be part of the Australian Breastfeeding Association workplace initiative and retained its status as an accredited Breastfeeding Friendly Workplace. The University provides three parenting rooms and paid lactation breaks for women wishing to breastfeed or express on campus.
As one of only three universities in Australia with White Ribbon Workplace Accreditation, Macquarie continued to lead in promoting the National White Ribbon Workplace Program, and held a high profile Business Leaders Symposium at MGSM, to encourage local precinct partners to become involved in Australia’s largest anti-violence towards women campaign.
PEOPLE WITH DISABILITYThe University recognises that employment equity for people with disability requires targeted interventions across a range of areas. 2014 saw significant progress in the implementation of the University’s Disability Action Plan (DAP) 2012–2017. During the year, a Human Resources DAP working party was established to specifically progress employment equity matters. An Accessible Information and Communications Roundtable Group was also set up. The Accessible Environments Advisory Group continued to focus on the built environment and resolving physical access issues.
In order to ensure the perspectives of staff with disability were heard, a survey was conducted that informed the work of relevant committees. The University continued its silver membership of the Australian Network on Disability, a not-for-profit organisation advancing the inclusion of people with disability in employment. Through this membership, an audit of Macquarie’s recruitment process in terms of accessibility was conducted. Raising the awareness of disability issues, rights and responsibilities in the Macquarie workforce is a key part of professional development.
According to voluntary responses, people with disability represented 3.9 per cent of academic and 4.2 per cent of professional staff at Macquarie in 2014. Representation of academic and professional staff with disability requiring work-related adjustments was 0.9 per cent. Academic staff with disability were primarily employed at Level C in 2014 (41.4 per cent of all academic staff with disability) and in mid-range professional staff positions HEW 5–7 (highest being HEW 6 at 21.1 per cent).
Of all academic staff with disability, 75.9 per cent were in continuing and 24.1 per cent in fixed-term roles. Of the continuing roles, 86.4 per cent were full-time. Of all professional staff with disability, 81.6 per cent were in continuing roles and 18.4 per cent were fixed-term employees. Of the continuing roles, 83.9 per cent were full-time.
26 Macquarie University Annual Report 2014
During the reporting year, there was one voluntary redundancy and no forced separations of academic staff with disability.
INDIGENOUS AUSTRALIANS4
In 2014, the University continued the implementation of Patyegarang Aboriginal and Torres Strait Islander People’s Advancement Strategy (2012–2017) to improve educational and employment outcomes for Indigenous people at Macquarie. According to voluntary responses, the representation of Aboriginal and Torres Strait Islander Peoples in the Macquarie workforce remained well below the government benchmark of 2.6 per cent. For academic staff, Indigenous Australian representation was 0.8 per cent in 2014 (six academic staff at levels B, C, D and E). The University recruited one Indigenous Australian into an academic role during the reporting year. Indigenous professional staff representation in 2013 was 0.7 per cent, which included six professional staff. Two Indigenous Australians were employed in casual professional staff roles.
CULTURAL AND LINGUISTIC DIVERSITYMacquarie University’s staff profile is diverse with 90 countries and 65 languages represented. In 2014, based on voluntary responses, the representation of staff from non-English speaking backgrounds (NESB) was 30.8 per cent in the academic and 34.8 per cent in the professional workforce. These rates are significantly higher than the government benchmark of 19.0 per cent.
In 2014, the highest representation of academic staff from non-English speaking backgrounds was at Level B (28.9 per cent of all academic staff from non-English speaking backgrounds). For professional staff it was at HEW 7 (26.4 per cent).
Staff from non-English speaking backgrounds represented 22.9 per cent of all academic and 11.9 per cent of all professional employees externally recruited in 2014. External recruitment was to academic levels A, B, C and E, and to professional HEW levels 2–10.
In separations from the Macquarie workforce, staff from non-English speaking backgrounds represented 8.0 per cent of all academic and 4.5 per cent of all professional staff separations in 2014. There were no voluntary redundancies of either academic or professional staff from non-English speaking backgrounds.
Of all academic staff from non-English speaking backgrounds, 71.1 per cent held continuing positions and 28.9 per cent fixed-term positions. Of the continuing roles, 98.2 per cent were full-time. Of all professional NESB staff, 84.1 per cent were employed in continuing and 15.9 per cent in fixed-term roles. Of these continuing roles, 91.5 per cent were full-time.
The GDI for both academic and professional NESB staff remained below the government benchmark of 100 (83 and 86 respectively).
EMPLOYMENT EQUITY GOALS FOR 2015
• embed equity considerations in human resources processes (recruitment and selection, induction, professional development, promotion and advancement)
• monitor restructures and change management processes for equity issues
• partner with external organisations that align with our equity goals and maximise opportunities to build a sense of community and engagement for all employees
• continue to provide Equity Observers for all academic promotion rounds and participation in reviews of processes
• provide professional development for managers and supervisors on legislation, rights and responsibilities around discrimination for staff and students, with a focus on inclusive leadership and the prevention of bullying and harassment
• consolidate the University’s Gender Equity Strategy with two main streams: Women in Research and Women in Science and Engineering, in consultation with the Macquarie Women’s Brains Trust
• continue to lead the White Ribbon Workplace Accreditation rollout
• implement the employment-related recommendations of the University’s Indigenous Advancement Strategy
• maintain the Macquarie Indigenous Student Cadetship Program at full capacity
• continue the Indigenous Staff Development Fund
• implement and monitor the Disability Action Plan 2012–2017 and conduct a 2015 mid-term review to increase local area operational plans and strategies that promote and support people with disability
• investigate opportunities for the employment of Macquarie students with disability at Macquarie both prior to and after graduation
• continue implementation of the ‘Racism: It Stops with Me’ campaign and launch the reviewed Multicultural Policies and Services Program.
Staff continued
4 Data pertaining to designated equity groups (Indigenous Australians, staff with disabilities and staff from culturally and linguistically diverse backgrounds) is gathered through voluntary e-survey responses.
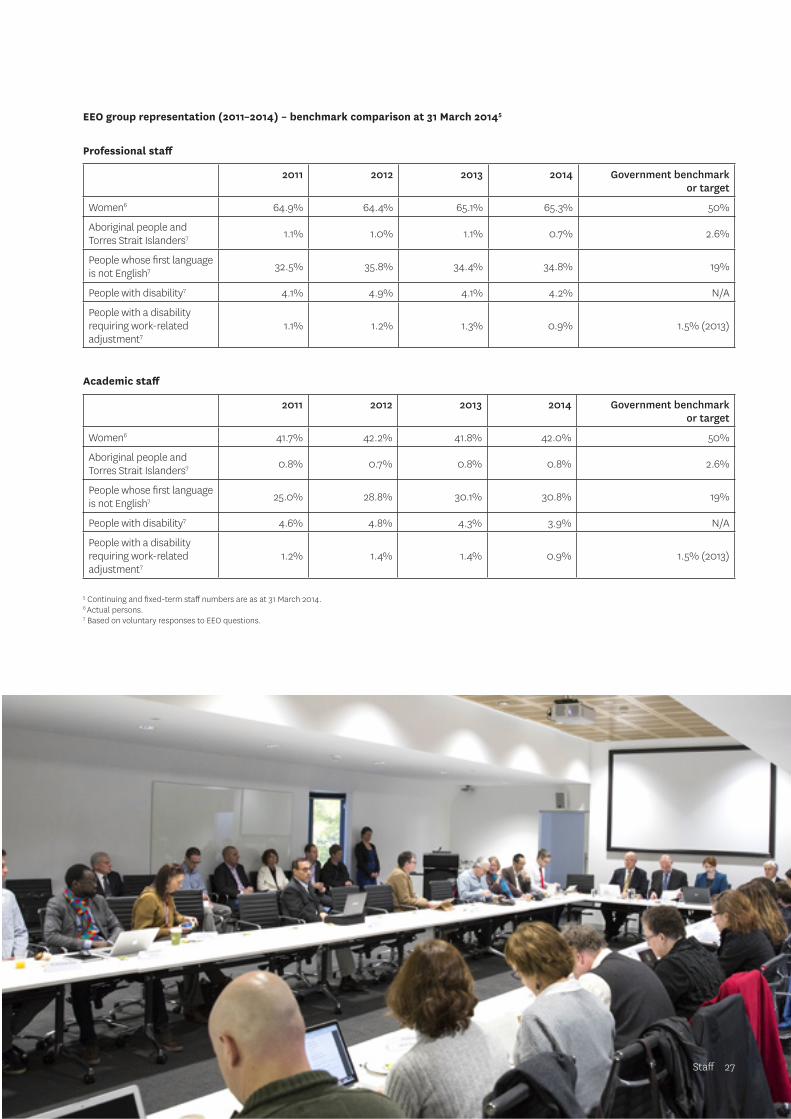
Staff 27
EEO group representation (2011–2014) – benchmark comparison at 31 March 20145
Professional staff
2011 2012 2013 2014 Government benchmark or target
Women6 64.9% 64.4% 65.1% 65.3% 50%
Aboriginal people and Torres Strait Islanders7 1.1% 1.0% 1.1% 0.7% 2.6%
People whose first language is not English7 32.5% 35.8% 34.4% 34.8% 19%
People with disability7 4.1% 4.9% 4.1% 4.2% N/A
People with a disability requiring work-related adjustment7
1.1% 1.2% 1.3% 0.9% 1.5% (2013)
Academic staff
2011 2012 2013 2014 Government benchmark or target
Women6 41.7% 42.2% 41.8% 42.0% 50%
Aboriginal people and Torres Strait Islanders7 0.8% 0.7% 0.8% 0.8% 2.6%
People whose first language is not English7 25.0% 28.8% 30.1% 30.8% 19%
People with disability7 4.6% 4.8% 4.3% 3.9% N/A
People with a disability requiring work-related adjustment7
1.2% 1.4% 1.4% 0.9% 1.5% (2013)
5 Continuing and fixed-term staff numbers are as at 31 March 2014. 6 Actual persons. 7 Based on voluntary responses to EEO questions.
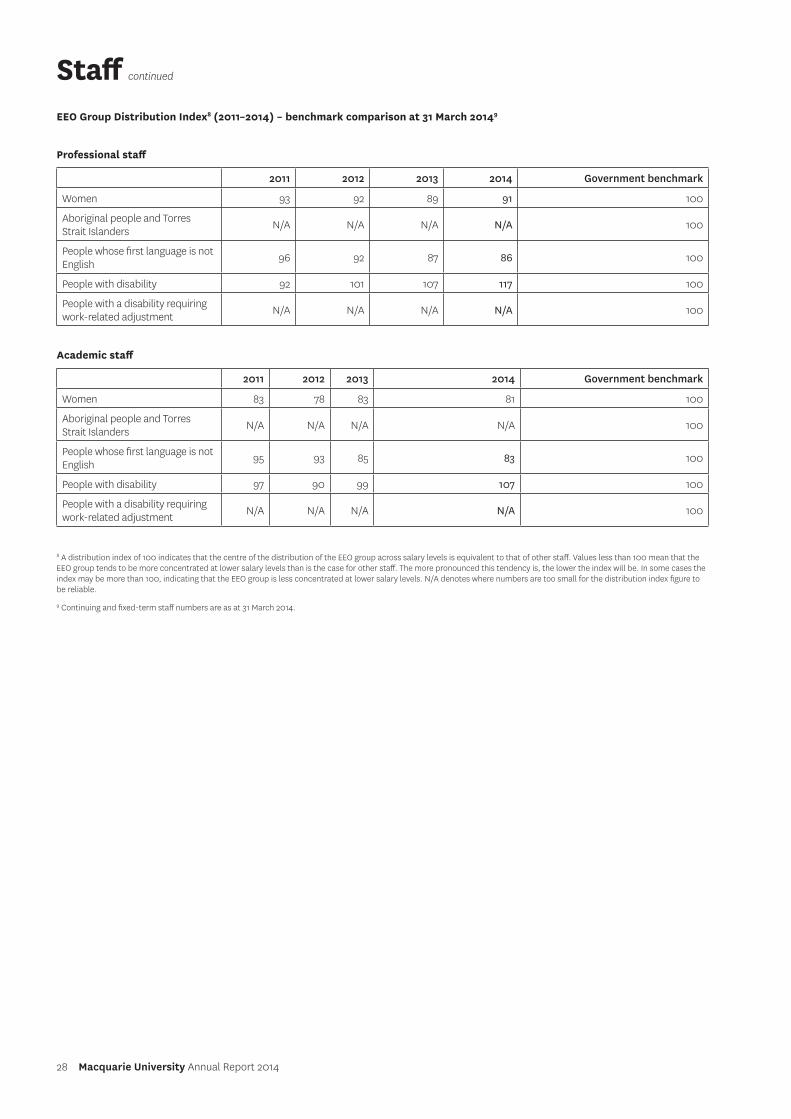
28 Macquarie University Annual Report 2014
EEO Group Distribution Index8 (2011–2014) – benchmark comparison at 31 March 20149
Professional staff
2011 2012 2013 2014 Government benchmark
Women 93 92 89 91 100
Aboriginal people and Torres Strait Islanders N/A N/A N/A N/A 100
People whose first language is not English 96 92 87 86 100
People with disability 92 101 107 117 100
People with a disability requiring work-related adjustment N/A N/A N/A N/A 100
Academic staff
2011 2012 2013 2014 Government benchmark
Women 83 78 83 81 100
Aboriginal people and Torres Strait Islanders N/A N/A N/A N/A 100
People whose first language is not English 95 93 85 83 100
People with disability 97 90 99 107 100
People with a disability requiring work-related adjustment N/A N/A N/A N/A 100
8 A distribution index of 100 indicates that the centre of the distribution of the EEO group across salary levels is equivalent to that of other staff. Values less than 100 mean that the EEO group tends to be more concentrated at lower salary levels than is the case for other staff. The more pronounced this tendency is, the lower the index will be. In some cases the index may be more than 100, indicating that the EEO group is less concentrated at lower salary levels. N/A denotes where numbers are too small for the distribution index figure to be reliable.
9 Continuing and fixed-term staff numbers are as at 31 March 2014.
Staff continued
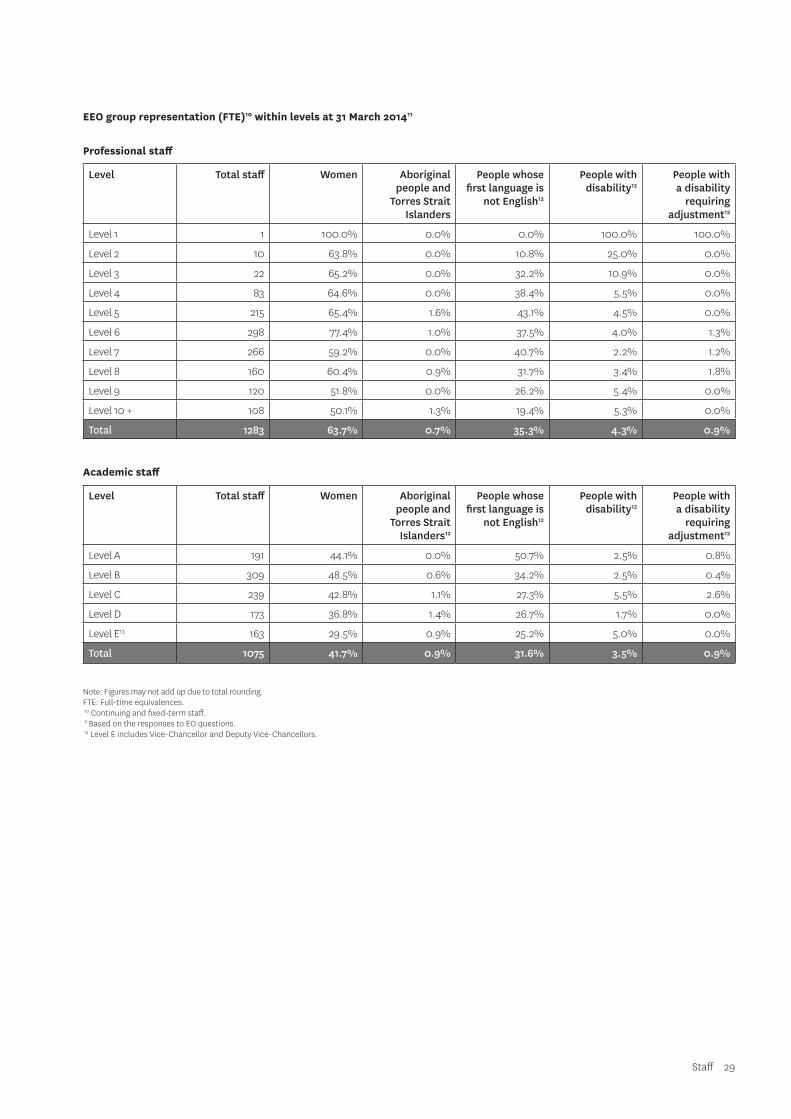
Staff 29
EEO group representation (FTE)10 within levels at 31 March 201411
Professional staff
Level Total staff Women Aboriginal people and
Torres Strait Islanders
People whose first language is
not English12
People with disability12
People with a disability
requiring adjustment12
Level 1 1 100.0% 0.0% 0.0% 100.0% 100.0%
Level 2 10 63.8% 0.0% 10.8% 25.0% 0.0%
Level 3 22 65.2% 0.0% 32.2% 10.9% 0.0%
Level 4 83 64.6% 0.0% 38.4% 5.5% 0.0%
Level 5 215 65.4% 1.6% 43.1% 4.5% 0.0%
Level 6 298 77.4% 1.0% 37.5% 4.0% 1.3%
Level 7 266 59.2% 0.0% 40.7% 2.2% 1.2%
Level 8 160 60.4% 0.9% 31.7% 3.4% 1.8%
Level 9 120 51.8% 0.0% 26.2% 5.4% 0.0%
Level 10 + 108 50.1% 1.3% 19.4% 5.3% 0.0%
Total 1283 63.7% 0.7% 35.3% 4.3% 0.9%
Academic staff
Level Total staff Women Aboriginal people and
Torres Strait Islanders12
People whose first language is
not English12
People with disability12
People with a disability
requiring adjustment12
Level A 191 44.1% 0.0% 50.7% 2.5% 0.8%
Level B 309 48.5% 0.6% 34.2% 2.5% 0.4%
Level C 239 42.8% 1.1% 27.3% 5.5% 2.6%
Level D 173 36.8% 1.4% 26.7% 1.7% 0.0%
Level E13 163 29.5% 0.9% 25.2% 5.0% 0.0%
Total 1075 41.7% 0.9% 31.6% 3.5% 0.9%
Note: Figures may not add up due to total rounding. FTE: Full-time equivalences. 10 Continuing and fixed-term staff. 11 Based on the responses to EO questions. 12 Level E includes Vice-Chancellor and Deputy Vice-Chancellors.
30 Macquarie University Annual Report 2014
Governance and managementReport by Members of Council The members of the Council present their report on the consolidated entity consisting of Macquarie University and the entities it controlled at the end of, or during, the year ended 31 December 2014.
MEMBERS The following persons were members of the Macquarie University Council during 2014:
The Hon Michael Egan AO – Chancellor Elizabeth Crouch – Deputy Chancellor Professor S Bruce Dowton – Vice-Chancellor and President Professor Dominic Verity – Chair of Academic Senate Brendan Crotty Chum Darvall Professor Julie Fitness The Hon Patricia Forsythe Professor Richard Howitt Gregory Jones Professor Deborah Kane The Hon Sandra Nori Gemma Quinn Steven Rubic (resigned 28 February 2014) Dr Kerry Schott Kathy Vozella Gregory Ward John Wigglesworth
MEETINGS OF MEMBERS
Information about the numbers of meetings of the members of Macquarie University’s Council in 2014, and the number of meetings attended by each member, appears on page 34.
PRINCIPAL ACTIVITIES During the year, the principal continuing activities of the consolidated entity consisted of:
(a) the provision of facilities for education and research of university standard
(b) the encouragement of the dissemination, advancement, development and application of knowledge informed by free enquiry
(c) the provision of courses of study or instruction across a range of fields, and the carrying out of research, to meet the needs of the community
(d) the participation in public discourse
(e) the conferring of degrees, including those of bachelor, master and doctor, and the awarding of diplomas, certificates and other awards
(f ) the provision of teaching and learning that engage with advanced knowledge and enquiry
(g) the development of governance, procedural rules, admission policies, financial arrangements and quality assurance processes that are underpinned by the values and goals referred to in the functions set out in the Macquarie University Act 1989, and
(h) that are sufficient to ensure the integrity of the University’s academic programs.
There were no significant changes in the nature of the University’s activities during the year.
REVIEW OF OPERATIONS
The activities of the Macquarie University Council during 2014 included:
• receipt of the Vice-Chancellor’s report at each meeting of Council, covering major strategic items, external developments and general issues of note, including selected projects and goals related to the objectives contained in Macquarie University’s strategic plan
• receipt of regular reports on health and safety across campus
• approval of key compliance reports including the Macquarie University 2013 Annual Report
• approval of the 2015 Consolidated Budget and 2015 Capital Management Plan
• approval of the conferral of various honorary awards
• approval of a new Council charter and updated terms of reference for Council committees
• approval of the Campus Masterplan
• approval of the establishment of the Faculty of Medicine and Health Sciences
• approval of an updated Intellectual Property policy
• approval of a new policy framework
• receipt of presentations from faculties on faculty performance and plans
• receipt of seminars on learning and teaching, the campus masterplan and presentations on other key areas of the business.
MATTERS SUBSEQUENT TO THE END OF THE FINANCIAL YEAR
There have been no subsequent events of significance announced by the University since the end of 2014.
LIKELY DEVELOPMENTS AND EXPECTED RESULTS OF OPERATIONS
There have been no developments of significance since the end of 2014.
ENVIRONMENTAL REGULATION
The significant environmental legislation and regulations to which the University is subject to are as follows:
Legislation
• Contaminated Land Management Act 1997 (NSW)
• Energy Efficiency Opportunities Act 2006 (Cth) (until 29 June)
• Environmental Planning and Assessment Act 1979 (NSW)
• Environment Protection and Biodiversity Conservation Act 1999 (Cth)
• Local Government Act 1993 (NSW)
• National Greenhouse and Energy Reporting Act 2007 (Cth)
• Native Vegetation Act 2003 (NSW)
• Pesticides Act 1999 (NSW)
• Protection of the Environment Operations Act 1997 (NSW)
• Threatened Species Conservation Act 1995 (NSW)
Governance and management 31
Regulations• Energy Efficiency Opportunities Regulations 2006 (Cth)
(until 14 June)
• National Greenhouse and Energy Reporting Regulations 2008 (Cth)
• National Greenhouse and Energy Reporting (Measurement) Determination 2008 (Cth)
• Native Vegetation Regulation 2013 (NSW)
• Protection of the Environment Operations (Clean Air) Regulation 2010 (NSW)
• Protection of the Environment Operations (Waste) Regulation 2014 (NSW)
INSURANCE OF OFFICERS The University holds two insurance policies covering Members of Council and officers of the University. They are:
• Professional Liability Protection Insurance, which covers professional, consulting, research and teaching activities (and any activities associated therewith), undertaken by the University or its affiliates, including the provision of and/or the facilitation of all recognised student activities.
• Directors and Officers Liability Insurance, which covers the University and individuals deemed to be insured Directors or Officers for their legal liability arising out of their conduct as officers of the University. Deemed insured persons include any Chancellor; Deputy Chancellor; Vice-Chancellor; Deputy Vice-Chancellor; Registrar; Bursar; Member of Council; Member of Senate; Member of a Regulatory Board or Committee who is responsible for the management, or monitoring the performance of management of the University; University Secretary and any employee who is concerned in, or takes part in, the management of the University.
This report is made in accordance with a resolution of the members of the Macquarie University Council.
Michael Rueben Egan Chancellor
9 April 2014
PHOT
O: P
AUL
WRI
GH
T
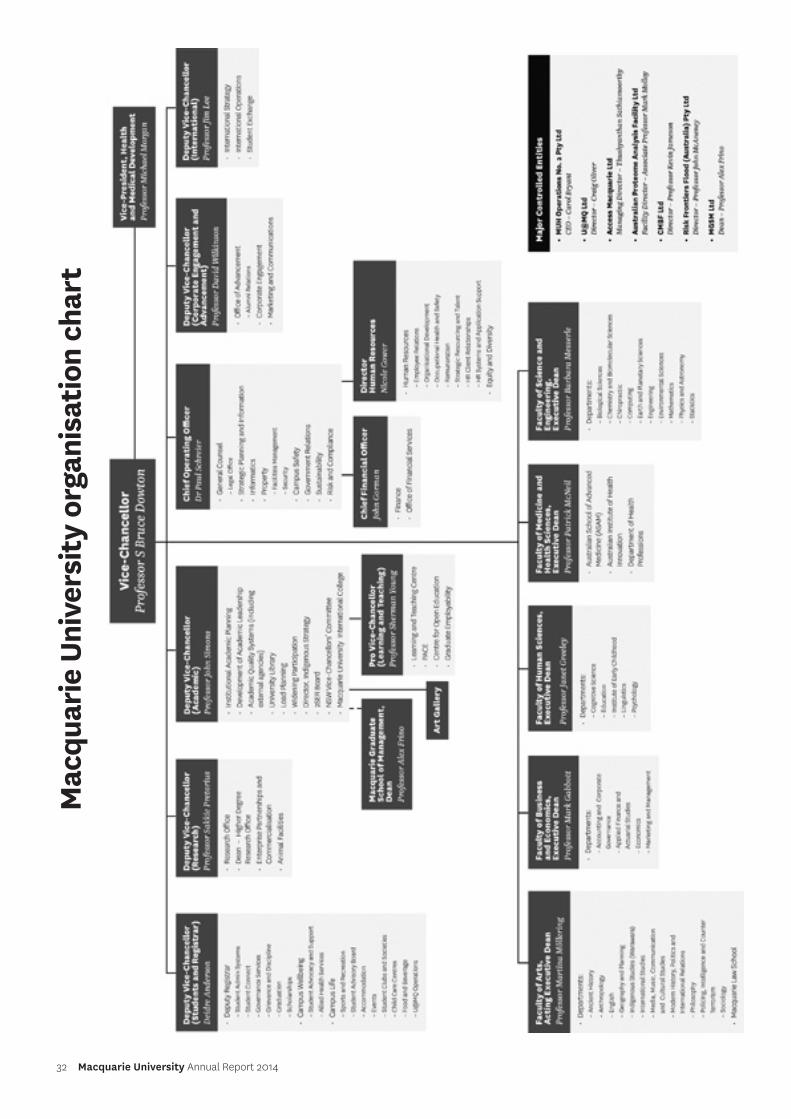
32 Macquarie University Annual Report 2014
Mac
quar
ie U
nive
rsit
y or
gani
sati
on c
hart
Governance and management 33
Principal office bearers Visitor Her Excellency Professor The Honourable Dame Marie Bashir AC CVO Governor of New South Wales (until 1 October)
His Excellency General The Honourable David Hurley AC DSC (Retd) Governor of New South Wales (from 2 October)
Chancellor The Hon Michael Rueben Egan AO, BA Syd, FAICD
Deputy Chancellor Elizabeth Crouch, BEc Macq, FAICD
Vice-Chancellor and President Professor S Bruce Dowton, MB Syd, BS Syd, MD Harv, FACMG FRACP
Deputy Vice-Chancellor (Provost) Professor Judyth Sachs, BA Qld, PhD Qld, MA WMich (until 4 March)
Deputy Vice-Chancellor (Students and Registrar) Deidre Anderson, BA VU, MA VU, PGCert Athlete Counselling AIS, PGDipSocSc Latrobe
Deputy Vice-Chancellor (Corporate Engagement and Advancement) Professor David Wilkinson, BSc Manc, MBChB Manc, MSc Col, MD Natal, PhD UniSA, DSc UniSA, FRCP (London), FAFPHM, FRACGP, FACRRM
Deputy Vice-Chancellor (Research) Professor Sakkie Pretorius, BSc Free State, BSc (Hons) Free State, MSc Free State, PhD Free State
Deputy Vice-Chancellor (International) Professor Jim Lee, BS QU, MA Prin, PhD Prin Deputy Vice-Chancellor (Academic) Professor John Simons, BA Abw, PhD Exon (from 25 August)
Chief Operating Officer Dr Paul Schreier, MA Cantab, MEng Cantab, PhD Cantab
Chief Financial Officer John Gorman, BBus Kuring-gai, MBA Rochester, FCPA, FTIA
Director, Human Resources Timothy Sprague, BSc Syd, DipEd Syd, MCom UNSW (until 22 July)
Nicole Gower, BA/LLB (Hons) UTS (from 20 October)
Executive Dean, Faculty of Arts Professor John Simons, BA Abw, PhD Exon (until 24 August)
Professor Martina Möllering, BA Essen, MA Appl Ling Macq, PhD Macq (from 25 August)
Executive Dean, Faculty of Business and Economics Professor Mark Gabbott, BA Essex, MSc ICL, DTS UK, PhD Stir
Executive Dean, Faculty of Human Sciences Professor Janet Greeley, BSc Nfld, MA Tor, PhD Tor
Executive Dean, Faculty of Science Professor Clive Baldock, PhD KCL, MSc LHMC, MTEM, BSc (Hons) Sus, FACPSEM FAIP FIPESM FInstP (until 31 January)
Acting Executive Dean, Faculty of Science Professor Peter Nelson, BSc (Hons) Syd, BA Macq, PhD Syd (from 20 January)
Executive Dean, Faculty of Medicine and Health Sciences Professor Patrick McNeil, MB BS (Hons) UTas PhD UNSW FRACP (from 3 November)
Macquarie University Council (Membership as at 31 December 2014)
Macquarie University Council is the governing authority of the University, established under Part 3 of the Macquarie University Act 1989. Under Part 4 of the Act, the Council acts for and on behalf of the University in the exercise of the University’s functions, has the control and management of the affairs and concerns of the University, and may act in all matters concerning the University in such manner as appears to the Council to be best calculated to promote the objectives and interests of the University.
MEMBERS OF COUNCIL Chancellor Elected pursuant to section 8h of the Act
The Hon Michael Rueben Egan AO, BA Syd, FAICD Current term to 28 February 2017
Vice-Chancellor Appointed pursuant to section 8h of the Act
Professor S Bruce Dowton, MB Syd, BS Syd, MD Harv, FACMG FRACP Appointed 3 September 2012, ex officio
Chair of the Academic Senate Appointed pursuant to section 9(1)(a)(iii) of the Act
Professor Dominic Verity, BA Cantab, PhD Cantab
Appointed by the Minister for Education and Training Pursuant to section 8g of the Act
The Hon Patricia Forsythe, BA DipEd Newcastle (NSW) Current term to 31 December 2016
Dr Kerry Schott, BA(Hons) UNE, MA UBC, D Phil Oxford Current term to 31 December 2017
Appointed by Council Pursuant to section 8f of the Act
Elizabeth Anne Crouch, BEc Macq, FAICD Current term to 31 December 2016
Gregory Mackenzie Jones, BA Macq, MA Macq Current term to 31 December 2016
The Hon Sandra Christine Nori, BEc Syd Current term to 31 December 2016
Gregory Ward, BEc Macq, MEc Macq, FCA, F Fin Current term to 31 December 2017
John Wigglesworth, BEc Macq, CA Current term to 31 December 2016
Elected by and from the academic staff Pursuant to section 8d of the Act
Professor Deb Kane, BSc(Hons) Otago, PhD St Andrews Current term to 31 December 2015
Professor Julie Fitness, BA, MA (Hons), PhD Cant, MAPS, FAPS Current term to 31 December 2015
Professor Richie Howitt, BA (Hons), Dip Ed Ncle; PhD UNSW; PGCert Ed Lship (2004) Macq Current term to 31 December 2015
Elected by and from the non-academic staff Pursuant to section 8d of the Act
Kathy Vozella, BComms Canberra Current term to 31 December 2014
Governance and management continued
34 Macquarie University Annual Report 2014
Elected by and from the students of the University Pursuant to section 8d of the Act
Gemma Quinn Current term to 31 May 2015
Appointed by Council Pursuant to section 8e of the Act
Brendan Crotty LS, DQIT (T&CP), Dip BusAdmin Macq, FAPI FAICD FRICS Current term to 31 August 2017
Chum Darvall BA Macq, F Fin, FAICD Current term to 31 December 2016
Steven Rubic, BHealthAdmin NSW, MBA MGSM, FAICD Resigned 28 February 2014
Members’ attendance at meetings
Council A B
The Hon Michael Egan 6 6
Elizabeth Crouch 5 6
Professor S Bruce Dowton 6 6
Professor Dominic Verity 5 6
Brendan Crotty 4 6
Chum Darvall 5 6
Professor Julie Fitness 6 6
The Hon Patricia Forsythe 5 6
Professor Richie Howitt 5 6
Greg Jones 5 6
Professor Deb Kane 6 6
The Hon Sandra Nori 4 6
Gemma Quinn 6 6
Steven Rubic 0 1
Dr Kerry Schott 3 6
Kathy Vozella 6 6
Greg Ward 2 6
John Wigglesworth 5 6
A Number of meetings attended B Number of meetings eligible to attend
Executive performance summaryVice-Chancellor and President Professor S Bruce Dowton
$864,959
Led the first phase of implementation of the long-range strategic framework for the University. Established a new Faculty of Medicine and Health Sciences, and recruited the Executive Dean. Restructured the Executive, including changing reporting lines for Executive Deans and the Director of Human Resources. Modernised University-wide governance structures. Led the University’s 50th anniversary celebrations.
Deputy Vice-Chancellor (Research) Isak Pretorius
$491,198
Developed a Strategic Research Framework setting the vision for Macquarie’s research for the next 10 years. Achieved record higher degree research completions and successfully introduced the second year of Macquarie’s unique Master of Research program. Produced a publication showcasing the impact of Macquarie’s research from the past 50 years. Oversaw relocation of the prestigious Australian Institute of Health Innovation to Macquarie University.
Deputy Vice-Chancellor (Provost) Professor Judyth Sachs
$101,820 (part year)
Was in the role until March and on study leave during the entire reporting period. Increased the scope and effectiveness of the PACE program. Continued oversight of University-wide curriculum, learning and teaching and academic standards.
Executive Dean, Faculty of Arts and Acting Joint Provost Deputy Vice-Chancellor (Academic) Professor John Simons
$465,555
Was in the role of Executive Dean, Arts, and Acting Joint Provost until August. Commenced as Deputy Vice-Chancellor (Academic) from August. Increased student numbers, hit targets for on-time completions of higher degree research students and initiated new partnerships with Nepal, Sri Lanka and Bangladesh. Developed a new archaeology degree and continued to improve success rates for external grant applications. Co-edited two books as part of the University’s Jubilee celebrations. Led a working party on Macquarie’s online overseas offering, worked on development of domestic pathways for the new Macquarie University International College, recruited a new Director of Indigenous Strategy and began the process of developing a University Reconciliation Action Plan. The University Art Gallery won a national award and was shortlisted for another.
Governance and management continued
Governance and management 35
Deputy Vice-Chancellor (Students and Registrar) Deidre Anderson
$437,191
Opened the new Student Connect facility offering student support services and a unique informal learning and teaching space. Significantly improved para-academic student experience scales within the international student barometer and other net promoter scores. Developed an integrated student retention plan. Developed performance dashboards for all offices. Developed and implemented student code of conduct, student disciplinary rules, and student complaints handling procedure. Implemented a number of key recommendations from the graduation review. Completed back-office process improvements across a number of University offices. Reviewed the student advisory board, leading to a number of key recommendations. Successful accreditation of medical centre and child care centres.
Chief Operating Officer Dr Paul Schreier
$486,493
Led improvements to support processes and services and began the implementation of the Lean methodology, enlisting the expertise of the University of St Andrews. Led strategic planning and strengthened the links between strategy and resources. Recruited a new Chief Information Officer and a new Director of Human Resources, and implemented action to improve the client service focus of support services in finance, human resources, legal and information technology services. Continued to strengthen the University’s focus on effective risk management.
Deputy Vice-Chancellor (International) Professor Jim Lee
$432,789
Completed a review of international activities across the University. Developed and implemented a major restructure of the international office (Macquarie International) including a new senior management team. Initiated a University-wide approach to internationalisation through the establishment of the International Advisory Group. Developed models and infrastructure to launch the Macquarie University International College. Hosted Sanya Key Partner Conference in China. Secured more than $300,000 in government funding for Macquarie University students to engage in the Indo-Pacific region under the New Colombo Plan Mobility Program.
Deputy Vice-Chancellor (Corporate Engagement and Advancement) Professor David Wilkinson
$491,505
Oversaw the creation of a new brand, and Jubilee year activities. Successfully scoped and tendered for a new University website. Commissioned and completed a readiness study for a comprehensive fundraising campaign, with a feasibility study underway. Led a restructure of the Office of Advancement. Increased philanthropic income from fundraising by more than 50 per cent to over $4 million. Increased alumni engagement by 7 per cent through improved communications and a series of Global Alumni Impact events held internationally. Expanded corporate engagement substantially with 10 new relationship agreements signed, revenue generation through workshops in Sydney and Singapore, and agreements for PACE placements and trainee programs.
Chief Financial Officer John Gorman
$486,956
Improved reporting and budget processes and timelines. Sponsored a project for migration of the planning module from a third-party provider to an in-house application.
Director, Human Resources Tim Sprague
$360,637 (part year)
Was in the role until July. Resolved academic staff bargaining with a new enterprise agreement for three years. Introduced data-driven decision making through the provision of quarterly reports to faculties and departments. Automated HR processes including the online provision of employee files and professional staff timesheets. Simplification of the Performance Development and Review system.
Director, Human Resources Nicole Gower
$70,077 (part year)
Commenced in the role in October. Initiated process improvements in HR service delivery as well as early development of human capital initiatives across the University.
Executive Dean, Faculty of Business and Economics Professor Mark Gabbott
$473,464
Improved faculty research outcomes, particularly in the four research centres. Developed and launched four new undergraduate degrees, and appointed four new professors, as well as contributing to the University’s international activities. Completed projects on pricing, academic workload review, and leadership restructure, as well as overseeing a number of program external reviews. Continued to build the faculty’s external engagement activity through media commentary and social media.
Executive Dean, Faculty of Human Sciences and Acting Joint Provost Professor Janet Greeley
$441,973
Effectively and efficiently managed the Faculty of Human Sciences and delivered major strategic initiatives including the full accreditation of the Doctor of Physiotherapy, completion of the Simulation Hub research facilities, establishing three new degrees, improving research performance and significantly increasing higher degree research student completions and commencements. Two departments within the faculty were listed in the QS 50 Top Universities Rankings.
Executive Dean, Faculty of Medicine and Health Sciences Professor Patrick McNeil
$70,135 (part year)
Commenced the role in November. Began the process of creating governance, leadership and academic departments within the new faculty. Commenced action planning for new undergraduate clinical science programs.
36 Macquarie University Annual Report 2014
Executive Dean, Faculty of Science Professor Clive Baldock
$41,419 (part year)
Was in the role until January. Initiated change processes in the departments of Mathematics, Statistics, and Environment and Geography.
Acting Executive Dean, Faculty of Science Professor Peter Nelson
$320,591 (part year)
Was in the role from January. Effectively managed the Faculty of Science, returning a budget surplus. Delivered on major strategic initiatives including substantial growth in Engineering; new masters programs in IT and Engineering; and building projects to enhance teaching and research facilities. Oversaw the recruitment and appointment of three new heads of department, and a number of high-profile researchers. Established a successful case for the re-naming of the faculty to the Faculty of Science and Engineering.
Acting Executive Dean, Faculty of Arts Professor Martina Möllering
$116,426 (part year)
Acted in the role from August. Exceeded targets for on-time completion of higher degree research students. Continued to improve intake of international cotutelle PhD students. Facilitated extended international research partner network and access to international research funding schemes.
Note: Remuneration data provided is total remuneration package, inclusive of superannuation.
PHOT
O: C
ORE
Y BU
TLER
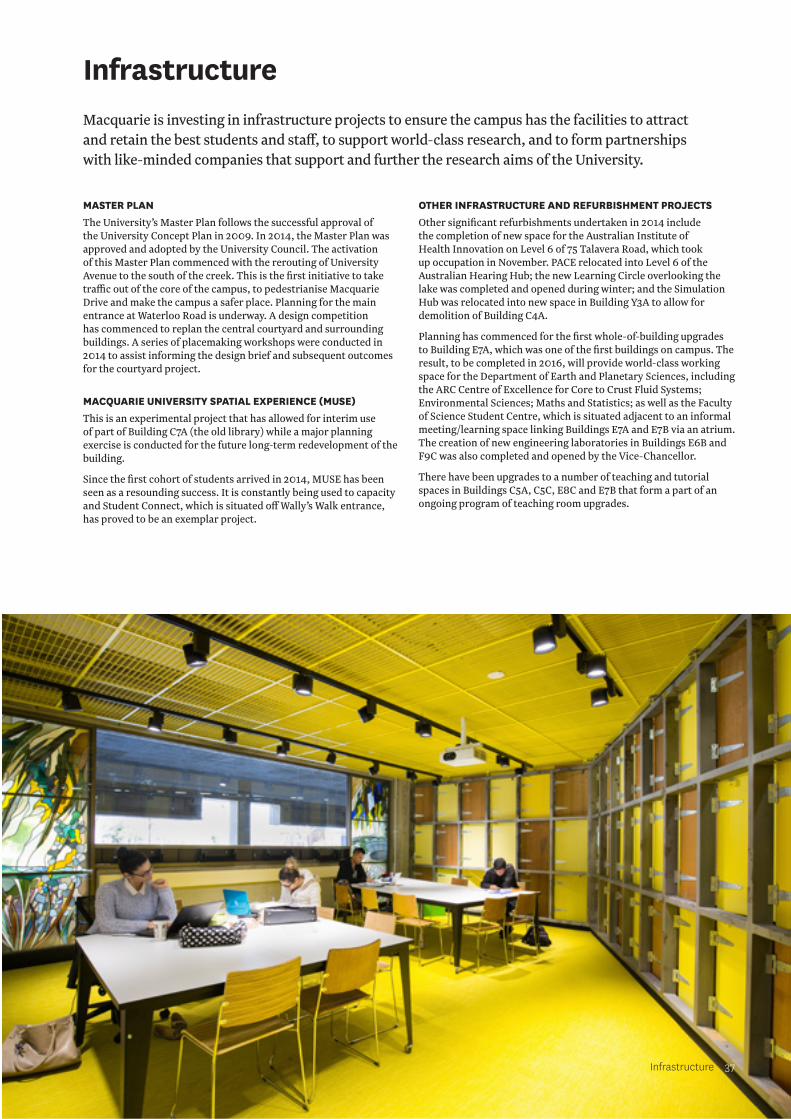
Infrastructure 37
MASTER PLAN The University’s Master Plan follows the successful approval of the University Concept Plan in 2009. In 2014, the Master Plan was approved and adopted by the University Council. The activation of this Master Plan commenced with the rerouting of University Avenue to the south of the creek. This is the first initiative to take traffic out of the core of the campus, to pedestrianise Macquarie Drive and make the campus a safer place. Planning for the main entrance at Waterloo Road is underway. A design competition has commenced to replan the central courtyard and surrounding buildings. A series of placemaking workshops were conducted in 2014 to assist informing the design brief and subsequent outcomes for the courtyard project.
MACQUARIE UNIVERSITY SPATIAL EXPERIENCE (MUSE) This is an experimental project that has allowed for interim use of part of Building C7A (the old library) while a major planning exercise is conducted for the future long-term redevelopment of the building.
Since the first cohort of students arrived in 2014, MUSE has been seen as a resounding success. It is constantly being used to capacity and Student Connect, which is situated off Wally’s Walk entrance, has proved to be an exemplar project.
OTHER INFRASTRUCTURE AND REFURBISHMENT PROJECTS Other significant refurbishments undertaken in 2014 include the completion of new space for the Australian Institute of Health Innovation on Level 6 of 75 Talavera Road, which took up occupation in November. PACE relocated into Level 6 of the Australian Hearing Hub; the new Learning Circle overlooking the lake was completed and opened during winter; and the Simulation Hub was relocated into new space in Building Y3A to allow for demolition of Building C4A.
Planning has commenced for the first whole-of-building upgrades to Building E7A, which was one of the first buildings on campus. The result, to be completed in 2016, will provide world-class working space for the Department of Earth and Planetary Sciences, including the ARC Centre of Excellence for Core to Crust Fluid Systems; Environmental Sciences; Maths and Statistics; as well as the Faculty of Science Student Centre, which is situated adjacent to an informal meeting/learning space linking Buildings E7A and E7B via an atrium. The creation of new engineering laboratories in Buildings E6B and F9C was also completed and opened by the Vice-Chancellor.
There have been upgrades to a number of teaching and tutorial spaces in Buildings C5A, C5C, E8C and E7B that form a part of an ongoing program of teaching room upgrades.
Infrastructure Macquarie is investing in infrastructure projects to ensure the campus has the facilities to attract and retain the best students and staff, to support world-class research, and to form partnerships with like-minded companies that support and further the research aims of the University.
38 Macquarie University Annual Report 2014
Freedom of information Macquarie University actively makes information available on its website and through media releases, and seeks at all times to provide information in a manner that is consistent with the Government Information (Public Access) Act 2009 (GIPA Act).
Information held by the University is available by either searching the University’s website or by contacting the University. Macquarie then assesses the request and decides whether the information requested is readily available, could be disclosed as part of a proactive release of information, could be disclosed through informal release, or whether a formal access application is required.
The fee for a formal GIPA Act application in 2014 was $30.
In 2014, the University was involved in proceedings at the New South Wales Civil and Administrative Tribunal (NCAT) concerning a 2012 application. The applicant commenced these proceedings in 2013 and the matter was determined by the Administrative and Equal Opportunity Division of NCAT on 7 June 2014 (NCAT replaced the Administrative Decisions Tribunal (ADT) on 1 January 2014). Under review, the University’s decision was supported. It was found overall that public interest considerations against disclosure, on balance, outweighed the public interest in disclosure.
One formal application from 2013 was modified by the applicant after a period of negotiation with the University and was determined on 15 January 2014.
During the period 1 January 2014 to 31 December 2014, Macquarie University received six formal access applications for information. In five applications, access to information was granted in full. One formal application for third party consultation under the GIPA Act was received from the NSW Environment Protection Authority (EPA).
Five applications were determined within statutory timeframes, and one was modified by the applicant after a period of negotiation with the University.
An amendment to the Government Information (Public Access) Regulation was gazetted on 12 December 2014. The University is obliged to report on GIPA applications received that are then transferred to another agency, either at the University’s or the applicant’s initiation. During the period 1 January 2014 to 31 December 2014, no GIPA applications received by the University were subject to transfer to another agency.
Assistance for any matter concerning the GIPA Act is available from:
The Right to Information Officer Building C5C, Room 371, Macquarie University NSW 2109 T: +61 2 9850 1561 E: [email protected]
The statistical reports that follow correspond to Schedule 2 of the Government Information (Public Access) Amendment Regulation 2010.
Operations
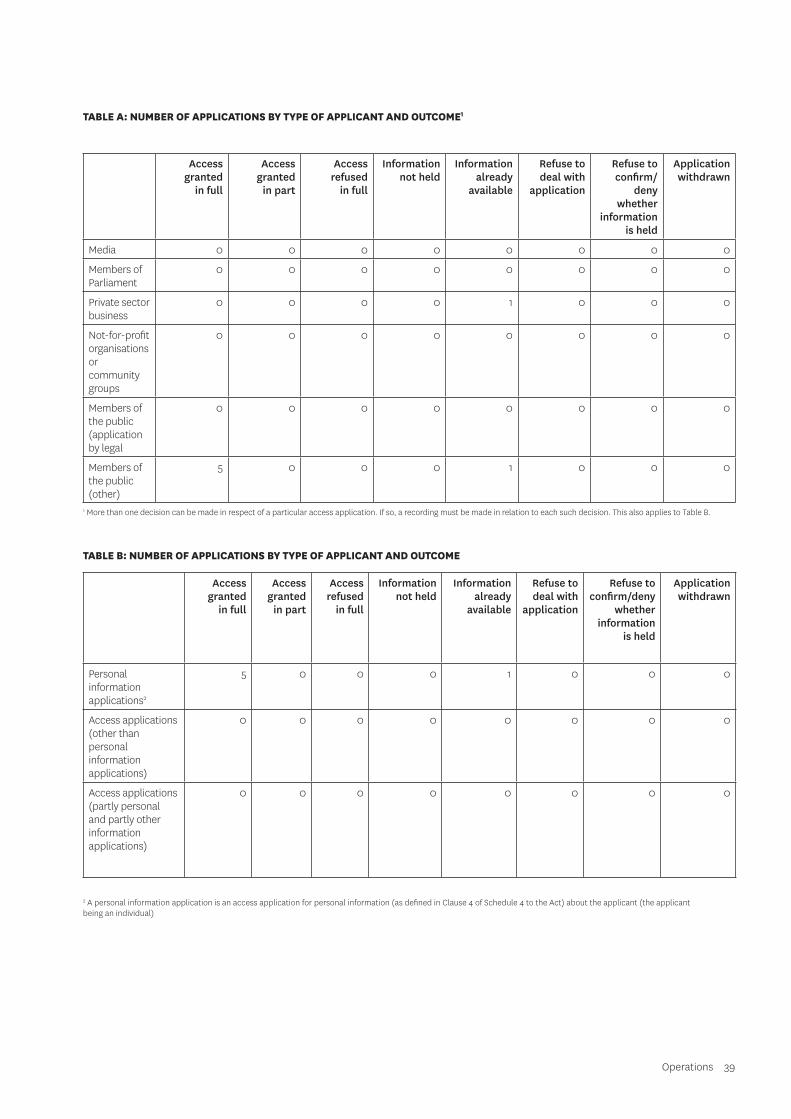
Operations 39
TABLE A: NUMBER OF APPLICATIONS BY TYPE OF APPLICANT AND OUTCOME1
Access granted
in full
Access granted
in part
Access refused
in full
Information not held
Information already
available
Refuse to deal with
application
Refuse to confirm/
deny whether
information is held
Application withdrawn
Media 0 0 0 0 0 0 0 0
Members of Parliament
0 0 0 0 0 0 0 0
Private sector business
0 0 0 0 1 0 0 0
Not-for-profit organisations or community groups
0 0 0 0 0 0 0 0
Members of the public (application by legal
0 0 0 0 0 0 0 0
Members of the public (other)
5 0 0 0 1 0 0 0
1 More than one decision can be made in respect of a particular access application. If so, a recording must be made in relation to each such decision. This also applies to Table B.
TABLE B: NUMBER OF APPLICATIONS BY TYPE OF APPLICANT AND OUTCOME
Access granted
in full
Access granted
in part
Access refused
in full
Information not held
Information already
available
Refuse to deal with
application
Refuse to confirm/deny
whether information
is held
Application withdrawn
Personal information applications2
5 0 0 0 1 0 0 0
Access applications (other than personal information applications)
0 0 0 0 0 0 0 0
Access applications (partly personal and partly other information applications)
0 0 0 0 0 0 0 0
2 A personal information application is an access application for personal information (as defined in Clause 4 of Schedule 4 to the Act) about the applicant (the applicant being an individual)
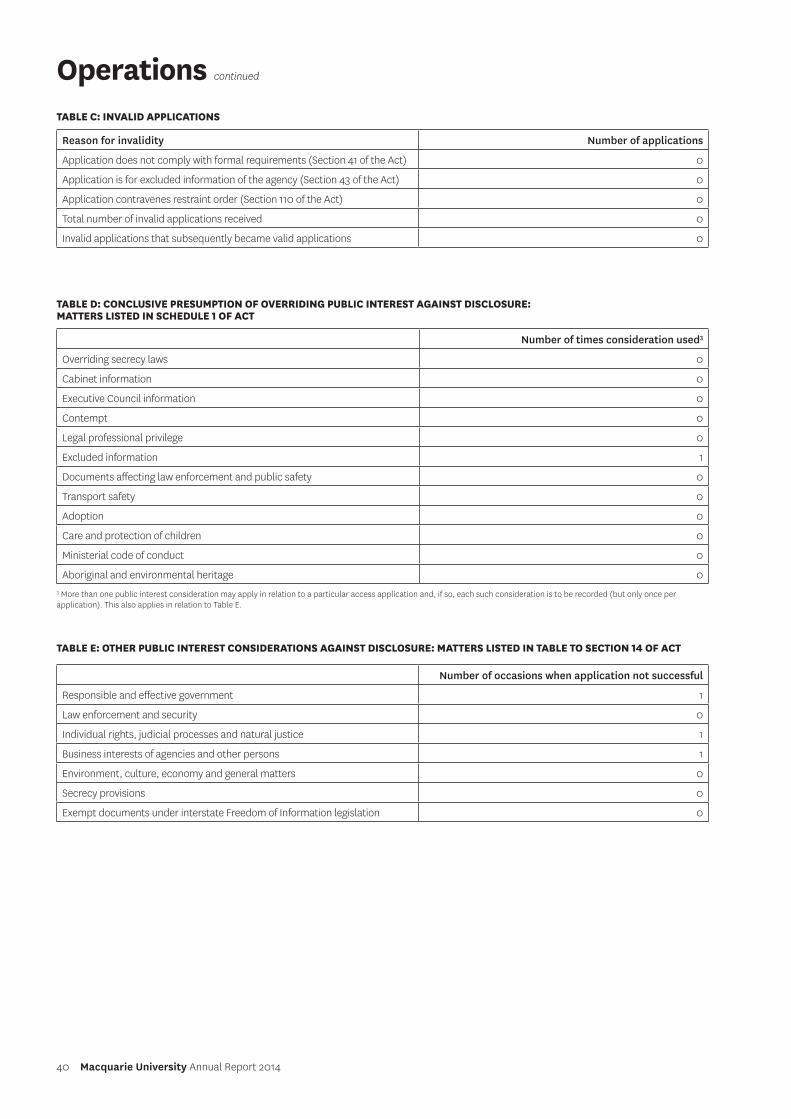
40 Macquarie University Annual Report 2014
TABLE C: INVALID APPLICATIONS
Reason for invalidity Number of applications
Application does not comply with formal requirements (Section 41 of the Act) 0
Application is for excluded information of the agency (Section 43 of the Act) 0
Application contravenes restraint order (Section 110 of the Act) 0
Total number of invalid applications received 0
Invalid applications that subsequently became valid applications 0
TABLE D: CONCLUSIVE PRESUMPTION OF OVERRIDING PUBLIC INTEREST AGAINST DISCLOSURE: MATTERS LISTED IN SCHEDULE 1 OF ACT
Number of times consideration used3
Overriding secrecy laws 0
Cabinet information 0
Executive Council information 0
Contempt 0
Legal professional privilege 0
Excluded information 1
Documents affecting law enforcement and public safety 0
Transport safety 0
Adoption 0
Care and protection of children 0
Ministerial code of conduct 0
Aboriginal and environmental heritage 03 More than one public interest consideration may apply in relation to a particular access application and, if so, each such consideration is to be recorded (but only once per application). This also applies in relation to Table E.
TABLE E: OTHER PUBLIC INTEREST CONSIDERATIONS AGAINST DISCLOSURE: MATTERS LISTED IN TABLE TO SECTION 14 OF ACT
Number of occasions when application not successful
Responsible and effective government 1
Law enforcement and security 0
Individual rights, judicial processes and natural justice 1
Business interests of agencies and other persons 1
Environment, culture, economy and general matters 0
Secrecy provisions 0
Exempt documents under interstate Freedom of Information legislation 0
Operations continued
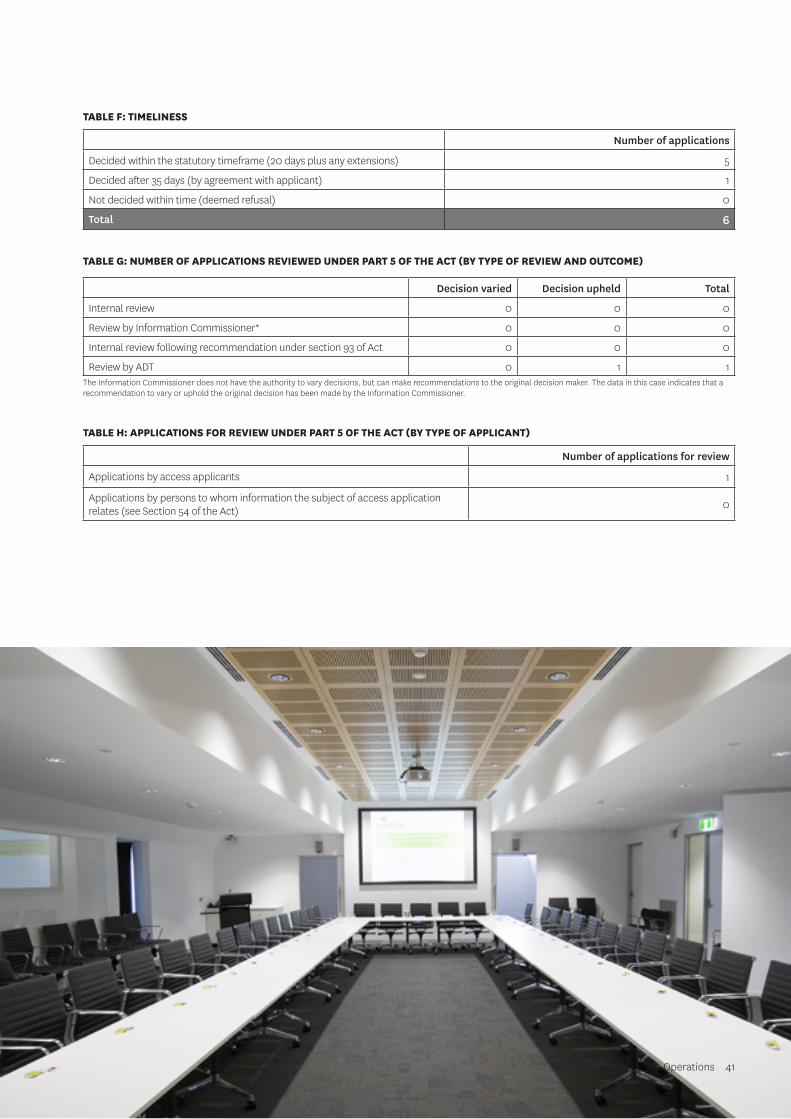
Operations 41
TABLE F: TIMELINESS
Number of applications
Decided within the statutory timeframe (20 days plus any extensions) 5
Decided after 35 days (by agreement with applicant) 1
Not decided within time (deemed refusal) 0
Total 6
TABLE G: NUMBER OF APPLICATIONS REVIEWED UNDER PART 5 OF THE ACT (BY TYPE OF REVIEW AND OUTCOME)
Decision varied Decision upheld Total
Internal review 0 0 0
Review by Information Commissioner* 0 0 0
Internal review following recommendation under section 93 of Act 0 0 0
Review by ADT 0 1 1The Information Commissioner does not have the authority to vary decisions, but can make recommendations to the original decision maker. The data in this case indicates that a recommendation to vary or uphold the original decision has been made by the Information Commissioner.
TABLE H: APPLICATIONS FOR REVIEW UNDER PART 5 OF THE ACT (BY TYPE OF APPLICANT)
Number of applications for review
Applications by access applicants 1
Applications by persons to whom information the subject of access application relates (see Section 54 of the Act) 0
42 Macquarie University Annual Report 2014
Credit card certificationDuring the 2014 financial year, credit card use was in accordance with both the University’s credit card and purchasing policies. These policies are themselves based on the requirements of the New South Wales Treasury.
Credit card use within the University is largely limited to claimable work-related travel expenses and accommodation, and for minor consumable expenses where the use of credit cards is a more efficient process.
Officers are required to sign a declaration that their obligations and duties in relation to the use of credit cards have been explained to them before a credit card is issued. Officers issued with a credit card can review their expenses on a daily basis via the University’s online expense management system. On a monthly basis officers are required to verify and certify that expenses were for official University business. At this time, original tax invoices must be provided. Acquittals are examined and authorised by a more senior officer who has appropriate delegation in accordance with a predetermined line of authority. The University follows a strict process of warning and cancellation of credit cards where they are used outside policy or not acquitted in a timely manner.
InsuranceThe University ensures that a cost-effective insurance program that sufficiently protects the University’s investment in assets and protects against liabilities arising from the conduct of its business activities is in place at all times.
In October 2014, the insurance program was taken to market by our two brokers, which resulted in the University securing the best available terms and conditions tailored to our unique activities.
Strathearn Pty Ltd (Strathearn) provides broking services for all of the University’s medical and allied health insurance risks, including University-run clinics and the Macquarie University Hospital.
All other classes of insurance are brokered through Aon Risk Services Australia Ltd (Aon).
The University Group continues to be a participant in the New South Wales WorkCover, Retro-Paid Loss Premium scheme. 2015 will be the fifth year of its participation. The scheme is driven largely by claims costs and provides incentives for employers with strong performance in workplace health and safety, injury management and return to work. The University has realised savings in premium cost due to our claims history.
Internal audit and risk managementThe University’s Audit and Risk Committee oversees the Risk Management and Internal Audit and functions. However, in 2014, the conduct of risk management activities was facilitated and managed by the newly appointed Head of Risk and Compliance and the conduct of internal audit was completed by Deloitte Touche Tohmatsu (Deloitte) and managed jointly by the Chief Financial Officer and the Head of Risk and Compliance.
RISK MANAGEMENTThe focus of the University’s risk and compliance management activities was to build an integrated, coordinated and tailored approach to understanding and managing risk and compliance. To this end, in February 2014, the Audit and Risk Committee endorsed
the University’s risk and compliance frameworks. The frameworks focus on understanding and analysing the uncertainty in achieving objectives and the requirements of legislation, regulations, standards and internal policies to identify practical mitigation strategies and leverage emerging opportunities. Key risk stakeholders and compliance leads have been identified across the University and its Controlled Entities and actively engaged to build capability.
In June 2014, the Audit and Risk Committee endorsed the enterprise risk profile which was discussed in light of our risk indicator dashboard. Quarterly reviews of the enterprise risk profile are conducted by both the University’s Executive Group and the Audit and Risk Committee.
Due to the University’s significant program of major capital developments, funded by a mix of cash reserves, debt and government contributions, progress and risks related to the delivery of capital works is reflected in the property risk profile but also reported to the Finance and Facilities Committee and included in the enterprise risk profile tabled at the Audit and Risk Committee.
INTERNAL AUDITThe internal audit function is primarily concerned with evaluating the effectiveness of internal controls and draws on the enterprise risk profile to target key controls that support the mitigation of threats.
Throughout 2014, Deloitte adopted and integrated the University’s risk management rating methodology and built greater alignment between the risk and internal audit reporting and planning processes. The alignment was reflected in the choice of audits nominated in the three-year rolling internal audit plan approved by the Audit and Risk Committee.
Audit and assurance activities resulted in identification of areas where there was opportunity for improvement and/or enhancement of existing processes and controls. Following discussion and agreement with management, internal audit reports were submitted to key stakeholders and reported to the Audit and Risk Committee. The closure of audit recommendations was monitored by the Audit and Risk Committee and clarification of any delay provided.
In light of the appointment of the Head of Risk and Compliance and the internal audit contract end date of December 2014, the University conducted a competitive tender for the internal audit role for 2015. The successful candidate for the revised internal audit service is PricewaterhouseCoopers.
Operations continued
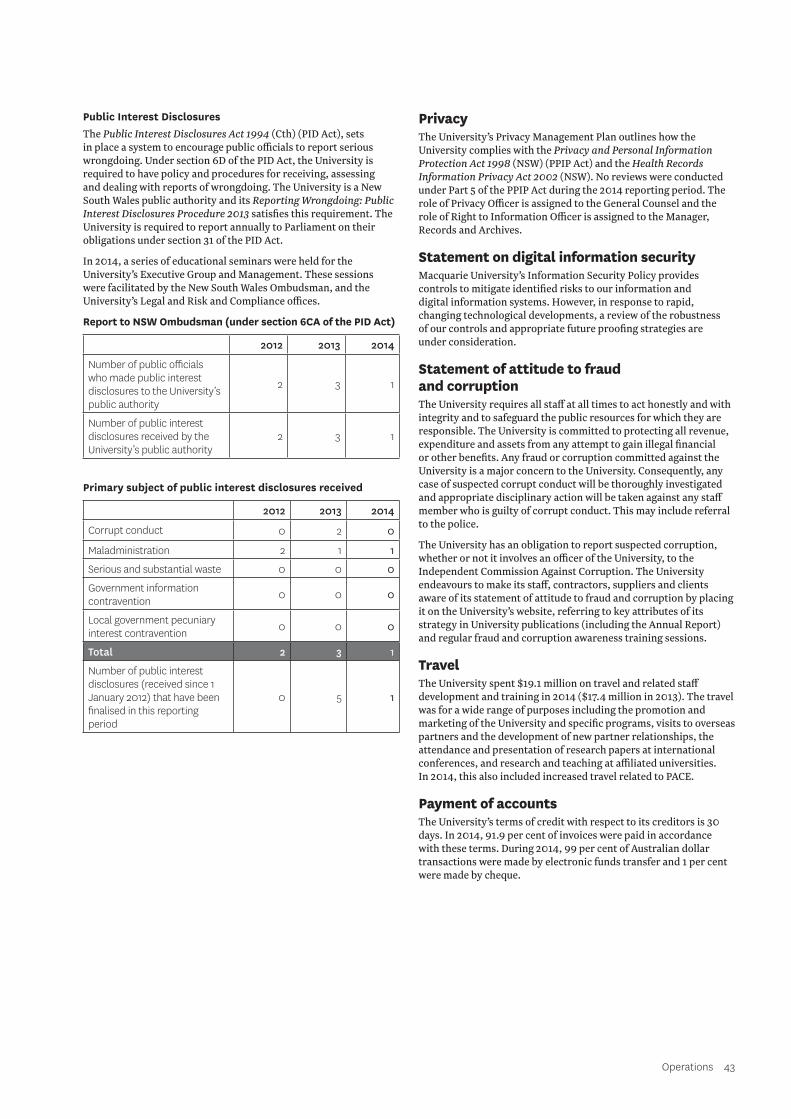
Operations 43
Public Interest DisclosuresThe Public Interest Disclosures Act 1994 (Cth) (PID Act), sets in place a system to encourage public officials to report serious wrongdoing. Under section 6D of the PID Act, the University is required to have policy and procedures for receiving, assessing and dealing with reports of wrongdoing. The University is a New South Wales public authority and its Reporting Wrongdoing: Public Interest Disclosures Procedure 2013 satisfies this requirement. The University is required to report annually to Parliament on their obligations under section 31 of the PID Act.
In 2014, a series of educational seminars were held for the University’s Executive Group and Management. These sessions were facilitated by the New South Wales Ombudsman, and the University’s Legal and Risk and Compliance offices.
Report to NSW Ombudsman (under section 6CA of the PID Act)
2012 2013 2014
Number of public officials who made public interest disclosures to the University’s public authority
2 3 1
Number of public interest disclosures received by the University’s public authority
2 3 1
Primary subject of public interest disclosures received
2012 2013 2014
Corrupt conduct 0 2 0
Maladministration 2 1 1
Serious and substantial waste 0 0 0
Government information contravention 0 0 0
Local government pecuniary interest contravention 0 0 0
Total 2 3 1
Number of public interest disclosures (received since 1 January 2012) that have been finalised in this reporting period
0 5 1
PrivacyThe University’s Privacy Management Plan outlines how the University complies with the Privacy and Personal Information Protection Act 1998 (NSW) (PPIP Act) and the Health Records Information Privacy Act 2002 (NSW). No reviews were conducted under Part 5 of the PPIP Act during the 2014 reporting period. The role of Privacy Officer is assigned to the General Counsel and the role of Right to Information Officer is assigned to the Manager, Records and Archives.
Statement on digital information securityMacquarie University’s Information Security Policy provides controls to mitigate identified risks to our information and digital information systems. However, in response to rapid, changing technological developments, a review of the robustness of our controls and appropriate future proofing strategies are under consideration.
Statement of attitude to fraud and corruptionThe University requires all staff at all times to act honestly and with integrity and to safeguard the public resources for which they are responsible. The University is committed to protecting all revenue, expenditure and assets from any attempt to gain illegal financial or other benefits. Any fraud or corruption committed against the University is a major concern to the University. Consequently, any case of suspected corrupt conduct will be thoroughly investigated and appropriate disciplinary action will be taken against any staff member who is guilty of corrupt conduct. This may include referral to the police.
The University has an obligation to report suspected corruption, whether or not it involves an officer of the University, to the Independent Commission Against Corruption. The University endeavours to make its staff, contractors, suppliers and clients aware of its statement of attitude to fraud and corruption by placing it on the University’s website, referring to key attributes of its strategy in University publications (including the Annual Report) and regular fraud and corruption awareness training sessions.
TravelThe University spent $19.1 million on travel and related staff development and training in 2014 ($17.4 million in 2013). The travel was for a wide range of purposes including the promotion and marketing of the University and specific programs, visits to overseas partners and the development of new partner relationships, the attendance and presentation of research papers at international conferences, and research and teaching at affiliated universities. In 2014, this also included increased travel related to PACE.
Payment of accountsThe University’s terms of credit with respect to its creditors is 30 days. In 2014, 91.9 per cent of invoices were paid in accordance with these terms. During 2014, 99 per cent of Australian dollar transactions were made by electronic funds transfer and 1 per cent were made by cheque.
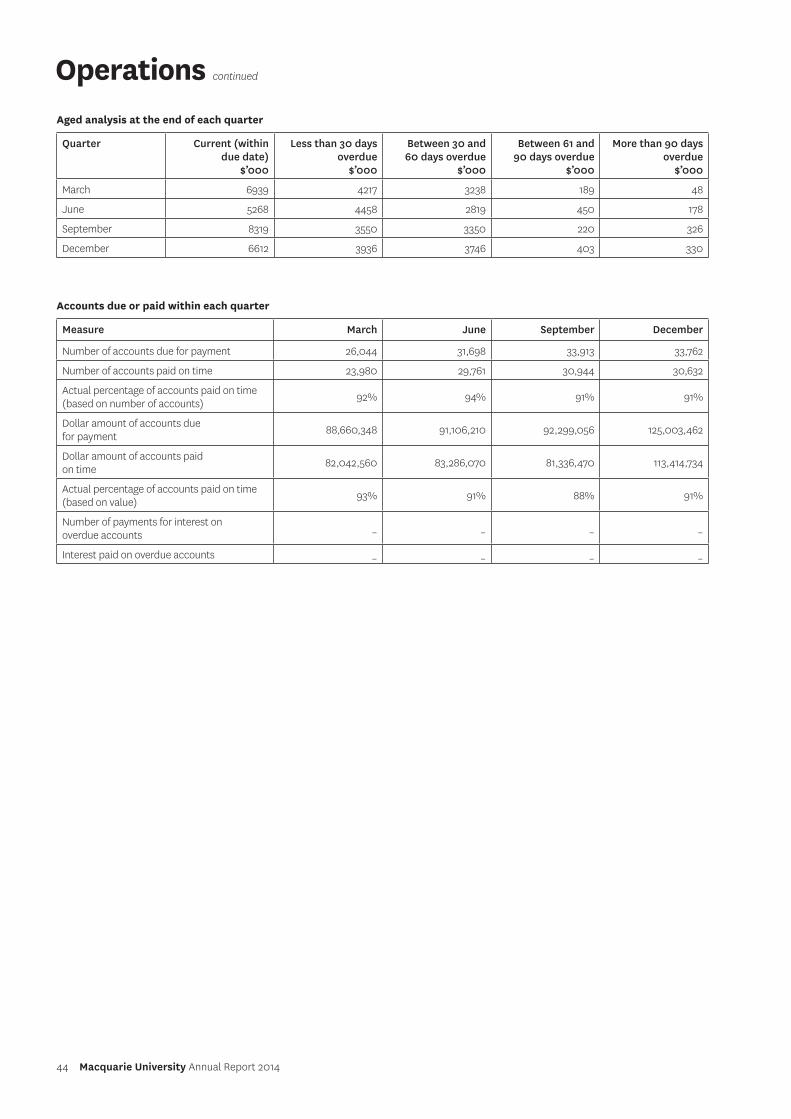
44 Macquarie University Annual Report 2014
Aged analysis at the end of each quarter
Quarter Current (within due date)
$’000
Less than 30 days overdue
$’000
Between 30 and 60 days overdue
$’000
Between 61 and 90 days overdue
$’000
More than 90 days overdue
$’000
March 6939 4217 3238 189 48
June 5268 4458 2819 450 178
September 8319 3550 3350 220 326
December 6612 3936 3746 403 330
Accounts due or paid within each quarter
Measure March June September December
Number of accounts due for payment 26,044 31,698 33,913 33,762
Number of accounts paid on time 23,980 29,761 30,944 30,632
Actual percentage of accounts paid on time (based on number of accounts) 92% 94% 91% 91%
Dollar amount of accounts due for payment 88,660,348 91,106,210 92,299,056 125,003,462
Dollar amount of accounts paid on time 82,042,560 83,286,070 81,336,470 113,414,734
Actual percentage of accounts paid on time (based on value) 93% 91% 88% 91%
Number of payments for interest on overdue accounts _ _ _ _
Interest paid on overdue accounts _ _ _ _
Operations continued
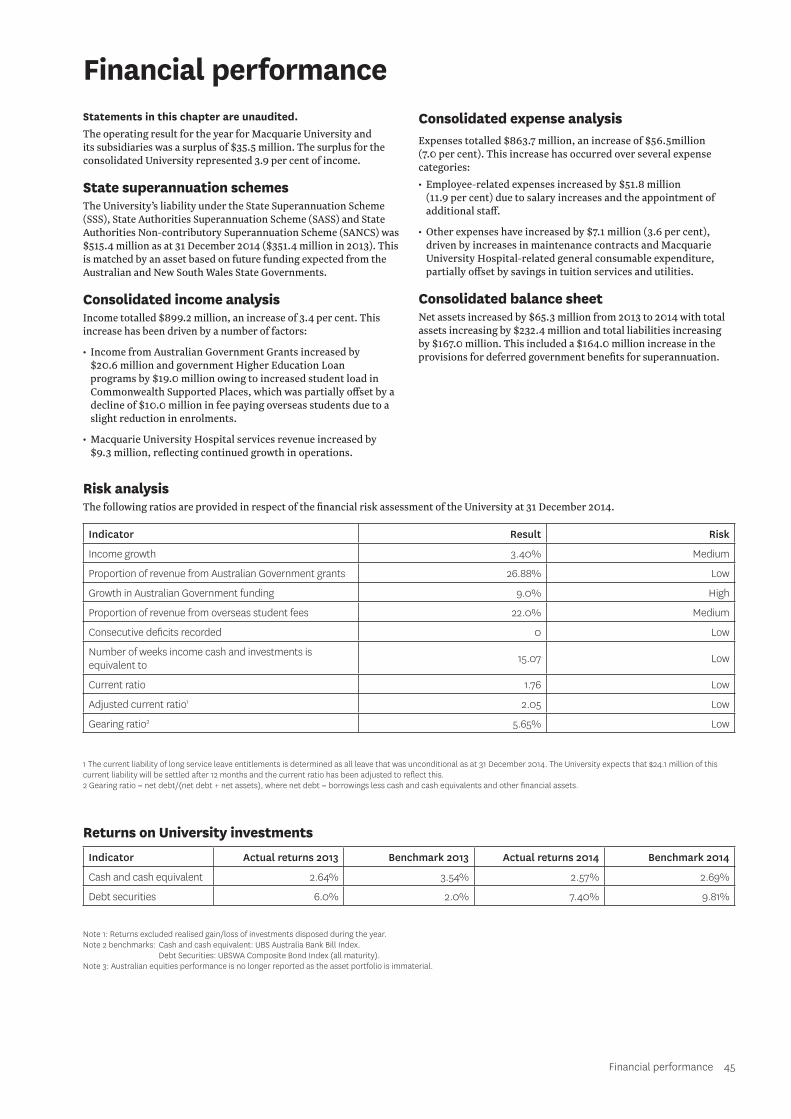
Financial performance 45
Financial performanceStatements in this chapter are unaudited.The operating result for the year for Macquarie University and its subsidiaries was a surplus of $35.5 million. The surplus for the consolidated University represented 3.9 per cent of income.
State superannuation schemesThe University’s liability under the State Superannuation Scheme (SSS), State Authorities Superannuation Scheme (SASS) and State Authorities Non-contributory Superannuation Scheme (SANCS) was $515.4 million as at 31 December 2014 ($351.4 million in 2013). This is matched by an asset based on future funding expected from the Australian and New South Wales State Governments.
Consolidated income analysisIncome totalled $899.2 million, an increase of 3.4 per cent. This increase has been driven by a number of factors:
• Income from Australian Government Grants increased by $20.6 million and government Higher Education Loan programs by $19.0 million owing to increased student load in Commonwealth Supported Places, which was partially offset by a decline of $10.0 million in fee paying overseas students due to a slight reduction in enrolments.
• Macquarie University Hospital services revenue increased by $9.3 million, reflecting continued growth in operations.
Consolidated expense analysisExpenses totalled $863.7 million, an increase of $56.5million (7.0 per cent). This increase has occurred over several expense categories:• Employee-related expenses increased by $51.8 million
(11.9 per cent) due to salary increases and the appointment of additional staff.
• Other expenses have increased by $7.1 million (3.6 per cent), driven by increases in maintenance contracts and Macquarie University Hospital-related general consumable expenditure, partially offset by savings in tuition services and utilities.
Consolidated balance sheetNet assets increased by $65.3 million from 2013 to 2014 with total assets increasing by $232.4 million and total liabilities increasing by $167.0 million. This included a $164.0 million increase in the provisions for deferred government benefits for superannuation.
Risk analysisThe following ratios are provided in respect of the financial risk assessment of the University at 31 December 2014.
Indicator Result Risk
Income growth 3.40% Medium
Proportion of revenue from Australian Government grants 26.88% Low
Growth in Australian Government funding 9.0% High
Proportion of revenue from overseas student fees 22.0% Medium
Consecutive deficits recorded 0 Low
Number of weeks income cash and investments is equivalent to 15.07 Low
Current ratio 1.76 Low
Adjusted current ratio1 2.05 Low
Gearing ratio2 5.65% Low
1 The current liability of long service leave entitlements is determined as all leave that was unconditional as at 31 December 2014. The University expects that $24.1 million of this current liability will be settled after 12 months and the current ratio has been adjusted to reflect this. 2 Gearing ratio = net debt/(net debt + net assets), where net debt = borrowings less cash and cash equivalents and other financial assets.
Returns on University investments
Indicator Actual returns 2013 Benchmark 2013 Actual returns 2014 Benchmark 2014
Cash and cash equivalent 2.64% 3.54% 2.57% 2.69%
Debt securities 6.0% 2.0% 7.40% 9.81%
Note 1: Returns excluded realised gain/loss of investments disposed during the year. Note 2 benchmarks: Cash and cash equivalent: UBS Australia Bank Bill Index. Debt Securities: UBSWA Composite Bond Index (all maturity). Note 3: Australian equities performance is no longer reported as the asset portfolio is immaterial.
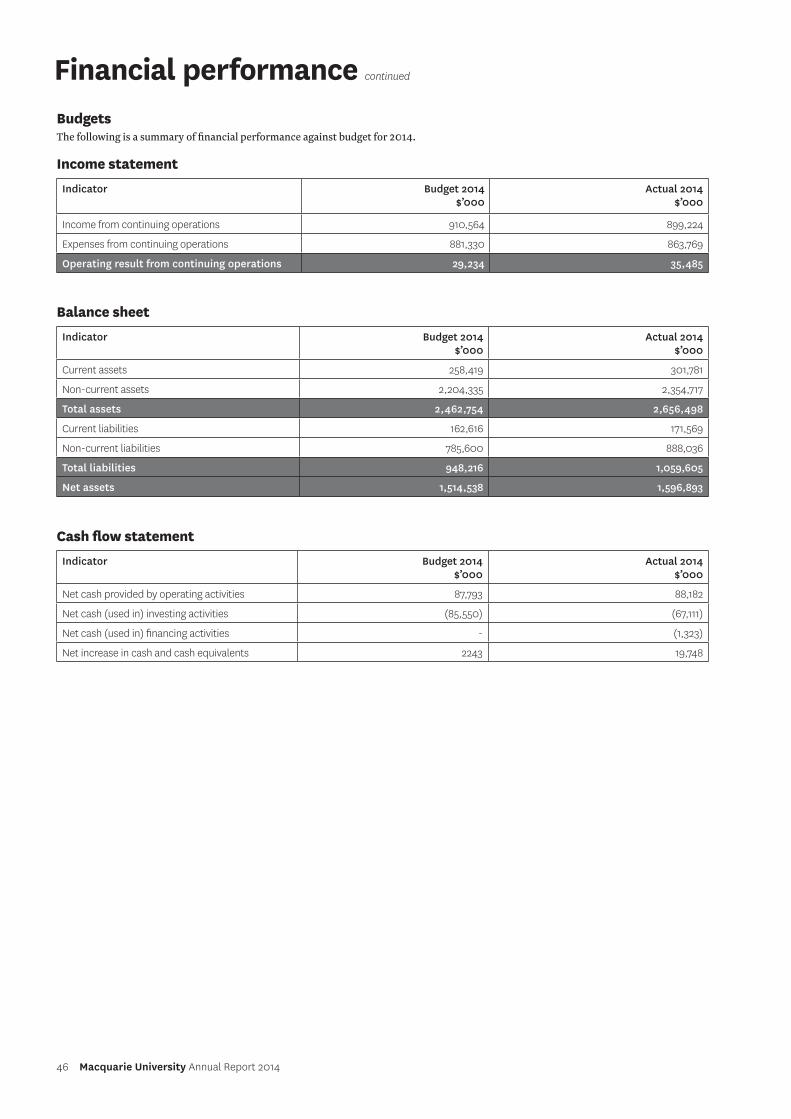
46 Macquarie University Annual Report 2014
BudgetsThe following is a summary of financial performance against budget for 2014.
Income statement
Indicator Budget 2014 $’000
Actual 2014 $’000
Income from continuing operations 910,564 899,224
Expenses from continuing operations 881,330 863,769
Operating result from continuing operations 29,234 35,485
Balance sheet
Indicator Budget 2014 $’000
Actual 2014 $’000
Current assets 258,419 301,781
Non-current assets 2,204,335 2,354,717
Total assets 2,462,754 2,656,498
Current liabilities 162,616 171,569
Non-current liabilities 785,600 888,036
Total liabilities 948,216 1,059,605
Net assets 1,514,538 1,596,893
Cash flow statement
Indicator Budget 2014 $’000
Actual 2014 $’000
Net cash provided by operating activities 87,793 88,182
Net cash (used in) investing activities (85,550) (67,111)
Net cash (used in) financing activities - (1,323)
Net increase in cash and cash equivalents 2243 19,748
Financial performance continued
Financial performance 47
Macquarie University has consolidated the following 16 controlled entities:
• Access Macquarie Ltd (AccessMQ)• Australian Proteome Analysis Facility Ltd (APAF)• CMBF Ltd• COH Property Trust• Macquarie Education South Africa NPC• Macquarie University Property Investment Company Pty Ltd• Macquarie University Property Investment Company No 3 Pty Ltd• Macquarie University Property Investment Trust (MUPIT)• MGSM Ltd• MUH Operations Pty Ltd• MUH Operations No 2 Pty Ltd• MUPH Clinic Pty Ltd• MUPH Hospital Pty Ltd• Risk Frontiers Flood (Australia) Pty Ltd• Risk Frontiers Group Pty Ltd• U@MQ Ltd MU Hospital Pty Ltd was de-registered during 2014.
During 2014, the 77 per cent investment in LAMS International Pty Ltd was sold to the minority shareholder, LD Education Services Pty Ltd. As part of that divestment, the University also resigned as a member of LAMS Foundation Ltd. The University has no ongoing interest in either of these companies.
The following seven controlled entities were trading in 2014.
Access Macquarie LtdAccess Macquarie Ltd (AccessMQ) is a not-for-profit public company limited by guarantee and wholly owned by Macquarie University. AccessMQ provided English language training to students from over 40 countries and IELTS testing for over 19,000 candidates in 2014. Its quality teaching resulted in students achieving 15 per cent higher grades in their first year at Macquarie University. Its continued management of research and consulting projects serves as a vital link between academics and researchers from Macquarie University and industry. In 2014, the AccessMQ research and consulting practice attracted approximately $15 million in research and consulting engagements.
Australian Proteome Analysis Facility LtdAustralian Proteome Analysis Facility Ltd (APAF) is a not-for-profit public company limited by guarantee and wholly owned by Macquarie University. APAF was the birthplace of the term proteomics in 1995 and was the world’s first dedicated high throughput proteomics laboratory. APAF has over 19 years of experience in providing proteomic services, and combined with leading-edge infrastructure and expertise, provides total solutions for proteomic research needs.
CMBF LtdCMBF Ltd (CMBF) is a not-for-profit public company limited by guarantee and wholly owned by Macquarie University. CMBF administers the delivery of the University’s Master of Applied Finance in Sydney and other locations, domestically and internationally. The program has approximately 1000 students enrolled and is internationally recognised in the global banking and finance industry.
MGSM LtdMGSM Ltd is a not-for-profit public company limited by guarantee and wholly owned by Macquarie University. Since 1 April 2012, the company has been the trading entity for the Macquarie Graduate School of Management. The three primary divisions of MGSM are Award Programs, Research and Executive Education, which are supported by the MGSM’s conference centre on the main campus. MGSM was again ranked among the world’s top 50 MBA programs (The Economist, Full-time MBA ranking, 2014). It also ranked number one in New South Wales, number three in Australia, and number five in the Asia-Pacific region in the same study1.
MUH Operations No 2 Pty LtdMUH Operations No 2 Pty Ltd (MUH) is a not-for-profit, public company limited by shares and wholly owned by Macquarie University. Macquarie University Hospital’s objectives are to provide evidenced-based care of the highest quality to every one of its patients; to provide education to its scholars by supporting University-based learning and actively supporting the professional development of its staff; and to support innovation in clinical care by providing the most advanced hospital facilities, links to research space and better information systems. Performance of the company’s operations is measured in terms of occupancy levels, patient days, average length of stay, patient revenue per patient day, labour work hours per patient day, and clinical and pharmaceutical supplies costs per patient day. The hospital’s board reviews the company’s performance at each of its meetings.
Risk Frontiers Flood (Australia) Pty LtdRisk Frontiers Flood (Australia) Pty Ltd (Risk Frontiers) is a for-profit private company limited by shares and ultimately wholly owned by Macquarie University. Risk Frontiers is a research centre sponsored by the insurance industry to aid better understanding and pricing of natural hazard risks in the Asia-Pacific region. Its aims are to undertake risk assessment and research into natural hazards, develop databases of natural hazards and their impact on communities and insured assets, and develop loss models to improve the pricing of natural hazard catastrophe risks. It is the preferred provider of research to the New South Wales State Emergency Service and works with various government agencies and a number of corporate and utility organisations on risk-related issues.
U@MQ LtdU@MQ is a not-for-profit public company limited by guarantee and wholly owned by Macquarie University. The principal activities of U@MQ are to provide products, services and facilities to the members of the University community – including staff and students – that complement and support the academic activities of the University. Those services and facilities include sporting and recreational facilities; food, beverage and retail services; and childcare. The company’s operations are measured in terms of number of transactions per outlet, average outlet transactions revenue, sports membership numbers, child care utilisation rates, customer satisfaction rates, per cent of cost of goods sold against revenue, per cent of wages, and per cent of direct expenses against revenue.
The financial statements for those controlled entities required to produce financial statements are available in the second volume to this Annual Report, which is available at mq.edu.au/about/how_mq_works/reports
1 mq.edu.au/thisweek/2014/10/12/mgsm-top-50-in-the-world/#.VOPTdS7Llmc
48 Macquarie University Annual Report 2014
Contents
Independent auditor’s report 50
Statement of appointed officers 52
Income statement 53
Statement of comprehensive income 54
Statement of financial position 55
Statement of changes in equity 56
Statement of cash flows 57
Notes to the financial statements 58
Financial statements
PHOT
O: P
AUL
WRI
GH
T

Financial statements 49
- This page has been left intentionally blank -
50 Macquarie University Annual Report 2014
Financial statements 51
52 Macquarie University Annual Report 2014
Statement of appointed officers
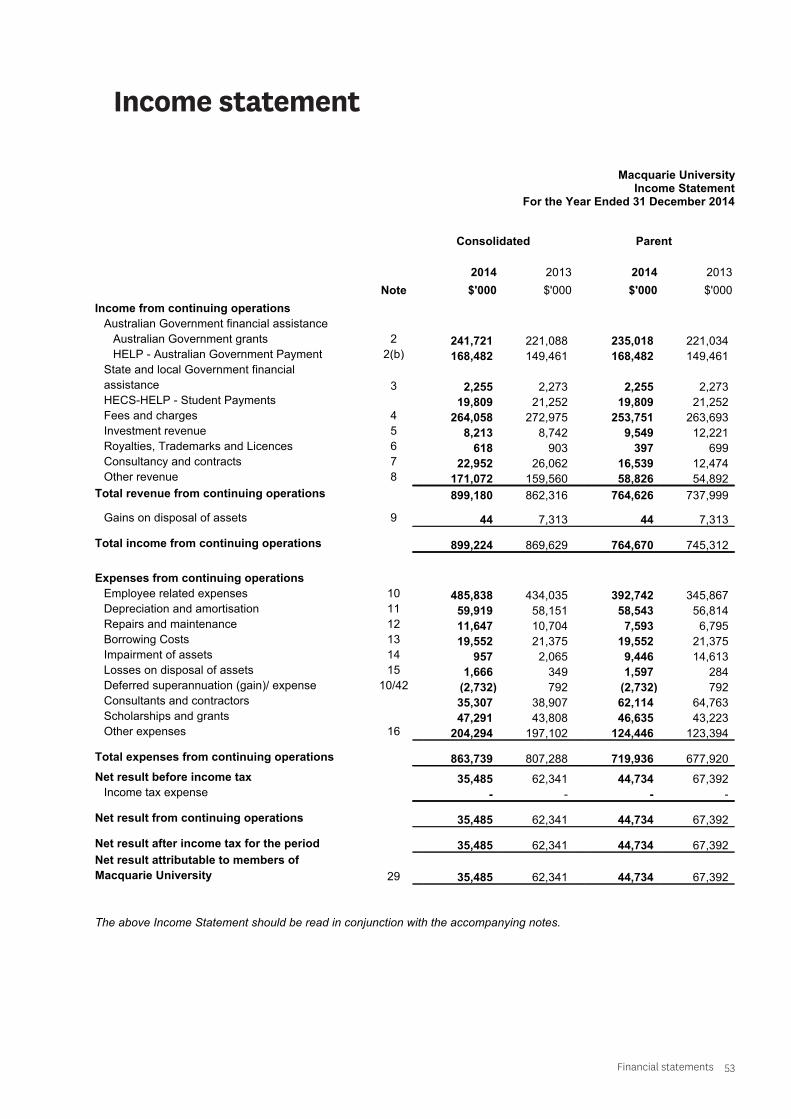
Financial statements 53
Macquarie UniversityIncome Statement
For the Year Ended 31 December 2014
Consolidated Parent
Note
2014
$'000
2013
$'000
2014
$'000
2013
$'000
Income from continuing operations
Australian Government financial assistance
Australian Government grants 2 241,721 221,088 235,018 221,034HELP - Australian Government Payment 2(b) 168,482 149,461 168,482 149,461
State and local Government financial
assistance 3 2,255 2,273 2,255 2,273HECS-HELP - Student Payments 19,809 21,252 19,809 21,252Fees and charges 4 264,058 272,975 253,751 263,693Investment revenue 5 8,213 8,742 9,549 12,221Royalties, Trademarks and Licences 6 618 903 397 699Consultancy and contracts 7 22,952 26,062 16,539 12,474Other revenue 8 171,072 159,560 58,826 54,892
Total revenue from continuing operations 899,180 862,316 764,626 737,999
Gains on disposal of assets 9 44 7,313 44 7,313
Total income from continuing operations 899,224 869,629 764,670 745,312
Expenses from continuing operations
Employee related expenses 10 485,838 434,035 392,742 345,867Depreciation and amortisation 11 59,919 58,151 58,543 56,814Repairs and maintenance 12 11,647 10,704 7,593 6,795Borrowing Costs 13 19,552 21,375 19,552 21,375Impairment of assets 14 957 2,065 9,446 14,613Losses on disposal of assets 15 1,666 349 1,597 284Deferred superannuation (gain)/ expense 10/42 (2,732) 792 (2,732) 792Consultants and contractors 35,307 38,907 62,114 64,763Scholarships and grants 47,291 43,808 46,635 43,223Other expenses 16 204,294 197,102 124,446 123,394
Total expenses from continuing operations 863,739 807,288 719,936 677,920
Net result before income tax 35,485 62,341 44,734 67,392Income tax expense - - - -
Net result from continuing operations 35,485 62,341 44,734 67,392
Net result after income tax for the period 35,485 62,341 44,734 67,392
Net result attributable to members of
Macquarie University 29 35,485 62,341 44,734 67,392
The above Income Statement should be read in conjunction with the accompanying notes.
2
Income statement
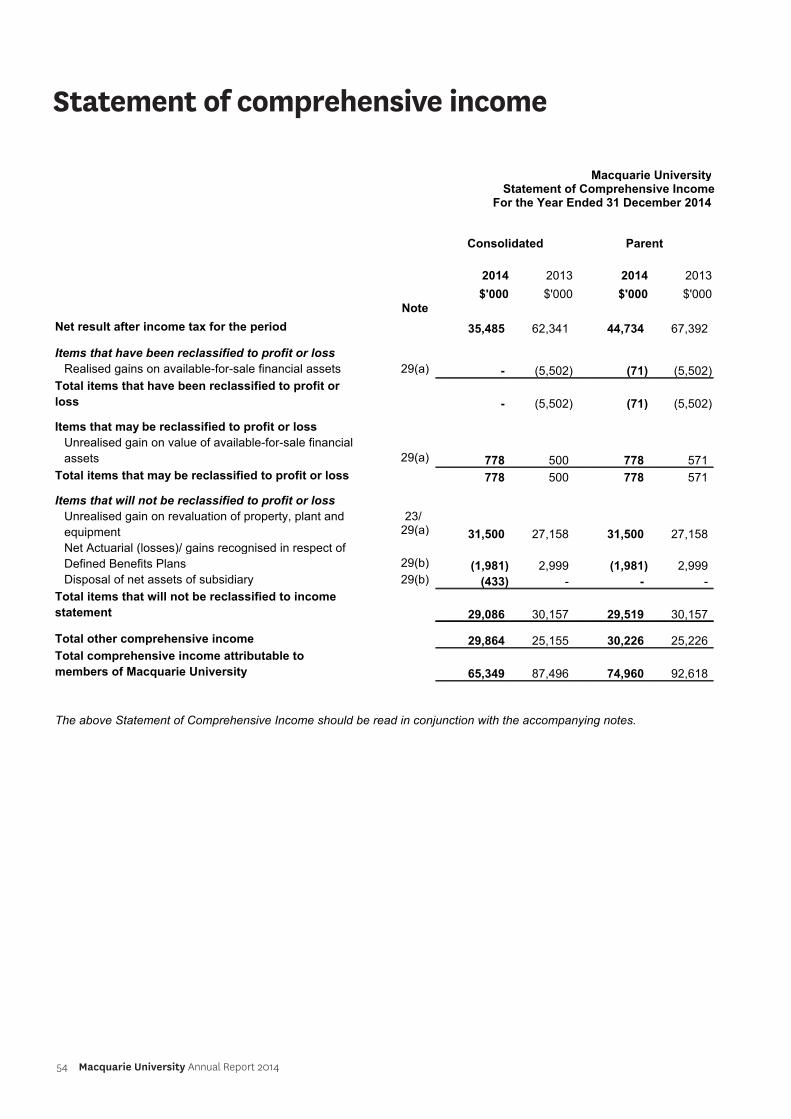
54 Macquarie University Annual Report 2014
Statement of comprehensive income
Macquarie UniversityStatement of Comprehensive Income
For the Year Ended 31 December 2014
Consolidated Parent
Note
2014
$'000
2013
$'000
2014
$'000
2013
$'000
Net result after income tax for the period 35,485 62,341 44,734 67,392
Items that have been reclassified to profit or loss
Realised gains on available-for-sale financial assets 29(a) - (5,502) (71) (5,502)
Total items that have been reclassified to profit or
loss - (5,502) (71) (5,502)
Items that may be reclassified to profit or loss
Unrealised gain on value of available-for-sale financial
assets 29(a) 778 500 778 571
Total items that may be reclassified to profit or loss 778 500 778 571
Items that will not be reclassified to profit or loss
Unrealised gain on revaluation of property, plant and
equipment
23/29(a) 31,500 27,158 31,500 27,158
Net Actuarial (losses)/ gains recognised in respect of
Defined Benefits Plans 29(b) (1,981) 2,999 (1,981) 2,999Disposal of net assets of subsidiary 29(b) (433) - - -
Total items that will not be reclassified to income
statement 29,086 30,157 29,519 30,157
Total other comprehensive income 29,864 25,155 30,226 25,226
Total comprehensive income attributable to
members of Macquarie University 65,349 87,496 74,960 92,618
The above Statement of Comprehensive Income should be read in conjunction with the accompanying notes.
3
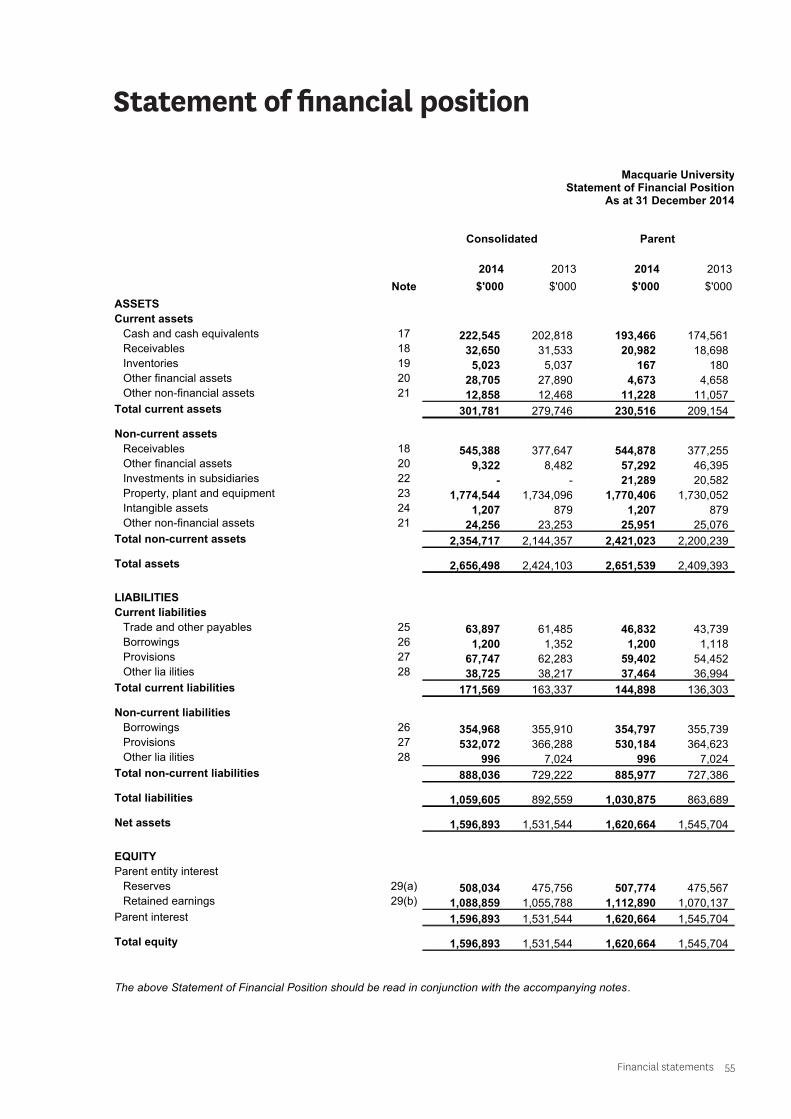
Financial statements 55
Statement of financial position
Macquarie UniversityStatement of Financial Position
As at 31 December 2014
Consolidated Parent
Note
2014
$'000
2013
$'000
2014
$'000
2013
$'000
ASSETS
Current assets
Cash and cash equivalents 17 222,545 202,818 193,466 174,561Receivables 18 32,650 31,533 20,982 18,698Inventories 19 5,023 5,037 167 180Other financial assets 20 28,705 27,890 4,673 4,658Other non-financial assets 21 12,858 12,468 11,228 11,057
Total current assets 301,781 279,746 230,516 209,154
Non-current assets
Receivables 18 545,388 377,647 544,878 377,255Other financial assets 20 9,322 8,482 57,292 46,395Investments in subsidiaries 22 - - 21,289 20,582Property, plant and equipment 23 1,774,544 1,734,096 1,770,406 1,730,052Intangible assets 24 1,207 879 1,207 879Other non-financial assets 21 24,256 23,253 25,951 25,076
Total non-current assets 2,354,717 2,144,357 2,421,023 2,200,239
Total assets 2,656,498 2,424,103 2,651,539 2,409,393
LIABILITIES
Current liabilities
Trade and other payables 25 63,897 61,485 46,832 43,739Borrowings 26 1,200 1,352 1,200 1,118Provisions 27 67,747 62,283 59,402 54,452Other liabilities 28 38,725 38,217 37,464 36,994
Total current liabilities 171,569 163,337 144,898 136,303
Non-current liabilities
Borrowings 26 354,968 355,910 354,797 355,739Provisions 27 532,072 366,288 530,184 364,623Other liabilities 28 996 7,024 996 7,024
Total non-current liabilities 888,036 729,222 885,977 727,386
Total liabilities 1,059,605 892,559 1,030,875 863,689
Net assets 1,596,893 1,531,544 1,620,664 1,545,704
EQUITY
Parent entity interest
Reserves 29(a) 508,034 475,756 507,774 475,567Retained earnings 29(b) 1,088,859 1,055,788 1,112,890 1,070,137
Parent interest 1,596,893 1,531,544 1,620,664 1,545,704
Total equity 1,596,893 1,531,544 1,620,664 1,545,704
The above Statement of Financial Position should be read in conjunction with the accompanying notes.
4
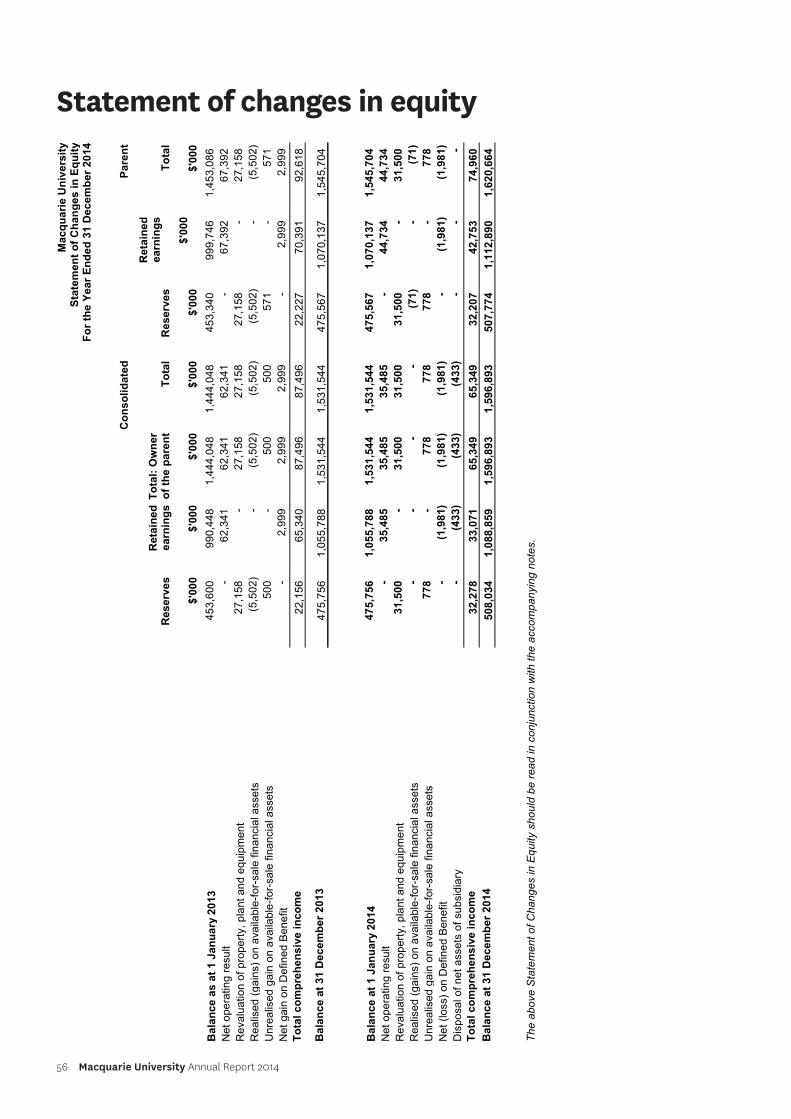
56 Macquarie University Annual Report 2014
Statement of changes in equityM
ac
qu
ari
e U
niv
ers
ity
Sta
tem
en
t o
f C
ha
ng
es
in
Eq
uit
yF
or
the
Ye
ar
En
de
d 3
1 D
ec
em
be
r 2
01
4
Co
ns
oli
da
ted
Pa
ren
t
Reserv
es
$'0
00
Re
tain
ed
ea
rnin
gs
$'0
00
To
tal:
Ow
ne
ro
f th
e p
are
nt
$'0
00
To
tal
$'0
00
Reserv
es
$'0
00
Re
tain
ed
ea
rnin
gs
$'0
00
To
tal
$'0
00
Ba
lan
ce
as
at
1 J
an
ua
ry 2
01
34
53
,60
09
90
,44
81
,44
4,0
48
1,4
44
,04
84
53
,34
09
99
,74
61
,45
3,0
86
Ne
t o
pe
ratin
g r
esu
lt-
62
,34
16
2,3
41
62
,34
1-
67
,39
26
7,3
92
Re
va
lua
tio
n o
f p
rop
ert
y,
pla
nt
an
d e
qu
ipm
en
t2
7,1
58
-2
7,1
58
27
,15
82
7,1
58
-2
7,1
58
Re
alis
ed
(g
ain
s)
on
ava
ilab
le-f
or-
sa
le f
ina
ncia
l a
sse
ts(5
,50
2)
-(5
,50
2)
(5,5
02
)(5
,50
2)
-(5
,50
2)
Un
rea
lise
d g
ain
on
ava
ilab
le-f
or-
sa
le f
ina
ncia
l a
sse
ts5
00
-5
00
50
05
71
-5
71
Ne
t g
ain
on
De
fin
ed
Be
ne
fit
-2
,99
92
,99
92
,99
9-
2,9
99
2,9
99
To
tal
co
mp
reh
en
siv
e i
nc
om
e2
2,1
56
65
,34
08
7,4
96
87
,49
62
2,2
27
70
,39
19
2,6
18
Ba
lan
ce
at
31
De
ce
mb
er
20
13
47
5,7
56
1,0
55
,78
81
,53
1,5
44
1,5
31
,54
44
75
,56
71
,07
0,1
37
1,5
45
,70
4
Ba
lan
ce
at
1 J
an
ua
ry 2
01
44
75
,75
61
,05
5,7
88
1,5
31
,54
41
,53
1,5
44
47
5,5
67
1,0
70
,13
71
,54
5,7
04
Ne
t o
pe
ratin
g r
esu
lt-
35
,48
53
5,4
85
35
,48
5-
44
,73
44
4,7
34
Re
va
lua
tio
n o
f p
rop
ert
y,
pla
nt
an
d e
qu
ipm
en
t3
1,5
00
-3
1,5
00
31
,50
03
1,5
00
-3
1,5
00
Re
alis
ed
(g
ain
s)
on
ava
ilab
le-f
or-
sa
le f
ina
ncia
l a
sse
ts-
--
-(7
1)
-(7
1)
Un
rea
lise
d g
ain
on
ava
ilab
le-f
or-
sa
le f
ina
ncia
l a
sse
ts7
78
-7
78
77
87
78
-7
78
Ne
t (l
oss)
on
De
fin
ed
Be
ne
fit
-(1
,98
1)
(1,9
81
)(1
,98
1)
-(1
,98
1)
(1,9
81
)
Dis
po
sa
l o
f n
et
asse
ts o
f su
bsid
iary
-(4
33
)(4
33
)(4
33
)-
--
To
tal
co
mp
reh
en
siv
e i
nc
om
e3
2,2
78
33
,07
16
5,3
49
65
,34
93
2,2
07
42
,75
37
4,9
60
Ba
lan
ce
at
31
De
ce
mb
er
20
14
50
8,0
34
1,0
88
,85
91
,59
6,8
93
1,5
96
,89
35
07
,77
41
,11
2,8
90
1,6
20
,66
4
Th
e a
bo
ve
Sta
tem
en
t o
f C
ha
ng
es in
Eq
uity s
ho
uld
be
re
ad
in
co
nju
nctio
n w
ith
th
e a
cco
mp
an
yin
g n
ote
s.
5
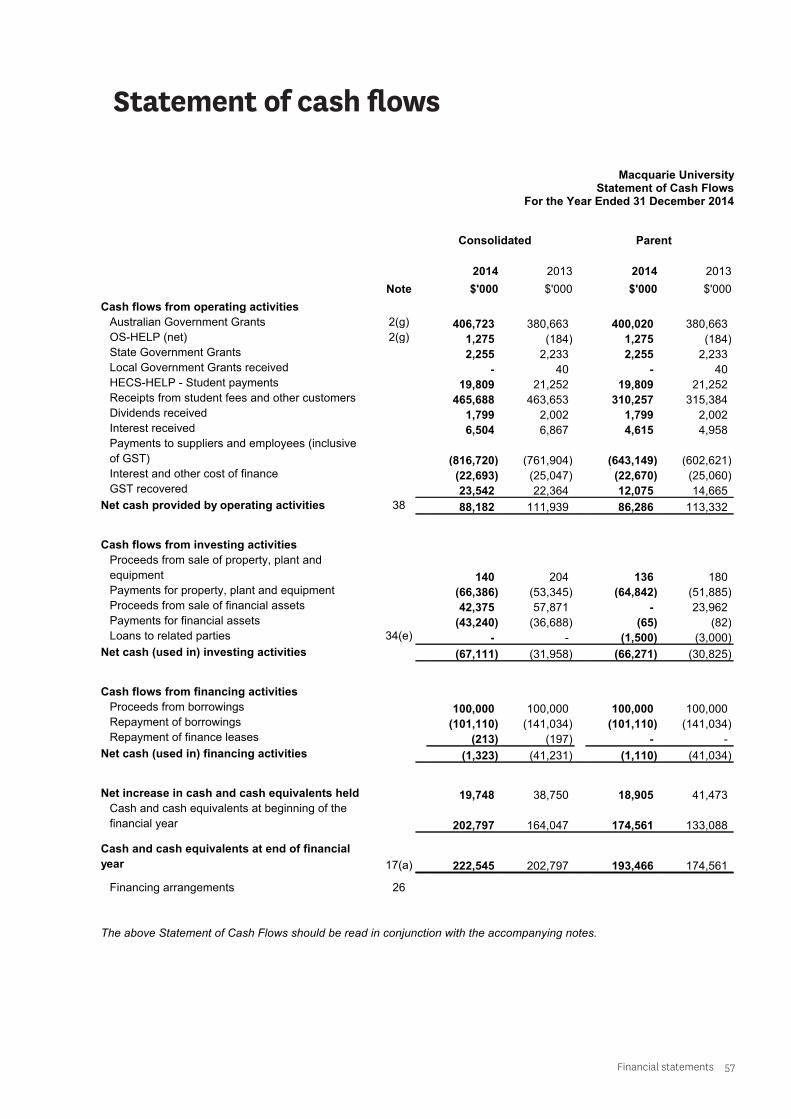
Financial statements 57
Macquarie UniversityStatement of Cash Flows
For the Year Ended 31 December 2014
Consolidated Parent
Note
2014
$'000
2013
$'000
2014
$'000
2013
$'000
Cash flows from operating activities
Australian Government Grants 2(g) 406,723 380,663 400,020 380,663OS-HELP (net) 2(g) 1,275 (184) 1,275 (184)State Government Grants 2,255 2,233 2,255 2,233Local Government Grants received - 40 - 40HECS-HELP - Student payments 19,809 21,252 19,809 21,252Receipts from student fees and other customers 465,688 463,653 310,257 315,384Dividends received 1,799 2,002 1,799 2,002Interest received 6,504 6,867 4,615 4,958Payments to suppliers and employees (inclusive
of GST) (816,720) (761,904) (643,149) (602,621)Interest and other cost of finance (22,693) (25,047) (22,670) (25,060)GST recovered 23,542 22,364 12,075 14,665
Net cash provided by operating activities 38 88,182 111,939 86,286 113,332
Cash flows from investing activities
Proceeds from sale of property, plant and
equipment 140 204 136 180Payments for property, plant and equipment (66,386) (53,345) (64,842) (51,885)Proceeds from sale of financial assets 42,375 57,871 - 23,962Payments for financial assets (43,240) (36,688) (65) (82)Loans to related parties 34(e) - - (1,500) (3,000)
Net cash (used in) investing activities (67,111) (31,958) (66,271) (30,825)
Cash flows from financing activities
Proceeds from borrowings 100,000 100,000 100,000 100,000Repayment of borrowings (101,110) (141,034) (101,110) (141,034)Repayment of finance leases (213) (197) - -
Net cash (used in) financing activities (1,323) (41,231) (1,110) (41,034)
Net increase in cash and cash equivalents held 19,748 38,750 18,905 41,473Cash and cash equivalents at beginning of the
financial year 202,797 164,047 174,561 133,088
Cash and cash equivalents at end of financial
year 17(a) 222,545 202,797 193,466 174,561
Financing arrangements 26
The above Statement of Cash Flows should be read in conjunction with the accompanying notes.
6
Statement of cash flows
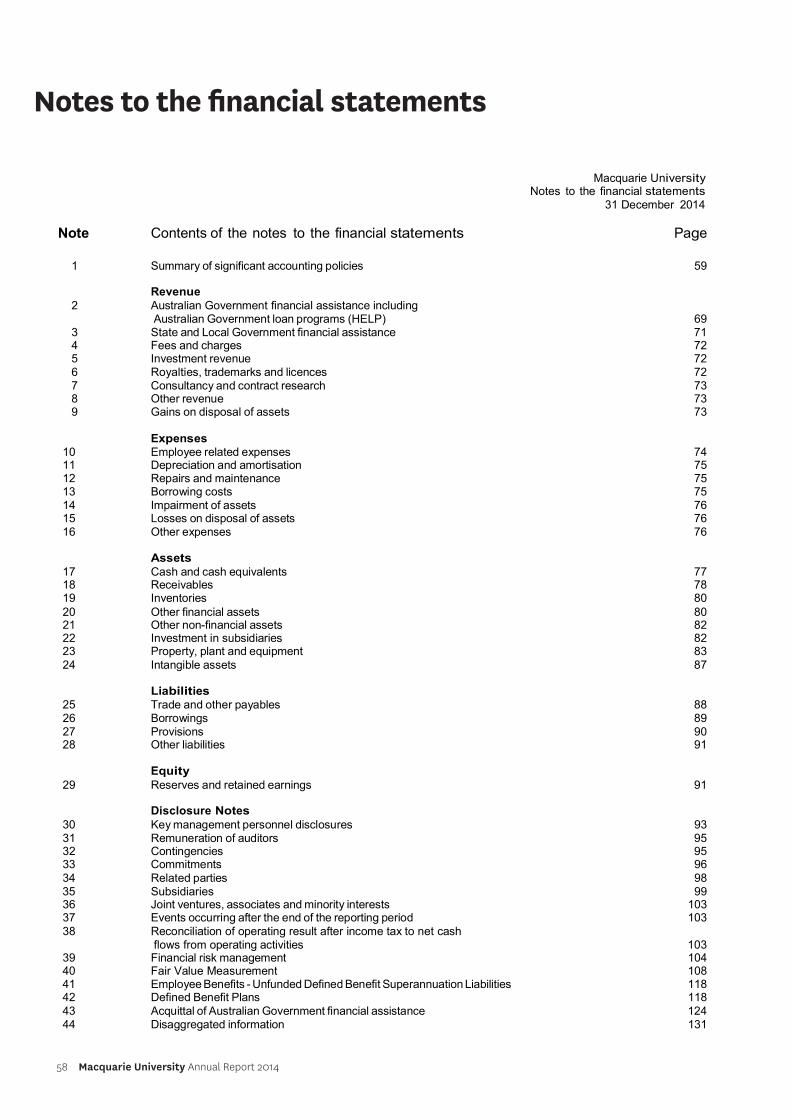
58 Macquarie University Annual Report 2014
Notes to the financial statements
Macquarie UniversityNotes to the financial statements
31 December 2014 Note Contents of the notes to the financial statements Page
1 Summary of significant accounting policies 59
Revenue 2 Australian Government financial assistance including
Australian Government loan programs (HELP) 69 3 State and Local Government financial assistance 71 4 Fees and charges 72 5 Investment revenue 72 6 Royalties, trademarks and licences 72 7 Consultancy and contract research 73 8 Other revenue 73 9 Gains on disposal of assets 73
Expenses
10 Employee related expenses 74 11 Depreciation and amortisation 7512 Repairs and maintenance 75 13 Borrowing costs 75 14 Impairment of assets 76 15 Losses on disposal of assets 76 16 Other expenses 76
Assets
17 Cash and cash equivalents 77 18 Receivables 78 19 Inventories 80 20 Other financial assets 80 21 Other non-financial assets 82 22 Investment in subsidiaries 82 23 Property, plant and equipment 83 24 Intangible assets 87
Liabilities
25 Trade and other payables 88 26 Borrowings 89 27 Provisions 90 28 Other liabilities 91
Equity
29 Reserves and retained earnings 91
Disclosure Notes30 Key management personnel disclosures 93 31 Remuneration of auditors 95 32 Contingencies 95 33 Commitments 96 34 Related parties 98 35 Subsidiaries 99 36 Joint ventures, associates and minority interests 103 37 Events occurring after the end of the reporting period 103 38 Reconciliation of operating result after income tax to net cash
flows from operating activities 103 39 Financial risk management 104 40 Fair Value Measurement 108 41 Employee Benefits - Unfunded Defined Benefit Superannuation Liabilities 118 42 Defined Benefit Plans 118 43 Acquittal of Australian Government financial assistance 124 44 Disaggregated information 131
Financial statements 59
Macquarie UniversityNotes to the Financial Statements
For the Year Ended 31 December 2014
1 Summary of Significant Accounting Policies
The principal accounting policies adopted in the preparation of the financial statements are set out below. Thesepolicies have been consistently applied to all the years presented, unless otherwise stated. The financial statements include separate financial statements for Macquarie University as a parent entity and the consolidated entity consistingof Macquarie University and its subsidiaries.
(a) Basis of Preparation
The financial statements are general purpose financial statements which have been prepared on an accrualbasis in accordance with Australian Accounting Standards, AASB Interpretations, the Public Finance and AuditAct 1983, the Public Finance and Audit Regulations 2010, the Higher Education Support Act 2003, Division 60of the Australian Charities and Not-for-profits Commission Act 2012, Division 60 of the Australian Charities andNot-for-profits Commission Regulation 2013 and the Financial Statement Guidelines for Australian HigherEducation Providers, as issued by the Australian Government (Department of Education).
Macquarie University is a not-for-profit entity and these statements have been prepared on that basis. Some ofthe Australian Accounting Standards requirements for not-for-profit entities are inconsistent with the IFRSrequirements.
Date of authorisation for issue
The financial statements for the year ended 31 December 2014 have been authorised for issue by theMacquarie University Council on 9 April 2015.
Historical cost convention
These financial statements have been prepared under the historical cost convention, as modified by therevaluation of available-for-sale financial assets, financial assets and liabilities (including derivative instruments)at fair value through the income statement, certain classes of property, plant and equipment and investmentproperty.
Critical accounting estimates
The preparation of financial statements in conformity with Australian Accounting Standards requires the use ofcertain critical accounting estimates. It also requires management to exercise its judgement in the process ofapplying Macquarie University’s accounting policies. The estimates and underlying assumptions are reviewedon an ongoing basis. All significant estimates or assumptions made in the preparation of the financialstatements have been explained in the accounting policy notes or subsequent notes.
(b) Basis of consolidation
(i) Subsidiaries
The consolidated financial statements incorporate the assets and liabilities of all subsidiaries of MacquarieUniversity (''parent entity'') as at 31 December 2014 and the results of all subsidiaries for the year then ended.Macquarie University and its subsidiaries together are referred to in this financial report as the Group or theConsolidated Entity.
Subsidiaries are all those entities (including special purpose entities) over which the Group has the ability togovern the financial and operating policies, generally accompanying a shareholding of more than one-half ofthe voting rights. The existence and effect of potential voting rights that are currently exercisable or convertibleare considered when assessing whether the Group controls another entity.
Subsidiaries are fully consolidated from the date on which control is transferred to the Group. They are de-consolidated from the date control ceases.
The acquisition method of accounting is used to account for the acquisition of subsidiaries by the Group.
Intercompany transactions, balances and unrealised gains on transactions between Group entities areeliminated. Unrealised losses are also eliminated unless the transaction provides evidence of the impairmentof the asset transferred. Accounting policies of subsidiaries have been changed where necessary to ensureconsistency with the policies adopted by the Group.
A list of the subsidiaries appears in note 35.
(ii) Common control transactions
The predecessor method of accounting is used to account for business combinations between the entities inthe Group.
Assets acquired and liabilities assumed in common control transactions are measured at acquisition date at thecarrying value for the Group's perspective.
7
60 Macquarie University Annual Report 2014
Macquarie UniversityNotes to the Financial Statements
For the Year Ended 31 December 2014
1 Summary of Significant Accounting Policies (continued)
(b) Basis of consolidation (continued)
Non-cash distributions involving entities under common control are treated as contributions by owners/distributions to owners and are accounted for through equity, as a redemption of ownership interest.
Transfer of businesses, assets and liabilities involving entities under common control are done at book valuesthrough equity.
(iii) Joint ventures, associates and minority interests
The proportionate interests in the assets, liabilities and expenses of joint venture operations were notconsidered material and have not been incorporated in the financial statements. Details of joint ventures andassociates are set out in note 36.
(c) Foreign currency translation
(i) Functional and presentation currency
Items included in the financial statements of each of the Group’s entities are measured using the currency ofthe primary economic environment in which the entity operates (‘the functional currency’). The consolidatedfinancial statements are presented in Australian dollars, which is Macquarie University’s functional andpresentation currency.
(ii) Transactions and balances
Foreign currency transactions during the period have been converted to Australian currency at the rateapplicable at the dates of transactions, with exchange rate fluctuations being recorded in the income statement.The balances of foreign currency accounts at balance sheet date are included with cash and cash equivalentsin the statement of financial position, converted at the rates applicable at year end. The balances of payablesdenominated in foreign currency at the balance sheet date are included in payables in the statement of financialposition, converted at the rates applicable at year end.
(d) Comparative Amounts
Where necessary, comparative information is reclassified to enhance comparability in respect of changes inpresentation adopted in the current year. There are no material reclassifications in 2014.
(e) Revenue Recognition
Revenue is measured at the fair value of the consideration received or receivable. Amounts disclosed asrevenue are net of returns, trade allowances, rebates and amounts collected on behalf of third parties.
The Group recognises revenue when the amount of revenue can be reliably measured, it is probable that futureeconomic benefits will flow to the Group and specific criteria have been met for each of the Group’s activities asdescribed below. The amount of revenue is not considered to be reliably measurable until all contingenciesrelating to the sale have been resolved. The Group bases its estimates on historical results, taking intoconsideration the type of customer, the type of transaction and the specifics of each arrangement.
Revenue is recognised for the major business activities as follows:
(i) Government Grants
The University treats operating grants received from Australian Government entities as revenue in the year ofreceipt.
Grants from the government are recognised at their fair value where the Group obtains control of the right toreceive the grant, it is probable that economic benefits will flow to the Group and it can be reliably measured.
(ii) HELP payments
Revenue from HELP is categorised into those received from the Australian Government and those receiveddirectly from students. Revenue is recognised and measured in accordance with the above disclosure.
(iii) Student fees and charges
Fees and charges are recognised as income in the year of receipt, except to the extent that fees and chargesrelate to courses to be held in future periods. Such receipts (or portion thereof) are treated as income inadvance. Conversely, fees and charges relating to debtors are recognised as revenue in the year to which theprescribed course relates.
8
Financial statements 61
Macquarie UniversityNotes to the Financial Statements
For the Year Ended 31 December 2014
1 Summary of Significant Accounting Policies (continued)
(e) Revenue Recognition (continued)
(iv) Royalties, trademarks and licences
Revenue from royalties, trademarks and licences is recognised as income when earned.
(v) Consultancy and Contracts / Fee for Service
Contract and consultancy revenue is recognised when the service is provided. Where appropriate, stage ofcompletion is measured by reference to labour hours incurred to date as a percentage of estimated total labourhours for each contract.
(vi) Lease income
Lease income from operating leases is recognised in the income statement on a straight-line basis over thelease term.
Finance lease income is recognised in the income statement over the lease period so as to produce a constantperiodic rate of interest on the remaining balance of the receivable for each period.
(vii) Investment revenue
Interest revenue is recognised on an accruals basis using the effective interest method. Dividend revenue isrecognised as received.
(f) Income Tax Exemption
Macquarie University and its controlled entities have received an endorsement by the Australian Taxation Officeto access the income tax exemption from 1st July 2000 under the Income Tax Assessment Act 1997, with theexception of Risk Frontiers Flood (Australia) Pty Ltd and Macquarie University Property Investment Company.Macquarie University Property Investment Company has no income tax liability as at 31 December 2014.
(g) Leases
Leases in which a significant portion of the risks and rewards of ownership are retained by the lessor areclassified as operating leases (note 33(c)). Payments made under operating leases (net of any incentivesreceived from the lessor) are charged to the income statement on a straight-line basis, over the period of thelease.
The University is lessor in a number of long term leases of land to commercial organisations. Wheresubstantially all the risks and rewards incidental to ownership are transferred to the lessee at inception, theseleases are classified as finance leases. Finance leases are recognised at the lease's inception at the lower ofthe fair value of the lease property and the present value of the minimum lease payments. The correspondingrent receivables, net of finance lease income, are included in other short term and long term receivables. Eachlease receipt is allocated between the receivable and finance lease income. The finance lease income isrecognised in the income statement over the lease period so as to produce a constant periodic rate of intereston the remaining balance of the receivable for each period.
At the end of the lease period, buildings constructed by the lessees on the various sites will revert to Universityownership without payment of consideration to the lessee. These assets have not been recognised in thefinancial statements as management considers the value of the assets at the end of the long term lease periodto be immaterial.
Lease income from operating leases is recognised in income on a straight-line basis over the lease term.
(h) Impairment of assets
Intangible assets that have an indefinite useful life are not subject to amortisation and are tested annually forimpairment. Assets that are subjected to amortisation are reviewed for impairment when events or changes incircumstances indicate that the carrying amount may not be recoverable. An impairment loss is recognised forthe amount by which the asset’s carrying amount exceeds its recoverable amount. The recoverable amount isthe higher of an asset’s fair value less costs to sell and value in use i.e. depreciated replacement cost.
For the purposes of assessing impairment, assets are grouped at the lowest levels for which there areseparately identifiable cash flows which are largely independent of the cash inflows from other assets or groupsof assets (cash generating units). Non-financial assets other than goodwill that suffered an impairment arereviewed for possible reversal of the impairment at each reporting date.
9
62 Macquarie University Annual Report 2014
Macquarie UniversityNotes to the Financial Statements
For the Year Ended 31 December 2014
1 Summary of Significant Accounting Policies (continued)
(i) Cash and cash equivalents
For statement of cash flows presentation purposes, cash and cash equivalents includes cash on hand, depositsheld at call with financial institutions, other short-term, highly liquid investments with original maturities of threemonths or less that are readily convertible to known amounts of cash and which are subject to an insignificantrisk of changes in value, and bank overdrafts. Bank overdrafts are shown within borrowings in current liabilitieson the statement of financial position.
(j) Trade receivables
Trade receivables are initially recognised and subsequently measured at invoiced amount. There is no materialdifference between invoiced amount and amortised cost due to their short term nature. Collectability of tradereceivables is reviewed on an ongoing basis. Debts which are known to be uncollectible are written off. Aprovision for impairment of receivables is established when there is objective evidence that the Group will notbe able to collect all amounts due according to the original terms of receivables.
Significant financial difficulties, probability that the debtor will enter bankruptcy or financial reorganisation, anddefault or delinquency in payments are considered indicators that the trade receivable is impaired.Consideration is also given to history of late but successful payment relations with the debtors and the quality ofcorrespondence between the Group and the debtor. The amount of the provision is the difference between theasset’s carrying amount and the value of estimated future cash flows. The amount of the provision isrecognised in the income statement.
A provision for impairment of receivables has been created based on a review of all outstanding amounts at 31December 2014. Bad debts are written off in the period in which they are identified.
(k) Inventories
Printery, publications, food and beverage, service stores, medical supplies and other inventories are valued atthe lower of cost and net realisable value.
(l) Investments and other financial assets
Funds are invested using guidelines established by the University Council. In 1996, the University applied forand was granted wide investment powers under part 4 of Schedule 4 of the "Public Authorities (FinancialArrangements) Act 1987". Using these powers in 1997 the University implemented a strategy to diversify itsinvestment portfolio between current and non-current investments.
For further information references should be made to the following notes:
Available-for-sale financial assets (Note 20)
Held-to-maturity investments (Note 20)
Other financial assets (Note 20)
Reserves and retained earnings (Note 29)
(i) Classification
The Group classifies its investments in the following categories: financial assets at fair value through theincome statement, loans and receivables, held-to-maturity investments, and available-for-sale financial assets.The classification depends on the purpose for which the investments were acquired. Management determinesthe classification of its investments at initial recognition and, in the case of assets classified as held-to-maturity,re-evaluates this designation at each reporting date.
(ii) Financial assets at fair value through income statement
Financial assets at fair value through income statement include financial assets held for trading. No suchassets were held in 2014 and 2013.
(iii) Loans and receivables
Loans and receivables are non-derivative financial assets with fixed or determinable payments that are notquoted in an active market. They arise when the Group provides money, goods or services directly to a debtorwith no intention of selling the receivable. They are included in current assets, except for those with maturitiesgreater than 12 months after the reporting date which are classified as non-current assets. Loans andreceivables are included in receivables in the statement of financial position.
10
Financial statements 63
Macquarie UniversityNotes to the Financial Statements
For the Year Ended 31 December 2014
1 Summary of Significant Accounting Policies (continued)
(l) Investments and other financial assets (continued)
(iv) Held-to-maturity investments
Held-to-maturity investments are non-derivative financial assets with fixed or determinable payments and fixedmaturities that the Group’s management has the positive intention and ability to hold to maturity.
(v) Available-for-sale financial assets
Available-for-sale financial assets, comprising principally marketable equity securities, are non-derivatives thatare either designated in this category or not classified in any of the other categories. They are included in non-current assets unless management intends to dispose of the investment within 12 months of the reporting date.
Purchases and sales of financial assets are recognised on trade-date - the date on which the Group commits topurchase or sell the asset. Investments are initially recognised at fair value plus transactions costs for allfinancial assets not carried at fair value through income statement. Financial assets are de-recognised whenthe rights to receive cash flows from the financial assets have expired or have been transferred and the Grouphas transferred substantially all the risks and rewards of ownership.
When available-for-sale financial assets are sold, the accumulated fair value adjustments recognised in othercomprehensive income are included in the income statement as gains and losses from investment securities.
Subsequent measurement
Available-for-sale financial assets are subsequently carried at fair value where this can be reliably measured orat historical cost where no reliable fair value measurement is available. Loans and receivables and held-to-maturity investments are carried at historical cost, which approximates to fair value calculated using theeffective interest method.
Unrealised gains and losses arising from changes in the fair value of non-monetary securities classified asavailable-for-sale are recognised in equity in the available-for-sale investments revaluation surplus. Changes inthe fair value of other monetary and non-monetary securities classified as available-for-sale are recognised inequity.
Fair value
The fair values of quoted investments are based on quoted prices in an active market. If the market for afinancial asset is not active, the Group establishes fair value by using valuation techniques that maximise theuse of relevant data. These include reference to the estimated price in an orderly transaction that would takeplace between market participants at the measurement date. Other valuation techniques used are the costapproach and the income approach based on the characteristics of the asset and the assumptions made bymarket participants. If fair value cannot be determined, the investment is measured at cost.
Impairment
The Group assesses at each balance date whether there is objective evidence that a financial asset or group offinancial assets is impaired. In the case of equity securities classified as available-for-sale, a significant orprolonged decline in the fair value of a security below its cost is considered in determining whether the securityis impaired.
In the case of unlisted securities measured at cost, reference to the percentage stake in the net assets of theinvestment is considered in determining whether the security is impaired. If any such evidence exists foravailable-for-sale financial assets, the cumulative loss, measured as the difference between the acquisition costand the current fair value, less any impairment loss on that financial asset previously recognised in profit orloss, is removed from equity and recognised in the income statement. Impairment losses recognised in theincome statement on equity instruments are not reversed through the income statement.
(m) Derivatives
Derivatives are initially recognised at fair value on the date a derivative contract is entered into and aresubsequently remeasured to their fair value. The method of recognising the resulting gain or loss depends onwhether the derivative is designated as a hedging instrument, and if so, the nature of the item being hedged.The Group designates certain derivatives as either; (1) hedges of the fair value of recognised assets orliabilities or a firm commitment (fair value hedge); or (2) hedges of highly probable forecast transactions (cashflow hedges).
(i) Fair value hedge
Changes in the fair value of derivatives that are designated and qualify as fair value hedges are recorded in the
11
64 Macquarie University Annual Report 2014
Macquarie UniversityNotes to the Financial Statements
For the Year Ended 31 December 2014
1 Summary of Significant Accounting Policies (continued)
(m) Derivatives (continued)income statement, together with any changes in the fair value of the hedged asset or liability that areattributable to the hedged risk.
(ii) Cash flow hedge
The effective portion of changes in the fair value of derivatives that are designated and qualify as cash flowhedges is recognised in other comprehensive income. The gain or loss relating to the ineffective portion isrecognised immediately in the income statement within other income or other expense.
Amounts that have been recognised in other comprehensive income are reclassified from equity to incomestatement as a reclassification adjustment in the periods when the hedged item affects profit or loss (forinstance when the forecast sale that is hedged takes place). The gain or loss relating to the effective portion ofinterest rate swaps hedging variable rate borrowings is recognised in the income statement within ’borrowingcosts’. The gain or loss relating to the effective portion of forward foreign exchange contracts hedging exportsales is recognised in the income statement within ‘fees and charges’.
However, when the forecast cash flow that is hedged results in the recognition of a non-financial asset (forexample, inventory or fixed assets) the gains and losses previously recognised in other comprehensive incomeare either reclassified as a reclassification adjustment to the income statement or are included in the initialmeasurement of the cost of the asset. The deferred amounts are ultimately recognised in profit or loss as costof goods sold in the case of inventory, or as depreciation in the case of fixed assets.
When a hedging instrument expires or is sold or terminated, or when a hedge no longer meets the criteria forhedge accounting, any cumulative gain or loss that has been recognised in other comprehensive income fromthe period when the hedge was effective shall remain separately in equity until the forecast transaction occurs.When a forecast transaction is no longer expected to occur, the cumulative gain or loss that was recognised inother comprehensive income shall be reclassified to income statement as a reclassification adjustment.
(iii) Derivatives that do not qualify for hedge accounting
Certain derivative instruments do not qualify for hedge accounting. Changes in the fair value of any derivativeinstrument that does not qualify for hedge accounting are recognised immediately in the income statement andare included in other income or other expenses.
(n) Fair value measurement
The fair value of assets and liabilities must be measured for recognition and disclosure purposes.
Macquarie University classifies fair value measurements using a fair value hierarchy that reflects thesignificance of the inputs used in making the measurements.
The fair value of assets or liabilities traded in active markets (such as publicly traded derivatives, and tradingand available-for-sale securities) is based on quoted market prices for identical assets or liabilities at thereporting date (Level 1). The quoted market price used for assets held by Macquarie University is the mostrepresentative of fair value in the circumstances within the bid-ask spread.
The fair value of assets or liabilities that are not traded in an active market (for example, over-the-counter-derivatives) is determined using valuation techniques. Macquarie University uses a variety of methods andmakes assumptions that are based on market conditions existing at each balance date. Quoted market pricesor dealer quotes for similar instruments (Level 2) are used for long-term debt instruments held. Othertechniques that are not based on observable market data (Level 3) such as estimated discounted cash flows,are used to determine fair value for the remaining assets and liabilities. The fair value of interest-rate swaps iscalculated as the present value of the estimated future cash flows. The fair value of forward exchangecontracts is determined using forward exchange market rates at the reporting date. The level in the fair valuehierarchy shall be determined on the basis of the lowest level input that is significant to the fair valuemeasurement in its entirety.
Fair value measurement of non-financial assets is based on the highest and best use of the asset. MacquarieUniversity considers market participants use of, or purchase of the asset, to use it in a manner that would behighest and best use.
The carrying value less impairment provision of trade receivables and payables are assumed to approximatetheir fair values due to their short-term nature. The fair value of financial liabilities for disclosure purposes isestimated by discounting the future contractual cash flows at the current market interest rate that is available toMacquarie University for similar financial instruments.
12
Notes to the financial statements 65
Macquarie UniversityNotes to the Financial Statements
For the Year Ended 31 December 2014
1 Summary of Significant Accounting Policies (continued)
(o) Property, Plant and Equipment
Acquisitions and additions of non-current assets are capitalised if the value is more than $5,000 for theUniversity, U@MQ Ltd and MGSM Ltd, and $1,000 for all other subsidiaries where individual items are less thanthese amounts but the project total is collectively greater than the capitalisation limit, the collective total may becapitalised. These additions are recorded at cost in the year of acquisition.
Land, buildings and infrastructure assets are measured at fair value. Fair value is determined usingindependent valuations prepared by external experts in accordance with AASB 13.
The fair value of property, plant and equipment is measured on an existing use basis, where there are nofeasible alternative uses in the existing natural, legal, financial and socio-political environment. However, in thelimited circumstances where there are feasible alternative uses, assets are valued at their highest and best use.Fair value of property, plant and equipment is determined based on the best available market evidence,including current market selling prices for the same or similar assets. Where there is no available marketevidence, the asset's fair value is measured at its market buying price, the best indicator of which is depreciatedreplacement cost.
Any accumulated depreciation at the date of revaluation is eliminated against the gross carrying amount of theasset and the net amount is restated to the revalued amount of the asset. All other property, plant andequipment are stated at historical cost less depreciation. Historical cost includes expenditure that is directlyattributable to the acquisition of the items.
Subsequent costs are included in the asset’s carrying amount or recognised as a separate asset, asappropriate, only when it is probable that future economic benefits associated with the item will flow to theGroup and the cost of the item can be measured reliably. All other repairs and maintenance are charged to theincome statement during the financial period in which they are incurred.
Increases in the carrying amounts arising on revaluation of land and buildings are recognised in othercomprehensive income and accumulated in equity under the heading of reserves. To the extent that theincrease reverses a decrease previously recognised in the income statement, the increase is first recognised inthe income statement. Decreases that reverse previous increases of the same asset are also firstly recognisedin other comprehensive income before reducing the balance of revaluation reserves in equity, to the extent ofthe remaining reserve attributable to the asset. All other decreases are charged to the income statement.
Gains and losses on disposals are disclosed separately in the income statement, in accordance with theDepartment of Education requirements.
Land, Building and Infrastructure is revalued annually, with dates of inspection between 31 July 2014 to 30November 2014 and valuation date as at 1 December 2014. The valuation was provided by Mr B Hill AAPI,Registered Valuer No. 024135 of Global Valuations Services Pty Ltd.
The carrying value of other plant and equipment is measured at depreciated historic cost. There is nosubstantive difference between the fair value and the carrying value of these assets.
IT software relating to capital projects which is purchased, developed or implemented is recorded at historicalcost and amortised over its useful life.
The Library General Collection is recorded at fair value on the basis of depreciated replacement value.
The following asset collections are measured at fair value and are revalued every three years:
Works of Art were revalued as at 31 December 2013 by Mr W Caruana for the indigenous works and
by Ms S Downer and Ms S Hewitt for the non-indigenous works, including works in the University's
Sculpture Park. The valuers are approved valuers under the Australian Government Cultural Gifts
Program.
The Library Special Collection was revalued as at 3 November 2013. The valuation was provided by
Mr S Taaffe, an approved valuer under the Australian Government Cultural Gifts Program.
Artefacts contained in the Lachlan Macquarie Room located at Macquarie University were revalued on
1 December 2013. The valuation was provided by Mr S Hollington M.A.V.A.A, Registered Valuer No.
255 of Hollington Fine Art Valuation.
Artefacts owned by Macquarie University in the Museum of Ancient Cultures were revalued in
November 2013. The valuation was provided by Mr R Loosley, an approved valuer under the
Australian Government Cultural Gifts Program.
The collections of papyri held by the Museum of Ancient Cultures were revalued in November 2013.
13
66 Macquarie University Annual Report 2014
Macquarie UniversityNotes to the Financial Statements
For the Year Ended 31 December 2014
1 Summary of Significant Accounting Policies (continued)
(o) Property, Plant and Equipment (continued)
The valuation was provided by Mr R Loosley, an approved valuer under the Australian Government
Cultural Gifts Program.
Coins held in the Museum of Ancient Cultures located at Macquarie University were revalued on 15
December 2013. The valuation was provided by Mr W Holt ANA, ANS, ASAN.
Property, plant and equipment are depreciated only when they are completed and ready for use. Depreciationis calculated on a straight line basis to expense the net cost or fair value of each item of property, plant andequipment, net of their residual value, over its expected useful life. Land is not depreciated. Standardapplicable rates by asset type are:
2014 2013
Asset
Land Nil NilBuildings 40 years 40 yearsInfrastructure 21 years 21 yearsAssets under construction Nil Nil- Computer equipment 3.33 years 3.33 years- Other equipment 10 years 10 years- Science equipment 5 years 5 years- Motor vehicles 6.7 years 6.7 years- Medical equipment 5-10 years 5-10 years- IT capital projects 3-10 years 3-10 yearsLeasehold improvements Term of lease Term of leaseLibrary Collections: General 5 years 5 yearsLibrary Collections: Special Nil NilWorks of Art Nil NilPatents 20 years 20 years
The assets’ residual values and useful lives are reviewed, and adjusted if appropriate, at each balance sheetdate.
An asset’s carrying amount is written down immediately to its recoverable amount if the asset’s carrying amountis greater than its estimated recoverable amount.
(p) Intangible Assets
(i) Research
Expenditure on research activities, undertaken with the prospect of obtaining new scientific or technicalknowledge and understanding, is recognised in the income statement as an expense when it is incurred.
(ii) Development
Expenditure on development activities, being the application of research findings or other knowledge to a planor design for the production of new or substantially improved products or services before the start ofcommercial production or use, is capitalised if the product or service is technically and commercially feasibleand adequate resources are available to complete development. The expenditure capitalised comprises alldirectly attributable costs, including costs of materials, services, direct labour and an appropriate proportion ofoverheads. Other development expenditure is recognised in the income statement as an expense as incurred.Capitalised development expenditure is stated at cost less accumulated amortisation. Amortisation iscalculated using the straight-line method to allocate the cost over the period of the expected benefit.
(iii) Patents
Patents were revalued on 1 December 2008. T he valuation was provided Mr Steven Allan from Moore Stephens, Associate of the Institute of Chartered Accountants Australia and New Zealand, Member of CPA Australia and Fellow of the Taxation Institute of Australia.
(q) Unfunded Superannuation
Refer to notes 41 and 42 for details of amounts owing by Commonwealth / State Governments for unfundeddeferred liabilities for superannuation schemes.
14
Financial statements 67
Macquarie UniversityNotes to the Financial Statements
For the Year Ended 31 December 2014
1 Summary of Significant Accounting Policies (continued)
(r) Trade and other payables
Trade accounts payable are recognised when the University becomes obliged to make future payments as aresult of purchases. Trade accounts payable are measured at original cost, which is not materially different toamortised cost due to the short term nature of liabilities. The amounts are unsecured and are usually paidwithin 30 days of recognition.
(s) Borrowings
Borrowings are initially recognised at fair value, net of transaction costs incurred. Borrowings are subsequentlymeasured at amortised cost. Any difference between the proceeds (net of transaction costs) and theredemption amount is recognised in the income statement over the period of the borrowings using the effectiveinterest method.
Borrowings are classified as current liabilities unless the Group has an unconditional right to defer settlement ofthe liability for at least 12 months after date of the statement of financial position and does not expect to settlethe liability for at least 12 months after the date of statement of financial position.
(t) Borrowing costs
Borrowing costs are recognised as expenses in the period in which they are incurred (except where they areincluded in the costs of qualifying assets during the period of time that is required to complete and prepare theasset for its intended use or sale). Interest is expensed as it accrues, unless it relates to qualifying assets, inwhich case the borrowing cost is capitalised.
(u) Provisions
Provisions for legal claims and service warranties are recognised when: the Group has a present legal orconstructive obligation as a result of past events; it is probable that an outflow of resources will be required tosettle the obligation and the amount can be reliably estimated.
Provisions are not recognised for future operating losses.
Where there are a number of similar obligations, the likelihood that an outflow will be required in settlement isdetermined by considering the class of obligations as a whole. A provision is recognised even if the likelihoodof an outflow with respect to any one item included in the same class of obligations may be small.
Provisions are measured at the present value of management’s best estimate of the expenditure required tosettle the present obligation at the date of statement of financial position. The discount rate used to determinethe present value reflects current market assessments of the time value of money and the risks specific to theliability. The increase in the provision due to the passage of time is recognised as a finance cost.
(v) Employee benefits
(i) Short-term obligations
Liabilities for short-term employee benefits including wages and salaries are measured at the amount expectedto be paid when the liability is settled, if it is expected to be settled wholly before twelve months after the end ofthe reporting period, and is recognised in payables.
(ii) Other long-term obligations
The liability for other long-term benefits such as annual leave and long service leave is recognised in currentprovisions for employee benefits if it is expected to be settled wholly before twelve months after the end of thereporting period. The liability is measured at the present value of expected future payments to be made inrespect of services provided by employees up to the reporting date. Consideration is given to expected futurewage and salary levels, experience of employee departures and periods of service. Expected future paymentsare discounted using market yields at the reporting date on national government bonds with terms to maturityand currency that match, as closely as possible, the estimated future cash outflows.
Regardless of the expected timing of settlements, provisions made in respect of employee benefits areclassified as a current liability, unless there is an unconditional right to defer the settlement of the liability for atleast twelve months after the reporting date, in which case it would be classified as a non-current liability.
The long service leave liability has been recognised according to an actuarial assessment performed inaccordance with AASB 119 Employee Benefits.
15
68 Macquarie University Annual Report 2014
Macquarie UniversityNotes to the Financial Statements
For the Year Ended 31 December 2014
1 Summary of Significant Accounting Policies (continued)
(v) Employee benefits (continued)(iii) Retirement benefit obligations
All University employees, including casuals, receive superannuation benefits equal to or exceeding theSuperannuation Guarantee Levy.
All employees of the Group are entitled to benefits on retirement, disability or death from the Group’ssuperannuation plan. The Group has a defined benefit section and defined contribution section within its plan.The defined benefit section provides defined lump sum benefits based on years of service and final averagesalary. The defined contribution section receives fixed contributions from the Group and the Group’s legal orconstructive obligation is limited to these contributions.
A liability or asset in respect of defined benefit superannuation plans is recognised in the statement of financialposition, and is measured as the present value of the defined benefit obligation at the reporting date less thefair value of the superannuation fund’s assets at that date and any unrecognised past service cost. The presentvalue of the defined benefit obligation is based on expected future payments which arise from membership ofthe fund to the reporting date, calculated annually by independent actuaries using the projected unit creditmethod. Consideration is given to expected future wage and salary levels, experience of employee departuresand periods of service.
Expected future payments are discounted using market yields at the reporting date on national governmentbonds with terms to maturity and currency that match, as closely as possible, the estimated future cashoutflows.
Remeasurement gains and losses arising from experience adjustments and changes in actuarial assumptionsare recognised in the period in which they occur, directly in other comprehensive income. They are included inthe retained earnings in the statement of changes in equity and in the statement of financial position.
Past service costs are recognised in income immediately.
Contribution to the defined contribution fund are recognised as an expense as they become payable.
(iv) Termination Benefits
Termination benefits are payable when employment is terminated before the normal retirement date, or whenan employee accepts an offer of benefits in exchange for the termination of employment. The Grouprecognises termination benefits either when it can no longer withdraw the offer of those benefits or when it hasrecognised costs for restructuring within the scope of AASB 137 that involves the payment of terminationbenefits. Benefits not expected to be settled wholly before 12 months after the end of the reporting period arediscounted to present value.
(w) Goods and Services Tax (GST)
Revenues, expenses and assets are recognised net of the amount of goods and services tax (GST), exceptwhere the GST incurred is not recoverable from the Australian Taxation Office (ATO). In these circumstancesthe GST is recognised as part of the cost of acquisition of the asset or as part of an item of the expense.
Receivables and payables are stated with the amount of GST included. The net amount of GST recoverablefrom, or payable to, the ATO is included with other receivables or payables in the statement of financialposition.
Cash flows are included in the statement of cash flows on a gross basis. The GST components of cash flowsarising from investing or financing activities which are recoverable from, or payable to, the ATO are classified asoperating cash flows.
(x) Rounding of amounts
Amounts in the financial statements have been rounded to the nearest thousand dollars.
(y) New Accounting Standards and Interpretations
Certain new Accounting Standards and Interpretations became mandatory for 31 December 2014 reportingperiod. These new requirements have not had a material impact on either the results or disclosure of theUniversity.
Certain new Accounting Standards and Interpretations have been published that are not mandatory for 31December 2014 reporting period. The University has elected not to early adopt any of these standards. TheUniversity has assessed the impact of these future Standards and Interpretations and considers the impact tobe insignificant for the year ending December 2014.
16
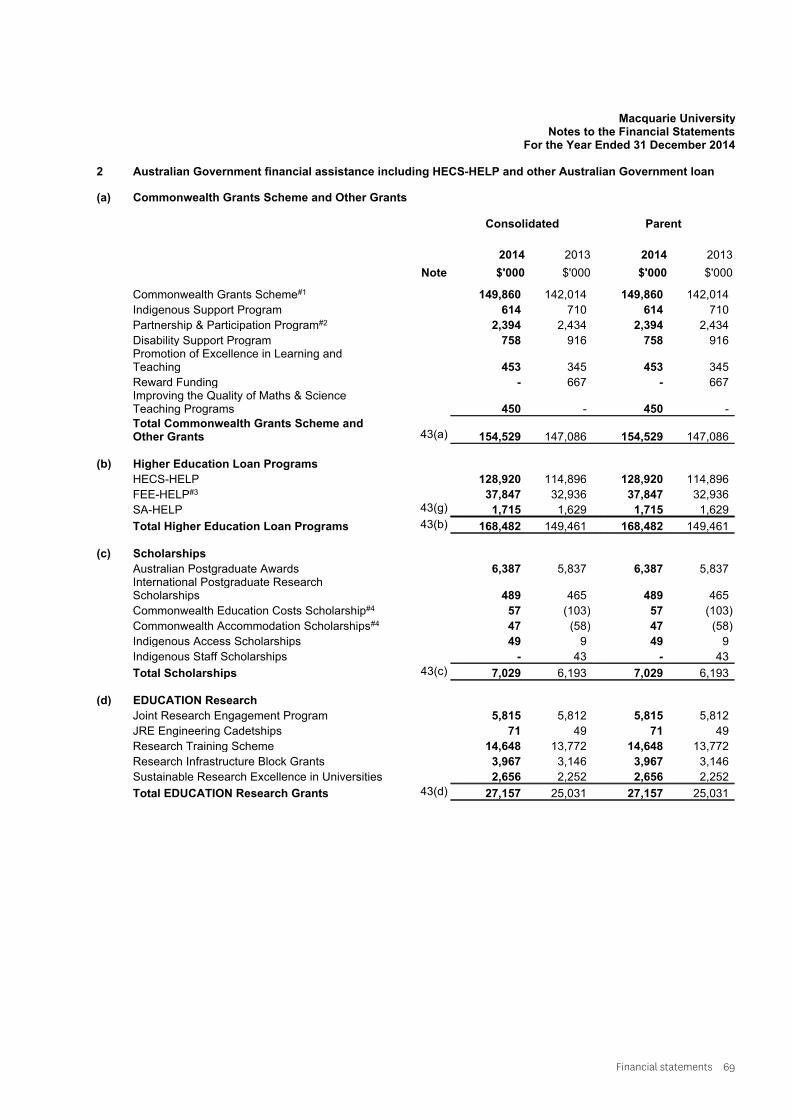
Financial statements 69
Macquarie UniversityNotes to the Financial Statements
For the Year Ended 31 December 2014
2 Australian Government financial assistance including HECS-HELP and other Australian Government loan
(a) Commonwealth Grants Scheme and Other Grants
Consolidated Parent
Note
2014
$'000
2013
$'000
2014
$'000
2013
$'000
Commonwealth Grants Scheme#1 149,860 142,014 149,860 142,014
Indigenous Support Program 614 710 614 710
Partnership & Participation Program#2 2,394 2,434 2,394 2,434
Disability Support Program 758 916 758 916Promotion of Excellence in Learning andTeaching 453 345 453 345
Reward Funding - 667 - 667Improving the Quality of Maths & ScienceTeaching Programs 450 - 450 -
Total Commonwealth Grants Scheme andOther Grants 43(a) 154,529 147,086 154,529 147,086
(b) Higher Education Loan Programs
HECS-HELP 128,920 114,896 128,920 114,896
FEE-HELP#3 37,847 32,936 37,847 32,936
SA-HELP 43(g) 1,715 1,629 1,715 1,629
Total Higher Education Loan Programs 43(b) 168,482 149,461 168,482 149,461
(c) Scholarships
Australian Postgraduate Awards 6,387 5,837 6,387 5,837International Postgraduate ResearchScholarships 489 465 489 465
Commonwealth Education Costs Scholarship#4 57 (103) 57 (103)
Commonwealth Accommodation Scholarships#4 47 (58) 47 (58)
Indigenous Access Scholarships 49 9 49 9
Indigenous Staff Scholarships - 43 - 43
Total Scholarships 43(c) 7,029 6,193 7,029 6,193
(d) EDUCATION Research
Joint Research Engagement Program 5,815 5,812 5,815 5,812
JRE Engineering Cadetships 71 49 71 49
Research Training Scheme 14,648 13,772 14,648 13,772
Research Infrastructure Block Grants 3,967 3,146 3,967 3,146
Sustainable Research Excellence in Universities 2,656 2,252 2,656 2,252
Total EDUCATION Research Grants 43(d) 27,157 25,031 27,157 25,031
17
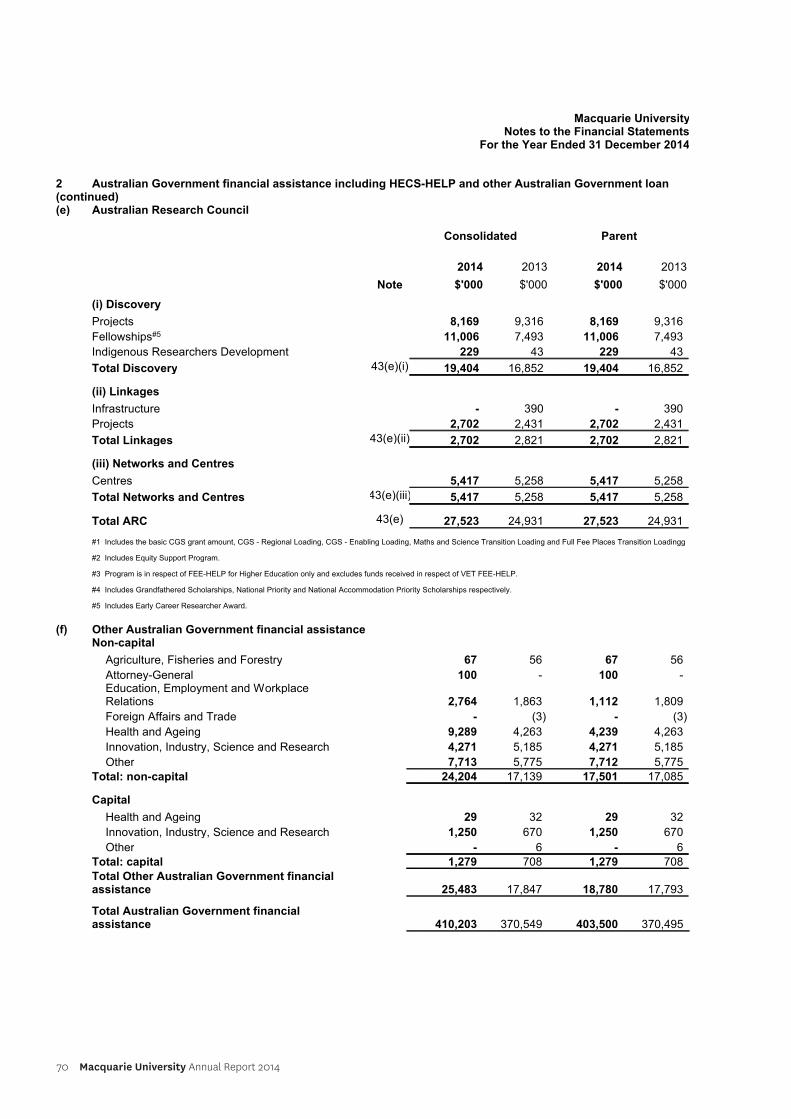
70 Macquarie University Annual Report 2014
Macquarie UniversityNotes to the Financial Statements
For the Year Ended 31 December 2014
2 Australian Government financial assistance including HECS-HELP and other Australian Government loan(continued)(e) Australian Research Council
Consolidated Parent
Note
2014
$'000
2013
$'000
2014
$'000
2013
$'000
(i) Discovery
Projects 8,169 9,316 8,169 9,316
Fellowships#5 11,006 7,493 11,006 7,493
Indigenous Researchers Development 229 43 229 43
Total Discovery 43(e)(i) 19,404 16,852 19,404 16,852
(ii) Linkages
Infrastructure - 390 - 390
Projects 2,702 2,431 2,702 2,431
Total Linkages 43(e)(ii) 2,702 2,821 2,702 2,821
(iii) Networks and Centres
Centres 5,417 5,258 5,417 5,258
Total Networks and Centres 43(e)(iii) 5,417 5,258 5,417 5,258
Total ARC 43(e) 27,523 24,931 27,523 24,931
#1 Includes the basic CGS grant amount, CGS - Regional Loading, CGS - Enabling Loading, Maths and Science Transition Loading and Full Fee Places Transition Loading.
#2 Includes Equity Support Program.
#3 Program is in respect of FEE-HELP for Higher Education only and excludes funds received in respect of VET FEE-HELP.
#4 Includes Grandfathered Scholarships, National Priority and National Accommodation Priority Scholarships respectively.
#5 Includes Early Career Researcher Award.
(f) Other Australian Government financial assistanceNon-capital
Agriculture, Fisheries and Forestry 67 56 67 56
Attorney-General 100 - 100 -Education, Employment and WorkplaceRelations 2,764 1,863 1,112 1,809
Foreign Affairs and Trade - (3) - (3)
Health and Ageing 9,289 4,263 4,239 4,263
Innovation, Industry, Science and Research 4,271 5,185 4,271 5,185
Other 7,713 5,775 7,712 5,775
Total: non-capital 24,204 17,139 17,501 17,085
Capital
Health and Ageing 29 32 29 32
Innovation, Industry, Science and Research 1,250 670 1,250 670
Other - 6 - 6
Total: capital 1,279 708 1,279 708
Total Other Australian Government financialassistance 25,483 17,847 18,780 17,793
Total Australian Government financialassistance 410,203 370,549 403,500 370,495
18
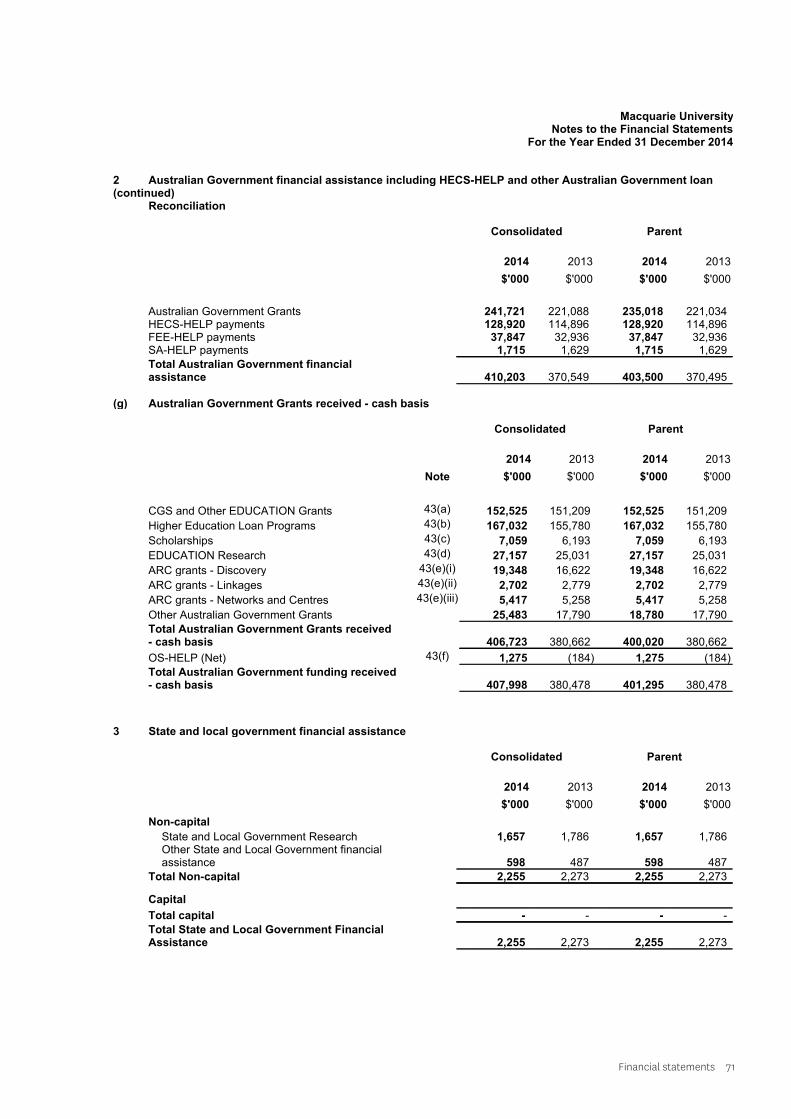
Financial statements 71
Macquarie UniversityNotes to the Financial Statements
For the Year Ended 31 December 2014
2 Australian Government financial assistance including HECS-HELP and other Australian Government loan(continued)
Reconciliation
Consolidated Parent
2014
$'000
2013
$'000
2014
$'000
2013
$'000
Australian Government Grants 241,721 221,088 235,018 221,034HECS-HELP payments 128,920 114,896 128,920 114,896FEE-HELP payments 37,847 32,936 37,847 32,936SA-HELP payments 1,715 1,629 1,715 1,629
Total Australian Government financialassistance 410,203 370,549 403,500 370,495
(g) Australian Government Grants received - cash basis
Consolidated Parent
Note
2014
$'000
2013
$'000
2014
$'000
2013
$'000
CGS and Other EDUCATION Grants 43(a) 152,525 151,209 152,525 151,209
Higher Education Loan Programs 43(b) 167,032 155,780 167,032 155,780
Scholarships 43(c) 7,059 6,193 7,059 6,193
EDUCATION Research 43(d) 27,157 25,031 27,157 25,031
ARC grants - Discovery 43(e)(i) 19,348 16,622 19,348 16,622
ARC grants - Linkages 43(e)(ii) 2,702 2,779 2,702 2,779
ARC grants - Networks and Centres 43(e)(iii) 5,417 5,258 5,417 5,258
Other Australian Government Grants 25,483 17,790 18,780 17,790
Total Australian Government Grants received- cash basis 406,723 380,662 400,020 380,662
OS-HELP (Net) 43(f) 1,275 (184) 1,275 (184)
Total Australian Government funding received- cash basis 407,998 380,478 401,295 380,478
3 State and local government financial assistance
Consolidated Parent
2014
$'000
2013
$'000
2014
$'000
2013
$'000
Non-capital
State and Local Government Research 1,657 1,786 1,657 1,786Other State and Local Government financialassistance 598 487 598 487
Total Non-capital 2,255 2,273 2,255 2,273
Capital
Total capital - - - -
Total State and Local Government FinancialAssistance 2,255 2,273 2,255 2,273
19
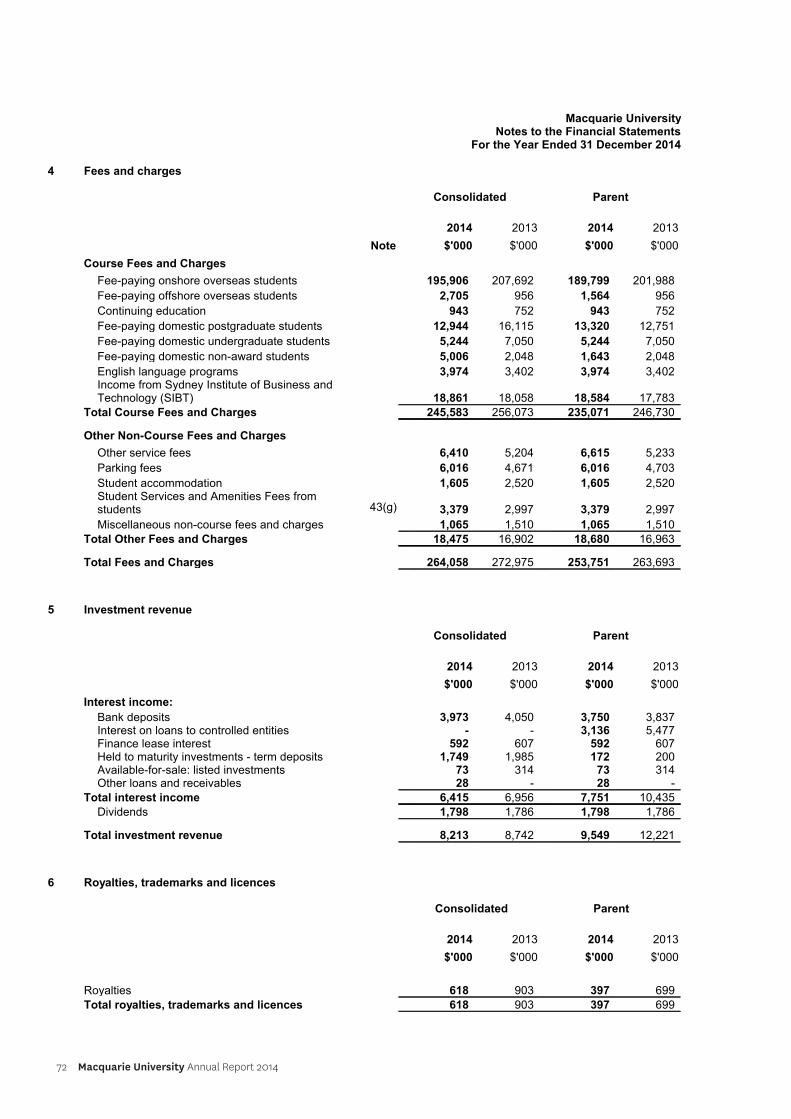
72 Macquarie University Annual Report 2014
Macquarie UniversityNotes to the Financial Statements
For the Year Ended 31 December 2014
4 Fees and charges
Consolidated Parent
Note
2014
$'000
2013
$'000
2014
$'000
2013
$'000
Course Fees and Charges
Fee-paying onshore overseas students 195,906 207,692 189,799 201,988
Fee-paying offshore overseas students 2,705 956 1,564 956
Continuing education 943 752 943 752
Fee-paying domestic postgraduate students 12,944 16,115 13,320 12,751
Fee-paying domestic undergraduate students 5,244 7,050 5,244 7,050
Fee-paying domestic non-award students 5,006 2,048 1,643 2,048
English language programs 3,974 3,402 3,974 3,402Income from Sydney Institute of Business andTechnology (SIBT) 18,861 18,058 18,584 17,783
Total Course Fees and Charges 245,583 256,073 235,071 246,730
Other Non-Course Fees and Charges
Other service fees 6,410 5,204 6,615 5,233
Parking fees 6,016 4,671 6,016 4,703
Student accommodation 1,605 2,520 1,605 2,520Student Services and Amenities Fees fromstudents 43(g) 3,379 2,997 3,379 2,997
Miscellaneous non-course fees and charges 1,065 1,510 1,065 1,510
Total Other Fees and Charges 18,475 16,902 18,680 16,963
Total Fees and Charges 264,058 272,975 253,751 263,693
5 Investment revenue
Consolidated Parent
2014
$'000
2013
$'000
2014
$'000
2013
$'000
Interest income:
Bank deposits 3,973 4,050 3,750 3,837Interest on loans to controlled entities - - 3,136 5,477Finance lease interest 592 607 592 607Held to maturity investments - term deposits 1,749 1,985 172 200Available-for-sale: listed investments 73 314 73 314Other loans and receivables 28 - 28 -
Total interest income 6,415 6,956 7,751 10,435
Dividends 1,798 1,786 1,798 1,786
Total investment revenue 8,213 8,742 9,549 12,221
6 Royalties, trademarks and licences
Consolidated Parent
2014
$'000
2013
$'000
2014
$'000
2013
$'000
Royalties 618 903 397 699
Total royalties, trademarks and licences 618 903 397 699
20
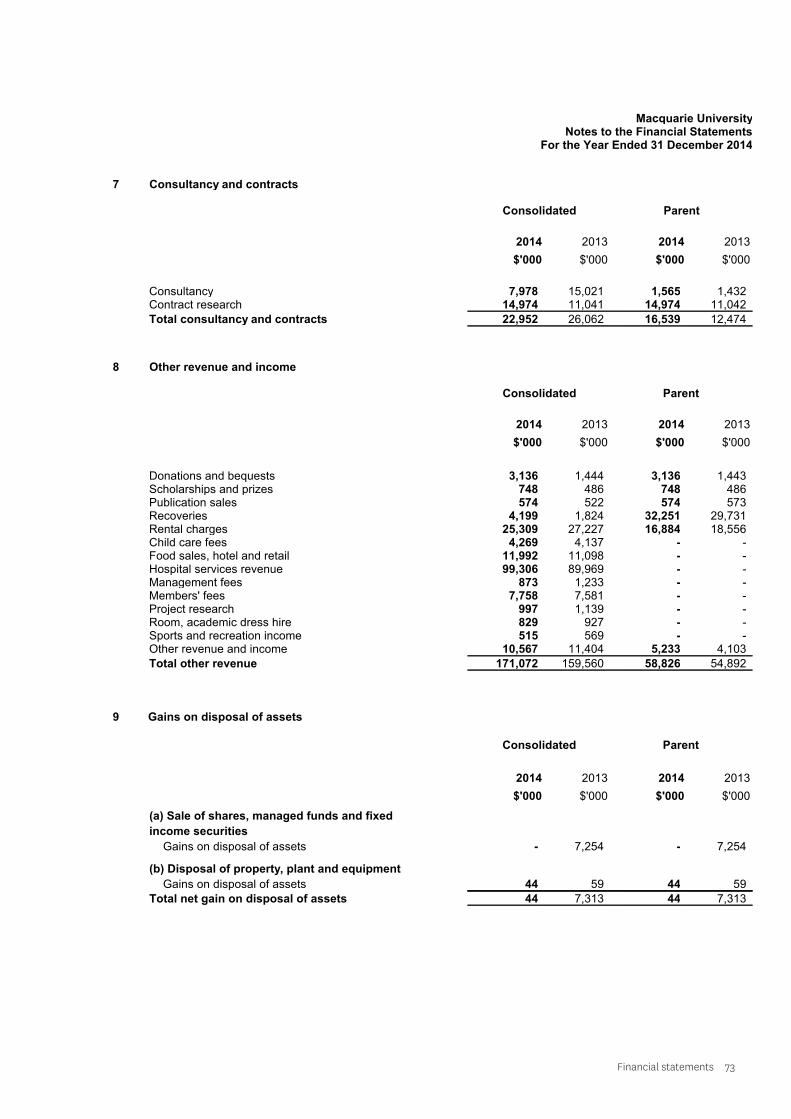
Financial statements 73
Macquarie UniversityNotes to the Financial Statements
For the Year Ended 31 December 2014
7 Consultancy and contracts
Consolidated Parent
2014
$'000
2013
$'000
2014
$'000
2013
$'000
Consultancy 7,978 15,021 1,565 1,432Contract research 14,974 11,041 14,974 11,042
Total consultancy and contracts 22,952 26,062 16,539 12,474
8 Other revenue and income
Consolidated Parent
2014
$'000
2013
$'000
2014
$'000
2013
$'000
Donations and bequests 3,136 1,444 3,136 1,443Scholarships and prizes 748 486 748 486Publication sales 574 522 574 573Recoveries 4,199 1,824 32,251 29,731Rental charges 25,309 27,227 16,884 18,556Child care fees 4,269 4,137 - -Food sales, hotel and retail 11,992 11,098 - -Hospital services revenue 99,306 89,969 - -Management fees 873 1,233 - -Members' fees 7,758 7,581 - -Project research 997 1,139 - -Room, academic dress hire 829 927 - -Sports and recreation income 515 569 - -Other revenue and income 10,567 11,404 5,233 4,103
Total other revenue 171,072 159,560 58,826 54,892
9 Gains on disposal of assets
Consolidated Parent
2014
$'000
2013
$'000
2014
$'000
2013
$'000
(a) Sale of shares, managed funds and fixed
income securities
Gains on disposal of assets - 7,254 - 7,254
(b) Disposal of property, plant and equipment
Gains on disposal of assets 44 59 44 59
Total net gain on disposal of assets 44 7,313 44 7,313
21
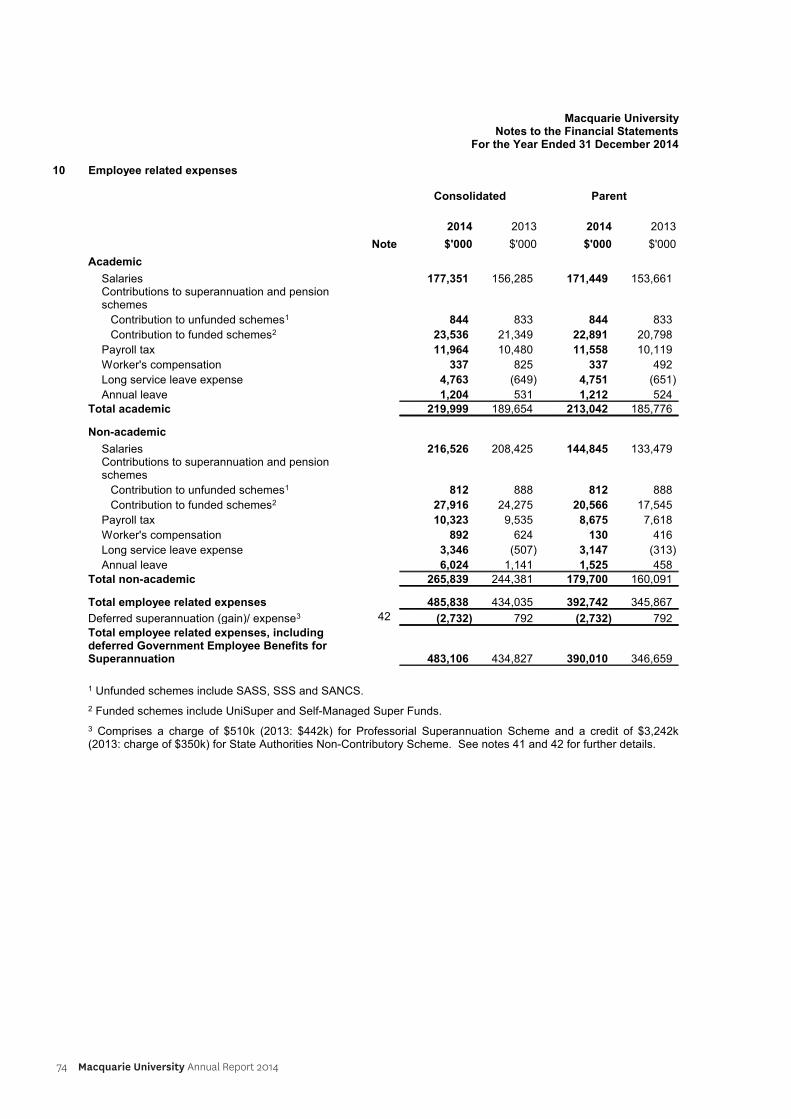
74 Macquarie University Annual Report 2014
Macquarie UniversityNotes to the Financial Statements
For the Year Ended 31 December 2014
10 Employee related expenses
Consolidated Parent
Note
2014
$'000
2013
$'000
2014
$'000
2013
$'000
Academic
Salaries 177,351 156,285 171,449 153,661Contributions to superannuation and pensionschemes
Contribution to unfunded schemes1 844 833 844 833
Contribution to funded schemes2 23,536 21,349 22,891 20,798
Payroll tax 11,964 10,480 11,558 10,119
Worker's compensation 337 825 337 492
Long service leave expense 4,763 (649) 4,751 (651)
Annual leave 1,204 531 1,212 524
Total academic 219,999 189,654 213,042 185,776
Non-academic
Salaries 216,526 208,425 144,845 133,479Contributions to superannuation and pensionschemes
Contribution to unfunded schemes1 812 888 812 888
Contribution to funded schemes2 27,916 24,275 20,566 17,545
Payroll tax 10,323 9,535 8,675 7,618
Worker's compensation 892 624 130 416
Long service leave expense 3,346 (507) 3,147 (313)
Annual leave 6,024 1,141 1,525 458
Total non-academic 265,839 244,381 179,700 160,091
Total employee related expenses 485,838 434,035 392,742 345,867
Deferred superannuation (gain)/ expense3 42 (2,732) 792 (2,732) 792
Total employee related expenses, includingdeferred Government Employee Benefits forSuperannuation 483,106 434,827 390,010 346,659
1 Unfunded schemes include SASS, SSS and SANCS.
2 Funded schemes include UniSuper and Self-Managed Super Funds.
3 Comprises a charge of $510k (2013: $442k) for Professorial Superannuation Scheme and a credit of $3,242k(2013: charge of $350k) for State Authorities Non-Contributory Scheme. See notes 41 and 42 for further details.
22
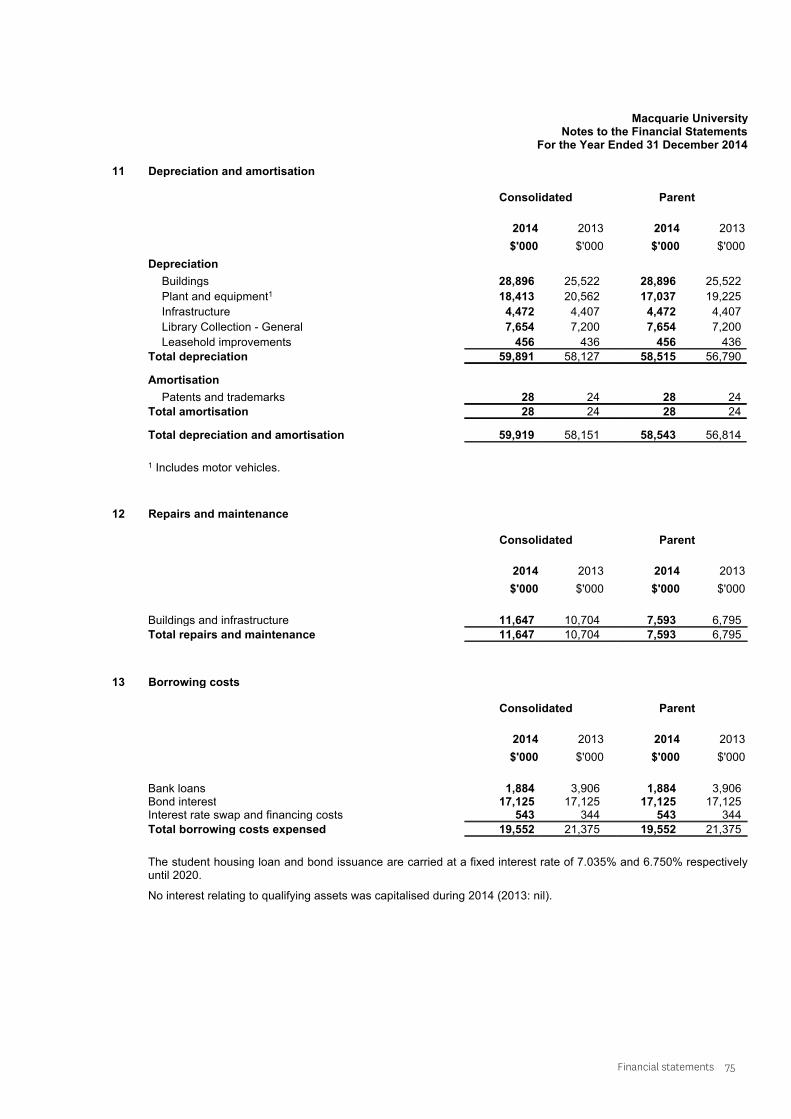
Financial statements 75
Macquarie UniversityNotes to the Financial Statements
For the Year Ended 31 December 2014
11 Depreciation and amortisation
Consolidated Parent
2014
$'000
2013
$'000
2014
$'000
2013
$'000
Depreciation
Buildings 28,896 25,522 28,896 25,522
Plant and equipment1 18,413 20,562 17,037 19,225
Infrastructure 4,472 4,407 4,472 4,407
Library Collection - General 7,654 7,200 7,654 7,200
Leasehold improvements 456 436 456 436
Total depreciation 59,891 58,127 58,515 56,790
Amortisation
Patents and trademarks 28 24 28 24
Total amortisation 28 24 28 24
Total depreciation and amortisation 59,919 58,151 58,543 56,814
1 Includes motor vehicles.
12 Repairs and maintenance
Consolidated Parent
2014
$'000
2013
$'000
2014
$'000
2013
$'000
Buildings and infrastructure 11,647 10,704 7,593 6,795
Total repairs and maintenance 11,647 10,704 7,593 6,795
13 Borrowing costs
Consolidated Parent
2014
$'000
2013
$'000
2014
$'000
2013
$'000
Bank loans 1,884 3,906 1,884 3,906Bond interest 17,125 17,125 17,125 17,125Interest rate swap and financing costs 543 344 543 344
Total borrowing costs expensed 19,552 21,375 19,552 21,375
The student housing loan and bond issuance are carried at a fixed interest rate of 7.035% and 6.750% respectivelyuntil 2020.
No interest relating to qualifying assets was capitalised during 2014 (2013: nil).
23
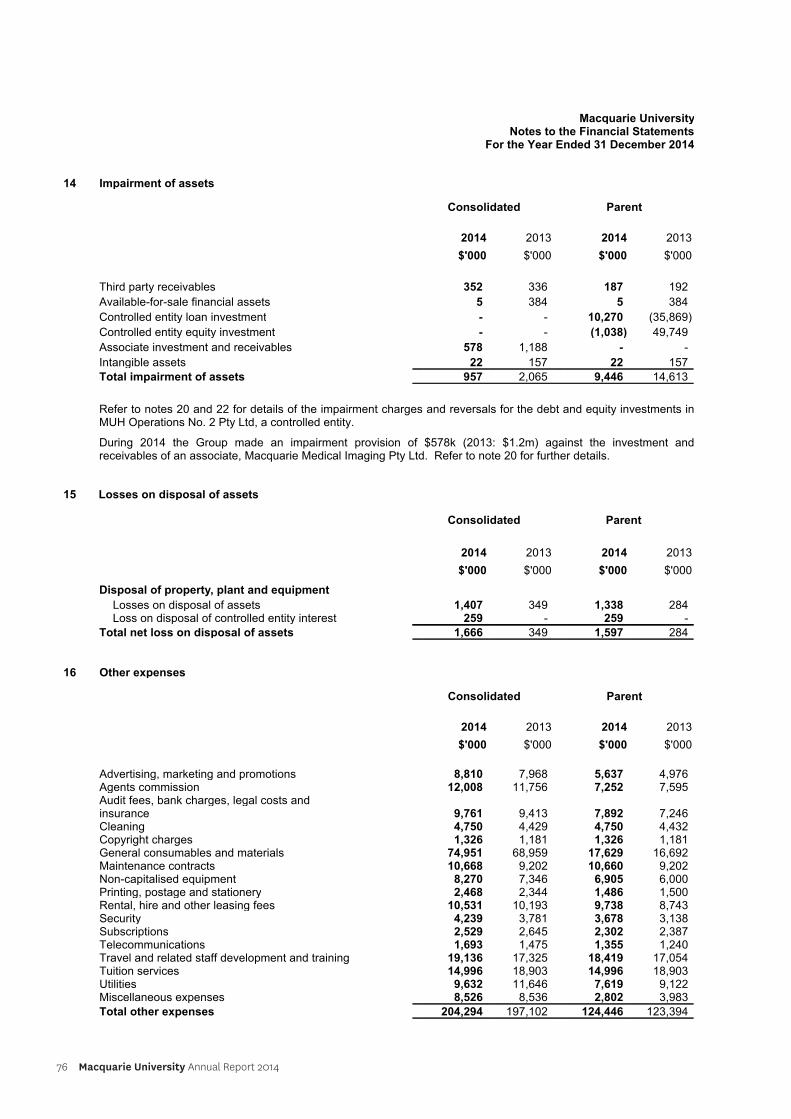
76 Macquarie University Annual Report 2014
Macquarie UniversityNotes to the Financial Statements
For the Year Ended 31 December 2014
14 Impairment of assets
Consolidated Parent
2014
$'000
2013
$'000
2014
$'000
2013
$'000
Third party receivables 352 336 187 192
Available-for-sale financial assets 5 384 5 384
Controlled entity loan investment - - 10,270 (35,869)
Controlled entity equity investment - - (1,038) 49,749
Associate investment and receivables 578 1,188 - -
Intangible assets 22 157 22 157
Total impairment of assets 957 2,065 9,446 14,613
Refer to notes 20 and 22 for details of the impairment charges and reversals for the debt and equity investments inMUH Operations No. 2 Pty Ltd, a controlled entity.
During 2014 the Group made an impairment provision of $578k (2013: $1.2m) against the investment andreceivables of an associate, Macquarie Medical Imaging Pty Ltd. Refer to note 20 for further details.
15 Losses on disposal of assets
Consolidated Parent
2014
$'000
2013
$'000
2014
$'000
2013
$'000
Disposal of property, plant and equipment
Losses on disposal of assets 1,407 349 1,338 284Loss on disposal of controlled entity interest 259 - 259 -
Total net loss on disposal of assets 1,666 349 1,597 284
16 Other expenses
Consolidated Parent
2014
$'000
2013
$'000
2014
$'000
2013
$'000
Advertising, marketing and promotions 8,810 7,968 5,637 4,976Agents commission 12,008 11,756 7,252 7,595Audit fees, bank charges, legal costs andinsurance 9,761 9,413 7,892 7,246Cleaning 4,750 4,429 4,750 4,432Copyright charges 1,326 1,181 1,326 1,181General consumables and materials 74,951 68,959 17,629 16,692Maintenance contracts 10,668 9,202 10,660 9,202Non-capitalised equipment 8,270 7,346 6,905 6,000Printing, postage and stationery 2,468 2,344 1,486 1,500Rental, hire and other leasing fees 10,531 10,193 9,738 8,743Security 4,239 3,781 3,678 3,138Subscriptions 2,529 2,645 2,302 2,387Telecommunications 1,693 1,475 1,355 1,240Travel and related staff development and training 19,136 17,325 18,419 17,054Tuition services 14,996 18,903 14,996 18,903Utilities 9,632 11,646 7,619 9,122Miscellaneous expenses 8,526 8,536 2,802 3,983
Total other expenses 204,294 197,102 124,446 123,394
24
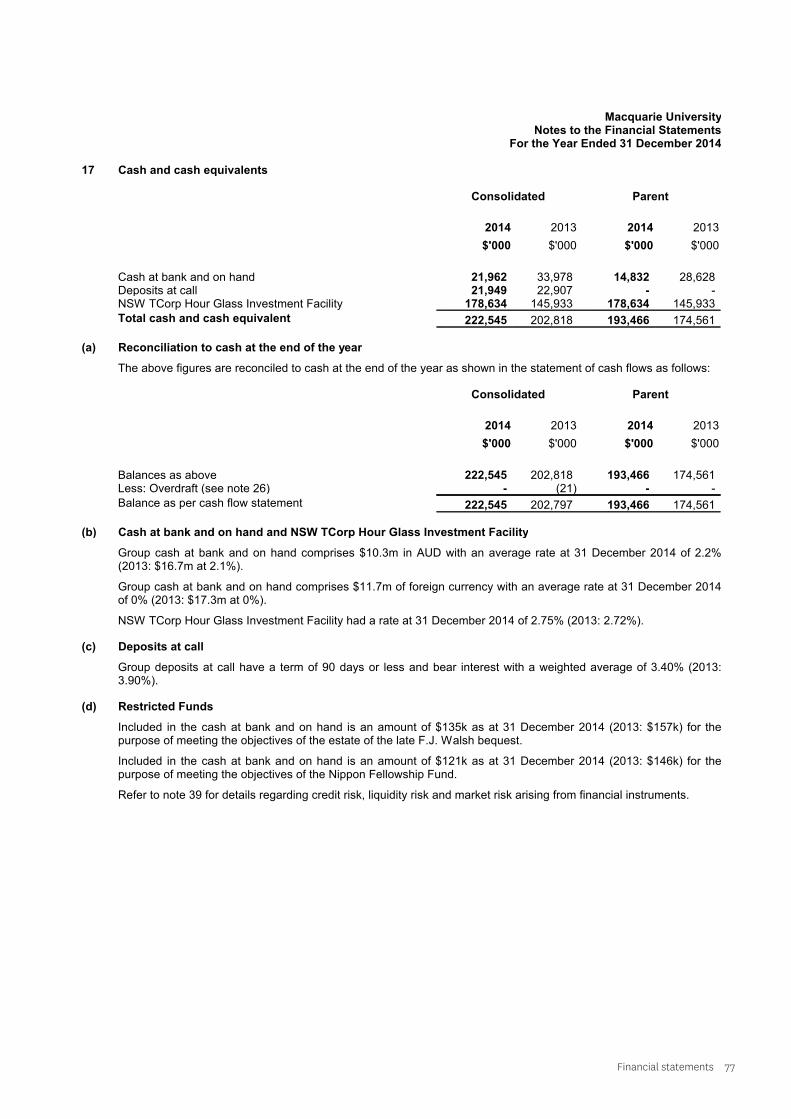
Financial statements 77
Macquarie UniversityNotes to the Financial Statements
For the Year Ended 31 December 2014
17 Cash and cash equivalents
Consolidated Parent
2014
$'000
2013
$'000
2014
$'000
2013
$'000
Cash at bank and on hand 21,962 33,978 14,832 28,628Deposits at call 21,949 22,907 - -NSW TCorp Hour Glass Investment Facility 178,634 145,933 178,634 145,933
Total cash and cash equivalent 222,545 202,818 193,466 174,561
(a) Reconciliation to cash at the end of the year
The above figures are reconciled to cash at the end of the year as shown in the statement of cash flows as follows:
Consolidated Parent
2014
$'000
2013
$'000
2014
$'000
2013
$'000
Balances as above 222,545 202,818 193,466 174,561Less: Overdraft (see note 26) - (21) - -
Balance as per cash flow statement 222,545 202,797 193,466 174,561
(b) Cash at bank and on hand and NSW TCorp Hour Glass Investment Facility
Group cash at bank and on hand comprises $10.3m in AUD with an average rate at 31 December 2014 of 2.2%(2013: $16.7m at 2.1%).
Group cash at bank and on hand comprises $11.7m of foreign currency with an average rate at 31 December 2014of 0% (2013: $17.3m at 0%).
NSW TCorp Hour Glass Investment Facility had a rate at 31 December 2014 of 2.75% (2013: 2.72%).
(c) Deposits at call
Group deposits at call have a term of 90 days or less and bear interest with a weighted average of 3.40% (2013:3.90%).
(d) Restricted Funds
Included in the cash at bank and on hand is an amount of $135k as at 31 December 2014 (2013: $157k) for thepurpose of meeting the objectives of the estate of the late F.J. Walsh bequest.
Included in the cash at bank and on hand is an amount of $121k as at 31 December 2014 (2013: $146k) for thepurpose of meeting the objectives of the Nippon Fellowship Fund.
Refer to note 39 for details regarding credit risk, liquidity risk and market risk arising from financial instruments.
25
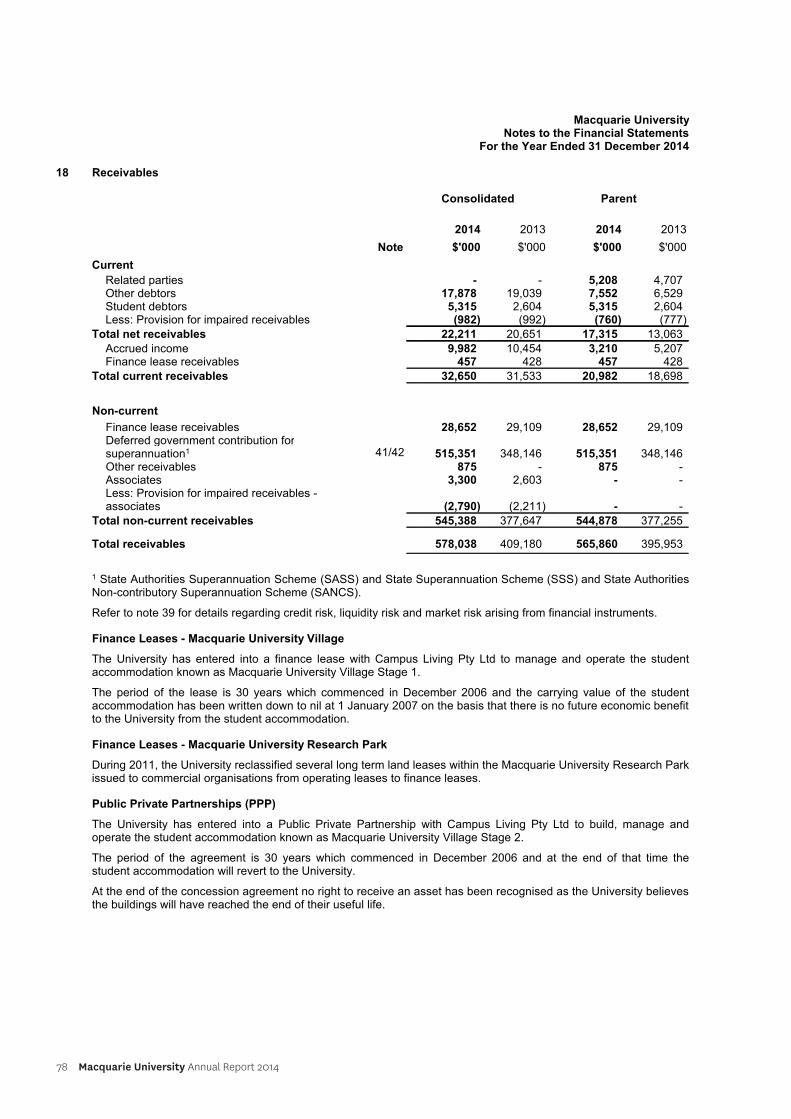
78 Macquarie University Annual Report 2014
Macquarie UniversityNotes to the Financial Statements
For the Year Ended 31 December 2014
18 Receivables
Consolidated Parent
Note
2014
$'000
2013
$'000
2014
$'000
2013
$'000
Current
Related parties - - 5,208 4,707Other debtors 17,878 19,039 7,552 6,529Student debtors 5,315 2,604 5,315 2,604Less: Provision for impaired receivables (982) (992) (760) (777)
Total net receivables 22,211 20,651 17,315 13,063
Accrued income 9,982 10,454 3,210 5,207Finance lease receivables 457 428 457 428
Total current receivables 32,650 31,533 20,982 18,698
Non-current
Finance lease receivables 28,652 29,109 28,652 29,109Deferred government contribution forsuperannuation1 41/42 515,351 348,146 515,351 348,146Other receivables 875 - 875 -Associates 3,300 2,603 - -Less: Provision for impaired receivables -associates (2,790) (2,211) - -
Total non-current receivables 545,388 377,647 544,878 377,255
Total receivables 578,038 409,180 565,860 395,953
1 State Authorities Superannuation Scheme (SASS) and State Superannuation Scheme (SSS) and State AuthoritiesNon-contributory Superannuation Scheme (SANCS).
Refer to note 39 for details regarding credit risk, liquidity risk and market risk arising from financial instruments.
Finance Leases - Macquarie University Village
The University has entered into a finance lease with Campus Living Pty Ltd to manage and operate the studentaccommodation known as Macquarie University Village Stage 1.
The period of the lease is 30 years which commenced in December 2006 and the carrying value of the studentaccommodation has been written down to nil at 1 January 2007 on the basis that there is no future economic benefitto the University from the student accommodation.
Finance Leases - Macquarie University Research Park
During 2011, the University reclassified several long term land leases within the Macquarie University Research Parkissued to commercial organisations from operating leases to finance leases.
Public Private Partnerships (PPP)
The University has entered into a Public Private Partnership with Campus Living Pty Ltd to build, manage andoperate the student accommodation known as Macquarie University Village Stage 2.
The period of the agreement is 30 years which commenced in December 2006 and at the end of that time thestudent accommodation will revert to the University.
At the end of the concession agreement no right to receive an asset has been recognised as the University believesthe buildings will have reached the end of their useful life.
26
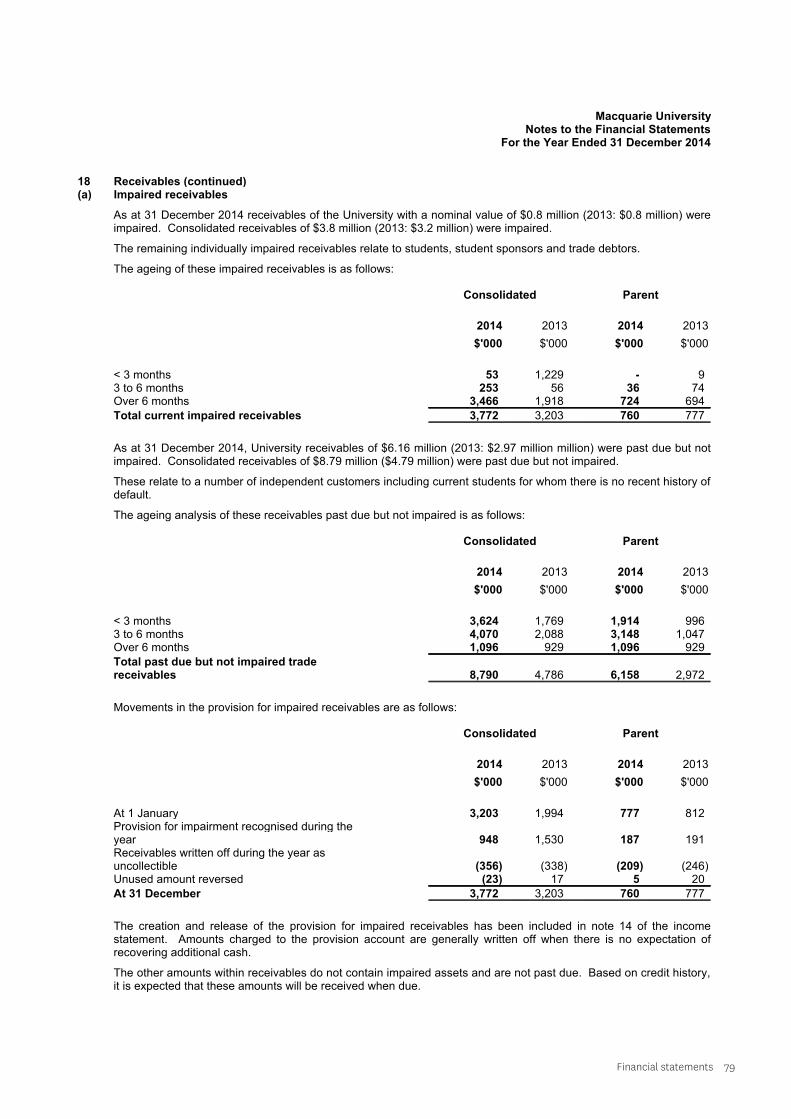
Financial statements 79
Macquarie UniversityNotes to the Financial Statements
For the Year Ended 31 December 2014
18 Receivables (continued)(a) Impaired receivables
As at 31 December 2014 receivables of the University with a nominal value of $0.8 million (2013: $0.8 million) wereimpaired. Consolidated receivables of $3.8 million (2013: $3.2 million) were impaired.
The remaining individually impaired receivables relate to students, student sponsors and trade debtors.
The ageing of these impaired receivables is as follows:
Consolidated Parent
2014
$'000
2013
$'000
2014
$'000
2013
$'000
< 3 months 53 1,229 - 93 to 6 months 253 56 36 74Over 6 months 3,466 1,918 724 694
Total current impaired receivables 3,772 3,203 760 777
As at 31 December 2014, University receivables of $6.16 million (2013: $2.97 million million) were past due but notimpaired. Consolidated receivables of $8.79 million ($4.79 million) were past due but not impaired.
These relate to a number of independent customers including current students for whom there is no recent history ofdefault.
The ageing analysis of these receivables past due but not impaired is as follows:
Consolidated Parent
2014
$'000
2013
$'000
2014
$'000
2013
$'000
< 3 months 3,624 1,769 1,914 9963 to 6 months 4,070 2,088 3,148 1,047Over 6 months 1,096 929 1,096 929
Total past due but not impaired tradereceivables 8,790 4,786 6,158 2,972
Movements in the provision for impaired receivables are as follows:
Consolidated Parent
2014
$'000
2013
$'000
2014
$'000
2013
$'000
At 1 January 3,203 1,994 777 812Provision for impairment recognised during theyear 948 1,530 187 191Receivables written off during the year asuncollectible (356) (338) (209) (246)Unused amount reversed (23) 17 5 20
At 31 December 3,772 3,203 760 777
The creation and release of the provision for impaired receivables has been included in note 14 of the incomestatement. Amounts charged to the provision account are generally written off when there is no expectation ofrecovering additional cash.
The other amounts within receivables do not contain impaired assets and are not past due. Based on credit history,it is expected that these amounts will be received when due.
27
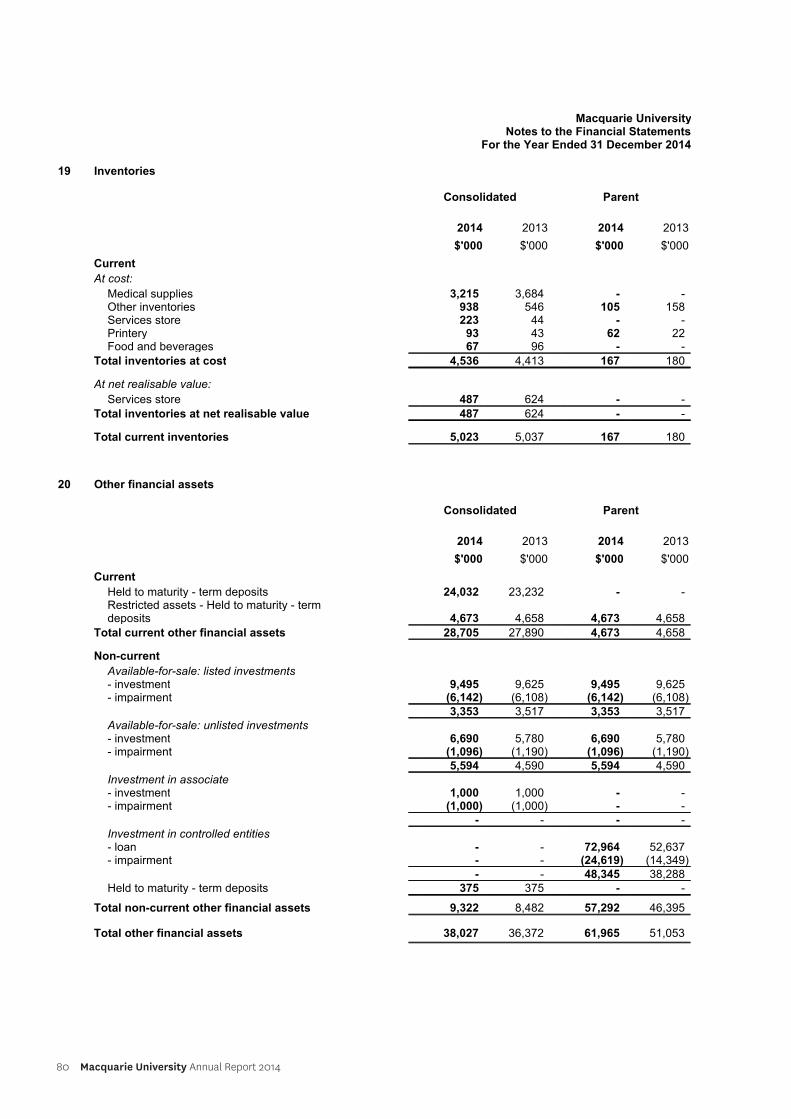
80 Macquarie University Annual Report 2014
Macquarie UniversityNotes to the Financial Statements
For the Year Ended 31 December 2014
19 Inventories
Consolidated Parent
2014
$'000
2013
$'000
2014
$'000
2013
$'000
Current
At cost:
Medical supplies 3,215 3,684 - -Other inventories 938 546 105 158Services store 223 44 - -Printery 93 43 62 22Food and beverages 67 96 - -
Total inventories at cost 4,536 4,413 167 180
At net realisable value:
Services store 487 624 - -
Total inventories at net realisable value 487 624 - -
Total current inventories 5,023 5,037 167 180
20 Other financial assets
Consolidated Parent
2014
$'000
2013
$'000
2014
$'000
2013
$'000
Current
Held to maturity - term deposits 24,032 23,232 - -Restricted assets - Held to maturity - termdeposits 4,673 4,658 4,673 4,658
Total current other financial assets 28,705 27,890 4,673 4,658
Non-current
Available-for-sale: listed investments- investment 9,495 9,625 9,495 9,625- impairment (6,142) (6,108) (6,142) (6,108)
3,353 3,517 3,353 3,517Available-for-sale: unlisted investments- investment 6,690 5,780 6,690 5,780- impairment (1,096) (1,190) (1,096) (1,190)
5,594 4,590 5,594 4,590Investment in associate - investment 1,000 1,000 - -- impairment (1,000) (1,000) - -
- - - -Investment in controlled entities- loan - - 72,964 52,637- impairment - - (24,619) (14,349)
- - 48,345 38,288Held to maturity - term deposits 375 375 - -
Total non-current other financial assets 9,322 8,482 57,292 46,395
Total other financial assets 38,027 36,372 61,965 51,053
28
Financial statements 81
Macquarie UniversityNotes to the Financial Statements
For the Year Ended 31 December 2014
20 Other financial assets (continued)
Investment in controlled entities
Since 2010 the University has offered a loan facility to a controlled entity, MUH Operations No. 2 Pty Limited, for thepurposes of providing capital and working capital start-up funds to the greenfield hospital site in pursuance of theHospital’s goal to provide the highest quality of patient care and to provide world class facilities and researchenvironments for the Hospital and the University to meet its research and teaching agenda.
During 2013, $70m of debt issued by the University to MUH Operations No. 2 Pty Limited was converted to an equityinvestment in MUH Operations No. 2 Pty Limited by issue of $70m of Class B Funding shares in consideration for$70m of debt. This equity investment is shown in note 22.
At 31 December 2014 the loan balance was $73.0m. At 31 December 2014 the 10 year evergreen facility was$120m, with $47.0m undrawn. On 4 December 2014, Macquarie University Council resolved that funds wouldcontinue to be lent to MUH Operations No. 2 Pty Limited to enable MUH Operations No. 2 Pty Limited to meet itsobligations.
At 31 December 2014 management identified indicators that the loan may be impaired. The loan investment of$73.0m was therefore assessed for impairment in accordance with AASB 139 Financial Instruments: Recognitionand Measurement.
The impairment test modelled the discounted cash flows expected to be received from MUH Operations No. 2 PtyLtd relating to the loan balance at 31 December 2014, over the expected remaining life of the loan. Inputs into themodelling included a 10 year plan reviewed by the Board of MUH Operations No. 2 Pty Ltd in December 2014, towhich management applied a number of judgements based on actual history of performance against plan by MUHOperations No. 2 Pty Ltd. The discount rate applicable to the loan as at 31 December 2014, of 4.74% (2013:4.58%), was used to discount the cash flows.
An impairment of $24.6m was determined as at 31 December 2014 (2013: $14.3m). The movement in the provisionis reflected in the income statement in note 14.
Investment in Associate
The Group holds $1.0m of Series A Preference Shares in an associate, Macquarie Medical Imaging Pty Ltd (MMI).
This investment, and $3.3m of receivables owing from MMI was assessed for impairment in accordance with AASB 139 and an impairment charge of $0.6m was made in 2014 (2013: $1.2m) bringing the closing provision at 31 December 2014 to $3.8m (2013: $3.2m). The impairment provision is applied fully against the $1.0m of Preference Shares, with the remaining provision applied against the receivable (see note 18 for details).
Restricted Assets
When the University is granted statutory funds, these funds will be used for specific purposes, however, theUniversity has the power to invest these funds in a manner to generate sufficient return on these unused funds.
Included in held to maturity term deposits is an amount of $2.7 million (2013: $2.7 million) held by the Universitysolely for the purposes of meeting the objectives of the Nippon Foundation and $2.0 million (2013: $2.0 million) forthe Numismatic Fund.
29
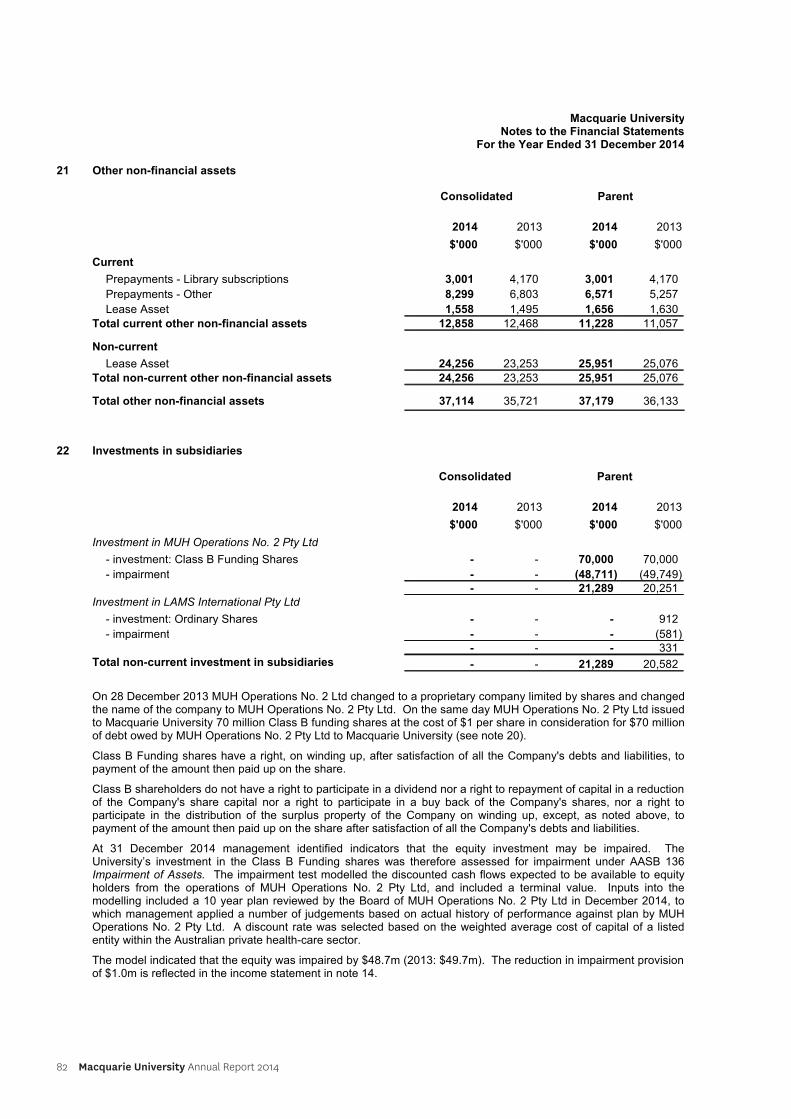
82 Macquarie University Annual Report 2014
Macquarie UniversityNotes to the Financial Statements
For the Year Ended 31 December 2014
21 Other non-financial assets
Consolidated Parent
2014
$'000
2013
$'000
2014
$'000
2013
$'000
Current
Prepayments - Library subscriptions 3,001 4,170 3,001 4,170
Prepayments - Other 8,299 6,803 6,571 5,257
Lease Asset 1,558 1,495 1,656 1,630
Total current other non-financial assets 12,858 12,468 11,228 11,057
Non-current
Lease Asset 24,256 23,253 25,951 25,076
Total non-current other non-financial assets 24,256 23,253 25,951 25,076
Total other non-financial assets 37,114 35,721 37,179 36,133
22 Investments in subsidiaries
Consolidated Parent
2014
$'000
2013
$'000
2014
$'000
2013
$'000
Investment in MUH Operations No. 2 Pty Ltd
- investment: Class B Funding Shares - - 70,000 70,000
- impairment - - (48,711) (49,749)- - 21,289 20,251
Investment in LAMS International Pty Ltd
- investment: Ordinary Shares - - - 912
- impairment - - - (581)- - - 331
Total non-current investment in subsidiaries - - 21,289 20,582
On 28 December 2013 MUH Operations No. 2 Ltd changed to a proprietary company limited by shares and changedthe name of the company to MUH Operations No. 2 Pty Ltd. On the same day MUH Operations No. 2 Pty Ltd issuedto Macquarie University 70 million Class B funding shares at the cost of $1 per share in consideration for $70 millionof debt owed by MUH Operations No. 2 Pty Ltd to Macquarie University (see note 20).
Class B Funding shares have a right, on winding up, after satisfaction of all the Company's debts and liabilities, topayment of the amount then paid up on the share.
Class B shareholders do not have a right to participate in a dividend nor a right to repayment of capital in a reductionof the Company's share capital nor a right to participate in a buy back of the Company's shares, nor a right toparticipate in the distribution of the surplus property of the Company on winding up, except, as noted above, topayment of the amount then paid up on the share after satisfaction of all the Company's debts and liabilities.
At 31 December 2014 management identified indicators that the equity investment may be impaired. TheUniversity’s investment in the Class B Funding shares was therefore assessed for impairment under AASB 136Impairment of Assets. The impairment test modelled the discounted cash flows expected to be available to equityholders from the operations of MUH Operations No. 2 Pty Ltd, and included a terminal value. Inputs into themodelling included a 10 year plan reviewed by the Board of MUH Operations No. 2 Pty Ltd in December 2014, towhich management applied a number of judgements based on actual history of performance against plan by MUHOperations No. 2 Pty Ltd. A discount rate was selected based on the weighted average cost of capital of a listedentity within the Australian private health-care sector.
The model indicated that the equity was impaired by $48.7m (2013: $49.7m). The reduction in impairment provision of $1.0m is reflected in the income statement in note 14.
30
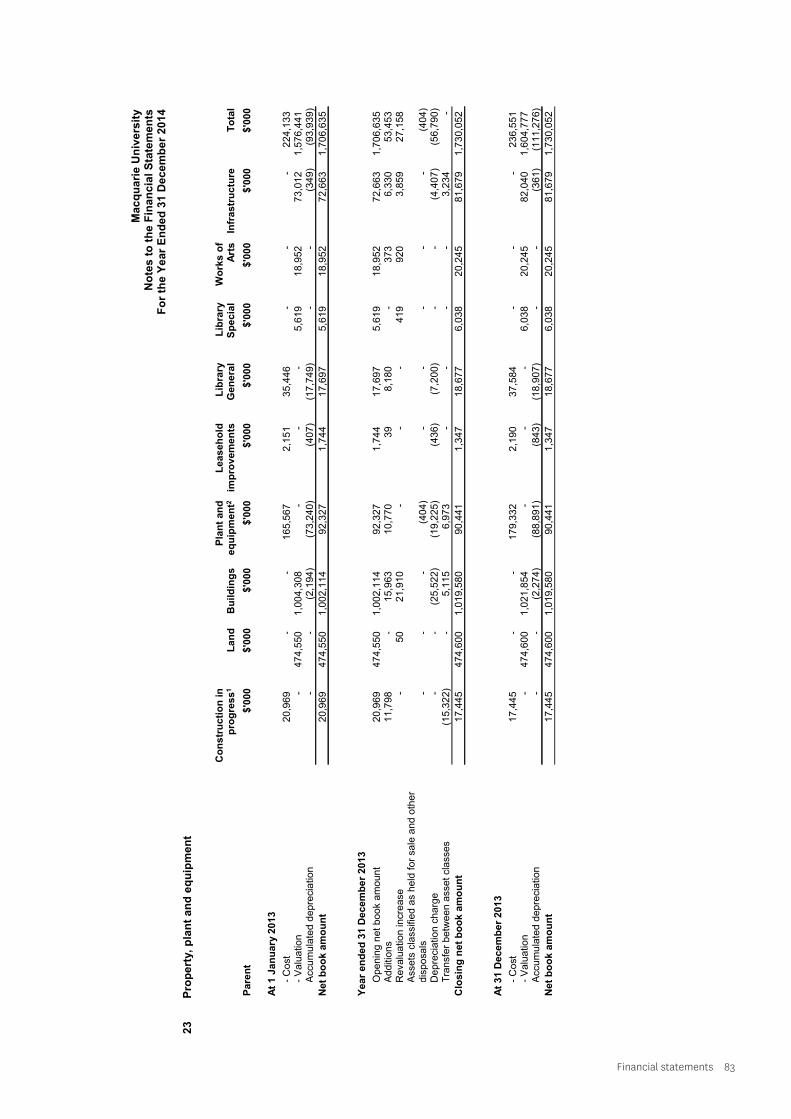
Financial statements 83
Ma
cq
ua
rie
Un
ive
rsit
yN
ote
s t
o t
he
Fin
an
cia
l S
tate
me
nts
F
or
the
Ye
ar
En
de
d 3
1 D
ec
em
be
r 2
01
4
23
Pro
pert
y,
pla
nt
an
d e
qu
ipm
en
t
Pare
nt
Co
ns
tru
cti
on
in
pro
gre
ss
1
$'0
00
Lan
d
$'0
00
Bu
ild
ing
s
$'0
00
Pla
nt
an
de
qu
ipm
en
t2
$'0
00
Leaseh
old
imp
rov
em
en
ts
$'0
00
Lib
rary
Gen
era
l
$'0
00
Lib
rary
Sp
ec
ial
$'0
00
Wo
rks
of
Art
s
$'0
00
Infr
astr
uctu
re
$'0
00
To
tal
$'0
00
At
1 J
an
ua
ry 2
013
- C
ost
20,9
69
--
165,5
67
2,1
51
35,4
46
--
-224,1
33
- V
alu
atio
n-
474,5
50
1,0
04,3
08
--
-5,6
19
18,9
52
73,0
12
1,5
76,4
41
Accu
mu
late
d d
ep
recia
tio
n-
-(2
,194)
(73,2
40)
(407)
(17,7
49)
--
(349)
(93,9
39)
Ne
t b
oo
k a
mo
un
t20,9
69
474,5
50
1,0
02,1
14
92,3
27
1,7
44
17,6
97
5,6
19
18,9
52
72,6
63
1,7
06,6
35
Year
en
ded
31 D
ecem
ber
2013
Op
en
ing
ne
t b
oo
k a
mo
un
t20,9
69
474,5
50
1,0
02,1
14
92,3
27
1,7
44
17,6
97
5,6
19
18,9
52
72,6
63
1,7
06,6
35
Ad
diti
on
s11,7
98
-15,9
63
10,7
70
39
8,1
80
-373
6,3
30
53,4
53
Reva
luatio
n in
crease
-50
21,9
10
--
-419
920
3,8
59
27,1
58
Asse
ts c
lassifie
d a
s h
eld
fo
r sa
le a
nd
oth
er
dis
po
sa
ls-
--
(404)
--
--
-(4
04)
Depre
ciatio
n c
harg
e-
-(2
5,5
22)
(19,2
25)
(436)
(7,2
00)
--
(4,4
07)
(56,7
90)
Tra
nsf
er
be
twe
en
asse
t cl
ass
es
(15,3
22)
-5,1
15
6,9
73
--
--
3,2
34
-
Clo
sin
g n
et
bo
ok
am
ou
nt
17,4
45
474,6
00
1,0
19,5
80
90,4
41
1,3
47
18,6
77
6,0
38
20,2
45
81,6
79
1,7
30,0
52
At
31 D
ecem
ber
2013
- C
ost
17,4
45
--
179,3
32
2,1
90
37,5
84
--
-236,5
51
- V
alu
atio
n-
474,6
00
1,0
21,8
54
--
-6,0
38
20,2
45
82,0
40
1,6
04,7
77
Accu
mu
late
d d
ep
recia
tio
n-
-(2
,274)
(88,8
91)
(843)
(18,9
07)
--
(361)
(111,2
76)
Ne
t b
oo
k a
mo
un
t17,4
45
474,6
00
1,0
19,5
80
90,4
41
1,3
47
18,6
77
6,0
38
20,2
45
81,6
79
1,7
30,0
52
31
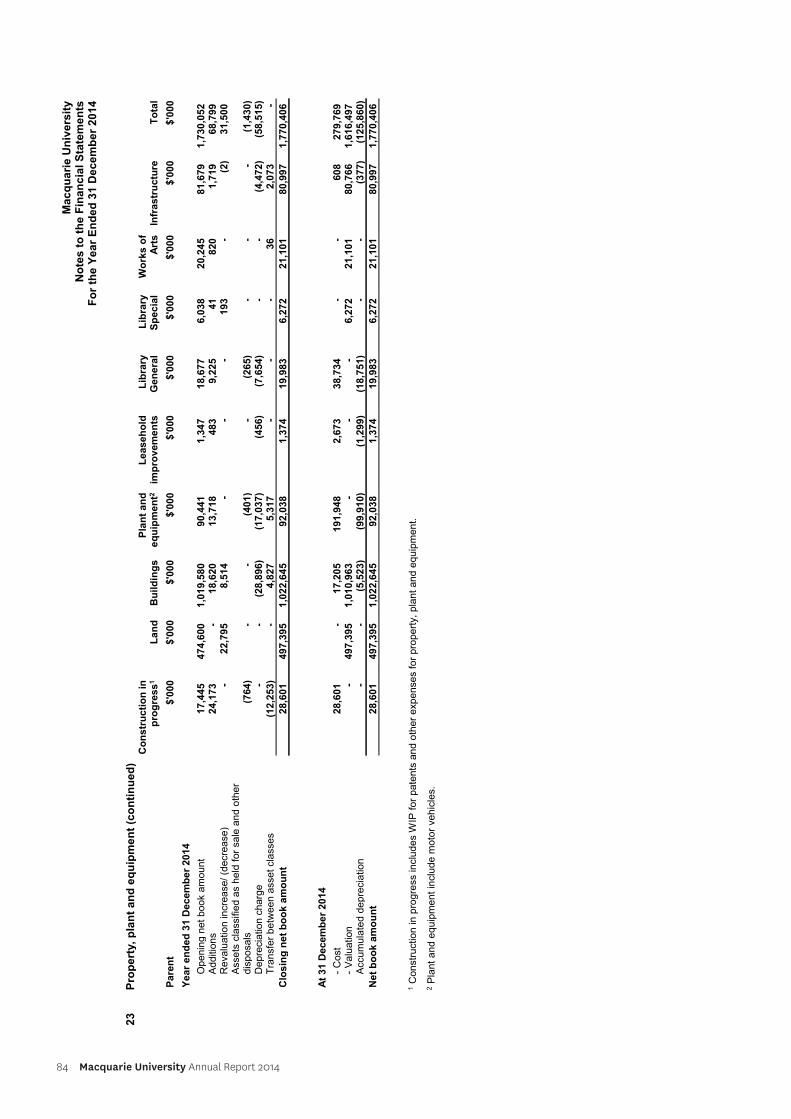
84 Macquarie University Annual Report 2014
Ma
cq
ua
rie
Un
ive
rsit
yN
ote
s t
o t
he
Fin
an
cia
l S
tate
me
nts
F
or
the
Ye
ar
En
de
d 3
1 D
ec
em
be
r 2
01
4
23
Pro
pert
y,
pla
nt
an
d e
qu
ipm
en
t (c
on
tin
ue
d)
Pare
nt
Co
ns
tru
cti
on
in
pro
gre
ss
1
$'0
00
Lan
d
$'0
00
Bu
ild
ing
s
$'0
00
Pla
nt
an
de
qu
ipm
en
t2
$'0
00
Leaseh
old
imp
rov
em
en
ts
$'0
00
Lib
rary
Gen
era
l
$'0
00
Lib
rary
Sp
ec
ial
$'0
00
Wo
rks
of
Art
s
$'0
00
Infr
astr
uctu
re
$'0
00
To
tal
$'0
00
Year
en
ded
31 D
ecem
ber
2014
Op
en
ing
ne
t b
oo
k a
mo
un
t17,4
45
474,6
00
1,0
19,5
80
90,4
41
1,3
47
18,6
77
6,0
38
20,2
45
81,6
79
1,7
30,0
52
Ad
diti
on
s24,1
73
-18,6
20
13,7
18
483
9,2
25
41
820
1,7
19
68,7
99
Reva
luatio
n in
crease
/ (d
ecr
ease
)-
22,7
95
8,5
14
--
-193
-(2
)31,5
00
Asse
ts c
lassifie
d a
s h
eld
fo
r sa
le a
nd
oth
er
dis
po
sals
(764)
--
(401)
-(2
65)
--
-(1
,430)
Depre
ciatio
n c
harg
e-
-(2
8,8
96)
(17,0
37)
(456)
(7,6
54)
--
(4,4
72)
(58,5
15)
Tra
nsf
er
be
twe
en
ass
et
cla
sse
s(1
2,2
53)
-4,8
27
5,3
17
--
-36
2,0
73
-
Clo
sin
g n
et
bo
ok
am
ou
nt
28,6
01
497,3
95
1,0
22,6
45
92,0
38
1,3
74
19,9
83
6,2
72
21,1
01
80,9
97
1,7
70,4
06
At
31 D
ecem
ber
2014
- C
ost
28,6
01
-17,2
05
191,9
48
2,6
73
38,7
34
--
608
279,7
69
- V
alu
atio
n-
497,3
95
1,0
10,9
63
--
-6,2
72
21,1
01
80,7
66
1,6
16,4
97
Accu
mu
late
d d
ep
recia
tio
n-
-(5
,523)
(99,9
10)
(1,2
99)
(18,7
51)
--
(377)
(125,8
60)
Ne
t b
oo
k a
mo
un
t28,6
01
497,3
95
1,0
22,6
45
92,0
38
1,3
74
19,9
83
6,2
72
21,1
01
80,9
97
1,7
70,4
06
1 C
on
stru
ctio
n in
pro
gre
ss in
clu
de
s W
IP f
or
pa
ten
ts a
nd
oth
er
exp
en
ses
for
pro
pe
rty,
pla
nt
an
d e
qu
ipm
en
t.
2 P
lan
t a
nd
eq
uip
me
nt
inclu
de
mo
tor
ve
hic
les.
32
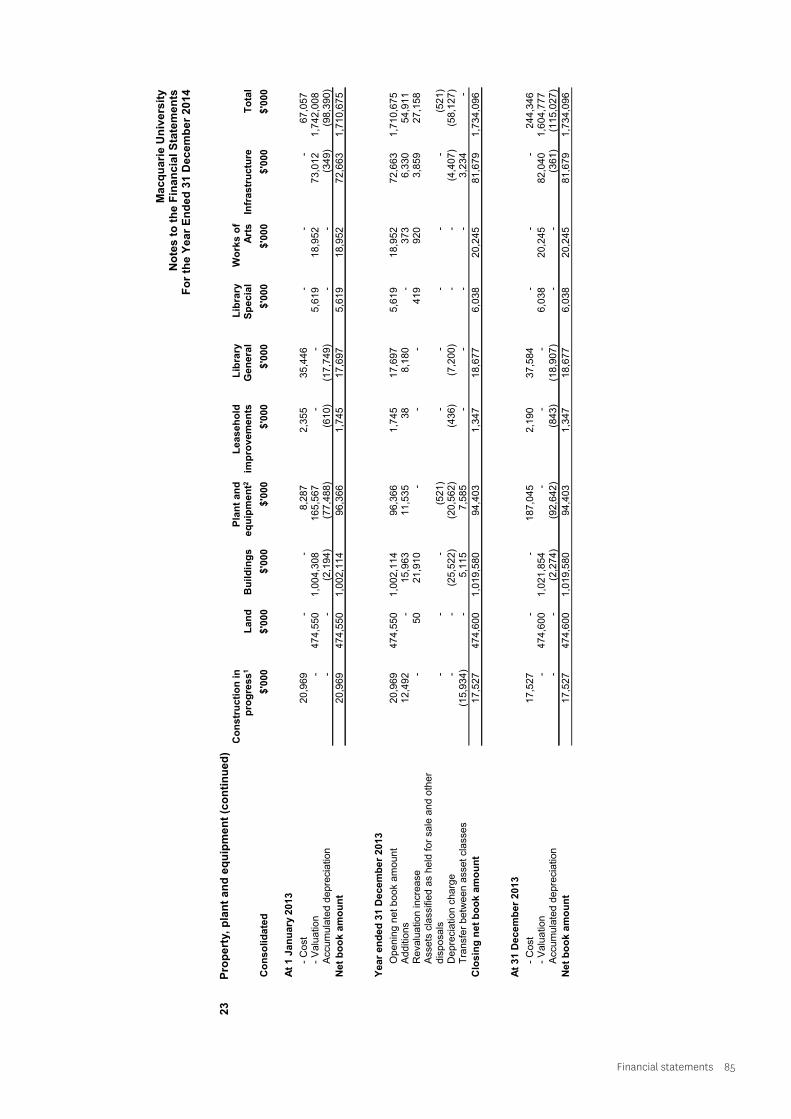
Financial statements 85
Ma
cq
ua
rie
Un
ive
rsit
yN
ote
s t
o t
he
Fin
an
cia
l S
tate
me
nts
F
or
the
Ye
ar
En
de
d 3
1 D
ec
em
be
r 2
01
4
23
Pro
pert
y,
pla
nt
an
d e
qu
ipm
en
t (c
on
tin
ue
d)
Co
nso
lid
ate
d
Co
ns
tru
cti
on
in
pro
gre
ss
1
$'0
00
Lan
d
$'0
00
Bu
ild
ing
s
$'0
00
Pla
nt
an
de
qu
ipm
en
t2
$'0
00
Leaseh
old
imp
rov
em
en
ts
$'0
00
Lib
rary
Gen
era
l
$'0
00
Lib
rary
Sp
ec
ial
$'0
00
Wo
rks
of
Art
s
$'0
00
Infr
astr
uctu
re
$'0
00
To
tal
$'0
00
At
1 J
an
ua
ry 2
013
- C
ost
20,9
69
--
8,2
87
2,3
55
35,4
46
--
-67,0
57
- V
alu
atio
n-
474,5
50
1,0
04,3
08
165,5
67
--
5,6
19
18,9
52
73,0
12
1,7
42,0
08
Accu
mu
late
d d
ep
recia
tio
n-
-(2
,194)
(77,4
88)
(610)
(17,7
49)
--
(349)
(98,3
90)
Ne
t b
oo
k a
mo
un
t20,9
69
474,5
50
1,0
02,1
14
96,3
66
1,7
45
17,6
97
5,6
19
18,9
52
72,6
63
1,7
10,6
75
Year
en
ded
31 D
ecem
ber
2013
Op
en
ing
ne
t b
oo
k a
mo
un
t20,9
69
474,5
50
1,0
02,1
14
96,3
66
1,7
45
17,6
97
5,6
19
18,9
52
72,6
63
1,7
10,6
75
Ad
diti
on
s12,4
92
-15,9
63
11,5
35
38
8,1
80
-373
6,3
30
54,9
11
Reva
luatio
n in
crease
-50
21,9
10
--
-419
920
3,8
59
27,1
58
Asse
ts c
lassifie
d a
s h
eld
fo
r sa
le a
nd
oth
er
dis
po
sals
--
-(5
21)
--
--
-(5
21)
Depre
ciatio
n c
harg
e-
-(2
5,5
22)
(20,5
62)
(436)
(7,2
00)
--
(4,4
07)
(58,1
27)
Tra
nsf
er
be
twe
en
ass
et
cla
sse
s(1
5,9
34)
-5,1
15
7,5
85
--
--
3,2
34
-
Clo
sin
g n
et
bo
ok
am
ou
nt
17,5
27
474,6
00
1,0
19,5
80
94,4
03
1,3
47
18,6
77
6,0
38
20,2
45
81,6
79
1,7
34,0
96
At
31 D
ecem
ber
2013
- C
ost
17,5
27
--
187,0
45
2,1
90
37,5
84
--
-244,3
46
- V
alu
atio
n-
474,6
00
1,0
21,8
54
--
-6,0
38
20,2
45
82,0
40
1,6
04,7
77
Accu
mu
late
d d
ep
recia
tio
n-
-(2
,274)
(92,6
42)
(843)
(18,9
07)
--
(361)
(115,0
27)
Ne
t b
oo
k a
mo
un
t17,5
27
474,6
00
1,0
19,5
80
94,4
03
1,3
47
18,6
77
6,0
38
20,2
45
81,6
79
1,7
34,0
96
33
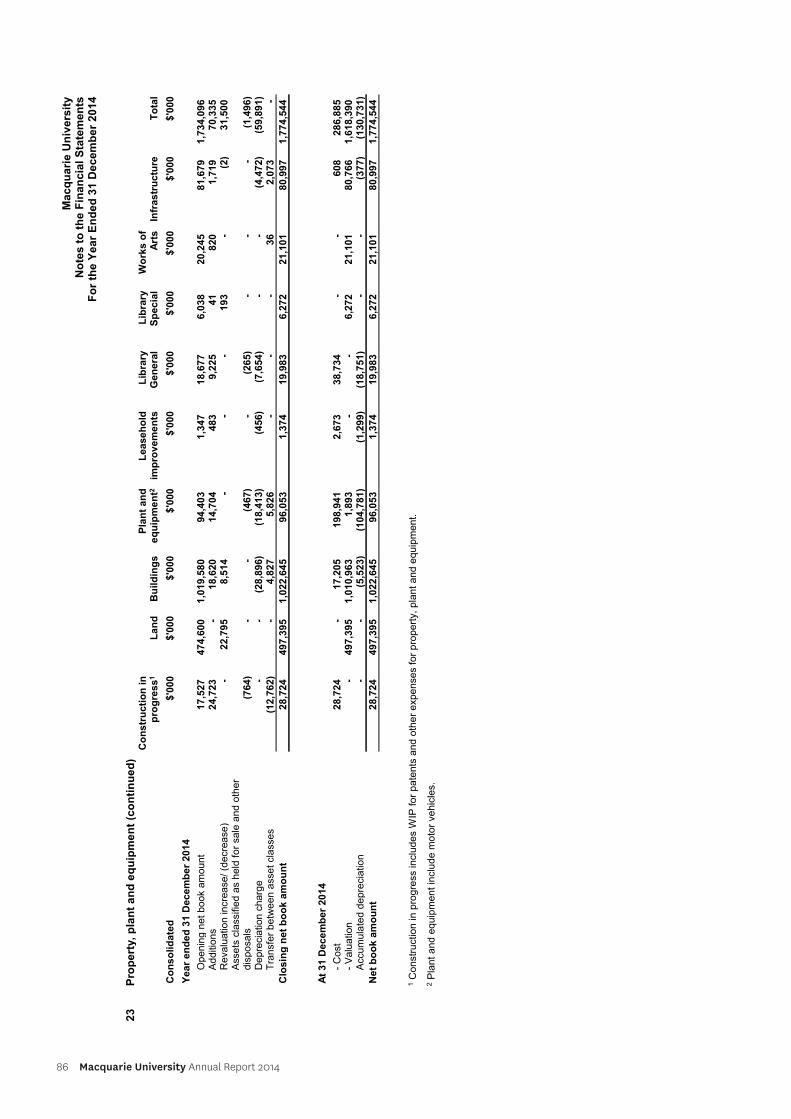
86 Macquarie University Annual Report 2014
Ma
cq
ua
rie
Un
ive
rsit
yN
ote
s t
o t
he
Fin
an
cia
l S
tate
me
nts
F
or
the
Ye
ar
En
de
d 3
1 D
ec
em
be
r 2
01
4
23
Pro
pert
y,
pla
nt
an
d e
qu
ipm
en
t (c
on
tin
ue
d)
Co
nso
lid
ate
d
Co
ns
tru
cti
on
in
pro
gre
ss
1
$'0
00
Lan
d
$'0
00
Bu
ild
ing
s
$'0
00
Pla
nt
an
de
qu
ipm
en
t2
$'0
00
Leaseh
old
imp
rov
em
en
ts
$'0
00
Lib
rary
Gen
era
l
$'0
00
Lib
rary
Sp
ec
ial
$'0
00
Wo
rks
of
Art
s
$'0
00
Infr
astr
uctu
re
$'0
00
To
tal
$'0
00
Year
en
ded
31 D
ecem
ber
2014
Op
en
ing
ne
t b
oo
k a
mo
un
t17,5
27
474,6
00
1,0
19,5
80
94,4
03
1,3
47
18,6
77
6,0
38
20,2
45
81,6
79
1,7
34,0
96
Ad
diti
on
s24,7
23
-18,6
20
14,7
04
483
9,2
25
41
820
1,7
19
70,3
35
Reva
luatio
n in
crease
/ (d
ecr
ease
)-
22,7
95
8,5
14
--
-193
-(2
)31,5
00
Asse
ts c
lassifie
d a
s h
eld
fo
r sa
le a
nd
oth
er
dis
po
sals
(764)
--
(467)
-(2
65)
--
-(1
,496)
Depre
ciatio
n c
harg
e-
-(2
8,8
96)
(18,4
13)
(456)
(7,6
54)
--
(4,4
72)
(59,8
91)
Tra
nsf
er
be
twe
en
ass
et
cla
sse
s(1
2,7
62)
-4,8
27
5,8
26
--
-36
2,0
73
-
Clo
sin
g n
et
bo
ok
am
ou
nt
28,7
24
497,3
95
1,0
22,6
45
96,0
53
1,3
74
19,9
83
6,2
72
21,1
01
80,9
97
1,7
74,5
44
At
31 D
ecem
ber
2014
- C
ost
28,7
24
-17,2
05
198,9
41
2,6
73
38,7
34
--
608
286,8
85
- V
alu
atio
n-
497,3
95
1,0
10,9
63
1,8
93
--
6,2
72
21,1
01
80,7
66
1,6
18,3
90
Accu
mu
late
d d
ep
recia
tio
n-
-(5
,523)
(104,7
81)
(1,2
99)
(18,7
51)
--
(377)
(130,7
31)
Ne
t b
oo
k a
mo
un
t28,7
24
497,3
95
1,0
22,6
45
96,0
53
1,3
74
19,9
83
6,2
72
21,1
01
80,9
97
1,7
74,5
44
1 C
on
stru
ctio
n in
pro
gre
ss in
clu
de
s W
IP f
or
pa
ten
ts a
nd
oth
er
exp
en
se
s fo
r p
rop
ert
y, p
lan
t a
nd
eq
uip
me
nt.
2 P
lan
t a
nd
eq
uip
me
nt
inclu
de
mo
tor
ve
hic
les.
34
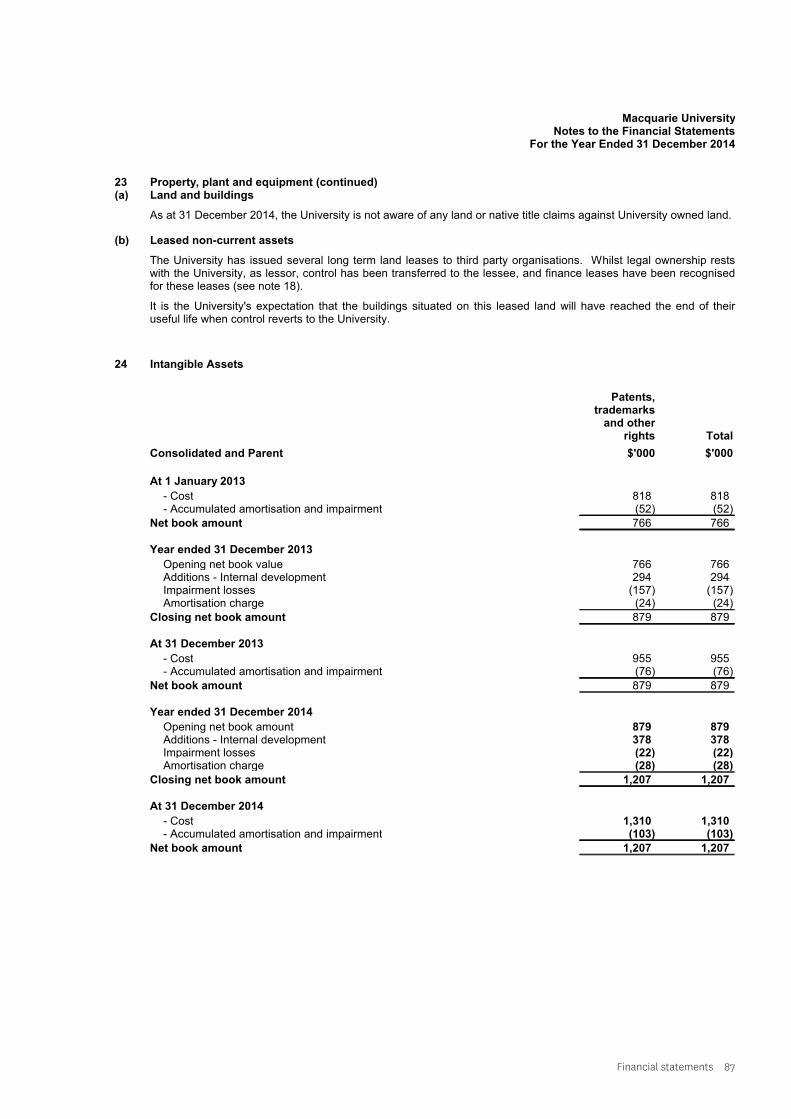
Financial statements 87
Macquarie UniversityNotes to the Financial Statements
For the Year Ended 31 December 2014
23 Property, plant and equipment (continued)(a) Land and buildings
As at 31 December 2014, the University is not aware of any land or native title claims against University owned land.
(b) Leased non-current assets
The University has issued several long term land leases to third party organisations. Whilst legal ownership restswith the University, as lessor, control has been transferred to the lessee, and finance leases have been recognisedfor these leases (see note 18).
It is the University's expectation that the buildings situated on this leased land will have reached the end of theiruseful life when control reverts to the University.
24 Intangible Assets
Consolidated and Parent
Patents,trademarks
and otherrights
$'000
Total
$'000
At 1 January 2013
- Cost 818 818- Accumulated amortisation and impairment (52) (52)
Net book amount 766 766
Year ended 31 December 2013
Opening net book value 766 766Additions - Internal development 294 294Impairment losses (157) (157)Amortisation charge (24) (24)
Closing net book amount 879 879
At 31 December 2013
- Cost 955 955- Accumulated amortisation and impairment (76) (76)
Net book amount 879 879
Year ended 31 December 2014
Opening net book amount 879 879Additions - Internal development 378 378Impairment losses (22) (22)Amortisation charge (28) (28)
Closing net book amount 1,207 1,207
At 31 December 2014
- Cost 1,310 1,310- Accumulated amortisation and impairment (103) (103)
Net book amount 1,207 1,207
35
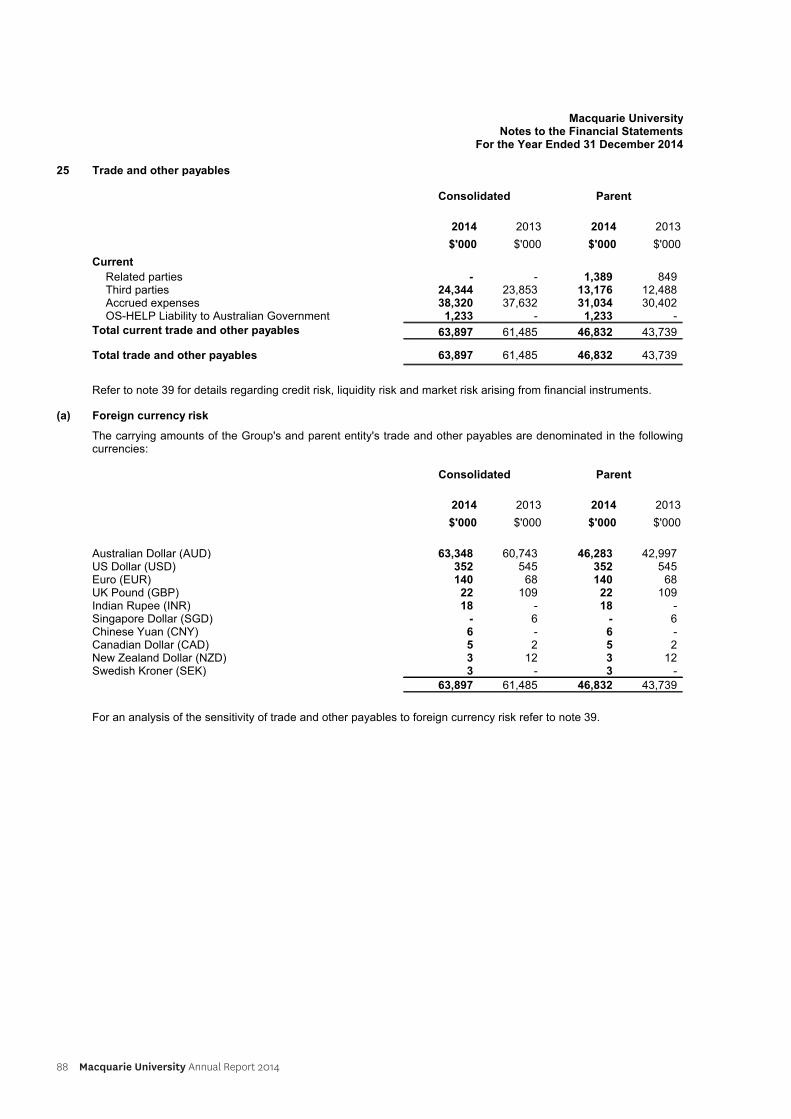
88 Macquarie University Annual Report 2014
Macquarie UniversityNotes to the Financial Statements
For the Year Ended 31 December 2014
25 Trade and other payables
Consolidated Parent
2014
$'000
2013
$'000
2014
$'000
2013
$'000
Current
Related parties - - 1,389 849Third parties 24,344 23,853 13,176 12,488Accrued expenses 38,320 37,632 31,034 30,402OS-HELP Liability to Australian Government 1,233 - 1,233 -
Total current trade and other payables 63,897 61,485 46,832 43,739
Total trade and other payables 63,897 61,485 46,832 43,739
Refer to note 39 for details regarding credit risk, liquidity risk and market risk arising from financial instruments.
(a) Foreign currency risk
The carrying amounts of the Group's and parent entity's trade and other payables are denominated in the followingcurrencies:
Consolidated Parent
2014
$'000
2013
$'000
2014
$'000
2013
$'000
Australian Dollar (AUD) 63,348 60,743 46,283 42,997US Dollar (USD) 352 545 352 545Euro (EUR) 140 68 140 68UK Pound (GBP) 22 109 22 109Indian Rupee (INR) 18 - 18 -Singapore Dollar (SGD) - 6 - 6Chinese Yuan (CNY) 6 - 6 -Canadian Dollar (CAD) 5 2 5 2New Zealand Dollar (NZD) 3 12 3 12Swedish Kroner (SEK) 3 - 3 -
63,897 61,485 46,832 43,739
For an analysis of the sensitivity of trade and other payables to foreign currency risk refer to note 39.
36
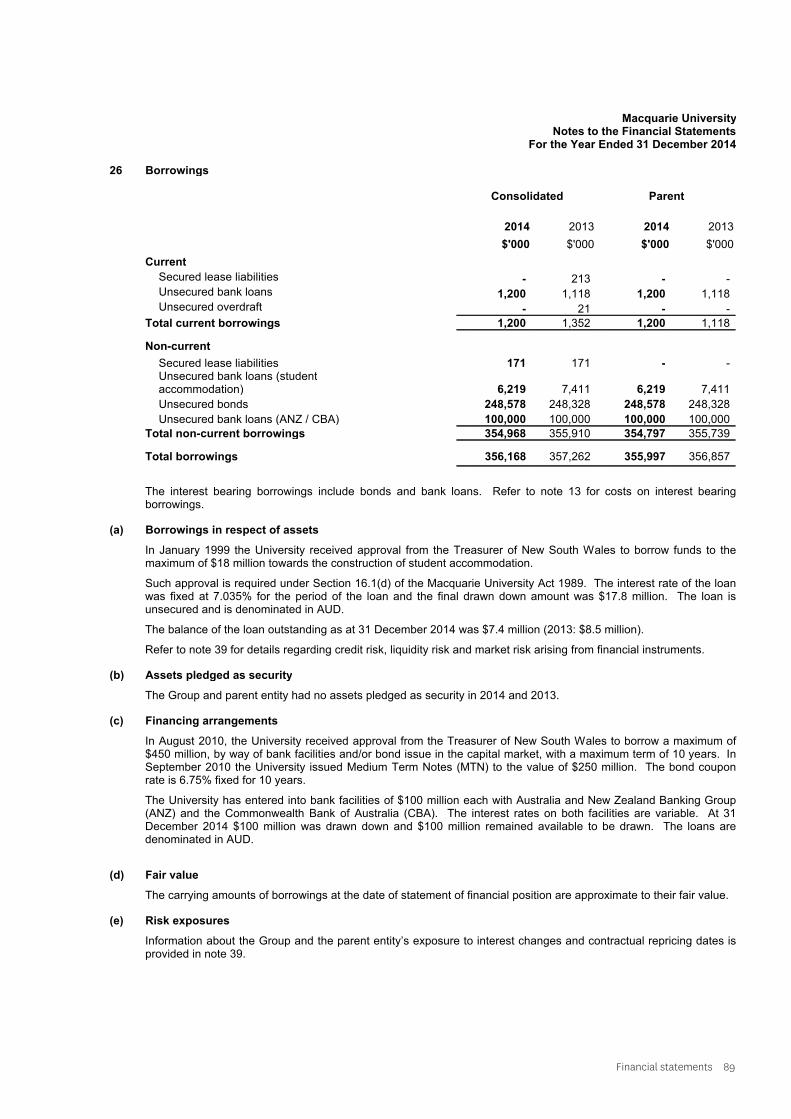
Financial statements 89
Macquarie UniversityNotes to the Financial Statements
For the Year Ended 31 December 2014
26 Borrowings
Consolidated Parent
2014
$'000
2013
$'000
2014
$'000
2013
$'000
Current
Secured lease liabilities - 213 - -Unsecured bank loans 1,200 1,118 1,200 1,118Unsecured overdraft - 21 - -
Total current borrowings 1,200 1,352 1,200 1,118
Non-current
Secured lease liabilities 171 171 - -Unsecured bank loans (studentaccommodation) 6,219 7,411 6,219 7,411
Unsecured bonds 248,578 248,328 248,578 248,328
Unsecured bank loans (ANZ / CBA) 100,000 100,000 100,000 100,000
Total non-current borrowings 354,968 355,910 354,797 355,739
Total borrowings 356,168 357,262 355,997 356,857
The interest bearing borrowings include bonds and bank loans. Refer to note 13 for costs on interest bearingborrowings.
(a) Borrowings in respect of assets
In January 1999 the University received approval from the Treasurer of New South Wales to borrow funds to themaximum of $18 million towards the construction of student accommodation.
Such approval is required under Section 16.1(d) of the Macquarie University Act 1989. The interest rate of the loanwas fixed at 7.035% for the period of the loan and the final drawn down amount was $17.8 million. The loan isunsecured and is denominated in AUD.
The balance of the loan outstanding as at 31 December 2014 was $7.4 million (2013: $8.5 million).
Refer to note 39 for details regarding credit risk, liquidity risk and market risk arising from financial instruments.
(b) Assets pledged as security
The Group and parent entity had no assets pledged as security in 2014 and 2013.
(c) Financing arrangements
In August 2010, the University received approval from the Treasurer of New South Wales to borrow a maximum of$450 million, by way of bank facilities and/or bond issue in the capital market, with a maximum term of 10 years. InSeptember 2010 the University issued Medium Term Notes (MTN) to the value of $250 million. The bond couponrate is 6.75% fixed for 10 years.
The University has entered into bank facilities of $100 million each with Australia and New Zealand Banking Group(ANZ) and the Commonwealth Bank of Australia (CBA). The interest rates on both facilities are variable. At 31December 2014 $100 million was drawn down and $100 million remained available to be drawn. The loans aredenominated in AUD.
(d) Fair value
The carrying amounts of borrowings at the date of statement of financial position are approximate to their fair value.
(e) Risk exposures
Information about the Group and the parent entity’s exposure to interest changes and contractual repricing dates isprovided in note 39.
37
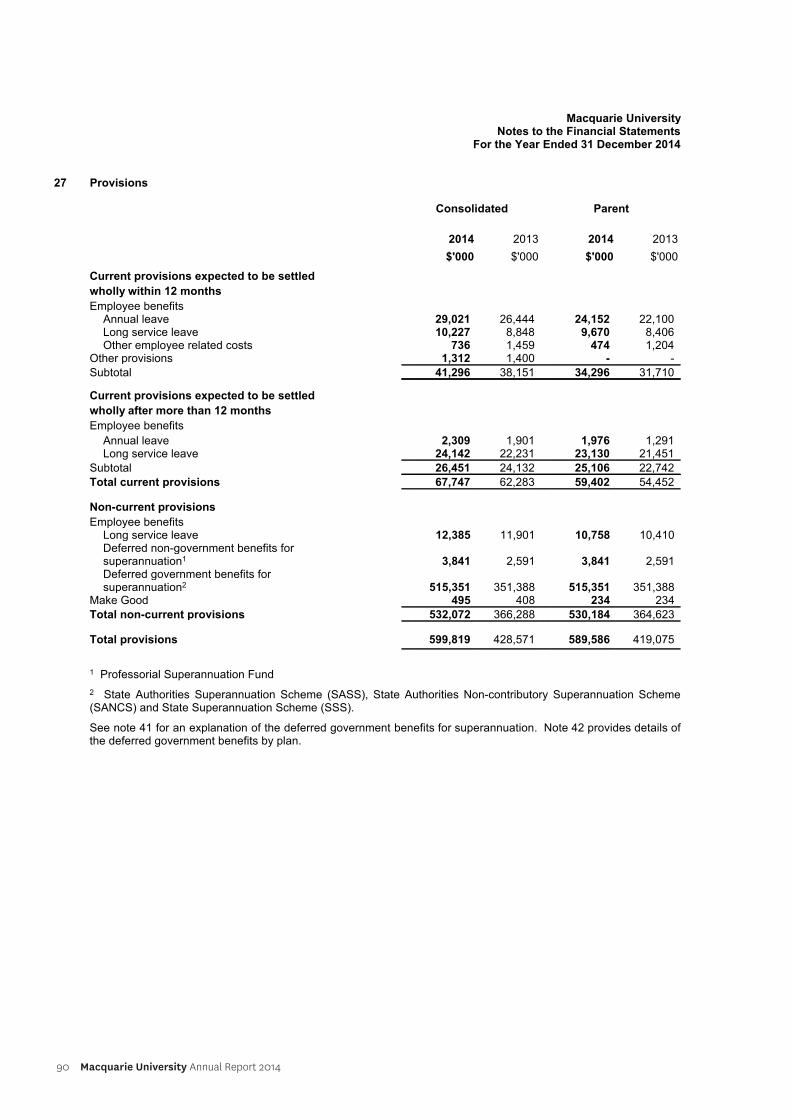
90 Macquarie University Annual Report 2014
Macquarie UniversityNotes to the Financial Statements
For the Year Ended 31 December 2014
27 Provisions
Consolidated Parent
2014
$'000
2013
$'000
2014
$'000
2013
$'000
Current provisions expected to be settled
wholly within 12 months
Employee benefitsAnnual leave 29,021 26,444 24,152 22,100Long service leave 10,227 8,848 9,670 8,406Other employee related costs 736 1,459 474 1,204
Other provisions 1,312 1,400 - -
Subtotal 41,296 38,151 34,296 31,710
Current provisions expected to be settled
wholly after more than 12 months
Employee benefits
Annual leave 2,309 1,901 1,976 1,291Long service leave 24,142 22,231 23,130 21,451
Subtotal 26,451 24,132 25,106 22,742
Total current provisions 67,747 62,283 59,402 54,452
Non-current provisions
Employee benefitsLong service leave 12,385 11,901 10,758 10,410Deferred non-government benefits forsuperannuation1 3,841 2,591 3,841 2,591Deferred government benefits forsuperannuation2 515,351 351,388 515,351 351,388
Make Good 495 408 234 234
Total non-current provisions 532,072 366,288 530,184 364,623
Total provisions 599,819 428,571 589,586 419,075
1 Professorial Superannuation Fund
2 State Authorities Superannuation Scheme (SASS), State Authorities Non-contributory Superannuation Scheme(SANCS) and State Superannuation Scheme (SSS).
See note 41 for an explanation of the deferred government benefits for superannuation. Note 42 provides details ofthe deferred government benefits by plan.
38
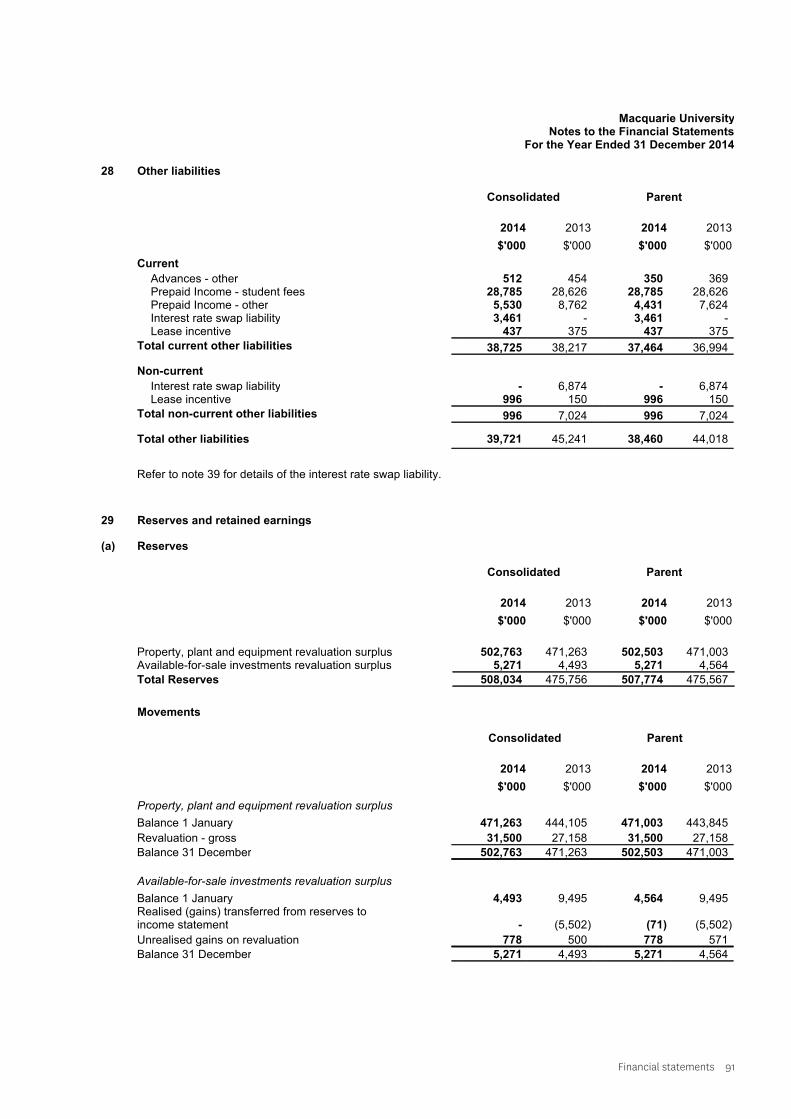
Financial statements 91
Macquarie UniversityNotes to the Financial Statements
For the Year Ended 31 December 2014
28 Other liabilities
Consolidated Parent
2014
$'000
2013
$'000
2014
$'000
2013
$'000
Current
Advances - other 512 454 350 369Prepaid Income - student fees 28,785 28,626 28,785 28,626Prepaid Income - other 5,530 8,762 4,431 7,624Interest rate swap liability 3,461 - 3,461 -Lease incentive 437 375 437 375
Total current other liabilities 38,725 38,217 37,464 36,994
Non-current
Interest rate swap liability - 6,874 - 6,874Lease incentive 996 150 996 150
Total non-current other liabilities 996 7,024 996 7,024
Total other liabilities 39,721 45,241 38,460 44,018
Refer to note 39 for details of the interest rate swap liability.
29 Reserves and retained earnings
(a) Reserves
Consolidated Parent
2014
$'000
2013
$'000
2014
$'000
2013
$'000
Property, plant and equipment revaluation surplus 502,763 471,263 502,503 471,003Available-for-sale investments revaluation surplus 5,271 4,493 5,271 4,564
Total Reserves 508,034 475,756 507,774 475,567
Movements
Consolidated Parent
2014
$'000
2013
$'000
2014
$'000
2013
$'000
Property, plant and equipment revaluation surplus
Balance 1 January 471,263 444,105 471,003 443,845
Revaluation - gross 31,500 27,158 31,500 27,158
Balance 31 December 502,763 471,263 502,503 471,003
Available-for-sale investments revaluation surplus
Balance 1 January 4,493 9,495 4,564 9,495Realised (gains) transferred from reserves toincome statement - (5,502) (71) (5,502)
Unrealised gains on revaluation 778 500 778 571
Balance 31 December 5,271 4,493 5,271 4,564
39
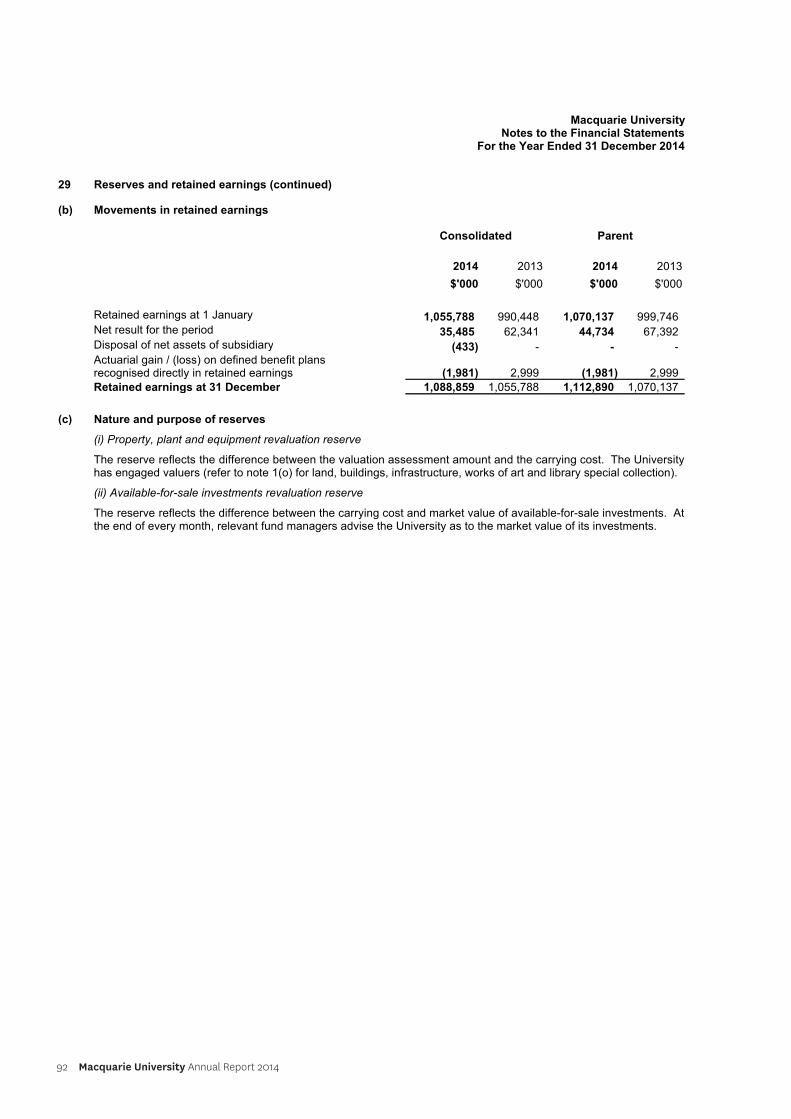
92 Macquarie University Annual Report 2014
Macquarie UniversityNotes to the Financial Statements
For the Year Ended 31 December 2014
29 Reserves and retained earnings (continued)
(b) Movements in retained earnings
Consolidated Parent
2014
$'000
2013
$'000
2014
$'000
2013
$'000
Retained earnings at 1 January 1,055,788 990,448 1,070,137 999,746Net result for the period 35,485 62,341 44,734 67,392Disposal of net assets of subsidiary (433) - - -Actuarial gain / (loss) on defined benefit plansrecognised directly in retained earnings (1,981) 2,999 (1,981) 2,999
Retained earnings at 31 December 1,088,859 1,055,788 1,112,890 1,070,137
(c) Nature and purpose of reserves
(i) Property, plant and equipment revaluation reserve
The reserve reflects the difference between the valuation assessment amount and the carrying cost. The Universityhas engaged valuers (refer to note 1(o) for land, buildings, infrastructure, works of art and library special collection).
(ii) Available-for-sale investments revaluation reserve
The reserve reflects the difference between the carrying cost and market value of available-for-sale investments. Atthe end of every month, relevant fund managers advise the University as to the market value of its investments.
40
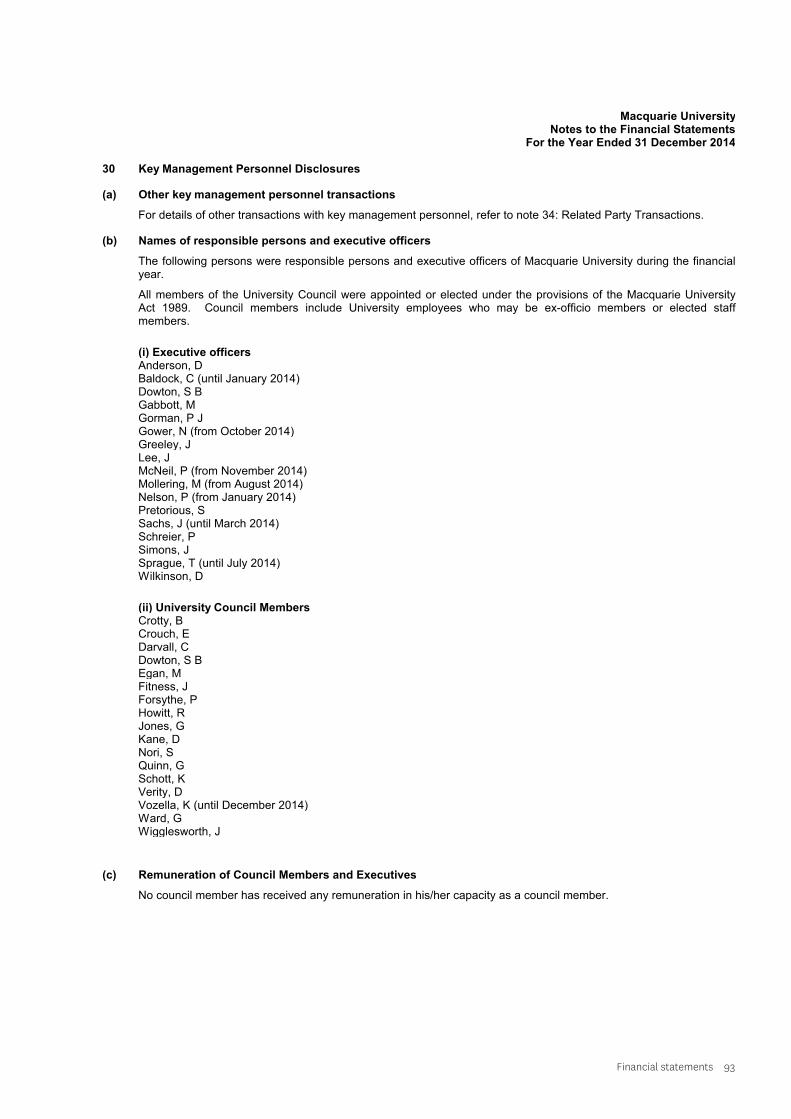
Financial statements 93
Macquarie UniversityNotes to the Financial Statements
For the Year Ended 31 December 2014
30 Key Management Personnel Disclosures
(a) Other key management personnel transactions
For details of other transactions with key management personnel, refer to note 34: Related Party Transactions.
(b) Names of responsible persons and executive officers
The following persons were responsible persons and executive officers of Macquarie University during the financialyear.
All members of the University Council were appointed or elected under the provisions of the Macquarie UniversityAct 1989. Council members include University employees who may be ex-officio members or elected staffmembers.
(i) Executive officersAnderson, DBaldock, C (until January 2014)Dowton, S BGabbott, MGorman, P JGower, N (from October 2014)Greeley, JLee, J McNeil, P (from November 2014)Mollering, M (from August 2014)Nelson, P (from January 2014)Pretorious, S Sachs, J (until March 2014)Schreier, P Simons, JSprague, T (until July 2014)Wilkinson, D
(ii) University Council MembersCrotty, B Crouch, EDarvall, CDowton, S BEgan, MFitness, JForsythe, PHowitt, RJones, GKane, DNori, SQuinn, G Schott, KVerity, DVozella, K (until December 2014)Ward, GWigglesworth, J
(c) Remuneration of Council Members and Executives
No council member has received any remuneration in his/her capacity as a council member.
41
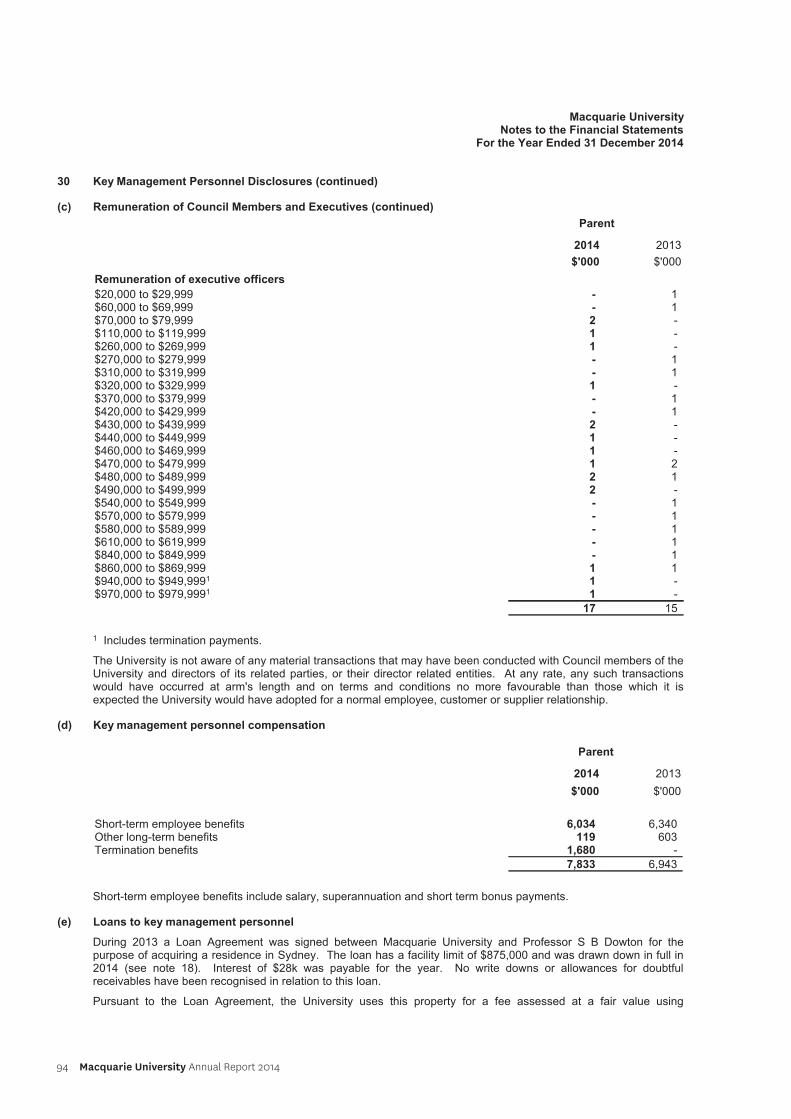
94 Macquarie University Annual Report 2014
Macquarie UniversityNotes to the Financial Statements
For the Year Ended 31 December 2014
30 Key Management Personnel Disclosures (continued)
(c) Remuneration of Council Members and Executives (continued)Parent
2014$'000
2013$'000
Remuneration of executive officers$20,000 to $29,999 - 1$60,000 to $69,999 - 1$70,000 to $79,999 2 -$110,000 to $119,999 1 -$260,000 to $269,999 1 -$270,000 to $279,999 - 1$310,000 to $319,999 - 1$320,000 to $329,999 1 -$370,000 to $379,999 - 1$420,000 to $429,999 - 1$430,000 to $439,999 2 -$440,000 to $449,999 1 -$460,000 to $469,999 1 -$470,000 to $479,999 1 2$480,000 to $489,999 2 1$490,000 to $499,999 2 -$540,000 to $549,999 - 1$570,000 to $579,999 - 1$580,000 to $589,999 - 1$610,000 to $619,999 - 1$840,000 to $849,999 - 1$860,000 to $869,999 1 1$940,000 to $949,9991 1 -$970,000 to $979,9991 1 -
17 15
1 Includes termination payments.
The University is not aware of any material transactions that may have been conducted with Council members of theUniversity and directors of its related parties, or their director related entities. At any rate, any such transactionswould have occurred at arm's length and on terms and conditions no more favourable than those which it isexpected the University would have adopted for a normal employee, customer or supplier relationship.
(d) Key management personnel compensation
Parent
2014$'000
2013$'000
Short-term employee benefits 6,034 6,340Other long-term benefits 119 603Termination benefits 1,680 -
7,833 6,943
Short-term employee benefits include salary, superannuation and short term bonus payments.
(e) Loans to key management personnel
During 2013 a Loan Agreement was signed between Macquarie University and Professor S B Dowton for thepurpose of acquiring a residence in Sydney. The loan has a facility limit of $875,000 and was drawn down in full in2014 (see note 18). Interest of $28k was payable for the year. No write downs or allowances for doubtfulreceivables have been recognised in relation to this loan.
Pursuant to the Loan Agreement, the University uses this property for a fee assessed at a fair value using
42
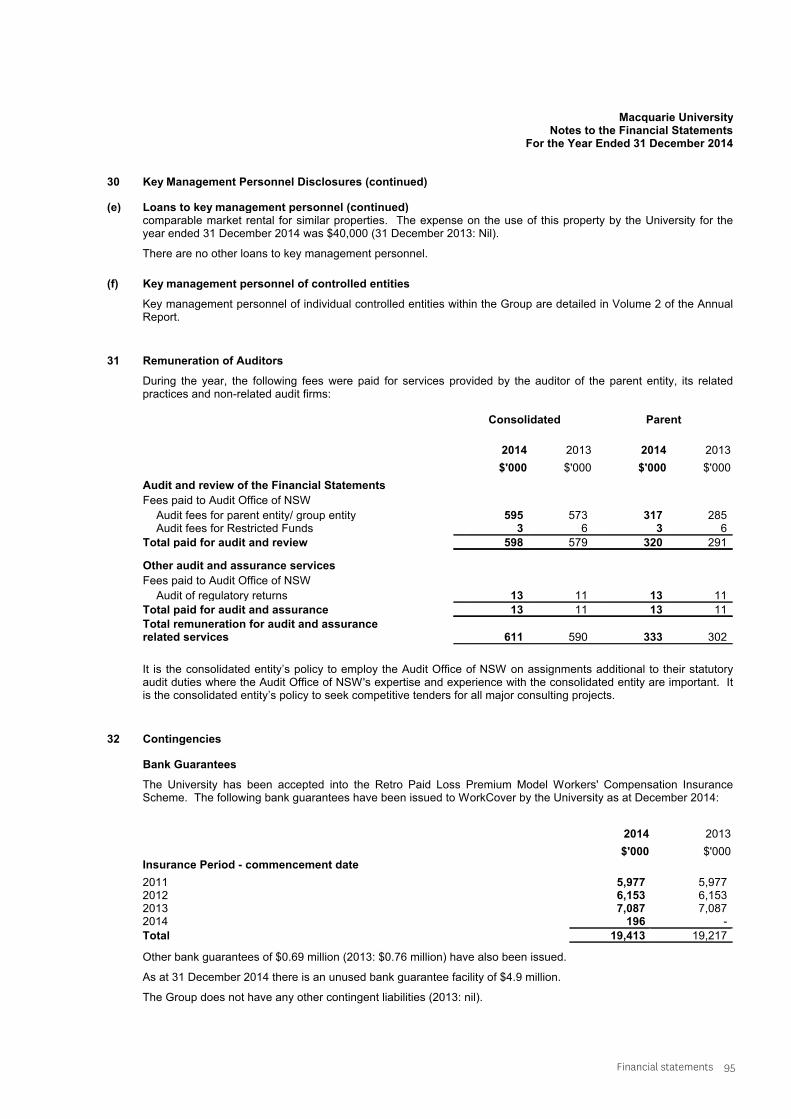
Financial statements 95
Macquarie UniversityNotes to the Financial Statements
For the Year Ended 31 December 2014
30 Key Management Personnel Disclosures (continued)
(e) Loans to key management personnel (continued)comparable market rental for similar properties. The expense on the use of this property by the University for theyear ended 31 December 2014 was $40,000 (31 December 2013: Nil).
There are no other loans to key management personnel.
(f) Key management personnel of controlled entities
Key management personnel of individual controlled entities within the Group are detailed in Volume 2 of the AnnualReport.
31 Remuneration of Auditors
During the year, the following fees were paid for services provided by the auditor of the parent entity, its relatedpractices and non-related audit firms:
Consolidated Parent
2014
$'000
2013
$'000
2014
$'000
2013
$'000
Audit and review of the Financial Statements
Fees paid to Audit Office of NSW
Audit fees for parent entity/ group entity 595 573 317 285Audit fees for Restricted Funds 3 6 3 6
Total paid for audit and review 598 579 320 291
Other audit and assurance services
Fees paid to Audit Office of NSW
Audit of regulatory returns 13 11 13 11
Total paid for audit and assurance 13 11 13 11
Total remuneration for audit and assurancerelated services 611 590 333 302
It is the consolidated entity’s policy to employ the Audit Office of NSW on assignments additional to their statutoryaudit duties where the Audit Office of NSW's expertise and experience with the consolidated entity are important. Itis the consolidated entity’s policy to seek competitive tenders for all major consulting projects.
32 Contingencies
Bank Guarantees
The University has been accepted into the Retro Paid Loss Premium Model Workers' Compensation InsuranceScheme. The following bank guarantees have been issued to WorkCover by the University as at December 2014:
Insurance Period - commencement date
2014
$'000
2013
$'000
2011 5,977 5,9772012 6,153 6,1532013 7,087 7,0872014 196 -
Total 19,413 19,217
Other bank guarantees of $0.69 million (2013: $0.76 million) have also been issued.
As at 31 December 2014 there is an unused bank guarantee facility of $4.9 million.
The Group does not have any other contingent liabilities (2013: nil).
43
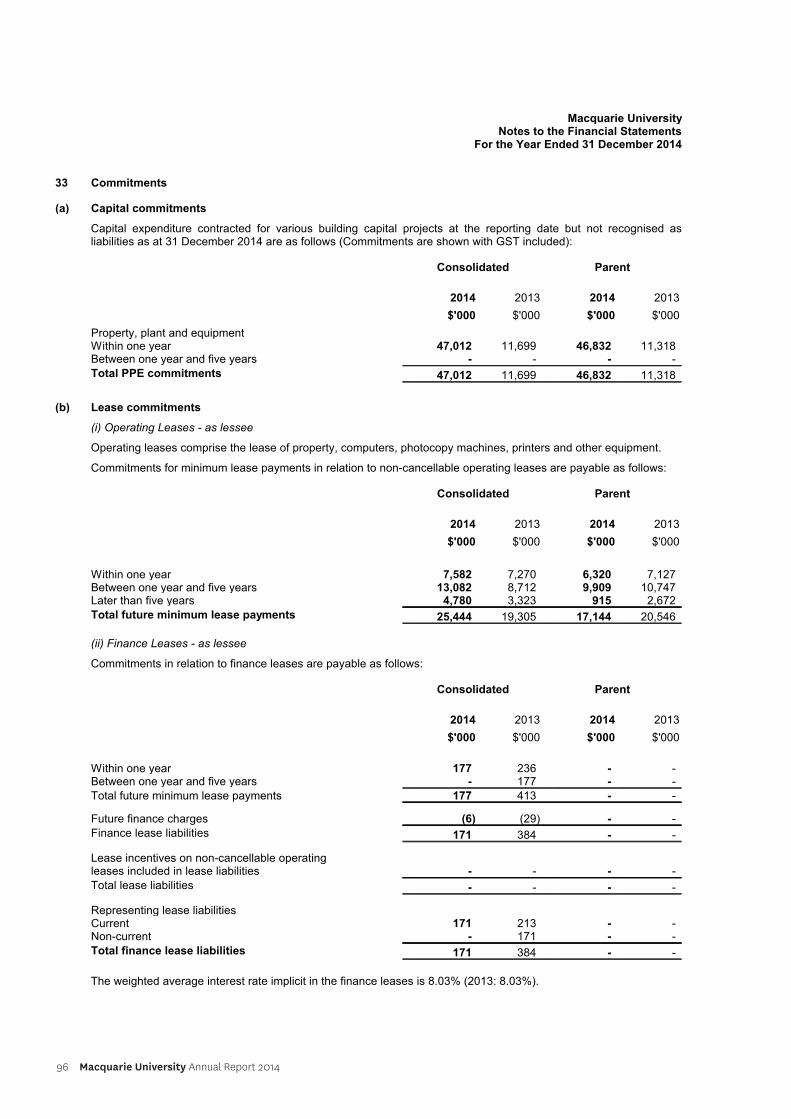
96 Macquarie University Annual Report 2014
Macquarie UniversityNotes to the Financial Statements
For the Year Ended 31 December 2014
33 Commitments
(a) Capital commitments
Capital expenditure contracted for various building capital projects at the reporting date but not recognised asliabilities as at 31 December 2014 are as follows (Commitments are shown with GST included):
Consolidated Parent
2014
$'000
2013
$'000
2014
$'000
2013
$'000
Property, plant and equipmentWithin one year 47,012 11,699 46,832 11,318Between one year and five years - - - -
Total PPE commitments 47,012 11,699 46,832 11,318
(b) Lease commitments
(i) Operating Leases - as lessee
Operating leases comprise the lease of property, computers, photocopy machines, printers and other equipment.
Commitments for minimum lease payments in relation to non-cancellable operating leases are payable as follows:
Consolidated Parent
2014
$'000
2013
$'000
2014
$'000
2013
$'000
Within one year 7,582 7,270 6,320 7,127Between one year and five years 13,082 8,712 9,909 10,747Later than five years 4,780 3,323 915 2,672
Total future minimum lease payments 25,444 19,305 17,144 20,546
(ii) Finance Leases - as lessee
Commitments in relation to finance leases are payable as follows:
Consolidated Parent
2014
$'000
2013
$'000
2014
$'000
2013
$'000
Within one year 177 236 - -Between one year and five years - 177 - -
Total future minimum lease payments 177 413 - -
Future finance charges (6) (29) - -
Finance lease liabilities 171 384 - -
Lease incentives on non-cancellable operatingleases included in lease liabilities - - - -
Total lease liabilities - - - -
Representing lease liabilitiesCurrent 171 213 - -Non-current - 171 - -
Total finance lease liabilities 171 384 - -
The weighted average interest rate implicit in the finance leases is 8.03% (2013: 8.03%).
44
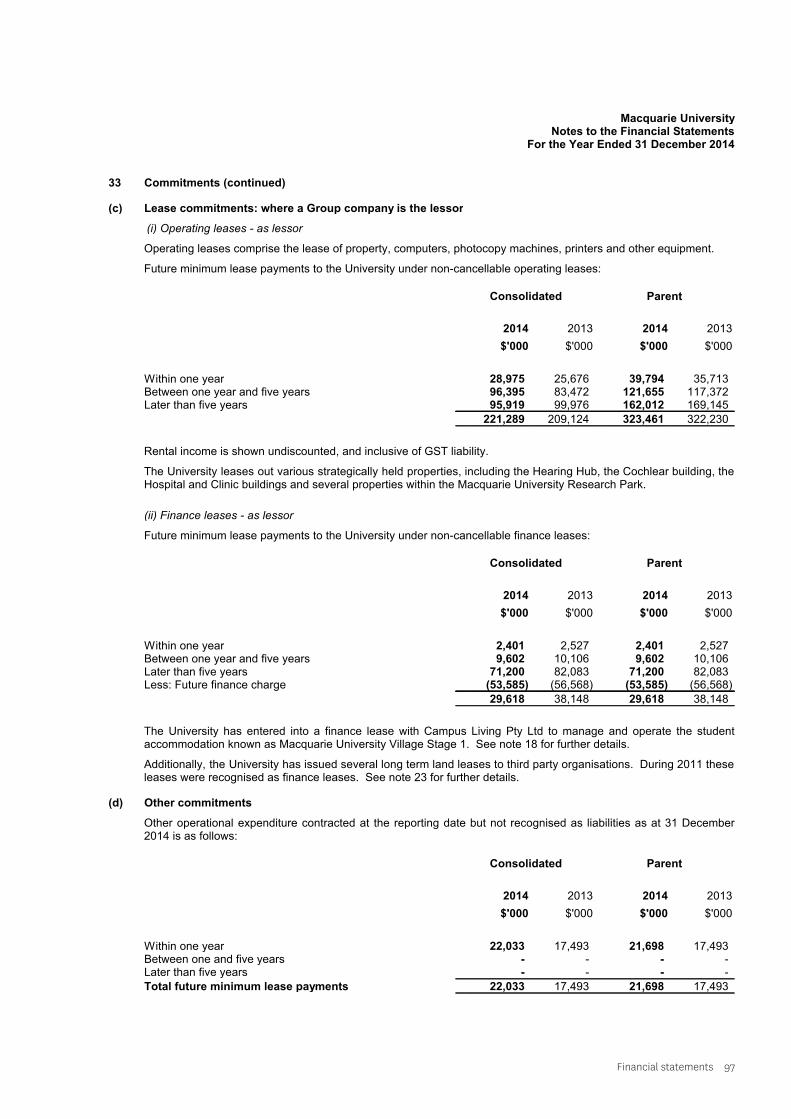
Financial statements 97
Macquarie UniversityNotes to the Financial Statements
For the Year Ended 31 December 2014
33 Commitments (continued)
(c) Lease commitments: where a Group company is the lessor
(i) Operating leases - as lessor
Operating leases comprise the lease of property, computers, photocopy machines, printers and other equipment.
Future minimum lease payments to the University under non-cancellable operating leases:
Consolidated Parent
2014
$'000
2013
$'000
2014
$'000
2013
$'000
Within one year 28,975 25,676 39,794 35,713Between one year and five years 96,395 83,472 121,655 117,372Later than five years 95,919 99,976 162,012 169,145
221,289 209,124 323,461 322,230
Rental income is shown undiscounted, and inclusive of GST liability.
The University leases out various strategically held properties, including the Hearing Hub, the Cochlear building, theHospital and Clinic buildings and several properties within the Macquarie University Research Park.
(ii) Finance leases - as lessor
Future minimum lease payments to the University under non-cancellable finance leases:
Consolidated Parent
2014
$'000
2013
$'000
2014
$'000
2013
$'000
Within one year 2,401 2,527 2,401 2,527Between one year and five years 9,602 10,106 9,602 10,106Later than five years 71,200 82,083 71,200 82,083Less: Future finance charge (53,585) (56,568) (53,585) (56,568)
29,618 38,148 29,618 38,148
The University has entered into a finance lease with Campus Living Pty Ltd to manage and operate the studentaccommodation known as Macquarie University Village Stage 1. See note 18 for further details.
Additionally, the University has issued several long term land leases to third party organisations. During 2011 theseleases were recognised as finance leases. See note 23 for further details.
(d) Other commitments
Other operational expenditure contracted at the reporting date but not recognised as liabilities as at 31 December2014 is as follows:
Consolidated Parent
2014
$'000
2013
$'000
2014
$'000
2013
$'000
Within one year 22,033 17,493 21,698 17,493Between one and five years - - - -Later than five years - - - -
Total future minimum lease payments 22,033 17,493 21,698 17,493
45
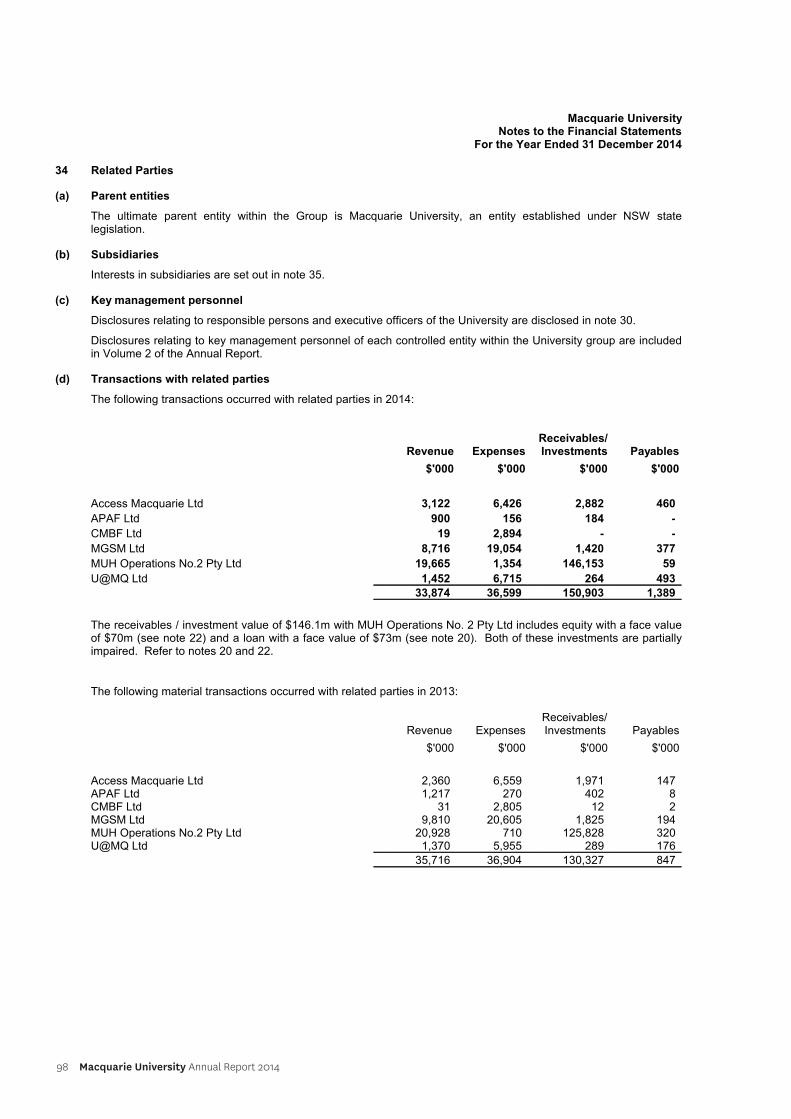
98 Macquarie University Annual Report 2014
Macquarie UniversityNotes to the Financial Statements
For the Year Ended 31 December 2014
34 Related Parties
(a) Parent entities
The ultimate parent entity within the Group is Macquarie University, an entity established under NSW statelegislation.
(b) Subsidiaries
Interests in subsidiaries are set out in note 35.
(c) Key management personnel
Disclosures relating to responsible persons and executive officers of the University are disclosed in note 30.
Disclosures relating to key management personnel of each controlled entity within the University group are includedin Volume 2 of the Annual Report.
(d) Transactions with related parties
The following transactions occurred with related parties in 2014:
Revenue
$'000
Expenses
$'000
Receivables/Investments
$'000
Payables
$'000
Access Macquarie Ltd 3,122 6,426 2,882 460
APAF Ltd 900 156 184 -
CMBF Ltd 19 2,894 - -
MGSM Ltd 8,716 19,054 1,420 377
MUH Operations No.2 Pty Ltd 19,665 1,354 146,153 59
U@MQ Ltd 1,452 6,715 264 493
33,874 36,599 150,903 1,389
The receivables / investment value of $146.1m with MUH Operations No. 2 Pty Ltd includes equity with a face valueof $70m (see note 22) and a loan with a face value of $73m (see note 20). Both of these investments are partiallyimpaired. Refer to notes 20 and 22.
The following material transactions occurred with related parties in 2013:
Revenue$'000
Expenses
$'000
Receivables/ Investments
$'000
Payables
$'000
Access Macquarie Ltd 2,360 6,559 1,971 147APAF Ltd 1,217 270 402 8CMBF Ltd 31 2,805 12 2MGSM Ltd 9,810 20,605 1,825 194MUH Operations No.2 Pty Ltd 20,928 710 125,828 320U@MQ Ltd 1,370 5,955 289 176
35,716 36,904 130,327 847
46
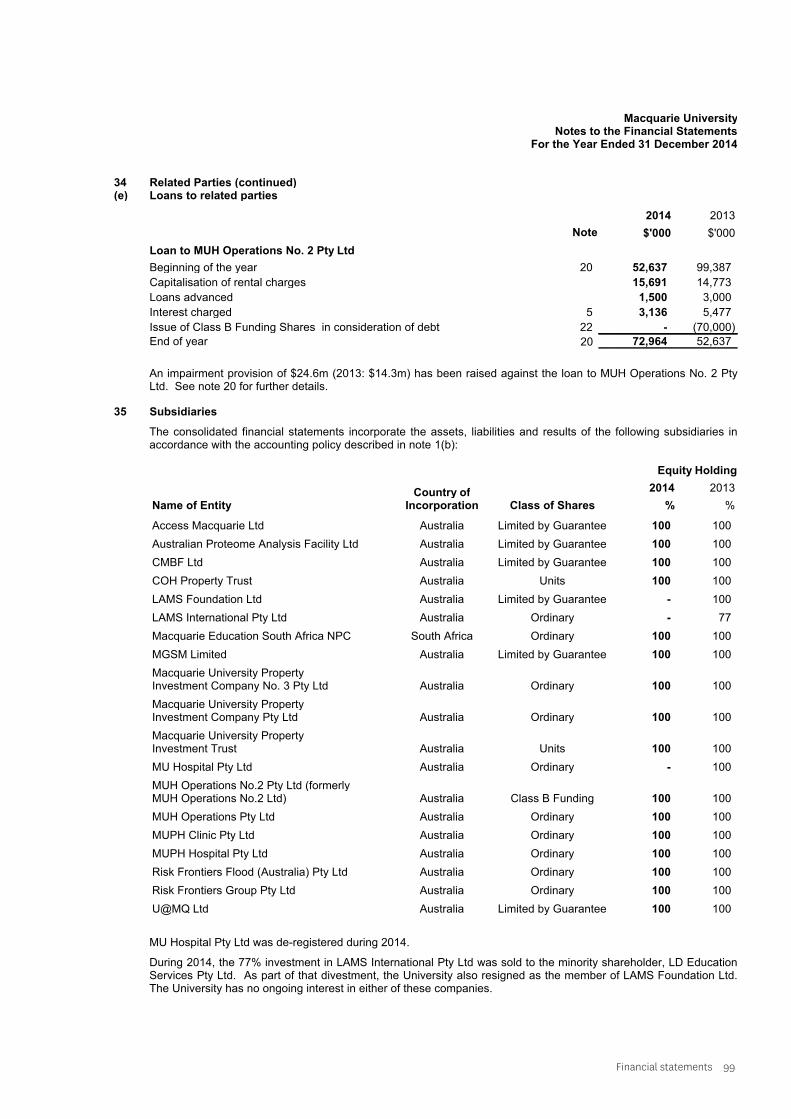
Financial statements 99
Macquarie UniversityNotes to the Financial Statements
For the Year Ended 31 December 2014
34 Related Parties (continued)(e) Loans to related parties
2014
$'000
2013
$'000
Loan to MUH Operations No. 2 Pty Ltd
Beginning of the year
Note
20 52,637 99,387
Capitalisation of rental charges 15,691 14,773
Loans advanced 1,500 3,000
Interest charged 5 3,136 5,477
Issue of Class B Funding Shares in consideration of debt
2022 - (70,000)
End of year 72,964 52,637
An impairment provision of $24.6m (2013: $14.3m) has been raised against the loan to MUH Operations No. 2 PtyLtd. See note 20 for further details.
35 Subsidiaries
The consolidated financial statements incorporate the assets, liabilities and results of the following subsidiaries inaccordance with the accounting policy described in note 1(b):
Equity Holding
Name of EntityCountry of
Incorporation Class of Shares
2014
%
2013
%
Access Macquarie Ltd Australia Limited by Guarantee 100 100
Australian Proteome Analysis Facility Ltd Australia Limited by Guarantee 100 100
CMBF Ltd Australia Limited by Guarantee 100 100
COH Property Trust Australia Units 100 100
LAMS Foundation Ltd Australia Limited by Guarantee - 100
LAMS International Pty Ltd Australia Ordinary - 77
Macquarie Education South Africa NPC South Africa Ordinary 100 100
MGSM Limited Australia Limited by Guarantee 100 100
Macquarie University PropertyInvestment Company No. 3 Pty Ltd Australia Ordinary 100 100
Macquarie University PropertyInvestment Company Pty Ltd Australia Ordinary 100 100
Macquarie University PropertyInvestment Trust Australia Units 100 100
MU Hospital Pty Ltd Australia Ordinary - 100
MUH Operations No.2 Pty Ltd (formerlyMUH Operations No.2 Ltd) Australia Class B Funding 100 100
MUH Operations Pty Ltd Australia Ordinary 100 100
MUPH Clinic Pty Ltd Australia Ordinary 100 100
MUPH Hospital Pty Ltd Australia Ordinary 100 100
Risk Frontiers Flood (Australia) Pty Ltd Australia Ordinary 100 100
Risk Frontiers Group Pty Ltd Australia Ordinary 100 100
U@MQ Ltd Australia Limited by Guarantee 100 100
MU Hospital Pty Ltd was de-registered during 2014.
During 2014, the 77% investment in LAMS International Pty Ltd was sold to the minority shareholder, LD EducationServices Pty Ltd. As part of that divestment, the University also resigned as the member of LAMS Foundation Ltd.The University has no ongoing interest in either of these companies.
47
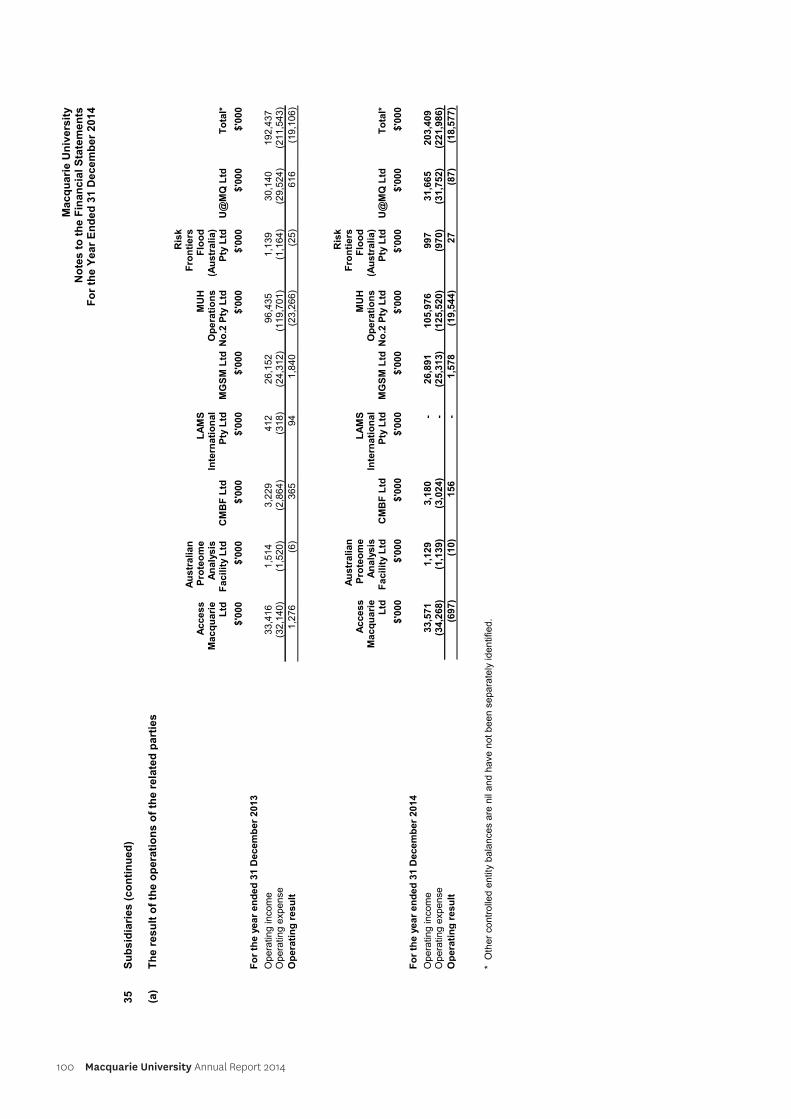
100 Macquarie University Annual Report 2014
Ma
cq
ua
rie
Un
ive
rsit
yN
ote
s t
o t
he
Fin
an
cia
l S
tate
me
nts
F
or
the
Ye
ar
En
de
d 3
1 D
ec
em
be
r 2
01
4
35
Su
bs
idia
rie
s (
co
nti
nu
ed
)
(a)
Th
e r
es
ult
of
the
op
era
tio
ns
of
the
re
late
d p
art
ies
Access
Ma
cq
ua
rie
Ltd
$'0
00
Au
str
alian
Pro
teo
me
An
aly
sis
Fa
cil
ity L
td
$'0
00
CM
BF
Ltd
$'0
00
LA
MS
Inte
rnati
on
al
Pty
Ltd
$'0
00
MG
SM
Ltd
$'0
00
MU
HO
pera
tio
ns
No
.2 P
ty L
td
$'0
00
Ris
kF
ron
tiers
Flo
od
(Au
str
alia)
Pty
Ltd
$'0
00
U@
MQ
Ltd
$'0
00
To
tal*
$'0
00
Fo
r th
e y
ear
en
ded
31 D
ecem
ber
2013
Opera
ting inco
me
33,4
16
1,5
14
3,2
29
412
26,1
52
96,4
35
1,1
39
30,1
40
192,4
37
Opera
ting e
xpense
(32,1
40)
(1,5
20)
(2,8
64)
(318)
(24,3
12)
(119,7
01)
(1,1
64)
(29,5
24)
(211,5
43)
Op
era
tin
g r
esu
lt1,2
76
(6)
365
94
1,8
40
(23,2
66)
(25)
616
(19,1
06)
Access
Ma
cq
ua
rie
Ltd
$'0
00
Au
str
alian
Pro
teo
me
An
aly
sis
Fa
cil
ity L
td
$'0
00
CM
BF
Ltd
$'0
00
LA
MS
Inte
rnati
on
al
Pty
Ltd
$'0
00
MG
SM
Ltd
$'0
00
MU
HO
pera
tio
ns
No
.2 P
ty L
td
$'0
00
Ris
kF
ron
tiers
Flo
od
(Au
str
alia)
Pty
Ltd
$'0
00
U@
MQ
Ltd
$'0
00
To
tal*
$'0
00
Fo
r th
e y
ear
en
ded
31 D
ecem
ber
2014
Opera
ting inco
me
33,5
71
1,1
29
3,1
80
-26,8
91
105,9
76
997
31,6
65
203,4
09
Opera
ting e
xpense
(34,2
68)
(1,1
39)
(3,0
24)
-(2
5,3
13)
(125,5
20)
(970)
(31,7
52)
(221,9
86)
Op
era
tin
g r
esu
lt(6
97)
(10)
156
-1,5
78
(19,5
44)
27
(87)
(18,5
77)
*O
ther
contr
olle
d e
ntit
y bala
nce
s are
nil
and h
ave
not been s
epara
tely
identif
ied.
48
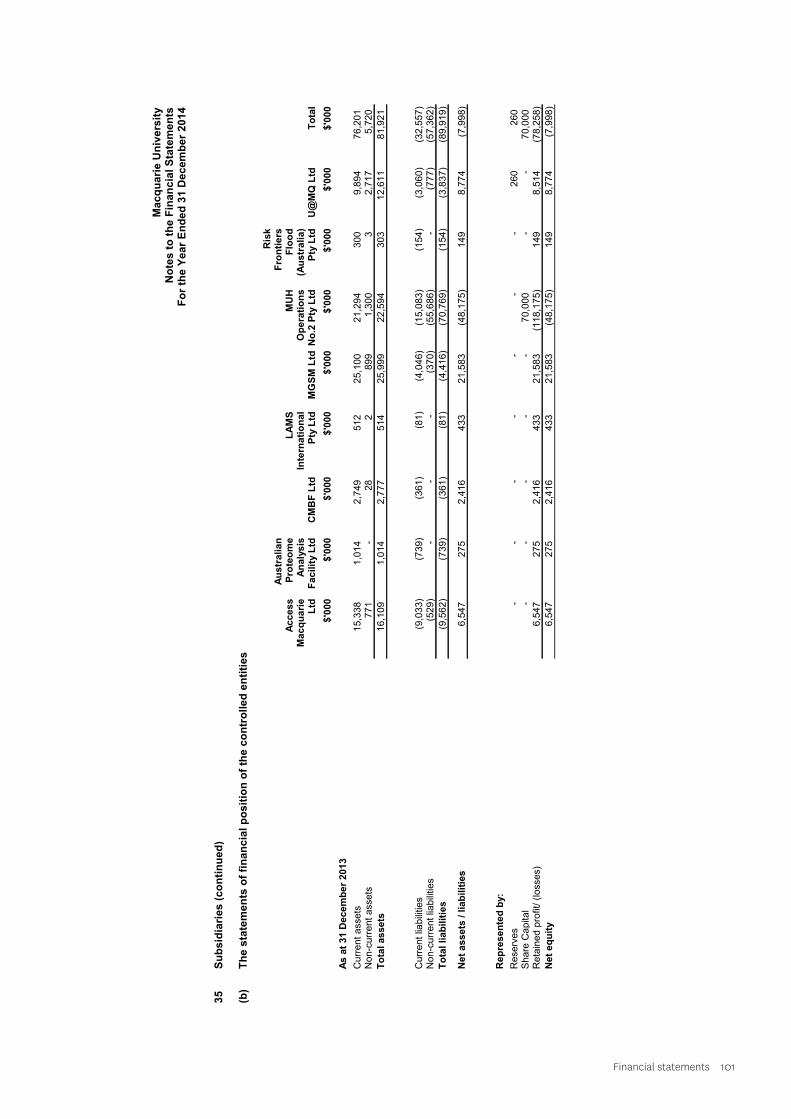
Financial statements 101
Ma
cq
ua
rie
Un
ive
rsit
yN
ote
s t
o t
he
Fin
an
cia
l S
tate
me
nts
F
or
the
Ye
ar
En
de
d 3
1 D
ec
em
be
r 2
01
4
35
Su
bs
idia
rie
s (
co
nti
nu
ed
)
(b)
Th
e s
tate
me
nts
of
fin
an
cia
l p
os
itio
n o
f th
e c
on
tro
lle
d e
nti
tie
s
Access
Ma
cq
ua
rie
Ltd
$'0
00
Au
str
alian
Pro
teo
me
An
aly
sis
Fa
cil
ity L
td
$'0
00
CM
BF
Ltd
$'0
00
LA
MS
Inte
rnati
on
al
Pty
Ltd
$'0
00
MG
SM
Ltd
$'0
00
MU
HO
pera
tio
ns
No
.2 P
ty L
td
$'0
00
Ris
kF
ron
tie
rsF
loo
d(A
ustr
alia)
Pty
Ltd
$'0
00
U@
MQ
Ltd
$'0
00
To
tal
$'0
00
As a
t 31 D
ecem
ber
2013
Cu
rre
nt
ass
ets
15,3
38
1,0
14
2,7
49
512
25,1
00
21,2
94
300
9,8
94
76,2
01
No
n-c
urr
en
t a
sse
ts771
-28
2899
1,3
00
32,7
17
5,7
20
To
tal assets
16,1
09
1,0
14
2,7
77
514
25,9
99
22,5
94
303
12,6
11
81,9
21
Curr
ent lia
bili
ties
(9,0
33)
(739)
(361)
(81)
(4,0
46)
(15,0
83)
(154)
(3,0
60)
(32,5
57)
Non-c
urr
ent lia
bili
ties
(529)
--
-(3
70)
(55,6
86)
-(7
77)
(57,3
62)
To
tal
lia
bil
itie
s(9
,562)
(739)
(361)
(81)
(4,4
16)
(70,7
69)
(154)
(3,8
37)
(89,9
19)
Ne
t a
ss
ets
/ l
iab
ilit
ies
6,5
47
275
2,4
16
433
21,5
83
(48,1
75)
149
8,7
74
(7,9
98)
R
ep
resen
ted
by:
Rese
rves
--
--
--
-260
260
Share
Capita
l-
--
--
70,0
00
--
70,0
00
Re
tain
ed
pro
fit/
(lo
sse
s)6,5
47
275
2,4
16
433
21,5
83
(118,1
75)
149
8,5
14
(78,2
58)
Net
eq
uit
y6,5
47
275
2,4
16
433
21,5
83
(48,1
75)
149
8,7
74
(7,9
98)
49
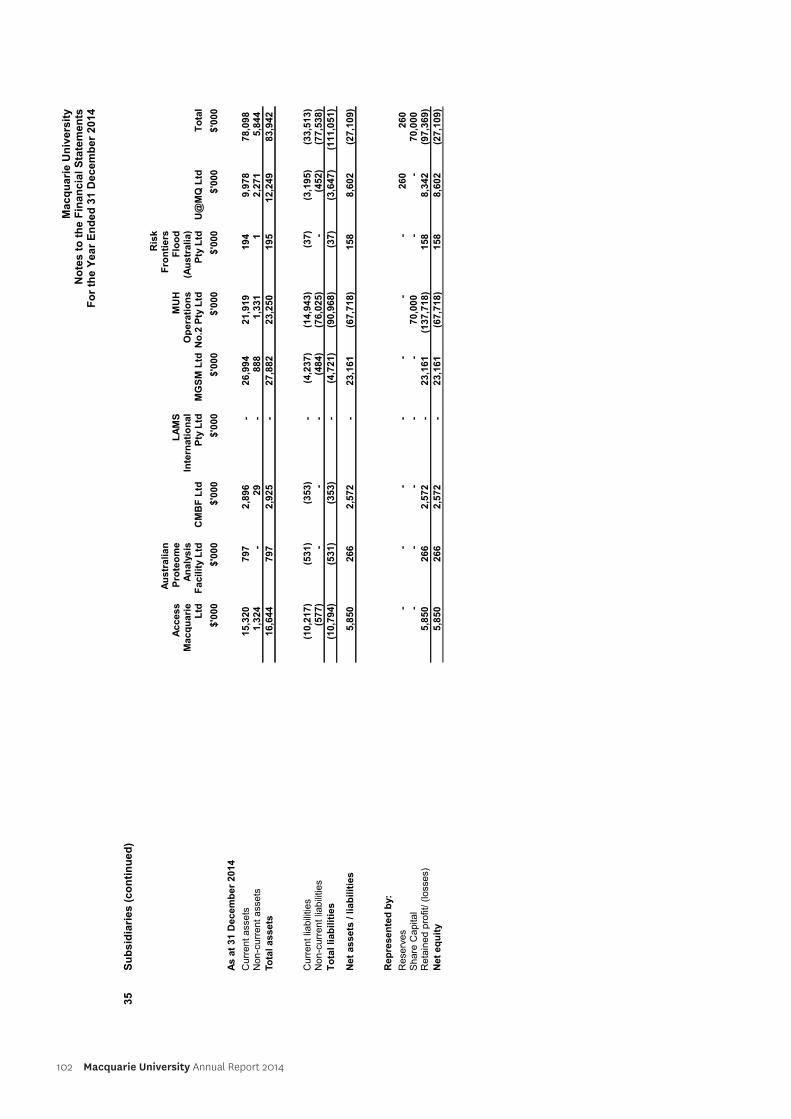
102 Macquarie University Annual Report 2014
Ma
cq
ua
rie
Un
ive
rsit
yN
ote
s t
o t
he
Fin
an
cia
l S
tate
me
nts
F
or
the
Ye
ar
En
de
d 3
1 D
ec
em
be
r 2
01
4
35
Su
bs
idia
rie
s (
co
nti
nu
ed
)
Access
Ma
cq
ua
rie
Ltd
$'0
00
Au
str
alian
Pro
teo
me
An
aly
sis
Fa
cil
ity L
td
$'0
00
CM
BF
Ltd
$'0
00
LA
MS
Inte
rnati
on
al
Pty
Ltd
$'0
00
MG
SM
Ltd
$'0
00
MU
HO
pera
tio
ns
No
.2 P
ty L
td
$'0
00
Ris
kF
ron
tiers
Flo
od
(Au
str
alia)
Pty
Ltd
$'0
00
U@
MQ
Ltd
$'0
00
To
tal
$'0
00
As a
t 31 D
ecem
ber
2014
Curr
ent ass
ets
15,3
20
797
2,8
96
-26,9
94
21,9
19
194
9,9
78
78,0
98
Non-c
urr
ent ass
ets
1,3
24
-29
-888
1,3
31
12,2
71
5,8
44
To
tal assets
16,6
44
797
2,9
25
-27,8
82
23,2
50
195
12,2
49
83,9
42
Curr
ent lia
bili
ties
(10,2
17)
(531)
(353)
-(4
,237)
(14,9
43)
(37)
(3,1
95)
(33,5
13)
Non-c
urr
ent lia
bili
ties
(577)
--
-(4
84)
(76,0
25)
-(4
52)
(77,5
38)
To
tal
lia
bil
itie
s(1
0,7
94)
(531)
(353)
-(4
,721)
(90,9
68)
(37)
(3,6
47)
(111,0
51)
Net
assets
/ lia
bilit
ies
5,8
50
266
2,5
72
-23,1
61
(67,7
18)
158
8,6
02
(27,1
09)
Rep
resen
ted
by:
Rese
rves
--
--
--
-260
260
Share
Capita
l-
--
--
70,0
00
--
70,0
00
Reta
ined p
rofit
/ (loss
es)
5,8
50
266
2,5
72
-23,1
61
(137,7
18)
158
8,3
42
(97,3
69)
Net
eq
uit
y5,8
50
266
2,5
72
-23,1
61
(67,7
18)
158
8,6
02
(27,1
09)
50
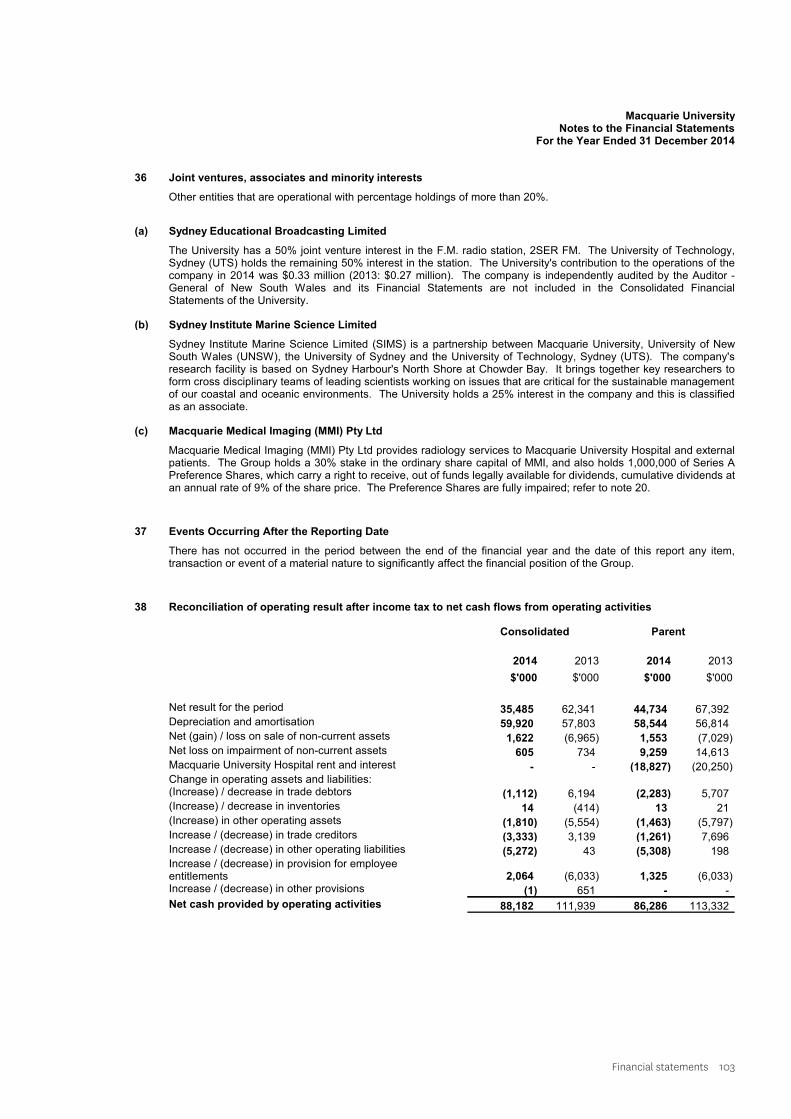
Financial statements 103
Macquarie UniversityNotes to the Financial Statements
For the Year Ended 31 December 2014
36 Joint ventures, associates and minority interests
Other entities that are operational with percentage holdings of more than 20%.
(a) Sydney Educational Broadcasting Limited
The University has a 50% joint venture interest in the F.M. radio station, 2SER FM. The University of Technology,Sydney (UTS) holds the remaining 50% interest in the station. The University's contribution to the operations of thecompany in 2014 was $0.33 million (2013: $0.27 million). The company is independently audited by the Auditor -General of New South Wales and its Financial Statements are not included in the Consolidated FinancialStatements of the University.
(b) Sydney Institute Marine Science Limited
Sydney Institute Marine Science Limited (SIMS) is a partnership between Macquarie University, University of NewSouth Wales (UNSW), the University of Sydney and the University of Technology, Sydney (UTS). The company'sresearch facility is based on Sydney Harbour's North Shore at Chowder Bay. It brings together key researchers toform cross disciplinary teams of leading scientists working on issues that are critical for the sustainable managementof our coastal and oceanic environments. The University holds a 25% interest in the company and this is classifiedas an associate.
(c) Macquarie Medical Imaging (MMI) Pty Ltd
Macquarie Medical Imaging (MMI) Pty Ltd provides radiology services to Macquarie University Hospital and externalpatients. The Group holds a 30% stake in the ordinary share capital of MMI, and also holds 1,000,000 of Series APreference Shares, which carry a right to receive, out of funds legally available for dividends, cumulative dividends atan annual rate of 9% of the share price. The Preference Shares are fully impaired; refer to note 20.
37 Events Occurring After the Reporting Date
There has not occurred in the period between the end of the financial year and the date of this report any item,transaction or event of a material nature to significantly affect the financial position of the Group.
38 Reconciliation of operating result after income tax to net cash flows from operating activities
Consolidated Parent
2014
$'000
2013
$'000
2014
$'000
2013
$'000
Net result for the period 35,485 62,341 44,734 67,392Depreciation and amortisation 59,920 57,803 58,544 56,814Net (gain) / loss on sale of non-current assets 1,622 (6,965) 1,553 (7,029)Net loss on impairment of non-current assets 605 734 9,259 14,613Macquarie University Hospital rent and interest - - (18,827) (20,250)Change in operating assets and liabilities:(Increase) / decrease in trade debtors (1,112) 6,194 (2,283) 5,707(Increase) / decrease in inventories 14 (414) 13 21(Increase) in other operating assets (1,810) (5,554) (1,463) (5,797)Increase / (decrease) in trade creditors (3,333) 3,139 (1,261) 7,696Increase / (decrease) in other operating liabilities (5,272) 43 (5,308) 198Increase / (decrease) in provision for employeeentitlements 2,064 (6,033) 1,325 (6,033)Increase / (decrease) in other provisions (1) 651 - -
Net cash provided by operating activities 88,182 111,939 86,286 113,332
51
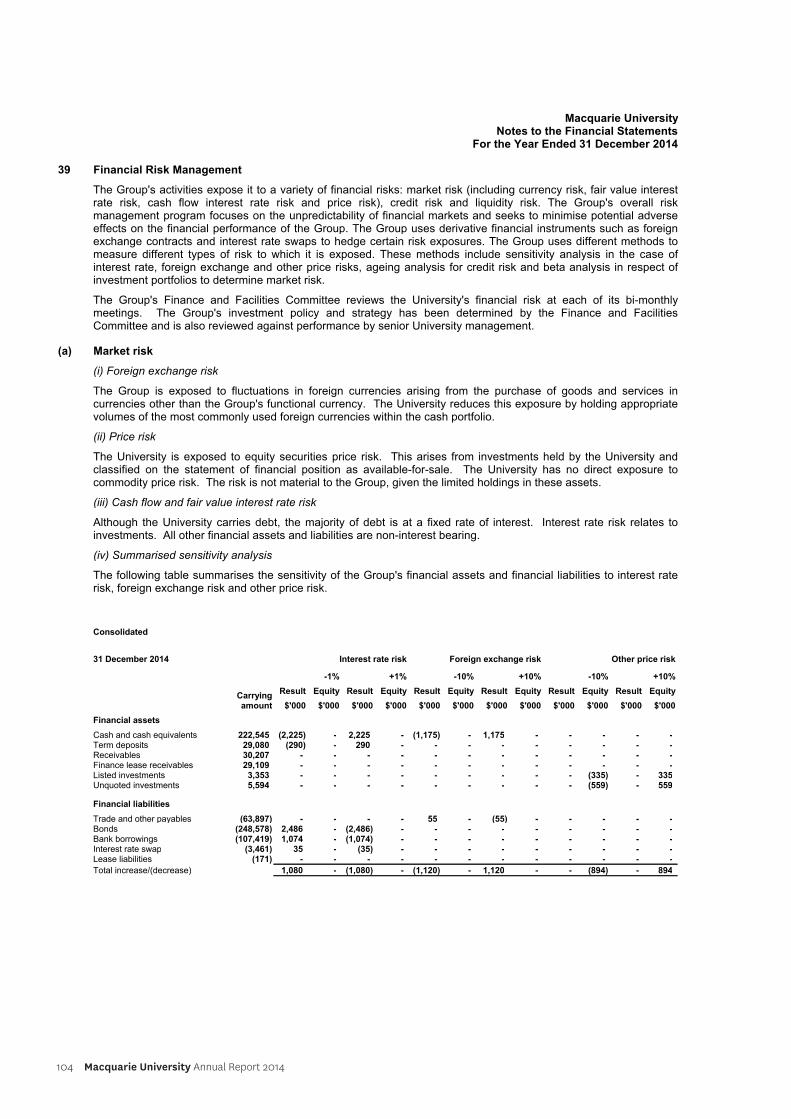
104 Macquarie University Annual Report 2014
Macquarie UniversityNotes to the Financial Statements
For the Year Ended 31 December 2014
39 Financial Risk Management
The Group's activities expose it to a variety of financial risks: market risk (including currency risk, fair value interestrate risk, cash flow interest rate risk and price risk), credit risk and liquidity risk. The Group's overall riskmanagement program focuses on the unpredictability of financial markets and seeks to minimise potential adverseeffects on the financial performance of the Group. The Group uses derivative financial instruments such as foreignexchange contracts and interest rate swaps to hedge certain risk exposures. The Group uses different methods tomeasure different types of risk to which it is exposed. These methods include sensitivity analysis in the case ofinterest rate, foreign exchange and other price risks, ageing analysis for credit risk and beta analysis in respect ofinvestment portfolios to determine market risk.
The Group's Finance and Facilities Committee reviews the University's financial risk at each of its bi-monthlymeetings. The Group's investment policy and strategy has been determined by the Finance and FacilitiesCommittee and is also reviewed against performance by senior University management.
(a) Market risk
(i) Foreign exchange risk
The Group is exposed to fluctuations in foreign currencies arising from the purchase of goods and services incurrencies other than the Group's functional currency. The University reduces this exposure by holding appropriatevolumes of the most commonly used foreign currencies within the cash portfolio.
(ii) Price risk
The University is exposed to equity securities price risk. This arises from investments held by the University andclassified on the statement of financial position as available-for-sale. The University has no direct exposure tocommodity price risk. The risk is not material to the Group, given the limited holdings in these assets.
(iii) Cash flow and fair value interest rate risk
Although the University carries debt, the majority of debt is at a fixed rate of interest. Interest rate risk relates toinvestments. All other financial assets and liabilities are non-interest bearing.
(iv) Summarised sensitivity analysis
The following table summarises the sensitivity of the Group's financial assets and financial liabilities to interest raterisk, foreign exchange risk and other price risk.
Consolidated
31 December 2014 Interest rate risk Foreign exchange risk Other price risk
-1% +1% -10% +10% -10% +10%
Carryingamount
Result
$'000
Equity
$'000
Result
$'000
Equity
$'000
Result
$'000
Equity
$'000
Result
$'000
Equity
$'000
Result
$'000
Equity
$'000
Result
$'000
Equity
$'000
Financial assets
Cash and cash equivalents 222,545 (2,225) - 2,225 - (1,175) - 1,175 - - - - -Term deposits 29,080 (290) - 290 - - - - - - - - -Receivables 30,207 - - - - - - - - - - - -Finance lease receivables 29,109 - - - - - - - - - - - -Listed investments 3,353 - - - - - - - - - (335) - 335Unquoted investments 5,594 - - - - - - - - - (559) - 559
Financial liabilities
Trade and other payables (63,897) - - - - 55 - (55) - - - - -Bonds (248,578) 2,486 - (2,486) - - - - - - - - -Bank borrowings (107,419) 1,074 - (1,074) - - - - - - - - -Interest rate swap (3,461) 35 - (35) - - - - - - - - -Lease liabilities (171) - - - - - - - - - - - -
Total increase/(decrease) 1,080 - (1,080) - (1,120) - 1,120 - - (894) - 894
52
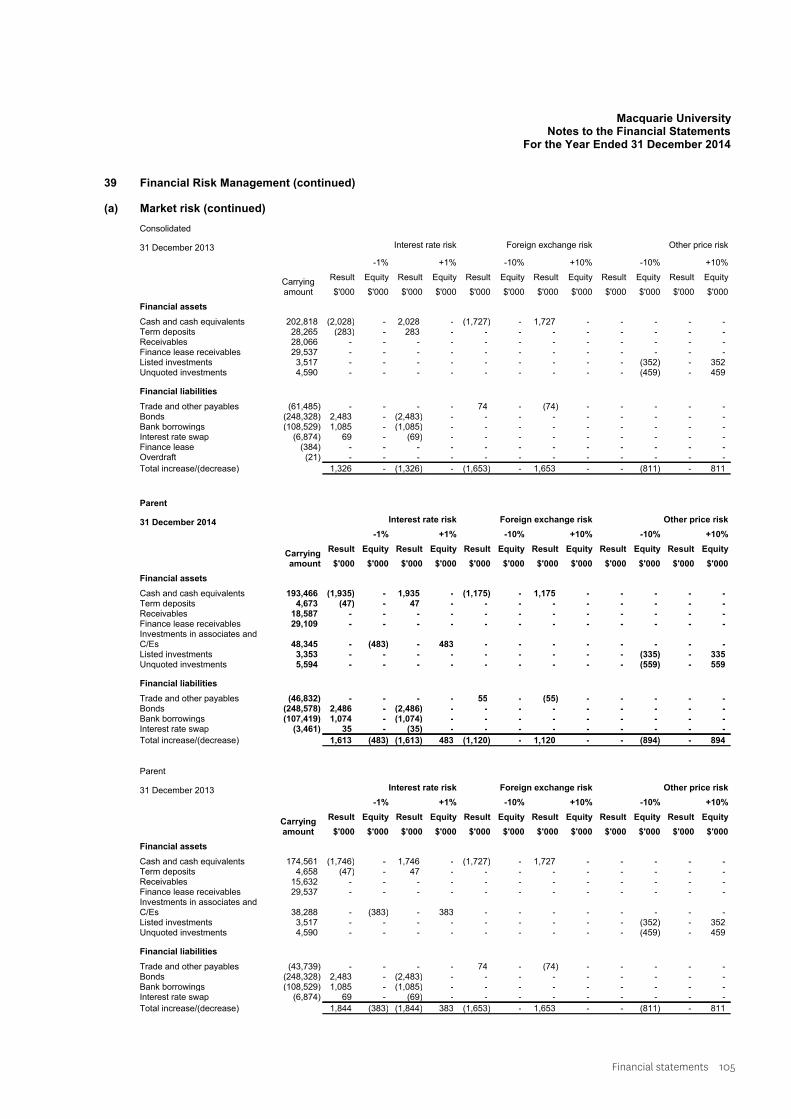
Financial statements 105
Macquarie UniversityNotes to the Financial Statements
For the Year Ended 31 December 2014
39 Financial Risk Management (continued)
(a) Market risk (continued)Consolidated
31 December 2013 Interest rate risk Foreign exchange risk Other price risk
-1% +1% -10% +10% -10% +10%
Carryingamount
Result
$'000
Equity
$'000
Result
$'000
Equity
$'000
Result
$'000
Equity
$'000
Result
$'000
Equity
$'000
Result
$'000
Equity
$'000
Result
$'000
Equity
$'000
Financial assets
Cash and cash equivalents 202,818 (2,028) - 2,028 - (1,727) - 1,727 - - - - -Term deposits 28,265 (283) - 283 - - - - - - - - -Receivables 28,066 - - - - - - - - - - - -Finance lease receivables 29,537 - - - - - - - - - - - -Listed investments 3,517 - - - - - - - - - (352) - 352Unquoted investments 4,590 - - - - - - - - - (459) - 459
Financial liabilities
Trade and other payables (61,485) - - - - 74 - (74) - - - - -Bonds (248,328) 2,483 - (2,483) - - - - - - - - -Bank borrowings (108,529) 1,085 - (1,085) - - - - - - - - -Interest rate swap (6,874) 69 - (69) - - - - - - - - -Finance lease (384) - - - - - - - - - - - -Overdraft (21) - - - - - - - - - - - -
Total increase/(decrease) 1,326 - (1,326) - (1,653) - 1,653 - - (811) - 811
Parent
31 December 2014 Interest rate risk Foreign exchange risk Other price risk
-1% +1% -10% +10% -10% +10%
Carryingamount
Result
$'000
Equity
$'000
Result
$'000
Equity
$'000
Result
$'000
Equity
$'000
Result
$'000
Equity
$'000
Result
$'000
Equity
$'000
Result
$'000
Equity
$'000
Financial assets
Cash and cash equivalents 193,466 (1,935) - 1,935 - (1,175) - 1,175 - - - - -Term deposits 4,673 (47) - 47 - - - - - - - - -Receivables 18,587 - - - - - - - - - - - -Finance lease receivables 29,109 - - - - - - - - - - - -Investments in associates andC/Es 48,345 - (483) - 483 - - - - - - - -Listed investments 3,353 - - - - - - - - - (335) - 335Unquoted investments 5,594 - - - - - - - - - (559) - 559
Financial liabilities
Trade and other payables (46,832) - - - - 55 - (55) - - - - -Bonds (248,578) 2,486 - (2,486) - - - - - - - - -Bank borrowings (107,419) 1,074 - (1,074) - - - - - - - - -Interest rate swap (3,461) 35 - (35) - - - - - - - - -
Total increase/(decrease) 1,613 (483) (1,613) 483 (1,120) - 1,120 - - (894) - 894
Parent
31 December 2013 Interest rate risk Foreign exchange risk Other price risk
-1% +1% -10% +10% -10% +10%
Carryingamount
Result
$'000
Equity
$'000
Result
$'000
Equity
$'000
Result
$'000
Equity
$'000
Result
$'000
Equity
$'000
Result
$'000
Equity
$'000
Result
$'000
Equity
$'000
Financial assets
Cash and cash equivalents 174,561 (1,746) - 1,746 - (1,727) - 1,727 - - - - -Term deposits 4,658 (47) - 47 - - - - - - - - -Receivables 15,632 - - - - - - - - - - - -Finance lease receivables 29,537 - - - - - - - - - - - -Investments in associates andC/Es 38,288 - (383) - 383 - - - - - - - -Listed investments 3,517 - - - - - - - - - (352) - 352Unquoted investments 4,590 - - - - - - - - - (459) - 459
Financial liabilities
Trade and other payables (43,739) - - - - 74 - (74) - - - - -Bonds (248,328) 2,483 - (2,483) - - - - - - - - -Bank borrowings (108,529) 1,085 - (1,085) - - - - - - - - -Interest rate swap (6,874) 69 - (69) - - - - - - - - -
Total increase/(decrease) 1,844 (383) (1,844) 383 (1,653) - 1,653 - - (811) - 811
53
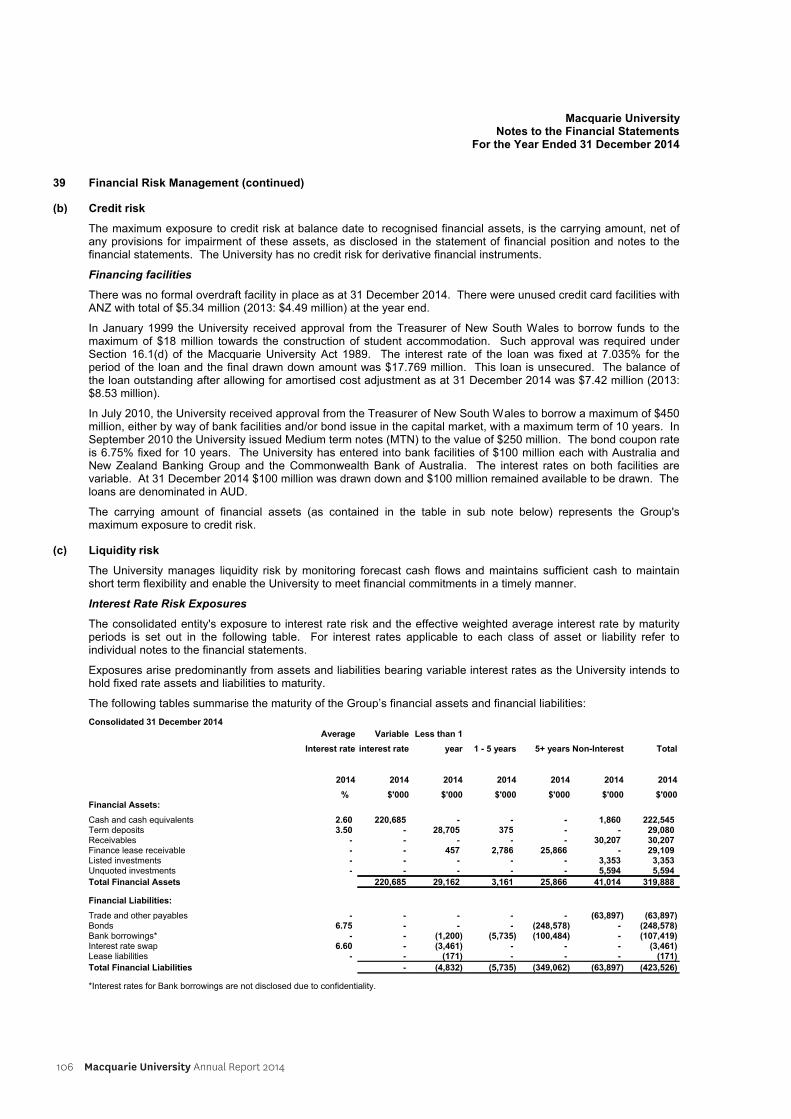
106 Macquarie University Annual Report 2014
Macquarie UniversityNotes to the Financial Statements
For the Year Ended 31 December 2014
39 Financial Risk Management (continued)
(b) Credit risk
The maximum exposure to credit risk at balance date to recognised financial assets, is the carrying amount, net ofany provisions for impairment of these assets, as disclosed in the statement of financial position and notes to thefinancial statements. The University has no credit risk for derivative financial instruments.
Financing facilities
There was no formal overdraft facility in place as at 31 December 2014. There were unused credit card facilities withANZ with total of $5.34 million (2013: $4.49 million) at the year end.
In January 1999 the University received approval from the Treasurer of New South Wales to borrow funds to themaximum of $18 million towards the construction of student accommodation. Such approval was required underSection 16.1(d) of the Macquarie University Act 1989. The interest rate of the loan was fixed at 7.035% for theperiod of the loan and the final drawn down amount was $17.769 million. This loan is unsecured. The balance ofthe loan outstanding after allowing for amortised cost adjustment as at 31 December 2014 was $7.42 million (2013:$8.53 million).
In July 2010, the University received approval from the Treasurer of New South Wales to borrow a maximum of $450million, either by way of bank facilities and/or bond issue in the capital market, with a maximum term of 10 years. InSeptember 2010 the University issued Medium term notes (MTN) to the value of $250 million. The bond coupon rateis 6.75% fixed for 10 years. The University has entered into bank facilities of $100 million each with Australia andNew Zealand Banking Group and the Commonwealth Bank of Australia. The interest rates on both facilities arevariable. At 31 December 2014 $100 million was drawn down and $100 million remained available to be drawn. Theloans are denominated in AUD.
The carrying amount of financial assets (as contained in the table in sub note below) represents the Group'smaximum exposure to credit risk.
(c) Liquidity risk
The University manages liquidity risk by monitoring forecast cash flows and maintains sufficient cash to maintainshort term flexibility and enable the University to meet financial commitments in a timely manner.
Interest Rate Risk Exposures
The consolidated entity's exposure to interest rate risk and the effective weighted average interest rate by maturityperiods is set out in the following table. For interest rates applicable to each class of asset or liability refer toindividual notes to the financial statements.
Exposures arise predominantly from assets and liabilities bearing variable interest rates as the University intends tohold fixed rate assets and liabilities to maturity.
The following tables summarise the maturity of the Group’s financial assets and financial liabilities:
Consolidated 31 December 2014
Average
Interest rate
Variable
interest rate
Less than 1
year 1 - 5 years 5+ years Non-Interest Total
2014
%2014
$'000
2014
$'000
2014
$'000
2014
$'000
2014
$'000
2014
$'000Financial Assets:
Cash and cash equivalents 2.60 220,685 - - - 1,860 222,545Term deposits 3.50 - 28,705 375 - - 29,080Receivables - - - - - 30,207 30,207Finance lease receivable - - 457 2,786 25,866 - 29,109Listed investments - - - - - 3,353 3,353Unquoted investments - - - - - 5,594 5,594
Total Financial Assets 220,685 29,162 3,161 25,866 41,014 319,888
Financial Liabilities:
Trade and other payables - - - - - (63,897) (63,897)Bonds 6.75 - - - (248,578) - (248,578)Bank borrowings* - - (1,200) (5,735) (100,484) - (107,419)Interest rate swap 6.60 - (3,461) - - - (3,461)Lease liabilities - - (171) - - - (171)
Total Financial Liabilities - (4,832) (5,735) (349,062) (63,897) (423,526)
*Interest rates for Bank borrowings are not disclosed due to confidentiality.
54
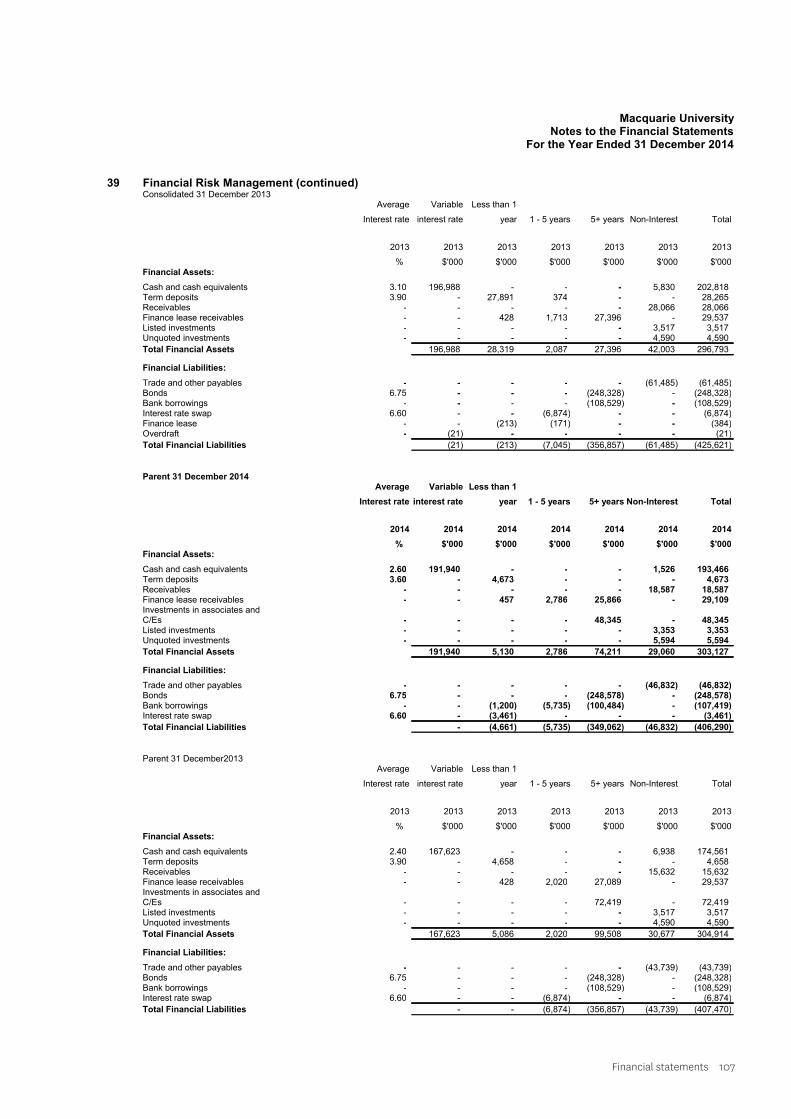
Financial statements 107
Macquarie UniversityNotes to the Financial Statements
For the Year Ended 31 December 2014
39 Financial Risk Management (continued)Consolidated 31 December 2013
Average
Interest rate
Variable
interest rate
Less than 1
year 1 - 5 years 5+ years Non-Interest Total
2013
%
2013
$'000
2013
$'000
2013
$'000
2013
$'000
2013
$'000
2013
$'000Financial Assets:
Cash and cash equivalents 3.10 196,988 - - - 5,830 202,818Term deposits 3.90 - 27,891 374 - - 28,265Receivables - - - - - 28,066 28,066Finance lease receivables - - 428 1,713 27,396 - 29,537Listed investments - - - - - 3,517 3,517Unquoted investments - - - - - 4,590 4,590
Total Financial Assets 196,988 28,319 2,087 27,396 42,003 296,793
Financial Liabilities:
Trade and other payables - - - - - (61,485) (61,485)Bonds 6.75 - - - (248,328) - (248,328)Bank borrowings - - - - (108,529) - (108,529)Interest rate swap 6.60 - - (6,874) - - (6,874)Finance lease - - (213) (171) - - (384)Overdraft - (21) - - - - (21)
Total Financial Liabilities (21) (213) (7,045) (356,857) (61,485) (425,621)
Parent 31 December 2014Average
Interest rate
Variable
interest rate
Less than 1
year 1 - 5 years 5+ years Non-Interest Total
2014
%2014
$'000
2014
$'000
2014
$'000
2014
$'000
2014
$'000
2014
$'000Financial Assets:
Cash and cash equivalents 2.60 191,940 - - - 1,526 193,466Term deposits 3.60 - 4,673 - - - 4,673Receivables - - - - - 18,587 18,587Finance lease receivables - - 457 2,786 25,866 - 29,109Investments in associates andC/Es - - - - 48,345 - 48,345Listed investments - - - - - 3,353 3,353Unquoted investments - - - - - 5,594 5,594
Total Financial Assets 191,940 5,130 2,786 74,211 29,060 303,127
Financial Liabilities:
Trade and other payables - - - - - (46,832) (46,832)Bonds 6.75 - - - (248,578) - (248,578)Bank borrowings - - (1,200) (5,735) (100,484) - (107,419)Interest rate swap 6.60 - (3,461) - - - (3,461)
Total Financial Liabilities - (4,661) (5,735) (349,062) (46,832) (406,290)
Parent 31 December2013Average
Interest rate
Variable
interest rate
Less than 1
year 1 - 5 years 5+ years Non-Interest Total
2013
%
2013
$'000
2013
$'000
2013
$'000
2013
$'000
2013
$'000
2013
$'000Financial Assets:
Cash and cash equivalents 2.40 167,623 - - - 6,938 174,561Term deposits 3.90 - 4,658 - - - 4,658Receivables - - - - - 15,632 15,632Finance lease receivables - - 428 2,020 27,089 - 29,537Investments in associates andC/Es - - - - 72,419 - 72,419Listed investments - - - - - 3,517 3,517Unquoted investments - - - - - 4,590 4,590
Total Financial Assets 167,623 5,086 2,020 99,508 30,677 304,914
Financial Liabilities:
Trade and other payables - - - - - (43,739) (43,739)Bonds 6.75 - - - (248,328) - (248,328)Bank borrowings - - - - (108,529) - (108,529)Interest rate swap 6.60 - - (6,874) - - (6,874)
Total Financial Liabilities - - (6,874) (356,857) (43,739) (407,470)
55
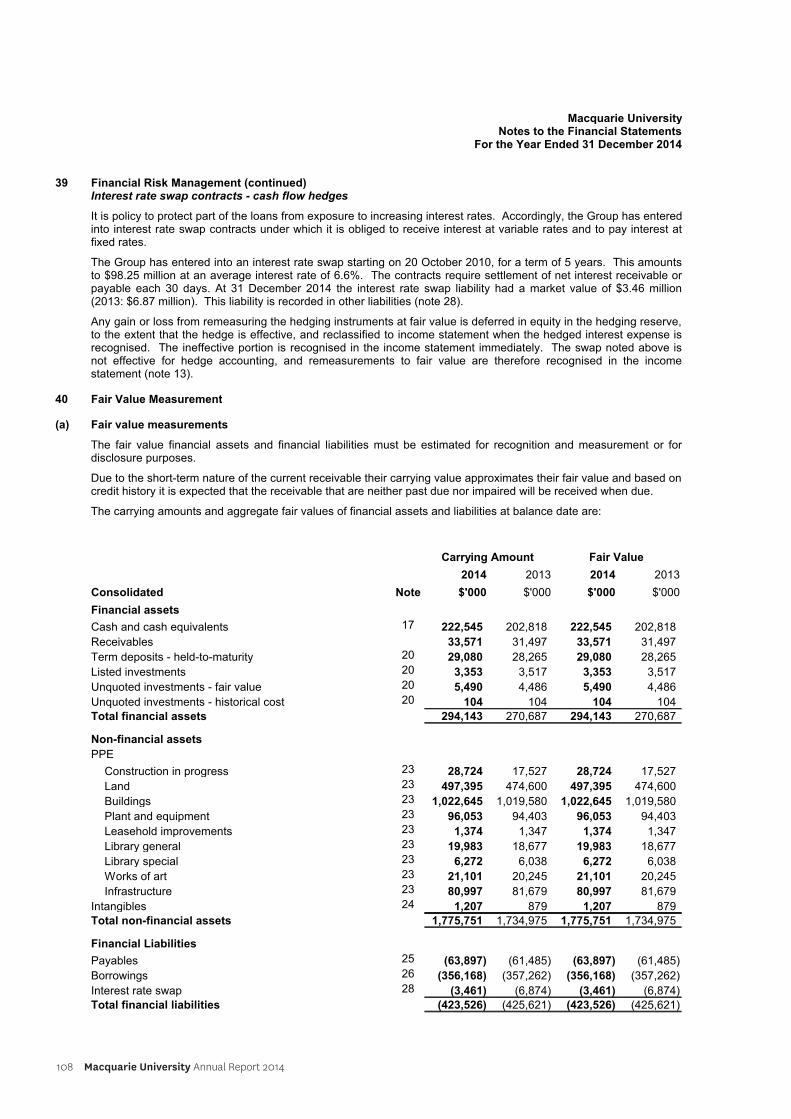
108 Macquarie University Annual Report 2014
Macquarie UniversityNotes to the Financial Statements
For the Year Ended 31 December 2014
39 Financial Risk Management (continued)Interest rate swap contracts - cash flow hedges
It is policy to protect part of the loans from exposure to increasing interest rates. Accordingly, the Group has enteredinto interest rate swap contracts under which it is obliged to receive interest at variable rates and to pay interest atfixed rates.
The Group has entered into an interest rate swap starting on 20 October 2010, for a term of 5 years. This amountsto $98.25 million at an average interest rate of 6.6%. The contracts require settlement of net interest receivable orpayable each 30 days. At 31 December 2014 the interest rate swap liability had a market value of $3.46 million(2013: $6.87 million). This liability is recorded in other liabilities (note 28).
Any gain or loss from remeasuring the hedging instruments at fair value is deferred in equity in the hedging reserve,to the extent that the hedge is effective, and reclassified to income statement when the hedged interest expense isrecognised. The ineffective portion is recognised in the income statement immediately. The swap noted above isnot effective for hedge accounting, and remeasurements to fair value are therefore recognised in the incomestatement (note 13).
40 Fair Value Measurement
(a) Fair value measurements
The fair value financial assets and financial liabilities must be estimated for recognition and measurement or fordisclosure purposes.
Due to the short-term nature of the current receivable their carrying value approximates their fair value and based oncredit history it is expected that the receivable that are neither past due nor impaired will be received when due.
The carrying amounts and aggregate fair values of financial assets and liabilities at balance date are:
Carrying Amount Fair Value
Consolidated Note
2014
$'000
2013
$'000
2014
$'000
2013
$'000
Financial assets
Cash and cash equivalents 17 222,545 202,818 222,545 202,818
Receivables 33,571 31,497 33,571 31,497
Term deposits - held-to-maturity 20 29,080 28,265 29,080 28,265
Listed investments 20 3,353 3,517 3,353 3,517
Unquoted investments - fair value 20 5,490 4,486 5,490 4,486
Unquoted investments - historical cost 20 104 104 104 104
Total financial assets 294,143 270,687 294,143 270,687
Non-financial assets
PPE
Construction in progress 23 28,724 17,527 28,724 17,527
Land 23 497,395 474,600 497,395 474,600
Buildings 23 1,022,645 1,019,580 1,022,645 1,019,580
Plant and equipment 23 96,053 94,403 96,053 94,403
Leasehold improvements 23 1,374 1,347 1,374 1,347
Library general 23 19,983 18,677 19,983 18,677
Library special 23 6,272 6,038 6,272 6,038
Works of art 23 21,101 20,245 21,101 20,245
Infrastructure 23 80,997 81,679 80,997 81,679
Intangibles 24 1,207 879 1,207 879
Total non-financial assets 1,775,751 1,734,975 1,775,751 1,734,975
Financial Liabilities
Payables 25 (63,897) (61,485) (63,897) (61,485)
Borrowings 26 (356,168) (357,262) (356,168) (357,262)
Interest rate swap 28 (3,461) (6,874) (3,461) (6,874)
Total financial liabilities (423,526) (425,621) (423,526) (425,621)
56
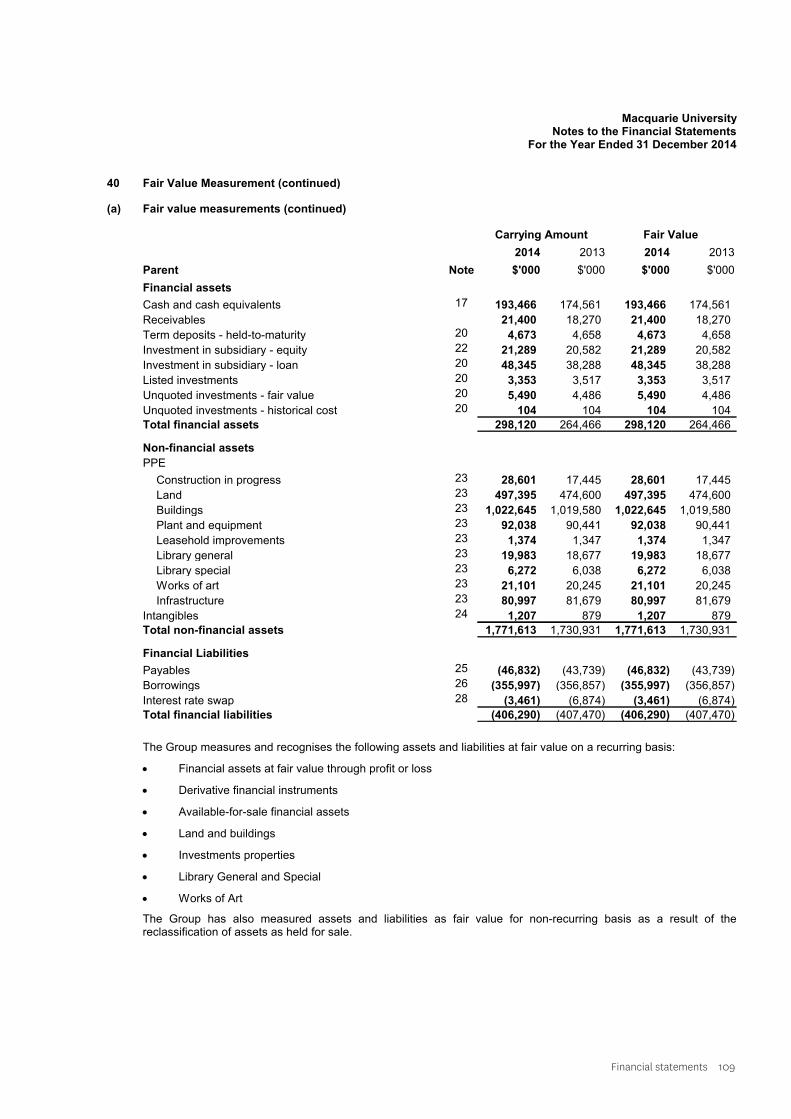
Financial statements 109
Macquarie UniversityNotes to the Financial Statements
For the Year Ended 31 December 2014
40 Fair Value Measurement (continued)
(a) Fair value measurements (continued)
Carrying Amount Fair Value
Parent Note
2014
$'000
2013
$'000
2014
$'000
2013
$'000
Financial assets
Cash and cash equivalents 17 193,466 174,561 193,466 174,561
Receivables 21,400 18,270 21,400 18,270
Term deposits - held-to-maturity 20 4,673 4,658 4,673 4,658
Investment in subsidiary - equity 22 21,289 20,582 21,289 20,582
Investment in subsidiary - loan 20 48,345 38,288 48,345 38,288
Listed investments 20 3,353 3,517 3,353 3,517
Unquoted investments - fair value 20 5,490 4,486 5,490 4,486
Unquoted investments - historical cost 20 104 104 104 104
Total financial assets 298,120 264,466 298,120 264,466
Non-financial assets
PPE
Construction in progress 23 28,601 17,445 28,601 17,445
Land 23 497,395 474,600 497,395 474,600
Buildings 23 1,022,645 1,019,580 1,022,645 1,019,580
Plant and equipment 23 92,038 90,441 92,038 90,441
Leasehold improvements 23 1,374 1,347 1,374 1,347
Library general 23 19,983 18,677 19,983 18,677
Library special 23 6,272 6,038 6,272 6,038
Works of art 23 21,101 20,245 21,101 20,245
Infrastructure 23 80,997 81,679 80,997 81,679
Intangibles 24 1,207 879 1,207 879
Total non-financial assets 1,771,613 1,730,931 1,771,613 1,730,931
Financial Liabilities
Payables 25 (46,832) (43,739) (46,832) (43,739)
Borrowings 26 (355,997) (356,857) (355,997) (356,857)
Interest rate swap 28 (3,461) (6,874) (3,461) (6,874)
Total financial liabilities (406,290) (407,470) (406,290) (407,470)
The Group measures and recognises the following assets and liabilities at fair value on a recurring basis:
Financial assets at fair value through profit or loss
Derivative financial instruments
Available-for-sale financial assets
Land and buildings
Investments properties
Library General and Special
Works of Art
The Group has also measured assets and liabilities as fair value for non-recurring basis as a result of thereclassification of assets as held for sale.
57
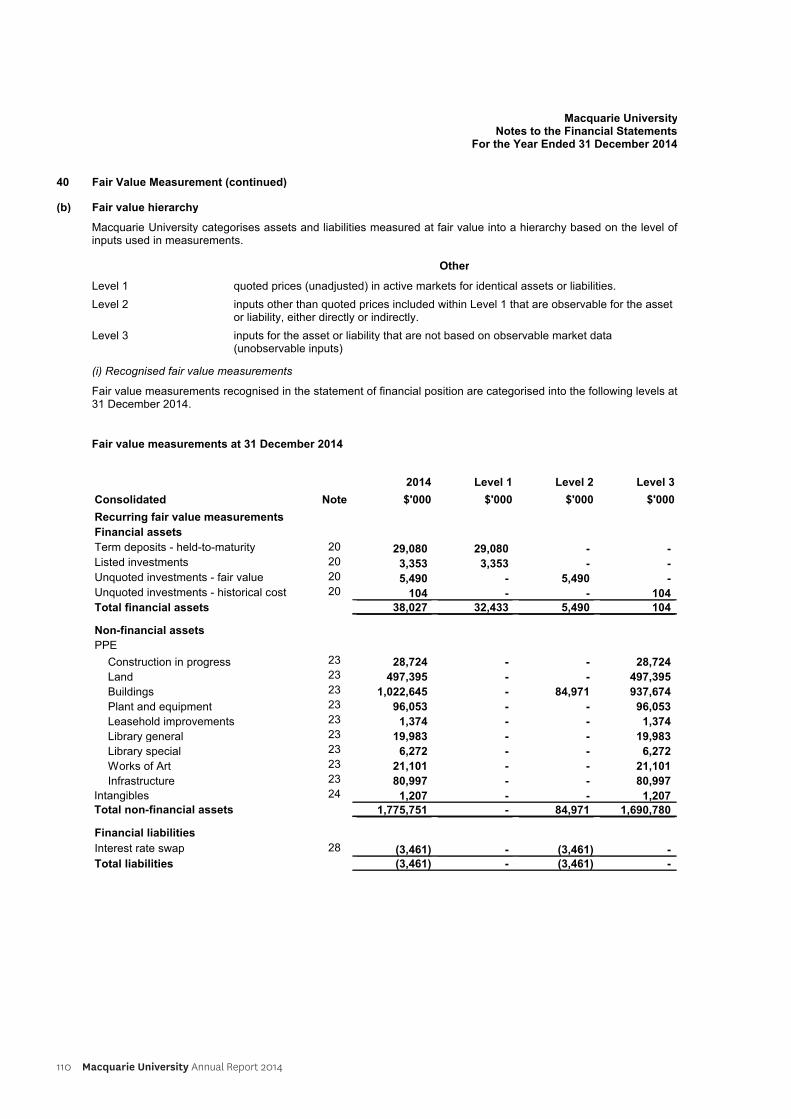
110 Macquarie University Annual Report 2014
Macquarie UniversityNotes to the Financial Statements
For the Year Ended 31 December 2014
40 Fair Value Measurement (continued)
(b) Fair value hierarchy
Macquarie University categorises assets and liabilities measured at fair value into a hierarchy based on the level ofinputs used in measurements.
Other
Level 1 quoted prices (unadjusted) in active markets for identical assets or liabilities.
Level 2 inputs other than quoted prices included within Level 1 that are observable for the assetor liability, either directly or indirectly.
Level 3 inputs for the asset or liability that are not based on observable market data(unobservable inputs)
(i) Recognised fair value measurements
Fair value measurements recognised in the statement of financial position are categorised into the following levels at31 December 2014.
Fair value measurements at 31 December 2014
Consolidated Note
2014
$'000
Level 1
$'000
Level 2
$'000
Level 3
$'000
20 29,080 29,080 - -20 3,353 3,353 - -20 5,490 - 5,490 -20 104 - - 104
Recurring fair value measurements Financial assets
Term deposits - held-to-maturity Listed investments
Unquoted investments - fair value Unquoted investments - historical cost Total financial assets 38,027 32,433 5,490 104
Non-financial assets
PPE
Construction in progress 23 28,724 - - 28,724
Land 23 497,395 - - 497,395
Buildings 23 1,022,645 - 84,971 937,674
Plant and equipment 23 96,053 - - 96,053
Leasehold improvements 23 1,374 - - 1,374
Library general 23 19,983 - - 19,983
Library special 23 6,272 - - 6,272
Works of Art 23 21,101 - - 21,101
Infrastructure 23 80,997 - - 80,99724 1,207 - - 1,207Intangibles
Total non-financial assets 1,775,751 - 84,971 1,690,780
28 (3,461) - (3,461) -
Financial liabilities Interest rate swap Total liabilities (3,461) - (3,461) -
58
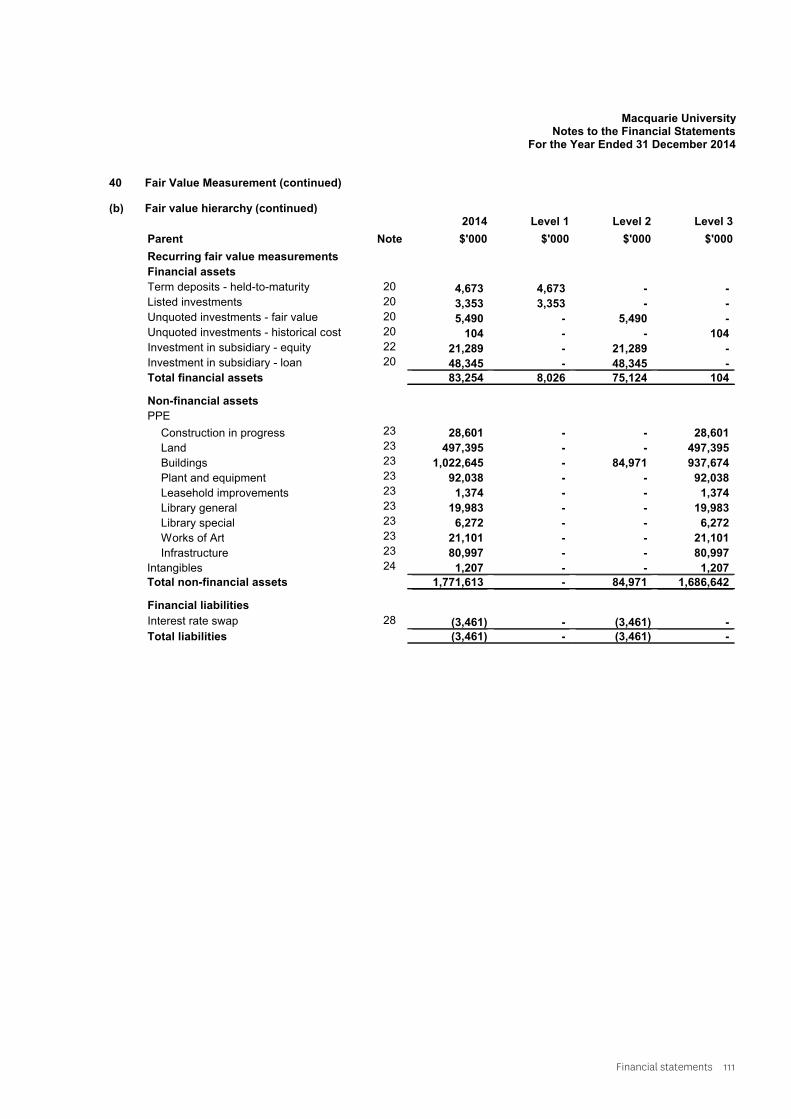
Financial statements 111
Macquarie UniversityNotes to the Financial Statements
For the Year Ended 31 December 2014
40 Fair Value Measurement (continued)
(b) Fair value hierarchy (continued)
Parent Note
2014
$'000
Level 1
$'000
Level 2
$'000
Level 3
$'000
20 4,673 4,673 - -20 3,353 3,353 - -20 5,490 - 5,490 -20 104 - - 10422 21,289 - 21,289 -20 48,345 - 48,345 -
Recurring fair value measurements Financial assets
Term deposits - held-to-maturity Listed investments
Unquoted investments - fair value Unquoted investments - historical cost Investment in subsidiary - equity Investment in subsidiary - loan
Total financial assets 83,254 8,026 75,124 104
Non-financial assets
PPE
Construction in progress 23 28,601 - - 28,601
Land 23 497,395 - - 497,395
Buildings 23 1,022,645 - 84,971 937,674
Plant and equipment 23 92,038 - - 92,038
Leasehold improvements 23 1,374 - - 1,374
Library general 23 19,983 - - 19,983
Library special 23 6,272 - - 6,272
Works of Art 23 21,101 - - 21,101
Infrastructure 23 80,997 - - 80,99724 1,207 - - 1,207Intangibles
Total non-financial assets 1,771,613 - 84,971 1,686,642
28 (3,461) - (3,461) -
Financial liabilities Interest rate swap Total liabilities (3,461) - (3,461) -
59
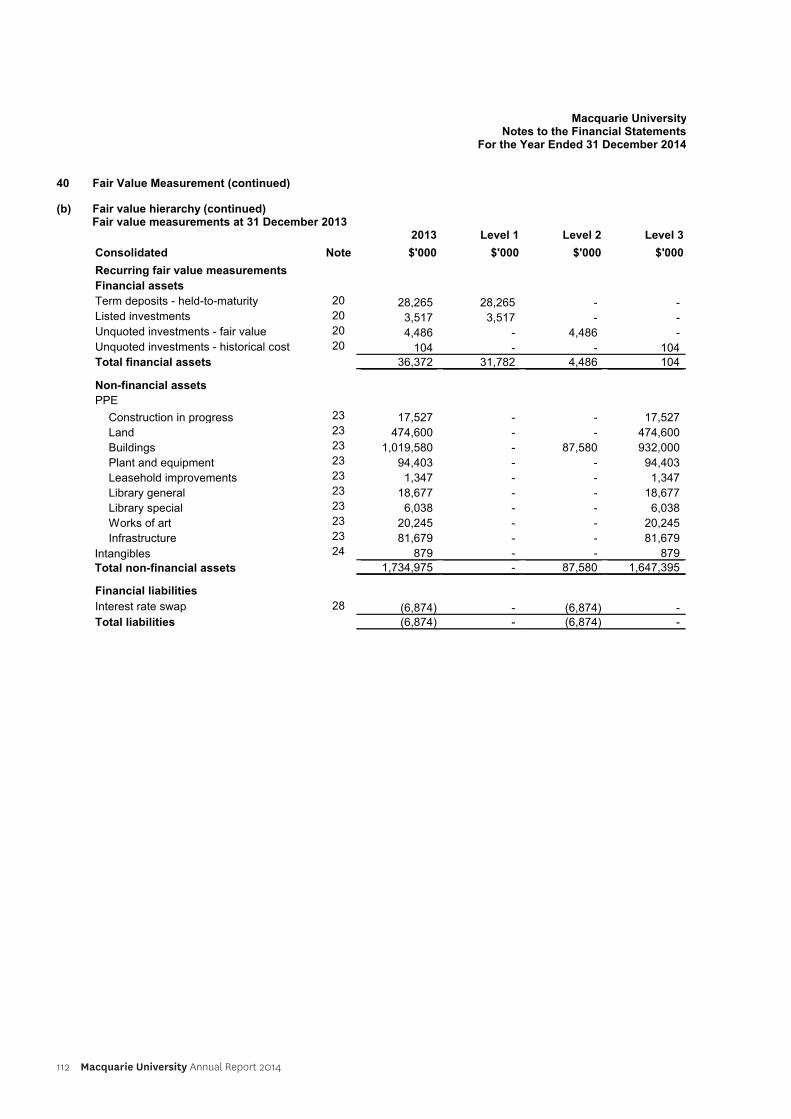
112 Macquarie University Annual Report 2014
Macquarie UniversityNotes to the Financial Statements
For the Year Ended 31 December 2014
40 Fair Value Measurement (continued)
(b) Fair value hierarchy (continued)Fair value measurements at 31 December 2013
Consolidated Note
2013
$'000
Level 1
$'000
Level 2
$'000
Level 3
$'000
20 28,265 28,265 - -20 3,517 3,517 - -20 4,486 - 4,486 -20 104 - - 104
Recurring fair value measurements Financial assets
Term deposits - held-to-maturity Listed investments
Unquoted investments - fair value Unquoted investments - historical cost Total financial assets 36,372 31,782 4,486 104
Non-financial assets
PPE
Construction in progress 23 17,527 - - 17,527
Land 23 474,600 - - 474,600
Buildings 23 1,019,580 - 87,580 932,000
Plant and equipment 23 94,403 - - 94,403
Leasehold improvements 23 1,347 - - 1,347
Library general 23 18,677 - - 18,677
Library special 23 6,038 - - 6,038
Works of art 23 20,245 - - 20,245
Infrastructure 23 81,679 - - 81,67924 879 - - 879Intangibles
Total non-financial assets 1,734,975 - 87,580 1,647,395
28 (6,874) - (6,874) -
Financial liabilities Interest rate swap Total liabilities (6,874) - (6,874) -
60

Financial statements 113
Macquarie UniversityNotes to the Financial Statements
For the Year Ended 31 December 2014
40 Fair Value Measurement (continued)
(b) Fair value hierarchy (continued)
Parent Note
2013
$'000
Level 1
$'000
Level 2
$'000
Level 3
$'000
20 4,658 4,658 - -20 3,517 3,517 - -20 4,486 - 4,486 -20 104 - - 10422 20,582 - 20,582 -20 38,288 - 38,288 -
Recurring fair value measurements Financial assets
Term deposits - held-to-maturity Listed investments
Unquoted investments - fair value Unquoted investments - historical cost Investment in subsidiary - equity Investment in subsidiary - loan
Total financial assets 71,635 8,175 63,356 104
Non-financial assets
PPE
Construction in progress 23 17,445 - - 17,445
Land 23 474,600 - - 474,600
Buildings 23 1,019,580 - 87,580 932,000
Plant and equipment 23 90,441 - - 90,441
Leasehold improvements 23 1,347 - - 1,347
Library general 23 18,677 - - 18,677
Library special 23 6,038 - - 6,038
Works of art 23 20,245 - - 20,245
Infrastructure 23 81,679 - - 81,67924 879 - - 879Intangibles
Total non-financial assets 1,730,931 - 87,580 1,643,351
28 (6,874) - (6,874) -
Financial liabilities Interest rate swap Total liabilities (6,874) - (6,874) -
There were no transfers between levels 1 and 2 for recurring fair value measurements during the year. For transfersin and out of level 3 measurements, see (d) below.
Macquarie University's policy is to recognise transfers into and transfers out of fair value hierarchy levels as at theend of the reporting period.
61
114 Macquarie University Annual Report 2014
Macquarie UniversityNotes to the Financial Statements
For the Year Ended 31 December 2014
40 Fair Value Measurement (continued)(c) Valuation techniques used to derive level 2 and level 3 fair values
(i) Assets or liabilities traded in active markets
The fair value of assets or liabilities traded in active markets (such as publicly traded derivatives, and trading andavailable-for-sale securities) is based on quoted market prices for identical assets or liabilities at the reporting date(Level 1). This is the most representative of fair value in the circumstances.
(ii) Held-to-maturity investments
The fair values of held-to-maturity investments were determined by reference to published price quotations in anactive market (Level1).
(iii) Trade receivables and payables
The carrying value less impairment provision of trade receivables and payables is a reasonable approximation oftheir fair values due to the short-term nature of trade receivables. Not reported in 40(b).
(iv) Borrowings
The value of both current and non-current borrowings approximates the carrying amount, as the impact ofdiscounting is not significant (Level 2).
(v) Derivatives
Derivative contracts classified as held for trading are fair valued by comparing the contracted rate to the currentmarket rate for a contract with the same remaining period to maturity. No such derivatives were held in 2014 or2013.
(vi) Assets or liabilities not traded in active markets
The fair value of financial instruments that are not traded in an active market (for example, over-the-counterderivatives) is determined using valuation techniques. These valuation techniques maximise the use of observablemarket data where it is available and rely as little as possible on entity specific estimates. If all significant inputsrequired to fair value an instrument are observable, the instrument is included in Level 2.
(vii) Property, Plant and Equipment – off-campus buildings
Off-campus buildings are assessed annually by an independent expert valuer. Observable market transactions ormarket information is used when available (Sales Comparison Approach and Income Capitalisation Approach).These assets are located in established and relatively liquid markets and are classified as Level 2.
(viii) Property Plant and Equipment – on-campus land
On-campus land is assessed annually by an independent expert valuer, based on direct comparison with land sales,taking into account its existing use as a university as the highest and best use (Level 3).
(ix) Property Plant and Equipment – on-campus buildings and infrastructure
On-campus buildings are assessed annually by an independent expert valuer. Market information is not observable,and other valuation techniques (including discounted replacement value) are used that maximise the use of relevantobservable inputs and minimises the use of unobservable inputs. These assets are classified as Level 3.
(x) Intangible assets – patents
Patents are revalued every five years by an independent external valuer. In addition, an annual internal review isconducted to gain assurance that the product or service continues to be technically and commercially feasible.Patents are classified as Level 3 due to the limited number of external observable inputs.
(xi) Library General and Special
The Library General Collection is recorded at fair value on the basis of depreciated replacement value. The LibrarySpecial Collection is revalued every three years by an independent expert valuer. Both collections are classified asLevel 3 due to the limited number of external observable inputs.
(xii) Works of Art
Works of Art are revalued every five years by an independent external valuer, on the basis of market value forexisting use. The collection is classified as Level 3 due to the limited number of external observable inputs.
62
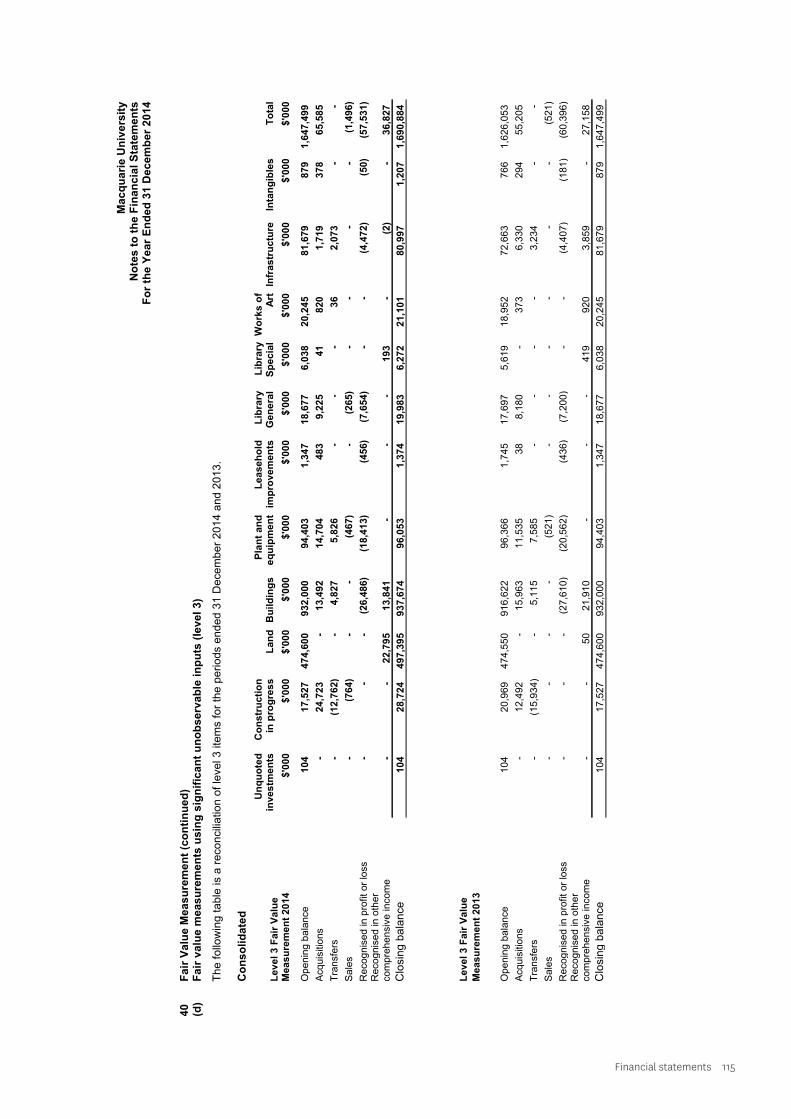
Financial statements 115
Ma
cq
ua
rie
Un
ive
rsit
yN
ote
s t
o t
he
Fin
an
cia
l S
tate
me
nts
F
or
the
Ye
ar
En
de
d 3
1 D
ec
em
be
r 2
01
4
40
Fa
ir V
alu
e M
ea
su
rem
en
t (c
on
tin
ue
d)
(d)
Fa
ir v
alu
e m
ea
su
rem
en
ts u
sin
g s
ign
ific
an
t u
no
bs
erv
ab
le i
np
uts
(le
ve
l 3
)
Th
e f
ollo
win
g t
ab
le is a
re
co
ncili
atio
n o
f le
ve
l 3
ite
ms f
or
the
pe
rio
ds e
nd
ed
31
De
ce
mb
er
20
14
an
d 2
01
3.
Co
ns
oli
da
ted
Le
ve
l 3
Fa
ir V
alu
eM
easu
rem
en
t 2014
Un
qu
ote
din
vestm
en
ts
$'0
00
Co
nstr
ucti
on
in p
rog
res
s
$'0
00
Lan
d
$'0
00
Bu
ild
ing
s
$'0
00
Pla
nt
an
de
qu
ipm
en
t
$'0
00
Leaseh
old
imp
rovem
en
ts
$'0
00
Lib
rary
Gen
era
l
$'0
00
Lib
rary
Sp
ecia
l
$'0
00
Wo
rks
of
Art
$'0
00
Infr
astr
uctu
re
$'0
00
Inta
ng
ible
s
$'0
00
To
tal
$'0
00
Openin
g b
ala
nce
104
17,5
27
474,6
00
932,0
00
94,4
03
1,3
47
18,6
77
6,0
38
20,2
45
81,6
79
879
1,6
47,4
99
Acquisitions
-24,7
23
-13,4
92
14,7
04
483
9,2
25
41
820
1,7
19
378
65,5
85
Tra
nsf
ers
-(1
2,7
62)
-4,8
27
5,8
26
--
-36
2,0
73
--
Sale
s-
(764)
--
(467)
-(2
65)
--
--
(1,4
96)
Reco
gnis
ed in p
rofit
or
loss
--
-(2
6,4
86)
(18,4
13)
(456)
(7,6
54)
--
(4,4
72)
(50)
(57,5
31)
Reco
gnis
ed in
oth
er
co
mp
reh
en
siv
e in
co
me
--
22,7
95
13,8
41
--
-193
-(2
)-
36,8
27
Clo
sin
g b
ala
nce
104
28,7
24
497,3
95
937,6
74
96,0
53
1,3
74
19,9
83
6,2
72
21,1
01
80,9
97
1,2
07
1,6
90,8
84
Le
ve
l 3
Fa
ir V
alu
e
Measu
rem
en
t 2013
Openin
g b
ala
nce
104
20,9
69
474,5
50
916,6
22
96,3
66
1,7
45
17,6
97
5,6
19
18,9
52
72,6
63
766
1,6
26,0
53
Acquisitions
-12,4
92
-15,9
63
11,5
35
38
8,1
80
-373
6,3
30
294
55,2
05
Tra
nsf
ers
-(1
5,9
34)
-5,1
15
7,5
85
--
--
3,2
34
--
Sale
s-
--
-(5
21)
--
--
--
(521)
Reco
gnis
ed in p
rofit
or
loss
--
-(2
7,6
10)
(20,5
62)
(436)
(7,2
00)
--
(4,4
07)
(181)
(60,3
96)
Reco
gnis
ed in
oth
er
co
mp
reh
en
siv
e in
co
me
--
50
21,9
10
--
-419
920
3,8
59
-27,1
58
Clo
sin
g b
ala
nce
104
17,5
27
474,6
00
932,0
00
94,4
03
1,3
47
18,6
77
6,0
38
20,2
45
81,6
79
879
1,6
47,4
99
63
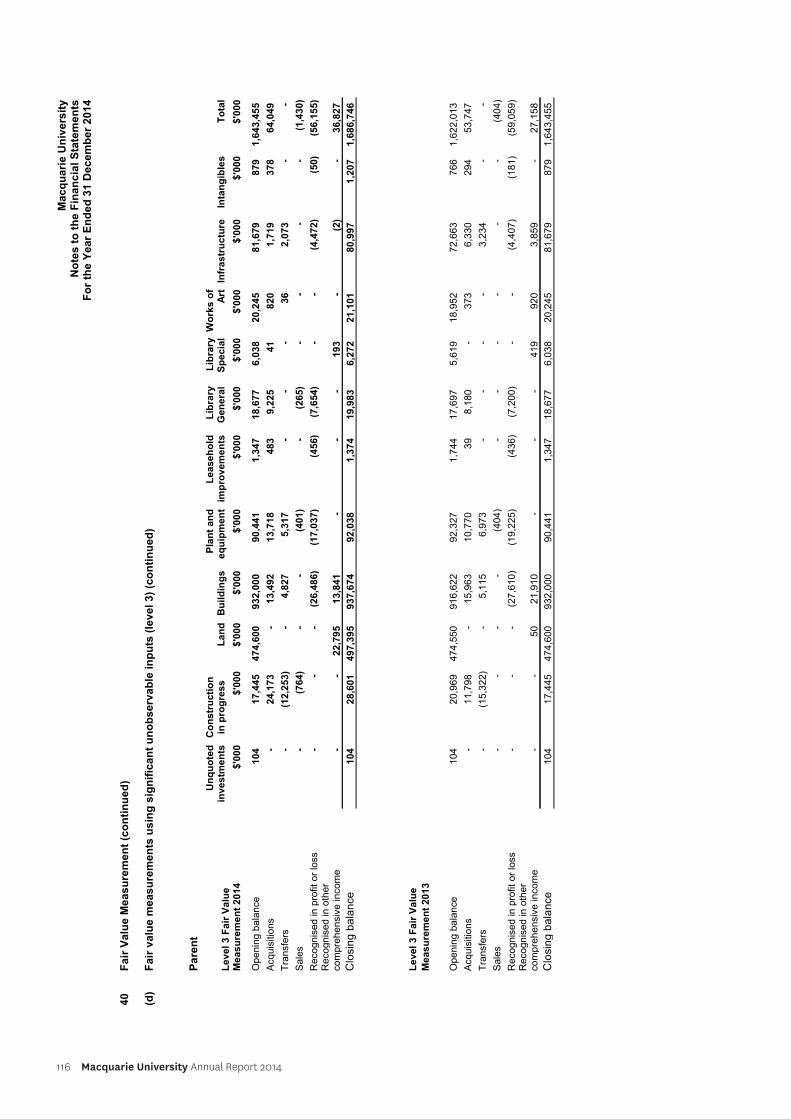
116 Macquarie University Annual Report 2014
Ma
cq
ua
rie
Un
ive
rsit
yN
ote
s t
o t
he
Fin
an
cia
l S
tate
me
nts
F
or
the
Ye
ar
En
de
d 3
1 D
ec
em
be
r 2
01
4
40
Fa
ir V
alu
e M
ea
su
rem
en
t (c
on
tin
ue
d)
(d)
Fa
ir v
alu
e m
ea
su
rem
en
ts u
sin
g s
ign
ific
an
t u
no
bs
erv
ab
le i
np
uts
(le
ve
l 3
) (c
on
tin
ue
d)
Pa
ren
t
Le
ve
l 3
Fa
ir V
alu
eM
easu
rem
en
t 2014
Un
qu
ote
din
vestm
en
ts
$'0
00
Co
nstr
ucti
on
in p
rog
res
s
$'0
00
Lan
d
$'0
00
Bu
ild
ing
s
$'0
00
Pla
nt
an
de
qu
ipm
en
t
$'0
00
Leaseh
old
imp
rovem
en
ts
$'0
00
Lib
rary
Gen
era
l
$'0
00
Lib
rary
Sp
ecia
l
$'0
00
Wo
rks
of
Art
$'0
00
Infr
astr
uctu
re
$'0
00
Inta
ng
ible
s
$'0
00
To
tal
$'0
00
Openin
g b
ala
nce
104
17,4
45
474,6
00
932,0
00
90,4
41
1,3
47
18,6
77
6,0
38
20,2
45
81,6
79
879
1,6
43,4
55
Acq
uis
itio
ns
-24,1
73
-13,4
92
13,7
18
483
9,2
25
41
820
1,7
19
378
64,0
49
Tra
nsf
ers
-(1
2,2
53)
-4,8
27
5,3
17
--
-36
2,0
73
--
Sale
s-
(764)
--
(401)
-(2
65)
--
--
(1,4
30)
Reco
gnis
ed in
pro
fit o
r lo
ss-
--
(26,4
86)
(17,0
37)
(456)
(7,6
54)
--
(4,4
72)
(50)
(56,1
55)
Reco
gnis
ed in
oth
er
co
mp
reh
en
siv
e in
co
me
--
22,7
95
13,8
41
--
-193
-(2
)-
36,8
27
Clo
sin
g b
ala
nce
104
28,6
01
497,3
95
937,6
74
92,0
38
1,3
74
19,9
83
6,2
72
21,1
01
80,9
97
1,2
07
1,6
86,7
46
Le
ve
l 3
Fa
ir V
alu
e
Measu
rem
en
t 2013
Openin
g b
ala
nce
104
20,9
69
474,5
50
916,6
22
92,3
27
1,7
44
17,6
97
5,6
19
18,9
52
72,6
63
766
1,6
22,0
13
Acq
uis
itio
ns
-11,7
98
-15,9
63
10,7
70
39
8,1
80
-373
6,3
30
294
53,7
47
Tra
nsf
ers
-(1
5,3
22)
-5,1
15
6,9
73
--
--
3,2
34
--
Sale
s-
--
-(4
04)
--
--
--
(404)
Reco
gnis
ed in
pro
fit o
r lo
ss-
--
(27,6
10)
(19,2
25)
(436)
(7,2
00)
--
(4,4
07)
(181)
(59,0
59)
Reco
gnis
ed in
oth
er
co
mp
reh
en
siv
e in
co
me
--
50
21,9
10
--
-419
920
3,8
59
-27,1
58
Clo
sin
g b
ala
nce
104
17,4
45
474,6
00
932,0
00
90,4
41
1,3
47
18,6
77
6,0
38
20,2
45
81,6
79
879
1,6
43,4
55
64
Financial statements 117
Macquarie UniversityNotes to the Financial Statements
For the Year Ended 31 December 2014
40 Fair Value Measurement (continued)
(d) Fair value measurements using significant unobservable inputs (level 3) (continued)(i) Transfers between levels 2 and 3 and changes in valuation techniques
There were no transfers of assets / liabilities between levels 2 and 3.
(ii) Valuation inputs and relationships to fair value
Buildings and Land represent the majority of the assets classified within level 3. Key inputs for these assets, with arange of changes in fair value given a 5% increase or decrease in these assumptions, are shown below:
Consolidated andParent
DescriptionFair value at
31December
2014
$'000
Unobservableinputs*
Range of inputs(probability
weightedaverage)
Relationship ofunobservable inputs to
fair value
PPE - Buildings 937,674Remaining usefullife of assets + / 5%
Increased term of useful lifeby 5% would increase fairvalue by $46.3m
Decrease term of useful lifeby 5% would decrease fairvalue by $46.3m
Land 497,395
$ per squaremetre forcampus land + / 5%
Increase in $ per squaremetre by 5% would increasefair value by $23.5m
Decrease in $ per squaremetre by 5% woulddecrease fair value by$23.5m
*There were no significant inter-relationship between unobservable inputs that materially affects fair value
(iii) Valuation processes
Valuation methodology has been disclosed as part of (c) in this note.
41 Employee Benefits - Unfunded Defined Benefit Superannuation Liabilities
Certain University employees are entitled to pension benefits under three closed pension schemes, being the StateAuthorities Superannuation Scheme (SASS), the State Authorities Non-contributory Superannuation Scheme(SANCS) and the State Superannuation Scheme (SSS). These schemes are managed by the State AuthoritiesSuperannuation Trustee Corporation (STC).
In accordance with the 1998 instructions issued by the Department of Education, Training and Youth Affairs(DETYA) now known as the Department of Education (Education), the effects of the unfunded defined benefitsuperannuation liabilities have been recognised in the Statement of Financial Position under Provisions with acorresponding asset recognised under Receivables.
This arrangement is supported by Division 41 of the Commonwealth Higher Education Support Act 2003 and section20 of the Higher Education Funding Act 1988.
Correspondence from the Commonwealth Government in 2010 indicated that the reimbursement right in respect ofthe SANCS fund had become uncertain, and, as a result, the relevant receivable was reduced from $3.4m to nil inthe 2009 accounts. During 2014, the Commonwealth and State Governments signed a memorandum ofunderstanding to pay the unfunded superannuation liabilities on a Pay As You Go basis under an agreed cost sharearrangement for the three funds (SASS, SANCS and SSS). Amendments to the Higher Education Support Act 2003(the Act) were necessary to enact the provision of the memorandum of understanding. The Minister for Educationsigned the Amendment on 20 November 2014, and it was registered on the Federal Register of LegislativeInstruments (FRIL) on 4 December 2014, from which date it had the effect of law.
65
118 Macquarie University Annual Report 2014
Macquarie UniversityNotes to the Financial Statements
For the Year Ended 31 December 2014
41 Employee Benefits - Unfunded Defined Benefit Superannuation Liabilities (continued)
As a consequence of this change of law, a prospective adjustment creating a debtor for the reimbursement right forSANCS has been recorded as at the reporting date, with an adjustment of $3.2m recognised through the IncomeStatement in Note 10. The accounting treatment for the SASS and SSS schemes is unchanged by the amendmentto the Act. The unfunded defined benefit superannuation liabilities for the SASS, SSS and SANCS plans, asdetermined by the actuary at 31 December 2014 was $515.4m (2013: $348.1m). This amount has been reflected asa debtor in note 18 and as a liability in Note 27. Refer to note 42 for details by pension plan.
The recognition of both the asset and liability does not affect the year end net position of the University and itscontrolled entities.
42 Defined Benefits Plans
(a) Fund specific disclosure
The Pooled Funds holds in trust the investments of the closed NSW public sector superannuation schemes:
- State Authorities Superannuation Scheme (SASS)
- State Authorities Non-contributory Superannuation Scheme (SANCS)
- State Superannuation Scheme (SSS)
The Professorial Superannuation Fund (PSF) is a combination of an accumulation benefit and a defined benefit.
The Professorial Superannuation Scheme was an alternative superannuation arrangement to the StateSuperannuation Scheme that was available to professors of the University, until its closure to new entrants in 1988.The scheme provides active members with a combination of accumulation benefits and defined benefits. Pensionermembers receive pension payments from the scheme. The University commenced its funding of the previouslyunfunded "non-contributory pension" during the 2006 year.
The above schemes are all defined benefit schemes - at least a component of the final benefit is derived from amultiple of member salary and years of membership. Members receive lump sum or pension benefits on retirement,death, disablement and withdrawal. All schemes are closed to new members.
The University does not expect to make contributions to any Pooled Fund Schemes in 2014 (2013: nil) aside fromnormal payments made under the Superannuation Guarantee Levy for those employees who are members of thesefunds. The University expects to make a contribution of $1.3m in 2015 (2014: $1.2m) to the ProfessorialSuperannuation Scheme.
Pooled Funds - maturity analysis
The expected maturity analysis of undiscounted benefit payments is as follows:
Less than 1year
$'000
Between 1and 2 years
$'000
Between 2and 5 years
$'000
Over 5years
$'000
Total
$'000
Defined benefit obligations - 31 December2014 31,828 32,172 97,123 573,769 734,892Defined benefit obligations - 31 December2013 30,640 31,302 95,067 591,605 748,614
Professorial Superannuation Fund - maturity analysis
The expected maturity analysis of undiscounted benefit payments is as follows:
Less than 1year
$'000
Between 1and 2 years
$'000
Between 2and 5 years
$'000
Over 5years
$'000
Total
$'000
Defined benefit obligations - 31 December2014 1,517 1,472 4,118 10,745 17,852Defined benefit obligations - 31 December2013 1,563 1,516 4,238 9,192 16,509
66
Financial statements 119
Macquarie UniversityNotes to the Financial Statements
For the Year Ended 31 December 2014
42 Defined Benefits Plans (continued)(b) Categories of plan assets
Pooled Funds - key assumptions
The analysis of the plan assets at the end of the reporting period is as follows:
2014 (%) 2013 (%)
ActiveMarket
No ActiveMarket
ActiveMarket
No ActiveMarket
Cash and Cash Equivalents - 7.00 5.00 3.00Equity instruments 49.00 8.00 55.00 8.00Debt instruments - 9.00 - 6.00Property 3.00 6.00 2.00 6.00Other 2.00 16.00 1.00 14.00
Total 54.00 46.00 63.00 37.00
The principal assumptions used for the purposes of the actuarial valuations were as follows (expressed as weightedaverages):
2014
%
2013
%
Discount rate(s) 2.83 4.27Expected return on plan assets 8.30 8.30Expected rate(s) of salary increase 2.25 - 3.50 2.25 - 3.50Expected rate of CPI increase 2.50 2.50
Professorial Superannuation Fund - key assumptions
The analysis of the plan assets at the end of the reporting period is as follows:
2014 (%) 2013 (%)
ActiveMarket
No ActiveMarket
ActiveMarket
No ActiveMarket
Cash and Cash Equivalents - 16.20 - 18.00Equity instruments 51.70 - 56.00 -Debt instruments - 22.40 - 17.00Other - 9.70 - 9.00
Total 51.70 48.30 56.00 44.00
The principal assumptions used for the purposes of the actuarial valuations were as follows (expressed as weightedaverages):
2014
%
2013
%
Discount rate(s) 2.60 4.00Expected rate(s) of salary increase 4.00 4.00Pension growth rate 4.00 4.00
67
120 Macquarie University Annual Report 2014
Macquarie UniversityNotes to the Financial Statements
For the Year Ended 31 December 2014
42 Defined Benefits Plans (continued)(c) Actuarial assumptions and sensitivity
The sensitivity of the Pooled Funds defined benefit obligation to change in the significant assumptions is:
Change inassumption Impact on defined obligation
Increase in assumption Decrease in assumption
Discount rate %1.00 Decrease by 10.04% Increase by 12.04%Rate of CPI increase %0.50 Increase by 5.4% Decrease by 5.0%Rate of salary increase %0.50 Increase by 0.23% Decrease by 0.22%Rate of pensioner mortality %0.50 Decrease by 1.34% Increase by 1.42%
The sensitivity of the Professorial Superannuation Fund defined benefit obligation to change in the significantassumptions is:
Change inassumption Impact on defined obligation
Increase in assumption Decrease in assumption
Discount rate %0.50 Decrease by 4.6% Increase by 4.9%Salary/ pension growth rate %0.50 Increase by 4.9% Decrease by 4.6%
The above sensitivity analyses are based on a change in an assumption while holding all the other assumptionsconstant. In practice this is unlikely to occur, and changes in some of the assumptions may be correlated. Whencalculating the sensitivity of the defined benefit obligation to significant actuarial assumptions the same method hasbeen applied as when calculating the defined benefit liability recognised in the statement of financial position.
The methods and types of assumptions used in the preparation of the sensitivity analysis did not change comparedto the prior period.
(d) Statement of financial position amounts
Net liability reconciliation - 2014 Note
$'000
SASS
$'000
SANCS
$'000
SSS
$'000
PSF
$'000
Total
Defined benefit obligation 39,906 7,142 550,596 17,852 615,496
Fair value of plan assets (30,468) (2,362) (49,463) (14,011) (96,304)
Net liability 27 9,438 4,780 501,133 3,841 519,192
Reimbursement rights - 2014
Opening value of reimbursement right 6,008 3,243 342,138 - 351,389Adjustment due to contribution taxassumption change 931 536 59,613 - 61,080
Opening defined benefit obligation 6,939 3,779 401,751 - 412,469
Expected return on reimbursement rights (3,925) (92) 9,017 - 5,000
Remeasurements 6,424 1,093 90,365 - 97,882
Closing value of reimbursement right 18 9,438 4,780 501,133 - 515,351
68
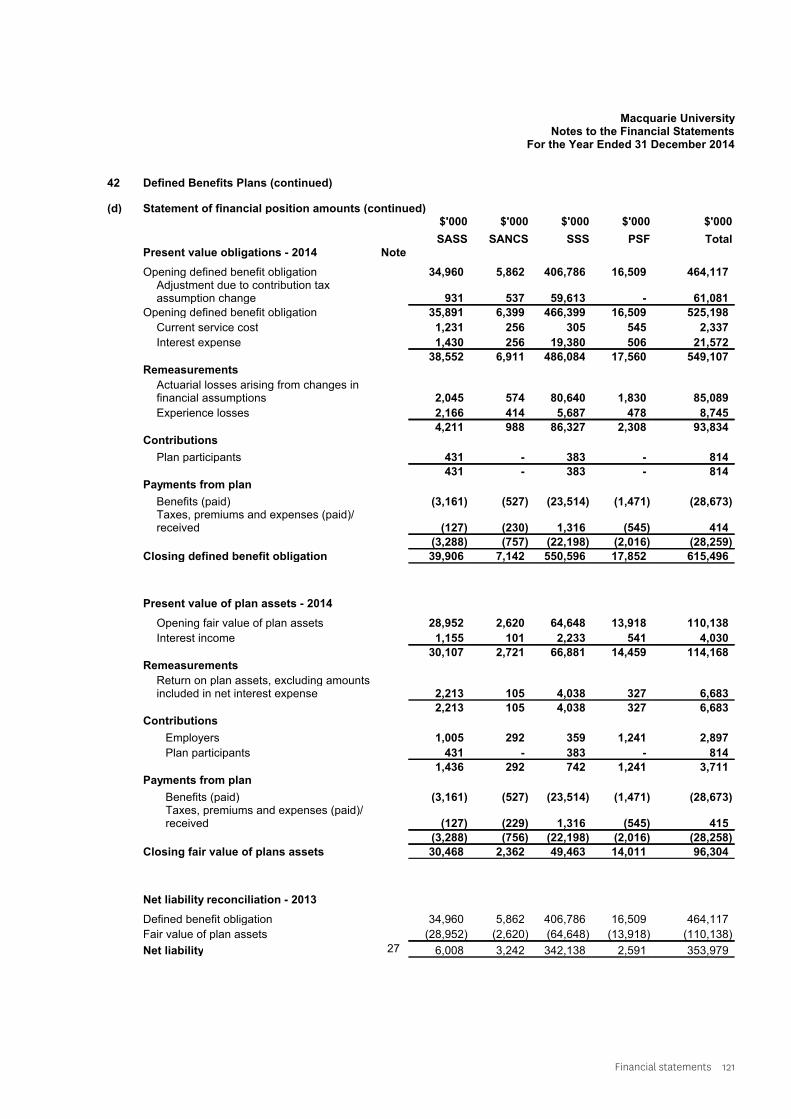
Financial statements 121
Macquarie UniversityNotes to the Financial Statements
For the Year Ended 31 December 2014
42 Defined Benefits Plans (continued)
(d) Statement of financial position amounts (continued)
Present value obligations - 2014 Note
$'000
SASS
$'000
SANCS
$'000
SSS
$'000
PSF
$'000
Total
Opening defined benefit obligation 34,960 5,862 406,786 16,509 464,117Adjustment due to contribution taxassumption change 931 537 59,613 - 61,081
Opening defined benefit obligation 35,891 6,399 466,399 16,509 525,198
Current service cost 1,231 256 305 545 2,337
Interest expense 1,430 256 19,380 506 21,572
38,552 6,911 486,084 17,560 549,107Remeasurements
Actuarial losses arising from changes infinancial assumptions 2,045 574 80,640 1,830 85,089
Experience losses 2,166 414 5,687 478 8,745
4,211 988 86,327 2,308 93,834Contributions
Plan participants 431 - 383 - 814
431 - 383 - 814Payments from plan
Benefits (paid) (3,161) (527) (23,514) (1,471) (28,673)Taxes, premiums and expenses (paid)/received (127) (230) 1,316 (545) 414
(3,288) (757) (22,198) (2,016) (28,259)
Closing defined benefit obligation 39,906 7,142 550,596 17,852 615,496
Present value of plan assets - 2014
Opening fair value of plan assets 28,952 2,620 64,648 13,918 110,138
Interest income 1,155 101 2,233 541 4,030
30,107 2,721 66,881 14,459 114,168Remeasurements
Return on plan assets, excluding amountsincluded in net interest expense 2,213 105 4,038 327 6,683
2,213 105 4,038 327 6,683Contributions
Employers 1,005 292 359 1,241 2,897
Plan participants 431 - 383 - 814
1,436 292 742 1,241 3,711Payments from plan
Benefits (paid) (3,161) (527) (23,514) (1,471) (28,673)Taxes, premiums and expenses (paid)/received (127) (229) 1,316 (545) 415
(3,288) (756) (22,198) (2,016) (28,258)
Closing fair value of plans assets 30,468 2,362 49,463 14,011 96,304
Net liability reconciliation - 2013
Defined benefit obligation 34,960 5,862 406,786 16,509 464,117
Fair value of plan assets (28,952) (2,620) (64,648) (13,918) (110,138)
Net liability 27 6,008 3,242 342,138 2,591 353,979
69
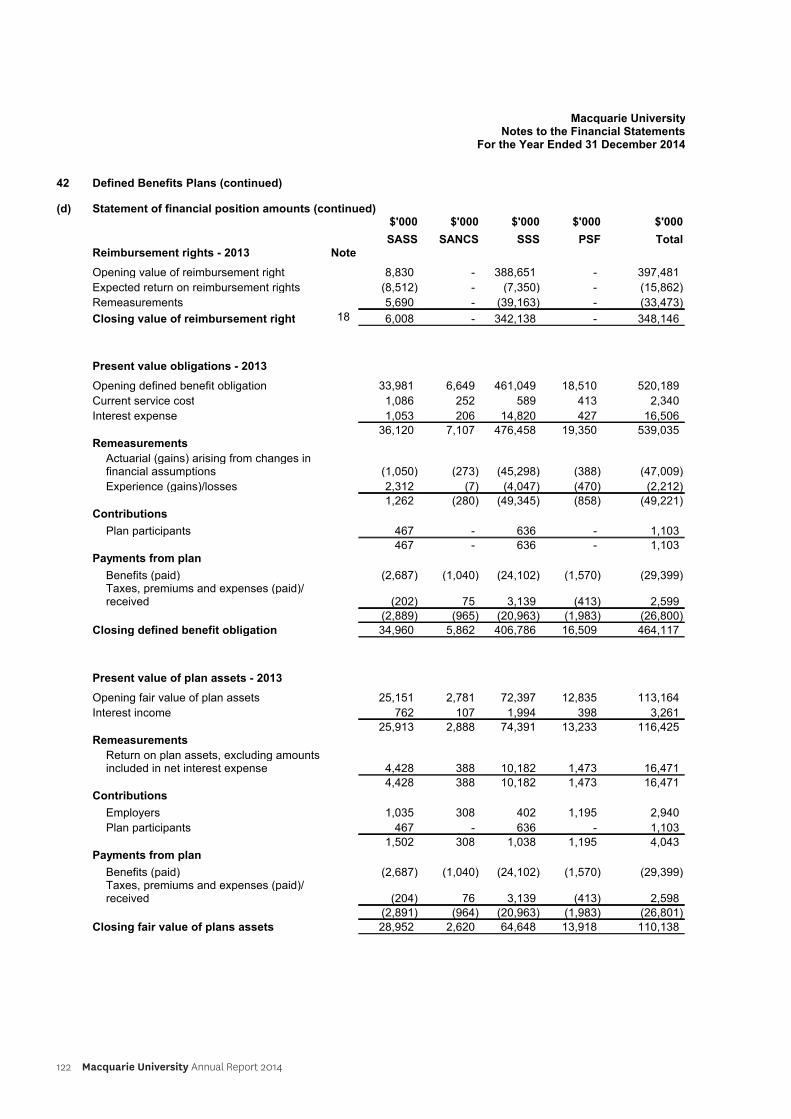
122 Macquarie University Annual Report 2014
Macquarie UniversityNotes to the Financial Statements
For the Year Ended 31 December 2014
42 Defined Benefits Plans (continued)
(d) Statement of financial position amounts (continued)
Reimbursement rights - 2013 Note
$'000
SASS
$'000
SANCS
$'000
SSS
$'000
PSF
$'000
Total
Opening value of reimbursement right 8,830 - 388,651 - 397,481
Expected return on reimbursement rights (8,512) - (7,350) - (15,862)
Remeasurements 5,690 - (39,163) - (33,473)
Closing value of reimbursement right 18 6,008 - 342,138 - 348,146
Present value obligations - 2013
Opening defined benefit obligation 33,981 6,649 461,049 18,510 520,189
Current service cost 1,086 252 589 413 2,340
Interest expense 1,053 206 14,820 427 16,506
36,120 7,107 476,458 19,350 539,035Remeasurements
Actuarial (gains) arising from changes infinancial assumptions (1,050) (273) (45,298) (388) (47,009)
Experience (gains)/losses 2,312 (7) (4,047) (470) (2,212)
1,262 (280) (49,345) (858) (49,221)Contributions
Plan participants 467 - 636 - 1,103
467 - 636 - 1,103Payments from plan
Benefits (paid) (2,687) (1,040) (24,102) (1,570) (29,399)Taxes, premiums and expenses (paid)/received (202) 75 3,139 (413) 2,599
(2,889) (965) (20,963) (1,983) (26,800)
Closing defined benefit obligation 34,960 5,862 406,786 16,509 464,117
Present value of plan assets - 2013
Opening fair value of plan assets 25,151 2,781 72,397 12,835 113,164
Interest income 762 107 1,994 398 3,261
25,913 2,888 74,391 13,233 116,425Remeasurements
Return on plan assets, excluding amountsincluded in net interest expense 4,428 388 10,182 1,473 16,471
4,428 388 10,182 1,473 16,471Contributions
Employers 1,035 308 402 1,195 2,940
Plan participants 467 - 636 - 1,103
1,502 308 1,038 1,195 4,043Payments from plan
Benefits (paid) (2,687) (1,040) (24,102) (1,570) (29,399)Taxes, premiums and expenses (paid)/received (204) 76 3,139 (413) 2,598
(2,891) (964) (20,963) (1,983) (26,801)
Closing fair value of plans assets 28,952 2,620 64,648 13,918 110,138
70
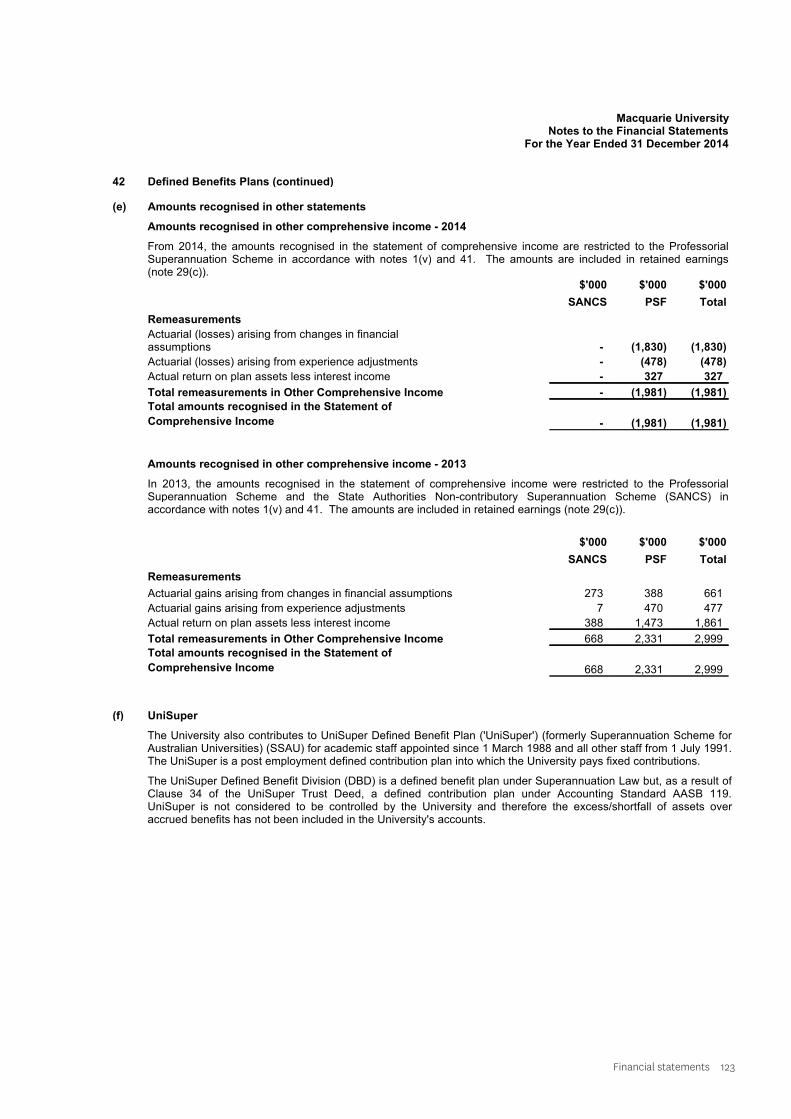
Financial statements 123
Macquarie UniversityNotes to the Financial Statements
For the Year Ended 31 December 2014
42 Defined Benefits Plans (continued)
(e) Amounts recognised in other statements
Amounts recognised in other comprehensive income - 2014
From 2014, the amounts recognised in the statement of comprehensive income are restricted to the ProfessorialSuperannuation Scheme in accordance with notes 1(v) and 41. The amounts are included in retained earnings(note 29(c)).
$'000
SANCS
$'000
PSF
$'000
Total
Remeasurements
Actuarial (losses) arising from changes in financialassumptions - (1,830) (1,830)
Actuarial (losses) arising from experience adjustments - (478) (478)
Actual return on plan assets less interest income - 327 327
Total remeasurements in Other Comprehensive Income - (1,981) (1,981)
Total amounts recognised in the Statement of
Comprehensive Income - (1,981) (1,981)
Amounts recognised in other comprehensive income - 2013
In 2013, the amounts recognised in the statement of comprehensive income were restricted to the ProfessorialSuperannuation Scheme and the State Authorities Non-contributory Superannuation Scheme (SANCS) inaccordance with notes 1(v) and 41. The amounts are included in retained earnings (note 29(c)).
$'000
SANCS
$'000
PSF
$'000
Total
Remeasurements
Actuarial gains arising from changes in financial assumptions 273 388 661
Actuarial gains arising from experience adjustments 7 470 477
Actual return on plan assets less interest income 388 1,473 1,861
Total remeasurements in Other Comprehensive Income 668 2,331 2,999
Total amounts recognised in the Statement of
Comprehensive Income 668 2,331 2,999
(f) UniSuper
The University also contributes to UniSuper Defined Benefit Plan ('UniSuper') (formerly Superannuation Scheme for Australian Universities) (SSAU) for academic staff appointed since 1 March 1988 and all other staff from 1 July 1991. The UniSuper is a post employment defined contribution plan into which the University pays fixed contributions.
The UniSuper Defined Benefit Division (DBD) is a defined benefit plan under Superannuation Law but, as a result of Clause 34 of the UniSuper Trust Deed, a defined contribution plan under Accounting Standard AASB 119. UniSuper is not considered to be controlled by the University and therefore the excess/shortfall of assets over accrued benefits has not been included in the University's accounts.
71
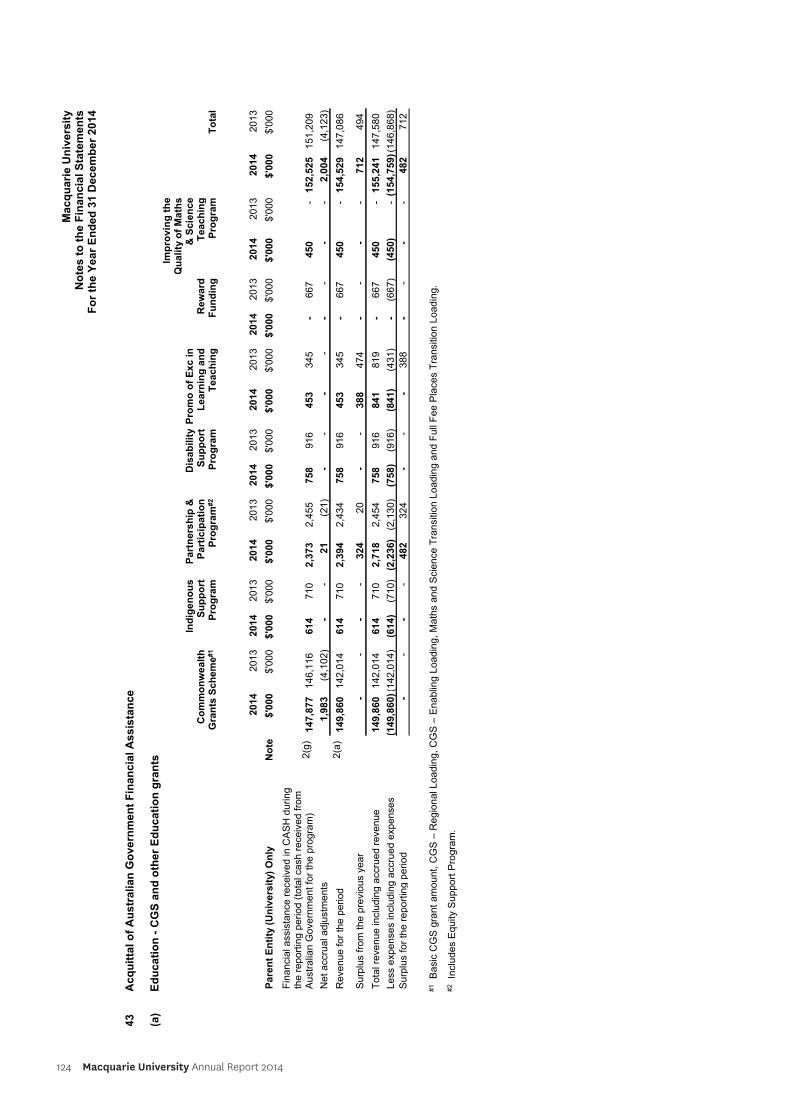
124 Macquarie University Annual Report 2014
Ma
cq
ua
rie
Un
ive
rsit
yN
ote
s t
o t
he
Fin
an
cia
l S
tate
me
nts
F
or
the
Ye
ar
En
de
d 3
1 D
ec
em
be
r 2
01
4
43
Ac
qu
itta
l o
f A
us
tra
lia
n G
ov
ern
me
nt
Fin
an
cia
l A
ss
ista
nc
e
(a)
Ed
uc
ati
on
- C
GS
an
d o
the
r E
du
ca
tio
n g
ran
ts
Co
mm
on
we
alt
hG
ran
ts S
ch
em
e#1
Ind
ige
no
us
Su
pp
ort
Pro
gra
m
Part
ners
hip
&P
art
icip
ati
on
Pro
gra
m#2
Dis
ab
ilit
yS
up
po
rtP
rog
ram
Pro
mo
of
Ex
c i
nL
ea
rnin
g a
nd
Teach
ing
Rew
ard
Fu
nd
ing
Imp
rov
ing
th
eQ
ua
lity
of
Ma
ths
& S
cie
nce
Teach
ing
Pro
gra
mT
ota
l
Pare
nt
En
tity
(U
niv
ers
ity)
On
lyN
ote
2014
$'0
00
2013
$'0
00
2014
$'0
00
2013
$'0
00
2014
$'0
00
2013
$'0
00
2014
$'0
00
2013
$'0
00
2014
$'0
00
2013
$'0
00
2014
$'0
00
2013
$'0
00
2014
$'0
00
2013
$'0
00
2014
$'0
00
2013
$'0
00
Fin
anci
al a
ssis
tance
rece
ived in
CA
SH
during
the r
eport
ing p
eriod (
tota
l cash
rece
ived fro
mA
ust
ralia
n G
ove
rnm
ent fo
r th
e p
rogra
m)
2(g
)147,8
77
146,1
16
614
710
2,3
73
2,4
55
758
916
453
345
-667
450
-152,5
25
151,2
09
Ne
t a
ccru
al a
dju
stm
en
ts1,9
83
(4,1
02)
--
21
(21)
--
--
--
--
2,0
04
(4,1
23)
Reve
nue for
the p
eriod
2(a
)149,8
60
142,0
14
614
710
2,3
94
2,4
34
758
916
453
345
-667
450
-154,5
29
147,0
86
Surp
lus
from
the p
revi
ous
year
--
--
324
20
--
388
474
--
--
712
494
Tota
l reve
nue in
cludin
g a
ccru
ed r
eve
nue
149,8
60
142,0
14
614
710
2,7
18
2,4
54
758
916
841
819
-667
450
-155,2
41
147,5
80
Less
exp
ense
s in
cludin
g a
ccru
ed e
xpense
s(1
49,8
60)(
142,0
14)
(614)
(710)
(2,2
36)
(2,1
30)
(758)
(916)
(841)
(431)
-(6
67)
(450)
-(1
54,7
59)(
146,8
68)
Surp
lus
for
the r
eport
ing p
eriod
--
--
482
324
--
-388
--
--
482
712
#1 B
asi
c C
GS
gra
nt am
ount, C
GS
– R
egio
nal L
oadin
g, C
GS
– E
nablin
g L
oadin
g, M
ath
s and S
cience
Tra
nsi
tion L
oadin
g a
nd F
ull
Fee P
laces T
ransitio
n L
oadin
g.
#2
Inclu
de
s E
qu
ity S
up
po
rt P
rog
ram
.
72
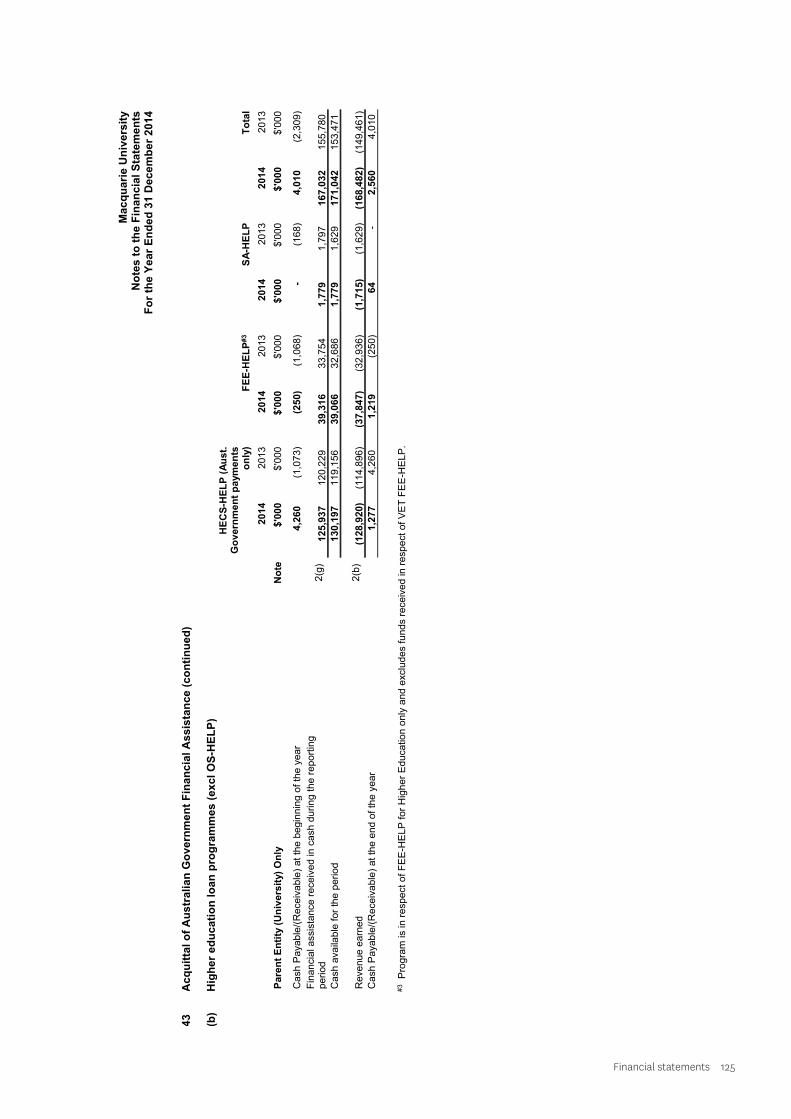
Financial statements 125
Ma
cq
ua
rie
Un
ive
rsit
yN
ote
s t
o t
he
Fin
an
cia
l S
tate
me
nts
F
or
the
Ye
ar
En
de
d 3
1 D
ec
em
be
r 2
01
4
43
Ac
qu
itta
l o
f A
us
tra
lia
n G
ov
ern
me
nt
Fin
an
cia
l A
ss
ista
nc
e (
co
nti
nu
ed
)
(b)
Hig
he
r e
du
ca
tio
n l
oa
n p
rog
ram
me
s (
ex
cl
OS
-HE
LP
)H
EC
S-H
EL
P (
Au
st.
Go
vern
men
t p
aym
en
tso
nly
)F
EE
-HE
LP
#3
SA
-HE
LP
To
tal
Pa
ren
t E
nti
ty (
Un
ivers
ity)
On
lyN
ote
2014
$'0
00
2013
$'0
00
2014
$'0
00
2013
$'0
00
2014
$'0
00
2013
$'0
00
2014
$'0
00
2013
$'0
00
Cash
Paya
ble
/(R
ece
ivable
) at th
e b
egin
nin
g o
f th
e y
ear
4,2
60
(1,0
73)
(250)
(1,0
68)
-(1
68)
4,0
10
(2,3
09)
Fin
an
cia
l a
ssis
tan
ce r
ece
ive
d in
ca
sh
du
rin
g t
he
re
po
rtin
gperiod
2(g
)125,9
37
120,2
29
39,3
16
33,7
54
1,7
79
1,7
97
167,0
32
155,7
80
Cash
ava
ilable
for
the p
eriod
130,1
97
119,1
56
39,0
66
32,6
86
1,7
79
1,6
29
171,0
42
153,4
71
Reve
nue e
arn
ed
2(b
)(1
28,9
20)
(114,8
96)
(37,8
47)
(32,9
36)
(1,7
15)
(1,6
29)
(168,4
82)
(149,4
61)
Cash
Paya
ble
/(R
ece
ivable
) at th
e e
nd o
f th
e y
ear
1,2
77
4,2
60
1,2
19
(250)
64
-2,5
60
4,0
10
#3
Pro
gra
m is in
re
sp
ect
of
FE
E-H
EL
P f
or
Hig
he
r E
du
ca
tio
n o
nly
an
d e
xclu
de
s f
un
ds r
ece
ive
d in
re
sp
ect
of
VE
T F
EE
-HE
LP
.
73
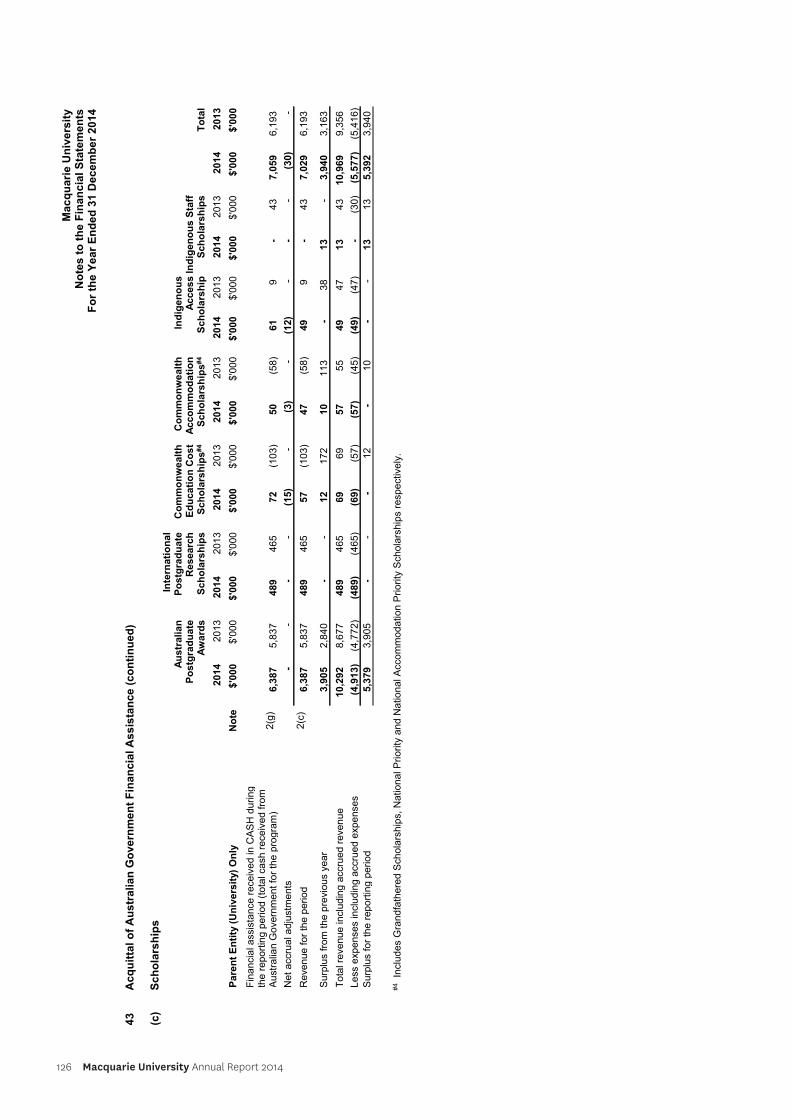
126 Macquarie University Annual Report 2014
Ma
cq
ua
rie
Un
ive
rsit
yN
ote
s t
o t
he
Fin
an
cia
l S
tate
me
nts
F
or
the
Ye
ar
En
de
d 3
1 D
ec
em
be
r 2
01
4
43
Ac
qu
itta
l o
f A
us
tra
lia
n G
ov
ern
me
nt
Fin
an
cia
l A
ss
ista
nc
e (
co
nti
nu
ed
)
(c)
Sc
ho
lars
hip
s
Au
str
alian
Po
stg
rad
uate
Aw
ard
s
Inte
rnati
on
al
Po
stg
rad
uate
Researc
hS
ch
ola
rsh
ips
Co
mm
on
we
alt
hE
du
ca
tio
n C
os
tS
ch
ola
rsh
ips
#4
Co
mm
on
we
alt
hA
cc
om
mo
da
tio
nS
ch
ola
rsh
ips
#4
Ind
ige
no
us
Access
Sc
ho
lars
hip
Ind
ige
no
us
Sta
ffS
ch
ola
rsh
ips
To
tal
Pa
ren
t E
nti
ty (
Un
ivers
ity)
On
lyN
ote
2014
$'0
00
2013
$'0
00
2014
$'0
00
2013
$'0
00
2014
$'0
00
2013
$'0
00
2014
$'0
00
2013
$'0
00
2014
$'0
00
2013
$'0
00
2014
$'0
00
2013
$'0
00
2014
$'0
00
2013
$'0
00
Fin
an
cia
l a
ssi
sta
nce
re
ceiv
ed
in C
AS
H d
urin
gth
e r
ep
ort
ing
pe
rio
d (
tota
l ca
sh r
ece
ive
d f
rom
Au
stra
lian
Go
vern
me
nt
for
the
pro
gra
m)
2(g
)6,3
87
5,8
37
489
465
72
(103)
50
(58)
61
9-
43
7,0
59
6,1
93
Ne
t a
ccru
al a
dju
stm
en
ts-
--
-(1
5)
-(3
)-
(12)
--
-(3
0)
-
Reve
nue for
the p
eriod
2(c
)6,3
87
5,8
37
489
465
57
(103)
47
(58)
49
9-
43
7,0
29
6,1
93
Su
rplu
s fr
om
th
e p
revi
ou
s ye
ar
3,9
05
2,8
40
--
12
172
10
113
-38
13
-3,9
40
3,1
63
Tota
l reve
nue in
cludin
g a
ccru
ed r
eve
nue
10,2
92
8,6
77
489
465
69
69
57
55
49
47
13
43
10,9
69
9,3
56
Less
exp
ense
s in
cludin
g a
ccru
ed e
xpense
s(4
,913)
(4,7
72)
(489)
(465)
(69)
(57)
(57)
(45)
(49)
(47)
-(3
0)
(5,5
77)
(5,4
16)
Surp
lus
for
the r
eport
ing p
eriod
5,3
79
3,9
05
--
-12
-10
--
13
13
5,3
92
3,9
40
#4
Incl
ud
es
Gra
nd
fath
ere
d S
cho
lars
hip
s,
Na
tion
al P
rio
rity
an
d N
atio
na
l Acc
om
mo
da
tion
Prio
rity
Sch
ola
rsh
ips
resp
ect
ive
ly.
74
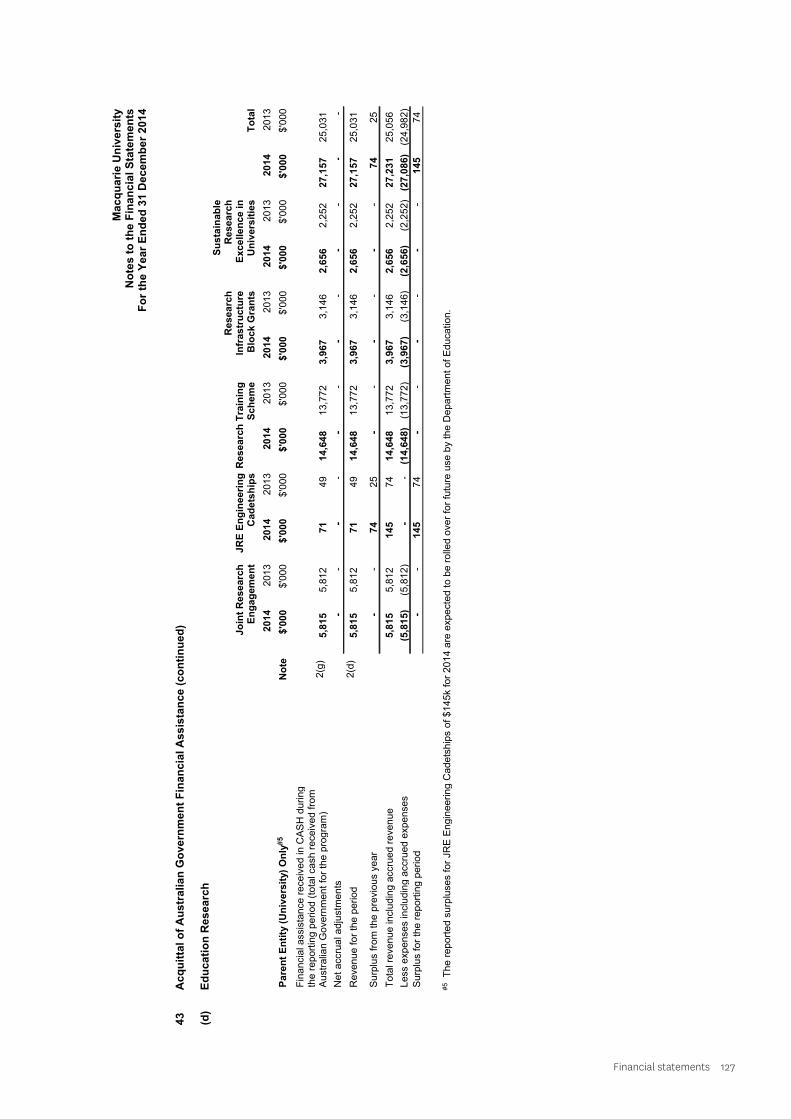
Financial statements 127
Ma
cq
ua
rie
Un
ive
rsit
yN
ote
s t
o t
he
Fin
an
cia
l S
tate
me
nts
F
or
the
Ye
ar
En
de
d 3
1 D
ec
em
be
r 2
01
4
43
Ac
qu
itta
l o
f A
us
tra
lia
n G
ov
ern
me
nt
Fin
an
cia
l A
ss
ista
nc
e (
co
nti
nu
ed
)
(d)
Ed
uc
ati
on
Re
se
arc
h
Jo
int
Researc
hE
ng
ag
em
en
tJ
RE
En
gin
ee
rin
gC
ad
ets
hip
sR
esearc
h T
rain
ing
Sc
he
me
Researc
hIn
frastr
uctu
reB
lock G
ran
ts
Su
sta
ina
ble
Researc
hE
xc
ell
en
ce
in
Un
ivers
itie
sT
ota
l
Pa
ren
t E
nti
ty (
Un
ivers
ity)
On
ly#
5N
ote
2014
$'0
00
2013
$'0
00
2014
$'0
00
2013
$'0
00
2014
$'0
00
2013
$'0
00
2014
$'0
00
2013
$'0
00
2014
$'0
00
2013
$'0
00
2014
$'0
00
2013
$'0
00
Fin
an
cia
l ass
ista
nce
re
ceiv
ed
in C
AS
H d
urin
gth
e r
ep
ort
ing
pe
rio
d (
tota
l ca
sh
re
ceiv
ed
fro
mA
ustr
alia
n G
ove
rnm
en
t fo
r th
e p
rog
ram
)2(g
)5,8
15
5,8
12
71
49
14,6
48
13,7
72
3,9
67
3,1
46
2,6
56
2,2
52
27,1
57
25,0
31
Ne
t a
ccru
al a
dju
stm
en
ts-
--
--
--
--
--
-
Reve
nue for
the p
eriod
2(d
)5,8
15
5,8
12
71
49
14,6
48
13,7
72
3,9
67
3,1
46
2,6
56
2,2
52
27,1
57
25,0
31
Su
rplu
s fr
om
th
e p
revio
us
yea
r-
-74
25
--
--
--
74
25
Tota
l reve
nue in
cludin
g a
ccru
ed r
eve
nue
5,8
15
5,8
12
145
74
14,6
48
13,7
72
3,9
67
3,1
46
2,6
56
2,2
52
27,2
31
25,0
56
Less
exp
ense
s in
cludin
g a
ccru
ed e
xpense
s(5
,815)
(5,8
12)
--
(14,6
48)
(13,7
72)
(3,9
67)
(3,1
46)
(2,6
56)
(2,2
52)
(27,0
86)
(24,9
82)
Surp
lus
for
the r
eport
ing p
eriod
--
145
74
--
--
--
145
74
#5
Th
e r
ep
ort
ed
su
rplu
ses
for
JRE
Engin
eering C
adets
hip
s o
f $
14
5k
for
20
14
are
exp
ect
ed
to
be
ro
lled
ove
r fo
r fu
ture
use
by
the
De
pa
rtm
en
t o
f E
du
catio
n.
75
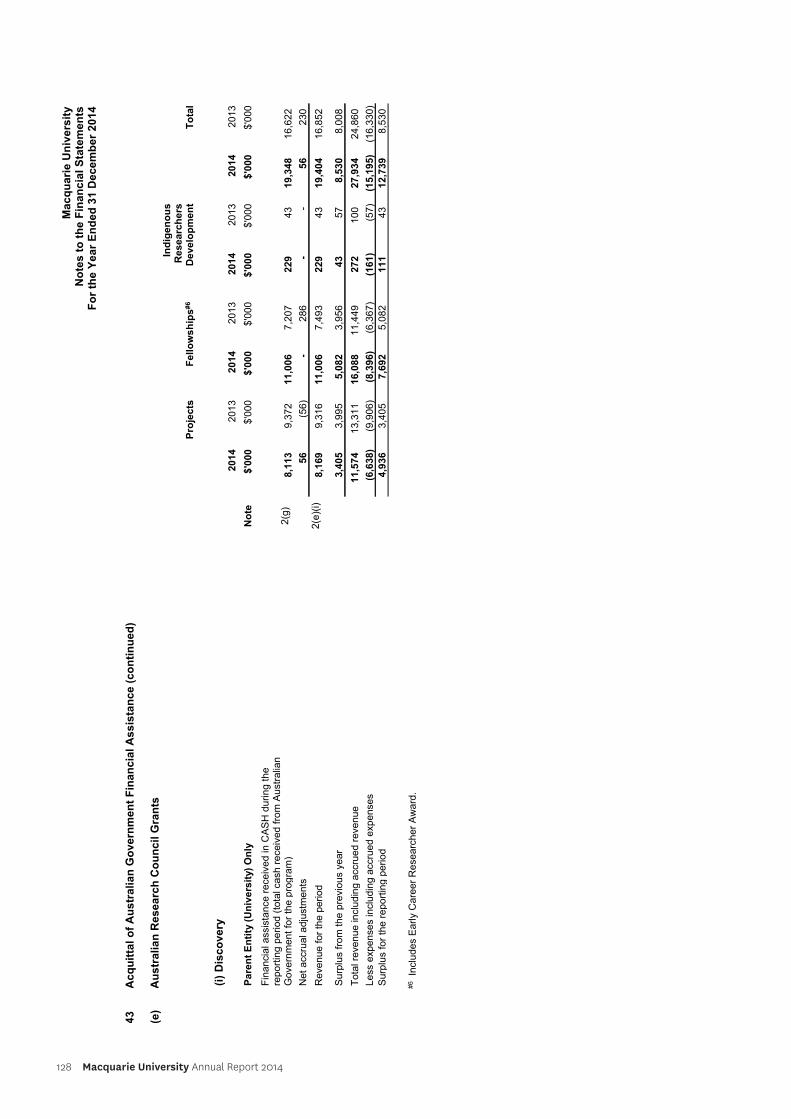
128 Macquarie University Annual Report 2014
Ma
cq
ua
rie
Un
ive
rsit
yN
ote
s t
o t
he
Fin
an
cia
l S
tate
me
nts
F
or
the
Ye
ar
En
de
d 3
1 D
ec
em
be
r 2
01
4
43
Ac
qu
itta
l o
f A
us
tra
lia
n G
ov
ern
me
nt
Fin
an
cia
l A
ss
ista
nc
e (
co
nti
nu
ed
)
(e)
Au
str
ali
an
Re
se
arc
h C
ou
nc
il G
ran
ts
Pro
jects
Fe
llo
ws
hip
s#6
Ind
ige
no
us
Researc
hers
Develo
pm
en
tT
ota
l
(i)
Dis
co
very
Pa
ren
t E
nti
ty (
Un
ivers
ity)
On
lyN
ote
2014
$'0
00
2013
$'0
00
2014
$'0
00
2013
$'0
00
2014
$'0
00
2013
$'0
00
2014
$'0
00
2013
$'0
00
Fin
an
cia
l a
ssi
sta
nce
re
ceiv
ed
in
CA
SH
du
rin
g t
he
rep
ort
ing
pe
rio
d (
tota
l ca
sh r
ece
ive
d f
rom
Au
stra
lian
Go
vern
me
nt
for
the
pro
gra
m)
2(g
)8,1
13
9,3
72
11,0
06
7,2
07
229
43
19,3
48
16,6
22
Ne
t a
ccru
al a
dju
stm
en
ts56
(56)
-286
--
56
230
Reve
nue for
the p
eriod
2(e
)(i)
8,1
69
9,3
16
11,0
06
7,4
93
229
43
19,4
04
16,8
52
Su
rplu
s f
rom
th
e p
revi
ou
s ye
ar
3,4
05
3,9
95
5,0
82
3,9
56
43
57
8,5
30
8,0
08
Tota
l reve
nue in
cludin
g a
ccru
ed r
eve
nue
11,5
74
13,3
11
16,0
88
11,4
49
272
100
27,9
34
24,8
60
Less
exp
ense
s in
cludin
g a
ccru
ed e
xpense
s(6
,638)
(9,9
06)
(8,3
96)
(6,3
67)
(161)
(57)
(15,1
95)
(16,3
30)
Surp
lus
for
the r
eport
ing p
eriod
4,9
36
3,4
05
7,6
92
5,0
82
111
43
12,7
39
8,5
30
#6 In
cludes
Early
Care
er
Rese
arc
her
Aw
ard
.
76
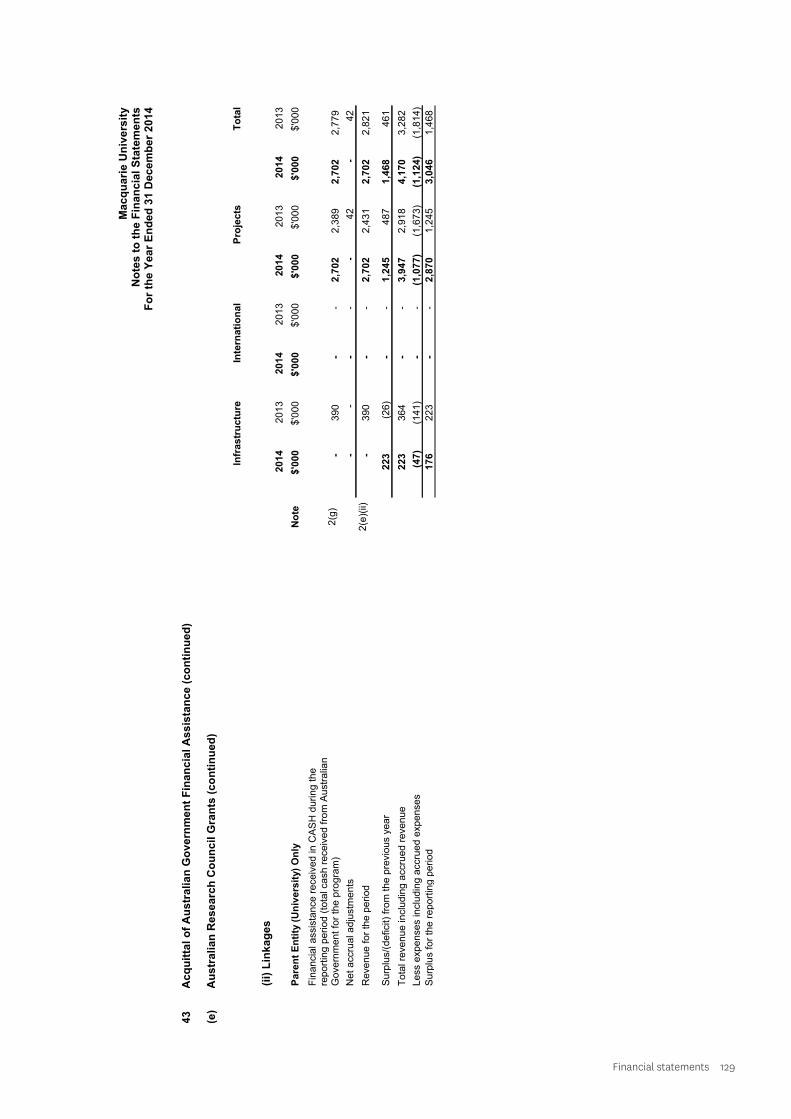
Financial statements 129
Ma
cq
ua
rie
Un
ive
rsit
yN
ote
s t
o t
he
Fin
an
cia
l S
tate
me
nts
F
or
the
Ye
ar
En
de
d 3
1 D
ec
em
be
r 2
01
4
43
Ac
qu
itta
l o
f A
us
tra
lia
n G
ov
ern
me
nt
Fin
an
cia
l A
ss
ista
nc
e (
co
nti
nu
ed
)
(e)
Au
str
ali
an
Re
se
arc
h C
ou
nc
il G
ran
ts (
co
nti
nu
ed
)
Infr
astr
uctu
reIn
tern
ati
on
al
Pro
jects
To
tal
(ii)
Lin
ka
ge
s
Pare
nt
En
tity
(U
niv
ers
ity)
On
lyN
ote
2014
$'0
00
2013
$'0
00
2014
$'0
00
2013
$'0
00
2014
$'0
00
2013
$'0
00
2014
$'0
00
2013
$'0
00
Fin
anci
al a
ssis
tance
rece
ived in
CA
SH
during the
report
ing p
eriod (
tota
l cash
rece
ived fro
m A
ust
ralia
nG
ove
rnm
ent fo
r th
e p
rogra
m)
2(g
)-
390
--
2,7
02
2,3
89
2,7
02
2,7
79
Ne
t a
ccru
al a
dju
stm
en
ts-
--
--
42
-42
Reve
nue for
the p
eriod
2(e
)(ii)
-390
--
2,7
02
2,4
31
2,7
02
2,8
21
Surp
lus/
(defic
it) fro
m the p
revi
ous
year
223
(26)
--
1,2
45
487
1,4
68
461
Tota
l reve
nue in
cludin
g a
ccru
ed r
eve
nue
223
364
--
3,9
47
2,9
18
4,1
70
3,2
82
Less
exp
ense
s in
cludin
g a
ccru
ed e
xpense
s(4
7)
(141)
--
(1,0
77)
(1,6
73)
(1,1
24)
(1,8
14)
Surp
lus
for
the r
eport
ing p
eriod
176
223
--
2,8
70
1,2
45
3,0
46
1,4
68
77
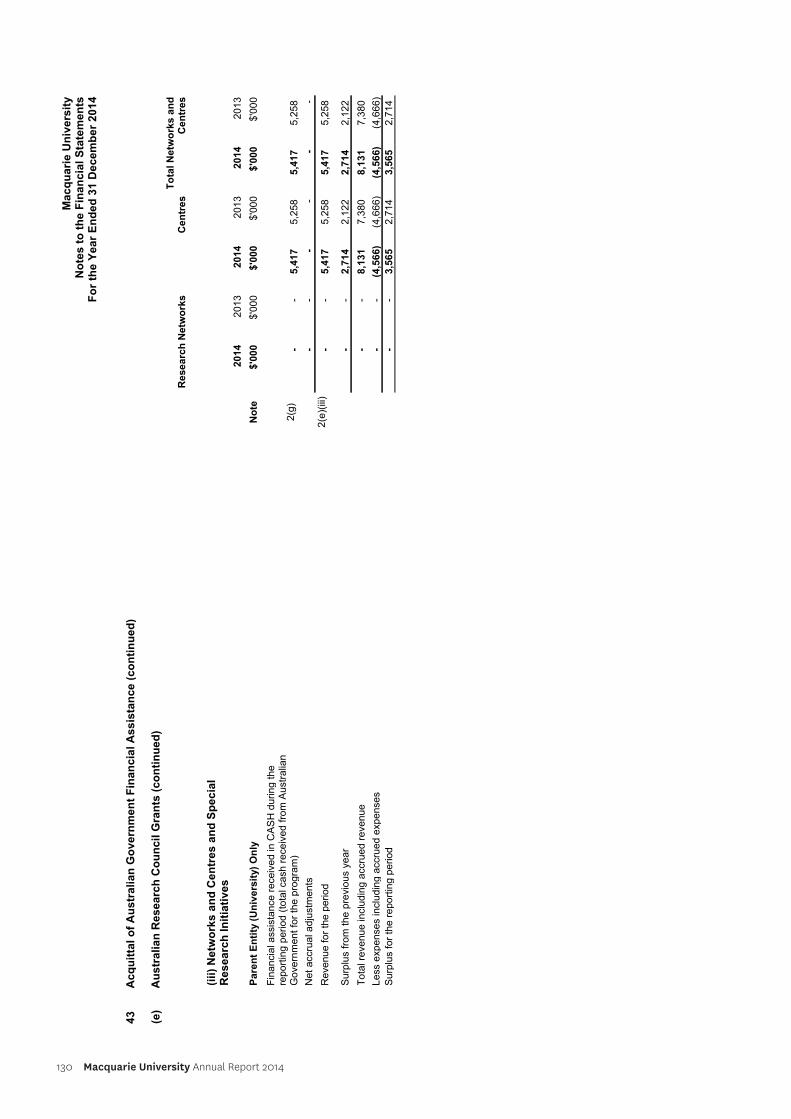
130 Macquarie University Annual Report 2014
Ma
cq
ua
rie
Un
ive
rsit
yN
ote
s t
o t
he
Fin
an
cia
l S
tate
me
nts
F
or
the
Ye
ar
En
de
d 3
1 D
ec
em
be
r 2
01
4
43
Ac
qu
itta
l o
f A
us
tra
lia
n G
ov
ern
me
nt
Fin
an
cia
l A
ss
ista
nc
e (
co
nti
nu
ed
)
(e)
Au
str
ali
an
Re
se
arc
h C
ou
nc
il G
ran
ts (
co
nti
nu
ed
)
Researc
h N
etw
ork
sC
en
tres
To
tal N
etw
ork
s a
nd
Cen
tres
(iii
) N
etw
ork
s a
nd
Ce
ntr
es
an
d S
pe
cia
lR
es
ea
rch
In
itia
tiv
es
Pare
nt
En
tity
(U
niv
ers
ity)
On
lyN
ote
2014
$'0
00
2013
$'0
00
2014
$'0
00
2013
$'0
00
2014
$'0
00
2013
$'0
00
Fin
anci
al a
ssis
tance
receiv
ed in
CA
SH
during the
report
ing p
eriod (
tota
l cash
rece
ived fro
m A
ust
ralia
nG
ove
rnm
ent fo
r th
e p
rogra
m)
2(g
)-
-5,4
17
5,2
58
5,4
17
5,2
58
Ne
t a
ccru
al a
dju
stm
en
ts-
--
--
-
Reve
nue for
the p
eriod
2(e
)(iii
)-
-5,4
17
5,2
58
5,4
17
5,2
58
Surp
lus
from
the p
revio
us y
ear
--
2,7
14
2,1
22
2,7
14
2,1
22
Tota
l reve
nue in
cludin
g a
ccru
ed r
eve
nue
--
8,1
31
7,3
80
8,1
31
7,3
80
Less
exp
ense
s in
cludin
g a
ccru
ed e
xpense
s-
-(4
,566)
(4,6
66)
(4,5
66)
(4,6
66)
Surp
lus
for
the r
eport
ing p
eriod
--
3,5
65
2,7
14
3,5
65
2,7
14
78
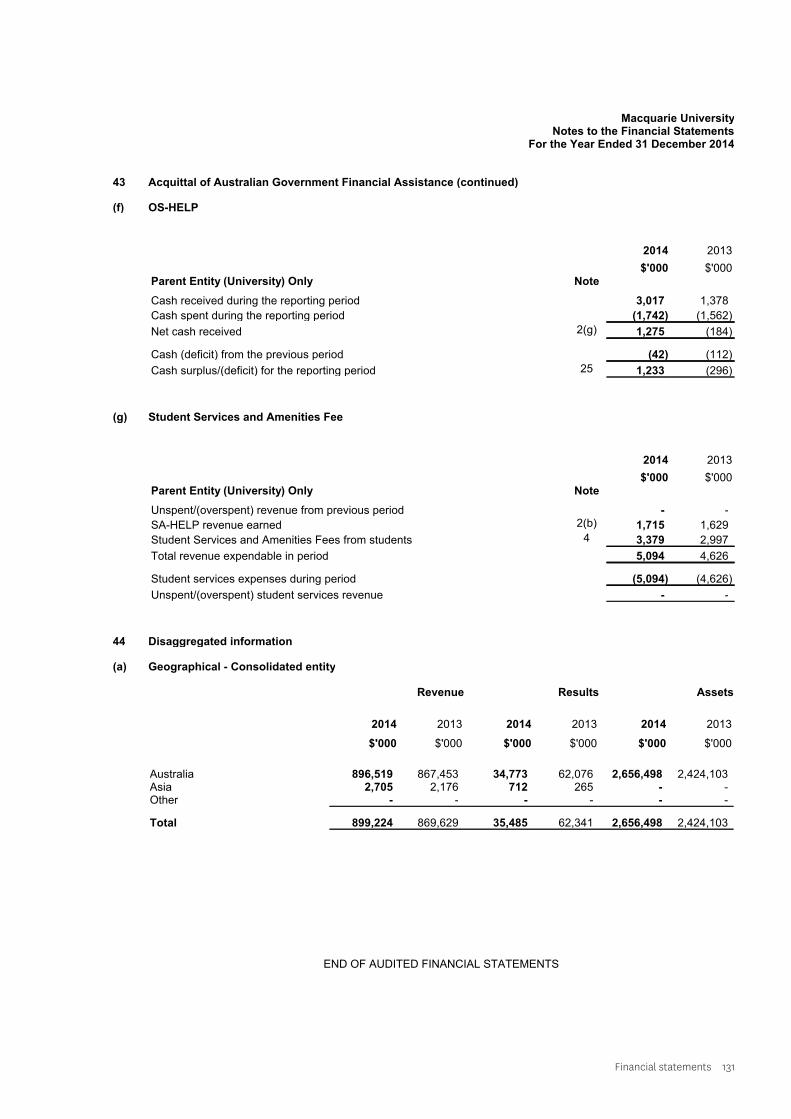
Financial statements 131
Macquarie UniversityNotes to the Financial Statements
For the Year Ended 31 December 2014
43 Acquittal of Australian Government Financial Assistance (continued)
(f) OS-HELP
Parent Entity (University) Only Note
2014
$'000
2013
$'000
Cash received during the reporting period 3,017 1,378
Cash spent during the reporting period (1,742) (1,562)
Net cash received 2(g) 1,275 (184)
Cash (deficit) from the previous period (42) (112)
Cash surplus/(deficit) for the reporting period 25 1,233 (296)
(g) Student Services and Amenities Fee
Parent Entity (University) Only Note
2014
$'000
2013
$'000
Unspent/(overspent) revenue from previous period - -
SA-HELP revenue earned 2(b) 1,715 1,629
Student Services and Amenities Fees from students 4 3,379 2,997
Total revenue expendable in period 5,094 4,626
Student services expenses during period (5,094) (4,626)
Unspent/(overspent) student services revenue - -
44 Disaggregated information
(a) Geographical - Consolidated entity
Revenue Results Assets
2014
$'000
2013
$'000
2014
$'000
2013
$'000
2014
$'000
2013
$'000
Australia 896,519 867,453 34,773 62,076 2,656,498 2,424,103Asia 2,705 2,176 712 265 - -Other - - - - - -
Total 899,224 869,629 35,485 62,341 2,656,498 2,424,103
END OF AUDITED FINANCIAL STATEMENTS
79
132 Macquarie University Annual Report 2014
Index
AAboriginal people and Torres Strait Islanders,
see equity, diversity and inclusionAcademic Appeals Committee, 12Academic Senate, 24access, inside front coverAccess Macquarie Ltd, 47, 98, 99accounts, payment of, 43alternative pathways to university, 15alumni relations, 14appeals, academic, 12audit, internal, 42Australian Hearing Hub, 37Australian Proteome Analysis Facility Ltd, 47, 99ARC College of Experts, 6ARC Future Fellowships, 9awards received by academic staff AMP Tomorrow Makers Awards, 8 ARC Discovery Early Career Researcher Awards, 9 Australia Day Honours, 10 Australian Academy of Science Awards, 8 Fellow of the Australian Academy of the Humanities, 8 New South Wales Premier’s History Awards, 8 New South Wales Scientist of the Year, 8 Office of Learning and Teaching Citations, 11 Paul Bourke Award for Early Career Research, 8 UNESCO-L’Oreal for Women in Science Award, 8 Young Tall Poppy Science Awards, 11
Bbalance sheet, consolidated, 45budgets, 46
CCALD engagement activities, 17CMBF Ltd, 47, 98, 99Centre for Open Education, 10COH Property Trust, 47, 99community engagement, 10, 16, 19complaints, student, see grievancescompletions, higher degree research, 7controlled entities, 47, 98, 99costs incurred in production of report, inside front covercotutelle agreements, 13
Council, members of, 33 report by members of, 30–31credit card certification, 42cultural diversity, see Equity, diversity and inclusion
Ddegrees awarded, 11disability, people with a, 15–17, 25
EEEO, see employment equity and diversityEmployment equity and diversity, 24employment equity goals, 26Engagement and advancement, 14energy, 19, 20enrolments, 11 higher degree research, 7entities, controlled, see controlled entitiesentry pathways, 10, 15environmental regulation, 30 see also sustainabilityequal employment opportunity, 27–29Equity, diversity and inclusion, 15executive performance summary, 34expense analysis, consolidated, 45
Ffacilities, see infrastructure, 37Financial performance, 45fraud and corruption, see statement of attitude to, 43freedom of information, 38funding, research, 9Furniture re-use store, 20Faculty of Medicine and Health Sciences, 6, 9
GGIPA, see Government Information (Public Access), 38statistics, 39–41 Global Leadership Entry Program, 10Global Leadership Program, 13Governance and management, 30–36
Index 133
grants Diversity, 18 Government, 45 Indigenous student, 16 National Learning and Teaching Grants, 11 Parental Leave Research Grants, 25 research, 6, 9grievances, 12
Hhealth and safety, 22higher degree research students, 6, 7Hospital, Macquarie University, 42, 45, 47, 98, 99human resources, 21–29
Iincome analysis, consolidated, 45income, research, 9Indigenous people, 15, 16 engagement, 16 outreach, 16 cadetships, 17 staff development fund, 17industrial relations, 21Infrastructure, 37insurance, 31, 42internal audit and risk management, 42internationalisation, 13investment performance, 45
JJubilee Scheme, 15
LLAMS International Pty Ltd, 47Learning and teaching, 10–13Learning Skills Program, 17Learning Skills Program, Higher degree research, 7letter of submission, 3Lighthouse Scheme, 15
Mmanagement and structure, 32–36Marketing unit, 14Master Plan, 37Macquarie University Act, establishment of Council under, 33Macquarie University Hospital, 42, 45, 47, 98, 99Macquarie University Property Investment Company Pty Ltd, 47, 99, 100Macquarie University Property Investment Trust, 47, 99Macquarie University Spatial Experience (MUSE), 37MGSM Ltd, 47, 99, 100meetings, Council members’ attendance at, 34Message from the Vice-Chancellor, 4MUH Operations No. 2 Pty Ltd, 47, 98, 99Muliticultural Policies and Services Program, 17, 18
NNHMRC (National Health and Medical Research Council), 6, 8National Indigenous Science Education program (NISEP), 16Next Step, 15
OOffice of Advancement, 14Office of Corporate Engagement, 14Open Universities Australia, 10, 15Operations, 38organisation chart, 32Our Shared Identity, 14outcomes, research, see research, 6overseas travel, see travel
PPACE (Professional and Community Engagement), 10, 13, 43partnerships, research, 8Patyegarang – Aboriginal and Torres Strait Islander People’s Advancement Strategy, 16pathways to university, 15payment of accounts, 43performance summary, executive, 34policies, staff, 21principal activities, 30principal office bearers, 33privacy, 43publications, research, 6Public Interest Disclosures, 43
Index continued
134 Macquarie University Annual Report 2014
R‘Racism. It stops with me’ campaign, 26remuneration, senior executive, 22Report by Members of Council, 30research, 6–9research funding, 9research partnerships, 8research publications, 6Retro-Paid Loss Premium, 23returns on investments, 45review of operations, 30Risk Frontiers Flood (Australia) Pty Ltd, 47, 99risk analysis, 45risk management, 42Rural Bonus Scheme, 15
Ssafety, see health and safety, 22salary movements, 21scholarships, 7, 13, 14, 16, 17, 21senior executive remuneration, 22Staff, 21–29statement of attitude to fraud and corruption, 43statement on digital information security, 43statement on workforce diversity achievements, 24statistics equal employment opportunity, 27-29 Government Information (Public Access), 39–41 health and safety, 22–24 staff, 21–22 student enrolments, 11 student awards, 12student code of conduct, 12student enrolments, 11student feedback, 12student experience, 12Student Ombudsman, 12students, 11–12 complaints, see grievances, 12 degrees awarded, 12 enrolment statistics, 11–12 higher degree research, 7 internationalisation, 13 representation, 12special entry schemes, 15support services, 17
summary review of operations, see principal activitiessuperannuation, state schemes, 45Sustainability, 19–20
Tteaching, see learning and teachingTimes Higher Education Rankings, 13travel, 43
UU@MQ Ltd, 47, 98, 99University Council, 30
Wwage and salary movements, 21Warawara Alternative Entry Program, 15Warawara – Department of Indigenous Studies, 16White Ribbon workplace accreditation, 25women, see employment equity and diversityworkers’ compensation, 23workplace safety, 22

Balaclava Road, North Ryde, Sydney, AustraliaT: (02) 9850 7111, F: (02) 9850 7433Macquarie University mq.edu.au
CRICOS Provider 00002J
Related Documents