reaching women ANNUAL REPORT 2000

Welcome message from author
This document is posted to help you gain knowledge. Please leave a comment to let me know what you think about it! Share it to your friends and learn new things together.
Transcript

reaching womenAvon Products, Inc.1345 Avenue of the AmericasNew York, NY 10105-0196(212) 282-5000 www.avon.com
ANNUAL REPORT 2000
Avon Products, Inc.
20
00
Annual Report
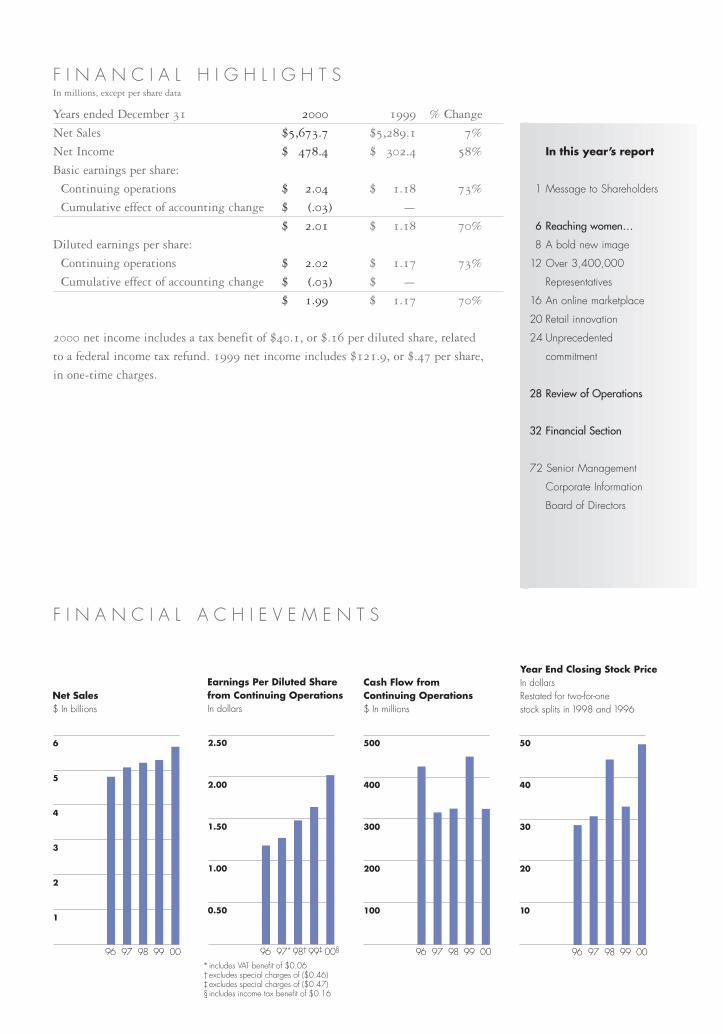
F I N A N C I A L H I G H L I G H T SIn millions, except per share data
Years ended December 31 2000 1999 % Change
Net Sales $5,673.7 $5,289.1 7%
Net Income $ 478.4 $ 302.4 58%
Basic earnings per share:
Continuing operations $ 2.04 $ 1.18 73%
Cumulative effect of accounting change $ (.03) —
$ 2.01 $ 1.18 70%
Diluted earnings per share:
Continuing operations $ 2.02 $ 1.17 73%
Cumulative effect of accounting change $ (.03) $ —
$ 1.99 $ 1.17 70%
2000 net income includes a tax benefit of $40.1, or $.16 per diluted share, related
to a federal income tax refund. 1999 net income includes $121.9, or $.47 per share,
in one-time charges.
F I N A N C I A L A C H I E V E M E N T S
Net Sales$ In billions
1
2
3
4
5
6
96 97 98 99 00
Earnings Per Diluted Share from Continuing OperationsIn dollars
0.50
1.00
1.50
2.00
2.50
96 97 98 99 00*includes VAT benefit of $0.06†excludes special charges of ($0.46)‡excludes special charges of ($0.47)§includes income tax benefit of $0.16
†* ‡ §
100
200
300
400
500
96 97 98 99 00
Cash Flow fromContinuing Operations$ In millions
10
20
30
40
50
96 97 98 99 00
Year End Closing Stock PriceIn dollarsRestated for two-for-onestock splits in 1998 and 1996
B O A R D O F D I R E C T O R S
1 Andrea JungChief Executive Officer
2 Brenda C. BarnesFormer President and ChiefExecutive Officer, Pepsi-ColaNorth America, Pepsi-Cola Co.
3 Edward T. FogartyFormer Chairman, President and Chief Executive Officer,Tambrands, Inc.
4 Stanley C. GaultNon-Executive Chairman, Former Chairman and Chief Executive Officer, TheGoodyear Tire and Rubber Co.
5 Fred Hassan*President and Chief ExecutiveOfficer, Pharmacia Corporation
6 Susan KropfPresident and Chief Operating Officer
7 Maria Elena Lagomasino*Managing Director,Chase Manhattan Bank
8 Ann S. MoorePresident, People MagazineGroup, Time, Inc.
9 Paula Stern, Ph.D.*President, The Stern Group
10 Lawrence A. Weinbach*Chairman, President and Chief Executive Officer,Unisys Corporation
*Audit Committee Member
This report is printed on recycled paper.
Design: BrandLogic Group, Ridgefield, CT
Principal photography:Jeffrey Apoian, New York, NY
Williams sisters photography:George Holz, New York, NY
Printing:Avanti/Case-Hoyt, Rochester, NY
1 2
3
4
5
6
7
8
9
10
In this year’s report
1 Message to Shareholders
6 Reaching women…
8 A bold new image
12 Over 3,400,000
Representatives
16 An online marketplace
20 Retail innovation
24 Unprecedented
commitment
28 Review of Operations
32 Financial Section
72 Senior Management
Corporate Information
Board of Directors

As a business and as a brand, Avon has embarked on a journey of renewal
and great opportunity. 2000 was an exciting year for us, and I feel priv-
ileged to be leading the company and serving you–its shareholders–
as our performance and prospects have gathered momentum and
strength. Your Board of Directors and management team have been
diligent in planning and executing against our long-term strategy, which is to
revitalize our core direct-selling business while extending the Avon franchise
M E S S A G E
to shareholders
“Reflecting Avon’s standout
business performance, our
share price ended the year
with an increase of 45%,
substantially outperform-
ing both our peer group
and the s&p 500.”
CEO Andrea Jung
B0046 AVON EDI.qxd 3/13/01 12:39 PM Page 1
2
into new, untapped markets. As you will read in this report,we have made significant progress toward those goals. At the same time, we have kept a close eye on the funda-mentals of day-to-day operating performance. We met orexceeded investor expectations in each quarter of 2000and– importantly–we ended the year with a much-improvedshare price.
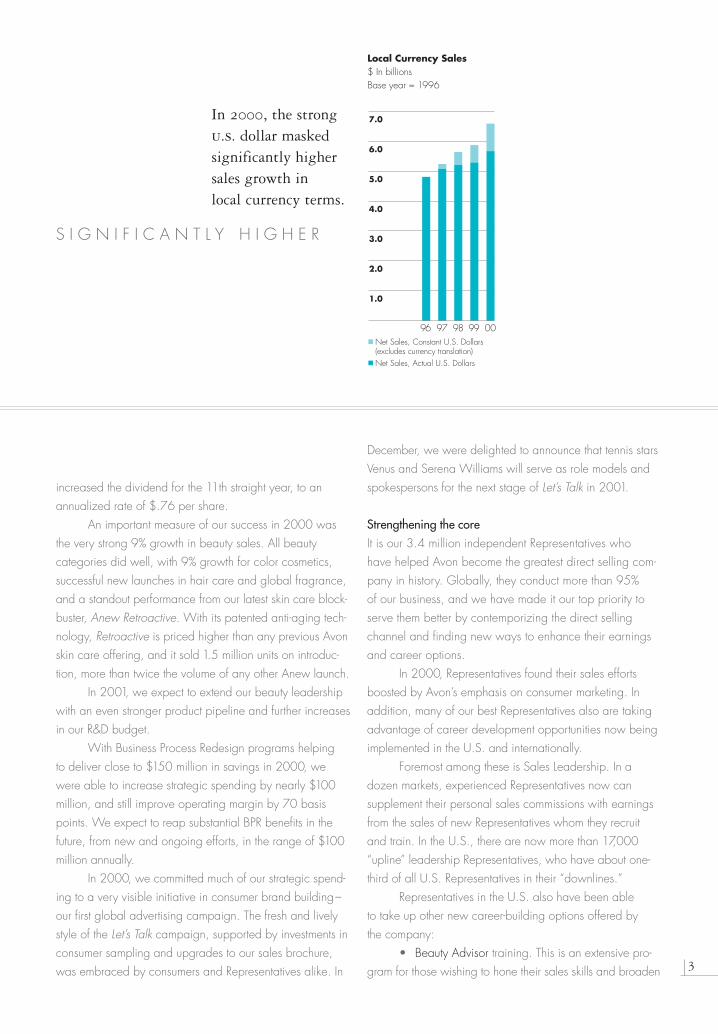
Delivering resultsAvon achieved outstanding results in 2000. Sales reacheda record $5.7 billion, up 7% (up 11% in local currency).We reported earnings per share of $1.99, which includeda benefit of $.16 per share from a federal income tax refund and a charge of $.03 per share from an account-ing change. We also incurred significant unbudgetedexpenses at the close of the year of $.02 per share relatedto asset writedowns and executive reorganization costs.Excluding these items, earnings per share were $1.88, up15% from $1.64 before one-time charges in 1999.
This was our twelfth consecutive year of solid growthin sales and earnings, and we were pleased that our 2000performance was at the high end of the targets we estab-lished going into the year. Our goal for 2001 is to onceagain achieve double-digit growth in local currency salesand earnings per share–even as we continue to increasethe level of investments to support our growth strategies.
The financial results in 2000 were due to the strengthof our operations around the world. All geographic regions
posted increases in sales, operating profit, units and activeRepresentatives. Sales growth in the U.S. was a solid 5%,while all international regions reported double-digit salesincreases in local currencies.
Reflecting Avon’s standout business performance, our share price ended the year at $47.88–a twelve monthincrease of 45%, substantially outperforming both our peergroup and the S&P 500. Total return, including dividends,was 48% for the year.
To further increase returns to shareholders in 2000,we bought back $68 million of stock, as part of our ongoing share repurchases. And on February 1, 2001, we
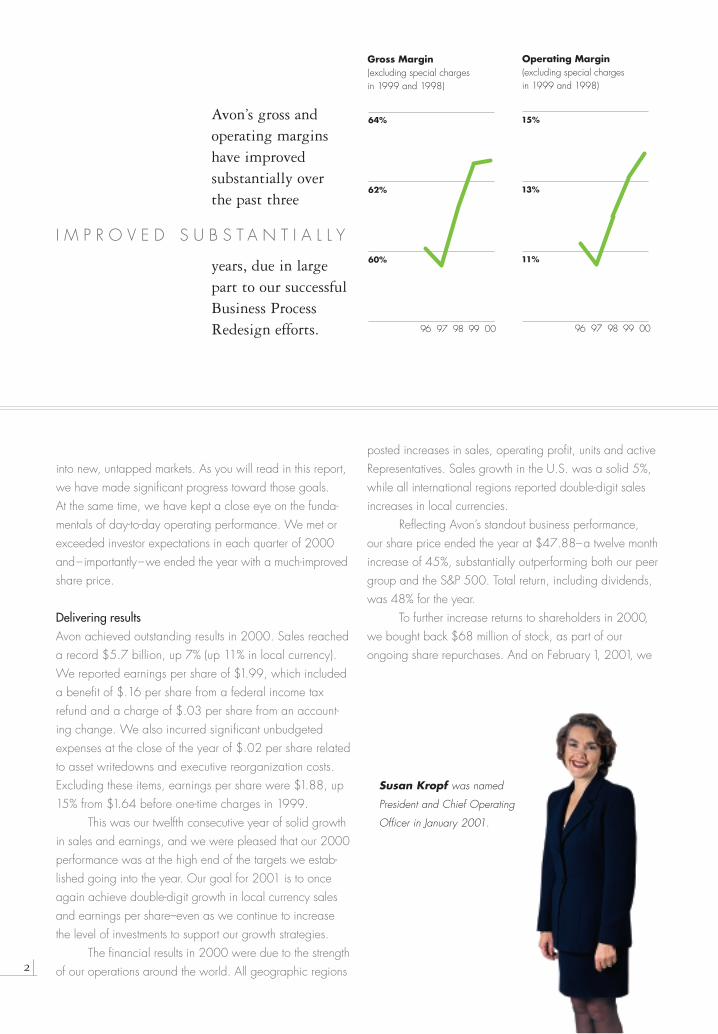
I M P R O V E D S U B S T A N T I A L L Y
Avon’s gross andoperating marginshave improved substantially over the past three
years, due in largepart to our successfulBusiness ProcessRedesign efforts. 58%
60%
62%
64%
96 97 98 99 00
Gross Margin(excluding special charges in 1999 and 1998)
11%
13%
15%
96 97 98 99 00
Operating Margin(excluding special charges in 1999 and 1998)
Susan Kropf was named
President and Chief Operating
Officer in January 2001.
3
increased the dividend for the 11th straight year, to anannualized rate of $.76 per share.
An important measure of our success in 2000 wasthe very strong 9% growth in beauty sales. All beauty categories did well, with 9% growth for color cosmetics,successful new launches in hair care and global fragrance,and a standout performance from our latest skin care block-buster, Anew Retroactive. With its patented anti-aging tech-nology, Retroactive is priced higher than any previous Avonskin care offering, and it sold 1.5 million units on introduc-tion, more than twice the volume of any other Anew launch.
In 2001, we expect to extend our beauty leadershipwith an even stronger product pipeline and further increasesin our R&D budget.
With Business Process Redesign programs helping to deliver close to $150 million in savings in 2000, wewere able to increase strategic spending by nearly $100million, and still improve operating margin by 70 basispoints. We expect to reap substantial BPR benefits in thefuture, from new and ongoing efforts, in the range of $100million annually.
In 2000, we committed much of our strategic spend-ing to a very visible initiative in consumer brand building–our first global advertising campaign. The fresh and livelystyle of the Let’s Talk campaign, supported by investments inconsumer sampling and upgrades to our sales brochure,was embraced by consumers and Representatives alike. In
December, we were delighted to announce that tennis starsVenus and Serena Williams will serve as role models andspokespersons for the next stage of Let’s Talk in 2001.
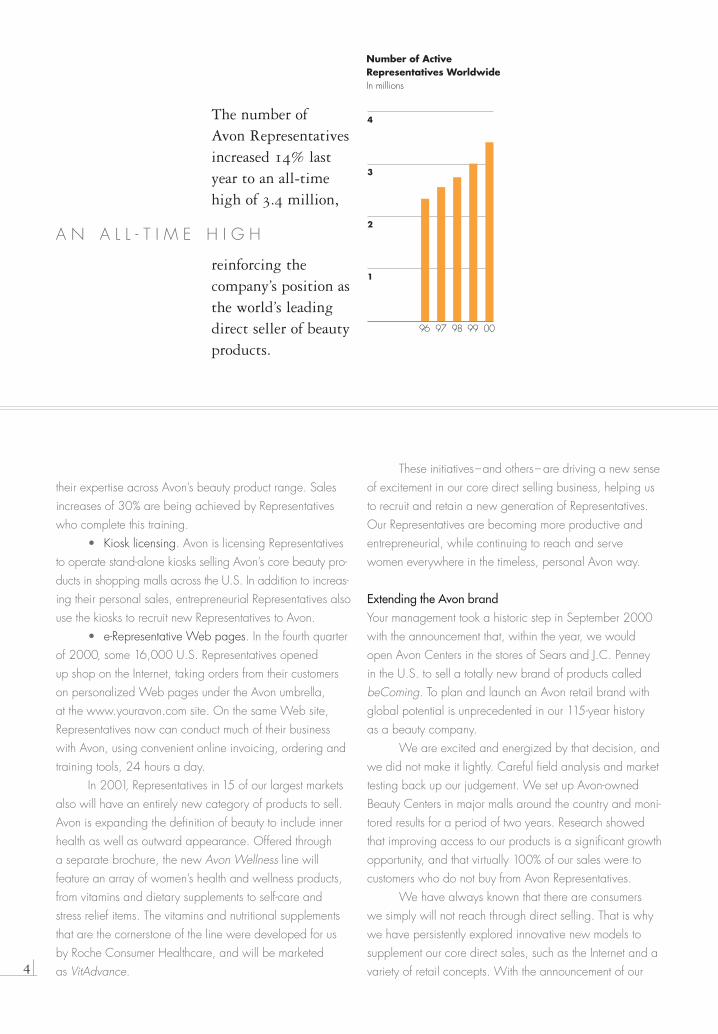
Strengthening the coreIt is our 3.4 million independent Representatives who have helped Avon become the greatest direct selling com-pany in history. Globally, they conduct more than 95% of our business, and we have made it our top priority toserve them better by contemporizing the direct sellingchannel and finding new ways to enhance their earningsand career options.
In 2000, Representatives found their sales effortsboosted by Avon’s emphasis on consumer marketing. Inaddition, many of our best Representatives also are takingadvantage of career development opportunities now beingimplemented in the U.S. and internationally.
Foremost among these is Sales Leadership. In adozen markets, experienced Representatives now can supplement their personal sales commissions with earningsfrom the sales of new Representatives whom they recruitand train. In the U.S., there are now more than 17,000“upline” leadership Representatives, who have about one-third of all U.S. Representatives in their “downlines.”
Representatives in the U.S. also have been able to take up other new career-building options offered by the company:
• Beauty Advisor training. This is an extensive pro-gram for those wishing to hone their sales skills and broaden
S I G N I F I C A N T L Y H I G H E R
In 2000, the strongu.s. dollar maskedsignificantly highersales growth inlocal currency terms.
Local Currency Sales$ In billionsBase year = 1996
1.0
2.0
3.0
4.0
5.0
6.0
7.0
96 97 98 99 00� Net Sales, Constant U.S. Dollars
(excludes currency translation)� Net Sales, Actual U.S. Dollars
4
These initiatives–and others– are driving a new senseof excitement in our core direct selling business, helping usto recruit and retain a new generation of Representatives.Our Representatives are becoming more productive andentrepreneurial, while continuing to reach and servewomen everywhere in the timeless, personal Avon way.
Extending the Avon brandYour management took a historic step in September 2000with the announcement that, within the year, we wouldopen Avon Centers in the stores of Sears and J.C. Penney in the U.S. to sell a totally new brand of products calledbeComing. To plan and launch an Avon retail brand withglobal potential is unprecedented in our 115-year history as a beauty company.
We are excited and energized by that decision, andwe did not make it lightly. Careful field analysis and markettesting back up our judgement. We set up Avon-ownedBeauty Centers in major malls around the country and moni-tored results for a period of two years. Research showedthat improving access to our products is a significant growthopportunity, and that virtually 100% of our sales were tocustomers who do not buy from Avon Representatives.
We have always known that there are consumers we simply will not reach through direct selling. That is whywe have persistently explored innovative new models tosupplement our core direct sales, such as the Internet and avariety of retail concepts. With the announcement of our
A N A L L - T I M E H I G H
The number of Avon Representativesincreased 14% lastyear to an all-timehigh of 3.4 million,
reinforcing the company’s position as the world’s leadingdirect seller of beautyproducts.
their expertise across Avon’s beauty product range. Salesincreases of 30% are being achieved by Representativeswho complete this training.
• Kiosk licensing. Avon is licensing Representativesto operate stand-alone kiosks selling Avon’s core beauty pro-ducts in shopping malls across the U.S. In addition to increas-ing their personal sales, entrepreneurial Representatives alsouse the kiosks to recruit new Representatives to Avon.
• e-Representative Web pages. In the fourth quarterof 2000, some 16,000 U.S. Representatives opened up shop on the Internet, taking orders from their customerson personalized Web pages under the Avon umbrella, at the www.youravon.com site. On the same Web site,Representatives now can conduct much of their businesswith Avon, using convenient online invoicing, ordering andtraining tools, 24 hours a day.
In 2001, Representatives in 15 of our largest marketsalso will have an entirely new category of products to sell.Avon is expanding the definition of beauty to include innerhealth as well as outward appearance. Offered through a separate brochure, the new Avon Wellness line will feature an array of women’s health and wellness products,from vitamins and dietary supplements to self-care and stress relief items. The vitamins and nutritional supplementsthat are the cornerstone of the line were developed for usby Roche Consumer Healthcare, and will be marketed as VitAdvance.
Number of Active Representatives WorldwideIn millions
1
2
3
4
96 97 98 99 00
5
agreement with Sears and J.C. Penney, we are extendingAvon to women wherever they prefer to shop.
The beComing brand–an entirely new line– isexpected to be available in approximately 200 store-in-store Avon Centers by the fall of 2001. An internationalexpansion plan is being developed for 2002.
A strong management teamIn order to speed decision making and facilitate the imple-mentation of our strategies, we announced an executivereorganization early in 2001. Susan Kropf, one of Avon’smost experienced and respected executives, was promotedto President and Chief Operating Officer, responsible for alldirect-selling operations worldwide. I look forward to work-ing closely with Susan to build on the momentum created in2000 and take Avon to even higher levels of achievement.We are supported by a management team of exceptionalstrength. Our business unit leaders around the world havean average of more than 23 years of experience with Avon.
I am also very fortunate to have the support andresources of our outstanding Board of Directors. In 2000,we welcomed one new Director–Maria Elena Lagomasinoof the Chase Manhattan Corporation, who brings aninformed, global perspective to the company. We also saidfarewell to another Director, Richard S. Barton, to whom weextend our thanks for his six years of exemplary service.
Reaching out to womenIn closing, I would like to highlight a particularly noteworthyAvon achievement in 2000–one that I am personally veryproud of. In October, donations from the Avon WorldwideFund for Women’s Health–a suite of initiatives to raisemoney for vital women’s health issues– surpassed the $100million milestone. The money has been raised by AvonRepresentatives and volunteers, and has been used to fundaccess to care and to find a cure for breast cancer. As westrive to serve the community of women, we will continue tostay close to their aspirations and concerns. We have setan ambitious fundraising target of $200 million for theworldwide fund by the end of 2002, and I am very confi-dent that we will achieve that goal.
Avon is at the threshold of a new era…of becomingthe Avon we all believe is possible. We will do our utmostto make those possibilities real, so our shareholders, associ-ates and Representatives may all reap the rewards of thecompany’s future success.
Sincerely,
Andrea JungChief Executive OfficerMarch 1, 2001
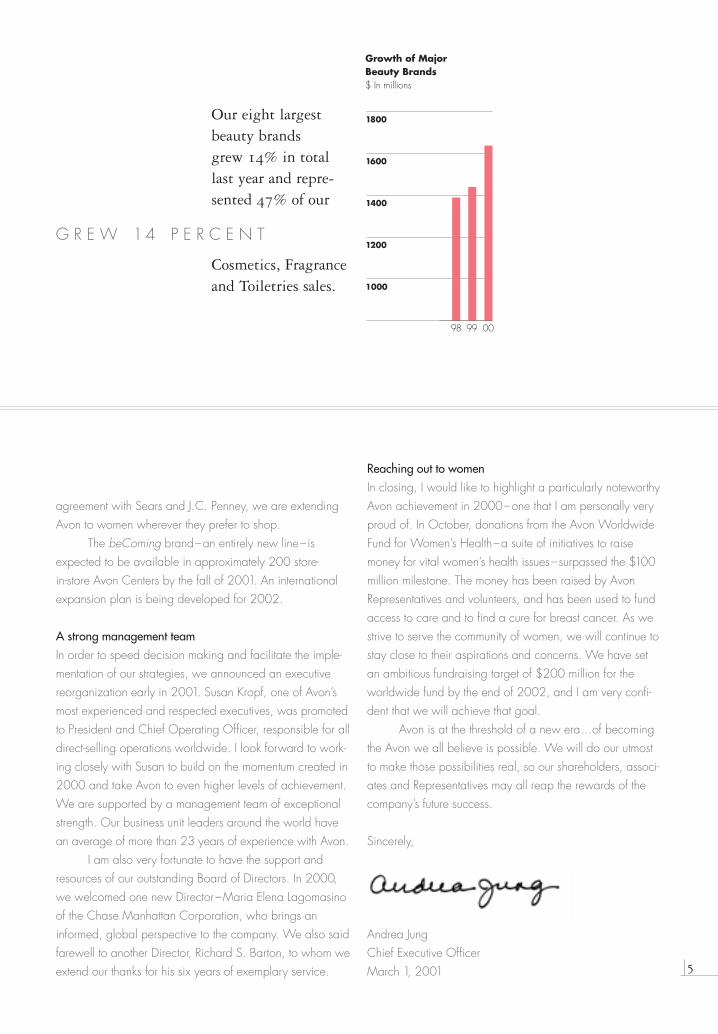
G R E W 1 4 P E R C E N T
Our eight largest beauty brands grew 14% in total last year and repre-sented 47% of our
Cosmetics, Fragranceand Toiletries sales.
Growth of MajorBeauty Brands$ In millions
1000
1200
1400
1600
1800
98 99 00

6
reachingwomenThey’re a community of hand and heart and mind, populating more than
half the globe. They are mothers, daughters, sisters and grandmothers,
drawing near to them children, partners, parents and friends. They’re
entrepreneurs and teachers and homemakers and kin, practicing science
and sports and the arts. They are women. And to Avon, they’re the most
important people in the world. � It’s a bond forged by everything from
shared causes to biology, tracing back through more than a century of beauty
and business opportunity. And as we stride past the threshold to the next
hundred years, that natural affinity is strengthened by energetic new initiatives,
a bolder vision and a wider, more diverse community of customers. In a dynamic
new world, Avon continues to connect, reaching women through a vibrant
image and outstanding products, personal relationships, cutting-edge technology,
exciting new channels and unparalleled support for gender and family issues.
When we say we’re the Company for Women…we mean it.


8

$100 million
9
and breakthrough products. � (Oh, yes. Did we mention attitude?) They’re
the signature elements of today’s Avon, a marquee name taking on fresh, youth-
ful meaning with the presentation of a spirited new face to the world and the
introduction of innovative beauty products. We’re as global as Singapore and
São Paulo…and as local as your front door. And the women who trust and use
our products are as likely to be found practicing on tennis courts…as they are
in courts of law. Just ask Grand Slam tennis stars Venus and Serena Williams.
That was Avon’s investment in a bright new brand
image and direct selling, tried-and-true. The year 2000
saw significant strategic spending on global advertis-
ing, product sampling and smart new brochures –core
business investments designed to carry the momentum
into 2001.
a bold new image
R E A C H I N G W O M E N
10
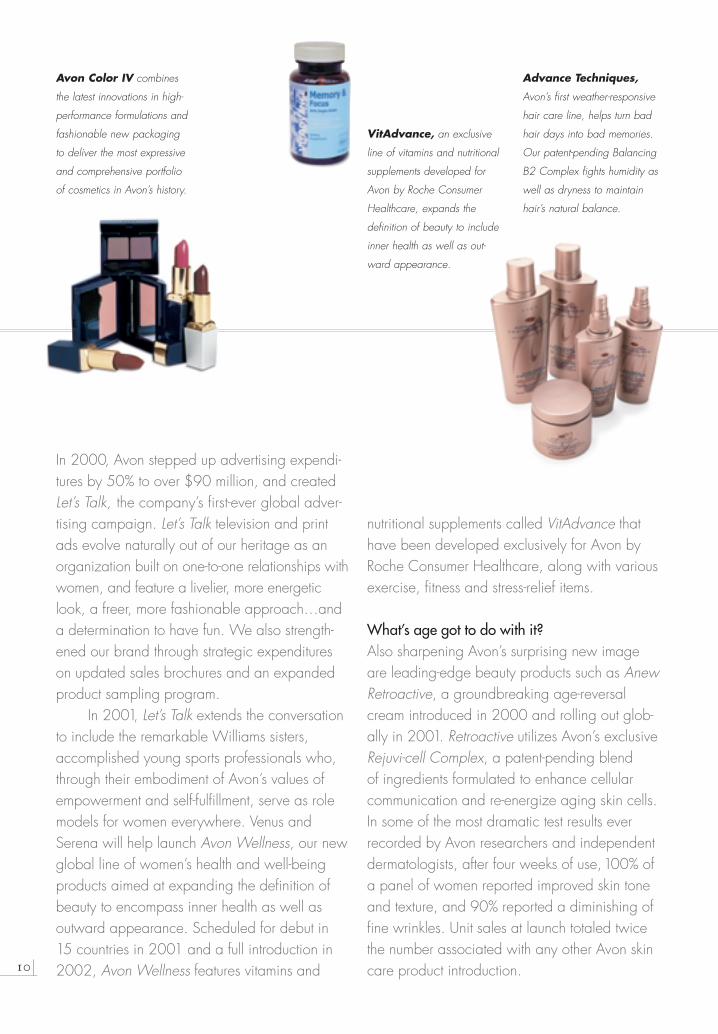
In 2000, Avon stepped up advertising expendi-tures by 50% to over $90 million, and createdLet’s Talk, the company’s first-ever global adver-tising campaign. Let’s Talk television and printads evolve naturally out of our heritage as anorganization built on one-to-one relationships withwomen, and feature a livelier, more energeticlook, a freer, more fashionable approach…anda determination to have fun. We also strength-ened our brand through strategic expenditureson updated sales brochures and an expandedproduct sampling program.
In 2001, Let’s Talk extends the conversationto include the remarkable Williams sisters,accomplished young sports professionals who,through their embodiment of Avon’s values ofempowerment and self-fulfillment, serve as rolemodels for women everywhere. Venus andSerena will help launch Avon Wellness, our newglobal line of women’s health and well-beingproducts aimed at expanding the definition ofbeauty to encompass inner health as well as outward appearance. Scheduled for debut in 15 countries in 2001 and a full introduction in2002, Avon Wellness features vitamins and
nutritional supplements called VitAdvance thathave been developed exclusively for Avon byRoche Consumer Healthcare, along with variousexercise, fitness and stress-relief items.
What’s age got to do with it?Also sharpening Avon’s surprising new imageare leading-edge beauty products such as AnewRetroactive, a groundbreaking age-reversalcream introduced in 2000 and rolling out glob-ally in 2001. Retroactive utilizes Avon’s exclusiveRejuvi-cell Complex, a patent-pending blend of ingredients formulated to enhance cellularcommunication and re-energize aging skin cells.In some of the most dramatic test results everrecorded by Avon researchers and independentdermatologists, after four weeks of use,100% ofa panel of women reported improved skin toneand texture, and 90% reported a diminishing offine wrinkles. Unit sales at launch totaled twicethe number associated with any other Avon skincare product introduction.
VitAdvance, an exclusive
line of vitamins and nutritional
supplements developed for
Avon by Roche Consumer
Healthcare, expands the
definition of beauty to include
inner health as well as out-
ward appearance.
Avon Color IV combines
the latest innovations in high-
performance formulations and
fashionable new packaging
to deliver the most expressive
and comprehensive portfolio
of cosmetics in Avon’s history.
Advance Techniques,
Avon’s first weather-responsive
hair care line, helps turn bad
hair days into bad memories.
Our patent-pending Balancing
B2 Complex fights humidity as
well as dryness to maintain
hair’s natural balance.

11
While Retroactive may slow the signs ofaging, there are no signs that things are slowingdown at Avon’s product development labs. Othereye-catching 2000 product launches includedthe release of Avon Color IV, the most compre-hensive cosmetics portfolio in the company’s his-tory, a lineup featuring such innovations as:
• Color Rich Renewable Lipstick, employ-ing patented microcapsule technology and aspecial Gel-Matrix system to continually releasemoisturizers and keep color blooming for hours.
• True Color Eyeshadow and PowderBlush, providing enhanced adhesion and anexceptionally smooth finish thanks to Jet Mill tech-nology, and bringing to the mass market an inno-vation that optimizes powder particle size tocreate a uniform, ultra-fine bond with the skin.
• And our Incredible Finish Foundation and Powders, combining Jet Mill technology with color, finish and enhanced reflective proper-ties to produce an even, naturally luminous coverage.
Beauty and beyondFormulated with an exclusive vitamin- and protein-enriched Balancing B2 Complex, Avon’sAdvance Techniques Hair Care System–a set
of 22 shampoos, conditioners and treatmentsalso released in 2000–became the broadesthair care product launch in company history.
Incandessence–a sophisticated floral scentinspired by the warmth of the sun– is Avon’snewest fragrance, and takes perfume design tothe next level with a unique formulation thatreveals aromatic layers in successive stages dur-ing a woman’s busy day.
And in 2000, our successful line of BeautyPlus high-quality jewelry and fashion accessorieswas extended into 17 global markets spanningall geographic regions. Combined worldwidesales of Avon jewelry, watches and accessoriesincreased a solid 14% from 1999 to 2000.
A revitalized brand image and beautyproducts of extraordinary value–a strategic com-bination that’s redefining Avon as the progressivenew company for women of every style, everypersonality, every outlook…and every birth date.
Let’s Talk has everyone,
well…talking! Avon’s very first
global advertising campaign
speaks to women in a friendly,
easy way, conveying the
Looking good. Avon’s
print “store” has never looked
better. Smartly designed and
more shop-able than ever,
our brochures provide Avon
Representatives with a power-
ful sales tool to more effectively
serve their customers.
DREAM BIG — FOR ANYTHING IS POSSIBLE. BEHIND EVERY GREAT WOMAN...THERE ARE MORE
GREAT WOMEN. AVON — THE COMPANY FOR WOMEN.
CALL YOUR AVON LADY...CHAT...LOG ON! VISIT US AT AVON.COM OR CALL 1 800 FOR AVON.
dream big
let’s talk
©20
01 A
von
Prod
ucts,
Inc.
HO
NE
Y &
ES
SE
SERENA AND VENUS WILLIAMS
spirit of a vibrant company in
touch with the beauty needs
of women of every style…and
every age.
hablemos
ANEW FORCE EXTRACON LA MOLÉCULAANTIEDAD AVC 10REAFIRMA Y ESTIRA EL CUTIS DONDE LA PIELLO NECESITA. LAS PRUEBAS DEMUESTRANQUE EN 7 DÍAS PUEDE TENER MENOSARRUGAS Y UNA PIEL MÁS FIRME Y SUAVE.
LLAME A SUREPRESENTANTE AVONO AL 1 800 288 5236O VISÍTENOS ENAVON.COM.
©20
00 A
von
Prod
ucts,
Inc.
del lift sin bisturí
B0046 AVON EDI.qxd 3/6/01 8:43 PM Page 11

12
13
R E A C H I N G W O M E N
One awesome army of businesswomen. � And together they make Avon
the largest and most successful direct seller of beauty products in the world.
On every business day, in 139 countries, our Representatives–an estimated
95% of whom are women–make personal contact with millions of Avon
customers. They put a warm and welcome face on our products and services…
and secure our reputation as the company that best understands and satis-
fies the needs of women everywhere. For more than a century, enterprising
Representatives have been at the heart of Avon’s continuing success.
That’s how much Avon Representatives around the
world earned in commissions during 2000. By providing
women with a wider range of sales and career oppor-
tunities, Avon has made person-to-person selling more
relevant than ever.
R E A C H I N G W O M E N
$2.3 billion
over 3,400,000Representatives

’’’’
‘‘
14
Today, and for the foreseeable future, the lion’sshare of Avon’s annual revenue will be derivedfrom direct selling, making it our most importantmarketing channel by far, and a keystone to thecompany’s business strategy. In 2000, Avonrecommitted to strengthening its direct-sellingchannel through innovative programs like SalesLeadership, a business model designed to attractand retain Representatives, and through initia-tives focused on business and beauty training.
Providing women with the chance to suc-ceed in business as respected and indepen-dent entrepreneurs has been central to Avon’spurpose from its beginning 115 years ago. It’s no wonder, then, that Sales Leadership isdesigned to encourage Representatives withmore and better earning opportunities…and tohelp Avon grow its global business by increas-ing the size of its Representative workforce.
We’ve added a new level of entrepreneurs toour sales structure, whose job is to recruit, trainand mentor new Representatives, as well as per-sonally sell Avon products. Under the program,Representatives experience increased opportu-nity for advancement and share in the successof their unit, while simultaneously developingmanagement skills.
Going globalSuccessful Sales Leadership programs have been piloted in all geographic regions, and testmarkets are evaluating results with the idea ofeither extending the scope of their pilots or
Timea Milánkovits
Home base: Budapest,
Hungary
Age: 20
Onboard with Avon: 1997
Preferred method of getting
from here to there: Public trans-
portation (Had an Opel Astra,
but sold it to avoid Budapest’s
crazy traffic).
Through my work, I have
established lots of new relation-
ships with interesting people.
I enjoy dealing with customers
and my zone manager. Special
offers, quick shipments and
gifts help to keep our customers
interested in Avon.
‘‘
Beverley Tomlinson
Home base: Queens,
New York, USA
Age: 51
Onboard with Avon: 1990
Musical instrument she wishes
she had learned to play: Piano.
When my son was accepted
at Howard University, I started
setting myself goals. And on
reaching those goals, I would
set higher ones. I pulled out
all the stops and not only
reached membership in the
President’s Club, but went on
to become an Honor Society
member. Being an Avon
Representative has dramatically
changed my life.
implementing the program full-scale. While SalesLeadership is still in its early stages, preliminaryresults show positive feedback from Representatives,increased productivity and a marked reduction in turnover. Some test results, in fact, have demon-strated decreases in annual turnover from highsof nearly 90% to below 50%.
To help U.S. Representatives become more confident and knowledgeable about their profession, Avon also has implemented a highly popular Beauty Advisor program, themost extensive training effort in the history of the company. Representatives enroll in a series of courses designed to upgrade their makeupand skin care consulting skills and teach themabout the latest advances in beauty products.Successful graduates are certified as BeautyAdvisors, whose potential for increased saleshas been documented to increase by nearly
’’
15
30% in pilot programs. In 2000, more than20,000 Beauty Advisor training kits were pur-chased by U.S. Representatives.
In 2000, Avon also brought its entre-preneurial Licensed Beauty Centers to retail shopping malls across the country. The centers–attractive carts filled with select Avon beautyproducts–combine the power of direct sellingwith the customer access of retail to give enterprising Representatives entrée to increasedearnings and recruitment opportunities.
Advanced training. Greater career opportunities. Make that 3.4 million worldwideRepresentatives…and growing each day.
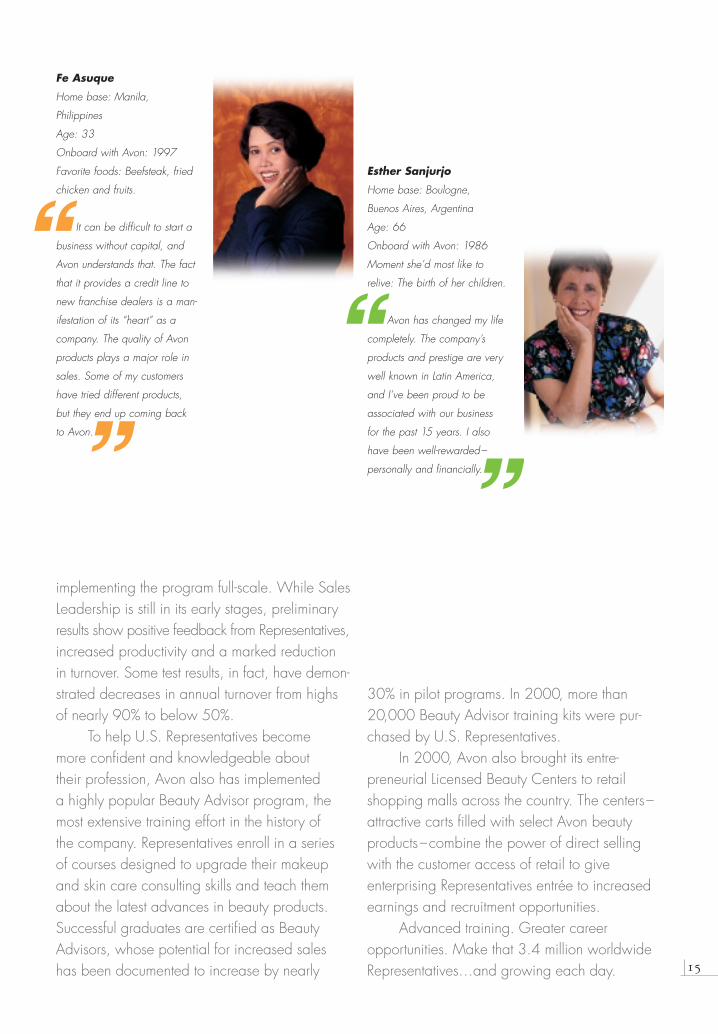
‘‘
Esther Sanjurjo
Home base: Boulogne,
Buenos Aires, Argentina
Age: 66
Onboard with Avon: 1986
Moment she’d most like to
relive: The birth of her children.
Avon has changed my life
completely. The company’s
products and prestige are very
well known in Latin America,
and I’ve been proud to be
associated with our business
for the past 15 years. I also
have been well-rewarded–
personally and financially.
‘‘
’’
Fe Asuque
Home base: Manila,
Philippines
Age: 33
Onboard with Avon: 1997
Favorite foods: Beefsteak, fried
chicken and fruits.
It can be difficult to start a
business without capital, and
Avon understands that. The fact
that it provides a credit line to
new franchise dealers is a man-
ifestation of its “heart” as a
company. The quality of Avon
products plays a major role in
sales. Some of my customers
have tried different products,
but they end up coming back
to Avon.

16

17
and entrepreneurs with a great big “e.” � Hear that clicking? That’s the
sound of cyber-success. We’re talking about the Internet, of course, and the
extraordinary advantage it can deliver to Avon and its Representatives as a sales
and business tool. Consumers make online purchases based on brands they
know–and from companies that provide them with a variety of access channels.
Avon has the brand, of course. And it has the bandwidth. But it also comes with
the added advantage of a smiling face–your friendly e-Representative.
R E A C H I N G W O M E N
24x7With “click-here” efficiency and no care for the clock,
youravon.com brings Representatives into their customers’
homes in a new and exciting way…complementing the
personal touch that is Avon’s hallmark.
an onlinemarketplace

18
Over the past several years, women by the tensof millions have logged onto the World WideWeb, giving them access to a virtual universe of information, products and services…and providing businesses with a phenomenal newchannel to connect with customers. Online sales are expected to grow threefold over thenext few years, reaching $100 billion in 2002.An estimated $4 billion of those sales will bebeauty and health items, and 52% of all onlinecustomers will be women. In September 2000,Avon revolutionized its direct sales approach,plugging its U.S. Representatives into a dynamiconline marketing tool called youravon.comand empowering them with the technology of the Web.
One more way to connectUsing their own personalized, consumer-facingWeb sites, e-Representatives provide their familyof customers with 24x7 access to Avon products.At the same time, e-Representatives have theadvantage of business-to-business capabilitiesthat connect them seamlessly to Avon’s order andfulfillment systems. While their customers benefitfrom the speed, convenience and delivery flexi-bility of online ordering, Avon e-Representativesare able to promote special products, target specific groups of customers, place and trackorders online, and capitalize on e-mail to shareproduct information, selling tips and marketingincentives. Self-paced online training also isavailable, as is up-to-the-minute news about the company.
Representative success increases
exponentially. Customized
Representative Web sites
and digital brochures mean
anytime assistance with
account, order and customer
information…and anywhere
access to Avon’s full line
of products.
e-Representatives. Add
the global reach and tech-
nological advantage of
the Internet to direct sales
and customer relationships,
and Avon’s formula for

19
By the end of 2000, more than 16,000excited U.S. Avon Representatives had addedan “e” to their titles. Our goal is to signifi-cantly expand Representative online ordering in 2001, and to help make it happen, Avon has partnered with Gateway, Inc. to provideRepresentatives with extremely affordable desktop computers and Internet access to buildtheir own customized home pages. Everything in the process is fast and simple– for beginnersand experts alike.
Digits and dollarsBy managing their businesses online,Representatives are able to improve service to their customers, enhance their own pro-ductivity, provide a truly personalized Internet shopping experience and reduce the cost ofdoing business. While it’s early to quantify
potential cost savings, Avon expects decreasedcall center volumes, reduced telecommunicationscosts and lower paper and printing expenses toresult in significant efficiencies for the company–perhaps saving as much as $10 million annuallyby the end of 2002.
High-touch customer relationships enhancedby high-tech contact. Shopping encounters tailored to the needs of customers. Enhancedproductivity and an exciting new channel toattract more Representatives. Significant opera-tional cost savings and a 21st century commit-ment to Avon’s fundamental direct-sales strategy.It’s a formula that puts Avon online, and in line… to capitalize on the personal and commercialpower of the Internet.
Dawn Parrino, an Avon
Leadership Representative
and a Certified Beauty Advisor
on New York‘s Staten Island,
revels in her multiple personas
as a regular Avon Lady and
an e-Representative. “It‘s con-
venient for me and for my cus-
tomers,” she says. ”Through
youravon.com, I can reach
my sister in Virginia and other
friends and family out of state
without ever leaving the com-
fort of my own home! I like the
freedom and flexibility that hav-
ing my own Web page offers.”

20
21
Incremental sales, that is. Studies show retail purchases
at Avon Beauty Centers in shopping malls across the
United States were made almost exclusively by new
customers–women who have had no previous associa-
tion with personal Avon Representatives. In fact,
Representatives’ sales have been known to increase in
areas where Avon has operated Beauty Centers.
R E A C H I N G W O M E N
When only a shopping mall will do. � While direct selling continues to be
the engine of Avon’s success, it represents only a small fraction of the
$155 billion global beauty market. Internationally, Avon is no stranger to retail
sales, having managed successful retail operations in geographies as far-flung
as China and Venezuela. In the United States alone, there are roughly
20 million women who say they like Avon quality and would be buying Avon
products and services…except for one thing: They do their shopping in retail malls.
retailinnovation
100%
22
Well, we listened. And in 2000–after an exten-sive two-year test in which our beauty productswere sold in company-owned mall kiosks withoutany adverse effect on Representative sales–Avonannounced that, as the first of several plannedphases, it would open Avon Centers in Sears andJ.C. Penney stores in the United States. Presentedas innovative stores-within-stores, Avon Centerswill introduce an entirely new brand of productscalled beComing, offerings representing a fuller,more complete vision that integrates lifestyle,beauty and fashion.
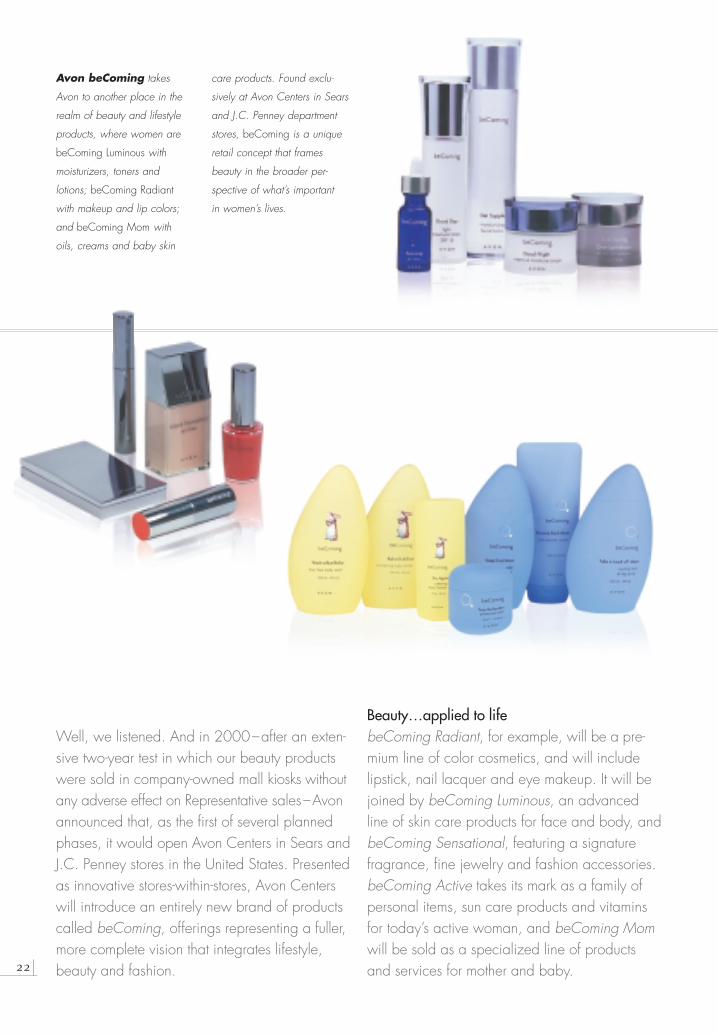
Beauty…applied to lifebeComing Radiant, for example, will be a pre-mium line of color cosmetics, and will include lipstick, nail lacquer and eye makeup. It will bejoined by beComing Luminous, an advanced line of skin care products for face and body, andbeComing Sensational, featuring a signature fragrance, fine jewelry and fashion accessories.beComing Active takes its mark as a family ofpersonal items, sun care products and vitaminsfor today’s active woman, and beComing Momwill be sold as a specialized line of products and services for mother and baby.
care products. Found exclu-
sively at Avon Centers in Sears
and J.C. Penney department
stores, beComing is a unique
retail concept that frames
beauty in the broader per-
spective of what’s important
in women’s lives.
Avon beComing takes
Avon to another place in the
realm of beauty and lifestyle
products, where women are
beComing Luminous with
moisturizers, toners and
lotions; beComing Radiant
with makeup and lip colors;
and beComing Mom with
oils, creams and baby skin
23
beComing Centered will be offered as an array of aromatherapeutic bath, body andenvironmental products, while women lookingfor information about lifestyle and health-relatedtopics can turn to our new beComing Awareseries. Customers interested in beComingConnected also will be able to avail them-selves of personalized computer beauty pro-files and online links to Avon Representatives and women’s networks.
The beComing brand is expected to belaunched in approximately 200 store-in-storeAvon Centers by the end of 2001, and an inter-national expansion is planned for 2002. By 2005, beComing is projected to generate$200-$300 million in annual revenue in theUnited States alone.
The retail touchAvon Centers– intimate and attractive 400 to600 square-foot environments in which customersare served by Lifestyle Consultants–will add significantly to the company’s retail presence inother worldwide markets, where retail and directselling have a history of mutual growth and pros-perity. In the United States in particular, our care-fully orchestrated expansion into retail sales isexpected to open Avon to an entirely new cus-tomer segment–women who prefer to do theirshopping in stores and malls.
With its extended reach into retail sales,Avon continues to thoughtfully transform itself into the company for women of every age andlifestyle– touching new customers as it creativelypreserves and strengthens the core direct-sellingbusiness that has carried it to more than a cen-tury of success.
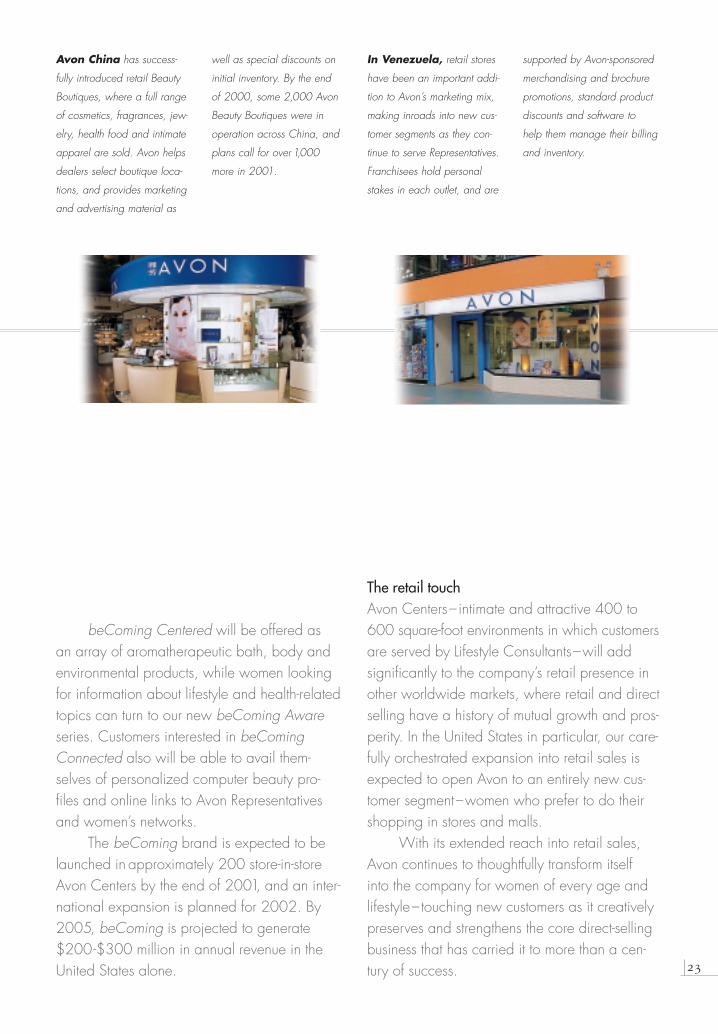
Avon China has success-
fully introduced retail Beauty
Boutiques, where a full range
of cosmetics, fragrances, jew-
elry, health food and intimate
apparel are sold. Avon helps
dealers select boutique loca-
tions, and provides marketing
and advertising material as
In Venezuela, retail stores
have been an important addi-
tion to Avon’s marketing mix,
making inroads into new cus-
tomer segments as they con-
tinue to serve Representatives.
Franchisees hold personal
stakes in each outlet, and are
well as special discounts on
initial inventory. By the end
of 2000, some 2,000 Avon
Beauty Boutiques were in
operation across China, and
plans call for over 1,000
more in 2001.
supported by Avon-sponsored
merchandising and brochure
promotions, standard product
discounts and software to
help them manage their billing
and inventory.

24

25
That’s the fundraising mark the Avon Worldwide Fund
for Women’s Health expects to reach by 2002. Avon is
one of the world’s largest corporate supporters of global
programs related to breast cancer and other women’s
health issues.
R E A C H I N G W O M E N
to health and the empowerment of women. � 3-Day Walks. Kiss Goodbye
to Breast Cancer. The Pink Mile. If you know Avon, you know these are just a few
of the dozens of women’s support programs we sponsor around the world. And
if you don’t know Avon…it’s time that you did. Women are our principal cus-
tomers. But they’re also our paramount concern. As a business, Avon is commit-
ted to women of every age and culture, not only as consumers…but as people.
$200 million
unprecedented commitment
26
We care deeply about women’s health, theirfinancial well-being and the issues that areimportant to them. And we believe in givingback to them, and to the communities where they live and work. As a measure of that commitment, the Avon Worldwide Fund forWomen’s Health–a set of initiatives to raisemoney for and increase awareness of women’shealth issues– supports a range of programs in30 countries. In Japan, for instance, it provides funding for elder care, and in Germany a separate initiative helps fund an associationoffering emotional and financial support to mothers in need.
In 2000, donations to global causes from the Avon Worldwide Fund for Women’sHealth surpassed $100 million, and we’re wellon our way to reaching $200 million by the end of 2002.
The battle against breast cancerThe largest contributor to the Worldwide Fund is the company’s U.S. Avon Breast CancerCrusade, which supports breast cancer researchand education and community-based programs
for medically underserved women. Through fund-raising and awareness campaigns such as thesale of unique “pink ribbon” products, AvonBreast Cancer 3-Day walking events and ThePink Mile–a line painted on New York’s fashion-able Fifth Avenue in the color symbolizing theinternational battle against breast cancer– the2000 U.S. Avon Breast Cancer Crusade wasable to donate a record-setting $15.3 million tohelp fund breast cancer research and breasthealth programs at leading medical centers.
Sister programs such as Avon U.K.’s high-profile “Kiss Goodbye to Breast Cancer” cam-paign and Argentina’s “Un Lazo por la Vida” (A Ribbon for Life) are just two of the manyworldwide Avon-sponsored initiatives also linkedto the Crusade.
The Avon Running Global Women’s Circuithelps to promote good cardiovascular healththrough physical fitness. It has the distinction of
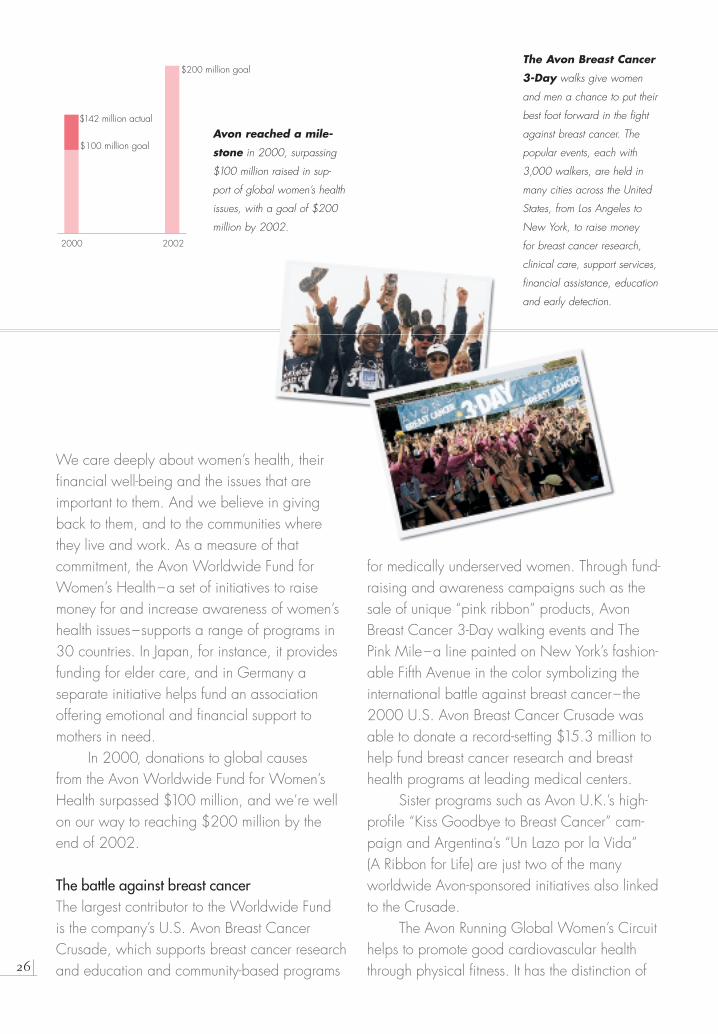
2000 2002
$100 million goal
$200 million goal
$142 million actual
Avon reached a mile-
stone in 2000, surpassing
$100 million raised in sup-
port of global women’s health
issues, with a goal of $200
million by 2002.
The Avon Breast Cancer
3-Day walks give women
and men a chance to put their
best foot forward in the fight
against breast cancer. The
popular events, each with
3,000 walkers, are held in
many cities across the United
States, from Los Angeles to
New York, to raise money
for breast cancer research,
clinical care, support services,
financial assistance, education
and early detection.
27
being the world’s sole international circuit ofwomen-only, 10-kilometer runs and 5-kilometerwalks. The first running events in the Circuit were held in 1998, although the program’s pre-cursor– the former Avon International RunningCircuit– is credited with helping to establish the women’s marathon as an Olympic event during the 1984 Games. The mission of theAvon Running Global Women’s Circuit is to “get women to the starting line of fitness,” andduring 2000, runners participating in events in12 countries around the world got ready, gotset…and went.
Encouraging achievementA separate initiative, the Avon Women ofEnterprise program, celebrates the entrepre-neurial spirit and economic accomplishments of women. Annual awards are presented toAvon Representatives whose achievements set them apart as trailblazers and role models of empowerment. In a first in 2000, a Women of Enterprise program was implemented by
Avon Poland. In Mexico, the Avon-sponsoredZazil Award recognizes women who excel in a variety of professions, and in Australia, Avon’sSpirit of Achievement Award honors women for outstanding contributions in the fields of art,science, sports, business, the environment andcommunity affairs.
In addition, the Avon Products Foundationcontinues a half-century tradition of funding pro-grams and organizations that promote economicopportunity and physical and emotional well-being for women and girls. Grants, employeevolunteers and product and equipment donationsavailable from the Foundation help bring to lifeAvon’s vision of being the company that bestunderstands and satisfies the product, serviceand self-fulfillment needs of women globally.
For more than100 years, women havebrought out the best in Avon. And with our products and support programs, we have tried to bring out our best for them. It’s part of our heritage…and why we strive to be the companyfor women.
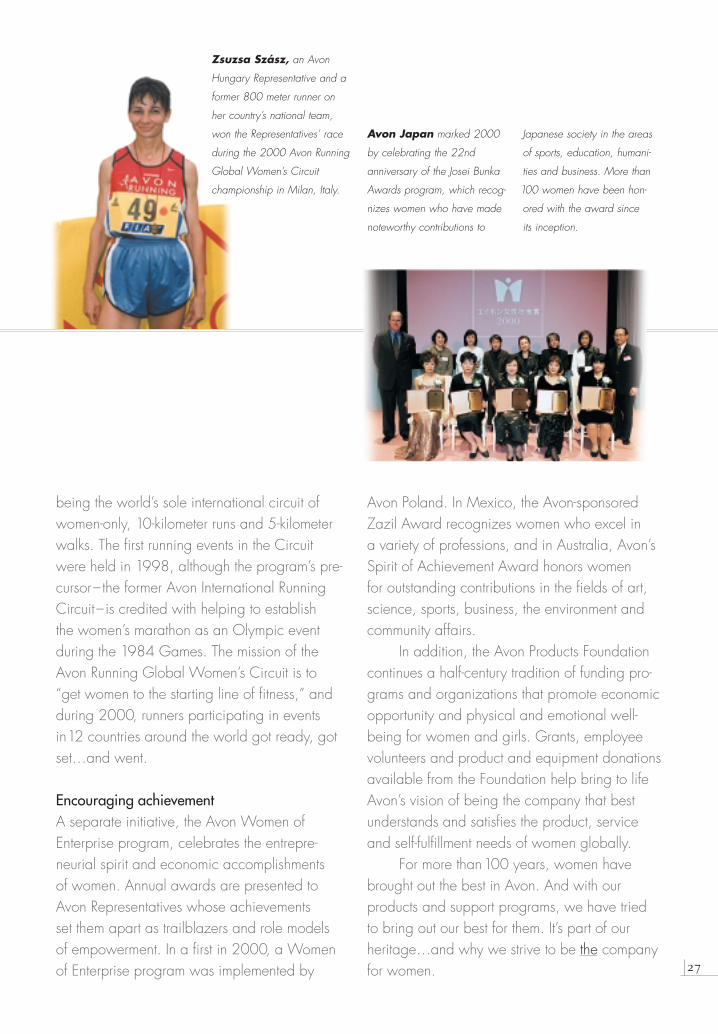
Zsuzsa Szász, an Avon
Hungary Representative and a
former 800 meter runner on
her country’s national team,
won the Representatives’ race
during the 2000 Avon Running
Global Women’s Circuit
championship in Milan, Italy.
Avon Japan marked 2000
by celebrating the 22nd
anniversary of the Josei Bunka
Awards program, which recog-
nizes women who have made
noteworthy contributions to
Japanese society in the areas
of sports, education, humani-
ties and business. More than
100 women have been hon-
ored with the award since
its inception.
28
The North America Region, which includes the U.S., Canadaand Puerto Rico, posted a solid 5% sales increase on unitgrowth of 5%, and a 2% increase in active Representatives.Operating profit growth of 2% was tempered by significantstrategic investments in the U.S. and higher expenses inPuerto Rico related to facilities consolidation.
In the U.S., Beauty sales increased 7%, reflecting double-digit gains in color cosmetics and skin care, aswell as growth in fragrance and personal care. Among the major product successes of the year was the launch ofAnew Retroactive, the best-ever skin care introduction inAvon’s history. The Avon Color brand also got a significantboost from the highly successful introduction of Nailwearand Glazewear during the year. And, Avon’s well-knownSkin-So-Soft brand enjoyed its highest-ever year-over-yearsales increase in 2000.
Sales in the Beauty Plus category also registeredincreases, with excellent growth in accessories and watches,partially offset by a decline in apparel.
U.S. operating profit rose 4% in 2000, despite significant investments in e-commerce and advertising aswell as one-time costs associated with the writedown ofcompany-owned Beauty Centers in shopping malls.
A major strategic initiative in the U.S. in 2000 wasthe September launch of the youravon.com Web site. Thenew Web site greatly expands the use of the Internet as a tool for offering better service to Representatives and customers. Youravon.com enables e-Representatives to usepersonalized Web pages to communicate with their cus-tomers, receive and process orders for products, check
product availability and shipping status, create and sendcustomer invoices, make payments to Avon, and manageother aspects of their Avon business online. In addition,consumers can now browse the entire Avon sales brochureonline with point-and-click convenience. Over 16,000 U.S.Representatives signed up to become e-Representatives inthe first segment of a phased launch of youravon.com,with further expansion expected in 2001.
Also in 2000, Avon U.S. continued to improve thecareer opportunities it offers to Representatives. Initiativesincluded the expansion of Sales Leadership, a form oftiered marketing that enables Representatives to earnmoney from their personal sales plus the sales of newRepresentatives they have recruited and trained. Nearlyone-third of U.S. Representatives have been recruited toAvon through Sales Leadership.
Other successful initiatives included the launch of anextensive beauty training program called Beauty Advisors,as well as the licensing of Representatives to sell Avon’sBeauty products in kiosks in shopping malls.
Plans also were put in place during the year for the2001 launch of an entirely new retail product line calledbeComing, to be sold in selected Sears and J.C. Penneystores. In addition, Avon U.S. will launch a new women’shealth and well-being business including vitamins and nutri-tional supplements developed exclusively for Avon byRoche Consumer Health.
R E V I E W O F
N O R T H A M E R I C A
operations
2000 In millions % change from 1999
Net Sales $2,148 +5%
Operating Profit $ 368 +2%
Canada
Puerto Rico
United States
Retroactive
29
The Europe Region’s operating performance in 2000 wascharacterized by exceptionally strong results in Central and Eastern markets, largely offset by declines in WesternEurope and the U.K., where foreign currency translationhad a negative impact on reported results. Overall sales in the region increased 1%, but rose a much stronger 13%in local currencies. Operating profit increased 3% after asignificant negative effect from currency translation.
Central/Eastern Europe once again produced out-standing results, continuing the trend of the past severalyears. Major markets in the area, including Poland,Hungary and Ukraine, all generated strong double-digitgains in sales, units, active Representatives and operatingprofit, as well as solid margin improvement.
Avon’s CFT market share in Central Europeincreased nearly two points in 2000. Results in Central/Eastern Europe were aided by consumer-focused market-ing initiatives and Avon’s overall high image rating. Sales also benefited from a redesigned sales campaigncycle designed to deliver products to the consumer more quickly. In addition, Sales Leadership programs to enhance earnings opportunities for career-mindedRepresentatives expanded in key markets such as Polandand Hungary, with positive results.
Avon Russia rebounded strongly in 2000, reversinga downturn in 1999 that followed the 1998 Russian eco-nomic crisis. Local currency sales nearly doubled, drivenby a more than 60% growth in units and a nearly 30%increase in active Representatives. Russia also returned toprofitability following an operating loss in 1999.
Europe’s largest market, the U.K., posted a 7% localcurrency sales increase on 7% unit growth, and furtherincreased its Beauty market share, following a major sharegain in 1999. Operating profit declined by double digits,however, largely due to currency translation and the imple-mentation of a new high-speed shipping line that causedan initial decline in productivity.
Europe continued its drive to improve efficiency in2000. Avon Poland expanded its manufacturing capacityand produced over 85 million CFT units, with furtherexpansion to 150 million units planned for 2001.Previously, outdated facilities in Ireland and France wereclosed, and French distribution operations were transferredto Germany. The region also has introduced a cluster-stylemarketing management structure for Italy, Germany andFrance, which should generate future savings to fundinvestments in advertising and promotions.
Among the marketing highlights for the year, theintroduction of Avon Color IV was the biggest color cosmetics launch ever in Europe and resulted in a 20%increase in sales and units. In addition, sales of personalcare products increased nearly 15%.
Also in 2000, Avon successfully launched awomen’s health and well-being product line in Spain andsolidified its partnering strategy with Quelle, a major catalog showroom retailer in Germany.
E U R O P E2000 In millions % change from 1999
Net Sales $ 886 +1%
Operating Profit $ 130 +3%
Austria
Bulgaria
Croatia
Czech Republic
France
Germany
Hungary
Ireland
Italy
Latvia
Lithuania
Poland
Portugal
Romania
Russia
Slovakia
Slovenia
Spain
Turkey
Ukraine
United Kingdom
South Africa
Color IV
30
Despite difficult economic conditions in some countries,the Pacific Region posted solid sales and profit growth in2000, with all major markets showing increases in localcurrency sales and higher dollar operating profits. Salesin local currencies grew 13% in the region, driven bystrong unit growth of 18% and a 31% jump in the numberof active Representatives. Avon also established a pres-ence in two new markets–Singapore and South Korea–during the year.
In Japan, Avon’s largest Pacific market, economicrecovery proved elusive. However, after two years ofdeclines, Avon Japan grew local currency sales by 5%,which was well ahead of expectations. Growth was driven by a 10% increase in orders and units. Japan’s operating profit climbed 24% for the year.
Contributing to Japan’s results were several highlysuccessful promotions, including the distribution of over 30 million flyers supported by newspaper ads. These con-sumer initiatives resulted in significant new customer growth.Japan’s Avon Lady shops increased to 14,200, with salesup 17%. Japan’s Internet initiatives are also expanding. The Representative Web site, www.order.avon.co.jp, nowaccounts for about 4% of sales and transactions and isresulting in significant order-entry cost savings. The con-sumer Web site, www.avon.co.jp, is being promoted todrive traffic and is now featured in five Japanese virtual malls.
Other Pacific Region markets also did well in theface of economic challenges. Avon Philippines focused on strengthening field fundamentals to expand consumerreach in an environment of slower consumer spending
and political uncertainty. Local currency sales grew animpressive 21%, powered by unit growth of 18% and a51% increase in active Representatives. Operating profitfor the year grew 6% over 1999, after a negative foreignexchange impact of about 13%.
Taiwan’s economy began strong in 2000, recover-ing from the devastating earthquake of September 1999.However, new challenges arose during the year, including adecline in consumer confidence and competition from healthfood direct-sellers entering the CFT market. Despite the uncer-tain environment, Avon Taiwan posted a local currency salesincrease for the year of 8%, on unit growth of 7%.
China’s economy continued strong, as prospects for World Trade Organization entry encouraged the private sector to be more competitive. Despite increasedcompetition, China’s sales rose 44% over 1999, reflect-ing the company’s continued aggressive retail expansion and increased export sales. Avon China estimated that it increased market share in all Beauty categories, espe-cially fragrance. Importantly, Avon China operated at aprofit in 2000, following three years of losses.
For the fifth consecutive year, Avon Australia gener-ated a solid increase in local currency sales, reflectingdouble-digit unit growth. Australia’s operating profit alsorose by double digits.
P A C I F I C2000 In millions % change from 1999
Net Sales $ 799 +11%
Operating Profit $ 118 +15%
Australia
China
Hong Kong
India
Indonesia
Japan
Malaysia
New Zealand
Philippines
Singapore
South Korea
Taiwan
Thailand
Luminosity
31
Latin America had an excellent year in 2000, driven by growth in nearly all countries and a particularly strongperformance in Mexico and Brazil, the region’s two largestmarkets, as well as Venezuela.
Sales grew 12%, or 15% in local currency whileoperating profit was up 13% in dollars, despite a contin-ued weak economy in Argentina. Active Representativesgrew 10%, with increases in every major market. Nearlyall markets also posted unit gains, except Brazil, whichwas down slightly from the exceptionally high level in1999, when the company was driving for market share following the maxi-devaluation of the Brazilian real.
Avon Brazil delivered sales growth of 14% and an operating profit increase of 17% in 2000. CFT salesrose 15% in local currency, with particularly strong results in the color cosmetics segment. Additionally, BusinessProcess Redesign programs continued to generate funds to support aggressive business-building investments in marketing. Also noteworthy was Brazil’s working capitalmanagement, including a reduction in inventories despiterapid sales growth.
Avon Mexico posted a sales increase of 18% on unitgrowth of 10% and an 8% increase in active Representatives.Mexico grew operating profit by a very strong 18%, even after absorbing start-up costs for a new state-of-the-art distribution center in Celaya, which handles about 50% of Mexico’s orders. Mexico also increased sales of BeautyPlus products such as lingerie and jewelry/watches.
Avon Argentina delivered a modest sales increase,despite a severe economic recession prevalent in the
country throughout the year. Units rose 6% and activeRepresentatives increased 11%. Argentina’s results wereaided by a highly successful customer growth and advertis-ing program under the Let´s Talk umbrella, involving aggres-sive recruiting and promotion to mobilize Representativesand associates. Argentina’s operating profit declined in thesingle digits primarily due to the increase in promotionalexpenses necessitated by the weak economy and highermiscellaneous taxes.
Avon Venezuela posted solid gains in sales, unitsand operating profit over 1999, despite the floods thatnegatively affected Avon’s operations early in the year.Similarly, Avon Chile overcame catastrophic rainfalls in the third quarter, and posted solid sales and dollar operat-ing profit gains for the year. Both Chile and Venezuelamaintained their very strong market shares.
Central America had another outstanding year,increasing local currency sales and dollar operating profitby 16% and 18%, respectively. Central America continuesas one of Avon’s fastest-growing and highest-margin markets in the world, having successfully implemented acluster-style management structure to improve efficienciesand leverage management talent.
Further driving efficiency in the region, several smaller markets also completed the transition to a clusterapproach. Peru and Bolivia now share a common productline and brochure with Chile, and Uruguay and Paraguayare clustered with Argentina.
L A T I N A M E R I C A2000 In millions % change from 1999
Net Sales $1,841 +12%
Operating Profit $ 416 +13%
Argentina
Bolivia
Brazil
Chile
Dominican Republic
Ecuador
El Salvador
Guatemala
Honduras
Mexico
Nicaragua
Panama
Peru
Uruguay
Venezuela
Herbal Care

32
Contents
33 Management’s Discussion & Analysis
33 Cautionary Statement
33 Results of Operations
33 Consolidated
36 2000 Compared to 1999North AmericaInternational
38 1999 Compared to 1998North AmericaInternational
39 Global Expenses
40 Accounting Changes
40 Contingencies
40 Liquidity and CapitalResources
40 Cash Flows
40 Working Capital
41 Capital Resources
42 Inventories
42 Capital Expenditures
42 Foreign Operations
44 Risk Management Strategies and Market Rate SensitiveInstruments
45 Other Information
45 Euro
46 Results of Operations by Quarter
47 Market Prices Per Share ofCommon Stock by Quarter
48 Consolidated Statements of Income
49 Consolidated Balance Sheets
50 Consolidated Statements of Cash Flows
51 Consolidated Statements of Changes in Shareholders’(Deficit) Equity
52 Notes to ConsolidatedFinancial Statements
69 Report of Management andReport of IndependentAuditors
70 Eleven-Year Review
F I N A N C I A L S E C T I O N
Net Sales–Constant vs.Actual U.S. Dollars$ In billionsBase year = 1996
1.0
2.0
3.0
4.0
5.0
6.0
7.0
96 97 98 99 00�� Net Sales, Constant U.S. Dollars
(excludes currency translation)� Net Sales, Actual U.S. Dollars
Business Unit Operating Profit$ In millions
200
400
600
800
1000
1200
96 97 98 99 00
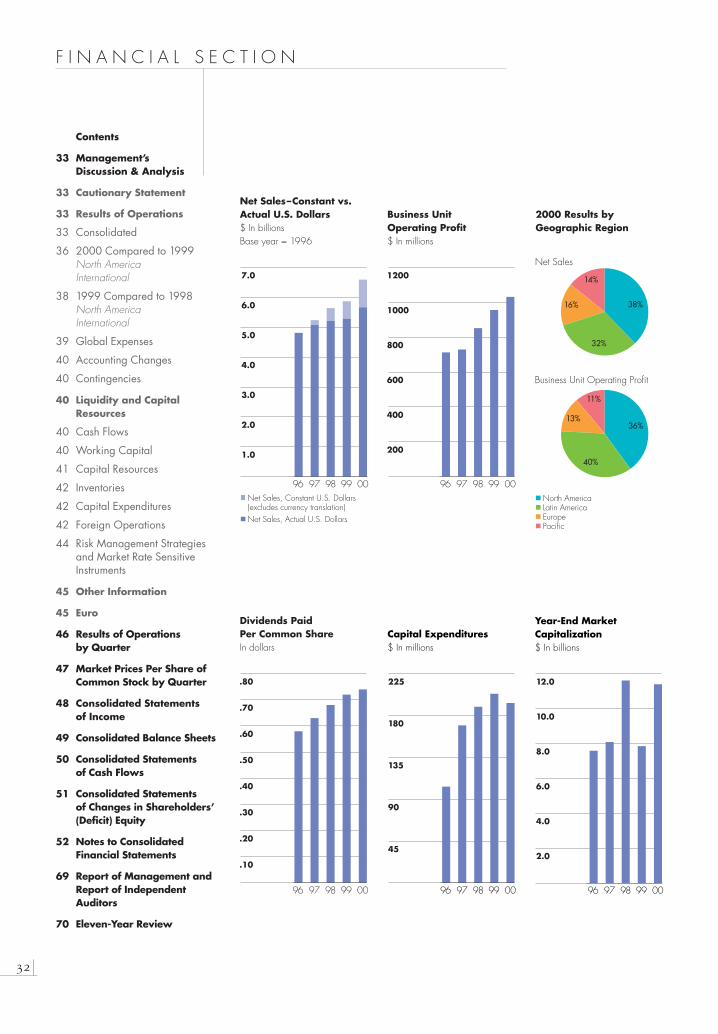
2000 Results byGeographic Region
� North America� Latin America� Europe� Pacific
Net Sales
Business Unit Operating Profit
38%
32%
16%
14%
36%
40%
13%
11%
Dividends Paid Per Common ShareIn dollars
.10
.20
.30
.40
.50
.60
.70
.80
96 97 98 99 00
Capital Expenditures$ In millions
45
90
135
180
225
96 97 98 99 00
Year-End Market Capitalization$ In billions
2.0
4.0
6.0
8.0
10.0
12.0
96 97 98 99 00
33
The following discussion of the results of operations andfinancial condition of Avon Products, Inc. (“Avon” or the“Company”) should be read in conjunction with the infor-mation contained in the Consolidated Financial Statementsand Notes thereto. These statements have been preparedin conformity with generally accepted accounting princi-ples which require management to make estimates andassumptions that affect amounts reported and disclosed inthe financial statements and related notes. Actual resultscould differ from these estimates.
Cautionary Statement for Purposes of the “SafeHarbor” Statement Under the Private SecuritiesLitigation Reform Act of 1995Certain statements in this report which are not historicalfacts or information are forward-looking statementswithin the meaning of the Private Securities LitigationReform Act of 1995, including, but not limited to, theinformation set forth herein. Such forward-looking state-ments involve known and unknown risks, uncertaintiesand other factors which may cause the actual results,levels of activity, performance or achievement of theCompany, or industry results, to be materially differentfrom any future results, levels of activity, performance or achievement expressed or implied by such forward-looking statements. Such factors include, among others,the following: General economic and business conditions;the ability of the Company to implement its businessstrategy; the Company’s access to financing and its man-agement of foreign currency risks; the Company’s abilityto successfully identify new business opportunities; theCompany’s ability to attract and retain key executives; theCompany’s ability to achieve anticipated cost savings andprofitability targets; the impact of substantial currencyexchange devaluations in the Company’s principal foreignmarkets; changes in the industry; competition; the effectof regulatory and legal restrictions imposed by foreigngovernments; the effect of regulatory and legal proceed-ings and other factors discussed in Item 1 of the Company’sForm 10-k. As a result of the foregoing and other factors,no assurance can be given as to the future results andachievements of the Company. Neither the Company norany other person assumes responsibility for the accuracyand completeness of these statements.
Results of OperationsConsolidated > Net income in 2000 was $478.4 com-pared with $302.4 in 1999. Basic and diluted earningsper share in 2000 were $2.01 and $1.99, respectively,compared with $1.18 and $1.17, respectively, in 1999.Net income for 1998 was $270.0 and basic and dilutedearnings per share were $1.03 and $1.02, respectively.
Effective January 1, 2000, the Company changed its method of accounting for revenue recognition in accor-dance with Staff Accounting Bulletin (“sab”) No. 101,“Revenue Recognition in Financial Statements.” See Note2 of the Notes to Consolidated Financial Statements. Thecumulative effect of the change on prior years resulted ina charge of $6.7, net of a tax benefit of $3.5, or $.03 pershare on a basic and diluted basis, which is included innet income for the year ended December 31, 2000. Theeffect of the accounting change in 2000 was to decreasenet income before the cumulative effect of the accountingchange by $1.1.
In addition, the 2000 results include the settlementof a federal income tax refund, which was received inJanuary 2001, consisting of $32.5 of tax and $62.7 ofinterest related to the years ended December 31, 1982,1983, 1985 and 1986. For the year ended December 31,2000, the Company recognized $40.1 ($.17 and $.16 pershare on a basic and diluted basis, respectively) as an incometax benefit in the Consolidated Statements of Income,resulting from the impact of the tax refund offset by taxesdue on interest received and other related tax obligations.
Special and non-recurring charges were recorded in the first quarter of 1999 for the Company’s businessprocess redesign (“bpr”) program. These charges totaled$151.2 pretax, which reduced net income by $121.9 aftertax, or $.47 per share on a basic and diluted basis. The1998 results include special and non-recurring chargestotaling $154.4 pretax, which reduced net income by$122.8 after tax, or $.46 per share on a basic and dilutedbasis. See Note 13 of the Notes to Consolidated FinancialStatements for further discussion of this program.
Before special and non-recurring charges in 1999,earnings per share of $1.65 and $1.64 on a basic anddiluted basis, respectively, both increased 11% over thecomparable period in 1998.
Management’s Discussion and AnalysisAvon Products, Inc.Dollars in millions, except share data
Consolidated net sales increased 7% in 2000 to$5.67 billion from $5.29 billion in 1999. Sales in NorthAmerica increased 5% to $2.15 billion in 2000.International sales increased 9% to $3.53 billion due tostrong growth in the Latin American and Pacific regionsand, to a lesser extent, in the European region. In 1999,consolidated net sales of $5.29 billion increased 1% from$5.21 billion in 1998. Sales in North America increased1% to $2.05 billion in 1999. International sales increased2% to $3.24 billion due to strong growth in the Pacificregion and in Europe, partially offset by declines in LatinAmerica. Excluding the unfavorable impact of foreigncurrency translation, consolidated net sales would haveincreased 11% and 9% in 2000 and 1999, respectively.
Other revenue includes shipping and handling feesbilled to Representatives and totaled $40.9, $38.8 and$35.0 in 2000, 1999 and 1998, respectively.
Cost of sales as a percentage of net sales was 37.4%in 2000, compared with 38.4% in 1999 and 39.4% in1998. The 1999 and 1998 cost of sales included $46.0 and$37.9, respectively, of non-recurring charges for inventorywrite-downs related to the Company’s bpr program. Thecharges related to the closure of facilities, discontinuationof certain product lines, size-of-line reductions and achange in strategy for product dispositions. See Note 13of the Notes to Consolidated Financial Statements for fur-ther discussion of these charges. Excluding the charges,cost of sales as a percentage of sales was 37.5% in 1999versus 38.7% in 1998.
In 2000, the favorable gross margin variance versus1999 was due to improvements in all internationalregions, most significantly in the Pacific region, includ-ing Japan and China, as well as Central and EasternEurope, due to lower product costs on imports from eurocountries coupled with a shift in mix to higher marginproducts, and in Russia, due to a favorable comparisonresulting from a discount pricing policy in 1999. Grossmargins remained level with prior year in Brazil and theu.s. These improvements were partially offset by declinesin Puerto Rico, due to inventory variations related to the consolidation of operations, and in Mexico and thePhilippines, resulting from higher sales of a lower marginmix of cosmetics, fragrance and toiletries (“cft”) productsand selective price cuts to meet competition.
In 1999, the favorable gross margin variance versus1998 was due to improvements in all regions, most sig-nificantly in Europe, including the United Kingdom,Germany, Italy and Central Europe, due to a continuingfocus on pricing strategies and improved profitability ofBeauty Plus categories, including fashion jewelry andaccessories. Japan, Mexico and the u.s. also posted stronggross margin improvements. These improvements werepartially offset by a decline in Brazil, resulting fromhigher costs in the second half of 1999 as a result of amajor currency devaluation, and in Russia, due to a pric-ing discount policy begun in the fourth quarter of 1998.
Marketing, distribution and administrativeexpenses of $2.80 billion increased $161.4, or 6%, overprior year, but decreased as a percentage of total revenueto 49.1% from 49.6% in 1999. The overall improvementin the expense ratio was due to a favorable expense ratioin Mexico, resulting from lower marketing and promo-tional expenses associated with product introductions, inRussia, due to strict expense controls as well as favorablecomparisons against prior year, and in the Philippines and China, reflecting fixed administrative expenses on ahigher sales base. Expense ratio improvements were par-tially offset by higher expenses in Argentina, reflectingincreased advertising and brochure costs, in the UnitedKingdom, due to increased shipping and distributioncosts from decreased capacity of shipping lines duringtransition to a new system, and in Puerto Rico, reflectinghigher transitional expenses related to the consolidationof operations.
Marketing, distribution and administrativeexpenses of $2.64 billion in 1999 increased $36.8, or 1%,over 1998, but remained level as a percentage of total revenue versus 1998. Expense ratio improvements werereported in Brazil reflecting strict expense managementand bpr initiatives, in Japan reflecting bpr efforts, and inCentral Europe reflecting volume efficiencies and a signif-icant reduction in expenses. These improvements wereoffset by higher expense ratios in Mexico due to increasedadvertising and incentive programs in 1999, in Germanydue to strategic marketing investments, in Venezuela due to increased incentive programs and in the UnitedKingdom due to higher shipping expenses, most signifi-cantly in the fourth quarter of 1999.
Interest expense increased $41.5 in 2000 to $84.7and $8.5 in 1999 to $43.2. The increases in both 2000and 1999 are primarily the result of increased domesticborrowings related to the acceleration of the Company’sshare repurchase program, which occurred in the secondhalf of 1999, and working capital requirements.
34
Interest income in 2000 of $8.5 versus the prioryear decreased $2.6 primarily resulting from reducedinterest rates in Brazil and Mexico during 2000. Interestincome in 1999 of $11.1 decreased $4.8 versus 1998mainly due to a tax refund claim recognized in 1998.
In 2000, other expense (income) net was $10.8unfavorable to 1999 mainly due to favorable foreignexchange in 1999 resulting from gains on Brazilian for-ward contracts and, to a lesser extent, a value added taxrefund in China in 1999, partially offset by favorablecomparisons versus 1999, primarily in Europe and thePacific. In 1999, other expense (income) net was $12.2unfavorable to 1998 due primarily to unfavorable net for-eign exchange in 1999 resulting from exchange losses,primarily in Europe and Latin America.
Income taxes were $201.7 in 2000 and the effectivetax rate was 29.2% compared with $204.2 in 1999 and an effective tax rate of 40.3%. Excluding the effect of afederal income tax refund in 2000 and special and non-recurring charges in 1999, the effective tax rate was
35.0% and 35.5% in 2000 and 1999, respectively. Theeffective tax rate was lower in 2000 versus 1999 due tothe settlement of foreign audits, dividend planning, uti-lization of net operating loss carryforwards and the mix of earnings and income tax rates of the international subsidiaries. Income taxes in 1998 were $190.8 and theeffective tax rate was 41.9% (36.4% excluding the effectof the special and non-recurring charges).
Inflation in the United States has remained at a rel-atively low level during the last three years and has nothad a major effect on Avon’s results of operations. Manycountries in which Avon has operations have experiencedhigher rates of inflation than the United States, includingVenezuela and Russia, which experienced high cumula-tive rates of inflation over the past three years. Mexico was converted to non-hyperinflationary status beginningJanuary 1, 1999 due to reduced cumulative inflation ratesduring the three-year period 1996 through 1998.
35
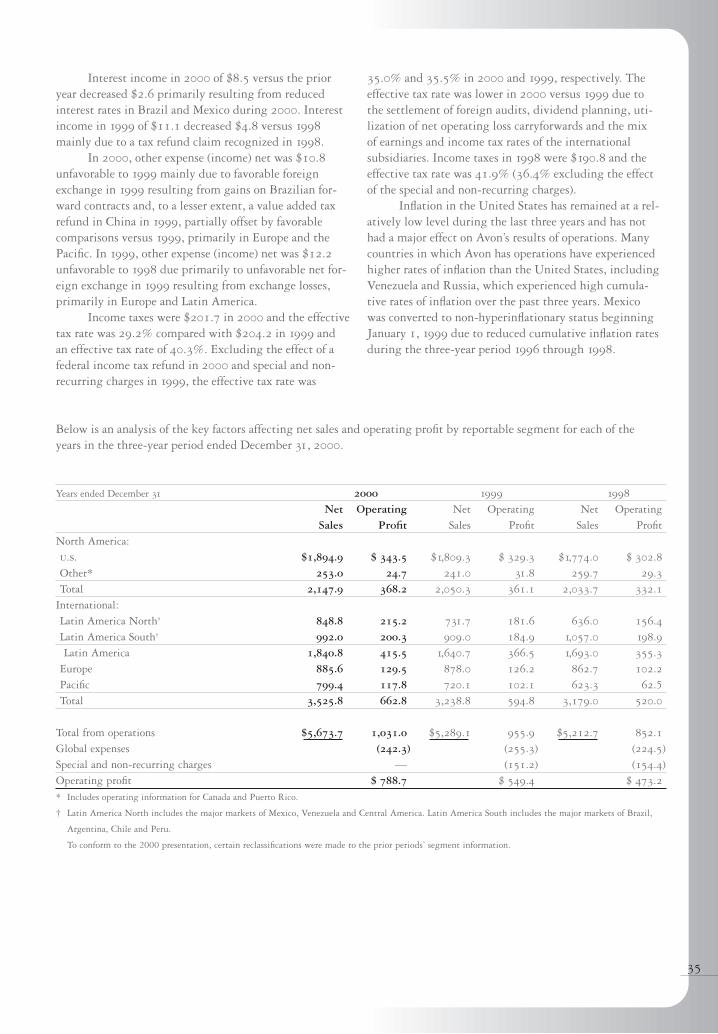
Years ended December 31 2000 1999 1998
Net Operating Net Operating Net OperatingSales Profit Sales Profit Sales Profit
North America:u.s. $1,894.9 $ 343.5 $1,809.3 $ 329.3 $1,774.0 $ 302.8
Other* 253.0 24.7 241.0 31.8 259.7 29.3
Total 2,147.9 368.2 2,050.3 361.1 2,033.7 332.1
International:Latin America North† 848.8 215.2 731.7 181.6 636.0 156.4
Latin America South† 992.0 200.3 909.0 184.9 1,057.0 198.9
Latin America 1,840.8 415.5 1,640.7 366.5 1,693.0 355.3
Europe 885.6 129.5 878.0 126.2 862.7 102.2
Pacific 799.4 117.8 720.1 102.1 623.3 62.5Total 3,525.8 662.8 3,238.8 594.8 3,179.0 520.0
Total from operations $5,673.7 1,031.0 $5,289.1 955.9 $5,212.7 852.1
Global expenses (242.3) (255.3) (224.5)
Special and non-recurring charges — (151.2) (154.4)
Operating profit $ 788.7 $ 549.4 $ 473.2
* Includes operating information for Canada and Puerto Rico.
† Latin America North includes the major markets of Mexico, Venezuela and Central America. Latin America South includes the major markets of Brazil,
Argentina, Chile and Peru.
To conform to the 2000 presentation, certain reclassifications were made to the prior periods’ segment information.
Below is an analysis of the key factors affecting net sales and operating profit by reportable segment for each of theyears in the three-year period ended December 31, 2000.
2000 Compared to 1999North America > Net sales in North America increased 5% to $2.15 billion in 2000. The u.s. business, whichrepresents almost 90% of the North American segment,reported sales growth of 5%. The sales increase in theu.s. resulted primarily from a 6% increase in the numberof units sold, a 2% increase in active Representatives anda higher average cft order size. Sales improvements inthe u.s. resulted from increases in cft categories, fash-ion jewelry and watches and accessories, partially offset by declines in apparel and home entertainment products.u.s. sales of cft increased 7% over 1999 reflecting a double-digit increase in skincare, primarily due to stronglaunches of Botanisource and Anew Retroactive, which wasthe largest cft launch ever. Color cosmetics also reporteddouble-digit increases versus prior year, reflecting ourcommitment to the Avon Color brand and powerful newproduct introductions, such as Nailwear and Glazewear.Growth in the fragrance category was driven by strongperformance in Men’s brands. The personal care categoryalso contributed to the sales increase, particularly fromthe strength of the new launch of Chamomile and sales ofexisting Skin-So-Soft lines, which reported the largestincreases ever for this brand. Fashion jewelry and watchesincreased mid-single digits versus 1999 due to strategicgrowth in fashion and fine jewelry segments. Highersales in accessories were driven by strong performance infashion accessories, including handbags, totes and smallleather goods. These increases were partially offset bydeclines in the apparel category, due to softness in casualwear items, and lower sales in home entertainment prod-ucts, resulting from fewer new product introductions.
Operating profit in North America increased 2% to $368.2 in 2000 due to the region’s increased sales, discussed above, while the operating margindeclined 0.5 points. The decline in operating margin isprimarily due to an increase in the operating expense ratio in Puerto Rico caused by higher transitionalexpenses related to the consolidation of operations. Gross margin in North America remained level in 2000as compared to 1999. Operating profit in the u.s. of$343.5 increased 4% versus 1999 reflecting sales growth,partially offset by a slightly unfavorable expense ratio.The expense ratio in the u.s. was negatively impacted by asset writedowns associated with the closure of certainCompany-owned Avon Beauty Centers. Excluding theasset writedowns, the expense ratio was favorable to 1999
resulting from cost containment, bpr savings and lowerbenefit expenses partially offset by increased spending onadvertising and e-commerce initiatives.
International > International sales increased 9% to $3.53billion and operating profit increased 11% to $662.8 in2000. Excluding the effect of foreign exchange, interna-tional sales increased 14% in 2000 with double-digitincreases in all regions.
In Latin America, sales increased 12% to $1.84billion in 2000 driven by improvements in all major markets, with Mexico, Brazil and Venezuela being themain contributors. Excluding the impact of foreignexchange, sales in Latin America increased 15% in 2000.Units and active Representatives for the region rose 4%and 10%, respectively, versus the same period in 1999.The sales growth in Mexico was driven by increases in the number of units sold, active Representatives and customers served. Mexico had double-digit sales growth in all product categories, particularly in the cft cate-gory, as well as in apparel, as a result of greater productselection. In Brazil, higher average orders, along withincreased prices and more Representatives were the maindrivers of sales improvements. Venezuela’s sales improve-ment resulted from increases in the number of units sold,orders, active Representatives and customers served.Venezuela was able to post these increases despite severeflooding in late 1999, which negatively affected opera-tions at the beginning of 2000, along with persistent eco-nomic and political uncertainty.
Operating profit in Latin America grew 13% to $415.5 in 2000 due to the sales increases, discussedabove, and operating margin improvements in Venezuelaand Brazil, partially offset by a decline in Argentina. Theoperating margin in 2000 in Latin America improved 20 basis points versus 1999. Venezuela’s operating margin reflected a higher gross margin, driven by priceincreases and cost improvement, partially offset byincreased marketing spending and incentive programs.Brazil’s operating margin increased primarily due tolower bad debt and recognition expenses. Mexico’s operat-ing margin remained level with 1999 due to savings inmarketing and cost savings on purchase orders, offset by a decrease in gross margin due to increased sales of lowermargin items and selective pricing cuts. In Argentina,operating margin declined as incentives and advertisingexpenses were increased to solidify our leading marketposition in a weak economic environment.
36
In Europe, sales increased 1% to $885.6 versus1999 but increased 13% in local currency on 12%growth in units and 15% higher active Representatives.The euro, pound and zloty devalued significantly in 2000and, as a result, negatively affected u.s. dollar results.Sales growth in Central and Eastern Europe, primarilyPoland, and in Russia was partially offset by declines inmost Western European markets, most significantly inGermany. The sales improvement in Central Europeresulted from double-digit increases in units, activeRepresentatives and customers served. New Represent-ative leadership programs and a new campaign cycle alsofavorably impacted sales in Poland. The sales increase in Russia was due to double-digit increases in units andactive Representatives and an improved economic envi-ronment resulting from the stability of the Russian ruble.In Germany, the sales decline reflected a continuing weak economic climate. In the United Kingdom, salesincreased in local currency but u.s. dollar results werenegatively impacted by foreign currency exchange.
Operating profit in Europe grew 3% to $129.5 in2000 due to the sales increases, discussed above, coupledwith operating margin improvements in Central andEastern Europe, particularly Poland, and Russia, partiallyoffset by increased spending on incentives and advertisingthroughout the region and the impact of weaker curren-cies. In the Europe region, operating margin in 2000improved 30 basis points over 1999. In Poland, grossmargin improved due to a shift in mix to higher marginitems, partially offset by the cost of shipping increasedorders. The operating margin improvement in Russia wasprimarily due to a favorable comparison against the prioryear’s discount pricing policy and product sourcing, aswell as tight expense controls on a higher sales base. Adecline in the United Kingdom’s operating margin wasprimarily due to increased advertising, consumer motiva-tion and sampling activities to support sales growth, as well as increased shipping, distribution and volumerelated costs due to reduced capacity of shipping linesduring transition to a new shipping system.
In the Pacific region, sales increased 11% to $799.4in 2000 due to increases in all major markets resultingfrom an 18% increase in the number of units sold and31% increase in active Representatives. In 2000, dollar
sales for most markets were negatively impacted by for-eign currency exchange, excluding Japan and Taiwan,where foreign currency exchange had a positive impact on dollar sales. In Japan, sales increased double-digits due to an increase in units sold and active Representativesdespite a reduction in consumer spending due to eco-nomic pressures, as well as a favorable exchange rateimpact versus 1999. In China, sales growth of 44% wasdriven by channel expansion, led by beauty boutiques. Inthe Philippines, dollar sales grew in the mid-single dig-its, but local currency sales increased solid double-digits.In the Philippines, increased advertising and consumerpromotions resulted in strong increases in units sold, customers served and active Representatives. Excludingthe impact of foreign exchange, sales in the Pacific regionrose 13%.
Operating profit in the Pacific region increased15% to $117.8 in 2000 due to the sales increases, dis-cussed above, and operating margin improvements, pri-marily in Japan and China, partially offset by operatingmargin declines in Taiwan and the Philippines. In thePacific region, 2000 operating margin improved 60 basispoints over 1999. In Japan, operating margin was favor-ably impacted by an improvement in gross margin due to product cost savings initiatives and a favorable change of product mix from non-cft to higher margin cftproducts. China’s operating margin improvement wasdriven primarily by increased sales growth and newhigher margin products. Operating margin declined inTaiwan primarily due to increased costs resulting frommoving to a new distribution facility and increasedspending to support sales growth. Operating margin in the Philippines was negatively impacted by a lowergross margin resulting from higher sales of lower marginitems, and higher advertising expenses.
37
1999 Compared to 1998North America > Sales in North America increased 1% to $2.05 billion, and operating profit increased 9% to$361.1 in 1999. The u.s. business reported sales andoperating profit growth of 2% and 9%, respectively. The sales increase in the u.s. resulted primarily from anincrease in the average order size. Growth in fashion jew-elry and accessories and beyond beauty categories was partially offset by sales decreases in cft and apparel. Salesof fashion jewelry and accessories rose significantly over1998 reflecting the success of sterling silver and bolderjewelry designs, the introduction of licensed luggage and a strong performance in watches and handbags.Additionally, sales of accessories increased significantlydue to the success of the Pokémon watch in the fourthquarter. The Beyond Beauty category, consisting prima-rily of home entertainment and gift and decorative items,posted strong growth due to increased sales of inspira-tional and religious products. Fourth quarter sales ofMillennium products also contributed to the overallincrease of Beyond Beauty items. These improvementswere partially offset by declines in the cft and apparelcategories. The decrease in cft sales resulted primarilyfrom lower fragrance sales in 1999 due to the underperfor-mance of women’s new products as well as fewer offers onexisting products. Apparel sales decreased due to under-performance of new product introductions and demon-stration products as well as a shift in focus from salesgrowth to increased profitability. A 1.1 point operatingmargin improvement in the u.s. included favorable grossmargin and operating expense ratios. The gross marginimprovement resulted from supply chain cost improve-ments and product category management, partially offsetby price reductions in cft during the fourth quarter todrive sales. The favorable expense ratio reflects lowerspending in 1999 on advertising, lower variable compen-sation and the elimination of the Sponsorship program,partially offset by increased spending on strategic initia-tives such as the Internet and express and Beauty Centers.
International > International sales increased 2% to $3.24billion and operating profit increased 14% to $594.8from $520.0 in 1998. Excluding the impact of foreigncurrency exchange, international sales rose 14% and oper-ating profit increased 27% over 1998. The sales growthresulted from strong double-digit growth in the Pacificregion, most significantly in Japan, the Philippines,Taiwan and Australia, as well as growth in Europe reflect-ing improvements in Poland and the United Kingdom,
and in Mexico, Venezuela and Central America. Theseresults were significantly offset by sales declines in Brazil,and, to a lesser extent, in Russia, Argentina and Germany.
In Latin America, sales declined 3% to $1.64 bil-lion while operating profit increased 3% to $366.5 in1999. Excluding the impact of foreign currency exchange,sales increased 17%, a 20 point differential due primarilyto the Brazilian real devaluation that began in early 1999,discussed below. Brazil, however, had double-digitincreases in local currency sales, units and number of customers served. Sales decreased in Argentina and Chileas a result of weak economic conditions. The Argentineeconomy has been in a prolonged recession with highunemployment and low consumer spending. Despite thesales decline, Avon continued to gain market share inArgentina in 1999. These sales declines were partially offset by strong growth in Mexico, and, to a lesser extent,in Venezuela and Central America. Mexico’s sales increaseresulted from both operational factors including newproduct launches in the cosmetics, home and fashion linesas well as economic growth reflecting consumer priceincreases in 1999. Sales grew in Venezuela due mainly toprice increases as well as double-digit increases in numberof orders and active Representatives, and in CentralAmerica due to strong increases in units, customersserved and active Representatives. The improvement inthe region’s operating profit was primarily due to favor-able results in Mexico attributable to the sales increaseand an improved gross margin, partially offset byincreased advertising expense and incentive programs in1999. The gross margin improvement in Mexico resultedfrom a shift in the sales mix from fewer sales of toiletriesto more sales of higher-margin cosmetics and fragrances.However, in the third quarter of 1999, Avon’s retail competitors in the toiletries and non-cft categories sig-nificantly discounted their prices which led to unitdeclines. Management in Mexico adjusted prices in thefourth quarter of 1999 and planned incentive programs to aggressively recruit Representatives to mitigate theimpact of competitors’ deep discounting. ActiveRepresentatives in Mexico grew 11% in 1999. Venezuelacontributed to the region’s growth in operating profitthrough a gross margin improvement driven by priceincreases as well as bpr initiatives, particularly in thehome segment. As discussed, these improvements werepartially offset by reduced sales and a gross margindecline in Brazil and weak economic conditions inArgentina and Chile. Brazil’s gross margin decline, par-ticularly during the fourth quarter of 1999, resulted fromincreased costs due to the impact of the devaluation.
38
However, Brazil made tremendous improvements in theoperating expense ratio attributable to reduced bad debtexpense, sales returns and transportation costs. Excludingthe impact of foreign currency exchange, operating profitin Latin America increased 22% over 1998.
The Brazilian real devalued significantly in January 1999 and, as a result, negatively affected Brazil’su.s. dollar results in 1999. The effect of exchange rateswas reduced by foreign exchange contracts previously in place and several actions taken by local management to offset the devaluation, including a focused effortdirected at vendor negotiations and additional localsourcing to reduce imports. Brazil’s 1999 sales, althoughup over 20% in local currency, were down approximately20% in u.s. dollars due to the devaluation.
In the Europe region, sales increased 2% to $878.0and operating profit increased 23% to $126.2 in 1999.Sales growth in Central Europe, primarily Poland, andthe United Kingdom was partially offset by declines in Russia, Germany and France. Continued double-digit increases in units, customers served and activeRepresentatives contributed to Central Europe’s salesincrease. Poland’s success reflects strong growth in thecft category, increased Representative retention and achange in the campaign cycle, including a new brochureevery four weeks versus six weeks in 1998. Growth in theUnited Kingdom resulted from a higher average ordersize, increased distributorship sales and the successfullaunch of a new brochure in 1999 to enhance Avon’simage. Sales were lower in Russia due to the economiccrisis and ruble devaluation, which occurred in August1998, and in Germany due to a weak economy. Local currency sales in Russia increased almost 30% over 1998, with a strong increase in active Representatives.Excluding the impact of foreign currency exchange, salesin Europe increased 13% over 1998. The increase inEurope’s operating profit resulted from operating marginimprovements in Central Europe, mainly Poland, theUnited Kingdom and Italy due to higher gross marginsthat resulted from a continuing focus on pricing strate-gies and improved profitability of non-cft categories.These operating profit increases were partially offset bycontinued declines in Russia due to the ruble devaluation.
Management in Russia will continue to focus on marketshare growth and improved margins through pricing flex-ibility and tight expense management. Excluding theimpact of foreign currency exchange, operating profitincreased 31% over 1998.
In the Pacific region, sales increased 16% to $720.1and operating profit increased 63% to $102.1 in 1999.Excluding the impact of foreign currency exchange, salesincreased 8% over 1998. The sales improvement resultedfrom growth in every market, most significantly in Japandue to a favorable currency impact in 1999, and in thePhilippines, Taiwan and Australia due to strong increasesin units and customers served. Despite the earthquake inTaiwan in September 1999, sales were up double-digitsover 1998 due to aggressive marketing and sales pro-grams, incentive offers and increased spending on adver-tising. The increase in the region’s operating profitresulted primarily from the above sales increases andoperating margin improvements in Japan and China.Japan’s gross margin improved due to product cost sav-ings initiatives in cft and improved sourcing decisionsfor non-cft as well as a profitability screening processthat led to the elimination of many low-margin productsin the apparel and jewelry segments. Additionally, bprefforts continue to generate significant savings across allexpense areas in Japan. China’s operating margin alsoimproved significantly in 1999 reflecting the suspensionof operations for most of the second quarter of 1998.Excluding the impact of foreign currency exchange, oper-ating profit increased 53% over 1998.
See Foreign Operations section under Liquidity andCapital Resources for additional discussion.
Global Expenses > Global expenses were $242.3 in 2000compared with $255.3 in 1999. The $13.0 decrease wasprimarily due to lower expenses related to the Company’slong-term incentive plan, lower benefit expenses, insur-ance proceeds received in 2000 related to the 1998 hurri-cane losses in Central America, the 1999 flood losses inVenezuela and 1999 earthquake losses in Taiwan, and sav-ings in global marketing departments, partially offset byincreased investments in information technology andretail initiatives. In 1999, global expenses were $30.8higher than 1998 due to higher spending related to globalmarketing and information technology system initiatives.
39
Accounting Changes > See Note 2 of the Notes toConsolidated Financial Statements for a discussionregarding recently issued accounting standards, includ-ing Financial Accounting Standard No. 137, StaffAccounting Bulletin No. 101, Emerging Issues TaskForce (“eitf”) 00-10, eitf 00-14 and eitf 00-19.
Contingencies > Although Avon has completed itsdivestiture of all discontinued operations, various law-suits and claims (asserted and unasserted) are pending orthreatened against Avon. The Company is also involvedin a number of proceedings arising out of the federalSuperfund law and similar state laws. In some instances,Avon, along with other companies, has been designated as a potentially responsible party which may be liable forcosts associated with these various hazardous waste sites.In the opinion of Avon’s management, based on its reviewof the information available at this time, the total cost of resolving such contingencies at December 31, 2000should not have a material adverse impact on Avon’s consolidated financial position, results of operations orcash flows.
Liquidity and Capital ResourcesCash Flows > Net cash provided by operating activitieswas $323.9 in 2000 compared to $448.7 in 1999. The2000 decrease principally reflects higher working capitallevels, which primarily included increased inventory levels and a use of cash related to accounts payable andaccrued expenses, partially offset by higher net income.The increase in inventory was mainly due to higher salesvolume and additional stock on hand to protect servicelevels. Accounts payable and accrued expenses reflectedthe payout of the Company’s long-term incentive plan in2000, as well as a decline in days in payables, to a levelthat is consistent with valuable supply chain partnershipsdeveloped in recent years.
Excluding changes in debt and other financingactivities, net cash usage of $97.1 in 2000 was $639.5favorable compared to net cash usage of $736.6 in 1999.The $639.5 variance primarily reflects a decrease in repur-chases of common stock resulting from the acceleration of the buyback program in the second half of 1999. See Note 9 of the Notes to Consolidated Financial Statementsfor further discussion of the Company’s share repurchase
program. In addition, the variance was also a result of afavorable exchange rate impact on cash and decreased cashused for investing activities in 2000, due to the acquisi-tion of a manufacturing facility in Poland in 1999 andlower capital expenditures in 2000. These sources of cashwere partially offset by lower cash provided by operatingactivities, discussed above, and a reduction in book over-drafts in 2000. During 1998 and 1997, the Companyreceived net proceeds of approximately $58.1 and $58.6,respectively, under securities lending transactions thatwere settled in the fourth quarter of 2000 and areincluded in the cash flows as other financing activities.See Note 4 of the Notes to Consolidated FinancialStatements for further discussion of these transactions.
For the period 1994 through 2000, 59.6 millionshares of common stock have been purchased for approximately $1.51 billion under the stock repurchase programs. See Note 9 of the Notes to ConsolidatedFinancial Statements for further details of the sharerepurchase programs.
Working Capital > At December 31, 2000, current assetsexceeded current liabilities by $186.4 while at December31, 1999, current liabilities exceeded current assets by$375.0. This increase of $561.4 is primarily due todecreased net debt (short-term debt less cash and equiva-lents), the repayment of $101.4 related to securities lend-ing transactions that were included in other accruedliabilities in 1999, the payout of the long-term incentiveplan in 2000 as well as the net effect of the 2000 taxrefund. In addition, higher inventory levels, as discussedin the Inventories Section, also contributed to the variance.
Although current liabilities exceeded current assetsat December 31, 1999, management believes this is dueto the Company’s direct selling business format whichresults in lower receivable and working capital levels.Avon’s liquidity results from its ability to generate signif-icant cash flows from operations and its ample unusedborrowing capacity. At December 31, 1999, the largeexcess of current liabilities over current assets as well asthe issuance of long-term debt in 1999, discussed in Note4 of the Notes to Consolidated Financial Statements,reflects the acceleration of the Company’s share repurchaseprogram. These share repurchases resulted in a sharehold-ers’ deficit balance at December 31, 2000 and 1999, of$215.8 and $406.1, respectively. Avon’s credit agree-ments do not contain any provisions or requirements withrespect to working capital or equity balances.
40
Capital Resources > Total debt of $1,213.6 at December31, 2000 increased $206.2 from $1,007.4 at December31, 1999, compared with an increase of $751.1 fromDecember 31, 1998. At December 31, 1999, other accruedliabilities included approximately $106.4, related to secu-rities lending activities. These liabilities were repaid in2000. See Note 4 of the Notes to Consolidated FinancialStatements for further discussion of these transactions.During 2000 and 1999, cash flows from operating activi-ties combined with cash on hand and higher debt levelswere used for repurchase of common stock, dividends,capital expenditures and the acquisition of a manufactur-ing facility in Poland in 1999.
At December 31, 2000, debt maturing within oneyear consisted of borrowings from banks of $104.6 andthe current maturities of long-term debt of $.8. Manage-ment believes that cash from operations and availablesources of financing are adequate to meet anticipatedrequirements for working capital, dividends, capitalexpenditures, the remainder of the stock repurchase pro-gram and other cash needs.
In July 2000, the Company issued in a privateplacement $735.8 principal amount at maturity of zerocoupon convertible senior notes (“Convertible Notes”)due July 12, 2020, with proceeds of approximately$350.0. The issue price per note was $475.66, being47.566% of the principal amount of $1,000 per note atmaturity. The Convertible Notes have a 3.75% yield to maturity and are convertible at any time into theCompany’s common stock at a conversion rate of 8.2723shares of common stock per $1,000 principal amount atmaturity of the Convertible Notes (equivalent to a con-version price of $57.50 per share based on the initialoffering price of the Convertible Notes). The ConvertibleNotes may be redeemed at the option of the Company onor after July 12, 2003, at a redemption price equal to theissue price plus accrued original issue discount to theredemption date. The holders can require the Company to purchase all or a portion of the Convertible Notes onJuly 12, 2003, July 12, 2008 and July 12, 2013, at theredemption price per note of $531.74, $640.29 and$771.00, respectively. The holders may also require theCompany to repurchase the Convertible Notes if a funda-mental change, as defined, involving Avon occurs prior toJuly 12, 2003. The Company has the option to pay thepurchase price or, if a fundamental change has occurred,the repurchase price in cash or common stock or a combi-nation of cash and common stock. The indenture underwhich the Convertible Notes were issued restricts theCompany’s ability to merge with or consolidate intoanother company or to sell substantially all of theCompany’s assets.
The Company also granted to the initial purchasersof the Convertible Notes an over-allotment option to purchase an additional $105.0 of Convertible Notes. As of August 8, 2000, the over-allotment option hadbeen exercised and additional Convertible Notes with an aggregate principal amount at maturity of approxi-mately $105.0 were purchased by the initial purchasersfrom the Company for proceeds of approximately $50.0.
The net proceeds from the offering (including the proceeds of the over-allotment option) were used forgeneral corporate purposes, including the repayment ofshort-term debt.
In November 1999, the Company issued $500.0 ofunsubordinated, unsecured notes payable (the “Notes”) ina private offering to institutional investors. The proceedsfrom this issuance were used for general corporate pur-poses, including the repayment of outstanding short-termborrowings incurred to finance the acceleration of theCompany’s share repurchase program.
In connection with the November 1999 offering,Avon entered into five-year and ten-year interest rateswap contracts with notional amounts of $200.0 and$300.0, respectively, to effectively convert fixed intereston the Notes to a variable interest rate, based on commer-cial paper rates. In November 2000, these interest rateswap contracts were terminated. The cost to settle thesecontracts is being amortized over the remaining term ofthe underlying debt. At the same time, the Companyentered into new four-year and nine-year interest rateswap contracts with notional amounts of $200.0 and$300.0, respectively, to effectively convert fixed intereston the Notes to a variable interest rate, based on libor.
In May 2000, the Company entered into an interestrate cap agreement with a notional amount of $150.0expiring on May 31, 2001, to convert a variable interestrate, resulting from the interest rate swaps above, to afixed interest rate. The cap rate under this contract is 7%.
In May 1998, Avon issued $100.0 of bonds embed-ded with option features (the “Bonds”) to pay down com-mercial paper borrowings. The Bonds have a twenty-yearmaturity; however, after five years, the Bonds, at theholder’s option, can be sold back to the Company at par or can be called at par by the underwriter and resold toinvestors as fifteen-year debt. The coupon rate on theBonds is 6.25% for the first five years, but will be refi-nanced at 5.69% plus the then corporate spread if theBonds are reissued.
41
In connection with the May 1998 Bond issuance,Avon entered into a five-year interest rate swap contractwith a notional amount of $50.0 to effectively convertfixed interest on a portion of the Bonds to a variable inter-est rate, based on libor.
During 1997, the Company issued $100.0 of6.55% notes, due August 1, 2007, to pay down commer-cial paper borrowings.
During 1996, the Company entered into an agree-ment (the “credit facility”), which expires in 2001, withvarious banks to amend and restate the five-year, $600.0revolving credit and competitive advance facility agree-ment. The Company is currently negotiating with variousbanks to renew this credit facility and expects to have afinal agreement by the end of the second quarter of 2001.Within this facility, the Company is able to borrow, on anuncommitted basis, various foreign currencies.
The credit facility is primarily to be used to financeworking capital, provide support for the issuance of com-mercial paper and support the stock repurchase program.At the Company’s option, the interest rate on borrowingsunder the credit facility is based on libor or the higher of prime or federal fund rates. The credit facility has anannual facility fee of $.4. The credit facility contains acovenant for interest coverage, as defined. The Companyis in compliance with this covenant. At December 31,2000 and 1999, the Company has $29.9 and $226.4,respectively, outstanding under a $600.0 commercialpaper program supported by the credit facility.
The Company has uncommitted lines of creditavailable of $49.0 in 2000 and 1999 with various banks that have no compensating balances or fees. As of December 31, 2000 and 1999, $11.1 of these lines are being used for letters of credit. In addition, as ofDecember 31, 2000 and 1999, there were internationallines of credit totaling $449.5 and $399.5, respectively, of which $74.8 and $81.6, respectively, were outstanding.
Inventories > Avon’s products are marketed during 12 to26 individual sales campaigns each year. Each campaignis conducted using a brochure offering a wide assortmentof products, many of which change from campaign tocampaign. It is necessary for Avon to maintain relativelyhigh inventory levels as a result of the nature of its busi-ness, including the number of campaigns conductedannually and the large number of products marketed.Avon’s operations have a seasonal pattern characteristic of
many companies selling cft, fashion jewelry and acces-sories, gift and decorative items, and apparel. Holidaysales cause a peak in the fourth quarter, which results inthe build up of inventory at the end of the third quarter.Inventory levels are then reduced by the end of the fourthquarter. Inventories of $610.6 at December 31, 2000 were$87.1 higher than 1999 as a result of worldwide inven-tory investments due to sales increases; an increase inbeauty inventories to protect service levels, primarily inthe u.s. and Europe; transitional start-up related to newdistribution/manufacturing facilities in Taiwan, Mexicoand Poland; and European new market entries. It isAvon’s objective to continue to manage purchases andinventory levels maintaining the focus of operating thebusiness at efficient inventory levels. However, the addi-tion or expansion of product lines, which are subject tochanging fashion trends and consumer tastes, as well asplanned expansion in high growth markets, may cause theinventory levels to grow periodically.
Capital Expenditures > Capital expenditures during 2000were $193.5 (1999–$203.4). These expenditures weremade for capacity expansion in high growth markets,maintenance of worldwide facilities, contemporizationand replacement of information systems, the new Internetstrategy and a new manufacturing facility in Poland.Numerous construction and information systems projectswere in progress at December 31, 2000 with an estimatedcost to complete of approximately $130.0. Capital expen-ditures in 2001 are currently expected to be in the rangeof $200.0–$220.0. These expenditures will includeimprovements on existing facilities, continued invest-ments for capacity expansion in high growth markets,facility modernization, information systems, includingspending on the new Internet strategy, and equipmentreplacement projects.
Foreign Operations > For the three years ended 2000,1999 and 1998, the Company derived approximately 60%of its consolidated net sales and consolidated operatingprofit from operations from its subsidiaries outside ofNorth America. In addition, as of December 31, 2000 and1999, these subsidiaries comprised approximately 51% ofthe Company’s consolidated total assets.
Avon’s operations in many countries utilize numer-ous currencies. Avon has significant net assets in Brazil,Mexico, the United Kingdom, Japan, Argentina, Canada,the Philippines and Poland. Changes in the value of non-hyperinflationary countries’ currencies relative to
42
the u.s. dollar result in direct charges or credits to equity.Effective January 1, 1997, Mexico was designated as acountry with a highly inflationary economy due to thecumulative inflation rates over the three-year period1994–1996. However, Mexico was converted to non-hyperinflationary status effective January 1, 1999 due toreduced cumulative inflation rates during the three-yearperiod 1996 through 1998.
The euro devalued significantly during 2000 and,as a result, negatively affected the 2000 u.s. dollar resultsof the European countries using this common currency.Net sales from these countries represent 5% of Avon’sconsolidated net sales. The impact on earnings of thisdevaluation was reduced by foreign exchange contractspreviously in place.
The Brazilian real devalued significantly in January1999 and, as a result, negatively affected Brazil’s u.s. dol-lar results in 1999. The effect of exchange rates wasreduced by foreign exchange contracts previously in placeand several actions taken by local management to offsetthe devaluation, including a focused effort directed atvendor negotiations and local sourcing to reduce imports.Brazil’s 1999 net sales represented approximately 9% ofAvon’s consolidated net sales.
On April 21, 1998, the Chinese government issueda directive banning all direct selling in China resulting in the shutdown of the Company’s sales operations formost of the second quarter. As of the beginning of June1998, the Company received Chinese governmentalapproval to resume operations as a wholesale and retailbusiness and became operational again on June 15, 1998.The Company converted its 75 branches into retail out-lets to serve customers. During the end of the secondquarter of 1998, Avon received government approval to utilize sales promoters, much like Representatives, to promote product sales in China.
In early April 1999, the United States and Chinaagreed to remove all market access restrictions on directselling in China by January 1, 2003, including the cur-rent ban on direct selling imposed by the Chinese govern-ment in April 1998. The agreement is contingent uponsuccessful completion of the World Trade Organizationaccession negotiations between the United States and
China and also includes development of regulations fordirect selling based on the World Federation of DirectSelling Association’s World Code of Conduct. Avon sup-ports resolution of this direct selling issue in China andremains committed to the opportunities this promisingregion offers.
Avon’s well diversified global portfolio of busi-nesses has demonstrated that the effects of weak economiesand currency fluctuations in certain countries may be off-set by strong results in others. Fluctuations in the value offoreign currencies cause u.s. dollar-translated amounts tochange in comparison with previous periods. Accordingly,Avon cannot project in any meaningful way the possibleeffect of such fluctuations upon translated amounts orfuture earnings. This is due to the large number of cur-rencies, the complexity of intercompany relationships, the hedging activity entered into in an attempt to mini-mize certain effects of exchange rate changes where eco-nomically feasible, and the fact that all foreign currenciesdo not react in the same manner against the u.s. dollar.
Certain of the Company’s financial instruments,which are discussed below under Risk ManagementStrategies and Market Rate Sensitive Instruments and inNote 7 of the Notes to Consolidated Financial Statements,are used to hedge various amounts relating to certaininternational subsidiaries. However, the Company’s for-eign currency hedging activities are not material whencompared to the Company’s international financial posi-tion or results of operations.
Some foreign subsidiaries rely primarily on borrow-ings from local commercial banks to fund working capitalneeds created by their highly seasonal sales pattern. Fromtime to time, when tax and other considerations dictate,Avon will finance subsidiary working capital needs orborrow foreign currencies. At December 31, 2000, thetotal indebtedness of foreign subsidiaries was $76.5.
It is Avon’s policy to remit all the available cash(cash in excess of working capital requirements, having nolegal restrictions and not considered permanently rein-vested) of foreign subsidiaries as rapidly as is practical.During 2000, these subsidiaries remitted, net of taxes,$393.3 in dividends and royalties. This sum is a substan-tial portion of the 2000 consolidated net earnings ofAvon’s foreign subsidiaries.
43
Risk Management Strategies and Market Rate SensitiveInstruments > The Company operates globally, with manu-facturing and distribution facilities in various locationsaround the world. The Company may reduce its primarymarket exposures to fluctuations in interest rates and foreign exchange rates by creating offsetting positionsthrough the use of derivative financial instruments. TheCompany does not use derivative financial instruments for trading or speculative purposes, nor is the Company a party to leveraged derivatives.
The Company periodically uses interest rate swapsto hedge portions of interest payable on its debt. In addi-tion, the Company may periodically employ interest ratecaps to reduce exposure, if any, to increases in variableinterest rates.
The Company may periodically hedge foreign currency royalties, net investments in foreign subsidi-aries, firm purchase commitments and contractual foreign currency cash flows or obligations, including third partyand intercompany foreign currency transactions. TheCompany regularly monitors its foreign currency expo-sures and ensures that hedge contract amounts do notexceed the amounts of the underlying exposures.
At December 31, 2000, the Company held foreigncurrency forward contracts with notional amounts total-ing $393.7 and option contracts with notional amountstotaling $19.1 to hedge foreign currency items. All of these contracts mature within the next 13 months.Also outstanding in 2000 were foreign currency forward contracts totaling $34.2, which do not qualify as hedg-ing transactions under the current accounting definitionsand, accordingly, have been marked to market. Themark-to-market adjustment at December 31, 2000 wasnot material.
The Company has entered into forward contracts to purchase approximately 1,374,400 shares of Avon common stock at an average price of $37.09 per share atDecember 31, 2000. The contracts mature over the nextten months and provide for physical or net share settle-ment to the Company. Accordingly, no adjustment forsubsequent changes in fair value has been recognized. Inaccordance with the provisions of eitf 00-19, $51.0 ofthese contracts have been included in the accompanyingConsolidated Balance Sheets in Share repurchase commit-ments with a corresponding decrease in Additional paid-in capital. See Note 2 of the Notes to ConsolidatedFinancial Statements. On March 1, 2001, the Companypurchased 260,000 shares of Avon common stock at apurchase price of $11.5 under these contracts.
The Company attempts to minimize its creditexposure to counterparties by entering into interest rateswap and cap contracts only with major internationalfinancial institutions with “a” or higher credit ratings asissued by Standard & Poor’s Corporation. The Company’sforeign currency and interest rate derivatives are com-prised of over-the-counter forward contracts or optionswith major international financial institutions. Althoughthe Company’s theoretical credit risk is the replacementcost at the then estimated fair value of these instruments,management believes that the risk of incurring losses isremote and that such losses, if any, would not be material.
Non-performance of the counterparties to the bal-ance of all the currency and interest rate swap agreementswould not result in a significant write off at December 31,2000. In addition, Avon may be exposed to market riskon its foreign exchange and interest rate swap agreementsas a result of changes in foreign exchange and interestrates. The market risk related to the foreign exchangeagreements should be substantially offset by changes inthe valuation of the underlying items being hedged.
The Company is exposed to changes in financialmarket conditions in the normal course of its operations,primarily due to international businesses and transactionsdenominated in foreign currencies and the use of variousfinancial instruments to fund ongoing activities.
Various derivative and non-derivative financialinstruments held by the Company are sensitive to changesin interest rates. These financial instruments are eitherdiscussed above or in Notes 4 and 7 of the Notes toConsolidated Financial Statements. Interest rate changeswould result in gains or losses in the fair value of debt and other financing instruments held by the Company.Based on the outstanding balance of all instruments atDecember 31, 2000, a hypothetical 50 basis pointincrease or decrease in interest rates prevailing at thisdate, sustained for one year, would not represent a mate-rial potential loss in fair value, earnings or cash flows.This potential loss was calculated based on discountedcash flow analyses using interest rates comparable to theCompany’s current cost of debt. In 2000, the Companydid not experience a material loss in fair value, earnings or cash flows associated with changes in interest rates.
The Company is exposed to equity price fluctua-tions for investments included in the grantors trust. A 10% change in equity prices would not be material based on the fair value of equity investments as ofDecember 31, 2000.
44
The Company also engages in various hedgingactivities in order to reduce potential losses due to for-eign currency risks. Consistent with the nature of the economic hedge of such foreign exchange contracts, anyunrealized gain or loss would be offset by correspondingdecreases or increases, respectively, of the underlyinginstrument or transaction being hedged. These financialinstruments are discussed above and in Note 7 of theNotes to Consolidated Financial Statements. Based on theCompany’s foreign exchange contracts at December 31,2000, the impact of a 10% appreciation or 10% depre-ciation of the u.s. dollar against the Company’s foreignexchange contracts would not represent a material potential loss in fair value, earnings or cash flows. Thispotential loss does not consider the underlying foreigncurrency transaction or translation exposures of theCompany. The hypothetical impact was calculated on thecombined option and forward positions using forwardrates at December 31, 2000 adjusted for an assumed 10% appreciation or 10% depreciation of the u.s. dollaragainst the foreign contracts. The impact of payoffs onoption contracts is not significant to this calculation. In 2000, net foreign exchange losses associated with theCompany’s foreign exchange contracts did not represent a material loss in fair value, earnings or cash flows.
As of December 31, 2000, the primary currenciesfor which the Company has net underlying foreign cur-rency exchange rate exposure are the u.s. dollar versus the Mexican peso, Brazilian real, Argentine peso, Britishpound, Philippine peso, Polish zloty, Japanese yen andthe euro. The Company is also exposed to other SouthAmerican and Asian currencies.
The Company does not hedge its foreign cur-rency exposure in a manner that would entirely eliminatethe effect of changes in foreign exchange rates on theCompany’s consolidated financial position, results of operations and cash flows. The impact of a 10% appreci-ation or 10% depreciation of the u.s. dollar against theCompany’s net underlying foreign currency transactionand translation exposures could be material.
Other InformationIn October 1997, the Company announced its bpr pro-gram to streamline operations and improve profitabilitythrough margin improvement and expense reductions.The special and non-recurring charges associated withthis program totaled $151.2 pretax ($121.9 net of tax, or$.47 per share on a basic and diluted basis) for the yearended December 31, 1999 and $154.4 pretax ($122.8 netof tax, or $.46 per share on a basic and diluted basis) forthe year ended December 31, 1998.
In connection with these programs, bpr initiativesreduced costs by approximately $400.0 in 2000 versus1997 levels, with a portion of the savings being reinvestedprimarily in consumer-focused initiatives.
EuroA single currency called the euro was introduced inEurope on January 1, 1999. Eleven of the fifteen membercountries of the European Union adopted the euro as theircommon legal currency on that date. Fixed conversionrates between these participating countries’ existing cur-rencies (the “legacy currencies”) and the euro were estab-lished as of that date. The legacy currencies are scheduledto remain legal tender as denominations of the euro untilJune 30, 2002 after which they will be withdrawn fromcirculation. During this transition period, parties maysettle transactions using either the euro or a participatingcountry’s legal currency. Beginning in January 2002, neweuro-denominated bills and coins will be issued.
Avon operating subsidiaries affected by the euroconversion have established plans to address issues raisedby the euro currency conversion. These issues include,among others, the need to adapt information technologysystems, business processes and equipment to accommo-date euro-denominated transactions, the impact of onecommon currency on pricing and recalculating currencyrisk. Avon does not expect system and equipment con-version costs to be material. Due to the numerous uncer-tainties associated with the market impact of the euroconversion, the Company cannot reasonably estimate theeffects one common currency will have on pricing and theresulting impact, if any, on results of operations, financialposition or cash flows.
45
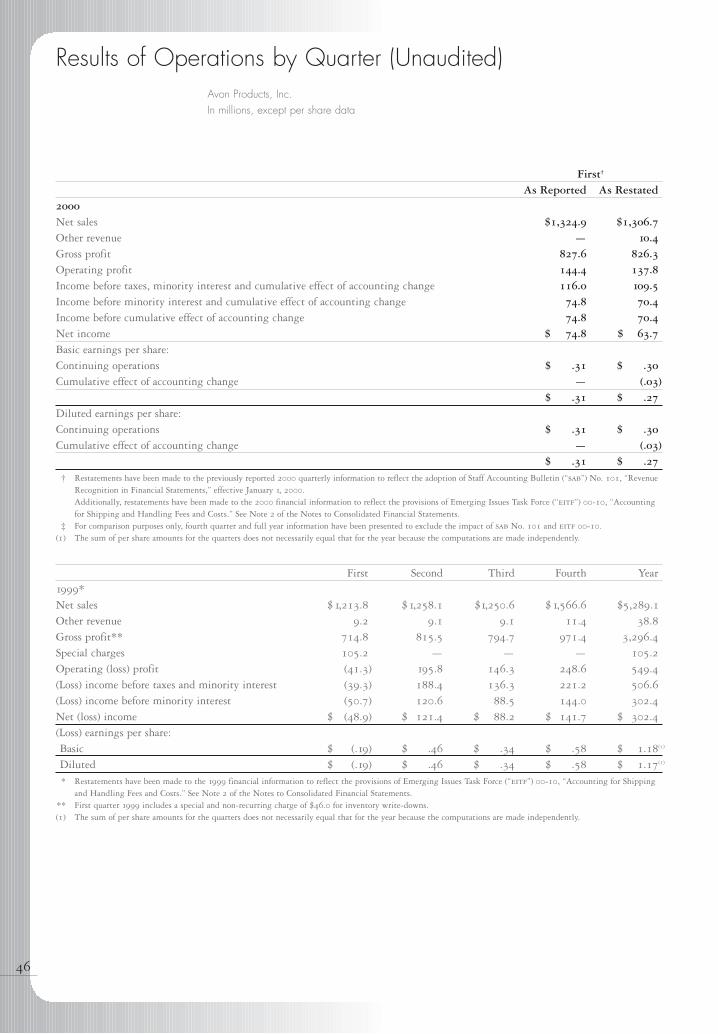
First†
As Reported As Restated2000Net sales $1,324.9 $1,306.7Other revenue — 10.4 Gross profit 827.6 826.3 Operating profit 144.4 137.8 Income before taxes, minority interest and cumulative effect of accounting change 116.0 109.5 Income before minority interest and cumulative effect of accounting change 74.8 70.4 Income before cumulative effect of accounting change 74.8 70.4 Net income $ 74.8 $ 63.7 Basic earnings per share:Continuing operations $ .31 $ .30Cumulative effect of accounting change — (.03)
$ .31 $ .27 Diluted earnings per share:Continuing operations $ .31 $ .30Cumulative effect of accounting change — (.03)
$ .31 $ .27† Restatements have been made to the previously reported 2000 quarterly information to reflect the adoption of Staff Accounting Bulletin (“sab”) No. 101, “Revenue
Recognition in Financial Statements,” effective January 1, 2000.Additionally, restatements have been made to the 2000 financial information to reflect the provisions of Emerging Issues Task Force (“eitf”) 00-10, “Accountingfor Shipping and Handling Fees and Costs.” See Note 2 of the Notes to Consolidated Financial Statements.
‡ For comparison purposes only, fourth quarter and full year information have been presented to exclude the impact of sab No. 101 and eitf 00-10.(1) The sum of per share amounts for the quarters does not necessarily equal that for the year because the computations are made independently.
Results of Operations by Quarter (Unaudited)Avon Products, Inc.In millions, except per share data
46
First Second Third Fourth Year1999*
Net sales $1,213.8 $1,258.1 $1,250.6 $1,566.6 $5,289.1
Other revenue 9.2 9.1 9.1 11.4 38.8
Gross profit** 714.8 815.5 794.7 971.4 3,296.4
Special charges 105.2 — — — 105.2
Operating (loss) profit (41.3) 195.8 146.3 248.6 549.4
(Loss) income before taxes and minority interest (39.3) 188.4 136.3 221.2 506.6
(Loss) income before minority interest (50.7) 120.6 88.5 144.0 302.4
Net (loss) income $ (48.9) $ 121.4 $ 88.2 $ 141.7 $ 302.4
(Loss) earnings per share:Basic $ (.19) $ .46 $ .34 $ .58 $ 1.18(1)
Diluted $ (.19) $ .46 $ .34 $ .58 $ 1.17(1)
* Restatements have been made to the 1999 financial information to reflect the provisions of Emerging Issues Task Force (“eitf”) 00-10, “Accounting for Shippingand Handling Fees and Costs.” See Note 2 of the Notes to Consolidated Financial Statements.
** First quarter 1999 includes a special and non-recurring charge of $46.0 for inventory write-downs.(1) The sum of per share amounts for the quarters does not necessarily equal that for the year because the computations are made independently.
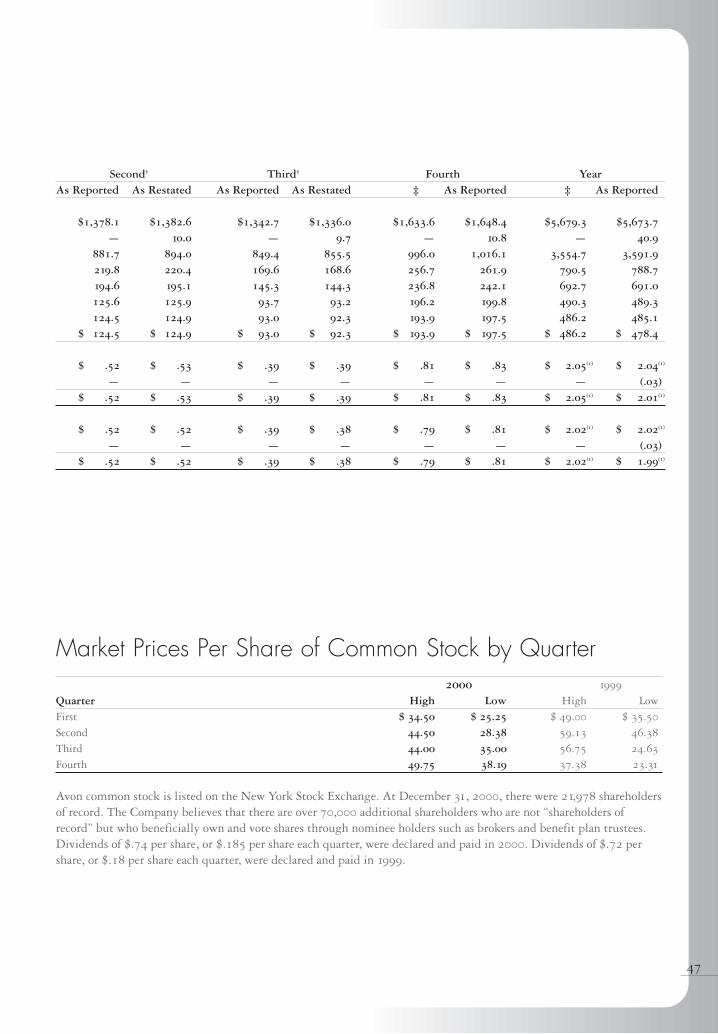
47
Second† Third† Fourth YearAs Reported As Restated As Reported As Restated ‡ As Reported ‡ As Reported
$1,378.1 $1,382.6 $1,342.7 $1,336.0 $1,633.6 $1,648.4 $5,679.3 $5,673.7— 10.0 — 9.7 — 10.8 — 40.9
881.7 894.0 849.4 855.5 996.0 1,016.1 3,554.7 3,591.9219.8 220.4 169.6 168.6 256.7 261.9 790.5 788.7194.6 195.1 145.3 144.3 236.8 242.1 692.7 691.0125.6 125.9 93.7 93.2 196.2 199.8 490.3 489.3124.5 124.9 93.0 92.3 193.9 197.5 486.2 485.1
$ 124.5 $ 124.9 $ 93.0 $ 92.3 $ 193.9 $ 197.5 $ 486.2 $ 478.4
$ .52 $ .53 $ .39 $ .39 $ .81 $ .83 $ 2.05(1) $ 2.04(1)
— — — — — — — (.03)$ .52 $ .53 $ .39 $ .39 $ .81 $ .83 $ 2.05(1) $ 2.01(1)
$ .52 $ .52 $ .39 $ .38 $ .79 $ .81 $ 2.02(1) $ 2.02(1)
— — — — — — — (.03)$ .52 $ .52 $ .39 $ .38 $ .79 $ .81 $ 2.02(1) $ 1.99(1)
2000 1999
Quarter High Low High LowFirst $ 34.50 $ 25.25 $ 49.00 $ 35.50
Second 44.50 28.38 59.13 46.38
Third 44.00 35.00 56.75 24.63
Fourth 49.75 38.19 37.38 23.31
Avon common stock is listed on the New York Stock Exchange. At December 31, 2000, there were 21,978 shareholdersof record. The Company believes that there are over 70,000 additional shareholders who are not “shareholders ofrecord” but who beneficially own and vote shares through nominee holders such as brokers and benefit plan trustees.Dividends of $.74 per share, or $.185 per share each quarter, were declared and paid in 2000. Dividends of $.72 pershare, or $.18 per share each quarter, were declared and paid in 1999.
Market Prices Per Share of Common Stock by Quarter
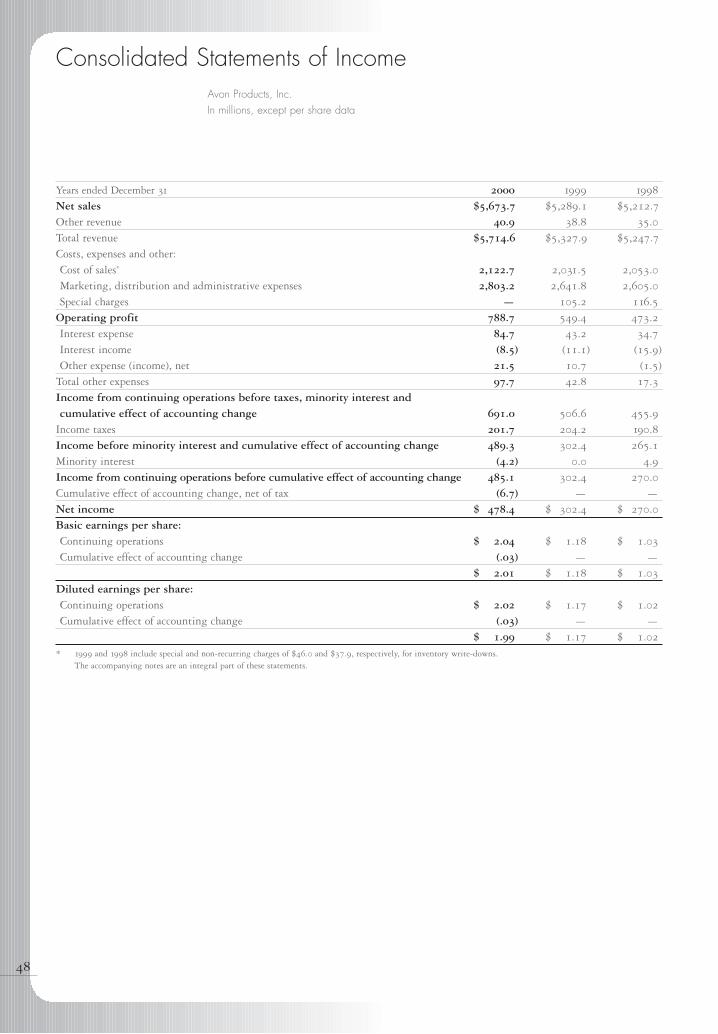
Years ended December 31 2000 1999 1998
Net sales $5,673.7 $5,289.1 $5,212.7
Other revenue 40.9 38.8 35.0
Total revenue $5,714.6 $5,327.9 $5,247.7
Costs, expenses and other:Cost of sales* 2,122.7 2,031.5 2,053.0
Marketing, distribution and administrative expenses 2,803.2 2,641.8 2,605.0
Special charges — 105.2 116.5
Operating profit 788.7 549.4 473.2
Interest expense 84.7 43.2 34.7
Interest income (8.5) (11.1) (15.9)
Other expense (income), net 21.5 10.7 (1.5)
Total other expenses 97.7 42.8 17.3
Income from continuing operations before taxes, minority interest and cumulative effect of accounting change 691.0 506.6 455.9
Income taxes 201.7 204.2 190.8
Income before minority interest and cumulative effect of accounting change 489.3 302.4 265.1
Minority interest (4.2) 0.0 4.9
Income from continuing operations before cumulative effect of accounting change 485.1 302.4 270.0
Cumulative effect of accounting change, net of tax (6.7) — —
Net income $ 478.4 $ 302.4 $ 270.0
Basic earnings per share:Continuing operations $ 2.04 $ 1.18 $ 1.03
Cumulative effect of accounting change (.03) — —
$ 2.01 $ 1.18 $ 1.03
Diluted earnings per share:Continuing operations $ 2.02 $ 1.17 $ 1.02
Cumulative effect of accounting change (.03) — —
$ 1.99 $ 1.17 $ 1.02
* 1999 and 1998 include special and non-recurring charges of $46.0 and $37.9, respectively, for inventory write-downs.The accompanying notes are an integral part of these statements.
Consolidated Statements of IncomeAvon Products, Inc.In millions, except per share data
48
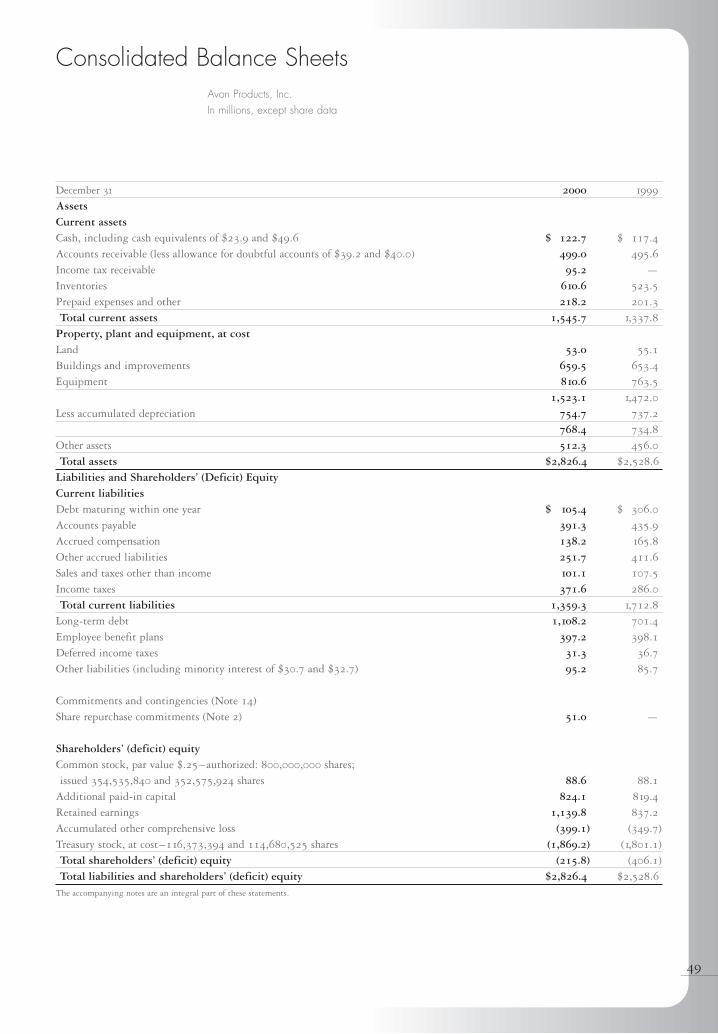
49
December 31 2000 1999
AssetsCurrent assetsCash, including cash equivalents of $23.9 and $49.6 $ 122.7 $ 117.4
Accounts receivable (less allowance for doubtful accounts of $39.2 and $40.0) 499.0 495.6
Income tax receivable 95.2 —
Inventories 610.6 523.5
Prepaid expenses and other 218.2 201.3
Total current assets 1,545.7 1,337.8
Property, plant and equipment, at costLand 53.0 55.1
Buildings and improvements 659.5 653.4
Equipment 810.6 763.5
1,523.1 1,472.0
Less accumulated depreciation 754.7 737.2
768.4 734.8
Other assets 512.3 456.0
Total assets $2,826.4 $2,528.6
Liabilities and Shareholders’ (Deficit) EquityCurrent liabilitiesDebt maturing within one year $ 105.4 $ 306.0
Accounts payable 391.3 435.9
Accrued compensation 138.2 165.8
Other accrued liabilities 251.7 411.6
Sales and taxes other than income 101.1 107.5
Income taxes 371.6 286.0
Total current liabilities 1,359.3 1,712.8
Long-term debt 1,108.2 701.4
Employee benefit plans 397.2 398.1
Deferred income taxes 31.3 36.7
Other liabilities (including minority interest of $30.7 and $32.7) 95.2 85.7
Commitments and contingencies (Note 14)Share repurchase commitments (Note 2) 51.0 —
Shareholders’ (deficit) equityCommon stock, par value $.25–authorized: 800,000,000 shares; issued 354,535,840 and 352,575,924 shares 88.6 88.1
Additional paid-in capital 824.1 819.4
Retained earnings 1,139.8 837.2
Accumulated other comprehensive loss (399.1) (349.7)
Treasury stock, at cost–116,373,394 and 114,680,525 shares (1,869.2) (1,801.1)
Total shareholders’ (deficit) equity (215.8) (406.1)
Total liabilities and shareholders’ (deficit) equity $2,826.4 $2,528.6
The accompanying notes are an integral part of these statements.
Consolidated Balance SheetsAvon Products, Inc.In millions, except share data
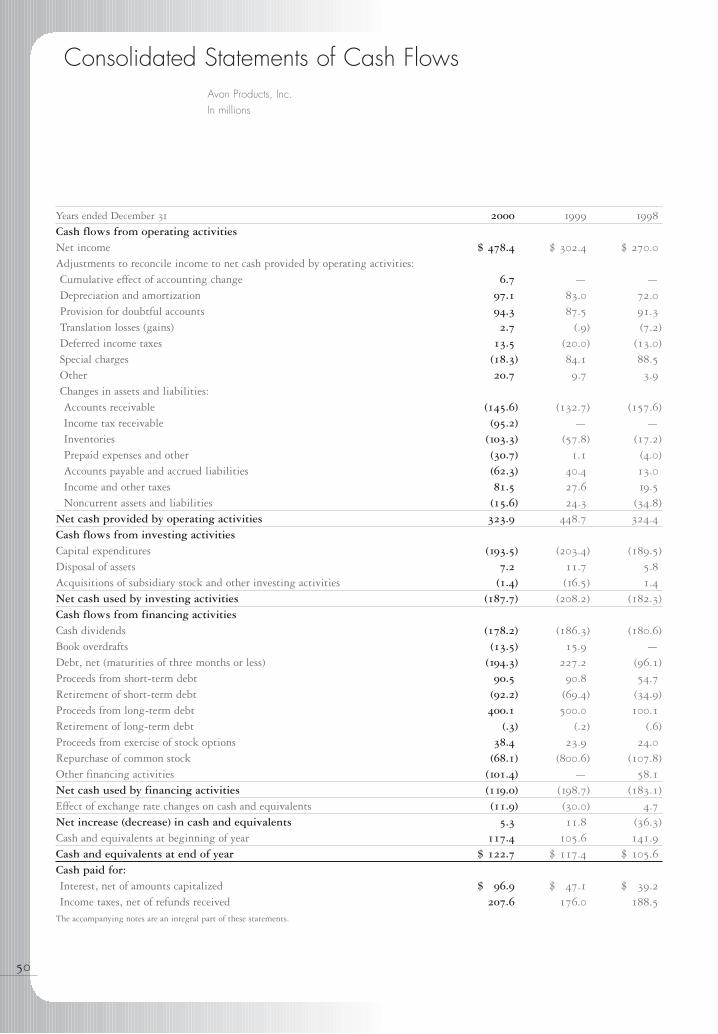
Years ended December 31 2000 1999 1998
Cash flows from operating activitiesNet income $ 478.4 $ 302.4 $ 270.0
Adjustments to reconcile income to net cash provided by operating activities:Cumulative effect of accounting change 6.7 — —
Depreciation and amortization 97.1 83.0 72.0
Provision for doubtful accounts 94.3 87.5 91.3
Translation losses (gains) 2.7 (.9) (7.2)
Deferred income taxes 13.5 (20.0) (13.0)
Special charges (18.3) 84.1 88.5
Other 20.7 9.7 3.9
Changes in assets and liabilities:Accounts receivable (145.6) (132.7) (157.6)
Income tax receivable (95.2) — —
Inventories (103.3) (57.8) (17.2)
Prepaid expenses and other (30.7) 1.1 (4.0)
Accounts payable and accrued liabilities (62.3) 40.4 13.0
Income and other taxes 81.5 27.6 19.5
Noncurrent assets and liabilities (15.6) 24.3 (34.8)
Net cash provided by operating activities 323.9 448.7 324.4
Cash flows from investing activitiesCapital expenditures (193.5) (203.4) (189.5)
Disposal of assets 7.2 11.7 5.8
Acquisitions of subsidiary stock and other investing activities (1.4) (16.5) 1.4
Net cash used by investing activities (187.7) (208.2) (182.3)
Cash flows from financing activitiesCash dividends (178.2) (186.3) (180.6)
Book overdrafts (13.5) 15.9 —
Debt, net (maturities of three months or less) (194.3) 227.2 (96.1)
Proceeds from short-term debt 90.5 90.8 54.7
Retirement of short-term debt (92.2) (69.4) (34.9)
Proceeds from long-term debt 400.1 500.0 100.1
Retirement of long-term debt (.3) (.2) (.6)
Proceeds from exercise of stock options 38.4 23.9 24.0
Repurchase of common stock (68.1) (800.6) (107.8)
Other financing activities (101.4) — 58.1
Net cash used by financing activities (119.0) (198.7) (183.1)
Effect of exchange rate changes on cash and equivalents (11.9) (30.0) 4.7
Net increase (decrease) in cash and equivalents 5.3 11.8 (36.3)
Cash and equivalents at beginning of year 117.4 105.6 141.9
Cash and equivalents at end of year $ 122.7 $ 117.4 $ 105.6
Cash paid for:Interest, net of amounts capitalized $ 96.9 $ 47.1 $ 39.2
Income taxes, net of refunds received 207.6 176.0 188.5
The accompanying notes are an integral part of these statements.
Consolidated Statements of Cash FlowsAvon Products, Inc.In millions
50
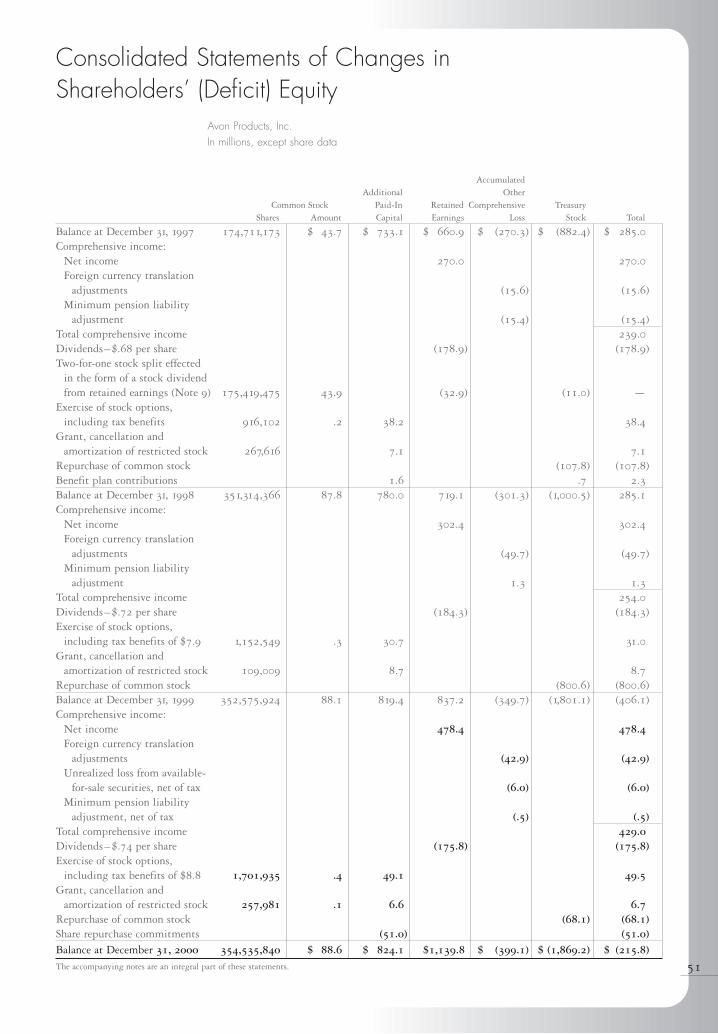
51
AccumulatedAdditional Other
Common Stock Paid-In Retained Comprehensive TreasuryShares Amount Capital Earnings Loss Stock Total
Balance at December 31, 1997 174,711,173 $ 43.7 $ 733.1 $ 660.9 $ (270.3) $ (882.4) $ 285.0Comprehensive income:
Net income 270.0 270.0Foreign currency translation
adjustments (15.6) (15.6)Minimum pension liability
adjustment (15.4) (15.4)Total comprehensive income 239.0Dividends–$.68 per share (178.9) (178.9)Two-for-one stock split effected
in the form of a stock dividend from retained earnings (Note 9) 175,419,475 43.9 (32.9) (11.0) —
Exercise of stock options, including tax benefits 916,102 .2 38.2 38.4
Grant, cancellation and amortization of restricted stock 267,616 7.1 7.1
Repurchase of common stock (107.8) (107.8)Benefit plan contributions 1.6 .7 2.3Balance at December 31, 1998 351,314,366 87.8 780.0 719.1 (301.3) (1,000.5) 285.1Comprehensive income:
Net income 302.4 302.4Foreign currency translation
adjustments (49.7) (49.7)Minimum pension liability
adjustment 1.3 1.3Total comprehensive income 254.0Dividends–$.72 per share (184.3) (184.3)Exercise of stock options,
including tax benefits of $7.9 1,152,549 .3 30.7 31.0Grant, cancellation and
amortization of restricted stock 109,009 8.7 8.7Repurchase of common stock (800.6) (800.6)Balance at December 31, 1999 352,575,924 88.1 819.4 837.2 (349.7) (1,801.1) (406.1)Comprehensive income:
Net income 478.4 478.4Foreign currency translation
adjustments (42.9) (42.9)Unrealized loss from available-
for-sale securities, net of tax (6.0) (6.0)Minimum pension liability
adjustment, net of tax (.5) (.5)Total comprehensive income 429.0Dividends–$.74 per share (175.8) (175.8)Exercise of stock options,
including tax benefits of $8.8 1,701,935 .4 49.1 49.5Grant, cancellation and
amortization of restricted stock 257,981 .1 6.6 6.7Repurchase of common stock (68.1) (68.1)Share repurchase commitments (51.0) (51.0)Balance at December 31, 2000 354,535,840 $ 88.6 $ 824.1 $1,139.8 $ (399.1) $ (1,869.2) $ (215.8)The accompanying notes are an integral part of these statements.
Consolidated Statements of Changes in Shareholders’ (Deficit) Equity
Avon Products, Inc.In millions, except share data
52
1Description of the Business and Summary ofSignificant Accounting Policies
BusinessAvon Products, Inc. (“Avon” or the “Company”) is aglobal manufacturer and marketer of beauty and relatedproducts. The product categories include cosmetics, fra-grance and toiletries (“cft”); Beauty Plus which consistsof jewelry, watches and accessories and apparel; andBeyond Beauty which consists of gift and decorative,home entertainment and health and nutrition products.Avon’s business is primarily comprised of one industrysegment, direct selling, which is conducted in NorthAmerica, Latin America, the Pacific and Europe. Sales aremade to the ultimate customers principally by independ-ent Avon Representatives.
Significant Accounting PoliciesPrinciples of Consolidation > The consolidated financialstatements include the accounts of Avon and its majorityand wholly-owned subsidiaries. Intercompany balancesand transactions are eliminated. These statements havebeen prepared in conformity with generally acceptedaccounting principles and require management to makeestimates and assumptions that affect amounts reportedand disclosed in the financial statements and relatednotes. Actual results could differ from these estimates.
Foreign Currency > Financial statements of foreign sub-sidiaries operating in other than highly inflationaryeconomies are translated at year-end exchange rates forassets and liabilities and average exchange rates duringthe year for income and expense accounts. The resultingtranslation adjustments are recorded within accumulatedother comprehensive income. Financial statements of sub-sidiaries operating in highly inflationary economies aretranslated using a combination of current and historicalexchange rates and any translation adjustments areincluded in income.
Revenue Recognition > Avon recognizes revenue upondelivery, when both title and risks and rewards of owner-ship pass to the independent Representatives, who areAvon’s customers. Prior to 2000, Avon recognized rev-enue as shipments were made. See Note 2 of the Notes toConsolidated Financial Statements.
Other revenues include shipping and handling feescharged to Representatives.
Cash and Equivalents > Cash equivalents are stated at costplus accrued interest, which approximates fair value. Cashequivalents are highly liquid debt instruments with anoriginal maturity of three months or less and consist oftime deposits with a number of u.s. and non-u.s. com-mercial banks with high credit ratings.
Inventories > Inventories are stated at the lower of cost ormarket. Cost is determined using the first-in, first-out(“fifo”) method for all inventories. Prior to October1999, substantially all u.s. inventories, except apparel,used the last-in, first-out (“lifo”) method to determinecost. The lifo value of such inventory at December 31,
1999 was approximately $3.6 lower than it would havebeen under the fifo method at December 31, 1998.Effective October 1, 1999, the u.s. inventories using thelifo method were changed to the fifo method. Thechange was made because the Company had begun torealize and expects to continue to experience cost reduc-tions as a result of technological advancements andprocess improvements in its manufacturing operations.As a result, the fifo method will better measure the cur-rent value of such inventories, provide a more appropriatematching of revenues and expenses, and conform allinventories of the Company to the same accountingmethod. This accounting change was not material to thefinancial statements on an annual or quarterly basis, andaccordingly, no restatement of prior periods’ financialstatements was made.
Notes to Consolidated Financial StatementsAvon Products, Inc.In millions, except per share data
53
Contracts that require physical or net share settlement areinitially measured at fair value with subsequent changesin fair value not recognized. Contracts that require netcash settlement are initially measured at fair value withsubsequent changes in fair value recognized as gains orlosses in the income statement.
Research and Development > Research and developmentcosts are expensed as incurred and aggregated in2000–$43.1 (1999–$38.2; 1998–$31.4).
Advertising > Advertising costs are expensed as incurredand aggregated in 2000–$92.4 (1999–$63.4;1998–$65.0).
Income Taxes > Deferred income taxes have been providedon items recognized for financial reporting purposes indifferent periods than for income tax purposes at futureenacted rates.
u.s. income taxes have not been provided onapproximately $204.0 of undistributed income of sub-sidiaries that has been or is intended to be permanentlyreinvested outside the United States.
Shipping and Handling > Shipping and handling costs areexpensed as incurred and aggregated in 2000–$533.2(1999–$495.4; 1998–$440.9). Shipping and handlingcosts are included in Marketing, distribution and adminis-trative expenses on the Consolidated Statements of Income.
Earnings per Share > Basic earnings per share (“eps”) are computed by dividing net income by the weighted-average number of shares outstanding during the year.Diluted earnings per share are calculated to give effect to all potentially dilutive common shares that were out-standing during the year.
Depreciation > Substantially all buildings, improvementsand equipment are depreciated using the straight-linemethod over estimated useful lives. Estimated useful livesfor buildings and improvements range from approximately20 to 45 years and equipment range from 3 to 15 years.
Deferred Software > Systems development costs related to the development of major information and account-ing systems are capitalized and amortized over the esti-mated useful life of the related project, not to exceed five years. Unamortized deferred software costs totaled$121.2 and $90.7 at December 31, 2000 and 1999,respectively, and are included in Other assets on theConsolidated Balance Sheets.
Stock Options > Avon applies apb Opinion 25, “Account-ing for Stock Issued to Employees,” and related interpre-tations in accounting for its long-term incentive plans.Compensation cost for fixed price options is measured asthe excess, if any, of the quoted market price of Avon’sstock at the grant date or other measurement date overthe amount an employee must pay to acquire the stock.
Financial Instruments > The Company uses derivativefinancial instruments, including swaps, forward contractsand options, to manage interest rate and foreign currencyexposures. Gains and losses on existing assets, liabilitiesand firm commitments designated as hedged items aredeferred and included in other assets or liabilities and rec-ognized when the offsetting gains and losses are recog-nized on the related financial instrument. Gains andlosses and cash flows from derivative instruments desig-nated as hedges are classified consistent with the itemsbeing hedged. Items which do not qualify for hedgeaccounting are marked to market with the resulting gainor loss recognized in other expense (income), net. Gainsand losses on terminations of foreign exchange and inter-est rate swap contracts are deferred and amortized overthe remaining terms of the original agreements.
The Company also uses financial instruments,including forward contracts to purchase Avon commonstock, to hedge certain employee benefit costs and thecost of the Company’s share repurchase program.
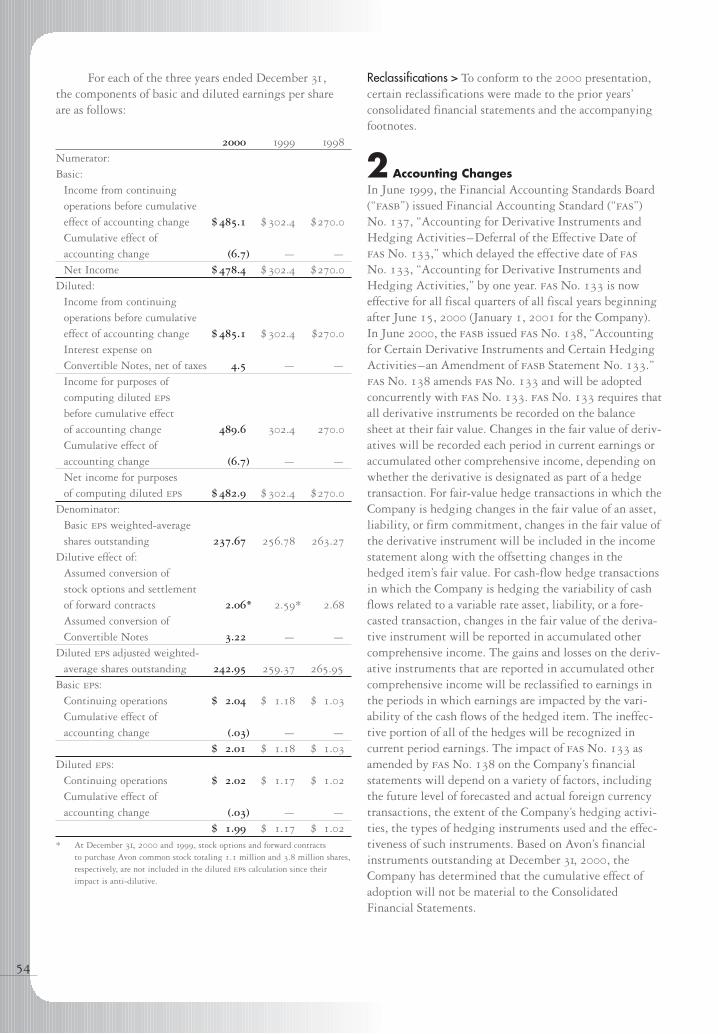
For each of the three years ended December 31, the components of basic and diluted earnings per shareare as follows:
2000 1999 1998
Numerator:Basic:
Income from continuing operations before cumulative effect of accounting change $ 485.1 $ 302.4 $270.0
Cumulative effect of accounting change (6.7) — —
Net Income $ 478.4 $ 302.4 $270.0
Diluted:Income from continuingoperations before cumulative effect of accounting change $ 485.1 $ 302.4 $270.0
Interest expense on Convertible Notes, net of taxes 4.5 — —
Income for purposes of computing diluted eps
before cumulative effect of accounting change 489.6 302.4 270.0
Cumulative effect of accounting change (6.7) — —
Net income for purposes of computing diluted eps $ 482.9 $ 302.4 $270.0
Denominator:Basic eps weighted-average shares outstanding 237.67 256.78 263.27
Dilutive effect of:Assumed conversion ofstock options and settlement of forward contracts 2.06* 2.59* 2.68
Assumed conversion of Convertible Notes 3.22 — —
Diluted eps adjusted weighted-average shares outstanding 242.95 259.37 265.95
Basic eps:Continuing operations $ 2.04 $ 1.18 $ 1.03
Cumulative effect of accounting change (.03) — —
$ 2.01 $ 1.18 $ 1.03
Diluted eps:Continuing operations $ 2.02 $ 1.17 $ 1.02
Cumulative effect of accounting change (.03) — —
$ 1.99 $ 1.17 $ 1.02
* At December 31, 2000 and 1999, stock options and forward contracts to purchase Avon common stock totaling 1.1 million and 3.8 million shares,respectively, are not included in the diluted eps calculation since theirimpact is anti-dilutive.
Reclassifications > To conform to the 2000 presentation,certain reclassifications were made to the prior years’ consolidated financial statements and the accompanyingfootnotes.
2 Accounting ChangesIn June 1999, the Financial Accounting Standards Board(“fasb”) issued Financial Accounting Standard (“fas”)No. 137, “Accounting for Derivative Instruments andHedging Activities–Deferral of the Effective Date of fas No. 133,” which delayed the effective date of fasNo. 133, “Accounting for Derivative Instruments andHedging Activities,” by one year. fas No. 133 is noweffective for all fiscal quarters of all fiscal years beginningafter June 15, 2000 (January 1, 2001 for the Company).In June 2000, the fasb issued fas No. 138, “Accountingfor Certain Derivative Instruments and Certain HedgingActivities–an Amendment of fasb Statement No. 133.”fas No. 138 amends fas No. 133 and will be adoptedconcurrently with fas No. 133. fas No. 133 requires thatall derivative instruments be recorded on the balancesheet at their fair value. Changes in the fair value of deriv-atives will be recorded each period in current earnings oraccumulated other comprehensive income, depending onwhether the derivative is designated as part of a hedgetransaction. For fair-value hedge transactions in which theCompany is hedging changes in the fair value of an asset,liability, or firm commitment, changes in the fair value ofthe derivative instrument will be included in the incomestatement along with the offsetting changes in thehedged item’s fair value. For cash-flow hedge transactionsin which the Company is hedging the variability of cashflows related to a variable rate asset, liability, or a fore-casted transaction, changes in the fair value of the deriva-tive instrument will be reported in accumulated othercomprehensive income. The gains and losses on the deriv-ative instruments that are reported in accumulated othercomprehensive income will be reclassified to earnings inthe periods in which earnings are impacted by the vari-ability of the cash flows of the hedged item. The ineffec-tive portion of all of the hedges will be recognized incurrent period earnings. The impact of fas No. 133 asamended by fas No. 138 on the Company’s financialstatements will depend on a variety of factors, includingthe future level of forecasted and actual foreign currencytransactions, the extent of the Company’s hedging activi-ties, the types of hedging instruments used and the effec-tiveness of such instruments. Based on Avon’s financialinstruments outstanding at December 31, 2000, theCompany has determined that the cumulative effect ofadoption will not be material to the ConsolidatedFinancial Statements.
54
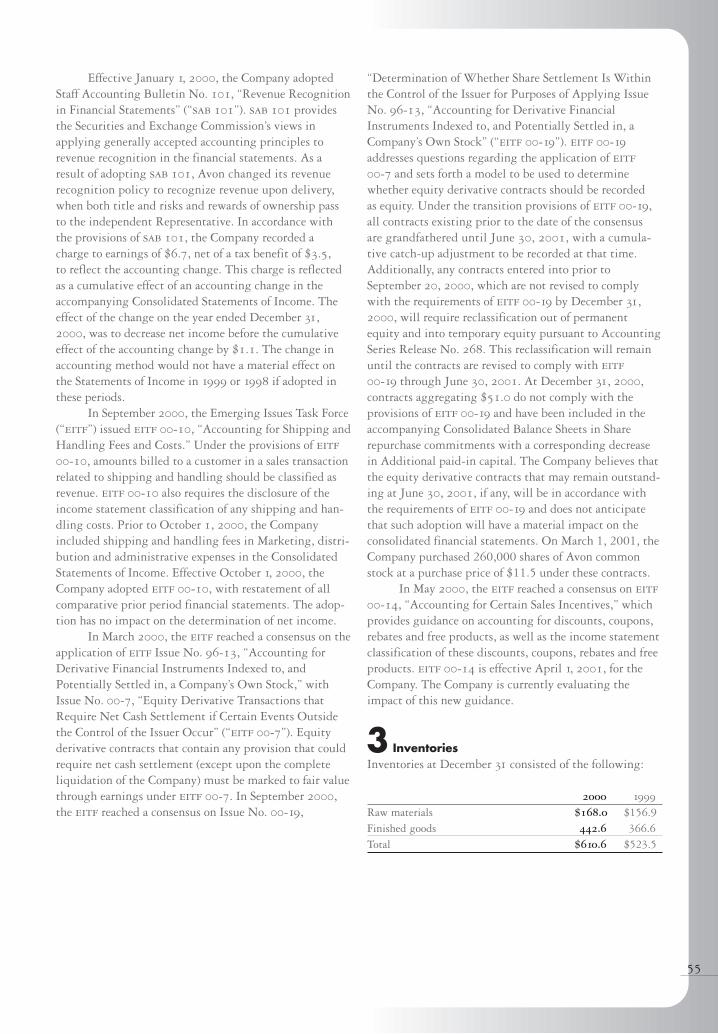
55
Effective January 1, 2000, the Company adoptedStaff Accounting Bulletin No. 101, “Revenue Recognitionin Financial Statements” (“sab 101”). sab 101 providesthe Securities and Exchange Commission’s views inapplying generally accepted accounting principles to revenue recognition in the financial statements. As aresult of adopting sab 101, Avon changed its revenuerecognition policy to recognize revenue upon delivery,when both title and risks and rewards of ownership passto the independent Representative. In accordance withthe provisions of sab 101, the Company recorded a charge to earnings of $6.7, net of a tax benefit of $3.5, to reflect the accounting change. This charge is reflectedas a cumulative effect of an accounting change in theaccompanying Consolidated Statements of Income. Theeffect of the change on the year ended December 31,2000, was to decrease net income before the cumulativeeffect of the accounting change by $1.1. The change inaccounting method would not have a material effect onthe Statements of Income in 1999 or 1998 if adopted in these periods.
In September 2000, the Emerging Issues Task Force(“eitf”) issued eitf 00-10, “Accounting for Shipping andHandling Fees and Costs.” Under the provisions of eitf00-10, amounts billed to a customer in a sales transactionrelated to shipping and handling should be classified asrevenue. eitf 00-10 also requires the disclosure of theincome statement classification of any shipping and han-dling costs. Prior to October 1, 2000, the Companyincluded shipping and handling fees in Marketing, distri-bution and administrative expenses in the ConsolidatedStatements of Income. Effective October 1, 2000, theCompany adopted eitf 00-10, with restatement of allcomparative prior period financial statements. The adop-tion has no impact on the determination of net income.
In March 2000, the eitf reached a consensus on theapplication of eitf Issue No. 96-13, “Accounting forDerivative Financial Instruments Indexed to, andPotentially Settled in, a Company’s Own Stock,” withIssue No. 00-7, “Equity Derivative Transactions thatRequire Net Cash Settlement if Certain Events Outsidethe Control of the Issuer Occur” (“eitf 00-7”). Equityderivative contracts that contain any provision that couldrequire net cash settlement (except upon the completeliquidation of the Company) must be marked to fair valuethrough earnings under eitf 00-7. In September 2000,the eitf reached a consensus on Issue No. 00-19,
“Determination of Whether Share Settlement Is Withinthe Control of the Issuer for Purposes of Applying IssueNo. 96-13, “Accounting for Derivative FinancialInstruments Indexed to, and Potentially Settled in, aCompany’s Own Stock” (“eitf 00-19”). eitf 00-19addresses questions regarding the application of eitf00-7 and sets forth a model to be used to determinewhether equity derivative contracts should be recorded as equity. Under the transition provisions of eitf 00-19,all contracts existing prior to the date of the consensus are grandfathered until June 30, 2001, with a cumula-tive catch-up adjustment to be recorded at that time.Additionally, any contracts entered into prior toSeptember 20, 2000, which are not revised to complywith the requirements of eitf 00-19 by December 31,2000, will require reclassification out of permanentequity and into temporary equity pursuant to AccountingSeries Release No. 268. This reclassification will remainuntil the contracts are revised to comply with eitf00-19 through June 30, 2001. At December 31, 2000,contracts aggregating $51.0 do not comply with the provisions of eitf 00-19 and have been included in theaccompanying Consolidated Balance Sheets in Sharerepurchase commitments with a corresponding decreasein Additional paid-in capital. The Company believes thatthe equity derivative contracts that may remain outstand-ing at June 30, 2001, if any, will be in accordance withthe requirements of eitf 00-19 and does not anticipate that such adoption will have a material impact on theconsolidated financial statements. On March 1, 2001, theCompany purchased 260,000 shares of Avon commonstock at a purchase price of $11.5 under these contracts.
In May 2000, the eitf reached a consensus on eitf00-14, “Accounting for Certain Sales Incentives,” whichprovides guidance on accounting for discounts, coupons,rebates and free products, as well as the income statementclassification of these discounts, coupons, rebates and freeproducts. eitf 00-14 is effective April 1, 2001, for theCompany. The Company is currently evaluating theimpact of this new guidance.
3 InventoriesInventories at December 31 consisted of the following:
2000 1999
Raw materials $168.0 $156.9Finished goods 442.6 366.6Total $610.6 $523.5
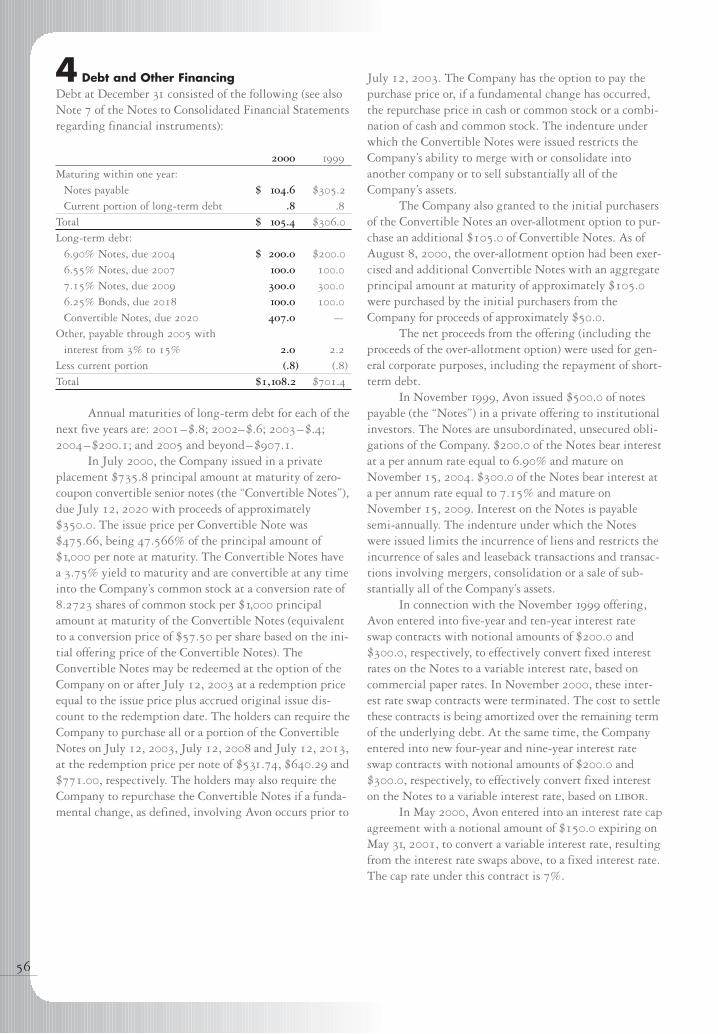
4 Debt and Other FinancingDebt at December 31 consisted of the following (see alsoNote 7 of the Notes to Consolidated Financial Statementsregarding financial instruments):
2000 1999
Maturing within one year:Notes payable $ 104.6 $305.2
Current portion of long-term debt .8 .8
Total $ 105.4 $306.0
Long-term debt:6.90% Notes, due 2004 $ 200.0 $200.0
6.55% Notes, due 2007 100.0 100.0
7.15% Notes, due 2009 300.0 300.0
6.25% Bonds, due 2018 100.0 100.0
Convertible Notes, due 2020 407.0 —
Other, payable through 2005 with interest from 3% to 15% 2.0 2.2
Less current portion (.8) (.8)
Total $1,108.2 $701.4
Annual maturities of long-term debt for each of thenext five years are: 2001–$.8; 2002–$.6; 2003–$.4;2004–$200.1; and 2005 and beyond–$907.1.
In July 2000, the Company issued in a privateplacement $735.8 principal amount at maturity of zero-coupon convertible senior notes (the “Convertible Notes”),due July 12, 2020 with proceeds of approximately$350.0. The issue price per Convertible Note was$475.66, being 47.566% of the principal amount of$1,000 per note at maturity. The Convertible Notes havea 3.75% yield to maturity and are convertible at any timeinto the Company’s common stock at a conversion rate of8.2723 shares of common stock per $1,000 principalamount at maturity of the Convertible Notes (equivalentto a conversion price of $57.50 per share based on the ini-tial offering price of the Convertible Notes). TheConvertible Notes may be redeemed at the option of theCompany on or after July 12, 2003 at a redemption priceequal to the issue price plus accrued original issue dis-count to the redemption date. The holders can require theCompany to purchase all or a portion of the ConvertibleNotes on July 12, 2003, July 12, 2008 and July 12, 2013,at the redemption price per note of $531.74, $640.29 and$771.00, respectively. The holders may also require theCompany to repurchase the Convertible Notes if a funda-mental change, as defined, involving Avon occurs prior to
July 12, 2003. The Company has the option to pay thepurchase price or, if a fundamental change has occurred,the repurchase price in cash or common stock or a combi-nation of cash and common stock. The indenture underwhich the Convertible Notes were issued restricts theCompany’s ability to merge with or consolidate intoanother company or to sell substantially all of theCompany’s assets.
The Company also granted to the initial purchasersof the Convertible Notes an over-allotment option to pur-chase an additional $105.0 of Convertible Notes. As ofAugust 8, 2000, the over-allotment option had been exer-cised and additional Convertible Notes with an aggregateprincipal amount at maturity of approximately $105.0were purchased by the initial purchasers from theCompany for proceeds of approximately $50.0.
The net proceeds from the offering (including theproceeds of the over-allotment option) were used for gen-eral corporate purposes, including the repayment of short-term debt.
In November 1999, Avon issued $500.0 of notespayable (the “Notes”) in a private offering to institutionalinvestors. The Notes are unsubordinated, unsecured obli-gations of the Company. $200.0 of the Notes bear interestat a per annum rate equal to 6.90% and mature onNovember 15, 2004. $300.0 of the Notes bear interest ata per annum rate equal to 7.15% and mature onNovember 15, 2009. Interest on the Notes is payablesemi-annually. The indenture under which the Noteswere issued limits the incurrence of liens and restricts theincurrence of sales and leaseback transactions and transac-tions involving mergers, consolidation or a sale of sub-stantially all of the Company’s assets.
In connection with the November 1999 offering,Avon entered into five-year and ten-year interest rateswap contracts with notional amounts of $200.0 and$300.0, respectively, to effectively convert fixed interestrates on the Notes to a variable interest rate, based oncommercial paper rates. In November 2000, these inter-est rate swap contracts were terminated. The cost to settlethese contracts is being amortized over the remaining termof the underlying debt. At the same time, the Companyentered into new four-year and nine-year interest rateswap contracts with notional amounts of $200.0 and$300.0, respectively, to effectively convert fixed intereston the Notes to a variable interest rate, based on libor.
In May 2000, Avon entered into an interest rate capagreement with a notional amount of $150.0 expiring onMay 31, 2001, to convert a variable interest rate, resultingfrom the interest rate swaps above, to a fixed interest rate.The cap rate under this contract is 7%.d interest rate. The
56
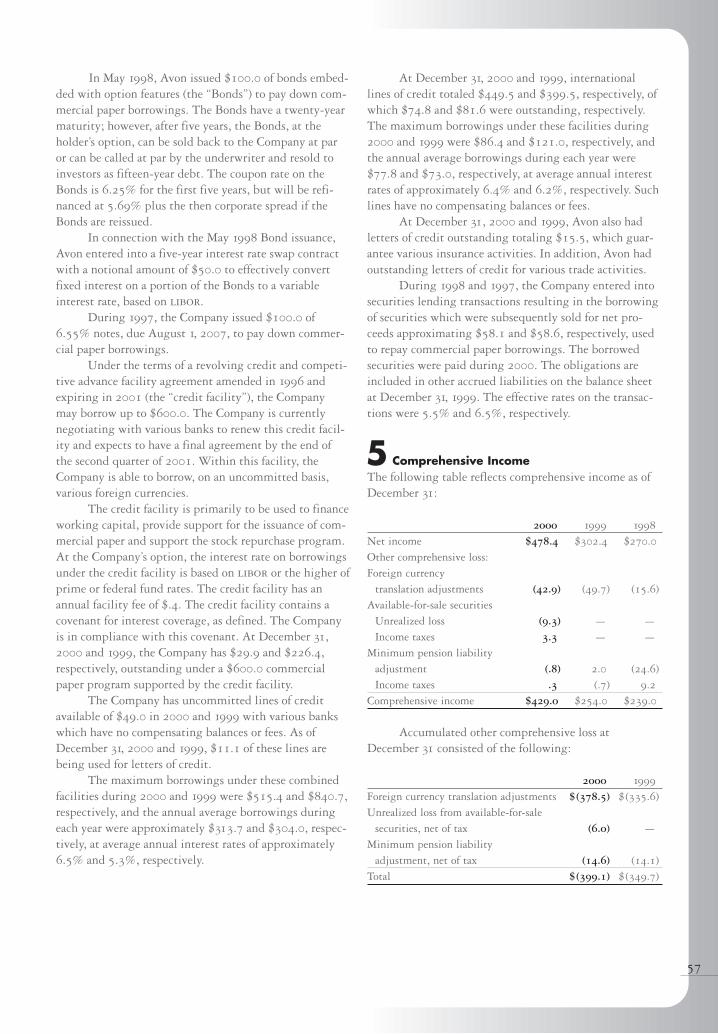
57
cap ra In May 1998, Avon issued $100.0 of bonds embed-ded with option features (the “Bonds”) to pay down com-mercial paper borrowings. The Bonds have a twenty-yearmaturity; however, after five years, the Bonds, at theholder’s option, can be sold back to the Company at par or can be called at par by the underwriter and resold toinvestors as fifteen-year debt. The coupon rate on theBonds is 6.25% for the first five years, but will be refi-nanced at 5.69% plus the then corporate spread if theBonds are reissued.
In connection with the May 1998 Bond issuance,Avon entered into a five-year interest rate swap contractwith a notional amount of $50.0 to effectively convertfixed interest on a portion of the Bonds to a variableinterest rate, based on libor.
During 1997, the Company issued $100.0 of6.55% notes, due August 1, 2007, to pay down commer-cial paper borrowings.
Under the terms of a revolving credit and competi-tive advance facility agreement amended in 1996 andexpiring in 2001 (the “credit facility”), the Company may borrow up to $600.0. The Company is currentlynegotiating with various banks to renew this credit facil-ity and expects to have a final agreement by the end of the second quarter of 2001. Within this facility, theCompany is able to borrow, on an uncommitted basis,various foreign currencies.
The credit facility is primarily to be used to financeworking capital, provide support for the issuance of com-mercial paper and support the stock repurchase program.At the Company’s option, the interest rate on borrowingsunder the credit facility is based on libor or the higher ofprime or federal fund rates. The credit facility has anannual facility fee of $.4. The credit facility contains acovenant for interest coverage, as defined. The Companyis in compliance with this covenant. At December 31,2000 and 1999, the Company has $29.9 and $226.4,respectively, outstanding under a $600.0 commercialpaper program supported by the credit facility.
The Company has uncommitted lines of creditavailable of $49.0 in 2000 and 1999 with various bankswhich have no compensating balances or fees. As ofDecember 31, 2000 and 1999, $11.1 of these lines arebeing used for letters of credit.
The maximum borrowings under these combinedfacilities during 2000 and 1999 were $515.4 and $840.7,respectively, and the annual average borrowings duringeach year were approximately $313.7 and $304.0, respec-tively, at average annual interest rates of approximately6.5% and 5.3%, respectively.
At December 31, 2000 and 1999, internationallines of credit totaled $449.5 and $399.5, respectively, ofwhich $74.8 and $81.6 were outstanding, respectively.The maximum borrowings under these facilities during2000 and 1999 were $86.4 and $121.0, respectively, andthe annual average borrowings during each year were$77.8 and $73.0, respectively, at average annual interestrates of approximately 6.4% and 6.2%, respectively. Suchlines have no compensating balances or fees.
At December 31, 2000 and 1999, Avon also hadletters of credit outstanding totaling $15.5, which guar-antee various insurance activities. In addition, Avon hadoutstanding letters of credit for various trade activities.
During 1998 and 1997, the Company entered intosecurities lending transactions resulting in the borrowingof securities which were subsequently sold for net pro-ceeds approximating $58.1 and $58.6, respectively, usedto repay commercial paper borrowings. The borrowedsecurities were paid during 2000. The obligations areincluded in other accrued liabilities on the balance sheetat December 31, 1999. The effective rates on the transac-tions were 5.5% and 6.5%, respectively.
5 Comprehensive IncomeThe following table reflects comprehensive income as ofDecember 31:
2000 1999 1998
Net income $478.4 $302.4 $270.0
Other comprehensive loss: Foreign currency
translation adjustments (42.9) (49.7) (15.6)
Available-for-sale securitiesUnrealized loss (9.3) — —
Income taxes 3.3 — —
Minimum pension liabilityadjustment (.8) 2.0 (24.6)
Income taxes .3 (.7) 9.2
Comprehensive income $429.0 $254.0 $239.0
Accumulated other comprehensive loss atDecember 31 consisted of the following:
2000 1999
Foreign currency translation adjustments $(378.5) $(335.6)
Unrealized loss from available-for-sale securities, net of tax (6.0) —
Minimum pension liabilityadjustment, net of tax (14.6) (14.1)
Total $(399.1) $(349.7)
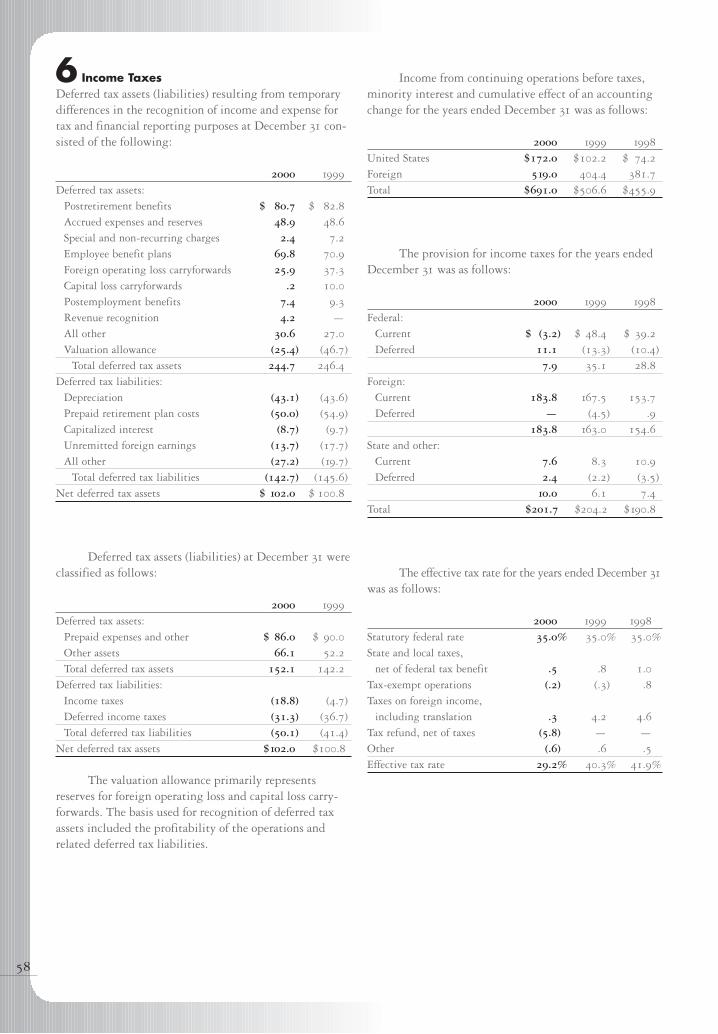
6 Income TaxesDeferred tax assets (liabilities) resulting from temporarydifferences in the recognition of income and expense fortax and financial reporting purposes at December 31 con-sisted of the following:
2000 1999
Deferred tax assets:Postretirement benefits $ 80.7 $ 82.8
Accrued expenses and reserves 48.9 48.6
Special and non-recurring charges 2.4 7.2
Employee benefit plans 69.8 70.9
Foreign operating loss carryforwards 25.9 37.3
Capital loss carryforwards .2 10.0
Postemployment benefits 7.4 9.3
Revenue recognition 4.2 —
All other 30.6 27.0
Valuation allowance (25.4) (46.7)
Total deferred tax assets 244.7 246.4
Deferred tax liabilities:Depreciation (43.1) (43.6)
Prepaid retirement plan costs (50.0) (54.9)
Capitalized interest (8.7) (9.7)
Unremitted foreign earnings (13.7) (17.7)
All other (27.2) (19.7)
Total deferred tax liabilities (142.7) (145.6)
Net deferred tax assets $ 102.0 $ 100.8
Deferred tax assets (liabilities) at December 31 wereclassified as follows:
2000 1999
Deferred tax assets:Prepaid expenses and other $ 86.0 $ 90.0
Other assets 66.1 52.2
Total deferred tax assets 152.1 142.2
Deferred tax liabilities:Income taxes (18.8) (4.7)Deferred income taxes (31.3) (36.7)
Total deferred tax liabilities (50.1) (41.4)
Net deferred tax assets $102.0 $100.8
The valuation allowance primarily representsreserves for foreign operating loss and capital loss carry-forwards. The basis used for recognition of deferred taxassets included the profitability of the operations andrelated deferred tax liabilities.
Income from continuing operations before taxes,minority interest and cumulative effect of an accountingchange for the years ended December 31 was as follows:
2000 1999 1998
United States $172.0 $102.2 $ 74.2
Foreign 519.0 404.4 381.7
Total $691.0 $506.6 $455.9
The provision for income taxes for the years endedDecember 31 was as follows:
2000 1999 1998
Federal:Current $ (3.2) $ 48.4 $ 39.2
Deferred 11.1 (13.3) (10.4)
7.9 35.1 28.8
Foreign:Current 183.8 167.5 153.7
Deferred — (4.5) .9
183.8 163.0 154.6
State and other:Current 7.6 8.3 10.9
Deferred 2.4 (2.2) (3.5)
10.0 6.1 7.4
Total $201.7 $204.2 $190.8
The effective tax rate for the years ended December 31was as follows:
2000 1999 1998
Statutory federal rate 35.0% 35.0% 35.0%
State and local taxes, net of federal tax benefit .5 .8 1.0
Tax-exempt operations (.2) (.3) .8
Taxes on foreign income, including translation .3 4.2 4.6
Tax refund, net of taxes (5.8) — —
Other (.6) .6 .5
Effective tax rate 29.2% 40.3% 41.9%
58
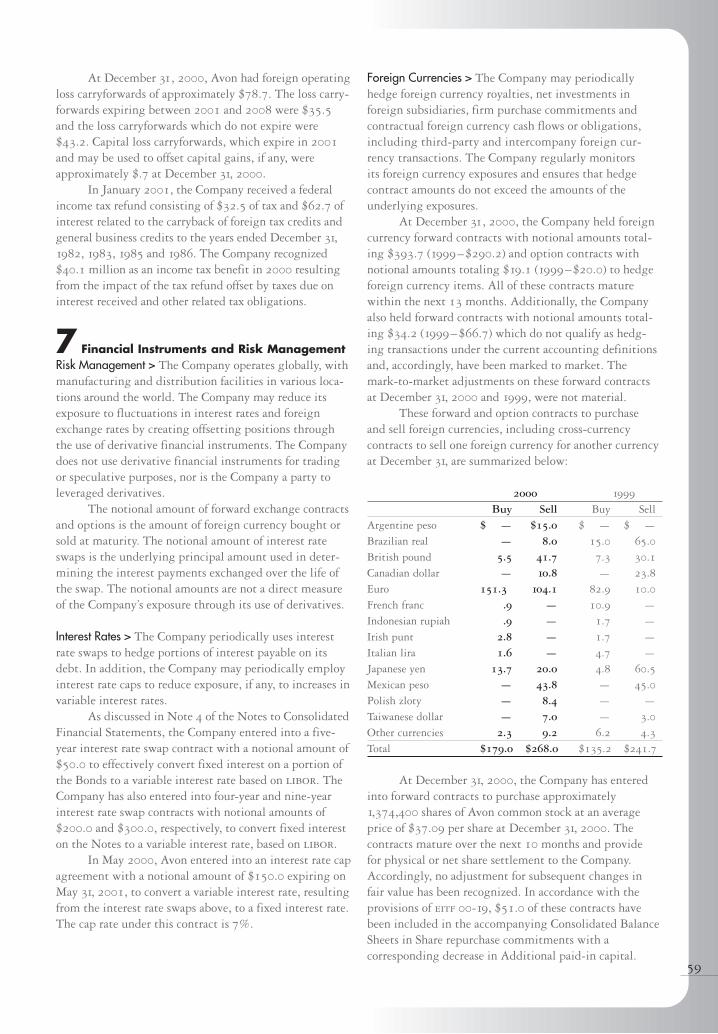
59
At December 31, 2000, Avon had foreign operatingloss carryforwards of approximately $78.7. The loss carry-forwards expiring between 2001 and 2008 were $35.5and the loss carryforwards which do not expire were$43.2. Capital loss carryforwards, which expire in 2001and may be used to offset capital gains, if any, wereapproximately $.7 at December 31, 2000.
In January 2001, the Company received a federalincome tax refund consisting of $32.5 of tax and $62.7 ofinterest related to the carryback of foreign tax credits andgeneral business credits to the years ended December 31,1982, 1983, 1985 and 1986. The Company recognized$40.1 million as an income tax benefit in 2000 resultingfrom the impact of the tax refund offset by taxes due oninterest received and other related tax obligations.
7 Financial Instruments and Risk ManagementRisk Management > The Company operates globally, withmanufacturing and distribution facilities in various loca-tions around the world. The Company may reduce itsexposure to fluctuations in interest rates and foreignexchange rates by creating offsetting positions throughthe use of derivative financial instruments. The Companydoes not use derivative financial instruments for tradingor speculative purposes, nor is the Company a party toleveraged derivatives.
The notional amount of forward exchange contractsand options is the amount of foreign currency bought orsold at maturity. The notional amount of interest rateswaps is the underlying principal amount used in deter-mining the interest payments exchanged over the life ofthe swap. The notional amounts are not a direct measureof the Company’s exposure through its use of derivatives.
Interest Rates > The Company periodically uses interestrate swaps to hedge portions of interest payable on itsdebt. In addition, the Company may periodically employinterest rate caps to reduce exposure, if any, to increases invariable interest rates.
As discussed in Note 4 of the Notes to ConsolidatedFinancial Statements, the Company entered into a five-year interest rate swap contract with a notional amount of$50.0 to effectively convert fixed interest on a portion ofthe Bonds to a variable interest rate based on libor. TheCompany has also entered into four-year and nine-yearinterest rate swap contracts with notional amounts of$200.0 and $300.0, respectively, to convert fixed intereston the Notes to a variable interest rate, based on libor.
In May 2000, Avon entered into an interest rate capagreement with a notional amount of $150.0 expiring onMay 31, 2001, to convert a variable interest rate, resultingfrom the interest rate swaps above, to a fixed interest rate.The cap rate under this contract is 7%.
Foreign Currencies > The Company may periodicallyhedge foreign currency royalties, net investments in foreign subsidiaries, firm purchase commitments andcontractual foreign currency cash flows or obligations,including third-party and intercompany foreign cur-rency transactions. The Company regularly monitors its foreign currency exposures and ensures that hedge contract amounts do not exceed the amounts of theunderlying exposures.
At December 31, 2000, the Company held foreigncurrency forward contracts with notional amounts total-ing $393.7 (1999–$290.2) and option contracts withnotional amounts totaling $19.1 (1999–$20.0) to hedgeforeign currency items. All of these contracts maturewithin the next 13 months. Additionally, the Companyalso held forward contracts with notional amounts total-ing $34.2 (1999–$66.7) which do not qualify as hedg-ing transactions under the current accounting definitions and, accordingly, have been marked to market. The mark-to-market adjustments on these forward contractsat December 31, 2000 and 1999, were not material.
These forward and option contracts to purchase and sell foreign currencies, including cross-currency contracts to sell one foreign currency for another currency at December 31, are summarized below:
2000 1999
Buy Sell Buy SellArgentine peso $ — $15.0 $ — $ —
Brazilian real — 8.0 15.0 65.0
British pound 5.5 41.7 7.3 30.1
Canadian dollar — 10.8 — 23.8
Euro 151.3 104.1 82.9 10.0
French franc .9 — 10.9 —
Indonesian rupiah .9 — 1.7 —
Irish punt 2.8 — 1.7 —
Italian lira 1.6 — 4.7 —
Japanese yen 13.7 20.0 4.8 60.5
Mexican peso — 43.8 — 45.0
Polish zloty — 8.4 — —
Taiwanese dollar — 7.0 — 3.0
Other currencies 2.3 9.2 6.2 4.3
Total $179.0 $268.0 $135.2 $241.7
At December 31, 2000, the Company has enteredinto forward contracts to purchase approximately1,374,400 shares of Avon common stock at an averageprice of $37.09 per share at December 31, 2000. The contracts mature over the next 10 months and provide for physical or net share settlement to the Company.Accordingly, no adjustment for subsequent changes infair value has been recognized. In accordance with theprovisions of eitf 00-19, $51.0 of these contracts havebeen included in the accompanying Consolidated BalanceSheets in Share repurchase commitments with a corresponding decrease in Additional paid-in capital.
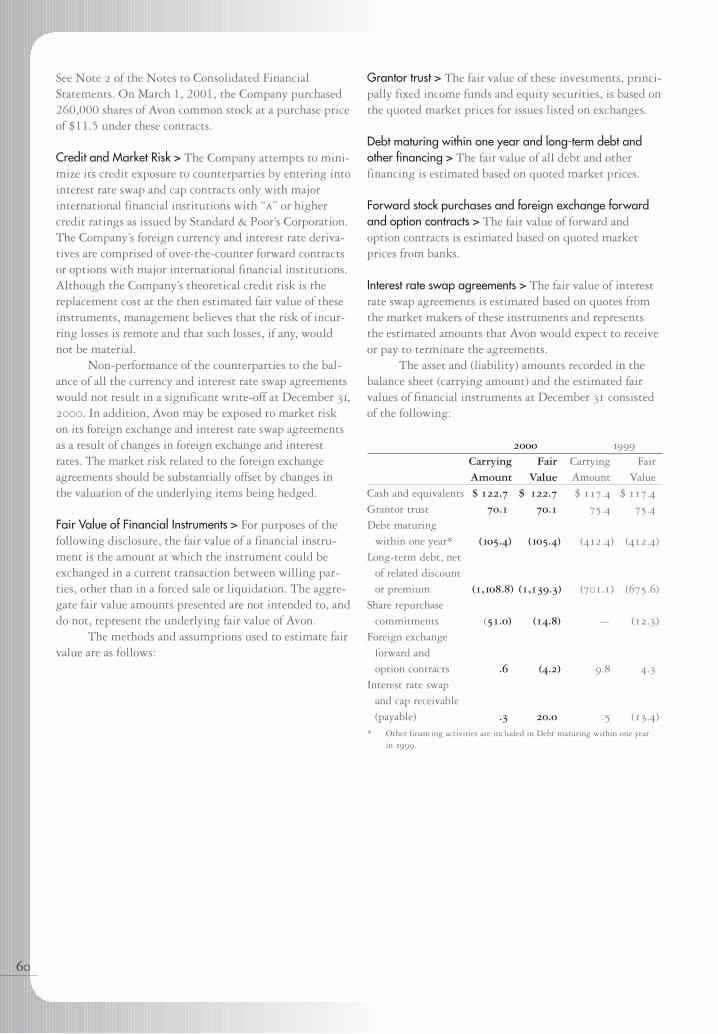
See Note 2 of the Notes to Consolidated FinancialStatements. On March 1, 2001, the Company purchased260,000 shares of Avon common stock at a purchase priceof $11.5 under these contracts.
Credit and Market Risk > The Company attempts to mini-mize its credit exposure to counterparties by entering intointerest rate swap and cap contracts only with majorinternational financial institutions with “a” or highercredit ratings as issued by Standard & Poor’s Corporation.The Company’s foreign currency and interest rate deriva-tives are comprised of over-the-counter forward contractsor options with major international financial institutions.Although the Company’s theoretical credit risk is thereplacement cost at the then estimated fair value of theseinstruments, management believes that the risk of incur-ring losses is remote and that such losses, if any, wouldnot be material.
Non-performance of the counterparties to the bal-ance of all the currency and interest rate swap agreementswould not result in a significant write-off at December 31,2000. In addition, Avon may be exposed to market riskon its foreign exchange and interest rate swap agreementsas a result of changes in foreign exchange and interestrates. The market risk related to the foreign exchangeagreements should be substantially offset by changes inthe valuation of the underlying items being hedged.
Fair Value of Financial Instruments > For purposes of thefollowing disclosure, the fair value of a financial instru-ment is the amount at which the instrument could beexchanged in a current transaction between willing par-ties, other than in a forced sale or liquidation. The aggre-gate fair value amounts presented are not intended to, anddo not, represent the underlying fair value of Avon.
The methods and assumptions used to estimate fairvalue are as follows:
Grantor trust > The fair value of these investments, princi-pally fixed income funds and equity securities, is based onthe quoted market prices for issues listed on exchanges.
Debt maturing within one year and long-term debt andother financing > The fair value of all debt and otherfinancing is estimated based on quoted market prices.
Forward stock purchases and foreign exchange forwardand option contracts > The fair value of forward andoption contracts is estimated based on quoted marketprices from banks.
Interest rate swap agreements > The fair value of interestrate swap agreements is estimated based on quotes fromthe market makers of these instruments and representsthe estimated amounts that Avon would expect to receiveor pay to terminate the agreements.
The asset and (liability) amounts recorded in thebalance sheet (carrying amount) and the estimated fairvalues of financial instruments at December 31 consistedof the following:
2000 1999
Carrying Fair Carrying FairAmount Value Amount Value
Cash and equivalents $ 122.7 $ 122.7 $ 117.4 $ 117.4
Grantor trust 70.1 70.1 75.4 75.4
Debt maturing within one year* (105.4) (105.4) (412.4) (412.4)
Long-term debt, net of related discount or premium (1,108.8) (1,139.3) (701.1) (675.6)
Share repurchasecommitments (51.0) (14.8) — (12.3)
Foreign exchange forward and option contracts 0.6 (4.2) 9.8 4.3
Interest rate swap and cap receivable (payable) 0.3 20.0 .5 (13.4)
* Other financing activities are included in Debt maturing within one year in 1999.
60
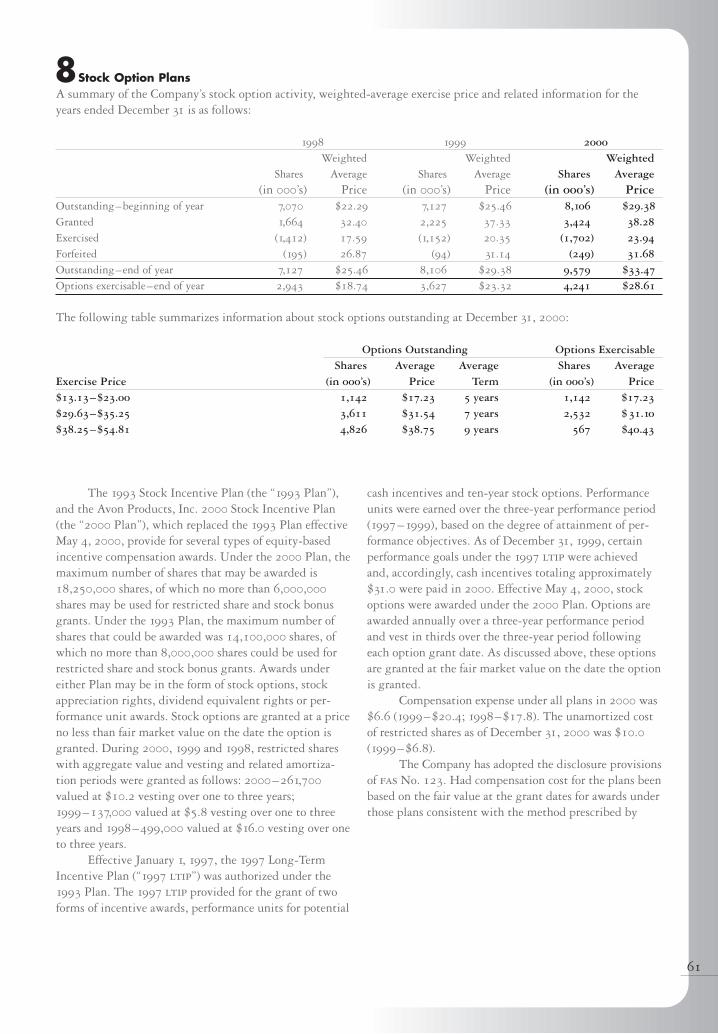
61
8Stock Option PlansA summary of the Company’s stock option activity, weighted-average exercise price and related information for theyears ended December 31 is as follows:
1998 1999 2000Weighted Weighted Weighted
Shares Average Shares Average Shares Average(in 000’s) Price (in 000’s) Price (in 000’s) Price
Outstanding–beginning of year 7,070 $22.29 7,127 $25.46 8,106 $29.38Granted 1,664 32.40 2,225 37.33 3,424 38.28Exercised (1,412) 17.59 (1,152) 20.35 (1,702) 23.94Forfeited (195) 26.87 (94) 31.14 (249) 31.68Outstanding–end of year 7,127 $25.46 8,106 $29.38 9,579 $33.47Options exercisable–end of year 2,943 $18.74 3,627 $23.32 4,241 $28.61
The following table summarizes information about stock options outstanding at December 31, 2000:
Options Outstanding Options ExercisableShares Average Average Shares Average
Exercise Price (in 000’s) Price Term (in 000’s) Price$13.13–$23.00 1,142 $17.23 5 years 1,142 $17.23$29.63–$35.25 3,611 $31.54 7 years 2,532 $31.10$38.25–$54.81 4,826 $38.75 9 years 567 $40.43
The 1993 Stock Incentive Plan (the “1993 Plan”),and the Avon Products, Inc. 2000 Stock Incentive Plan(the “2000 Plan”), which replaced the 1993 Plan effectiveMay 4, 2000, provide for several types of equity-basedincentive compensation awards. Under the 2000 Plan, themaximum number of shares that may be awarded is18,250,000 shares, of which no more than 6,000,000shares may be used for restricted share and stock bonusgrants. Under the 1993 Plan, the maximum number ofshares that could be awarded was 14,100,000 shares, ofwhich no more than 8,000,000 shares could be used forrestricted share and stock bonus grants. Awards undereither Plan may be in the form of stock options, stockappreciation rights, dividend equivalent rights or per-formance unit awards. Stock options are granted at a priceno less than fair market value on the date the option isgranted. During 2000, 1999 and 1998, restricted shareswith aggregate value and vesting and related amortiza-tion periods were granted as follows: 2000–261,700valued at $10.2 vesting over one to three years;1999–137,000 valued at $5.8 vesting over one to threeyears and 1998–499,000 valued at $16.0 vesting over oneto three years.
Effective January 1, 1997, the 1997 Long-TermIncentive Plan (“1997 ltip”) was authorized under the1993 Plan. The 1997 ltip provided for the grant of twoforms of incentive awards, performance units for potential
cash incentives and ten-year stock options. Performanceunits were earned over the three-year performance period(1997–1999), based on the degree of attainment of per-formance objectives. As of December 31, 1999, certainperformance goals under the 1997 ltip were achievedand, accordingly, cash incentives totaling approximately$31.0 were paid in 2000. Effective May 4, 2000, stockoptions were awarded under the 2000 Plan. Options areawarded annually over a three-year performance periodand vest in thirds over the three-year period followingeach option grant date. As discussed above, these optionsare granted at the fair market value on the date the optionis granted.
Compensation expense under all plans in 2000 was$6.6 (1999–$20.4; 1998–$17.8). The unamortized costof restricted shares as of December 31, 2000 was $10.0(1999–$6.8).
The Company has adopted the disclosure provisionsof fas No. 123. Had compensation cost for the plans beenbased on the fair value at the grant dates for awards underthose plans consistent with the method prescribed by
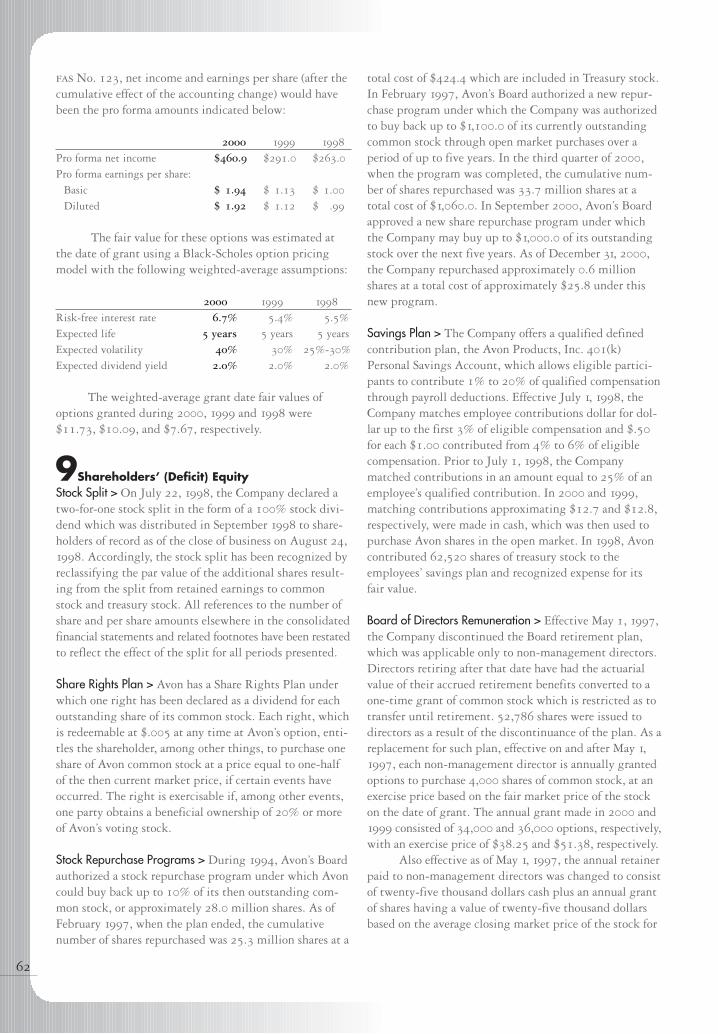
62
fas No. 123, net income and earnings per share (after thecumulative effect of the accounting change) would havebeen the pro forma amounts indicated below:
2000 1999 1998
Pro forma net income $460.9 $291.0 $263.0
Pro forma earnings per share:Basic $ 1.94 $ 1.13 $ 1.00
Diluted $ 1.92 $ 1.12 $ .99
The fair value for these options was estimated atthe date of grant using a Black-Scholes option pricingmodel with the following weighted-average assumptions:
2000 1999 1998
Risk-free interest rate 6.7% 5.4% 5.5%
Expected life 5 years 5 years 5 yearsExpected volatility 40% 30% 25%-30%Expected dividend yield 2.0% 2.0% 2.0%
The weighted-average grant date fair values ofoptions granted during 2000, 1999 and 1998 were$11.73, $10.09, and $7.67, respectively.
9Shareholders’ (Deficit) EquityStock Split > On July 22, 1998, the Company declared atwo-for-one stock split in the form of a 100% stock divi-dend which was distributed in September 1998 to share-holders of record as of the close of business on August 24,1998. Accordingly, the stock split has been recognized byreclassifying the par value of the additional shares result-ing from the split from retained earnings to commonstock and treasury stock. All references to the number ofshare and per share amounts elsewhere in the consolidatedfinancial statements and related footnotes have been restatedto reflect the effect of the split for all periods presented.
Share Rights Plan > Avon has a Share Rights Plan underwhich one right has been declared as a dividend for eachoutstanding share of its common stock. Each right, whichis redeemable at $.005 at any time at Avon’s option, enti-tles the shareholder, among other things, to purchase oneshare of Avon common stock at a price equal to one-halfof the then current market price, if certain events haveoccurred. The right is exercisable if, among other events,one party obtains a beneficial ownership of 20% or moreof Avon’s voting stock.
Stock Repurchase Programs > During 1994, Avon’s Boardauthorized a stock repurchase program under which Avoncould buy back up to 10% of its then outstanding com-mon stock, or approximately 28.0 million shares. As ofFebruary 1997, when the plan ended, the cumulativenumber of shares repurchased was 25.3 million shares at a
total cost of $424.4 which are included in Treasury stock.In February 1997, Avon’s Board authorized a new repur-chase program under which the Company was authorizedto buy back up to $1,100.0 of its currently outstandingcommon stock through open market purchases over aperiod of up to five years. In the third quarter of 2000,when the program was completed, the cumulative num-ber of shares repurchased was 33.7 million shares at atotal cost of $1,060.0. In September 2000, Avon’s Boardapproved a new share repurchase program under whichthe Company may buy up to $1,000.0 of its outstandingstock over the next five years. As of December 31, 2000,the Company repurchased approximately 0.6 millionshares at a total cost of approximately $25.8 under thisnew program.
Savings Plan > The Company offers a qualified definedcontribution plan, the Avon Products, Inc. 401(k)Personal Savings Account, which allows eligible partici-pants to contribute 1% to 20% of qualified compensationthrough payroll deductions. Effective July 1, 1998, theCompany matches employee contributions dollar for dol-lar up to the first 3% of eligible compensation and $.50for each $1.00 contributed from 4% to 6% of eligiblecompensation. Prior to July 1, 1998, the Companymatched contributions in an amount equal to 25% of anemployee’s qualified contribution. In 2000 and 1999,matching contributions approximating $12.7 and $12.8,respectively, were made in cash, which was then used topurchase Avon shares in the open market. In 1998, Avoncontributed 62,520 shares of treasury stock to theemployees’ savings plan and recognized expense for itsfair value.
Board of Directors Remuneration > Effective May 1, 1997,the Company discontinued the Board retirement plan,which was applicable only to non-management directors.Directors retiring after that date have had the actuarialvalue of their accrued retirement benefits converted to aone-time grant of common stock which is restricted as totransfer until retirement. 52,786 shares were issued todirectors as a result of the discontinuance of the plan. As areplacement for such plan, effective on and after May 1,1997, each non-management director is annually grantedoptions to purchase 4,000 shares of common stock, at anexercise price based on the fair market price of the stockon the date of grant. The annual grant made in 2000 and1999 consisted of 34,000 and 36,000 options, respectively,with an exercise price of $38.25 and $51.38, respectively.
Also effective as of May 1, 1997, the annual retainerpaid to non-management directors was changed to consistof twenty-five thousand dollars cash plus an annual grantof shares having a value of twenty-five thousand dollarsbased on the average closing market price of the stock for
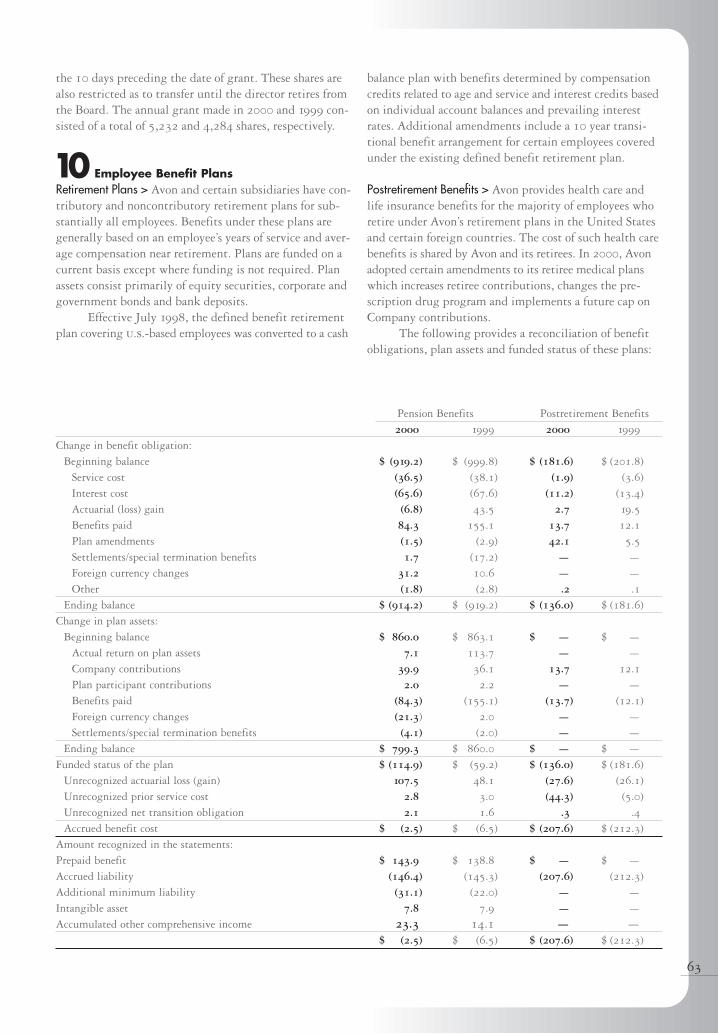
63
the 10 days preceding the date of grant. These shares arealso restricted as to transfer until the director retires fromthe Board. The annual grant made in 2000 and 1999 con-sisted of a total of 5,232 and 4,284 shares, respectively.
10 Employee Benefit PlansRetirement Plans > Avon and certain subsidiaries have con-tributory and noncontributory retirement plans for sub-stantially all employees. Benefits under these plans aregenerally based on an employee’s years of service and aver-age compensation near retirement. Plans are funded on acurrent basis except where funding is not required. Planassets consist primarily of equity securities, corporate andgovernment bonds and bank deposits.
Effective July 1998, the defined benefit retirementplan covering u.s.-based employees was converted to a cash
balance plan with benefits determined by compensationcredits related to age and service and interest credits basedon individual account balances and prevailing interestrates. Additional amendments include a 10 year transi-tional benefit arrangement for certain employees coveredunder the existing defined benefit retirement plan.
Postretirement Benefits > Avon provides health care andlife insurance benefits for the majority of employees whoretire under Avon’s retirement plans in the United Statesand certain foreign countries. The cost of such health carebenefits is shared by Avon and its retirees. In 2000, Avonadopted certain amendments to its retiree medical planswhich increases retiree contributions, changes the pre-scription drug program and implements a future cap onCompany contributions.
The following provides a reconciliation of benefitobligations, plan assets and funded status of these plans:
Pension Benefits Postretirement Benefits2000 1999 2000 1999
Change in benefit obligation:Beginning balance $ (919.2) $ (999.8) $ (181.6) $ (201.8)
Service cost (36.5) (38.1) (1.9) (3.6)
Interest cost (65.6) (67.6) (11.2) (13.4)
Actuarial (loss) gain (6.8) 43.5 2.7 19.5
Benefits paid 84.3 155.1 13.7 12.1
Plan amendments (1.5) (2.9) 42.1 5.5
Settlements/special termination benefits 1.7 (17.2) — —
Foreign currency changes 31.2 10.6 — —
Other (1.8) (2.8) .2 .1
Ending balance $ (914.2) $ (919.2) $ (136.0) $ (181.6)
Change in plan assets:Beginning balance $ 860.0 $ 863.1 $ — $ —
Actual return on plan assets 7.1 113.7 — —
Company contributions 39.9 36.1 13.7 12.1
Plan participant contributions 2.0 2.2 — —
Benefits paid (84.3) (155.1) (13.7) (12.1)
Foreign currency changes (21.3) 2.0 — —
Settlements/special termination benefits (4.1) (2.0) — —
Ending balance $ 799.3 $ 860.0 $ — $ —
Funded status of the plan $ (114.9) $ (59.2) $ (136.0) $ (181.6)
Unrecognized actuarial loss (gain) 107.5 48.1 (27.6) (26.1)
Unrecognized prior service cost 2.8 3.0 (44.3) (5.0)
Unrecognized net transition obligation 2.1 1.6 .3 .4
Accrued benefit cost $ (2.5) $ (6.5) $ (207.6) $ (212.3)
Amount recognized in the statements:Prepaid benefit $ 143.9 $ 138.8 $ — $ —
Accrued liability (146.4) (145.3) (207.6) (212.3)Additional minimum liability (31.1) (22.0) — —
Intangible asset 7.8 7.9 — —
Accumulated other comprehensive income 23.3 14.1 — —$ (2.5) $ (6.5) $ (207.6) $ (212.3)
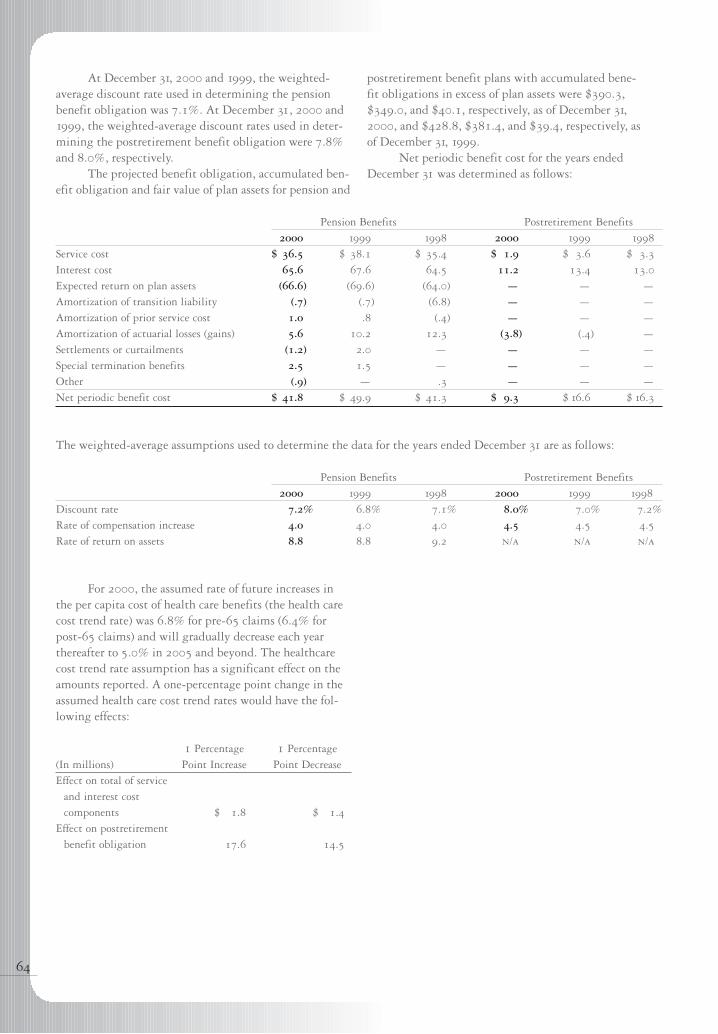
At December 31, 2000 and 1999, the weighted-average discount rate used in determining the pensionbenefit obligation was 7.1%. At December 31, 2000 and1999, the weighted-average discount rates used in deter-mining the postretirement benefit obligation were 7.8%and 8.0%, respectively.
The projected benefit obligation, accumulated ben-efit obligation and fair value of plan assets for pension and
64
Pension Benefits Postretirement Benefits2000 1999 1998 2000 1999 1998
Service cost $ 36.5 $ 38.1 $ 35.4 $ 1.9 $ 3.6 $ 3.3
Interest cost 65.6 67.6 64.5 11.2 13.4 13.0
Expected return on plan assets (66.6) (69.6) (64.0) — — —
Amortization of transition liability (.7) (.7) (6.8) — — —
Amortization of prior service cost 1.0 .8 (.4) — — —
Amortization of actuarial losses (gains) 5.6 10.2 12.3 (3.8) (.4) —
Settlements or curtailments (1.2) 2.0 — — — —
Special termination benefits 2.5 1.5 — — — —
Other (.9) — .3 — — —
Net periodic benefit cost $ 41.8 $ 49.9 $ 41.3 $ 9.3 $ 16.6 $ 16.3
The weighted-average assumptions used to determine the data for the years ended December 31 are as follows:
Pension Benefits Postretirement Benefits2000 1999 1998 2000 1999 1998
Discount rate 7.2% 6.8% 7.1% 8.0% 7.0% 7.2%
Rate of compensation increase 4.0 4.0 4.0 4.5 4.5 4.5
Rate of return on assets 8.8 8.8 9.2 n/a n/a n/a
postretirement benefit plans with accumulated bene-fit obligations in excess of plan assets were $390.3,$349.0, and $40.1, respectively, as of December 31,2000, and $428.8, $381.4, and $39.4, respectively, as of December 31, 1999.
Net periodic benefit cost for the years endedDecember 31 was determined as follows:
For 2000, the assumed rate of future increases inthe per capita cost of health care benefits (the health carecost trend rate) was 6.8% for pre-65 claims (6.4% forpost-65 claims) and will gradually decrease each yearthereafter to 5.0% in 2005 and beyond. The healthcarecost trend rate assumption has a significant effect on theamounts reported. A one-percentage point change in theassumed health care cost trend rates would have the fol-lowing effects:
1 Percentage 1 Percentage(In millions) Point Increase Point DecreaseEffect on total of service
and interest cost components $ 1.8 $ 1.4
Effect on postretirement benefit obligation 17.6 14.5
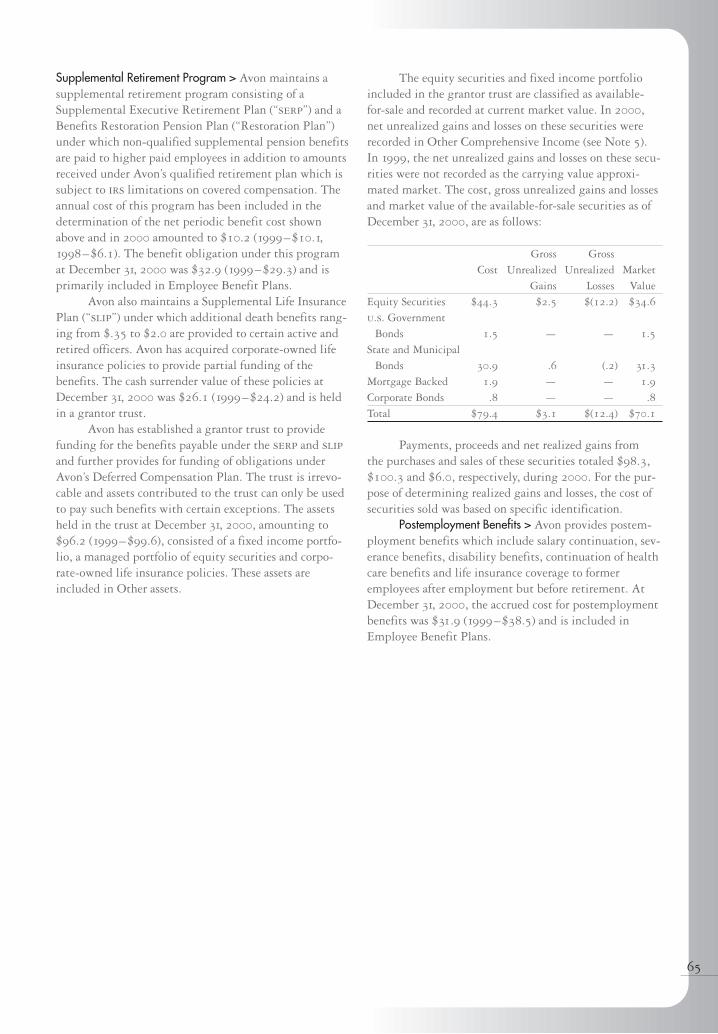
65
Supplemental Retirement Program > Avon maintains asupplemental retirement program consisting of aSupplemental Executive Retirement Plan (“serp”) and aBenefits Restoration Pension Plan (“Restoration Plan”)under which non-qualified supplemental pension benefitsare paid to higher paid employees in addition to amountsreceived under Avon’s qualified retirement plan which issubject to irs limitations on covered compensation. Theannual cost of this program has been included in thedetermination of the net periodic benefit cost shownabove and in 2000 amounted to $10.2 (1999–$10.1,1998–$6.1). The benefit obligation under this programat December 31, 2000 was $32.9 (1999–$29.3) and isprimarily included in Employee Benefit Plans.
Avon also maintains a Supplemental Life InsurancePlan (“slip”) under which additional death benefits rang-ing from $.35 to $2.0 are provided to certain active andretired officers. Avon has acquired corporate-owned lifeinsurance policies to provide partial funding of the benefits. The cash surrender value of these policies atDecember 31, 2000 was $26.1 (1999–$24.2) and is heldin a grantor trust.
Avon has established a grantor trust to providefunding for the benefits payable under the serp and slipand further provides for funding of obligations underAvon’s Deferred Compensation Plan. The trust is irrevo-cable and assets contributed to the trust can only be usedto pay such benefits with certain exceptions. The assetsheld in the trust at December 31, 2000, amounting to$96.2 (1999–$99.6), consisted of a fixed income portfo-lio, a managed portfolio of equity securities and corpo-rate-owned life insurance policies. These assets areincluded in Other assets.
The equity securities and fixed income portfolioincluded in the grantor trust are classified as available-for-sale and recorded at current market value. In 2000,net unrealized gains and losses on these securities wererecorded in Other Comprehensive Income (see Note 5). In 1999, the net unrealized gains and losses on these secu-rities were not recorded as the carrying value approxi-mated market. The cost, gross unrealized gains and lossesand market value of the available-for-sale securities as ofDecember 31, 2000, are as follows:
Gross GrossCost Unrealized Unrealized Market
Gains Losses ValueEquity Securities $44.3 $2.5 $(12.2) $34.6
u.s. Government Bonds 1.5 — — 1.5
State and Municipal Bonds 30.9 0.6 (.2) 31.3
Mortgage Backed 1.9 — — 1.9
Corporate Bonds 0.8 — — .8
Total $79.4 $3.1 $(12.4) $70.1
Payments, proceeds and net realized gains from the purchases and sales of these securities totaled $98.3,$100.3 and $6.0, respectively, during 2000. For the pur-pose of determining realized gains and losses, the cost ofsecurities sold was based on specific identification.
Postemployment Benefits > Avon provides postem-ployment benefits which include salary continuation, sev-erance benefits, disability benefits, continuation of healthcare benefits and life insurance coverage to formeremployees after employment but before retirement. AtDecember 31, 2000, the accrued cost for postemploymentbenefits was $31.9 (1999–$38.5) and is included inEmployee Benefit Plans.
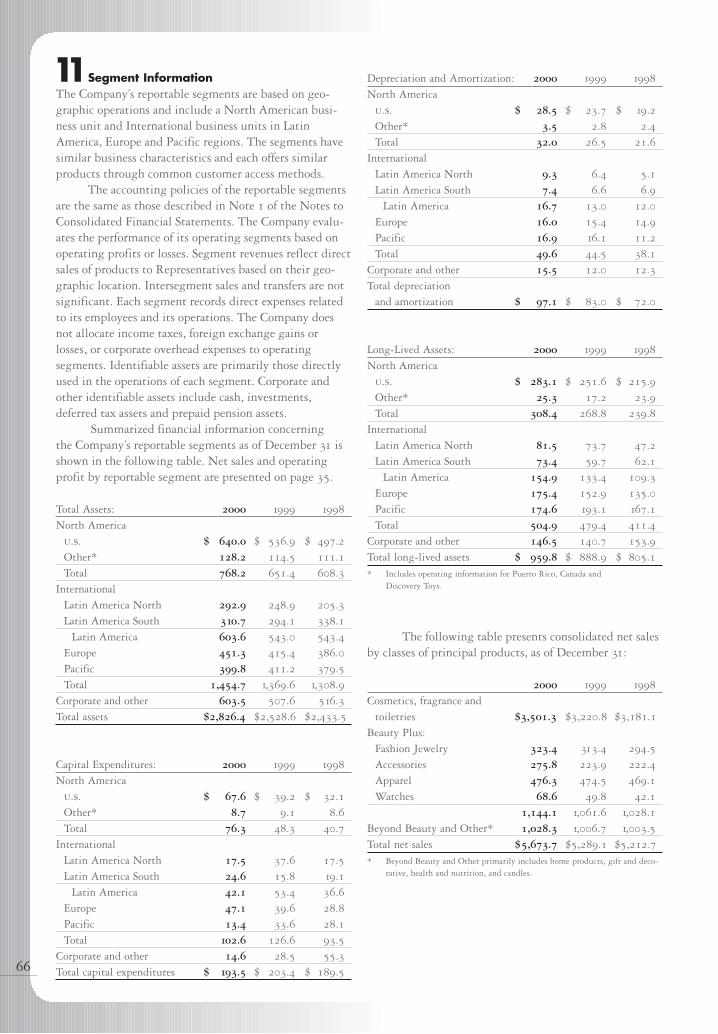
11Segment InformationThe Company’s reportable segments are based on geo-graphic operations and include a North American busi-ness unit and International business units in LatinAmerica, Europe and Pacific regions. The segments havesimilar business characteristics and each offers similarproducts through common customer access methods.
The accounting policies of the reportable segmentsare the same as those described in Note 1 of the Notes toConsolidated Financial Statements. The Company evalu-ates the performance of its operating segments based onoperating profits or losses. Segment revenues reflect directsales of products to Representatives based on their geo-graphic location. Intersegment sales and transfers are notsignificant. Each segment records direct expenses relatedto its employees and its operations. The Company doesnot allocate income taxes, foreign exchange gains orlosses, or corporate overhead expenses to operating segments. Identifiable assets are primarily those directlyused in the operations of each segment. Corporate andother identifiable assets include cash, investments,deferred tax assets and prepaid pension assets.
Summarized financial information concerning the Company’s reportable segments as of December 31 isshown in the following table. Net sales and operatingprofit by reportable segment are presented on page 35.
Total Assets: 2000 1999 1998
North Americau.s. $ 640.0 $ 536.9 $ 497.2
Other* 128.2 114.5 111.1
Total 768.2 651.4 608.3
InternationalLatin America North 292.9 248.9 205.3
Latin America South 310.7 294.1 338.1
Latin America 603.6 543.0 543.4
Europe 451.3 415.4 386.0
Pacific 399.8 411.2 379.5
Total 1,454.7 1,369.6 1,308.9
Corporate and other 603.5 507.6 516.3
Total assets $2,826.4 $2,528.6 $2,433.5
Capital Expenditures: 2000 1999 1998
North Americau.s. $ 67.6 $ 39.2 $ 32.1
Other* 8.7 9.1 8.6
Total 76.3 48.3 40.7
InternationalLatin America North 17.5 37.6 17.5
Latin America South 24.6 15.8 19.1
Latin America 42.1 53.4 36.6
Europe 47.1 39.6 28.8
Pacific 13.4 33.6 28.1
Total 102.6 126.6 93.5
Corporate and other 14.6 28.5 55.3
Total capital expenditures $ 193.5 $ 203.4 $ 189.5
Depreciation and Amortization: 2000 1999 1998
North Americau.s. $ 28.5 $ 23.7 $ 19.2
Other* 3.5 2.8 2.4
Total 32.0 26.5 21.6
InternationalLatin America North 9.3 6.4 5.1
Latin America South 7.4 6.6 6.9
Latin America 16.7 13.0 12.0
Europe 16.0 15.4 14.9
Pacific 16.9 16.1 11.2
Total 49.6 44.5 38.1
Corporate and other 15.5 12.0 12.3
Total depreciation and amortization $ 97.1 $ 83.0 $ 72.0
Long-Lived Assets: 2000 1999 1998
North Americau.s. $ 283.1 $ 251.6 $ 215.9
Other* 25.3 17.2 23.9
Total 308.4 268.8 239.8
InternationalLatin America North 81.5 73.7 47.2
Latin America South 73.4 59.7 62.1
Latin America 154.9 133.4 109.3
Europe 175.4 152.9 135.0
Pacific 174.6 193.1 167.1
Total 504.9 479.4 411.4
Corporate and other 146.5 140.7 153.9
Total long-lived assets $ 959.8 $ 888.9 $ 805.1
* Includes operating information for Puerto Rico, Canada and Discovery Toys.
The following table presents consolidated net salesby classes of principal products, as of December 31:
2000 1999 1998
Cosmetics, fragrance and toiletries $3,501.3 $3,220.8 $3,181.1
Beauty Plus:Fashion Jewelry 323.4 313.4 294.5
Accessories 275.8 223.9 222.4
Apparel 476.3 474.5 469.1
Watches 68.6 49.8 42.1
1,144.1 1,061.6 1,028.1
Beyond Beauty and Other* 1,028.3 1,006.7 1,003.5
Total net sales $5,673.7 $5,289.1 $5,212.7
* Beyond Beauty and Other primarily includes home products, gift and deco-rative, health and nutrition, and candles.
66

67
Foreign Exchange > Financial statement translation ofsubsidiaries operating in highly inflationary economiesand foreign currency transactions resulted in losses (gains)in 2000 netting to $12.6 (1999–$7.5; 1998–$(1.1)),which are included in other expense (income), net andincome taxes. In addition, cost of sales and expensesinclude the unfavorable impact of the translation ofinventories and prepaid expenses at historical rates incountries with highly inflationary economies in 2000 of$3.2 (1999–$7.1; 1998–$15.8).
12 Leases and CommitmentsMinimum rental commitments under noncancellableoperating leases, primarily for equipment and office facili-ties at December 31, 2000, consisted of the following:
Year2001 $ 69.1
2002 52.8
2003 40.6
2004 33.1
2005 29.1
Later years 225.3
Sublease rental income (4.5)
Total $445.5
Rent expense in 2000 was $85.4 (1999–$84.5;1998–$84.7). Various construction and information sys-tems projects were in progress at December 31, 2000, withan estimated cost to complete of approximately $130.0.
13 Special and Non-Recurring ChargesIn October 1997, the Company announced a worldwidebusiness process redesign program to streamline opera-tions and improve profitability through margin improve-ment and expense reductions. The special and non-recurring charges associated with this program totaled$151.2 pretax ($121.9 net of tax, or $.47 per share on abasic and diluted basis) for the year ended December 31,1999 and totaled $154.4 pretax ($122.8 net of tax, or$.46 per share on a basic and diluted basis) for the yearended December 31, 1998.
Special and non-recurring charges by business seg-ment are as follows:
1999 1998
North America $ 33.6 $ 84.6
Latin America 14.7 6.3
Europe 69.8 18.2
Pacific 11.8 27.3
Corporate 21.3 18.0
Total $151.2 $ 154.4
Special and non-recurring charges by category of expenditures are as follows for the years endedDecember 31:
1999
Cost ofSpecial Sales
Charges Charge TotalEmployee severance costs $ 57.0 $ — $ 57.0
Inventories — 46.0 46.0
Writedown of assets to net realizable value 26.4 — 26.4
Recognition of foreign currency translation adjustment 9.8 — 9.8
Other 12.0 — 12.0
$105.2 $ 46.0 $151.2
1998
Cost ofSpecial Sales
Charges Charge TotalEmployee severance costs $ 56.4 $ — $ 56.4
Inventories — 37.9 37.9
Writedown of assets to net realizable value 31.8 — 31.8
Field program buy-out 14.4 — 14.4
Other 13.9 — 13.9
$116.5 $ 37.9 $154.4
Employee severance costs are expenses, both domes-tic and international, associated with the realignment of the Company’s global operations. Certain employeeseverance costs were accounted for in accordance with theCompany’s existing fas 112 (“Employers’ Accounting for Postemployment Benefits”) severance plans. Remainingseverance costs were accounted for in accordance withother accounting literature. The workforce was reducedby approximately 3,700 employees, or 9% of the total.Approximately one-half of the terminated employeesrelated to the facility closures. As of December 31, 2000,all employees under the program have been terminated.
Inventory-related charges represent losses to writedown the carrying value of non-strategic inventory priorto disposal. The 1999 charges primarily result from a new business strategy for product dispositions which fundamentally changes the way the Company marketsand sells certain inventory. This new strategy, approvedand effective in March 1999, is meant to complementother redesign initiatives, with the objective of reducinginventory clearance sales, building core brochure sales and building global brands. The 1998 charges resultedfrom the closure of facilities, discontinuation of certainproduct lines, size-of-line reductions and a change instrategy for product dispositions.
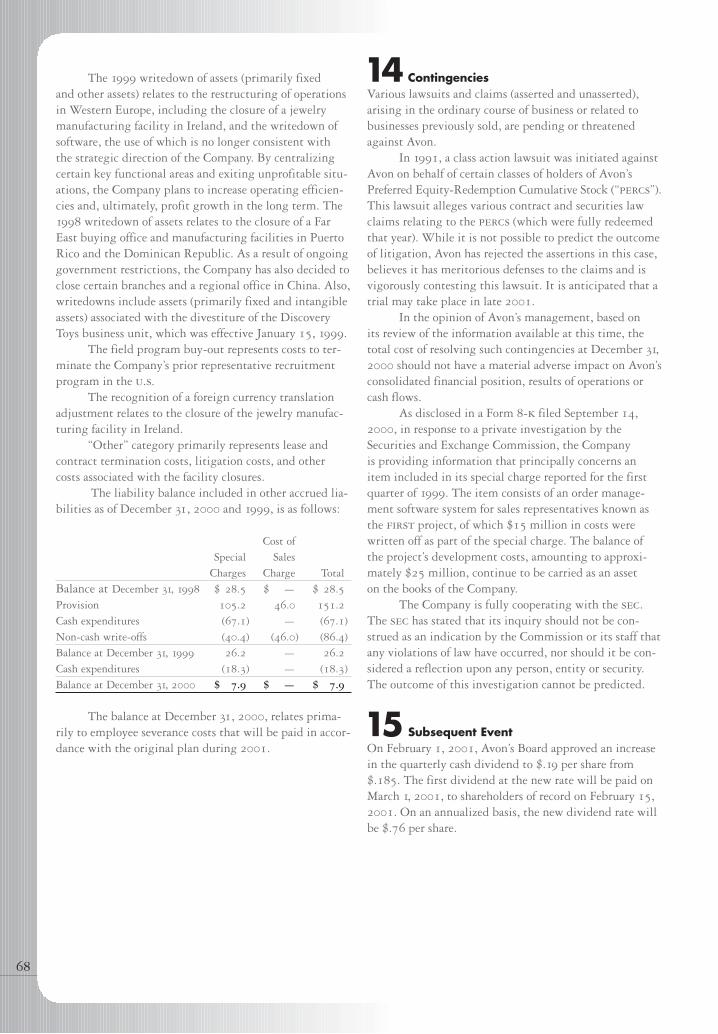
The 1999 writedown of assets (primarily fixed and other assets) relates to the restructuring of operations in Western Europe, including the closure of a jewelrymanufacturing facility in Ireland, and the writedown ofsoftware, the use of which is no longer consistent with the strategic direction of the Company. By centralizingcertain key functional areas and exiting unprofitable situ-ations, the Company plans to increase operating efficien-cies and, ultimately, profit growth in the long term. The1998 writedown of assets relates to the closure of a FarEast buying office and manufacturing facilities in PuertoRico and the Dominican Republic. As a result of ongoinggovernment restrictions, the Company has also decided toclose certain branches and a regional office in China. Also,writedowns include assets (primarily fixed and intangibleassets) associated with the divestiture of the DiscoveryToys business unit, which was effective January 15, 1999.
The field program buy-out represents costs to ter-minate the Company’s prior representative recruitmentprogram in the u.s.
The recognition of a foreign currency translationadjustment relates to the closure of the jewelry manufac-turing facility in Ireland.
“Other” category primarily represents lease andcontract termination costs, litigation costs, and othercosts associated with the facility closures.
The liability balance included in other accrued lia-bilities as of December 31, 2000 and 1999, is as follows:
Cost ofSpecial Sales
Charges Charge TotalBalance at December 31, 1998 $ 28.5 $ — $ 28.5
Provision 105.2 46.0 151.2
Cash expenditures (67.1) — (67.1)
Non-cash write-offs (40.4) (46.0) (86.4)
Balance at December 31, 1999 26.2 — 26.2
Cash expenditures (18.3) — (18.3)
Balance at December 31, 2000 $ 7.9 $ — $ 7.9
The balance at December 31, 2000, relates prima-rily to employee severance costs that will be paid in accor-dance with the original plan during 2001.
14 ContingenciesVarious lawsuits and claims (asserted and unasserted),arising in the ordinary course of business or related tobusinesses previously sold, are pending or threatenedagainst Avon.
In 1991, a class action lawsuit was initiated againstAvon on behalf of certain classes of holders of Avon’sPreferred Equity-Redemption Cumulative Stock (“percs”).This lawsuit alleges various contract and securities lawclaims relating to the percs (which were fully redeemedthat year). While it is not possible to predict the outcomeof litigation, Avon has rejected the assertions in this case,believes it has meritorious defenses to the claims and isvigorously contesting this lawsuit. It is anticipated that atrial may take place in late 2001.
In the opinion of Avon’s management, based on its review of the information available at this time, thetotal cost of resolving such contingencies at December 31,2000 should not have a material adverse impact on Avon’sconsolidated financial position, results of operations orcash flows.
As disclosed in a Form 8-k filed September 14,2000, in response to a private investigation by theSecurities and Exchange Commission, the Company is providing information that principally concerns anitem included in its special charge reported for the firstquarter of 1999. The item consists of an order manage-ment software system for sales representatives known asthe first project, of which $15 million in costs werewritten off as part of the special charge. The balance ofthe project’s development costs, amounting to approxi-mately $25 million, continue to be carried as an asset on the books of the Company.
The Company is fully cooperating with the sec.The sec has stated that its inquiry should not be con-strued as an indication by the Commission or its staff thatany violations of law have occurred, nor should it be con-sidered a reflection upon any person, entity or security.The outcome of this investigation cannot be predicted.
15 Subsequent EventOn February 1, 2001, Avon’s Board approved an increasein the quarterly cash dividend to $.19 per share from$.185. The first dividend at the new rate will be paid onMarch 1, 2001, to shareholders of record on February 15,2001. On an annualized basis, the new dividend rate willbe $.76 per share.
68
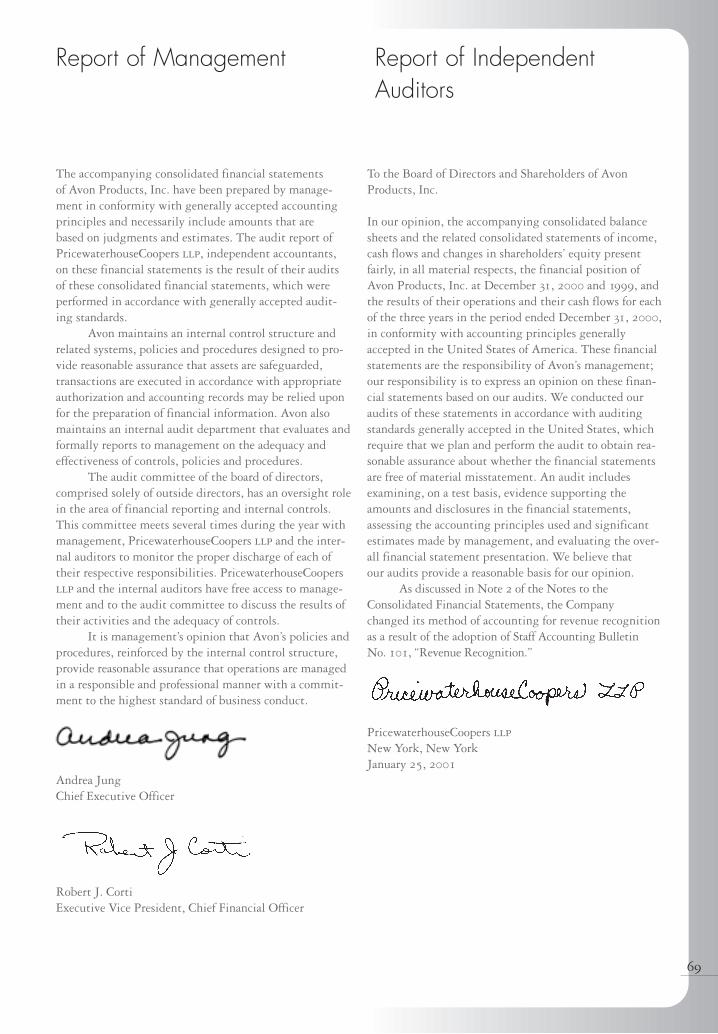
69
The accompanying consolidated financial statements of Avon Products, Inc. have been prepared by manage-ment in conformity with generally accepted accountingprinciples and necessarily include amounts that are based on judgments and estimates. The audit report ofPricewaterhouseCoopers llp, independent accountants,on these financial statements is the result of their auditsof these consolidated financial statements, which wereperformed in accordance with generally accepted audit-ing standards.
Avon maintains an internal control structure andrelated systems, policies and procedures designed to pro-vide reasonable assurance that assets are safeguarded,transactions are executed in accordance with appropriateauthorization and accounting records may be relied uponfor the preparation of financial information. Avon alsomaintains an internal audit department that evaluates andformally reports to management on the adequacy andeffectiveness of controls, policies and procedures.
The audit committee of the board of directors,comprised solely of outside directors, has an oversight rolein the area of financial reporting and internal controls.This committee meets several times during the year withmanagement, PricewaterhouseCoopers llp and the inter-nal auditors to monitor the proper discharge of each oftheir respective responsibilities. PricewaterhouseCoopersllp and the internal auditors have free access to manage-ment and to the audit committee to discuss the results oftheir activities and the adequacy of controls.
It is management’s opinion that Avon’s policies andprocedures, reinforced by the internal control structure,provide reasonable assurance that operations are managedin a responsible and professional manner with a commit-ment to the highest standard of business conduct.
Andrea Jung Chief Executive Officer
Robert J. CortiExecutive Vice President, Chief Financial Officer
To the Board of Directors and Shareholders of AvonProducts, Inc.
In our opinion, the accompanying consolidated balancesheets and the related consolidated statements of income,cash flows and changes in shareholders’ equity presentfairly, in all material respects, the financial position ofAvon Products, Inc. at December 31, 2000 and 1999, andthe results of their operations and their cash flows for eachof the three years in the period ended December 31, 2000,in conformity with accounting principles generallyaccepted in the United States of America. These financialstatements are the responsibility of Avon’s management;our responsibility is to express an opinion on these finan-cial statements based on our audits. We conducted ouraudits of these statements in accordance with auditingstandards generally accepted in the United States, whichrequire that we plan and perform the audit to obtain rea-sonable assurance about whether the financial statementsare free of material misstatement. An audit includesexamining, on a test basis, evidence supporting theamounts and disclosures in the financial statements,assessing the accounting principles used and significantestimates made by management, and evaluating the over-all financial statement presentation. We believe that our audits provide a reasonable basis for our opinion.
As discussed in Note 2 of the Notes to theConsolidated Financial Statements, the Company changed its method of accounting for revenue recognitionas a result of the adoption of Staff Accounting Bulletin No. 101, “Revenue Recognition.”
PricewaterhouseCoopers llpNew York, New YorkJanuary 25, 2001
Report of Management Report of IndependentAuditors
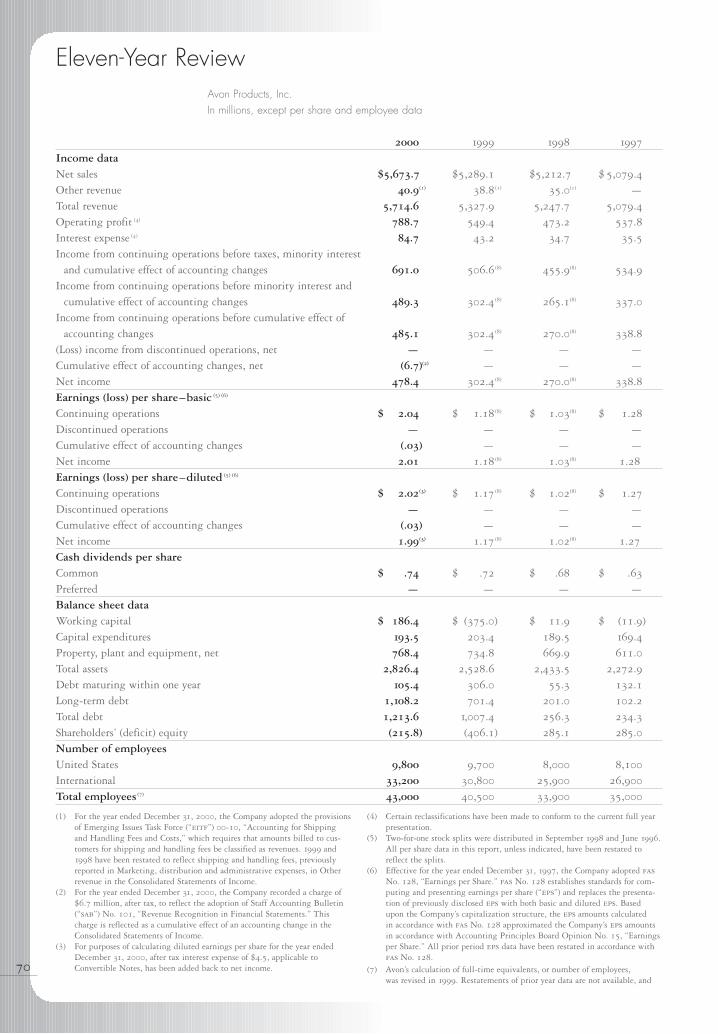
Eleven-Year ReviewAvon Products, Inc.In millions, except per share and employee data
70
(1) For the year ended December 31, 2000, the Company adopted the provisionsof Emerging Issues Task Force (“eitf”) 00-10, “Accounting for Shippingand Handling Fees and Costs,” which requires that amounts billed to cus-tomers for shipping and handling fees be classified as revenues. 1999 and1998 have been restated to reflect shipping and handling fees, previouslyreported in Marketing, distribution and administrative expenses, in Otherrevenue in the Consolidated Statements of Income.
(2) For the year ended December 31, 2000, the Company recorded a charge of$6.7 million, after tax, to reflect the adoption of Staff Accounting Bulletin(“sab”) No. 101, “Revenue Recognition in Financial Statements.” Thischarge is reflected as a cumulative effect of an accounting change in theConsolidated Statements of Income.
(3) For purposes of calculating diluted earnings per share for the year endedDecember 31, 2000, after tax interest expense of $4.5, applicable toConvertible Notes, has been added back to net income.
(4) Certain reclassifications have been made to conform to the current full yearpresentation.
(5) Two-for-one stock splits were distributed in September 1998 and June 1996.All per share data in this report, unless indicated, have been restated toreflect the splits.
(6) Effective for the year ended December 31, 1997, the Company adopted fasNo. 128, “Earnings per Share.” fas No. 128 establishes standards for com-puting and presenting earnings per share (“eps”) and replaces the presenta-tion of previously disclosed eps with both basic and diluted eps. Based upon the Company’s capitalization structure, the eps amounts calculated in accordance with fas No. 128 approximated the Company’s eps amountsin accordance with Accounting Principles Board Opinion No. 15, “Earningsper Share.” All prior period eps data have been restated in accordance withfas No. 128.
(7) Avon’s calculation of full-time equivalents, or number of employees, was revised in 1999. Restatements of prior year data are not available, and
2000 1999 1998 1997
Income dataNet sales $5,673.7 $5,289.1 $5,212.7 $ 5,079.4
Other revenue 40.9(1) 38.8(1) 35.0(1) —
Total revenue 5,714.6 5,327.9 5,247.7 5,079.4
Operating profit (4) 788.7 549.4 473.2 537.8
Interest expense (4) 84.7 43.2 34.7 35.5
Income from continuing operations before taxes, minority interest and cumulative effect of accounting changes 691.0 506.6(8) 455.9(8) 534.9
Income from continuing operations before minority interest andcumulative effect of accounting changes 489.3 302.4(8) 265.1(8) 337.0
Income from continuing operations before cumulative effect of accounting changes 485.1 302.4(8) 270.0(8) 338.8
(Loss) income from discontinued operations, net — — — —
Cumulative effect of accounting changes, net (6.7)(2) — — —
Net income 478.4 302.4(8) 270.0(8) 338.8
Earnings (loss) per share–basic (5) (6)
Continuing operations $ 2.04 $ 1.18(8) $ 1.03(8) $ 1.28
Discontinued operations — — — —
Cumulative effect of accounting changes (.03) — — —
Net income 2.01 1.18(8) 1.03(8) 1.28
Earnings (loss) per share–diluted (5) (6)
Continuing operations $ 2.02(3) $ 1.17(8) $ 1.02(8) $ 1.27
Discontinued operations — — — —
Cumulative effect of accounting changes (.03) — — —
Net income 1.99(3) 1.17(8) 1.02(8) 1.27
Cash dividends per shareCommon $ .74 $ .72 $ .68 $ .63
Preferred — — — —
Balance sheet dataWorking capital $ 186.4 $ (375.0) $ 11.9 $ (11.9)
Capital expenditures 193.5 203.4 189.5 169.4
Property, plant and equipment, net 768.4 734.8 669.9 611.0
Total assets 2,826.4 2,528.6 2,433.5 2,272.9
Debt maturing within one year 105.4 306.0 55.3 132.1
Long-term debt 1,108.2 701.4 201.0 102.2
Total debt 1,213.6 1,007.4 256.3 234.3
Shareholders’ (deficit) equity (215.8) (406.1) 285.1 285.0
Number of employeesUnited States 9,800 9,700 8,000 8,100
International 33,200 30,800 25,900 26,900
Total employees (7) 43,000 40,500 33,900 35,000
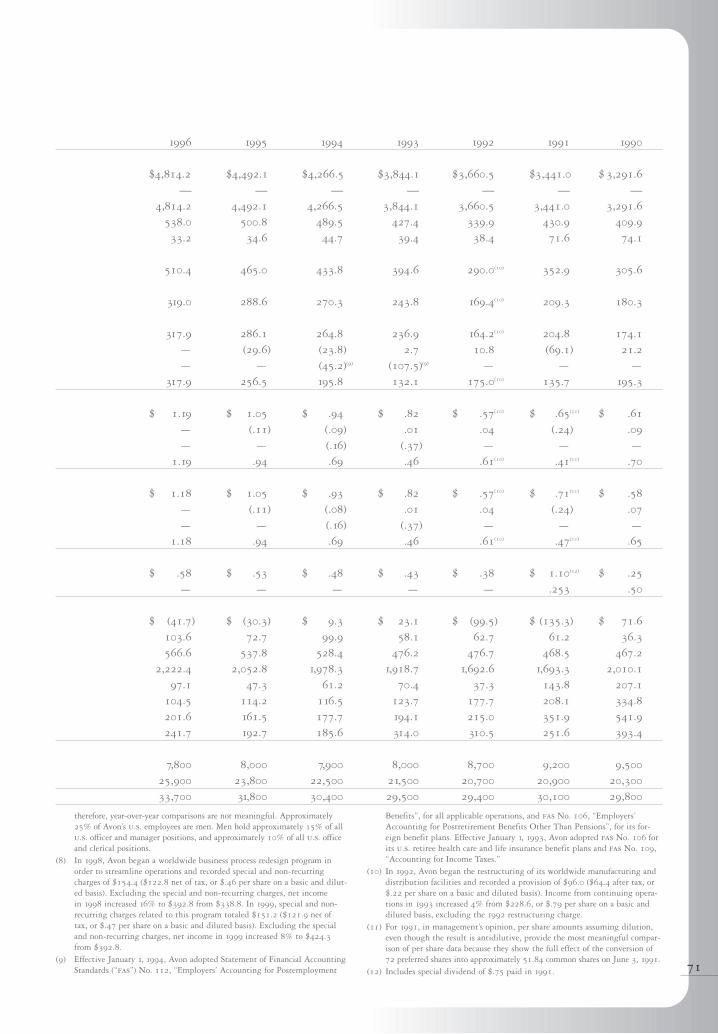
71
therefore, year-over-year comparisons are not meaningful. Approximately25% of Avon’s u.s. employees are men. Men hold approximately 15% of allu.s. officer and manager positions, and approximately 10% of all u.s. officeand clerical positions.
(8) In 1998, Avon began a worldwide business process redesign program inorder to streamline operations and recorded special and non-recurringcharges of $154.4 ($122.8 net of tax, or $.46 per share on a basic and dilut-ed basis). Excluding the special and non-recurring charges, net income in 1998 increased 16% to $392.8 from $338.8. In 1999, special and non-recurring charges related to this program totaled $151.2 ($121.9 net of tax, or $.47 per share on a basic and diluted basis). Excluding the specialand non-recurring charges, net income in 1999 increased 8% to $424.3from $392.8.
(9) Effective January 1, 1994, Avon adopted Statement of Financial AccountingStandards (“fas”) No. 112, “Employers’ Accounting for Postemployment
Benefits”, for all applicable operations, and fas No. 106, “Employers’Accounting for Postretirement Benefits Other Than Pensions”, for its for-eign benefit plans. Effective January 1, 1993, Avon adopted fas No. 106 forits u.s. retiree health care and life insurance benefit plans and fas No. 109,“Accounting for Income Taxes.”
(10) In 1992, Avon began the restructuring of its worldwide manufacturing anddistribution facilities and recorded a provision of $96.0 ($64.4 after tax, or$.22 per share on a basic and diluted basis). Income from continuing opera-tions in 1993 increased 4% from $228.6, or $.79 per share on a basic anddiluted basis, excluding the 1992 restructuring charge.
(11) For 1991, in management’s opinion, per share amounts assuming dilution,even though the result is antidilutive, provide the most meaningful compar-ison of per share data because they show the full effect of the conversion of72 preferred shares into approximately 51.84 common shares on June 3, 1991.
(12) Includes special dividend of $.75 paid in 1991.
1996 1995 1994 1993 1992 1991 1990
$4,814.2 $4,492.1 $4,266.5 $3,844.1 $3,660.5 $3,441.0 $ 3,291.6
— — — — — — —4,814.2 4,492.1 4,266.5 3,844.1 3,660.5 3,441.0 3,291.6
538.0 500.8 489.5 427.4 339.9 430.9 409.9
33.2 34.6 44.7 39.4 38.4 71.6 74.1
510.4 465.0 433.8 394.6 290.0(10) 352.9 305.6
319.0 288.6 270.3 243.8 169.4(10) 209.3 180.3
317.9 286.1 264.8 236.9 164.2(10) 204.8 174.1
— (29.6) (23.8) 2.7 10.8 (69.1) 21.2
— — (45.2)(9) (107.5)(9) — — —
317.9 256.5 195.8 132.1 175.0(10) 135.7 195.3
$ 1.19 $ 1.05 $ .94 $ .82 $ .57(10) $ .65(11) $ .61
— (.11) (.09) .01 .04 (.24) .09
— — (.16) (.37) — — —
1.19 .94 .69 .46 .61(10) .41(11) .70
$ 1.18 $ 1.05 $ .93 $ .82 $ .57(10) $ .71(11) $ .58
— (.11) (.08) .01 .04 (.24) .07
— — (.16) (.37) — — —
1.18 .94 .69 .46 .61(10) .47(11) .65
$ .58 $ .53 $ .48 $ .43 $ .38 $ 1.10(12) $ .25
— — — — — .253 .50
$ (41.7) $ (30.3) $ 9.3 $ 23.1 $ (99.5) $ (135.3) $ 71.6
103.6 72.7 99.9 58.1 62.7 61.2 36.3
566.6 537.8 528.4 476.2 476.7 468.5 467.2
2,222.4 2,052.8 1,978.3 1,918.7 1,692.6 1,693.3 2,010.1
97.1 47.3 61.2 70.4 37.3 143.8 207.1
104.5 114.2 116.5 123.7 177.7 208.1 334.8
201.6 161.5 177.7 194.1 215.0 351.9 541.9
241.7 192.7 185.6 314.0 310.5 251.6 393.4
7,800 8,000 7,900 8,000 8,700 9,200 9,500
25,900 23,800 22,500 21,500 20,700 20,900 20,300
33,700 31,800 30,400 29,500 29,400 30,100 29,800

Andrea Jung*Chief Executive Officer
Susan J. Kropf*†
President andChief Operating Officer
Robert J. Corti*Executive Vice President andChief Financial Officer
Walter Biel†
Senior Vice PresidentLatin America–North
Steve Bock*Senior Vice President andPresident, Retail
Brian C. Connolly†
Senior Vice President and President, Avon U.S.
Pablo Daly†
Senior Vice President Latin America–South
Harriet Edelman*Senior Vice President and Chief Information Officer
Joseph A. Faranda*Group Vice PresidentStrategy and New BusinessDevelopment
Bennett R. Gallina*†
Senior Vice PresidentGlobal Business Support
Dennis LingGroup Vice President, Finance and Treasurer
Jill Kanin-Lovers*Senior Vice PresidentHuman Resources
Gilbert L. Klemann II*Senior Vice President andGeneral Counsel
Fernando Lezama†
Executive Vice PresidentAsia-Pacific
Brian T. Martin*Senior Vice PresidentCorporate Communications
John F. Owen†
Group Vice PresidentFinance
Robert Toth†
Senior Vice President Europe, Middle East and Africa
* Executive Council† Operating Council
S E N I O R M A N A G E M E N T
72
Independent AccountantsPricewaterhouseCoopers L.L.P.1301 Avenue of the AmericasNew York, NY 10019-6013
Transfer Agent and RegistrarEquiServeP.O. Box 2500Jersey City, NJ 07303-2500(201) 324-0498
Form 10-KAny shareholder may obtain a copyof the company’s 2000 annual report(Form 10-K) by writing to:Shareholder RelationsAvon Products, Inc1345 Avenue of the AmericasNew York, NY 10105-0196
For the latest earnings and dividend information, please call 1-888-AVP-FACT
Institutional InvestorsPlease call Carol Murray-Negron,Vice President, Investor Relations at(212) 282-5320
Individual ShareholderServicesPlease call Marilyn Reynolds,Manager, Shareholder Relations at(212) 282-5619
World Headquarters1345 Avenue of the AmericasNew York, NY 10105-0196(212) 282-5000
For information about becoming an Avon Representative or purchas-ing Avon products, please call 1-800-FOR-AVON. Visit Avon on theWorldwide Web at www.avon.com
C O R P O R A T E I N F O R M A T I O N

F I N A N C I A L H I G H L I G H T SIn millions, except per share data
Years ended December 31 2000 1999 % Change
Net Sales $5,673.7 $5,289.1 7%
Net Income $ 478.4 $ 302.4 58%
Basic earnings per share:
Continuing operations $ 2.04 $ 1.18 73%
Cumulative effect of accounting change $ (.03) —
$ 2.01 $ 1.18 70%
Diluted earnings per share:
Continuing operations $ 2.02 $ 1.17 73%
Cumulative effect of accounting change $ (.03) $ —
$ 1.99 $ 1.17 70%
2000 net income includes a tax benefit of $40.1, or $.16 per diluted share, related
to a federal income tax refund. 1999 net income includes $121.9, or $.47 per share,
in one-time charges.
F I N A N C I A L A C H I E V E M E N T S
Net Sales$ In billions
1
2
3
4
5
6
96 97 98 99 00
Earnings Per Diluted Share from Continuing OperationsIn dollars
0.50
1.00
1.50
2.00
2.50
96 97 98 99 00*includes VAT benefit of $0.06†excludes special charges of ($0.46)‡excludes special charges of ($0.47)§includes income tax benefit of $0.16
†* ‡ §
100
200
300
400
500
96 97 98 99 00
Cash Flow fromContinuing Operations$ In millions
10
20
30
40
50
96 97 98 99 00
Year End Closing Stock PriceIn dollarsRestated for two-for-onestock splits in 1998 and 1996
B O A R D O F D I R E C T O R S
1 Andrea JungChief Executive Officer
2 Brenda C. BarnesFormer President and ChiefExecutive Officer, Pepsi-ColaNorth America, Pepsi-Cola Co.
3 Edward T. FogartyFormer Chairman, President and Chief Executive Officer,Tambrands, Inc.
4 Stanley C. GaultNon-Executive Chairman, Former Chairman and Chief Executive Officer, TheGoodyear Tire and Rubber Co.
5 Fred Hassan*President and Chief ExecutiveOfficer, Pharmacia Corporation
6 Susan KropfPresident and Chief Operating Officer
7 Maria Elena Lagomasino*Managing Director,Chase Manhattan Bank
8 Ann S. MoorePresident, People MagazineGroup, Time, Inc.
9 Paula Stern, Ph.D.*President, The Stern Group
10 Lawrence A. Weinbach*Chairman, President and Chief Executive Officer,Unisys Corporation
*Audit Committee Member
This report is printed on recycled paper.
Design: BrandLogic Group, Ridgefield, CT
Principal photography:Jeffrey Apoian, New York, NY
Williams sisters photography:George Holz, New York, NY
Printing:Avanti/Case-Hoyt, Rochester, NY
1 2
3
4
5
6
7
8
9
10
In this year’s report
1 Message to Shareholders
6 Reaching women…
8 A bold new image
12 Over 3,400,000
Representatives
16 An online marketplace
20 Retail innovation
24 Unprecedented
commitment
28 Review of Operations
32 Financial Section
72 Senior Management
Corporate Information
Board of Directors
Related Documents