Annual Meeting Budget Hearing 2008-2009

Annual Meeting Budget Hearing 2008-2009. Budget Process Overview Revenue Limit Calculation and Estimation of Other Revenues December Revenue Limit Calculation.
Jan 05, 2016
Welcome message from author
This document is posted to help you gain knowledge. Please leave a comment to let me know what you think about it! Share it to your friends and learn new things together.
Transcript
Annual MeetingBudget Hearing
2008-2009
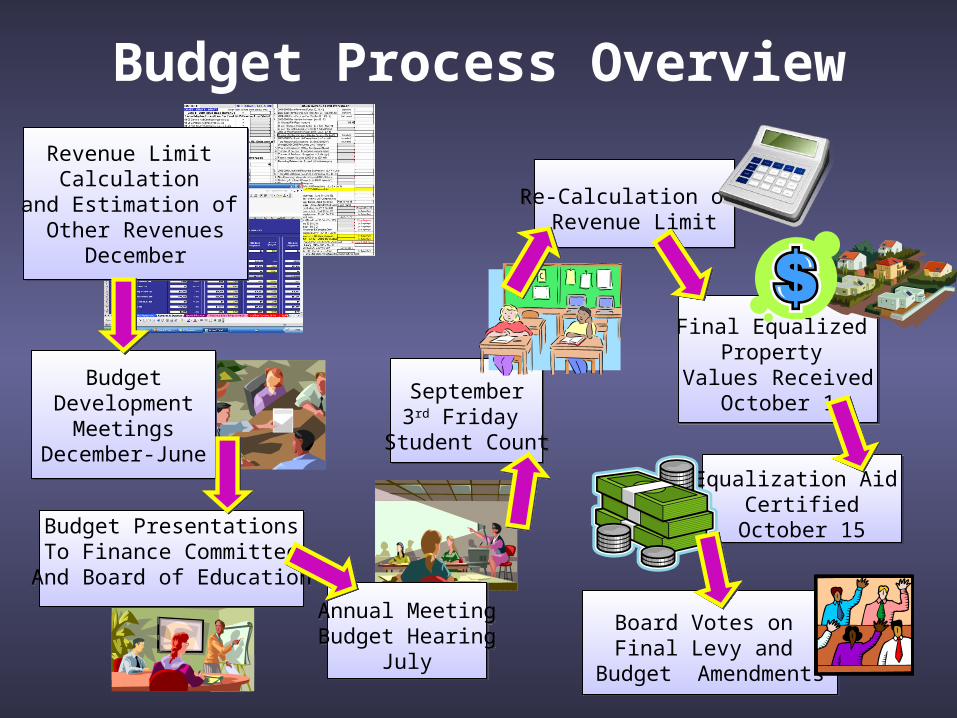
Budget Process Overview
Revenue Limit Calculation
and Estimation of Other Revenues
December
Revenue Limit Calculation
and Estimation of Other Revenues
December
BudgetDevelopment
MeetingsDecember-June
BudgetDevelopment
MeetingsDecember-June
Budget PresentationsTo Finance CommitteeAnd Board of Education
Budget PresentationsTo Finance CommitteeAnd Board of Education
Annual MeetingBudget Hearing
July
Annual MeetingBudget Hearing
July
September3rd Friday
Student Count
September3rd Friday
Student Count
Final Equalized Property
Values ReceivedOctober 1
Final Equalized Property
Values ReceivedOctober 1
Equalization Aid Certified
October 15
Equalization Aid Certified
October 15
Re-Calculation of Revenue Limit
Re-Calculation of Revenue Limit
Board Votes on Final Levy and
Budget Amendments
Board Votes on Final Levy and
Budget Amendments
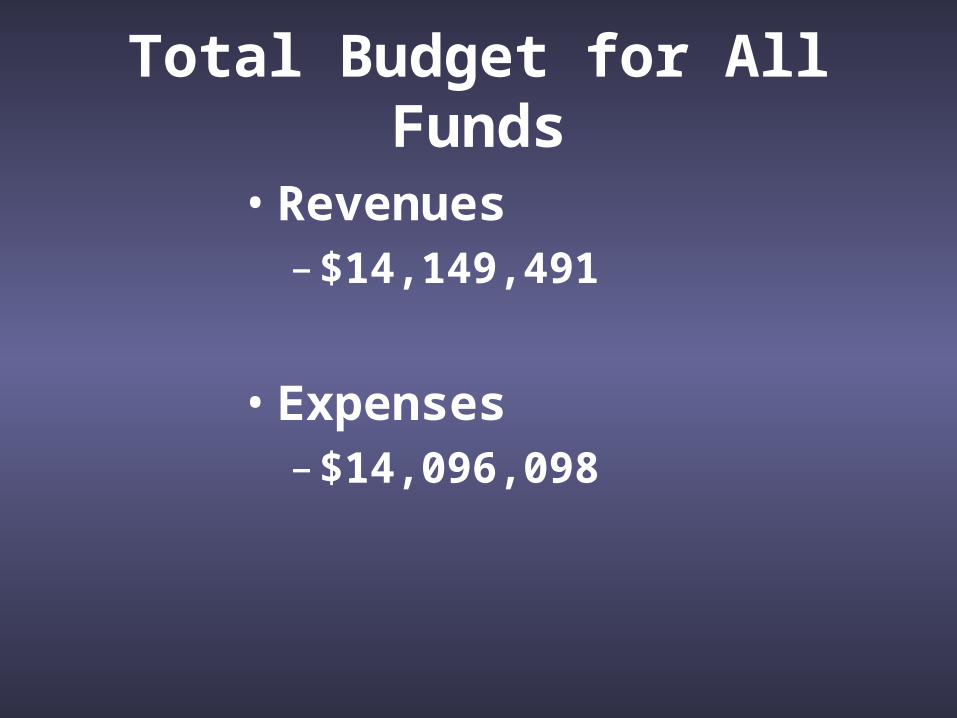
Total Budget for All Funds
• Revenues– $14,149,491
• Expenses– $14,096,098
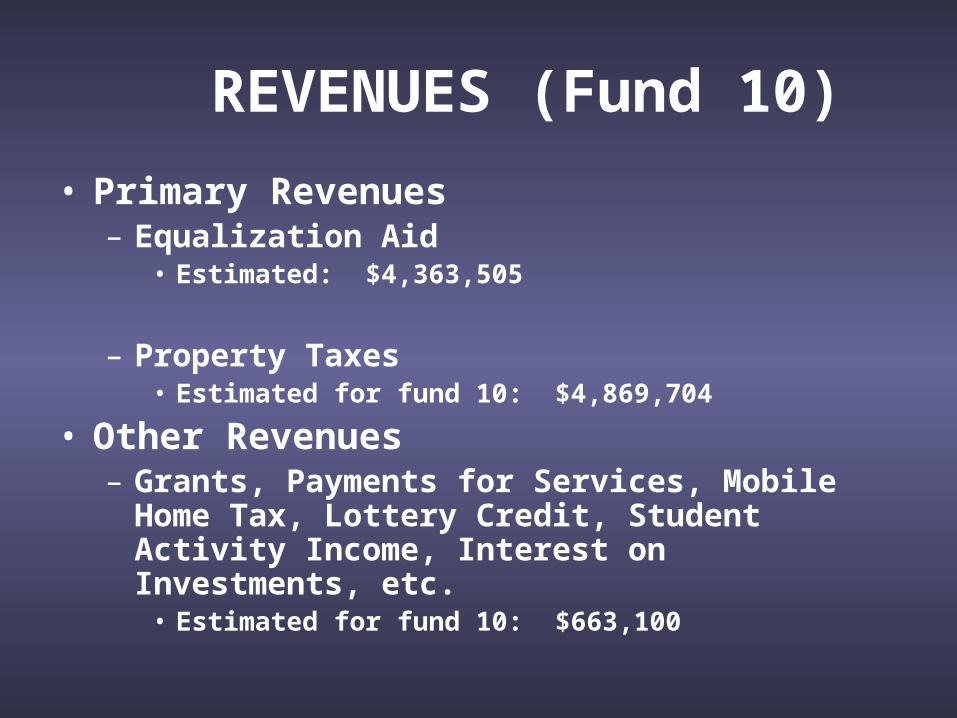
REVENUES (Fund 10)
• Primary Revenues– Equalization Aid
• Estimated: $4,363,505
– Property Taxes• Estimated for fund 10: $4,869,704
• Other Revenues– Grants, Payments for Services, Mobile Home Tax,
Lottery Credit, Student Activity Income, Interest on Investments, etc.
• Estimated for fund 10: $663,100
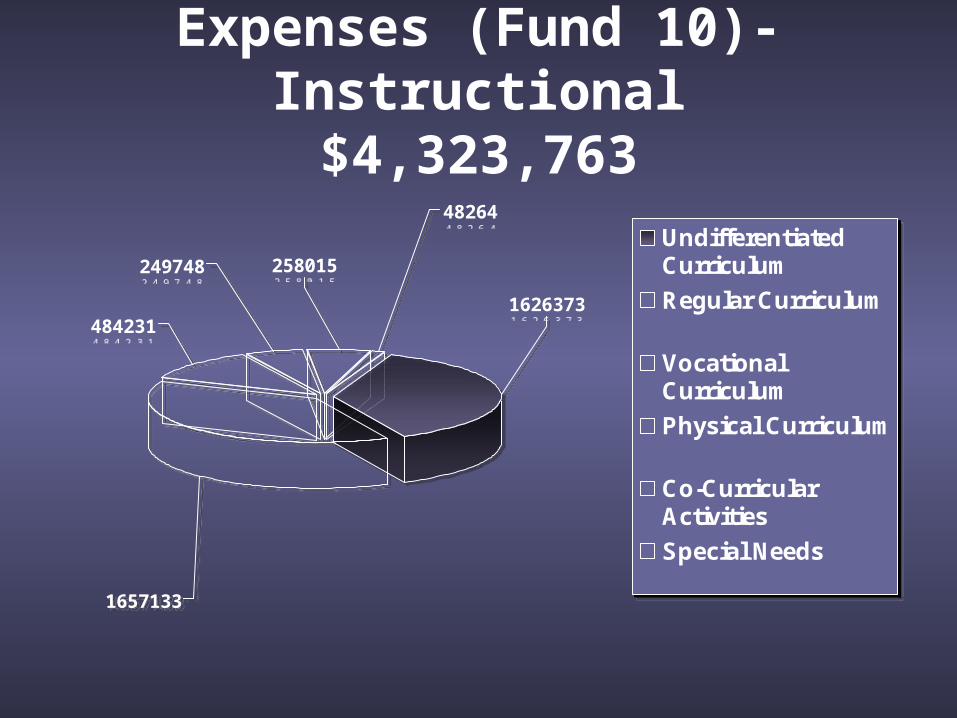
Expenses (Fund 10)-Instructional$4,323,763
1657133
1626373
48264
258015249748
484231
UndifferentiatedCurriculum
Regular Curriculum
VocationalCurriculum
Physical Curriculum
Co-CurricularActivities
Special Needs
1657133
1626373
48264
258015249748
484231
UndifferentiatedCurriculum
Regular Curriculum
VocationalCurriculum
Physical Curriculum
Co-CurricularActivities
Special Needs
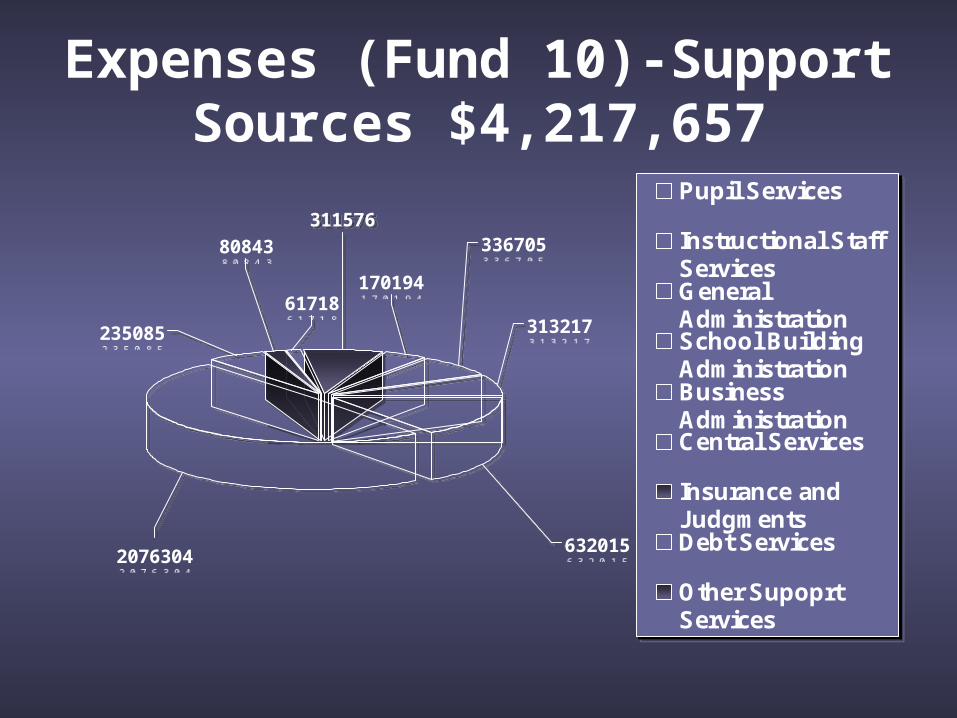
Expenses (Fund 10)-Support Sources $4,217,657
311576
61718
80843 336705
170194
235085
2076304632015
313217
Pupil Services
Instructional StaffServicesGeneralAdministrationSchool BuildingAdministrationBusinessAdministrationCentral Services
Insurance andJudgmentsDebt Services
Other SupoprtServices
311576
61718
80843 336705
170194
235085
2076304632015
313217
Pupil Services
Instructional StaffServicesGeneralAdministrationSchool BuildingAdministrationBusinessAdministrationCentral Services
Insurance andJudgmentsDebt Services
Other SupoprtServices
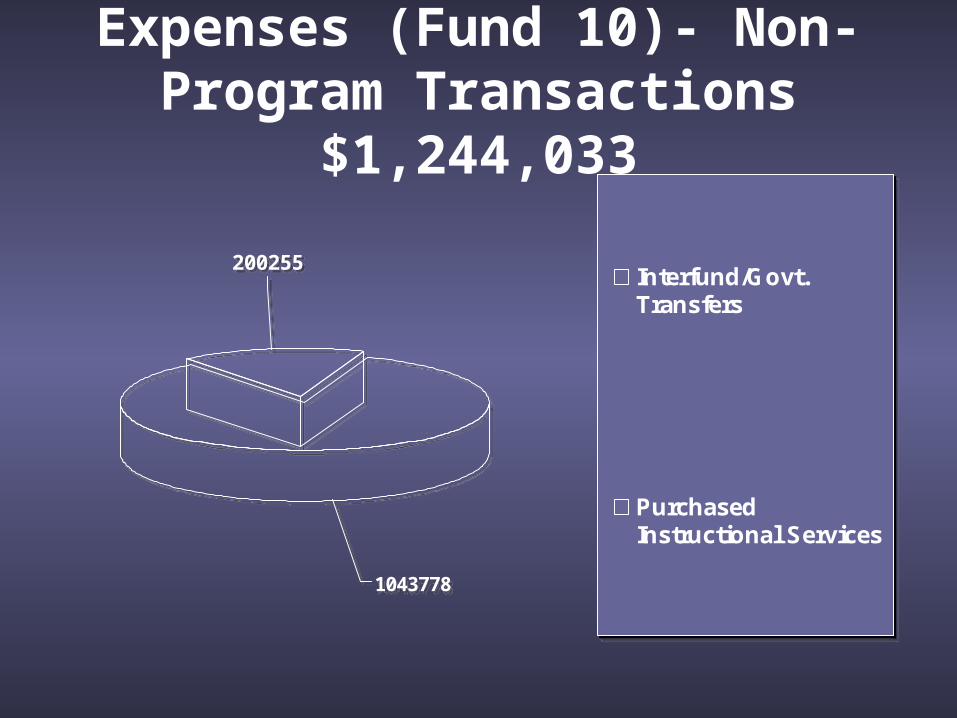
Expenses (Fund 10)- Non-Program Transactions $1,244,033
200255
1043778
Interfund/Govt.Transfers
PurchasedInstructional Services
200255
1043778
Interfund/Govt.Transfers
PurchasedInstructional Services
Special Projects (21, 23, 27, 29)$1,725,978
• Primarily Special Education
• Instruction $1,218,004
• Support Services $ 463,645
• Non-Program Transactions $ 44,329
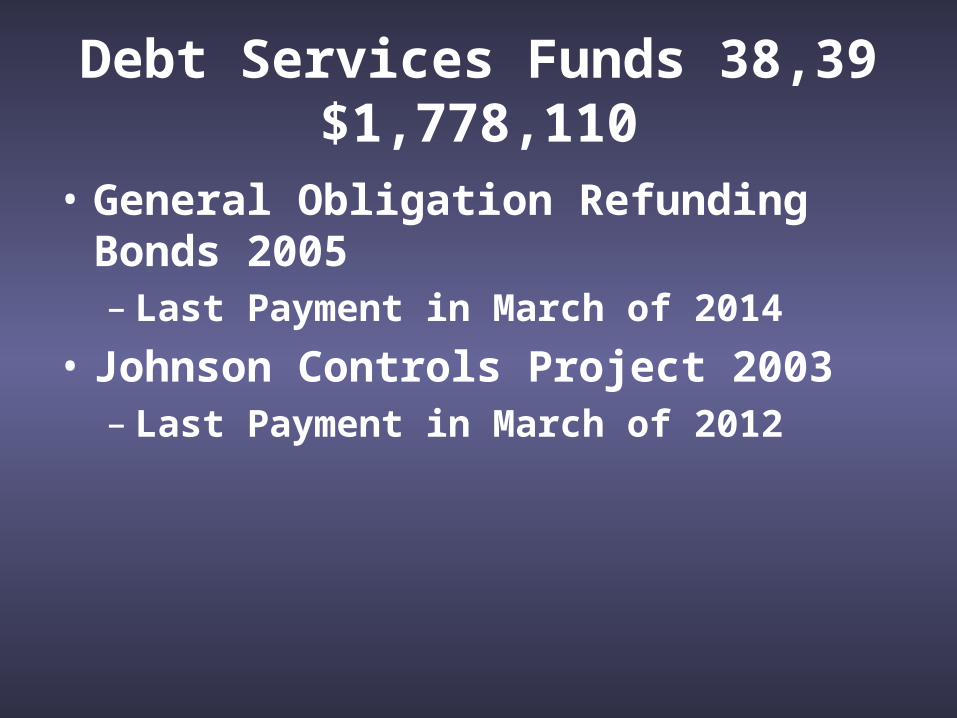
Debt Services Funds 38,39$1,778,110
• General Obligation Refunding Bonds 2005– Last Payment in March of 2014
• Johnson Controls Project 2003– Last Payment in March of 2012
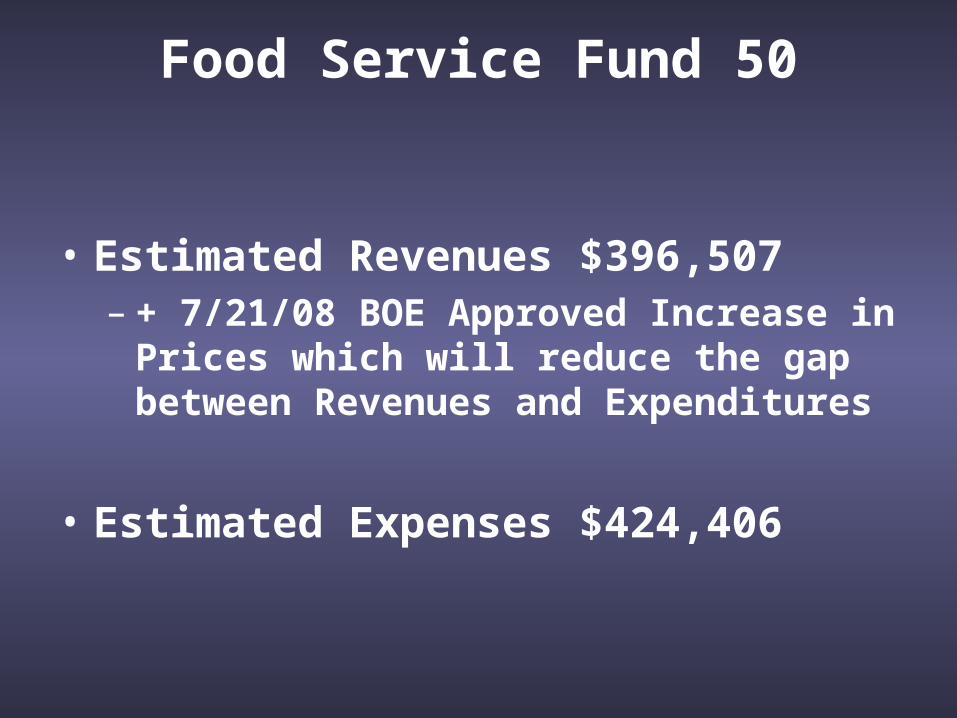
Food Service Fund 50
• Estimated Revenues $396,507– + 7/21/08 BOE Approved Increase in Prices
which will reduce the gap between Revenues and Expenditures
• Estimated Expenses $424,406
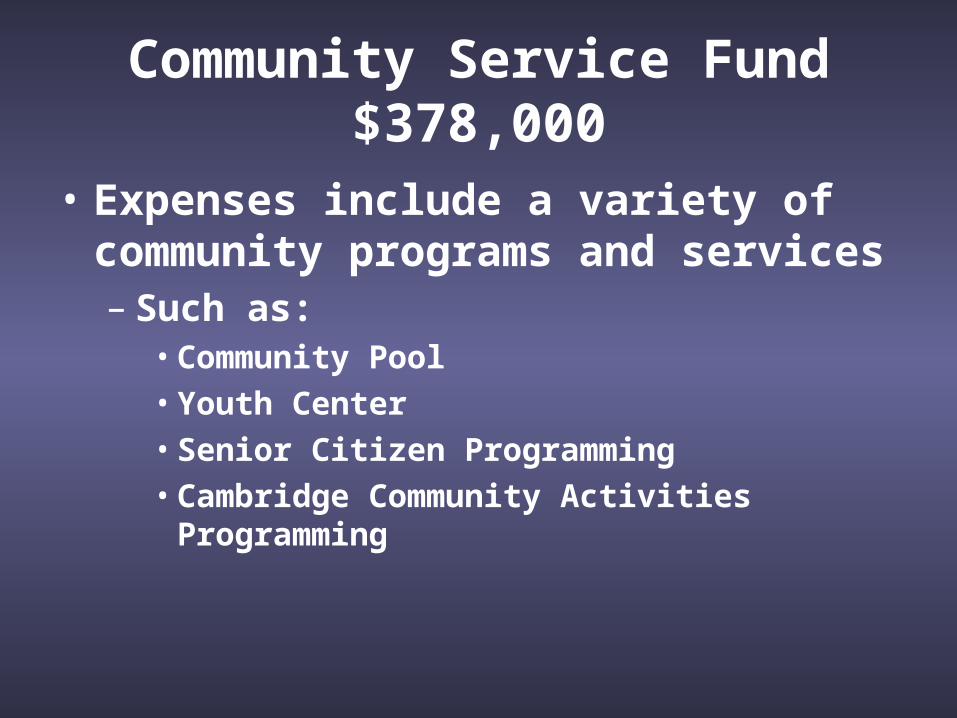
Community Service Fund$378,000
• Expenses include a variety of community programs and services– Such as:
• Community Pool• Youth Center• Senior Citizen Programming• Cambridge Community Activities Programming
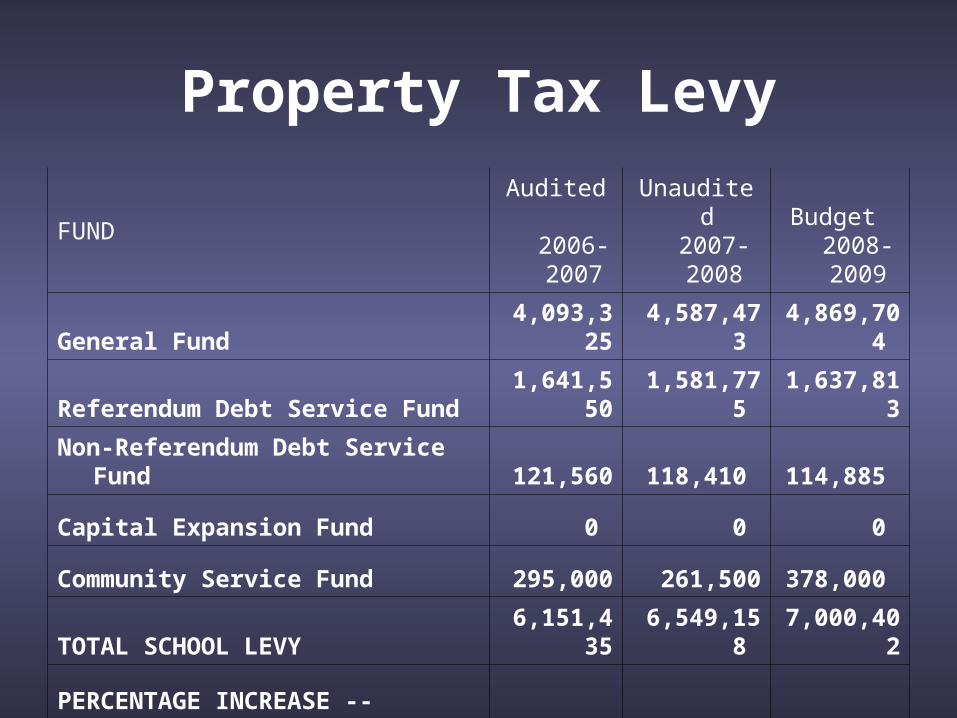
Property Tax Levy
FUNDAudited
2006-2007
Unaudited 2007-2008
Budget 2008-2009
General Fund 4,093,325 4,587,473 4,869,704
Referendum Debt Service Fund 1,641,550 1,581,775 1,637,813
Non-Referendum Debt Service Fund 121,560 118,410 114,885
Capital Expansion Fund 0 0 0
Community Service Fund 295,000 261,500 378,000
TOTAL SCHOOL LEVY 6,151,435 6,549,158 7,000,402
PERCENTAGE INCREASE -- TOTAL LEVY FROM PRIOR YEAR 8.77% 6.47% 6.89%
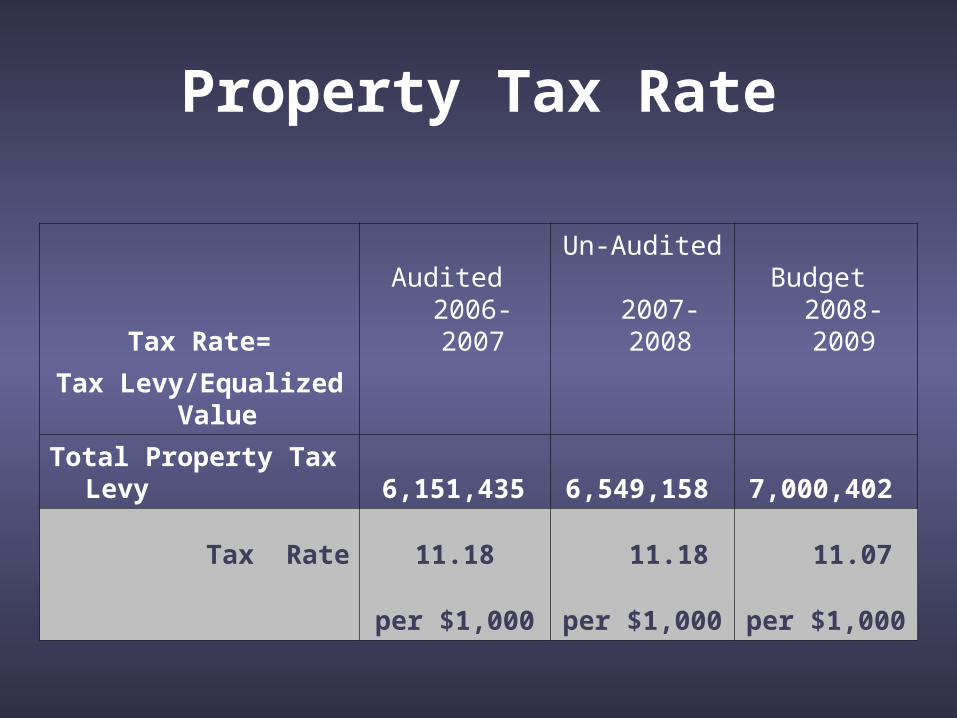
Property Tax Rate
Tax Rate=Audited 2006-2007
Un-Audited 2007-2008
Budget 2008-2009
Tax Levy/Equalized Value
Total Property Tax Levy 6,151,435 6,549,158 7,000,402
Tax Rate 11.18 11.18 11.07
per $1,000 per $1,000 per $1,000
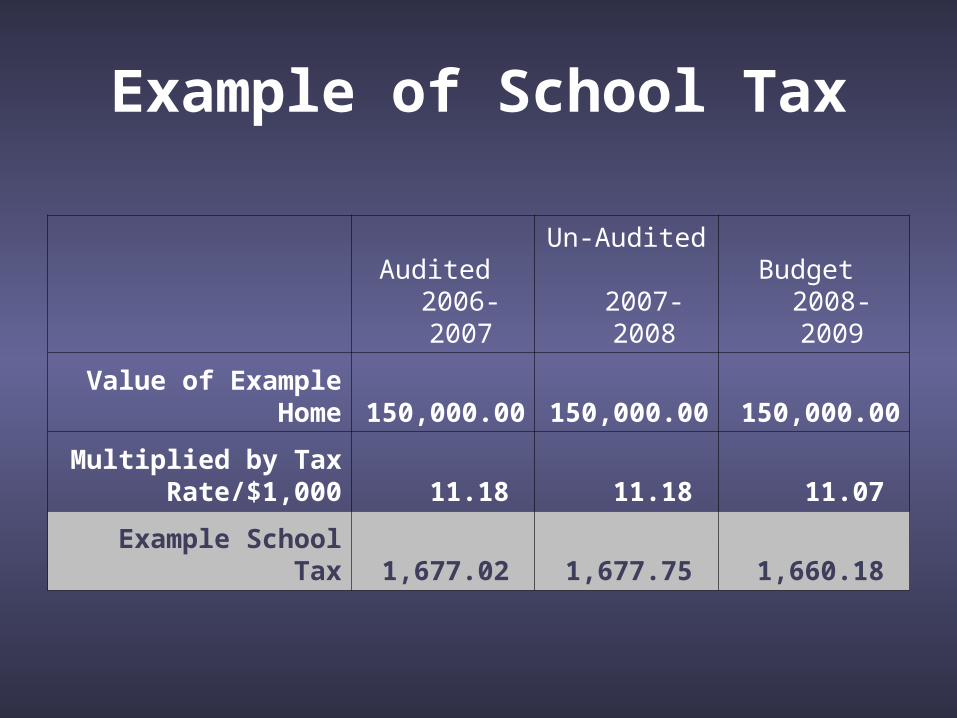
Example of School Tax
Audited 2006-2007
Un-Audited 2007-2008
Budget 2008-2009
Value of Example Home 150,000.00 150,000.00 150,000.00
Multiplied by Tax Rate/$1,000 11.18 11.18 11.07
Example School Tax 1,677.02 1,677.75 1,660.18
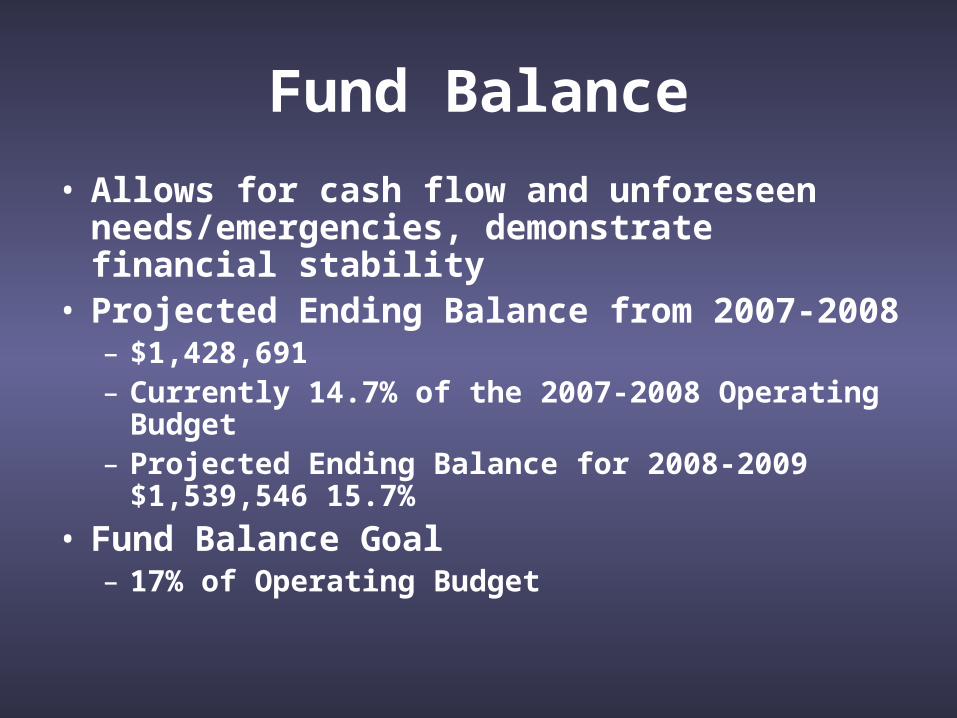
Fund Balance
• Allows for cash flow and unforeseen needs/emergencies, demonstrate financial stability
• Projected Ending Balance from 2007-2008– $1,428,691– Currently 14.7% of the 2007-2008 Operating
Budget– Projected Ending Balance for 2008-2009
$1,539,546 15.7%
• Fund Balance Goal– 17% of Operating Budget
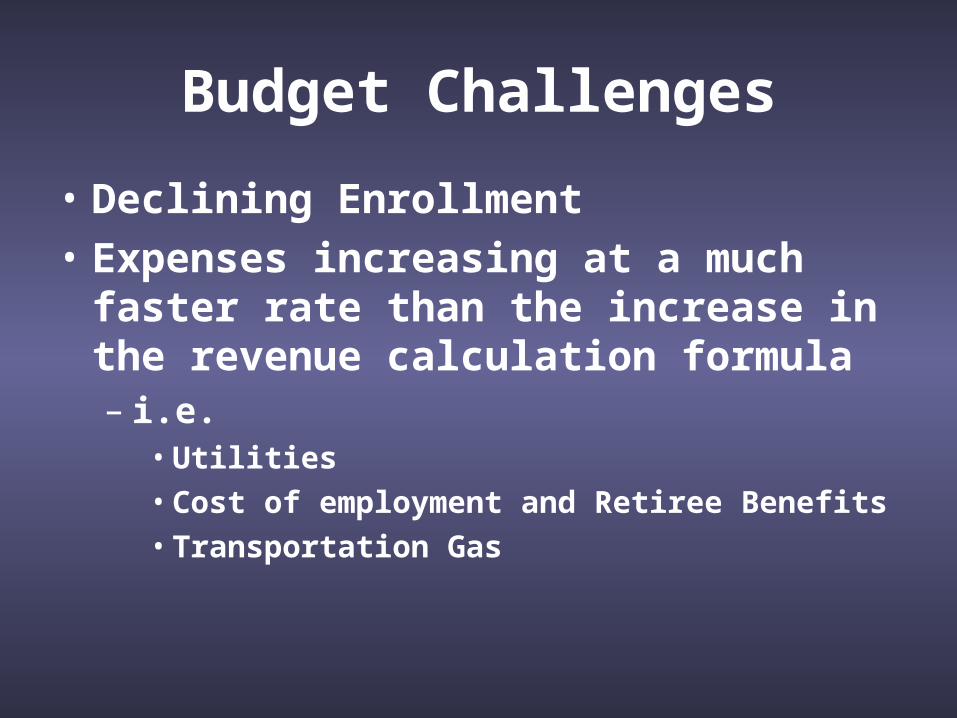
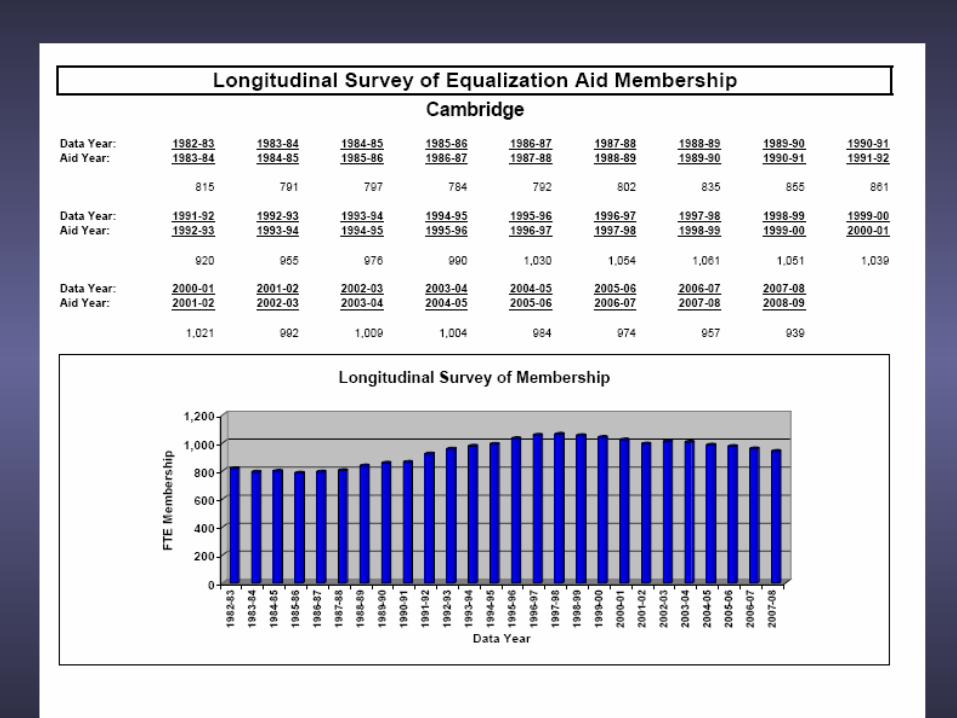
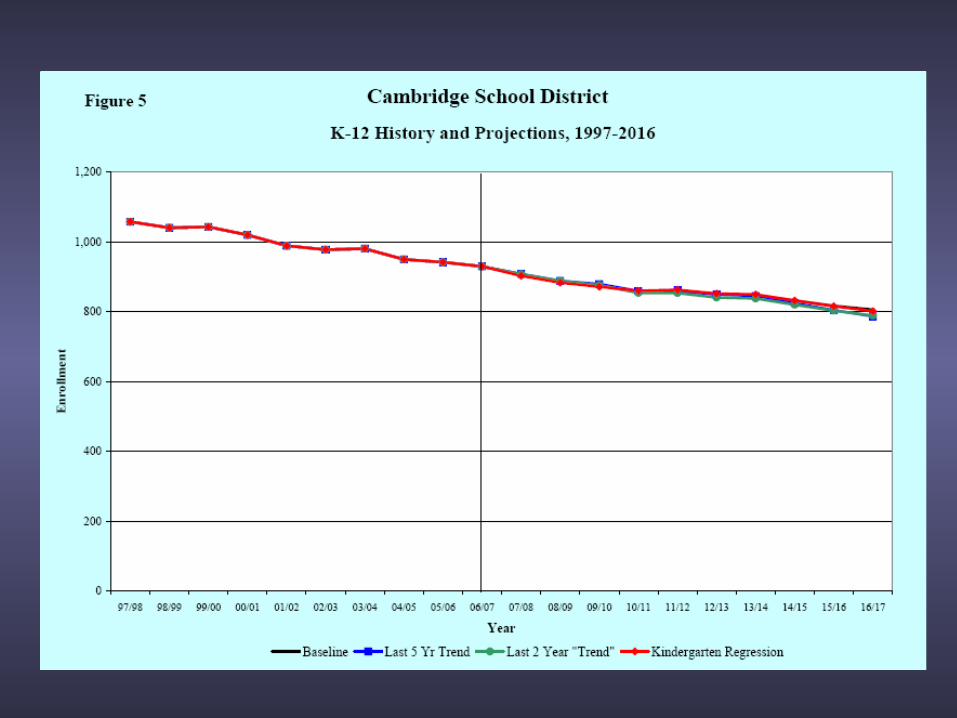
Budget Challenges
• Declining Enrollment
• Expenses increasing at a much faster rate than the increase in the revenue calculation formula– i.e.
• Utilities• Cost of employment and Retiree Benefits• Transportation Gas
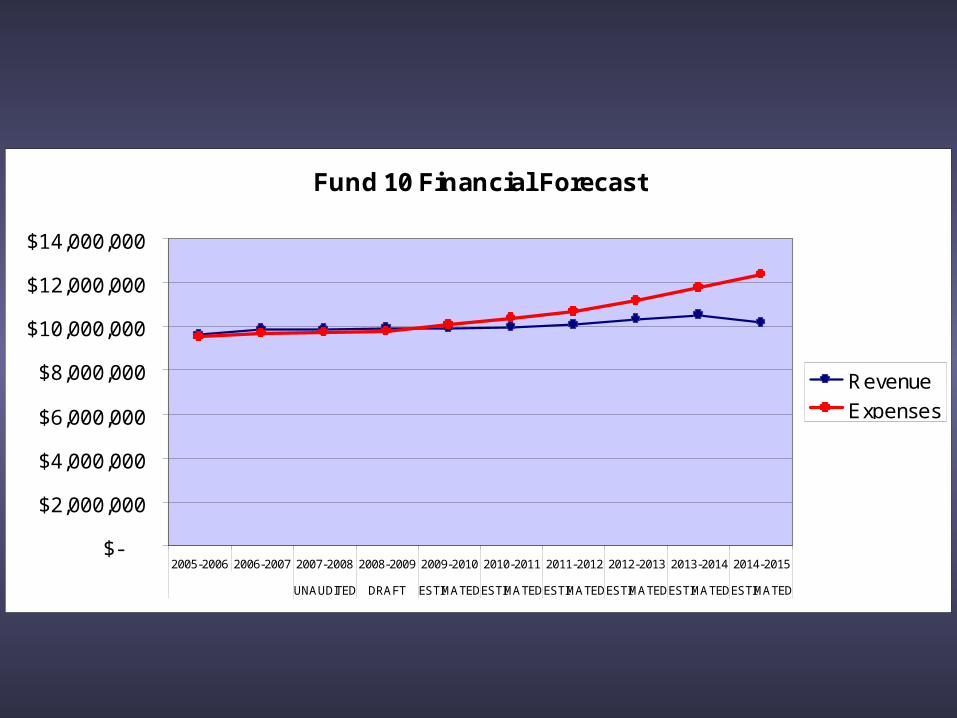
Fund 10 Financial Forecast
$-
$2,000,000
$4,000,000
$6,000,000
$8,000,000
$10,000,000
$12,000,000
$14,000,000
2005-2006 2006-2007 2007-2008 2008-2009 2009-2010 2010-2011 2011-2012 2012-2013 2013-2014 2014-2015
UNAUDITED DRAFT ESTIMATEDESTIMATEDESTIMATEDESTIMATEDESTIMATEDESTIMATED
Revenue
Expenses
Related Documents


