U.S. Department of Commerce Economics and Statistics Administration U.S. CENSUS BUREAU Annual Capital Expenditures: 2003 Issued May 2005 ACE/03 You Make Informed Decisions Helping USCENSUSBUREAU

Welcome message from author
This document is posted to help you gain knowledge. Please leave a comment to let me know what you think about it! Share it to your friends and learn new things together.
Transcript

U.S. Department of CommerceEconomics and Statistics Administration
U.S. CENSUS BUREAU
Annual Capital Expenditures: 2003 Issued May 2005
ACE/03
You Make Informed DecisionsHelping
U S C E N S U S B U R E A U

The Company Statistics Division preparedthis report. Ruth A. Runyan, AssistantDivision Chief for Surveys and Programs,was responsible for the overall planning,management, and coordination. Planningand implementation were under the direc-tion of Charles A. Funk, Chief, BusinessInvestment Branch, assisted by SaraPrebble, Jacqueline Eanes, DerrickRoy, and Victor Souphom, SectionChiefs. Primary staff assistance was pro-vided by Ayub Abdallah, WilliamAbriatis, Susan Andrichuk, GeorgeChancellor, Tina Choe, Beth Evans,Jamie Faulkner, William Gainor, VenitaHolland, Demetrius Lambeth, AnthonyMatacale, Holly Merwin, Sean Morse,Conrad Munger, Omar Nix, SherritaPowell, Monica Sovero, and JamesThomas. Additional assistance was pro-vided by Marie Rustin and JeremyWiedemann.
General direction for statistical methodol-ogy was provided by Carol Caldwell,Assistant Division Chief for Research andMethodology, and Mark Sands, Chief, Sta-tistical Research and Methods Branch.Amy Newman-Smith, Ana Rodriguez,Tameka Johnson, Justin Smith, andMatthew Falkenstein developed andimplemented the sample design, nonre-sponse adjustment and estimation meth-odology.
The Economic Planning and CoordinationDivision, William Samples, Chief, Mailoutand Data Collection Branch, coordinatedsurvey mailout and data collection withSection Chiefs Betty McKay and ChrisBerbert. Primary assistance was providedby Bernadette Gray and DamekaHemsley.
The staff of the National Processing Center,Mark Grice, Assistant Division Chief forProcessing, performed mailout preparationand receipt operations, clerical and analyti-cal review activities, and data entry.
The Economic Statistical Methods and Pro-gramming Division, Edward Bates Jr.,Chief, Current Manufacturing and Com-pany Statistics Annuals Branch, developedand implemented computer processingsystems. Nestor Baez Jr., SupervisoryComputer Specialist Systems Analyst,supervised the preparation of computerprograms. Stephen Potemkin wasresponsible for frame creation and sampleselection. Tony Duong, ZbigniewGorski, Barbara Harris, KavitaKhaneja, and Diane Musachio wereassigned primary programming responsi-bilities.
Wanda Cevis, Margaret A. Smith,Heather M. Lilley, and Catherine M.Raymond of the Administrative and Cus-tomer Services Division, Walter C. Odom,Chief, provided publications and printingmanagement, graphics design and compo-sition, and editorial review for print andelectronic media. General direction andproduction management were provided byJames R. Clark, Assistant Division Chief,and Susan L. Rappa, Chief, PublicationsServices Branch.
Finally, a special acknowledgment is dueto the many businesses whose coopera-tion was essential to the success of thisreport.
If you have any questions concerning thestatistics in this report, call 301-763-3324.
ACKNOWLEDGMENTS

Annual Capital Expenditures: 2003
U.S. Department of CommerceCarlos M. Gutierrez,
Secretary
David A. Sampson,Acting Deputy Secretary
Economics and Statistics AdministrationKathleen B. Cooper,
Under Secretaryfor Economic Affairs
U.S. CENSUS BUREAUCharles Louis Kincannon,
Director
Issued May 2005
ACE/03

Thomas L. Mesenbourg,Acting Associate Directorfor Economic Programs
Thomas L. Mesenbourg,Assistant Directorfor Economic Programs
Ewen M. Wilson,Chief, Company StatisticsDivision
ECONOMICS
AND STATISTICS
ADMINISTRATION
Economicsand StatisticsAdministration
Kathleen B. Cooper,Under Secretaryfor Economic Affairs
U.S. CENSUS BUREAU
Charles Louis Kincannon,Director
Hermann Habermann,Deputy Director andChief Operating Officer

Introduction . . . . . . . . . . . . . . . . . . . . . . . . . . . . . . . . . . . v
Figures
1. Capital Expenditures by Business Sectors for Companies WithEmployees: 2003. . . . . . . . . . . . . . . . . . . . . . . . . . . . vi
2. Capital Expenditures for Structures and Equipment by CompaniesWith and Without Employees: 2003 . . . . . . . . . . . . . . . . . . xi
3. Capital Expenditures for Structures and Equipment for CompaniesWith Employees: 2003 and 2002 Revised . . . . . . . . . . . . . . xi
4. Capital Expenditures Distribution for New and Used Structures andEquipment for Companies With Employees: 2003 . . . . . . . . . . xii
5. Capital Expenditures Distribution for New and Used Structures andEquipment for Companies Without Employees: 2003 . . . . . . . . xii
6. Capital Expenditures for Structures and Equipment by SelectedBusiness Sectors for Companies With Employees: 2003 . . . . . . . xiii
7. Capital Expenditures by Major Type of Structures for CompaniesWith Employees: 2003 . . . . . . . . . . . . . . . . . . . . . . . . xiv
8. Capital Expenditures Distribution by Structure Classification forCompanies With Employees: 2003 . . . . . . . . . . . . . . . . . . xiv
9. Capital Expenditures by Major Types of Equipment for CompaniesWith Employees: 2003 . . . . . . . . . . . . . . . . . . . . . . . . . xv
10. Capital Expenditures Distribution by Major Types of Equipment forCompanies With Employees: 2003 . . . . . . . . . . . . . . . . . . xv
Text Table
A. Capital Expenditures by Business Sector for Companies WithEmployees . . . . . . . . . . . . . . . . . . . . . . . . . . . . . . . viii
Tables
1a. Capital Expenditures for Structures and Equipment: 2003 . . . . . . 11b. Capital Expenditures for Structures and Equipment: 2002
Revised . . . . . . . . . . . . . . . . . . . . . . . . . . . . . . . . 11c. Relative Standard Errors for Capital Expenditures for Structures and
Equipment: 2003 . . . . . . . . . . . . . . . . . . . . . . . . . . . 21d. Relative Standard Errors for Capital Expenditures for Structures and
Equipment: 2002 Revised . . . . . . . . . . . . . . . . . . . . . . 22a. Capital Expenditures and Percent Change for Companies With
Employees by Major Industry Sector: 2003, 2002 Revised, and2001 Revised . . . . . . . . . . . . . . . . . . . . . . . . . . . . . 3
2b. Relative Standard Errors for Capital Expenditures and StandardErrors of Percent Change for Companies With Employees by MajorIndustry Sector: 2003, 2002 Revised, and 2001 Revised . . . . . . 4
3a. Capital Expenditures for Structures and Equipment for CompaniesWith Employees by Major Industry Sector: 2003 and 2002 Revised . 5
3b. Relative Standard Errors for Capital Expenditures for Structures andEquipment for Companies With Employees by Major IndustrySector: 2003 and 2002 Revised . . . . . . . . . . . . . . . . . . . 6
4a. Capital Expenditures for Structures and Equipment for CompaniesWith Employees by Industry: 2003 . . . . . . . . . . . . . . . . . . 7
4b. Capital Expenditures for Structures and Equipment for CompaniesWith Employees by Industry: 2002 Revised . . . . . . . . . . . . . 10
CONTENTS
Contents iiiAnnual Capital Expenditures: 2003
Tables—Con.
4c. Relative Standard Errors for Capital Expenditures for Structures andEquipment for Companies With Employees by Industry:2003 . . . . . . . . . . . . . . . . . . . . . . . . . . . . . . . . . . 13
4d. Relative Standard Errors for Capital Expenditures for Structures andEquipment for Companies With Employees by Industry: 2002Revised . . . . . . . . . . . . . . . . . . . . . . . . . . . . . . . . 16
5a. Capital Expenditures for Structures by Major Industry Group andMajor Structure Type for Companies With Employees: 2003 . . . . 19
5b. Relative Standard Errors for Capital Expenditures for Structures byMajor Industry Group and Major Structure Type for CompaniesWith Employees: 2003 . . . . . . . . . . . . . . . . . . . . . . . . 21
6a. Capital Expenditures for Structures by Type and Classification forCompanies With Employees: 2003 . . . . . . . . . . . . . . . . . . 23
6b. Relative Standard Errors for Capital Expenditures for Structures byType and Classification for Companies With Employees: 2003 . . . 24
7a. Capital Expenditures for Equipment by Major Industry Group andMajor Equipment Type for Companies With Employees: 2003 . . . . 25
7b. Relative Standard Errors for Capital Expenditures for Equipment byMajor Industry Group and Major Equipment for Companies WithEmployees: 2003 . . . . . . . . . . . . . . . . . . . . . . . . . . . 27
8a. Capital Expenditures for Equipment by Type and Classification forCompanies With Employees by Industry:2003 . . . . . . . . . . . . 29
8b. Relative Standard Errors for Capital Expenditures for Equupment byType and Classification for Companies With Employees: 2003 . . . 30
Appendixes
A. Definition of Terms . . . . . . . . . . . . . . . . . . . . . . . . . . . A–1B. Comparisons With Other Estimates of Capital Expenditures . . . . . B–1C. Sampling and Estimation Methodologies . . . . . . . . . . . . . . . . C–1D. Survey Forms and Instructions . . . . . . . . . . . . . . . . . . . . . D–1
iv Contents Annual Capital Expenditures: 2003

Introduction
DESCRIPTION OF SURVEY
The Annual Capital Expenditures Survey (ACES) is part of acomprehensive program designed to provide moredetailed and timely information on capital investment instructures and equipment by nonfarm businesses. Thedata are used to improve the quality of current economicindicators of business investments, as well as the quar-terly estimates of gross domestic product. The data alsoprovide facts about trends in capital expenditures usefulfor identifying business opportunities, product develop-ment, and business planning.
BACKGROUND
Funding for the survey was first provided by Congress infiscal year 1991. At that time, the U.S. Census Bureaudeveloped and conducted a feasibility survey to collect1991 data from a sample of approximately 4,400 nonfarmcompanies. The purpose was to test the clarity of ques-tions and instructions and determine the ability of compa-nies to report the requested data.
The results of that survey were incorporated into a smalltest survey to collect 1992 data from a sample of 11,200nonfarm companies. The purpose here was to furtherevaluate the survey content, refine the survey forms andinstructions, and test the sufficiency of the sample.Selected results of this survey were published in May1994.
After evaluating the 1992 survey results, it was deter-mined that the annual collection of detailed expenditureson the types of structures and equipment purchased wasoverly burdensome for respondents. Consequently, a5-year survey plan was developed beginning with the datacollection for the 1993 ACES. The 5-year cycle includedconducting annually a basic survey that collects total capi-tal expenditures for new and used structures and equip-ment from companies with five employees or more andbiannually a survey of businesses with fewer than fiveemployees, including those with no employees. Detailedinformation on types of structures and equipment wouldbe collected once during the 5-year cycle with structuresinformation collected in 1994 and equipment in 1996.
A proposal to further revise this plan was approved by theOffice of Management and Budget beginning with the1996 survey. The new plan included a mail sample of allsmall businesses annually to provide an improved timeseries estimate of total and new capital expenditures by
all companies. Additionally, detailed information on typesof structures and equipment would be collected in the1998 survey from companies with employees and every 5years thereafter or as determined by the 1998 surveyresults.
The 2003 estimates presented in this report are based ondata collected from a sample of 45,994 companies withemployees and 15,000 businesses without employees.The sample frame for companies with employees wasslightly more than 5.7 million and for companies withoutemployees about 21.3 million. For those companies withemployees, capital expenditures data are published for132 industries. In addition, total capital expenditures, withno industry detail, are shown for the businesses withoutemployees.
COMPOSITION OF INDUSTRY CATEGORY CODES
Beginning with the 1999 ACES, industry categories used inthe survey were comprised primarily of three-digit andselected four-digit industries from the North AmericanIndustry Classification System (NAICS): 1997. Industrycombinations were developed through consultation withdata users. In addition, a category was provided for struc-tures and equipment expenditures serving multiple indus-tries; for example, headquarters, regional offices, and cen-tral research laboratories.
INFORMATION REQUESTED
Four survey forms (ACE-1(S), ACE-1(M), ACE-1(L), andACE-2) were used for the 2002 ACES. The ACE-1(S), ACE-1(M), and ACE-1(L) survey forms were mailed to a sampleof 45,994 companies with employees. Recipients of thesesurvey forms were requested to provide capital expendi-tures data for each industry in which they had activity andto classify these expenditures as new and used structuresand equipment.
New structures and equipment include expenditures fornew buildings and other structures, structures that havebeen previously owned but neither used or occupied, newmachinery and equipment, and other new depreciableassets. Used structures and equipment include expendi-tures for buildings and other structures which have beenpreviously owned and occupied, secondhand machineryand equipment, and other used depreciable assets. Inaddition, these companies were asked to report new struc-tures and equipment acquired under capital lease arrange-ments entered into during the survey year.
Introduction vAnnual Capital Expenditures: 2003
U.S. Census Bureau

The ACE-2 survey form was mailed to a sample of approxi-mately 15,000 businesses without employees. Capitalexpenditures data were requested separately for new and
used structures and equipment. (Examples of ACE-1(S),ACE-1(M), ACE-1(L), and ACE-2 survey forms are in Appen-dix D.)
Figure 1. Capital Expenditures by Business Sectors for Companies With Employees: 2003
(Billion dollars)
Manufacturing
Real estate andrental and leasing
Finance and insurance
Information
Retail trade
Health care andsocial assistance
Transportation andwarehousing
Utilities
Professional, scientific,and technical services
Mining
Wholesale trade
149.5
125.1
89.4
81.7
54.7
65.5
60.8
44.9
50.5
28.4
24.9
Other services
Construction
Educational services
Arts, entertainment,and recreation
Management of companiesand enterprises
Forestry, fishing, andagricultural services
Accommodation andfood services
23.1
21.0
26.1
16.6
15.6
11.0
1.9
Administrative and supportand waste management
3.4
vi Introduction Annual Capital Expenditures: 2003
U.S. Census Bureau
SUMMARY OF FINDINGS
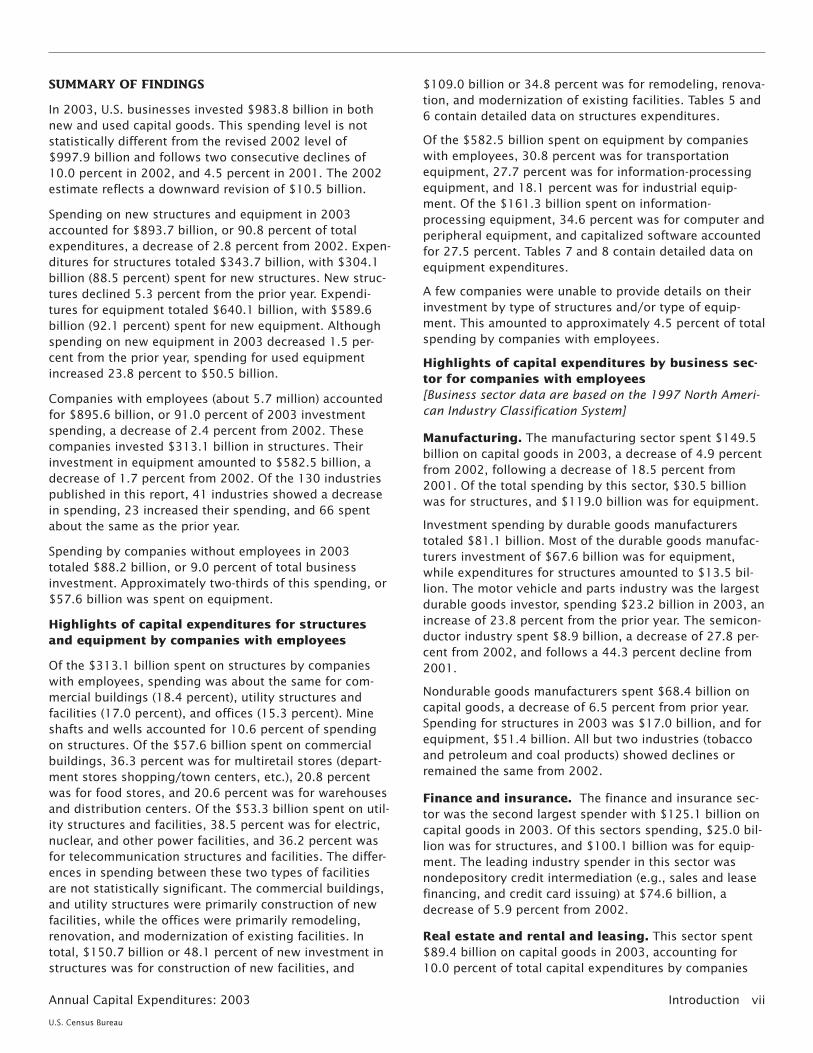
In 2003, U.S. businesses invested $983.8 billion in bothnew and used capital goods. This spending level is notstatistically different from the revised 2002 level of$997.9 billion and follows two consecutive declines of10.0 percent in 2002, and 4.5 percent in 2001. The 2002estimate reflects a downward revision of $10.5 billion.
Spending on new structures and equipment in 2003accounted for $893.7 billion, or 90.8 percent of totalexpenditures, a decrease of 2.8 percent from 2002. Expen-ditures for structures totaled $343.7 billion, with $304.1billion (88.5 percent) spent for new structures. New struc-tures declined 5.3 percent from the prior year. Expendi-tures for equipment totaled $640.1 billion, with $589.6billion (92.1 percent) spent for new equipment. Althoughspending on new equipment in 2003 decreased 1.5 per-cent from the prior year, spending for used equipmentincreased 23.8 percent to $50.5 billion.
Companies with employees (about 5.7 million) accountedfor $895.6 billion, or 91.0 percent of 2003 investmentspending, a decrease of 2.4 percent from 2002. Thesecompanies invested $313.1 billion in structures. Theirinvestment in equipment amounted to $582.5 billion, adecrease of 1.7 percent from 2002. Of the 130 industriespublished in this report, 41 industries showed a decreasein spending, 23 increased their spending, and 66 spentabout the same as the prior year.
Spending by companies without employees in 2003totaled $88.2 billion, or 9.0 percent of total businessinvestment. Approximately two-thirds of this spending, or$57.6 billion was spent on equipment.
Highlights of capital expenditures for structuresand equipment by companies with employees
Of the $313.1 billion spent on structures by companieswith employees, spending was about the same for com-mercial buildings (18.4 percent), utility structures andfacilities (17.0 percent), and offices (15.3 percent). Mineshafts and wells accounted for 10.6 percent of spendingon structures. Of the $57.6 billion spent on commercialbuildings, 36.3 percent was for multiretail stores (depart-ment stores shopping/town centers, etc.), 20.8 percentwas for food stores, and 20.6 percent was for warehousesand distribution centers. Of the $53.3 billion spent on util-ity structures and facilities, 38.5 percent was for electric,nuclear, and other power facilities, and 36.2 percent wasfor telecommunication structures and facilities. The differ-ences in spending between these two types of facilitiesare not statistically significant. The commercial buildings,and utility structures were primarily construction of newfacilities, while the offices were primarily remodeling,renovation, and modernization of existing facilities. Intotal, $150.7 billion or 48.1 percent of new investment instructures was for construction of new facilities, and
$109.0 billion or 34.8 percent was for remodeling, renova-tion, and modernization of existing facilities. Tables 5 and6 contain detailed data on structures expenditures.
Of the $582.5 billion spent on equipment by companieswith employees, 30.8 percent was for transportationequipment, 27.7 percent was for information-processingequipment, and 18.1 percent was for industrial equip-ment. Of the $161.3 billion spent on information-processing equipment, 34.6 percent was for computer andperipheral equipment, and capitalized software accountedfor 27.5 percent. Tables 7 and 8 contain detailed data onequipment expenditures.
A few companies were unable to provide details on theirinvestment by type of structures and/or type of equip-ment. This amounted to approximately 4.5 percent of totalspending by companies with employees.
Highlights of capital expenditures by business sec-tor for companies with employees[Business sector data are based on the 1997 North Ameri-can Industry Classification System]
Manufacturing. The manufacturing sector spent $149.5billion on capital goods in 2003, a decrease of 4.9 percentfrom 2002, following a decrease of 18.5 percent from2001. Of the total spending by this sector, $30.5 billionwas for structures, and $119.0 billion was for equipment.
Investment spending by durable goods manufacturerstotaled $81.1 billion. Most of the durable goods manufac-turers investment of $67.6 billion was for equipment,while expenditures for structures amounted to $13.5 bil-lion. The motor vehicle and parts industry was the largestdurable goods investor, spending $23.2 billion in 2003, anincrease of 23.8 percent from the prior year. The semicon-ductor industry spent $8.9 billion, a decrease of 27.8 per-cent from 2002, and follows a 44.3 percent decline from2001.
Nondurable goods manufacturers spent $68.4 billion oncapital goods, a decrease of 6.5 percent from prior year.Spending for structures in 2003 was $17.0 billion, and forequipment, $51.4 billion. All but two industries (tobaccoand petroleum and coal products) showed declines orremained the same from 2002.
Finance and insurance. The finance and insurance sec-tor was the second largest spender with $125.1 billion oncapital goods in 2003. Of this sectors spending, $25.0 bil-lion was for structures, and $100.1 billion was for equip-ment. The leading industry spender in this sector wasnondepository credit intermediation (e.g., sales and leasefinancing, and credit card issuing) at $74.6 billion, adecrease of 5.9 percent from 2002.
Real estate and rental and leasing. This sector spent$89.4 billion on capital goods in 2003, accounting for10.0 percent of total capital expenditures by companies
Introduction viiAnnual Capital Expenditures: 2003
U.S. Census Bureau
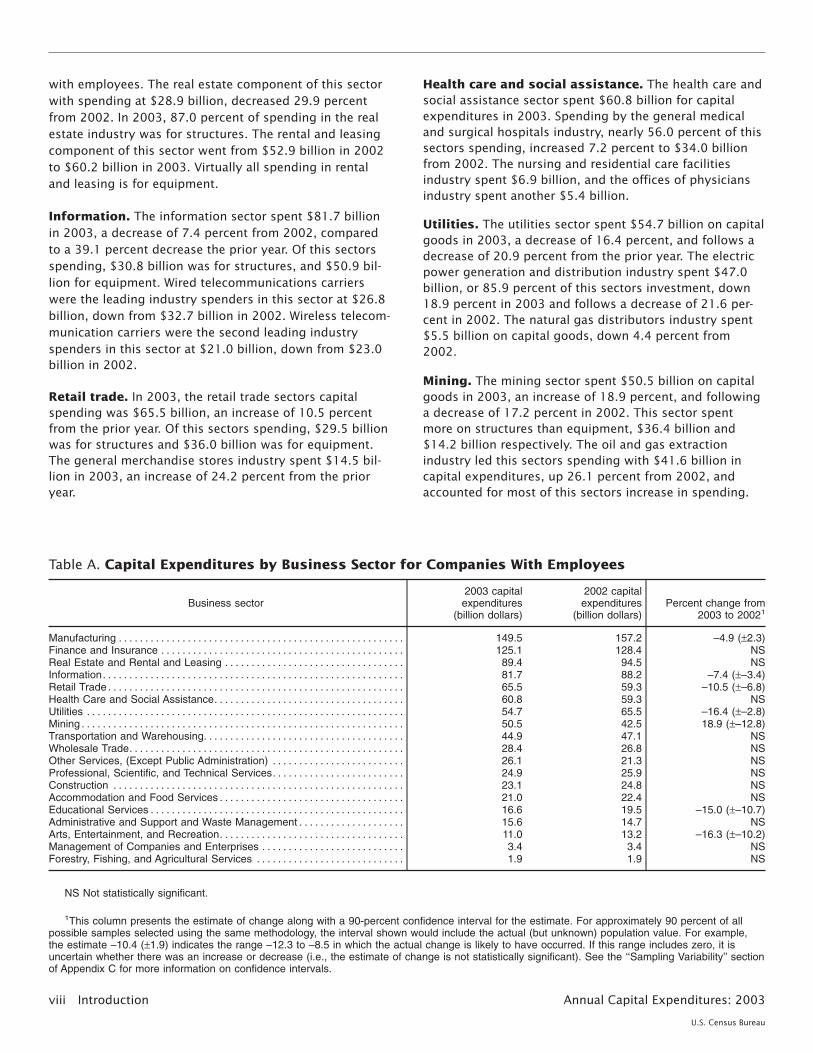
with employees. The real estate component of this sectorwith spending at $28.9 billion, decreased 29.9 percentfrom 2002. In 2003, 87.0 percent of spending in the realestate industry was for structures. The rental and leasingcomponent of this sector went from $52.9 billion in 2002to $60.2 billion in 2003. Virtually all spending in rentaland leasing is for equipment.
Information. The information sector spent $81.7 billionin 2003, a decrease of 7.4 percent from 2002, comparedto a 39.1 percent decrease the prior year. Of this sectorsspending, $30.8 billion was for structures, and $50.9 bil-lion for equipment. Wired telecommunications carrierswere the leading industry spenders in this sector at $26.8billion, down from $32.7 billion in 2002. Wireless telecom-munication carriers were the second leading industryspenders in this sector at $21.0 billion, down from $23.0billion in 2002.
Retail trade. In 2003, the retail trade sectors capitalspending was $65.5 billion, an increase of 10.5 percentfrom the prior year. Of this sectors spending, $29.5 billionwas for structures and $36.0 billion was for equipment.The general merchandise stores industry spent $14.5 bil-lion in 2003, an increase of 24.2 percent from the prioryear.
Health care and social assistance. The health care andsocial assistance sector spent $60.8 billion for capitalexpenditures in 2003. Spending by the general medicaland surgical hospitals industry, nearly 56.0 percent of thissectors spending, increased 7.2 percent to $34.0 billionfrom 2002. The nursing and residential care facilitiesindustry spent $6.9 billion, and the offices of physiciansindustry spent another $5.4 billion.
Utilities. The utilities sector spent $54.7 billion on capitalgoods in 2003, a decrease of 16.4 percent, and follows adecrease of 20.9 percent from the prior year. The electricpower generation and distribution industry spent $47.0billion, or 85.9 percent of this sectors investment, down18.9 percent in 2003 and follows a decrease of 21.6 per-cent in 2002. The natural gas distributors industry spent$5.5 billion on capital goods, down 4.4 percent from2002.
Mining. The mining sector spent $50.5 billion on capitalgoods in 2003, an increase of 18.9 percent, and followinga decrease of 17.2 percent in 2002. This sector spentmore on structures than equipment, $36.4 billion and$14.2 billion respectively. The oil and gas extractionindustry led this sectors spending with $41.6 billion incapital expenditures, up 26.1 percent from 2002, andaccounted for most of this sectors increase in spending.
Table A. Capital Expenditures by Business Sector for Companies With Employees
Business sector2003 capital
expenditures(billion dollars)
2002 capitalexpenditures
(billion dollars)Percent change from
2003 to 20021
Manufacturing . . . . . . . . . . . . . . . . . . . . . . . . . . . . . . . . . . . . . . . . . . . . . . . . . . . . . . 149.5 157.2 –4.9 (±2.3)Finance and Insurance . . . . . . . . . . . . . . . . . . . . . . . . . . . . . . . . . . . . . . . . . . . . . . 125.1 128.4 NSReal Estate and Rental and Leasing . . . . . . . . . . . . . . . . . . . . . . . . . . . . . . . . . . 89.4 94.5 NSInformation. . . . . . . . . . . . . . . . . . . . . . . . . . . . . . . . . . . . . . . . . . . . . . . . . . . . . . . . . 81.7 88.2 –7.4 (±–3.4)Retail Trade . . . . . . . . . . . . . . . . . . . . . . . . . . . . . . . . . . . . . . . . . . . . . . . . . . . . . . . . 65.5 59.3 –10.5 (±–6.8)Health Care and Social Assistance. . . . . . . . . . . . . . . . . . . . . . . . . . . . . . . . . . . . 60.8 59.3 NSUtilities . . . . . . . . . . . . . . . . . . . . . . . . . . . . . . . . . . . . . . . . . . . . . . . . . . . . . . . . . . . . 54.7 65.5 –16.4 (±–2.8)Mining . . . . . . . . . . . . . . . . . . . . . . . . . . . . . . . . . . . . . . . . . . . . . . . . . . . . . . . . . . . . . 50.5 42.5 18.9 (±–12.8)Transportation and Warehousing. . . . . . . . . . . . . . . . . . . . . . . . . . . . . . . . . . . . . . 44.9 47.1 NSWholesale Trade. . . . . . . . . . . . . . . . . . . . . . . . . . . . . . . . . . . . . . . . . . . . . . . . . . . . 28.4 26.8 NSOther Services, (Except Public Administration) . . . . . . . . . . . . . . . . . . . . . . . . . 26.1 21.3 NSProfessional, Scientific, and Technical Services. . . . . . . . . . . . . . . . . . . . . . . . . 24.9 25.9 NSConstruction . . . . . . . . . . . . . . . . . . . . . . . . . . . . . . . . . . . . . . . . . . . . . . . . . . . . . . . 23.1 24.8 NSAccommodation and Food Services . . . . . . . . . . . . . . . . . . . . . . . . . . . . . . . . . . . 21.0 22.4 NSEducational Services . . . . . . . . . . . . . . . . . . . . . . . . . . . . . . . . . . . . . . . . . . . . . . . . 16.6 19.5 –15.0 (±–10.7)Administrative and Support and Waste Management . . . . . . . . . . . . . . . . . . . . 15.6 14.7 NSArts, Entertainment, and Recreation. . . . . . . . . . . . . . . . . . . . . . . . . . . . . . . . . . . 11.0 13.2 –16.3 (±–10.2)Management of Companies and Enterprises . . . . . . . . . . . . . . . . . . . . . . . . . . . 3.4 3.4 NSForestry, Fishing, and Agricultural Services . . . . . . . . . . . . . . . . . . . . . . . . . . . . 1.9 1.9 NS
NS Not statistically significant.
1This column presents the estimate of change along with a 90-percent confidence interval for the estimate. For approximately 90 percent of allpossible samples selected using the same methodology, the interval shown would include the actual (but unknown) population value. For example,the estimate –10.4 (±1.9) indicates the range –12.3 to –8.5 in which the actual change is likely to have occurred. If this range includes zero, it isuncertain whether there was an increase or decrease (i.e., the estimate of change is not statistically significant). See the ‘‘Sampling Variability’’ sectionof Appendix C for more information on confidence intervals.
viii Introduction Annual Capital Expenditures: 2003
U.S. Census Bureau

Transportation and warehousing. Investment in thissector was $44.9 billion in 2003. The air transportationindustry accounted for about a fourth of capital spendingwith $10.7 billion, down 13.0 percent from 2002, andaccounted for most of this sectors spending decrease forequipment. The truck transportation industry spent $9.1billion, about the same as the prior year. The rail transpor-tation industry with spending of $6.5 billion increased 2.2percent in 2003. The pipeline transportation of natural gasindustry, with spending of $4.4 billion in 2003, decreased20.5 percent from the prior year.
Wholesale trade. The wholesale trade sector spent $28.4billion on capital expenditures in 2003. The durable goodsindustry spent $19.1 billion, and the nondurable goodsindustry spent $9.4 billion.
Other services (except public administration). Thissector, which includes various types of organizations andmembership groups, repair and maintenance services, andpersonal services, had $26.1 billion in capital expendi-tures in 2003. The religious, social advocacy, and organi-zations industry was the largest spender in 2003, with$17.6 billion.
Professional, scientific, and technical services. Thissector spent $24.9 billion for capital goods in 2003. Com-bined, the computer systems design industry with spend-ing of $5.5 billion, scientific research and developmentwith spending of $4.5 billion, and management, scientific,and technical consulting with spending of $3.1 billionaccounted for 52.9 percent of this sectors spending.
Construction. The construction sector spent $23.1 bil-lion for capital expenditures in 2003. Special trade con-tractors, with spending of $10.2 billion, decreased 21.2percent from the prior year.
Accommodation and food services. This sectors capi-tal spending in 2003 amounted to $21.0 billion. The foodservices and drinking places industry spent $13.2 billionfor capital expenditures in 2003. The traveler accommoda-tion services industry, which includes hotels and casinohotels, spent $7.8 billion on capital expenditures, down28.0 percent in 2003.
Educational services. The educational services sectorspent $16.6 billion on capital expenditures in 2003, adecrease of about 15.0 percent from the prior year, duemainly to a $2.7 billion spending decrease on new andused structures. Spending for structures totaled $11.9 bil-lion and spending for equipment totaled $4.7 billion.
Administrative and support and waste manage-ment. This sector spent $15.6 billion for capital goods in2003. The office administrative support industry spent$6.0 billion for capital goods, an increase of 49.9 percentfrom the prior year.
Arts, entertainment, and recreation. This sector spent$11.0 billion for capital goods in 2003, a decrease of 16.3percent from the prior year. The amusement, gambling,and recreation industry spent $6.7 billion. This representsa decrease of 29.9 percent from the prior year.
Note: Revised 2002 Annual Capital Expenditures Surveydata and associated relative standard error tables areincluded in this publication.
The data in this report are subject to sampling variability,as well as nonsampling error. Sources of nonsamplingerror include errors of response, nonreporting, and cover-age. Further details concerning survey design, methodol-ogy, and data limitations are contained in the appendixesof this publication.
In accordance with federal law governing census reports(Title 13 of the United States Code), no data are publishedthat would disclose the operations of an individual estab-lishment or company. Disclosure limitation is the processfor protecting the confidentiality of data. A disclosurewould occur if someone could use published statisticalinformation to infer the identity or operations of a busi-ness that has provided information under a pledge of con-fidentiality. Disclosure suppression protects the confidenti-ality of individual businesses by withholding (suppressing)the cell values in tables of aggregate data for cases whereonly a few businesses are represented or dominate thestatistic presented.
DISCLOSURE
The disclosure analysis for the ACES statistics is per-formed on each data item. When the estimate for a spe-cific data item cannot be shown without disclosing infor-mation for individual companies, then the publication ofthat data item is suppressed. The process of suppressiondoes not change the marginal totals, so the integrity ofthe data is not adversely affected.
ABBREVIATIONS AND SYMBOLS
The following abbreviations and symbols are used in thispublication:
– Represents zero.(D) Withheld to avoid disclosing data for indi-
vidual companies, data are included in higherlevel totals.
(NA) Not available.(X) Not applicable.(Z) Less than half of unit shown.
ELECTRONIC ACCESS OF DATA
The 2003 Annual Capital Expenditures Survey data areavailable electronically on the Internet at this address:http://www.census.gov/csd/ace/. For further informationregarding electronic releases, call 301-763-INFO (4636).
Introduction ixAnnual Capital Expenditures: 2003
U.S. Census Bureau
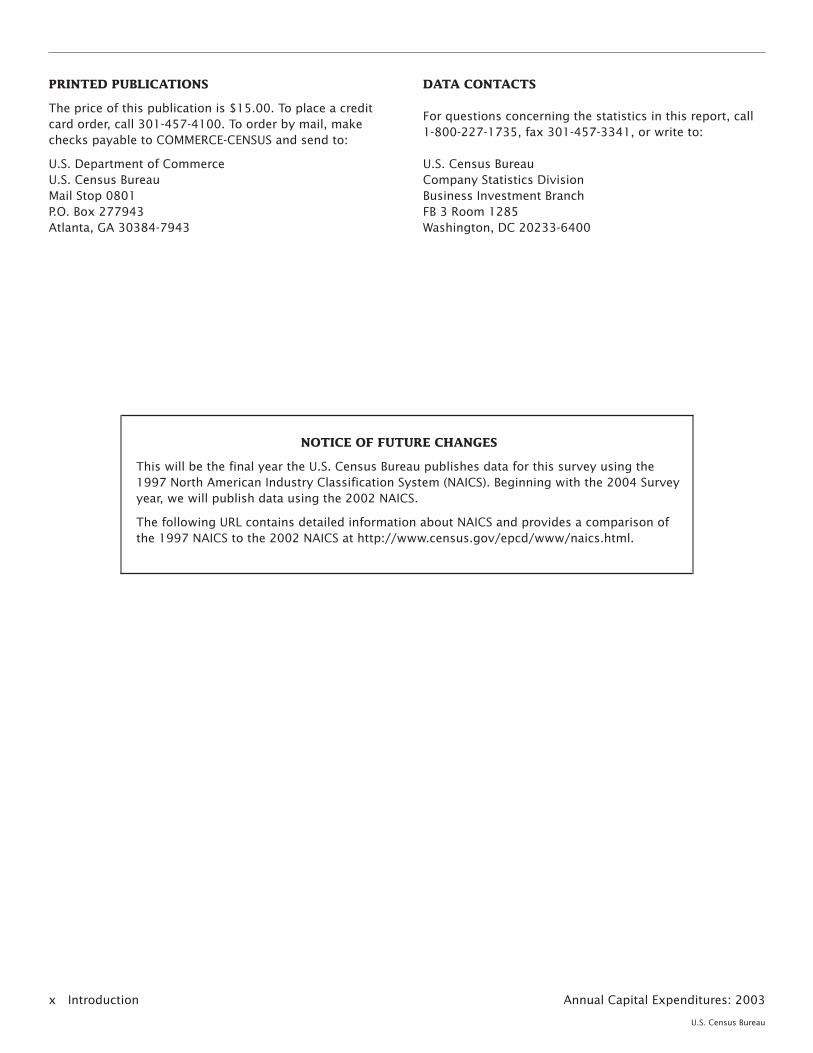
PRINTED PUBLICATIONS
The price of this publication is $15.00. To place a creditcard order, call 301-457-4100. To order by mail, makechecks payable to COMMERCE-CENSUS and send to:
U.S. Department of CommerceU.S. Census BureauMail Stop 0801P.O. Box 277943Atlanta, GA 30384-7943
DATA CONTACTS
For questions concerning the statistics in this report, call1-800-227-1735, fax 301-457-3341, or write to:
U.S. Census BureauCompany Statistics DivisionBusiness Investment BranchFB 3 Room 1285Washington, DC 20233-6400
NOTICE OF FUTURE CHANGES
This will be the final year the U.S. Census Bureau publishes data for this survey using the1997 North American Industry Classification System (NAICS). Beginning with the 2004 Surveyyear, we will publish data using the 2002 NAICS.
The following URL contains detailed information about NAICS and provides a comparison ofthe 1997 NAICS to the 2002 NAICS at http://www.census.gov/epcd/www/naics.html.
x Introduction Annual Capital Expenditures: 2003
U.S. Census Bureau
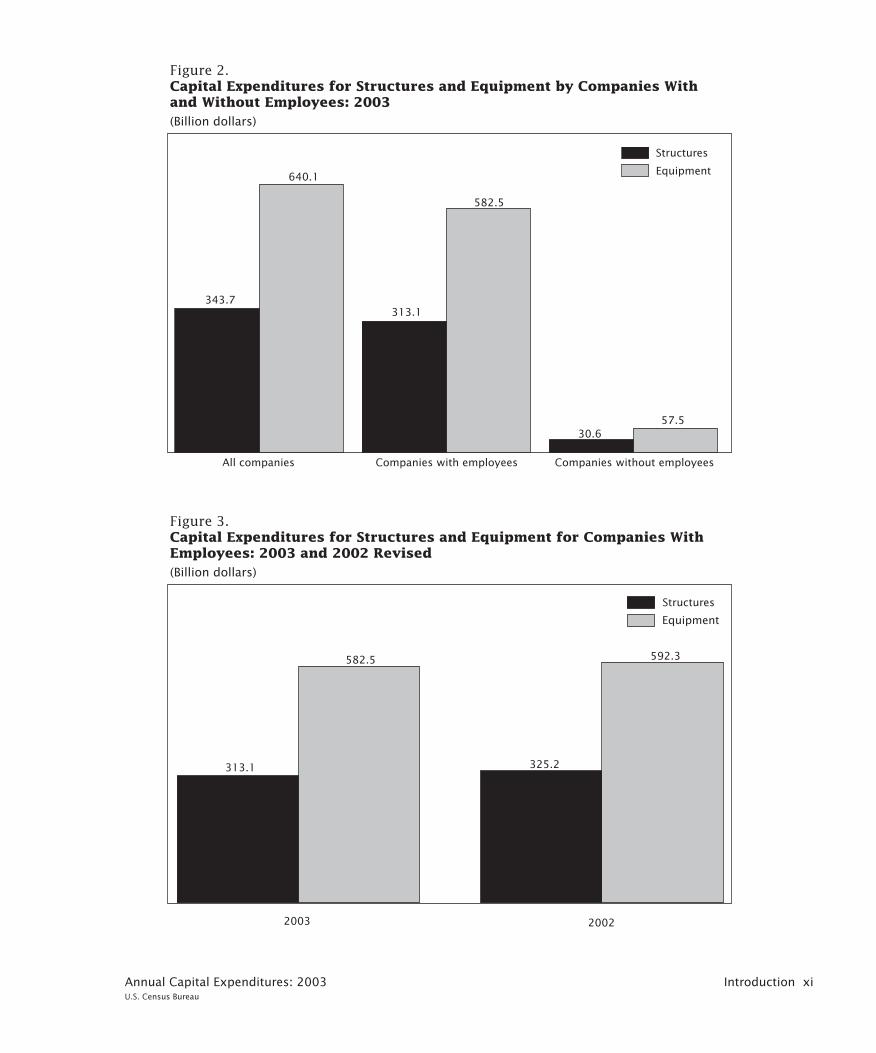
Figure 2.Capital Expenditures for Structures and Equipment by Companies With and Without Employees: 2003(Billion dollars)
All companies Companies with employees Companies without employees
343.7
640.1
313.1
582.5
30.657.5
Structures
Equipment
Figure 3.Capital Expenditures for Structures and Equipment for Companies With Employees: 2003 and 2002 Revised(Billion dollars)
2003 2002
313.1
582.5
325.2
592.3
Structures
Equipment
Introduction xi Annual Capital Expenditures: 2003U.S. Census Bureau
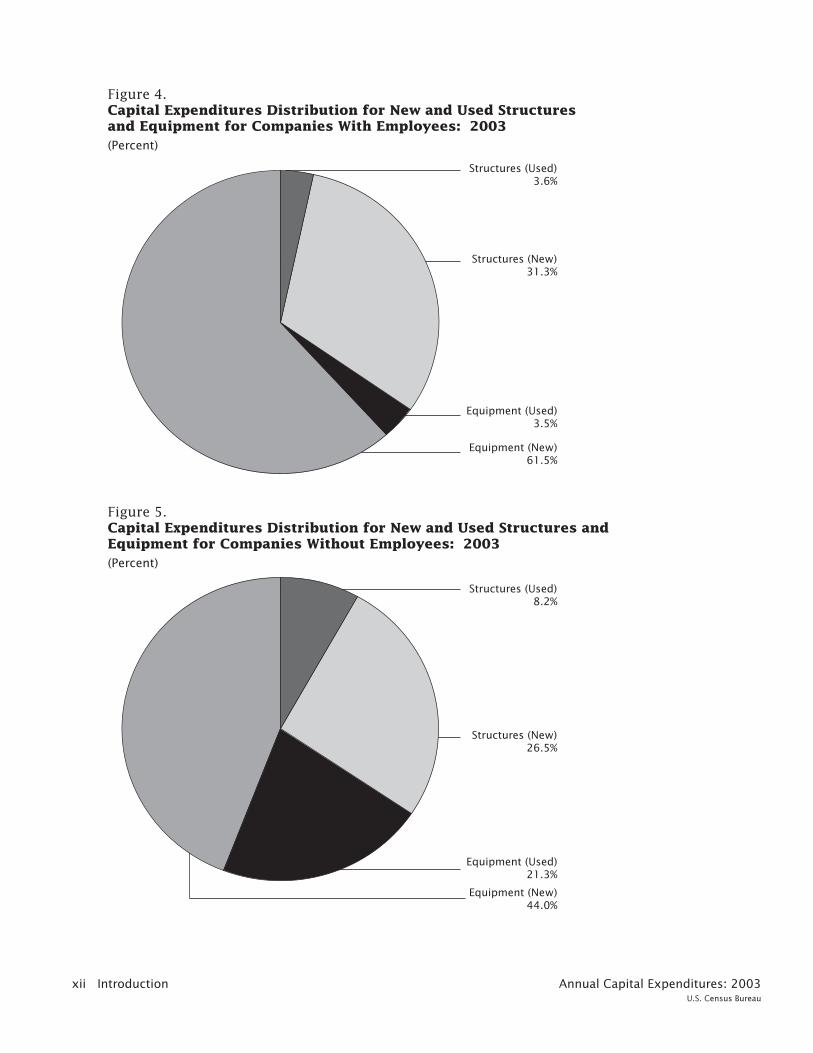
Figure 4.Capital Expenditures Distribution for New and Used Structuresand Equipment for Companies With Employees: 2003(Percent)
Structures (Used)3.6%
Structures (New)31.3%
Equipment (Used)3.5%
Figure 5.Capital Expenditures Distribution for New and Used Structures and Equipment for Companies Without Employees: 2003(Percent)
Equipment (New)61.5%
Structures (Used)8.2%
Structures (New)26.5%
Equipment (Used)21.3%
Equipment (New)44.0%
xii Introduction Annual Capital Expenditures: 2003U.S. Census Bureau

Figure 6. Capital Expenditures for Structures and Equipment by Selected Business Sectors for Companies With Employees: 2003
(Billion dollars)
50.9
119.0
100.0
6.0
30.5
21.51.7
30.0
24.7
14.2
36.4
22.4
29.5
36.0
12.9
32.0
30.8
25.0
26.2
63.2
30.9
29.9
Structures
EquipmentMining
Construction
Manufacturing
Transportationand warehousing
Information
Utilities
Wholesaletrade
Retailtrade
Finance andInsurance
Real estate and rental and leasing
Health care and social assistance
Professional, scientific,and technical services
Accommodationand food services
Administrative andsupport and waste
management
5.3
19.6
10.6
10.5
3.9
11.7
Introduction xiiiAnnual Capital Expenditures: 2003U.S. Census Bureau

Figure 7.Capital Expenditures by Major Types of Structures for Companies With Employees: 2003
(Billion dollars)
Figure 8.Capital Expenditures Distribution by Structure Classification for Companies WithEmployees: 2003(Percent)
Construction of newfacilities (Contract)38.9%
Acquisition of existing facilities (New)3.7%
Acquisition of existingfacilities (Used)
10.6%
Remodeling, renovation ofexisting facility (Contract)
32.6%
Remodeling, renovation of existing facility (Own employees)
3.3%Construction of new facilities(Own employees)10.8%
Residentialbuildings
Hotelsand
motels
Industrialbuildings
Offices Commer-cial
buildings
Healthcare
Amusementand
recreationalfacilities
Transpor-tation
facilities
Utilitystructures
and facilities
Otherbuildings
Mineshaftsand
wells
Othernonbuildingstructures
10.1
4.6
31.9
48.0
57.6
23.0
5.6 6.7
53.3
26.7
33.2
2.5
Annual Capital Expenditures: 2003U.S. Census Bureau
xiv Introduction
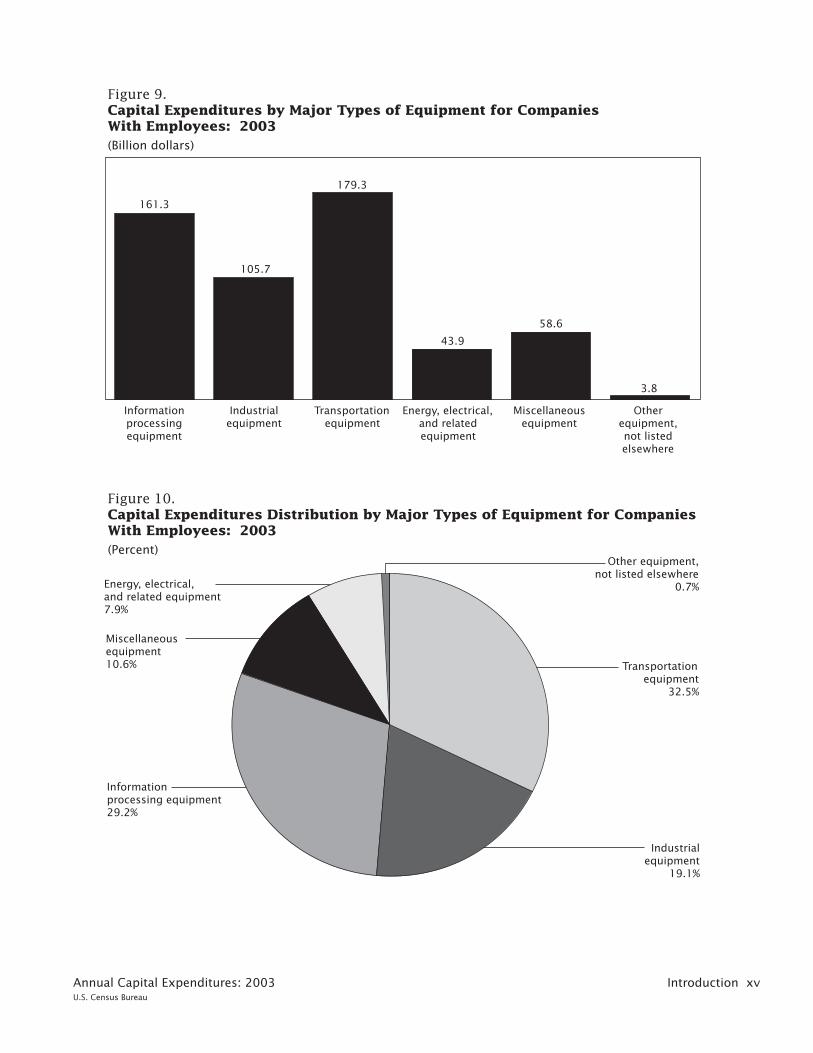
Figure 9.Capital Expenditures by Major Types of Equipment for CompaniesWith Employees: 2003(Billion dollars)
Figure 10.Capital Expenditures Distribution by Major Types of Equipment for Companies With Employees: 2003(Percent)
Informationprocessing equipment29.2%
Other equipment,not listed elsewhere
0.7%
Transportationequipment
32.5%
Miscellaneousequipment10.6%
Energy, electrical,and related equipment7.9%
Informationprocessingequipment
Industrialequipment
Transportationequipment
Energy, electrical,and relatedequipment
Miscellaneousequipment
161.3
105.7
43.9
179.3
58.6
3.8
Otherequipment,not listedelsewhere
Industrialequipment
19.1%
Introduction xvAnnual Capital Expenditures: 2003U.S. Census Bureau

Table 1a. Capital Expenditures for Structures and Equipment: 2003[Millions of current dollars. For meaning of abbreviations and symbols, see introductory text. See Appendixes A and C for definition of terms and sampling and estimation methodology]
Capital expendituresCapital expenditures for all companies
Capital expenditures for companieswith employees
Capital expenditures for companieswithout employees
Total 983 815�������������������������������������������������������� 895 646 88 169
Structures 343 721����������������������������������������������������� 313 101 30 621
New 304 094������������������������������������������������������������������� 280 695 23 399Used 39 627������������������������������������������������������������������ 32 406 7 222
Equipment 640 094���������������������������������������������������� 582 546 57 549
New 589 643������������������������������������������������������������������� 550 841 38 803Used 50 451������������������������������������������������������������������ 31 705 18 746
Not distributed as structures or equipment –���������������������� – –
Capitalized computer software1 (NA)��������������������������������� 45 388 (NA)
Prepackaged (NA)����������������������������������������������������������� 15 879 (NA)Vendor�customized (NA)����������������������������������������������������� 14 553 (NA)Internally�developed (NA)����������������������������������������������������� 14 957 (NA)
Capital leases1 15 641������������������������������������������������ 15 137 504
1Included in structures and equipment data shown above.
Note: Detail may not add to total because of rounding.
Table 1b. Capital Expenditures for Structures and Equipment: 2002 Revised[Millions of current dollars. For meaning of abbreviations and symbols, see introductory text. See Appendixes A and C for definition of terms and sampling and estimation methodology]
Capital expendituresCapital expenditures for all companies
Capital expenditures for companieswith employees
Capital expenditures for companieswithout employees
Total 997 894�������������������������������������������������������� 917 490 80 404
Structures 358 484����������������������������������������������������� 325 168 33 316
New 321 191������������������������������������������������������������������� 299 941 21 250Used 37 293������������������������������������������������������������������ 25 227 12 066
Equipment 639 410���������������������������������������������������� 592 321 47 088
New 598 668������������������������������������������������������������������� 564 218 34 450Used 40 741������������������������������������������������������������������ 28 103 12 638
Not distributed as structures or equipment –���������������������� – –
Capitalized computer software1 (NA)��������������������������������� (NA) (NA)
Prepackaged (NA)����������������������������������������������������������� (NA) (NA)Vendor�customized (NA)����������������������������������������������������� (NA) (NA)Internally�developed (NA)����������������������������������������������������� (NA) (NA)
Capital leases1 15 334������������������������������������������������ 15 092 242
1Included in structures and equipment data shown above.
Note: Detail may not add to total because of rounding.
Annual Capital Expenditures: 2003 1U.S. Census Bureau

Table 1c. Relative Standard Errors for Capital Expenditures for Structures and Equipment:2003
[Percent. For meaning of abbreviations and symbols, see introductory text. See Appendixes A and C for definition of terms and sampling and estimation methodology]
Capital expendituresCapital expenditures for all companies
Capital expenditures for companieswith employees
Capital expenditures for companieswithout employees
Total 0.9�������������������������������������������������������� 0.8 7.5
Structures 2.1����������������������������������������������������� 2.4 12.9
New 1.8������������������������������������������������������������������� 2.0 16.1Used 10.9������������������������������������������������������������������ 12.1 19.9
Equipment 0.6���������������������������������������������������� 0.5 7.0
New 0.6������������������������������������������������������������������� 0.5 6.2Used 5.7������������������������������������������������������������������ 7.3 12.9
Not distributed as structures or equipment –���������������������� – –
Capitalized computer software (NA)��������������������������������� 1.0 (NA)
Prepackaged (NA)����������������������������������������������������������� 1.4 (NA)Vendor�customized (NA)����������������������������������������������������� 1.8 (NA)Internally�developed (NA)����������������������������������������������������� 2.1 (NA)
Capital leases 5.9������������������������������������������������� 6.4 53.8
Table 1d. Relative Standard Errors for Capital Expenditures for Structures and Equipment:2002 Revised
[Percent. For meaning of abbreviations and symbols, see introductory text. See Appendixes A and C for definition of terms and sampling and estimation methodology]
Capital expendituresCapital expenditures for all companies
Capital expenditures for companieswith employees
Capital expenditures for companieswithout employees
Total 1.2�������������������������������������������������������� 1.1 7.2
Structures 2.8����������������������������������������������������� 2.4 14.7
New 2.6������������������������������������������������������������������� 2.5 15.0Used 11.4������������������������������������������������������������������ 6.6 30.3
Equipment 0.6���������������������������������������������������� 0.6 5.2
New 0.6������������������������������������������������������������������� 0.6 6.8Used 4.3������������������������������������������������������������������ 5.3 4.6
Not distributed as structures or equipment –���������������������� – –
Capitalized computer software (NA)��������������������������������� (NA) (NA)
Prepackaged (NA)����������������������������������������������������������� (NA) (NA)Vendor�customized (NA)����������������������������������������������������� (NA) (NA)Internally�developed (NA)����������������������������������������������������� (NA) (NA)
Capital leases 6.6������������������������������������������������� 6.2 48.6
2 Annual Capital Expenditures: 2003U.S. Census Bureau

Table 2a. Capital Expenditures and Percent Change for Companies With Employees by MajorIndustry Sector: 2003, 2002 Revised, and 2001 Revised
[Millions of current dollars. For meaning of abbreviations and symbols, see introductory text. See Appendixes A and C for definition of terms and sampling and estimation methodology]
NAICS code Industry 2003 capitalexpenditures
Percent change(2003�2002)
2002 capitalexpenditures
Percent change(2002�2001)
2001 capitalexpenditures
Total expenditures 895 646���������������������������������������� �2.4 917 490 �12.8 1 052 344
By industry 895 646������������������������������������������������� �2.4 917 490 �12.8 1 052 344
113�115 Forestry, fishing, and agricultural services 1 894����������������������������� �0.9 1 910 24.7 1 532
21 Mining 50 513������������������������������������������������������������ 18.9 42 467 �17.2 51 278
22 Utilities 54 748����������������������������������������������������������� �16.4 65 502 �20.9 82 823
23 Construction 23 136������������������������������������������������������� �6.6 24 773 �0.1 24 802
31�33 Manufacturing 149 509����������������������������������������������������� �4.9 157 243 �18.5 192 835321, 327, 33 Durable goods industries 81 116������������������������������������������ �3.5 84 062 �29.3 118 87531, 322�326 Nondurable goods industries 68 393�������������������������������������� �6.5 73 181 �1.1 73 959
42 Wholesale trade 28 420��������������������������������������������������� 6.1 26 789 �10.6 29 981
44�45 Retail trade 65 548�������������������������������������������������������� 10.5 59 316 �11.4 66 917
48�49 Transportation and warehousing 44 892������������������������������������� �4.7 47 124 �18.4 57 756
51 Information 81 658�������������������������������������������������������� �7.4 88 156 �39.1 144 793
52 Finance and insurance 125 109���������������������������������������������� �2.6 128 444 �2.0 131 105
53 Real estate and rental and leasing 89 392������������������������������������ �5.4 94 529 14.3 82 674
54 Professional, scientific, and technical services 24 877������������������������� �3.8 25 864 �15.1 30 464
55 Management of companies and enterprises 3 397��������������������������� �1.0 3 430 13.0 3 035
56 Administrative and support and waste management 15 600�������������������� 6.0 14 719 �6.8 15 785
61 Educational services 16 601������������������������������������������������ �15.0 19 532 12.4 17 377
62 Health care and social assistance 60 776������������������������������������ 2.5 59 311 12.1 52 932
71 Arts, entertainment, and recreation 11 029����������������������������������� �16.3 13 169 �12.1 14 974
72 Accommodation and food services 21 036����������������������������������� �6.1 22 409 4.9 21 365
81 Other services (except public administration) 26 118�������������������������� 22.8 21 269 �26.7 29 006
Structure and equipment expenditures serving multiple industrycategories 1 394�������������������������������������������������������� �9.0 1 532 68.1 911
Note: Detail may not add to total because of rounding.
Annual Capital Expenditures: 2003 3U.S. Census Bureau

Table 2b. Relative Standard Errors for Capital Expenditures and Standard Error of PercentChange for Companies With Employees by Major Industry Sector: 2003, 2002Revised, and 2001 Revised
[For meaning of abbreviations and symbols, see introductory text. See Appendixes A and C for definition of terms and sampling and estimation methodology]
NAICS code Industry2003 capital
expenditures(percent)
Percent change(2003�2002)
2002 capitalexpenditures
(percent)Percent change
(2002�2001)
2001 capitalexpenditures
(percent)
Total expenditures 0.8���������������������������������������� 1.3 1.1 1.2 0.8
By industry 0.8������������������������������������������������� 1.3 1.1 1.2 0.8
113�115 Forestry, fishing, and agricultural services 15.3����������������������������� 19.6 12.5 22.6 13.1
21 Mining 6.4������������������������������������������������������������ 7.8 1.3 3.2 3.6
22 Utilities 0.9����������������������������������������������������������� 1.7 1.8 1.7 1.1
23 Construction 4.6������������������������������������������������������� 7.6 6.7 9.4 6.6
31�33 Manufacturing 1.0����������������������������������������������������� 1.4 1.1 1.0 (Z)321, 327, 33 Durable goods industries 2.0������������������������������������������ 2.3 1.2 1.0 0.831, 322�326 Nondurable goods industries 1.1�������������������������������������� 1.8 1.6 2.0 1.2
42 Wholesale trade 6.9��������������������������������������������������� 10.6 7.3 9.1 7.1
44�45 Retail trade 3.4�������������������������������������������������������� 4.1 1.6 2.4 2.2
48�49 Transportation and warehousing 2.5������������������������������������� 2.9 1.8 4.6 5.3
51 Information 1.8�������������������������������������������������������� 2.1 1.3 1.5 2.1
52 Finance and insurance 1.5���������������������������������������������� 1.8 1.1 1.8 1.4
53 Real estate and rental and leasing 5.0������������������������������������ 8.6 7.6 9.2 2.7
54 Professional, scientific, and technical services 3.0������������������������� 3.9 2.7 4.7 4.9
55 Management of companies and enterprises 4.1��������������������������� 5.8 4.2 7.4 5.1
56 Administrative and support and waste management 6.9�������������������� 9.0 5.0 5.4 3.1
61 Educational services 6.3������������������������������������������������ 6.5 4.3 5.7 2.7
62 Health care and social assistance 3.4������������������������������������ 4.1 2.1 4.4 3.3
71 Arts, entertainment, and recreation 5.0����������������������������������� 6.2 5.5 7.2 6.1
72 Accommodation and food services 7.2����������������������������������� 9.2 6.7 9.4 6.0
81 Other services (except public administration) 13.1�������������������������� 18.1 6.9 10.5 12.6
Structure and equipment expenditures serving multiple industrycategories 0.6�������������������������������������������������������� 0.6 (Z) 2.3 1.3
1Included in structures and equipment data shown above.
4 Annual Capital Expenditures: 2003U.S. Census Bureau

Table 3a. Capital Expenditures for Structures and Equipment for Companies With Employeesby Major Industry Sector: 2003 and 2002 Revised
[Millions of current dollars. For meaning of abbreviations and symbols, see introductory text. See Appendixes A and C for definition of terms and sampling and estimation methodology]
NAICS code Industry
Expenditures for structures Expenditures for equipment
Totalexpenditures Total New Used Total New Used
Notdistributed asstructures or
equipment
Total expenditures 2003��������������������� 895 646 313 101 280 695 32 406 582 546 550 841 31 705 –2002�� 917 490 325 168 299 941 25 227 592 321 564 218 28 103 –
By industry 2003������������������������������ 895 646 313 101 280 695 32 406 582 546 550 841 31 705 –2002�� 917 490 325 168 299 941 25 227 592 321 564 218 28 103 –
113�115 Forestry, fishing, and agricultural services 2003���������� 1 894 202 177 25 1 692 1 267 425 –2002�� 1 910 184 118 66 1 726 1 319 407 –
21 Mining 2003����������������������������������������� 50 513 36 361 35 641 720 14 152 12 265 1 887 –2002�� 42 467 30 685 29 775 910 11 783 10 262 1 520 –
22 Utilities 2003����������������������������������������� 54 748 24 747 24 487 261 30 001 29 316 685 –2002�� 65 502 29 893 29 008 886 35 609 34 816 793 –
23 Construction 2003������������������������������������ 23 136 1 665 1 413 251 21 471 16 193 5 278 –2002�� 24 773 1 890 1 254 456 23 063 19 257 3 806 –
31�33 Manufacturing 2003���������������������������������� 149 509 30 490 28 668 1 823 119 018 113 156 5 862 –2002�� 157 243 32 643 31 022 1 622 124 600 118 621 5 978 –
321, 327, 33 Durable goods industries 2003����������������������� 81 116 13 535 12 806 730 67 581 63 476 4 105 –2002�� 84 062 15 133 14 396 737 68 929 66 112 2 817 –
31, 322�326 Nondurable goods industries 2003�������������������� 68 393 16 955 15 862 1 093 51 438 49 680 1 757 –2002�� 73 181 17 510 16 626 885 55 671 52 510 3 161 –
42 Wholesale trade 2003��������������������������������� 28 420 6 000 5 061 939 22 420 20 450 1 970 –2002�� 26 789 5 885 5 447 438 20 904 18 562 2 342 –
44�45 Retail trade 2003������������������������������������� 65 548 29 530 27 255 2 275 36 018 31 987 4 031 –2002�� 59 316 26 286 25 051 1 234 33 030 31 157 1 873 –
48�49 Transportation and warehousing 2003������������������� 44 892 12 919 11 692 1 226 31 973 27 361 4 612 –2002�� 47 124 14 498 13 870 628 32 626 29 178 3 447 –
51 Information 2003������������������������������������� 81 658 30 750 30 391 358 50 908 50 463 445 –2002�� 88 156 33 607 33 472 135 54 550 54 247 303 –
52 Finance and insurance 2003��������������������������� 125 109 25 012 17 267 7 745 100 097 99 714 383 –2002�� 128 444 24 308 19 748 4 739 103 956 103 421 535 –
53 Real estate and rental and leasing 2003����������������� 89 392 26 216 17 086 9 130 63 176 61 585 1 591 –2002�� 94 529 35 579 30 227 5 352 58 949 56 847 2 102 –
54 Professional, scientific, and technical services 2003������� 24 877 5 314 4 667 648 19 562 18 848 714 –2002�� 25 864 7 129 6 424 706 18 735 18 021 714 –
55 Management of companies and enterprises 2003��������� 3 397 980 924 56 2 417 2 411 5 –2002�� 3 430 933 913 21 2 497 2 481 16 –
56 Administrative and support and wastemanagement 2003���������������������������������� 15 600 3 907 3 139 768 11 693 10 431 1 262 –
2002�� 14 719 3 276 2 948 328 11 443 10 585 857 –
61 Educational services 2003����������������������������� 16 601 11 918 11 503 415 4 683 4 569 114 –2002�� 19 532 14 655 13 601 1 055 4 876 4 690 186 –
62 Health care and social assistance 2003����������������� 60 776 30 921 28 810 2 111 29 855 29 205 650 –2002�� 59 311 30 291 27 273 3 018 29 021 28 196 825 –
71 Arts, entertainment, and recreation 2003���������������� 11 029 6 800 6 532 268 4 229 4 038 192 –2002�� 13 169 7 758 7 332 425 5 412 5 132 280 –
72 Accommodation and food services 2003����������������� 21 036 10 568 9 417 1 151 10 468 9 684 783 –2002�� 22 409 12 157 10 848 1 309 10 252 9 290 962 –
81 Other services (except public administration) 2003�������� 26 118 18 528 16 297 2 230 7 591 6 779 811 –2002�� 21 269 13 261 11 363 1 899 8 007 6 858 1 149 –
Structure and equipment expenditures servingmultiple industry categories 2003���������������������� 1 394 272 265 7 1 122 1 118 4 –
2002�� 1 532 250 248 2 1 282 1 276 6 –
Note: Detail may not add to total because of rounding.
Annual Capital Expenditures: 2003 5U.S. Census Bureau
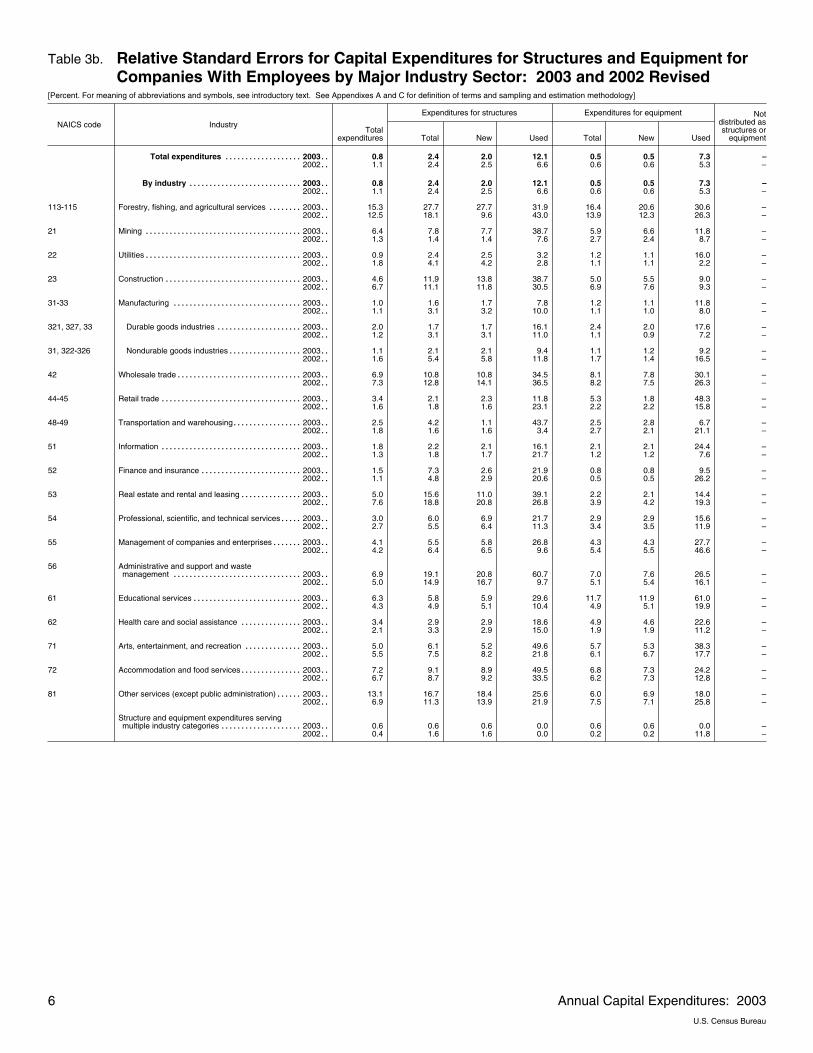
Table 3b. Relative Standard Errors for Capital Expenditures for Structures and Equipment forCompanies With Employees by Major Industry Sector: 2003 and 2002 Revised
[Percent. For meaning of abbreviations and symbols, see introductory text. See Appendixes A and C for definition of terms and sampling and estimation methodology]
NAICS code Industry
Expenditures for structures Expenditures for equipment
Totalexpenditures Total New Used Total New Used
Notdistributed asstructures or
equipment
Total expenditures 2003��������������������� 0.8 2.4 2.0 12.1 0.5 0.5 7.3 –2002�� 1.1 2.4 2.5 6.6 0.6 0.6 5.3 –
By industry 2003������������������������������ 0.8 2.4 2.0 12.1 0.5 0.5 7.3 –2002�� 1.1 2.4 2.5 6.6 0.6 0.6 5.3 –
113�115 Forestry, fishing, and agricultural services 2003���������� 15.3 27.7 27.7 31.9 16.4 20.6 30.6 –2002�� 12.5 18.1 9.6 43.0 13.9 12.3 26.3 –
21 Mining 2003����������������������������������������� 6.4 7.8 7.7 38.7 5.9 6.6 11.8 –2002�� 1.3 1.4 1.4 7.6 2.7 2.4 8.7 –
22 Utilities 2003����������������������������������������� 0.9 2.4 2.5 3.2 1.2 1.1 16.0 –2002�� 1.8 4.1 4.2 2.8 1.1 1.1 2.2 –
23 Construction 2003������������������������������������ 4.6 11.9 13.8 38.7 5.0 5.5 9.0 –2002�� 6.7 11.1 11.8 30.5 6.9 7.6 9.3 –
31�33 Manufacturing 2003���������������������������������� 1.0 1.6 1.7 7.8 1.2 1.1 11.8 –2002�� 1.1 3.1 3.2 10.0 1.1 1.0 8.0 –
321, 327, 33 Durable goods industries 2003����������������������� 2.0 1.7 1.7 16.1 2.4 2.0 17.6 –2002�� 1.2 3.1 3.1 11.0 1.1 0.9 7.2 –
31, 322�326 Nondurable goods industries 2003�������������������� 1.1 2.1 2.1 9.4 1.1 1.2 9.2 –2002�� 1.6 5.4 5.8 11.8 1.7 1.4 16.5 –
42 Wholesale trade 2003��������������������������������� 6.9 10.8 10.8 34.5 8.1 7.8 30.1 –2002�� 7.3 12.8 14.1 36.5 8.2 7.5 26.3 –
44�45 Retail trade 2003������������������������������������� 3.4 2.1 2.3 11.8 5.3 1.8 48.3 –2002�� 1.6 1.8 1.6 23.1 2.2 2.2 15.8 –
48�49 Transportation and warehousing 2003������������������� 2.5 4.2 1.1 43.7 2.5 2.8 6.7 –2002�� 1.8 1.6 1.6 3.4 2.7 2.1 21.1 –
51 Information 2003������������������������������������� 1.8 2.2 2.1 16.1 2.1 2.1 24.4 –2002�� 1.3 1.8 1.7 21.7 1.2 1.2 7.6 –
52 Finance and insurance 2003��������������������������� 1.5 7.3 2.6 21.9 0.8 0.8 9.5 –2002�� 1.1 4.8 2.9 20.6 0.5 0.5 26.2 –
53 Real estate and rental and leasing 2003����������������� 5.0 15.6 11.0 39.1 2.2 2.1 14.4 –2002�� 7.6 18.8 20.8 26.8 3.9 4.2 19.3 –
54 Professional, scientific, and technical services 2003������� 3.0 6.0 6.9 21.7 2.9 2.9 15.6 –2002�� 2.7 5.5 6.4 11.3 3.4 3.5 11.9 –
55 Management of companies and enterprises 2003��������� 4.1 5.5 5.8 26.8 4.3 4.3 27.7 –2002�� 4.2 6.4 6.5 9.6 5.4 5.5 46.6 –
56 Administrative and support and wastemanagement 2003���������������������������������� 6.9 19.1 20.8 60.7 7.0 7.6 26.5 –
2002�� 5.0 14.9 16.7 9.7 5.1 5.4 16.1 –
61 Educational services 2003����������������������������� 6.3 5.8 5.9 29.6 11.7 11.9 61.0 –2002�� 4.3 4.9 5.1 10.4 4.9 5.1 19.9 –
62 Health care and social assistance 2003����������������� 3.4 2.9 2.9 18.6 4.9 4.6 22.6 –2002�� 2.1 3.3 2.9 15.0 1.9 1.9 11.2 –
71 Arts, entertainment, and recreation 2003���������������� 5.0 6.1 5.2 49.6 5.7 5.3 38.3 –2002�� 5.5 7.5 8.2 21.8 6.1 6.7 17.7 –
72 Accommodation and food services 2003����������������� 7.2 9.1 8.9 49.5 6.8 7.3 24.2 –2002�� 6.7 8.7 9.2 33.5 6.2 7.3 12.8 –
81 Other services (except public administration) 2003�������� 13.1 16.7 18.4 25.6 6.0 6.9 18.0 –2002�� 6.9 11.3 13.9 21.9 7.5 7.1 25.8 –
Structure and equipment expenditures servingmultiple industry categories 2003���������������������� 0.6 0.6 0.6 0.0 0.6 0.6 0.0 –
2002�� 0.4 1.6 1.6 0.0 0.2 0.2 11.8 –
6 Annual Capital Expenditures: 2003U.S. Census Bureau

Table 4a. Capital Expenditures for Structures and Equipment for Companies With Employeesby Industry: 2003
[Millions of current dollars. For meaning of abbreviations and symbols, see introductory text. See Appendixes A and C for definition of terms and sampling and estimation methodology]
NAICS code Industry
Expenditures for structures Expenditures for equipment
Totalexpenditures
Total newexpenditures Total New Used Total New Used
Notdistributed asstructures or
equipment
Total expenditures 895 646������������ 831 535 313 101 280 695 32 406 582 546 550 841 31 705 –
By industry 895 646��������������������� 831 535 313 101 280 695 32 406 582 546 550 841 31 705 –
113�115 Forestry, fishing, and agriculturalservices 1 894������������������������� 1 444 202 177 25 1 692 1 267 425 –
113, 114, 115 Forestry, logging, fishing, hunting, trapping,and agricultural support activities 1 894��������� 1 444 202 177 25 1 692 1 267 425 –
21 Mining 50 513��������������������������� 47 905 36 361 35 641 720 14 152 12 265 1 887 –
2111 Oil and gas extraction 41 593�������������������� 40 083 34 597 33 887 710 6 996 6 196 800 –2121 Coal mining 1 872����������������������������� 1 699 771 770 1 1 101 929 171 –2122 Metal ore mining 788������������������������� 765 376 376 – 412 389 23 –2123 Nonmetallic mineral mining and quarrying 1 723��� 1 501 186 181 5 1 536 1 320 217 –213111,213112
Support activities for oil and gas operations 4 389� 3 721 403 399 4 3 985 3 322 663 –
213113,213114,213115
Support activities for solid mineraloperations 149����������������������������� 136 27 27 – 122 109 13 –
22 Utilities 54 748�������������������������� 53 803 24 747 24 487 261 30 001 29 316 685 –
2211 Electric power generation, transmission, anddistribution 47 027����������������������������� 46 145 20 542 20 331 211 26 485 25 814 670 –
2212 Natural gas distribution 5 462������������������� 5 411 2 375 2 330 45 3 087 3 081 6 –2213 Water, sewage, and other systems 2 260��������� 2 247 1 830 1 826 5 429 421 8 –
23 Construction 23 136��������������������� 17 606 1 665 1 413 251 21 471 16 193 5 278 –
233 Building, developing, and generalcontracting 6 031����������������������������� 4 917 1 164 992 172 4 867 3 925 942 –
234 Heavy construction 6 943����������������������� 4 522 201 133 68 6 742 4 389 2 354 –235 Special trade contractors 10 162����������������� 8 167 300 288 12 9 862 7 879 1 983 –
31�33 Manufacturing 149 509�������������������� 141 824 30 490 28 668 1 823 119 018 113 156 5 862 –
321, 327, 33 Durable goods industries 81 116����������� 76 281 13 535 12 806 730 67 581 63 476 4 105 –
321 Wood product manufacturing 2 978�������������� 2 406 474 457 18 2 504 1 949 555 –3271, 3272 Clay and glass products manufacturing 1 791����� 1 713 315 307 8 1 476 1 406 70 –3273, 3274,3279
Cement, concrete, lime, gypsum, and othernonmetallic mineral product manufacturing 2 934� 2 705 512 502 10 2 422 2 203 219 –
3311, 3312 Iron and steel mills, ferroalloy manufacturing,and steel product manufacturing frompurchased steel 2 081������������������������ 1 862 251 233 17 1 830 1 629 201 –
3313, 3314 Nonferrous metals production andprocessing 1 232����������������������������� 1 174 172 170 1 1 061 1 004 57 –
3315 Ferrous and nonferrous foundries 730���������� 670 105 90 16 625 581 44 –332 Fabricated metal product manufacturing 7 353���� 5 676 834 796 38 6 519 4 880 1 638 –3331 Agriculture, construction, and mining
machinery manufacturing 1 385���������������� 1 332 184 156 28 1 201 1 176 25 –3332, 3335,3339
Industrial, metalworking, and generalpurpose machinery manufacturing 2 495�������� 2 330 459 414 45 2 035 1 915 120 –
3333, 3334 Commercial, service industry, temperaturecontrol, and air�flow control machinerymanufacturing 1 132�������������������������� 1 090 216 197 19 916 892 23 –
3336 Engine, turbine, and power transmissionequipment manufacturing 845���������������� 753 96 78 18 748 675 73 –
3341 Computer and peripheral equipmentmanufacturing 2 936�������������������������� 2 919 349 343 6 2 587 2 577 11 –
3342, 3343 Communications, audio and video equipmentmanufacturing 3 055�������������������������� 2 898 541 500 41 2 515 2 398 117 –
3344 Semiconductor and other electroniccomponent manufacturing 8 854��������������� 8 416 1 472 1 297 174 7 382 7 119 264 –
3345 Navigational, measuring, electromedical, andcontrol instruments manufacturing 2 666�������� 2 621 685 676 9 1 981 1 945 36 –
3346 Manufacturing and reproducing magneticand optical media 209����������������������� 204 53 53 – 156 151 5 –
335 Electrical equipment, appliance, andcomponent manufacturing 2 864��������������� 2 811 472 461 11 2 392 2 350 42 –
3361, 3362,3363
Motor vehicle, body, trailer, and partsmanufacturing 23 153�������������������������� 22 890 3 414 3 311 103 19 739 19 579 160 –
3364 Aerospace product and parts manufacturing 2 984� 2 944 712 709 3 2 272 2 235 37 –3365, 3366,3369
Other transportation equipmentmanufacturing 1 640�������������������������� 1 460 455 439 16 1 185 1 021 164 –
337 Furniture and related productmanufacturing 1 635�������������������������� 1 490 391 326 65 1 244 1 164 80 –
3391 Medical equipment and suppliesmanufacturing 4 177�������������������������� 4 066 1 112 1 053 59 3 065 3 013 51 –
3399 Other miscellaneous manufacturing 1 989�������� 1 851 262 238 24 1 727 1 613 114 –
31, 322�326 Nondurable goods industries 68 393�������� 65 542 16 955 15 862 1 093 51 438 49 680 1 757 –
311 Food manufacturing 12 251���������������������� 11 488 2 841 2 541 299 9 410 8 947 463 –3121 Beverage manufacturing 4 970������������������ 4 888 867 832 35 4 102 4 055 47 –3122 Tobacco manufacturing 559������������������� 550 66 (D) (D) 493 (D) (D) –313, 314 Textile mills and textile product mills 1 528�������� 1 400 214 207 7 1 314 1 193 121 –315 Apparel manufacturing 749������������������� 711 201 185 16 548 526 22 –316 Leather and allied product manufacturing 164��� 156 34 (D) (D) 130 (D) (D) –322 Paper manufacturing 5 381��������������������� 5 256 555 544 11 4 827 4 712 115 –323 Printing and related support activities 4 237������� 3 780 525 509 15 3 712 3 271 441 –324 Petroleum and coal products manufacturing 7 095� 6 497 2 997 2 471 526 4 098 4 026 72 –3251, 3252 Basic chemical, resin, synthetic rubber, and
fiber manufacturing 7 823��������������������� 7 672 1 589 1 513 76 6 235 6 159 75 –3253 Pesticide, fertilizer, and other agricultural
chemical manufacturing 780����������������� 761 110 106 4 670 655 15 –3254 Pharmaceutical and medicine
manufacturing 11 823�������������������������� 11 671 5 422 5 364 57 6 401 6 307 94 –3255, 3256,3259
Paint, adhesive, soap, and other chemicalmanufacturing 3 490�������������������������� 3 375 653 637 17 2 837 2 739 99 –
326 Plastics and rubber products manufacturing 7 543� 7 336 883 854 29 6 660 6 482 178 –
See note at end of table.
Annual Capital Expenditures: 2003 7U.S. Census Bureau
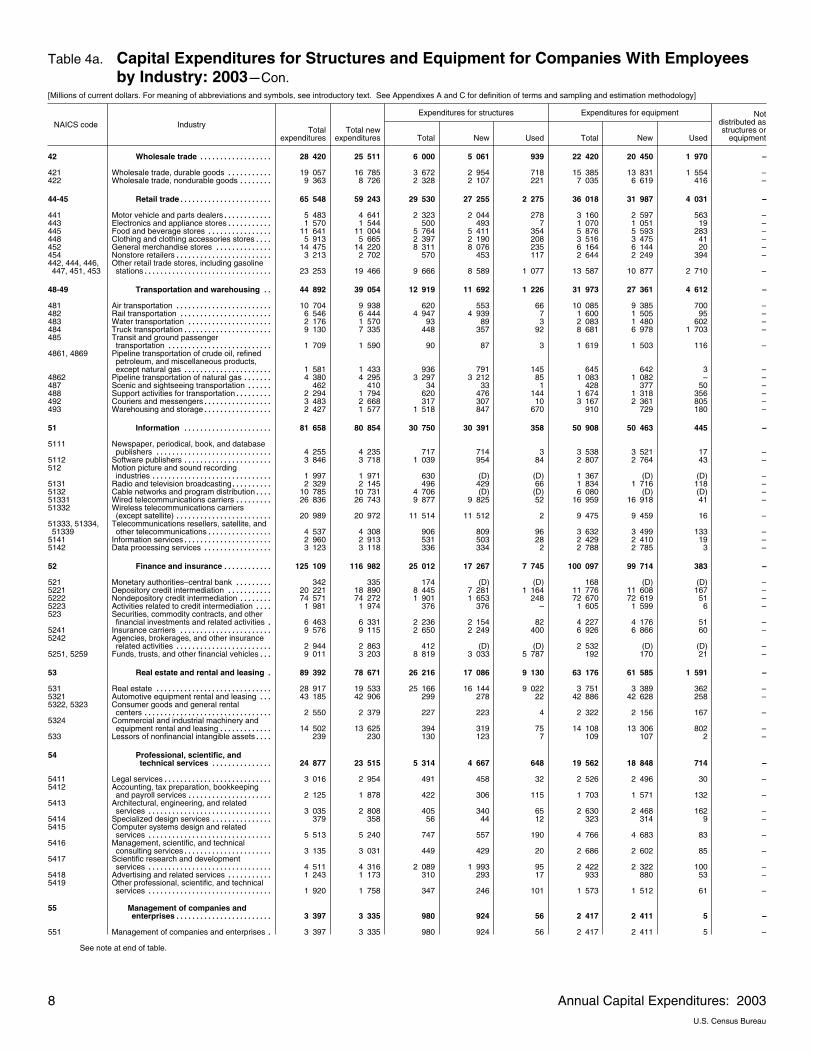
Table 4a. Capital Expenditures for Structures and Equipment for Companies With Employeesby Industry: 2003�Con.
[Millions of current dollars. For meaning of abbreviations and symbols, see introductory text. See Appendixes A and C for definition of terms and sampling and estimation methodology]
NAICS code Industry
Expenditures for structures Expenditures for equipment
Totalexpenditures
Total newexpenditures Total New Used Total New Used
Notdistributed asstructures or
equipment
42 Wholesale trade 28 420������������������ 25 511 6 000 5 061 939 22 420 20 450 1 970 –
421 Wholesale trade, durable goods 19 057����������� 16 785 3 672 2 954 718 15 385 13 831 1 554 –422 Wholesale trade, nondurable goods 9 363�������� 8 726 2 328 2 107 221 7 035 6 619 416 –
44�45 Retail trade 65 548����������������������� 59 243 29 530 27 255 2 275 36 018 31 987 4 031 –
441 Motor vehicle and parts dealers 5 483������������ 4 641 2 323 2 044 278 3 160 2 597 563 –443 Electronics and appliance stores 1 570����������� 1 544 500 493 7 1 070 1 051 19 –445 Food and beverage stores 11 641���������������� 11 004 5 764 5 411 354 5 876 5 593 283 –448 Clothing and clothing accessories stores 5 913���� 5 665 2 397 2 190 208 3 516 3 475 41 –452 General merchandise stores 14 475�������������� 14 220 8 311 8 076 235 6 164 6 144 20 –454 Nonstore retailers 3 213������������������������ 2 702 570 453 117 2 644 2 249 394 –442, 444, 446,447, 451, 453
Other retail trade stores, including gasolinestations 23 253�������������������������������� 19 466 9 666 8 589 1 077 13 587 10 877 2 710 –
48�49 Transportation and warehousing 44 892�� 39 054 12 919 11 692 1 226 31 973 27 361 4 612 –
481 Air transportation 10 704������������������������ 9 938 620 553 66 10 085 9 385 700 –482 Rail transportation 6 546����������������������� 6 444 4 947 4 939 7 1 600 1 505 95 –483 Water transportation 2 176��������������������� 1 570 93 89 3 2 083 1 480 602 –484 Truck transportation 9 130���������������������� 7 335 448 357 92 8 681 6 978 1 703 –485 Transit and ground passenger
transportation 1 709�������������������������� 1 590 90 87 3 1 619 1 503 116 –4861, 4869 Pipeline transportation of crude oil, refined
petroleum, and miscellaneous products,except natural gas 1 581���������������������� 1 433 936 791 145 645 642 3 –
4862 Pipeline transportation of natural gas 4 380������� 4 295 3 297 3 212 85 1 083 1 082 – –487 Scenic and sightseeing transportation 462������ 410 34 33 1 428 377 50 –488 Support activities for transportation 2 294��������� 1 794 620 476 144 1 674 1 318 356 –492 Couriers and messengers 3 483����������������� 2 668 317 307 10 3 167 2 361 805 –493 Warehousing and storage 2 427����������������� 1 577 1 518 847 670 910 729 180 –
51 Information 81 658���������������������� 80 854 30 750 30 391 358 50 908 50 463 445 –
5111 Newspaper, periodical, book, and databasepublishers 4 255����������������������������� 4 235 717 714 3 3 538 3 521 17 –
5112 Software publishers 3 846���������������������� 3 718 1 039 954 84 2 807 2 764 43 –512 Motion picture and sound recording
industries 1 997������������������������������ 1 971 630 (D) (D) 1 367 (D) (D) –5131 Radio and television broadcasting 2 329���������� 2 145 496 429 66 1 834 1 716 118 –5132 Cable networks and program distribution 10 785���� 10 731 4 706 (D) (D) 6 080 (D) (D) –51331 Wired telecommunications carriers 26 836��������� 26 743 9 877 9 825 52 16 959 16 918 41 –51332 Wireless telecommunications carriers
(except satellite) 20 989������������������������ 20 972 11 514 11 512 2 9 475 9 459 16 –51333, 51334,51339
Telecommunications resellers, satellite, andother telecommunications 4 537���������������� 4 308 906 809 96 3 632 3 499 133 –
5141 Information services 2 960���������������������� 2 913 531 503 28 2 429 2 410 19 –5142 Data processing services 3 123����������������� 3 118 336 334 2 2 788 2 785 3 –
52 Finance and insurance 125 109������������ 116 982 25 012 17 267 7 745 100 097 99 714 383 –
521 Monetary authorities–central bank 342��������� 335 174 (D) (D) 168 (D) (D) –5221 Depository credit intermediation 20 221����������� 18 890 8 445 7 281 1 164 11 776 11 608 167 –5222 Nondepository credit intermediation 74 571�������� 74 272 1 901 1 653 248 72 670 72 619 51 –5223 Activities related to credit intermediation 1 981���� 1 974 376 376 – 1 605 1 599 6 –523 Securities, commodity contracts, and other
financial investments and related activities 6 463� 6 331 2 236 2 154 82 4 227 4 176 51 –5241 Insurance carriers 9 576����������������������� 9 115 2 650 2 249 400 6 926 6 866 60 –5242 Agencies, brokerages, and other insurance
related activities 2 944������������������������ 2 863 412 (D) (D) 2 532 (D) (D) –5251, 5259 Funds, trusts, and other financial vehicles 9 011��� 3 203 8 819 3 033 5 787 192 170 21 –
53 Real estate and rental and leasing 89 392� 78 671 26 216 17 086 9 130 63 176 61 585 1 591 –
531 Real estate 28 917����������������������������� 19 533 25 166 16 144 9 022 3 751 3 389 362 –5321 Automotive equipment rental and leasing 43 185��� 42 906 299 278 22 42 886 42 628 258 –5322, 5323 Consumer goods and general rental
centers 2 550�������������������������������� 2 379 227 223 4 2 322 2 156 167 –5324 Commercial and industrial machinery and
equipment rental and leasing 14 502������������� 13 625 394 319 75 14 108 13 306 802 –533 Lessors of nonfinancial intangible assets 239���� 230 130 123 7 109 107 2 –
54 Professional, scientific, andtechnical services 24 877��������������� 23 515 5 314 4 667 648 19 562 18 848 714 –
5411 Legal services 3 016��������������������������� 2 954 491 458 32 2 526 2 496 30 –5412 Accounting, tax preparation, bookkeeping
and payroll services 2 125��������������������� 1 878 422 306 115 1 703 1 571 132 –5413 Architectural, engineering, and related
services 3 035������������������������������� 2 808 405 340 65 2 630 2 468 162 –5414 Specialized design services 379��������������� 358 56 44 12 323 314 9 –5415 Computer systems design and related
services 5 513������������������������������� 5 240 747 557 190 4 766 4 683 83 –5416 Management, scientific, and technical
consulting services 3 135���������������������� 3 031 449 429 20 2 686 2 602 85 –5417 Scientific research and development
services 4 511������������������������������� 4 316 2 089 1 993 95 2 422 2 322 100 –5418 Advertising and related services 1 243����������� 1 173 310 293 17 933 880 53 –5419 Other professional, scientific, and technical
services 1 920������������������������������� 1 758 347 246 101 1 573 1 512 61 –
55 Management of companies andenterprises 3 397������������������������ 3 335 980 924 56 2 417 2 411 5 –
551 Management of companies and enterprises 3 397� 3 335 980 924 56 2 417 2 411 5 –
See note at end of table.
8 Annual Capital Expenditures: 2003U.S. Census Bureau
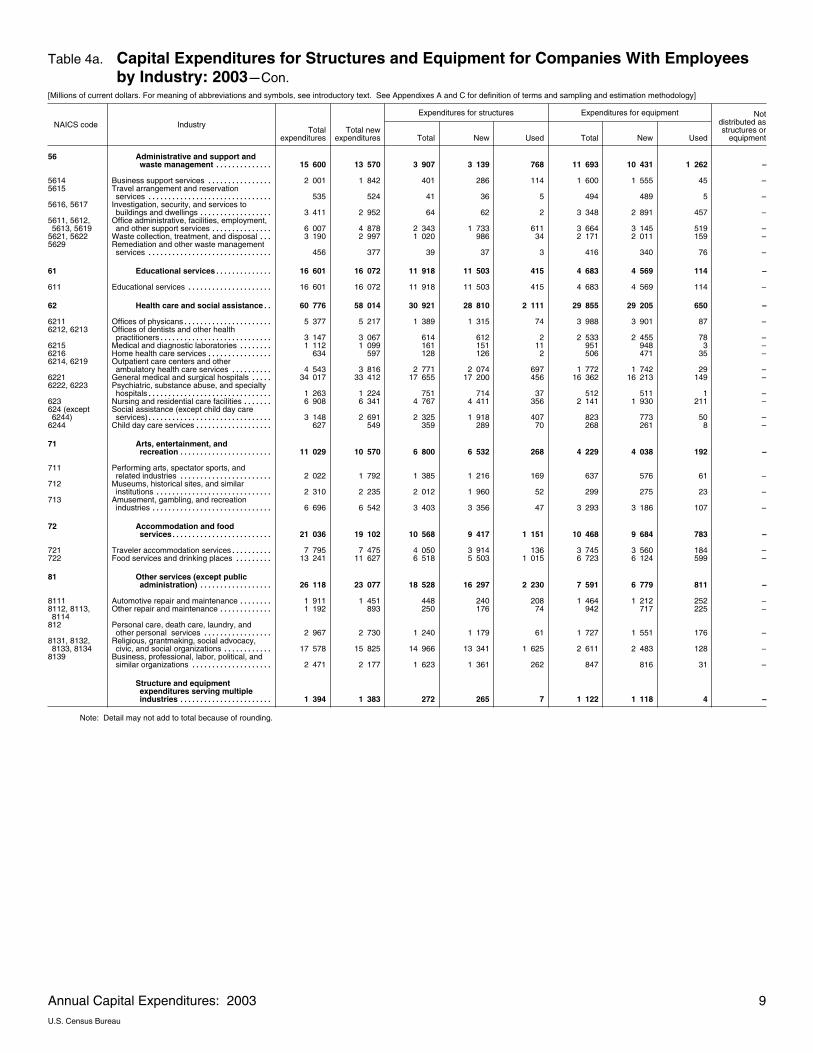
Table 4a. Capital Expenditures for Structures and Equipment for Companies With Employeesby Industry: 2003�Con.
[Millions of current dollars. For meaning of abbreviations and symbols, see introductory text. See Appendixes A and C for definition of terms and sampling and estimation methodology]
NAICS code Industry
Expenditures for structures Expenditures for equipment
Totalexpenditures
Total newexpenditures Total New Used Total New Used
Notdistributed asstructures or
equipment
56 Administrative and support andwaste management 15 600�������������� 13 570 3 907 3 139 768 11 693 10 431 1 262 –
5614 Business support services 2 001���������������� 1 842 401 286 114 1 600 1 555 45 –5615 Travel arrangement and reservation
services 535������������������������������� 524 41 36 5 494 489 5 –5616, 5617 Investigation, security, and services to
buildings and dwellings 3 411������������������ 2 952 64 62 2 3 348 2 891 457 –5611, 5612,5613, 5619
Office administrative, facilities, employment,and other support services 6 007��������������� 4 878 2 343 1 733 611 3 664 3 145 519 –
5621, 5622 Waste collection, treatment, and disposal 3 190��� 2 997 1 020 986 34 2 171 2 011 159 –5629 Remediation and other waste management
services 456������������������������������� 377 39 37 3 416 340 76 –
61 Educational services 16 601�������������� 16 072 11 918 11 503 415 4 683 4 569 114 –
611 Educational services 16 601��������������������� 16 072 11 918 11 503 415 4 683 4 569 114 –
62 Health care and social assistance 60 776�� 58 014 30 921 28 810 2 111 29 855 29 205 650 –
6211 Offices of physicans 5 377���������������������� 5 217 1 389 1 315 74 3 988 3 901 87 –6212, 6213 Offices of dentists and other health
practitioners 3 147���������������������������� 3 067 614 612 2 2 533 2 455 78 –6215 Medical and diagnostic laboratories 1 112�������� 1 099 161 151 11 951 948 3 –6216 Home health care services 634���������������� 597 128 126 2 506 471 35 –6214, 6219 Outpatient care centers and other
ambulatory health care services 4 543���������� 3 816 2 771 2 074 697 1 772 1 742 29 –6221 General medical and surgical hospitals 34 017����� 33 412 17 655 17 200 456 16 362 16 213 149 –6222, 6223 Psychiatric, substance abuse, and specialty
hospitals 1 263������������������������������� 1 224 751 714 37 512 511 1 –623 Nursing and residential care facilities 6 908������� 6 341 4 767 4 411 356 2 141 1 930 211 –624 (except6244)
Social assistance (except child day careservices) 3 148������������������������������� 2 691 2 325 1 918 407 823 773 50 –
6244 Child day care services 627������������������� 549 359 289 70 268 261 8 –
71 Arts, entertainment, andrecreation 11 029����������������������� 10 570 6 800 6 532 268 4 229 4 038 192 –
711 Performing arts, spectator sports, andrelated industries 2 022����������������������� 1 792 1 385 1 216 169 637 576 61 –
712 Museums, historical sites, and similarinstitutions 2 310����������������������������� 2 235 2 012 1 960 52 299 275 23 –
713 Amusement, gambling, and recreationindustries 6 696������������������������������ 6 542 3 403 3 356 47 3 293 3 186 107 –
72 Accommodation and foodservices 21 036������������������������� 19 102 10 568 9 417 1 151 10 468 9 684 783 –
721 Traveler accommodation services 7 795���������� 7 475 4 050 3 914 136 3 745 3 560 184 –722 Food services and drinking places 13 241��������� 11 627 6 518 5 503 1 015 6 723 6 124 599 –
81 Other services (except publicadministration) 26 118������������������ 23 077 18 528 16 297 2 230 7 591 6 779 811 –
8111 Automotive repair and maintenance 1 911�������� 1 451 448 240 208 1 464 1 212 252 –8112, 8113,8114
Other repair and maintenance 1 192������������� 893 250 176 74 942 717 225 –
812 Personal care, death care, laundry, andother personal services 2 967����������������� 2 730 1 240 1 179 61 1 727 1 551 176 –
8131, 8132,8133, 8134
Religious, grantmaking, social advocacy,civic, and social organizations 17 578������������ 15 825 14 966 13 341 1 625 2 611 2 483 128 –
8139 Business, professional, labor, political, andsimilar organizations 2 471�������������������� 2 177 1 623 1 361 262 847 816 31 –
Structure and equipmentexpenditures serving multipleindustries 1 394����������������������� 1 383 272 265 7 1 122 1 118 4 –
Note: Detail may not add to total because of rounding.
Annual Capital Expenditures: 2003 9U.S. Census Bureau

Table 4b. Capital Expenditures for Structures and Equipment for Companies With Employeesby Industry: 2002 Revised
[Millions of current dollars. For meaning of abbreviations and symbols, see introductory text. See Appendixes A and C for definition of terms and sampling and estimation methodology]
NAICS code Industry
Expenditures for structures Expenditures for equipment
Totalexpenditures
Total newexpenditures Total New Used Total New Used
Notdistributed asstructures or
equipment
Total expenditures 917 490������������ 864 159 325 168 299 941 25 227 592 321 564 218 28 103 –
By industry 917 490��������������������� 864 159 325 168 299 941 25 227 592 321 564 218 28 103 –
113�115 Forestry, fishing, and agriculturalservices 1 910������������������������� 1 438 184 118 66 1 726 1 319 407 –
113, 114, 115 Forestry, logging, fishing, hunting, trapping,and agricultural support activities 1 910��������� 1 438 184 118 66 1 726 1 319 407 –
21 Mining 42 467��������������������������� 40 037 30 685 29 775 910 11 783 10 262 1 520 –
2111 Oil and gas extraction 32 976�������������������� 31 886 27 851 27 100 751 5 125 4 786 339 –2121 Coal mining 2 225����������������������������� 2 051 1 119 1 116 4 1 105 935 171 –2122 Metal ore mining 714������������������������� 690 268 253 15 446 437 10 –2123 Nonmetallic mineral mining and quarrying 1 873��� 1 371 322 269 53 1 550 1 102 448 –213111,213112
Support activities for oil and gas operations 4 459� 3 863 1 083 996 87 3 376 2 867 509 –
213113,213114,213115
Support activities for solid mineraloperations 221����������������������������� 176 41 41 1 180 136 44 –
22 Utilities 65 502�������������������������� 63 824 29 893 29 008 886 35 609 34 816 793 –
2211 Electric power generation, transmission, anddistribution 57 995����������������������������� 56 446 25 638 (D) (D) 32 356 (D) (D) –
2212 Natural gas distribution 5 714������������������� 5 665 2 838 2 818 20 2 876 2 847 29 –2213 Water, sewage, and other systems 1 794��������� 1 713 1 417 (D) (D) 377 (D) (D) –
23 Construction 24 773��������������������� 20 510 1 890 1 254 456 23 063 19 257 3 806 –
233 Building, developing, and generalcontracting 5 790����������������������������� 4 769 772 448 144 5 198 4 321 877 –
234 Heavy construction 6 083����������������������� 4 718 339 306 33 5 744 4 412 1 332 –235 Special trade contractors 12 900����������������� 11 024 779 500 279 12 121 10 524 1 597 –
31�33 Manufacturing 157 243�������������������� 149 643 32 643 31 022 1 622 124 600 118 621 5 978 –
321, 327, 33 Durable goods industries 84 062����������� 80 508 15 133 14 396 737 68 929 66 112 2 817 –
321 Wood product manufacturing 2 535�������������� 2 094 505 457 47 2 031 1 637 394 –3271, 3272 Clay and glass products manufacturing 1 706����� 1 614 216 199 17 1 491 1 416 75 –3273, 3274,3279
Cement, concrete, lime, gypsum, and othernonmetallic mineral product manufacturing 4 347� 3 864 1 053 958 95 3 294 2 906 388 –
3311, 3312 Iron and steel mills, ferroalloy manufacturing,and steel product manufacturing frompurchased steel 1 555������������������������ 1 418 120 113 7 1 435 1 305 130 –
3313, 3314 Nonferrous metals production andprocessing 1 235����������������������������� 1 196 175 169 5 1 060 1 026 34 –
3315 Ferrous and nonferrous foundries 728���������� 687 122 120 3 606 568 38 –332 Fabricated metal product manufacturing 6 209���� 5 741 848 782 65 5 361 4 959 403 –3331 Agriculture, construction, and mining
machinery manufacturing 1 611���������������� 1 516 250 222 28 1 360 1 293 67 –3332, 3335,3339
Industrial, metalworking, and generalpurpose machinery manufacturing 3 194�������� 3 021 829 791 38 2 366 2 231 135 –
3333, 3334 Commercial, service industry, temperaturecontrol, and air�flow control machinerymanufacturing 1 328�������������������������� 1 157 297 240 57 1 030 917 114 –
3336 Engine, turbine, and power transmissionequipment manufacturing 1 495���������������� 1 472 197 195 2 1 298 1 277 21 –
3341 Computer and peripheral equipmentmanufacturing 2 316�������������������������� 2 268 376 347 29 1 940 1 922 18 –
3342, 3343 Communications, audio and video equipmentmanufacturing 5 324�������������������������� 5 228 2 175 2 151 24 3 150 3 077 72 –
3344 Semiconductor and other electroniccomponent manufacturing 12 267��������������� 12 003 1 788 1 746 42 10 479 10 257 223 –
3345 Navigational, measuring, electromedical, andcontrol instruments manufacturing 2 955�������� 2 858 686 638 48 2 269 2 220 49 –
3346 Manufacturing and reproducing magneticand optical media 332����������������������� 315 29 29 1 302 286 16 –
335 Electrical equipment, appliance, andcomponent manufacturing 3 613��������������� 3 439 469 442 27 3 144 2 997 147 –
3361, 3362,3363
Motor vehicle, body, trailer, and partsmanufacturing 18 704�������������������������� 18 482 2 199 2 131 69 16 505 16 351 154 –
3364 Aerospace product and parts manufacturing 3 365� 3 290 647 632 15 2 718 2 658 60 –3365, 3366,3369
Other transportation equipmentmanufacturing 1 433�������������������������� 1 344 297 293 4 1 136 1 051 85 –
337 Furniture and related productmanufacturing 1 453�������������������������� 1 370 279 268 12 1 174 1 103 71 –
3391 Medical equipment and suppliesmanufacturing 4 177�������������������������� 4 029 1 161 1 074 86 3 017 2 955 62 –
3399 Other miscellaneous manufacturing 2 178�������� 2 100 415 400 16 1 763 1 700 62 –
31, 322�326 Nondurable goods industries 73 181�������� 69 135 17 510 16 626 885 55 671 52 510 3 161 –
311 Food manufacturing 13 306���������������������� 12 389 2 952 2 748 204 10 354 9 640 714 –3121 Beverage manufacturing 4 723������������������ 4 575 848 776 72 3 875 3 800 75 –3122 Tobacco manufacturing 547������������������� 522 54 (D) (D) 493 (D) (D) –313, 314 Textile mills and textile product mills 2 622�������� 2 204 890 812 78 1 731 1 392 339 –315 Apparel manufacturing 1 148������������������� 994 183 173 10 966 821 144 –316 Leather and allied product manufacturing 168��� 163 39 38 1 129 125 5 –322 Paper manufacturing 6 402��������������������� 6 157 811 775 36 5 591 5 382 209 –323 Printing and related support activities 4 330������� 3 495 428 369 59 3 902 3 126 776 –324 Petroleum and coal products manufacturing 6 422� 6 090 1 990 (D) (D) 4 432 (D) (D) –3251, 3252 Basic chemical, resin, synthetic rubber, and
fiber manufacturing 9 324��������������������� 9 250 2 185 2 170 14 7 139 7 079 60 –3253 Pesticide, fertilizer, and other agricultural
chemical manufacturing 1 428����������������� 1 414 226 223 3 1 201 1 191 10 –3254 Pharmaceutical and medicine
manufacturing 11 219�������������������������� 10 726 4 741 4 642 98 6 478 6 084 394 –3255, 3256,3259
Paint, adhesive, soap, and other chemicalmanufacturing 4 207�������������������������� 4 119 1 418 1 389 28 2 789 2 729 60 –
326 Plastics and rubber products manufacturing 7 335� 7 037 747 672 74 6 588 6 365 223 –
See note at end of table.
10 Annual Capital Expenditures: 2003U.S. Census Bureau

Table 4b. Capital Expenditures for Structures and Equipment for Companies With Employeesby Industry: 2002 Revised�Con.
[Millions of current dollars. For meaning of abbreviations and symbols, see introductory text. See Appendixes A and C for definition of terms and sampling and estimation methodology]
NAICS code Industry
Expenditures for structures Expenditures for equipment
Totalexpenditures
Total newexpenditures Total New Used Total New Used
Notdistributed asstructures or
equipment
42 Wholesale trade 26 789������������������ 24 009 5 885 5 447 438 20 904 18 562 2 342 –
421 Wholesale trade, durable goods 17 427����������� 15 825 3 434 3 100 335 13 993 12 726 1 267 –422 Wholesale trade, nondurable goods 9 363�������� 8 184 2 451 2 347 103 6 912 5 837 1 075 –
44�45 Retail trade 59 316����������������������� 56 208 26 286 25 051 1 234 33 030 31 157 1 873 –
441 Motor vehicle and parts dealers 4 501������������ 4 040 2 010 1 815 195 2 491 2 225 266 –443 Electronics and appliance stores 2 073����������� 1 987 586 530 56 1 487 1 456 30 –445 Food and beverage stores 13 385���������������� 12 706 6 317 6 146 171 7 068 6 560 508 –448 Clothing and clothing accessories stores 5 607���� 5 302 2 167 2 046 121 3 440 3 256 184 –452 General merchandise stores 11 654�������������� 11 632 6 312 6 304 7 5 342 5 328 15 –454 Nonstore retailers 2 371������������������������ 2 193 379 350 29 1 992 1 843 148 –442, 444, 446,447, 451, 453
Other retail trade stores, including gasolinestations 19 725�������������������������������� 18 348 8 515 7 860 655 11 210 10 488 722 –
48�49 Transportation and warehousing 47 124�� 43 049 14 498 13 870 628 32 626 29 178 3 447 –
481 Air transportation 12 299������������������������ 11 538 783 696 88 11 516 10 843 673 –482 Rail transportation 6 402����������������������� 6 275 4 965 (D) (D) 1 436 (D) (D) –483 Water transportation 2 143��������������������� 1 875 159 127 32 1 983 1 748 235 –484 Truck transportation 9 344���������������������� 7 548 459 416 42 8 886 7 132 1 754 –485 Transit and ground passenger
transportation 1 215�������������������������� 1 027 128 128 – 1 087 899 188 –4861, 4869 Pipeline transportation of crude oil, refined
petroleum, and miscellaneous products,except natural gas 2 022���������������������� 1 900 1 448 1 329 118 575 570 4 –
4862 Pipeline transportation of natural gas 5 510������� 5 494 4 215 (D) (D) 1 296 (D) (D) –487 Scenic and sightseeing transportation 101������ 81 24 12 12 77 69 8 –488 Support activities for transportation 2 840��������� 2 627 770 645 125 2 070 1 982 88 –492 Couriers and messengers 3 204����������������� 2 817 379 379 – 2 825 2 438 387 –493 Warehousing and storage 2 043����������������� 1 867 1 168 1 046 122 875 821 55 –
51 Information 88 156���������������������� 87 719 33 607 33 472 135 54 550 54 247 303 –
5111 Newspaper, periodical, book, and databasepublishers 3 693����������������������������� 3 571 946 886 71 2 690 2 685 51 –
5112 Software publishers 3 057���������������������� 3 005 714 692 21 2 344 2 312 32 –512 Motion picture and sound recording
industries 2 350������������������������������ 2 326 819 809 10 1 531 1 517 14 –5131 Radio and television broadcasting 1 887���������� 1 840 425 417 8 1 462 1 422 40 –5132 Cable networks and program distribution 9 849���� 9 784 4 773 4 768 6 5 075 5 016 59 –51331 Wired telecommunications carriers 32 718��������� 32 705 12 061 12 060 1 20 657 20 645 12 –51332 Wireless telecommunications carriers
(except satellite) 23 033������������������������ 22 997 11 433 11 426 7 11 600 11 572 29 –51333, 51334,51339
Telecommunications resellers, satellite, andother telecommunications 5 691���������������� 5 676 1 560 1 556 3 4 131 4 119 12 –
5141 Information services 2 177���������������������� 2 138 208 192 4 2 026 1 946 35 –5142 Data processing services 3 700����������������� 3 677 668 664 3 3 032 3 012 20 –
52 Finance and insurance 128 444������������ 123 169 24 308 19 748 4 739 103 956 103 421 535 –
521 Monetary authorities–central bank 322��������� 322 137 137 – 184 184 – –5221 Depository credit intermediation 19 734����������� 18 943 8 070 7 528 542 11 664 11 415 249 –5222 Nondepository credit intermediation 79 277�������� 79 227 2 422 2 411 11 76 854 76 817 38 –5223 Activities related to credit intermediation 1 503���� 1 431 320 300 20 1 184 1 131 53 –523 Securities, commodity contracts, and other
financial investments and related activities 7 568� 7 499 3 169 3 112 57 4 399 4 388 12 –5241 Insurance carriers 9 984����������������������� 9 647 2 692 2 364 328 7 292 7 283 9 –5242 Agencies, brokerages, and other insurance
related activities 2 392������������������������ 2 230 301 278 24 2 091 1 952 139 –5251, 5259 Funds, trusts, and other financial vehicles 7 664��� 3 870 7 197 3 619 3 757 288 251 36 –
53 Real estate and rental and leasing 94 529� 87 074 35 579 30 227 5 352 58 949 56 847 2 102 –
531 Real estate 41 286����������������������������� 35 405 34 519 29 249 5 270 6 767 6 157 610 –5321 Automotive equipment rental and leasing 36 627��� 35 887 315 271 45 36 311 35 616 695 –5322, 5323 Consumer goods and general rental
centers 2 142�������������������������������� 1 932 235 217 17 1 908 1 715 193 –5324 Commercial and industrial machinery and
equipment rental and leasing 14 194������������� 13 578 359 342 18 13 835 13 236 599 –533 Lessors of nonfinancial intangible assets 280���� 272 151 149 2 129 124 5 –
54 Professional, scientific, andtechnical services 25 864��������������� 24 445 7 129 6 424 706 18 735 18 021 714 –
5411 Legal services 3 531��������������������������� 3 378 1 001 965 36 2 531 2 413 118 –5412 Accounting, tax preparation, bookkeeping
and payroll services 2 039��������������������� 1 929 514 453 61 1 525 1 475 50 –5413 Architectural, engineering, and related
services 3 499������������������������������� 3 334 764 696 67 2 735 2 637 98 –5414 Specialized design services 403��������������� 320 89 56 33 314 264 49 –5415 Computer systems design and related
services 5 999������������������������������� 5 815 1 062 962 100 4 937 4 854 83 –5416 Management, scientific, and technical
consulting services 2 682���������������������� 2 624 473 462 11 2 209 2 162 46 –5417 Scientific research and development
services 4 780������������������������������� 4 305 2 575 2 256 319 2 206 2 050 156 –5418 Advertising and related services 1 415����������� 1 307 496 442 54 920 865 54 –5419 Other professional, scientific, and technical
services 1 515������������������������������� 1 433 156 132 24 1 359 1 301 58 –
55 Management of companies andenterprises 3 430������������������������ 3 393 933 913 21 2 497 2 481 16 –
551 Management of companies and enterprises 3 430� 3 393 933 913 21 2 497 2 481 16 –
See note at end of table.
Annual Capital Expenditures: 2003 11U.S. Census Bureau
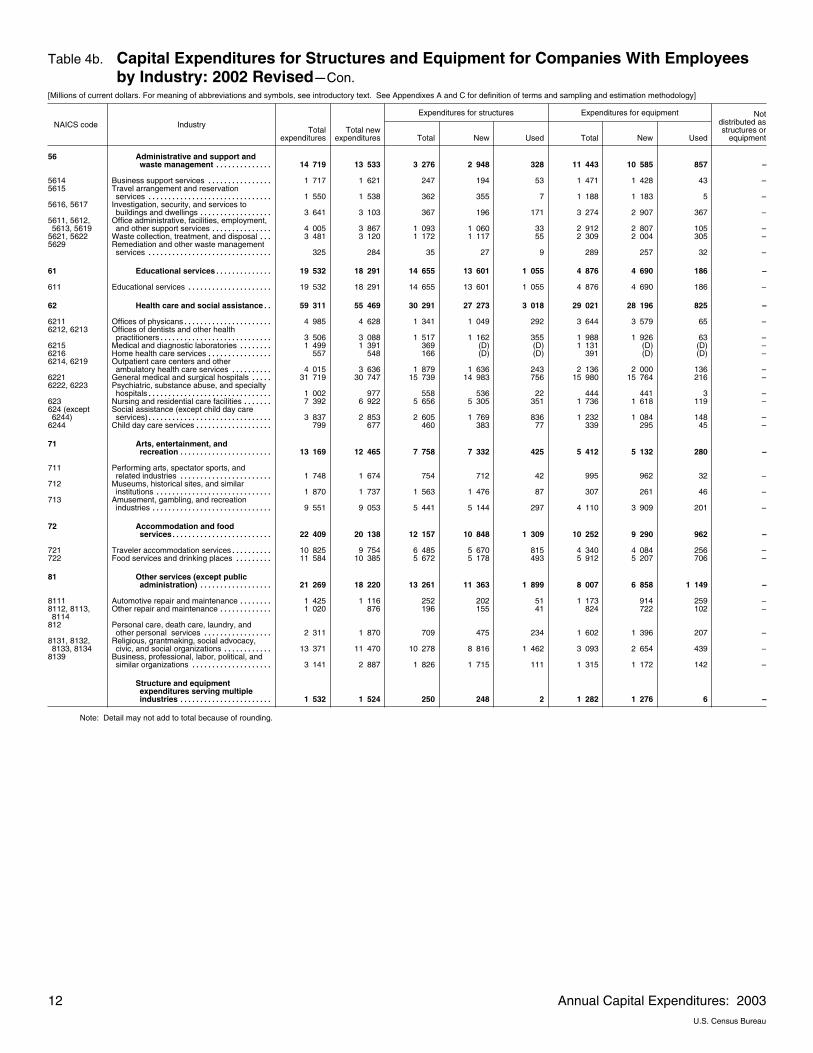
Table 4b. Capital Expenditures for Structures and Equipment for Companies With Employeesby Industry: 2002 Revised�Con.
[Millions of current dollars. For meaning of abbreviations and symbols, see introductory text. See Appendixes A and C for definition of terms and sampling and estimation methodology]
NAICS code Industry
Expenditures for structures Expenditures for equipment
Totalexpenditures
Total newexpenditures Total New Used Total New Used
Notdistributed asstructures or
equipment
56 Administrative and support andwaste management 14 719�������������� 13 533 3 276 2 948 328 11 443 10 585 857 –
5614 Business support services 1 717���������������� 1 621 247 194 53 1 471 1 428 43 –5615 Travel arrangement and reservation
services 1 550������������������������������� 1 538 362 355 7 1 188 1 183 5 –5616, 5617 Investigation, security, and services to
buildings and dwellings 3 641������������������ 3 103 367 196 171 3 274 2 907 367 –5611, 5612,5613, 5619
Office administrative, facilities, employment,and other support services 4 005��������������� 3 867 1 093 1 060 33 2 912 2 807 105 –
5621, 5622 Waste collection, treatment, and disposal 3 481��� 3 120 1 172 1 117 55 2 309 2 004 305 –5629 Remediation and other waste management
services 325������������������������������� 284 35 27 9 289 257 32 –
61 Educational services 19 532�������������� 18 291 14 655 13 601 1 055 4 876 4 690 186 –
611 Educational services 19 532��������������������� 18 291 14 655 13 601 1 055 4 876 4 690 186 –
62 Health care and social assistance 59 311�� 55 469 30 291 27 273 3 018 29 021 28 196 825 –
6211 Offices of physicans 4 985���������������������� 4 628 1 341 1 049 292 3 644 3 579 65 –6212, 6213 Offices of dentists and other health
practitioners 3 506���������������������������� 3 088 1 517 1 162 355 1 988 1 926 63 –6215 Medical and diagnostic laboratories 1 499�������� 1 391 369 (D) (D) 1 131 (D) (D) –6216 Home health care services 557���������������� 548 166 (D) (D) 391 (D) (D) –6214, 6219 Outpatient care centers and other
ambulatory health care services 4 015���������� 3 636 1 879 1 636 243 2 136 2 000 136 –6221 General medical and surgical hospitals 31 719����� 30 747 15 739 14 983 756 15 980 15 764 216 –6222, 6223 Psychiatric, substance abuse, and specialty
hospitals 1 002������������������������������� 977 558 536 22 444 441 3 –623 Nursing and residential care facilities 7 392������� 6 922 5 656 5 305 351 1 736 1 618 119 –624 (except6244)
Social assistance (except child day careservices) 3 837������������������������������� 2 853 2 605 1 769 836 1 232 1 084 148 –
6244 Child day care services 799������������������� 677 460 383 77 339 295 45 –
71 Arts, entertainment, andrecreation 13 169����������������������� 12 465 7 758 7 332 425 5 412 5 132 280 –
711 Performing arts, spectator sports, andrelated industries 1 748����������������������� 1 674 754 712 42 995 962 32 –
712 Museums, historical sites, and similarinstitutions 1 870����������������������������� 1 737 1 563 1 476 87 307 261 46 –
713 Amusement, gambling, and recreationindustries 9 551������������������������������ 9 053 5 441 5 144 297 4 110 3 909 201 –
72 Accommodation and foodservices 22 409������������������������� 20 138 12 157 10 848 1 309 10 252 9 290 962 –
721 Traveler accommodation services 10 825���������� 9 754 6 485 5 670 815 4 340 4 084 256 –722 Food services and drinking places 11 584��������� 10 385 5 672 5 178 493 5 912 5 207 706 –
81 Other services (except publicadministration) 21 269������������������ 18 220 13 261 11 363 1 899 8 007 6 858 1 149 –
8111 Automotive repair and maintenance 1 425�������� 1 116 252 202 51 1 173 914 259 –8112, 8113,8114
Other repair and maintenance 1 020������������� 876 196 155 41 824 722 102 –
812 Personal care, death care, laundry, andother personal services 2 311����������������� 1 870 709 475 234 1 602 1 396 207 –
8131, 8132,8133, 8134
Religious, grantmaking, social advocacy,civic, and social organizations 13 371������������ 11 470 10 278 8 816 1 462 3 093 2 654 439 –
8139 Business, professional, labor, political, andsimilar organizations 3 141�������������������� 2 887 1 826 1 715 111 1 315 1 172 142 –
Structure and equipmentexpenditures serving multipleindustries 1 532����������������������� 1 524 250 248 2 1 282 1 276 6 –
Note: Detail may not add to total because of rounding.
12 Annual Capital Expenditures: 2003U.S. Census Bureau

Table 4c. Relative Standard Errors for Capital Expenditures for Structures and Equipment forCompanies With Employees by Industry: 2003
[Percent. For meaning of abbreviations and symbols, see introductory text. See Appendixes A and C for definition of terms and sampling and estimation methodology]
NAICS code Industry
Expenditures for structures Expenditures for equipment
Totalexpenditures
Total newexpenditures Total New Used Total New Used
Notdistributed asstructures or
equipment
Total expenditures 0.8������������ 0.7 2.4 2.0 12.1 0.5 0.5 7.3 –
By industry 0.8��������������������� 0.7 2.4 2.0 12.1 0.5 0.5 7.3 –
113�115 Forestry, fishing, and agriculturalservices 15.3������������������������� 18.5 27.7 27.7 31.9 16.4 20.6 30.6 –
113, 114, 115 Forestry, logging, fishing, hunting, trapping,and agricultural support activities 15.3��������� 18.5 27.7 27.7 31.9 16.4 20.6 30.6 –
21 Mining 6.4��������������������������� 6.5 7.8 7.7 38.7 5.9 6.6 11.8 –
2111 Oil and gas extraction 7.9�������������������� 7.9 8.2 8.1 39.2 12.6 13.4 21.2 –2121 Coal mining 2.3����������������������������� 1.7 0.5 0.5 0.5 3.8 2.9 16.7 –2122 Metal ore mining 0.7������������������������� 0.7 1.4 1.4 – 0.5 0.1 7.7 –2123 Nonmetallic mineral mining and quarrying 6.6��� 7.5 5.1 5.2 4.9 7.5 8.6 12.7 –213111,213112
Support activities for oil and gas operations 5.8� 5.2 6.3 6.4 3.9 6.5 5.8 23.8 –
213113,213114,213115
Support activities for solid mineraloperations 5.1����������������������������� 4.9 12.7 12.7 0.0 5.4 4.9 14.1 –
22 Utilities 0.9�������������������������� 1.0 2.4 2.5 3.2 1.2 1.1 16.0 –
2211 Electric power generation, transmission, anddistribution 1.2����������������������������� 1.2 3.0 3.0 3.7 1.3 1.2 15.8 –
2212 Natural gas distribution 0.4������������������� 0.4 0.6 0.6 0.0 0.7 0.7 39.2 –2213 Water, sewage, and other systems 7.7��������� 7.8 9.7 9.7 24.6 9.1 8.8 80.4 –
23 Construction 4.6��������������������� 5.0 11.9 13.8 38.7 5.0 5.5 9.0 –
233 Building, developing, and generalcontracting 10.4����������������������������� 12.5 19.0 21.6 52.8 11.3 13.9 17.2 –
234 Heavy construction 7.3����������������������� 8.2 26.0 17.6 73.4 7.7 8.3 14.4 –235 Special trade contractors 11.1����������������� 11.1 26.9 27.6 26.1 10.9 11.0 18.3 –
31�33 Manufacturing 1.0�������������������� 0.9 1.6 1.7 7.8 1.2 1.1 11.8 –
321, 327, 33 Durable goods industries 2.0����������� 1.7 1.7 1.7 16.1 2.4 2.0 17.6 –
321 Wood product manufacturing 10.5�������������� 6.6 19.8 20.6 26.8 11.8 5.7 43.5 –3271, 3272 Clay and glass products manufacturing 5.2����� 5.4 21.0 21.5 6.1 2.5 2.4 11.2 –3273, 3274,3279
Cement, concrete, lime, gypsum, and othernonmetallic mineral product manufacturing 6.3� 6.8 7.8 8.0 0.0 6.7 7.5 22.2 –
3311, 3312 Iron and steel mills, ferroalloy manufacturing,and steel product manufacturing frompurchased steel 9.9������������������������ 10.7 26.8 26.4 77.7 8.4 9.1 6.1 –
3313, 3314 Nonferrous metals production andprocessing 3.6����������������������������� 3.8 6.5 6.5 43.4 3.7 3.9 22.2 –
3315 Ferrous and nonferrous foundries 6.8���������� 6.7 10.8 9.7 43.7 6.7 7.4 14.1 –332 Fabricated metal product manufacturing 11.6���� 6.4 8.8 9.3 18.1 12.4 6.6 44.2 –3331 Agriculture, construction, and mining
machinery manufacturing 2.6���������������� 2.6 3.6 4.3 0.0 3.0 2.9 14.6 –3332, 3335,3339
Industrial, metalworking, and generalpurpose machinery manufacturing 6.3�������� 6.8 7.0 7.7 0.0 6.8 7.4 11.4 –
3333, 3334 Commercial, service industry, temperaturecontrol, and air�flow control machinerymanufacturing 2.4�������������������������� 2.5 4.5 4.0 9.9 2.7 2.9 27.6 –
3336 Engine, turbine, and power transmissionequipment manufacturing 2.7���������������� 2.2 4.5 1.5 23.1 2.9 2.5 9.8 –
3341 Computer and peripheral equipmentmanufacturing 21.4�������������������������� 21.5 1.4 1.4 3.1 24.3 24.4 29.3 –
3342, 3343 Communications, audio and video equipmentmanufacturing 2.1�������������������������� 2.1 0.4 0.4 0.3 2.6 2.5 7.5 –
3344 Semiconductor and other electroniccomponent manufacturing 1.5��������������� 1.1 5.5 0.9 46.3 1.3 1.2 9.3 –
3345 Navigational, measuring, electromedical, andcontrol instruments manufacturing 4.1�������� 3.7 7.4 7.5 5.9 3.3 2.7 40.2 –
3346 Manufacturing and reproducing magneticand optical media 3.8����������������������� 3.6 1.2 1.2 – 4.8 4.5 16.9 –
335 Electrical equipment, appliance, andcomponent manufacturing 1.7��������������� 1.8 1.8 1.9 9.1 2.1 2.1 26.0 –
3361, 3362,3363
Motor vehicle, body, trailer, and partsmanufacturing 3.6�������������������������� 3.6 5.2 5.0 49.4 4.1 4.2 16.3 –
3364 Aerospace product and parts manufacturing 0.9� 0.9 0.7 0.7 11.8 1.1 1.1 8.6 –3365, 3366,3369
Other transportation equipmentmanufacturing 6.7�������������������������� 6.1 8.9 9.1 9.6 8.6 7.3 30.1 –
337 Furniture and related productmanufacturing 12.7�������������������������� 12.3 20.2 21.1 68.3 13.4 13.0 39.1 –
3391 Medical equipment and suppliesmanufacturing 3.2�������������������������� 3.2 6.5 6.7 20.4 2.1 2.1 7.1 –
3399 Other miscellaneous manufacturing 8.5�������� 8.9 10.9 11.2 9.5 9.4 9.9 22.2 –
31, 322�326 Nondurable goods industries 1.1�������� 1.1 2.1 2.1 9.4 1.1 1.2 9.2 –
311 Food manufacturing 2.7���������������������� 2.9 2.5 2.8 7.3 3.5 3.6 3.4 –3121 Beverage manufacturing 2.1������������������ 2.1 3.5 2.9 64.0 2.0 2.1 22.4 –3122 Tobacco manufacturing 1.1������������������� 1.1 0.1 (D) (D) 1.3 (D) (D) –313, 314 Textile mills and textile product mills 5.1�������� 5.7 15.7 16.3 0.0 4.0 4.3 14.1 –315 Apparel manufacturing 5.6������������������� 5.8 2.4 2.6 0.0 7.2 7.3 23.4 –316 Leather and allied product manufacturing 9.0��� 9.6 2.9 (D) (D) 11.4 (D) (D) –322 Paper manufacturing 1.6��������������������� 1.6 2.3 2.3 28.6 1.8 1.7 30.6 –323 Printing and related support activities 10.9������� 10.9 32.5 33.7 50.4 10.9 12.5 36.5 –324 Petroleum and coal products manufacturing 2.0� 1.1 3.4 1.2 14.6 1.4 1.3 23.5 –3251, 3252 Basic chemical, resin, synthetic rubber, and
fiber manufacturing 2.8��������������������� 2.8 1.9 2.0 4.7 3.3 3.3 9.1 –3253 Pesticide, fertilizer, and other agricultural
chemical manufacturing 1.3����������������� 1.1 2.3 2.4 1.0 1.2 1.1 17.5 –3254 Pharmaceutical and medicine
manufacturing 3.5�������������������������� 3.0 3.6 3.7 0.1 3.6 2.9 70.8 –3255, 3256,3259
Paint, adhesive, soap, and other chemicalmanufacturing 2.5�������������������������� 2.7 3.7 3.7 0.0 2.8 3.2 37.4 –
326 Plastics and rubber products manufacturing 3.6� 3.8 7.4 7.6 4.9 4.0 4.2 18.1 –
42 Wholesale trade 6.9������������������ 6.3 10.8 10.8 34.5 8.1 7.8 30.1 –
421 Wholesale trade, durable goods 8.6����������� 8.0 11.0 9.6 45.7 9.7 9.4 38.6 –422 Wholesale trade, nondurable goods 9.4�������� 9.7 21.4 23.7 15.6 10.7 10.8 20.8 –
Annual Capital Expenditures: 2003 13U.S. Census Bureau
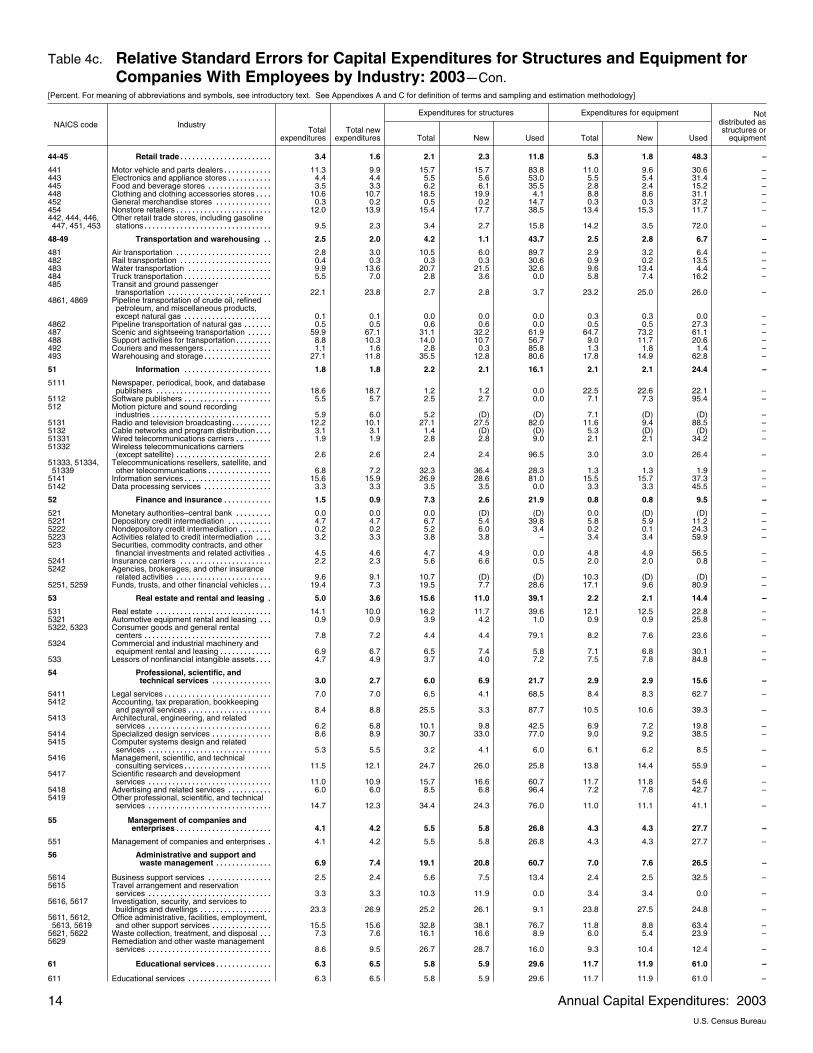
Table 4c. Relative Standard Errors for Capital Expenditures for Structures and Equipment forCompanies With Employees by Industry: 2003�Con.
[Percent. For meaning of abbreviations and symbols, see introductory text. See Appendixes A and C for definition of terms and sampling and estimation methodology]
NAICS code Industry
Expenditures for structures Expenditures for equipment
Totalexpenditures
Total newexpenditures Total New Used Total New Used
Notdistributed asstructures or
equipment
44�45 Retail trade 3.4����������������������� 1.6 2.1 2.3 11.8 5.3 1.8 48.3 –
441 Motor vehicle and parts dealers 11.3������������ 9.9 15.7 15.7 83.8 11.0 9.6 30.6 –443 Electronics and appliance stores 4.4����������� 4.4 5.5 5.6 53.0 5.5 5.4 31.4 –445 Food and beverage stores 3.5���������������� 3.3 6.2 6.1 35.5 2.8 2.4 15.2 –448 Clothing and clothing accessories stores 10.6���� 10.7 18.5 19.9 4.1 8.8 8.6 31.1 –452 General merchandise stores 0.3�������������� 0.2 0.5 0.2 14.7 0.3 0.3 37.2 –454 Nonstore retailers 12.0������������������������ 13.9 15.4 17.7 38.5 13.4 15.3 11.7 –442, 444, 446,447, 451, 453
Other retail trade stores, including gasolinestations 9.5�������������������������������� 2.3 3.4 2.7 15.8 14.2 3.5 72.0 –
48�49 Transportation and warehousing 2.5�� 2.0 4.2 1.1 43.7 2.5 2.8 6.7 –
481 Air transportation 2.8������������������������ 3.0 10.5 6.0 89.7 2.9 3.2 6.4 –482 Rail transportation 0.4����������������������� 0.3 0.3 0.3 30.6 0.9 0.2 13.5 –483 Water transportation 9.9��������������������� 13.6 20.7 21.5 32.6 9.6 13.4 4.4 –484 Truck transportation 5.5���������������������� 7.0 2.8 3.6 0.0 5.8 7.4 16.2 –485 Transit and ground passenger
transportation 22.1�������������������������� 23.8 2.7 2.8 3.7 23.2 25.0 26.0 –4861, 4869 Pipeline transportation of crude oil, refined
petroleum, and miscellaneous products,except natural gas 0.1���������������������� 0.1 0.0 0.0 0.0 0.3 0.3 0.0 –
4862 Pipeline transportation of natural gas 0.5������� 0.5 0.6 0.6 0.0 0.5 0.5 27.3 –487 Scenic and sightseeing transportation 59.9������ 67.1 31.1 32.2 61.9 64.7 73.2 61.1 –488 Support activities for transportation 8.8��������� 10.3 14.0 10.7 56.7 9.0 11.7 20.6 –492 Couriers and messengers 1.1����������������� 1.6 2.8 0.3 85.8 1.3 1.8 1.4 –493 Warehousing and storage 27.1����������������� 11.8 35.5 12.8 80.6 17.8 14.9 62.8 –
51 Information 1.8���������������������� 1.8 2.2 2.1 16.1 2.1 2.1 24.4 –
5111 Newspaper, periodical, book, and databasepublishers 18.6����������������������������� 18.7 1.2 1.2 0.0 22.5 22.6 22.1 –
5112 Software publishers 5.5���������������������� 5.7 2.5 2.7 0.0 7.1 7.3 95.4 –512 Motion picture and sound recording
industries 5.9������������������������������ 6.0 5.2 (D) (D) 7.1 (D) (D) –5131 Radio and television broadcasting 12.2���������� 10.1 27.1 27.5 82.0 11.6 9.4 88.5 –5132 Cable networks and program distribution 3.1���� 3.1 1.4 (D) (D) 5.3 (D) (D) –51331 Wired telecommunications carriers 1.9��������� 1.9 2.8 2.8 9.0 2.1 2.1 34.2 –51332 Wireless telecommunications carriers
(except satellite) 2.6������������������������ 2.6 2.4 2.4 96.5 3.0 3.0 26.4 –51333, 51334,51339
Telecommunications resellers, satellite, andother telecommunications 6.8���������������� 7.2 32.3 36.4 28.3 1.3 1.3 1.9 –
5141 Information services 15.6���������������������� 15.9 26.9 28.6 81.0 15.5 15.7 37.3 –5142 Data processing services 3.3����������������� 3.3 3.5 3.5 0.0 3.3 3.3 45.5 –
52 Finance and insurance 1.5������������ 0.9 7.3 2.6 21.9 0.8 0.8 9.5 –
521 Monetary authorities–central bank 0.0��������� 0.0 0.0 (D) (D) 0.0 (D) (D) –5221 Depository credit intermediation 4.7����������� 4.7 6.7 5.4 39.8 5.8 5.9 11.2 –5222 Nondepository credit intermediation 0.2�������� 0.2 5.2 6.0 3.4 0.2 0.1 24.3 –5223 Activities related to credit intermediation 3.2���� 3.3 3.8 3.8 – 3.4 3.4 59.9 –523 Securities, commodity contracts, and other
financial investments and related activities 4.5� 4.6 4.7 4.9 0.0 4.8 4.9 56.5 –5241 Insurance carriers 2.2����������������������� 2.3 5.6 6.6 0.5 2.0 2.0 0.8 –5242 Agencies, brokerages, and other insurance
related activities 9.6������������������������ 9.1 10.7 (D) (D) 10.3 (D) (D) –5251, 5259 Funds, trusts, and other financial vehicles 19.4��� 7.3 19.5 7.7 28.6 17.1 9.6 80.9 –
53 Real estate and rental and leasing 5.0� 3.6 15.6 11.0 39.1 2.2 2.1 14.4 –
531 Real estate 14.1����������������������������� 10.0 16.2 11.7 39.6 12.1 12.5 22.8 –5321 Automotive equipment rental and leasing 0.9��� 0.9 3.9 4.2 1.0 0.9 0.9 25.8 –5322, 5323 Consumer goods and general rental
centers 7.8�������������������������������� 7.2 4.4 4.4 79.1 8.2 7.6 23.6 –5324 Commercial and industrial machinery and
equipment rental and leasing 6.9������������� 6.7 6.5 7.4 5.8 7.1 6.8 30.1 –533 Lessors of nonfinancial intangible assets 4.7���� 4.9 3.7 4.0 7.2 7.5 7.8 84.8 –
54 Professional, scientific, andtechnical services 3.0��������������� 2.7 6.0 6.9 21.7 2.9 2.9 15.6 –
5411 Legal services 7.0��������������������������� 7.0 6.5 4.1 68.5 8.4 8.3 62.7 –5412 Accounting, tax preparation, bookkeeping
and payroll services 8.4��������������������� 8.8 25.5 3.3 87.7 10.5 10.6 39.3 –5413 Architectural, engineering, and related
services 6.2������������������������������� 6.8 10.1 9.8 42.5 6.9 7.2 19.8 –5414 Specialized design services 8.6��������������� 8.9 30.7 33.0 77.0 9.0 9.2 38.5 –5415 Computer systems design and related
services 5.3������������������������������� 5.5 3.2 4.1 6.0 6.1 6.2 8.5 –5416 Management, scientific, and technical
consulting services 11.5���������������������� 12.1 24.7 26.0 25.8 13.8 14.4 55.9 –5417 Scientific research and development
services 11.0������������������������������� 10.9 15.7 16.6 60.7 11.7 11.8 54.6 –5418 Advertising and related services 6.0����������� 6.0 8.5 6.8 96.4 7.2 7.8 42.7 –5419 Other professional, scientific, and technical
services 14.7������������������������������� 12.3 34.4 24.3 76.0 11.0 11.1 41.1 –
55 Management of companies andenterprises 4.1������������������������ 4.2 5.5 5.8 26.8 4.3 4.3 27.7 –
551 Management of companies and enterprises 4.1� 4.2 5.5 5.8 26.8 4.3 4.3 27.7 –
56 Administrative and support andwaste management 6.9�������������� 7.4 19.1 20.8 60.7 7.0 7.6 26.5 –
5614 Business support services 2.5���������������� 2.4 5.6 7.5 13.4 2.4 2.5 32.5 –5615 Travel arrangement and reservation
services 3.3������������������������������� 3.3 10.3 11.9 0.0 3.4 3.4 0.0 –5616, 5617 Investigation, security, and services to
buildings and dwellings 23.3������������������ 26.9 25.2 26.1 9.1 23.8 27.5 24.8 –5611, 5612,5613, 5619
Office administrative, facilities, employment,and other support services 15.5��������������� 15.6 32.8 38.1 76.7 11.8 8.8 63.4 –
5621, 5622 Waste collection, treatment, and disposal 7.3��� 7.6 16.1 16.6 8.9 6.0 5.4 23.9 –5629 Remediation and other waste management
services 8.6������������������������������� 9.5 26.7 28.7 16.0 9.3 10.4 12.4 –
61 Educational services 6.3�������������� 6.5 5.8 5.9 29.6 11.7 11.9 61.0 –
611 Educational services 6.3��������������������� 6.5 5.8 5.9 29.6 11.7 11.9 61.0 –
14 Annual Capital Expenditures: 2003U.S. Census Bureau

Table 4c. Relative Standard Errors for Capital Expenditures for Structures and Equipment forCompanies With Employees by Industry: 2003�Con.
[Percent. For meaning of abbreviations and symbols, see introductory text. See Appendixes A and C for definition of terms and sampling and estimation methodology]
NAICS code Industry
Expenditures for structures Expenditures for equipment
Totalexpenditures
Total newexpenditures Total New Used Total New Used
Notdistributed asstructures or
equipment
62 Health care and social assistance 3.4�� 3.4 2.9 2.9 18.6 4.9 4.6 22.6 –
6211 Offices of physicans 15.0���������������������� 15.4 9.2 9.9 58.6 19.1 19.4 44.6 –6212, 6213 Offices of dentists and other health
practitioners 15.7���������������������������� 15.5 39.2 39.3 18.0 12.4 12.0 50.4 –6215 Medical and diagnostic laboratories 10.8�������� 10.9 10.4 11.1 1.6 11.9 11.9 31.7 –6216 Home health care services 15.0���������������� 14.1 21.4 21.7 1.8 15.4 14.7 43.0 –6214, 6219 Outpatient care centers and other
ambulatory health care services 17.9���������� 15.0 26.1 23.1 51.6 9.6 9.8 48.5 –6221 General medical and surgical hospitals 0.8����� 0.8 1.1 1.1 1.8 0.9 0.8 4.9 –6222, 6223 Psychiatric, substance abuse, and specialty
hospitals 1.6������������������������������� 1.6 2.0 2.1 0.1 2.9 2.9 34.9 –623 Nursing and residential care facilities 10.6������� 9.5 7.9 7.8 17.5 22.1 17.7 67.0 –624 (except6244)
Social assistance (except child day careservices) 13.0������������������������������� 15.1 17.1 20.2 22.9 6.9 7.5 19.7 –
6244 Child day care services 9.5������������������� 9.5 13.9 13.4 54.9 13.0 13.0 24.9 –
71 Arts, entertainment, andrecreation 5.0����������������������� 4.5 6.1 5.2 49.6 5.7 5.3 38.3 –
711 Performing arts, spectator sports, andrelated industries 9.4����������������������� 5.8 12.3 7.8 79.7 10.3 8.7 63.0 –
712 Museums, historical sites, and similarinstitutions 5.7����������������������������� 6.0 6.4 6.5 31.5 8.9 9.5 53.6 –
713 Amusement, gambling, and recreationindustries 6.3������������������������������ 6.4 8.6 8.8 4.6 6.5 6.4 33.6 –
72 Accommodation and foodservices 7.2������������������������� 7.3 9.1 8.9 49.5 6.8 7.3 24.2 –
721 Traveler accommodation services 7.5���������� 7.7 12.5 13.0 0.0 7.9 8.3 21.0 –722 Food services and drinking places 11.2��������� 11.8 13.0 12.6 56.1 10.5 11.4 31.9 –
81 Other services (except publicadministration) 13.1������������������ 14.3 16.7 18.4 25.6 6.0 6.9 18.0 –
8111 Automotive repair and maintenance 13.4�������� 11.3 33.0 24.3 66.6 13.7 12.2 52.5 –8112, 8113,8114
Other repair and maintenance 17.0������������� 11.1 28.6 17.6 86.6 14.5 11.0 44.3 –
812 Personal care, death care, laundry, andother personal services 19.6����������������� 21.3 38.2 39.8 32.7 8.2 9.0 33.2 –
8131, 8132,8133, 8134
Religious, grantmaking, social advocacy,civic, and social organizations 18.5������������ 19.3 20.0 21.2 29.1 16.5 16.8 26.7 –
8139 Business, professional, labor, political, andsimilar organizations 17.6�������������������� 15.4 26.1 24.4 78.6 7.0 7.3 28.5 –
Structure and equipmentexpenditures serving multipleindustries 0.6����������������������� 0.6 0.6 0.6 0.0 0.6 0.6 0.0 –
Annual Capital Expenditures: 2003 15U.S. Census Bureau
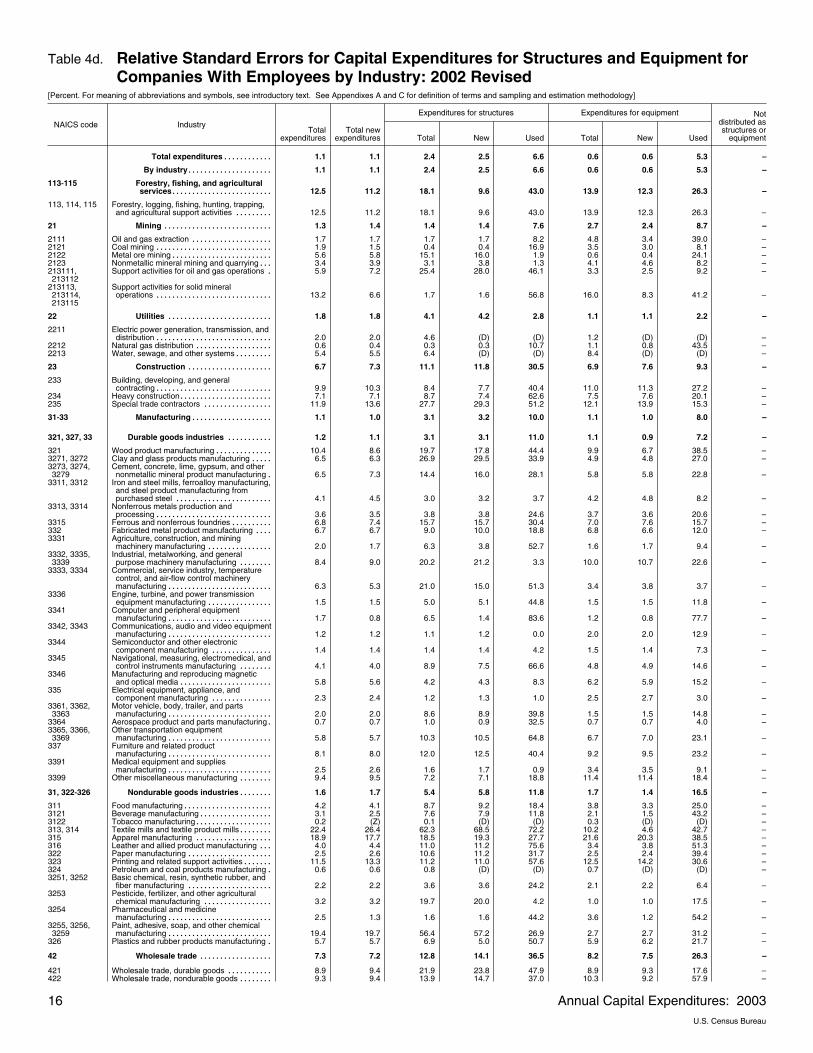
Table 4d. Relative Standard Errors for Capital Expenditures for Structures and Equipment forCompanies With Employees by Industry: 2002 Revised
[Percent. For meaning of abbreviations and symbols, see introductory text. See Appendixes A and C for definition of terms and sampling and estimation methodology]
NAICS code Industry
Expenditures for structures Expenditures for equipment
Totalexpenditures
Total newexpenditures Total New Used Total New Used
Notdistributed asstructures or
equipment
Total expenditures 1.1������������ 1.1 2.4 2.5 6.6 0.6 0.6 5.3 –
By industry 1.1��������������������� 1.1 2.4 2.5 6.6 0.6 0.6 5.3 –
113�115 Forestry, fishing, and agriculturalservices 12.5������������������������� 11.2 18.1 9.6 43.0 13.9 12.3 26.3 –
113, 114, 115 Forestry, logging, fishing, hunting, trapping,and agricultural support activities 12.5��������� 11.2 18.1 9.6 43.0 13.9 12.3 26.3 –
21 Mining 1.3��������������������������� 1.4 1.4 1.4 7.6 2.7 2.4 8.7 –
2111 Oil and gas extraction 1.7�������������������� 1.7 1.7 1.7 8.2 4.8 3.4 39.0 –2121 Coal mining 1.9����������������������������� 1.5 0.4 0.4 16.9 3.5 3.0 8.1 –2122 Metal ore mining 5.6������������������������� 5.8 15.1 16.0 1.9 0.6 0.4 24.1 –2123 Nonmetallic mineral mining and quarrying 3.4��� 3.9 3.1 3.8 1.3 4.1 4.6 8.2 –213111,213112
Support activities for oil and gas operations 5.9� 7.2 25.4 28.0 46.1 3.3 2.5 9.2 –
213113,213114,213115
Support activities for solid mineraloperations 13.2����������������������������� 6.6 1.7 1.6 56.8 16.0 8.3 41.2 –
22 Utilities 1.8�������������������������� 1.8 4.1 4.2 2.8 1.1 1.1 2.2 –
2211 Electric power generation, transmission, anddistribution 2.0����������������������������� 2.0 4.6 (D) (D) 1.2 (D) (D) –
2212 Natural gas distribution 0.6������������������� 0.4 0.3 0.3 10.7 1.1 0.8 43.5 –2213 Water, sewage, and other systems 5.4��������� 5.5 6.4 (D) (D) 8.4 (D) (D) –
23 Construction 6.7��������������������� 7.3 11.1 11.8 30.5 6.9 7.6 9.3 –
233 Building, developing, and generalcontracting 9.9����������������������������� 10.3 8.4 7.7 40.4 11.0 11.3 27.2 –
234 Heavy construction 7.1����������������������� 7.1 8.7 7.4 62.6 7.5 7.6 20.1 –235 Special trade contractors 11.9����������������� 13.6 27.7 29.3 51.2 12.1 13.9 15.3 –
31�33 Manufacturing 1.1�������������������� 1.0 3.1 3.2 10.0 1.1 1.0 8.0 –
321, 327, 33 Durable goods industries 1.2����������� 1.1 3.1 3.1 11.0 1.1 0.9 7.2 –
321 Wood product manufacturing 10.4�������������� 8.6 19.7 17.8 44.4 9.9 6.7 38.5 –3271, 3272 Clay and glass products manufacturing 6.5����� 6.3 26.9 29.5 33.9 4.9 4.8 27.0 –3273, 3274,3279
Cement, concrete, lime, gypsum, and othernonmetallic mineral product manufacturing 6.5� 7.3 14.4 16.0 28.1 5.8 5.8 22.8 –
3311, 3312 Iron and steel mills, ferroalloy manufacturing,and steel product manufacturing frompurchased steel 4.1������������������������ 4.5 3.0 3.2 3.7 4.2 4.8 8.2 –
3313, 3314 Nonferrous metals production andprocessing 3.6����������������������������� 3.5 3.8 3.8 24.6 3.7 3.6 20.6 –
3315 Ferrous and nonferrous foundries 6.8���������� 7.4 15.7 15.7 30.4 7.0 7.6 15.7 –332 Fabricated metal product manufacturing 6.7���� 6.7 9.0 10.0 18.8 6.8 6.6 12.0 –3331 Agriculture, construction, and mining
machinery manufacturing 2.0���������������� 1.7 6.3 3.8 52.7 1.6 1.7 9.4 –3332, 3335,3339
Industrial, metalworking, and generalpurpose machinery manufacturing 8.4�������� 9.0 20.2 21.2 3.3 10.0 10.7 22.6 –
3333, 3334 Commercial, service industry, temperaturecontrol, and air�flow control machinerymanufacturing 6.3�������������������������� 5.3 21.0 15.0 51.3 3.4 3.8 3.7 –
3336 Engine, turbine, and power transmissionequipment manufacturing 1.5���������������� 1.5 5.0 5.1 44.8 1.5 1.5 11.8 –
3341 Computer and peripheral equipmentmanufacturing 1.7�������������������������� 0.8 6.5 1.4 83.6 1.2 0.8 77.7 –
3342, 3343 Communications, audio and video equipmentmanufacturing 1.2�������������������������� 1.2 1.1 1.2 0.0 2.0 2.0 12.9 –
3344 Semiconductor and other electroniccomponent manufacturing 1.4��������������� 1.4 1.4 1.4 4.2 1.5 1.4 7.3 –
3345 Navigational, measuring, electromedical, andcontrol instruments manufacturing 4.1�������� 4.0 8.9 7.5 66.6 4.8 4.9 14.6 –
3346 Manufacturing and reproducing magneticand optical media 5.8����������������������� 5.6 4.2 4.3 8.3 6.2 5.9 15.2 –
335 Electrical equipment, appliance, andcomponent manufacturing 2.3��������������� 2.4 1.2 1.3 1.0 2.5 2.7 3.0 –
3361, 3362,3363
Motor vehicle, body, trailer, and partsmanufacturing 2.0�������������������������� 2.0 8.6 8.9 39.8 1.5 1.5 14.8 –
3364 Aerospace product and parts manufacturing 0.7� 0.7 1.0 0.9 32.5 0.7 0.7 4.0 –3365, 3366,3369
Other transportation equipmentmanufacturing 5.8�������������������������� 5.7 10.3 10.5 64.8 6.7 7.0 23.1 –
337 Furniture and related productmanufacturing 8.1�������������������������� 8.0 12.0 12.5 40.4 9.2 9.5 23.2 –
3391 Medical equipment and suppliesmanufacturing 2.5�������������������������� 2.6 1.6 1.7 0.9 3.4 3.5 9.1 –
3399 Other miscellaneous manufacturing 9.4�������� 9.5 7.2 7.1 18.8 11.4 11.4 18.4 –
31, 322�326 Nondurable goods industries 1.6�������� 1.7 5.4 5.8 11.8 1.7 1.4 16.5 –
311 Food manufacturing 4.2���������������������� 4.1 8.7 9.2 18.4 3.8 3.3 25.0 –3121 Beverage manufacturing 3.1������������������ 2.5 7.6 7.9 11.8 2.1 1.5 43.2 –3122 Tobacco manufacturing 0.2������������������� (Z) 0.1 (D) (D) 0.3 (D) (D) –313, 314 Textile mills and textile product mills 22.4�������� 26.4 62.3 68.5 72.2 10.2 4.6 42.7 –315 Apparel manufacturing 18.9������������������� 17.7 18.5 19.3 27.7 21.6 20.3 38.5 –316 Leather and allied product manufacturing 4.0��� 4.4 11.0 11.2 75.6 3.4 3.8 51.3 –322 Paper manufacturing 2.5��������������������� 2.6 10.6 11.2 31.7 2.5 2.4 39.4 –323 Printing and related support activities 11.5������� 13.3 11.2 11.0 57.6 12.5 14.2 30.6 –324 Petroleum and coal products manufacturing 0.6� 0.6 0.8 (D) (D) 0.7 (D) (D) –3251, 3252 Basic chemical, resin, synthetic rubber, and
fiber manufacturing 2.2��������������������� 2.2 3.6 3.6 24.2 2.1 2.2 6.4 –3253 Pesticide, fertilizer, and other agricultural
chemical manufacturing 3.2����������������� 3.2 19.7 20.0 4.2 1.0 1.0 17.5 –3254 Pharmaceutical and medicine
manufacturing 2.5�������������������������� 1.3 1.6 1.6 44.2 3.6 1.2 54.2 –3255, 3256,3259
Paint, adhesive, soap, and other chemicalmanufacturing 19.4�������������������������� 19.7 56.4 57.2 26.9 2.7 2.7 31.2 –
326 Plastics and rubber products manufacturing 5.7� 5.7 6.9 5.0 50.7 5.9 6.2 21.7 –
42 Wholesale trade 7.3������������������ 7.2 12.8 14.1 36.5 8.2 7.5 26.3 –
421 Wholesale trade, durable goods 8.9����������� 9.4 21.9 23.8 47.9 8.9 9.3 17.6 –422 Wholesale trade, nondurable goods 9.3�������� 9.4 13.9 14.7 37.0 10.3 9.2 57.9 –
16 Annual Capital Expenditures: 2003U.S. Census Bureau
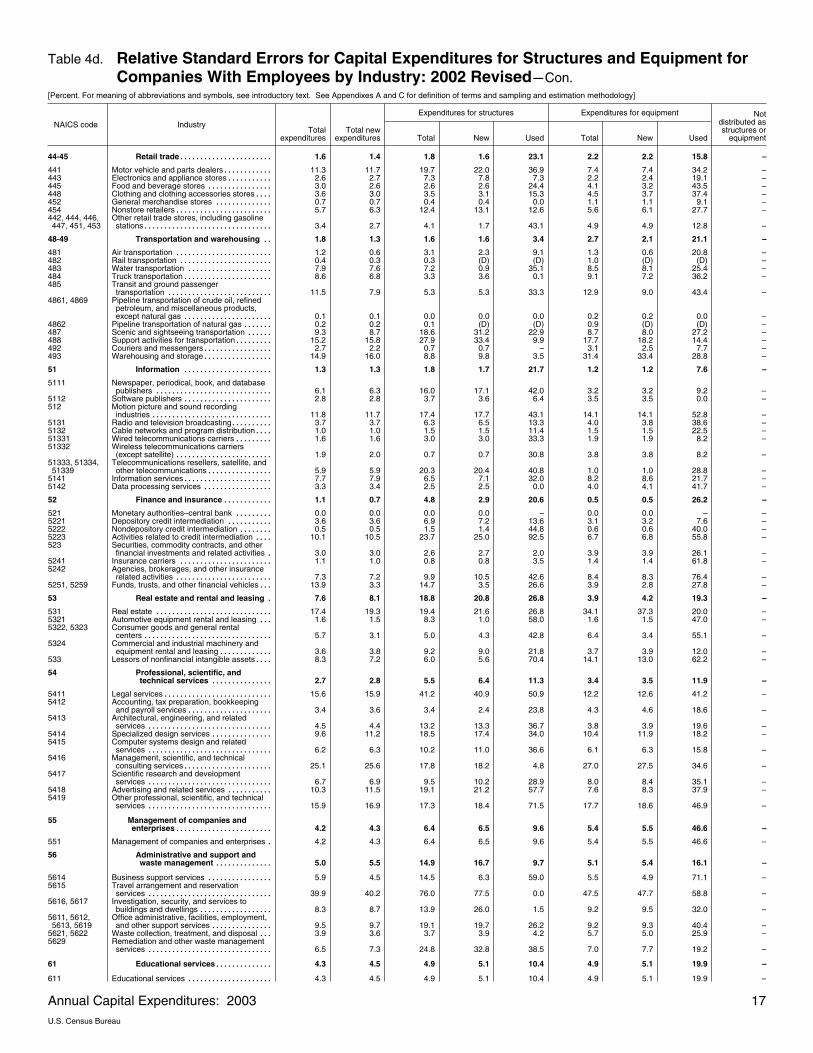
Table 4d. Relative Standard Errors for Capital Expenditures for Structures and Equipment forCompanies With Employees by Industry: 2002 Revised�Con.
[Percent. For meaning of abbreviations and symbols, see introductory text. See Appendixes A and C for definition of terms and sampling and estimation methodology]
NAICS code Industry
Expenditures for structures Expenditures for equipment
Totalexpenditures
Total newexpenditures Total New Used Total New Used
Notdistributed asstructures or
equipment
44�45 Retail trade 1.6����������������������� 1.4 1.8 1.6 23.1 2.2 2.2 15.8 –
441 Motor vehicle and parts dealers 11.3������������ 11.7 19.7 22.0 36.9 7.4 7.4 34.2 –443 Electronics and appliance stores 2.6����������� 2.7 7.3 7.8 7.3 2.2 2.4 19.1 –445 Food and beverage stores 3.0���������������� 2.6 2.6 2.6 24.4 4.1 3.2 43.5 –448 Clothing and clothing accessories stores 3.6���� 3.0 3.5 3.1 15.3 4.5 3.7 37.4 –452 General merchandise stores 0.7�������������� 0.7 0.4 0.4 0.0 1.1 1.1 9.1 –454 Nonstore retailers 5.7������������������������ 6.3 12.4 13.1 12.6 5.6 6.1 27.7 –442, 444, 446,447, 451, 453
Other retail trade stores, including gasolinestations 3.4�������������������������������� 2.7 4.1 1.7 43.1 4.9 4.9 12.8 –
48�49 Transportation and warehousing 1.8�� 1.3 1.6 1.6 3.4 2.7 2.1 21.1 –
481 Air transportation 1.2������������������������ 0.6 3.1 2.3 9.1 1.3 0.6 20.8 –482 Rail transportation 0.4����������������������� 0.3 0.3 (D) (D) 1.0 (D) (D) –483 Water transportation 7.9��������������������� 7.6 7.2 0.9 35.1 8.5 8.1 25.4 –484 Truck transportation 8.6���������������������� 6.8 3.3 3.6 0.1 9.1 7.2 36.2 –485 Transit and ground passenger
transportation 11.5�������������������������� 7.9 5.3 5.3 33.3 12.9 9.0 43.4 –4861, 4869 Pipeline transportation of crude oil, refined
petroleum, and miscellaneous products,except natural gas 0.1���������������������� 0.1 0.0 0.0 0.0 0.2 0.2 0.0 –
4862 Pipeline transportation of natural gas 0.2������� 0.2 0.1 (D) (D) 0.9 (D) (D) –487 Scenic and sightseeing transportation 9.3������ 8.7 18.6 31.2 22.9 8.7 8.0 27.2 –488 Support activities for transportation 15.2��������� 15.8 27.9 33.4 9.9 17.7 18.2 14.4 –492 Couriers and messengers 2.7����������������� 2.2 0.7 0.7 – 3.1 2.5 7.7 –493 Warehousing and storage 14.9����������������� 16.0 8.8 9.8 3.5 31.4 33.4 28.8 –
51 Information 1.3���������������������� 1.3 1.8 1.7 21.7 1.2 1.2 7.6 –
5111 Newspaper, periodical, book, and databasepublishers 6.1����������������������������� 6.3 16.0 17.1 42.0 3.2 3.2 9.2 –
5112 Software publishers 2.8���������������������� 2.8 3.7 3.6 6.4 3.5 3.5 0.0 –512 Motion picture and sound recording
industries 11.8������������������������������ 11.7 17.4 17.7 43.1 14.1 14.1 52.8 –5131 Radio and television broadcasting 3.7���������� 3.7 6.3 6.5 13.3 4.0 3.8 38.6 –5132 Cable networks and program distribution 1.0���� 1.0 1.5 1.5 11.4 1.5 1.5 22.5 –51331 Wired telecommunications carriers 1.6��������� 1.6 3.0 3.0 33.3 1.9 1.9 8.2 –51332 Wireless telecommunications carriers
(except satellite) 1.9������������������������ 2.0 0.7 0.7 30.8 3.8 3.8 8.2 –51333, 51334,51339
Telecommunications resellers, satellite, andother telecommunications 5.9���������������� 5.9 20.3 20.4 40.8 1.0 1.0 28.8 –
5141 Information services 7.7���������������������� 7.9 6.5 7.1 32.0 8.2 8.6 21.7 –5142 Data processing services 3.3����������������� 3.4 2.5 2.5 0.0 4.0 4.1 41.7 –
52 Finance and insurance 1.1������������ 0.7 4.8 2.9 20.6 0.5 0.5 26.2 –
521 Monetary authorities–central bank 0.0��������� 0.0 0.0 0.0 – 0.0 0.0 – –5221 Depository credit intermediation 3.6����������� 3.6 6.9 7.2 13.6 3.1 3.2 7.6 –5222 Nondepository credit intermediation 0.5�������� 0.5 1.5 1.4 44.8 0.6 0.6 40.0 –5223 Activities related to credit intermediation 10.1���� 10.5 23.7 25.0 92.5 6.7 6.8 55.8 –523 Securities, commodity contracts, and other
financial investments and related activities 3.0� 3.0 2.6 2.7 2.0 3.9 3.9 26.1 –5241 Insurance carriers 1.1����������������������� 1.0 0.8 0.8 3.5 1.4 1.4 61.8 –5242 Agencies, brokerages, and other insurance
related activities 7.3������������������������ 7.2 9.9 10.5 42.6 8.4 8.3 76.4 –5251, 5259 Funds, trusts, and other financial vehicles 13.9��� 3.3 14.7 3.5 26.6 3.9 2.8 27.8 –
53 Real estate and rental and leasing 7.6� 8.1 18.8 20.8 26.8 3.9 4.2 19.3 –
531 Real estate 17.4����������������������������� 19.3 19.4 21.6 26.8 34.1 37.3 20.0 –5321 Automotive equipment rental and leasing 1.6��� 1.5 8.3 1.0 58.0 1.6 1.5 47.0 –5322, 5323 Consumer goods and general rental
centers 5.7�������������������������������� 3.1 5.0 4.3 42.8 6.4 3.4 55.1 –5324 Commercial and industrial machinery and
equipment rental and leasing 3.6������������� 3.8 9.2 9.0 21.8 3.7 3.9 12.0 –533 Lessors of nonfinancial intangible assets 8.3���� 7.2 6.0 5.6 70.4 14.1 13.0 62.2 –
54 Professional, scientific, andtechnical services 2.7��������������� 2.8 5.5 6.4 11.3 3.4 3.5 11.9 –
5411 Legal services 15.6��������������������������� 15.9 41.2 40.9 50.9 12.2 12.6 41.2 –5412 Accounting, tax preparation, bookkeeping
and payroll services 3.4��������������������� 3.6 3.4 2.4 23.8 4.3 4.6 18.6 –5413 Architectural, engineering, and related
services 4.5������������������������������� 4.4 13.2 13.3 36.7 3.8 3.9 19.6 –5414 Specialized design services 9.6��������������� 11.2 18.5 17.4 34.0 10.4 11.9 18.2 –5415 Computer systems design and related
services 6.2������������������������������� 6.3 10.2 11.0 36.6 6.1 6.3 15.8 –5416 Management, scientific, and technical
consulting services 25.1���������������������� 25.6 17.8 18.2 4.8 27.0 27.5 34.6 –5417 Scientific research and development
services 6.7������������������������������� 6.9 9.5 10.2 28.9 8.0 8.4 35.1 –5418 Advertising and related services 10.3����������� 11.5 19.1 21.2 57.7 7.6 8.3 37.9 –5419 Other professional, scientific, and technical
services 15.9������������������������������� 16.9 17.3 18.4 71.5 17.7 18.6 46.9 –
55 Management of companies andenterprises 4.2������������������������ 4.3 6.4 6.5 9.6 5.4 5.5 46.6 –
551 Management of companies and enterprises 4.2� 4.3 6.4 6.5 9.6 5.4 5.5 46.6 –
56 Administrative and support andwaste management 5.0�������������� 5.5 14.9 16.7 9.7 5.1 5.4 16.1 –
5614 Business support services 5.9���������������� 4.5 14.5 6.3 59.0 5.5 4.9 71.1 –5615 Travel arrangement and reservation
services 39.9������������������������������� 40.2 76.0 77.5 0.0 47.5 47.7 58.8 –5616, 5617 Investigation, security, and services to
buildings and dwellings 8.3������������������ 8.7 13.9 26.0 1.5 9.2 9.5 32.0 –5611, 5612,5613, 5619
Office administrative, facilities, employment,and other support services 9.5��������������� 9.7 19.1 19.7 26.2 9.2 9.3 40.4 –
5621, 5622 Waste collection, treatment, and disposal 3.9��� 3.6 3.7 3.9 4.2 5.7 5.0 25.9 –5629 Remediation and other waste management
services 6.5������������������������������� 7.3 24.8 32.8 38.5 7.0 7.7 19.2 –
61 Educational services 4.3�������������� 4.5 4.9 5.1 10.4 4.9 5.1 19.9 –
611 Educational services 4.3��������������������� 4.5 4.9 5.1 10.4 4.9 5.1 19.9 –
Annual Capital Expenditures: 2003 17U.S. Census Bureau
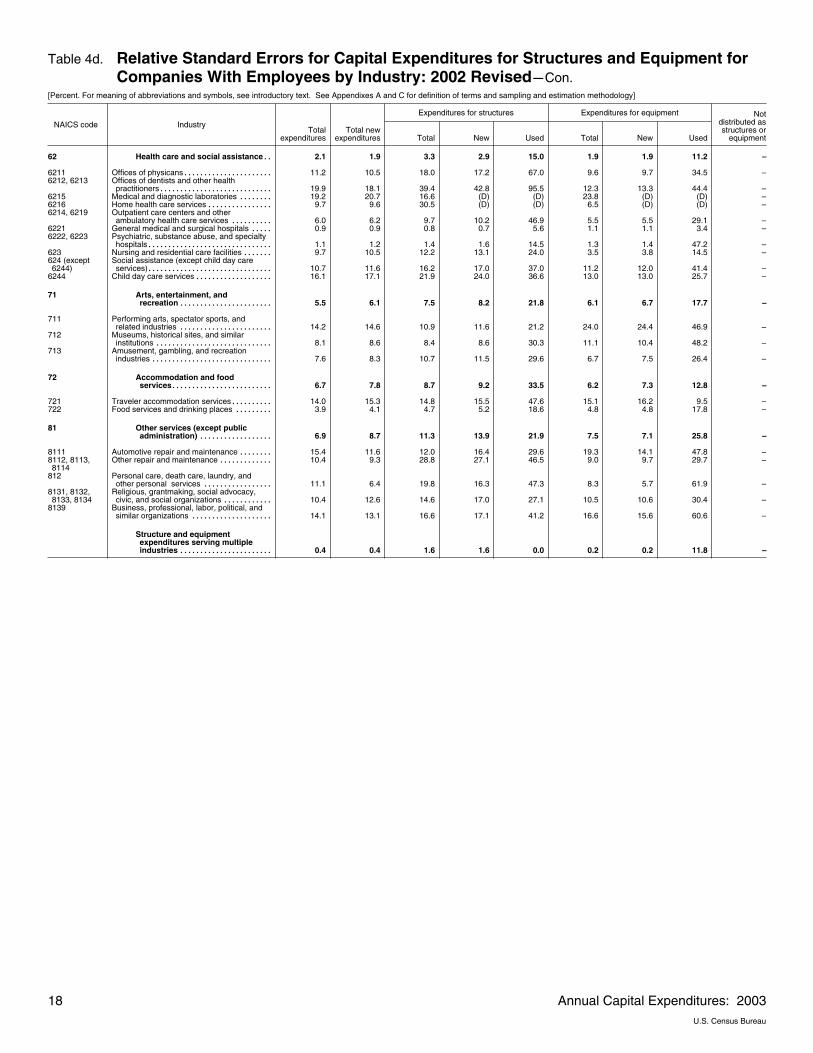
Table 4d. Relative Standard Errors for Capital Expenditures for Structures and Equipment forCompanies With Employees by Industry: 2002 Revised�Con.
[Percent. For meaning of abbreviations and symbols, see introductory text. See Appendixes A and C for definition of terms and sampling and estimation methodology]
NAICS code Industry
Expenditures for structures Expenditures for equipment
Totalexpenditures
Total newexpenditures Total New Used Total New Used
Notdistributed asstructures or
equipment
62 Health care and social assistance 2.1�� 1.9 3.3 2.9 15.0 1.9 1.9 11.2 –
6211 Offices of physicans 11.2���������������������� 10.5 18.0 17.2 67.0 9.6 9.7 34.5 –6212, 6213 Offices of dentists and other health
practitioners 19.9���������������������������� 18.1 39.4 42.8 95.5 12.3 13.3 44.4 –6215 Medical and diagnostic laboratories 19.2�������� 20.7 16.6 (D) (D) 23.8 (D) (D) –6216 Home health care services 9.7���������������� 9.6 30.5 (D) (D) 6.5 (D) (D) –6214, 6219 Outpatient care centers and other
ambulatory health care services 6.0���������� 6.2 9.7 10.2 46.9 5.5 5.5 29.1 –6221 General medical and surgical hospitals 0.9����� 0.9 0.8 0.7 5.6 1.1 1.1 3.4 –6222, 6223 Psychiatric, substance abuse, and specialty
hospitals 1.1������������������������������� 1.2 1.4 1.6 14.5 1.3 1.4 47.2 –623 Nursing and residential care facilities 9.7������� 10.5 12.2 13.1 24.0 3.5 3.8 14.5 –624 (except6244)
Social assistance (except child day careservices) 10.7������������������������������� 11.6 16.2 17.0 37.0 11.2 12.0 41.4 –
6244 Child day care services 16.1������������������� 17.1 21.9 24.0 36.6 13.0 13.0 25.7 –
71 Arts, entertainment, andrecreation 5.5����������������������� 6.1 7.5 8.2 21.8 6.1 6.7 17.7 –
711 Performing arts, spectator sports, andrelated industries 14.2����������������������� 14.6 10.9 11.6 21.2 24.0 24.4 46.9 –
712 Museums, historical sites, and similarinstitutions 8.1����������������������������� 8.6 8.4 8.6 30.3 11.1 10.4 48.2 –
713 Amusement, gambling, and recreationindustries 7.6������������������������������ 8.3 10.7 11.5 29.6 6.7 7.5 26.4 –
72 Accommodation and foodservices 6.7������������������������� 7.8 8.7 9.2 33.5 6.2 7.3 12.8 –
721 Traveler accommodation services 14.0���������� 15.3 14.8 15.5 47.6 15.1 16.2 9.5 –722 Food services and drinking places 3.9��������� 4.1 4.7 5.2 18.6 4.8 4.8 17.8 –
81 Other services (except publicadministration) 6.9������������������ 8.7 11.3 13.9 21.9 7.5 7.1 25.8 –
8111 Automotive repair and maintenance 15.4�������� 11.6 12.0 16.4 29.6 19.3 14.1 47.8 –8112, 8113,8114
Other repair and maintenance 10.4������������� 9.3 28.8 27.1 46.5 9.0 9.7 29.7 –
812 Personal care, death care, laundry, andother personal services 11.1����������������� 6.4 19.8 16.3 47.3 8.3 5.7 61.9 –
8131, 8132,8133, 8134
Religious, grantmaking, social advocacy,civic, and social organizations 10.4������������ 12.6 14.6 17.0 27.1 10.5 10.6 30.4 –
8139 Business, professional, labor, political, andsimilar organizations 14.1�������������������� 13.1 16.6 17.1 41.2 16.6 15.6 60.6 –
Structure and equipmentexpenditures serving multipleindustries 0.4����������������������� 0.4 1.6 1.6 0.0 0.2 0.2 11.8 –
18 Annual Capital Expenditures: 2003U.S. Census Bureau

Table 5a. Capital Expenditures for Structures by Major Industry Group and Major StructureType for Companies With Employees: 2003
[Millions of current dollars. For meaning of abbreviations and symbols, see introductory text. See Appendixes A and C for definition of terms and sampling and estimation methodology]
IndustryTotal
structuresResidential
buildings
Hotelsand
motelsIndustrialbuildings Offices
Commercialbuildings
Healthcare
Amusementand
recreationalfacilities
Transportationfacilities
Utilitystructures
andfacilities
Otherbuildings
Mineshafts
andwells
Othernonbuilding
structures
Total structures 313 101����� (X) (X) (X) (X) (X) (X) (X) (X) (X) (X) (X) (X)
Structures by industryand type 303 148������������� 10 136 4 603 31 904 47 992 57 627 23 049 5 566 6 674 53 268 26 654 33 187 2 488
New 271 028���������������������������� 7 384 4 450 29 072 38 926 44 526 22 227 5 218 6 475 52 702 25 101 32 510 2 437Used 32 120���������������������������� 2 752 153 2 832 9 065 13 101 822 349 199 566 1 553 678 50Not distributed by industry and type 9 953� (X) (X) (X) (X) (X) (X) (X) (X) (X) (X) (X) (X)
Forestry, fishing, andagricultural services 202������ 4 – 64 30 76 1 – – 1 – – 26
New 177���������������������������� (D) – 49 (D) 72 1 – – – – – 22Used 25���������������������������� (D) – 15 (D) 3 – – – – – – 5
Mining 36 361�������������������� (D) – 433 104 44 – (D) 4 2 588 – 33 112 68
New 35 641���������������������������� (D) – 388 101 43 – (D) 4 2 580 – 32 451 68Used 720���������������������������� 1 – 45 4 1 – (Z) – 8 – 661 –
Utilities 24 747������������������� 5 – 7 141 184 – – – (D) – 9 (D)
New 24 487���������������������������� – – 7 128 184 – – (D) 23 939 – 9 (D)Used 261���������������������������� 5 – – 13 – – – (D) 243 – – –
Construction 1 651�������������� 329 11 145 876 149 – 46 2 56 2 – 36
New 1 400���������������������������� 201 11 140 777 140 – 46 2 56 2 – 26Used 251���������������������������� 128 – 4 99 9 – – – – – – 11
Manufacturing 29 160������������ 67 (D) 24 293 2 048 1 218 – (D) 81 1 144 10 30 264
New 27 357���������������������������� 64 (D) 22 853 1 873 1 079 – (D) 76 1 125 10 14 259Used 1 803���������������������������� 3 – 1 441 175 139 – – 5 19 – 17 6
Durable goodsindustries 12 252�������������� 33 (D) 10 266 1 080 625 – 1 35 47 6 (D) 151
New 11 542���������������������������� 31 (D) 9 694 1 025 550 – 1 30 (D) 6 (D) (D)Used 711���������������������������� 2 – 572 55 74 – – 5 (D) – – (D)
Nondurable goodsindustries 16 908�������������� (D) – 14 028 968 593 – – 47 1 097 (D) 25 113
New 15 815���������������������������� (D) – 13 159 848 529 – – 47 1 079 (D) 9 109Used 1 093���������������������������� 1 – 869 119 64 – – – 18 – 17 4
Wholesale trade 5 995����������� 27 – 2 079 1 720 2 060 – – 5 69 – – 36
New 5 056���������������������������� 6 – 1 648 1 702 1 591 – – 5 – – 35Used 939���������������������������� 21 – 430 18 468 – – 1 – – – 1
Retail trade 28 331��������������� 39 – 99 524 27 227 – – 28 129 16 – 269
New 26 057���������������������������� 13 – 70 435 25 112 – – 28 114 16 – 268Used 2 275���������������������������� 26 – 29 89 2 115 – – – 16 – – 1
Transportation andwarehousing 12 917������������� 1 (D) 11 344 1 940 – 11 6 240 4 143 – (D) 189
New 11 690���������������������������� 1 (D) 10 318 1 159 – 11 6 051 3 915 – (D) 189Used 1 226���������������������������� 1 – 2 26 781 – – 189 228 – – –
Information 24 891��������������� 1 (D) 290 4 428 167 – 257 (D) 19 593 143 – 12
New 24 532���������������������������� 1 (D) 283 4 095 159 – 254 (D) 19 585 143 – 12Used 358���������������������������� – – 7 333 8 – 3 – 7 – – –
Finance and insurance 24 923����� 1 033 (D) 1 154 17 518 4 960 6 17 6 (D) (D) – 79
New 17 267���������������������������� (D) (D) 374 14 052 1 999 6 17 6 (D) (D) – 79Used 7 657���������������������������� (D) (D) 780 3 466 2 961 – – – – – – –
Real estate and rental andleasing 26 145������������������ 6 353 (D) 1 432 6 972 10 655 40 382 (D) 102 2 – 57
New 17 086���������������������������� 5 237 (D) 1 420 4 310 5 544 40 254 (D) 102 2 – (D)Used 9 059���������������������������� 1 116 (D) 13 2 662 5 111 – 128 (D) – – – (D)
Professional, scientific, andtechnical services 5 296�������� 10 – 1 631 3 039 149 32 5 1 44 262 – 123
New 4 649���������������������������� 9 – 1 595 2 448 148 31 5 1 44 245 – 123Used 648���������������������������� 1 – 36 591 2 2 – – – 17 – –
Management of companiesand enterprises 980���������� 6 – 6 755 65 51 1 2 75 5 – 15
New 924���������������������������� 5 – 6 716 65 51 1 2 60 5 – 14Used 56���������������������������� 1 – – 38 – – – – 15 – – 1
Administrative and supportand waste management 3 864��� 573 – 45 1 762 134 78 6 1 1 005 113 – 147
New 3 097���������������������������� 37 – 42 1 643 128 56 6 1 977 60 – 147Used 768���������������������������� 536 – 3 119 5 22 – – 29 53 – –
Educational services 11 916������ 70 34 – 551 21 2 145 1 51 10 757 – 284
New 11 501���������������������������� 34 34 – 526 19 2 145 1 51 10 406 – 284Used 415���������������������������� 36 – – 26 2 – – – – 352 – –
Health care and socialassistance 29 659��������������� 650 12 2 5 316 148 22 814 97 3 5 473 – 141
New 27 655���������������������������� 453 12 2 4 432 92 22 015 96 3 4 405 – 140Used 2 004���������������������������� 197 – – 884 55 799 1 – – 68 – 1
Arts, entertainment, andrecreation 6 781��������������� 18 504 1 (D) 346 – 4 043 40 (D) 1 536 – (D)
New 6 515���������������������������� (D) 504 1 (D) 340 – 3 839 (D) (D) 1 491 – (D)Used 266���������������������������� (D) – – (D) 5 – 205 (D) – 45 – (D)
Annual Capital Expenditures: 2003 19U.S. Census Bureau
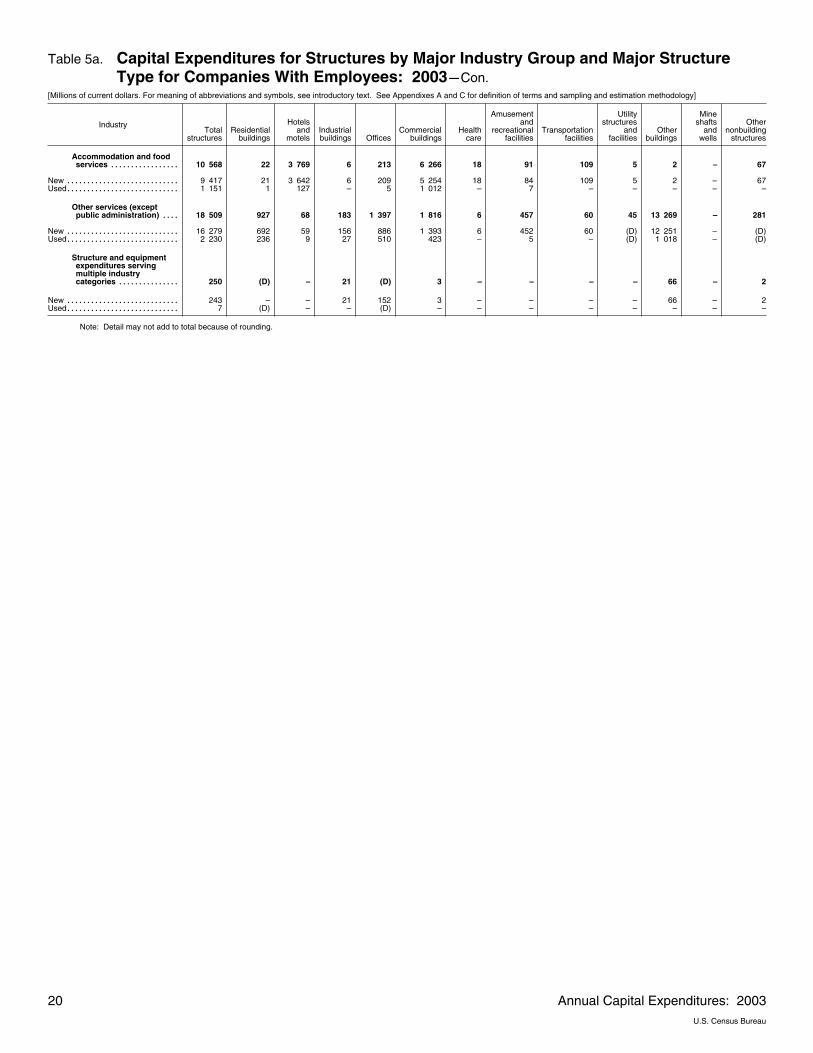
Table 5a. Capital Expenditures for Structures by Major Industry Group and Major StructureType for Companies With Employees: 2003�Con.
[Millions of current dollars. For meaning of abbreviations and symbols, see introductory text. See Appendixes A and C for definition of terms and sampling and estimation methodology]
IndustryTotal
structuresResidential
buildings
Hotelsand
motelsIndustrialbuildings Offices
Commercialbuildings
Healthcare
Amusementand
recreationalfacilities
Transportationfacilities
Utilitystructures
andfacilities
Otherbuildings
Mineshafts
andwells
Othernonbuilding
structures
Accommodation and foodservices 10 568����������������� 22 3 769 6 213 6 266 18 91 109 5 2 – 67
New 9 417���������������������������� 21 3 642 6 209 5 254 18 84 109 5 2 – 67Used 1 151���������������������������� 1 127 – 5 1 012 – 7 – – – – –
Other services (exceptpublic administration) 18 509���� 927 68 183 1 397 1 816 6 457 60 45 13 269 – 281
New 16 279���������������������������� 692 59 156 886 1 393 6 452 60 (D) 12 251 – (D)Used 2 230���������������������������� 236 9 27 510 423 – 5 – (D) 1 018 – (D)
Structure and equipmentexpenditures servingmultiple industrycategories 250��������������� (D) – 21 (D) 3 – – – – 66 – 2
New 243���������������������������� – – 21 152 3 – – – – 66 – 2Used 7���������������������������� (D) – – (D) – – – – – – – –
Note: Detail may not add to total because of rounding.
20 Annual Capital Expenditures: 2003U.S. Census Bureau

Table 5b. Relative Standard Errors for Capital Expenditures for Structures by Major IndustryGroup and Major Structure Type for Companies With Employees: 2003
[Percent. For meaning of abbreviations and symbols, see introductory text. See Appendixes A and C for definition of terms and sampling and estimation methodology]
IndustryTotal
structuresResidential
buildings
Hotelsand
motelsIndustrialbuildings Offices
Commercialbuildings
Healthcare
Amusementand
recreationalfacilities
Transportationfacilities
Utilitystructures
andfacilities
Otherbuildings
Mineshafts
andwells
Othernonbuilding
structures
Total structures 2.4����� (X) (X) (X) (X) (X) (X) (X) (X) (X) (X) (X) (X)
Structures by industryand type 2.5������������� 10.6 10.6 4.1 4.9 5.0 2.8 7.5 1.3 1.4 12.3 8.5 14.5
New 2.0���������������������������� 12.9 11.0 4.4 3.7 3.1 2.7 5.8 0.9 1.4 12.2 8.4 14.8Used 12.2���������������������������� 19.6 5.2 15.8 16.4 23.0 18.5 48.8 29.7 2.9 28.0 41.0 7.9Not distributed by industry and type –� (X) (X) (X) (X) (X) (X) (X) (X) (X) (X) (X) (X)
Forestry, fishing, andagricultural services 27.7������ 58.6 – 15.5 42.6 49.9 66.0 – 66.0 51.1 57.1 – 37.6
New 27.7���������������������������� (D) – 13.8 (D) 51.0 66.0 – 66.0 48.8 57.1 – 46.1Used 31.9���������������������������� (D) – 45.4 (D) 44.7 – – – 66.0 – – 48.4
Mining 7.8�������������������� (D) – 2.2 5.3 28.7 – (D) 4.1 1.6 – 8.5 4.5
New 7.7���������������������������� (D) – 2.4 5.5 28.8 – (D) 4.1 1.6 – 8.4 4.5Used 38.7���������������������������� 3.2 – 0.2 3.2 29.7 – 19.6 – 48.0 – 42.0 –
Utilities 2.4������������������� 97.4 – 17.6 30.5 36.0 – – (D) 2.6 – 79.5 (D)
New 2.5���������������������������� – – 17.6 30.4 36.0 – – (D) 2.6 – 79.5 (D)Used 3.2���������������������������� 97.4 – – 33.8 – – – – 2.0 – – –
Construction 12.0�������������� 36.0 99.8 53.5 18.4 29.0 69.6 – 45.0 38.3 25.3 – 17.7
New 14.0���������������������������� 17.2 99.8 55.1 21.3 31.3 69.6 – 45.0 38.3 25.3 – 25.0Used 38.7���������������������������� 68.9 – – 57.3 41.9 – – – – – – –
Manufacturing 1.6������������ 45.3 (D) 1.9 5.3 7.6 – (D) 13.1 1.3 – 1.5 4.4
New 1.7���������������������������� 47.4 (D) 2.0 1.9 5.6 – (D) 12.7 1.4 – 3.3 3.9Used 7.9���������������������������� 9.8 – 7.9 43.4 40.1 – – 25.6 1.2 – – 49.7
Durable goodsindustries 1.9�������������� 68.6 (D) 2.3 1.5 13.4 – – 30.9 11.7 – (D) 2.3
New 1.8���������������������������� 72.8 (D) 2.3 1.5 8.7 – – 32.9 (D) – (D) (D)Used 16.6���������������������������� 14.8 – 19.8 1.8 66.9 – – 25.6 (D) – – (D)
Nondurable goodsindustries 2.1�������������� (D) – 2.2 11.3 7.9 – 15.1 0.4 1.4 (D) 1.8 10.3
New 2.1���������������������������� (D) – 2.4 4.1 7.7 – 15.1 0.4 1.4 (D) 5.2 9.0Used 9.4���������������������������� – – 2.8 63.6 38.7 – – – – – – 66.9
Wholesale trade 10.8����������� 74.2 – 17.0 23.9 15.2 – – 1.6 2.7 – 19.6 13.2
New 10.8���������������������������� 59.4 – 16.6 24.1 6.5 – – 1.8 2.7 – 19.6 13.5Used 34.5���������������������������� 95.3 – 59.7 12.8 49.8 – – – – – – –
Retail trade 2.2��������������� 59.5 99.7 28.2 4.7 2.4 – – 50.6 32.6 – – 5.8
New 2.4���������������������������� 53.4 99.7 40.0 5.6 2.6 – – 50.6 37.2 – – 5.8Used 11.8���������������������������� 87.6 – 3.0 0.1 12.8 – – – 51.8 – – –
Transportation andwarehousing 4.2������������� 14.0 (D) 25.2 4.0 27.6 – 61.1 1.5 0.9 – (D) 10.6
New 1.1���������������������������� 1.3 (D) 29.5 4.3 9.2 – 61.1 1.0 0.9 – (D) 10.6Used 43.7���������������������������� 34.5 – 2.2 0.3 69.1 – – 31.4 – – – 9.7
Information 2.7��������������� – (D) 3.4 4.7 8.1 – 3.3 (D) 2.7 71.9 – 12.2
New 2.6���������������������������� – (D) 3.1 5.1 6.4 – 3.3 (D) 2.7 71.9 – 12.2Used 16.1���������������������������� – – 65.6 17.9 93.9 – – – 66.1 – – –
Finance and insurance 7.4����� 0.2 (D) 33.5 4.3 28.1 – – – (D) (D) – 67.0
New 2.6���������������������������� (D) (D) 3.1 2.5 11.8 – – – (D) (D) – 67.0Used 22.1���������������������������� (D) (D) 48.6 20.0 42.9 – – – – – – –
Real estate and rental andleasing 15.6������������������ 14.4 (D) 84.2 21.1 25.5 68.0 37.1 (D) 0.2 8.5 – 23.8
New 11.0���������������������������� 17.9 (D) 84.9 12.7 9.9 68.0 35.7 (D) 0.2 8.5 – (D)Used 39.5���������������������������� 18.9 (D) 32.1 49.8 52.3 – 89.8 (D) 72.7 – – (D)
Professional, scientific, andtechnical services 6.0�������� 17.2 – 19.9 5.7 29.8 63.7 17.5 92.1 30.2 22.1 – 3.2
New 6.9���������������������������� 18.5 – 20.4 4.3 30.2 67.0 17.5 92.1 30.2 23.6 – 3.2Used 21.7���������������������������� 52.8 – 54.4 22.3 53.4 – – – – – – –
Management of companiesand enterprises 5.5���������� 1.5 – – 4.5 17.4 – – – 20.1 – – 73.7
New 5.8���������������������������� 1.8 – – 4.7 17.4 – – – – – – 79.9Used 26.8���������������������������� – – – – – – – – 99.8 – – –
Administrative and supportand waste management 19.4��� 81.4 – 23.2 37.4 38.8 0.6 25.5 – 16.3 0.3 – 0.3
New 21.1���������������������������� 82.3 – 25.2 40.2 40.3 0.9 25.5 – 16.8 0.6 – 0.2Used 60.8���������������������������� 87.3 – 17.6 10.2 55.4 – – – 0.3 – – 86.8
Educational services 5.8������ 12.7 – – 3.3 – – 29.9 – 8.5 5.1 – 76.9
New 5.9���������������������������� 20.0 – – 3.5 – – 29.9 – 8.5 5.1 – 77.0Used 29.6���������������������������� 17.2 – – – – – – – – 35.1 – –
Health care and socialassistance 3.0��������������� 10.5 98.5 9.9 13.5 36.2 2.8 32.1 0.2 10.5 12.5 – 10.0
New 3.0���������������������������� 14.1 98.5 9.9 11.8 15.4 2.7 32.4 0.2 9.1 9.4 – 10.0Used 19.6���������������������������� 20.3 – – 38.8 75.4 19.0 – – 94.8 46.1 – –
Arts, entertainment, andrecreation 6.1��������������� 35.2 0.6 – (D) 42.0 – 8.7 13.9 (D) 7.9 – (D)
New 5.2���������������������������� (D) 0.6 – (D) 42.7 – 8.1 (D) (D) 8.2 – (D)Used 49.9���������������������������� (D) – – (D) 5.3 – 65.7 (D) – 34.1 (D) –
Annual Capital Expenditures: 2003 21U.S. Census Bureau

Table 5b. Relative Standard Errors for Capital Expenditures for Structures by Major IndustryGroup and Major Structure Type for Companies With Employees: 2003�Con.
[Percent. For meaning of abbreviations and symbols, see introductory text. See Appendixes A and C for definition of terms and sampling and estimation methodology]
IndustryTotal
structuresResidential
buildings
Hotelsand
motelsIndustrialbuildings Offices
Commercialbuildings
Healthcare
Amusementand
recreationalfacilities
Transportationfacilities
Utilitystructures
andfacilities
Otherbuildings
Mineshafts
andwells
Othernonbuilding
structures
Accommodation and foodservices 9.1����������������� 15.6 12.9 – 39.0 13.2 – 17.4 17.9 – – – 16.3
New 8.9���������������������������� 16.0 13.4 – 39.9 13.3 – 19.0 17.9 – – – 16.3Used 49.5���������������������������� – 0.1 – – 56.3 – – – – – – –
Other services (exceptpublic administration) 16.8���� 34.0 30.8 15.5 22.8 30.5 30.9 19.6 14.0 54.4 22.7 – 29.4
New 18.4���������������������������� 44.7 28.7 18.0 14.0 38.4 30.9 19.7 14.0 (D) 23.0 – (D)Used 25.6���������������������������� 54.8 89.0 27.9 47.1 59.8 – 26.1 – (D) 44.9 – (D)
Structure and equipmentexpenditures servingmultiple industrycategories 0.7��������������� (D) – 1.3 (D) – – – – – – – 66.7
New 0.7���������������������������� – – 1.3 0.8 – – – – – – – 66.7Used –���������������������������� (D) – – (D) – – – – – – – –
22 Annual Capital Expenditures: 2003U.S. Census Bureau
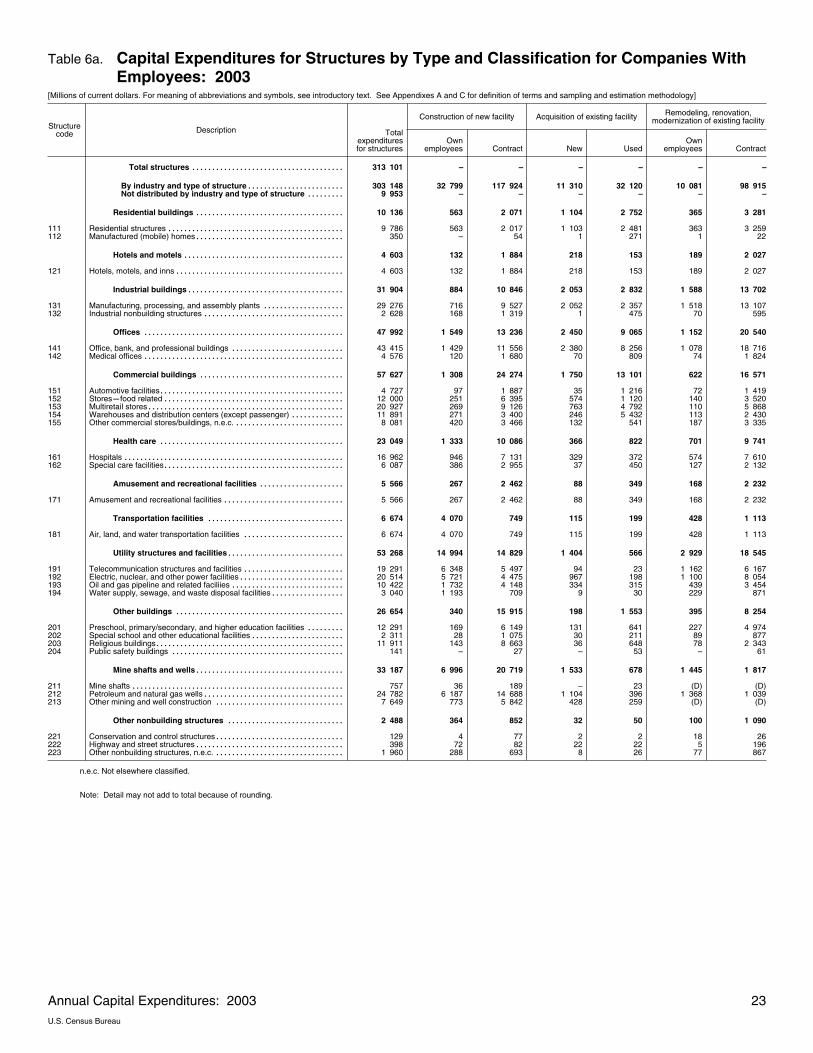
Table 6a. Capital Expenditures for Structures by Type and Classification for Companies WithEmployees: 2003
[Millions of current dollars. For meaning of abbreviations and symbols, see introductory text. See Appendixes A and C for definition of terms and sampling and estimation methodology]
Structurecode Description
Construction of new facility Acquisition of existing facility Remodeling, renovation,modernization of existing facility
Totalexpendituresfor structures
Ownemployees Contract New Used
Ownemployees Contract
Total structures 313 101�������������������������������������� – – – – – –
By industry and type of structure 303 148������������������������ 32 799 117 924 11 310 32 120 10 081 98 915Not distributed by industry and type of structure 9 953��������� – – – – – –
Residential buildings 10 136������������������������������������� 563 2 071 1 104 2 752 365 3 281
111 Residential structures 9 786�������������������������������������������� 563 2 017 1 103 2 481 363 3 259112 Manufactured (mobile) homes 350������������������������������������� – 54 1 271 1 22
Hotels and motels 4 603���������������������������������������� 132 1 884 218 153 189 2 027
121 Hotels, motels, and inns 4 603������������������������������������������ 132 1 884 218 153 189 2 027
Industrial buildings 31 904��������������������������������������� 884 10 846 2 053 2 832 1 588 13 702
131 Manufacturing, processing, and assembly plants 29 276�������������������� 716 9 527 2 052 2 357 1 518 13 107132 Industrial nonbuilding structures 2 628����������������������������������� 168 1 319 1 475 70 595
Offices 47 992�������������������������������������������������� 1 549 13 236 2 450 9 065 1 152 20 540
141 Office, bank, and professional buildings 43 415���������������������������� 1 429 11 556 2 380 8 256 1 078 18 716142 Medical offices 4 576�������������������������������������������������� 120 1 680 70 809 74 1 824
Commercial buildings 57 627������������������������������������ 1 308 24 274 1 750 13 101 622 16 571
151 Automotive facilities 4 727���������������������������������������������� 97 1 887 35 1 216 72 1 419152 Stores�food related 12 000��������������������������������������������� 251 6 395 574 1 120 140 3 520153 Multiretail stores 20 927������������������������������������������������� 269 9 126 763 4 792 110 5 868154 Warehouses and distribution centers (except passenger) 11 891������������� 271 3 400 246 5 432 113 2 430155 Other commercial stores/buildings, n.e.c. 8 081��������������������������� 420 3 466 132 541 187 3 335
Health care 23 049���������������������������������������������� 1 333 10 086 366 822 701 9 741
161 Hospitals 16 962������������������������������������������������������� 946 7 131 329 372 574 7 610162 Special care facilities 6 087��������������������������������������������� 386 2 955 37 450 127 2 132
Amusement and recreational facilities 5 566��������������������� 267 2 462 88 349 168 2 232
171 Amusement and recreational facilities 5 566������������������������������ 267 2 462 88 349 168 2 232
Transportation facilities 6 674���������������������������������� 4 070 749 115 199 428 1 113
181 Air, land, and water transportation facilities 6 674������������������������� 4 070 749 115 199 428 1 113
Utility structures and facilities 53 268����������������������������� 14 994 14 829 1 404 566 2 929 18 545
191 Telecommunication structures and facilities 19 291������������������������� 6 348 5 497 94 23 1 162 6 167192 Electric, nuclear, and other power facilities 20 514�������������������������� 5 721 4 475 967 198 1 100 8 054193 Oil and gas pipeline and related faciliies 10 422���������������������������� 1 732 4 148 334 315 439 3 454194 Water supply, sewage, and waste disposal facilities 3 040������������������ 1 193 709 9 30 229 871
Other buildings 26 654������������������������������������������ 340 15 915 198 1 553 395 8 254
201 Preschool, primary/secondary, and higher education facilities 12 291��������� 169 6 149 131 641 227 4 974202 Special school and other educational facilities 2 311����������������������� 28 1 075 30 211 89 877203 Religious buildings 11 911����������������������������������������������� 143 8 663 36 648 78 2 343204 Public safety buildings 141������������������������������������������� – 27 – 53 – 61
Mine shafts and wells 33 187������������������������������������� 6 996 20 719 1 533 678 1 445 1 817
211 Mine shafts 757����������������������������������������������������� 36 189 – 23 (D) (D)212 Petroleum and natural gas wells 24 782����������������������������������� 6 187 14 688 1 104 396 1 368 1 039213 Other mining and well construction 7 649�������������������������������� 773 5 842 428 259 (D) (D)
Other nonbuilding structures 2 488����������������������������� 364 852 32 50 100 1 090
221 Conservation and control structures 129�������������������������������� 4 77 2 2 18 26222 Highway and street structures 398������������������������������������� 72 82 22 22 5 196223 Other nonbuilding structures, n.e.c. 1 960�������������������������������� 288 693 8 26 77 867
n.e.c. Not elsewhere classified.
Note: Detail may not add to total because of rounding.
Annual Capital Expenditures: 2003 23U.S. Census Bureau

Table 6b. Relative Standard Error for Capital Expenditures for Structures by Type andClassification for Companies With Employees: 2003
[Percent. For meaning of abbreviations and symbols, see introductory text. See Appendixes A and C for definition of terms and sampling and estimation methodology]
Structurecode Description
Construction of new facility Acquisition of existing facility Remodeling, renovation,modernization of existing facility
Totalexpendituresfor structures
Ownemployees Contract New Used
Ownemployees Contract
Total structures 2.4�������������������������������������� – – – – – –
By industry and type of structure 2.5������������������������ 1.2 3.7 14.1 12.2 6.5 1.0Not distributed by industry and type of structure –��������� – – – – – –
Residential buildings 10.6������������������������������������� 6.9 22.5 60.6 19.6 18.8 15.0
111 Residential structures 11.5�������������������������������������������� 6.9 23.3 60.7 21.1 18.9 15.3112 Manufactured (mobile) homes 61.5������������������������������������� – 80.4 56.5 77.2 – 95.5
Hotels and motels 10.6���������������������������������������� 71.8 23.6 53.2 5.2 22.1 5.5
121 Hotels, motels, and inns 10.6������������������������������������������ 71.8 23.6 53.2 5.2 22.1 5.5
Industrial buildings 4.1��������������������������������������� 2.2 11.7 9.3 15.8 4.9 2.3
131 Manufacturing, processing, and assembly plants 4.5�������������������� 2.7 13.4 9.3 19.0 5.1 2.5132 Industrial nonbuilding structures 0.9����������������������������������� – 1.2 – (z) 19.0 1.1
Offices 4.9�������������������������������������������������� 9.0 6.6 2.4 16.4 4.2 4.0
141 Office, bank, and professional buildings 4.9���������������������������� 8.8 8.0 2.5 18.6 4.0 4.3142 Medical offices 15.8�������������������������������������������������� 68.4 24.5 27.9 62.5 10.3 12.6
Commercial buildings 5.0������������������������������������ 4.0 2.6 42.6 23.0 19.4 4.7
151 Automotive facilities 14.1���������������������������������������������� 0.3 17.8 75.0 33.6 44.5 9.9152 Stores�food related 7.4��������������������������������������������� 4.1 4.8 62.7 46.1 10.6 5.8153 Multiretail stores 6.1������������������������������������������������� – 0.7 52.1 22.9 7.4 8.4154 Warehouses and distribution centers (except passenger) 26.1������������� 19.9 6.3 31.3 55.1 6.9 5.8155 Other commercial stores/buildings, n.e.c. 9.3��������������������������� 2.7 11.1 13.4 23.3 59.7 18.4
Health care 2.8���������������������������������������������� 20.1 4.4 4.4 18.5 6.0 2.3
161 Hospitals 1.2������������������������������������������������������� 2.0 1.3 – (z) 0.9 2.0162 Special care facilities 9.5��������������������������������������������� 69.9 15.4 42.8 33.8 31.5 6.8
Amusement and recreational facilities 7.5��������������������� 34.2 3.4 74.4 48.8 22.0 12.8
171 Amusement and recreational facilities 7.5������������������������������ 34.2 3.4 74.4 48.8 22.0 12.8
Transportation facilities 1.3���������������������������������� 0.5 4.9 6.2 29.7 3.1 4.5
181 Air, land, and water transportation facilities 1.3������������������������� 0.5 4.9 6.2 29.7 3.1 4.5
Utility structures and facilities 1.4����������������������������� 1.3 3.1 34.1 2.9 5.3 1.2
191 Telecommunication structures and facilities 2.8������������������������� 2.5 7.8 3.8 68.6 0.9 1.3192 Electric, nuclear, and other power facilities 3.1�������������������������� 2.6 7.4 49.6 2.4 4.9 2.1193 Oil and gas pipeline and related faciliies 0.7���������������������������� 0.7 1.7 (z) 2.8 0.5 0.8194 Water supply, sewage, and waste disposal facilities 7.2������������������ 0.8 15.6 23.1 0.4 66.1 20.7
Other buildings 12.3������������������������������������������ 36.1 18.1 53.8 28.0 22.5 6.2
201 Preschool, primary/secondary, and higher education facilities 6.9��������� 9.9 9.4 78.7 51.3 38.5 5.7202 Special school and other educational facilities 9.3����������������������� 7.9 8.4 56.0 56.8 17.7 14.3203 Religious buildings 26.8����������������������������������������������� 86.7 32.5 97.6 55.3 31.0 21.1204 Public safety buildings 4.0������������������������������������������� – 18.7 – – 94.7 0.9
Mine shafts and wells 8.5������������������������������������� 1.5 9.1 57.9 41.0 39.5 6.7
211 Mine shafts 11.0����������������������������������������������������� 2.4 42.6 – 13.7 (D) (D)212 Petroleum and natural gas wells 10.2����������������������������������� 1.6 9.5 80.6 69.2 41.8 11.8213 Other mining and well construction 14.8�������������������������������� 7.9 18.3 6.7 28.8 (D) (D)
Other nonbuilding structures 14.5����������������������������� 42.3 15.9 1.9 7.9 39.1 13.2
221 Conservation and control structures 10.9�������������������������������� 28.8 8.1 – 9.6 – 31.1222 Highway and street structures 28.5������������������������������������� 8.0 27.9 – – 28.5 51.1223 Other nonbuilding structures, n.e.c. 14.3�������������������������������� 53.2 18.9 8.0 15.2 50.5 9.4
n.e.c. Not elsewhere classified.
24 Annual Capital Expenditures: 2003U.S. Census Bureau

Table 7a. Capital Expenditures for Equipment by Major Industry Group and Major EquipmentType for Companies With Employees: 2003
[Millions of current dollars. For meaning of abbreviations and symbols, see introductory text. See Appendixes A and C for definition of terms and sampling and estimation methodology]
Description
Total equipment
Information�processingequipment
Industrialequipment
Transportationequipment
Energy,electrical, and
relatedequipment
Miscellaneousequipment
Otherequipment, not
listed elsewhere
Total equipment 582 546������������������������������������� – – – – – –
Equipment by industry and type 552 637������������������������ 161 334 105 716 179 335 43 890 58 594 3 769
New 521 110������������������������������������������������������������ 159 419 98 222 165 320 41 948 52 677 3 525Used 31 527������������������������������������������������������������ 1 915 7 495 14 014 1 943 5 917 244Not distributed by industry and type 29 908��������������������������������� – – – – – –
Forestry, fishing, and agricultural services 1 692������������������ 63 247 572 10 788 12
New 1 267������������������������������������������������������������ 60 192 373 9 622 11Used 425������������������������������������������������������������ 4 55 199 – 166 1
Mining 14 152���������������������������������������������������� 487 580 1 656 10 046 1 305 78
New 12 265������������������������������������������������������������ 486 534 1 154 9 001 1 020 69Used 1 887������������������������������������������������������������ 1 46 502 1 044 285 9
Utilities 30 001��������������������������������������������������� 2 531 182 603 26 262 407 17
New 29 316������������������������������������������������������������ 2 520 178 592 25 604 406 17Used 685������������������������������������������������������������ 12 3 11 658 – –
Construction 21 426���������������������������������������������� 1 167 1 085 9 645 168 9 238 123
New 16 148������������������������������������������������������������ 1 117 807 7 481 128 6 519 96Used 5 278������������������������������������������������������������ 50 278 2 164 40 2 719 27
Manufacturing 113 101�������������������������������������������� 17 054 81 968 6 241 3 631 3 812 396
New 107 358������������������������������������������������������������ 16 871 77 335 5 651 3 508 3 630 363Used 5 743������������������������������������������������������������ 183 4 633 591 123 181 32
Durable goods industries 62 169�������������������������������� 9 594 43 059 4 709 2 131 2 534 142
New 58 183������������������������������������������������������������ 9 474 39 813 4 251 2 098 2 409 137Used 3 986������������������������������������������������������������ 120 3 246 458 33 125 5
Nondurable goods industries 50 932���������������������������� 7 460 38 910 1 532 1 499 1 277 254
New 49 175������������������������������������������������������������ 7 397 37 522 1 399 1 410 1 221 226Used 1 757������������������������������������������������������������ 63 1 388 133 89 56 28
Wholesale trade 22 324������������������������������������������� 6 726 6 626 5 512 277 2 992 192
New 20 354������������������������������������������������������������ 6 599 5 808 4 688 275 2 796 188Used 1 970������������������������������������������������������������ 127 818 824 3 196 3
Retail trade 34 377����������������������������������������������� 9 774 5 720 6 810 922 10 433 718
New 30 348������������������������������������������������������������ 9 629 5 211 3 891 888 10 127 602Used 4 029������������������������������������������������������������ 145 509 2 919 34 306 116
Transportation and warehousing 31 941��������������������������� 2 160 768 27 047 1 359 504 104
New 27 330������������������������������������������������������������ 2 040 624 22 800 1 355 407 103Used 4 612������������������������������������������������������������ 120 144 4 247 3 96 1
Information 42 689����������������������������������������������� 38 320 885 1 564 403 1 380 137
New 42 269������������������������������������������������������������ 38 135 866 1 414 393 1 324 137Used 420������������������������������������������������������������ 185 19 150 10 57 –
Finance and insurance 89 562������������������������������������� 25 273 262 58 948 42 4 682 355
New 89 180������������������������������������������������������������ 25 086 261 58 837 39 4 606 351Used 383������������������������������������������������������������ 187 1 111 2 76 4
Real estate and rental and leasing 61 623�������������������������� 4 790 782 51 269 401 4 275 107
New 60 032������������������������������������������������������������ 4 647 726 50 493 392 3 672 103Used 1 591������������������������������������������������������������ 144 56 776 8 602 4
Professional, scientific, and technical services 19 514�������������� 13 789 1 316 2 358 40 1 839 172
New 18 800������������������������������������������������������������ 13 539 1 205 2 083 39 1 763 171Used 714������������������������������������������������������������ 251 111 275 1 76 1
Management of companies and enterprises 2 398����������������� 1 423 142 335 1 492 5
New 2 393������������������������������������������������������������ 1 422 141 332 1 492 5Used 5������������������������������������������������������������ 1 1 3 – – –
Administrative and support and waste management 11 453��������� 5 012 1 228 2 494 20 2 627 72
New 10 192������������������������������������������������������������ 4 933 751 2 052 15 2 371 70Used 1 261������������������������������������������������������������ 79 477 442 5 256 2
Educational services 4 609�������������������������������������� 2 892 120 357 42 689 509
New 4 495������������������������������������������������������������ 2 889 (D) 265 42 (D) 504Used 114������������������������������������������������������������ 3 (D) 92 – (D) 5
Health care and social assistance 28 611�������������������������� 24 245 627 1 206 131 2 272 130
New 27 987������������������������������������������������������������ 23 972 620 1 091 130 2 045 128Used 625������������������������������������������������������������ 273 7 115 1 227 2
Arts, entertainment, and recreation 4 208������������������������� 1 139 214 471 27 2 125 233
New 4 022������������������������������������������������������������ 1 136 209 376 26 2 066 209Used 186������������������������������������������������������������ 2 5 96 – 60 23
Accommodation and food services 10 468������������������������� 1 455 1 842 779 73 6 039 280
New 9 684������������������������������������������������������������ 1 389 1 678 690 73 5 585 270Used 783������������������������������������������������������������ 66 164 89 – 454 10
Other services (except public administration) 7 507��������������� 2 385 1 004 1 439 37 2 512 130
New 6 696������������������������������������������������������������ 2 303 847 1 034 28 2 356 127Used 811������������������������������������������������������������ 82 156 406 9 156 3
Annual Capital Expenditures: 2003 25U.S. Census Bureau

Table 7a. Capital Expenditures for Equipment by Major Industry Group and Major EquipmentType for Companies With Employees: 2003�Con.
[Millions of current dollars. For meaning of abbreviations and symbols, see introductory text. See Appendixes A and C for definition of terms and sampling and estimation methodology]
Description
Total equipment
Information�processingequipment
Industrialequipment
Transportationequipment
Energy,electrical, and
relatedequipment
Miscellaneousequipment
Otherequipment, not
listed elsewhere
Structure and equipment expenditures serving multipleindustry categories 980��������������������������������������� 648 119 28 1 184 –
New 976������������������������������������������������������������ 648 (D) 25 1 (D) –Used 4������������������������������������������������������������ – (D) 4 – (D) –
Note: Detail may not add to total because of rounding.
26 Annual Capital Expenditures: 2003U.S. Census Bureau

Table 7b. Relative Standard Errors for Capital Expenditures for Equipment by Major IndustryGroup and Major Equipment Type for Companies With Employees: 2003
[Percent. For meaning of abbreviations and symbols, see introductory text. See Appendixes A and C for definition of terms and sampling and estimation methodology]
Description
Total equipment
Information�processingequipment
Industrialequipment
Transportationequipment
Energy,electrical, and
relatedequipment
Miscellaneousequipment
Otherequipment, not
listed elsewhere
Total equipment 0.5������������������������������������� – – – – – –
Equipment by industry and type 0.6������������������������ 0.9 2.1 1.2 2.4 2.6 3.4
New 0.6������������������������������������������������������������ 0.9 1.8 0.4 2.2 2.7 3.4Used 7.4������������������������������������������������������������ 10.1 13.7 14.7 12.6 10.1 16.8Not distributed by industry and type (Z)��������������������������������� – – – – – –
Forestry, fishing, and agricultural services 16.4������������������ 8.7 12.1 22.5 3.9 29.9 40.4
New 20.6������������������������������������������������������������ 7.6 10.1 21.6 0.4 38.3 42.3Used 30.6������������������������������������������������������������ 57.0 36.6 56.0 94.7 28.0 59.0
Mining 5.9���������������������������������������������������� 3.5 11.1 13.4 8.4 6.1 1.2
New 6.6������������������������������������������������������������ 3.5 12.1 18.6 8.8 6.5 1.4Used 11.8������������������������������������������������������������ 26.6 16.0 8.3 21.1 17.6 0.2
Utilities 1.2��������������������������������������������������� 2.5 6.5 3.1 1.1 5.5 10.0
New 1.1������������������������������������������������������������ 2.5 6.6 3.2 1.0 5.5 10.1Used 16.0������������������������������������������������������������ 3.2 18.2 60.7 16.1 34.1 –
Construction 5.0���������������������������������������������� 6.4 22.1 9.6 31.8 9.5 28.9
New 5.6������������������������������������������������������������ 6.2 22.4 9.4 29.8 11.0 29.8Used 9.0������������������������������������������������������������ 28.0 32.1 16.1 59.2 13.7 74.0
Manufacturing 1.3�������������������������������������������� 0.7 1.6 3.7 3.1 16.1 8.1
New 1.1������������������������������������������������������������ 0.6 1.3 3.8 2.4 16.2 8.1Used 12.1������������������������������������������������������������ 9.3 15.3 15.4 41.6 19.1 29.9
Durable goods industries 2.6�������������������������������� 0.9 3.4 3.9 3.3 24.6 9.2
New 2.1������������������������������������������������������������ 0.9 2.5 4.0 3.3 24.9 9.5Used 18.1������������������������������������������������������������ 13.4 22.4 16.7 7.9 27.2 40.2
Nondurable goods industries 1.1���������������������������� 1.3 1.2 5.3 6.7 3.9 10.9
New 1.2������������������������������������������������������������ 1.2 1.3 5.9 4.1 3.6 11.6Used 9.2������������������������������������������������������������ 15.4 11.6 19.4 57.2 17.7 34.0
Wholesale trade 8.1������������������������������������������� 5.1 16.6 7.8 17.1 25.7 30.2
New 7.8������������������������������������������������������������ 5.2 16.6 9.0 17.3 26.6 30.7Used 30.1������������������������������������������������������������ 28.3 66.8 9.5 9.4 47.6 60.7
Retail trade 5.6����������������������������������������������� 4.0 4.4 27.8 4.6 1.9 9.2
New 1.8������������������������������������������������������������ 4.0 4.8 7.6 3.7 1.8 8.8Used 48.4������������������������������������������������������������ 8.8 6.5 67.4 38.7 24.6 12.7
Transportation and warehousing 2.5��������������������������� 2.6 8.9 2.9 0.6 7.8 6.7
New 2.8������������������������������������������������������������ 2.7 3.9 3.3 0.6 4.8 6.8Used 6.7������������������������������������������������������������ 11.5 43.4 7.2 9.1 40.4 60.8
Information 2.5����������������������������������������������� 2.7 5.8 3.2 29.1 8.0 24.9
New 2.5������������������������������������������������������������ 2.7 6.0 3.4 29.9 8.4 24.9Used 25.9������������������������������������������������������������ 53.0 50.2 5.9 99.4 56.2 –
Finance and insurance 0.9������������������������������������� 2.2 16.1 0.2 19.7 6.6 6.0
New 0.9������������������������������������������������������������ 2.2 16.2 0.2 21.0 6.8 5.5Used 9.5������������������������������������������������������������ 6.1 10.1 29.2 56.5 23.2 86.8
Real estate and rental and leasing 2.2�������������������������� 16.9 20.6 0.9 6.3 9.4 24.6
New 2.1������������������������������������������������������������ 16.6 20.4 0.8 6.1 10.3 25.5Used 14.4������������������������������������������������������������ 35.2 34.6 29.9 27.4 15.2 –
Professional, scientific, and technical services 2.9�������������� 4.0 17.8 12.8 9.1 5.9 14.8
New 2.9������������������������������������������������������������ 4.1 18.9 12.9 9.3 6.2 14.8Used 15.6������������������������������������������������������������ 24.6 41.0 25.3 50.7 13.8 54.5
Management of companies and enterprises 4.3����������������� 6.0 28.5 9.2 – 1.9 31.8
New 4.3������������������������������������������������������������ 6.0 28.7 9.3 – 1.9 32.2Used 27.7������������������������������������������������������������ 69.9 – 11.4 – 42.2 94.6
Administrative and support and waste management 7.1��������� 4.9 28.4 7.3 13.1 30.8 28.9
New 7.8������������������������������������������������������������ 5.1 7.4 7.5 15.0 33.3 29.7Used 26.6������������������������������������������������������������ 34.5 71.1 18.4 25.7 35.2 40.0
Educational services 11.9�������������������������������������� 13.6 21.0 48.3 17.2 3.9 4.4
New 12.1������������������������������������������������������������ 13.6 (D) 57.4 17.2 (D) 4.2Used 61.0������������������������������������������������������������ 24.0 (D) 74.3 – (D) 34.0
Health care and social assistance 5.1�������������������������� 4.2 42.2 14.6 15.2 9.7 9.6
New 4.8������������������������������������������������������������ 4.2 42.8 16.2 15.3 5.7 9.7Used 23.6������������������������������������������������������������ 16.1 21.2 19.2 58.2 64.0 8.9
Arts, entertainment, and recreation 5.8������������������������� 5.0 22.4 22.8 56.6 6.4 18.1
New 5.3������������������������������������������������������������ 5.1 22.5 21.4 56.9 6.6 14.5Used 39.4������������������������������������������������������������ 3.2 32.1 40.9 17.5 30.1 98.1
Accommodation and food services 6.8������������������������� 5.6 6.0 16.1 17.6 10.4 7.6
New 7.3������������������������������������������������������������ 5.8 4.2 17.3 17.7 11.0 5.3Used 24.2������������������������������������������������������������ 41.2 57.2 23.5 – 22.0 74.4
Other services (except public administration) 6.1��������������� 8.4 16.9 12.1 30.2 15.1 25.4
New 7.0������������������������������������������������������������ 8.5 16.6 9.2 32.5 16.4 26.2Used 18.0������������������������������������������������������������ 51.0 42.1 32.0 77.4 21.8 49.4
Annual Capital Expenditures: 2003 27U.S. Census Bureau

Table 7b. Relative Standard Errors for Capital Expenditures for Equipment by Major IndustryGroup and Major Equipment Type for Companies With Employees: 2003�Con.
[Percent. For meaning of abbreviations and symbols, see introductory text. See Appendixes A and C for definition of terms and sampling and estimation methodology]
Description
Total equipment
Information�processingequipment
Industrialequipment
Transportationequipment
Energy,electrical, and
relatedequipment
Miscellaneousequipment
Otherequipment, not
listed elsewhere
Structure and equipment expenditures serving multipleindustry categories 0.7��������������������������������������� 0.9 0.2 4.1 – 0.4 –
New 0.7������������������������������������������������������������ 0.9 (D) 4.7 – (D) –Used –������������������������������������������������������������ – (D) – – (D) –
28 Annual Capital Expenditures: 2003U.S. Census Bureau

Table 8a. Capital Expenditures for Equipment by Type and Classification for Companies WithEmployees: 2003
[Millions of current dollars. For meaning of abbreviations and symbols, see introductory text. See Appendix A for definition of terms]
Equipmentcode Description
Classification of expenditures for equipment
Total expenditures forequipment New equipment Used equipment
Total equipment 582 546������������������������������������������������������������������ – –
By industry and type of equipment 552 637��������������������������������������������������� 521 110 31 527Not distributed by industry and type of equipment 29 908������������������������������������ – –
Information�processing equipment 161 334����������������������������������������������������� 159 419 1 915
311 Computer and peripheral equipment 55 847������������������������������������������������������������ 54 991 856312 Office equipment except computers and peripherals 7 888���������������������������������������������� 7 654 233313 Information and communication technology equipment, excluding computers and peripherals 28 894���������� 28 599 295314 Audio and video equipment 1 931�������������������������������������������������������������������� 1 899 32315 Navigational, measuring, and control instruments 3 059������������������������������������������������ 2 927 132316 Electromedical and electrotherapeutic apparatus 3 052������������������������������������������������� 3 039 14317 Medical equipment and supplies 16 371��������������������������������������������������������������� 16 151 220318 Capitalized software 44 292�������������������������������������������������������������������������� 44 158 134
Industrial equipment 105 716������������������������������������������������������������������ 98 222 7 495
321 Fabricated metal products 3 133��������������������������������������������������������������������� 2 694 438322 Metalworking machinery 20 507���������������������������������������������������������������������� 17 897 2 609323 Special industrial machinery 64 290������������������������������������������������������������������� 60 995 3 295324 Ventilation, heating, air�conditioning, commercial, refrigeration, and other general purpose machinery 17 787��� 16 635 1 152
Transportation equipment 179 335������������������������������������������������������������� 165 320 14 014
331 Cars and light trucks 119 211�������������������������������������������������������������������������� 115 149 4 062332 Heavy duty trucks 15 443���������������������������������������������������������������������������� 12 555 2 888333 Aerospace products and parts 21 748����������������������������������������������������������������� 19 482 2 267334 Other transportation equipment 22 932���������������������������������������������������������������� 18 135 4 798
Energy, electrical, and related equipment 43 890����������������������������������������������� 41 948 1 943
341 Engine, turbine, and power transmission equipment 10 704���������������������������������������������� 10 289 415342 Electrical transmission and distribution equipment 11 879������������������������������������������������ 11 701 178343 Electrical equipment, n.e.c. 4 423�������������������������������������������������������������������� 4 351 71344 Mining and oil and gas field machinery and equipment 14 953�������������������������������������������� 13 696 1 258345 Floating oil and gas drilling and production platforms 994���������������������������������������������� 973 21346 Nuclear fuel 937��������������������������������������������������������������������������������� 937 –
Miscellaneous equipment 58 594������������������������������������������������������������� 52 677 5 917
351 Furniture and related products 28 325����������������������������������������������������������������� 27 298 1 027352 Agricultural equipment 1 636������������������������������������������������������������������������ 1 349 287353 Construction machinery 16 870����������������������������������������������������������������������� 12 877 3 993354 Service industry equipment 7 465�������������������������������������������������������������������� 6 950 515355 Other miscellaneous equipment 4 297���������������������������������������������������������������� 4 202 95
Other equipment not listed elsewhere 3 769�������������������������������������������������� 3 525 244
361 Artwork, books, and other equipment, n.e.c. 3 769����������������������������������������������������� 3 525 244
n.e.c. Not elsewhere classified.
Note: Detail may not add to total because of rounding.
Annual Capital Expenditures: 2003 29U.S. Census Bureau

Table 8b. Relative Standard Errors for Capital Expenditures for Equipment by Type andClassification for Companies With Employees: 2003
[Percent. For meaning of abbreviations and symbols, see introductory text. See Appendixes A and C for definition of terms and sampling and estimation methodology]
Equipmentcode Description
Classification of expenditures for equipment
Total expenditures forequipment New equipment Used equipment
Total equipment 0.5������������������������������������������������������������������ – –
By industry and type of equipment 0.6��������������������������������������������������� 0.6 7.4Not distributed by industry and type of equipment (z)������������������������������������ – –
Information�processing equipment 0.9����������������������������������������������������� 0.9 10.1
311 Computer and peripheral equipment 2.0������������������������������������������������������������ 2.0 11.8312 Office equipment except computers and peripherals 2.9���������������������������������������������� 3.1 20.0313 Information and communication technology equipment, excluding computers and peripherals 2.2���������� 2.2 35.3314 Audio and video equipment 6.4�������������������������������������������������������������������� 6.7 47.8315 Navigational, measuring, and control instruments 4.4������������������������������������������������ 4.4 31.7316 Electromedical and electrotherapeutic apparatus 18.0������������������������������������������������� 18.0 30.1317 Medical equipment and supplies 2.2��������������������������������������������������������������� 2.2 20.2318 Capitalized software 1.0�������������������������������������������������������������������������� 1.0 4.0
Industrial equipment 2.1������������������������������������������������������������������ 1.8 13.7
321 Fabricated metal products 9.1��������������������������������������������������������������������� 9.8 21.9322 Metalworking machinery 6.3���������������������������������������������������������������������� 2.2 38.4323 Special industrial machinery 2.3������������������������������������������������������������������� 2.4 11.2324 Ventilation, heating, air�conditioning, commercial, refrigeration, and other general purpose machinery 2.5��� 2.7 11.9
Transportation equipment 1.2������������������������������������������������������������� 0.4 14.7
331 Cars and light trucks 0.8�������������������������������������������������������������������������� 0.6 10.4332 Heavy duty trucks 4.7���������������������������������������������������������������������������� 4.9 11.0333 Aerospace products and parts 1.6����������������������������������������������������������������� 1.6 10.2334 Other transportation equipment 9.1���������������������������������������������������������������� 2.9 42.4
Energy, electrical, and related equipment 2.4����������������������������������������������� 2.2 12.6
341 Engine, turbine, and power transmission equipment 2.5���������������������������������������������� 2.4 21.1342 Electrical transmission and distribution equipment 2.6������������������������������������������������ 2.5 42.2343 Electrical equipment, n.e.c. 2.7�������������������������������������������������������������������� 2.1 66.2344 Mining and oil and gas field machinery and equipment 6.1�������������������������������������������� 6.1 18.6345 Floating oil and gas drilling and production platforms 5.5���������������������������������������������� 5.4 19.2346 Nuclear fuel 0.1��������������������������������������������������������������������������������� 0.1 –
Miscellaneous equipment 2.6������������������������������������������������������������� 2.7 10.1
351 Furniture and related products 2.0����������������������������������������������������������������� 2.2 15.8352 Agricultural equipment 17.3������������������������������������������������������������������������ 18.7 32.0353 Construction machinery 7.3����������������������������������������������������������������������� 8.2 9.8354 Service industry equipment 5.9�������������������������������������������������������������������� 5.9 19.7355 Other miscellaneous equipment 13.5���������������������������������������������������������������� 13.9 24.4
Other equipment not listed elsewhere 3.4�������������������������������������������������� 3.4 16.8
361 Artwork, books, and other equipment, n.e.c. 3.4����������������������������������������������������� 3.4 16.8
n.e.c. Not elsewhere classified.
30 Annual Capital Expenditures: 2003U.S. Census Bureau

Appendix A.Definition of Terms
CAPITAL EXPENDITURES
Capital expenditures include all expenditures during theyear for both new and used structures and equipmentchargeable to asset accounts for which depreciation oramortization accounts are ordinarily maintained. Forprojects lasting longer than 1 year, this definition includesgross additions to construction-in-progress accounts evenif the asset was not in use and not yet depreciated. Forcapital leases, the company using the asset (lessee) isasked to include the cost or present value of the leasedassets in the year in which the lease was entered. Alsoincluded in capital expenditures are capitalized leaseholdimprovements and capitalized interest charges on loansused to finance capital projects.
STRUCTURES
Capital expenditures for structures consist of the capital-ized costs of buildings and other structures and all neces-sary expenditures to acquire, construct, and prepare thestructure for its intended use. The costs of any machineryand equipment which are an integral or built-in feature ofthe structure are classified as structures. Also included aremajor additions and alterations to existing structures andcapitalized repairs and improvements to buildings.
New structures include new buildings and other structuresnot previously owned, as well as buildings and otherstructures that have been previously owned but not usedor occupied. Used structures are buildings and other struc-tures which have been previously owned and occupied.
EQUIPMENT
Capital expenditures for equipment include machinery,furniture and fixtures, computers, and vehicles used in theproduction and distribution of goods and services. Expen-ditures for machinery and equipment which are housed instructures and can be removed or replaced without signifi-cantly altering the structure are classified as machineryand equipment.
New equipment consists of machinery and equipment pur-chased new and equipment produced in the company foruse by the company. Used equipment is secondhandmachinery and equipment.
OTHER CAPITAL EXPENDITURES
‘‘Other’’ capital expenditures refers to depreciable andamortizable assets which companies could not classify asstructures or equipment because of recordkeeping prac-tices or difficulties interpreting the definitions of struc-tures and equipment.
CAPITAL LEASES
Capital leases consist of new assets acquired under capitallease arrangements entered into during the year. Capitalleases are defined by the criteria in the Financial Account-ing Standards (FASB) Number 13.
CAPITALIZED COMPUTER SOFTWARE
Capitalized computer software expenditures consist ofcosts of materials and services directly related to thedevelopment or acquisition of software; payroll andpayroll-related costs for employees direclty associatedwith software development; and interest cost incurredwhile developing the software. Capitalized computer soft-ware is defined by the criteria in Statement of Position98-1, Accounting for the Costs of Computer SoftwareDeveloped or Obtained for Internal Use.
Prepackaged Software
Prepackaged software is purchased off-the-shelf throughretailers or other mass-market outlets for internal use bythe company and includes the cost of licensing fees andservice/maintenance agreements.
Vendor-Customized Software
Vendor-customized software is externally developed byvendors and customized for the company’s use.
Internally-Developed Software
Internally developed software is developed by the compa-ny’s employees for internal use and includes loaded pay-roll (salaries, wages, benefits, and bonuses related to allsoftware development activities).
Appendix A A–1Annual Capital Expenditures: 2003
U.S. Census Bureau

Appendix B.Comparisons With Other Estimates of Capital Expenditures
Investment estimates, from the Annual Capital Expendi-tures Survey (ACES), that appear in this report, are notdirectly comparable with investment data from othersources. Variations in survey concepts, coverage, defini-tions, data collection techniques, estimation methodology,and sample designs may contribute to differences amongestimates. The following are examples of investment sur-veys and possible factors contributing to differencesbetween estimates. Data users are cautioned to reviewtechnical information from each data source before mak-ing comparisons of the estimates.
ECONOMIC CENSUS
The economic census is conducted every 5 years for yearsending in 2 and 7, and covers nearly all of the U.S.economy in its basic collection of establishment statistics.Total capital expenditures and depreciable assets data arecollected for mining, construction, and manufacturingestablishments. In addition, capital expenditures for new
and used structures and new and used equipment are col-lected for manufacturing establishments. Differences inthe reporting units of the economic census and ACES mayresult in differences in each survey’s estimates.
VALUE OF NEW CONSTRUCTION PUT IN PLACE(VPIP)
Estimates of the value of new construction put in place arecompiled from several sources. Estimates for some sectorsare based on sample surveys of construction project activ-ity. In addition to sampling variability and coverage, differ-ences in reporting units and respondent interpretationcontribute to variations in level and distribution of invest-ment data. Estimates for other sectors depend on datasupplied to federal agencies to meet regulatory reportingrequirements. Differences in the objectives of the regula-tory requirements and the ACES may contribute to differ-ences in estimates.
Appendix B B–1Annual Capital Expenditures: 2003
U.S. Census Bureau
Appendix C.Sampling and Estimation Methodologies
The estimates in this report are based on two stratifiedsimple random samples. The ACE-1 sample consists of45,994 companies with paid employees (determined bythe presence of payroll) in 2002. The ACE-2 sample con-sists of 15,000 businesses without employees. The twosample populations received different survey forms (seeAppendix D for an example of each survey form).
The scope of the survey was defined to include all private,nonfarm, domestic companies. Major exclusions from theframe were government-owned operations (including theU.S. Postal Service), foreign-owned operations of domesticcompanies, establishments located in U.S. Territories,establishments engaged in agricultural production (notagricultural services), and private households.
The 2002 Business Register (BR) was used to develop the2003 ACE-1 sample frame. The BR is the U.S. CensusBureau’s establishment-based database. The database con-tains records for each physical business entity with payrolllocated in the United States, including company ownershipinformation and current-year administrative data. In creat-ing the ACE-1 frame, establishment data in the BR filewere consolidated to create company-level records.Employment and payroll information was maintained foreach six-digit North American Industry Classification Sys-tem1 (NAICS) industry in which the company had activity.Next, payroll data for each company-level record were runthrough an algorithm to assign the company, first to anindustry sector (i.e., manufacturing, construction, etc.),then to a subsector (three-digit NAICS code), then to anindustry group (four-digit NAICS code), then to an industry(five-digit NAICS code), and finally to an ACES industrycode based on the industry. The resulting sample framecontained slightly more than 5.7 million companies.
The 2003 ACE-1 sampling frame consists of a certaintyportion and a noncertainty portion. The 16,970 companieswith 500 or more employees were selected with certainty.The remaining companies with 1 to 499 employees werethen grouped into 132 industry categories. Each industrywas then further divided into four strata. Since capitalexpenditures data were not available on the samplingframe, 2002 payroll was used as the stratification variable.
The stratification methodology resulted in minimizing thesample size subject to a desired level of reliability for eachindustry. The expected relative standard errors (RSEs)ranged from 1 to 3 percent.
The ACE-2 sample frame was selected from four catego-ries of small businesses.
• Companies with no payroll and no employees on March12 in the prior year, but with characteristics indicatingpossible employment during the survey period.
• Companies that had received an Employer Identification(EI) number within the last 2 years, but for which nopayroll, employment, or receipts data have yet beenreceived.
• Nonemployer corporations and partnerships.
• Nonemployer sole proprietorships with sales or receiptsof $1,000 or more.
Each of these four categories was treated as a separatestratum. The source of the first two categories of busi-nesses was the 2002 BR; the source of the second two cat-egories was the 2002 Nonemployer Database. Companieswithin each stratum were selected using a simple randomsample. From a universe of about 21.3 million businesses,15,000 businesses were selected
ESTIMATION
Each company selected for the survey has a sampleweight which is the inverse of its probability of selection.All sampled companies within the same stratum andindustry grouping have the same weight. Weights wereincreased to adjust for nonresponse. The coverage rate forall companies was 86.6 percent. The coverage rate is cal-culated by multiplying 100 by the ratio of the capitalexpenditures of all reporting companies weighted by theoriginal sample weights, to the capital expenditures of allreporting companies weighted by the adjusted-for-nonresponse sample weights. Weight adjustment and pub-lication estimation are described in the following subsec-tions.
Weight Adjustment
For estimation purposes, each company was placed into 1of 4 response-related categories:
1. Respondents.
1North American Industry Classification System (NAICS) –United States, 1997. For sale by National Technical InformationService (NTIS), Springfield, VA 22161. Call NTIS at 1-800-553-6847.
Appendix C C–1Annual Capital Expenditures: 2003
U.S. Census Bureau

2. Nonrespondents.
3. Not in business.
4. Known duplicates.
A company was considered a respondent or nonrespon-dent based on whether the company provided sufficientdata in items 1 or 2 of the ACE-1 survey form for theACE-1 segment or item 1 of the ACE-2 survey form for theACE-2 segment. Companies that went out of businessprior to 2003 and duplicates were dropped from the sur-vey. Companies that went out of business during the sur-vey year were kept in the sample and efforts were made tocollect data for the period the company was active.
ACE-1 segment. The following discussion assumes 660strata (strata designation h = 1, 2, . . ., 660) which arebased on 132 industries, each containing five strata(including the certainty stratum).
The original stratum weights (Wh) were adjusted to com-pensate for nonresponse. The adjusted weight is com-puted as follows:
Wh (adj) = Wh �(Phr + Phn)
(Phr)
where,
Wh(adj) is the adjusted stratum weight ofthe hth stratum
Wh =Nh
nh
is the original stratum weight ofthe hth stratum
Nh is the population size of the hth
stratumnh is the sample size of the hth stra-
tumPhr is the sum of total company pay-
roll for respondent companies instratum h
Phn is the sum of total company pay-roll for nonrespondent companiesin stratum h
ACE-2 segment. The ACE-2 segment initially was strati-fied into four strata based on the four small business cat-egories mentioned above. The stratum consisting of ‘‘com-panies with no payroll and no employees on March 12 inthe prior year, but with characteristics indicating possibleemployment during the survey period’’ was poststratifiedinto three strata. The stratum ‘‘companies which hadreceived an Employer Identification (EI) number within thelast 2 years, but for which no payroll, employment, orreceipts data have yet been received’’ was poststratifiedinto three strata. In both instances, the poststratificationwas based on updated administrative-record data thatwere not available at the time the sample frames were cre-ated. This method resulted in seven strata (strata designa-tion h = 1, 2, . . ., 8). The stratum population sizes,sample sizes, response counts, and stratum weights forthe six strata resulting from the poststratification were
modified accordingly. For these six strata, the followingformulas use these modified sizes and weights; for theremaining two strata, the formulas use the original stra-tum sizes and weights.
The stratum weights (Wh) were adjusted to compensate fornonresponse. The adjusted weight is computed as follows:
Wh (adj) = Wh ( nh
rh) =
Nh
rhwhere,
Wh (adj) is the adjusted stratum weight ofthe hth stratum
Wh =Nh
nh
is the stratum weight of the hth
stratum
Nh is the population size of the hth
stratumnh is the sample size of the hth stra-
tumrh is the number of respondents in
the hth stratum
Note: A statistical procedure was used in reweightingextreme outliers to minimize the mean square error of theestimates. Mean square error accounts for both samplingvariability and bias.
Publication Estimation
Publication cell estimates were computed by obtaining aweighted sum of reported values for companies treated asrespondents. For those strata undergoing nonresponseadjustment, the estimates for Xj are biased, since thismethod assumes that nonresponse is not a purely randomevent. No attempt was made to estimate the magnitude ofthis bias.
ACE-1 segment. The ACE-1 estimates were derived asfollows. Each estimated cell total, X̂j, is of the form
X̂j = �h=1
660
�i�h
�Wh(adj)� X(j),i,h�
where,
Wh(adj) is the adjusted weight of the hth
stratum
X(j),i,h is the value attributed to the ithcompany of stratum h, where j isthe publication cell of interest.
Note: Although a company was assigned to and sampledin one ACES industry, it could report expenditures in mul-tiple ACES industries. When this occurred, the reporteddata for all industries were inflated by the weight in thesample industry.
ACE-2 segment. The ACE-2 estimates were derived asfollows:
X̂j = �h=1
7
�i�h
�Wh(adj)� X(j),i,h�
C–2 Appendix C Annual Capital Expenditures: 2003
U.S. Census Bureau

where,
Wh (adj) is the adjusted weight of the hth
stratum
X(j),i,h is the value attributed to the ithcompany in stratum h, where j isthe publication cell of interest(note, since no industry level esti-mates are derived for ACE-2 com-panies, this j will always representa national-level cell estimate).
RELIABILITY OF THE ESTIMATES
The data shown in this report are estimated from a sampleand will differ from the data which would have beenobtained from a complete census. Two types of possibleerrors are associated with estimates based on data fromsample surveys: sampling errors and nonsampling errors.The accuracy of a survey result depends not only on thesampling errors and nonsampling errors measured butalso on the nonsampling errors not explicitly measured.For particular estimates, the total error may considerablyexceed the measured errors.
Sampling Variability
The sample used in this survey is one of many possiblesamples that could have been selected using the samplingmethodology described earlier. Each of these possiblesamples would likely yield different results. The RSE is ameasure of the variability among the estimates from thesepossible samples. The RSEs were calculated using a delete-a-group jackknife replicate variance estimator. The RSEaccounts for sampling variability but does not account fornonsampling error or systematic biases in the data. Bias isthe difference, averaged over all possible samples of thesame design and size, between the estimate and the truevalue being estimated.
The RSEs presented in the tables can be used to derive theSE of the estimate. The SE can be used to derive intervalestimates with prescribed levels of confidence that theinterval includes the average results of all samples:
a. intervals defined by one SE above and below thesample estimate will contain the true value about 68percent of the time,
b. intervals defined by 1.6 SE above and below the sampleestimate will contain the true value about 90 percent ofthe time,
c. intervals defined by two SEs above and below thesample estimate will contain the true value about 95percent of the time.
The SE of the estimate can be calculated by multiplyingthe RSE presented in the tables by the corresponding esti-mate. Note, the RSE is the measure of variability presentedfor all estimates in this publication except for the esti-mates of percent change presented in Table 2a, for whichwe provide the SE as the measure of variability (refer toTable 2b). Also note that RSEs in this publication are inpercentage form. They must be divided by 100 beforebeing multiplied by the corresponding estimate. Forexample, using data from Tables 4a and 4c, the SE fortotal nondurable manufacturing capital expenditureswould be calculated as follows:
�̂ (X̂j) � �RSE(X̂j)
100 �* Xj � �1.1
100� * $68,393 million � $752
The 90-percent confidence interval can be constructed bymultiplying 1.6 by the SE, adding this value to the esti-mate to create the upper bound, and subtracting it fromthe estimate to create the lower bound.
X̂j � [1.6 * �̂ (X̂j)]
Using data from Table 4a, for nondurable manufacturingcapital expenditures, a 90-percent confidence intervalwould be calculated as:
$68,393 million ± 1.6($752) = $68,393 ± $1,203million
Nonsampling Error
All surveys and censuses are subject to nonsamplingerrors. Nonsampling errors can be attributed to manysources: inability to obtain information about all compa-nies in the sample; inability or unwillingness on the partof respondents to provide correct information; responseerrors; definition difficulties; differences in the interpreta-tion of questions; mistakes in recording or coding thedata; and other errors of collection, response, coverage,and estimation for nonresponse.
Explicit measures of the effects of these nonsamplingerrors are not available. However, to minimize nonsam-pling error, all reports were reviewed for reasonablenessand consistency, and every effort was made to achieveaccurate response from all survey participants.
Coverage errors may have a significant effect on the accu-racy of estimates for this survey. The BR, which forms thebasis of our survey universe frame, may not contain allbusinesses. Also, businesses that are contained in the BRmay have their payroll misreported.
Appendix C C–3Annual Capital Expenditures: 2003
U.S. Census Bureau

Appendix D.Survey Forms and Instructions
2003 Annual Capital Expenditures Survey (ACE-1(S)) - - - - - - - - - - - - - - - - - - - - - - - - - - - - D–2
2003 Annual Capital Expenditures Survey (ACE-1(M)) - - - - - - - - - - - - - - - - - - - - - - - - - - D–11
2003 Annual Capital Expenditures Survey (ACE-1(Long))- - - - - - - - - - - - - - - - - - - - - - - D–27
2003 Instructions, Definitions, and Codes List (ACE-1(I))- - - - - - - - - - - - - - - - - - - - - - - D–43
2003 Annual Capital Expenditures Survey (ACE-2) - - - - - - - - - - - - - - - - - - - - - - - - - - - - - D–60
2003 Instructions and Definitions (ACE-2(I)) - - - - - - - - - - - - - - - - - - - - - - - - - - - - - - - - - - - - D–62
Appendix D D–1Annual Capital Expenditures: 2003
U.S. Census Bureau
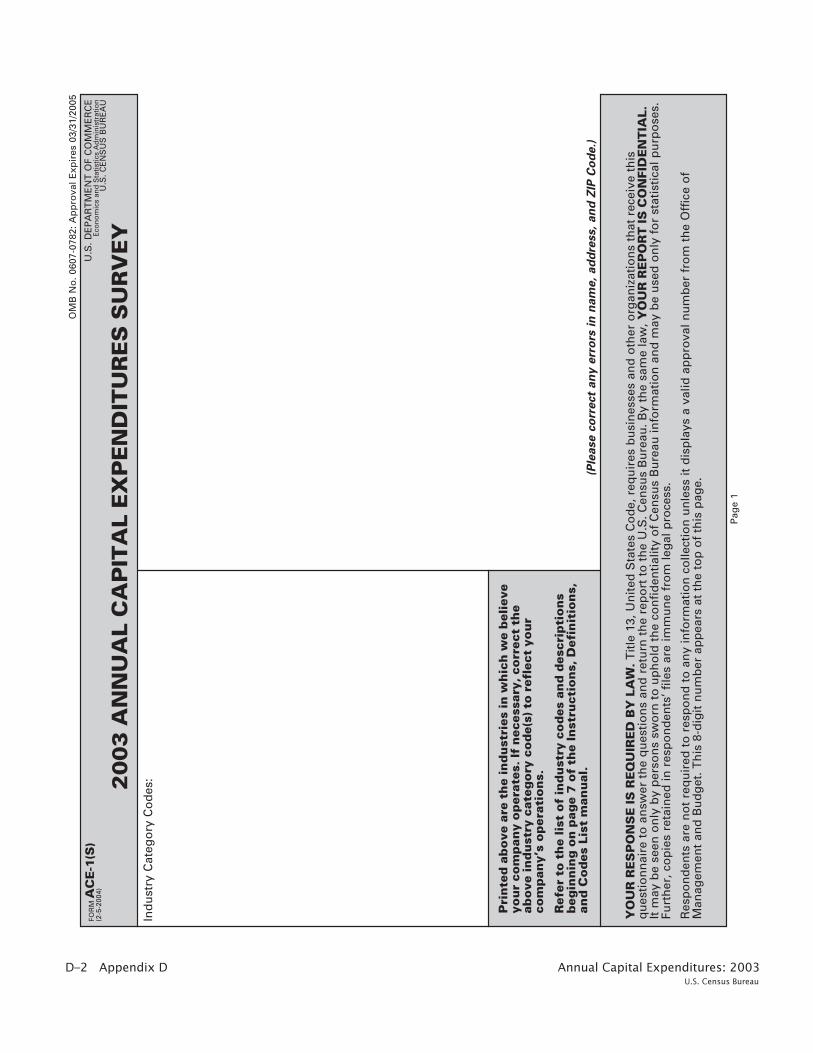
D–2 Appendix D Annual Capital Expenditures: 2003 U.S. Census Bureau
Pag
e 1
OM
B N
o. 0
607-
0782
: Ap
pro
val E
xpir
es 0
3/31
/200
5
FOR
MA
CE-1
(S)
(2-5
-200
4)
20
03
AN
NU
AL
CA
PIT
AL
EX
PE
ND
ITU
RE
S S
UR
VE
Y
(Ple
ase
co
rre
ct
an
y e
rro
rs i
n n
am
e,
ad
dre
ss,
an
d Z
IP C
od
e.)
U.S
. DE
PA
RT
ME
NT
OF
CO
MM
ER
CE
Eco
no
mic
s an
d S
tati
stic
s A
dm
inis
trat
ion
U.S
. CE
NS
US
BU
RE
AU
Ind
ust
ry C
ateg
ory
Co
des
:
Pri
nte
d a
bo
ve a
re t
he
ind
ust
ries
in
wh
ich
we
bel
ieve
you
r co
mp
any
op
erat
es. If
nec
essa
ry, co
rrec
t th
eab
ove
in
du
stry
cat
ego
ry c
od
e(s)
to
ref
lect
yo
ur
com
pan
y’s
op
erat
ion
s.
Ref
er t
o t
he
list
of
ind
ust
ry c
od
es a
nd
des
crip
tio
ns
beg
inn
ing
on
pag
e 7
of
the
Inst
ruct
ion
s, D
efin
itio
ns,
and
Co
des
Lis
t m
anu
al.
YO
UR
RE
SP
ON
SE
IS
RE
QU
IRE
D B
Y L
AW
. T
itle
13,
Un
ited
Sta
tes
Co
de,
req
uir
es b
usi
nes
ses
and
oth
er o
rgan
izat
ion
s th
at r
ecei
ve t
his
qu
esti
on
nai
re t
o a
nsw
er t
he
qu
esti
on
s an
d r
etu
rn t
he
rep
ort
to
th
e U
.S. C
ensu
s B
ure
au. B
y th
e sa
me
law
, Y
OU
R R
EP
OR
T IS
CO
NFI
DE
NT
IAL.
It m
ay b
e se
en o
nly
by
per
son
s sw
orn
to
up
ho
ld t
he
con
fid
enti
alit
y o
f C
ensu
s B
ure
au in
form
atio
n a
nd
may
be
use
d o
nly
fo
r st
atis
tica
l pu
rpo
ses.
Furt
her
, co
pie
s re
tain
ed in
res
po
nd
ents
’ file
s ar
e im
mu
ne
fro
m le
gal
pro
cess
.
Res
po
nd
ents
are
no
t re
qu
ired
to
res
po
nd
to
an
y in
form
atio
n c
olle
ctio
n u
nle
ss it
dis
pla
ys a
val
id a
pp
rova
l nu
mb
er f
rom
th
e O
ffic
e o
fM
anag
emen
t an
d B
ud
get
. Th
is 8
-dig
it n
um
ber
ap
pea
rs a
t th
e to
p o
f th
is p
age.
US
CE
NS
US
BU
RE
AU

Appendix D D–3Annual Capital Expenditures: 2003U.S. Census Bureau
Pag
e 2
FOR
M A
CE
-1(S
) (2
-5-2
004)
DE
FIN
ITIO
NS
AN
D G
EN
ER
AL
INS
TR
UC
TIO
NS
•S
UR
VE
Y S
CO
PE
–T
his
surv
ey c
olle
cts
cap
ital
exp
end
itu
res
dat
a fo
rn
on
farm
co
mp
anie
s, o
rgan
izat
ion
s, a
nd
ass
oci
atio
ns
op
erat
ing
wit
hin
th
e U
nit
ed S
tate
s. T
his
incl
ud
es c
hu
rch
es a
nd
oth
ern
on
-pro
fit
org
aniz
atio
ns,
go
vern
men
t o
wn
ed b
ut
pri
vate
ly o
per
ated
org
aniz
atio
ns,
tri
bal
bu
sin
ess
op
erat
ion
s, a
nd
ag
ricu
ltu
ral s
ervi
ces.
Ag
ricu
ltu
ral p
rod
uct
ion
sh
ou
ld b
e ex
clu
ded
.
PLE
AS
E R
EFE
R T
O T
HE
EN
CLO
SE
D IN
ST
RU
CT
ION
S,
DE
FIN
ITIO
NS
, A
ND
CO
DE
S L
IST
MA
NU
AL
BE
FOR
EC
OM
PLE
TIN
G T
HE
SU
RV
EY
.
•S
UR
VE
Y P
ER
IOD
–R
epo
rtd
ata
for
cale
nd
ar y
ear
2003
. Ref
er t
op
age
1 o
f th
e in
stru
ctio
n m
anu
al if
you
r re
cord
s ar
e o
n a
fisc
al y
ear
bas
is.
•If
yo
ur
com
pan
y ce
ased
op
erat
ion
s d
uri
ng
th
e su
rvey
yea
r,co
mp
lete
th
e fo
rm f
or
the
per
iod
of
tim
e th
e co
mp
any
was
in
op
erat
ion
.
•R
easo
nab
le e
stim
ates
are
acc
epta
ble
.
•R
epo
rt d
olla
rva
lues
ro
un
ded
to
th
ou
san
ds.
Exa
mp
le: If
fig
ure
is
$1
79
,12
5,6
28
.00
rep
ort
Mil
179
•T
o r
etu
rn t
he
form
by
FAX
, fax
to
1–8
00
–43
8–8
04
0.
•If
yo
u h
ave
any
qu
esti
on
s re
gar
din
g t
his
su
rvey
or
nee
d h
elp
com
ple
tin
g it,
cal
l 1
–80
0–5
28
–30
49
.
Thou
126
•P
leas
e co
mp
lete
an
d r
etu
rn t
he
form
in t
he
enve
lop
e p
rovi
ded
by
the
du
e d
ate
sho
wn
on
th
e to
p o
f th
e p
age
wit
h y
ou
r m
ailin
gad
dre
ss.T
o r
equ
est
ano
ther
su
rvey
fo
rm o
r an
ext
ensi
on
of
tim
efo
r fi
ling
, cal
l 1–8
00
–52
8–3
04
9.
FRO
M T
HE
DIR
EC
TO
R
U.S
. CE
NS
US
BU
RE
AU
We
are
con
du
ctin
g t
he
An
nu
al C
apit
al E
xpen
dit
ure
s S
urv
ey, a
nd
we
wo
uld
like
yo
u t
o h
elp
by
com
ple
tin
gth
e en
clo
sed
su
rvey
fo
rm.
Th
e U
.S. C
ensu
s B
ure
au’s
An
nu
al C
apit
al E
xpen
dit
ure
s S
urv
ey is
a k
ey s
ou
rce
of
info
rmat
ion
ab
ou
t o
ur
cou
ntr
y’s
eco
no
mic
per
form
ance
. Bu
sin
ess
inve
stm
ent
in s
tru
ctu
res
and
eq
uip
men
t is
an
imp
ort
ant
com
po
nen
t o
f G
ross
Do
mes
tic
Pro
du
ct. I
nve
stm
ent
dat
a ar
e u
sefu
l fo
r id
enti
fyin
g b
usi
nes
s o
pp
ort
un
itie
s,p
rod
uct
dev
elo
pm
ent,
an
d s
trat
egic
pla
nn
ing
.
Tit
le 1
3 o
f th
e U
nit
ed S
tate
s C
od
e re
qu
ires
yo
u t
o a
nsw
er t
his
su
rvey
; it
also
req
uir
es u
s to
kee
p y
ou
rre
spo
nse
co
nfi
den
tial
.
We
real
ize
that
co
mp
leti
ng
th
is s
urv
ey is
a b
urd
en f
or
you
. We
ho
pe,
ho
wev
er, t
hat
yo
u a
pp
reci
ate
the
imp
ort
ance
of
you
r re
spo
nse
in p
rovi
din
g a
ccu
rate
dat
a ab
ou
t o
ur
Nat
ion
’s e
con
om
ic p
erfo
rman
ce. W
eh
ave
limit
ed t
he
surv
ey s
amp
le t
o t
he
few
est
po
ssib
le n
um
ber
of
rep
rese
nta
tive
fir
ms,
an
d w
e ac
cep
tes
tim
ates
if b
oo
k fi
gu
res
are
no
t av
aila
ble
.
Ple
ase
revi
ew t
he
inst
ruct
ion
s, c
om
ple
te t
he
form
, an
d r
etu
rn it
wit
hin
30
day
s. T
he
inst
ruct
ion
sca
n a
ssis
t yo
u o
n h
ow
to
rep
ort
fo
r ea
ch it
em. R
etu
rnin
g y
ou
r fo
rm p
rom
ptl
y h
elp
s u
s ke
ep f
ollo
w-u
pco
sts
do
wn
. If
you
hav
e an
y q
ues
tio
ns
or
com
men
ts, p
leas
e ca
ll u
s to
ll-fr
ee a
t 1
-80
0-5
28
-30
49
.
Th
ank
you
in a
dva
nce
fo
r yo
ur
coo
per
atio
n.
Sin
cere
ly,
En
clo
sure
Ch
arle
s Lo
uis
Kin
can
no
n

D–4 Appendix D Annual Capital Expenditures: 2003 U.S. Census Bureau
Pag
e 3
ITE
M 1
A–
DO
ME
ST
ICD
EP
RE
CIA
BLE
AS
SE
T D
AT
A
DE
PR
EC
IAB
LE A
SS
ET
S–
New
an
d u
sed
bu
ildin
gs,
str
uct
ure
s, m
ach
iner
y, a
nd
eq
uip
men
t fo
r w
hic
h d
epre
ciat
ion
or
amo
rtiz
atio
n a
cco
un
tsar
e o
rdin
arily
mai
nta
ined
. Th
e va
lue
of
lan
d d
evel
op
men
t an
d im
pro
vem
ents
, as
wel
l as
exp
lora
tio
n a
nd
dev
elo
pm
ent
of
min
eral
pro
per
ties
, are
incl
ud
ed.
Exc
lud
e•
Co
st o
f la
nd
an
d d
eple
tab
le a
sset
s su
ch a
s m
iner
al a
nd
tim
ber
rig
hts
;•
Ass
ets
of
fore
ign
op
erat
ion
s;•
Ass
ets
leas
ed t
o o
ther
s u
nd
er c
apit
al le
ase
arra
ng
emen
ts;
•P
aten
ts, c
op
yrig
hts
, tra
dem
arks
, fra
nch
ises
, an
d g
oo
dw
ill.
CA
PIT
AL
EX
PE
ND
ITU
RE
S–
All
cap
ital
ized
co
sts
du
rin
g 2
003
for
bo
th n
ew a
nd
use
d s
tru
ctu
res
and
eq
uip
men
t ch
arg
eab
le t
o a
sset
acco
un
ts, a
nd
fo
r w
hic
h d
epre
ciat
ion
or
amo
rtiz
atio
n a
cco
un
ts a
re o
rdin
arily
mai
nta
ined
.
Incl
ud
e•
Exp
end
itu
res
for
maj
or
add
itio
ns,
alt
erat
ion
s, a
nd
cap
ital
ized
rep
airs
to
exi
stin
g s
tru
ctu
res,
wh
eth
er p
erfo
rmed
by
aco
ntr
acto
r o
r co
mp
lete
d in
-ho
use
;•
Gro
ss a
dd
itio
ns
du
rin
g t
he
year
to
co
nst
ruct
ion
-in
-pro
gre
ss a
cco
un
ts f
or
pro
ject
s la
stin
g m
ore
th
an o
ne
year
, eve
n if
th
e as
set
was
no
t in
use
an
d n
ot
yet
dep
reci
ated
;
•C
apit
aliz
ed c
ost
of
asse
ts p
rod
uce
d o
r p
urc
has
ed t
hen
leas
ed a
s th
e le
sso
r u
nd
er o
per
atin
g le
ases
; •
Cap
ital
co
sts
for
feas
ibili
ty s
tud
ies,
arc
hit
ectu
ral,
leg
al, i
nst
alla
tio
n, a
nd
en
gin
eeri
ng
fee
s;•
Co
st o
f as
sets
acq
uir
ed u
nd
er c
apit
al le
ases
en
tere
d in
to d
uri
ng
th
e su
rvey
yea
r;•
Exp
end
itu
res
for
cap
ital
ized
imp
rove
men
ts m
ade
to a
sset
s le
ased
fro
m o
ther
s (l
ease
ho
ld im
pro
vem
ents
);•
Exp
end
itu
res
for
dev
elo
pm
enta
l an
d e
xplo
rato
ry d
rilli
ng
act
ivit
ies,
incl
ud
ing
inta
ng
ible
dri
llin
g c
ost
s;•
Cap
ital
ized
inte
rest
ch
arg
es o
n lo
ans
wit
h w
hic
h c
apit
al p
roje
cts
are
fin
ance
d, i
f co
nsi
sten
t w
ith
th
eS
tate
men
t o
f Fi
nan
cial
Acc
ou
nti
ng
Sta
nd
ard
s B
oar
d (
FAS
B)
Nu
mb
er 3
4;
•E
xpen
dit
ure
s fo
r la
nd
dev
elo
pm
ent
and
imp
rove
men
t, in
clu
din
g d
emo
litio
n o
f b
uild
ing
s, la
nd
ser
vici
ng
,an
d s
ite
pre
par
atio
n.
Exc
lud
e
OT
HE
R A
DD
ITIO
NS
AN
D A
CQ
UIS
ITIO
NS
– A
dd
itio
ns
to y
ou
r d
epre
ciab
le a
sset
acc
ou
nts
, in
clu
din
g d
epre
ciab
le a
sset
s ac
qu
ired
th
rou
gh
mer
ger
s an
d a
cqu
isit
ion
s, if
no
t co
nsi
der
ed c
apit
al e
xpen
dit
ure
s.
•E
xpen
dit
ure
s fo
r st
ruct
ure
s o
r eq
uip
men
t b
y su
bsi
dia
ries
an
d b
ran
ches
loca
ted
ou
tsid
e th
e U
nit
ed S
tate
s;•
Val
ue
of
stru
ctu
res
bu
ilt o
r w
ork
per
form
ed b
y yo
ur
ente
rpri
se o
n c
on
trac
t to
oth
ers;
•It
ems
char
gea
ble
as
curr
ent
op
erat
ing
exp
ense
s su
ch a
s co
st o
f m
ain
ten
ance
, no
rmal
rep
airs
, an
d s
up
plie
s;•
Exp
end
itu
res
for
go
od
will
, pat
ents
, or
cop
yrig
hts
;•
Pay
men
ts t
o o
ther
s fo
r st
ruct
ure
s an
d e
qu
ipm
ent
acq
uir
ed u
nd
er o
per
atin
g le
ases
or
ren
ted
;•
Exp
end
itu
res
for
pro
per
ty w
hic
h is
leas
ed t
o o
ther
s as
par
t o
f a
cap
ital
(fu
ll-p
ayo
ut
or
equ
ity)
leas
e ar
ran
gem
ent.
ITE
M 1
B–
GR
OS
SS
ALE
S, O
PE
RA
TIN
G R
EC
EIP
TS
, A
ND
RE
VE
NU
ES
Incl
ud
e•
Gro
ss s
ales
, op
erat
ing
rec
eip
ts, a
nd
rev
enu
es f
rom
tax
able
op
erat
ion
s as
wel
l as
tota
l rev
enu
es f
rom
tax-
exem
pt
acti
viti
es. S
ee p
age
4 o
f th
e in
stru
ctio
n m
anu
al f
or
add
itio
nal
det
ails
reg
ard
ing
th
is it
em.
DE
FIN
ITIO
NS
AN
D G
EN
ER
AL
INS
TR
UC
TIO
NS
•V
alu
e o
f as
sets
exp
ense
d a
s p
erm
itte
d u
nd
er S
ecti
on
179
of
the
U.S
. In
tern
al R
even
ue
Co
de;
•C
apit
aliz
ed c
om
pu
ter
soft
war
e;
FOR
M A
CE
-1(S
) (2
-5-2
004)
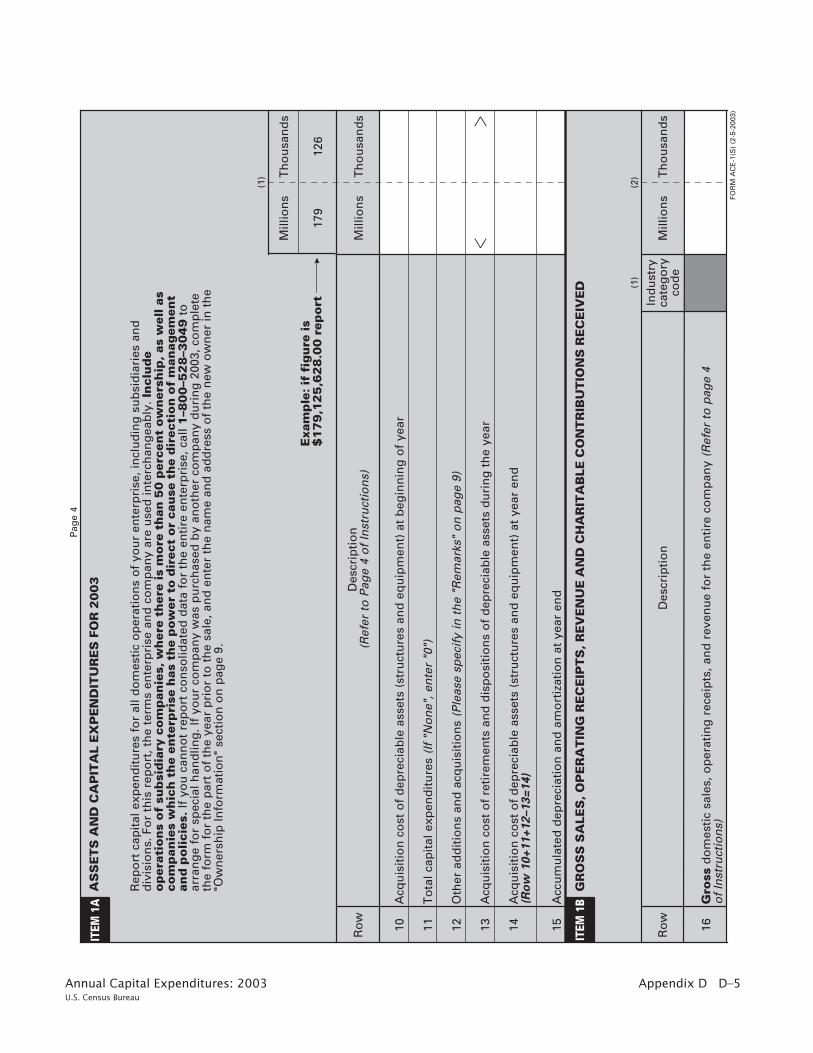
Appendix D D–5Annual Capital Expenditures: 2003U.S. Census Bureau
ITEM
1A
Exa
mp
le: if
fig
ure
is
$1
79
,12
5,6
28
.00
rep
ort
Ro
wD
escr
ipti
on
(Ref
er t
o P
age
4 o
f In
stru
ctio
ns)
10 11 12 13 14
Th
ou
san
ds
15
��
Acq
uis
itio
n c
ost
of
dep
reci
able
ass
ets
(str
uct
ure
s an
d e
qu
ipm
ent)
at
beg
inn
ing
of
year
To
tal c
apit
al e
xpen
dit
ure
s (I
f "N
on
e", e
nte
r "0
")
Oth
er a
dd
itio
ns
and
acq
uis
itio
ns
(Ple
ase
spec
ify
in t
he
"Rem
arks
" o
n p
age
9)
Acq
uis
itio
n c
ost
of
reti
rem
ents
an
d d
isp
osi
tio
ns
of
dep
reci
able
ass
ets
du
rin
g t
he
year
Acq
uis
itio
n c
ost
of
dep
reci
able
ass
ets
(str
uct
ure
s an
d e
qu
ipm
ent)
at
year
en
d(R
ow
10
+1
1+
12
–1
3=
14
)
Acc
um
ula
ted
dep
reci
atio
n a
nd
am
ort
izat
ion
at
year
en
d
(1)
Pag
e 4
AS
SE
TS
AN
D C
AP
ITA
L E
XP
EN
DIT
UR
ES
FO
R 2
00
3
Rep
ort
cap
ital
exp
end
itu
res
for
all d
om
esti
c o
per
atio
ns
of
you
r en
terp
rise
, in
clu
din
g s
ub
sid
iari
es a
nd
div
isio
ns.
Fo
r th
is r
epo
rt, t
he
term
s en
terp
rise
an
d c
om
pan
y ar
e u
sed
inte
rch
ang
eab
ly. In
clu
de
op
erat
ion
s o
f su
bsi
dia
ry c
om
pan
ies,
wh
ere
ther
e is
mo
re t
han
50
per
cen
t o
wn
ersh
ip, as
wel
l as
com
pan
ies
wh
ich
th
e en
terp
rise
has
th
e p
ow
er t
o d
irec
t o
r ca
use
th
e d
irec
tio
n o
f m
anag
emen
tan
d p
olici
es.
If y
ou
can
no
t re
po
rt c
on
solid
ated
dat
a fo
r th
e en
tire
en
terp
rise
, cal
l 1–8
00
–52
8–3
04
9to
arra
ng
e fo
r sp
ecia
l han
dlin
g. I
f yo
ur
com
pan
y w
as p
urc
has
ed b
y an
oth
er c
om
pan
y d
uri
ng
200
3, c
om
ple
teth
e fo
rm f
or
the
par
t o
f th
e ye
ar p
rio
r to
th
e sa
le, a
nd
en
ter
the
nam
e an
d a
dd
ress
of
the
new
ow
ner
in t
he
"Ow
ner
ship
Info
rmat
ion
" se
ctio
n o
n p
age
9.
Mill
ion
s
ITEM
1B
Ro
wD
escr
ipti
on
(1)
Mill
ion
sIn
du
stry
cate
go
ryco
de
Gro
ssd
om
esti
c sa
les,
op
erat
ing
rec
eip
ts, a
nd
rev
enu
e fo
r th
e en
tire
co
mp
any
(Ref
er t
o p
age
4 o
f In
stru
ctio
ns)
16
179
126
Mill
ion
sT
ho
usa
nd
s
GR
OS
S S
ALE
S, O
PE
RA
TIN
G R
EC
EIP
TS
, R
EV
EN
UE
AN
D C
HA
RIT
AB
LE C
ON
TR
IBU
TIO
NS
RE
CE
IVE
D
(2) T
ho
usa
nd
s
FOR
M A
CE
-1(S
) (2
-5-2
003)
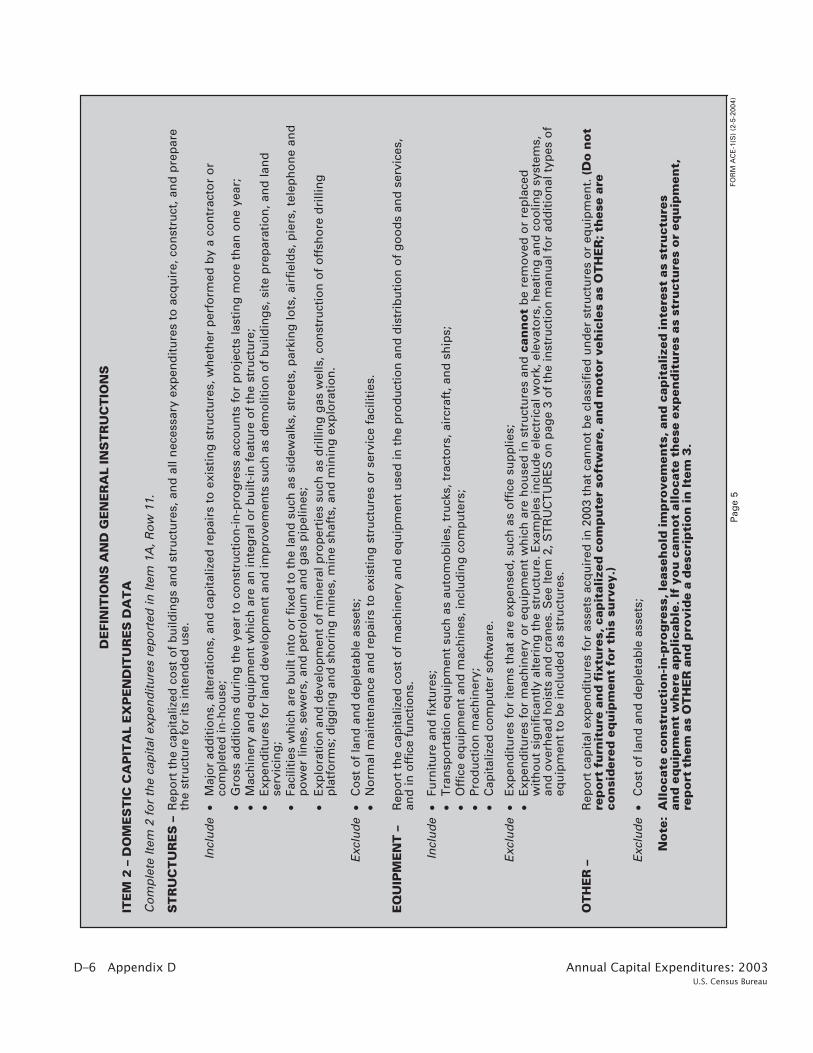
D–6 Appendix D Annual Capital Expenditures: 2003 U.S. Census Bureau
Pag
e 5
ITE
M 2
–D
OM
ES
TIC
CA
PIT
AL
EX
PE
ND
ITU
RE
S D
AT
A
ST
RU
CT
UR
ES
–
Exc
lud
e
Incl
ud
e
Exc
lud
e
Co
mp
lete
Item
2 f
or
the
cap
ital
exp
end
itu
res
rep
ort
ed in
Item
1A
, Ro
w 1
1.
Rep
ort
th
e ca
pit
aliz
ed c
ost
of
bu
ildin
gs
and
str
uct
ure
s, a
nd
all
nec
essa
ry e
xpen
dit
ure
s to
acq
uir
e, c
on
stru
ct, a
nd
pre
par
eth
e st
ruct
ure
fo
r it
s in
ten
ded
use
.
•M
ajo
r ad
dit
ion
s, a
lter
atio
ns,
an
d c
apit
aliz
ed r
epai
rs t
o e
xist
ing
str
uct
ure
s, w
het
her
per
form
ed b
y a
con
trac
tor
or
com
ple
ted
in-h
ou
se;
•M
ach
iner
y an
d e
qu
ipm
ent
wh
ich
are
an
inte
gra
l or
bu
ilt-i
n f
eatu
re o
f th
e st
ruct
ure
;•
Exp
end
itu
res
for
lan
d d
evel
op
men
t an
d im
pro
vem
ents
su
ch a
s d
emo
litio
n o
f b
uild
ing
s, s
ite
pre
par
atio
n, a
nd
lan
dse
rvic
ing
;•
Faci
litie
s w
hic
h a
re b
uilt
into
or
fixe
d t
o t
he
lan
d s
uch
as
sid
ewal
ks, s
tree
ts, p
arki
ng
lots
, air
fiel
ds,
pie
rs, t
elep
ho
ne
and
po
wer
lin
es, s
ewer
s, a
nd
pet
role
um
an
d g
as p
ipel
ines
;•
Exp
lora
tio
n a
nd
dev
elo
pm
ent
of
min
eral
pro
per
ties
su
ch a
s d
rilli
ng
gas
wel
ls, c
on
stru
ctio
n o
f o
ffsh
ore
dri
llin
gp
latf
orm
s; d
igg
ing
an
d s
ho
rin
g m
ines
, min
e sh
afts
, an
d m
inin
g e
xplo
rati
on
.
•C
ost
of
lan
d a
nd
dep
leta
ble
ass
ets;
•N
orm
al m
ain
ten
ance
an
d r
epai
rs t
o e
xist
ing
str
uct
ure
s o
r se
rvic
e fa
cilit
ies.
Rep
ort
th
e ca
pit
aliz
ed c
ost
of
mac
hin
ery
and
eq
uip
men
t u
sed
in t
he
pro
du
ctio
n a
nd
dis
trib
uti
on
of
go
od
s an
d s
ervi
ces,
and
in o
ffic
e fu
nct
ion
s.
•Fu
rnit
ure
an
d f
ixtu
res;
•T
ran
spo
rtat
ion
eq
uip
men
t su
ch a
s au
tom
ob
iles,
tru
cks,
tra
cto
rs, a
ircr
aft,
an
d s
hip
s;•
Off
ice
equ
ipm
ent
and
mac
hin
es, i
ncl
ud
ing
co
mp
ute
rs;
•E
xpen
dit
ure
s fo
r it
ems
that
are
exp
ense
d, s
uch
as
off
ice
sup
plie
s;•
Exp
end
itu
res
for
mac
hin
ery
or
equ
ipm
ent
wh
ich
are
ho
use
d in
str
uct
ure
s an
d c
ann
ot
be
rem
ove
d o
r re
pla
ced
wit
ho
ut
sig
nif
ican
tly
alte
rin
g t
he
stru
ctu
re. E
xam
ple
s in
clu
de
elec
tric
al w
ork
, ele
vato
rs, h
eati
ng
an
d c
oo
ling
sys
tem
s,an
d o
verh
ead
ho
ists
an
d c
ran
es. S
ee It
em 2
, ST
RU
CT
UR
ES
on
pag
e 3
of
the
inst
ruct
ion
man
ual
fo
r ad
dit
ion
al t
ypes
of
equ
ipm
ent
to b
e in
clu
ded
as
stru
ctu
res.
OT
HE
R –
Rep
ort
cap
ital
exp
end
itu
res
for
asse
ts a
cqu
ired
in 2
003
that
can
no
t b
e cl
assi
fied
un
der
str
uct
ure
s o
r eq
uip
men
t. (D
o n
ot
rep
ort
fu
rnit
ure
an
d f
ixtu
res,
cap
ital
ized
co
mp
ute
r so
ftw
are,
an
d m
oto
r ve
hic
les
as O
TH
ER
; th
ese
are
con
sid
ered
eq
uip
men
t fo
r th
is s
urv
ey.)
•C
ost
of
lan
d a
nd
dep
leta
ble
ass
ets;
No
te:
•P
rod
uct
ion
mac
hin
ery;
•C
apit
aliz
ed c
om
pu
ter
soft
war
e.
EQ
UIP
ME
NT
–
Incl
ud
e
Exc
lud
e
All
oca
te c
on
stru
ctio
n-i
n-p
rog
ress
, le
aseh
old
im
pro
vem
ents
, an
d c
apit
aliz
ed in
tere
st a
s st
ruct
ure
san
d e
qu
ipm
ent
wh
ere
app
lica
ble
. If
yo
u c
ann
ot
allo
cate
th
ese
exp
end
itu
res
as s
tru
ctu
res
or
equ
ipm
ent,
re
po
rt t
hem
as
OT
HE
R a
nd
pro
vid
e a
des
crip
tio
n in
Ite
m 3
.
DE
FIN
ITIO
NS
AN
D G
EN
ER
AL
INS
TR
UC
TIO
NS
•G
ross
ad
dit
ion
s d
uri
ng
th
e ye
ar t
o c
on
stru
ctio
n-i
n-p
rog
ress
acc
ou
nts
fo
r p
roje
cts
last
ing
mo
re t
han
on
e ye
ar;
FOR
M A
CE
-1(S
) (2
-5-2
004)

Appendix D D–7Annual Capital Expenditures: 2003U.S. Census Bureau
CA
PITA
L EX
PEN
DIT
UR
ES(R
efer
to
page
2 o
f In
stru
ctio
ns)
(4)
(1)
(2)
(3)
Str
uct
ure
sE
qu
ipm
ent
Oth
er
Mil
Th
ou
ITE
M 2
Rep
ort
th
e fo
llo
win
g d
om
esti
c ca
pit
al e
xpen
dit
ure
s d
ata
for
the
enti
reco
mp
any.
(Ref
er t
o p
age
4 o
f In
stru
ctio
ns)
ITE
M 3
List
the
item
s in
clud
ed in
"O
ther
". Re
port
in th
ousa
nds
of d
olla
rs. F
urni
ture
and
fix
ture
s, c
ompu
ters
, cap
ital
ized
com
pute
r so
ftw
are,
and
mot
orve
hicl
essh
ould
be
repo
rted
as
equi
pmen
t. Le
aseh
old
impr
ovem
ents
sho
uld
be c
onsi
dere
d st
ruct
ures
or
equi
pmen
t bas
ed o
n w
hat i
s be
ing
impr
oved
.
ITE
M 4
Ro
w
Ro
w
20 21 22 30 31
(2)
Des
crip
tio
n o
f C
apit
al E
xpen
dit
ure
s
Cap
ital e
xpen
ditu
res
for
NEW
str
uctu
res
and
equi
pmen
t(In
clud
e m
ajor
add
ition
s, a
ltera
tions
, and
cap
italiz
edre
pair
s to
exi
stin
g st
ruct
ures
)
Cap
ital
exp
end
itu
res
for
US
ED
str
uct
ure
s an
deq
uip
men
t
TO
TA
L ca
pit
al e
xpen
dit
ure
s (A
dd
Ro
ws 2
0+
21)
41Ro
w
For
new
cap
ital
exp
end
itu
res
rep
ort
ed in
Item
2, R
ow
20,
Co
lum
n (
4), r
epo
rt t
he
esti
mat
ed c
ost
of
asse
tsac
qu
ired
un
der
CA
PIT
AL
LEA
SE
arr
ang
emen
ts e
nte
red
into
du
rin
g t
he
year
. Exc
lud
e p
aym
ents
fo
ro
per
atin
g le
ases
an
d c
apit
aliz
ed c
ost
s o
f le
aseh
old
imp
rove
men
ts. (
Ref
er t
o p
age
5 o
f th
e In
stru
ctio
ns)
TO
TA
L
(1)
(1)
ITE
M 5
50Ro
w
Pag
e 6
Mil
Th
ou
Mil
Th
ou
Mil
Th
ou
Th
ou
CA
PIT
AL
EX
PE
ND
ITU
RE
S
To
tal
(Ad
d c
olu
mn
s 1
+2+
3)
Mil
Th
ou
179
126
Exa
mp
le: if
fig
ure
is
$1
79
,12
5,6
28
.00
rep
ort
Mil
Th
ou
Mil
To
tal
sh
ou
ld e
qu
al
Ite
m 1
A,
Ro
w 1
1
Mil
Th
ou
Mil
Th
ou
Mil
Th
ou
Mil
Th
ou
Pre
pac
kag
ed(1
)V
endo
r- c
usto
miz
ed(2
)(3
)
To
tal
(Ad
d c
olu
mn
s 1
+2
+3
)(4
)C
AP
ITA
LIZ
ED
CO
MP
UT
ER
SO
FTW
AR
E
(Ref
er t
o p
age
5 o
f In
stru
ctio
ns)
Rep
ort
capi
tal e
xpen
ditu
res
for
com
pute
r so
ftw
are
deve
lope
d or
obt
aine
d fo
r in
tern
al u
se d
urin
g th
e ye
ar.
Incl
ude
amou
nts
in It
em 1
A a
nd It
em 2
.
FOR
M A
CE
-1(S
) (2
-5-2
004)
Inte
rnal
ly-d
evel
oped
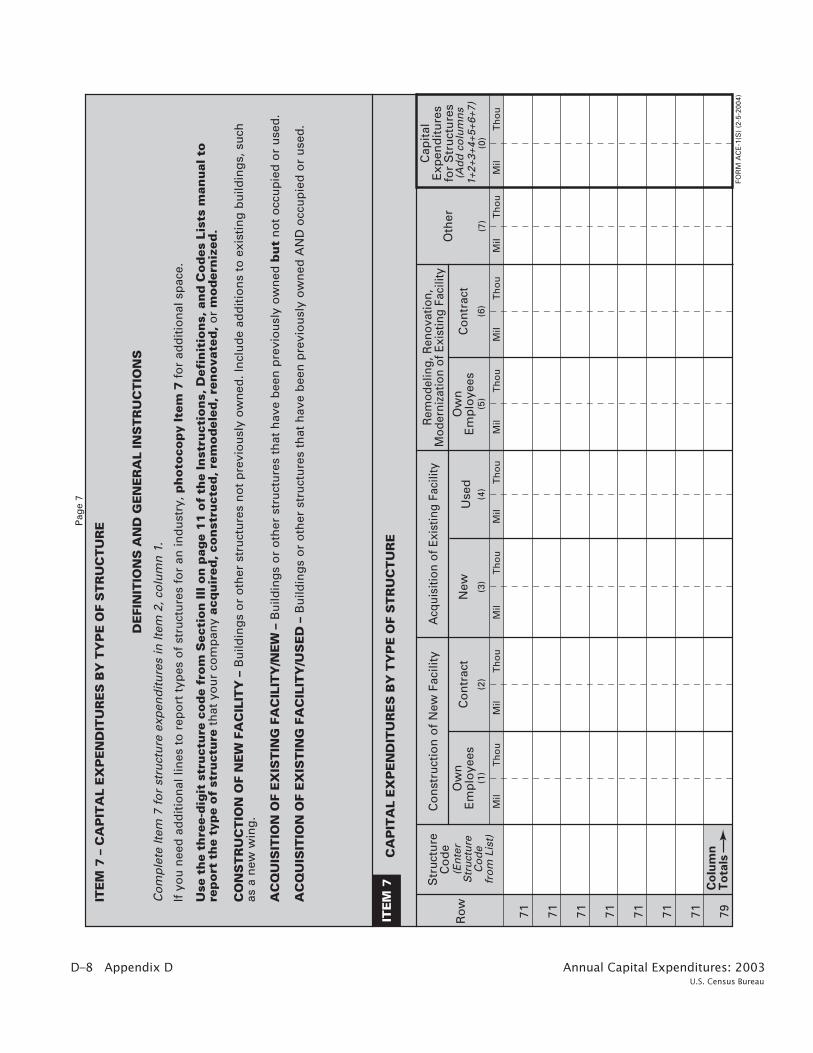
D–8 Appendix D Annual Capital Expenditures: 2003 U.S. Census Bureau
Pag
e 7
FOR
M A
CE
-1(S
) (2
-5-2
004)
(En
ter
Str
uct
ure
Co
de
fro
m L
ist)
(0)
(3)
(7)
Use
d
Rem
odel
ing,
Ren
ovat
ion,
Mod
erni
zatio
n of
Exi
stin
g Fa
cilit
yO
ther
Mil
Th
ou
Ro
w
71 71 71 71 71 71 71 79
Mil
Th
ou
Mil
Th
ou
Mil
Th
ou
(2)
New
Mil
Th
ou
(1)
Co
ntr
act
Mil
Th
ou
Cap
ital
Exp
end
itu
res
for
Str
uct
ure
sO
wn
Em
plo
yees
Co
nst
ruct
ion
of
New
Fac
ility
Acq
uisi
tion
of E
xist
ing
Faci
lity
(4)
Mil
Th
ou
Mil
Th
ou
(6)
(5)
Co
ntr
act
Ow
nE
mp
loye
es
Str
uct
ure
Co
de
(Ad
d c
olu
mn
s1+
2+3+
4+5+
6+7)
Co
lum
nT
ota
ls
ITE
M 7
CA
PIT
AL
EX
PE
ND
ITU
RE
S B
Y T
YP
E O
F S
TR
UC
TU
RE
ITE
M 7
–C
AP
ITA
LE
XP
EN
DIT
UR
ES
BY
TY
PE
OF
ST
RU
CT
UR
E
DE
FIN
ITIO
NS
AN
D G
EN
ER
AL
INS
TR
UC
TIO
NS
If y
ou
nee
d a
dd
itio
nal
lin
es t
o r
epo
rt t
ypes
of
stru
ctu
res
for
an in
du
stry
, ph
oto
cop
y It
em 7
fo
r ad
dit
ion
al s
pac
e.
Use
th
e th
ree-
dig
it s
tru
ctu
re c
od
e fr
om
Sec
tio
n III
on
pag
e 1
1 o
f th
e In
stru
ctio
ns,
Def
init
ion
s, a
nd
Co
des
Lis
ts m
anu
al t
ore
po
rt t
he
typ
e o
f st
ruct
ure
th
at y
ou
r co
mp
any
acq
uir
ed, co
nst
ruct
ed, re
mo
del
ed, re
no
vate
d,
or
mo
der
niz
ed.
CO
NS
TR
UC
TIO
N O
F N
EW
FA
CIL
ITY
– B
uild
ing
s o
r o
ther
str
uct
ure
s n
ot
pre
vio
usl
y o
wn
ed. I
ncl
ud
e ad
dit
ion
s to
exi
stin
g b
uild
ing
s, s
uch
as a
new
win
g.
AC
QU
ISIT
ION
OF
EX
IST
ING
FA
CIL
ITY
/NE
W–
Bu
ildin
gs
or
oth
er s
tru
ctu
res
that
hav
e b
een
pre
vio
usl
y o
wn
ed b
ut
no
t o
ccu
pie
d o
r u
sed
.
AC
QU
ISIT
ION
OF
EX
IST
ING
FA
CIL
ITY
/US
ED
– B
uild
ing
s o
r o
ther
str
uct
ure
s th
at h
ave
bee
n p
revi
ou
sly
ow
ned
AN
D o
ccu
pie
d o
r u
sed
.
Co
mp
lete
Item
7 f
or
stru
ctu
re e
xpen
dit
ure
s in
Item
2, c
olu
mn
1.
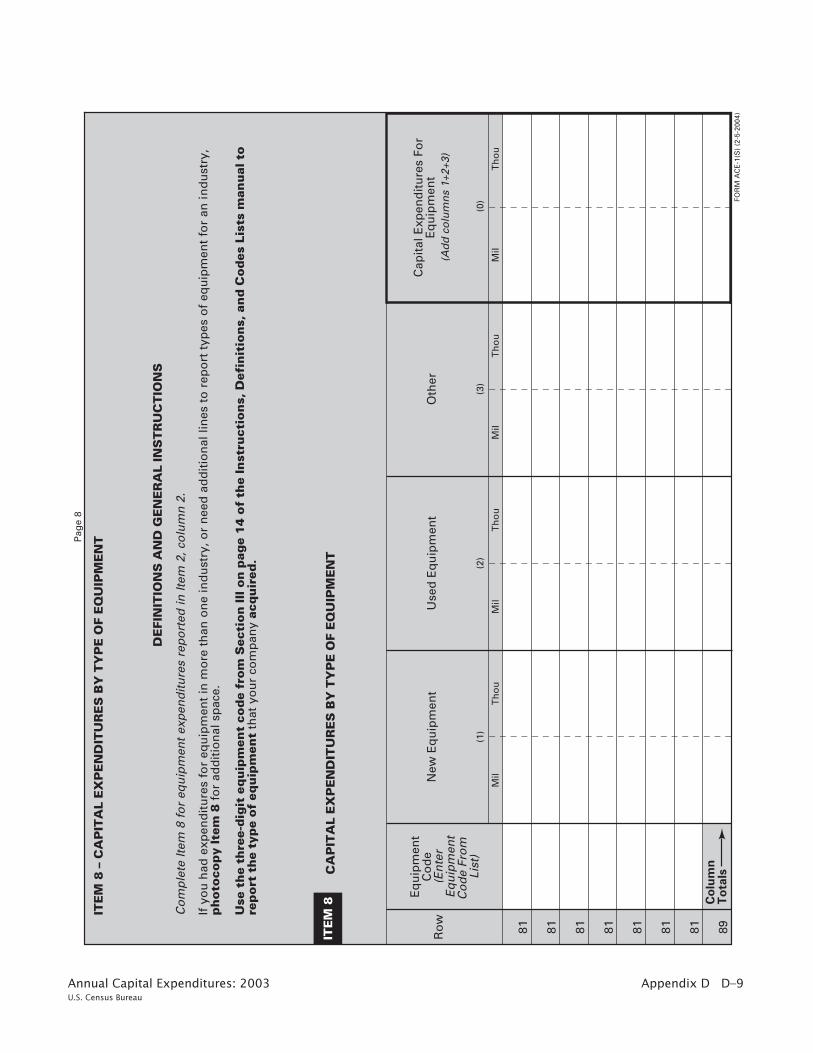
Appendix D D–9Annual Capital Expenditures: 2003U.S. Census Bureau
Pag
e 8
FOR
M A
CE
-1(S
) (2
-5-2
004)
(En
ter
Eq
uip
men
tC
od
e Fr
om
Li
st)
(1)
(3)
Oth
er
Mil
Ro
w
81 81 81 81 81 81 81 89C
olu
mn
To
tals
Mil
Mil
Th
ou
(0)
New
Eq
uip
men
t
Th
ou
Cap
ital
Exp
end
itu
res
For
Eq
uip
men
t
Th
ou
Th
ou
(2)
Use
d E
qu
ipm
ent
Eq
uip
men
tC
od
e
Mil
(Ad
d c
olu
mn
s 1+
2+3)
ITE
M 8
CA
PIT
AL
EX
PE
ND
ITU
RE
S B
Y T
YP
E O
F E
QU
IPM
EN
T
ITE
M 8
–C
AP
ITA
LE
XP
EN
DIT
UR
ES
BY
TY
PE
OF
EQ
UIP
ME
NT
DE
FIN
ITIO
NS
AN
D G
EN
ER
AL
INS
TR
UC
TIO
NS
If y
ou
had
exp
end
itu
res
for
equ
ipm
ent
in m
ore
th
an o
ne
ind
ust
ry, o
r n
eed
ad
dit
ion
al li
nes
to
rep
ort
typ
es o
f eq
uip
men
t fo
r an
in
du
stry
,p
ho
toco
py
Item
8 f
or
add
itio
nal
sp
ace.
Use
th
e th
ree-
dig
it e
qu
ipm
ent
cod
e fr
om
Sec
tio
n III
on
pag
e 1
4 o
f th
e In
stru
ctio
ns,
Def
init
ion
s, a
nd
Co
des
Lis
ts m
anu
al t
ore
po
rt t
he
typ
e o
f eq
uip
men
t th
at y
ou
r co
mp
any
acq
uir
ed.
Co
mp
lete
Item
8 f
or
equ
ipm
ent
exp
end
itu
res
rep
ort
ed in
Item
2, c
olu
mn
2.
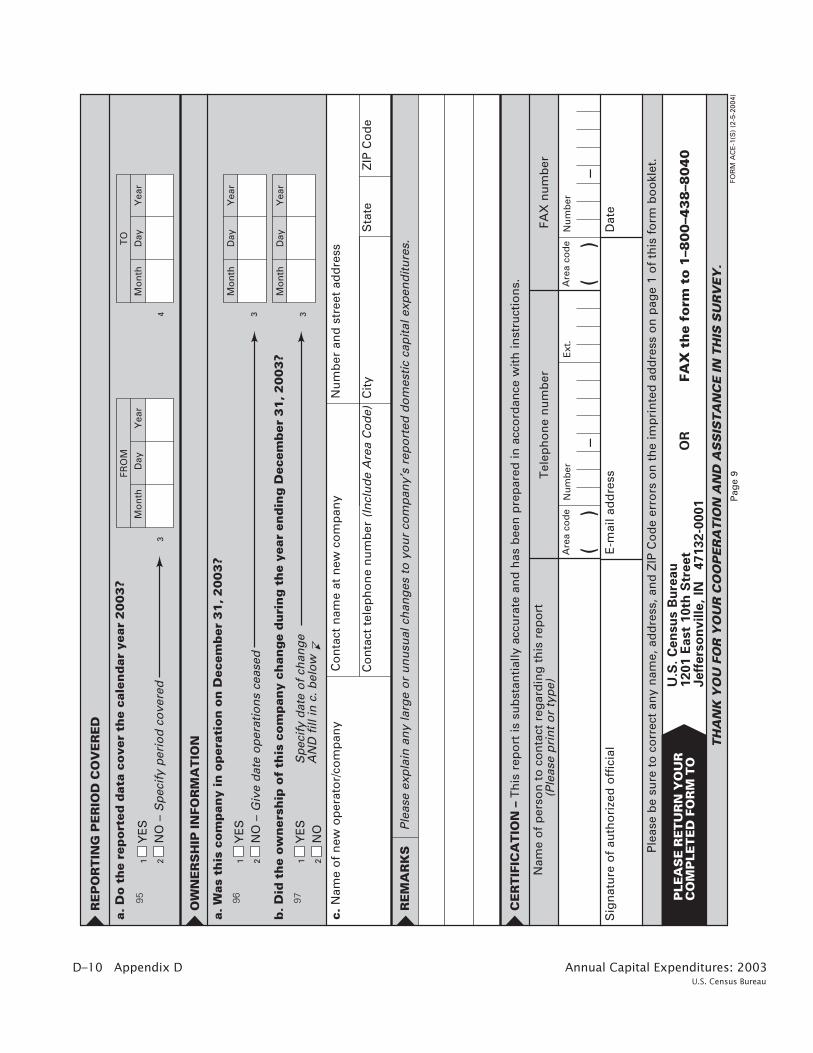
RE
MA
RK
S
CE
RT
IFIC
AT
ION
– T
his
rep
ort
is s
ub
stan
tial
ly a
ccu
rate
an
d h
as b
een
pre
par
ed in
acc
ord
ance
wit
h in
stru
ctio
ns.
Nam
e o
f p
erso
n t
o c
on
tact
reg
ard
ing
th
is r
epo
rt
(Ple
ase
pri
nt
or
typ
e)
Sig
nat
ure
of
auth
ori
zed
off
icia
l
FAX
nu
mb
er
Are
a co
de
Nu
mb
er
Dat
e
()
–
Ple
ase
be
sure
to
co
rrec
t an
y n
ame,
ad
dre
ss, a
nd
ZIP
Co
de
erro
rs o
n t
he
imp
rin
ted
ad
dre
ss o
n p
age
1 o
f th
is f
orm
bo
okl
et.
PLE
AS
E R
ET
UR
N Y
OU
R
CO
MP
LET
ED
FO
RM
TO
U.S
. C
en
su
s B
ure
au
1
20
1 E
ast
10
th S
tre
et
Je
ffe
rso
nv
ille
, IN
47
13
2-0
00
1
Tel
eph
on
e n
um
ber
Are
a co
de
Nu
mb
er
()
–
Pag
e 9
RE
PO
RT
ING
PE
RIO
D C
OV
ER
ED
OW
NE
RS
HIP
INFO
RM
AT
ION
a. D
o t
he
rep
ort
ed d
ata
cove
r th
e ca
len
dar
yea
r 2
00
3?
a. W
as t
his
co
mp
any
in o
per
atio
n o
n D
ecem
ber
31
, 2
00
3?
961
YE
SN
O –
Giv
e d
ate
op
erat
ion
s ce
ased
2
951
YE
SN
O –
Sp
ecif
y p
erio
d c
ove
red
2
b. D
id t
he
ow
ner
ship
of
this
co
mp
any
chan
ge
du
rin
g t
he
year
en
din
g D
ecem
ber
31
, 2
00
3?
971
YE
SN
O2
c.N
ame
of
new
op
erat
or/
com
pan
y
Sp
ecif
y d
ate
of
chan
ge
AN
D f
ill in
c. b
elo
w
Mo
nth
Day
Yea
r
Mo
nth
Day
Yea
r
34
Mo
nth
Day
Yea
rM
on
thD
ayY
ear
TO
FRO
M
3 3
Nu
mb
er a
nd
str
eet
add
ress
Cit
yS
tate
ZIP
Co
de
TH
AN
K Y
OU
FO
R Y
OU
R C
OO
PE
RA
TIO
N A
ND
AS
SIS
TA
NC
E IN
TH
IS S
UR
VE
Y.
FAX
th
e fo
rm t
o 1
–80
0–4
38
–80
40
OR
Ple
ase
exp
lain
an
y la
rge
or
un
usu
al c
han
ges
to
yo
ur
com
pan
y’s
rep
ort
ed d
om
esti
c ca
pit
al e
xpen
dit
ure
s.
Ext
.
E-m
ail a
dd
ress
Co
nta
ct n
ame
at n
ew c
om
pan
y
Co
nta
ct t
elep
ho
ne
nu
mb
er (
Incl
ud
e A
rea
Co
de)
FOR
M A
CE
-1(S
) (2
-5-2
004)
D–10 Appendix D Annual Capital Expenditures: 2003 U.S. Census Bureau

Appendix D D–11Annual Capital Expenditures: 2003U.S. Census Bureau
Pag
e 1
OM
B N
o. 0
607-
0782
: Ap
pro
val E
xpir
es 0
3/31
/200
5
FOR
MA
CE-1
(M)
(2-5
-200
4)
20
03
AN
NU
AL
CA
PIT
AL
EX
PE
ND
ITU
RE
S S
UR
VE
Y
(Ple
ase
co
rre
ct
an
y e
rro
rs i
n n
am
e,
ad
dre
ss,
an
d Z
IP C
od
e.)
U.S
. DE
PA
RT
ME
NT
OF
CO
MM
ER
CE
Eco
no
mic
s an
d S
tati
stic
s A
dm
inis
trat
ion
U.S
. CE
NS
US
BU
RE
AU
Ind
ust
ry C
ateg
ory
Co
des
:
Pri
nte
d a
bo
ve a
re t
he
ind
ust
ries
in
wh
ich
we
bel
ieve
you
r co
mp
any
op
erat
es. If
nec
essa
ry, co
rrec
t th
eab
ove
in
du
stry
cat
ego
ry c
od
e(s)
to
ref
lect
yo
ur
com
pan
y’s
op
erat
ion
s.
Ref
er t
o t
he
list
of
ind
ust
ry c
od
es a
nd
des
crip
tio
ns
beg
inn
ing
on
pag
e 7
of
the
Inst
ruct
ion
s, D
efin
itio
ns,
and
Co
des
Lis
t m
anu
al.
YO
UR
RE
SP
ON
SE
IS
RE
QU
IRE
D B
Y L
AW
. T
itle
13,
Un
ited
Sta
tes
Co
de,
req
uir
es b
usi
nes
ses
and
oth
er o
rgan
izat
ion
s th
at r
ecei
ve t
his
qu
esti
on
nai
re t
o a
nsw
er t
he
qu
esti
on
s an
d r
etu
rn t
he
rep
ort
to
th
e U
.S. C
ensu
s B
ure
au. B
y th
e sa
me
law
, Y
OU
R R
EP
OR
T IS
CO
NFI
DE
NT
IAL.
It m
ay b
e se
en o
nly
by
per
son
s sw
orn
to
up
ho
ld t
he
con
fid
enti
alit
y o
f C
ensu
s B
ure
au in
form
atio
n a
nd
may
be
use
d o
nly
fo
r st
atis
tica
l pu
rpo
ses.
Furt
her
, co
pie
s re
tain
ed in
res
po
nd
ents
’ file
s ar
e im
mu
ne
fro
m le
gal
pro
cess
.
Res
po
nd
ents
are
no
t re
qu
ired
to
res
po
nd
to
an
y in
form
atio
n c
olle
ctio
n u
nle
ss it
dis
pla
ys a
val
id a
pp
rova
l nu
mb
er f
rom
th
e O
ffic
e o
fM
anag
emen
t an
d B
ud
get
. Th
is 8
-dig
it n
um
ber
ap
pea
rs a
t th
e to
p o
f th
is p
age.
US
CE
NS
US
BU
RE
AU
D–12 Appendix D Annual Capital Expenditures: 2003 U.S. Census Bureau
Pag
e 2
FOR
M A
CE
-1(M
) (2
-5-2
004)
DE
FIN
ITIO
NS
AN
D G
EN
ER
AL
INS
TR
UC
TIO
NS
•S
UR
VE
Y S
CO
PE
–T
his
surv
ey c
olle
cts
cap
ital
exp
end
itu
res
dat
a fo
rn
on
farm
co
mp
anie
s, o
rgan
izat
ion
s, a
nd
ass
oci
atio
ns
op
erat
ing
wit
hin
th
e U
nit
ed S
tate
s. T
his
incl
ud
es c
hu
rch
es a
nd
oth
ern
on
-pro
fit
org
aniz
atio
ns,
go
vern
men
t o
wn
ed b
ut
pri
vate
ly o
per
ated
org
aniz
atio
ns,
tri
bal
bu
sin
ess
op
erat
ion
s, a
nd
ag
ricu
ltu
ral s
ervi
ces.
Ag
ricu
ltu
ral p
rod
uct
ion
sh
ou
ld b
e ex
clu
ded
.
PLE
AS
E R
EFE
R T
O T
HE
EN
CLO
SE
D IN
ST
RU
CT
ION
S,
DE
FIN
ITIO
NS
, A
ND
CO
DE
S L
IST
MA
NU
AL
BE
FOR
EC
OM
PLE
TIN
G T
HE
SU
RV
EY
.
•S
UR
VE
Y P
ER
IOD
–R
epo
rtd
ata
for
cale
nd
ar y
ear
2003
. Ref
er t
op
age
1 o
f th
e in
stru
ctio
n m
anu
al if
you
r re
cord
s ar
e o
n a
fisc
al y
ear
bas
is.
•If
yo
ur
com
pan
y ce
ased
op
erat
ion
s d
uri
ng
th
e su
rvey
yea
r,co
mp
lete
th
e fo
rm f
or
the
per
iod
of
tim
e th
e co
mp
any
was
in
op
erat
ion
.
•R
easo
nab
le e
stim
ates
are
acc
epta
ble
.
•R
epo
rt d
olla
rva
lues
ro
un
ded
to
th
ou
san
ds.
Exa
mp
le: If
fig
ure
is
$1
79
,12
5,6
28
.00
rep
ort
Mil
179
•T
o r
etu
rn t
he
form
by
FAX
, fax
to
1–8
00
–43
8–8
04
0.
•If
yo
u h
ave
any
qu
esti
on
s re
gar
din
g t
his
su
rvey
or
nee
d h
elp
com
ple
tin
g it,
cal
l 1
–80
0–5
28
–30
49
.
Thou
126
•P
leas
e co
mp
lete
an
d r
etu
rn t
he
form
in t
he
enve
lop
e p
rovi
ded
by
the
du
e d
ate
sho
wn
on
th
e to
p o
f th
e p
age
wit
h y
ou
r m
ailin
gad
dre
ss.T
o r
equ
est
ano
ther
su
rvey
fo
rm o
r an
ext
ensi
on
of
tim
efo
r fi
ling
, cal
l 1–8
00
–52
8–3
04
9.
FRO
M T
HE
DIR
EC
TO
R
U.S
. CE
NS
US
BU
RE
AU
We
are
con
du
ctin
g t
he
An
nu
al C
apit
al E
xpen
dit
ure
s S
urv
ey, a
nd
we
wo
uld
like
yo
u t
o h
elp
by
com
ple
tin
gth
e en
clo
sed
su
rvey
fo
rm.
Th
e U
.S. C
ensu
s B
ure
au’s
An
nu
al C
apit
al E
xpen
dit
ure
s S
urv
ey is
a k
ey s
ou
rce
of
info
rmat
ion
ab
ou
t o
ur
cou
ntr
y’s
eco
no
mic
per
form
ance
. Bu
sin
ess
inve
stm
ent
in s
tru
ctu
res
and
eq
uip
men
t is
an
imp
ort
ant
com
po
nen
t o
f G
ross
Do
mes
tic
Pro
du
ct. I
nve
stm
ent
dat
a ar
e u
sefu
l fo
r id
enti
fyin
g b
usi
nes
s o
pp
ort
un
itie
s,p
rod
uct
dev
elo
pm
ent,
an
d s
trat
egic
pla
nn
ing
.
Tit
le 1
3 o
f th
e U
nit
ed S
tate
s C
od
e re
qu
ires
yo
u t
o a
nsw
er t
his
su
rvey
; it
also
req
uir
es u
s to
kee
p y
ou
rre
spo
nse
co
nfi
den
tial
.
We
real
ize
that
co
mp
leti
ng
th
is s
urv
ey is
a b
urd
en f
or
you
. We
ho
pe,
ho
wev
er, t
hat
yo
u a
pp
reci
ate
the
imp
ort
ance
of
you
r re
spo
nse
in p
rovi
din
g a
ccu
rate
dat
a ab
ou
t o
ur
Nat
ion
’s e
con
om
ic p
erfo
rman
ce. W
eh
ave
limit
ed t
he
surv
ey s
amp
le t
o t
he
few
est
po
ssib
le n
um
ber
of
rep
rese
nta
tive
fir
ms,
an
d w
e ac
cep
tes
tim
ates
if b
oo
k fi
gu
res
are
no
t av
aila
ble
.
Ple
ase
revi
ew t
he
inst
ruct
ion
s, c
om
ple
te t
he
form
, an
d r
etu
rn it
wit
hin
30
day
s. T
he
inst
ruct
ion
sca
n a
ssis
t yo
u o
n h
ow
to
rep
ort
fo
r ea
ch it
em. R
etu
rnin
g y
ou
r fo
rm p
rom
ptl
y h
elp
s u
s ke
ep f
ollo
w-u
pco
sts
do
wn
. If
you
hav
e an
y q
ues
tio
ns
or
com
men
ts, p
leas
e ca
ll u
s to
ll-fr
ee a
t 1
-80
0-5
28
-30
49
.
Th
ank
you
in a
dva
nce
fo
r yo
ur
coo
per
atio
n.
Sin
cere
ly,
En
clo
sure
Ch
arle
s Lo
uis
Kin
can
no
n
Appendix D D–13Annual Capital Expenditures: 2003U.S. Census Bureau
Pag
e 3
ITE
M 1
A–
DO
ME
ST
ICD
EP
RE
CIA
BLE
AS
SE
T D
AT
A
DE
PR
EC
IAB
LE A
SS
ET
S–
New
an
d u
sed
bu
ildin
gs,
str
uct
ure
s, m
ach
iner
y, a
nd
eq
uip
men
t fo
r w
hic
h d
epre
ciat
ion
or
amo
rtiz
atio
n a
cco
un
tsar
e o
rdin
arily
mai
nta
ined
. Th
e va
lue
of
lan
d d
evel
op
men
t an
d im
pro
vem
ents
, as
wel
l as
exp
lora
tio
n a
nd
dev
elo
pm
ent
of
min
eral
pro
per
ties
, are
incl
ud
ed.
Exc
lud
e•
Co
st o
f la
nd
an
d d
eple
tab
le a
sset
s su
ch a
s m
iner
al a
nd
tim
ber
rig
hts
;•
Ass
ets
of
fore
ign
op
erat
ion
s;•
Ass
ets
leas
ed t
o o
ther
s u
nd
er c
apit
al le
ase
arra
ng
emen
ts;
•P
aten
ts, c
op
yrig
hts
, tra
dem
arks
, fra
nch
ises
, an
d g
oo
dw
ill.
CA
PIT
AL
EX
PE
ND
ITU
RE
S–
All
cap
ital
ized
co
sts
du
rin
g 2
003
for
bo
th n
ew a
nd
use
d s
tru
ctu
res
and
eq
uip
men
t ch
arg
eab
le t
o a
sset
acco
un
ts, a
nd
fo
r w
hic
h d
epre
ciat
ion
or
amo
rtiz
atio
n a
cco
un
ts a
re o
rdin
arily
mai
nta
ined
.
Incl
ud
e•
Exp
end
itu
res
for
maj
or
add
itio
ns,
alt
erat
ion
s, a
nd
cap
ital
ized
rep
airs
to
exi
stin
g s
tru
ctu
res,
wh
eth
er p
erfo
rmed
by
aco
ntr
acto
r o
r co
mp
lete
d in
-ho
use
;•
Gro
ss a
dd
itio
ns
du
rin
g t
he
year
to
co
nst
ruct
ion
-in
-pro
gre
ss a
cco
un
ts f
or
pro
ject
s la
stin
g m
ore
th
an o
ne
year
, eve
n if
th
e as
set
was
no
t in
use
an
d n
ot
yet
dep
reci
ated
;
•C
apit
aliz
ed c
ost
of
asse
ts p
rod
uce
d o
r p
urc
has
ed t
hen
leas
ed a
s th
e le
sso
r u
nd
er o
per
atin
g le
ases
; •
Cap
ital
co
sts
for
feas
ibili
ty s
tud
ies,
arc
hit
ectu
ral,
leg
al, i
nst
alla
tio
n, a
nd
en
gin
eeri
ng
fee
s;•
Co
st o
f as
sets
acq
uir
ed u
nd
er c
apit
al le
ases
en
tere
d in
to d
uri
ng
th
e su
rvey
yea
r;•
Exp
end
itu
res
for
cap
ital
ized
imp
rove
men
ts m
ade
to a
sset
s le
ased
fro
m o
ther
s (l
ease
ho
ld im
pro
vem
ents
);•
Exp
end
itu
res
for
dev
elo
pm
enta
l an
d e
xplo
rato
ry d
rilli
ng
act
ivit
ies,
incl
ud
ing
inta
ng
ible
dri
llin
g c
ost
s;•
Cap
ital
ized
inte
rest
ch
arg
es o
n lo
ans
wit
h w
hic
h c
apit
al p
roje
cts
are
fin
ance
d, i
f co
nsi
sten
t w
ith
th
eS
tate
men
t o
f Fi
nan
cial
Acc
ou
nti
ng
Sta
nd
ard
s B
oar
d (
FAS
B)
Nu
mb
er 3
4;
•E
xpen
dit
ure
s fo
r la
nd
dev
elo
pm
ent
and
imp
rove
men
t, in
clu
din
g d
emo
litio
n o
f b
uild
ing
s, la
nd
ser
vici
ng
,an
d s
ite
pre
par
atio
n.
Exc
lud
e
OT
HE
R A
DD
ITIO
NS
AN
D A
CQ
UIS
ITIO
NS
– A
dd
itio
ns
to y
ou
r d
epre
ciab
le a
sset
acc
ou
nts
, in
clu
din
g d
epre
ciab
le a
sset
s ac
qu
ired
th
rou
gh
mer
ger
s an
d a
cqu
isit
ion
s, if
no
t co
nsi
der
ed c
apit
al e
xpen
dit
ure
s.
•E
xpen
dit
ure
s fo
r st
ruct
ure
s o
r eq
uip
men
t b
y su
bsi
dia
ries
an
d b
ran
ches
loca
ted
ou
tsid
e th
e U
nit
ed S
tate
s;•
Val
ue
of
stru
ctu
res
bu
ilt o
r w
ork
per
form
ed b
y yo
ur
ente
rpri
se o
n c
on
trac
t to
oth
ers;
•It
ems
char
gea
ble
as
curr
ent
op
erat
ing
exp
ense
s su
ch a
s co
st o
f m
ain
ten
ance
, no
rmal
rep
airs
, an
d s
up
plie
s;•
Exp
end
itu
res
for
go
od
will
, pat
ents
, or
cop
yrig
hts
;•
Pay
men
ts t
o o
ther
s fo
r st
ruct
ure
s an
d e
qu
ipm
ent
acq
uir
ed u
nd
er o
per
atin
g le
ases
or
ren
ted
;•
Exp
end
itu
res
for
pro
per
ty w
hic
h is
leas
ed t
o o
ther
s as
par
t o
f a
cap
ital
(fu
ll-p
ayo
ut
or
equ
ity)
leas
e ar
ran
gem
ent.
ITE
M 1
B–
GR
OS
SS
ALE
S, O
PE
RA
TIN
G R
EC
EIP
TS
, A
ND
RE
VE
NU
ES
Incl
ud
e•
Gro
ss s
ales
, op
erat
ing
rec
eip
ts, a
nd
rev
enu
es f
rom
tax
able
op
erat
ion
s as
wel
l as
tota
l rev
enu
es f
rom
tax-
exem
pt
acti
viti
es. S
ee p
age
4 o
f th
e in
stru
ctio
n m
anu
al f
or
add
itio
nal
det
ails
reg
ard
ing
th
is it
em.
DE
FIN
ITIO
NS
AN
D G
EN
ER
AL
INS
TR
UC
TIO
NS
•V
alu
e o
f as
sets
exp
ense
d a
s p
erm
itte
d u
nd
er S
ecti
on
179
of
the
U.S
. In
tern
al R
even
ue
Co
de;
•C
apit
aliz
ed c
om
pu
ter
soft
war
e;
FOR
M A
CE
-1(M
) (2
-5-2
004)
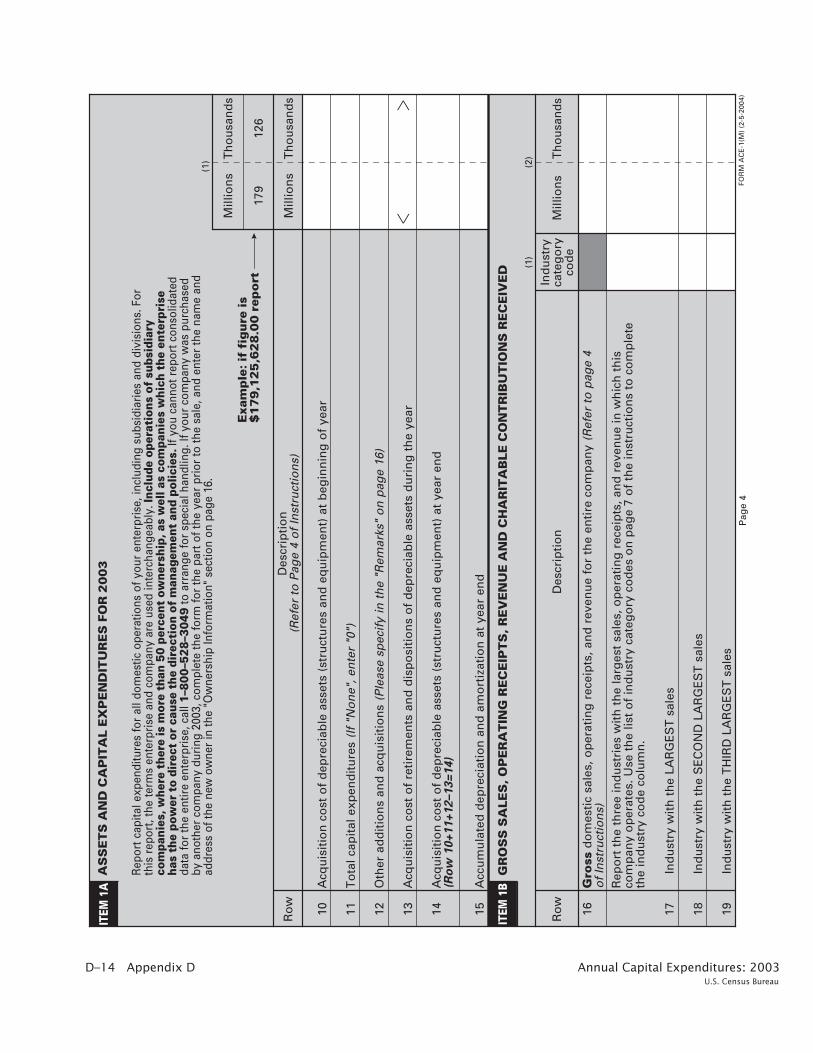
D–14 Appendix D Annual Capital Expenditures: 2003 U.S. Census Bureau
ITEM
1A
Exa
mp
le: if
fig
ure
is
$1
79
,12
5,6
28
.00
rep
ort
Ro
wD
escr
ipti
on
(Ref
er t
o P
age
4 o
f In
stru
ctio
ns)
10 11 12 13 14
Th
ou
san
ds
15
��
Acq
uis
itio
n c
ost
of
dep
reci
able
ass
ets
(str
uct
ure
s an
d e
qu
ipm
ent)
at
beg
inn
ing
of
year
To
tal c
apit
al e
xpen
dit
ure
s (I
f "N
on
e", e
nte
r "0
")
Oth
er a
dd
itio
ns
and
acq
uis
itio
ns
(Ple
ase
spec
ify
in t
he
"Rem
arks
" o
n p
age
16)
Acq
uis
itio
n c
ost
of
reti
rem
ents
an
d d
isp
osi
tio
ns
of
dep
reci
able
ass
ets
du
rin
g t
he
year
Acq
uis
itio
n c
ost
of
dep
reci
able
ass
ets
(str
uct
ure
s an
d e
qu
ipm
ent)
at
year
en
d(R
ow
10
+1
1+
12
–1
3=
14
)
Acc
um
ula
ted
dep
reci
atio
n a
nd
am
ort
izat
ion
at
year
en
d
(1)
Pag
e 4
AS
SE
TS
AN
D C
AP
ITA
L E
XP
EN
DIT
UR
ES
FO
R 2
00
3
Rep
ort c
apita
l exp
endi
ture
s fo
r al
l dom
estic
ope
ratio
ns o
f you
r en
terp
rise
, inc
ludi
ng s
ubsi
diar
ies
and
divi
sion
s. F
orth
is r
epor
t, th
e te
rms
ente
rpri
se a
nd c
ompa
ny a
re u
sed
inte
rcha
ngea
bly.
Incl
ude
oper
atio
ns o
f su
bsid
iary
com
pani
es, w
here
the
re is
mor
e th
an 5
0 pe
rcen
t ow
ners
hip,
as
wel
l as
com
pani
es w
hich
the
ent
erpr
ise
has
the
pow
er t
o di
rect
or
caus
e th
e di
rect
ion
of m
anag
emen
t an
d po
licie
s. If
you
can
not r
epor
t con
solid
ated
data
for
the
entir
e en
terp
rise
, cal
l 1–8
00–5
28–3
049
to a
rran
ge fo
r sp
ecia
l han
dlin
g. If
you
r co
mpa
ny w
as p
urch
ased
by a
noth
er c
ompa
ny d
urin
g 20
03, c
ompl
ete
the
form
for
the
part
of t
he y
ear
prio
r to
the
sale
, and
ent
er th
e na
me
and
addr
ess
of th
e ne
w o
wne
r in
the
"Ow
ners
hip
Info
rmat
ion"
sec
tion
on p
age
16.
Mill
ion
s
ITEM
1B
Ro
wD
escr
ipti
on
(1)
Mill
ion
sIn
du
stry
cate
go
ryco
de
Gro
ssd
om
esti
c sa
les,
op
erat
ing
rec
eip
ts, a
nd
rev
enu
e fo
r th
e en
tire
co
mp
any
(Ref
er t
o p
age
4 o
f In
stru
ctio
ns)
16
Rep
ort
th
e th
ree
ind
ust
ries
wit
h t
he
larg
est
sale
s, o
per
atin
g r
ecei
pts
, an
d r
even
ue
in w
hic
h t
his
com
pan
y o
per
ates
. Use
th
e lis
t o
f in
du
stry
cat
ego
ry c
od
es o
n p
age
7 o
f th
e in
stru
ctio
ns
to c
om
ple
teth
e in
du
stry
co
de
colu
mn
.
Ind
ust
ry w
ith
th
e LA
RG
ES
T s
ales
Ind
ust
ry w
ith
th
e S
EC
ON
D L
AR
GE
ST
sal
es
Ind
ust
ry w
ith
th
e T
HIR
D L
AR
GE
ST
sal
es
17 18 19
179
126
Mill
ion
sT
ho
usa
nd
s
GR
OS
S S
ALE
S, O
PE
RA
TIN
G R
EC
EIP
TS
, R
EV
EN
UE
AN
D C
HA
RIT
AB
LE C
ON
TR
IBU
TIO
NS
RE
CE
IVE
D
(2) T
ho
usa
nd
s
FOR
M A
CE
-1(M
) (2
-5-2
004)
Appendix D D–15Annual Capital Expenditures: 2003U.S. Census Bureau
Pag
e 5
ITE
M 2
–D
OM
ES
TIC
CA
PIT
AL
EX
PE
ND
ITU
RE
S D
AT
A
ST
RU
CT
UR
ES
–
Exc
lud
e
Incl
ud
e
Exc
lud
e
Co
mp
lete
Item
2 f
or
the
cap
ital
exp
end
itu
res
rep
ort
ed in
Item
1A
, Ro
w 1
1.
Rep
ort
th
e ca
pit
aliz
ed c
ost
of
bu
ildin
gs
and
str
uct
ure
s, a
nd
all
nec
essa
ry e
xpen
dit
ure
s to
acq
uir
e, c
on
stru
ct, a
nd
pre
par
eth
e st
ruct
ure
fo
r it
s in
ten
ded
use
.
•M
ajo
r ad
dit
ion
s, a
lter
atio
ns,
an
d c
apit
aliz
ed r
epai
rs t
o e
xist
ing
str
uct
ure
s, w
het
her
per
form
ed b
y a
con
trac
tor
or
com
ple
ted
in-h
ou
se;
•M
ach
iner
y an
d e
qu
ipm
ent
wh
ich
are
an
inte
gra
l or
bu
ilt-i
n f
eatu
re o
f th
e st
ruct
ure
;•
Exp
end
itu
res
for
lan
d d
evel
op
men
t an
d im
pro
vem
ents
su
ch a
s d
emo
litio
n o
f b
uild
ing
s, s
ite
pre
par
atio
n, a
nd
lan
dse
rvic
ing
;•
Faci
litie
s w
hic
h a
re b
uilt
into
or
fixe
d t
o t
he
lan
d s
uch
as
sid
ewal
ks, s
tree
ts, p
arki
ng
lots
, air
fiel
ds,
pie
rs, t
elep
ho
ne
and
po
wer
lin
es, s
ewer
s, a
nd
pet
role
um
an
d g
as p
ipel
ines
;•
Exp
lora
tio
n a
nd
dev
elo
pm
ent
of
min
eral
pro
per
ties
su
ch a
s d
rilli
ng
gas
wel
ls, c
on
stru
ctio
n o
f o
ffsh
ore
dri
llin
gp
latf
orm
s; d
igg
ing
an
d s
ho
rin
g m
ines
, min
e sh
afts
, an
d m
inin
g e
xplo
rati
on
.
•C
ost
of
lan
d a
nd
dep
leta
ble
ass
ets;
•N
orm
al m
ain
ten
ance
an
d r
epai
rs t
o e
xist
ing
str
uct
ure
s o
r se
rvic
e fa
cilit
ies.
Rep
ort
th
e ca
pit
aliz
ed c
ost
of
mac
hin
ery
and
eq
uip
men
t u
sed
in t
he
pro
du
ctio
n a
nd
dis
trib
uti
on
of
go
od
s an
d s
ervi
ces,
and
in o
ffic
e fu
nct
ion
s.
•Fu
rnit
ure
an
d f
ixtu
res;
•T
ran
spo
rtat
ion
eq
uip
men
t su
ch a
s au
tom
ob
iles,
tru
cks,
tra
cto
rs, a
ircr
aft,
an
d s
hip
s;•
Off
ice
equ
ipm
ent
and
mac
hin
es, i
ncl
ud
ing
co
mp
ute
rs;
•E
xpen
dit
ure
s fo
r it
ems
that
are
exp
ense
d, s
uch
as
off
ice
sup
plie
s;•
Exp
end
itu
res
for
mac
hin
ery
or
equ
ipm
ent
wh
ich
are
ho
use
d in
str
uct
ure
s an
d c
ann
ot
be
rem
ove
d o
r re
pla
ced
wit
ho
ut
sig
nif
ican
tly
alte
rin
g t
he
stru
ctu
re. E
xam
ple
s in
clu
de
elec
tric
al w
ork
, ele
vato
rs, h
eati
ng
an
d c
oo
ling
sys
tem
s,an
d o
verh
ead
ho
ists
an
d c
ran
es. S
ee It
em 2
, ST
RU
CT
UR
ES
on
pag
e 3
of
the
inst
ruct
ion
man
ual
fo
r ad
dit
ion
al t
ypes
of
equ
ipm
ent
to b
e in
clu
ded
as
stru
ctu
res.
OT
HE
R –
Rep
ort
cap
ital
exp
end
itu
res
for
asse
ts a
cqu
ired
in 2
003
that
can
no
t b
e cl
assi
fied
un
der
str
uct
ure
s o
r eq
uip
men
t. (D
o n
ot
rep
ort
fu
rnit
ure
an
d f
ixtu
res,
cap
ital
ized
co
mp
ute
r so
ftw
are,
an
d m
oto
r ve
hic
les
as O
TH
ER
; th
ese
are
con
sid
ered
eq
uip
men
t fo
r th
is s
urv
ey.)
•C
ost
of
lan
d a
nd
dep
leta
ble
ass
ets;
No
te:
•P
rod
uct
ion
mac
hin
ery;
•C
apit
aliz
ed c
om
pu
ter
soft
war
e.
EQ
UIP
ME
NT
–
Incl
ud
e
Exc
lud
e
All
oca
te c
on
stru
ctio
n-i
n-p
rog
ress
, le
aseh
old
im
pro
vem
ents
, an
d c
apit
aliz
ed in
tere
st a
s st
ruct
ure
san
d e
qu
ipm
ent
wh
ere
app
lica
ble
. If
yo
u c
ann
ot
allo
cate
th
ese
exp
end
itu
res
as s
tru
ctu
res
or
equ
ipm
ent,
re
po
rt t
hem
as
OT
HE
R a
nd
pro
vid
e a
des
crip
tio
n in
Ite
m 3
.
DE
FIN
ITIO
NS
AN
D G
EN
ER
AL
INS
TR
UC
TIO
NS
•G
ross
ad
dit
ion
s d
uri
ng
th
e ye
ar t
o c
on
stru
ctio
n-i
n-p
rog
ress
acc
ou
nts
fo
r p
roje
cts
last
ing
mo
re t
han
on
e ye
ar;
FOR
M A
CE
-1(M
) (2
-5-2
004)

D–16 Appendix D Annual Capital Expenditures: 2003 U.S. Census Bureau
CA
PITA
L EX
PEN
DIT
UR
ES(R
efer
to
page
2 o
f In
stru
ctio
ns)
(4)
(1)
(2)
(3)
Str
uct
ure
sE
qu
ipm
ent
Oth
er
Mil
Th
ou
ITE
M 2
Rep
ort
th
e fo
llo
win
g d
om
esti
c ca
pit
al e
xpen
dit
ure
s d
ata
for
the
enti
reco
mp
any.
(Ref
er t
o p
age
4 o
f In
stru
ctio
ns)
ITE
M 3
List
the
item
s in
clud
ed in
"O
ther
". Re
port
in th
ousa
nds
of d
olla
rs. F
urni
ture
and
fix
ture
s, c
ompu
ters
, cap
ital
ized
com
pute
r so
ftw
are,
and
mot
orve
hicl
essh
ould
be
repo
rted
as
equi
pmen
t. Le
aseh
old
impr
ovem
ents
sho
uld
be c
onsi
dere
d st
ruct
ures
or
equi
pmen
t bas
ed o
n w
hat i
s be
ing
impr
oved
.
ITE
M 4
Ro
w
Ro
w
20 21 22 30 31
(2)
Des
crip
tio
n o
f C
apit
al E
xpen
dit
ure
s
Cap
ital e
xpen
ditu
res
for
NEW
str
uctu
res
and
equi
pmen
t(In
clud
e m
ajor
add
ition
s, a
ltera
tions
, and
cap
italiz
edre
pair
s to
exi
stin
g st
ruct
ures
)
Cap
ital
exp
end
itu
res
for
US
ED
str
uct
ure
s an
deq
uip
men
t
TO
TA
L ca
pit
al e
xpen
dit
ure
s (A
dd
Ro
ws 2
0+
21)
41Ro
w
For
new
cap
ital
exp
end
itu
res
rep
ort
ed in
Item
2, R
ow
20,
Co
lum
n (
4), r
epo
rt t
he
esti
mat
ed c
ost
of
asse
tsac
qu
ired
un
der
CA
PIT
AL
LEA
SE
arr
ang
emen
ts e
nte
red
into
du
rin
g t
he
year
. Exc
lud
e p
aym
ents
fo
ro
per
atin
g le
ases
an
d c
apit
aliz
ed c
ost
s o
f le
aseh
old
imp
rove
men
ts. (
Ref
er t
o p
age
5 o
f th
e In
stru
ctio
ns)
TO
TA
L
(1)
(1)
ITE
M 5
50Ro
w
Pag
e 6
Mil
Th
ou
Mil
Th
ou
Mil
Th
ou
Th
ou
CA
PIT
AL
EX
PE
ND
ITU
RE
S
To
tal
(Ad
d c
olu
mn
s 1
+2+
3)
Mil
Th
ou
179
126
Exa
mp
le: if
fig
ure
is
$1
79
,12
5,6
28
.00
rep
ort
Mil
Th
ou
Mil
To
tal
sh
ou
ld e
qu
al
Ite
m 1
A,
Ro
w 1
1
Mil
Th
ou
Mil
Th
ou
Mil
Th
ou
Mil
Th
ou
Pre
pac
kag
ed(1
)
Ven
dor-
cus
tom
ized
(2)
(3)
To
tal
(Ad
d c
olu
mn
s 1
+2
+3
)(4
)C
AP
ITA
LIZ
ED
CO
MP
UT
ER
SO
FTW
AR
E
(Ref
er t
o p
age
5 o
f In
stru
ctio
ns)
Rep
ort
capi
tal e
xpen
ditu
res
for
com
pute
r so
ftw
are
deve
lope
d or
obt
aine
d fo
r in
tern
al u
se d
urin
g th
e ye
ar.
Incl
ude
amou
nts
in It
em 1
A a
nd It
em 2
.
FOR
M A
CE
-1(M
) (1
-5-2
004)
Inte
rnal
ly-d
evel
oped
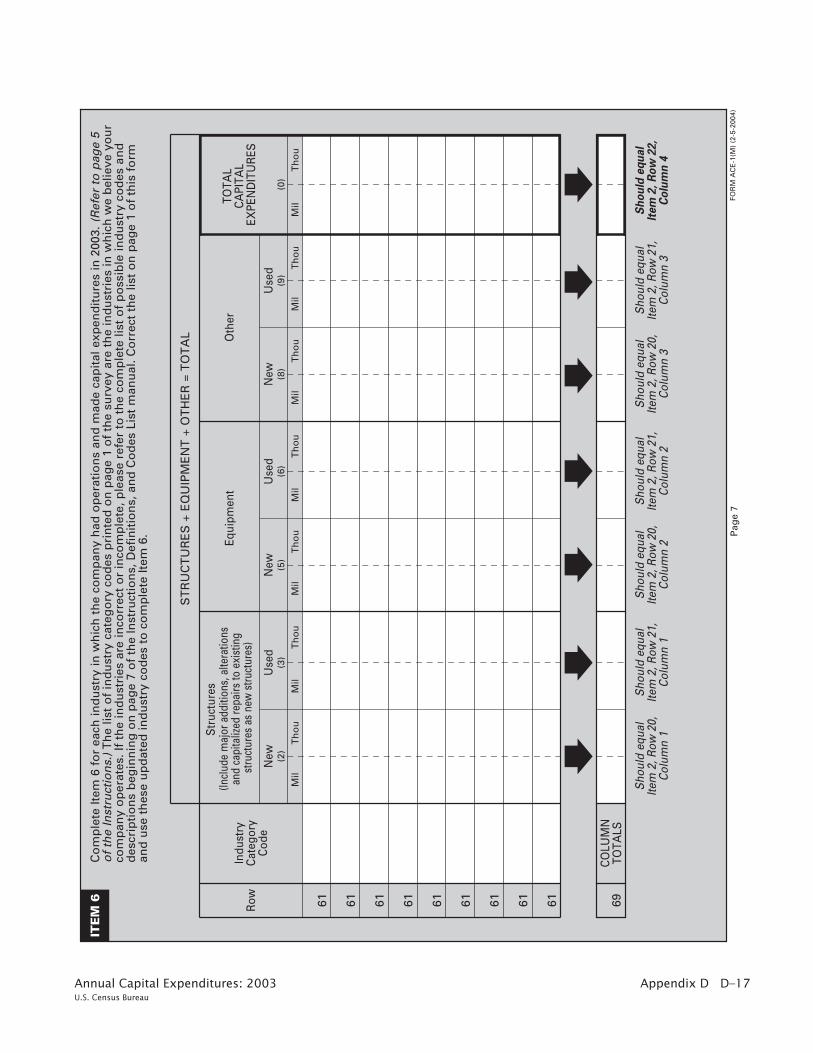
Appendix D D–17Annual Capital Expenditures: 2003U.S. Census Bureau
Pag
e 7
61 61 61 61 61 61 61 61 61
Indu
stry
Cat
egor
yC
ode
Equi
pmen
tO
ther
(2)
(3)
(5)
(6)
New
Use
dU
sed
New
New
Use
dR
ow
ITE
M 6
Co
mp
lete
Item
6 f
or
each
ind
ust
ry in
wh
ich
th
e co
mp
any
had
op
erat
ion
s an
d m
ade
cap
ital
exp
end
itu
res
in 2
003.
(R
efer
to
pag
e 5
of
the
Inst
ruct
ion
s.)
Th
e lis
t o
f in
du
stry
cat
ego
ry c
od
es p
rin
ted
on
pag
e 1
of
the
surv
ey a
re t
he
ind
ust
ries
in w
hic
h w
e b
elie
ve y
ou
rco
mp
any
op
erat
es. I
f th
e in
du
stri
es a
re in
corr
ect
or
inco
mp
lete
, ple
ase
refe
r to
th
e co
mp
lete
list
of
po
ssib
le in
du
stry
co
des
an
dd
escr
ipti
on
s b
egin
nin
g o
n p
age
7 o
f th
e In
stru
ctio
ns,
Def
init
ion
s, a
nd
Co
des
Lis
t m
anu
al. C
orr
ect
the
list
on
pag
e 1
of
this
fo
rman
d u
se t
hes
e u
pd
ated
ind
ust
ry c
od
es t
o c
om
ple
te It
em 6
.
(8)
(9)
Mil
Th
ou
Mil
Th
ou
Mil
Th
ou
Mil
Th
ou
Mil
Th
ou
Mil
Th
ou
Str
uctu
res
(Incl
ude
maj
or a
dditi
ons,
alte
ratio
ns
and
capi
taliz
ed re
pairs
to e
xist
ing
stru
ctur
es a
s ne
w s
truct
ures
)
(0)
Mil
Th
ou
TOTA
LC
API
TAL
EXPE
ND
ITU
RES
ST
RU
CT
UR
ES
+ E
QU
IPM
EN
T +
OT
HE
R =
TO
TA
L
69C
OLU
MN
TOTA
LS
Sho
uld
equa
lIte
m 2
, Row
20,
Col
umn
1
Sho
uld
equa
lIte
m 2
, Row
21,
Col
umn
1
Sho
uld
equa
lIte
m 2
, Row
20,
Col
umn
2
Sho
uld
equa
lIte
m 2
, Row
21,
Col
umn
2
Sho
uld
equa
lIte
m 2
, Row
20,
Col
umn
3
Sho
uld
equa
lIte
m 2
, Row
21,
Col
umn
3
Sh
ou
ld e
qu
al
Ite
m 2
, R
ow
22
,C
olu
mn
4
FOR
M A
CE
-1(M
) (2
-5-2
004)

D–18 Appendix D Annual Capital Expenditures: 2003 U.S. Census Bureau
Pag
e 8
ITE
M 7
Co
mp
lete
a s
epar
ate
Item
7 f
or
each
ind
ust
ry li
sted
in It
em 6
wit
h e
xpen
dit
ure
s fo
r st
ruct
ure
s.
FOR
M A
CE
-1(M
) (2
-5-2
004)
(En
ter
Str
uct
ure
Co
de
fro
m L
ist)
(0)
(3)
(7)
Use
d
Rem
odel
ing,
Ren
ovat
ion,
Mod
erni
zatio
n of
Exi
stin
g Fa
cilit
yO
ther
Mil
Th
ou
En
ter
ind
ust
ry c
ateg
ory
fro
m In
du
stry
C
ateg
ory
Co
de
colu
mn
of
Item
6:
Ro
w
71 71 71 71 71 71 71 79
Mil
Th
ou
Mil
Th
ou
Mil
Th
ou
CA
PIT
AL
EX
PE
ND
ITU
RE
S B
Y T
YP
E O
F S
TR
UC
TU
RE
(2)
New
Mil
Th
ou
(1)
Co
ntr
act
Mil
Th
ou
Cap
ital
Exp
end
itu
res
for
Str
uct
ure
sO
wn
Em
plo
yees
Co
nst
ruct
ion
of
New
Fac
ility
Acq
uisi
tion
of E
xist
ing
Faci
lity
(4)
Mil
Th
ou
Mil
Th
ou
(6)
(5)
Co
ntr
act
Ow
nE
mp
loye
es
ITE
M 7
–C
AP
ITA
LE
XP
EN
DIT
UR
ES
BY
TY
PE
OF
ST
RU
CT
UR
E
DE
FIN
ITIO
NS
AN
D G
EN
ER
AL
INS
TR
UC
TIO
NS
If y
ou
had
exp
end
itu
res
for
stru
ctu
res
in m
ore
th
an 7
ind
ust
ries
, ph
oto
cop
y It
em 7
fo
r ad
dit
ion
al s
pac
e. If
yo
u n
eed
ad
dit
ion
al li
nes
to
rep
ort
typ
es o
f st
ruct
ure
s fo
r an
ind
ust
ry, c
on
tin
ue
to t
he
nex
t It
em 7
en
teri
ng
th
e sa
me
ind
ust
ry c
od
e.
Use
th
e th
ree-
dig
it s
tru
ctu
re c
od
e fr
om
Sec
tio
n III
on
pag
e 1
1 o
f th
e In
stru
ctio
ns,
Def
init
ion
s, a
nd
Co
des
Lis
ts m
anu
al t
ore
po
rt t
he
typ
e o
f st
ruct
ure
th
at y
ou
r co
mp
any
acq
uir
ed, co
nst
ruct
ed, re
mo
del
ed, re
no
vate
d,
or
mo
der
niz
ed.
CO
NS
TR
UC
TIO
N O
F N
EW
FA
CIL
ITY
– B
uild
ing
s o
r o
ther
str
uct
ure
s n
ot
pre
vio
usl
y o
wn
ed. I
ncl
ud
e ad
dit
ion
s to
exi
stin
g b
uild
ing
s, s
uch
as a
new
win
g.
AC
QU
ISIT
ION
OF
EX
IST
ING
FA
CIL
ITY
/NE
W–
Bu
ildin
gs
or
oth
er s
tru
ctu
res
that
hav
e b
een
pre
vio
usl
y o
wn
ed b
ut
no
t o
ccu
pie
d o
r u
sed
.
AC
QU
ISIT
ION
OF
EX
IST
ING
FA
CIL
ITY
/US
ED
– B
uild
ing
s o
r o
ther
str
uct
ure
s th
at h
ave
bee
n p
revi
ou
sly
ow
ned
AN
D o
ccu
pie
d o
r u
sed
.
Str
uct
ure
Co
de
(Ad
d c
olu
mn
s1+
2+3+
4+5+
6+7)
Co
lum
nT
ota
ls

Appendix D D–19Annual Capital Expenditures: 2003U.S. Census Bureau
Pag
e 9
ITE
M 7
FOR
M A
CE
-1(M
) (2
-5-2
004)
(3)
(7)
Use
d
Rem
od
elin
g, R
eno
vati
on
,M
od
ern
izat
ion
of
Exi
stin
g F
acili
tyO
ther
Mil
Th
ou
En
ter
ind
ust
ry c
ateg
ory
fro
m In
du
stry
C
ateg
ory
Co
de
colu
mn
of
Item
6:
Ro
w
71 71 71 71 71 71 71 79
Mil
Th
ou
Mil
Th
ou
CA
PIT
AL
EX
PE
ND
ITU
RE
S B
Y T
YP
E O
F S
TR
UC
TU
RE
(2)
New
Mil
Th
ou
(1)
Co
ntr
act
Mil
Th
ou
Ow
nE
mp
loye
es
Co
nst
ruct
ion
of
New
Fac
ility
Acq
uis
itio
n o
f E
xist
ing
Fac
ility
(4)
Mil
Th
ou
Mil
Th
ou
(6)
(5)
Co
ntr
act
Ow
nE
mp
loye
es
ITE
M 7
En
ter
ind
ust
ry c
ateg
ory
fro
m In
du
stry
C
ateg
ory
Co
de
colu
mn
of
Item
6:
CA
PIT
AL
EX
PE
ND
ITU
RE
S B
Y T
YP
E O
F S
TR
UC
TU
RE
(0)
Mil
Th
ou
Cap
ital
Exp
end
itu
res
for
Str
uct
ure
s(A
dd
co
lum
ns
1+2+
3+4+
5+6+
7)(E
nte
rS
tru
ctu
reC
od
efr
om
Lis
t)
Str
uct
ure
Co
de
Co
lum
nT
ota
ls
(3)
(7)
Use
d
Rem
od
elin
g, R
eno
vati
on
,M
od
ern
izat
ion
of
Exi
stin
g F
acili
tyO
ther
Mil
Th
ou
Ro
w
71 71 71 71 71 71 71 79
Mil
Th
ou
Mil
Th
ou
(2)
New
Mil
Th
ou
(1)
Co
ntr
act
Mil
Th
ou
Ow
nE
mp
loye
es
Co
nst
ruct
ion
of
New
Fac
ility
Acq
uis
itio
n o
f E
xist
ing
Fac
ility
(4)
Mil
Th
ou
Mil
Th
ou
(6)
(5)
Co
ntr
act
Ow
nE
mp
loye
es(0
)
Mil
Th
ou
Cap
ital
Exp
end
itu
res
for
Str
uct
ure
s(A
dd
co
lum
ns
1+2+
3+4+
5+6+
7)(E
nte
rS
tru
ctu
reC
od
efr
om
Lis
t)
Str
uct
ure
Co
de
Co
lum
nT
ota
ls

D–20 Appendix D Annual Capital Expenditures: 2003 U.S. Census Bureau
Pag
e 10
ITE
M 7
FOR
M A
CE
-1(M
) (2
-5-2
004)
(3)
(7)
Use
d
Rem
od
elin
g, R
eno
vati
on
,M
od
ern
izat
ion
of
Exi
stin
g F
acili
tyO
ther
Mil
Th
ou
En
ter
ind
ust
ry c
ateg
ory
fro
m In
du
stry
C
ateg
ory
Co
de
colu
mn
of
Item
6:
Ro
w
71 71 71 71 71 71 71 79
Mil
Th
ou
Mil
Th
ou
CA
PIT
AL
EX
PE
ND
ITU
RE
S B
Y T
YP
E O
F S
TR
UC
TU
RE
(2)
New
Mil
Th
ou
(1)
Co
ntr
act
Mil
Th
ou
Ow
nE
mp
loye
es
Co
nst
ruct
ion
of
New
Fac
ility
Acq
uis
itio
n o
f E
xist
ing
Fac
ility
(4)
Mil
Th
ou
Mil
Th
ou
(6)
(5)
Co
ntr
act
Ow
nE
mp
loye
es
ITE
M 7
En
ter
ind
ust
ry c
ateg
ory
fro
m In
du
stry
C
ateg
ory
Co
de
colu
mn
of
Item
6:
CA
PIT
AL
EX
PE
ND
ITU
RE
S B
Y T
YP
E O
F S
TR
UC
TU
RE
(0)
Mil
Th
ou
Cap
ital
Exp
end
itu
res
for
Str
uct
ure
s(A
dd
co
lum
ns
1+2+
3+4+
5+6+
7)(E
nte
rS
tru
ctu
reC
od
efr
om
Lis
t)
Str
uct
ure
Co
de
Co
lum
nT
ota
ls
(3)
(7)
Use
d
Rem
od
elin
g, R
eno
vati
on
,M
od
ern
izat
ion
of
Exi
stin
g F
acili
tyO
ther
Mil
Th
ou
Ro
w
71 71 71 71 71 71 71 79
Mil
Th
ou
Mil
Th
ou
(2)
New
Mil
Th
ou
(1)
Co
ntr
act
Mil
Th
ou
Ow
nE
mp
loye
es
Co
nst
ruct
ion
of
New
Fac
ility
Acq
uis
itio
n o
f E
xist
ing
Fac
ility
(4)
Mil
Th
ou
Mil
Th
ou
(6)
(5)
Co
ntr
act
Ow
nE
mp
loye
es(0
)
Mil
Th
ou
Cap
ital
Exp
end
itu
res
for
Str
uct
ure
s(A
dd
co
lum
ns
1+2+
3+4+
5+6+
7)(E
nte
rS
tru
ctu
reC
od
efr
om
Lis
t)
Str
uct
ure
Co
de
Co
lum
nT
ota
ls
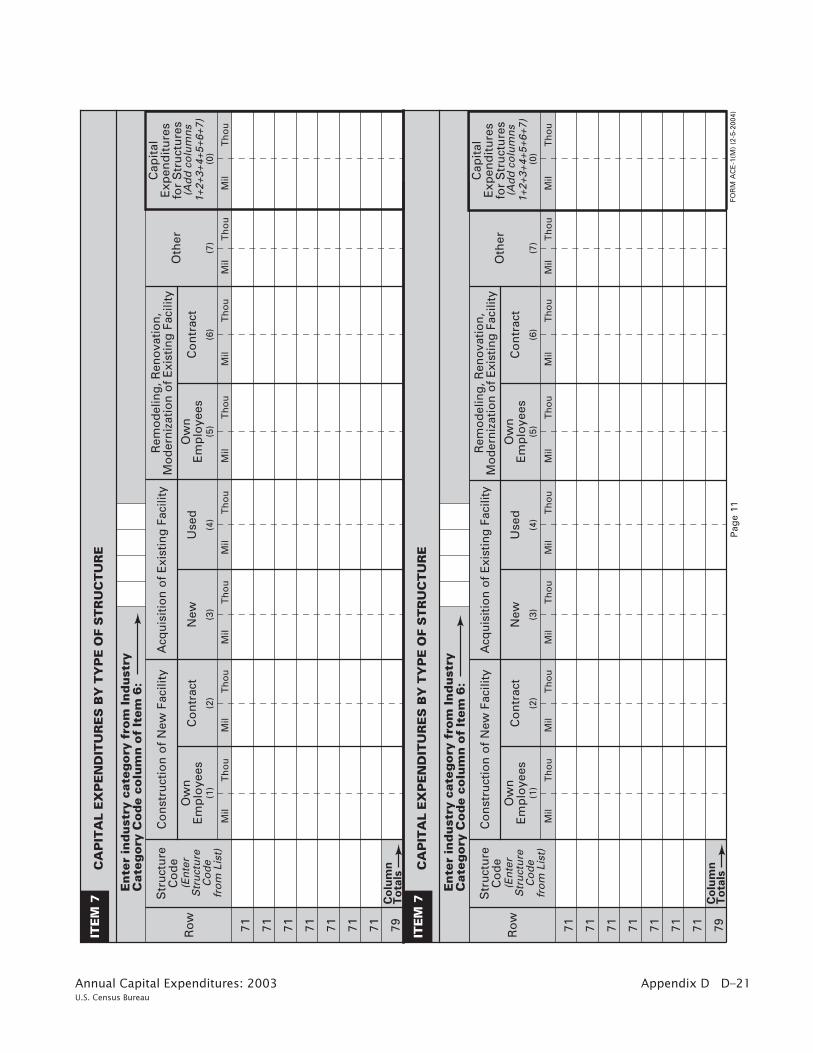
Appendix D D–21Annual Capital Expenditures: 2003U.S. Census Bureau
Pag
e 11
ITE
M 7
FOR
M A
CE
-1(M
) (2
-5-2
004)
(3)
(7)
Use
d
Rem
od
elin
g, R
eno
vati
on
,M
od
ern
izat
ion
of
Exi
stin
g F
acili
tyO
ther
Mil
Th
ou
En
ter
ind
ust
ry c
ateg
ory
fro
m In
du
stry
C
ateg
ory
Co
de
colu
mn
of
Item
6:
Ro
w
71 71 71 71 71 71 71 79
Mil
Th
ou
Mil
Th
ou
CA
PIT
AL
EX
PE
ND
ITU
RE
S B
Y T
YP
E O
F S
TR
UC
TU
RE
(2)
New
Mil
Th
ou
(1)
Co
ntr
act
Mil
Th
ou
Ow
nE
mp
loye
es
Co
nst
ruct
ion
of
New
Fac
ility
Acq
uis
itio
n o
f E
xist
ing
Fac
ility
(4)
Mil
Th
ou
Mil
Th
ou
(6)
(5)
Co
ntr
act
Ow
nE
mp
loye
es
ITE
M 7
En
ter
ind
ust
ry c
ateg
ory
fro
m In
du
stry
C
ateg
ory
Co
de
colu
mn
of
Item
6:
CA
PIT
AL
EX
PE
ND
ITU
RE
S B
Y T
YP
E O
F S
TR
UC
TU
RE
(0)
Mil
Th
ou
Cap
ital
Exp
end
itu
res
for
Str
uct
ure
s(A
dd
co
lum
ns
1+2+
3+4+
5+6+
7)(E
nte
rS
tru
ctu
reC
od
efr
om
Lis
t)
Str
uct
ure
Co
de
Co
lum
nT
ota
ls
(3)
(7)
Use
d
Rem
od
elin
g, R
eno
vati
on
,M
od
ern
izat
ion
of
Exi
stin
g F
acili
tyO
ther
Mil
Th
ou
Ro
w
71 71 71 71 71 71 71 79
Mil
Th
ou
Mil
Th
ou
(2)
New
Mil
Th
ou
(1)
Co
ntr
act
Mil
Th
ou
Ow
nE
mp
loye
es
Co
nst
ruct
ion
of
New
Fac
ility
Acq
uis
itio
n o
f E
xist
ing
Fac
ility
(4)
Mil
Th
ou
Mil
Th
ou
(6)
(5)
Co
ntr
act
Ow
nE
mp
loye
es(0
)
Mil
Th
ou
Cap
ital
Exp
end
itu
res
for
Str
uct
ure
s(A
dd
co
lum
ns
1+2+
3+4+
5+6+
7)(E
nte
rS
tru
ctu
reC
od
efr
om
Lis
t)
Str
uct
ure
Co
de
Co
lum
nT
ota
ls

D–22 Appendix D Annual Capital Expenditures: 2003 U.S. Census Bureau
Pag
e 12
ITE
M 8Co
mp
lete
a s
epar
ate
Item
8 f
or
each
ind
ust
ry li
sted
in It
em 6
wit
h e
xpen
dit
ure
s fo
r eq
uip
men
t.
FOR
M A
CE
-1(M
) (2
-5-2
004)
(En
ter
Eq
uip
men
tC
od
e Fr
om
Li
st)
(1)
(3)
Oth
er
Mil
En
ter
ind
ust
ry c
ateg
ory
fro
m In
du
stry
C
ateg
ory
Co
de
colu
mn
of
Item
6:
Ro
w
81 81 81 81 81 81 81 89C
olu
mn
To
tals
Mil
Mil
Th
ou
CA
PIT
AL
EX
PE
ND
ITU
RE
S B
Y T
YP
E O
F E
QU
IPM
EN
T
(0)
New
Eq
uip
men
t
Th
ou
Cap
ital
Exp
end
itu
res
For
Eq
uip
men
t
Th
ou
Th
ou
(2)
Use
d E
qu
ipm
ent
ITE
M 8
–C
AP
ITA
LE
XP
EN
DIT
UR
ES
BY
TY
PE
OF
EQ
UIP
ME
NT
DE
FIN
ITIO
NS
AN
D G
EN
ER
AL
INS
TR
UC
TIO
NS
If y
ou
had
exp
end
itu
res
for
equ
ipm
ent
in m
ore
th
an 7
ind
ust
ries
, ph
oto
cop
y It
em 8
fo
r ad
dit
ion
al s
pac
e. If
yo
u n
eed
ad
dit
ion
al li
nes
to r
epo
rt t
ypes
of
equ
ipm
ent
for
an in
du
stry
, co
nti
nu
e to
th
e n
ext
Item
8 e
nte
rin
g t
he
sam
e in
du
stry
co
de.
Use
th
e th
ree-
dig
it e
qu
ipm
ent
cod
e fr
om
Sec
tio
n III
on
pag
e 1
4 o
f th
e In
stru
ctio
ns,
Def
init
ion
s, a
nd
Co
des
Lis
ts m
anu
alto
rep
ort
th
e ty
pe
of
equ
ipm
ent
that
yo
ur
com
pan
y ac
qu
ired
.
Eq
uip
men
tC
od
e
Mil
(Ad
d c
olu
mn
s 1+
2+3)

Appendix D D–23Annual Capital Expenditures: 2003U.S. Census Bureau
(En
ter
Eq
uip
men
tC
od
e Fr
om
Li
st)
(1)
(3)
Oth
er
Mil
Mil
Mil
Th
ou
(0)
New
Eq
uip
men
t
Th
ou
Cap
ital
Exp
end
itu
res
For
Eq
uip
men
t
Th
ou
Th
ou
(2)
Use
d E
qu
ipm
ent
Eq
uip
men
tC
od
e
Mil
(Ad
d c
olu
mn
s 1+
2+3)
Pag
e 13
ITE
M 8
FOR
M A
CE
-1(M
) (2
-5-2
004)
En
ter
ind
ust
ry c
ateg
ory
fro
m In
du
stry
C
ateg
ory
Co
de
colu
mn
of
Item
6:
Ro
w
81 81 81 81 81 81 81 89
CA
PIT
AL
EX
PE
ND
ITU
RE
S B
Y T
YP
E O
F E
QU
IPM
EN
T
ITE
M 8
En
ter
ind
ust
ry c
ateg
ory
fro
m In
du
stry
C
ateg
ory
Co
de
colu
mn
of
Item
6:
Ro
w
CA
PIT
AL
EX
PE
ND
ITU
RE
S B
Y T
YP
E O
F E
QU
IPM
EN
T
(En
ter
Eq
uip
men
tC
od
e Fr
om
Li
st)
(1)
(3)
Oth
er
Mil
Mil
Mil
Th
ou
(0)
New
Eq
uip
men
t
Th
ou
Cap
ital
Exp
end
itu
res
For
Eq
uip
men
t
Th
ou
Th
ou
(2)
Use
d E
qu
ipm
ent
Eq
uip
men
tC
od
e
Mil
(Ad
d c
olu
mn
s 1+
2+3)
81 81 81 81 81 81 81 89C
olu
mn
To
tals
Co
lum
nT
ota
ls

D–24 Appendix D Annual Capital Expenditures: 2003 U.S. Census Bureau
(En
ter
Eq
uip
men
tC
od
e Fr
om
Li
st)
(1)
(3)
Oth
er
Mil
Mil
Mil
Th
ou
(0)
New
Eq
uip
men
t
Th
ou
Cap
ital
Exp
end
itu
res
For
Eq
uip
men
t
Th
ou
Th
ou
(2)
Use
d E
qu
ipm
ent
Eq
uip
men
tC
od
e
Mil
(Ad
d c
olu
mn
s 1+
2+3)
Pag
e 14
ITE
M 8
FOR
M A
CE
-1(M
) (2
-5-2
004)
En
ter
ind
ust
ry c
ateg
ory
fro
m In
du
stry
C
ateg
ory
Co
de
colu
mn
of
Item
6:
Ro
w
81 81 81 81 81 81 81 89
CA
PIT
AL
EX
PE
ND
ITU
RE
S B
Y T
YP
E O
F E
QU
IPM
EN
T
ITE
M 8
En
ter
ind
ust
ry c
ateg
ory
fro
m In
du
stry
C
ateg
ory
Co
de
colu
mn
of
Item
6:
Ro
w
CA
PIT
AL
EX
PE
ND
ITU
RE
S B
Y T
YP
E O
F E
QU
IPM
EN
T
(En
ter
Eq
uip
men
tC
od
e Fr
om
Li
st)
(1)
(3)
Oth
er
Mil
Mil
Mil
Th
ou
(0)
New
Eq
uip
men
t
Th
ou
Cap
ital
Exp
end
itu
res
For
Eq
uip
men
t
Th
ou
Th
ou
(2)
Use
d E
qu
ipm
ent
Eq
uip
men
tC
od
e
Mil
(Ad
d c
olu
mn
s 1+
2+3)
81 81 81 81 81 81 81 89C
olu
mn
To
tals
Co
lum
nT
ota
ls
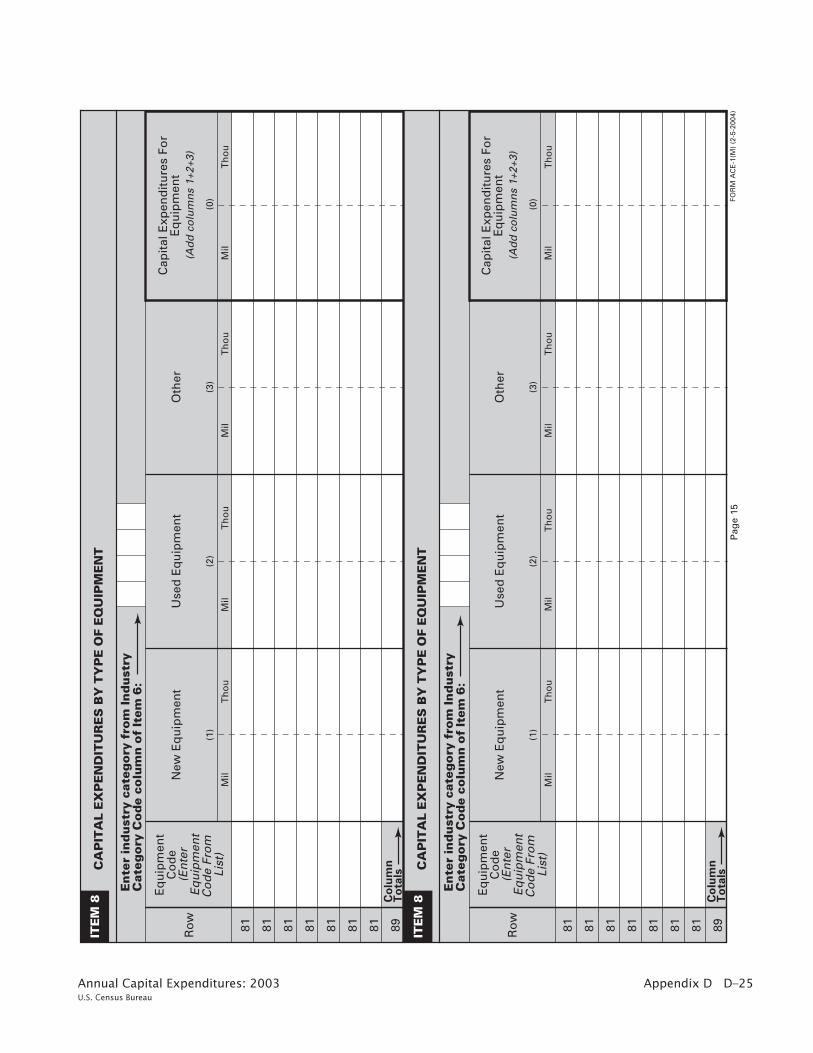
Appendix D D–25Annual Capital Expenditures: 2003U.S. Census Bureau
(En
ter
Eq
uip
men
tC
od
e Fr
om
Li
st)
(1)
(3)
Oth
er
Mil
Mil
Mil
Th
ou
(0)
New
Eq
uip
men
t
Th
ou
Cap
ital
Exp
end
itu
res
For
Eq
uip
men
t
Th
ou
Th
ou
(2)
Use
d E
qu
ipm
ent
Eq
uip
men
tC
od
e
Mil
(Ad
d c
olu
mn
s 1+
2+3)
Pag
e 15
ITE
M 8
FOR
M A
CE
-1(M
) (2
-5-2
004)
En
ter
ind
ust
ry c
ateg
ory
fro
m In
du
stry
C
ateg
ory
Co
de
colu
mn
of
Item
6:
Ro
w
81 81 81 81 81 81 81 89
CA
PIT
AL
EX
PE
ND
ITU
RE
S B
Y T
YP
E O
F E
QU
IPM
EN
T
ITE
M 8
En
ter
ind
ust
ry c
ateg
ory
fro
m In
du
stry
C
ateg
ory
Co
de
colu
mn
of
Item
6:
Ro
w
CA
PIT
AL
EX
PE
ND
ITU
RE
S B
Y T
YP
E O
F E
QU
IPM
EN
T
(En
ter
Eq
uip
men
tC
od
e Fr
om
Li
st)
(1)
(3)
Oth
er
Mil
Mil
Mil
Th
ou
(0)
New
Eq
uip
men
t
Th
ou
Cap
ital
Exp
end
itu
res
For
Eq
uip
men
t
Th
ou
Th
ou
(2)
Use
d E
qu
ipm
ent
Eq
uip
men
tC
od
e
Mil
(Ad
d c
olu
mn
s 1+
2+3)
81 81 81 81 81 81 81 89C
olu
mn
To
tals
Co
lum
nT
ota
ls

D–26 Appendix D Annual Capital Expenditures: 2003 U.S. Census Bureau
RE
MA
RK
S
CE
RT
IFIC
AT
ION
– T
his
rep
ort
is s
ub
stan
tial
ly a
ccu
rate
an
d h
as b
een
pre
par
ed in
acc
ord
ance
wit
h in
stru
ctio
ns.
Nam
e o
f p
erso
n t
o c
on
tact
reg
ard
ing
th
is r
epo
rt
(Ple
ase
pri
nt
or
typ
e)
Sig
nat
ure
of
auth
ori
zed
off
icia
l
FAX
nu
mb
er
Are
a co
de
Nu
mb
er
Dat
e
()
–
Ple
ase
be
sure
to
co
rrec
t an
y n
ame,
ad
dre
ss, a
nd
ZIP
Co
de
erro
rs o
n t
he
imp
rin
ted
ad
dre
ss o
n p
age
1 o
f th
is f
orm
bo
okl
et.
PLE
AS
E R
ET
UR
N Y
OU
R
CO
MP
LET
ED
FO
RM
TO
U.S
. C
en
su
s B
ure
au
1
20
1 E
ast
10
th S
tre
et
Je
ffe
rso
nv
ille
, IN
47
13
2-0
00
1
Tel
eph
on
e n
um
ber
Are
a co
de
Nu
mb
er
()
–
Pag
e 16
RE
PO
RT
ING
PE
RIO
D C
OV
ER
ED
OW
NE
RS
HIP
INFO
RM
AT
ION
a. D
o t
he
rep
ort
ed d
ata
cove
r th
e ca
len
dar
yea
r 2
00
3?
a. W
as t
his
co
mp
any
in o
per
atio
n o
n D
ecem
ber
31
, 2
00
3?
961
YE
SN
O –
Giv
e d
ate
op
erat
ion
s ce
ased
2
951
YE
SN
O –
Sp
ecif
y p
erio
d c
ove
red
2
b. D
id t
he
ow
ner
ship
of
this
co
mp
any
chan
ge
du
rin
g t
he
year
en
din
g D
ecem
ber
31
, 2
00
3?
971
YE
SN
O2
c.N
ame
of
new
op
erat
or/
com
pan
y
Sp
ecif
y d
ate
of
chan
ge
AN
D f
ill in
c. b
elo
w
Mo
nth
Day
Yea
r
Mo
nth
Day
Yea
r
34
Mo
nth
Day
Yea
rM
on
thD
ayY
ear
TO
FRO
M
3 3
Nu
mb
er a
nd
str
eet
add
ress
Cit
yS
tate
ZIP
Co
de
TH
AN
K Y
OU
FO
R Y
OU
R C
OO
PE
RA
TIO
N A
ND
AS
SIS
TA
NC
E IN
TH
IS S
UR
VE
Y.
FAX
th
e fo
rm t
o 1
–80
0–4
38
–80
40
OR
Ple
ase
exp
lain
an
y la
rge
or
un
usu
al c
han
ges
to
yo
ur
com
pan
y’s
rep
ort
ed d
om
esti
c ca
pit
al e
xpen
dit
ure
s.
Ext
.
E-m
ail a
dd
ress
Co
nta
ct n
ame
at n
ew c
om
pan
y
Co
nta
ct t
elep
ho
ne
nu
mb
er (
Incl
ud
e A
rea
Co
de)
FOR
M A
CE
-1(M
) (2
-5-2
004)
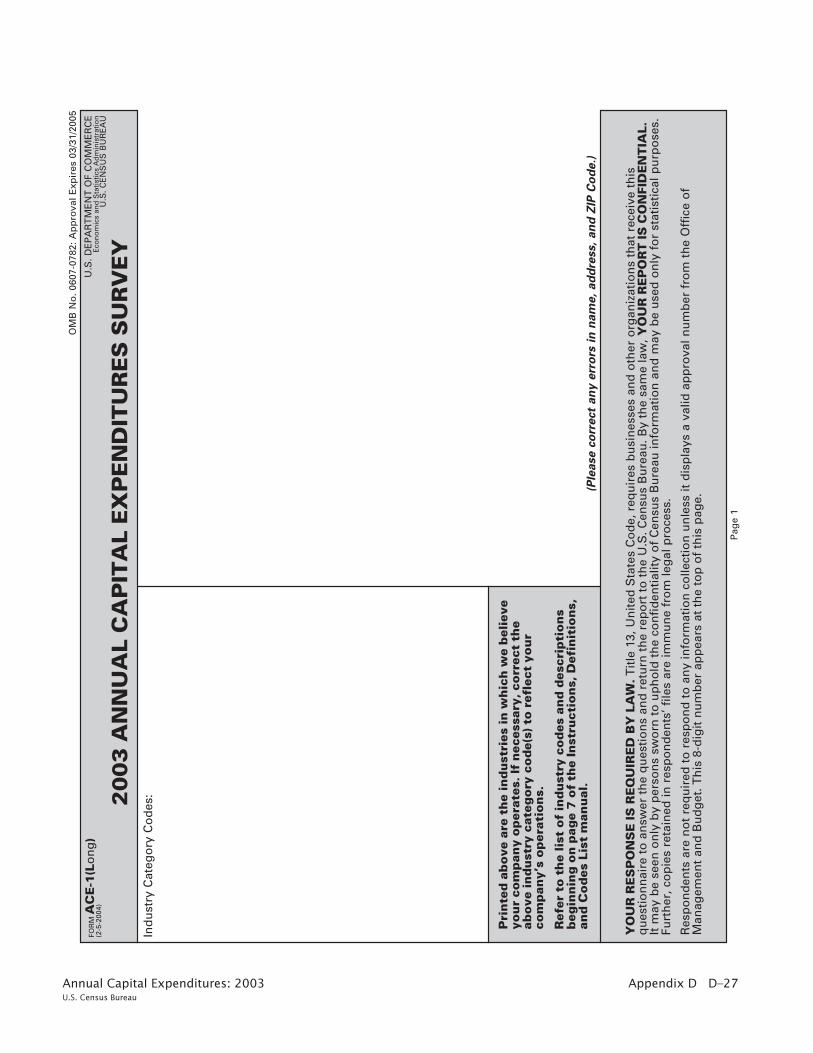
Appendix D D–27Annual Capital Expenditures: 2003U.S. Census Bureau
Pag
e 1
OM
B N
o. 0
607-
0782
: Ap
pro
val E
xpir
es 0
3/31
/200
5
FOR
MA
CE
-1(L
on
g)
(2-5
-200
4)
20
03
AN
NU
AL
CA
PIT
AL
EX
PE
ND
ITU
RE
S S
UR
VE
Y
(Ple
ase
co
rre
ct
an
y e
rro
rs i
n n
am
e,
ad
dre
ss,
an
d Z
IP C
od
e.)
U.S
. DE
PA
RT
ME
NT
OF
CO
MM
ER
CE
Eco
no
mic
s an
d S
tati
stic
s A
dm
inis
trat
ion
U.S
. CE
NS
US
BU
RE
AU
Ind
ust
ry C
ateg
ory
Co
des
:
Pri
nte
d a
bo
ve a
re t
he
ind
ust
ries
in
wh
ich
we
bel
ieve
you
r co
mp
any
op
erat
es. If
nec
essa
ry, co
rrec
t th
eab
ove
in
du
stry
cat
ego
ry c
od
e(s)
to
ref
lect
yo
ur
com
pan
y’s
op
erat
ion
s.
Ref
er t
o t
he
list
of
ind
ust
ry c
od
es a
nd
des
crip
tio
ns
beg
inn
ing
on
pag
e 7
of
the
Inst
ruct
ion
s, D
efin
itio
ns,
and
Co
des
Lis
t m
anu
al.
YO
UR
RE
SP
ON
SE
IS
RE
QU
IRE
D B
Y L
AW
. T
itle
13,
Un
ited
Sta
tes
Co
de,
req
uir
es b
usi
nes
ses
and
oth
er o
rgan
izat
ion
s th
at r
ecei
ve t
his
qu
esti
on
nai
re t
o a
nsw
er t
he
qu
esti
on
s an
d r
etu
rn t
he
rep
ort
to
th
e U
.S. C
ensu
s B
ure
au. B
y th
e sa
me
law
, Y
OU
R R
EP
OR
T IS
CO
NFI
DE
NT
IAL.
It m
ay b
e se
en o
nly
by
per
son
s sw
orn
to
up
ho
ld t
he
con
fid
enti
alit
y o
f C
ensu
s B
ure
au in
form
atio
n a
nd
may
be
use
d o
nly
fo
r st
atis
tica
l pu
rpo
ses.
Furt
her
, co
pie
s re
tain
ed in
res
po
nd
ents
’ file
s ar
e im
mu
ne
fro
m le
gal
pro
cess
.
Res
po
nd
ents
are
no
t re
qu
ired
to
res
po
nd
to
an
y in
form
atio
n c
olle
ctio
n u
nle
ss it
dis
pla
ys a
val
id a
pp
rova
l nu
mb
er f
rom
th
e O
ffic
e o
fM
anag
emen
t an
d B
ud
get
. Th
is 8
-dig
it n
um
ber
ap
pea
rs a
t th
e to
p o
f th
is p
age.
US
CE
NS
US
BU
RE
AU
D–28 Appendix D Annual Capital Expenditures: 2003 U.S. Census Bureau
Pag
e 2
FOR
M A
CE
-1(L
on
g)
(2-5
-200
4)
DE
FIN
ITIO
NS
AN
D G
EN
ER
AL
INS
TR
UC
TIO
NS
•S
UR
VE
Y S
CO
PE
–T
his
surv
ey c
olle
cts
cap
ital
exp
end
itu
res
dat
a fo
rn
on
farm
co
mp
anie
s, o
rgan
izat
ion
s, a
nd
ass
oci
atio
ns
op
erat
ing
wit
hin
th
e U
nit
ed S
tate
s. T
his
incl
ud
es c
hu
rch
es a
nd
oth
ern
on
-pro
fit
org
aniz
atio
ns,
go
vern
men
t o
wn
ed b
ut
pri
vate
ly o
per
ated
org
aniz
atio
ns,
tri
bal
bu
sin
ess
op
erat
ion
s, a
nd
ag
ricu
ltu
ral s
ervi
ces.
Ag
ricu
ltu
ral p
rod
uct
ion
sh
ou
ld b
e ex
clu
ded
.
PLE
AS
E R
EFE
R T
O T
HE
EN
CLO
SE
D IN
ST
RU
CT
ION
S,
DE
FIN
ITIO
NS
, A
ND
CO
DE
S L
IST
MA
NU
AL
BE
FOR
EC
OM
PLE
TIN
G T
HE
SU
RV
EY
.
•S
UR
VE
Y P
ER
IOD
–R
epo
rtd
ata
for
cale
nd
ar y
ear
2003
. Ref
er t
op
age
1 o
f th
e in
stru
ctio
n m
anu
al if
you
r re
cord
s ar
e o
n a
fisc
al y
ear
bas
is.
•If
yo
ur
com
pan
y ce
ased
op
erat
ion
s d
uri
ng
th
e su
rvey
yea
r,co
mp
lete
th
e fo
rm f
or
the
per
iod
of
tim
e th
e co
mp
any
was
in
op
erat
ion
.
•R
easo
nab
le e
stim
ates
are
acc
epta
ble
.
•R
epo
rt d
olla
rva
lues
ro
un
ded
to
th
ou
san
ds.
Exa
mp
le: If
fig
ure
is
$1
79
,12
5,6
28
.00
rep
ort
Mil
179
•T
o r
etu
rn t
he
form
by
FAX
, fax
to
1–8
00
–43
8–8
04
0.
•If
yo
u h
ave
any
qu
esti
on
s re
gar
din
g t
his
su
rvey
or
nee
d h
elp
com
ple
tin
g it,
cal
l 1
–80
0–5
28
–30
49
.
Thou
126
•P
leas
e co
mp
lete
an
d r
etu
rn t
he
form
in t
he
enve
lop
e p
rovi
ded
by
the
du
e d
ate
sho
wn
on
th
e to
p o
f th
e p
age
wit
h y
ou
r m
ailin
gad
dre
ss.T
o r
equ
est
ano
ther
su
rvey
fo
rm o
r an
ext
ensi
on
of
tim
efo
r fi
ling
, cal
l 1–8
00
–52
8–3
04
9.
FRO
M T
HE
DIR
EC
TO
R
U.S
. CE
NS
US
BU
RE
AU
We
are
con
du
ctin
g t
he
An
nu
al C
apit
al E
xpen
dit
ure
s S
urv
ey, a
nd
we
wo
uld
like
yo
u t
o h
elp
by
com
ple
tin
gth
e en
clo
sed
su
rvey
fo
rm.
Th
e U
.S. C
ensu
s B
ure
au’s
An
nu
al C
apit
al E
xpen
dit
ure
s S
urv
ey is
a k
ey s
ou
rce
of
info
rmat
ion
ab
ou
t o
ur
cou
ntr
y’s
eco
no
mic
per
form
ance
. Bu
sin
ess
inve
stm
ent
in s
tru
ctu
res
and
eq
uip
men
t is
an
imp
ort
ant
com
po
nen
t o
f G
ross
Do
mes
tic
Pro
du
ct. I
nve
stm
ent
dat
a ar
e u
sefu
l fo
r id
enti
fyin
g b
usi
nes
s o
pp
ort
un
itie
s,p
rod
uct
dev
elo
pm
ent,
an
d s
trat
egic
pla
nn
ing
.
Tit
le 1
3 o
f th
e U
nit
ed S
tate
s C
od
e re
qu
ires
yo
u t
o a
nsw
er t
his
su
rvey
; it
also
req
uir
es u
s to
kee
p y
ou
rre
spo
nse
co
nfi
den
tial
.
We
real
ize
that
co
mp
leti
ng
th
is s
urv
ey is
a b
urd
en f
or
you
. We
ho
pe,
ho
wev
er, t
hat
yo
u a
pp
reci
ate
the
imp
ort
ance
of
you
r re
spo
nse
in p
rovi
din
g a
ccu
rate
dat
a ab
ou
t o
ur
Nat
ion
’s e
con
om
ic p
erfo
rman
ce. W
eh
ave
limit
ed t
he
surv
ey s
amp
le t
o t
he
few
est
po
ssib
le n
um
ber
of
rep
rese
nta
tive
fir
ms,
an
d w
e ac
cep
tes
tim
ates
if b
oo
k fi
gu
res
are
no
t av
aila
ble
.
Ple
ase
revi
ew t
he
inst
ruct
ion
s, c
om
ple
te t
he
form
, an
d r
etu
rn it
wit
hin
30
day
s. T
he
inst
ruct
ion
sca
n a
ssis
t yo
u o
n h
ow
to
rep
ort
fo
r ea
ch it
em. R
etu
rnin
g y
ou
r fo
rm p
rom
ptl
y h
elp
s u
s ke
ep f
ollo
w-u
pco
sts
do
wn
. If
you
hav
e an
y q
ues
tio
ns
or
com
men
ts, p
leas
e ca
ll u
s to
ll-fr
ee a
t 1
-80
0-5
28
-30
49
.
Th
ank
you
in a
dva
nce
fo
r yo
ur
coo
per
atio
n.
Sin
cere
ly,
En
clo
sure
Ch
arle
s Lo
uis
Kin
can
no
n

Appendix D D–29Annual Capital Expenditures: 2003U.S. Census Bureau
Pag
e 3
ITE
M 1
A–
DO
ME
ST
ICD
EP
RE
CIA
BLE
AS
SE
T D
AT
A
DE
PR
EC
IAB
LE A
SS
ET
S–
New
an
d u
sed
bu
ildin
gs,
str
uct
ure
s, m
ach
iner
y, a
nd
eq
uip
men
t fo
r w
hic
h d
epre
ciat
ion
or
amo
rtiz
atio
n a
cco
un
tsar
e o
rdin
arily
mai
nta
ined
. Th
e va
lue
of
lan
d d
evel
op
men
t an
d im
pro
vem
ents
, as
wel
l as
exp
lora
tio
n a
nd
dev
elo
pm
ent
of
min
eral
pro
per
ties
, are
incl
ud
ed.
Exc
lud
e•
Co
st o
f la
nd
an
d d
eple
tab
le a
sset
s su
ch a
s m
iner
al a
nd
tim
ber
rig
hts
;•
Ass
ets
of
fore
ign
op
erat
ion
s;•
Ass
ets
leas
ed t
o o
ther
s u
nd
er c
apit
al le
ase
arra
ng
emen
ts;
•P
aten
ts, c
op
yrig
hts
, tra
dem
arks
, fra
nch
ises
, an
d g
oo
dw
ill.
CA
PIT
AL
EX
PE
ND
ITU
RE
S–
All
cap
ital
ized
co
sts
du
rin
g 2
003
for
bo
th n
ew a
nd
use
d s
tru
ctu
res
and
eq
uip
men
t ch
arg
eab
le t
o a
sset
acco
un
ts, a
nd
fo
r w
hic
h d
epre
ciat
ion
or
amo
rtiz
atio
n a
cco
un
ts a
re o
rdin
arily
mai
nta
ined
.
Incl
ud
e•
Exp
end
itu
res
for
maj
or
add
itio
ns,
alt
erat
ion
s, a
nd
cap
ital
ized
rep
airs
to
exi
stin
g s
tru
ctu
res,
wh
eth
er p
erfo
rmed
by
aco
ntr
acto
r o
r co
mp
lete
d in
-ho
use
;•
Gro
ss a
dd
itio
ns
du
rin
g t
he
year
to
co
nst
ruct
ion
-in
-pro
gre
ss a
cco
un
ts f
or
pro
ject
s la
stin
g m
ore
th
an o
ne
year
, eve
n if
th
e as
set
was
no
t in
use
an
d n
ot
yet
dep
reci
ated
;
•C
apit
aliz
ed c
ost
of
asse
ts p
rod
uce
d o
r p
urc
has
ed t
hen
leas
ed a
s th
e le
sso
r u
nd
er o
per
atin
g le
ases
; •
Cap
ital
co
sts
for
feas
ibili
ty s
tud
ies,
arc
hit
ectu
ral,
leg
al, i
nst
alla
tio
n, a
nd
en
gin
eeri
ng
fee
s;•
Co
st o
f as
sets
acq
uir
ed u
nd
er c
apit
al le
ases
en
tere
d in
to d
uri
ng
th
e su
rvey
yea
r;•
Exp
end
itu
res
for
cap
ital
ized
imp
rove
men
ts m
ade
to a
sset
s le
ased
fro
m o
ther
s (l
ease
ho
ld im
pro
vem
ents
);•
Exp
end
itu
res
for
dev
elo
pm
enta
l an
d e
xplo
rato
ry d
rilli
ng
act
ivit
ies,
incl
ud
ing
inta
ng
ible
dri
llin
g c
ost
s;•
Cap
ital
ized
inte
rest
ch
arg
es o
n lo
ans
wit
h w
hic
h c
apit
al p
roje
cts
are
fin
ance
d, i
f co
nsi
sten
t w
ith
th
eS
tate
men
t o
f Fi
nan
cial
Acc
ou
nti
ng
Sta
nd
ard
s B
oar
d (
FAS
B)
Nu
mb
er 3
4;
•E
xpen
dit
ure
s fo
r la
nd
dev
elo
pm
ent
and
imp
rove
men
t, in
clu
din
g d
emo
litio
n o
f b
uild
ing
s, la
nd
ser
vici
ng
,an
d s
ite
pre
par
atio
n.
Exc
lud
e
OT
HE
R A
DD
ITIO
NS
AN
D A
CQ
UIS
ITIO
NS
– A
dd
itio
ns
to y
ou
r d
epre
ciab
le a
sset
acc
ou
nts
, in
clu
din
g d
epre
ciab
le a
sset
s ac
qu
ired
th
rou
gh
mer
ger
s an
d a
cqu
isit
ion
s, if
no
t co
nsi
der
ed c
apit
al e
xpen
dit
ure
s.
•E
xpen
dit
ure
s fo
r st
ruct
ure
s o
r eq
uip
men
t b
y su
bsi
dia
ries
an
d b
ran
ches
loca
ted
ou
tsid
e th
e U
nit
ed S
tate
s;•
Val
ue
of
stru
ctu
res
bu
ilt o
r w
ork
per
form
ed b
y yo
ur
ente
rpri
se o
n c
on
trac
t to
oth
ers;
•It
ems
char
gea
ble
as
curr
ent
op
erat
ing
exp
ense
s su
ch a
s co
st o
f m
ain
ten
ance
, no
rmal
rep
airs
, an
d s
up
plie
s;•
Exp
end
itu
res
for
go
od
will
, pat
ents
, or
cop
yrig
hts
;•
Pay
men
ts t
o o
ther
s fo
r st
ruct
ure
s an
d e
qu
ipm
ent
acq
uir
ed u
nd
er o
per
atin
g le
ases
or
ren
ted
;•
Exp
end
itu
res
for
pro
per
ty w
hic
h is
leas
ed t
o o
ther
s as
par
t o
f a
cap
ital
(fu
ll-p
ayo
ut
or
equ
ity)
leas
e ar
ran
gem
ent.
ITE
M 1
B–
GR
OS
SS
ALE
S, O
PE
RA
TIN
G R
EC
EIP
TS
, A
ND
RE
VE
NU
ES
Incl
ud
e•
Gro
ss s
ales
, op
erat
ing
rec
eip
ts, a
nd
rev
enu
es f
rom
tax
able
op
erat
ion
s as
wel
l as
tota
l rev
enu
es f
rom
tax-
exem
pt
acti
viti
es. S
ee p
age
4 o
f th
e in
stru
ctio
n m
anu
al f
or
add
itio
nal
det
ails
reg
ard
ing
th
is it
em.
DE
FIN
ITIO
NS
AN
D G
EN
ER
AL
INS
TR
UC
TIO
NS
•V
alu
e o
f as
sets
exp
ense
d a
s p
erm
itte
d u
nd
er S
ecti
on
179
of
the
U.S
. In
tern
al R
even
ue
Co
de;
•C
apit
aliz
ed c
om
pu
ter
soft
war
e;
FOR
M A
CE
-1(L
on
g)
(2-5
-200
4)
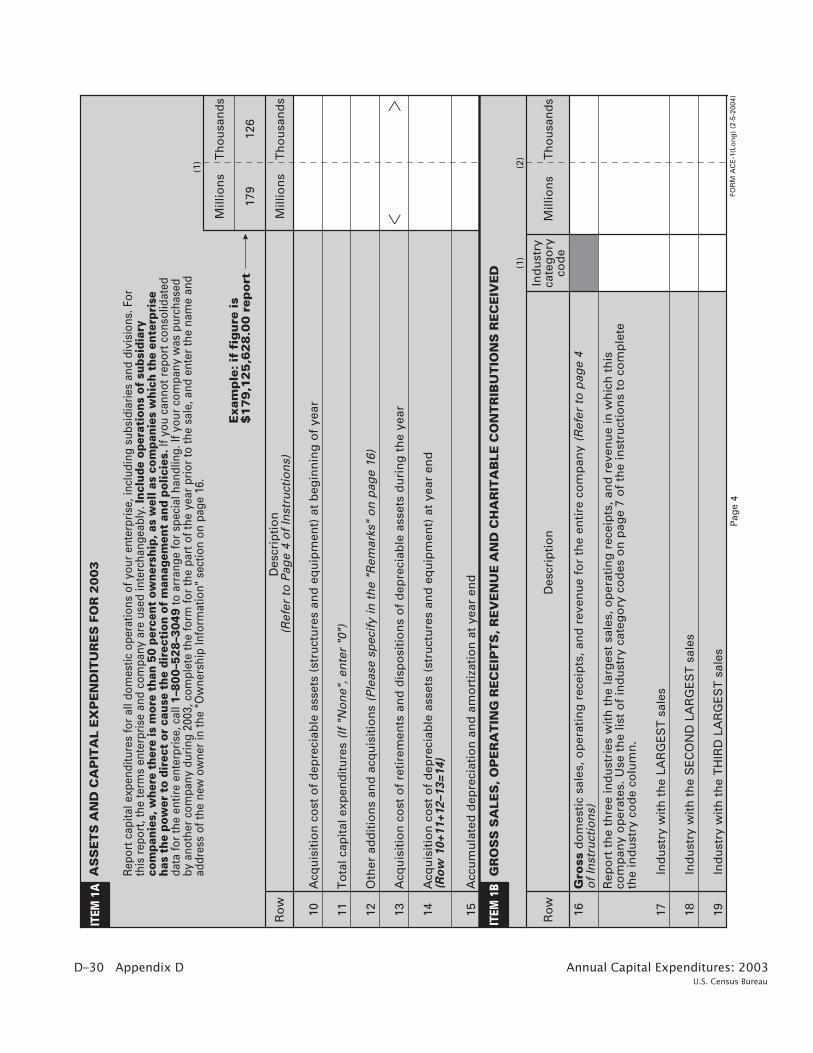
D–30 Appendix D Annual Capital Expenditures: 2003 U.S. Census Bureau
ITEM
1A
Exa
mp
le: if
fig
ure
is
$1
79
,12
5,6
28
.00
rep
ort
Ro
wD
escr
ipti
on
(Ref
er t
o P
age
4 o
f In
stru
ctio
ns)
10 11 12 13 14
Th
ou
san
ds
15
��
Acq
uis
itio
n c
ost
of
dep
reci
able
ass
ets
(str
uct
ure
s an
d e
qu
ipm
ent)
at
beg
inn
ing
of
year
To
tal c
apit
al e
xpen
dit
ure
s (I
f "N
on
e", e
nte
r "0
")
Oth
er a
dd
itio
ns
and
acq
uis
itio
ns
(Ple
ase
spec
ify
in t
he
"Rem
arks
" o
n p
age
16)
Acq
uis
itio
n c
ost
of
reti
rem
ents
an
d d
isp
osi
tio
ns
of
dep
reci
able
ass
ets
du
rin
g t
he
year
Acq
uis
itio
n c
ost
of
dep
reci
able
ass
ets
(str
uct
ure
s an
d e
qu
ipm
ent)
at
year
en
d(R
ow
10
+1
1+
12
–1
3=
14
)
Acc
um
ula
ted
dep
reci
atio
n a
nd
am
ort
izat
ion
at
year
en
d
(1)
Pag
e 4
AS
SE
TS
AN
D C
AP
ITA
L E
XP
EN
DIT
UR
ES
FO
R 2
00
3
Rep
ort c
apita
l exp
endi
ture
s fo
r al
l dom
estic
ope
ratio
ns o
f you
r en
terp
rise
, inc
ludi
ng s
ubsi
diar
ies
and
divi
sion
s. F
orth
is r
epor
t, th
e te
rms
ente
rpri
se a
nd c
ompa
ny a
re u
sed
inte
rcha
ngea
bly.
Incl
ude
oper
atio
ns o
f su
bsid
iary
com
pani
es, w
here
the
re is
mor
e th
an 5
0 pe
rcen
t ow
ners
hip,
as
wel
l as
com
pani
es w
hich
the
ent
erpr
ise
has
the
pow
er t
o di
rect
or
caus
e th
e di
rect
ion
of m
anag
emen
t an
d po
licie
s. If
you
can
not r
epor
t con
solid
ated
data
for
the
entir
e en
terp
rise
, cal
l 1–8
00–5
28–3
049
to a
rran
ge fo
r sp
ecia
l han
dlin
g. If
you
r co
mpa
ny w
as p
urch
ased
by a
noth
er c
ompa
ny d
urin
g 20
03, c
ompl
ete
the
form
for
the
part
of t
he y
ear
prio
r to
the
sale
, and
ent
er th
e na
me
and
addr
ess
of th
e ne
w o
wne
r in
the
"Ow
ners
hip
Info
rmat
ion"
sec
tion
on p
age
16.
Mill
ion
s
ITEM
1B
Ro
wD
escr
ipti
on
Gro
ssd
om
esti
c sa
les,
op
erat
ing
rec
eip
ts, a
nd
rev
enu
e fo
r th
e en
tire
co
mp
any
(Ref
er t
o p
age
4 o
f In
stru
ctio
ns)
16
Ind
ust
ry w
ith
th
e LA
RG
ES
T s
ales
Ind
ust
ry w
ith
th
e S
EC
ON
D L
AR
GE
ST
sal
es
Ind
ust
ry w
ith
th
e T
HIR
D L
AR
GE
ST
sal
es
17 18 19
179
126
Mill
ion
sT
ho
usa
nd
s
GR
OS
S S
ALE
S, O
PE
RA
TIN
G R
EC
EIP
TS
, R
EV
EN
UE
AN
D C
HA
RIT
AB
LE C
ON
TR
IBU
TIO
NS
RE
CE
IVE
D
FOR
M A
CE
-1(L
on
g)
(2-5
-200
4)
(1)
Mill
ion
sIn
du
stry
cate
go
ryco
de
Rep
ort
th
e th
ree
ind
ust
ries
wit
h t
he
larg
est
sale
s, o
per
atin
g r
ecei
pts
, an
d r
even
ue
in w
hic
h t
his
com
pan
y o
per
ates
. Use
th
e lis
t o
f in
du
stry
cat
ego
ry c
od
es o
n p
age
7 o
f th
e in
stru
ctio
ns
to c
om
ple
teth
e in
du
stry
co
de
colu
mn
.
(2) T
ho
usa
nd
s

Appendix D D–31Annual Capital Expenditures: 2003U.S. Census Bureau
Pag
e 5
ITE
M 2
–D
OM
ES
TIC
CA
PIT
AL
EX
PE
ND
ITU
RE
S D
AT
A
ST
RU
CT
UR
ES
–
Exc
lud
e
Incl
ud
e
Exc
lud
e
Co
mp
lete
Item
2 f
or
the
cap
ital
exp
end
itu
res
rep
ort
ed in
Item
1A
, Ro
w 1
1.
Rep
ort
th
e ca
pit
aliz
ed c
ost
of
bu
ildin
gs
and
str
uct
ure
s, a
nd
all
nec
essa
ry e
xpen
dit
ure
s to
acq
uir
e, c
on
stru
ct, a
nd
pre
par
eth
e st
ruct
ure
fo
r it
s in
ten
ded
use
.
•M
ajo
r ad
dit
ion
s, a
lter
atio
ns,
an
d c
apit
aliz
ed r
epai
rs t
o e
xist
ing
str
uct
ure
s, w
het
her
per
form
ed b
y a
con
trac
tor
or
com
ple
ted
in-h
ou
se;
•M
ach
iner
y an
d e
qu
ipm
ent
wh
ich
are
an
inte
gra
l or
bu
ilt-i
n f
eatu
re o
f th
e st
ruct
ure
;•
Exp
end
itu
res
for
lan
d d
evel
op
men
t an
d im
pro
vem
ents
su
ch a
s d
emo
litio
n o
f b
uild
ing
s, s
ite
pre
par
atio
n, a
nd
lan
dse
rvic
ing
;•
Faci
litie
s w
hic
h a
re b
uilt
into
or
fixe
d t
o t
he
lan
d s
uch
as
sid
ewal
ks, s
tree
ts, p
arki
ng
lots
, air
fiel
ds,
pie
rs, t
elep
ho
ne
and
po
wer
lin
es, s
ewer
s, a
nd
pet
role
um
an
d g
as p
ipel
ines
;•
Exp
lora
tio
n a
nd
dev
elo
pm
ent
of
min
eral
pro
per
ties
su
ch a
s d
rilli
ng
gas
wel
ls, c
on
stru
ctio
n o
f o
ffsh
ore
dri
llin
gp
latf
orm
s; d
igg
ing
an
d s
ho
rin
g m
ines
, min
e sh
afts
, an
d m
inin
g e
xplo
rati
on
.
•C
ost
of
lan
d a
nd
dep
leta
ble
ass
ets;
•N
orm
al m
ain
ten
ance
an
d r
epai
rs t
o e
xist
ing
str
uct
ure
s o
r se
rvic
e fa
cilit
ies.
Rep
ort
th
e ca
pit
aliz
ed c
ost
of
mac
hin
ery
and
eq
uip
men
t u
sed
in t
he
pro
du
ctio
n a
nd
dis
trib
uti
on
of
go
od
s an
d s
ervi
ces,
and
in o
ffic
e fu
nct
ion
s.
•Fu
rnit
ure
an
d f
ixtu
res;
•T
ran
spo
rtat
ion
eq
uip
men
t su
ch a
s au
tom
ob
iles,
tru
cks,
tra
cto
rs, a
ircr
aft,
an
d s
hip
s;•
Off
ice
equ
ipm
ent
and
mac
hin
es, i
ncl
ud
ing
co
mp
ute
rs;
•E
xpen
dit
ure
s fo
r it
ems
that
are
exp
ense
d, s
uch
as
off
ice
sup
plie
s;•
Exp
end
itu
res
for
mac
hin
ery
or
equ
ipm
ent
wh
ich
are
ho
use
d in
str
uct
ure
s an
d c
ann
ot
be
rem
ove
d o
r re
pla
ced
wit
ho
ut
sig
nif
ican
tly
alte
rin
g t
he
stru
ctu
re. E
xam
ple
s in
clu
de
elec
tric
al w
ork
, ele
vato
rs, h
eati
ng
an
d c
oo
ling
sys
tem
s,an
d o
verh
ead
ho
ists
an
d c
ran
es. S
ee It
em 2
, ST
RU
CT
UR
ES
on
pag
e 3
of
the
inst
ruct
ion
man
ual
fo
r ad
dit
ion
al t
ypes
of
equ
ipm
ent
to b
e in
clu
ded
as
stru
ctu
res.
OT
HE
R –
Rep
ort
cap
ital
exp
end
itu
res
for
asse
ts a
cqu
ired
in 2
003
that
can
no
t b
e cl
assi
fied
un
der
str
uct
ure
s o
r eq
uip
men
t. (D
o n
ot
rep
ort
fu
rnit
ure
an
d f
ixtu
res,
cap
ital
ized
co
mp
ute
r so
ftw
are,
an
d m
oto
r ve
hic
les
as O
TH
ER
; th
ese
are
con
sid
ered
eq
uip
men
t fo
r th
is s
urv
ey.)
•C
ost
of
lan
d a
nd
dep
leta
ble
ass
ets;
No
te:
•P
rod
uct
ion
mac
hin
ery;
•C
apit
aliz
ed c
om
pu
ter
soft
war
e.
EQ
UIP
ME
NT
–
Incl
ud
e
Exc
lud
e
All
oca
te c
on
stru
ctio
n-i
n-p
rog
ress
, le
aseh
old
im
pro
vem
ents
, an
d c
apit
aliz
ed in
tere
st a
s st
ruct
ure
san
d e
qu
ipm
ent
wh
ere
app
lica
ble
. If
yo
u c
ann
ot
allo
cate
th
ese
exp
end
itu
res
as s
tru
ctu
res
or
equ
ipm
ent,
re
po
rt t
hem
as
OT
HE
R a
nd
pro
vid
e a
des
crip
tio
n in
Ite
m 3
.
DE
FIN
ITIO
NS
AN
D G
EN
ER
AL
INS
TR
UC
TIO
NS
•G
ross
ad
dit
ion
s d
uri
ng
th
e ye
ar t
o c
on
stru
ctio
n-i
n-p
rog
ress
acc
ou
nts
fo
r p
roje
cts
last
ing
mo
re t
han
on
e ye
ar;
FOR
M A
CE
-1(L
on
g)
(2-5
-200
4)

D–32 Appendix D Annual Capital Expenditures: 2003 U.S. Census Bureau
CA
PITA
L EX
PEN
DIT
UR
ES(R
efer
to
page
2 o
f In
stru
ctio
ns)
(4)
(1)
(2)
(3)
Str
uct
ure
sE
qu
ipm
ent
Oth
er
Mil
Th
ou
ITE
M 2
Rep
ort
th
e fo
llo
win
g d
om
esti
c ca
pit
al e
xpen
dit
ure
s d
ata
for
the
enti
reco
mp
any.
(Ref
er t
o p
age
4 o
f In
stru
ctio
ns)
ITE
M 3
List
the
item
s in
clud
ed in
"O
ther
". Re
port
in th
ousa
nds
of d
olla
rs. F
urni
ture
and
fix
ture
s, c
ompu
ters
, cap
ital
ized
com
pute
r so
ftw
are,
and
mot
orve
hicl
essh
ould
be
repo
rted
as
equi
pmen
t. Le
aseh
old
impr
ovem
ents
sho
uld
be c
onsi
dere
d st
ruct
ures
or
equi
pmen
t bas
ed o
n w
hat i
s be
ing
impr
oved
.
ITE
M 4
Ro
w
Ro
w
20 21 22 30 31
(2)
Des
crip
tio
n o
f C
apit
al E
xpen
dit
ure
s
Cap
ital e
xpen
ditu
res
for
NEW
str
uctu
res
and
equi
pmen
t(In
clud
e m
ajor
add
ition
s, a
ltera
tions
, and
cap
italiz
edre
pair
s to
exi
stin
g st
ruct
ures
)
Cap
ital
exp
end
itu
res
for
US
ED
str
uct
ure
s an
deq
uip
men
t
TO
TA
L ca
pit
al e
xpen
dit
ure
s (A
dd
Ro
ws 2
0+
21)
41Ro
w
For
new
cap
ital
exp
end
itu
res
rep
ort
ed in
Item
2, R
ow
20,
Co
lum
n (
4), r
epo
rt t
he
esti
mat
ed c
ost
of
asse
tsac
qu
ired
un
der
CA
PIT
AL
LEA
SE
arr
ang
emen
ts e
nte
red
into
du
rin
g t
he
year
. Exc
lud
e p
aym
ents
fo
ro
per
atin
g le
ases
an
d c
apit
aliz
ed c
ost
s o
f le
aseh
old
imp
rove
men
ts. (
Ref
er t
o p
age
5 o
f th
e In
stru
ctio
ns)
TO
TA
L
(1)
(1)
ITE
M 5
50Ro
w
Pag
e 6
Mil
Th
ou
Mil
Th
ou
Mil
Th
ou
Th
ou
CA
PIT
AL
EX
PE
ND
ITU
RE
S
To
tal
(Ad
d c
olu
mn
s 1
+2+
3)
Mil
Th
ou
179
126
Exa
mp
le: if
fig
ure
is
$1
79
,12
5,6
28
.00
rep
ort
Mil
Th
ou
Mil
To
tal
sh
ou
ld e
qu
al
Ite
m 1
A,
Ro
w 1
1
Mil
Th
ou
Mil
Th
ou
Mil
Th
ou
Mil
Th
ou
Pre
pac
kag
ed(1
)V
endo
r- c
usto
miz
ed(2
)(3
)
To
tal
(Ad
d c
olu
mn
s 1
+2
+3
)(4
)C
AP
ITA
LIZ
ED
CO
MP
UT
ER
SO
FTW
AR
E
(Ref
er t
o p
age
5 o
f In
stru
ctio
ns)
Rep
ort
capi
tal e
xpen
ditu
res
for
com
pute
r so
ftw
are
deve
lope
d or
obt
aine
d fo
r in
tern
al u
se d
urin
g th
e ye
ar.
Incl
ude
amou
nts
in It
em 1
A a
nd It
em 2
.
FOR
M A
CE
-1(L
on
g)
(2-5
-200
4)
Inte
rnal
ly-d
evel
oped

Appendix D D–33Annual Capital Expenditures: 2003U.S. Census Bureau
Pag
e 7
61 61 61 61 61 61 61 61 61
Indu
stry
Cat
egor
yC
ode
Equi
pmen
tO
ther
(2)
(3)
(5)
(6)
New
Use
dU
sed
New
New
Use
dR
ow
ITE
M 6
Co
mp
lete
Item
6 f
or
each
ind
ust
ry in
wh
ich
th
e co
mp
any
had
op
erat
ion
s an
d m
ade
cap
ital
exp
end
itu
res
in 2
003.
(R
efer
to
pag
e 5
of
the
Inst
ruct
ion
s.)
Th
e lis
t o
f in
du
stry
cat
ego
ry c
od
es p
rin
ted
on
pag
e 1
of
the
surv
ey a
re t
he
ind
ust
ries
in w
hic
h w
e b
elie
ve y
ou
rco
mp
any
op
erat
es. I
f th
e in
du
stri
es a
re in
corr
ect
or
inco
mp
lete
, ple
ase
refe
r to
th
e co
mp
lete
list
of
po
ssib
le in
du
stry
co
des
an
dd
escr
ipti
on
s b
egin
nin
g o
n p
age
7 o
f th
e In
stru
ctio
ns,
Def
init
ion
s, a
nd
Co
des
Lis
t m
anu
al. C
orr
ect
the
list
on
pag
e 1
of
this
fo
rman
d u
se t
hes
e u
pd
ated
ind
ust
ry c
od
es t
o c
om
ple
te It
em 6
.
(8)
(9)
Mil
Th
ou
Mil
Th
ou
Mil
Th
ou
Mil
Th
ou
Mil
Th
ou
Mil
Th
ou
Str
uctu
res
(Incl
ude
maj
or a
dditi
ons,
alte
ratio
ns
and
capi
taliz
ed re
pairs
to e
xist
ing
stru
ctur
es a
s ne
w s
truct
ures
)
(0)
Mil
Th
ou
TOTA
LC
API
TAL
EXPE
ND
ITU
RES
ST
RU
CT
UR
ES
+ E
QU
IPM
EN
T +
OT
HE
R =
TO
TA
L
69C
OLU
MN
TOTA
LS
Sho
uld
equa
lIte
m 2
, Row
20,
Col
umn
1
Sho
uld
equa
lIte
m 2
, Row
21,
Col
umn
1
Sho
uld
equa
lIte
m 2
, Row
20,
Col
umn
2
Sho
uld
equa
lIte
m 2
, Row
21,
Col
umn
2
Sho
uld
equa
lIte
m 2
, Row
20,
Col
umn
3
Sho
uld
equa
lIte
m 2
, Row
21,
Col
umn
3
Sh
ou
ld e
qu
al
Ite
m 2
, R
ow
22
,C
olu
mn
4
FOR
M A
CE
-1(L
on
g)
(2-5
-200
4)

D–34 Appendix D Annual Capital Expenditures: 2003 U.S. Census Bureau
Pag
e 8
ITE
M 7
Co
mp
lete
a s
epar
ate
Item
7 f
or
each
ind
ust
ry li
sted
in It
em 6
wit
h e
xpen
dit
ure
s fo
r st
ruct
ure
s.
FOR
M A
CE
-1(L
on
g)
(2-5
-200
4)
(En
ter
Str
uct
ure
Co
de
fro
m L
ist)
(0)
(3)
(7)
Use
d
Rem
odel
ing,
Ren
ovat
ion,
Mod
erni
zatio
n of
Exi
stin
g Fa
cilit
yO
ther
Mil
Th
ou
En
ter
ind
ust
ry c
ateg
ory
fro
m In
du
stry
C
ateg
ory
Co
de
colu
mn
of
Item
6:
Ro
w
71 71 71 71 71 71 71 79
Mil
Th
ou
Mil
Th
ou
Mil
Th
ou
CA
PIT
AL
EX
PE
ND
ITU
RE
S B
Y T
YP
E O
F S
TR
UC
TU
RE
(2)
New
Mil
Th
ou
(1)
Co
ntr
act
Mil
Th
ou
Cap
ital
Exp
end
itu
res
for
Str
uct
ure
sO
wn
Em
plo
yees
Co
nst
ruct
ion
of
New
Fac
ility
Acq
uisi
tion
of E
xist
ing
Faci
lity
(4)
Mil
Th
ou
Mil
Th
ou
(6)
(5)
Co
ntr
act
Ow
nE
mp
loye
es
ITE
M 7
–C
AP
ITA
LE
XP
EN
DIT
UR
ES
BY
TY
PE
OF
ST
RU
CT
UR
E
DE
FIN
ITIO
NS
AN
D G
EN
ER
AL
INS
TR
UC
TIO
NS
If y
ou
had
exp
end
itu
res
for
stru
ctu
res
in m
ore
th
an 7
ind
ust
ries
, ph
oto
cop
y It
em 7
fo
r ad
dit
ion
al s
pac
e. If
yo
u n
eed
ad
dit
ion
al li
nes
to
rep
ort
typ
es o
f st
ruct
ure
s fo
r an
ind
ust
ry, c
on
tin
ue
to t
he
nex
t It
em 7
en
teri
ng
th
e sa
me
ind
ust
ry c
od
e.
Use
th
e th
ree-
dig
it s
tru
ctu
re c
od
e fr
om
Sec
tio
n III
on
pag
e 1
1 o
f th
e In
stru
ctio
ns,
Def
init
ion
s, a
nd
Co
des
Lis
ts m
anu
al t
ore
po
rt t
he
typ
e o
f st
ruct
ure
th
at y
ou
r co
mp
any
acq
uir
ed, co
nst
ruct
ed, re
mo
del
ed, re
no
vate
d,
or
mo
der
niz
ed.
CO
NS
TR
UC
TIO
N O
F N
EW
FA
CIL
ITY
– B
uild
ing
s o
r o
ther
str
uct
ure
s n
ot
pre
vio
usl
y o
wn
ed. I
ncl
ud
e ad
dit
ion
s to
exi
stin
g b
uild
ing
s, s
uch
as a
new
win
g.
AC
QU
ISIT
ION
OF
EX
IST
ING
FA
CIL
ITY
/NE
W–
Bu
ildin
gs
or
oth
er s
tru
ctu
res
that
hav
e b
een
pre
vio
usl
y o
wn
ed b
ut
no
t o
ccu
pie
d o
r u
sed
.
AC
QU
ISIT
ION
OF
EX
IST
ING
FA
CIL
ITY
/US
ED
– B
uild
ing
s o
r o
ther
str
uct
ure
s th
at h
ave
bee
n p
revi
ou
sly
ow
ned
AN
D o
ccu
pie
d o
r u
sed
.
Str
uct
ure
Co
de
(Ad
d c
olu
mn
s1+
2+3+
4+5+
6+7)
Co
lum
nT
ota
ls

Appendix D D–35Annual Capital Expenditures: 2003U.S. Census Bureau
Pag
e 9
ITE
M 7
FOR
M A
CE
-1(L
on
g)
(2-5
-200
4)
(3)
(7)
Use
d
Rem
od
elin
g, R
eno
vati
on
,M
od
ern
izat
ion
of
Exi
stin
g F
acili
tyO
ther
Mil
Th
ou
En
ter
ind
ust
ry c
ateg
ory
fro
m In
du
stry
C
ateg
ory
Co
de
colu
mn
of
Item
6:
Ro
w
71 71 71 71 71 71 71 79
Mil
Th
ou
Mil
Th
ou
CA
PIT
AL
EX
PE
ND
ITU
RE
S B
Y T
YP
E O
F S
TR
UC
TU
RE
(2)
New
Mil
Th
ou
(1)
Co
ntr
act
Mil
Th
ou
Ow
nE
mp
loye
es
Co
nst
ruct
ion
of
New
Fac
ility
Acq
uis
itio
n o
f E
xist
ing
Fac
ility
(4)
Mil
Th
ou
Mil
Th
ou
(6)
(5)
Co
ntr
act
Ow
nE
mp
loye
es
ITE
M 7
En
ter
ind
ust
ry c
ateg
ory
fro
m In
du
stry
C
ateg
ory
Co
de
colu
mn
of
Item
6:
CA
PIT
AL
EX
PE
ND
ITU
RE
S B
Y T
YP
E O
F S
TR
UC
TU
RE
(0)
Mil
Th
ou
Cap
ital
Exp
end
itu
res
for
Str
uct
ure
s(A
dd
co
lum
ns
1+2+
3+4+
5+6+
7)(E
nte
rS
tru
ctu
reC
od
efr
om
Lis
t)
Str
uct
ure
Co
de
Co
lum
nT
ota
ls
(3)
(7)
Use
d
Rem
od
elin
g, R
eno
vati
on
,M
od
ern
izat
ion
of
Exi
stin
g F
acili
tyO
ther
Mil
Th
ou
Ro
w
71 71 71 71 71 71 71 79
Mil
Th
ou
Mil
Th
ou
(2)
New
Mil
Th
ou
(1)
Co
ntr
act
Mil
Th
ou
Ow
nE
mp
loye
es
Co
nst
ruct
ion
of
New
Fac
ility
Acq
uis
itio
n o
f E
xist
ing
Fac
ility
(4)
Mil
Th
ou
Mil
Th
ou
(6)
(5)
Co
ntr
act
Ow
nE
mp
loye
es(0
)
Mil
Th
ou
Cap
ital
Exp
end
itu
res
for
Str
uct
ure
s(A
dd
co
lum
ns
1+2+
3+4+
5+6+
7)(E
nte
rS
tru
ctu
reC
od
efr
om
Lis
t)
Str
uct
ure
Co
de
Co
lum
nT
ota
ls
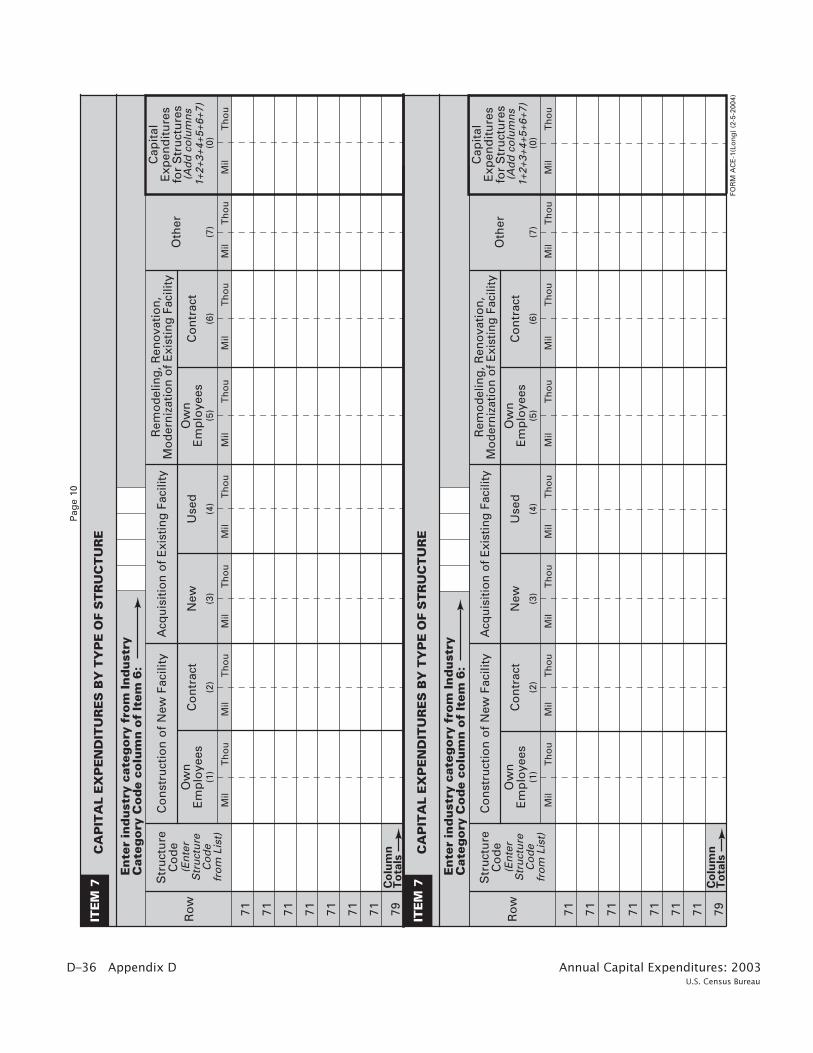
D–36 Appendix D Annual Capital Expenditures: 2003 U.S. Census Bureau
Pag
e 10
ITE
M 7
FOR
M A
CE
-1(L
on
g)
(2-5
-200
4)
(3)
(7)
Use
d
Rem
od
elin
g, R
eno
vati
on
,M
od
ern
izat
ion
of
Exi
stin
g F
acili
tyO
ther
Mil
Th
ou
En
ter
ind
ust
ry c
ateg
ory
fro
m In
du
stry
C
ateg
ory
Co
de
colu
mn
of
Item
6:
Ro
w
71 71 71 71 71 71 71 79
Mil
Th
ou
Mil
Th
ou
CA
PIT
AL
EX
PE
ND
ITU
RE
S B
Y T
YP
E O
F S
TR
UC
TU
RE
(2)
New
Mil
Th
ou
(1)
Co
ntr
act
Mil
Th
ou
Ow
nE
mp
loye
es
Co
nst
ruct
ion
of
New
Fac
ility
Acq
uis
itio
n o
f E
xist
ing
Fac
ility
(4)
Mil
Th
ou
Mil
Th
ou
(6)
(5)
Co
ntr
act
Ow
nE
mp
loye
es
ITE
M 7
En
ter
ind
ust
ry c
ateg
ory
fro
m In
du
stry
C
ateg
ory
Co
de
colu
mn
of
Item
6:
CA
PIT
AL
EX
PE
ND
ITU
RE
S B
Y T
YP
E O
F S
TR
UC
TU
RE
(0)
Mil
Th
ou
Cap
ital
Exp
end
itu
res
for
Str
uct
ure
s(A
dd
co
lum
ns
1+2+
3+4+
5+6+
7)(E
nte
rS
tru
ctu
reC
od
efr
om
Lis
t)
Str
uct
ure
Co
de
Co
lum
nT
ota
ls
(3)
(7)
Use
d
Rem
od
elin
g, R
eno
vati
on
,M
od
ern
izat
ion
of
Exi
stin
g F
acili
tyO
ther
Mil
Th
ou
Ro
w
71 71 71 71 71 71 71 79
Mil
Th
ou
Mil
Th
ou
(2)
New
Mil
Th
ou
(1)
Co
ntr
act
Mil
Th
ou
Ow
nE
mp
loye
es
Co
nst
ruct
ion
of
New
Fac
ility
Acq
uis
itio
n o
f E
xist
ing
Fac
ility
(4)
Mil
Th
ou
Mil
Th
ou
(6)
(5)
Co
ntr
act
Ow
nE
mp
loye
es(0
)
Mil
Th
ou
Cap
ital
Exp
end
itu
res
for
Str
uct
ure
s(A
dd
co
lum
ns
1+2+
3+4+
5+6+
7)(E
nte
rS
tru
ctu
reC
od
efr
om
Lis
t)
Str
uct
ure
Co
de
Co
lum
nT
ota
ls

Appendix D D–37Annual Capital Expenditures: 2003U.S. Census Bureau
Pag
e 11
ITE
M 7
FOR
M A
CE
-1(L
on
g)
(2-5
-200
4)
(3)
(7)
Use
d
Rem
od
elin
g, R
eno
vati
on
,M
od
ern
izat
ion
of
Exi
stin
g F
acili
tyO
ther
Mil
Th
ou
En
ter
ind
ust
ry c
ateg
ory
fro
m In
du
stry
C
ateg
ory
Co
de
colu
mn
of
Item
6:
Ro
w
71 71 71 71 71 71 71 79
Mil
Th
ou
Mil
Th
ou
CA
PIT
AL
EX
PE
ND
ITU
RE
S B
Y T
YP
E O
F S
TR
UC
TU
RE
(2)
New
Mil
Th
ou
(1)
Co
ntr
act
Mil
Th
ou
Ow
nE
mp
loye
es
Co
nst
ruct
ion
of
New
Fac
ility
Acq
uis
itio
n o
f E
xist
ing
Fac
ility
(4)
Mil
Th
ou
Mil
Th
ou
(6)
(5)
Co
ntr
act
Ow
nE
mp
loye
es
ITE
M 7
En
ter
ind
ust
ry c
ateg
ory
fro
m In
du
stry
C
ateg
ory
Co
de
colu
mn
of
Item
6:
CA
PIT
AL
EX
PE
ND
ITU
RE
S B
Y T
YP
E O
F S
TR
UC
TU
RE
(0)
Mil
Th
ou
Cap
ital
Exp
end
itu
res
for
Str
uct
ure
s(A
dd
co
lum
ns
1+2+
3+4+
5+6+
7)(E
nte
rS
tru
ctu
reC
od
efr
om
Lis
t)
Str
uct
ure
Co
de
Co
lum
nT
ota
ls
(3)
(7)
Use
d
Rem
od
elin
g, R
eno
vati
on
,M
od
ern
izat
ion
of
Exi
stin
g F
acili
tyO
ther
Mil
Th
ou
Ro
w
71 71 71 71 71 71 71 79
Mil
Th
ou
Mil
Th
ou
(2)
New
Mil
Th
ou
(1)
Co
ntr
act
Mil
Th
ou
Ow
nE
mp
loye
es
Co
nst
ruct
ion
of
New
Fac
ility
Acq
uis
itio
n o
f E
xist
ing
Fac
ility
(4)
Mil
Th
ou
Mil
Th
ou
(6)
(5)
Co
ntr
act
Ow
nE
mp
loye
es(0
)
Mil
Th
ou
Cap
ital
Exp
end
itu
res
for
Str
uct
ure
s(A
dd
co
lum
ns
1+2+
3+4+
5+6+
7)(E
nte
rS
tru
ctu
reC
od
efr
om
Lis
t)
Str
uct
ure
Co
de
Co
lum
nT
ota
ls

D–38 Appendix D Annual Capital Expenditures: 2003 U.S. Census Bureau
Pag
e 12
ITE
M 8Co
mp
lete
a s
epar
ate
Item
8 f
or
each
ind
ust
ry li
sted
in It
em 6
wit
h e
xpen
dit
ure
s fo
r eq
uip
men
t.
FOR
M A
CE
-1(L
on
g)
(2-5
-200
4)
(En
ter
Eq
uip
men
tC
od
e Fr
om
Li
st)
(1)
(3)
Oth
er
Mil
En
ter
ind
ust
ry c
ateg
ory
fro
m In
du
stry
C
ateg
ory
Co
de
colu
mn
of
Item
6:
Ro
w
81 81 81 81 81 81 81 89C
olu
mn
To
tals
Mil
Mil
Th
ou
CA
PIT
AL
EX
PE
ND
ITU
RE
S B
Y T
YP
E O
F E
QU
IPM
EN
T
(0)
New
Eq
uip
men
t
Th
ou
Cap
ital
Exp
end
itu
res
For
Eq
uip
men
t
Th
ou
Th
ou
(2)
Use
d E
qu
ipm
ent
ITE
M 8
–C
AP
ITA
LE
XP
EN
DIT
UR
ES
BY
TY
PE
OF
EQ
UIP
ME
NT
DE
FIN
ITIO
NS
AN
D G
EN
ER
AL
INS
TR
UC
TIO
NS
If y
ou
had
exp
end
itu
res
for
equ
ipm
ent
in m
ore
th
an 7
ind
ust
ries
, ph
oto
cop
y It
em 8
fo
r ad
dit
ion
al s
pac
e. If
yo
u n
eed
ad
dit
ion
al li
nes
to r
epo
rt t
ypes
of
equ
ipm
ent
for
an in
du
stry
, co
nti
nu
e to
th
e n
ext
Item
8 e
nte
rin
g t
he
sam
e in
du
stry
co
de.
Use
th
e th
ree-
dig
it e
qu
ipm
ent
cod
e fr
om
Sec
tio
n III
on
pag
e 1
4 o
f th
e In
stru
ctio
ns,
Def
init
ion
s, a
nd
Co
des
Lis
ts m
anu
alto
rep
ort
th
e ty
pe
of
equ
ipm
ent
that
yo
ur
com
pan
y ac
qu
ired
.
Eq
uip
men
tC
od
e
Mil
(Ad
d c
olu
mn
s 1+
2+3)
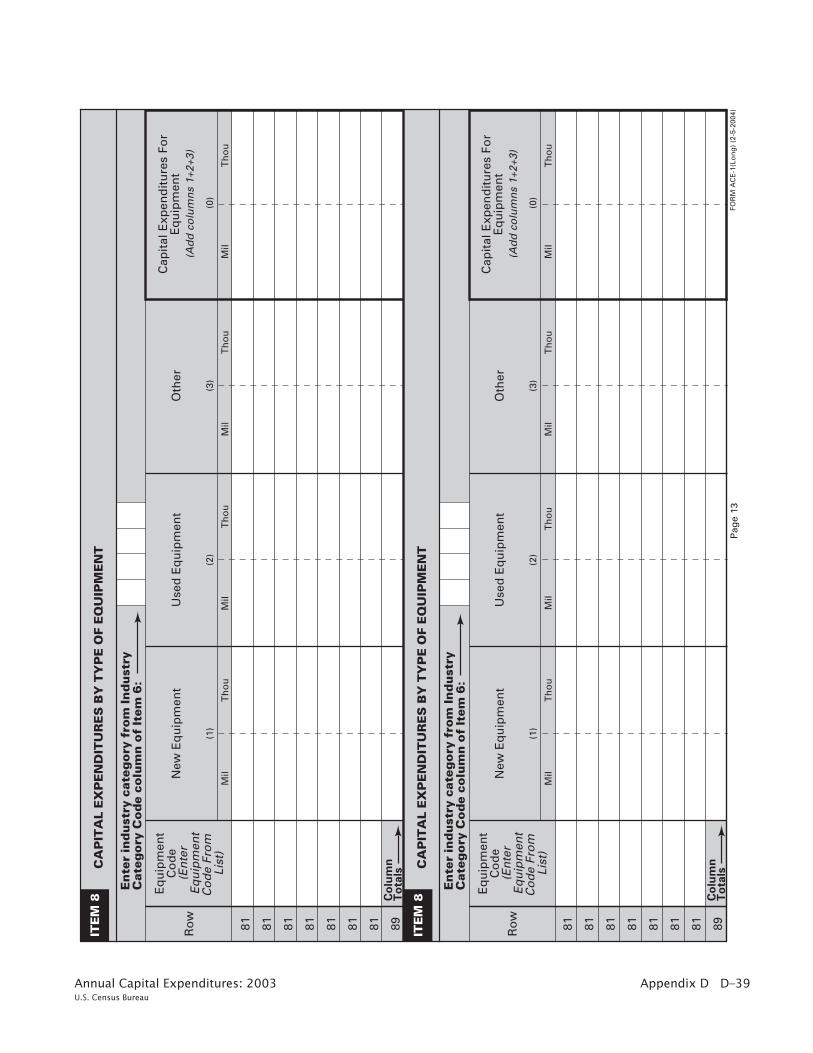
Appendix D D–39Annual Capital Expenditures: 2003U.S. Census Bureau
(En
ter
Eq
uip
men
tC
od
e Fr
om
Li
st)
(1)
(3)
Oth
er
Mil
Mil
Mil
Th
ou
(0)
New
Eq
uip
men
t
Th
ou
Cap
ital
Exp
end
itu
res
For
Eq
uip
men
t
Th
ou
Th
ou
(2)
Use
d E
qu
ipm
ent
Eq
uip
men
tC
od
e
Mil
(Ad
d c
olu
mn
s 1+
2+3)
Pag
e 13
ITE
M 8
FOR
M A
CE
-1(L
on
g)
(2-5
-200
4)
En
ter
ind
ust
ry c
ateg
ory
fro
m In
du
stry
C
ateg
ory
Co
de
colu
mn
of
Item
6:
Ro
w
81 81 81 81 81 81 81 89
CA
PIT
AL
EX
PE
ND
ITU
RE
S B
Y T
YP
E O
F E
QU
IPM
EN
T
ITE
M 8
En
ter
ind
ust
ry c
ateg
ory
fro
m In
du
stry
C
ateg
ory
Co
de
colu
mn
of
Item
6:
Ro
w
CA
PIT
AL
EX
PE
ND
ITU
RE
S B
Y T
YP
E O
F E
QU
IPM
EN
T
(En
ter
Eq
uip
men
tC
od
e Fr
om
Li
st)
(1)
(3)
Oth
er
Mil
Mil
Mil
Th
ou
(0)
New
Eq
uip
men
t
Th
ou
Cap
ital
Exp
end
itu
res
For
Eq
uip
men
t
Th
ou
Th
ou
(2)
Use
d E
qu
ipm
ent
Eq
uip
men
tC
od
e
Mil
(Ad
d c
olu
mn
s 1+
2+3)
81 81 81 81 81 81 81 89C
olu
mn
To
tals
Co
lum
nT
ota
ls

D–40 Appendix D Annual Capital Expenditures: 2003 U.S. Census Bureau
(En
ter
Eq
uip
men
tC
od
e Fr
om
Li
st)
(1)
(3)
Oth
er
Mil
Mil
Mil
Th
ou
(0)
New
Eq
uip
men
t
Th
ou
Cap
ital
Exp
end
itu
res
For
Eq
uip
men
t
Th
ou
Th
ou
(2)
Use
d E
qu
ipm
ent
Eq
uip
men
tC
od
e
Mil
(Ad
d c
olu
mn
s 1+
2+3)
Pag
e 14
ITE
M 8
FOR
M A
CE
-1(L
on
g)
(2-5
-200
4)
En
ter
ind
ust
ry c
ateg
ory
fro
m In
du
stry
C
ateg
ory
Co
de
colu
mn
of
Item
6:
Ro
w
81 81 81 81 81 81 81 89
CA
PIT
AL
EX
PE
ND
ITU
RE
S B
Y T
YP
E O
F E
QU
IPM
EN
T
ITE
M 8
En
ter
ind
ust
ry c
ateg
ory
fro
m In
du
stry
C
ateg
ory
Co
de
colu
mn
of
Item
6:
Ro
w
CA
PIT
AL
EX
PE
ND
ITU
RE
S B
Y T
YP
E O
F E
QU
IPM
EN
T
(En
ter
Eq
uip
men
tC
od
e Fr
om
Li
st)
(1)
(3)
Oth
er
Mil
Mil
Mil
Th
ou
(0)
New
Eq
uip
men
t
Th
ou
Cap
ital
Exp
end
itu
res
For
Eq
uip
men
t
Th
ou
Th
ou
(2)
Use
d E
qu
ipm
ent
Eq
uip
men
tC
od
e
Mil
(Ad
d c
olu
mn
s 1+
2+3)
81 81 81 81 81 81 81 89C
olu
mn
To
tals
Co
lum
nT
ota
ls

Appendix D D–41Annual Capital Expenditures: 2003U.S. Census Bureau
(En
ter
Eq
uip
men
tC
od
e Fr
om
Li
st)
(1)
(3)
Oth
er
Mil
Mil
Mil
Th
ou
(0)
New
Eq
uip
men
t
Th
ou
Cap
ital
Exp
end
itu
res
For
Eq
uip
men
t
Th
ou
Th
ou
(2)
Use
d E
qu
ipm
ent
Eq
uip
men
tC
od
e
Mil
(Ad
d c
olu
mn
s 1+
2+3)
Pag
e 15
ITE
M 8
FOR
M A
CE
-1(L
on
g)
(2-5
-200
4)
En
ter
ind
ust
ry c
ateg
ory
fro
m In
du
stry
C
ateg
ory
Co
de
colu
mn
of
Item
6:
Ro
w
81 81 81 81 81 81 81 89
CA
PIT
AL
EX
PE
ND
ITU
RE
S B
Y T
YP
E O
F E
QU
IPM
EN
T
ITE
M 8
En
ter
ind
ust
ry c
ateg
ory
fro
m In
du
stry
C
ateg
ory
Co
de
colu
mn
of
Item
6:
Ro
w
CA
PIT
AL
EX
PE
ND
ITU
RE
S B
Y T
YP
E O
F E
QU
IPM
EN
T
(En
ter
Eq
uip
men
tC
od
e Fr
om
Li
st)
(1)
(3)
Oth
er
Mil
Mil
Mil
Th
ou
(0)
New
Eq
uip
men
t
Th
ou
Cap
ital
Exp
end
itu
res
For
Eq
uip
men
t
Th
ou
Th
ou
(2)
Use
d E
qu
ipm
ent
Eq
uip
men
tC
od
e
Mil
(Ad
d c
olu
mn
s 1+
2+3)
81 81 81 81 81 81 81 89C
olu
mn
To
tals
Co
lum
nT
ota
ls

D–42 Appendix D Annual Capital Expenditures: 2003 U.S. Census Bureau
RE
MA
RK
S
CE
RT
IFIC
AT
ION
– T
his
rep
ort
is s
ub
stan
tial
ly a
ccu
rate
an
d h
as b
een
pre
par
ed in
acc
ord
ance
wit
h in
stru
ctio
ns.
Nam
e o
f p
erso
n t
o c
on
tact
reg
ard
ing
th
is r
epo
rt
(Ple
ase
pri
nt
or
typ
e)
Sig
nat
ure
of
auth
ori
zed
off
icia
l
FAX
nu
mb
er
Are
a co
de
Nu
mb
er
Dat
e
()
–
Ple
ase
be
sure
to
co
rrec
t an
y n
ame,
ad
dre
ss, a
nd
ZIP
Co
de
erro
rs o
n t
he
imp
rin
ted
ad
dre
ss o
n p
age
1 o
f th
is f
orm
bo
okl
et.
PLE
AS
E R
ET
UR
N Y
OU
R
CO
MP
LET
ED
FO
RM
TO
U.S
. C
en
su
s B
ure
au
1
20
1 E
ast
10
th S
tre
et
Je
ffe
rso
nv
ille
, IN
47
13
2-0
00
1
Tel
eph
on
e n
um
ber
Are
a co
de
Nu
mb
er
()
–
Pag
e 16
RE
PO
RT
ING
PE
RIO
D C
OV
ER
ED
OW
NE
RS
HIP
INFO
RM
AT
ION
a. D
o t
he
rep
ort
ed d
ata
cove
r th
e ca
len
dar
yea
r 2
00
3?
a. W
as t
his
co
mp
any
in o
per
atio
n o
n D
ecem
ber
31
, 2
00
3?
961
YE
SN
O –
Giv
e d
ate
op
erat
ion
s ce
ased
2
951
YE
SN
O –
Sp
ecif
y p
erio
d c
ove
red
2
b. D
id t
he
ow
ner
ship
of
this
co
mp
any
chan
ge
du
rin
g t
he
year
en
din
g D
ecem
ber
31
, 2
00
3?
971
YE
SN
O2
c.N
ame
of
new
op
erat
or/
com
pan
y
Sp
ecif
y d
ate
of
chan
ge
AN
D f
ill in
c. b
elo
w
Mo
nth
Day
Yea
r
Mo
nth
Day
Yea
r
34
Mo
nth
Day
Yea
rM
on
thD
ayY
ear
TO
FRO
M
3 3
Nu
mb
er a
nd
str
eet
add
ress
Cit
yS
tate
ZIP
Co
de
TH
AN
K Y
OU
FO
R Y
OU
R C
OO
PE
RA
TIO
N A
ND
AS
SIS
TA
NC
E IN
TH
IS S
UR
VE
Y.
FAX
th
e fo
rm t
o 1
–80
0–4
38
–80
40
OR
Ple
ase
exp
lain
an
y la
rge
or
un
usu
al c
han
ges
to
yo
ur
com
pan
y’s
rep
ort
ed d
om
esti
c ca
pit
al e
xpen
dit
ure
s.
Ext
.
E-m
ail a
dd
ress
Co
nta
ct n
ame
at n
ew c
om
pan
y
Co
nta
ct t
elep
ho
ne
nu
mb
er (
Incl
ud
e A
rea
Co
de)
FOR
M A
CE
-1(L
on
g)
(2-5
-200
4)
(2-23-2004)ACE-1(I) U.S. DEPARTMENT OF COMMERCE
Economics and Statistics Administration
2003 ANNUAL CAPITAL EXPENDITURES SURVEYINSTRUCTIONS, DEFINITIONS, AND CODES LIST
INTRODUCTIONThis manual provides instructions, definitions, andcodes to assist you in completing your AnnualCapital Expenditures Survey (ACES) report form.Section I provides general instructions, definitions,and item specific instructions for reporting in theACE survey. Section II contains the INDUSTRYCATEGORY CODES LIST for the appropriate industrycodes used in this survey. Section III contains theACES STRUCTURE CODES LIST and the ACESEQUIPMENT CODES LIST.
BURDEN HOUR ESTIMATEPublic reporting burden for this collection ofinformation is estimated to range from 2 to 28 hours,averaging 4 hours per response, including time forreviewing instructions, searching existing datasources, gathering and maintaining the data needed,and completing and reviewing the collection ofinformation. Send comments regarding this burdenestimate or any other aspect of this collection ofinformation, including suggestions for reducing thisburden, to: Paperwork Project 0607-0782, U.S. CensusBureau, 4700 Silver Hill Road, Stop 1500, Washington,DC 20233-1500. You may e-mail comments [email protected]; use "Paperwork Project0607-0782" as the subject.
PURPOSE OF THE SURVEYThe purpose of this survey is to collectcomprehensive and timely information about thenature and level of capital expenditures in the UnitedStates. The level of capital expenditures is animportant component in the overall assessment ofour Nation’s productivity. The information youprovide will be used to prepare national measures ofcapital spending and to formulate fiscal andmonetary policy.
SECTION I
PART A – GENERAL INSTRUCTIONS
Survey Scope – This survey collects capitalexpenditures data for nonfarm companies,organizations, and associations operating within theUnited States. Information for agricultural productionoperations should be excluded. However, companiesperforming agricultural services are included.Information for churches, nonprofitorganizations, and organizations that aregovernment owned but privately operatedshould be included.
Reporting Entity – Report capital expenditures forall domestic operations of your enterprise, includingsubsidiaries and divisions. For this report, the termsenterprise and company are used interchangeably.An enterprise is a business, service, or membershiporganization consisting of one or moreestablishments under common ownership or control.It includes all establishments of subsidiary
Survey Period – Report data for the calendar year2003. If calendar year book figures are not availableexcept at considerable cost, reasonable estimatesare acceptable. If you cannot provide reasonableestimates on a calendar basis, fiscal year data will beaccepted. Indicate on page 16 of the ACE-1(Long)and ACE-1(M) forms, or page 9 of the ACE-1(S) formthe exact dates the data represent if they are not forthe calendar year.
If fiscal data are used and your fiscal period ends inJanuary, February, or March, report for the fiscalyear ending in 2004. Otherwise, report for the fiscalyear ending in 2003.
Estimates Are Acceptable – The data requestedon this report form may not correspond to yourcompany’s accounting records. If you cannot answera question from your company records, pleaseprovide carefully prepared estimates. If yourcompany did not have any capital expenditures forthe 2003 reporting period, enter "0" in theappropriate cell(s).
Mergers and Acquisitions – Such events occurringduring the period covered by this report requirespecial attention.
(a) If your enterprise merged with or acquired anotherdomestic enterprise during the period, include thedomestic capital expenditures made by the mergedor acquired enterprise since the date of acquisition;the cost to your enterprise for structures andequipment previously owned by the acquiredenterprise at the time of the merger or acquisitionshould be reported as expenditures, only if treatedas capital expenditures by your enterprise. Pleasefurnish the date of the acquisition or merger andthe name of the acquired enterprise in the"Remarks" section.
(b) If your enterprise was acquired by anotherenterprise during the period covered by this report,please furnish the acquisition date and the nameand address of the acquiring enterprise in the"Ownership Information" section, and complete theform for the period of time the enterprise was inoperation prior to the acquisition.
companies, where there is more than 50 percentownership, as well as establishments of firms whichthe enterprise has the power to direct or cause thedirection of management and policies. Holdingcompanies should report for the entirecorporation, including all subsidiaries undertheir ownership. If you are unable to consolidaterecords for the entire company or have any reportingquestions, please call 1–800–528–3049. This reportform will be used by companies having activity inone or more industries; therefore, not all items willapply to all companies. For purposes of this survey,exclude data for Puerto Rico, the Virgin Islands, andU.S. Territories.
U.S. CENSUS BUREAU
U S C E N S U S B U R E A UAnnual Capital Expenditures: 2003U.S. Census Bureau
Appendix D D–43

PART B – DEFINITIONS
1. CAPITAL EXPENDITURES:Capital expenditures include all expenditures duringthe year for both new and used structures andequipment chargeable to asset accounts for whichdepreciation or amortization accounts are ordinarilymaintained.
Include:
• all capital costs such as feasibility studies,architectural, legal, installation, and engineering fees,as well as work done by the company’s work force;
• gross additions during the year toconstruction-in-progress accounts for projectslasting longer than one year (allocate theadditions between structures and equipment inItem 2), even if the asset was not in use andnot yet depreciated;
• estimated cost or present value of assets acquiredunder capital leases entered into during the surveyyear (reported by the lessee). Capital leasespresume a sale and purchase of an asset, and aredefined by the criteria in the Statement ofFinancial Accounting Standards Board (FASB)Number 13;
• all capitalized leasehold improvements made toassets leased from others. In Item 2, allocateleasehold improvements between structures andequipment based on what is being improved;
• capitalized interest charges on loans financingcapital projects if consistent with the Statementof Financial Accounting Standards Board(FASB) Number 34;
• expenditures for structures and equipment(whether acquired on contract or directly by yourenterprise), including items purchased abroad, forinstallation or use within the United States;
• expenditures for major alterations, capitalizedrepairs, and improvements;
• expenditures for structures or equipment that are,or will be, leased or rented to others;
• expenditures made by your firm for structureswhich, upon completion, were or are to be soldand leased back to your company;
• expenditures for both developmental andexploratory drilling activities includingintangible drilling costs;
• expenditures for land development andimprovement, including demolition of buildings,land servicing, and site preparation;
• cost of construction work performed by your ownemployees (force-account construction work);
• expenditures that are made jointly for bothbusiness and personal use, include only thatportion allocated to business use.
ACE-1(I) (2-23-2004) Page 2
Exclude:• the cost of maintenance, repairs, and supplies
charged as current operating expenses;
• capital expenditures for structures and equipmentby foreign operations;
• reductions for retirements, write-downs, sales,subsidies, or other dispositions of existing assets;
• the value of structures built and other workperformed by your enterprise on contract toothers;
Filing Extensions – If you cannot complete thesurvey by the due date shown on page 1 of the reportform, you may request an extension of time by writingto the address below (include your 11 digit ID):
U.S. Census Bureau 1201 East 10th Street Jeffersonville, IN 47132-0001
or call:1–800–528–3049.
Direct any QUESTIONS regarding this report formto the U.S. Census Bureau, ATTN: BusinessInvestment Branch, Company StatisticsDivision, Washington, DC 20233-6400 or call1–800–528–3049.
Additional Forms – Photocopies of this form areacceptable. If you require additional forms, call1–800–528–3049 or write to the U.S. CensusBureau, ACES Processing, 1201 East 10thStreet, Jeffersonville, IN 47132-0001. Pleaseinclude your 11 digit Census ID Number located onthe first line of the mailing address.
Alternate Reporting Formats – For informationconcerning the use of reporting formats other thanthe report form provided, call 1–800–528–3049.
Filing the Report Form – Return your completedreport form in the pre-addressed envelope. If you arenot using the pre-addressed envelope, return yourreport form to the U.S. Census Bureau, 1201 East10th Street, Jeffersonville, IN 47132-0001 orfax to 1–800–438–8040. Make a copy of thecompleted report form for your company records.
• capitalized cost of assets produced or purchased,then leased as the lessor under operating leases;
Legal Authority and Confidentiality of Data –Your response is required by law. Title 13, UnitedStates Code, requires businesses and otherorganizations that receive this questionnaire toanswer the questions and return the report to the U.S.Census Bureau. By the same law, YOUR REPORT ISCONFIDENTIAL. It may be seen only by personssworn to uphold the confidentiality of Census Bureauinformation and may be used only for statisticalpurposes. Further, copies retained in respondents’files are immune from legal process.
• values of assets expended as permitted undersection 179 of the U.S. Internal Revenue code;
• capitalized computer software; • expenditures for goodwill, patents, orcopyrights;
• expenditures for geological and geophysical workby oil companies and similarly off-site mining orgeneral exploration which are not capitalized;
• payments to others for structures and equipmentacquired under operating leases or rented;
D–44 Appendix D Annual Capital Expenditures: 2003 U.S. Census Bureau

Page 3
• drilling gas wells, including construction ofoffshore drilling platforms; digging and shoringmines, including constructing buildings at minesites, and expenditures for constructing mineshafts and mining exploration;
• land improvements; exploration and developmentof mineral properties.
Exclude:• land acquisition;
• normal maintenance and repairs to existingstructures or service facilities such as painting,roofing repairs, and street and highway patching.
3. EQUIPMENT:Include machinery, furniture and fixtures,computer software, computers, and motorvehicles used in the production and distribution ofgoods and services or in office functions.
Expenditures for machinery and equipment whichare housed in structures and can be removed orreplaced without significantly altering the structureare considered equipment, not expenditures forstructures.
Include:• capitalized office equipment and machines;
computers, furniture and fixtures for offices;cafeteria and warehouse equipment;
• capitalized computer software;
• transportation equipment for highway andoff-highway use such as automobiles, trucks, andtractors;
• corporate helicopters and aircraft;
• production machinery;
• computer assisted machines that possess theability to be programmed for a wide variety offunctions including robots, numerically controlledmachine tool equipment, and individualcomputerized machines.
2. STRUCTURES:Structures include the capitalized cost of buildingsand structures, and all necessary expenditures toacquire, construct, and prepare the structure for itsintended use.
Major additions and alterations to existing structuresand capitalized repairs and improvements tobuildings should also be included.
The cost of any machinery and equipment which isan integral or built-in feature of the structure shouldbe reported as part of that structure (e.g., assemblyline superstructure in an automotive assembly plant).Expenditures for land development andimprovements, including demolition of buildings,land servicing, and site preparation should beincluded.
• site preparation, including the demolition ofbuildings and outside construction of fixedstructures or facilities such as sidewalks, highwaysand streets, parking lots, landscaping, utilityconnections, outdoor lighting, railroad tracks,airfields, piers, wharves and docks, telephoneand telegraph lines, cellular transmissiontowers, radio and television towers, watersupply lines, sewers, water and signal towers,electric power distribution and transmission lines,petroleum and gas pipelines, and similar facilitieswhich are built into or fixed to the land;
• installation of boilers, overhead hoists and cranes,blast furnaces, brick kilns, fractionating towers,overhead traveling cranes, shipways, and similartypes of structures;
• fixed, largely site-fabricated equipment not housedin a building, primarily for petroleum refineriesand chemical plants, but also including storagetanks and refrigeration systems;
• installation of construction materials placed insidea building and used to support productionmachinery; for example, concrete platforms,overhead steel girders, and pipes to carry liquidsfrom storage tanks;
• mechanical and electrical installations such asplumbing, electrical work, elevators, escalators,power plants, heating and cooling systems,sprinkler systems, environmental controls,intercom systems, and other similar buildingservices;
Include:
• expenditures made by your firm or organization(as lessor) for property which is leased to others aspart of capital (full-payout or equity) leasearrangements;
• expenditures made by owners of property rentedor leased to your firm under operating leases.
Exclude – Continued
ITEM 1 – DOMESTIC DEPRECIABLE ASSET DATA
Report the acquisition cost of total domesticdepreciable assets excluding land and depletableassets. The figure should include structures,equipment, and other depreciable assets. Reportvalues in thousands of dollars. Enter zeroeswhere applicable.
Include:Value of land development and improvements (suchas landscaping, paving, and parking lots) andexploration and development of mineral properties.Expenditures for these items should also be reportedas structures in Item 2.
PART C – INSTRUCTIONS BY ITEM
Exclude:Cost of land and depletable assets (such as mineral ortimber rights); current assets (such as inventories,cash, and accounts receivable); assets of foreignoperations; assets leased to others under capital leasearrangements; and patents, copyrights, trademarks,franchises, and goodwill.
ACE-1(I) (2-23-2004)
Annual Capital Expenditures: 2003U.S. Census Bureau
Appendix D D–45
Page 4
ROWS:
10.Gross value (acquisition cost) of depreciableassets at beginning of year:Report the acquisition cost of depreciable assets(excluding land) at the beginning of the year.
11.Total capital expenditures:Report capital expenditures for depreciable assets(excluding land) during the year. (See Part B –DEFINITIONS on page 2 of this booklet.)
12.Other additions and acquisitions:Report other depreciable assets acquired throughadditions, acquisitions, and mergers during the yearat fair market value, if these are not consideredcapital expenditures. Please explain such additionsin the "Remarks" section on page 16 of theACE-1(Long) and ACE-1(M) forms, or page 9 of theACE-1(S) form.
13.Gross value of retirements and dispositions:Report the acquisition cost of depreciable assets(excluding land) sold, retired, scrapped, or destroyedduring the year. Include assets considered soldunder capital lease arrangements which, prior to thelease, were subject to depreciation by the lessor.
14.Gross value (acquisition cost) of depreciableassets at end of year:Report the acquisition cost of depreciable assets(excluding land) at the end of the year. The entry inRow 14 should equal beginning of year assets (Row10) + capital expenditures (Row 11) + other additions (Row 12) – retirements (Row 13). Please explain anydiscrepancies or imbalances in the "Remarks" section.
15.Accumulated depreciation and amortizationat end of year:
ITEM 2 – DOMESTIC CAPITAL EXPENDITURESDATACOLUMNS:
4. Total:Report the value of total capital expenditures fordepreciable assets (excluding land) in Column (4). Thefigure in Column (4) should include structures,equipment, and other depreciable assets. The value inItem 2, Row 22, Column (4) should be the same asItem 1A, Row 11. Report values in thousands ofdollars. Enter zeroes where applicable.
Report the value of capital expenditures for structuresin Column (1). The values in Column (1) should beincluded in Column (4).
2. Equipment:Report the value of capital expenditures forequipment in Column (2). The values in Column (2)should be included in Column (4).
3. Other:Report the value of depreciable and amortizableassets that you are unable to categorize as structuresor equipment in Column (3). The values in Column (3)should be included in Column (4).Include expenditures for construction-in-progress,leasehold improvements, and capitalized interest thatyou are unable to categorize as structures andequipment. Report land improvements as structures.Report furniture and fixtures, capitalized computersoftware, computers, and automobiles as equipment.This column excludes the cost of land anddepletable assets.
Report year-end accumulated depreciation andamortization charges for depreciable assets excludingland. Include charges against depreciable assetsacquired during the year.
1. Structures:
ITEM 1 – DOMESTIC DEPRECIABLE ASSETDATA – Continued
PART C – INSTRUCTIONS BY ITEM – Continued
16.Gross domestic sales, operating receipts,and revenue:Report sales, operating receipts, and revenue at theend of the year for goods produced, distributed, orservices provided. Include revenue from investments,rents, and royalties only if it is the principal businessactivity of the company. For example: finance,insurance, and real estate companies. (Report inthousands of dollars)
Include all operating receipts from taxable operations,as well as total revenue from tax-exempt activities(contributions, gifts, grants, etc.). Report revenues fromcustomers outside the company including sales ofproducts and services to other companies, individuals,U.S. Government agencies, and foreign customers.Include tranfers to foreign subsidiaries.
Exclude domestic intra-enterprise transfers, sales byforeign subsidiaries, freight charges and excise taxes.
17–19. Industries with the highest domesticsales, operating receipts, and revenue: (Notapplicable to form ACE-1(S))
Enter the industry category code(s) in which yourcompany operated. If the company is involved in morethan three industry activities, report those industrieswith the highest sales. See the "Industry CategoryCodes List" (page 7) for the appropriate 4-digit industrycode(s). Central Administrative Office Activity Code9900 should not be used in this item. (Report inthousands of dollars)
ROWS:
22. Total capital expenditures:Report capital expenditures for depreciable assetsduring the year by column category.
20. New capital expenditures:Report capital expenditures for new buildings andother structures, structures that have beenpreviously owned but not used or occupied, newmachinery and equipment, and other newdepreciable assets. Remodeling, renovation, ormodernization of existing facility should be reportedas new structures.
21. Used capital expenditures:Report capital expenditures for buildings and otherstructures which have been previously owned andoccupied, machinery and secondhand equipment,and other used depreciable assets.
ACE-1(I) (2-23-2004)
D–46 Appendix D Annual Capital Expenditures: 2003 U.S. Census Bureau

Page 5
ITEM 5 – CAPITALIZED COMPUTER SOFTWARE
Report capital expenditures for computer softwaredeveloped or obtained for internal use during theyear. Capitalized computer software expendituresshould consist of costs of materials and servicesdirectly related to the development or acquisition ofsoftware; payroll and payroll-related costs foremployees directly associated with softwaredevelopment; and interest costs incurred whiledeveloping the software.
ITEM 6 – CAPITAL EXPENDITURES BYINDUSTRY (Not applicable to form ACE-1(S))
Complete Item 6 for each industry in which thecompany had operations and made capitalexpenditures in 2003. Review the list of companyactivities printed to the left of the company name andaddress on page 1 of the report form. These are theindustries we expected your company to operate induring 2003. If we expected your operations to includemore industry activities than are printed on page 1, welisted additional activities on a continuation sheet forItem 6. If necessary, add, correct, or delete industrycodes on page 1 (and the continuation sheet ifapplicable) to reflect your company’s operations in2003. Refer to the list of INDUSTRY CATEGORY CODES(beginning on page 7 of this booklet) to update the list.
All companies should complete Item 6. Using thecorrected list of company activities on page 1, reportthe data requested for each industry in which thecompany made capital expenditures in 2003.Complete a separate row for each industry.
ITEM 3 – OTHER CAPITAL EXPENDITURES
Describe depreciable assets included as "Other"capital expenditures in Item 2, Row 22, Column (3)."Other" capital expenditures refer to depreciable andamortizable assets that you were unable tocategorize as structures or equipment.
Do not report land, depletable assets, patents,copyrights, trademarks, franchises, or goodwill as"Other" capital expenditures. Report furniture andfixtures, capitalized computer software, computers,and motor vehicles as equipment. Report additions toconstruction-in-progress, capitalized interest, andleasehold improvements as structures or equipmentwhere applicable.
ITEM 4 – CAPITAL LEASE ARRANGEMENTS
If your company leased new structures and/orequipment and the lease is capitalized by yourcompany, report the cost or present value of thestructures and equipment acquired in the surveyyear. Capital leases presume a sale and purchase ofan asset, and are defined by the criteria in theStatement of Financial Accounting StandardsBoard (FASB) Number 13. This amount should bereported as capital expenditures in Item 1A,Row 11 and Item 2, Row 20.
Exclude periodic payments under capital andoperating leases. Also exclude the cost of capitalizedimprovements your enterprise made to assets leasedfrom others (leasehold improvements) in thisitem. Leasehold improvements should be reportedas capital expenditures in Item 1A, Row 11 andItem 2, Rows 20 and 22.
COLUMNS:1. Prepackaged software:
Capitalized computer software is defined by thecriteria in Statement of Position 98-1, Accountingfor the Costs of Computer Software Developedor Obtained for Internal Use. This amount shouldbe reported as capital expenditures in Item 1A,Row 11 and Item 2, Column(2).
Report the value of capital expenditures forprepackaged computer software in Column (1).Prepackaged software is purchased off-the-shelfthrough retailers or other mass-market outlets forinternal use by the company. Include the cost oflicensing fees and service/maintenance agreements.
2. Vendor-customized software:Report the value of capital expenditures forvendor-customized software in Column (2).Vendor-customized software is EXTERNALLYdeveloped by vendors and customized for yourcompany’s use.
3. Internally-developed software:Report the value of capital expenditures forinternally-developed software in Column (3).Internally-developed software is developed by yourcompany’s employees, for internal use. Includeloaded payroll – (salaries, wages, benefits, andbonuses related to all software developmentactivities).
In the "Industry Category Code" column, enter theindustry code(s) in which your company madecapital expenditures in 2003. List industries whichaccount for the company’s total capital expendituresreported in Item 2, Row 22, Column (4).
Allocate expenditures for assets which serve morethan one industry such as: central, regional, ordivisional administrative functions, payroll andpersonnel, and research and development. If capitalexpenditures for these assets cannot be allocated tospecific industry categories, report the amount ofthese capital expenditures as industry code 9900.
Complete the columns as follows:In Column (0) enter total capital expenditures(excluding land) for each industry category codelisted. Of the capital expenditures reported inColumn (0), report the amount of new structures inColumn (2); used structures in Column (3); newequipment in Column (5); used equipment in Column(6); other new depreciable assets in Column (8); andother used depreciable assets in Column (9). Includethe value of assets acquired through capital leasearrangements in Columns (0) through (9).
ACE-1(I) (2-23-2004)
Annual Capital Expenditures: 2003U.S. Census Bureau
Appendix D D–47
Page 6
ITEM 7 – CAPITAL EXPENDITURES BY TYPE OFSTRUCTURE
Complete a separate Item 7 for each industrycategory listed in Item 6 with expenditures reportedfor structures. If you received the ACE-1(S) (whichexcludes Item 6) complete Item 7 for theexpenditures reported in Item 2, Column 1.
If you had expenditures for structures in more than 7industries, photocopy Item 7 for additional space. Ifyou need additional lines to report types of structuresfor an industry, continue to the next Item 7 enteringthe same industry code.
Complete the columns as follows:
In the "Structure Code" column, enter the code(s)from the list of "Structure Codes" (page 11 of theinstructions) to select the primary function of thestructures built or acquired for the industry.
In Column (0), enter the total capital expenditures foreach "Structure Code" listed in the "Structure Code"column. Combine expenditures for structureshaving the same structure code within eachindustry category code. The total of Column (0)should be included in Item 2, Row 22, Column 1.
ACE-1(I) (2-23-2004)
In Column (1), enter the expenditures for newstructures built by your own employees."Construction of New Facility" refers to newbuildings and other structures not previously owned.
In Column (2), enter the expenditures for newbuildings and other structures that were built on acontract basis. "Construction of New Facility" refersto new buildings and other structures not previouslyowned.
In Column (3), enter the expenditures for theacquisition of any new structures. "Acquisition ofExisting Facility – New" refers to buildings and otherstructures which have been previously owned buthave not been used or occupied.
In Column (4), enter the expenditures for theacquisition of any used structures. "Acquisition ofExisting Facility – Used" refers to buildings and otherstructures which have been previously owned andoccupied.
In Column (5), enter the expenditures forremodeling, renovation, and modernization of anexisting structure performed by your ownemployees. Include additions to existing buildings,(such as a new wing) in Column (1).
In Column (6), enter the expenditures forremodeling, renovation, and modernization of anexisting structure performed on a contract basis.Include additions to existing buildings performed ona contract basis, (such as a new wing) in Column (2).
In Column (7), enter the expenditures not covered inColumns (1)–(6).
ITEM 8 – CAPITAL EXPENDITURES BY TYPE OFEQUIPMENT
Complete a separate Item 8 for each industrycategory listed in Item 6 with expenditures reportedfor equipment. If you received the ACE-1(S) (whichexcludes Item 6) complete Item 8 for theexpenditures reported in Item 2, Column 2.Photocopies may be used if additional pages areneeded.
Complete the columns as follows:
In the "Equipment Code" column, enter the code(s)from the list of "Equipment Codes" (page 14 of theinstructions) for each type of equipment acquiredduring the reporting period.
In Column (1), enter expenditures for newequipment. Include expenditures for equipmentmanufactured in-house (produced in the companyfor use by the company) and expenditures forenhancements to existing equipment.
In Column (2), enter expenditures for usedequipment.
In Column (3), enter expenditures for otherequipment not covered in Columns (1)–(2).
In Column (0), enter the total capital expenditures foreach "Equipment Code" listed in the "EquipmentCode" column. Combine expenditures forequipment having the same equipment codewithin each industry category code. The total ofColumn (0) should be included in Item 2, Row 22,Column 2.
D–48 Appendix D Annual Capital Expenditures: 2003 U.S. Census Bureau

Page 7
SECTION II – ACES INDUSTRY CATEGORY CODES LIST
Use the following industry codes to complete Item 6 as requested on the report form. The North AmericanIndustrial Classification System (NAICS) codes are listed for reference only.
INDUSTRYCODE
NAICSCODE(S)
DESCRIPTION INDUSTRYCODE
DESCRIPTION NAICSCODE(S)
Agriculture, Forestry,Fishing and Hunting
Crop and Animal Production
Manufacturing – Continued
1110 111, 112
ACE-1(I) (2-23-2004)
INSTRUCTIONS
Forestry, Logging, Fishing, Hunting,Trapping, and Agricultural SupportActivities
1130 113, 114,115
Mining
Oil and Gas Extraction2110 2111
Coal Mining2121 2121
Metal Ore Mining2122 2122
Nonmetallic Mineral Mining and Quarrying2123 2123
Support Activities for Oil and GasOperations
2130 213111,213112
Utilities
Electric Power Generation, Transmissionand Distribution
2211 2211
Natural Gas Distribution2212 2212
Water, Sewage, and Other Systems2213 2213
Construction
Building, Developing, and GeneralContracting
2330 233
Heavy Construction2340 234
Special Trade Contractors2350 235
Manufacturing
Food Manufacturing3110 311
Beverage Manufacturing3121 3121
Tobacco Manufacturing3122 3122
Textile Mills and Textile Product Mills3130 313, 314
Apparel Manufacturing3150 315
Leather and Allied Product Manufacturing3160 316
Wood Product Manufacturing3210 321
Paper Manufacturing3220 322
Printing and Related Support Activities3230 323
Petroleum and Coal ProductsManufacturing
3240 324
Basic Chemical, Resin, Synthetic Rubber,and Fiber Manufacturing
3251 3251,3252
Pesticide, Fertilizer, and Other AgriculturalChemical Manufacturing
3253 3253
Pharmaceutical and MedicineManufacturing
3254 3254
Paint, Adhesive, Soap, and OtherChemical Manufacturing
3259 3255,3256,3259
Plastics and Rubber ProductsManufacturing
3260 326
Clay and Glass Products Manufacturing3271 3271,3272
Cement, Concrete, Lime, Gypsum, andOther Nonmetallic Mineral ProductManufacturing
3279 3273,3274,3279
Iron and Steel Mills, FerroalloyManufacturing, and Steel ProductManufacturing from Purchased Steel
3311 3311,3312
Nonferrous Metals Production andProcessing
3313 3313,3314
Ferrous and Nonferrous Foundries3315 3315
Fabricated Metal Product Manufacturing3320 332
Agriculture, Construction, and MiningMachinery Manufacturing
Industrial, Metalworking, and GeneralPurpose Machinery Manufacturing
Commercial, Service Industry,Temperature Control, and Air- FlowControl Machinery Manufacturing
3331
3332
3333
3331
3332,3335,3339
3333,3334,
Support Activities for SolidMineral Operations
2131 213113,213114,213115
Annual Capital Expenditures: 2003U.S. Census Bureau
Appendix D D–49

Page 8
SECTION II – ACES INDUSTRY CATEGORY CODES LIST – Continued
INDUSTRYCODE
NAICSCODE(S)
DESCRIPTION INDUSTRYCODE
DESCRIPTION NAICSCODE(S)
Manufacturing – Continued
Computer and Peripheral EquipmentManufacturing
Wholesale Trade, Durable Goods
Clothing and Clothing Accessories Stores
Transportation and Warehousing
Rail Transportation
Water Transportation
Truck Transportation
Pipeline Transportation of Crude Oil,Refined Petroleum, and MiscellaneousProducts, except Natural Gas
Pipeline Transportation of Natural Gas
Warehousing and Storage
Information
Motion Picture and Sound RecordingIndustries
Wireless Telecommunications Carriers(except Satellite)
Telecommunications Resellers, Satellite,and Other Telecommunications
Information Services
Communications, Audio, and VideoEquipment Manufacturing
Semiconductor and Other ElectronicComponent Manufacturing
Navigational, Measuring, Electromedical,and Control Instruments Manufacturing
Manufacturing and Reproducing Magneticand Optical Media
Electrical Equipment, Appliance andComponent Manufacturing
Motor Vehicle, Body, Trailer, and PartsManufacturing
Aerospace Product and PartsManufacturing
Other Transportation EquipmentManufacturing
Furniture and Related ProductManufacturing
Medical Equipment and SuppliesManufacturing
Other Miscellaneous Manufacturing
Wholesale Trade
Wholesale Trade, Nondurable Goods
Motor Vehicle and Parts Dealers
Electronics and Appliance Stores
Food and Beverage Stores
General Merchandise Stores
Nonstore Retailers
Other Retail Trade Stores, including Gasoline Stations
Retail Trade
Air Transportation
Transit and Ground PassengerTransportation
Scenic and Sightseeing Transportation
Support Activities for Transportation
Couriers and Messengers
Newspaper, Periodical, Book, andDatabase Publishers
Software Publishers
Radio and Television Broadcasting
Cable Networks and Program Distribution
Wired Telecommunications Carriers
Data Processing Services
Finance and Insurance
Monetary Authorities-Central Bank
Depository Credit Intermediation
Engine, Turbine, and Power TransmissionEquipment Manufacturing
3336 3336
3341 3341
3342 3342,3343
3344 3344
3345 3345
3346 3346
3350 335
3361 3361,3362,3363
3364 3364
3369 3365,3366,3369
3370 337
3391 3391
3399 3399
4210 421
4220 422
4410 441
4430 443
4450 445
4480 448
4520 452
4540 454
4599 442, 444,446, 447,451, 453
4810 481
4820 482
4830 483
4840 484
4850 485
4861 4861,4869
4862 4862
4870 487
4880 488
4920 492
4930 493
5111 5111
5112 5112
5120 512
5131 5131
5132 5132
5133 51331
5134 51332
5135 51333,51334,51339
5141 5141
5142 5142
5210
52215221
521
ACE-1(I) (2-23-2004)
D–50 Appendix D Annual Capital Expenditures: 2003 U.S. Census Bureau
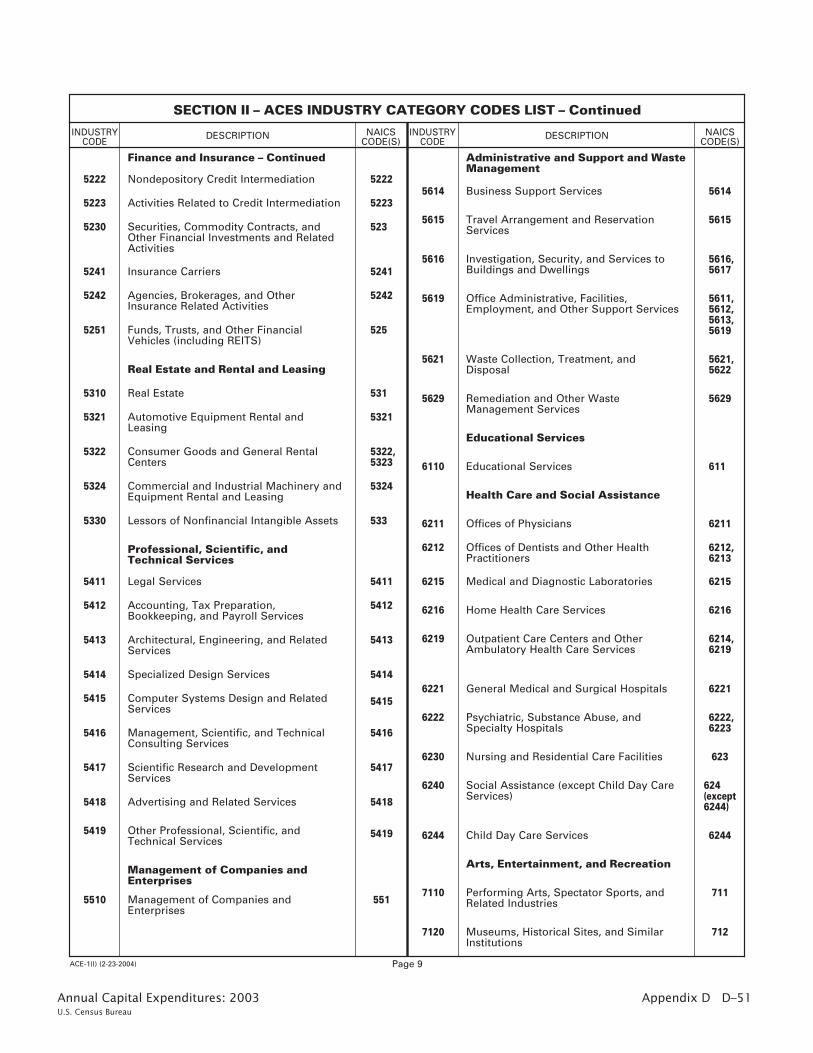
Page 9
SECTION II – ACES INDUSTRY CATEGORY CODES LIST – Continued
INDUSTRYCODE
NAICSCODE(S)
DESCRIPTION INDUSTRYCODE
DESCRIPTION NAICSCODE(S)
Management of Companies andEnterprises
Management of Companies andEnterprises
Finance and Insurance – Continued
Nondepository Credit Intermediation
Activities Related to Credit Intermediation
5510 551
5222
52235223
5222
Securities, Commodity Contracts, andOther Financial Investments and RelatedActivities
5235230
Insurance Carriers 52415241
Agencies, Brokerages, and OtherInsurance Related Activities
52425242
Funds, Trusts, and Other FinancialVehicles (including REITS)
5255251
Real Estate and Rental and Leasing
Real Estate 5315310
Automotive Equipment Rental andLeasing
53215321
Consumer Goods and General RentalCenters
5322,5323
5322
Commercial and Industrial Machinery andEquipment Rental and Leasing
53245324
Lessors of Nonfinancial Intangible Assets 5335330
Professional, Scientific, andTechnical Services
Legal Services 54115411
5412Accounting, Tax Preparation,Bookkeeping, and Payroll Services
5412
5413Architectural, Engineering, and RelatedServices
5413
5414Specialized Design Services5414
5415Computer Systems Design and RelatedServices
5415
5416Management, Scientific, and TechnicalConsulting Services
5416
5417Scientific Research and DevelopmentServices
5417
5418Advertising and Related Services5418
5419Other Professional, Scientific, andTechnical Services
5419
Administrative and Support and WasteManagement
Business Support Services5614 5614
Travel Arrangement and ReservationServices
5615 5615
Investigation, Security, and Services toBuildings and Dwellings
5616 5616,5617
Office Administrative, Facilities,Employment, and Other Support Services
5619 5611,5612,5613,5619
Waste Collection, Treatment, andDisposal
5621 5621,5622
Remediation and Other WasteManagement Services
5629 5629
Educational Services
Educational Services6110 611
Health Care and Social Assistance
Offices of Physicians6211 6211
Medical and Diagnostic Laboratories6215 6215
Home Health Care Services6216 6216
Outpatient Care Centers and OtherAmbulatory Health Care Services
6219 6214,6219
General Medical and Surgical Hospitals6221 6221
Psychiatric, Substance Abuse, andSpecialty Hospitals
6222 6222,6223
Nursing and Residential Care Facilities6230 623
Social Assistance (except Child Day CareServices)
6240 624(except6244)
Child Day Care Services6244 6244
Arts, Entertainment, and Recreation
Performing Arts, Spectator Sports, andRelated Industries
7110 711
Museums, Historical Sites, and SimilarInstitutions
7120 712
Offices of Dentists and Other HealthPractitioners
6212 6212,6213
ACE-1(I) (2-23-2004)
Annual Capital Expenditures: 2003U.S. Census Bureau
Appendix D D–51

Page 10
SECTION II – ACES INDUSTRY CATEGORY CODES LIST – Continued
INDUSTRYCODE
NAICSCODE(S)
DESCRIPTION INDUSTRYCODE
DESCRIPTION NAICSCODE(S)
Arts, Entertainment, and Recreation –Continued
Amusement, Gambling, and RecreationIndustries
7130 713
Accommodation and Food Services
Traveler Accommodation Services7210 721
Food Services and Drinking Places7220 722
Other Services (except PublicAdministration)
Automotive Repair and Maintenance8111 8111
Other Repair and Maintenance8119 8112,8113,8114
Personal Care, Death Care, Laundry, andOther Personal Services
8120 812
Religious, Grantmaking, Social Advocacy,Civic, and Social Organizations
8131 8131,8132,8133,8134
Business, Professional, Labor, Political,and Similar Organizations
8139 8139
Central Administrative OfficeActivity
Central Administrative Office ActivityUnallocated to Other Industry Categories
9900 N/A
ACE-1(I) (2-23-2004)
D–52 Appendix D Annual Capital Expenditures: 2003 U.S. Census Bureau
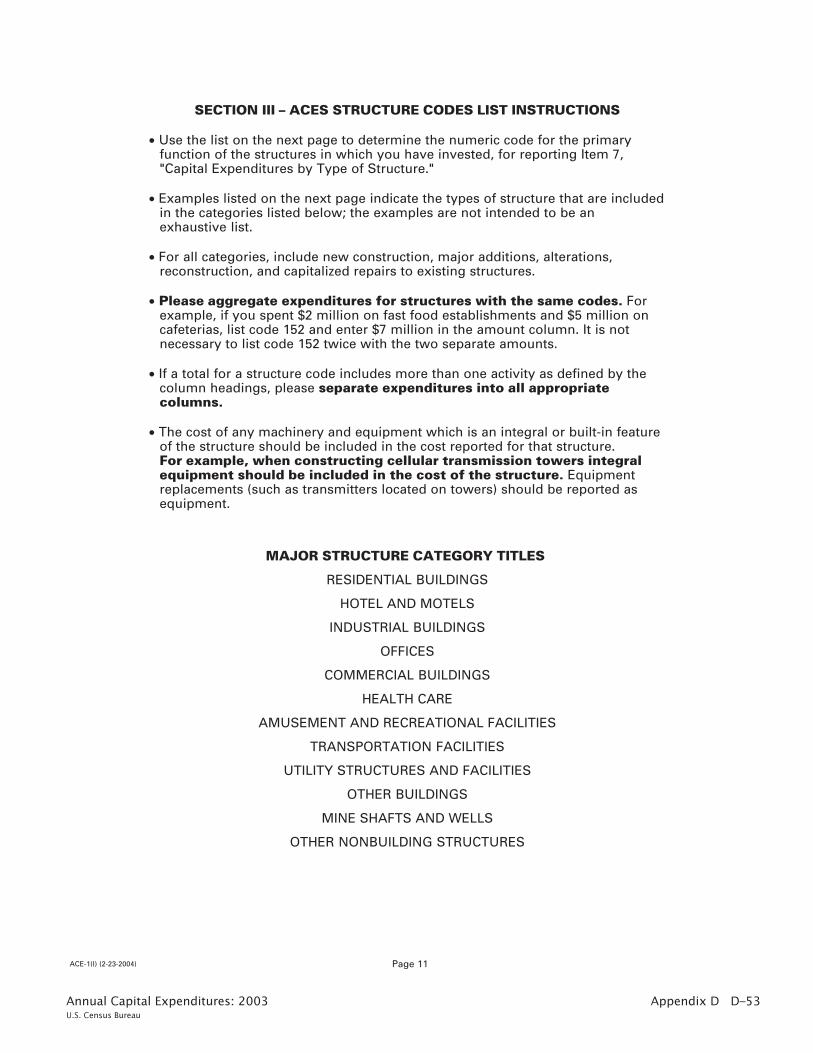
Page 11
SECTION III – ACES STRUCTURE CODES LIST INSTRUCTIONS
ACE-1(I) (2-23-2004)
• Use the list on the next page to determine the numeric code for the primaryfunction of the structures in which you have invested, for reporting Item 7,"Capital Expenditures by Type of Structure."
• Examples listed on the next page indicate the types of structure that are includedin the categories listed below; the examples are not intended to be anexhaustive list.
• For all categories, include new construction, major additions, alterations,reconstruction, and capitalized repairs to existing structures.
• Please aggregate expenditures for structures with the same codes. Forexample, if you spent $2 million on fast food establishments and $5 million oncafeterias, list code 152 and enter $7 million in the amount column. It is notnecessary to list code 152 twice with the two separate amounts.
• If a total for a structure code includes more than one activity as defined by thecolumn headings, please separate expenditures into all appropriatecolumns.
• The cost of any machinery and equipment which is an integral or built-in featureof the structure should be included in the cost reported for that structure. For example, when constructing cellular transmission towers integralequipment should be included in the cost of the structure. Equipmentreplacements (such as transmitters located on towers) should be reported asequipment.
MAJOR STRUCTURE CATEGORY TITLES
RESIDENTIAL BUILDINGS
HOTEL AND MOTELS
INDUSTRIAL BUILDINGS
OFFICES
COMMERCIAL BUILDINGS
HEALTH CARE
AMUSEMENT AND RECREATIONAL FACILITIES
TRANSPORTATION FACILITIES
UTILITY STRUCTURES AND FACILITIES
OTHER BUILDINGS
MINE SHAFTS AND WELLS
OTHER NONBUILDING STRUCTURES
Annual Capital Expenditures: 2003U.S. Census Bureau
Appendix D D–53

Page 12
2003 ACES STRUCTURE CODES LIST
STRUCTURECODE
DESCRIPTION DESCRIPTION
ACE-1(I) (2-23-2004)
STRUCTURECODE
RESIDENTIAL BUILDINGS
111
Apartment buildings, condominiums, singlefamily houses, and townhouses
112
HOTELS AND MOTELS
121
INDUSTRIAL BUILDINGS
131
132
OFFICES
141
142
COMMERCIAL BUILDINGS
151
152
Residential Structures
Manufactured (Mobile) Homes
Hotels, Motels, and Inns
Manufacturing, Processing, and AssemblyPlants
Office, Bank, and Professional Buildings
Industrial Nonbuilding Structures
Medical Offices
Automotive Facilities
Stores – Food Related
Hotels, Hotel/Casinos, Motels,Resorts, and park lodgings
Manufacturing, processing, and assemblyplants
Chemical complexes/facilities, petroleumrefineries, and cement plants
Administration, offices, and professionalbuildings
Medical, doctor, and dentist offices
Auto, truck, and motorcycle dealerships
Bakeries, coffee shops, delicatessens
153
154
155
HEALTH CARE
161
162
AMUSEMENT AND RECREATIONALFACILITIES
171
Multi-Retail Stores
Department stores, shopping malls/plazas/centers, town centers, and retailwarehouses
Warehouses and Distribution Centers(except Passenger)
Commercial and storage warehouses,distribution buildings, greenhouses, grainelevators, silos, and mini-storage buildings
Other Commercial Stores/Buildings, NotElsewhere Classified
Drug, pharmacy, electric, computer, clothing,jewelry, furniture, and office supply stores
Hospitals
General, mental, and infirmary hospitals
Special Care Facilities
Convalescent/nursing homes, rest homes withmedical facilities, adult daycare centers,hospices, battered spouse and child facilities,homeless shelters, drug clinics, rehabilitationcenters, institutional buildings, andsanatoriums
Amusement and Recreational Facilities
Amusement facilities/rides, theme parks,arcades, arenas, amphitheaters, pavilions,parks, concert and dance halls, operahouses, fraternal and banquet hallscommunity/trade/convention centers,theaters, motion picture/TV/cable studios,and casinos
Industrial buildings, factories, production,and laboratory facilities
Industrial incinerators, ovens, and kilns
Banks, credit unions, building/saving andloan offices, and other financial institutions
Computer centersMotion picture, TV, and radio multi-media
offices
Clinics, health centers, and medicallaboratories
Auto and truck parts/service/repair/rentalfacilities
Convenience stores, grocery stores,supermarkets, food markets, andliquor/beer stores
Restaurants, bars/nightclubs, cafes, cocktaillounges, diners, cafes, cafeterias, and fastfood stores
Beauty salons, florists and nursery-plantshops, dry cleaners, Laundromats,pawnshops, photo studios, repair shops,hardware and lumber stores, crematoriesand funeral homes, animal shelters, andveterinary clinics
Fitness centers, health clubs, racquetball,tennis, and other outdoor courts/fields
Golf courses, country clubs, driving ranges,race-tracks, bowling alleys, billiard halls, andrifle ranges
Filling stations, car washes, and parkinggarages
Noneducational gyms, athletic field houses,coliseums, stadiums, swimming pools, andauditoriums
D–54 Appendix D Annual Capital Expenditures: 2003 U.S. Census Bureau
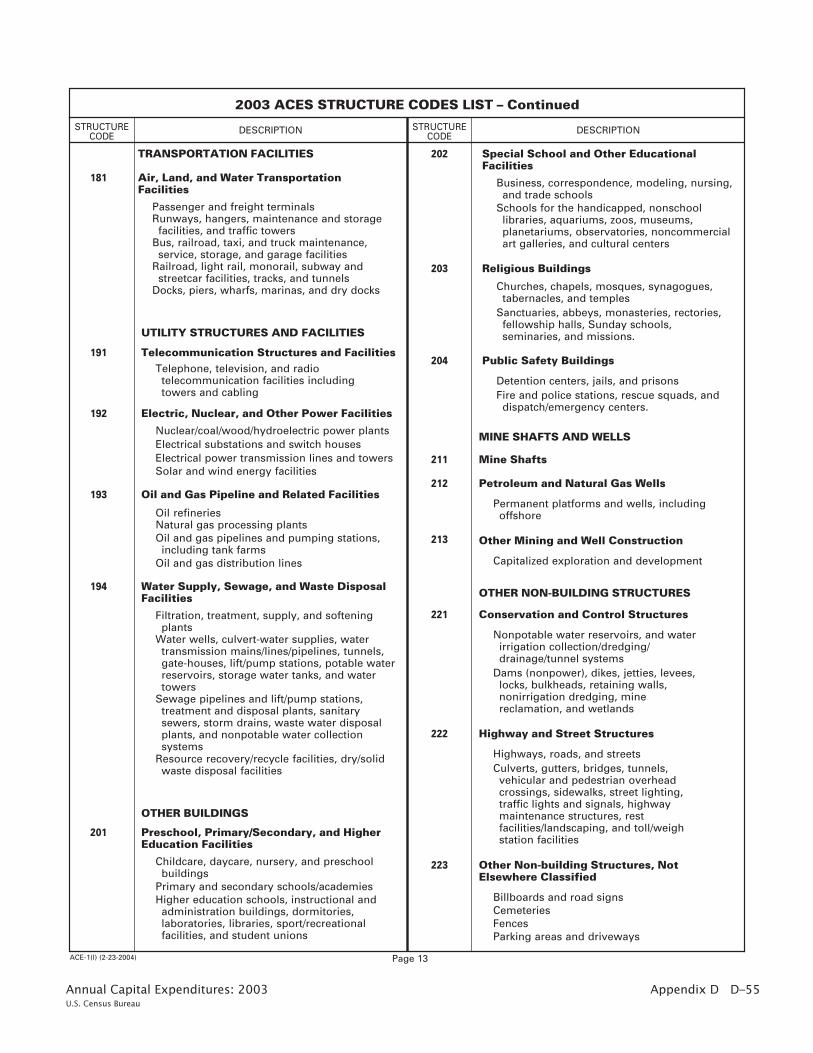
Page 13
2003 ACES STRUCTURE CODES LIST – Continued
STRUCTURECODE
DESCRIPTION DESCRIPTION
ACE-1(I) (2-23-2004)
STRUCTURECODE
191
194
OTHER BUILDINGS
201
202
203
204
MINE SHAFTS AND WELLS
211
212
213
OTHER NON-BUILDING STRUCTURES
221
222
223
Telecommunication Structures and Facilities
Water Supply, Sewage, and Waste DisposalFacilities
Filtration, treatment, supply, and softeningplants
Preschool, Primary/Secondary, and HigherEducation Facilities
Childcare, daycare, nursery, and preschoolbuildings
Special School and Other EducationalFacilities
Religious Buildings
Churches, chapels, mosques, synagogues,tabernacles, and temples
Public Safety Buildings
Detention centers, jails, and prisons
Mine Shafts
Petroleum and Natural Gas Wells
Permanent platforms and wells, includingoffshore
Other Mining and Well Construction
Capitalized exploration and development
Conservation and Control Structures
Nonpotable water reservoirs, and waterirrigation collection/dredging/drainage/tunnel systems
Highway and Street Structures
Highways, roads, and streets
Other Non-building Structures, NotElsewhere Classified
Billboards and road signs CemeteriesFencesParking areas and driveways
Telephone, television, and radiotelecommunication facilities includingtowers and cabling
Business, correspondence, modeling, nursing,and trade schools
Water wells, culvert-water supplies, watertransmission mains/lines/pipelines, tunnels,gate-houses, lift/pump stations, potable waterreservoirs, storage water tanks, and watertowers
Sewage pipelines and lift/pump stations,treatment and disposal plants, sanitarysewers, storm drains, waste water disposalplants, and nonpotable water collectionsystems
Resource recovery/recycle facilities, dry/solidwaste disposal facilities
Schools for the handicapped, nonschoollibraries, aquariums, zoos, museums,planetariums, observatories, noncommercialart galleries, and cultural centers
Primary and secondary schools/academies Higher education schools, instructional andadministration buildings, dormitories,laboratories, libraries, sport/recreationalfacilities, and student unions
Sanctuaries, abbeys, monasteries, rectories,fellowship halls, Sunday schools, seminaries, and missions.
Fire and police stations, rescue squads, anddispatch/emergency centers.
Dams (nonpower), dikes, jetties, levees,locks, bulkheads, retaining walls,nonirrigation dredging, minereclamation, and wetlands
Culverts, gutters, bridges, tunnels,vehicular and pedestrian overheadcrossings, sidewalks, street lighting,traffic lights and signals, highwaymaintenance structures, restfacilities/landscaping, and toll/weighstation facilities
TRANSPORTATION FACILITIES
181 Air, Land, and Water TransportationFacilities
Passenger and freight terminals Runways, hangers, maintenance and storagefacilities, and traffic towers
Bus, railroad, taxi, and truck maintenance,service, storage, and garage facilities
Railroad, light rail, monorail, subway andstreetcar facilities, tracks, and tunnels
Docks, piers, wharfs, marinas, and dry docks
UTILITY STRUCTURES AND FACILITIES
192
193
Electric, Nuclear, and Other Power Facilities
Nuclear/coal/wood/hydroelectric power plants
Oil and Gas Pipeline and Related Facilities
Oil refineries
Electrical substations and switch housesElectrical power transmission lines and towersSolar and wind energy facilities
Natural gas processing plantsOil and gas pipelines and pumping stations,including tank farms
Oil and gas distribution lines
Annual Capital Expenditures: 2003U.S. Census Bureau
Appendix D D–55

Page 14
SECTION III – ACES EQUIPMENT CODES LIST INSTRUCTIONS
ACE-1(I) (2-23-2004)
• Use the list on the next page to determine the numeric code for the primaryfunction of the equipment in which you have invested, for reporting Item 8,"Capital Expenditures by Type of Equipment."
• Examples listed on the next page indicate the types of equipment that areincluded in the categories listed below; the examples are not intended to be anexhaustive list.
• Please aggregate expenditures for equipment with the same codes. Forexample, if you spent $50,000 on computers and $20,000 on peripheralequipment for computers, list code 311 and enter $70,000 in the amount column.It is not necessary to list code 311 twice with the two separate amounts.
• If a total for an equipment code includes more than one activity as defined bythe column headings, please separate expenditures into all appropriatecolumns.
• The cost of any machinery and equipment which is an integral or built-in featureof a structure should be included as part of that that structure, not as equipment.
MAJOR EQUIPMENT CATEGORY TITLES
INFORMATION-PROCESSING EQUIPMENT
INDUSTRIAL EQUIPMENT
TRANSPORTATION EQUIPMENT
ENERGY, ELECTRICAL, AND RELATED EQUIPMENT
MISCELLANEOUS EQUIPMENT
OTHER EQUIPMENT NOT LISTED ELSEWHERE
• Please include as capital expenditures, the value of assets expended aspermitted under section 179 of the U.S. Internal Revenue code.
• Computer assisted machinery and systems that possess the ability to beprogrammed for a variety of functions should be reported according to theprimary function of the system.
D–56 Appendix D Annual Capital Expenditures: 2003 U.S. Census Bureau

Page 15
2003 ACES EQUIPMENT CODES LIST
EQUIPMENTCODE
DESCRIPTION DESCRIPTION
ACE-1(I) (2-23-2004)
EQUIPMENTCODE
311
312
313
314
315
316
317
321
322
323
Computer and Peripheral Equipment MainframesPersonal computers Workstations and terminals Laptops and computer servers Printers, plotters, and monitors Storage devices Automatic Teller machines (ATMs) Point-of-sale terminals PDA (Personal Data Assistance) equipmentScanners
Office Equipment Except Computersand Peripherals
Photographic and photocopying equipment Mail-handling machinery
Information and Communication TechnologyEquipment, Excluding Computers andPeripherals
Audio and Video Equipment MP3 equipmentVideo cassette recorders Stereo equipment and speaker systemsDVD recorders
Navigational, Measuring, and ControlInstruments
Aircraft instruments Flight recorders
Electromedical and ElectrotheraputicApparatus
Magnetic resonance imaging equipment ElectrocardiographsMedical ultrasound equipment Electromedical endoscopic equipment Defibrillators
Medical Equipment and Supplies Hospital beds Operating room tables Laboratory balances and scales Surgical and medical instruments Surgical appliances and supplies Dental equipment and supplies Orthodontic goods and appliances
Capitalized Software PrepackagedVendor customized Internally developed
Central office switching equipment
318
Fabricated Metal Products
Metalworking Machinery
Special Industrial Machinery
Nonpowered hand and edge tools Cutlery and kitchen utensils Metal drums, bins, and vats Metal tanks (heavy gauge)
Metal cutting, grinding, drilling, andforming machinery and machine tools
Circular and band sawing equipment Planing and sanding machinery Plastics compression equipment Extrusion and injection molding equipment Tire building and recapping equipment Pulp making machinery Paper and paperboard making machinery Knitting machinery Spinning machinery Weaving machinery Printing presses
Calculators, typewriters and dedicated wordprocessing equipment
Telephones (Wired and wireless) andtelephone apparatus
Global Positioning Systems (GPS) equipment Radio and television studio and broadcasting
equipmentFire detection and alarm systems Intercom systems
Facsimile equipment Bridges, routers, and gateways Transmitting and receiving antennas Communications satellites Cable television equipment
Radar and sonar systems and equipment Appliance regulators and controls (exceptswitches)
Water and gas consumption meters Parking and taxi meters Circuit and continuity testers Laboratory analytical instruments Automotive emissions testing equipment Physical properties testing and inspection
equipment
Power boilers and heat exchangers Shipping containers, including truck, rail,and ship
Spring and wire products Sheet metal Metal valves, pipes, and nozzles Metal pallets, safes, and vaults Firearms
Special dies, tools, jigs, and fixtures Industrial molds Rolling mill and other metalworking
machinery
Typesetting machinery Homogenizers, pasteurizers, and ice creamfreezers
Dough mixers, bake ovens, pastry rollingmachines
Wafer processing equipment (semiconductors) Semiconductor assembly and packaging Chemical processing machinery and
equipmentCigarette making machinery Circuit board machinery Glass making machinery Petroleum refining machinery
INFORMATION PROCESSING EQUIPMENT INDUSTRIAL EQUIPMENT
Annual Capital Expenditures: 2003U.S. Census Bureau
Appendix D D–57
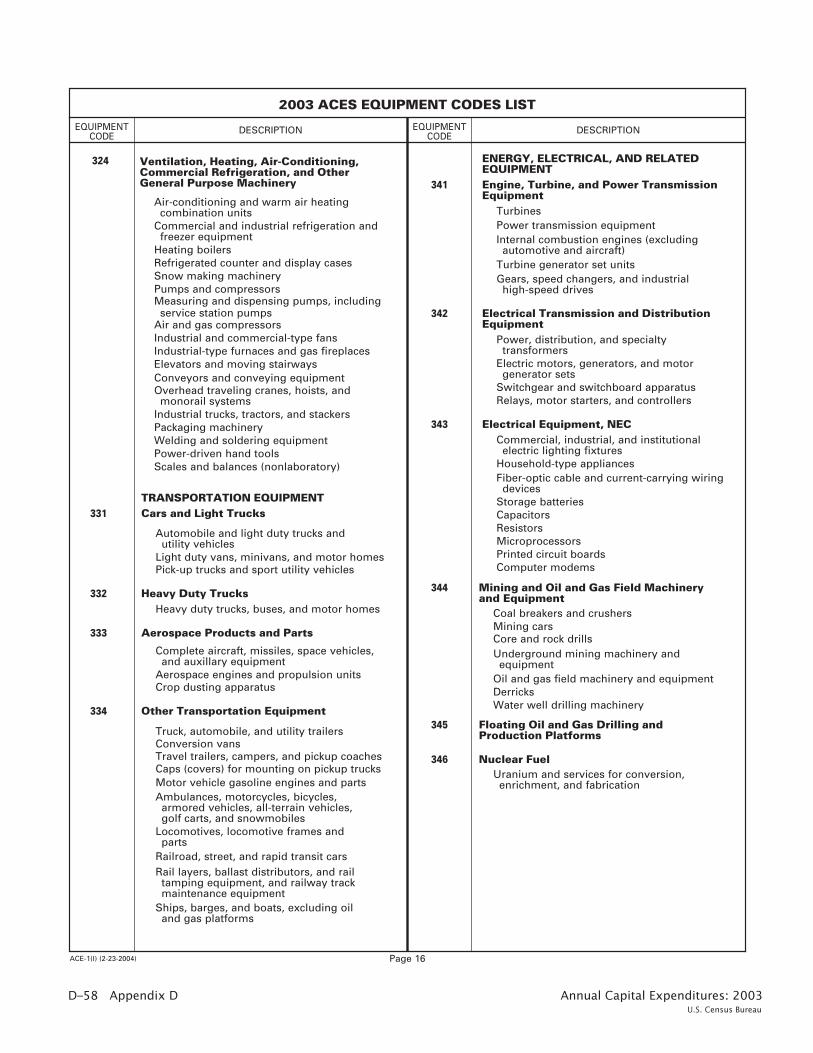
2003 ACES EQUIPMENT CODES LIST
EQUIPMENTCODE
DESCRIPTION DESCRIPTION
ACE-1(I) (2-23-2004)
EQUIPMENTCODE
331
Automobile and light duty trucks andutility vehicles
332Heavy duty trucks, buses, and motor homes
333
Complete aircraft, missiles, space vehicles,and auxillary equipment
334
Truck, automobile, and utility trailers Conversion vans Travel trailers, campers, and pickup coaches Caps (covers) for mounting on pickup trucks
ENERGY, ELECTRICAL, AND RELATEDEQUIPMENT
341
Turbines
342
Power, distribution, and specialtytransformers
343Commercial, industrial, and institutionalelectric lighting fixtures
344
Coal breakers and crushers Mining cars
345
346Uranium and services for conversion,enrichment, and fabrication
Cars and Light Trucks
Heavy Duty Trucks
Aerospace Products and Parts
Other Transportation Equipment
Engine, Turbine, and Power TransmissionEquipment
Electrical Transmission and DistributionEquipment
Electrical Equipment, NEC
TRANSPORTATION EQUIPMENT
Aerospace engines and propulsion units Crop dusting apparatus
Power transmission equipment Internal combustion engines (excludingautomotive and aircraft)
Turbine generator set units Gears, speed changers, and industrialhigh-speed drives
Ambulances, motorcycles, bicycles,armored vehicles, all-terrain vehicles,golf carts, and snowmobiles
Motor vehicle gasoline engines and parts
Railroad, street, and rapid transit cars Rail layers, ballast distributors, and railtamping equipment, and railway trackmaintenance equipment
Household-type appliances Fiber-optic cable and current-carrying wiringdevices
Storage batteries CapacitorsResistorsMicroprocessorsPrinted circuit boards Computer modems
Light duty vans, minivans, and motor homes Pick-up trucks and sport utility vehicles
Mining and Oil and Gas Field Machineryand Equipment
Floating Oil and Gas Drilling andProduction Platforms
Nuclear Fuel
Core and rock drills Underground mining machinery andequipment
Oil and gas field machinery and equipment DerricksWater well drilling machinery
Page 16
324 Ventilation, Heating, Air-Conditioning,Commercial Refrigeration, and OtherGeneral Purpose Machinery
Air-conditioning and warm air heatingcombination units
Commercial and industrial refrigeration andfreezer equipment
Heating boilers Refrigerated counter and display cases Snow making machinery Pumps and compressors Measuring and dispensing pumps, includingservice station pumps
Conveyors and conveying equipment Overhead traveling cranes, hoists, andmonorail systems
Industrial trucks, tractors, and stackers Packaging machinery Welding and soldering equipment Power-driven hand tools Scales and balances (nonlaboratory)
Air and gas compressors Industrial and commercial-type fans Industrial-type furnaces and gas fireplaces Elevators and moving stairways
Locomotives, locomotive frames andparts
Ships, barges, and boats, excluding oiland gas platforms
Electric motors, generators, and motorgenerator sets
Switchgear and switchboard apparatus Relays, motor starters, and controllers
D–58 Appendix D Annual Capital Expenditures: 2003 U.S. Census Bureau

2003 ACES EQUIPMENT CODES LIST
EQUIPMENTCODE
DESCRIPTION DESCRIPTION
ACE-1(I) (2-23-2004)
EQUIPMENTCODE
MISCELLANEOUS EQUIPMENT
351
Household-type furniture and cabinets
352Farm-type plows and tractors Planting and harvesting equipment Powered lawnmowers Lawn and garden tractors Tillers, shredders, and blowers
Bulldozers, cranes, and backhoes Construction-type tractors Surface mining machinery Logging equipment Off-highway trucks
354
Vending machines
355
Sporting and athletic goods Toys and games (including electronic) Musical instruments Jewelry and silverware Signs
OTHER EQUIPMENT NOT LISTEDELSEWHERE
361
Uniforms
Furniture and Related Products
Agricultural Equipment
Service Industry Equipment
Other Miscellaneous Equipment
Artwork, Books, and Other Equipment, NEC
Construction Machinery353
Institutional-type furniture such as furniturefor schools, theaters, and churches
Office furniture Office and store fixtures Mattresses, blinds, and shades
Coin operated machines Commercial and industrial laundry anddrycleaning equipment and pressingmachines
Commercial vacuum cleaners and carpetsweepers
Commercial-type cooking equipment Electronic training machines, includingflight simulators
Carnival and amusement park rides Carwashing machinery Power washer cleaning equipment Water treatment equipment
Page 17
Optical instruments Binoculars, telescopes, and prisms Coating, polishing, and mounting lenses
Annual Capital Expenditures: 2003U.S. Census Bureau
Appendix D D–59

FORM
2003 ANNUAL CAPITAL EXPENDITURES SURVEY
U.S. DEPARTMENT OF COMMERCEEconomics and Statistics Administration
U.S. CENSUS BUREAUYOUR RESPONSE IS REQUIRED BY LAW. Title 13, United States Code,requires businesses and other organizations that receive this questionnaireto answer the questions and return the report to the U.S. Census Bureau.By the same law, YOUR REPORT IS CONFIDENTIAL. It may be seen onlyby persons sworn to uphold the confidentiality of Census Bureauinformation and may be used only for statistical purposes. Further, copiesretained in respondents’ files are immune from legal process.
PLEASE REFER TO THE ENCLOSED INSTRUCTIONS AND DEFINITIONS PAGEBEFORE COMPLETING THIS SURVEY.
Report the following capital expenditures data for the entire business. Report dollar values rounded to thousands. Exclude land.ITEM 1
Report capital expenditures your business made during the 2003 reportingperiod. If your business did not make any capital expenditures enter"0" on the appropriate line(s).
a. Total Capital Expenditures
Report the following capital lease data for the entire business. Report in thousands of dollars.
Report the estimated cost of assets acquired under capital lease arrangements enteredinto during the year. Exclude the value of structures and equipment which you rent andperiodic payments made for leased structures and equipment. (For additionalinformation see Item 2 on page 2 of the Instructions and Definitions sheet.)
ITEM 2
New Structures (Include major additions, alterations, and capitalizedrepairs to existing structures)
Thousands Dollars
224
201
211
202
212
b.
c.
d.
e.
Used Structures
New Equipment
Used Equipment
ACE-2(3-15-2004)
411
DollarsThousands
OMB No. 0607-0782: Approval Expires 02/29/2004
(Please correct any errors in name, address, and ZIP Code.)
Page 1
Capital Expendituresfor 2003
Capital LeaseArrangements
for 2003
This questionnaire collectscapital expendituresinformation from nonfarmbusinesses including butnot limited to:
Self employed persons
Independent contractors(truckers, private duty nurses, construction contractors)Doctors, lawyers, investors, accountants
Even if this questionnairewas mailed to your homeaddress and the business isnot located at this address,the form is applicable andmust be completed.
••
•
•
Independent salespersons (e.g., cosmetic representatives)Independent commissionworkers (e.g., real estate and life insurance salespersons)
•
Small employer companies•
(The sum of lines b, c, d, and e should equal the value reported in line a.)
Respondents are not required to respond to any information collection unless it displays a valid approvalnumber from the Office of Management and Budget. This 8-digit number appears at the top of this page.
U S C E N S U S B U R E A U
D–60 Appendix D Annual Capital Expenditures: 2003 U.S. Census Bureau
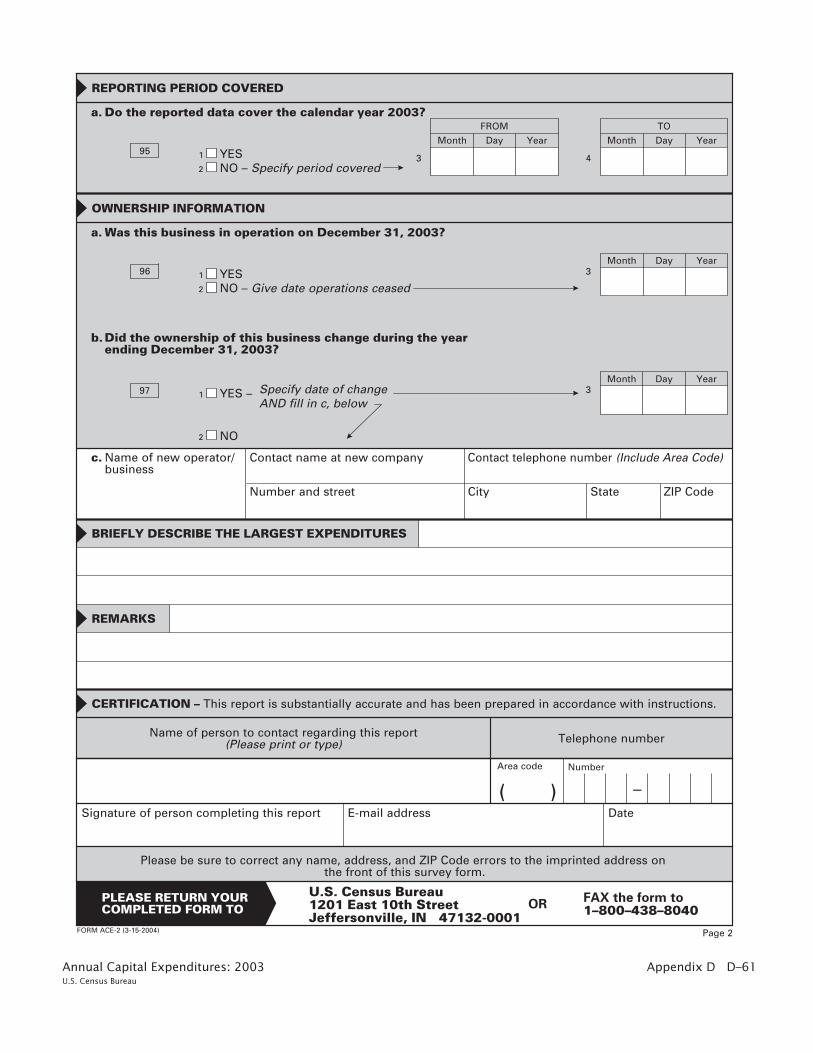
FORM ACE-2 (3-15-2004)
REPORTING PERIOD COVERED
OWNERSHIP INFORMATION
BRIEFLY DESCRIBE THE LARGEST EXPENDITURES
a. Do the reported data cover the calendar year 2003?
95 1
2
YESNO – Specify period covered
FROM
Month Day Year
3 4
TO
Month Day Year
a. Was this business in operation on December 31, 2003?
96 1
2
YESNO – Give date operations ceased
Month Day Year3
b.Did the ownership of this business change during the yearending December 31, 2003?
97 1 YES – 3
c. Name of new operator/business
Number and street City State ZIP Code
CERTIFICATION – This report is substantially accurate and has been prepared in accordance with instructions.
Name of person to contact regarding this report(Please print or type)
Signature of person completing this report
Telephone number
Area code Number
Date
( ) –
Please be sure to correct any name, address, and ZIP Code errors to the imprinted address on the front of this survey form.
PLEASE RETURN YOUR COMPLETED FORM TO
U.S. Census Bureau 1201 East 10th StreetJeffersonville, IN 47132-0001
Month Day YearSpecify date of change AND fill in c, below
2 NO
Page 2
FAX the form to 1–800–438–8040OR
E-mail address
Contact name at new company Contact telephone number (Include Area Code)
REMARKS
Annual Capital Expenditures: 2003U.S. Census Bureau
Appendix D D–61

D–62 Appendix D Annual Capital Expenditures: 2003 U.S. Census Bureau
(2-6-2004)ACE-2(I) U.S. DEPARTMENT OF COMMERCE
Economics and Statistics Administration
ANNUAL CAPITAL EXPENDITURES SURVEY
2003 INSTRUCTIONS AND DEFINITIONSBURDEN HOUR ESTIMATE
Public reporting burden for this collection of information is estimated to range from less than 1 hourto about 2 hours, averaging 1 hour per response, including time for reviewing instructions, searching existing data sources, gathering and maintaining the data needed, and completing and reviewing the collection of information. Send comments regarding this burden estimate or any other aspect of this collection of information, including suggestions for reducing this burden, to: Paperwork Project 0607-0782, U.S. Census Bureau, 4700 Silver Hill Road, Stop 1500, Washington, DC20233-1500. You may e-mail comments to [email protected]; use "Paperwork Project 0607-0782"as the subject.
SURVEY SCOPE – This survey collects capital expenditures data for nonfarm businesses, organizations,and associations operating within the United States. This survey also includes self-employed individuals.Report capital expenditures for all of your operations that are located in the 50 States and the District ofColumbia. Information for agricultural production operations should be excluded.
Survey Period –Report data for the calendar year 2003. If your fiscal year ends between October 31 andFebruary 28, fiscal year figures are acceptable. If calendar year book figures are not available except atconsiderable cost, reasonable estimates are acceptable. If the data reported are for a period other than thecalendar year, indicate the exact period covered on page 2 of the survey form.
Estimates are Acceptable – The data requested on this report may not correspond to your accountingrecords. If you cannot answer a question from your records, please estimate the answer. Report inthousands of dollars. If your business did not make any capital expenditures for the 2003 reporting period,enter "0" on the appropriate line(s).
Filing the Report – Return your completed report in the pre-addressed envelope. If you are not using thepre-addressed envelope, return your report form to the U.S. Census Bureau, 1201 East 10th Street,Jeffersonville, IN 47132-0001 or fax to 1–800–438–8040. Make a copy of the completed report form foryour company records.
U.S. CENSUS BUREAU
FROM THE DIRECTOR U.S. CENSUS BUREAU
We are conducting the Annual Capital Expenditures Survey, and we would like you to help bycompleting the enclosed survey form.
The U.S. Census Bureau’s Annual Capital Expenditures Survey is a key source of information about ourcountry’s economic performance. Business investment in structures and equipment is an important component of Gross Domestic Product. Investment data are useful for identifying business opportunities, product development, and strategic planning.
Title 13 of the United States Code requires you to answer this survey; it also requires us to keep yourresponse confidential.
In order to provide current and useful statistics for small, cyclical, and changing businesses, we needyour information, whether or not you made capital expenditures in calendar year 2003.
We realize that completing this survey is a burden for you. We hope, however, that you appreciatethe importance of your response in providing accurate data about our Nation’s economicperformance. We have limited the survey sample to the fewest possible number of representativefirms, and we accept estimates if book figures are not available.
Please review the instructions, complete the form, and return it within 30 days. The instructions canassist you on how to report for each item. Returning your form promptly helps us keep follow-up costs down. If you have any questions or comments, please call us toll-free at 1-800-528-3049.
Thank you in advance for your cooperation.
Sincerely,
Enclosure
Charles Louis Kincannon

Annual Capital Expenditures: 2003U.S. Census Bureau
Appendix D D–63
Filing Extensions – If you cannot complete the survey by the date shown on the front of the form, request anextension of time by writing to the U.S. Census Bureau, 1201 East 10th Street, Jeffersonville, IN47132-0001 or by calling 1–800–528–3049. Please reference your Census ID Number located on the top lineof the mailing address.
Legal Authority and Confidentiality of Data – Your response is required by law. Title 13, United StatesCode, requires businesses and other organizations that receive this questionnaire to answer the questions and returnthe report to the U.S. Census Bureau. By the same law, YOUR REPORT IS CONFIDENTIAL. It may be seen onlyby persons sworn to uphold the confidentiality of Census Bureau information and may be used only for statisticalpurposes. Further, copies retained in respondents’ files are immune from legal process.
Direct any QUESTIONS regarding this report form to the U.S. Census Bureau, ATTN: Company StatisticsDivision, Business Investment Branch, Washington, DC 20233-6400, or call 1–800–528–3049.
Page 2
HOW TO REPORT
Item 1CAPITAL EXPENDITURES – Report expenditures made during the year to purchase structures and equipmentfor use in your business. Records are ordinarily maintained for these expenditures since they are required to bedepreciated for tax purposes. Include the estimated cost of assets acquired as the lessee under capital leasearrangements entered into during the year. See Item 2 instructions below for additional information on capital leases.Assets which your company expensed as permitted under Section 179 of the U.S. Internal Revenue Code should bereported as capital expenditures for purposes of this survey. The requested information may be available from yourtax return, accountant, or tax advisor.
Exclude land and items charged as current operating expenses such as cost of maintenance (including maintenancecontracts), normal and ordinary repairs, supplies, and rental payments.
If expenditures are made for both business and personal use, report only those for business use.
NEW STRUCTURES – Report capital expenditures for new buildings, offices, and other structures, as well asstructures that have been previously owned but not used or occupied.
Include:
Cost of buildings and all necessary expenditures to acquire, construct, and prepare the structure for its intended use.
Cost of major additions, alterations, and capitalized repairs to existing structures whether performed by acontractor or completed in-house.
Cost of any machinery and equipment which is an integral or built-in feature of the structure.
NEW EQUIPMENT – Report capital expenditures for new machinery and equipment.
Include:
Capital expenditures for new equipment such as machinery, furniture and fixtures, cash registers, faxmachines, copy machines, computers, computer software, and cars and trucks used in the production anddistribution of goods and services and in office functions.
Expenditures for machinery and equipment which are housed in structures and can be removed or replaced without significantly altering the structure.
USED STRUCTURES AND USED EQUIPMENT – Report capital expenditures for offices, buildings, and otherstructures previously owned and occupied by others. Also include second hand equipment and machinery previouslyowned by others.
Item 2
CAPITAL LEASES – Report the estimated cost of new structures and equipment acquired as the lessee undercapital lease arrangements entered into during the year. Only the person or business to whom a lease is granted(lessee) from others should report here. This value should also be included as a capital expenditure in Item 1 sincethe purchase of a structure and/or equipment has essentially taken place.
Exclude the value of structures and equipment which you rent (operating leases); and periodic payments made forleased structures and equipment.
If you did not have capital expenditures during 2003, enter zeroes in the appropriate lines ofITEM 1 and complete the back of the form. Please sign and return your form in the enclosedenvelope or FAX to 1–800–438–8040.
If you have any questions about what to report or how to classify specific fixed assets, please call 1–800–528–3049.
ACE-2(I) (2-6-2004)
•
Report capital expenditures in dollar values rounded to thousands.
Enter zero if expenditures are less than one thousand dollars after rounding.
Thou. Dol.
1Example: If figure is$600.00, report
•
•
•
•
Thou. Dol.
3Example: If figure is$2,600.00, report

AC
E/03
20
03
An
nu
al Cap
ital Expen
ditu
res: 20
03
US
CE
NS
US
BU
RE
AU
Related Documents


![HOME [] · Author: Giovanni Rappa Created Date: 3/9/2020 6:51:08 PM](https://static.cupdf.com/doc/110x72/60a0554e8218c32a720bd3e2/home-author-giovanni-rappa-created-date-392020-65108-pm.jpg)


