Architecture, Design and Conservation Danish Portal for Artistic and Scientific Research Aarhus School of Architecture // Design School Kolding // Royal Danish Academy New Digital Technologies Applied to Architectural Design using Big Data Analysis Zarrillo, Annarita ; Ferla, Paolo ; Popovic Larsen, Olga; Castriotto, Caio; Browne, Xan; Minutolo, Vincenzo Published in: International Journal on Emerging Technologies Publication date: 2020 Document Version: Publisher's PDF, also known as Version of record Link to publication Citation for pulished version (APA): Zarrillo, A., Ferla, P., Popovic Larsen, O., Castriotto, C., Browne, X., & Minutolo, V. (2020). New Digital Technologies Applied to Architectural Design using Big Data Analysis. International Journal on Emerging Technologies, 11(4)( 240-246(2020)), 240-246. General rights Copyright and moral rights for the publications made accessible in the public portal are retained by the authors and/or other copyright owners and it is a condition of accessing publications that users recognise and abide by the legal requirements associated with these rights. • Users may download and print one copy of any publication from the public portal for the purpose of private study or research. • You may not further distribute the material or use it for any profit-making activity or commercial gain • You may freely distribute the URL identifying the publication in the public portal ? Take down policy If you believe that this document breaches copyright please contact us providing details, and we will remove access to the work immediately and investigate your claim. Download date: 20. Aug. 2022

Welcome message from author
This document is posted to help you gain knowledge. Please leave a comment to let me know what you think about it! Share it to your friends and learn new things together.
Transcript
Architecture, Design and ConservationDanish Portal for Artistic and Scientific Research
Aarhus School of Architecture // Design School Kolding // Royal Danish Academy
New Digital Technologies Applied to Architectural Design using Big Data Analysis
Zarrillo, Annarita ; Ferla, Paolo ; Popovic Larsen, Olga; Castriotto, Caio; Browne, Xan;Minutolo, VincenzoPublished in:International Journal on Emerging Technologies
Publication date:2020
Document Version:Publisher's PDF, also known as Version of record
Link to publication
Citation for pulished version (APA):Zarrillo, A., Ferla, P., Popovic Larsen, O., Castriotto, C., Browne, X., & Minutolo, V. (2020). New DigitalTechnologies Applied to Architectural Design using Big Data Analysis. International Journal on EmergingTechnologies, 11(4)( 240-246(2020)), 240-246.
General rightsCopyright and moral rights for the publications made accessible in the public portal are retained by the authors and/or other copyright ownersand it is a condition of accessing publications that users recognise and abide by the legal requirements associated with these rights.
• Users may download and print one copy of any publication from the public portal for the purpose of private study or research. • You may not further distribute the material or use it for any profit-making activity or commercial gain • You may freely distribute the URL identifying the publication in the public portal ?
Take down policyIf you believe that this document breaches copyright please contact us providing details, and we will remove access to the work immediatelyand investigate your claim.
Download date: 20. Aug. 2022

Zarrillo et al., International Journal on Emerging Technologies 11(4): 240-246(2020) 240
International Journal on Emerging Technologies 11(4): 240-246(2020) ISSN No. (Print): 0975-8364
ISSN No. (Online): 2249-3255
New Digital Technologies Applied to Architectural Design using Big Data Analysis
Annarita Zarrillo1, Paolo Ferla2, Olga Popovic-Larsen3, Caio Castriotto4, Xan Browne5 and Vincenzo Minutolo6 1Ph.D. Student, Department of Architecture and Industrial Design,
University of Campania Luigi Vanvitelli, Naples, Italy. 2Ph.D. Student, Department of Engineering, University of Campania Luigi Vanvitelli, Naples, Italy.
3Professor, Institute of Architecture and Technology, Royal Danish Academy of Fine Arts School of Architecture, Copenhagen, Denmark.
4Ph.D. Student, Faculty of Civil Engineer, Architecture and Urbanism, University of Campinas, Campinas, Brazil. 5Research Assistant, Institute of Architecture and Technology,
Royal Danish Academy of Fine Arts School of Architecture, Copenhagen, Denmark. 6Professor, Department of Engineering, University of Campania Luigi Vanvitelli, Naples, Italy.
(Corresponding author: Annarita Zarrillo) (Received 15 May 2020, Revised 26 June 2020, Accepted 06 July 2020)
(Published by Research Trend, Website: www.researchtrend.net)
ABSTRACT: This article aims to compare the world of architecture with that of technology to define how, over the years, they have contributed to the development of each other. In the 60s, with the forward-looking projects of Yona Friedman and Cedric Price, the idea of adapting architecture to human needs was born. To better respond to this request, there is a need of receiving a large amount of data and to analyze it. Only today, after more than 50 years, technology can adequately respond to this need thanks to the application of Big Data and the Internet of Things (IoT) to architectural design. The present study analyzes some past projects whilst considering contemporary digital technologies and mathematical algorithms. It highlights how Price's Generator Project was a forerunner of the modern Internet of Things systems. The second part of the article shows how new technologies can be applied to architectural design bringing both economic and adaptive advantages. In particular, a practical example is proposed based on the analysis of Big Data sets, related to meteorological and rainfall conditions by performing computational analysis on given data.The challenge of this experiment is to show that new IoT technologies and mathematical algorithms applied to architectural design could make the project more sustainable and aware.Ultimately, the contribution of this article is to increase the state of the art in this still-emerging field. It paves the way for new and more advanced future interactions between adaptive architecture and IoT systems.
Keywords: IoT in architectural design, adaptive architecture, Big Data analysis, bioclimatic, smart building, architectural technology, computational engineering, mathematical algorithm.
Abbreviations: IoT, Internet of Things; GEAM, Groupe d'Études de Architecture Mobile; IT, Information TechnologyITU, International Telecommunication Union; UN, United Nations; Dp, Differential pressure; COMet, Centro Operativo per la Meteorologia; NNE, North-Northeast; ENE, East-Northeast; ESE, East-Southeast; SSE, South-Southeast; SSW, South-Southwest; WSW, West-Southwest; WNW, West-Northwest; NNW, North-Northwest; HVAC, heating, ventilation, and air conditioning; MAXXI, national Museum of the Arts of the XXI century; ISPRA, Istituto Superioreper la Protezionee la RicercaAmbientale.
I. INTRODUCTION
Adaptive architecture has existed since the second half of the twentieth century, but the twenty-first century is considered its true starting point thanks to the contemporary growth of new digital technologies. The growing interest in this field is demonstrated by the multiple achievements of the last few years. Many examplesconsist of kinetic facades, such as the Garden by the Bay, Al-Bahr Tower in Abu Dhabi, and Thematic Pavillion Yeosu of Expo 2012. Technological innovations have changed not only the buildings but the way the architects approach design. The spaces are no longer static but become a hybrid combination of physical and digital elements that the architect transforms and rethinks using the technologies of the Internet of Things. An example of this is provided [1]. In the new scenario that we are experiencing, the architect
dialogues with designers, engineers, and IT technicians, to create environments for specific requirements. For example, these spaces can focus on the well-being and comfort of users, and itconfigures as smart space, promoting integration and collaboration. This article is part of the contemporary context by proposing a new interpretation that compares the concept of adaptivity with modern digital technologies applied to architecture, which are examples of Smart Homes, Smart Buildings, Smart Cities, and Smart Mobility.
II. REVIEW OF LITERATURE
A. The concept of architecture as a response to human needs In the "Mobile Architecture" manifesto presented in 1958, Yona Friedman asked the following question: "why should architects decide for the people who live in their buildings?".
et

Zarrillo et al., International Journal on Emerging Technologies 11(4): 240-246(2020) 241
For the first time, Friedman hypothesizes a design that has the user's freedom of choice as first interest. Friedman believes that the architectural projects of the 1950s responded to the needs of a hypothetical average man, no longer relevant in his time. A moving society, like the one that Friedman dreamed of, needs a new architecture that did not have the predetermined infrastructure, but that could be chosen by the occupant. In 1959, Friedman introduces "Spatial City" (Fig. 1 a), a materialization of his theory where the inhabitants would have flexible structures available that would allow them to modify spaces according to their needs. Furthermore, in this mobile city, buildings would occupy only a minimal amount of space and would be modular and mobile. This plan proposed by GEAM, Groupe d'Étudesde Architecture Mobile, was to consist of a city with movable walls, floors, and ceilings, with easily modifiable infrastructure networks and large mobile spatial units articulated on three levels. The project was based on a modular grid suspended in space, which Friedman called "artificial topography" and which outlined new cartography of the terrain, promoting unlimited growth of the city. The spaces in this grid are rectangular and habitable "voids", (Fig. 1b), with an average surface area of 25–35 m2. Instead, the configuration of the habitable volumes to be included in the grid is at the user's free discretion. The houses occupy only 50% of the three-dimensional lattice, allowing light to spread freely in the space city. This introduction of elements on a three-dimensional grid with different levels allows a variable occupation of space through the convertibility of the forms and their adaptation to multiple uses. This container-based design technique inaugurates a new development in urban planning.
Fig. 1. Friedman, Yona. Spatial City Project, (a) Perspective; (b) Aerial perspective.1958-59, The
Museum of Modern Art.
The raised floors allow increasing the three-dimensional area of the city so that the lower level can be used for public life and community services, as well as for pedestrian areas. The stacks, on the other hand, contain vertical transports, lifts, and stairs. The overlap of the levels should allow buildingan entire industrial city, a residential, or a commercial city, on the same site. Friedman's utopian projects are discussed in the context of the avant-garde of the 1960s [2]. The first example of an intelligent building. Cedric Price, with his architecture, asks the question: "What if a building or space could be constantly generated or regenerated?". In 1961 he tried to answer with the design of the Fun Palace. The project contains theaters, cinemas, restaurants, workshops that can be assembled, moved, reorganized, and demolished continuously. A few years later, in the 1970s, human life was greatly changed by information technology and telecommunications. In this context, in 1976 Cedric Price, collaborating with John and Julia Frazer, invented "The Generator Project" (Fig. 2), a project based on a computer program capable of reorganizing the layout of the site in response to various needs. Price's Seminal Generator Project, although unrealized, is considered very important in this field and it is considered the first intelligent construction project. Cedric Price's proposal for Gilman Corporation, described by Hernández in [3], consisted of a series of movable structures on a grid. In this project, John and Julia Frazer played the role of IT consultants. They created a program to manage the layout of the site on the computer in response to changing needs and suggested incorporating a single-chip microprocessor into each component of the building, to allow for centralized control.
Fig. 2. Price, Cedric. Generator Project, White Oak, Florida, Sketches 1978-1980. 2002, The Museum of
Modern Art.

Zarrillo et al., International Journal on Emerging Technologies 11(4): 240-246(2020) 242
This program made it possible to obtain an "intelligent" building that controlled its organization in response to use. Furthermore, thanks to the program, the building was able to offer various component aggregation solutions. In fact, when its conformation was not changed for a long time, the building was able to improve its organization based on experience. Price's project concerns the concept of adaptation applied to architectural design. This project was based on a system capable of collecting data relating to its users through sensors. Then the data are analyzed and, based on the results obtained, the system makes a decision on the layout to be adopted. This decision, taken independently by the system, would also have been put into practice directly, without human intervention. All this would have resulted in a different layout of the building, which would then reconfigure the different parts of the structure to better respond to the needs of users, resulting from the analysis of the data collected. The structural layout optimization technique is discussed [4]. Analyzing Price's project in the light of new digital technologies, this was one of the first cases of designing a system with its intelligence and could be considered an anticipator of modern Internet of Things systems. Internet of Things. Humans have always strived to make their life more convenient and comfortable.This has been the engine that has fueled curiosity in technology, leading to the development of new technological frontiers. As human society progressed through periods of evolution and revolution, technology has played a key role. The first industrial revolution was driven by the invention of the steam engine. The second was based on the discovery of electricity. The third started with the gradual introduction of electronics and computer science. Now, based on the innovations of the third industrial revolution, a digital revolution is being built with IoT systems as absolute protagonists [5]. The concept of the Internet of Things was first proposed by Kevin Ashton in 1999. This however was inspired by previous ideas, from Mark Weiser's utopian vision described in his 1991 article for Scientific American (The computer for 21 Century) in which he described a future world made up of numerous interconnected computers. There have been many interpretations of the IoT concept, yet there is still no universal definition on which all experts agree. Depending on the context of use, the Internet of Things can refer to the data collected, to the physical hardware, to the communication networks. In general, one can say that this concerns the collection and processing of data and the consequent ability to make decisions. The starting point for the denomination "Internet of Things" which finds popular recognition in the public domain can be traced back to the 2005 world summit in Tunis, where the International Telecommunication Union (ITU), a United Nations (UN) organ, published a report entitled "The Internet of Things". An exhaustive picture of IoT systems technologies is provided by Chin et al., [6]. The characteristics of a modern Internet of Things system include the following factors: devices, physical or virtual, data acquisition, communication, analysis, information and forecasting, and finally the supply of value, which takes the form of improving operational performance. Commonly, the expression "Internet of Things" is used to define a network of equipment and
devices, connected to the Internet, equipped with software that allows the exchange of data with other connected objects. The two main characteristics of a connected objectare: having an IP address that allows it to be uniquely identified on the network and having the ability to exchange data through the network itself without the need for human intervention. IoT brings "intelligence" to information processing systems. Through the IoT, things can be controlled remotely and areable to transmit data.From these data, useful information can be extracted aboutthe functioning of these objects, andthe interaction between these objects and those who use them. The devices, also called microcontrollers, constantly need to communicate with each other in a synchronized manner, according to very precise protocols. They collect data through the sensors and store them in data structures, generally in the Cloud,servers constantly accessible through an internet connection. In the Cloud, data are analyzed and information is obtained. This information is reintroduced into the real world for use by humans according to the objectives of the designer. The entire ecosystem of Hardware/Software elements, that forms an IoT project, is based on an architecture composed of assembled elements (Fig. 3). The most affected sectors by IoT applications are Smart Home, Smart Building, Smart City, Smart Mobility, but also Smart Manufacturing. In the field of energy, Smart Metering (remote reading of electricity, water, and gas meters) is widespread, while in the world of mobility new opportunities are coming in the context of Smart Cars.
Fig. 3. IoT architecture.
Big data. The concept of Big Data is closely linked to that of the Internet of Things. IoT objects and sensors can collect and store data inthe order of terabytes andrequiring software capable of working with millions of data points as well as large real-time fast processing power. Web 2.0 is also an ever-growing source of data: its fundamental feature is user-generated content, that is, content produced largely by users. Big data are data produced in large quantities, with remarkable rapidity and in the most diverse formats, the elaboration of which requires technologies and resources that go far beyond conventional systems of data management and storage. To obtain information that can be used in the company's decision-making processes, it is necessary to use alternative tools with high calculation capacity. Big data analysis can prove useful in many areas.

Zarrillo et al., International Journal on Emerging Technologies 11(4): 240-246(2020) 243
Examples of structural monitoring through special sensors are described in [7-9]. Further developments of Big Data can be performed by comparing experimental data with results obtained by mathematical algorithms such as the ones described [10, 11] IoT and adaptivity. IoT systems applied to buildings or cities are intended to collect a large amount of data and analyze it to allow for adaptation. In this case, adaptation meanschanging a situation to meetsuitable needs. Usually, the adaptation takes place according to the users, but it can also take place towards an object or an environment. The application of interactive technologies in architecture, to dynamically reuse the built environment, is widely discussed by Schnädelbach [12]. The design is rarely aimed at adapting to a single inhabitant or a small group of people. These are exceptional cases related to the design of a private home, such as the Bill Gates' House, where thanks to a personal label, adaptive technology can identify people and consequently regulate temperature, music, and lighting. The adaptation can take place manually when the residentscan change the layout of the architecture, or automatically when the building responds to a stimulus by drawing on a database containing the personal data of the residents. Most buildings are not used by a single individual, therefore adaptive design mustoften deal with groups of larger or smaller individuals. Again, the response of the building can be manual or automatic. The automatic adaptation of buildings to groups of individuals involves the need to know the behavior of the group and therefore gradual learning that takes place over time to arrive at the creation of personal profiles. The complexity of this process lies in the aggregation of multiple streams of personal data in a meaningful and useful way. One example is the Adaptive Houses of the University of Colorado [13, 14]. In this project, data relating to multiple inhabitants were considered to allow the house to adapt according to multiple parameters. The project aimed to develop a house that is planned by observing the residents' lifestyle and learning to anticipate their needs. The developed system automatically controls the residential comfort parameters relating to heating, ventilation, air conditioning, hot water, internal lighting. The system monitors the environment, observing the actions of the occupants, to arrive at composing models that foresee their actions. The prototype of the system, which was built and placed in a royal residence in Colorado, is equipped with a series of over seventy-five sensors that provide information on environmental conditions such as temperature, ambient light levels, sound, movement, door and window openings. This control system is based on a neural network, which is an artificial learning device inspired by the functioning of the human brain. These networks are made up of thousands of simple neuron-like processing units that interact with each other, leading to complex behaviors and the ability to learn from experience. Adaptability in reaction to objects is relatively less common. It can decline in various ways, for example, there may be the need to automatically limit access to a category of people when there is a specific object in the building that can be particularly valuable. Similarly, a warehouse could prepare the loading area in anticipation of an incoming delivery. Another possible application of adaptive architecture based on objects is the design of a
domestic device that displays passing air traffic so that people living on the flight path near the airport can understand what happens over their houses. An example is provided by the Curious Home project at Goldsmith's College [15]. A possible future line of study could be to design buildings that change their acoustic properties as objects that produce unwanted noise pass through.
III. MATERIALS AND METHODS
This study proposes an application of new digital technologies to architectural design, particularly bioclimatic one, to improve the performance of a building without resorting to plant engineering.
A. Natural ventilation The movement of the air takes place at a macroscopic level thanks to the prevailing winds.These are the winds that blow with the greatest frequency throughout the season. On days when the wind is weak, ventilation can be stimulated thanks to Dp, the difference in pressure between the upwind and downwind walls. In general, fresh air enters the colder front of the building and exits the warmer front. But it also depends on the direction ofthe prevailing winds if they push the air in or if they help to blow it out. The wind applied to the external walls of a building creates pressure that increases with velocity. It has a positive value on the side affected by the wind anda negative value on the opposite side.The difference in pressure between the upwind and downwind sides helps to create an airflow inside the building. This airflow will be greater if the inlet openings are on a high-pressure wall and the outlet openings on a low-pressure wall. The characteristics of the airflow that starts inside the buildings vary according to the position in plan and elevation as well asthe size of the openings. The analysis presented below has the purpose of identifying the most advantageous position of the openings so that the best internal natural air circulation is guaranteed, that is, without resorting to plant engineering.
B. Analysis The analysis conducted relates to the calendar year 2019. The area under consideration, is the city of Rome (IT), the Flaminio district. The research work was divided into the following phases: data collection, analysis and interaction of data using combined graphs, and examination of the results.
C. Data collection The data used for this study, relating to the 365 days of the calendar year 2019, are of three types: average wind velocity expressed in Km/h, rainfall height in mm, and prevailing wind direction in north degrees (°N). The data relating to the average speed and the prevailing wind direction were taken from the Meteorology Operations Center (COMet) archive. The prevailing wind directions are present in the archives expressed in degrees north. A mathematical algorithm was written in order to automatically compute north degrees in 16 directions as a reference, to make the data user friendly and easier to consult. These directions are: — 4 main cardinal directions: North (N), South (S), East (E), and West (W);

Zarrillo et al., International Journal on Emerging Technologies 11(4): 240-246(2020) 244
— 4 intermediate directions (Northeast (NE), Southeast (SE), Southwest (SW), and Northwest (NW); — 8 secondary directions: North-northeast (NNE), East-Northeast (ENE), East-Southeast (ESE), South-Southeast (SSE), South-Southwest (SSW), West-Southwest (WSW), West-Northwest (WNW), North-Northwest (NNW). The algorithm exploits Microsoft Excel IFS function, which syntax is the following: =IFS(Something is Truei; Value if Truei)
for every i condition. For the present case, the IFS function shows up as follows: =IFS(NorthDegrees>α0;"N";NorthDegrees>α0-∆α;"NNW";NorthDegrees>α0-2∆α;"NW";NorthDegrees>α0-3∆α;"WNW";NorthDegrees>α0-4∆α;"W";NorthDegrees>α0-5∆α;"WSW";NorthDegrees>α0-6∆α;"SW";NorthDegrees>α0-7∆α;"SSW";NorthDegrees>α0-8∆α;"S";NorthDegrees>α0-9∆α;"SSE";NorthDegrees>α0-10∆α;"SE";NorthDegrees>α0-11∆α;"ESE";NorthDegrees>α0-12∆α;"E";NorthDegrees>α0-13∆α;"ENE";NorthDegrees>α0-14∆α;"NE";NorthDegrees>α0-15∆α;"NNE";NorthDegrees>0;"N")
Where: ∆α = 22.5 °N representsthe angle between two subsequent cardinal directions. — α0 = 360 °N - ∆α/2 In this case, wind direction data taken from the COMet site are automatically transformed in cardinal directions with no effort to be done. Instead, the rainfall height values were taken from the thermo-rainfall data archive of the Civil Protection of the Lazio Region.
D. Data analysis with combined graphs The data are taken into consideration have been linked using scatter charts. Two scatter plots with straight lines and indicators were used to report the average wind velocity values on the first, (Fig. 4a), and the rainfall values on the second, (Fig.4 b). In a second step, these two series of data were put on a graph combined with a secondary axis that shows the measurement dates on the abscissas, the average wind velocity on the first ordinate, and the rainfall height on the second one, (Fig. 5). It is important to rememberthat, in meteorology, winds are classified as follows: – weak = speed from 1 to 10 knots (from 1 to 18.5 km/h), – moderate = speed from 11 to 20 knots (from 19 to 37 km/h), – strong = speed over 20 knots (over 37 km/h).
Fig. 4. (a) Average Wind Velocity graph in relation to the dates (b) Rainfall height graph in relation to the dates.
Fig. 5. Combined graph of rainfall height and average wind velocity in relation to the dates.
Zarrillo et al., International Journal on Emerging Technologies 11(4): 240-246(2020) 245
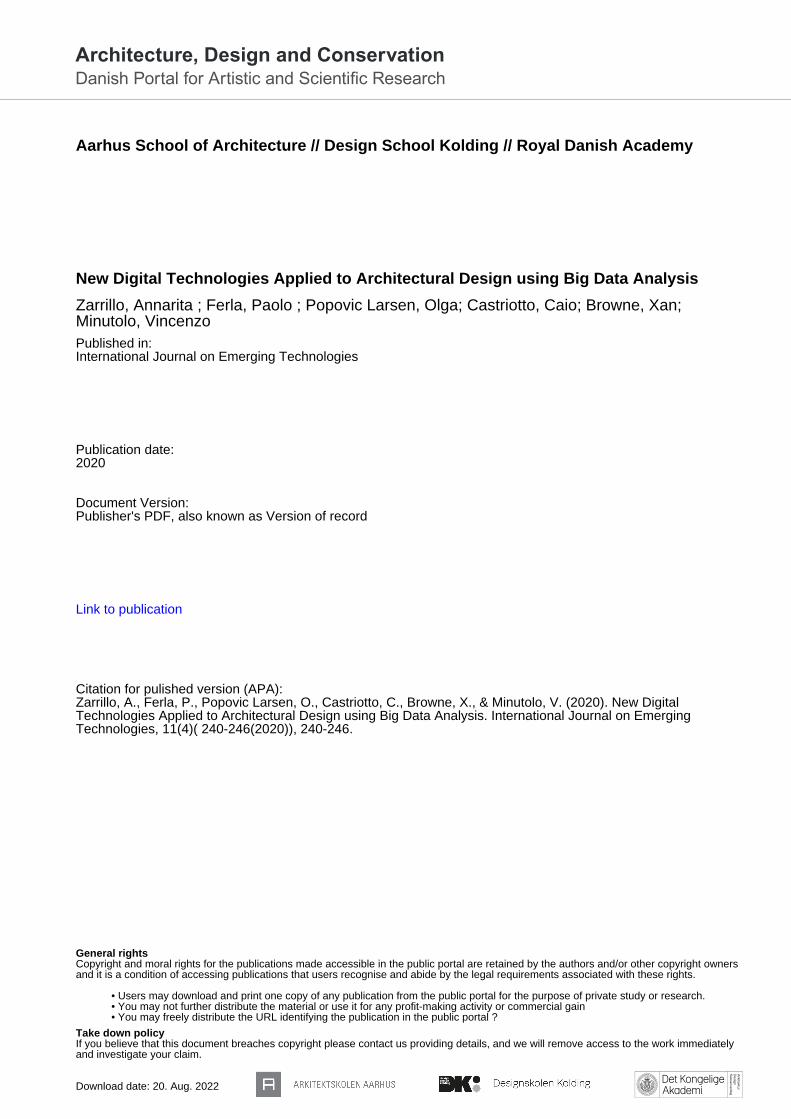
For this analysis, winds of at least moderate size should be considered. These wind values can stimulate the circulation of indoor air, instead, lower values would be insufficient. Therefore, a minimum value of 20 km/h is chosen. Also, the rainfall values are set to zero. The absence of precipitation is desirable because it allows the opening of the windows without the rain infiltration inside the building. From the general graph, we then
extract the days when the wind and the rainfall are in the previously described interval. The selected values are shown in a grouped column chart that has the dates on the abscissa axis and the prevailing wind velocity values on the ordinate axis. The wind directions are indicated with different colors and expressed in cardinal points.
Fig. 6. Grouped column chart with the dates on the abscissas, the average wind velocity on the ordinates, and the prevailing wind directions indicated with different colors and expressed in cardinal points.
IV. RESULTS
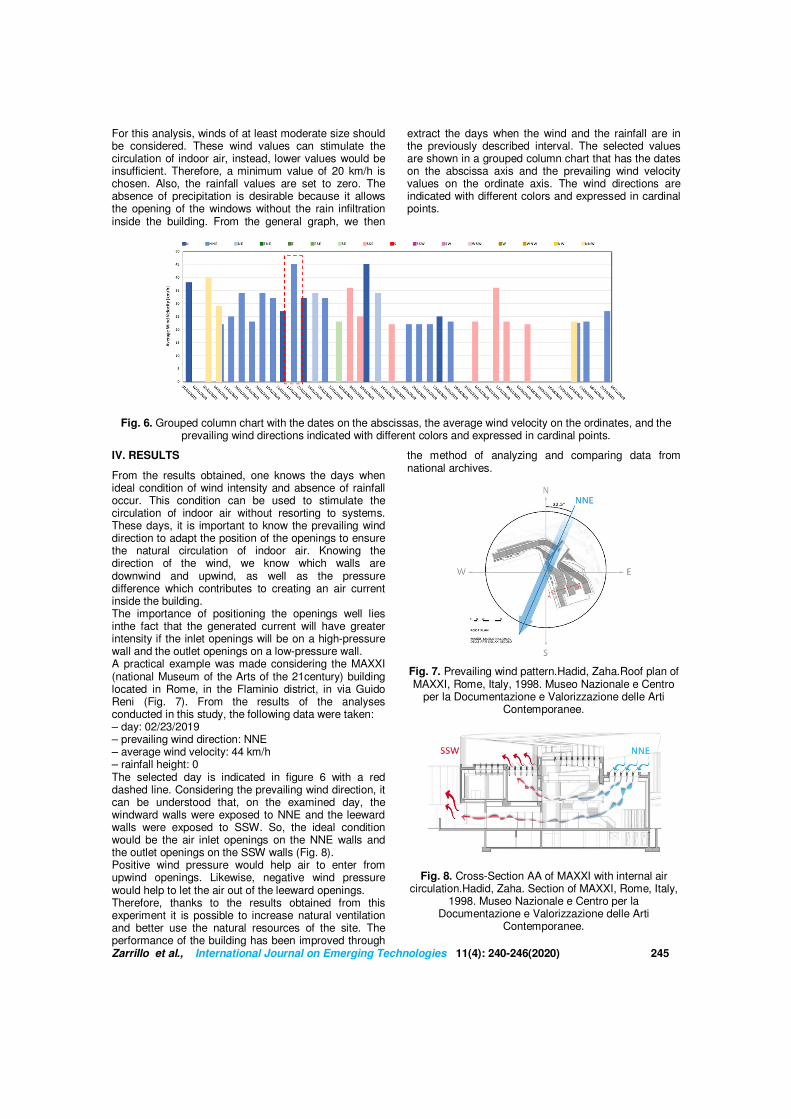
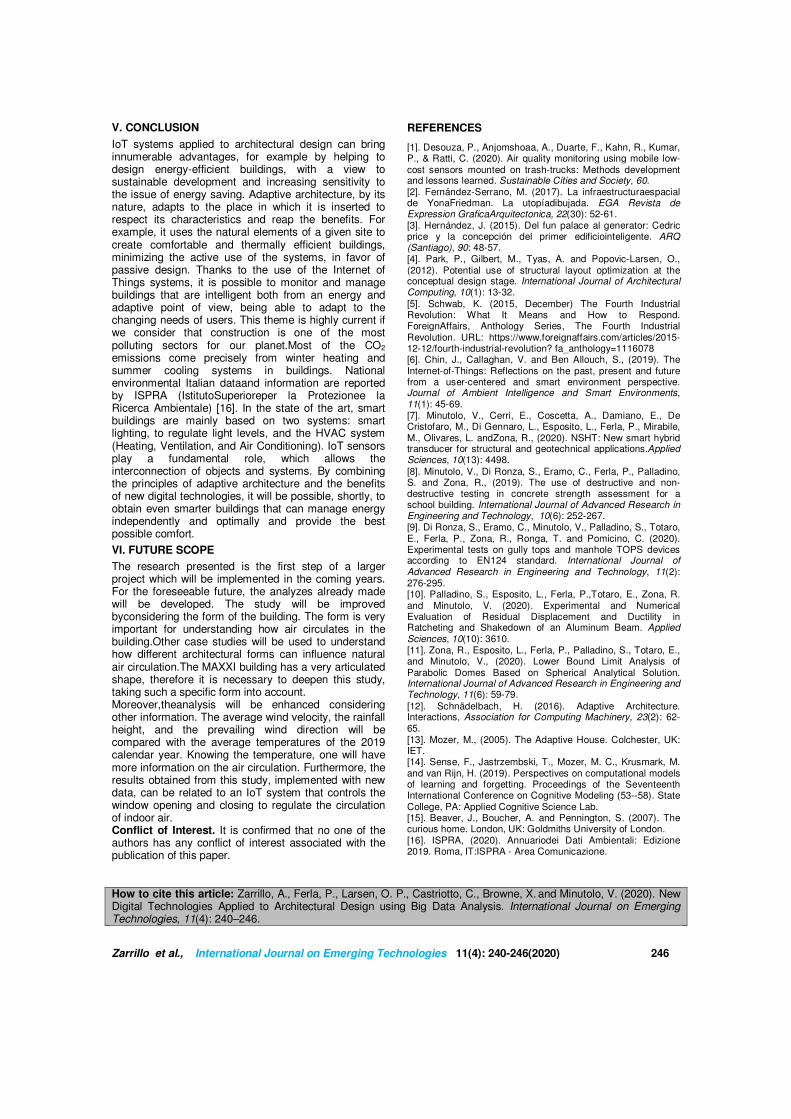
From the results obtained, one knows the days when ideal condition of wind intensity and absence of rainfall occur. This condition can be used to stimulate the circulation of indoor air without resorting to systems. These days, it is important to know the prevailing wind direction to adapt the position of the openings to ensure the natural circulation of indoor air. Knowing the direction of the wind, we know which walls are downwind and upwind, as well as the pressure difference which contributes to creating an air current inside the building. The importance of positioning the openings well lies inthe fact that the generated current will have greater intensity if the inlet openings will be on a high-pressure wall and the outlet openings on a low-pressure wall. A practical example was made considering the MAXXI (national Museum of the Arts of the 21century) building located in Rome, in the Flaminio district, in via Guido Reni (Fig. 7). From the results of the analyses conducted in this study, the following data were taken: – day: 02/23/2019 – prevailing wind direction: NNE – average wind velocity: 44 km/h – rainfall height: 0 The selected day is indicated in figure 6 with a red dashed line. Considering the prevailing wind direction, it can be understood that, on the examined day, the windward walls were exposed to NNE and the leeward walls were exposed to SSW. So, the ideal condition would be the air inlet openings on the NNE walls and the outlet openings on the SSW walls (Fig. 8). Positive wind pressure would help air to enter from upwind openings. Likewise, negative wind pressure would help to let the air out of the leeward openings. Therefore, thanks to the results obtained from this experiment it is possible to increase natural ventilation and better use the natural resources of the site. The performance of the building has been improved through
the method of analyzing and comparing data from national archives.
Fig. 7. Prevailing wind pattern.Hadid, Zaha.Roof plan of MAXXI, Rome, Italy, 1998. Museo Nazionale e Centro
per la Documentazione e Valorizzazione delle Arti Contemporanee.
Fig. 8. Cross-Section AA of MAXXI with internal air circulation.Hadid, Zaha. Section of MAXXI, Rome, Italy,
1998. Museo Nazionale e Centro per la Documentazione e Valorizzazione delle Arti
Contemporanee.
Zarrillo et al., International Journal on Emerging Technologies 11(4): 240-246(2020) 246
V. CONCLUSION
IoT systems applied to architectural design can bring innumerable advantages, for example by helping to design energy-efficient buildings, with a view to sustainable development and increasing sensitivity to the issue of energy saving. Adaptive architecture, by its nature, adapts to the place in which it is inserted to respect its characteristics and reap the benefits. For example, it uses the natural elements of a given site to create comfortable and thermally efficient buildings, minimizing the active use of the systems, in favor of passive design. Thanks to the use of the Internet of Things systems, it is possible to monitor and manage buildings that are intelligent both from an energy and adaptive point of view, being able to adapt to the changing needs of users. This theme is highly current if we consider that construction is one of the most polluting sectors for our planet.Most of the CO2 emissions come precisely from winter heating and summer cooling systems in buildings. National environmental Italian dataand information are reported by ISPRA (IstitutoSuperioreper la Protezionee la Ricerca Ambientale) [16]. In the state of the art, smart buildings are mainly based on two systems: smart lighting, to regulate light levels, and the HVAC system (Heating, Ventilation, and Air Conditioning). IoT sensors play a fundamental role, which allows the interconnection of objects and systems. By combining the principles of adaptive architecture and the benefits of new digital technologies, it will be possible, shortly, to obtain even smarter buildings that can manage energy independently and optimally and provide the best possible comfort. VI. FUTURE SCOPE The research presented is the first step of a larger project which will be implemented in the coming years. For the foreseeable future, the analyzes already made will be developed. The study will be improved byconsidering the form of the building. The form is very important for understanding how air circulates in the building.Other case studies will be used to understand how different architectural forms can influence natural air circulation.The MAXXI building has a very articulated shape, therefore it is necessary to deepen this study, taking such a specific form into account. Moreover,theanalysis will be enhanced considering other information. The average wind velocity, the rainfall height, and the prevailing wind direction will be compared with the average temperatures of the 2019 calendar year. Knowing the temperature, one will have more information on the air circulation. Furthermore, the results obtained from this study, implemented with new data, can be related to an IoT system that controls the window opening and closing to regulate the circulation of indoor air. Conflict of Interest. It is confirmed that no one of the authors has any conflict of interest associated with the publication of this paper.
REFERENCES
[1]. Desouza, P., Anjomshoaa, A., Duarte, F., Kahn, R., Kumar, P., & Ratti, C. (2020). Air quality monitoring using mobile low-cost sensors mounted on trash-trucks: Methods development and lessons learned. Sustainable Cities and Society, 60. [2]. Fernández-Serrano, M. (2017). La infraestructuraespacial de YonaFriedman. La utopíadibujada. EGA Revista de Expression GraficaArquitectonica, 22(30): 52-61. [3]. Hernández, J. (2015). Del fun palace al generator: Cedric price y la concepción del primer edificiointeligente. ARQ (Santiago), 90: 48-57. [4]. Park, P., Gilbert, M., Tyas, A. and Popovic-Larsen, O., (2012). Potential use of structural layout optimization at the conceptual design stage. International Journal of Architectural Computing, 10(1): 13-32. [5]. Schwab, K. (2015, December) The Fourth Industrial Revolution: What It Means and How to Respond. ForeignAffairs, Anthology Series, The Fourth Industrial Revolution. URL: https://www.foreignaffairs.com/articles/2015-12-12/fourth-industrial-revolution? fa_anthology=1116078 [6]. Chin, J., Callaghan, V. and Ben Allouch, S., (2019). The Internet-of-Things: Reflections on the past, present and future from a user-centered and smart environment perspective. Journal of Ambient Intelligence and Smart Environments, 11(1): 45-69. [7]. Minutolo, V., Cerri, E., Coscetta, A., Damiano, E., De Cristofaro, M., Di Gennaro, L., Esposito, L., Ferla, P., Mirabile, M., Olivares, L. andZona, R., (2020). NSHT: New smart hybrid transducer for structural and geotechnical applications.Applied Sciences, 10(13): 4498. [8]. Minutolo, V., Di Ronza, S., Eramo, C., Ferla, P., Palladino, S. and Zona, R., (2019). The use of destructive and non-destructive testing in concrete strength assessment for a school building. International Journal of Advanced Research in Engineering and Technology, 10(6): 252-267. [9]. Di Ronza, S., Eramo, C., Minutolo, V., Palladino, S., Totaro, E., Ferla, P., Zona, R., Ronga, T. and Pomicino, C. (2020). Experimental tests on gully tops and manhole TOPS devices according to EN124 standard. International Journal of Advanced Research in Engineering and Technology, 11(2): 276-295. [10]. Palladino, S., Esposito, L., Ferla, P.,Totaro, E., Zona, R. and Minutolo, V. (2020). Experimental and Numerical Evaluation of Residual Displacement and Ductility in Ratcheting and Shakedown of an Aluminum Beam. Applied Sciences, 10(10): 3610. [11]. Zona, R., Esposito, L., Ferla, P., Palladino, S., Totaro, E., and Minutolo, V., (2020). Lower Bound Limit Analysis of Parabolic Domes Based on Spherical Analytical Solution. International Journal of Advanced Research in Engineering and Technology, 11(6): 59-79. [12]. Schnädelbach, H. (2016). Adaptive Architecture. Interactions, Association for Computing Machinery, 23(2): 62-65. [13]. Mozer, M., (2005). The Adaptive House. Colchester, UK: IET. [14]. Sense, F., Jastrzembski, T., Mozer, M. C., Krusmark, M. and van Rijn, H. (2019). Perspectives on computational models of learning and forgetting. Proceedings of the Seventeenth International Conference on Cognitive Modeling (53--58). State College, PA: Applied Cognitive Science Lab. [15]. Beaver, J., Boucher, A. and Pennington, S. (2007). The curious home. London, UK: Goldmiths University of London. [16]. ISPRA, (2020). Annuariodei Dati Ambientali: Edizione 2019. Roma, IT:ISPRA - Area Comunicazione.
How to cite this article: Zarrillo, A., Ferla, P., Larsen, O. P., Castriotto, C., Browne, X. and Minutolo, V. (2020). New Digital Technologies Applied to Architectural Design using Big Data Analysis. International Journal on Emerging Technologies, 11(4): 240–246.
Related Documents