Bolide impact and long- and short term environmental change across the Cretaceous-Paleogene boundary Johannes Vellekoop Utrecht Studies in Earth Sciences No. 73 LPP Contribution Series No. 41

Welcome message from author
This document is posted to help you gain knowledge. Please leave a comment to let me know what you think about it! Share it to your friends and learn new things together.
Transcript

Bolide impact and long- and short term environmental change across the
Cretaceous-Paleogene boundary
Johannes Vellekoop
Utrecht Studies in Earth Sciences No. 73
LPP Contribution Series No. 41

ISBN 978-90-6266-385-9ISSN 2211-4335
USES No. 73LPP Contribution Series No. 41
Author contact: [email protected]
Cover: Artist impression of the impact at the K-Pg boundary. Paleogeographical reconstruction modified from Scotese and Dreher (2012)
Copyright © 2015 Johannes Vellekoop
Niets uit deze uitgave mag worden vermenigvuldigd en/of openbaar gemaakt door middel van druk, fotokopie of op welke andere wijze dan ook zonder voorafgaande schriftelijke toestemming van de uitgevers.
All rights reserved. No part of this publication may be reproduced in any form, by print or photo print, microfilm or any other means, without written permission by the publishers.
Printed in the Netherlands by WPS, Zutphen.

Bolide impact and long- and short term environmental change
across the Cretaceous-Paleogene boundary
Bolide-inslag en lange- en korte termijn milieuveranderingenover de Krijt-Paleogeengrens heen
(met een samenvatting in het Nederlands)
Proefschrift
ter verkrijging van de graad van doctor aan de Universiteit Utrecht op gezag van de rector magnificus prof. dr. G.J. van er Zwaan, ingevolge het besluit van het college voor promoties in het
openbaar te verdedigen op
dinsdag 14 januari 2015 des ochtends te 10.30 uur
door
Johannes Vellekoop
geboren op 4 mei 1987 te Smilde

Promotoren:
Prof. dr. H. BrinkhuisProf. dr. ir. J.S. Sinninghe Damsté
Copromotor:
Dr. B. van de Schootbrugge

Members of the dissertation committee:
Prof. dr. Robert P. Speijer Katholieke Universiteit Leuven, Belgium
Prof. dr. Dick KroonUniversity of Edinburgh, United Kingdom
Prof. dr. Lucas LourensUniversiteit Utrecht, the Netherlands
Prof. dr. Jörg ProssRuprecht-Karls-Universität Heidelberg, Germany
Prof. dr. ir. Stefan SchoutenKoninklijke NIOZ, Texel & Universiteit Utrecht, the Netherlands

“Ex Libro Lapidum Historia Mundi” Walter Alvarez

7
Contents
9 Chapter 1General Introduction and Synopsis
19 Chapter 2Geochemical and paleontological characterization of a new K-Pg Boundary locality from the Mudurnu-Göynük Basin, NW TurkeySanem Açikalin, Johan Vellekoop, Faruk Ocakoğlu, İsmail. Ö. Yilmaz, Jan Smit, Sevinç Ö. Altıner, Steven Goderis, Hubert Vonhof, Robert P. Speijer, Lineke Woelders, Eliana Fornaciari and Henk BrinkhuisCretaceous Research 51, 251-267 (2015)
57 Chapter 3Rapid short-term cooling following the Chicxulub impact at the Cretaceous-Paleogene boundary Johan Vellekoop, Appy Sluijs, Jan Smit, Stefan Schouten, Johan W. H. Weijers, Jaap S. Sinninghe Damsté and Henk Brinkhuis PNAS 111 (21) 7537-7541 (2014)
89 Chapter 4Palynological evidence for prolonged cooling along the Tunisian continental shelf following K-Pg boundary impactJohan Vellekoop, Jan Smit, Bas van de Schootbrugge, Johan W.H. Weijers, Simone Galeotti, Jaap S. Sinninghe Damsté and Henk Brinkhuis(under review for Palaeogeography, Palaeoclimatology, Palaeoecology)
121 Chapter 5Cretaceous-Paleogene boundary environmental crisis and recovery in the Mudurnu-Göynük Basin, NW TurkeyJohan Vellekoop, Lineke Woelders, Sanem Açikalin, Jan Smit, Bas van de Schootbrugge, Ismail, Ö. Yilmaz, Robert P. Speijer, and Henk Brinkhuis(to be submitted)

8
141 Chapter 6End Cretaceous bolide impact-induced sea surface temperature changes along the New Jersey Shelf, eastern USAJohan Vellekoop, Selen Esmeray-Senlet, Kenneth G. Miller, Jim Browning, Appy Sluijs, Bas van de Schootbrugge, Jaap S. Sinninghe Damsté and Henk Brinkhuis(to be submitted)
175 Chapter 7Reconstructing sea level change across the Cretaceous-Paleogene boundary intervalJohan Vellekoop, Jaap S. Sinninghe Damsté and Henk Brinkhuis(to be submitted)
197 References
213 Samenvatting in het Nederlands (Summary in Dutch)
219 Dankwoord (Acknowledgements)
223 Curriculum Vitae

99
GENERAL INTRODUCTION AND SYNOPSIS
CHAPTER I
General Introduction and Synopsis

1010
CHAPTER I

1111
GENERAL INTRODUCTION AND SYNOPSIS
1. RationaleThe Cretaceous-Paleogene (K-Pg) boundary mass extinction, ~66 million years ago, was one of
the most devastating events in the history of life, marking the end of the dinosaur era (Bambach, 2006). It is generally known as the last of the ‘big five’ mass extinctions in Earth’s history (see Fig. 1; Newell, 1963; Raup and Sepkoski, 1982; Benton, 1995) and is now widely acknowledged to be related to the global environmental consequences of the impact of an asteroid with a diameter of ~10 km, at present day Chicxulub, Mexico (Alvarez et al., 1980; Smit and Hertogen, 1980; Schulte et al, 2010). Evidence for this impact e.g. consists of a worldwide ejecta layer at the K-Pg boundary transition, characterized by anomalous concentrations of iridium and other platinum group elements, with nickel-rich spinel bearing microkrystites and shocked quartz (Smit, 1999; Schulte et al., 2010) and the discovery of a large impact structure on the Yucatan peninsula in Mexico (Hildebrand et al, 1991). After decades of research, international scientific focus shifted from the reality of such impacts to the effects of impacts on the global environmental system and ecological and biological recovery after such a major environmental crisis (e.g., Brinkhuis et al., 1998; Galeotti et al., 2004; Kring, 2007).
An unique aspect of the K-Pg boundary is the timescale at which these events occurred. The K-Pg boundary catastrophe can be regarded as one of the most rapid events in the history of life. It likely involved a sequence of regional to global catastrophes, such as earthquakes, tsunami’s, a so-called ‘fireball-stage’ with ensuing global wildfires, ozone layer destruction, severe acid rain and a global impact winter resulting from dust and sulphate aerosols that were ejected into the stratosphere (Kring, 2007). This impact dust was either directly emplaced in the stratosphere due to the force of the expanding impact‐explosion plume (Melosh and Vickery, 1991), and/or transported by means of a hypothesized so‐called ‘hypercanes’, super‐hurricanes supposedly capable of injecting large amounts of aerosols in the stratosphere (Emanuel et al., 1995). All models predict a resulting
Figure 1The genus extinction intensity, i.e. the fraction of marine genera that are present in each interval of time but do not exist in the following interval. The data are from Rohde and Muller (2005) and are based on the Raup and Sepkoski (1982). Courtesy of Robert A. Rohde.
Million years ago
% e
xtin
ctio
n m
arin
e ge
nera
Paleozoic Mesozoic Cenoz.Cm O S D C P Tr J K Pg N60
50
40
30
20
10
0 541 500 450 400 350 300 250 200 150 100 50 0

1212
CHAPTER I
short-lived severe drop in global surface temperatures, the so-called ‘impact winter’. The various scenarios suggest that this period, characterized by darkness and dramatic cooling, may have lasted anywhere between six months to more than a decade. Such a global impact winter would have perturbed the Cretaceous climate and likely represented a major stress factor for life on Earth. Therefore, it is expected to have been a key contributing element in the mass extinction at the K-Pg boundary
These short-lived catastrophes were followed likely by long-term consequences of the K-Pg boundary impact. CO2 produced from Chicxulub target lithologies and the projectiles may be expected to have caused greenhouse warming once the dust, aerosols and soot particles settled (Kring, 2007), resulting in significant and rapid global climate change (Galeotti et al., 2004, Coxall et al., 2006). The crash of photosynthetic organisms at the K-Pg boundary and widespread destruction of vegetation likely slowed down drawdown of the CO2 and, therefore, this post impact greenhouse phase may have lasted several tens of thousands of years at least (Brinkhuis et al., 1998; Kring, 2007).
Furthermore, the large-scale extinctions amongst primary producers must have caused rearrangements of the pelagic oceanic ecosystems, a major restructuring of global food webs and global carbon cycling (D’Hondt, 2005; Coxall et al., 2006). A collapse in the oceanic stable carbon isotope gradient between surface and bottom persisted for 1-3 million years (Zachos et al., 1989; Kump, 1991), likely reflecting a reduced/different carbon delivery to the ocean floor (D’Hondt et al., 1998; D’Hondt, 2005). It has been suggested that in the post-extinction ocean a smaller fraction of marine production sank to the deep waters (D’Hondt et al., 1998). This reduction in the organic flux to deep waters might be a consequence of the ecosystem reorganization that resulted from the mass extinction. A general absence of large pelagic grazers (such as macrozooplankton and fish) or a shift in dominance from grazers that create fecal pellets (fish) to grazers that do not (e.g., jellyfish) could have greatly reduced the packaging of biomass into the large particles that sank to the deep ocean (D’Hondt, 2005).
These global climatic and biotic effects of the K-Pg boundary bolide impact occurred superimposed on long-term background environmental changes unrelated to the impact event. Reconstructions of Cretaceous-Paleogene climates have resulted in a general picture of rather equable conditions, with a much reduced equator-to-pole temperature gradient than today. In these warm, equable climates, temperatures characteristic of the tropics extended into mid-latitudes and Polar regions experiencing temperate conditions (Huber et al., 1995; Clarke and Jenkyns, 1999; Huber et al., 2002; Donnadieu et al., 2006; Hay, 2008; Hollis et al., 2012; Hunter et al., 2013). One of the long-term (>100 kyr) climatic changes across the K-Pg boundary interval is climatic warming potentially related to volcanic outgassing during phases of extensive volcanism of the Deccan Traps Large Igneous Province in present-day India (Courtillot et al., 1986 Kucera and Malmgren, 1998; Olsson et al., 2001; Olsson et al., 2002). These eruptive phases are indicated by major shifts in osmium and strontium isotope records, consistent with increased basaltic weathering (Li and Keller, 1999; Olsson et al., 2002; Dessert et al., 2001).
The end-Cretaceous greenhouse world was characterized by high eustatic sea-levels, resulting in large epicontinental seas spreading on nearly all continents (Scotese et al., 2004; Müller et al., 2008; see Fig. 2). The late Maastrichtian to early Paleocene interval nevertheless appears to be marked by enigmatic long-term changes in relative sea level (Habib et al., 1992; Macleod and Keller, 1991; Adatte et al., 2002; Miller et al., 2005; Schulte et al., 2006; Kominz et al., 2008), resulting in varying expression and stratigraphic completeness of marginal marine K-Pg successions

1313
GENERAL INTRODUCTION AND SYNOPSIS
(Macleod and Keller, 1991; Adatte et al., 2002), complicating accurate and complete portrayal of the climatic and biotic changes across the K-Pg boundary.
To understand the true extent of the K-Pg boundary impact-related environmental perturbations, the effects of the impact need to be disentangled from these ongoing, long-term environmental changes. However, although decades of K-Pg boundary studies have brought important information, studies detailed and quantified enough to elucidate possible impact-provoked global environmental change mechanisms, or to test various proposed aftermath scenarios are still lacking (Kring, 2007), as the documentation both impact-related as well as long-term environmental K-Pg changes is still scarce. Therefore, the three main goals of this thesis are to (1) document short-term (centennial/millennial) regional and global climatic, oceanographic and biotic changes following the K-Pg boundary impact, (2) document the ecological succession and long-term biotic recovery following the K-Pg boundary catastrophe and (3) present these changes in a context of long-term background environmental change.
2. ApproachIn the past decades, a variety of different biological and geochemical proxies have been applied
in an attempt to further unravel the transient global changes and carbon cycle perturbation across the K-Pg boundary (Brinkhuis et al., 1998; Adatte et al., 2002a; Gardin, 2002; Hollis et al., 2003; Galeotti et al., 2004). Each of the applied proxies has its strengths as well as its weaknesses. Therefore, in this thesis a multi-proxy approach is applied, combining different tools and techniques.
While major extinctions amongst traditional proxy-carriers such as planktic foraminifera hamper accurate paleoenvironmental reconstructions across the K-Pg boundary, organic-walled cyst-producing dinoflagellates were hardly affected by the K-Pg crisis (Brinkhuis and Zachariasse, 1988). Brinkhuis et al. (1998) demonstrated that quantitative analysis of organic-walled cysts of
Figure 2A paleogeographic reconstruction of the Earth during the latest Cretaceous-earliest Paleogene; modified after Scotese and Dreher (2012). Brown indicates plateaus and mountainous areas, green indicates lowlands, light blue indicates shallow waters and dark blue represents deeper, oceanic waters.

1414
CHAPTER I
temperature-sensitive dinoflagellates may be applied in testing models of the environmental effects of the K-Pg impact. Records of migration of higher latitude taxa towards lower latitudes across the K-Pg boundary suggest that the K-Pg impact resulted in millennial scale oceanographic changes, likely related to a brief ‘impact winter’ phase. Yet, these migrations have so far not been confirmed by other studies and it is unknown how and if they might be related to climate fluctuations independent of the impact event. Furthermore, previous dinocyst studies suggest a subsequent increase in abundances of lower latitude dinoflagellate cysts just above the K-Pg boundary, interpreted to indicate >10 Kyrs of marked climatic warming following the K-Pg boundary impact winter (Brinkhuis et al., 1998). Regionally, however, such signals may have been dampened by the longer termed effect of the initial cooling resulting in sustained declining surface and intermediate water temperatures as argued by Galeotti et al. (2004). Previous marine palynological studies also portray enigmatic sea level changes across the K-Pg boundary interval (e.g. Habib et al., 1992), showing conspicuous lowering of sea level across the boundary, and marked transgression shortly after, resulting in varying expression and stratigraphic completeness of marginal marine K-Pg successions (Macleod and Keller, 1991; Adatte et al., 2002), complicating accurate and complete portrayal of the climatic and biotic changes across the K-Pg boundary. However, the degree of stratigraphic completeness is now resolvable using combined dinocyst and planktic foraminiferal biostratigraphies.
From the above it becomes clear that quantitative marine palynology can serve to recognize and document K-Pg boundary environmental perturbations, as well as ongoing ‘background’ environmental change, including the global sea level history across K-Pg boundary. It is particularly effective when dealing with the critical, relatively nearshore settings, characterized by high accumulation rates, which likely yield most relevant information pertaining to e.g., sea level dynamics and surface salinity, temperature and productivity, and potential leads and lags between them. Therefore, in this thesis we focus on K-Pg boundary records in ancient shallow marine settings, as these are generally characterized by high sedimentation rates and therefore allow a high temporal resolution (e.g. Brinkhuis et al., 1998).
Similar to studies using stratigraphically expanded sections of the Paleocene‐Eocene Thermal Maximum (Sluijs et al., 2008), (sub‐)millennial scale ecological and climatological dynamics can be resolved employing sections across the K-Pg boundary interval. Yet, very few studies of this type have been carried out across the K-Pg boundary so far, leading to a poor global coverage. In addition, although dinocyst analysis can reveal distinct trends in environmental parameters, quantification of such trends and values is not possible using only palynology. Organic geochemical techniques can, however, provide valuable additional insights in biological and environmental changes across the K-Pg boundary (e.g. Yamamoto et al., 1996) and enable the quantification of these changes. Recently, a novel technique has been developed for reconstructing absolute mean annual sea surface temperature based on distributions of Glycerol Dialkyl Glycerol Tetraether (GDGT) lipids derived from pelagic archaea in the ocean: the TEX86 index (an index of tetraethers consisting of 86 carbons; Schouten et al., 2002). This organic biomarker technique is based on the analysis of the distribution of archaeal tetraether membrane lipids in sediments (Schouten et al., 2002) and has been successfully applied in deep time (e.g. Jenkyns et al., 2004; Forster et al., 2007), notably when integrated with marine palynology (e.g., Sluijs et al., 2006; Van Helmond et al., 2013). Moreover, organic biomarker indices such as the Branched and Isoprenoid Tetraether (BIT) index can also be employed to reconstruct relative sea level changes (e.g., Menot et al., 2006; Sluijs et al., 2008). However, no high-resolution GDGT-based studies have previously been carried out across the K-Pg boundary. Combining palynological and organic geochemical analyses

1515
GENERAL INTRODUCTION AND SYNOPSIS
can therefore substantially improve our understanding of short- and long term biological and environmental changes across the K-Pg boundary.
3. SynopsisIn this thesis we thus employ mainly ‘organic tools’, i.e., quantitative dinocyst analysis (marine
palynology) and GDGT-based proxies to provide new insights into the long- and short term climatic and biotic effects of the bolide impact at the Cretaceous-Paleogene boundary.
Only by employing sedimentary records that are both stratigraphically expanded and stratigraphically complete, we can substantially improve our understanding of short-term biological and environmental changes across the K-Pg boundary and allow a detailed discrimination between impact-induced and other, long-term changes. It is essential to provide a truly global coverage of the environmental history across the impact horizon. In our quest finding suitable sites, we also focused on regions where K-Pg sites are rare, so far. Therefore, in Chapter 2 a new K-Pg boundary locality is presented, providing a geochemical and paleontological characterization of a new, stratigraphically complete K-Pg boundary site in the Mudurnu-Göynük Basin in Turkey, representing a geographic region with poor coverage. This chapter discusses the calcareous nannofossil, planktic foraminiferal and organic-walled dinoflagellates cyst biostratigraphy of the K-Pg boundary and the classical geochemical K-Pg boundary markers; siderophile trace elements, including Ir and other platinum group elements (PGEs) and stable carbon isotopes.
In Chapter 3 the short-term climatic effects of the K-Pg boundary impact are investigated using a key, stratigraphically expanded section at mid latitudes. In this chapter we are able to reconstruct sea surface temperature changes across the K-Pg boundary interval at an up to now unsurpassed temporal resolution, using TEX86 paleothermometry of sediments from the Brazos River section, Texas, USA. We document a substantial (i.e. >7 degrees C) decline in sea surface temperature during the first months to decades following the impact event. We interpret this cold spell to reflect the first direct evidence for the effects of the formation of dust and aerosols by the impact and their injection in the stratosphere, blocking incoming solar radiation. This ‘impact winter’ was likely a major driver of mass extinction because of the resulting global decimation of marine and continental photosynthesis.
In Chapter 4, the short-term (millennial) biological consequences of the K-Pg boundary climate change are evaluated. We performed a high-resolution marine palynological study on a closely spaced sample set from the Elles section in Tunisia, in order to generate a paleoenvironmental and paleoclimatic record across the K-Pg boundary to allow verification and refinement of environmental changes earlier reported from the nearby El Kef K-Pg boundary Global Stratotype Section and Point (GSSP). The well-preserved and diverse dinocyst assemblages at Elles show strong fluctuations similar to the El Kef record. The dinocyst record form Elles, therefore, confirms the earlier recorded signals, showing regionally consistent rapid changes. These records show a mild, gradual cooling trend in the latest Maastrichtian and the onset of relative sea level fall. Within the immediate post-extinction interval, the first millennia following the impact, dinocyst assemblages reveal multiple incursions of higher-latitude dinocyst species, implying repeated pulses of cooling. These results signify that the earliest Danian climatic and environmental conditions were relatively unstable across the Tunisian shelf.
In Chapter 5 the short- and long-term biological recovery following the K-Pg boundary catastrophe is further evaluated. In order to enable reconstructions of pre- and post-impact marine environmental conditions across the K-Pg boundary using microfossils, focus should be on those groups which did not experience extinction, like benthic foraminifera and organic-cyst

1616
CHAPTER I
producing dinoflagellates (dinocysts). Therefore, in this chapter we integrate dinocyst and benthic foraminiferal records of the recently discovered, stratigraphically expanded Okçular and Göynük North sections in Northwestern Turkey to reveal how the K-Pg boundary biotic crisis affected surface and bottom conditions, in a Tethyan-wide context. Our results indicate that during the initial post-impact phase, the collapse of export productivity likely resulted in a recycling of nutrients in the photic zone. This caused lower nutrient availability on the sea floor and higher nutrient availability for the earliest Paleocene planktic community.
In Chapter 6, the evidence for a so-called ‘impact winter’ following the K-Pg impact is verified and presented in the context of long-term climate change. To arrive at this, we employed high resolution marine palynology and the TEX86 sea surface temperature (SST) proxy on four stratigraphically expanded cores from the New Jersey Shelf, eastern USA, spanning the K-Pg boundary. This new record reveals long-term climate change related to Deccan Traps volcanism and confirms the brief impact winter phase immediately following the K-Pg impact.
In Chapter 7, the enigmatic long-term sea level changes across the K-Pg boundary interval are investigated. In this chapter, we compare sedimentological, palynological and organic geochemical records from some of the most well-known marginal marine K-Pg boundary sections worldwide: Elles El Kef (Tunisia), Stevns Klint (Denmark), New Jersey (USA), Brazos River (USA), Mid-Waipara River (New Zealand) and Bajada del Jaguël (Argentina). Collectively, these records point towards globally synchronous, long term sea level change. The evidence suggest that a synchronous global maximum flooding occurred in the latest Maastrichtian, followed by a relatively strong regression across the K-Pg boundary, reaching a lowstand in the early Danian. This episode is followed by a marked marine transgression globally. These long-term globally synchronous relative sea level changes are unrelated to the K-Pg impact. These fluctuations are matched by available benthic δ18O records, suggesting a link between temperature and sea level.
In summary, this thesis provides a detailed image of the long-term environmental changes across the K-Pg boundary interval and of the superimposed, regional and global climatic and biotic effects of the K-Pg boundary bolide impact. This impact was one of the most devastating events in the history of life, resulting in a sequence of regional and global catastrophes, including tsunami’s, a ‘fireball‐stage’ and a subsequent global impact winter, resulting from dust and sulphate aerosols that were ejected into the atmosphere. This impact winter, characterized by darkness and cooling, likely was a major driver of mass extinction because of the resulting global decimation of photosynthesis. The extinctions resulted in decreased export of organic matter from the photic zone to the sea floor and more nutrients becoming available for the surviving phytoplankton groups, including dinoflagellates. The evolutionary recovery of phyto- and zooplankton communities took hundreds of thousands to a few million years, showing that the rapid and short-lived K-Pg boundary disaster had exceptionally long-lasting consequences. The impact and resulting extinctions caused a major perturbation of the global carbon cycle and significant global climate change. Long-term climate changes nevertheless differed substantially between sites due to differences in oceanographic settings. These climatic and biotic consequences of the K-Pg boundary impact occurred superimposed on a long-term sea level regression and global cooling trend unrelated to the impact.

1717
GENERAL INTRODUCTION AND SYNOPSIS

18

1919
A NEW K-PG BOUNDARY LOCALITY IN THE MUDURNU-GÖYNÜK BASIN
CHAPTER II
Geochemical and paleontological characterization of a new K-Pg Boundary locality from the Northern branch of the Neo-Tethys: Mudurnu – Göynük Basin, NW Turkey

2020
CHAPTER II

2121
A NEW K-PG BOUNDARY LOCALITY IN THE MUDURNU-GÖYNÜK BASIN
AbstractA Cretaceous-Paleogene (K-Pg) succession is studied in detail in the Mudurnu-Göynük basin in northwestern Turkey. To characterize the K-Pg transition in this basin, two stratigraphic sections were measured and sampled at high resolution: the Okçular and the Göynük North sections. These sections were analysed for siderophile trace elements, including Ir and other platinum group elements (PGE: Ru, Rh, Pd, Ir, Pt), bulk stable carbon isotopes, calcareous nannofossils, planktic foraminifera and organic-walled dinoflagellate cysts (dinocysts). In this basin, the upper Maastrichtian consists of monotonous grey mudstones, mostly intercalated with turbidites and the basal Danian is characterised by grey mudstones, overlain by a rhythmic alternation of limestones and mudstones. The K-Pg boundary is marked by a thin, reddish ejecta layer, characterized by an enrichment of PGE and an abrupt negative shift in bulk carbonate δ13C. This ejecta layer is followed by 15 – 17 cm of thick darker, clayey mudstone, the so-called boundary clay. The upper Maastrichtian to lower Danian interval displays a succession of biostratigraphic events, such as the globally recognized spike of the dinocyst taxon Manumiella druggii in the Maastrichtian, followed by the extinction of Cretaceous planktic foraminifera at the K-Pg boundary, and a subsequent rapid succession of First Occurrences (FOs) of dinocysts, such as Senoniasphaera inornata, Membranilarnacia? tenella and Damassadinium californicum and planktic foraminifera, including Parvularugoglobigerina eugubina and Subbotina triloculinoides in the lower Danian. Overall the sedimentological and paleontological data suggest that the studied sites in the Mudurnu-Göynük basin were deposited under normal marine conditions, likely in an outer neritic to upper bathyal environment. Our geochemical and biostratigraphic characterization of the K-Pg boundary transition in the Mudurnu-Göynük basin provides a new K-Pg boundary record in the Northern branch of the Neo-Tethys and allows a detailed comparison with K-Pg boundary sections worldwide.

2222
CHAPTER II

2323
A NEW K-PG BOUNDARY LOCALITY IN THE MUDURNU-GÖYNÜK BASIN
1. IntroductionThe Cretaceous-Paleogene (K-Pg) boundary, ~66 million years ago, is characterized by one of
the largest mass extinction events in the Phanerozoic (Alroy, 2008; Bambach, 2006). This biotic transition has been known for more than a century (e.g. Phillips, 1860; Hancock, 1967) but the causes for the extinctions have been debated over for a long time. The discovery of anomalously high concentrations of iridium (Ir) and other platinum group elements (PGE) at the K-Pg boundary transition provided the first evidence for an extraterrestrial cause (Alvarez et al., 1980; Smit and Hertogen, 1980). Subsequently, a worldwide ejecta layer with Ni-rich spinel bearing microkrystites and shocked quartz was also found at the K-Pg boundary (Smit, 1999) and a large impact structure (Chicxulub) dating from the K-Pg transition was discovered on the Yucatan peninsula in Mexico (Hildebrand et al, 1991). Despite these multiple lines of evidence, alternative hypotheses for the cause of this mass extinction have been proposed over the last decades. Generally, these alternatives focus on the association of the K-Pg boundary either with multiple impacts and/or with large-scale volcanism during the latest Cretaceous; in the form of the Deccan Traps Large Igneous Province (Keller et al. 2012; Chenet et al., 2009).
Nowadays, there is broad consensus that the K-Pg boundary mass extinction event is related to the impact of a large extraterrestrial body at Chicxulub (Schulte et al, 2010). This impact was one of the most devastating events in the history of life, as it resulted in a sequence of regional and global catastrophs, such as earthquakes, tsunami’s, a so-called ‘fireball‐stage’ with ensuing global wildfires, ozone layer destruction, severe acid rain and a global impact winter resulting from dust and sulphate aerosols that were ejected into the atmosphere (Kring, 2007; Vellekoop et al., 2014). In addition, water and CO2 were produced from Chicxulub target lithologies and the projectile, which could have caused greenhouse warming after the dust, aerosols and soot settled (Kring, 2007). The impact has also been suggested to have caused a major perturbation of the global carbon cycle and significant global climate change (Galeotti et al., 2004, Coxall et al., 2006; Vellekoop et al., 2014).
A unique aspect of the K-Pg boundary catastrophe is the timescale at which these events occurred. The K-Pg boundary catastrophe can be regarded as one of the most rapid events in the history of life. Altough numerous studies provide evidence for the K-Pg boundary impact, its consequences for the global carbon cycle are still under debate (e.g. Coxall et al., 2006). Especially the fast, millennial-scale biotic and climatic responses to this rapid event are poorly understood. Only extensive study of the global sedimentary and fossil record can substantially improve our understanding of important biological and environmental changes across the K-Pg boundary, allowing a better discrimination between impact-induced and other, continuous changes.
In the past decades, a variety of different proxies has been applied in an attempt to further unravel the transient global changes and carbon cycle perturbation across the K-Pg boundary (Brinkhuis et al., 1998; Adatte et al., 2002a; Gardin, 2002; Hollis et al., 2003). Many of these studies were focused on specific regions with abundant sedimentary records of the K-Pg boundary transition. Two of these regions that have been studied intensively are Northern Europe, i.e. the ‘Boreal’ paleogeographic region (e.g. Denmark, The Netherlands, Poland), characterized by a temperate climate at the time of impact, and the Mediterranean, i.e. the Western Tethys (e.g. Tunisia, Southern Spain, Israel), characterized by a subtropical climate during the K-Pg. Several studies have shown that the K-Pg boundary event resulted in migrations of planktic and benthic biota between these regions, likely signifying strong climatic responses to the bolide impact (Brinkhuis et al., 1998; Galeotti and Coccioni, 2002). The exact extent of these migrations is nevertheless poorly understood because only few records are available from the transitional zone

2424
CHAPTER II
between the ‘Boreal’ and Western Tethys paleogeographic regions. An example of a region that is within this transitional zone is the northern branch of the Neo-Tethys. Unfortunately, only few localities are available in this region and most of these are characterized by a condensed boundary interval or hiatus (e.g. Adatte et al., 2002b; Gedl, 2004; Egger et al., 2009), inhibiting high-resolution studies. This signifies the need for additional K-Pg boundary records in the northern branch of the Neo-Tethys. Amongst the potential regions for such new high-resolution records is the Mudurnu-Göynük Basin in the Central Sakarya Region, Turkey. Recently, a well-preserved K-Pg boundary transition was discovered in this basin, which is described for the first time in this paper.
2. Geological SettingThe study area is located in the Mudurnu – Göynük Basin in the Central Sakarya Region,
Turkey (Fig. 1). Given its key location in reconstructing the regional geological history, and the presence of outcrops of both Paleo- and Neo-Tethys and continuous successions from the Jurassic to the Miocene, this region has attracted considerable attention since the 1930’s (e.g. Foley, 1938; Stchepinsky, 1940; Şengör and Yılmaz, 1981; Göncüoğlu et al, 2000; Yılmaz et al, 2010). At the beginning of the Jurassic, rifting started on the Sakarya continent – the continent which was bound by the Intra-Pontid Ocean to the north and the Izmir-Ankara Ocean, i.e. the Northern Branch of the Neo-Tethys, to the south – and continued till the Upper Cretaceous (Şengor and Yılmaz, 1981; Saner, 1980). The area became a fore-arc basin in the Turonian – Santonian due to northward subduction of the northern branch of Neo-Tethys (Saner, 1980).
The sedimentary succession of the basin starts on pre-Jurassic metamorphic basement rocks with Lower Jurassic volcanic andvolcanoclastic deposits (Şengör and Yılmaz, 1981) and continues with mainly shelf and pelagic carbonates with occasional turbidites until the Late Cretaceous (Yilmaz, 2008; Yılmaz et al, 2010, Altiner et al, 1991; Fig. 1). In the Late Cretaceous-Danian most of the basin was characterized by slope and basinal deposits (the Yenipazar and Tarakli formations; Saner, 1980; Altiner et al, 1991; Yılmaz et al, 2010).
An Albian-Campanian age was assigned to the Yenipazar Formation (Saner, 1980). It comprises mainly pelagic carbonates within the Albian-Santonian interval, but also turbiditic-volcano-turbiditic successions in the Cenomanian-Campanian (Saner, 1980; Altiner et al, 1991; Yılmaz et al, 2010). The Yenipazar Formation gradually passes to the Taraklı Formation, which is dominated by mudstones with occasional turbiditic sandstones and thin limestone/marl beds. In the study area these deposists represent the late Campanian, Maastrichtian and Danian. The studied Okçular and Göynük North sections comprise the Yenipazar and Taraklı formations. Superimposed on the Taraklı Formation is the Selvipınar Formation, which is characterized by shallow marine/reefal limestones and usually interpreted to have a middle Paleocene age (Şeker and Kesgin, 1991; Ocakoglu et al, 2007; Ocakoglu et al, 2009).
Across the Mudurnu-Göynük basin, the Taraklı Formation displays a very typical succession of alternating mudstones and limestone beds, in particular in the basal 20 m of the Danian succession. This succession comprises the K-Pg boundary transition and can be traced across the entire basin, over more than 150 km. This succession was examined in detail in two stratigraphic sections; the Okçular section (40°23’20.74”N, 30°59’23.04”E), measuring a thickness of 720 cm, and the Göynük North section (40°24’40.84”N, 30°46’42.68”E), measuring a thickness of 400 cm.

2525
A NEW K-PG BOUNDARY LOCALITY IN THE MUDURNU-GÖYNÜK BASIN
3. Material and methodsFor this study, three different sample sets have been used. The Okçular section was initially
sampled in 2006 for a basic stratigraphic pilot study with a m-scale resolution on a wider time span and after the K-Pg boundary succession was identified in this section, this interval was subsequently logged and sampled in more detail (mostly in dm-scale) in 2010. To increase the sample resolution at Okçular and identify additional K-Pg boundary sections in the basin, a third field campaign was carried out in 2011, involving high-resolution sampling of the Okçular and Göynük North sections (mm to cm-scale). At both localities the K-Pg boundary interval was sampled at a 1-2 cm resolution to attain a high temporal resolution. At the Okçular section the interval from 100 cm below the K-Pg boundary to 160 cm above the K-Pg boundary was sampled continuously. The samples from both sections were split for micropaleontological, palynological, stable carbon
ISTANBUL
50 km ESKISEHIR
Study areaC(Fig. 1 )
B
NORTH ANATOLIAN
FAULT ZONE
BURSA
BILECIKEskisehir Fault Zone
A
Alluvium(Quaternary)
Kizilçay Group(Paleocene-Lower Eocene)
Selvipinar Limestone(Paleocene-Lower Eocene)
Halidiye Formation(Lower-Middle Eocene)
Tarakli Formation(Maastrictian/Campanian-Danian)
Yenipazar Formation( )Albian-CampanianDeğirmenözü Member(Turonian-Campanian)
Mudurnu Formation(Hettangian-Callovian)
Soğukçam Limestone(Callovian-Aptian/Albian) Settlement
Anticline axis
Syncline axis
Göynük
0 5 km
Okcular section
Goynuk North section
C
Pre
JUR
AC
RET
AC
EOU
SPA
LEO
GEN
E
Basement Rocks
Mudurnu Fm
Soğukçam Lmst.
Yenipazar Fm( inc. Değirmenözü and Üzümlü Mbs.)
Tarakli Fm
Selvipinar lmst.Kizilçay Group
Halidiye Fm
Het
tang
ian-
Cal
lovi
anC
allo
vian
-A
ptia
n/A
lbia
nA
lbia
n/C
ampa
nian
Cam
p/M
aast
-D
ania
nPa
leoc
ene-
Eoce
ne
JUR
A
Paleogene depositsGalatian massif
Hettangian-Aptian sedimentsPre-Callovian deposits
Callovian-Aptian pelagic depositsAlbian-Maastrichtian flyschKarakaya
Tectonic Unit
Study area
0° 30°
20°
30°
40°
50°
Izmir-Ankara OceanIstanbul Zone
Sakarya Zone
Taurid-Anatolid
Platform
Deep marineShallow marineTerrestrial
Figure 1The genus extinction intensity, i.e. the fraction of marine genera that are present in each interval of time but do not exist in the following interval. The data are from Rohde and Muller (2005) and are based on the Raup and Sepkoski (1982). Courtesy of Robert A. Rohde.

2626
CHAPTER II
isotope and PGE analyses. For the age control of the Okçular and Göynük North sections different fossil groups were investigated. Low-resolution biostratigraphy using calcareous nannofossil and high-resolution biostratigraphy using planktic foraminifera and dinocysts were used to generate a detailed biostratigraphy for both sections. Distribution of samples positions throughout the studied sections is presented in the Figure 2.
The bulk carbonate carbon isotopic composition, determined for 411cm of the entire 720cm thick Okçular section was derived from 146 samples with a sample interval ranging between 1mm and 3cm. For the siderophile element determination, 10 samples were collected from the K-Pg boundary-bearing 80 cm of the Okçular section, but the PGE analysis focused on only 6 of these. The isotopic signature of the Göynük North Section is represented by fewer samples than the Okçular section. The 180 cm of the Göynük North section comprises 34 samples (with sample
Figure 2.Lithology and sample positions for calcareous nannoplankton, planktic foraminifera, palynological, bulk carbon isotope and Platinum Group Elemental analyses on the Okçular and Göynük North sections.
500
450
400
350
300
250
200
150
100
50
0
-50
-100
-150
-200
Okçular section
Dis
tanc
e fr
omK
-Pg
boun
dary
(cm
)
Lith
olog
y
PGEs
Plan
ktic
fo
ram
Din
ocys
t
Nan
no
Dis
tanc
e fr
omK
-Pg
boun
dary
(cm
)
350
300
250
200
150
100
50
0
-50
-100
-150
-200
Göynük North section
Lith
olog
y
δ13C
δ13C
Plan
ktic
fo
ram
s
Din
ocys
t
PGEs
Analyzed Samples
Analyzed samples MudstoneSandstoneLimestone
Boundary clayEjecta layerSecond reddish layer
A
B
Form
atio
nTa
rakl
i For
mat
ion
Age
Dan
ian
Maa
stri
chtia
n
Age
Form
atio
nTa
rakl
i For
mat
ionDan
ian
Maa
stri
chtia
n

2727
A NEW K-PG BOUNDARY LOCALITY IN THE MUDURNU-GÖYNÜK BASIN
spacing between 2 and 15 cm) for isotopic analysis while 7 samples were collected for siderophile element analysis of the 45 cm thick K-Pg boundary-bearing interval (Fig. 2).
3.1 PalynologysamplepreparationA total of 48 samples from the Göynük North section and 45 samples from the Okcular
section were processed following standard palynological processing techniques of the Laboratory of Palaeobotany and Palynology (Houben et al., 2011). Briefly, approximately 10 gram of each sample was crushed, oven dried (60°C), weighted and a known amount (10679, Standard Deviation 5%) of Lycopodium clavatum spores were added for quantification purposes. The samples were then treated with 10% HCl to remove carbonate components and 40% HF to dissolve the siliceous components. No heavy liquid separation or oxidation was employed. After each acid leaching step, samples were washed with water and centrifuged or settled for 24h and decanted. The residue was sieved over nylon mesh sieves of 250 μm and 15 μm and agglutinated particles or residue were broken up applying 5 minutes of ultrasound. From the residue of the 15-250 μm fraction, slides were made on well-mixed, representative fractions by mounting one droplet of homogenised residue and adding glycerine jelly. The mixture was homogenised and sealed. All slides are stored in the collection of the Laboratory of Palaeobotany and Palynology, Utrecht University.
For the present study, ~25-30 samples per site were studied for palynology. Palynomorphs were counted up to a minimum of 300 dinocysts. The taxonomy of dinocysts follows Fensome and Williams (2004), unless stated otherwise. A species list with taxonomic notes can be found in Supplementary Materials.
3.2 PlankticforaminiferapreparationThe samples of the pilot study on the initial Okçular section were processed at the Middle East
Technical University, whilst additional Göynük North and Okçular samples were processed at KU Leuven for foraminiferal studies, following standard micropaleontologic procedures. Rock samples were dried in a stove at 60°C for at least 24 hours. Depending on sample size, 4 to 60 grams of dry rock were soaked in a soda solution (50g/l Na2SO4). If necessary, the tenside Rewoquat was used to disintegrate strongly lithified samples. After disintegration, each sample was washed over 2 mm and 63-μm sieves. The dry residues were further sieved into three fractions: 63-125 μm, 125-630 μm and >630 μm. The two smaller fractions were intensively scanned for biostratigraphic marker taxa.
3.3 CalcareousnannofossilpreparationFor the calcareous nannofossil pilot study on the Okçular section, the samples were processed
at the Università degli Studi di Padova, Italy, following standard processing techniques for calcareous nannofossil analysis.
3.4 SiderophileelementsThe samples were prepared following the procedures described in Goderis et al. (2013). All
samples weighed between approximately 7 and 27 g, although sample masses of around 15 g were preferred to avoid nugget effects. The bulk rock samples were fragmented into smaller pieces, ground to powder with a corundum ball mill and thoroughly homogenized.
The concentrations of Cr, Co, and Ni were determined by ICP-MS, after acid digestion of approximately 100 mg of sample at Ghent University (Goderis et al., 2013). Each solution was measured twice and the mean concentrations are given in Supplementary Materials. Accuracy was assessed by analysis of certified reference materials BE-N (basalt; CRPG-CNRS, Nancy, France),

2828
CHAPTER II
PM-S (microgabbro; CRPG-CNRS), DNC-1 (dolerite; United States Geological Survey, USGS), and WPR-1 (peridotite; Canadian Certified Reference Material Project, CCRMP).
The concentrations of the PGE and Au were determined via a nickel-sulfide (NiS) fire assay sample preparation technique combined with ICP-MS, following the procedure described in detail in Goderis et al. (2013). The preferred use of large sample masses and external calibration versus a calibration curve ensures good analytical accuracy and reproducibility, relatively low limits of detection and quantification and simultaneous measurement of all PGE (except Os that volatilizes during the procedure applied). All solutions (of ~10 ml) obtained after NiS fire assay pre-concentration were analyzed twice for their PGE content by ICP-MS on separate measuring days. Next to the reference material TDB-1 (diabase) and WPR-1 (altered peridotite) from the CCRMP (certified and recommended; Govindaraju, 1994; Meisel and Moser, 2004), a spinel-bearing serpentinite UB-N from the Vosges Mountains in France that is distributed by the CRPG-CNRS (Nancy, France) for major and trace element analysis but characterized for PGEs (Meisel and Moser, 2004) and a K-Pg boundary ejecta layer at Stevns Klint (SK10) containing 34.7 ± 1.2 ng/g Ir (1s uncertainty) determined by several international laboratories applying neutron activation analysis (NAA) were used for method validation. Calculated uncertainties and values determined for reference materials can be found in Goderis et al. (2013).
3.4 StableisotopesStable carbon isotope analyses were conducted on bulk carbonate samples. The clean surfaces
of rock slabs were drilled with a dentist drill to obtain ~250 μg of powdered sample. Measurements of these samples were performed in the stable isotope laboratory of the department of Earth and Life Sciences at the VU University Amsterdam. Samples were analysed on a Thermo Finnigan Delta+ mass spectrometer equipped with a GASBENCH II preparation device. Approximately 30 microgram of CaCO3 sample, placed in a He-filled 10 ml exetainer vial was digested in concentrated H3PO4 at a temperature of 45 degrees Celsius. Subsequently the CO2-He gas mixture was transported to the GASBENCH II by use of a He flow through a flushing needle system. In the GASBENCH, water was extracted from the gas, by use of NAFION tubing, and CO2 was analysed in the mass spectrometer after separation of other gases in a GC column. Isotope values are reported as δ13C relative to V-PDB. The reproducibility of routinely analysed lab CaCO3 standards is better than 0.1 per mille (1SD). Results are provided in Supplementary Materials.
4. SedimentologyIn the Mudurnu-Göynük Basin, the upper Maastrichtian and lower Danian are represented
by two different lithological patterns. The upper Maastrichtian is typically characterized by grayish hemipelagic mudstones/siltstones, which are occasionally intercalated by thin turbiditic sandstone beds in the southeastern part of the basin. The turbiditic sandstones reach the K-Pg boundary, but do not occur in the Danian succession. The lower Danian is characterized by an interval of 30-50 m of rhythmic alternations of fine-grained limestones and carbonate-rich mudstones throughout the basin. In between these two distinct lithological packages, the K-Pg boundary (confirmed by the palaeontological and geochemical data given below) is marked by a 2-3 mm thick reddish clay layer (ejecta layer here after), which is typically overlain by 15 – 17 cm thick darker, clayey mudstone.
4.1 TheOkçularsectionThe studied Okçular section covers 250 cm below and 470 cm above the reddish layer (Fig.
2). The 190 cm of upper Maastrichtian of the section is represented by an alternation of turbiditic

2929
A NEW K-PG BOUNDARY LOCALITY IN THE MUDURNU-GÖYNÜK BASIN
sandstones with grayish mudstones (Figs. 2 and 3A). The upper 55 cm of the Maastrichtian is devoid of sandy beds (Fig. 3B), although in an identical parallel section 400 m further west, turbidites occur up to 20 cm below the K-Pg boundary. The topmost Maastrichtian muds (up to 1 cm below the ejecta layer) contain well preserved complete aragonitic bivalves and ammonite fragments.
The lowermost Danian (basal 17 cm) is represented by darker clayey mudstone on top of the reddish ejecta layer. At 17 cm above the ejecta layer another reddish, iron-rich layer is present (Fig. 3C). This second layer also has a thickness of 2-3 mm, sharp bottom and top boundaries, but is slightly less continuous than the ejecta layer. The thickness of the dark clay layer in between two layers (17 cm) appears constant for at least 20 m at the outcrop.
The first Danian carbonate-rich mudstone bed, which is 16 cm thick, appears at 120 cm above the ejecta layer. From this level, the Okçular section continues with rhythmic limestone-mudstone alternations (Fig. 3A).
Figure 3.Photographs of the outcrops of the K-Pg boundary interval. In the general (A, B) and detail views (C) of the K-Pg boundary in the Okçular section the ejecta layer is distinctive. The lowermost Danian is represented by darker clayey mudstone on top of a laterally continuous reddish ejecta layer, which, in Okçular section, is overlain by a second reddish layer (C). The ejecta layer at the Göynük North section (D). Lowermost Danian dark clay layers are overlain by lighter coloured mudstone with higher carbonate content (E) at the Göynük North section.

3030
CHAPTER II
4.2 TheGöynükNorthSectionThe studied Göynük North section covers 125 cm below and 275 cm above the K-Pg
Boundary (Fig. 2). Unlike the Okçular section in the eastern part of the Mudurnu – Göynük Basin, the Göynük North section does not contain distinctive turbiditic sandstone beds in the Maastrichtian. However, Maastrichtian mudstones are occasionally more silty, possibly the more distal equivalents of the turbidites in the Okçular section.
At the Göynük North section the K-Pg boundary is also represented by a laterally continuous 2-3 mm thick reddish ejecta layer (Figs. 3D and 3E). This thin ejecta layer is overlain by 16 – 17 cm of thick darker clay layer which becomes less argillaceous upwards, similar to the Okçular section. On top of the dark boundary clay, a lighter coloured mudstone with high carbonate content is present. This 6-7 cm thick limestone bed is a prominent feature in the field and can be traced throughout the area. This bed is overlain by approximately 1 meter of grey mudstones. Higher up in the section, a rhythmic alternation of limestones and mudstones appears, similar to the Okçular section.
5. BiostratigraphyThe initial biostratigraphic assessment of the longer Okçular section was based on a study using
calcareous nannofossils and planktic foraminifera based on a low-resolution sampling (Ocakoglu et al., 2007, 2009; Acikalin 2011). The biostratigraphical framework was later improved through a high-resolution analyses of planktic foraminifera and organic-walled dinoflagellate cysts.
5.1 CalcareousnannofossilsAlthough only 3 of the samples of the low-resolution set fall with the interval studied herein,
this assessment provided the first basic biostratigraphic framework for our age model (Fig. 4). The presence of the uppermost Maastrichtian markers Micula murus and Micula prinsii in samples below the boundary clay of the Okçular section (-270 cm and -80 cm) demonstrates that the basal part of the studied interval comprises the upper part of the Micula murus Zone (CC26b, Fig. 4A). Above the boundary clay at Okçular occurs a succession of Paleocene assemblages characteristic for Zone NP1, with the basal part of this zone dominated by inferred ‘disaster’ taxa, such as species of the calcareous dinoflagellate cyst genus Thoracosphaera. This bloom is considered characteristic for the lowermost Danian Biantolithus sparsus Zone (Perch Nielsen, 1981) and is recognized in the lowest sample above the boundary clay at Okcular, at ~1,38 m above the base of the clay. Above this is a succession of Paleocene taxa, such as Neobiscutum romeinii and Cruciplacolithus primus. Due to the limited number of samples in this pilot, the lowest occurrence of the first true Paleocene nannoplankton species (Neobiscutum romeinii) is difficult to assess. In the second sample above the boundary (~4 m above the base of the clay) N. romeinii is already present. The FAD of the small form of Cruciplacolithus primus, occurs at 630 cm above the base of the boundary clay, delineating the base of the C. primus Subzone.
5.2 PlankticforaminiferaPlanktic foraminifera from the Okçular and Göynük North sections are common to abundant
but not well preserved. In general, foraminifera from the Okçular section show a slightly better preservation than from the Göynük North section. Although in some samples dissolution is likely to have caused planktic foraminifera to be almost absent, in most studied samples biostratigraphic markers could be identified, enabling biostratigraphic analysis (Fig. 4). The lower Paleocene

3131
A NEW K-PG BOUNDARY LOCALITY IN THE MUDURNU-GÖYNÜK BASIN
biozonation scheme is based on Berggren et al. (1995), and the zonation by Caron (1985) is used for the upper Maastrichtian. Recorded marker taxa are shown in Plate I.
5.2.1 The Okçular SectionOnly upper Maastrichtian planktic index foraminifer R. fructicosa occurs between -150 cm
and the base of the boundary clay. Plummerita reicheli (= P. hantkeninoides) is not observed in this interval. Although the preservation of planktic foraminifera is generally better at the Okçular site
Figure 4.Calcareous nannoplankton zonation, planktic foraminiferal zonation, dinocyst events, lithology, Siderophile element (including PGE) concentrations and bulk stable carbon isotopes at the (A) Okçular section and (B) Göynük North sections.
450
400
350
300
250
200
150
100
50
0
-50
-100
-150
-200
300
250
200
150
100
50
0
-50
-100
-150
-200
P. grallatorD. californicum; C. cornuta
C. cf. cornuta
S. inornataD. cf. californicum
M. druggii acme
D. carposphaeropsisvar. ‘cornuta’
M. druggiiD. carposphaeropsis
-2 -1 0
-2 -1A. m
ayar
oens
is?
P0
PαP1
aP1
bN
o da
ta
P0P1
aP1
b?Pα
No
data
No
data
P0
0
-2 -1 0 5 10 15
RhRuPdPt
Pα20
10
-10
52.5 7.5
ppb ppm
Ir Rh, Ru, Pd, Pt
200 400
NiCo
Cr
ppm
Co, Ni, Cr
0
20
10
-10
Pα
ppb
Ir
52.5 7.5 5 10 15ppm
Rh, Ru, Pd, Pt
20 200ppm
Co, Ni, Cr
100 300
A
B
RhRuPdPt
NiCo
Cr
CC
26b
NP1
Nan
nofo
ssil
Zona
tion
Fora
min
ifera
lZo
natio
n
P. grallator
C. cornuta
D. californicum
S. inornataD. cf. californicum
M. druggii acme
D. carposphaeropsisvar. ‘cornuta’
M. druggii
Okçular section
Göynük North section
MudstoneSandstoneLimestone
Boundary clayEjecta layerSecond reddish layerδ13C
δ13C
Lith
olog
y
Dinocyst events
Dinocyst events
Lith
olog
y
Dis
tanc
e fr
omK
-Pg
boun
dary
(cm
)
Dis
tanc
e fr
omK
-Pg
boun
dary
(cm
)
A. m
ayar
.Fo
ram
inife
ral
Zona
tion
P0
-2 -1 0
δ13Cδ13C
‰ ‰
‰
‰

3232
CHAPTER II
than at the Göynük North site, in general, fewer planktic foraminifera are encountered at Okçular than at Göynük North. This may explain why relatively rare marker species such as Abathomphalus mayaroensis are not found at the Okçular site, despite better preservation. Up to 25 cm above the base of the boundary clay, hardly any planktic foraminifera are present, which may be the result of dissolution. Benthic foraminifera are present but not abundant in this zone and are severely weathered, which supports this assumption. Because no marker species can be recognized, this zone is tentatively assigned to Zone P0 (Fig. 4A). At 25 cm above the base of the boundary clay, very small specimens of Parvularugoglobigerina eugubina can be distinguished, marking the base of Zone Pα at this depth. It should be noted however, that Zone Pα may be present further down. P. eugubina (incl. P. longiapertura) is recognized in all investigated samples up to 100 cm above the base of the boundary clay. At 150 cm above the boundary neither P. eugubina nor Subbotina triloculinoides is observed, indicating Zone P1a. The boundary between Zone Pα and Zone P1a is probably situated between 100 and 150 cm above the boundary (Fig. 4A). Attempts to refine this zonal boundary have failed however, as the material investigated in between these two levels was too consolidated to retrieve foraminifera. Subbotina triloculinoides occurs at 200 cm above the K-Pg boundary, marking the base of Zone P1b. This zone reaches at least up to 470 cm above the boundary. At this depth, Guembelitria cretacea is no longer observed, suggesting this level to be situated in the upper part of Zone P1b.
5.2.2 The Göynük North SectionUpper Maastrichtian planktic index foraminifera Abathomphalus mayaroensis, Contusotruncana
contusa and Racemiguembelina fructicosa occur sporadically between -100 cm and the base of the boundary clay. Below -100 cm, no typical upper Maastrichtian markers are observed. The uppermost Maastrichtian marker P. reicheli is not observed in any of the samples. The transition across the K-Pg boundary is sharp. There is very little obvious reworking of Cretaceous material into the Paleocene. Common Cretaceous specimens occur at 1 cm above the base of the boundary clay but are very rare at 2 cm and higher above the boundary. Until 20 cm above the base of the boundary clay no P. eugubina could be observed, which indicates Zone P0. At 20 cm above the base of the boundary clay the first, strongly weathered P. eugubina (incl. P. longiapertura) specimens occur, indicating Zone Pα (Berggren et al., 1995). Neither S. triloculinoides nor P. eugubina is observed in the interval between ~100 to ~200 cm above the boundary. Therefore, it is assumed that this zone represents Zone P1a (Fig. 4B). It should be noted however that the preservation of this part of the section is very poor, leaving little trace of wall texture or architectural features. Often only partial moulds or compressed shells are recognized. It is therefore not possible to assign any biozone with certainty to this part of the section.
5.3 DinocystsThe palynological samples from the Mudurnu-Göynük basin yielded an abundance of well-
preserved palynomorphs. The assemblages are dominated by dinocysts, with minor contributions of acritarchs, prasinophytes, organic foraminiferal linings and terrestrial palynomorphs (i.e. pollen and spores). Dinocyst ranges are provided in Figures 5 and 6 whereas recorded marker taxa and other common taxa are shown in Plate II.
5.3.1 The Okçular SectionThe taxon Disphaerogena carposphaeropsis, which has its First Appearance Datum (FAD)
at about 1 million years before the boundary (De Gracianski et al., 1998; Williams et al., 2004),

3333
A NEW K-PG BOUNDARY LOCALITY IN THE MUDURNU-GÖYNÜK BASIN
Figu
re 5
.St
ratig
raph
ic di
strib
utio
n of
selec
ted
dino
cyst
taxa
and
bio
even
ts in
the
Okç
ular
sect
ion.
Plan
ktic
fora
min
ifera
l zon
es a
fter B
ergg
ren
et a
l., (1
995)
and
Par
do e
t al.
(199
6);
calca
reou
s nan
nopl
ankt
on z
ones
afte
r Per
ch N
ielse
n (1
981)
.
500
450
400
350
300
250
200
150
100
50 0 -50
-100
-150
-200
Okç
ular
Sec
tion
CC26bNP1Nannofossilbiozones
Distance fromK-Pg boundary
(cm)
Lithology
No dataA. mayaroensis ?
P0
P1aP1bPlanktic foram.
biozones Pα
Sample positions
Palynodinium grallatorAchilleodinium biannii
Oligosphaeridium saghirum
Manumiella druggii
Achomosphaera sagena
Apteodium fallax
Lejeunecysta izerzenensis
Cerodinium mediterraneumHafniasphaera septata
Senoniasphaera inornataMembranilarnacia ? tenella
Magallanesium densispinatum
Damassadinium californicumCarpatella cornuta
Kallosphaeridium yorubaenseCassidium fragile
acme
acme
Din
ocys
ts
APl
ankt
ic fo
ram
s
Racemiguembelina fructicosa ?
Parvularugoglobigerina eugubinaSubbotina triloculinoides
Nan
nofo
ssils
Micula murus
Micula prinsii
Braarudosphaera spp.
Thoracosphaera spp.acme
Neobiscutum romeinii
Dinogymnium spp.
Trithyrodinium evittii
Disphaerogena carposphaeropsis
Cordosphaeridium fibrospinosum
Disphaerogena carposphaeropsis var. “cornuta”
Senoniasphaera cf. inornata
Damassadinium californicum
Lanternosphaeridium reinhardtii var. “reduced” Spiniferella cornuta
Lanternosphaeridium reinhardtii

3434
CHAPTER II
Figu
re 6
.St
ratig
raph
ic di
strib
utio
n of
sele
cted
din
ocys
t tax
a an
d bi
oeve
nts
of th
e G
öynü
k N
orth
sec
tion.
Plan
ktic
fora
min
ifera
l zon
es a
fter B
ergg
ren
et a
l., (1
995)
and
Par
do e
t al.
(199
6).
B
Sample positions
350
300
250
200
150
100
50 0 -50
-100
-150
-200
Göy
nük
Nor
th S
ectio
n
Lithology
No dataA. mayaroensis
P0
P1a(P1b?)Planktic foram.
biozones PαNo data
Dinogymnium spp.Palynodinium grallator
Achilleodinium bianniiOligosphaeridium saghirum
Disphaerogena carposphaeropsisManumiella druggii
Achomosphaera sagena
Disphaerogena carposphaeropsis var. “cornuta”Lejeunecysta izerzenensis
Senoniasphaera cf. inornata
Hafniasphaera septata
Senoniasphaera inornata
Membranilarnacia? tenella
Damassadinium cf. californicum
Magallanesium densispinatum Lanternosphaeridium reinhardtii var. “reduced”
Spiniferella cornuta
Lanternosphaeridium reinhardtii
Damassadinium californicum
Carpatella cornuta
Kallosphaeridium yorubaense
Cassidium fragile
acme
acme
Din
ocys
ts
Cordosphaeridium fibrospinosumTrithyrodinium evittii
Plan
ktic
fora
ms
Racemiguembelina fructicosaAbathomphalus mayaroensisContusotruncana contusa
Parvularugoglobigerina eugubina
Distance fromK-Pg boundary (cm)

3535
A NEW K-PG BOUNDARY LOCALITY IN THE MUDURNU-GÖYNÜK BASIN
is common throughout the studied interval. Disphaerogena carposphaeropsis var. cornuta, a marker for the uppermost Maastrichtian and Danian (Vellekoop et al.,2014), is present in the upper 80 cm below K-Pg boundary (Fig. 5). Manumiella druggii, which has its FAD ~800 kyr befor the boundary (Williams et al., 2004), is present in the upper 120 cm below the K-Pg boundary, occurring in an acme at ~30 cm below the boundary. The basal Danian is characterized by the First Occurrences (FOs) of Senoniasphaera inornata and Cerodinium mediterraneum at 2.5 cm above the boundary, the FOs of Membranilarnacia? tenella and Hafniasphaera septata at 4.5 cm above the boundary and the subsequent FOs of Damassadinium cf. californicum, Damassadinium californicum and Lanternosphaeridium reinhardtii at 9.5 cm, 12.5 cm and 29.5 cm above the base of the boundary, respectively (Fig. 5).
5.3.2 The Göynük North SectionAt the Göynük North section, D. carposphaeropsis is encountered in the upper 100 cm below
the K-Pg boundary. D. carposphaeropsis var. cornuta, has a FO at 30 below the boundary. The marker species M. druggii is present in the upper 70 cm below the boundary, with the characteristic acme peaking at 40 cm below the boundary (Fig. 6). The placement of these stratigraphic events suggests that compared to the Okçular section, the uppermost Maastrichtian is slightly more condensed at the Göynük North section, in line with the presence of intercalated turbidites at Okçular.
Similar to the Okçular section, the basal Danian of the Göynük North section is characterized by a succession of FOs of dinocyst marker taxa, with the FOs of S. inornata and Membranilarnacia? tenella at 3 cm above the boundary, the FOs of D. cf. californicum and L. reinhardtii at 6 cm above the boundary and the subsequent FOs of, Carpatella cornuta, Hafniasphaera septata and D. californicum at 20 cm, 40 cm and 125 cm above the base of the boundary, respectively (Fig. 6). These last three stratigraphic markers are nevertheless very rare at this section, so the FOs of these taxa are probably not reliable as stratigraphic indicators.
5.4 OtherpaleontologicalfindingsThe K-Pg boundary succession in the Mudurnu-Göynük basin is characterized by a
relative low abundance of macrofossils. Across the K-Pg boundary interval at both sections, the monotonous mudstones occasionally comprise small bivalves and bivalve, gastropod and ammonite fragments. Below the boundary are very rare occurrences of large specimens of the echinoid Echinocorys edhemi. In the first meter above the K-Pg boundary, small specimens of the genus Echinocorys and other echinoid genera become slightly more abundant. The interval with limestone-mudstone alternations is characterized by the abundant occurrence of larger specimens of E. edhemi and at some horizons also by abundant burrows, attributed to a typical Cruziana ichnofacies.
5.5 BiostratigraphicsynthesisAt both studied sections the Maastrichtian interval is characterized by global biostratigraphic
markers for the uppermost Maastrichtian, such as the calcareous nannofossils M. murus and M. prinsii, the planktic foraminifera taxa A. mayaroensis, C. contusa and R. fructicosa and the dinocyst taxon Disphaerogena carposphaeropsis. In addition, at both sites a bloom of the dinocyst marker taxon Manumiella druggii was observed. This spike of Manumiella is recognized in the uppermost Maastrichtian at Cretaceous-Paleogene sections worldwide (Habib and Saeedi, 2007).
Although the uppermost Maastrichtian planktic foraminiferal marker P. reicheli, indicative of latest Maastrichtian Biozone CF1 (Pardo et al., 1996), is not observed in any of the samples, our combined biostratigraphic assessment indicates that at the Okçular and Göynük North sections the

3636
CHAPTER II
uppermost Maastrichtian is stratigraphically complete. While P. reicheli is commonly found in the upper Maastrichtian of the Tethyan realm, for instance in Tunisia (e.g. Speijer and van der Zwaan, 1996; Keller, 2004), Egypt (e.g. Speijer and van der Zwaan, 1996), Spain (Molina et al., 1996) and Israel (e.g. Adatte et al., 2005), its occurrence may be rare and or absent at other sites (e.g. Keller, 2004). P. reicheli is for example not found in Kazakhstan (Pardo et al., 1999). The absence of this taxon in the investigated samples may be caused by the rarity of the taxon at this location.
The Danian interval of the Okçular and Göynük North sections displays a succession of regional and global stratigraphic events, such as the FADs of dinocyst marker taxa Senoniasphaera inornata, Membranilarnacia? tenella and Damassadinium cf. californicum and the FADs of planktic foraminifera taxa such as P. eugubina and S. triloculinoides, allowing a precise zonation of this interval and confirming the placement of the K-Pg boundary at the reddish layer at the base of the dark clay layer encountered at the Göynük North and Okçular sections (see Figs. 4 and 5).
6. Geochemistry6.1 Carbonisotopes
The Cretaceous – Paleogene transition at both sections is characterised by an abrupt negative shift in the bulk δ13C curve just above the ejecta layer (see Fig. 4). At the Okçular section, the bulk carbon istope curve is obtained from 146 samples (App. B.2). Typically δ13C values range between -0.93‰ and 0.15‰ at pre-impact sediments and exhibit an abrupt shift from 0.15‰ to -1.6‰ at the ejecta layer. The δ13C profile of the Okçular section stays in negative values between the ejecta layer and the second reddish layer. At the second reddish layer δ13C values exhibit a further negative shift to -2.24‰. After the second reddish layer δ13C values return to pre-impact isotopic values.
The carbon isotope compositions of the selected 34 samples from the Göynük North Section range between 1.20‰ and 1.53‰ in the Cretaceous period. The istope record exhibits an abrupt negative shift at the ejecta layer from 1.23‰ to -0.05‰. The δ13C values slightly recover to positive values and stay below 1‰ throughout the first 80 cm of the Danian.
6.2 SiderophileelementsignalsEnrichment of siderophile elements, and more specifically the platinum group elements
(PGEs: Ru, Rh, Pd, Os, Ir and Pt; Fig. 4A), in the ejecta layer is one of the common features of most K-Pg Boundary sections sections (e.g., at Caravaca-Spain, Furlo-Italy, and Stevns Klint-Denmark). The siderophile elements are relatively rare in Earth’s crust, as these elements partitioned into the core during planetary differentiation. Therefore, enrichment of those elements in roughly meteoritic ratios generally points towards an extraterrestrial source. In this study, the siderophile element contents were determined in respectively 6 and 7 samples across the K-Pg boundary at the Okçular and Göynük North sections. At both sites studied, all siderophile elements, including Cr, Co, and Ni, show an abrupt increase at the ejecta layer (Fig. 4, App. B.1).
At the Okçular section, the Ir concentration reaches up to 7.41 ppb in the ejecta layer, compared to ~0.5 ppb below and ~0.8 ppb above this level. This is fully in range of typical K-Pg boundary concentrations reported for other K-Pg sites in the Neo-Tethys region (e.g., Irmax of 16.62 ppb at Caravaca (Spain), 2.33 ppb at Furlo (Italy), or 1.93 ppb at Siliana (Tunusia); Goderis et al., 2013). In the second reddish layer, the Ir concentration remains stable at background values (0.77 ppb), while Cr, Ni,Ru, Pt, and Pd exhibit a slight increase (App. B.1). Similar to the Okçular section, the Göynük North section is also characterised by an abrupt increase in all siderophile element contents at the ejecta layer, with an elevated Ir content of 7.23 ppb compared to Ir contents of ~0.3 ppb below and ~0.8 ppb above the boundary layer. A second enrichment

3737
A NEW K-PG BOUNDARY LOCALITY IN THE MUDURNU-GÖYNÜK BASIN
above the boundary clay was not observed. At both sections, the CI-type carbonaceous chondrite-normalized PGE pattern (Fig. 7) is relatively unfractionated, indicating the presence of a chondritic component, and comparable to the K-Pg boundary patterns observed for most distal sites worldwide (Goderis et al., 2013).
Although the boundary material shows a clear enrichment in siderophile element content of at least a factor 10 compared to the characterized samples directly above this layer at both Okçular and Göynük North, the Turkish pre- and post-impact deposits are considerably elevated compared to average continental crustal values (Ir = 0.02 – 0.10 ng/g; Goderis et al., 2013 and references therein), but also to background levels above and below the K – Pg interval at, for instance, Caravaca (Ir = 0.057 ng/g, 60 cm below the K – Pg level; Smit and Hertogen, 1980). Where continental crustal average 126-185 ppm for Cr, 24-29 ppm for Co, and 56-105 ppm for Ni (Goderis et al., 2013 and references therein), most Cr and Ni values reported for the Okçular background are above this range (Crbackground = 100-212 ppm, Nibackground = 77-174 ppm). This is not the case for Göynük (Crbackground = 62-140 ppm, Nibackground = 56-132 ppm), although the Ni values for the samples directly below the K-Pg boundary are slightly elevated compared to average
Figure 7.CI- normalized logarithmic plot of PGE and Au concentrations across the Okçular and Göynük North K-Pg boundary sections compared to the average composition of the continental crust (Ir, Ru, Pt, Pd from Peucker-Ehrenbrink and Jahn, 2001; Rh and Au from Wedepohl, 1995).CI values from Tagle and Berlin (2008). Elements are plotted in order of decreasing condensation temperatures. Although the boundary clays of both sections clearly show the highest and most chondritic PGE concentrations, all section samples are elevated in PGE compared to the average continental crust, most markedly for Ir.

3838
CHAPTER II
continental crustal values. On a plot of Cr versus Ir (Fig. 8), projectile-enriched impactites typically follow the mixing lines between Upper Continental Crust (UCC), Continental Crust (CC2) and chondrites (Goderis et al., 2013 and references therein). Samples from the Okçular and Göynük North sections clearly follow these mixing lines as expected, suggesting the addition of ~2 wt% of extraterrestrial material to the boundary clay. All Okçular section samples consistently exhibit high Cr concentrations, following the uppermost mixing trajectory between continental crust and chondrites.
Samples from the Göynük section show a wider range in Cr/Ir ratios. Considering that most samples follow the mixing lines, the observed element profiles at the Okçular and Göynük North sections are the result of element mobility during diagenesis, although a mafic-rich provenance area for the Okçular section is also be suggested based on the Cr contents. Possibly, proximity to a mafic-rich sediment source area to the south (Acikalin, 2011) could have played a role in the observed compositional differences between Okçular and Göynük North.
Figure 8. Cr versus Ir concentrations of terrestrial target rocks compared to the composition of the Popigai impact melt rocks, K-Pg boundary clays from Caravaca (Spain), Furlo (Italy), and Siliana (Tunesia), in addition to the characterized K-Pg boundary clays in this study (Goderis et al., 2013 and references therein). The grey field indicates the most likely mixing trajectories between chondritic projectiles and common terrestrial targets. Numbers represent wt.% chondritic material on the mixing lines. The plot os based on Figs. 1 and 2 of Tagle and Hecht (2006). PUM = primitive upper mantle, MORB = mid-ocean ridge basalt, UCC = upper continental crust, CC = continental crust. The Okçular and Göynük North samples clearly follow the mıxıng line, suggesting an impactite origin.

3939
A NEW K-PG BOUNDARY LOCALITY IN THE MUDURNU-GÖYNÜK BASIN
7. PaleoenvironmentThe Maastrichtian and Danian deposits of the Mudurnu-Göynük basin mainly consist of fine
siliciclastics with relatively high carbonate content. The influx of siliciclastics suggests the presence of landmasses relatively close to the depositional site, likely from an uplifted accretionary prism related to the initiation of continental crust collision further south (Acikalin, 2011).
Our paleontological records can be used to reconstruct the late Cretaceous-early Paleocene depositional environment in the Göynük basin. Dinocysts assemblages can provide valuable information on environmental parameters such as coastal proximity, sea surface temperature and salinity (Sluijs et al., 2005). Overall, the palynological assemblages at Göynük North and Okçular are characterized by a high percentage of marine palynomorphs, generally >90%, indicating that full marine conditions prevailed. The most dominant group of dinocysts is the Spiniferites-Achomosphaera group, comprising all species of Spiniferites and the morphologically related genus Achomosphaera. In general this group makes up 40-50% of the assemblage (Fig. 9). Spiniferites and Achomosphaera are commonly considered indicative for a typical shelf environment (Sluijs et al., 2005). The low abundances (generally below 20%) of typical coastal taxa such as Areoligera, Glaphyrocysta and Hystrichosphaeridium suggest a relatively offshore, open marine setting. This interpretation is confirmed by the mostly deep shelf benthic foraminifera fauna and the common presence of the bathyal marker Gavelinella beccariiformis in the Maastrichtian part of the Göynük North section, suggesting a deposition at an outer neritic to upper bathyal environment, likely at a paleodepth of 200-400 m. This typical deep-water marker is absent in the Okçular section, suggesting that this section was deposited in a slightly shallower setting, as supported by the more common presence of aragonitic bivalves and ammonite fragments in the Okçular section. The relative monotonous sedimentation of mudstones and relative low abundance of macrofossils at both sites is in accordance with the suggested environment. The overall sedimentological and paleontological data demonstrate that the K-Pg boundary sites in the Mudurnu-Göynük basin were characterized by mixed siliciclastic-carbonate sedimentation under normal marine conditions.
Spiniferites + Achomosphaera
44.9 %
Pterodinium + Impagidinium
1.7 %
Spiniferites + Achomosphaera
46.1%
Pterodinium + Impagidinium
0.75 %
hexa-peridinoids
18.9 %
hexa-peridinoids
15.9%
Hystrichosphaeridium3.6%
Hystrichosphaeridium3.9%
Gv cysts2.1%
Gv cysts2.1%
AP cpx.1.4%
AP cpx.1.3%
Manumiella3.9%
Manumiella0.4%
Other dinocysts
27%Other
dinocysts26.5%
Göynük North Okçular
Figure 9.Abundance distribution of the most abundant dinocyst groups of the Göynük North and Okçular sections. The dinocyst group [Spiniferites + Achomosphaera] includes all species within the genera Spiniferites and Achomopshaera. The dinocyst group [Pterodinium + Impagidinium] includes all species within the genera Pterodinium and Impagidinium. The dinocyst group [Hexa-peridinioids] includes all peridinioid taxa with an hexagonal archeopyle, except for species of the genera Andalusiella and Palaeocystodinium. The group [Hystrichosphaeridium] includes all species within the genus Hystrichosphaeridium. The dinocyst group [Gv cysts] includes all taxa with dorsoventrally compressed cysts. The group [AP cpx] includes all species of the genera Andalusiella and Palaeocystodinium. The group [Manumiella] includes all species of within the genus Manumiella. The group [Other dinocysts] includes all taxa that are not included in any of the previous groups.

4040
CHAPTER II
8. Discussion8.1 OriginofthesecondreddishlayerattheOkçularsection
The Cretaceous-Paleogene transition in the Okçular section exhibits two reddish layers separated by a 16-17 cm thick dark clay layer. The paleontological and geochemical analyses show that the first reddish layer marks the K-Pg boundary. Although the second reddish layer is absent in the Göynük North section, the lithological change from darker, clay rich mudstone to a less argillaceous lithology around +17 cm is considered as a correlatable surface of the second reddish layer of the Okçular section.
The K-Pg boundary in the Okçular section is marked by an abrupt increase in Ir content to ~7.4 ppb, which is significantly higher compared to local background and average continental crust values. Although Ir content tends to go back to lower values in the levels above the boundary, it does not entirely return to background levels in the samples between ejecta layer and the second reddish layer. In addition, slight enrichment of particular siderophiles element contents (e.g., Ru, Pt, Co) is evident in the second layer (Fig. 4, App. B.1). Given the concentration differences between the two reddish layers, it is clear that these intervals are not of similar origin. The sharp bottom boundaries of both layers, the continuity of bedding, and the constant grain size in between two layers do not suggest sediment reworking at the Okçular section. These observations exclude the possibility that the second layer reflects a simple repetition of the ejecta layer through faulting and slumping. Rather, geochemical remobilisation and re-precipitation at the sedimentary transition from boundary clay to normal background hemipelagic carbonates appears a more likely cause for the second reddish layer.
8.2 ComparisonoftheGöynükNorthandOkçularwithothersectionsOur sedimentological, geochemical and biostratigraphic characterization of the K-Pg
boundary interval in the Mudurnu-Göynük basin demonstrates that the studied sections comprise stratigraphically complete K-Pg boundary transitions. Furthermore, these new records allow a detailed comparison with K-Pg boundary sections worldwide. The sedimentological and paleontological records of the Okçular and Göynük North sections suggest that these sites are deposited in an outer neritic to upper bathyal environment. Therefore, the K-Pg boundary transition in this basin shows most similarities to other outer shelf and bathyal sites in the Tethys ocean, such as El Melah and El Kef in Tunisia or Caravaca and Agost in Spain (Molina et al. 1996; Adatte et al., 2002a, Fig. 10). All these sites are characterized by monotonous deposition of muds, interrupted by a dark boundary clay with a reddish ejecta layer at the base. Compared to the El Kef section, the Okçular and Göynük North sections appear to be more condensed (Fig. 10), suggesting that these sections might have been deposited in a different environmental setting, possibly more similar to the Caravaca and Agost sections in Spain (Lamolda et al., 2005). Interestingly, at various K-Pg boundary sites deposited in at an outer neritic to upper bathyal environment, such as Caravaca in Spain and Bjala in Bulgaria, the boundary clay is overlain by a prominent limestone bed at the base of planktic foraminifera Zone Pα (Molina et al,. 1996), a feature that is also prominent at the Göynük North section. This limestone bed is often characterized by an acme of Thoracosphaera and other calcareous dinoflagellate cysts, related to the initial resumption of carbonate production.
The palynological assemblages of the Okçular and Göynük North sections also have some similarities with those of the K-Pg boundary GSSP at El Kef, Tunisia and other records in the Western Tethys, but have significantly higher abundances of higher-latitude taxa. Dinocyst taxa that are typical for the ‘Boreal’ paleogeographic region, such as Palynodinium grallator (Schiøler

4141
A NEW K-PG BOUNDARY LOCALITY IN THE MUDURNU-GÖYNÜK BASIN
Figu
re 1
0.
A b
iostr
atig
raph
ic co
rrelat
ion
betw
een
the
new
K-P
g bo
unda
ry s
ectio
ns fr
om th
e M
udur
nu –
Göy
nük
basin
and
two
well-
know
n K
-Pg
boun
dary
sec
tions
in th
e Te
thys
: th
e K
-Pg
boun
dary
stra
toty
pe s
ectio
n of
El K
ef, T
unisi
a an
d th
e C
arav
aca
sect
ion,
Spa
in. Z
onat
ion
sche
me
and
dino
cyst
FOs
from
El K
ef a
re b
ased
on
Brin
khui
s an
d Z
acha
riass
e, 19
88 an
d Br
inkh
uis e
t al.
(199
8), Z
onat
ion
sche
me a
nd d
inoc
yst F
O’s
of C
arav
aca a
re b
ased
on
Are
nilla
s et a
l. (2
004)
and
Brin
khui
s et a
l. (1
998)
.
500
450
400
350
300
250
200
150
100
50 0 -50
-100
-150
-200
CC26bNP1
P. g
ralla
tor
C. co
rnut
a
D. c
alifo
rnic
um
M. d
rugg
ii ac
me
D. c
arpo
. va
r. ‘c
ornu
ta’
M
. dru
ggii
A. mayar. ?
P0
P1aP1b No data
Din
ocys
t eve
nts
350
300
250
200
150
100
50 0 -50
-100
-150
-200
P. g
ralla
tor
S. in
orna
ta
P0
P1aP1b?
150
100
50 0 -50
-100
-150
-200400
350
300
250
200
CC26bNP1A. mayaroensis
P0
PαP1aP1b ?
D. c
arpo
spha
erop
sisva
r. ‘c
ornu
ta’
150
100
50 0 -50
-100
-150
-200400
350
300
250
200
-250
-300
-350
PALEOGENE CRETACEOUS
CC26bNP1A. mayaroensis
P0
D. c
alifo
rnic
um
P. g
ralla
tor
S.
inor
nata
C. co
rnut
a
C. cf
. cor
nuta
D
. cf.
calif
orni
cum
P. g
ralla
tor
M. d
rugg
ii
El K
ef, T
unis
iaC
arav
aca,
Spa
in
Okç
ular
, Tur
key
Göy
nük
Nor
th, T
urke
y
Pα
Pα
A. mayar. No dataPα?
Din
ocys
t eve
nts
Din
ocys
t eve
nts
?
D. c
f. ca
lifor
nicu
mS.
inor
nata
D. c
alifo
rnic
um;C
. cor
nuta
C. cf
. cor
nuta
D. c
alifo
rnic
umS.
inor
nata
P. g
ralla
tor
D. c
f. ca
lifor
nicu
mD
. car
po.
var.
‘cor
nuta
’M
. dru
ggii
acm
eM
. dru
ggii
Age
Nannofossil zonation
Foram zonationDistance from K-Pgboundary (cm)
Nannofossil zonation
Foram zonation
Distance from K-Pgboundary (cm)
Nannofossil zonation
Foram zonationDistance from K-Pgboundary (cm)
Foram zonationDistance from K-Pgboundary (cm)
Din
ocys
t eve
nts
-400

4242
CHAPTER II
and Wilson, 1993), are present throughout the studied interval. Clearly, the dinocyst assemblages of the Mudurnu-Göynük basin represent a transition between the ‘Boreal’, temperate region and the subtropical region of Western Tethys, comprising components of both assemblages. Hence, the K-Pg boundary sites in the Mudurnu-Goynuk basin comprise an excellent record of the transitional zone between the ‘Boreal’ and Western Tethys paleogeographic regions. Therefore, the sedimentary records in this basin might provide essential insights in biotic migrations across the K-Pg boundary interval.
9. ConclusionsIn this study a Cretaceous-Paleogene transition is studied in two detailed sections (Okçular
and Göynük North sections), in the Mudurnu-Göynük Basin, in northwest Turkey. To characterise the K-Pg boundary, sedimentological observations were also carried out and the sections were analysed for bulk stable carbon isotope, siderophile trace elements, calcareous nannofossil, planktic foraminifera and organic-walled dinoflagellate cysts;. In the study area the upper Maastrichtian typically comprises grey mudstones with intercalated turbidites, whereas Danian is characterised by grey mudstones and rhythmic alternation of limestones and mudstones. The K-Pg boundary is marked by a thin (2-3mm thick) reddish ejecta layer which is overlain by 15-17cm thick darker mudstone (boundary clay). Enrichment of platinum group elements and abrupt negative shift of δ13C geochemically characterise the K-Pg boundary. The ejecta layer in the Okçular section exhibits high Ir concentration (7.41 ppb) and δ13C values decrease to -1.6‰ from 0.15‰ pre-ejecta values. Similar to the K-Pg transition at the Göynük North section is represented by an elevated Ir concentration (7.23 ppb) and a negative δ13C shift (from 1.23‰ to -0.05‰). In addition to Ir, all other studied siderophile elements also show an abrupt increase in the ejecta layer.
The position of the K-Pg boundary is confirmed by a biostratigraphic assessment. The globally recognised spike of the dinocyst taxon Manumiella druggii in the upper Maastrichtian, the extinction of Cretaceous planktic foraminifera at the ejecta layer, and a subsequent rapid succession of First Appearance Datums (FOs) of dinocysts, such as Senoniasphaera inornata, Membranilarnacia? tenella and Damassadinium californicum and planktic foraminifera, including Parvularugoglobigerina eugubina and Subbotina triloculinoides in the lower Danian, are some of the biostratigraphic events which confirm the position of the K-Pg boundary in the Okçular and Göynük North sections.
In the Okçular section a second reddish layer has been note about 17cm above the ejecta layer and it is believed that geochemical remobilisation and re-precipitation at the sedimentary transition from boundary clay to normal background hemipelagic deposition is the main reason of its occurrence.
Our sedimentological, geochemical and biostratigraphic findings suggest that the studied sections are stratigraphically complete and are deposited in an outer neritic and upper bathyal environment.. The palynological assemblages indicate that the Okçular and Göynük North sections represent a transition between the Boreal temperate region and the subtropical region of Western Tethys.

4343
A NEW K-PG BOUNDARY LOCALITY IN THE MUDURNU-GÖYNÜK BASIN

4444
CHAPTER II
Plate I.Plate with upper Maastrichtian and lower Paleocene planktic index foraminifera encountered in this study. 1a, b, c: Parvularugoglobigerina eugubina (Luterbacher and Premoli Silva) Okçular, 29-30 cm 2a, b, c: Parvularugoglobigerina longiapertura (Blow) Okçular, 49-50 cm 3a, b: Subbotina triloculinoides (Plummer) Okçular, 300 cm 4: Guembelitria cretacea (Cushman) Okçular, 99-100 cm 5a, b, c: Abathomphalus mayaroensis (Bolli) Göynük, -100 cm 6a, b, c: Abathomphalus mayaroensis (Bolli) Göynük, -50 cm 7a, b, c: Contusotruncana contusa (Cushman; emend. El-Naggar) Göynuk, -100 cm 8: Racemiguembelina fructicosa (Egger) Okçular, -100 cm

4545
A NEW K-PG BOUNDARY LOCALITY IN THE MUDURNU-GÖYNÜK BASIN
Plate I
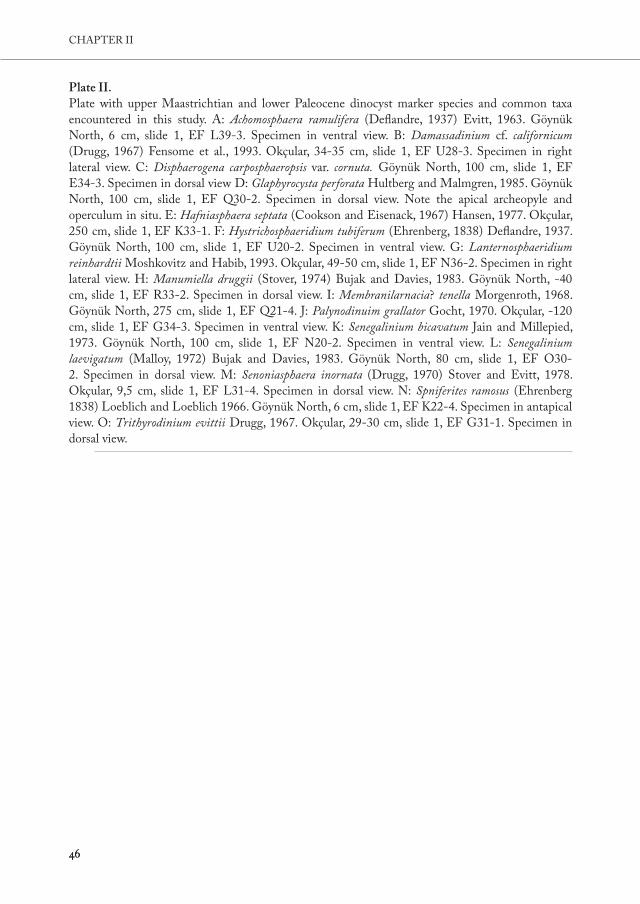
4646
CHAPTER II
Plate II.Plate with upper Maastrichtian and lower Paleocene dinocyst marker species and common taxa encountered in this study. A: Achomosphaera ramulifera (Deflandre, 1937) Evitt, 1963. Göynük North, 6 cm, slide 1, EF L39-3. Specimen in ventral view. B: Damassadinium cf. californicum (Drugg, 1967) Fensome et al., 1993. Okçular, 34-35 cm, slide 1, EF U28-3. Specimen in right lateral view. C: Disphaerogena carposphaeropsis var. cornuta. Göynük North, 100 cm, slide 1, EF E34-3. Specimen in dorsal view D: Glaphyrocysta perforata Hultberg and Malmgren, 1985. Göynük North, 100 cm, slide 1, EF Q30-2. Specimen in dorsal view. Note the apical archeopyle and operculum in situ. E: Hafniasphaera septata (Cookson and Eisenack, 1967) Hansen, 1977. Okçular, 250 cm, slide 1, EF K33-1. F: Hystrichosphaeridium tubiferum (Ehrenberg, 1838) Deflandre, 1937. Göynük North, 100 cm, slide 1, EF U20-2. Specimen in ventral view. G: Lanternosphaeridium reinhardtii Moshkovitz and Habib, 1993. Okçular, 49-50 cm, slide 1, EF N36-2. Specimen in right lateral view. H: Manumiella druggii (Stover, 1974) Bujak and Davies, 1983. Göynük North, -40 cm, slide 1, EF R33-2. Specimen in dorsal view. I: Membranilarnacia? tenella Morgenroth, 1968. Göynük North, 275 cm, slide 1, EF Q21-4. J: Palynodinuim grallator Gocht, 1970. Okçular, -120 cm, slide 1, EF G34-3. Specimen in ventral view. K: Senegalinium bicavatum Jain and Millepied, 1973. Göynük North, 100 cm, slide 1, EF N20-2. Specimen in ventral view. L: Senegalinium laevigatum (Malloy, 1972) Bujak and Davies, 1983. Göynük North, 80 cm, slide 1, EF O30-2. Specimen in dorsal view. M: Senoniasphaera inornata (Drugg, 1970) Stover and Evitt, 1978. Okçular, 9,5 cm, slide 1, EF L31-4. Specimen in dorsal view. N: Spniferites ramosus (Ehrenberg 1838) Loeblich and Loeblich 1966. Göynük North, 6 cm, slide 1, EF K22-4. Specimen in antapical view. O: Trithyrodinium evittii Drugg, 1967. Okçular, 29-30 cm, slide 1, EF G31-1. Specimen in dorsal view.

4747
A NEW K-PG BOUNDARY LOCALITY IN THE MUDURNU-GÖYNÜK BASIN
Plate I
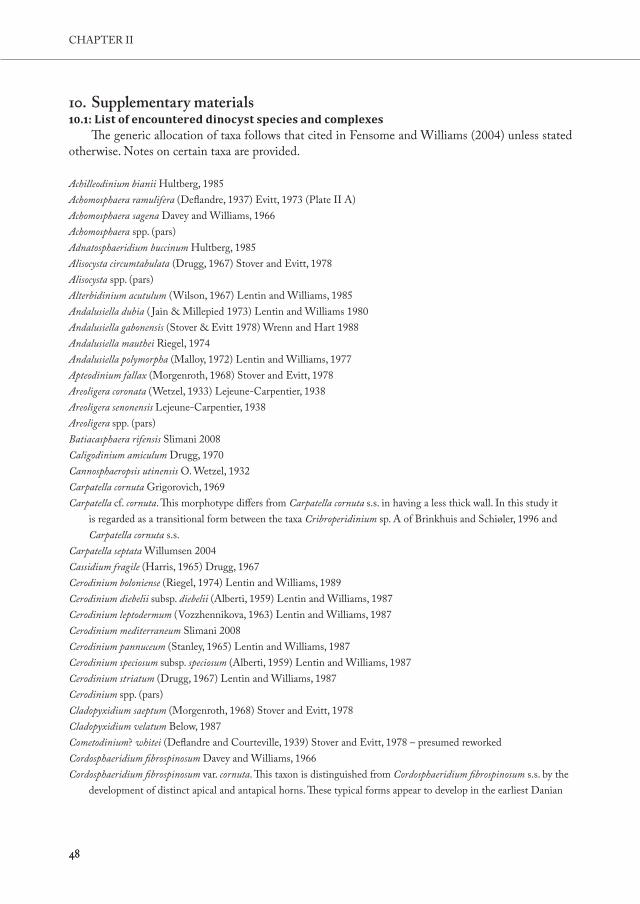
4848
CHAPTER II
10. Supplementary materials10.1:Listofencountereddinocystspeciesandcomplexes
The generic allocation of taxa follows that cited in Fensome and Williams (2004) unless stated otherwise. Notes on certain taxa are provided.
Achilleodinium bianii Hultberg, 1985Achomosphaera ramulifera (Deflandre, 1937) Evitt, 1973 (Plate II A)Achomosphaera sagena Davey and Williams, 1966Achomosphaera spp. (pars)Adnatosphaeridium buccinum Hultberg, 1985Alisocysta circumtabulata (Drugg, 1967) Stover and Evitt, 1978Alisocysta spp. (pars)Alterbidinium acutulum (Wilson, 1967) Lentin and Williams, 1985Andalusiella dubia ( Jain & Millepied 1973) Lentin and Williams 1980Andalusiella gabonensis (Stover & Evitt 1978) Wrenn and Hart 1988Andalusiella mauthei Riegel, 1974Andalusiella polymorpha (Malloy, 1972) Lentin and Williams, 1977Apteodinium fallax (Morgenroth, 1968) Stover and Evitt, 1978Areoligera coronata (Wetzel, 1933) Lejeune-Carpentier, 1938Areoligera senonensis Lejeune-Carpentier, 1938Areoligera spp. (pars)Batiacasphaera rifensis Slimani 2008Caligodinium amiculum Drugg, 1970Cannosphaeropsis utinensis O. Wetzel, 1932Carpatella cornuta Grigorovich, 1969Carpatella cf. cornuta. This morphotype differs from Carpatella cornuta s.s. in having a less thick wall. In this study it
is regarded as a transitional form between the taxa Cribroperidinium sp. A of Brinkhuis and Schiøler, 1996 and Carpatella cornuta s.s.
Carpatella septata Willumsen 2004Cassidium fragile (Harris, 1965) Drugg, 1967Cerodinium boloniense (Riegel, 1974) Lentin and Williams, 1989Cerodinium diebelii subsp. diebelii (Alberti, 1959) Lentin and Williams, 1987Cerodinium leptodermum (Vozzhennikova, 1963) Lentin and Williams, 1987Cerodinium mediterraneum Slimani 2008Cerodinium pannuceum (Stanley, 1965) Lentin and Williams, 1987Cerodinium speciosum subsp. speciosum (Alberti, 1959) Lentin and Williams, 1987Cerodinium striatum (Drugg, 1967) Lentin and Williams, 1987Cerodinium spp. (pars)Cladopyxidium saeptum (Morgenroth, 1968) Stover and Evitt, 1978Cladopyxidium velatum Below, 1987Cometodinium? whitei (Deflandre and Courteville, 1939) Stover and Evitt, 1978 – presumed reworkedCordosphaeridium fibrospinosum Davey and Williams, 1966Cordosphaeridium fibrospinosum var. cornuta. This taxon is distinguished from Cordosphaeridium fibrospinosum s.s. by the
development of distinct apical and antapical horns. These typical forms appear to develop in the earliest Danian

4949
A NEW K-PG BOUNDARY LOCALITY IN THE MUDURNU-GÖYNÜK BASIN
and have been described as” intermediate morphotype between C. fibrospinosum and Damassadinium spp of the Cordosphaeridium fibrospinosum Complex” by Brinkhuis and Sluijs 2009, plate 2 B
Cordosphaeridium inodes subsp. inodes (Klumpp, 1953) Eisenack, 1963Coronifera striolata (Deflandre, 1937) Stover and Evitt, 1978Cribroperidinium? pyrum (Drugg 1967) Stover and Evitt 1978Cribroperidinium septatum (Hultberg 1985) Poulsen 1996Cribroperidinium wetzelii (Lejeune-Carpentier, 1939) Helenes, 1984Cribroperidinium wilsonii forma A of Slimani et al., 2011Cribroperidinium sp. A of Brinkhuis & Schiøler 1996Damassadinium californicum (Drugg 1967) Fensome et al. 1993Damassadinium cf. californicum. This morphotype is distinguished from Damassadinium californicum s.s. by having
a less broad process base. In this study it is regarded as a transitional form between the taxa Cordosphaeridium fibrospinosum var. cornuta and Damassadinium californicum s.s. These forms appear to evolve in the earliest Danian and can therefore be used as a marker species. (Plate II B)
Deflandrea galeata (Lejeune-Carpentier 1942) Lentin and Williams 1973Deflandrea tuberculata Hultberg, 1985Diconodinium wilsonii (Diconidinium parvum in Wilson, 1974)Dinogymnium acuminatum Evitt et al., 1967Diphyes colligerum (Deflandre and Cookson 1955) Cookson 1965Diphyes?recurvatum May, 1980Disphaerogena carposphaeropsis Wetzel 1933Disphaerogena cf. carposphaeropsis. This taxon is distinguished from Disphaerogena carposphaeropsis s.s. in having
a significantly more pronounced antapical horn. According to the emended diagnosis of Sarjeant, 1985, Disphaerogena carposphaeropsis s.s is characterized by an apical horn that is always longer than the antapical horn, by a ratio varying between 1.2:1 to 3:1. In the uppermost Maastrichtian samples, specimen occur with an antapical horn that is as long as, or longer than the apical horn. Since this form first appears in the uppermost Maastrichtian (i.e. Vellekoop et al., 2014), it is used as a stratigraphic marker in the present study. Since this form clearly belongs to the species D. carposphaeropsis, but is characterized by an antapical horn similar to the taxon Carpatella cornuta, we used the informal name ‘Disphaerogena carposphaeropsis variety “cornuta” in study. (Plate II C)
Druggidium meerensis (Slimani and Louwye, 2011)Exochospaeridium bifidum (Clarke and Verdier, 1967) Clarke et al., 1968Exochosphaeridium phragmites Davey et al., 1966Fibradinium annetorpense Morgenroth, 1968Fibrocysta axialis (Eisenack 1965) Stover and Evitt 1978Fibrocysta bipolaris (Cookson and Eisenack 1965) Stover and Evitt 1978Fibrocysta licia ( Jain et al. 1975) Stover and Evitt 1978Fibrocysta spp. (pars)Florentina ferox (Deflandre, 1937) Duxbury, 1980Florentinia? flosculus (Eurysphaeridium fibratum in Wilson, 1974)Florentinia mantellii (Davey and Williams, 1966)Glaphyrocysta castelcasiensis (Corradini 1973) Michoux and Soncini in Fauconnier and Masure 2004Glaphyrocysta perforata Hultberg and Malmgren 1985 (Plate II D)Glaphyrocysta retiintexta (Cookson, 1965) Stover and Evitt, 1978Glaphyrocysta semitecta (Bujak in Bujak et al. 1980) Lentin and Williams 1981Hafniasphaera septata (Cookson and Eisenack, 1967) Hansen, 1977 (Plate II E)

5050
CHAPTER II
Heterosphaeridium? heteracanthum (Deflandre and Cookson, 1955) Eisenack and Kjellström, 1971Hystrichodinium pulchrum Deflandre, 1935. – presumed reworkedHystrichokolpoma bulbosum (Ehrenberg, 1838)Hystrichosphaeridium recurvatum (White 1842) Lejeune-Carpentier, 1940Hystrichosphaeridium tubiferum (Ehrenberg, 1838) Deflandre, 1937 (Plate II F)Hystrichosphaeridium spp. (pars)Hystrichosphaeropsis ovum Deflandre 1935Hystrichostrogylon coninckii Heilmann-Clausen in Thomsen and Heilmann-Clausen, 1985Impagidinium sp. 1 of Thomsen & Heilmann-Clausen 1985, following Slimani et al., 2010Impagidinium spp. (pars)Isabelidinium bakeri (Deflandre and Cookson, 1955) Lentin and Williams 1977Kallosphaeridium yorubaense Jan du Chêne and Adediran, 1985Lanternosphaeridium lanosum Morgenroth, 1966Lanternosphaeridium reinhardtii Moshkovitz and Habib, 1993 (Plate II G)Lanternosphaeridium reinhardtii var. „reduced“. This form of Lanternosphaeridium reinhardtii is characterized by a
pericyst that is sheathed close to the endocyst. The description is of this variety is already included in the original description of Lanternosphaeridium reinhardtii by Moshkovitz and Habib, 1993.
Lejeunecysta globosa Biffi and Grignani, 1983Lejeunecysta hyalina (Gerlach 1961) Artzner and Dörhöfer, 1978Lejeunecysta izerzenensis Slimani 2008Lejeunecysta spp. (pars)Manumiella coronata (Stover, 1974) Bujak and Davies, 1983Manumiella druggii (Stover, 1974) Bujak and Davies, 1983, following Thorn et al., 2009 (Plate II H)Manumiella seelandica (Lange 1969) Bujak and Davies 1983, following Thorn et al., 2009Membranilarnacia? tenella Morgenroth, 1968 Plate II I)Membranilarnacia polycladiata (Membranilarnacia multifibrata in Wilson, 1974), following Slimani et al., 2011Neonorthidium perforatum Marheinecke, 1992Odontochitina operculata (O.Wetzel, 1933) Deflandre and Cookson, 1955 – presumed reworkedOligosphaeridium complex (White, 1842) Davey and Williams, 1966Oligosphaeridium saghirum Slimani et al., 2012. (?Homotryblium sp. of Brinkhuis and Zachariasse, 1988, p. 183, pl. 6,
fig. 6, Oligosphaeridium sp. cf. Homotryblium sp. of Brinkhuis and Zachariasse 1988 of Slimani et al., 2010 p. 115, pl. 10, fig. 10).
Operculodinium centrocarpum (Deflandre & Cookson 1955) Wall 1967Palaeocystodinium australinum (Cookson 1965) Lentin and Williams 1976Palaeocystodinium golzowense Alberti 1961Palaeocystodinium spp. (pars)Palaeohystrichophora infusorioides Deflandre 1935 – presumed reworkedPalaeoperidinium pyrophorum (Ehrenberg, 1838) Sarjeant, 1967Palaeotetradinium silicorum Deflandre, 1936Palynodinium grallator Gocht, 1970 (Plate II J)Palynodinium cf. grallator. This morphotype differs from Palynodinium grallator s.s. in having less pronounced
lateroventral protrusionsPervosphaeridium spp.Phelodinium magnificum (Stanley 1965) Stover and Evitt, 1978Phelodinium pentagonale Corradini, 1973Pierceites pentagonus (May 1980) Habib & Drugg 1987

5151
A NEW K-PG BOUNDARY LOCALITY IN THE MUDURNU-GÖYNÜK BASIN
Pterodinium cingulatum (O. Wetzel, 1933) Below, 1981Pterodinum cretaceum Slimani, 2008Pyxidinopsis spp.Raetiaedinium truncigerum (Deflandre, 1937) Kirsch, 1991Renidinium gracile Hultberg and Malmgren 1985Riculacysta amplexa Kirsch, 1991Senegalinium bicavatum Jain and Millepied 1973 (Plate II K)Senegalinium? dilwynense (Cookson and Eisenack 1965) Stover and Evitt 1978Senegalinium laevigatum (Malloy 1972) Bujak and Davies 1983 (Plate II L)Senegalinium microgranulatum (Stanley 1965) Stover and Evitt 1978Senegalinium obscurum (Drugg 1967) Stover and Evitt 1978Senoniasphaera inornata (Drugg 1970) Stover and Evitt 1978 (Plate II M)Senoniasphaera cf. inornata. This morphotype differs from Senoniasphaera inornata s.s. in having a smaller size and
thinner outer wall. In this study it is regarded as an early form of Senoniasphaera inornata.Spinidinium densispinatum (Stanley 1965) following Sluijs et al., 2009Spinidinium? pilatum (Stanley 1965) following Sluijs et al., 2009Spiniferella cornuta (Gerlach, 1961)Spiniferites pseudofurcatus (Klump, 1953) Sarjeant, 1970Spiniferites ramosus (Ehrenberg 1838) Loeblich and Loeblich, 1966 (Plate II N)Spiniferites spp. (pars)Spongidinium delitense (Ehrenberg, 1838) Deflandre, 1936Surculosphaeridium? longifurcatum (Firtion, 1952) Davey et al., 1966Tanyosphaeridium xanthiopyxides (Wetzel 1933) Stover and Evitt, 1978Thalassiphora? cf. patula. This taxon differs from Thalassiphora patula in having a periphragm that more or less
surrounds the entire endophragm, instead of being closely oppressed at the dorsal site.Thalassiphora? cf. pelagica. This taxon differs from Thalassiphora pelagica in having a periphragm that more or less
surrounds the entire endophragm, instead of being closely oppressed at the dorsal site. In addition, the typical “hole” in the ventral site of the periphragm is missing.
Trabeculodinium quinquetrum Duxbury, 1980 following Mohammed et al., 2012. Trichodinium castanea (Deflandre, 1935) Clarke and Verdier, 1967 – presumed reworkedTrithyrodinium evittii Drugg 1967 (Plate II O)Turnhosphaera hypoflata (Yun, 1981) following Slimani et al., 2011Xiphophoridium alatum (Cookson and Eisenack, 1962) – presumed reworked
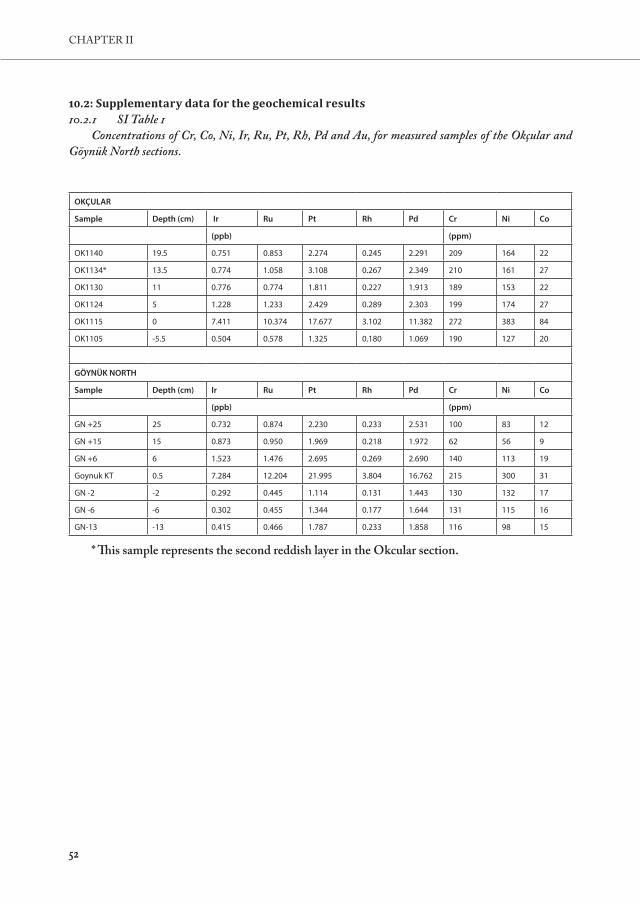
5252
CHAPTER II
10.2:Supplementarydataforthegeochemicalresults10.2.1 SI Table 1
Concentrations of Cr, Co, Ni, Ir, Ru, Pt, Rh, Pd and Au, for measured samples of the Okçular and Göynük North sections.
OKÇULAR
Sample Depth (cm) Ir Ru Pt Rh Pd Cr Ni Co
(ppb) (ppm)
OK1140 19.5 0.751 0.853 2.274 0.245 2.291 209 164 22
OK1134* 13.5 0.774 1.058 3.108 0.267 2.349 210 161 27
OK1130 11 0.776 0.774 1.811 0.227 1.913 189 153 22
OK1124 5 1.228 1.233 2.429 0.289 2.303 199 174 27
OK1115 0 7.411 10.374 17.677 3.102 11.382 272 383 84
OK1105 -5.5 0.504 0.578 1.325 0.180 1.069 190 127 20
GÖYNÜK NORTH
Sample Depth (cm) Ir Ru Pt Rh Pd Cr Ni Co
(ppb) (ppm)
GN +25 25 0.732 0.874 2.230 0.233 2.531 100 83 12
GN +15 15 0.873 0.950 1.969 0.218 1.972 62 56 9
GN +6 6 1.523 1.476 2.695 0.269 2.690 140 113 19
Goynuk KT 0.5 7.284 12.204 21.995 3.804 16.762 215 300 31
GN -2 -2 0.292 0.445 1.114 0.131 1.443 130 132 17
GN -6 -6 0.302 0.455 1.344 0.177 1.644 131 115 16
GN-13 -13 0.415 0.466 1.787 0.233 1.858 116 98 15
* This sample represents the second reddish layer in the Okcular section.

5353
A NEW K-PG BOUNDARY LOCALITY IN THE MUDURNU-GÖYNÜK BASIN
10.2.2 SI Table 2δ13C data for Okçular and Göynük North sections
OKÇULAR SECTION
Sample No Depth (cm) δ13C (‰) Sample No Depth (cm) δ13C (‰) Sample No Depth (cm) δ13C (‰)
OK-1304 183,5 0,27 OK-1174 53,5 -0,83 OK-1094 -16,5 0,00
OK-1295 174,5 0,19 OK-1171 50,5 -0,93 OK-1093 -17,5 -0,07
OK-1292 171,5 0,03 OK-1164 43,5 -0,96 OK-1092 -18,5 0,05
OK-1288 167,5 -0,04 OK-1161 40,5 -0,86 OK-1090 -20,5 -0,07
OK-1286 165,5 -0,11 OK-1158 37,5 -0,82 OK-1089 -21,5 -0,57
OK-1282 161,5 0,17 OK-1154 33,5 -0,82 OK-1088 -22,5 -0,19
OK-1274 153,5 0,03 OK-1150 29,5 -0,92 OK-1086 -24,5 -0,42
OK-1270 149,5 -0,07 OK-1148 27,5 -0,97 OK-1084 -26,5 -0,13
OK-1262 141,5 -0,52 OK-1146 25,5 -0,80 OK-1081 -29,5 -0,20
OK-1258 137,5 -0,34 OK-1144 23,5 -0,73 OK-1080 -30,5 -0,19
OK-1255 134,5 -0,25 OK-1138 17,5 -1,45 OK-1078 -32,5 -0,15
OK-1250 129,5 -0,69 OK-1137 16,5 -1,42 OK-1077 -33,5 -0,16
OK-1246 125,5 -0,48 OK-1136 15,5 -1,55 OK-1076 -34,5 -0,19
OK-1242 121,5 -0,62 OK-1131 12 -1,64 OK-1074 -36,5 -0,08
OK-1240 119,5 -0,25 OK-1130 11 -1,56 OK-1070 -40,5 -0,06
OK-1238 117,5 -0,62 OK-1128 9 -1,26 OK-1066 -44,5 -0,14
OK-1236 115,5 -0,53 OK-1127 8 -1,20 OK-1065 -45,5 -0,06
OK-1234 113,5 -0,69 OK-1126 7 -1,39 OK-1062 -48,5 0,05
OK-1232 111,5 -0,79 OK-1125 6 -1,58 OK-1060 -50,5 -0,26
OK-1230 109,5 -0,42 OK-1124 5 -1,83 OK-1059 -53 -0,01
OK-1226 105,5 -0,59 OK-1123 4 -1,59 OK-1057 -57,5 -0,06
OK-1224 103,5 -0,76 OK-1122 3 -1,55 OK-1056 -59,5 -0,16
OK-1222 101,5 -0,74 OK-1121 2,5 -1,60 OK-1055 -61,5 -0,39
OK-1220 99,5 -0,67 OK-1120 2 -1,47 OK-1053 -65,5 -0,43
OK-1218 97,5 -0,68 OK-1118 1 -1,52 OK-1052 -67,5 -0,27
OK-1214 93,5 -0,73 OK-1117 0,5 -1,27 OK-1049 -72,5 -0,18
OK-1212 91,5 -0,65 OK-1114 -0,5 0,15 OK-1047 -81,5 -0,07
OK-1209 88,5 -0,78 OK-1113 -1 0,00 OK-1045 -88,5 -0,31
OK-1206 85,5 -0,65 OK-1112 -1,5 -0,11 OK-1044 -91,5 -0,15
OK-1202 81,5 -0,67 OK-1111 -2 -0,42 OK-1043 -94,5 -0,21
OK-1200 79,5 -0,65 OK-1110 -2,5 0,02 OK-1042 -97,5 0,12

5454
CHAPTER II
OK-1196 75,5 -0,82 OK-1108 -3,5 -0,42 OK-1041 -99,5 -0,20
OK-1194 73,5 -0,90 OK-1107 -4 -0,28 OK-1040 -101,5 -0,15
OK-1192 71,5 -0,87 OK-1106 -4,5 -0,19 OK-1038 -105,5 -0,12
OK-1190 69,5 -0,79 OK-1105 -5,5 -0,17 OK-1037 -108,5 -0,19
OK-1188 67,5 -0,75 OK-1103 -7,5 -0,26 OK-1036 -111,5 -0,30
OK-1186 65,5 -0,73 OK-1102 -8,5 -0,57 OK-1035 -113,5 -0,33
OK-1184 63,5 -0,76 OK-1101 -9,5 -0,73 OK-1034 -116,5 -0,30
OK-1182 61,5 -0,74 OK-1100 -10,5 -0,24 OK-1032 -122,5 -0,05
OK-1180 59,5 -0,68 OK-1098 -12,5 -0,25 OK-1030 -129,5 -0,34
OK-1178 57,5 -0,78 OK-1096 -14,5 -0,24 OK-1029 -132,5 -0,14
OKÇULAR SECTION GÖYNÜK NORTH SECTION
Sample No Depth (cm) δ13C (‰) Sample No Depth (cm) δ13C (‰)
OK-1028 -135,5 -0,31 GN-55 80 0,74
OK-1027 -137,5 -0,38 GN-48 45 0,63
OK-1026 -140,5 -0,35 GN-46 35 0,73
OK-1025 -143,5 -0,22 GN-44 25 0,66
OK-1024 -145,5 -0,25 GN-42 18 1,05
OK-1023 -148,5 -0,50 GN-39 10 0,38
OK-1022 -151,5 -0,38 GN-39A 10 0,47
OK-1021 -154,5 -0,57 GN-38 8 0,39
OK-1020 -156,5 -0,70 GN-35 2 -0,05
OK-1019 -159,5 -0,65 GN-33 -1 1,23
OK-1018 -161,5 -0,67 GN-32 -2 1,23
OK-1017 -164,5 -0,53 GN-32A -2 1,36
OK-1016 -167 -0,40 GN-31 -4 1,43
OK-1014 -175,5 -0,42 GN-30A -6 1,21
OK-1013 -178,5 -0,24 GN-29 -8 1,34
OK-1011 -189,5 -0,56 GN-27 -10 1,36
OK-1009 -196,5 -0,56 GN-26 -13 1,46
OK-1008 -199,5 -0,49 GN-25 -14 1,29
OK-1006 -212,5 -0,56 GN-24 -15 1,40
OK-1005 -216,5 -0,56 GN-23 -18 1,32
OK-1003 -224,5 -0,89 GN-22 -19 1,34
OK-1002 -227,5 -0,92 GN-21 -21 1,44
OK-1001 -230,5 -0,94 GN-20 -25 1,43
GN-19 -30 1,53

5555
A NEW K-PG BOUNDARY LOCALITY IN THE MUDURNU-GÖYNÜK BASIN
GN-17 -40 1,28
GN-16 -45 1,30
GN-13 -60 1,36
GN-12 -65 1,46
GN-11 -70 1,45
GN-9 -80 1,35
GN-8 -85 1,18
GN-7 -90 1,09
GN-6 -95 1,20
GN-5 -100 1,27

56

5757
RAPID SHORT-TERM COOLING FOLLOWING THE CHICXULUB IMPACT
CHAPTER III
Rapid short-term cooling following the Chicxulub impact at the Cretaceous-Paleogene boundary

5858
CHAPTER III

5959
RAPID SHORT-TERM COOLING FOLLOWING THE CHICXULUB IMPACT
AbstractThe mass extinction at the Cretaceous-Paleogene boundary, ~66 Million years ago, is thought to be caused by the impact of an asteroid at Chicxulub, present day Mexico. While the precise mechanisms that led to this mass extinction remain enigmatic, most postulated scenarios involve a short-lived global cooling, a so-called ‘impact winter’ phase. Here, we document a major decline in sea surface temperature during the first months to decades following the impact event, using TEX86 paleothermometry of sediments from the Brazos River section, Texas, USA. We interpret this cold spell to reflect the first direct evidence for the effects of the formation of dust and aerosols by the impact and their injection in the stratosphere, blocking incoming solar radiation. This ‘impact winter’ was likely a major driver of mass extinction because of the resulting global decimation of marine and continental photosynthesis.

6060
CHAPTER III

6161
RAPID SHORT-TERM COOLING FOLLOWING THE CHICXULUB IMPACT
1. IntroductionThe Cretaceous-Paleogene (K-Pg) boundary mass extinction was one of the most devastating
events in the Phanerozoic history of life both on land and in the oceans (Bambach, 2006; Alroy, 2008). It is widely acknowledged to be related to the impact of an asteroid with an estimated diameter of ~10 km at Chicxulub, Yucatan Peninsula, Mexico (Alvarez et al., 2008; Smit and Hertogen, 1980; Schulte et al., 2010). Impact-models suggest that the first hours after the impact were characterized by earthquakes and tsunami’s, and the so-called ‘fireball‐stage’, including an intense heat pulse resulting from the return flux of larger ejecta, in turn resulting in global wildfires (Robertson et al., 2004). Next, the dust and sulfur aerosols, originating from the anhydrite target rocks, are predicted to have partially blocked incoming solar radiation leading to an “impact winter” (Pope et al., 1997; Pierazzo et a., 1998), potentially further amplified by soot derived from burning of fossil organic matter in targeted sediments, a strong absorber of short-wave radiation (Harvey et al., 2008). This dark phase is proposed to have temporarily inhibited photosynthesis, causing a global collapse of terrestrial and marine food webs (Schulte et al., 2010; Kring, 2007).
Model simulations suggest that the amount of sunlight reaching Earth’s surface was potentially reduced to ~20% (Pope et al., 1997). This implies a ~ 170 W*m-2 reduction in energy supply, that should have resulted in a severe but short‐lived drop in global surface temperature (Kring, 2007; Pierazzo et al., 2003). The resulting enhanced contrast between relatively warm oceans and cold atmosphere likely fuelled large storms and hurricanes (Covey et al., 1994; Emanuel et al., 1995), increasing the residence time of dust in the atmosphere. In the months to decades following the impact, the atmosphere probably stabilized and dust began to rain down and accumulate in depositional settings. This included asteroid-derived trace elements, globally recognized as a peak in Platinum Group Elements (PGE; including Iridium) concentrations in complete marine and terrestrial successions (Claeys et al., 2002). Crucially, fossil evidence for this ‘impact winter’ scenario is still missing since this period of reduced solar radiation may only have lasted several months to decades (Pope et al., 1994; Pierazzo et al., 1998; Galeotti et al., 2004; Harvey et al., 2008), generally too short to be captured in the ancient sedimentary record. In case of the K-Pg boundary this is even more complicated because the traditional proxy-carriers for the surface ocean conditions, calcareous microfossils, experienced major extinction (Hull et al., 2011). Furthermore, diagenetic alteration is commonly noted in post extinction biotic carbonates, inhibiting accurate temperature reconstructions (Magaritz et al., 1992).
Among the few sections with potentially sufficient temporal resolution across the K-Pg boundary are the exceptionally well-preserved and well-studied outcrops exposed along the Brazos River between Waco and Hearne, Texas, USA (31° 7’53.59”N, 96°49’26.08”W; Fig. 1). In the Late Cretaceous and early Paleogene, the Brazos area was characterized by nearly continuous and predominantly siliciclastic sedimentation on the shallow shelf of the northern Gulf of Mexico, close to the entrance of the Western Interior Seaway (Davidoff, 1993; Kennedy et al., 1998), at estimated depths of 75 to 200 m (Bourgeois et al., 1988; Smit et al., 1996). The sedimentary successions in this region comprise the Maastrichtian Corsicana (Kemp Clay) Formation and the Paleocene basal and upper Littig members of the Kincaid Formation.
At Brazos River, the K-Pg boundary interval has been further subdivided in a series of the lithological units (Units A to J; Fig. 2) (Bourgeois et al., 1988; Smit et al., 1996). The upper Maastrichtian fossiliferous shales of the Corsicana Formation (Unit A) (Hansen et al., 1987; Smit et al., 1996) are overlain by the basal part of the Paleocene Kincaid Formation, consisting of a sequence of sandstone layers yielding multiple types of clasts and shell debris (Units B, C & D)

6262
CHAPTER III
that have been interpreted as impact-triggered tsunami deposits (Smit and Romein, 1985; Hansen et al., 1987; Bourgeois et al., 1988; Smit et al., 1996; Schulte et al., 2006). The top of this sandstone complex comprises abundant burrows. The overlying complex of organic-rich silts and mudstones (Units E, F and G) include the Ir anomaly, consisting of scattered and smeared-out peaks of up to 2 ppb (Hansen et al., 1987; Smit et al., 1996) (Supplementary Information).
Traditionally, the age model of the Brazos River 1 (BR1) section is based on biostratigraphy, the Ir anomaly and the identification of impact-related tsunami beds (Fig. 3). Here, we update this age model with higher resolution planktic foraminifer and organic-walled dinoflagellate cyst (dinocyst) biostratigraphy (SI Materials and Methods Fig. 3). We also present a grain size record to further refine the temporal sequence of events following the impact. Finally, we generated TEX86 paleo-sea surface temperature (SST) proxy record to assess temperature changes across the K-Pg boundary at Brazos River. The TEX86 paleo-thermometer is based on glycerol dibiphytanyl glycerol tetraether (GDGT) lipids produced by marine Thaumarcheota (Schouten et al., 2002). A full methodological description is available in SI Materials and Methods. Our study is the first to apply the TEX86 SST proxy to reconstruct very fast (decadal) changes in deep time. Critically, mesocosm and sediment trap studies have shown that in the modern ocean, the Thaumarchaeota that produce the GDGTs adjust their membrane lipids to ocean water temperatures within weeks (Wuchter et al., 2004; Wuchter et al., 2006). Furthermore, Thaumarchaeota have been shown to be
Figure 1.A paleogeographic map of the Gulf of Mexico at the end of the Cretaceous. The Brazos-1 locality (red dot) and the Chicxulub crater are indicated, as well as other sites (green dots) with K-Pg impact-related tsunamites, slumping, faulting and sliding compiled in Smit et al (1996). Paleogeography based on Stéphan et al. (1990).
0 500 km faults
Brazos River
Chicxulub crater
impact related slumping
impact related faulting/sliding
impact triggered tsunamites

6363
RAPID SHORT-TERM COOLING FOLLOWING THE CHICXULUB IMPACT
able to grow chemoautotrophically in complete darkness (Wuchter et al., 2004). Therefore, strong changes in SST over months to decades, as projected to have occurred during an “impact winter”, can be recorded using TEX86.
2. Results and DiscussionThe grain-size data show that the complex of Units E, F and G is fining upwards (see Fig.
2), suggesting that it was formed in a rapid depositional event (Smit et al., 1996). This material was probably initially deposited as the settling tail-end of the impact-induced tsunami/seiche (Bourgeois et al., 1988; Smit et al., 1996) and subsequently re-suspended during post-impact storms (Hansen et al., 1987; Hart et al., 2012). Such storms might have been triggered by the enhanced contrast between warm oceans and cold atmosphere during an impact winter (Covey et al., 1994). Supporting evidence for these storms has also been found in the Geulhemmerberg section in the Netherlands, where the lowermost Danian is characterized by an alternating sequence of shell hashes and clays, interpreted to be related to episodic storm wave activity alternated with unusually low energy conditions (Smit and Brinkhuis, 1996). At Brazos river, the rapid deposition of the complex of Units E, F and G would have occurred in the waning stages of such storms. Numerical model experiments have shown that the temperature contrast causing these storms lasted for less than a century (Galeotti et al., 2004). Therefore, we assume that Units E, F and G were deposited less than 100 years after the impact. The occurrence of the Ir anomaly within this complex confirms our estimation of the maximum duration of the deposition of Units E, F and G, since the settling down of PGE-bearing impact dust likely occurred on a similar timescale (Kring and Durda, 2002). Modern day examples of dust input by volcanic eruptions, burning oil wells and nuclear bomb testing resulted in settling times of months to years (Mackinnon et al., 1984; Hobbs and Radke, 1992; Oman et al., 2006; Robock et al., 2007). Various studies have indicated that with high-energy events such as nuclear explosions and asteroid impacts black carbon particles and aerosols are knocked into the upper stratosphere, where they quickly spread globally and produce a long lasting climate forcing (Robock et al., 2007). With these kind of events, particles and aerosols end up much higher than for example volcanic aerosols, which typically end up just above the tropopause (Oman et al., 2006). As a result, aerosols produced by large impacts will have a residence time that is considerably longer than those produced by for example volcanos and burning oil wells.
Some of these estimates do not include the time it takes for particles to sink from the sea surface to the seafloor, which significantly prolongs the settling time for the very fine fraction to which the impact-derived PGEs are believed to be associated (Claeys et al., 2002; Kring and Durda, 2002). Moreover, the proposed extraordinary large storms during the initial impact winter phase might have temporarily re-suspended material, both in the atmosphere as well as in the ocean, further delaying the deposition of PGE-bearing impact dust. As a result, previous studies have resulted in a wide range of different estimated settling times, ranging from <10 years up to >10 kyr, although these latter values seem improbable because mechanisms to keep particles suspended for such prolonged periods of time appear lacking (Kring and Durda, 2002). With estimated water depths of 75 to 200 m (Bourgeois et al., 1988; Smit et al., 1996), settling time of PGE-bearing impact dust will have been in the order of 1-100 years at the Brazos river site. The scattered nature of the Ir record, combined with the dinocyst assemblages, implies that the complex of Units E, F and G reflects a mixture of earliest Paleocene and reworked uppermost Maastrichtian materials.
Given the time required to deposit the Iridium on the sea floor and given the presence of burrows in the top of the underlying tsunami deposited sandstone Unit D, the rapid deposition of this mixture eventually took place years to decades after the impact. Therefore, although mixed, the

6464
CHAPTER III
complex of Units E, F and G provides a unique insight in the environmental conditions in the first decades following the K-Pg boundary impact.
Figure 2.Sample positions of the 1995 sample set, plotted with lithological units, mean grain size on the Krumbein phi (φ) scale and four different Iridium profiles, from (Ganapathy, 1981; Asaro et al., 1982; Hansen et al., 1993; Rocchia et al., 1996). Note the scale difference between the Maastrichtian interval and the Danian interval.
1 20
Iridium concentration
Ir (ppb)
Asaro, 1982 & Hildebrand, 1992
Rocchia, 1996Hansen, 1993
Ganapathy, 1981
Lith
olog
ic u
nits
B/C
G
D
H
I
FE
A
J
46
14
2426
34
44
12
18
22
28
32
38
10
20
30
4042
86
16
36
545352515048
60
59
58
57
56
55
42
4947
4345
15
1113
171921232527293133
373941
35
97531
6162636465
Sam
ple
posi
tions
Lith
olog
y
(Han
sen
and
othe
rs, 1
987)
Phi9 68 7 5 4
Mean grainsizeDep
th (m
)
-500 -400
-300 -200
0
50
100
150
200
250
300
350
400
450

6565
RAPID SHORT-TERM COOLING FOLLOWING THE CHICXULUB IMPACT
Our TEX86 proxy record can be subdivided in three phases/intervals (I-III; Fig. 3). Interval I shows that Uppermost Cretaceous SSTs were stable and high, with values of ~30-31⁰C using the calibration (Kim et al., 2010), in agreement with published proxy records and climate model simulations for the Upper Cretaceous (Pearson et al., 2001; Donnadieu et al., 2006). Within the tsunami deposits, TEX86 values cannot be used to reconstruct SST because of high concentrations
Figu
re 3
.A
ge-m
odel,
and
gra
in s
ize
resu
lts a
t th
e Br
azos
-1 s
ectio
n. (
A)
Lith
ostra
tigra
phy
and
bios
tratig
raph
y, in
cludi
ng c
alcar
eous
nan
nofo
ssil,
plan
ktic
fora
min
ifera
and
din
ocys
t bi
ostra
tigra
phy,
at B
razo
s-1.
(B)
-bas
ed p
aleo
SST
rec
onstr
uctio
n. (
C)
Zoo
m o
f th
e re
cord
acr
oss
the
K-P
g bo
unda
ry
inte
rval.
(D) F
our
diffe
rent
Ir
reco
rds
acro
ss th
e K
-Pg
boun
dary
inte
rval
at th
e Br
azos
-1, f
rom
(Gan
apat
hy, 1
981;
Asa
ro e
t al.,
198
2; H
anse
n et
al.,
19
93; R
occh
ia e
t al.,
199
6; se
e Su
pplem
enta
ry In
form
atio
n. (E
) Lith
olog
y an
d gr
ain
size
distr
ibut
ion
on th
e K
rum
bein
phi
(φ) s
cale
acro
ss th
e K
-Pg
boun
dary
inte
rval
and
Firs
t App
eara
nce D
atum
s (FA
Ds)
of th
e firs
t Dan
ian
dino
cyst
mar
ker s
pecie
s.
Lithologic units I AJ
34 P01 2Foram Zonation
Formation
Lithology
EpochCorsicanaKincaidLittig Mb.
Paleocene Upper Cretaceous
DCP
1a
DCP
0Dinocyst Zonation
Depth (cm)
B-DH E-G
Nanno Zonation Micula prinsii ZoneTE
X₈₆
(BIT
<0.3)
0.70.8
0.6
H
-450
-400
-350
-300
-250
-200
-150
-100
-50 0
50
100
150
200
250
300
350
400
450
SST
(°C)
IIIIIIInterval
Depth (cm)
-45
-40
-35
-30
-25
-20
-15
-10
-5
0
5
10
15
20
25
30
35
40
45
50
55
60
65
70
-50
Stage MaastrichtianDanian
GH F E D B/CI ALithologic units
1.0
2.0
0.0
Iridi
um
conc
entra
tion
Ir (p
pb)
Asa
ro, 1
982 &
Hild
ebra
nd, 1
992
Rocc
hia,
1996
Han
sen,
1993
Gan
apat
hy, 1
981
2428
3032
26SS
T (°C
)
0.70.8
0.6
Damassadinium cf. californica
Senoniasphaera cf. inornata
Mean grain size
AB
CD
E
Phi
84
6
DCM z (b)
P1bDCP1bDCP1c
NP2 NP1
2428
3032
26
TEX₈
₆ (B
IT<0
.3)H
B. romeinii T. impC. primus

6666
CHAPTER III
of terrestrially derived GDGTs (Weijers et al., 2006) (Supplementary Figs. 7 and 8). However, in the section directly above the main tsunami deposits (Units E, F and G; interval II) a distinct cooling phase is recorded, with average SSTs up to 2 ⁰C lower than pre-impact values and two significant drops of up to 7 ⁰C below pre-impact values. In the subsequent Interval III, SSTs are generally 1-2 ⁰C higher than those for the pre-impact deposits.
The most remarkable features in our data are the two prominent drops in SST in the post-impact, mixed tsunami- storm deposits. As indicated above, this interval, and likely also the GDGTs, represents a mixture of redeposited uppermost Maastrichtian and immediate post-impact materials that was eventually deposited within the settling tail of tsunami activity and in the waning stage of the post-impact storms. Variable amount of mixing of reworked uppermost Maastrichtian GDGT’s with basal Paleocene post-impact GDGT’s might explain the multiple peaks of both our TEX86 record and the Ir profiles. The chaotic nature of the basal Paleocene TEX86 record contrasts with relatively stable and warm uppermost Maastrichtian SSTs. Hence, the samples that yield the lowest SSTs probably represent a mixture of uppermost Maastrichtian and direct post-impact GDGTs with a relatively high abundance of post impact materials, causing substantially lower TEX86 values. Considering the stable and warm uppermost Maastrichtian, the immediate post-impact SSTs must have been substantially lower. Since rapid deposition of the complex of Units E, F and G occurred within 100 years after the impact, the cooling recorded in these units likely happened in the first months to decades following the K-Pg impact. Our SST record thus provides the first evidence for a transient, global “impact winter” after the K-Pg boundary impact. The duration of this cold spell is in agreement with coupled ocean-atmosphere model results, suggesting that impact induced dust and aerosol loading will result in lower SSTs for several decades, even after most of the dust has been removed from the atmosphere (Luder et al., 2002). Our results of short-term cooling following the K-Pg asteroid impact are supported by a migration of cool, boreal dinoflagellate species into the sub-tropic Tethyan realm directly across the K-Pg boundary interval (Brinkhuis et al., 1998; Galeotti et al., 2004) and the ingression of boreal benthic foraminifera into the deeper parts of the Tethys Ocean, interpreted to reflect millennial time-scale changes in ocean circulation following the impact, attributed to a hypothesized short-term cooling of 1-10 years (Galeotti et al., 2004).
The global “impact winter”, characterized by darkness and a dramatic cooling of ocean surface waters, perturbed a relatively stable, warm latest Cretaceous climate (Pearson et al., 2001) and likely represented a major stress factor for life on Earth. Therefore, it is expected to have been a key contributory element in the mass extinction at the K-Pg boundary. Additionally, when the large amount of aerosols injected into the atmosphere rained out they might have resulted in acidification of the surface oceans (D’Hond et al., 1994), a further stressor for surface dwelling organisms. The initial cooling was followed by a long-term warming trend (Brinkuis et al., 1998), also observed in our TEX86 record (Fig. 2), and in previously reported stable isotope analyses (Romein and Smit, 1981) that most likely is associated with greenhouse gasses released into the atmosphere from the vaporization of carbonate target rock, the mass-mortality and forest fires (Kring, 2007; Brinkhuis et al., 1998; Pierazzo et al., 1998; Harvey et al., 2008). Our study reveals a combination of environmental and climatological events that is compatible with the pattern of extinction of many biological clades, including most species of planktic foraminifera and many coccolithophorids, but also larger marine taxa like ammonites and marine reptiles, in addition to the dinosaurs and flying reptiles (Galeotti et al., 2004; Bambach, 2006; Alroy, 2008).

6767
RAPID SHORT-TERM COOLING FOLLOWING THE CHICXULUB IMPACT
3. Materials and MethodsFor TEX86 analyses, freeze-dried, powdered samples (~10 g dry mass) were extracted with an
accelerated solvent extractor using a 9:1 (v/v) dichloromethane (DCM):methanol solvent mixture. The obtained extracts were separated over an activated Al2O3 column, using 9:1 (v/v) hexane:DCM, ethyl acetate (100%), 95:5 (v/v) DCM:MeOH and 1:1 (v/v) DCM:methanol, into apolar, ethylacetate and tethraether and polar fractions, respectively. The tetraether fractions were analyzed by HPLC/APCI-MS (high-performance liquid chromatography/atmospheric pressure positive ion chemical ionization mass spectrometry) using an Agilent 1100 series LC/MSD SL. TEX86 indices were calculated and converted into temperature estimates as described in Supplementary Information (SI Fig. 7-10).
For palynological analyses, oven-dried samples (~10-15 g dry mass) were spiked with Lycopodium spores to facilitate the calculation of absolute palynomorph abundances. Chemical processing comprised treatment with 10% HCl and 40% HF for carbonate and silica removal, respectively. Ultrasonication was used to disintegrate palynodebris Residues were sieved over a 15-μm mesh and mounted on microscope slides, which were-analysed at x200 and x1000 magnification to a minimum of 200 dinocysts. A detailed, step-by-step processing protocol is given in Supplementary Information. Taxonomy used follows that cited in the Lentin and Williams Index of Fossil Dinoflagellates, 2004 (Fensome and Williams, 2004), unless stated otherwise. See Supplementary Information for taxonomical notes. All slides are stored in the collection of the Laboratory of Palaeobotany and Palynology, Utrecht University, the Netherlands.
For analyses of planktic foraminifera, standard micropaleontological techniques were applied (Supplementary Information).
The grain size distribution was determined on a Fritsch A-22 laser particle sizer (Supplementary Information).

6868
CHAPTER III

6969
RAPID SHORT-TERM COOLING FOLLOWING THE CHICXULUB IMPACT
4. Supplementary Information4.1 Materials4.1.1 Geological setting
The K-Pg boundary deposits outcropping along the Brazos River between Waco and Hearne, Texas comprise an exceptionally well-preserved sedimentary succession (Ganapaty et al., 1981; Jiang and Gartner, 1986; Hansen et al., 1987; Bourgeois et al., 1988; Keller, 1989; Yancey, 1996; Smit et al., 1996; Heymann et al., 1998; Schulte et al., 2006). In most previous studies, the K-Pg boundary interval has been subdivided in a series of lithological units (Units A to J) first described in Hansen et al. (1987). The uppermost Maastrichtian Corsicana Formation consists of dark grey – brown mudstones, which are slightly laminated and include occasional shell hashes and other small mollusks. The top of the Corsicana Formation shows evidence of physical disruption with shell stringers and faint, plastically deformed clay clasts (Unit A). This soft-sediment deformation is most likely related to the force of the tsunami waves traversing the shelf. The basal coarse-grained part of the Paleocene Littig Member Unit B is scoured into Unit A and contains boulders and rip-up clasts. The Lower Littig Member consists of a distinct sequence of graded shell-hashes, cross-bedded sands and silts that is sometimes referred to as the K-Pg boundary “sandstone complex”
SI Figure 1.Compilation of published iridium profiles from the Brazos-1 section. These profiles can be directly compared, because they were sampled within a few m from each other.
Rocchia, 1996Asaro, 1982 &Hildebrand, 1992
Hansen, 1993
Lith
olog
ical
Uni
ts
Sect
ion
Phot
ogra
ph
-40
-30
-20
-10
0
10
20
30
40
50
60
70
-50
Dep
th (c
m)
A
B
C
DEF
G
H
I
1ppb1ppb1ppb 1ppb
Ganapathy, 1981

7070
CHAPTER III
(Units B-G) (Smit et al., 1996). The “sandstone complex” is further subdivided in a lower (B-D) and an upper complex (E-G). The lower complex is interpreted as tsunami deposits triggered by the Chicxulub impact on the Yucatan peninsula on present day Mexico (Hansen et al., 1987; Bourgeois et al., 1988; Hildebrand et al., 1991; Yancey, 1996; Smit et al., 1996;). Abundant altered impact spherules have been found in the lower B/C units (Smit et al., 1996), mixed in with backwashed local seafloor debris such as shell hash, fish-teeth, glauconite pellets and shallow-water foraminifera. Unit D consists of cross-bedded medium to fine-grained sands, displaying mainly climbing-ripple tracts from the tsunami backwash. The sequence C-E may repeat locally up to four times, reflecting backwash from several individual tsunami surges. The upper complex of the K-Pg boundary “sandstone complex” comprises Units E, F and G, grading from very fine sand, to silt to mudstone. The base of this complex consists of a 1-2 cm thick siltstone (Unit E), overlain by a silty limestone (Unit F, 8 cm thick), and a subsequent grey claystone (Unit G, 10 cm). This complex shows a normal gradation and has previously been interpreted to be deposited within a time span of 24 hours to weeks, as part of the settling phase of the tsunami/seiche complex deposited directly after the K-Pg boundary bolide impact (Smit et al., 1996) in the Gulf. However, the Iridium records already show elevated levels at the base of Unit E (Ganapathy et al., 1981; Asaro et al., 1982; Hansen et al., 1987; Rocchia et al., 1996; see SI Fig 1). Since it may take days to years to deposit the very fine-grained impact-derived Platinum Group Elements (PGEs) on the sea floor (Robin et al., 1991; Kring and Durda, 2002), the complex of Units E-G probably represents a rapid depositional event that may have occurred at least weeks after the K-Pg boundary tsunami, largely as the deposition of suspended material after the waning of the tsunami waves, combined with disturbances by the large storms and hurricanes that occurred in the decades following the K-Pg boundary impact (Emanuel et al., 1995; Hart et al., 2012) (see discussion under Section 3). The PGE-bearing, immediate post-impact sediments deposited directly on top of the tsunami deposit have probably been rapidly redeposited in the upper complex of Units E-G by these storms. This upper complex is overlain by a 5 cm thick, laminated sandy bed with small shells and thin clay flakes (Unit H), which may represent a storm lag deposit of the last great storm passing this site. Following this is Unit I, a ~2.5 m thick silty claystone that is herein interpreted as representing the resumption of normal marine shelf sedimentation at this site. This unit is unconformably overlain by a conglomerate of the Kincaid Formation, the upper Littig Member (Unit J). This member is composed of a 0.3-0.6 meter thick glauconitic sandy clay with grains, granules and pebbles, followed by a marly claystone bed which forms the top of the section.
4.1.2 SamplingAt Brazos River, the Paleocene stratigraphy differs considerably from outcrop to outcrop
(Hansen et al., 1987), so first and last appearances and amount of reworking are difficult to compare between the various outcrops. The Brazos-1 outcrop (BR1), the first well-studied outcrop has been partially destroyed due to sampling excavations and currently inaccessible because of recent fluvial activity, which renders additional sampling difficult. Our analyses on organic-walled dinoflagellate cysts, biomarkers (TEX86), planktic foraminifers and grain size were all performed on a sample set acquired in 1995, when the outcrop was still relatively well exposed and accessible. This sample set was taken within a few meters from the section where Hansen et al., (1987) and Jiang and Gartner (1986) obtained their samples of mollusks and calcareous nannofossils (SI Fig. 2), minimizing the stratigraphic differences between our and the earlier published biostratigraphic results.
In the extensive 1995 sampling performed at BR1, great care was taken to acquire unweathered rock samples, to limit possible contamination by for example modern soil microbiota. A closely

7171
RAPID SHORT-TERM COOLING FOLLOWING THE CHICXULUB IMPACT
spaced sample set was obtained, to attain a high temporal resolution. The stratigraphic position was measured from the base of the graded silty limestone, Unit F, since this level is sharp, well visible and constant throughout Brazos-1 and the other outcrops in the Brazos area. In total, about 100 samples were collected between 500 cm below the base of Unit F and 420 cm above the base of Unit F. The beds directly above the top of the sandstone (interval E-H) were sampled in large continuous blocks, which were slabbed in slices of 0.5 cm thickness. Unit I was sampled at 5 cm spacing in the first 2.5 m above the sandstone beds, the remainder to the Littig bed at 10cm and the top of the section at 25 cm intervals. The samples were split in aliquots for analysis of planktic and benthic foraminifers, organic-walled dinoflagellate cysts and TEX86 analysis. All samples were oven-dried at 60°C and stored at the VU University Amsterdam Faculty of Earth and Life Sciences sample storage, the Netherlands. A selection of these samples was used in the present study.
4.2 Methods4.2.1 Planktic foraminifera
To construct a biostratigraphic framework for the section, 65 samples were weighed and washed over a nylon mesh of 63μm. A split of the >63μ fraction was analyzed using a binocular at magnification of 125x and from the >124μ fraction about 200-400 specimens were randomly picked and counted. The remaining residue was searched for rare specimens and species.
4.2.2 PalynologyPalynological processing followed the standardized quantitative methods used at the
Laboratory of Palaeobotany and Palynology, Utrecht University, The Netherlands (Houben et al., 2011). Briefly, approximately 10 g of each sample was crushed, oven dried (60⁰C), weighed and a known amount (10679, 1φ = 5%) of modern Lycopodium clavatum spores was added. The
SI Figure 2.Brazos-1 outcrop situation in 1981, when the outcrop was still easily accessible. See pen for scale.

7272
CHAPTER III
samples were then treated with 10% HCl and subsequently with 40% HF to dissolve carbonate and siliceous components, respectively. The residue was sieved over nylon mesh sieves of 250 μm and 15 μm. From the residue of the 15-250 μm fraction, quantitative slides were made on well mixed representative fractions. In the present study, 84 samples were analyzed for palynology. Per sample, a minimum of 200 dinocysts was identified to the species level at ~500x magnification.
4.2.3 Organic geochemical analysesOrganic compounds were extracted from powdered and freeze-dried rock samples of
approximately 10 g with dichloromethane (DCM)/methanol (MeOH) (9:1, v/v) using a DIONEX accelerated solvent extractor (ASE 200) at a temperature of 100°C and a pressure of 7.6 x 10⁶ Pa. Excess solvent was removed by means of rotary evaporation under near vacuum. The total extracts were separated in 4 fractions over an activated Al2O3 column successively using hexane:dichloromethane (DCM) (9:1, v/v), ethyl acetate (100%), DCM:MeOH (95:5, v/v) and DCM:MeOH (1:1, v/v).
Following this, 250 ng of a C46 Glycerol Trialkyl Glycerol Tetraether internal standard (Huguet et al., 2006) was added to the DCM:MeOH (95:5, v/v) fraction for quantification purposes. This fraction was subsequently dried and redissolved in a hexane:isopropanol (99:1, v/v) solvent mixture and filtered using a 0.45 μm mesh, 4 mm diameter polytetrafluoroethylene (PTFE) filter prior to analysis. Samples were analyzed using high performance liquid chromatography/atmospheric pressure positive ion chemical ionization mass spectrometry (HPLC/APCI-MS).
HPLC/APCI-MS analyses were performed according to ref (Schouten et al., 2007), using an Agilent 1100 series LC/MSD SL and separation over a Prevail Cyano column (2.1 x 150 mm, 3 μm; Alltech), maintained at 30°C. Glycerol Dibiphytanyl Glycerol Tetraethers (GDGTs) were eluted using the following gradient in the hexane:isopropanol mixture as follows; hexane:propanol (99:1, v/v) for 5 minutes, then a linear gradient to hexane:propanol (98.2:1.8, v/v) in 45 minutes, with a flow rate of 0.2 ml per minute. Selective ion monitoring was set to scan the 8 [M+H]+ ions of the GDGTs. The TEX86 index values were calculated following ref (Schouten et al., 2002). Since we apply the TEX86 paleothermometer on samples from a mid-latitude site from a Cretaceous-Paleogene greenhouse world, unambiguously characterized by high sea surface temperatures (SSTs) (>15⁰C), we applied the calibration from ref (Kim et al., 2010) to translate TEX86 index values to mean annual sea surface temperature:
SST = 68.4 × TEX86H + 38.6
where
TEX86H = log(TEX86)
and
TEX86 =[GDGT − 2] + [GDGT − 3] + [Cren’]
[GDGT − 1] + [GDGT − 2] + [GDGT − 3] + [Cren’]
where GDGT numbers refer to figure 1 in Kim et al. (2010).

7373
RAPID SHORT-TERM COOLING FOLLOWING THE CHICXULUB IMPACT
P. minutula,
P. eugubina,
P. alabamensis
Thoracosphaera spp
Braarudosphaera spp
Micula decussata
Bisc. romeinii
CNPF
DC
KPg
Damassadinium cf. californica
Senoniasphaera cf. inornata
GH F E D B/CI A
Lithologic units
Lithology
1.0
2.0
0.0
Iridi
um
conc
entr
atio
n
Ir (p
pb)
Asa
ro, 1
982
Roc
chia
, 199
6H
anse
n, 1
993
Gan
apat
hy, 1
981
Interval
2428
3032
26SS
T (º
C)
0.7
0.8
0.6
TEX8
6 (B
IT<0
.3)
Phi
87
54
32
6Sm
it, 1
996
this
pap
er
Mea
n gr
ain
size
Depth (cm)
-40
-30
-20
-10
0
10
20
30
40
50
60
70
80
90
100
110
120
130
-50
Stage MaastrichtianDanian
Age
IIIIII
SI F
igur
e 3.
Biom
arke
r ran
ges o
f the
K-P
g in
terv
al of
the
Braz
os-1
sect
ion,
com
pare
d wi
th th
e T
EX86
pro
file,
iridi
um c
once
ntra
tions
, gra
in si
ze d
istrib
utio
n on
the
Kru
mbe
in p
hi (φ
) sc
ale a
nd li
thol
ogy.
The
calca
reou
s nan
nofo
ssil
(CN
) mar
kers
are
from
Jian
g an
d G
artn
er (1
989)
. Plan
ktic
fora
min
ifera
l (PF
) and
din
ocys
t (D
C) r
ange
s are
new
dat
a in
this
pape
r.

7474
CHAPTER III
4.2.4 Grain size analysisThe grain size distribution of each sample was determined in the same manner as the 1994
sample set described in Smit et al. (1996). The grain size distributions were determined on a Fritsch A-22 laser particle sizer. Each sample was first dissolved in HCL to remove all calcareous fossil and authigenic carbonate material, and the insoluble residue subsequently treated with 20% H2O2 to remove e.g. authigenic phases like pyrite and organic material. The remaining residue was dissolved in water with added Na2(P2O5) to prevent coagulation of clay particles during the analytical runs. The laser diffraction patterns were translated into a grain-size distribution according to the Fraunhofer model. In SI Fig. S3 the mean grain-size is drawn, showing the siliciclastic grain size of the tsunamigenic cross-bedded sands of units B-E, followed by the overall graded units F-I.
4.3 Age model4.3.1 Iridium
The high-resolution age model used in this study is based on the Ir-anomaly and calcareous nannoplankton, planktic foraminifer and organic-walled dinoflagellate cyst (dinocyst) biostratigraphy (see SI. Fig. 3). Various studies have been published on the Iridium anomalies at the sites in the Brazos River area (Ganapathy et al., 1981; Asaro et al., 1982; Hansen et al., 1993; Rocchia et al., 1996), showing as series of irregular peaks in lithological Units E, F and G. (SI Fig. 1). It is likely that the PGE bearing impact dust settled within months to years after the impact and was subsequently reworked in the lag deposits of post-impact storms (Robin et al., 1991; Kring and Durda, 2002), explaining the scattered and smeared out nature of the Iridium profile. Since the enhanced contrast between warm oceans and cold atmosphere, triggering the storms after the impact, likely lasted for less than a century (Galeotti et al., 2004), we assume that this is the maximum amount of time represented by units E, F and G.
4.3.2 Calcaerous nannofossilsJiang and Gartner (1986) published detailed, semi-quantitative nannofossil data from a closely
spaced sample set from the same Brazos-1 locality. Based on the lateral lithological continuity at this site we assume that their results can be tied in with our biostratigraphic data (see SI Fig. 3), although they did not specifically mention the limestone of unit F. They demonstrated that the top of the Corsicana Formation comprises the uppermost Maastrichtian Micula murus Zone and that the overlying Kincaid Formation contains a rapid succession of basal Paleocene assemblages, thereby recognizing that the contact between these two formations represents the K-Pg boundary. The basal meter of the Kincaid Fm, above the tsunami K-Pg boundary sandstone complex, is dominated by inferred ‘disaster’ taxa, such as species of the calcareous dinoflagellate cyst genus Thoracosphaera and the calcareous nannoplankton species Braarudosphaera bigelowii. Blooms of Thoracosphaera have been recorded in the earliest Paleocene at many different sites (Lottaroli and Catrullo, 2000; Gardin, 2002) and are considered a characteristic feature for the lowermost Danian. The first true Paleocene nannoplankton species (Biscutum romeinii) occurs ~1 meter above the base of the Kincaid Formation (see figure 3 of Jiang and Gartner, 1986).
4.3.3 Planktic foraminiferaThe foraminiferal biozonation applied in this paper largely follows Olsson et al. (1999), with a
few refinements of the basalmost Paleocene as already discussed in Smit (1982) (SI Figs. 3-5). The biostratigraphically important datum events of the earliest Paleocene species are discussed here (see taxonomic notes in Supplementary Information.

7575
RAPID SHORT-TERM COOLING FOLLOWING THE CHICXULUB IMPACT
SI Figure 4. Plate.Important planktic foraminiferal biomarkers from the Brazos-1 section (A-C) Parvulorugoglobigerina minutula Br95-29. (D-F) P. alabamensis D-E; Br95-29, F; Br95-29 (G-I) P. eugubina. (G) Br95-27, (H) Br95-31, (I)Br95-45. ( J) Morozovella pseudobulloides, Br95-59 (K) Eoglobigerina eobulloides, Br95-47. (L) Globoconusa daubjergensis Br95-46.

7676
CHAPTER III
The Maastrichtian samples Br95-61/70 (See SI Table 1 for a sample list) contain well-preserved, moderately abundant Maastrichtian planktic foraminiferal assemblages. However, the larger species such as G. contusa, G. stuarti, R. fructicosa and A. mayaroensis are missing due to the shallow paleodepth of the Brazos sections. The planktic/benthic foraminifer ratio is around 30-50%, indicating outer shelf conditions, indicative of a water depth of 50-100m (Schulte et al., 2006).
The first Paleocene taxon, P. minutula [G.extensa sensu Olsson et al. (1999)], appears in Br95-23, followed by the First Appearance Datum (FAD) of P. alabamensis [G. fringa sensu Smit, (1982)] in sample Br95-24. Chiloguembelina sp. and Woodringina sp. appear in sample Br95-30. These taxa are initially very rare and do not show up in the counts of 300 random selected specimens. P. eugubina appears in sample Br95-26. This sequence of FAD’s P. minutula-P. alabamensis-P. eugubina is remarkably similar to the expanded lowermost Paleocene section of el Kef in Tunisia (Olsson et al., 1999), and demonstrates that the zonation presented in SI Figure 5 is valid for extremely expanded sections for lower northern subtropical latitudes. In the majority of expanded and complete sections (such as Zumaya, Agost and Caravaca in Spain, and the Apennine sections in Italy, Bjala in Bulgaria) such successive first appearances cannot be distinguished, probably because of the homogenization by bioturbation. Biozone P0, -or G. cretacea zone- therefore attains a thickness in Brazos-1 of around 90 cm, all in background outer shelf mudstones, (Unit I) disregarding the combined thickness of 50 cm of the size-graded tsunami and storm-induced coarse-grained layers. (Units A-H).

7777
RAPID SHORT-TERM COOLING FOLLOWING THE CHICXULUB IMPACT
SI F
igur
e 5.
Fora
min
ifera
l and
org
anic-
walle
d di
nofla
gella
te c
yst z
onal
sche
me
used
in th
is pa
per.
The
inte
rval
of th
e ba
sal-m
ost D
ania
n is
subd
ivid
ed o
n th
e Fi
rst A
ppea
ranc
e D
atum
s (F
AD
s) of
earli
est D
ania
n sp
ecie
s, all
owin
g fo
r a co
mpa
rison
with
oth
er ex
pand
ed se
ctio
ns, s
uch
as at
El K
ef, T
unisi
a.
Bio
zone
s org
anic
-wal
led
dino
flage
llate
cys
tsD
inoc
yst D
atum
eve
nts
This
Pap
er
C.c
ornu
ta, D
. cal
iforn
icum
D. c
f. ca
lifor
nicu
mS.
cf.
inor
nata
D. c
arpo
spha
erop
sis
va
r. co
rnut
a
D. c
arpo
spha
erop
sis
DC
P1a
DC
P0
DC
M-z
DC
P1b
DC
P1c
Brin
khui
s and
Zac
haria
sse,
198
8
K-P
g bo
unda
ry
IV IV III II
Bio
zone
s pla
nktic
fora
min
ifera
Fora
m D
atum
eve
nts
This
Pap
erO
lsso
n et
al 1
999
Smit
1982
, 198
5K
elle
r et a
l 199
6
S. u
ncin
ata
S. in
cons
tans
S. tr
ilocu
linoi
des
Pv. e
ugub
ina
S. p
seud
obul
loid
esPv
eug
ubin
a ‘la
rge’
Eogl
obig
erin
a sp
p.Pv
eug
ubin
aPv
ala
bam
ensi
sPv
min
utul
a
P. h
antk
enin
oide
sP.
har
iaen
sis
G. g
anss
eri
A. m
ayar
oens
is
P2 P1c
P1b
P1a
P1a
P1a
P1a1
P1a
P1a2
P1b
P1c
P1d
P1c
P1b
P1c
P2
P1b
Pa5
Pa4
Pa3
Pa2
Pa1
Pa
P0P0
P0P0
CF1
CF2
CF3
CF4
CF1
CF2
CF3
CF4
A. m
ayar
oens
isM
aast
richt
ian
mas
s-ex
tinct
ion
plan
ktic
fora
min
ifera
S. d
eliti
ense
DC
P1d ab
Han
ssen
, 197
7
D. mutabilis Zone
Danea californica Zone
P. grallator ZoneC. inornatum SubzoneH. cryptosesiculata
Subzone
Unnamed intervalA. circumtabulata
SubzoneM. tenella Subzone
Unnamed interval

7878
CHAPTER III
4.3.4 Organic-walled dinoflagellate cysts Various studies have shown that organic-walled cyst-producing dinoflagellates do not experience extinctions across the K-Pg boundary. In contrast, they display a rapid succession of qualitative and quantitative events within planktic foraminiferal zone P0 that provides the basis for a high-resolution biostratigraphy for the lowermost Danian (Moshkovitz and Habib, 1993; Brinkhuis et al., 1998). The most important biostratigraphical dinocyst dates for the earliest Danian are the first occurrences of, subsequently, Senoniasphaera inornata, Damassadinium californicum and Carpatella cornuta (Moshkovitz and Habib, 1993; Brinkhuis et al., 1998). Also typical for dinocyst development across the K-Pg boundary are morphological changes of representatives of the ‘fibrous cribroperidinioids’ [cf. Sluijs and Brinkhuis, 2009), such as Cordosphaeridium spp., Disphaerogena spp. and Cribroperidinium spp.]. These changes involve the formation of distinct antapical and apical horns and in some genera strong variance of process types. The first signs of these morphological changes is found in Disphaerogena carposphaeropsis which forms an antapical and an apical horn and first occurs in the uppermost Maastrichtian in K-Pg boundary sections around the world (Moshkovitz and Habib, 1993; Prámparo and Papú, 2006).
Based on the lowermost en uppermost occurrences of stratigraphically important dinocyst species and forms, a dinocyst zonation can be produced for BR1 (see SI Figure 5). The uppermost Maastrichtian biostratigraphic marker D. carposphaeropsis with the typical apical and antapical horn (i.e. Disphaerogena carposphaeropsis var. cornuta) is found throughout the studied interval. The first lowermost Danian biostratigraphic marker Senoniasphaera cf. inornata is found just beneath lithological unit H, approximately 20 cm above the base of Unit F, in sample Br95-4b. This further substantiates that little time is represented by lithological units E, F and G. The stratigraphically important species Senoniasphaera cf. inornata differs slightly from Senoniasphaera inornata [For taxonomic notes on the dinocysts encountered in BR1, see Supplementary Information], which is found higher up in the section at the base of the Littig Member. The marker species D. cf. californicum first appears in Br95-14, 65 cm above the base of Unit F, the global biostratigraphic markers D. californicum and C. cornuta have their FAD at the base of the upper Littig members of the Kincaid Formation.
4.4 ConstraintsontheapplicationofTEX864.4.1 Introduction
The TEX86 SST proxy is based on the relative distribution of cyclopentane-containing isoprenoid GDGT lipids in the membranes of marine Thaumarchaeota (Schouten et al., 2002; Kim et al., 2010). These organisms have been shown to adjust the composition of these membrane lipids in response to changes in growth temperature (Wuchter et al., 2004). The distribution pattern is quantified as the so-called TEX86 (Tetraether index of 86 carbon atoms). This index shows a strong correlation with SST and appears to be independent of the initial seawater chemistry (Schouten et al., 2002; Wuchter et al., 2004; Kim et al., 2008; Kim et al., 2010). Therefore, TEX86 provides a means of reconstructing past mean annual average SSTs based on the tetraether membrane lipid composition preserved in sediments and sedimentary rocks (Schouten et al., 2002).
The TEX86 palaeothermometer has been successfully applied on a variety of Neogene, Paleogene and Cretaceous sites by various laboratories (Schouten et al., 2003; Forster et al., 2007; Sluijs et al., 2007; Bijl et al., 2010; Littler et al., 2011; Seki et al., 2012). Although the absolute values of the reconstructed temperatures are still subject of discussion, particularly at temperatures beyond the modern core-top calibration, the trends in TEX86 records are generally in good

7979
RAPID SHORT-TERM COOLING FOLLOWING THE CHICXULUB IMPACT
agreement with other palaeothermometers (δ18O, Mg/Ca,) and reflect known climate events e.g. warming during the PETM and late Eocene cooling (Schouten et al., 2003; Forster et al., 2007; Sluijs et al., 2007; Hollis et al., 2009; Liu et al., 2009; Wade et al., 2012).
4.4.2 Potential biases on TEX86High concentrations of Soil Organic Matter (SOM) in sediments can cause a substantial
bias in TEX86-reconstructed sea surface temperatures (Weijers et al., 2006). In outcrop sections possible contamination with GDGTs derived from modern soil bacteria often further hampers the application of the TEX86 paleothermometer. The relative amount of SOM in sediments can be approximated based on the analysis of tetraether lipids, using the so-called Branched and Isoprenoid Tetraether (BIT) index (Hopmans et al., 2004). To identify whether our TEX86 record is biased by the input of SOM, we have calculated the BIT index for all our samples. In our record, there is no significant correlation between TEX86 and the BIT-index (R2=0.0008, P-value=0.822, see SI Fig. S6), indicating that SOM in our samples did not bias our TEX86 record significantly. To nevertheless exclude all TEX86-reconstructed sea surface temperatures possibly biased by high concentrations of terrestrial-derived GDGTs, we discarded samples with a BIT-index exceeding the recommended (Weijers et al., 2006) threshold of 0.3 (see Fig. SI Fig. 6). A striking aspect of
R² = 0,0008
20
22
24
26
28
30
32
34
0.0 0.1 0.2 0.3 0.4 0.5 0.6 0.7 0.8
TEX vs BIT-index
P = 0,8216
SST
(TEX
86-H
)
BIT indexSI Figure 6.TEX86 derived sea surface temperatures plotted against BIT-index values. This plot indicates that there is no statistically significant correlation between SST and BIT, signifying our TEX86 record is not significantly biased by soil organic matter in our samples. Nevertheless, all samples with a BIT-index exceeding the recommended threshold of 0.3 (red diamonds) are discarded following Weijers et al. (2006).

8080
CHAPTER III
our BIT index record is the occurrence of prominent peaks of ~0.5 and ~0.65 in the tsunami-deposit and lithological unit H, respectively, superimposed on background values of ~ 0.1-0.2 (see SI Fig. 7). It is expected that backwash deposits of a tsunami comprise higher concentrations of terrestrial derived organic matter, potentially explaining this peak in the BIT record. Conversely, the larger grain size and higher porosity of these beds (Smit et al., 1996) makes them more prone to meteoric diagenesis and contamination with modern soil-derived organic material by percolating water. Hence, the peaks in the BIT record might also reflect input of modern soil-derived organic material.
Lith
olo
gic
un
its
I
A
J
BIT-index
Pa3
Pa4
P0
P1b
Pa1+2
Pla
nkt
on
ic F
ora
m
Zo
nat
ion
Form
atio
n
Lith
olo
gy
Epo
ch
Cors
icana
Kinc
aid
Litti
g M
b.
Pale
ocen
eU
pper
Cre
tace
ous
DCP1a
DCP0
Din
ocy
st Z
on
atio
nD
CM
-zD
CP
1cD
CP
1b
Dep
th (c
m)
B-D
HE-G
Cal
care
ou
s n
ann
ofo
ssil
Zo
nat
ion
Mic
ula
prin
sii
Zo
ne
NP
1
NP2
T im
p.
S
ub
zo
ne
B.
rom
ein
iiS
ub
zo
ne
C p
rim
us
Su
bzo
ne
TEX
0.7 0.80.6
H
-450
-400
-350
-300
-250
-200
-150
-100
-50
0
50
100
150
200
250
300
350
400
450
24 28 30 3226SST (ºC)
0.0 0.60.40.2
SI Figure 7.TEX86 record and BIT-index record of Brazos River. The recommended threshold of 0.3 of Weijers et al (2006) is indicated in the BIT-index graph. In the TEX86 record, red dots indicate samples with a BIT-index below 0.3 and yellow dots indicate samples with a BIT-index value exceeding 0.3.

8181
RAPID SHORT-TERM COOLING FOLLOWING THE CHICXULUB IMPACT
Another possible bias in TEX86 palaeothermometry can be introduced by the input of methanogenic and methanotrophic archaeal GDGTs, leading to erroneous SST reconstructions (Blaga et al., 2009; Weijers et al., 2011; Zhang et al., 2011). Potential contribution of methanogenic and methanotrophic archaeal GDGTs can be recognized using the ratio of GDGT-0/Crenarchaeol (Blaga et al., 2009) and the Methane Index (Zhang et al., 2011), respectively. In our study, the GDGT-0/Crenarchaeol ratio ranges between 0.08 – 1.01, well below the recommended threshold of 2.0 (Blaga et al., 2009), whereas the Methane Index ranges between 0.10-0.30, below the recommended threshold of 0.5 (Zhang et al., 2011). These values suggest that at BR1 there is little input of GDGTs derived from methanogenic or methanotrophic archaea.
4.4.3 Accuracy of TEX86 temperature estimatesIn the samples analyzed for this study, concentrations of isoprenoidal GDGTs range from
0.2-2 ng/g dry-weight sediment. The overall chromatography of the GDGTs was good, with proper signal to noise ratios (see SI Fig. 8). To test the reproducibility of these signals, approximately 10% of the samples were extracted and analyzed in duplicate. Of the samples, all but one had reproducibility better than 0.25 ºC (see SI Fig. 9). In one occasion (sample Br95-1G) a duplicate analysis resulted in a temperature difference of 1.1ºC. However, we cannot exclude that this difference actually reflects original sediment heterogeneity. This particular sample originates from lithological Unit F, interpreted as a mixed storm-lag deposit. Therefore, it is likely that this rock sample consists of a non-homogeneous mixture of uppermost Maastrichtian material and immediate post-impact materials. Similar discrepancies have been documented in the Iridium analyses of this interval (see section 3.1).
The calibration used in this study has a standard error of ±2.5 °C (Kim et al., 2010). The reconstructed absolute temperatures should be interpreted with care, but here we are more concerned with trends i.e. changes in ocean temperature rather than absolute temperatures. While TEX86 is calibrated to SST (Schouten et al., 2002), various studies suggested TEX86 might sometimes reflect deeper water temperatures (Huguet et al., 2007; Lopes dos Santos et al., 2010). However, the studied section was deposited at a shallow, shelf depositional environment (Bourgeois et al., 1988; Smit et al., 1996), excluding the possibility that the recorded trends would significantly differ from trends in SSTs.
Other potential problems with our TEX86 record include possible changes in ecology of Thaumarchaeota, e.g. a switch in growing season from summer to winter (Schouten et al., 2013). However, in the K-Pg boundary greenhouse, subtropical sites such as BR1 likely experienced a much smaller seasonality (Steuber et al., 2005; Donnadieu et al., 2006). Therefore, possible temperature effects of changes in growing season will be limited at BR1. Instead, our data demonstrate that the post-impact world was characterized by cool conditions for decades.

8282
CHAPTER III
min10 20 30 400
1000000
2000000
Base Peak Chromatogram
min10 20 30 400
200004000060000
m/z 1302-1303
min10 20 30 400
200004000060000 m/z 1300 - 1301
min10 20 30 400
200004000060000
m/z 1298 - 1299
min10 20 30 400
20000
40000 m/z 1296 - 1297
min10 20 30 400
200000
400000 m/z 1292 - 1293
min10 20 30 400
1000000
2000000
0 1 2 3
Cren
IS
0
1
2
3
Cren
Cren’
IS m/z 743.5 - 744.5
Retention Time (min)
Sign
al In
tens
ity
A
B
C
Retention Time (min)
Retention Time (min)
SI Figure 8.Partial HPLC/MS base peak chromatogram and mass chromatograms of a typical sample (95Br-59). Numbers refer to the GDGT numbers in equation 2.3. (A) Partial HPLC/MS base peak chromatogram. (B) Mass chromatograms of the GDGTs used in the determination of TEX86. Integrated peak areas are indicated in grey. (C) Mass chromatogram of the Internal Standard (IS) added for quantification purposes.

8383
RAPID SHORT-TERM COOLING FOLLOWING THE CHICXULUB IMPACT
4.5 TaxonomicNotes4.5.1 Taxonomic notes on planktic foraminifera
Parvulorugoglobigerina minutula (Luterbacher and Premoli Silva)Smit (1982), described specimens from El Kef, Tunisia that are the oldest Paleocene planktic
foraminifers as Globigerina minutula. This taxon has the typical smooth, microperforate wall textures as P. alabamensis and P. eugubina and is probably a derived taxon from G. cretacea (Olsson et al., 1999). However, we do not follow Olsson et al. (Olsson et al., 1999) in placing this taxon in P. extensa (Blow) as we regard, after study of the material of the type locality of P. minutula in Ceselli in the Apennines, P. extensa (sensu Olsson et al. (1999)) a junior synonym of P. minutula. Likewise, Globoconusa conusa (sensu Keller (1988b) is a synonym of P. minutula.
Parvulorugoglobigerina alabamensis (Olsson 1999)Smit (1977; 1982) described specimens of this taxon from Caravaca and el Kef as Globigerina
fringa. However, Olsson et al. (1999) demonstrated that the original holotype specimens of P. fringa (subbotina) are from a small cancellate species, more similar to Eoglobigerina spp. but unlike the specimens considered earlier as P. fringa. These specimens are closely similar to P. alabamensis (Olsson et al., 1999), and we place them in that taxon.
22
23
24
25
26
27
28
29
30
31
32
22 24 26 28 30 3223 25 27 29 31
samples vs. duplicates
�rst run
dupl
icat
e ru
nSS
T (T
EXh)
SST (TEXh)
SI Figure 9.TEX86 derived sea surface temperatures of samples processed in duplicate relative to their original values.

8484
CHAPTER III
4.5.2 Taxonomic Notes on organic-walled dinoflagellate cysts
Carpatella cf. cornutaDiscussion – This morphotype differs from Carpatella cornuta by having a less thick wall. In
this study it is regarded as a transitional form between Cribroperidinium sp. A of Brinkhuis and Schioler, 1996 and Carpatella cornuta s.s.
Cordosphaeridium fibrospinosum var. cornutaDiscussion – This taxon differs from Cordosphaeridium fibrospinosum by the development of
distinct apical and antapical horns.
Damassadinium cf. californicumDiscussion – This morphotype is distinguished from Damassadinium californicum by
having a less broad process base. In this study, this morphotype is regarded as a predecessor for Damassadinium californicum s.s.
Disphaerogena carposphaeropsis var. cornutaDiscussion – This morphotype is distinguished from Disphaerogena carposphaeropsis by having
formed an apical and antapical horn. This morphotype is very characteristic for the uppermost Maastrichtian and earliest Danian.
Senoniasphaera cf. inornataDiscussion – This morphotype differs from Senoniasphaera inornata by having a smaller size
and thinner outer wall. In this study this morphotype is regarded as a predecessor for Senoniasphaera inornata s.s.

8585
RAPID SHORT-TERM COOLING FOLLOWING THE CHICXULUB IMPACT
SI Table Chapter 3SI Table S1. Sample list and results summary
Sample codeDistance from base Unit F
Lithological unit Analyzed for
Grain size Planktic foraminifera Dinocysts TEX86 & BIT-index
95BR 60 420.00 Littig Member X X X
95BR 59 395.00 Littig Member X X X X
95BR 58 370.00 Littig Member X X X
95BR 57 345.00 Littig Member X X X X
95BR 56 320.00 Littig Member X X X
95BR 55 295.00 Littig Member X X X X
95BR 54 285.00 Unit I X X X
95BR 53 275.00 Unit I X X X X
95BR 52 265.00 Unit I X X X
95BR 51 255.00 Unit I X X X
95BR 50 245.00 Unit I X X X
95BR 49 240.00 Unit I X X X X
95BR 48 235.00 Unit I X X X
95BR 47 230.00 Unit I X X X X
smBR 27 225.00 Unit I X X
95BR 46 225.00 Unit I X X X
95BR 45 220.00 Unit I X X X
95BR 44 215.00 Unit I X X X
95BR 43 210.00 Unit I X X X
95BR 42 205.00 Unit I X X X X
95BR 41 200.00 Unit I X X X X
95BR 40 195.00 Unit I X X X
95BR 39 190.00 Unit I X X X X
95BR 38 185.00 Unit I X X X
95BR 37 180.00 Unit I X X X X
95BR 36 175.00 Unit I X X X
95BR 35 170.00 Unit I X X X X
95BR 34 165.00 Unit I X X X X
95BR 33 160.00 Unit I X X X
95BR 32 155.00 Unit I X X X X
95BR 31 150.00 Unit I X X X X
95BR 30 145.00 Unit I X X X X
95BR 29 140.00 Unit I X X X X
95BR 28 135.00 Unit I X X X
95BR 27 130.00 Unit I X X X X
95BR 26 125.00 Unit I X X X
95BR 25 120.00 Unit I X X X X

8686
CHAPTER III
95BR 24 115.00 Unit I X X X
95BR 23 110.00 Unit I X X X
95BR 22 105.00 Unit I X X X
95BR 21 100.00 Unit I X X X X
95BR 20 95.00 Unit I X X X X
95BR 19 90.00 Unit I X X X X
95BR 18 85.00 Unit I X X X
95BR 17 80.00 Unit I X X X X
sm BR 24 75.00 Unit I X X
95BR 16 75.00 Unit I X X X
95BR 15 70.00 Unit I X X X
95BR 14 65.00 Unit I X X X X
95BR 13 60.00 Unit I X X X
95BR 12 55.00 Unit I X X X X
95BR 11 50.00 Unit I X X X X
95BR 10 45.00 Unit I X X X X
95BR 9 40.00 Unit I X X X X
95BR 8 35.00 Unit I X X X X
sm BR82 233 33.00 Unit I X X
95BR 7 30.00 Unit I X X X
sm BR82 232 28.00 Unit H X X
95BR 6 27.00 Unit H X X X
95BR 5 23.00 Unit G X X X
95BR 5Bo 23.00 Unit G X
95BR 4B 22.00 Unit G X X X
95BR 5On 21.00 Unit G X
95BR 4A 20.00 Unit G X X X
BR2-4 -7.5 17.90 Unit G X X X
BR2-4 -7 17.40 Unit G X X X
BR2-4 -6.5 16.90 Unit G X X
BR2 4 -6 16.40 Unit G X X X
BR2-4 -5.5 15.90 Unit G X X
BR2-4 -5 15.40 Unit G X X X
sm BR 20 15.00 Unit G X X
95BR 3 15.00 Unit G X
BR2-4 -4.5 14.90 Unit G X X
BR2-4 -4 14.40 Unit G X X X
BR2-4 -3.5 13.90 Unit G X X X
BR2-4 -3 13.40 Unit G X X
BR2-4 -2.5 12.90 Unit G X X
BR2-4 -2 12.40 Unit G X X
95BR 2 12.00 Unit G X

8787
RAPID SHORT-TERM COOLING FOLLOWING THE CHICXULUB IMPACT
BR2-4 -1.5 11.90 Unit G X X X
BR2-4 -1 11.40 Unit G X X X
BR2-4 -0.5 10.90 Unit G X X X
95BR-1M 10.40 Unit F X X X X
95BR-1L 9.60 Unit F X X X X
95BR-1K 8.80 Unit F X X X
95BR-1J 8.00 Unit F X X X
95BR-1I 7.20 Unit F X X X X
95BR-1H 6.40 Unit F X X X X
95BR-1G 5.60 Unit F X X X X
95BR-1F 4.80 Unit F X X X X
95BR-1E 4.00 Unit F X X X X
95BR-1D 3.20 Unit F X X X X
95BR-1C 2.40 Unit F X X X
smBR82 8 2.00 Unit F X
95BR-1B 1.60 Unit F X X X X
95BR-1A 0.80 Unit F X X X
sm BR 11 -15.00 Event Bed Unit D X X
BR GSS -20.00 Event Bed Unit C X
smBR 8 -25.00 Event Bed Unit B X X
BR LM -26.00 Shell hash X
95BR 61 -30.00 Corsicana FM X X X
smBR 13 -32.00 Corsicana FM X X
smBR 12 -40.00 Corsicana FM X X
smBR 17 -52.50 Corsicana FM X X
95BR 62 -70.00 Corsicana FM X X X
95BR 63 -110.00 Corsicana FM X X X
smBR 3,04 -125.00 Corsicana FM X X
95BR 64 -150.00 Corsicana FM X X X
95BR 65 -190.00 Corsicana FM X X X
smBR 3,03 -225.00 Corsicana FM X X
95BR 66 -230.00 Corsicana FM X X X
95BR 67 -270.00 Corsicana FM X X X
95BR 68 -310.00 Corsicana FM X X X
smBR 3,02 -325.00 Corsicana FM X X
95BR 69 -350.00 Corsicana FM X X X
95BR 70 -390.00 Corsicana FM X X X
smBR 3,01 -425.00 Corsicana FM X X
95BR 72 -500.00 Corsicana FM X X X
SI Table S1. A list of samples used in our study, with the distance from the base of Unit F indicated. For each sample is indicated from which lithological unit it comes and which analyses have been performed on it.

88

8989
PALYNOLOGICAL EVIDENCE FOR PROLONGED COOLING
CHAPTER IV
Palynological evidence for prolonged cooling along the Tunisian continental shelf following K-Pg boundary impact

9090
CHAPTER IV

9191
PALYNOLOGICAL EVIDENCE FOR PROLONGED COOLING
AbstractThe Cretaceous-Paleogene (K-Pg) boundary mass extinction event is considered to be related to major global environmental changes related to a large extraterrestrial impact. Accurate reconstructions of climate change across this boundary, however, prove to be challenging, as traditional biotic environmental proxy-carriers such as planktic foraminifera and calcareous nannoplankton experienced major extinctions. In contrast, organic-walled cyst-producing marine dinoflagellates (dinocysts) survived the K-Pg mass-extinction relatively unscathed, making them ideally suited for reconstructing pre- and post-extinction marine conditions. So far, one of the best dinocyst records available is from the K-Pg boundary Global Stratotype Section and Point (GSSP) at El Kef (NW Tunisia). There, the dinocyst record across the boundary shows major fluctuations, likely reflecting strong responses to environmental changes. These fluctuations have so far not been confirmed by other studies. Therefore, in this study we performed a high-resolution marine palynological study on a closely spaced sample set from the Elles section, some 75 km south of El Kef, in order to generate a paleoenvironmental and paleoclimatic record across the K-Pg boundary to allow verification and refinement of earlier reported environmental changes. To better constrain the reconstructions based on qualitative biotic proxies we employed the quantitative sea surface temperature proxy TEX86. Unfortunately, the TEX86 proxy record of the studied sections is compromised because of post-depositional oxidation. However, the diverse dinocyst assemblages at Elles show strong fluctuations similar to the El Kef record, therefore confirming the earlier recorded signals, showing rapid, regionally consistent changes. These records imply that the latest Maastrichtian was characterized by a gradual cooling trend and the onset of relative sea level fall. Within the immediate post-extinction interval, dinocyst assemblages reveal multiple incursions of higher latitude dinocyst species implying repeated pulses of cooling. These results signify that the earliest Danian climatic and environmental conditions were relatively unstable across the Tunisian shelf.

9292
CHAPTER IV

9393
PALYNOLOGICAL EVIDENCE FOR PROLONGED COOLING
1. IntroductionThe Cretaceous – Paleogene (K-Pg) boundary (~65.5 Ma), is characterized by a major mass
extinction event that has been widely attributed to the global environmental consequences of an impact of a large extraterrestrial body (Alvarez et al., 1980; Schulte et al., 2010). However, the precise killing mechanisms, and e.g. the distinct selectivity of the extinctions are still debated (e.g. D’Hondt, 2005) since there is much uncertainty about the precise climatic and ecological consequences of this impact. Numerical simulations of the global climatic effects of the K-Pg boundary impact predict a brief period of global cooling induced by sulphate aerosols blocking sun light – the so-called “impact winter” (Siggurdsson et al., 1992; Pope et al., 1997; Pierazzo et al., 2003; Vellekoop et al., 2014), followed by a period of greenhouse warming caused by CO2 released into the atmosphere by the impact (Kring, 2007). Unfortunately, it has proven difficult to confirm these models, as major extinctions amongst traditional proxy-carriers, e.g. planktic foraminifera, hamper accurate paleoenvironental reconstructions (Hull et al., 2011). Consequently, studies of sufficient detail to elucidate the possible global environmental consequences of the impact and related mechanisms, or to test various aftermath scenarios, are generally lacking (Kring, 2007).
One biotic proxy-record that holds great promise to shed light on the environmental conditions governing the ocean-climate system pre- and post-impact are organic-walled dinoflagellate cysts (dinocysts). Dinocysts can be used to reconstruct a wide range of environmental parameters, including temperature, salinity, and nutrients. Moreover, this group does not show accelerated rates of extinction across the K-Pg boundary (Brinkhuis and Leereveld, 1988, Brinkhuis and Zachariasse, 1988; Brinkhuis et al., 1998), making them ideally suited to qualitatively assess latest Maastrichtian to earliest Danian changes in palaeoenvironment, palaeoceanography and palaeoclimate. In addition, dinocyst do provide the highest possible biochronostratigraphic resolution across this interval (Habib et al., 1996; Brinkhuis et al., 1998).
Among the best sites to unravel these changes are the stratigraphically complete and expanded sections of the El Haria Formation in Tunisia, including the Global Boundary Stratotype Section and Point (GSSP) of the Danian Stage at El Kef (Molina et al, 2006). The El Kef section has already provided one of the most complete, stratigraphically expanded and well-preserved dinocyst records across the K-Pg boundary (Brinkhuis and Leereveld, 1988, Brinkhuis and Zachariasse, 1988, Brinkhuis et al., 1998). Interestingly, in contrast to model predictions, the dinocyst distribution patterns and benthic foraminifera at El Kef suggest multiple cooling pulses during the earliest Danian interval (Brinkhuis et al., 1998; Galeotti et al., 2004). Yet, these fluctuations have so far not been confirmed by other studies and it is unknown how and if they might be related to climate fluctuations independent of the impact event.
The expanded Elles I section, approximately 75 km south of El Kef, also comprises a complete K-Pg boundary succession and is presumed to be deposited in a more proximal shelfal setting (e.g., Adatte et al., 2002a). This section provides an opportunity to corroborate the signals earlier recorded at El Kef. We therefore performed a high-resolution marine palynological study on a closely spaced sample set from the Elles section, in order to generate a paleoenvironmental and paleoclimatic record across the K-Pg boundary to allow verification of earlier reported environmental changes from the nearby El Kef. In order to better constrain the reconstructions based on biotic environmental proxies we employ the biomarker-based sea surface temperature proxy TEX86 (Schouten et al., 2002).

9494
CHAPTER IV
2. Geological SettingThis study focuses on the K-Pg boundary interval of the El Haria Formation in north-western
Tunisia. This formation encompasses some of the most complete K-Pg boundary transitions currently known. Two sections were investigated in the current study; the K-Pg boundary GSSP at El Kef and the Elles I section. Today these sites are located at 35-36°N, but at Cretaceous-Paleogene times, their position was in the arid climate zone in the low latitudes, near the tropic of Cancer (Scotese, 2004). The Elles and El Kef sections are paleogeographically situated in the Tethys Ocean, on the African continental shelf (Fig. 1).
The El Kef K-Pg stratotype section is located 7 km west from the town of El Kef (36° 9’0.25”N, 8°38’38.76”E). It comprises the uppermost Maastrichtian Planktic Foraminifer A. mayaroensis and lowermost Danian Planktic Foraminifer Zones P0 to P1 of Berggren et al. (1995)(Arenillas et al., 2000), consisting of gray marls interrupted by a 3 mm rusty red clay layer overlain by a ~50 cm thick dark gray shale layer at the K-Pg boundary, the so-called boundary clay layer. This boundary clay layer grades upwards into marly shales. The El Kef section is interpreted to be deposited in an offshore, outer-neritic setting (e.g. Adatte et al., 2002a; Galeotti and Coccioni, 2002)
The Elles sections share many similarities with the K-Pg stratotype section at El Kef. They are located near the small settlement of Elles, 75 km from El Kef, in the Karma Valley (35°56’43.73”N, 9° 4’48.15”E), Tunisian Central Atlas (Karoui-Yaakoub et al., 2002). The K-Pg boundary transition is exposed at two tributaries of the Karma Valley. The exposures in the right valley fork have been called the Elles I section and the exposures in the left valley fork have been called the Elles II section (Adatte et al., 2002). In this study, we focus on the Elles I section since it is best documented (Adatte et al., 2002). It mainly consists of marly and clayey sediments (CaCO3 content between 30% and 60%). Similar to El Kef, the sequence is interrupted at the K-Pg boundary by
Figure 1Late Cretaceous-Paleogene paleogeography of the Mediterranean region and a detailed paleogeographic setting of Tunisia, with the location of the Elles and El Kef sections. Paleogeographical reconstruction based on Scotese (2004) and Scotese and Dreher (2012).
Tunis
Saharan Platform
Gafsa Basin
EllesEl Kef
KassarineIsland
OceanicDeep continental shelfShallow continental shelfCoastalLand
500 km
N
9595
PALYNOLOGICAL EVIDENCE FOR PROLONGED COOLING
a dark, ~50 cm thick carbonate depleted (<10%) interval, the boundary clay layer (Adatte et al., 2002a; Coccioni and Marsili, 2007). The K-Pg boundary is located at the base of the boundary clay layer, where a 3-4 mm-thick rusty red (Fe-oxide rich) layer occurs. The boundary clay layer contains global K-Pg boundary markers such as an anomalous concentration in Ir, Ni-rich spinels, and altered microtektites (e.g. Coccioni and Marsili, 2007).
The Elles sections are interpreted to be deposited in middle to outer shelf depths (at an estimated paleo-waterdepth of about ~150 m; Adatte et al., 2002a), a slightly more proximal position than the El Kef section, resulting in a generally higher terrigenous influx and hence a sedimentation rate exceeding that of the El Kef section (Abramovisch and Keller, 2002; Adatte et al., 2002a; Stüben et al., 2002). Various authors have suggested that Maastrichtian sedimentation rates at Elles were about 3-4 cm/kyr (e.g. Adatte et al., 2002a; Stüben et al., 2003) and Danian sedimentation rates have been estimated to be between 2-4 cm/kyr (Galeotti et al, 2005).
Since the Elles section comprises a complete and expanded K-Pg boundary interval with a better exposure of the boundary than the K-Pg GSSP at El Kef, it has been proposed as parastratotype (e.g. Karoui-Yaakoub et al., 2002) and has been studied in great detail in the last decades, presenting an ideal section to verify the signals recorded at El Kef.
3. BiostratigraphyThe El Kef K-Pg boundary GSSP is one of the best studied K-Pg boundary section in the
world and has a detailed planktic foraminifera, calcareous nannofossil and dinocyst biostratigraphy (Molina et al., 2006) allowing a precise zonation of the boundary interval.
The biostratigraphic framework for the Elles section is less detailed. Planktic foraminifera biostratigraphy allows the most detailed zonation of the studied interval, which extends from 5 m below to 4 m above the K-Pg boundary interval, covering the uppermost Maastrichtian and lowermost Danian (Karoui-Yaakoub et al., 2002; Coccioni and Marsili, 2007). According to Coccioni and Marsili (2007), the Cretaceous interval of the Elles section comprises the upper half of the Plummerita hantkeninoides (CF1) Zone of Pardo et al. (1996), which is equivalent to the uppermost part of the Abathomphalus mayaroensis Zone of Robaszynski and Caron (1995). The Danian interval of the Elles sections comprises the Planktic Foraminifer Zones P0 and P1a of Keller et al. (1995). The biostratigraphic records of the Elles section indicate that the K-Pg boundary is stratigraphically complete at this section.
Most previous studies on the Elles section use the planktic foraminifera zonation of Keller et al. (1995). In the latter, the boundary between Zones P0 and P1a is marked by the First Appearance Datums (FADs) of Parvularugoglobigerina longiapertura and/or P. eugubina. In contrast, Brinkhuis et al. (1998) and Galeotti et al. (2004) used the planktic foraminiferal zonation of Smit and Romein (1985) for their studies on the El Kef stratotype section. This zonation is different from that of Keller et al. (1995) (Fig. 2). The zonation of Smit and Romein (1985) uses the FAD of P. minutula as the P0/P1a boundary, the FO of E. taurica marks the P1a/P1b zonal boundary and the FAD of P. pseudobulloides forms the P1b/P1c boundary. In this zonation, the P1a zone is subdivided into 3 subzones: P1a1, P1a2, P1a3, which are defined by the FADs of P. minutula, P. fringa and G. eugubina, respectively.
The zonation of Smit and Romein (1985) allows a more detailed subdivision of the lowermost Danian and hence, in theory, allows more precise biostratigraphic dating of the record. However, in this zonation the P0/P1a zonal boundary is defined by the FAD of Parvularugoglobigerina minutula (referred to as “Globocunosa alticunosa” in Arenillas et al., 2004 and “Parvularugoglobigerina extensa” in Olsson et al., 1999), a species that has not been recorded at the Elles section (Karoui-Yaakoub et

9696
CHAPTER IV
al., 2002). Furthermore, in some cases the sample-resolution of studies on planktic foraminifera of the Elles section is too low to accurately determine the different subzonations of Smit and Romein (1985), as for example the FOs of P. longiapertura and P. fringa both occur in one sample, at 20-25 cm above the boundary, whereas according to Smit and Romein (1985), the FAD of P. fringa occurs slightly before that of P. longiapertura.
To allow the most precise biostratigraphic dating of inferred changes and enable accurate comparison, we apply a zonation similar to that used in Brinkhuis et al. (1998), which closely resembles that of Smit and Romein (1985) and Vellekoop et al. (2014) (see Fig. 2). Given that the zonal marker P. minutula was not recorded in Elles, the P0/P1a zonal boundary of Smit and Romein (1985) cannot be exactly identified. However, since the FAD of P. minutula is just before the FAD P. fringa, the P0/P1a zonal boundary of Smit and Romein (1985) must be very close to the FO of P. fringa, permitting a tentative placement of this zonal boundary in the Elles section, just below the FO of P. fringa.
4. Methods4.1 Sampling
To develop a high-resolution dinocyst record across the K-Pg boundary, closely spaced samples were obtained from the Elles section. A total of 100 samples have been collected at 5-cm spaced intervals from the uppermost five meters of the Maastrichtian. We use splits from ten 50-cm-long continuous sections that have been obtained from the lowermost Danian part of the Elles section to form a composite core of 411 cm when depth is corrected by dip within individual sections.
Figure 2Planktic foraminiferal biostratigraphic zonation of the K-Pg boundary interval. First and Last Appearance Datums of important index species are indicated. The zonation applied here is similar to that used in Brinkhuis et al. (1998) and is here compared to the zonations of Smit and Romein (1985), Olsson et al. (1999), Berggren et al. (1995) and Karroui-Yaakoub et al. (2002).
Maa
stric
htia
nD
ania
nThis Paper
(cf. Brinkhuis et al., 1998)
P. uncinata
P. inconstans(P. trinidadensis)
P. pseudobull.
E. taurica
P. eugubina/P. longiapertura
P. fringa =P. alabamensis
P. minutula =G. conusa/P. excelsa
G. cretacea
P2
P1d
P1c
P1b
P1a3
P1a2
P1a1
P0
UC17A. mayaroensis
Smit and Romein, 1985
G. uncinata
G. inconstans(G. trinidadensis)
G. pseudobull.
E. taurica
‘Globigerina’ eugubina
‘Globigerina’fringa
‘Globigerina’minutula
G. cretacea
P2
P1d
P1c
P1b
I
P1a
P0
UC17A. mayaroensis
II
III
A. mayaroensis
Pα
P1a
P1b
P1c
P2
P0
Olsson et al., 1999
P1b
P1c
P2
P0
P1d
P1a(1)
(2)
P1b
P1c
Karroui-Yaakoub,2002
P. hantkeninoides
A. mayaroensis
(1)(2)
Berggren et al., 1995
P0
Pα
A. mayaroensis
P1a
Foram Datum Events
P. minutula / G. conusa
P. fringa / P. alamabensis
P. eugubina / P. longiapertura
E. taurica
P. pseudobulloides
P. eugubina
S. triloculinoides
P. inconstans
P. uncinata
G. varianta
P. trinidadensis

9797
PALYNOLOGICAL EVIDENCE FOR PROLONGED COOLING
These sections have been obtained by using a metal box hammered into a deeply dug trench (for a description of the sampling procedure, see Galeotti et al., 2005). This cored interval covers the interval calibrated against Planktic Foraminifer Zones P0 to P1c (Galeotti et al., 2005).
4.2 PalynologicalprocessingIn total, 236 samples from the Elles section were processed following standard palynological
processing techniques. Briefly, approximately 4 g of each sample was crushed, oven dried (60 °C) and weighted, and a known amount (10679, error 5%) of Lycopodium clavatum spores was added. The samples were then treated with 10% HCl and 40% HF to dissolve carbonate and silicate minerals, respectively. No heavy liquid separation or oxidation was employed. After each acid step, samples were washed with water and centrifuged or settled for 24h and decanted. The residue was sieved over nylon mesh sieves of 250 μm and 10 μm and treated with ultrasound for 5 minutes to break up agglutinated particles of the residue. From the residue of the 10-250 μm fraction, quantitative slides are made on well mixed, representative fractions by mounting one droplet of homogenised residue and adding glycerine jelly. The mixture was homogenised and sealed. All slides are stored in the collection of the Laboratory of Palaeobotany and Palynology, Utrecht University.
For the present study, of ~60 of these samples (20 samples from the Maastrichtian interval and ~40 samples from the Danian interval), the palynomorphs were counted up to a minimum of 200 dinocysts. The taxonomy of dinocysts follows that cited in Fensome and Williams (2004). A species list can be found in Appendix 1.
4.3 Organic-walleddinoflagellatecystsDinocysts provide a powerful biostratigraphic tool and various high resolution studies have
been performed across the K-Pg boundary (e.g. Moshkovitz and Habib, 1993; Brinkhuis and Schioler, 1996; Brinkhuis et al., 1998). In addition, they provide means to reconstruct changes in paleoproductivity and several other environmental parameters such as coastal proximity, sea surface temperature (SST) and salinity (SSS) using inferred ecological affinities (e.g., Sluijs et al., 2005). Brinkhuis and Biffi (1993) have demonstrated that the relative contribution of high/middle-latitude (cool-temperate) taxa vs. low-latitude/Tethyan (warm) taxa can be used to reconstruct SST trends in the Paleogene. This method has also been applied to infer paleo-temperature trends across the K-Pg boundary interval (Brinkhuis et al., 1998). In the latter study, a combination of two methods was used. First, apparent latitudinal preferences of taxa were identified by means of a literature study. Brinkhuis et al. (1998) argue that taxa like Palynodinium grallator and Achilleodinium biannii represent typical high-latitude influences, whereas for example Senegalinium bicavatum appears to be a low latitude taxon. However, although dinocysts have been demonstrated to be a useful tool in reconstructing the palaeoenvironment (e.g. Brinkhuis et al., 1998; Sluijs et al., 2005), the still relatively poor knowledge of ecological preferences of many, extinct species often hampers more detailed environmental reconstructions. In general, it may be helpful to use statistical methods such as Detrended Correspondence Analysis (DCA; Hill and Gauch, 1980) for this purpose. Versteegh and Zonneveld (1994) have shown that DCA is a useful tool to determine the ecological preferences of extinct dinoflagellate cyst species. Therefore, Brinkhuis et al. (1998) also used Detrended Correspondence Analysis (DCA) to identify temperature relationships within the dataset.
To allow a good comparison between the Elles and El Kef records, an approach similar to Brinkhuis et al. (1998) was used in the present study. To be able to accurately compare the dinocyst record of the present study with that of El Kef, the microscope slides used by Brinkhuis et al.

9898
CHAPTER IV
(1998), stored at the Laboratory of Palaeobotany and Palynology in Utrecht, Utrecht University, were re-examined to standardize the taxonomy used in these studies. For this taxonomic standardization, single-grain preparations of type-specimens of Brinkhuis et al. (1998) were also used.
In order to recognize the main environmental trends, DCA was carried out on a selected part of the data using PAST (Hammer et al., 2001), following procedures described in Brinkhuis et al. (1998). The species selected for this analysis are discussed in Appendix 3.
4.4 TEX86analysesIn an attempt to quantify the SST changes recorded by the dinocyst record, 40 aliquot samples
were investigated for TEX86 paleothermometry following standard procedures (Schouten et al., 2013). Briefly, organic compounds were extracted from powdered and freeze-dried rock samples of approximately 5 g with dichloromethane (DCM)/methanol (MeOH) (9:1, v/v) using a DIONEX accelerated solvent extractor (ASE 200). The total extracts were separated in 4 fractions over an activated Al2O3 column successively using hexane:dichloromethane (DCM) (9:1, v/v), ethyl acetate (100%), DCM:MeOH (95:5, v/v) and DCM:MeOH (1:1, v/v). Following this, 250 ng of a C46 Glycerol Trialkyl Glycerol Tetraether internal standard (Huguet et al., 2006) was added to the DCM:MeOH (95:5, v/v) fraction for quantification purposes. Samples were analyzed using high performance liquid chromatography/atmospheric pressure positive ion chemical ionization mass spectrometry (HPLC/APCI-MS) according to Schouten et al. (2007). For a more detailed description of this technique and its application, see Schouten et al. (2002; 2013). The TEX86 index values were calculated following Schouten et al. (2002).
5. Results5.1ComparisonEllesandElKef
In general, the El Haria Formation comprises rich, well to excellently preserved palynomorph assemblages, dominated by marine palynomorphs. All samples from the Elles section yielded palynological assemblages very similar to that at El Kef. Hence, the results from the Elles section can be used to verify the earlier reported signals at the El Kef section. Both records are dominated by marine palynomorphs (75-90% of the assemblage), with a dominance of the representaties of the genus Spiniferites, and the morphologically related genus Achomosphaera, and an overall relative high abundance of peridinioid dinocysts. Other categories of palynomorphs that were encountered include different types of acritarchs, foraminiferal linings, bisaccate pollen, angiosperm pollen, trilete spores and different genera of fresh- to brackish water algae (predominantly Paralecaniella indentata, Botryococcus sp. and Tasmanites sp.).
5.2 BiostratigraphyThe dinocyst records comprise several first and last occurrences of biostratigraphically
important species (referred to as ‘dinocyst events’). These include the First Appearance Datum (FAD) and Last Appearance Datum (LAD) of P. grallator and the FADs of Senoniasphaera inornata, Damassadinium californicum, Carpatella cornuta and Laternosphaeridium reinhardtii. (see Fig. 3).
The successive First Occurences (FOs) of the dinocyst species Senoniasphaera inornata, Damassadinium californicum and Carpatella cornuta permit a detailed zonation of the most basal part of the Danian (Brinkhuis et al., 1998). The interval above this can be stratigraphically correlated

9999
PALYNOLOGICAL EVIDENCE FOR PROLONGED COOLING
using the FOs of the planktic foraminiferal species P. longiapertura, E. fringa and G. eugubina. The resulting biostratigraphic correlation between the Elles and El Kef sections is shown in Figure 4.
Although the interval calibrated against Zones P0 and P1a1 is of similar thickness, the interval calibrated against zones P1a2, P1a3, P1b and P1c is slightly more expanded at the Elles section. The higher sedimentation rates at Elles, earlier related to to the more proximal setting of this site (Adatte et al., 2002a), is thus confirmed. The only major stratigraphical discrepancy between El Kef and Elles is the LO of P. grallator. At El Kef, this taxon has its LO at 25 cm above the boundary, whereas at Elles P. grallator appears to have a slightly longer range, as it occurs up to 50 cm above the boundary. Planktic foraminifera and dinocyst biostratigraphy shows that together, the El Haria K-Pg boundary sites can be regarded as the most expanded complete K-Pg boundary sites in the world.
Figure 3Stratigraphic ranges of selected dinoflagellate cyst taxa at the Elles section. Taxa included are considered important stratigraphic index species for the K-Pg boundary in previous studies (e.g. Moskovitz and Habib, 1993; Brinkhuis et al., 1998; Williams et al., 2004; Slimani et al., 2010) and have a Last Appearance Datum or First Appearance Datum within the studied interval.
-500
-450
-400
-350
-300
-250
-200
-150
-100
-50
0
50
100
150
200
250
300
350
400
450
Pale
ogen
eC
reta
ceou
s
cm a
bove
K-P
g bo
unda
ry
A. m
ayar
oens
is Z
one
P0
P1a
P1b
P1c
Plan
kton
ic fo
ram
zo
nes
Lith
olog
yIm
pagidinium ce
linae
Achomosp
haera
sagen
a
Eisenack
ia ret
iculat
a
Alisogymnium eu
claen
se
Carpate
lla cf
. corn
uta
Cassidium fr
agile
Cerodinium m
edite
rraneu
m
Damass
adinium cf
. califo
rnicu
m
Dinogymnium spp.
Disphae
rogena c
arposp
haeropsis
Kallosp
haerid
ium yorubae
nse
Lanter
nosphae
ridium re
inhardtii
Manumiel
la dru
ggii
Membran
ilarn
acia?
tenell
a
Palynodinium gral
lator
Senonias
phaera
inornata
Oligosp
haerid
ium saghiru
m
Thalassi
phora pela
gica
Kenley
ia lophophora

100100
CHAPTER IV
In the past, the typical Late Cretaceous group Dinogymnium spp. and the morphologically related Alisogymnium spp. have been considered the single group of organic-walled cyst producing
dinoflagellate species to go extinct at the K-Pg boundary (Williams et al., 2004). At both Tunisian records, this group has rare occurrences in the late Maastrichtian, but also throughout the lower half of the Danian interval. This might be related to reworking, but since this phenomenon has also been recorded at various other K-Pg boundary sites (e.g., Brazos River, Braggs, Geulhemmerberg) (e.g. Brinkhuis and Schioler, 1996; Vellekoop et al., 2014), alternatively, the LAD of Dinogymnium spp. and Alisogymnium spp. may actually be slightly younger, occurring in the early Danian rather than precisely at the K-Pg boundary.
5.3 EllessectionpaleoecologyWhile dinocysts are the dominant palynomorphs throughout the studied interval, terrestrial
elements and fresh- to brackish water algae show a small increase in abundance across the K-Pg boundary at the Elles section, reaching maximum values about 80-100 cm above the boundary. The ratio of terrestrial over marine palynomorphs (t/m) stays between 0 and 0.04 in the Maastrichtian and increases up to 0.11 in the lowermost Danian, to return to ~0.08 at the top of the studied interval. The relative distribution of the recorded categories of palynomorphs and the t/m ratio of the studied samples is plotted in Figure 5. Total palynomorph counts and concentrations are presented in Appendix 3.
0
5
10
15
20
25
30
35
40
45
0 5 10 15 20 25 30 35 40 45
P0 P1a1 P1a2 P1a3
P0P1
a2P1
a3
P1a1
cm above K-Pg boundary
cm a
bove
K-P
g bo
unda
ry
El Kef
Elle
s
B
A
C
DE
F
Figure 4A correlation of the lowermost Danian biostratigraphic events in the El Kef and Elles sections. A) FO P. grallator; B) FO S. cf. inornata; C) FO D. cf. californicum; D) FO P. minutula; E) FO P. fringa; F) FO P. eugubina. The exact depths of the biostratigraphic events are indicated in Appendix 2.

101101
PALYNOLOGICAL EVIDENCE FOR PROLONGED COOLING
The studied interval is characterized by diverse dinoflagellate cyst assemblages. In total, some 120 different dinocyst taxa were identified. An alphabetical species list of dinocyst taxa is provided in Appendix I. The most abundant dinocyst group in the record is the Spiniferites ramosus complex and the morphologically related genus Achomosphaera (~5-45% of the assemblage). Other abundant species are Glaphyrocysta perforata, Senegalinium bicavatum and Pierceites pentagona, all of which generally account for 1-25% of the assemblage. In the lower part of the section the typically outer neritic and normal marine dinocyst taxa, such as the Spiniferites group, are dominant and open marine, oceanic dinocyst taxa, such as the Impagidinium spp. and Pyxidinopsis spp. are also relatively abundant. Members of the Areoligera/Glaphyrocysta group (considered indicative of a nearshore, shallow environment, cf. Sluijs et al. (2005) are most abundant above the K-Pg boundary.
Presumed heterotrophic peridinioid dinoflagellates (Sluijs et al., 2005) are very abundant in the Elles record (up to 80% of the assemblage). The P/G ratio, here defined as the ratio of peridinioid dinocysts over gonyaulacoid dinocysts sensu Versteegh (1994), varies between 0.22 and 0.79 during the Maastrichtian (with an average of 0.43), decreases sharply to 0.13 at the K-Pg boundary and subsequently increases to values similar those for the Maastrichtian (see Fig. 5). Strikingly similar to the El Kef record, at Elles the presumably opportunistic, heterotrophic group composed of the tropical genera Andalusiella and Palaeocystodinium (referred to as the ‘A-P complex’) (Brinkhuis et al., 1998) rapidly increases in abundance approximately 10 cm above the boundary, peaking at 19 cm above the K-Pg boundary. At both sites this peak occurs in the upper part of Zone P0 (Brinkhuis et al., 1998). At this peak, the A-P complex makes up ~38% of the assemblage at Elles
Figure 5The relative distribution of the recorded categories of palynomorphs, the P/G ratio sensu Versteegh (1994) and the ratio of terrestrial over marine palynomorphs (t/m ratio).
-500
-450
-400
-350
-300 -250
-200
-150
-100
-50
0
50
100
150
200 250
300
350
400
450
Pale
ogen
eC
reta
ceou
s
cm a
bove
K-P
g bo
unad
ary
Plan
kton
ic fo
ram
zon
es
Lith
olog
y
A. m
ayar
oens
is Zo
ne
P0
P1b
P1c
P1a
0 80 90 100%
0 10 20%
0 10%
0 10%
0 10%
Dinocysts
Acritar
chs
Foram lin
ings
Freshwate
r algae
Sporomorp
hs
0,0 0,2 0,4 0,6 0,8
P/G ratio
0,00 0,06 0,12
t/m ratio

102102
CHAPTER IV
and about 25% at El Kef. At both sites, the peak of the A-P complex results from an increase in absolute abundances, up to 2500 cysts/gram at Elles and up to 4000 cysts/gram at El Kef, (see Fig. 6). Once the A/P complex abundance decreases again, other peridinioid cysts once more become dominant and restore to pre-K-Pg boundary concentrations.
Similar to the El Kef K-Pg boundary stratotype, the assemblage at Elles is generally dominated by groups that are regarded either as cosmopolitan or to have low latitude affinities by Brinkhuis et al. (1998), such as the Spiniferites ramosus complex, Pierceites pentagonia and Senegalinium bicavatum. Crucially, at both sites the basalmost Danian is characterized by the influx of higher latitude taxa, most notably with the FOs of P. grallator and Palaeoperidinium pyrophorum and the increase in abundance of inferred higher-latitude species, Cribroperidinium sp. A of Brinkhuis and Schiøler (1996) and Achilleodinium biannii.
5.4 StatisticalanalysisIn order to recognize the main environmental trends such as temperature relationships
within the dataset, a DCA was carried out on a selected part of the data, approximately following procedures described in Brinkhuis et al. (1998). For the DCA presented in this study, all species with less than 15 specimen in the total dataset of 20000 were omitted. A more detailed explanation
Figure 6The absolute abundances of the Andalusiella-Palaeocystodinium complex (A-P complex) in cysts per gram at the boundary intervals of the Elles section and the El Kef section. Data of the El Kef section are from Brinkhuis et al. (1998), the data from the Elles section are from this study.
Din
ocys
t eve
nts
(Thi
s st
udy)
P.gr, M.te
S.in
D.caC.co
P.gr
-20
-10
0
10
20
30
40
50
cm a
bove
K-P
g bo
unad
ary
A. m
ayar
oens
is
P0
P1a1
P1a2
P1a3
Plan
kton
ic fo
ram
zon
es
(Sm
it &
Rom
ein,
198
2)
Lith
olog
y
Elles
Din
ocys
t eve
nts
(Bri
nkhu
is e
t al.,
199
8)
P.gr, M.te
S.in
D.caC.co
P.gr
-20
-10
0
10
20
30
40
50
cm a
bove
K-P
g bo
unad
ary
A. m
ayar
oens
is
P0
P1a1
P1a2
P1a3
Plan
kton
ic fo
ram
zon
es
(Sm
it &
Rom
ein,
198
2)
Lith
olog
y
El Kef
A-P complex
0 2.0 3.01.0 4.0(x1000)
Dinocysts per gram
0 2.0 3.0
A-P complex
1.0(x1000)
Dinocysts per gramclaymarl
Pale
ogen
eC
reta
ceou
s
Pale
ogen
eC
reta
ceou
s

103103
PALYNOLOGICAL EVIDENCE FOR PROLONGED COOLING
of the criteria used can be found in Appendix 3. The distribution of the selected taxa along the two most important DCA-axes is plotted in Figure 7. In the distribution of the taxa along the first axis (eigenvalue 0.175) two main clusters can be recognized, with several outliers on the right side of the graph. The assemblage appears to have a normal distribution along the second axis of the DCA (eigenvalue of 0.121), with most taxa clustering in the middle.
5.5 TEX86Most of the samples analyzed for TEX86 contained traces of crenarchaeotal GDGT lipids,
but their overall concentrations were only just above detection limit. Unfortunately, poor signal to noise ratios make temperature reconstructions based on these biomarkers less reliable. A further complication was that the sediments are characterized by relatively high BIT-index values (0.06-0.78) (see Table 1) The BIT-index is a proxy indicative for the input of soil-organic matter. Since sediments with high input of soil organic matter also receive a contribution of terrestrial isoprenoid
Coastal
Oceanic
A.bian
A.dubi
A.seno
C.dieb
C.pannC.spec
C.fibr
C.sp.A
C.septataD.gala
Dicon
D.coll
D.carp
E.bif i
E.phra
Fibro-Kenl
F.mantG.cast
G.past
G.perf
H.sept
O.sagh
H.tubi
H.duplImpag
Lejeu
M.drug
O.cent
Operc
P.magn
P.pent
Pyxid
Xenic
S.bicaS.obsc
M. pila
Tanyo
T.evit
A/P cpx
S.ramo
-1,6 -0,8 0 0,8 1,6 2,4 3,2 4 4,8Axis 1
-1,8
-1,2
-0,6
0
0,6
1,2
1,8
2,4
3
3,6A
xis
2cosmopolitan“low latitude” “high latitude”
P.elon
Figure 7Results of the Detrended Correspondence Analysis (DCA) of the Elles section dataset.(A.bian = A. biannii; A.dubi = A. dubia; A/P cpx = Andalusiella/Palaeocystodinium complex; A.seno = A. senoniensis; C.dieb = C. diebelii; C.fibr = C. fibrospinosum; C.pann = C. pannunceum; C.sept = C. septata; C.sp.A = C. sp. A; C.spec = C. speciosum; D.carp = D. carposphaeropsis; D.coll = D. colligerum; D.gale = D.galeata; D.wils = D. wilsonii; E.bifi = E. bifidum; E.phra = E. phragmites; Fibro/Kenl = Fibrocysta/Kenleya spp.; F.mant = F. mantellii; G.cast = G. castelcasiensis; G.past = G. pastielsii; G.perf = G. perforata; H.recu = H. recurvatum; H.sept = H. septata; H.tubi = H. tubiferum; Impag = Impagidinium spp.; Lejeu = Lejeunecysta spp.; M.drug = M. druggii; M.pila = M. pilatum; O.cent = O. centrocarpum; O.isra = O. israelianum; O.sagh = O. saghirum; P.magn = P. magnificum; Pyxid = Pyxidinopsis spp.; P.elon = P. elongatum; S.bica = S. bicavatum; S.obsc = S. obscurum; S.ramo = S. ramosus; T.evit = T. evittii; T.xant = T. xanthiopyxides; P.pent = P. pentagonia; Xenic = Xenicodinium spp.). The average latitudinal preference based on the literature review of Brinkhuis et al. (1998) are indicated, with low latitude taxa indicated in red, high latitude taxa in blue and cosmopolitan taxa in yellow. Taxa with unknown latitudinal preferences are indicated in black. In the figure Gonyaulacoid dinocysts are indicated by circles, Peridinioid dinocysts are indicate by diamonds.

104104
CHAPTER IV
GDGTs, they may yield relatively unreliable SST estimates (Weijers et al., 2006). Therefore, also the high BIT-index values prevent to generate an accurate temperature record across the K-Pg boundary. The generally high BIT-index values are rather surprising given the relative offshore setting and the minor contribution of terrestrial components to the palynomorph assemblages. Perhaps these high BIT index values resulted from contamination by modern rather than representing original fossil soil organic matter. Alternatively, since marine GDGTs are relatively more labile than terrestrial GDGT (Lengger et al., 2014), the relatively high BIT-index values and the large variation throughout the record might be the result of post-depositional oxidation. Consequently, the resulting TEX86 and BIT-index records are relatively chaotic and probably unreliable.

105105
PALYNOLOGICAL EVIDENCE FOR PROLONGED COOLING
Table 1 GDGT analysesSample Distance from K-Pg
boundary (cm)Yield(ng/g)
BIT-index
ELLES 10 405 n.a. 0.74
ELLES 9-34/35/36 373 n.a. 0.24
ELLES 8-2/3/4 302 0.6 0.38
ELLES 6-4/5 229 n.a. 0.42
ELLES 6-1/2/3 226 n.a. 0.41
ELLES 5-34 220 2.4 0.27
ELLES 4-18/19 146 1.1 0.23
ELLES 3-18 97 0.5 0.34
ELLES 2-38 66 1.9 0.56
ELLES 2-22 49 0.9 0.32
ELLES 2-16 43 1.1 0.43
ELLES 2-10/11 36 n.a. 0.26
ELLES 2-5/6 31 0.4 0.18
ELLES 1-21 23 1.7 0.30
EL T7 20 n.a. 0.78
ELLES 1-18/19 18 0.6 0.27
ELLES 1-13/14 13 1.2 0.17
ELLES 1-9 9 2.3 0.26
ELLES 1-5 5 1.2 0.16
ELLES 1-4 4 0.9 0.27
EL T2 1 n.a. 0.62
ELLES 1-1 1 2.1 0.29
EL IL 0 37.6 0.41
EL T -1 0.6 0.06
EL -2 -2 n.a. 0.08
EL 2 -8 n.a. 0.15
EL 6 -28 2.5 0.12
EL 9-10 -48 0.5 0.08
EL 13 -63 n.a. n.a.
EL 14/15 -70 1.9 0.30
EL 31 -153 0.6 0.17
EL 43/44 -215 n.a. 0.24
EL 48 -238 16.9 0.42
EL 62 -308 0.8 0.19
EL 72 -358 n.a. 0.14
EL 82/83 -410 n.a. 0.29
EL 88/89 -440 1.5 0.30
EL 92/93 -460 1.5 0.55
EL 96-100 -480 n.a. 0.69
Table with samples processed for GDGT analyses. Per sample, where available, the yield (in ng/g total GDGTs) and BIT-index are indicated. Samples with BIT-index above the recommended threshold of 0.3 (Weijers et al., 2006) are indicated in grey. Note the variable nature of the BIT-index record.

106106
CHAPTER IV
6. Discussion6.1 Sealeveltrends
The palynological record of the Elles is very similar to that of El Kef. Consequently, the result of the DCA analysis of the Elles section also has a strong resemblance to that of Brinkhuis et al. (1998). In the DCA performed on the Elles dataset, most peridinioid cysts plot in the upper half of the graph, including typical peridinioid genera with hexagonal archeopyles such as Senegalinium and Cerodinium, which have been suggested to be indicative for freshwater input (Sluijs and Brinkhuis, 2009). This implies that the second axis of the DCA might correspond to nutrient and/or freshwater input. The fact that much of the inferred neritic gonyaulacoid genera, such as Areoligera, Glaphyrocysta and Operculodinium are also positioned in the upper half of the plot, whereas more oceanic genera such as Impagidinium, Spiniferites and Pyxidinopsis plot in the lower half of the plot suggest that this axis presents an indication of coastal proximity, characterized by gradients in nutrient and/or salinity.
Therefore, the loadings of DCA-axis 2 and the palynological assemblages can be used to reconstruct relative sea level changes across the studied interval (Fig. 8). When the loadings of this axis across the studied interval are plotted they show a minimum at about 150 cm below the boundary, at which point the oceanic genus Impagidinium also has its highest abundances. These results indicate that more oceanic conditions prevailed in the latest Maastrichtian, allowing the tentative placement of a maximum flooding surface (mfs). The record shows a sea level regression from 150 cm below the boundary upwards, with a sea level lowstand between approximately 100 and 200 cm above the K-Pg boundary. Over this interval the Areoligera/Glaphyrocysta group, indicative of nearshore, shallow marine environments becomes dominant and the ratio of terrestrial over marine palynomorphs increases. Similarly, freshwater algae and inferred freshwater tolerant dinocysts also have their highest abundance in this interval, suggesting it was characterized by the closest coastal proximity. This allows a tentative placement of a sequence boundary (SB) somewhere in this interval. Several previous studies have suggested the presence of more than one SB in the interval above the K-Pg boundary, with sequence boundaries both at the base of Zone P1a as well as at the base of Zone P1b, which is compatible with the palynological record from the Elles section. In many shallower sections worldwide, this interval is marked by the presence of hiatuses (e.g. Adatte et al., 2002a).
From this interval upwards, DCA-axis 2 decreases, the normal marine Spiniferites group becomes dominant again and the t/m ratio decreases. This could be interpreted as a gradual sea level rise continuing to the top of the section. These reconstructed sea level changes are consistent with the general trend that is recorded form sections worldwide (MacLeod and Keller, 1991; Moshkovitz and Habib, 1993; Schulte and Spijer, 2009).
Interestingly, in the DCA-analyses of the Elles record, Manumiella druggii and the A-P complex, both peridinioid taxa, plot in the lower part, amongst more offshore taxa. Some authors have suggested that Manumiella druggii is indicative for shallow marine conditions, potentially even in low salinity environments (e.g Hultberg., 1987), contradicting our interpretation of DCA-axis 2. Conversely, our results suggest that this presumably heterotrophic species can also occur in more open ocean conditions. Conspicuously, both Manumiella druggii and the A-P complex show blooms in our record. These peak occurrences likely resulted from other environmental or ecological changes and are therefore probably not controlled by coastal proximity.

107107
PALYNOLOGICAL EVIDENCE FOR PROLONGED COOLING
6.2 ClimatechangeacrosstheK-PgboundaryIn the DCA-analyses of the Elles record (Fig. 7), the main cluster on the left-hand side of the
plot represents inferred low latitude species such as Pierceites pentagonia, Senegalinium bicavatum and the Fibrocysta/Kenlyia group. Inferred cosmopolitan taxa, such as Spiniferites/Achomosphaera spp. and Florentinia mantellii, generally plot in the central cluster. The outliers on the right-hand side represent typical species included in the group of higher latitude taxa of Brinkhuis et al. (1998), such as Cribroperidinium sp. A of Brinkhuis and Schiøler (1996), Achilleodinium biannii and Glaphyrocysta pastielsii. This suggests that the first DCA-axis can be interpreted as a sea surface temperature gradient. The loadings on DCA-axis 1 through the studied interval are plotted in Figure 9.
Although the position of species in the DCA-plot of the Elles section dataset is quite similar to the position of species in the El Kef section DCA, there are some striking differences between these DCA-plots. One of these is that in the DCA of Brinkhuis et al. (1998) the first axis is determined
Figure 8Overview of different indicators of coastal proximity over the studied interval, with the loadings on DCA-axis 2 and the ratio of terrestrial palynomorphs over marine palynomorphs (t/m ratio). The relative abundances of the Impagidinium group (including all species of Impagidinium and Pterodinium) and Pyxidinopsis group (including all species belonging to Pyxidinopsis and Xenicodinium) are interpreted as indicators for offshore conditions (following Crouch and Brinkhuis, 2005) and relative abundances of the Areoligera group (including all species with dorsally-ventrally compressed (Gv) cysts, mainly Glaphyrocysta and Areoligera) and presumed fresh- and brackish water algae as indicators for inshore conditions (following Sluijs et al., 2005). The sequence stratigraphic interpretation of the palynological data is indicated on the right hand side.
0,0 0,5 1,0 1,5
DCA Axis
2
0,060,00
t/m ra
tio
0,12 0 10
Freshwate
r Alga
e
0 10 20 30 40 50
Areo group
0 10 20
Pyxidinop
sis
0 10 20
Impag
idinium
Relative sea level
Low High
mfs
SB?
% % % %
-500
-450
-400
-350
-300 -250
-200
-150
-100
-50
0
50
100
150
200 250
300
350
400
450
Pale
ogen
eC
reta
ceou
s
cm a
bove
K-P
g bo
unad
ary
Plan
kton
ic fo
ram
zon
es
Lith
olog
y
A. m
ayar
oens
is Zo
ne
P0
P1b
P1c
P1a

108108
CHAPTER IV
by two main outliers, the A-P complex and Areoligera senoniensis, whereas in the Elles record, these taxa plot on different places in the DCA analysis. In our analysis of Elles, both plot within the low latitude cluster and consequently, a different DCA axis is dominant. Also, several species that have been inferred to be high latitude taxa based on the literature review by Brinkhuis et al. (1998) do not show such a distribution in the DCA-analysis of the Elles section dataset, most notably Glaphyrocysta perforata and Cerodinium speciosum. Since these taxa plot amongst cosmopolitan taxa such as Spiniferites ramosus, Operculodinium centrocarpum and Florentinia mantellii, they possibly have a more cosmopolitan affinity. Of the taxa inferred to have a low-latitude affinity by Brinkhuis et al. (1998), most taxa show a similar distribution in the Elles dataset.
It is nevertheless possible to split the dinocyst assemblage into groups in a similar manner as Brinkhuis et al. (1998). Given the distribution along DCA-axis 1, we can divide the assemblage from right to left into: a high latitude group, a cosmopolitan group and a low latitude group, based on the literature review of Brinkhuis et al. (1998). A division criterion as indicated in Figure 7 can be used, in which most inferred high latitude species fall within the same group. The combined percentage of the “cold water” group that is created this way provides an indication of the contribution of higher latitude species to the total assemblage. The loading on DCA-axis 1 and the combined percentage of the cold water species group are two different ways to qualitatively reconstruct sea surface temperature changes across the studied interval, with the first portraying the trend in the data and the latter showing the intervals that SST likely was low enough for a significant ingression of “Boreal” taxa. The variation of this ratio through the studied interval are shown in Figure 9.
In general, the dinocyst records of the Elles and El Kef sections are dominated by cosmopolitan and typical low-latitude species, such as the Spiniferites ramosus complex, Pierceites pentagonia and Senegalinium bicavatum. This confirms that the overall sea surface temperatures were likely relatively high in this region. At Elles, the upper Maastrichtian interval of 440 cm up to 220 cm below the K-Pg boundary is characterized by a dominance of these, and other typical low latitude species, such as Pierceites pentagonia, Andalusiella polymorpha, Palaeocystodinium cpx. and Senegalinium bicavatum, resulting in high loadings on the first DCA-axis, revealing that this was likely the warmest interval. Above this, DCA-axis 1 reveals a general cooling trend up to the K-Pg boundary. Through this interval, inferred cosmopolitan species, such as the Spiniferites ramosus cpx, Glaphyrocysta perforata and Florentinia mantelli become more dominant. In the upper 80 cm of the Maastrichtian, the first inferred cold water species, such as Cribroperidinium sp. A of Brinkhuis and Schiøler (1996) and Achilleodinium biannii, make their appearance. The presence of Manumiella druggii in this interval (see Fig. 9) might also be in agreement with this cooling. In the Maastrichtian, Manumiella is a typical southern hemisphere high latitude genus (e.g. Elliot et al., 1994) and Habib and Saeedi (2007) suggested that the globally recorded Manumiella peak below the K-Pg boundary might be related to global cooling. Indeed, in the scatter plot of the DCA performed in the present study, this species plots close to other known high latitude taxa. The ingression of typical higher-latitude dinocyst species in the uppermost Maastrichtian has also been recorded at several other sites (e.g. Habib et al., 1996), consistent with a cooling interval in the latest Cretaceous. This general cooling trend is furthermore confirmed by faunal turnovers in for example planktic foraminifera (Abramovich and Keller, 2002) and calcareous nannofossil assemblages (Gardin, 2002) in the upper Maastrichtian.
At the K-Pg boundary, the El Haria Formation dinocyst assemblage changes dramatically. Our results confirm the rapid cooling pulse as recorded at the K-Pg boundary GSSP of El Kef. In the lowermost Danian (correlative to the base of Zone P0), several typical higher-latitude taxa make

109109
PALYNOLOGICAL EVIDENCE FOR PROLONGED COOLING
Figu
re 9
Ove
rvie
w of
var
ious
tem
pera
ture
indi
cato
rs a
cros
s th
e K
-Pg
boun
dary
inte
rval
at E
lles.
A) Th
e lo
adin
gs o
n D
CA
-axi
s 1,
relat
ive
abun
danc
es o
f 3 d
iffer
ent i
nfer
red
low-
latitu
de ta
xa, 2
infe
rred
cosm
opol
itan
taxa
and
all
infe
rred
high
-latit
ude
taxa
com
bine
d an
d th
e ra
nges
of s
ever
al in
ferre
d hi
gh-la
titud
e ta
xa. B
) A d
etai
l of t
he re
cord
acr
oss
the
K-P
g bo
unda
ry, w
ith th
e lo
adin
gs o
n D
CA
-axi
s 1 a
nd re
lativ
e ab
unda
nces
of i
nfer
red
high
-latit
ude
taxa
of t
he E
lles s
ectio
n co
mpa
red
with
δ18
O o
f bul
k ca
rbon
ate
and
bent
hic f
oram
inife
ra (A
nom
alin
oides
acut
a) (S
tübe
n et
al.,
2002
). an
d bu
lk ca
rbon
ate δ
13C
of t
he p
arall
el E
lles I
I out
crop
(Stü
ben
et al
., 20
02).
A
-500
-400
-300
-200
-100
0
100
200
300
400
Paleogene Cretaceous
cm above K-Pg bounadary
A. mayaroensis
P0
P1a
P1bP1c
Planktonic foram zones
Lithology 0,0
1,0
2,0
DC
A a
xis
1
M. druggii A. bianiiCriboroperidinium sp. A
M. polycladiataP. grallator
P. pentagonia
S. bicavatum
A-P complex
G. perforata
S. ramosus cpx.
%%
%%
%%
020
020
020
400
200
2040
0High latitude taxa
A. mayaroensis
P0P1a
-140
-1
20
-100
-8
0 -6
0 -4
0 -2
0 0
20
40
60
80
100
12
0 1
40
234
0,0
1,0
2,0
020
020
400
High latitude taxa
%
S. bicavatum
A-P complex
%%
02
-2
δ13C
-6-4
-2
δ18O bu
lk δ¹⁸O
δ¹⁸O
Ben
thic
sbu
lk δ
¹³C
cm above K-Pg bounadary
Planktonic foram zones
Lithology
DC
A a
xis
1
B

110110
CHAPTER IV
their first appearance and other inferred higher-latitude species become more dominant. Depending on the age model used, this first cooling pulse appears to last between 1 and 5 kyrs (Galeotti et al., 2004; Gradstein, 2012). The P/G ratio indicates that marine productivity rapidly recovers within 5 cm above the boundary. The first presumably heterotrophic dinocysts that become dominant are taxa of the Andalusiella/Palaeocystodinium complex (A-P Cpx.). In the interval calibrated against the upper part of Planktic Foraminifer Zone P0 this complex of heterotrophic dinocyst shows a bloom, with up to 4000 cysts per gram. Although the magnitude of this spike might be overestimated because sedimentation rates in the Danian are probably much lower than in the Maastrichtian because of decreased input of CaCO3 (Stüben et al., 2002), it most likely still represents an actual bloom, as it starts and ends within the boundary clay, the interval with lower sedimentation rates. Therefore, changes in sedimentation rate did probably not influence this signal. This peak has been recorded at various sites in the Tethyan Ocean, for example in Tunisia and Spain (Brinkhuis et al., 1998), suggesting that this phenomenon is related to specific regional environmental conditions following the K-Pg boundary event. Eshet et al. (1994) identified high abundances of this A-P Cpx. as typical for a high productivity upwelling systems in the Tethyan Realm. Brinkhuis et al. (1998) describe this group as typical for high sea surface temperatures. This suggests that this group thrives in warm, relatively nutrient-rich settings. It is likely that the A-P Cpx is an opportunistic group that bloomed in the warm, nutrient rich conditions following the K-Pg boundary impact winter. Various other studies have recorded a variety of blooms of opportunistic groups occurring in the earliest Danian, taking advantage of access of nutrients and ecological space available (e.g. Gardin, 2002; Alegret and Thomas, 2009). This interval likely coincides with the episode of global warming following the K-Pg boundary, resulting from the release of greenhouse gases into the atmosphere (Kring et al., 2007; Vellekoop et al., 2014).
Subsequently, in the interval correlative to Zone P1a, the dinocyst record reveal less pronounced second and third cool water pulses (See Fig. 9). At each of these pulses, there is an ingression of the inferred higher latitude species, with every subsequent pulse appearing less pronounced than its predecessor, suggesting a kind of reverberation of the initial cooling pulse at the K-Pg boundary. The loadings on DCA-axis 1 reveal that these cooling pulses are distinct events that occur superimposed on the general cooling trend that commenced in the Maastrichtian. Also at the El Kef stratotype section a multitude of cooling pulses was recorded (Brinkhuis et al., 1998, Galeotti and Coccioni, 2002; Galeotti et al., 2004), showing an overall similar pattern. These cooling pulses are also identified in the bulk δ18O record of the parallel Elles II section (Stüben et al., 2002; Fig. 9B) and suggest that the earliest Danian conditions were relatively unstable. Both at Elles and El Kef, this interval is also characterized by the ingressions of Boreal benthic foraminifera (Galeotti and Coccioni, 2002; Galeotti et al., 2004) and an increase in δ18O values of benthic foraminifera (Stüben et al., 2002), suggesting that bottom and surface waters cooled simultaneously (See Fig. 9). Strikingly, while surface waters appear to be characterized by multiple cooling pulses, δ18O values of benthic foraminifera indicate that the bottom waters remained cool over the entire interval. At approximately 100-120 cm above the boundary the benthic δ18O values return to pre-impact values, above which point the dinocyst assemblage is again dominated by cosmopolitan and low latitude taxa and the bulk δ18O has decreased to -5‰, slightly lower than pre-impact values. The low bulk δ18O values and dominance of low latitude dinocyst taxa like P. pentagonia, Senegalinium bicavatum and Thrithyrodinium evittii shows that planktic foraminiferal (sub)zones P1a4 and P1b are characterized by relatively warm conditions. In the basal part of Zone P1c, cosmopolitan dinocyst species increase in abundance, suggesting that peak warmth had reduced by this time and the system stabilized again.

111111
PALYNOLOGICAL EVIDENCE FOR PROLONGED COOLING
6.3 PotentialcauseforcoolingpulsesThe ingressions of higher latitude taxa directly above the K-Pg boundary are likely a biological
response to an ‘impact winter’ in the first years to decades following the Chixculub impact (Galeotti, et al., 2004; Vellekoop et al., 2014). However, in Tunisia this phase appears to have lasted more than 10 kyrs, much longer than the months to decades predicted by numerical models and indicated by TEX86 derived SST reconstructions at the Brazos River K-Pg boundary section (Vellekoop et al., 2014). In addition, the TEX86 record of Brazos River does not indicate any subsequent cooling pulses (Vellekoop et al., 2014). Both the prolonged duration of the cooling and its pulsating nature might be related to the presence of the North-Central Africa upwelling belt close to the studied sites (Parrish and Curtis, 1982; Huber and Sloan, 2001; Galeotti et al., 2004; Alsenz et al., 2013). A short impact winter, with a maximum duration of several decades, will have caused a rapid cooling of the global oceans, resulting in the formation of cold deep waters (See Fig. 10). When atmospheric and surface water temperatures rose again following the impact winter, this led to a temperature contrast between warm surface waters and cold, high density deep waters and, hence, a sharpening and strengthening of the main thermocline. Because vertical mixing is limited in such a condition, the large volume of cold, high density bottom waters will have persisted for time scales on the order of thousands of years (Galeotti et al., 2004), which is also evidenced by the δ18O values of benthic foraminifera, indicating that bottom waters remained cool for thousands of years after the impact Stüben et al., 2002 (See Fig. 9). In an area influenced by upwelling, such as Tunisia, this will also result in cooler surface waters, as evidenced by bulk δ18O and dinocysts (See Fig. 9). In such a situation, minor, local variations in upwelling-intensity are likely to result in large fluctuations in surface water temperatures. The bulk δ13C record of the Elles II section shows slight shifts concurring with the cooling pulses, which might indeed be related to small variations in upwelling-intensity (See Figs. 9 & 10). With time, the cold bottom waters will have slowly dissipated due to vertical mixing, decreasing their influence on the surface waters, which subsequently slowly returned to pre-impact conditions.

112112
CHAPTER IV
El Kef
Elles
El Kef
Elles
El Kef
Elles
Cretaceous
El Kef
Elles
50-5000 years after impact
>5000 years after impact
Stronger upwelling Weaker upwelling
Water temperaturewarm
cold
El Kef
Elles
El Kef
Elles
El Kef
Elles
Depth (m)
0
100
1000
Depth (m)
0
100
1000
Depth (m)
0
100
1000
Depth (m)
0
100
1000
Depth (m)
0
100
1000
Depth (m)
0
100
1000
Depth (m)
0
100
1000
Impact winter
High-latittude assemblage
Cosmopolitan assemblage
Low-latitude assemblage
Figure 10Conceptual model of the long term effects of an impact winter on a region influenced by upwelling. This situation along the Tunisian shelf is depicted for 4 different time intervals: late Maastrichtian; impact winter; the first thousands of years following the impact winter and >5000 years after the impact. For three of these time interval, the difference between stronger upwelling and weaker upwelling conditions is indicated and the consequences for the dinocyst assemblages.

113113
PALYNOLOGICAL EVIDENCE FOR PROLONGED COOLING
7. ConclusionsOur study provides an overview of the palynological record of the K-Pg boundary interval
of the El Haria Formation. The dinocyst assemblages of the Elles section are almost identical comparable to those of the El Kef K-Pg stratotype section. The El Haria assemblages are largely composed of species characteristic for an open marine shelf environment, and mainly includes typical cosmopolitan to warm water taxa. There is a clear sea level signal in the dinocyst record and the highest sea level appears to be reached at approximately -150cm. From there upwards, a general shallowing is evident, reaching a sea level lowstand above the K-Pg boundary. The dinocyst records of the El Haria Formation show several dinocyst events across the K-Pg boundary interval, likely indicating significant environmental perturbations. One of the most striking of these events is the ingression of higher latitude dinocyst species at the base of the boundary clay at both the El Kef and Elles section. This ingression is likely related to a pronounced cooling resulting from a so-called global ‘impact winter’. Following this is the peak of the Andalusiella-Palaeocystodinium ‘complex’, similar to other sites across the Tethys. This peak can likely be explained as a bloom of opportunistic low latitude taxa immediately succeeding the K-Pg boundary global impact winter. In Tunisia, the lowermost Danian is characterized by a prolonged cooling phase with multiple cooling pulses, likely related to upwelling of the large volume of colder bottom waters produced during the global impact winter, dissipating over longer timescales.

114114
CHAPTER IV

115115
PALYNOLOGICAL EVIDENCE FOR PROLONGED COOLING
8. Supplementary Information8.1 Systematicpalynology–Listofencountereddinocystspeciesandcomplexes
The generic allocation of taxa follows that cited in Fensome and Williams (2004) unless stated otherwise. Notes on certain taxa are provided, including cases of a difference in taxonomic interpretation with Brinkhuis et al. (1998).
Achilleodinium bianiiAchomosphaera ramuliferaAchomosphaera sagenaAchomosphaera spp. (pars)Adnatosphaeridium buccinumAlisocysta circumtabulataAlisocysta spp. (pars)Alisogymnium euclaenseAndalusiella dubiaAndalusiella gabonensis (part of the Palaeocyst./A. polymorpha Cpx of Brinkhuis et al., 1998)Andalusiella mauthei (part of the Palaeocyst./A. polymorpha Cpx of Brinkhuis et al., 1998)Andalusiella polymorpha (part of the Palaeocyst./A. polymorpha Cpx of Brinkhuis et al., 1998)Apteodinium fallaxAreoligera volataAreoligera senonensisAreoligera spp. (pars)Batiacasphaera rifensis Slimani 2008 (Batiacasphaera? sp. in Brinkhuis et al., 1998)Carpatella cf. cornuta. This morphotype differs from Carpatella cornuta s.s. in having a less thick
wall. In this study it is regarded as a transitional form between the taxa Cribroperidinium sp. A of Brinkhuis and Schiøler, 1996 and Carpatella cornuta s.s.
Cassidium fragileCerodinium diebelii subsp. diebeliiCerodinium mediterraneum Slimani 2008Cerodinium pannuceumCerodinium speciosum subsp. speciosum (part of the C. speciosum cpx. of Brinkhuis et al., 1998)Cerodinium striatumCerodinium spp. (pars)Chatangiella spectabilisCladopyxidium paucireticulatumCometodinium? whitei – presumed reworkedCordosphaeridosphaeridium inodes subsp. inodesCordosphaeridium fibrospinosumCordosphaeridium fibrospinosum var. cornuta. This taxon is distinguished from Cordosphaeridium
fibrospinosum s.s. by the development of distinct apical and antapical horns. These typical forms appear to develop in the earliest Danian and have been described as” intermediate morphotype between C. fibrospinosum and Damassadinium spp of the Cordosphaeridium fibrospinosum Complex” by Brinkhuis and Sluijs 2009, plate 2 B
Coronifera striolataCribroperidinium? pyrum

116116
CHAPTER IV
Cribroperidinium septata (Acanthaulax? sp. of Brinkhuis et al., 1998)Cribroperidinium sp. A of Brinkhuis & Schiøler 1996Dapsilidinium? sp. 1Damassadinium cf. californicum. This morphotype is distinguished from Damassadinium
californicum s.s. by having a less broad process base. In this study it is regarded as a transitional form between the taxa Cordosphaeridium fibrospinosum var. cornuta and Damassadinium californicum s.s. These forms appear to evolve in the earliest Danian and can therefore be used as a marker species.
Deflandrea galeataDeflandrea tuberculataDiconodinium wilsonii. (Diconidinium parvum in Wilson, 1974, following Slimani et al., 2011)Dinogymnium acuminatumDiphyes colligerumDisphaerogena carposphaeropsisDisphaerogena carposphaeropsis var. cornuta. This taxon is distinguished from Disphaerogena
carposphaeropsis s.s. in having a significantly more pronounced antapical horn. According to the emended diagnosis of Sarjeant, 1985, Disphaerogena carposphaeropsis s.s is characterized by an apical horn that is always longer than the antapical horn, by a ratio varying between 1.2:1 to 3:1. In the uppermost Maastrichtian samples, specimen occur with an antapical horn that is as long or longer than the apical horn. Since this form first appears in the uppermost Maastrichtian, in the basal part of magnetochron C29r, it is used as a stratigraphic marker in the present study.
Eisenackia reticulataExochospaeridium bifidumExochosphaeridium phragmitesFibrocysta axialisFibrocysta bipolarisFibrocysta liciaFibrocysta spp. (pars)Florentina feroxFlorentinia mantelliiGlaphyrocysta castelcasiensis (Corradini 1973) Michoux and Soncini in Fauconnier and Masure,
2004Glaphyrocysta pastielsiiGlaphyrocysta perforataGlaphyrocysta retiintextaGlaphyrocysta semitectaHafniasphaera septataHeterosphaeridium? heteracanthumHystrichokolpoma bulbosumHystrichosphaeridium recurvatum (Hystrichosphaeridium? sp. of Brinkhuis et al., 1998)Hystrichosphaeridium tubiferumHystrichosphaeropsis ovumHystrichostrogylon coninckiiImpagidinium celineae (Included in Impagidinium spp. undiff. in Brinkhuis et al., 1998)Impagidinium spp. (pars) All other taxa assignable to ImpagidiniumIsabelidinium bakeriKallosphaeridium yorubaense
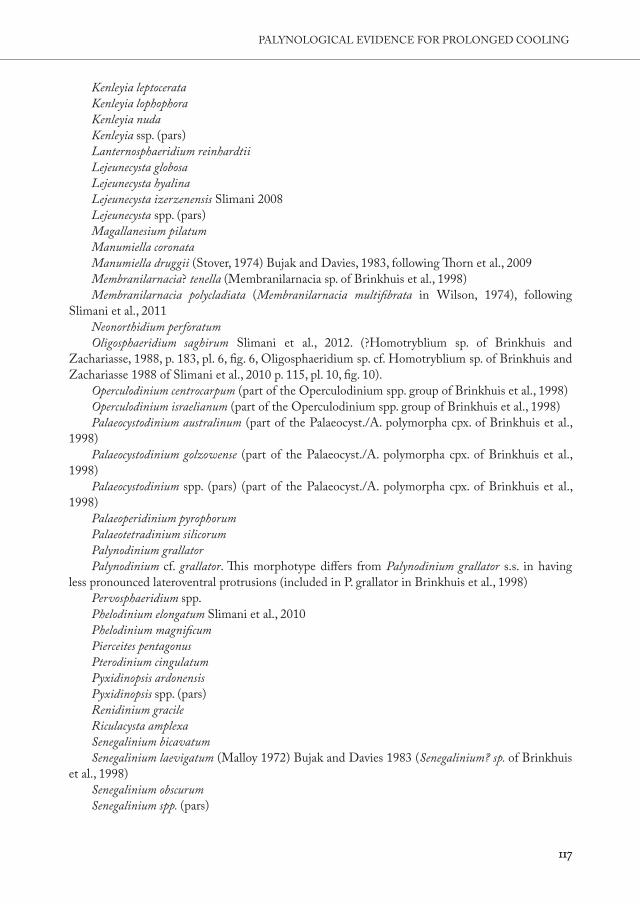
117117
PALYNOLOGICAL EVIDENCE FOR PROLONGED COOLING
Kenleyia leptocerataKenleyia lophophoraKenleyia nudaKenleyia ssp. (pars)Lanternosphaeridium reinhardtiiLejeunecysta globosaLejeunecysta hyalinaLejeunecysta izerzenensis Slimani 2008Lejeunecysta spp. (pars)Magallanesium pilatumManumiella coronataManumiella druggii (Stover, 1974) Bujak and Davies, 1983, following Thorn et al., 2009Membranilarnacia? tenella (Membranilarnacia sp. of Brinkhuis et al., 1998)Membranilarnacia polycladiata (Membranilarnacia multifibrata in Wilson, 1974), following
Slimani et al., 2011Neonorthidium perforatumOligosphaeridium saghirum Slimani et al., 2012. (?Homotryblium sp. of Brinkhuis and
Zachariasse, 1988, p. 183, pl. 6, fig. 6, Oligosphaeridium sp. cf. Homotryblium sp. of Brinkhuis and Zachariasse 1988 of Slimani et al., 2010 p. 115, pl. 10, fig. 10).
Operculodinium centrocarpum (part of the Operculodinium spp. group of Brinkhuis et al., 1998)Operculodinium israelianum (part of the Operculodinium spp. group of Brinkhuis et al., 1998)Palaeocystodinium australinum (part of the Palaeocyst./A. polymorpha cpx. of Brinkhuis et al.,
1998)Palaeocystodinium golzowense (part of the Palaeocyst./A. polymorpha cpx. of Brinkhuis et al.,
1998)Palaeocystodinium spp. (pars) (part of the Palaeocyst./A. polymorpha cpx. of Brinkhuis et al.,
1998)Palaeoperidinium pyrophorumPalaeotetradinium silicorumPalynodinium grallatorPalynodinium cf. grallator. This morphotype differs from Palynodinium grallator s.s. in having
less pronounced lateroventral protrusions (included in P. grallator in Brinkhuis et al., 1998)Pervosphaeridium spp.Phelodinium elongatum Slimani et al., 2010Phelodinium magnificumPierceites pentagonusPterodinium cingulatumPyxidinopsis ardonensisPyxidinopsis spp. (pars)Renidinium gracileRiculacysta amplexaSenegalinium bicavatumSenegalinium laevigatum (Malloy 1972) Bujak and Davies 1983 (Senegalinium? sp. of Brinkhuis
et al., 1998)Senegalinium obscurumSenegalinium spp. (pars)

118118
CHAPTER IV
Senoniasphaera inornataSenoniasphaera cf. inornata. This morphotype differs from Senoniasphaera inornata s.s. in having
a smaller size and thinner outer wall. In this study it is regarded as an early form of Senoniasphaera inornata.
Spiniferella cornutaSpiniferites pseudofurcatusSpiniferites ramosusSpiniferites spp. (pars)Spongidinium delitenseTanyosphaeridium xanthiopyxidesTectatodinium rugulatumThalassiphora cf. pelagica. This taxon differs from Thalassiphora pelagica in having a periphragm
that more or less surrounds the entire endophragm, instead of being closely oppressed at the dorsal site. The typical “hole” in the ventral site of the periphragm is also missing. (included in T. pelagica cpx in Brinkhuis et al., 1998)
Trichodinium castanea – presumed reworkedTrithyrodinium evittiiTurbiosphaera filosaXenicodinium spp. (includes Xenicodinium sp. A and Xenicodinium sp B of Brinkhuis et al.,
1998)

119119
PALYNOLOGICAL EVIDENCE FOR PROLONGED COOLING
8.2 BiostratigraphiceventsEl Kef references Elles references
FO P. pseudobulloides 240 cm 1 200 cm 4
FO Pv. eugubina 30-35 cm 2 40-45 cm 3
FO Gb. alabamensis 25-26 cm 2 20-25 cm 3
LO Palynodinium grallator ~25 cm 2 50.5 cm This study
FO Pv. longiapertura ~24 cm interpolated 20-25 cm 3
FO G. minutula 23 cm 1 N.F.
FO Carpatella cornuta ~16 cm 2 20.5 cm This study
FO Damassadinium californicum ~16 cm 2 15.5 cm This study
FO Senoniasphaera inornata ~10 cm 2 5.5 cm This study
FO Membranilarnacia tenella 0 cm 2 0 cm This study
FO Palynodinium grallator 0 cm 2 0 cm This study
LO A. mayaroensis 0 cm 1 0 cm 3
LO P. hantkeninoides 0 cm 1 0 cm 3
8.3 DetrendedCorrespondenceAnalysisonthedinocystassemblageFor their Detrended Correspondence Analysis (DCA), Brinkhuis et al. (1998) use a selected
set of species. In order to generate a clear environmental signal, they strip the dataset of taxa with relative abundances less than 2% in any sample and of any so-called ‘stratigraphical signals’.
When this arbitrary boundary of 2% was applied on the dataset from the Elles section, many taxa with environmental significance were omitted. To produce a better environmental signal and, more importantly, to produce a DCA plot with approximately the same species as Brinkhuis et al. (1998), a different boundary definition was looked for. Versteegh and Zonneveld (1994) use a different approach. They removed species with less than 30 specimens out of a dataset with 130000 specimen. Hence, they only take out species which form less than 0.023% of their dataset. Given that the dataset of the Elles section is not as extensive as the dataset from Versteegh and Zonneveld (there are ~20000 specimen in the dataset of Elles), this approach also seemed unsuitable.
Testing different boundary definitions, the definition with which the DCA produces the clearest results was determined. For the DCA presented in this study, all species with less than 15 specimen in the total dataset of 20000 were omitted.
To remove the ‘stratigraphic signal’, Brinkhuis et al. (1998) remove stratigraphic markers such as Seniosphaera inornata, Damassadinium californicum and Carpatella cornuta from the dataset. Unfortunately, this also includes two species that most likely signify an important environmental signal: Palynodinium grallator and?Membranilarnacia polycladiata. These two inferred higher latitude species have their first occurrence at the base of the Danian in both El Kef and Elles. The ingression of these species might indicate a cooling of the photic zone at this interval. In order to see what their position on the DCA axis would be, the DCA performed twice, one time on a dataset with these two species excluded, one time with these two species included. This analysis showed when these taxa are included, they plot well within the higher-latitude group.
1 = Smit in Brinkhuis et al., 1994; 2 = Brinkhuis et al., 1998; 3 = Karoui-Yaakoub et al., 2002; 4 = Coccioni and Marsili, 2007; N.F.= not found; Dinocyst events are colored blue.

120

121121
K-PG BOUNDARY ENVIRONMENTAL CRISIS AND RECOVERY
CHAPTER V
Cretaceous-Paleogene boundary environmental crisis and recovery in the Mudurnu-Göynük Basin, NW Turkey

122122
CHAPTER V

123123
K-PG BOUNDARY ENVIRONMENTAL CRISIS AND RECOVERY
AbstractStudies over the past decades have demonstrated that the mass extinction associated with the Cretaceous-Paleogene (K-Pg) boundary (~66 Ma) is related to the short- and long-term environmental effects of a large extraterrestrial impact. These environmental effects are, however, still poorly understood. In order to enable reconstructions of pre- and post-impact marine environmental conditions across the K-Pg boundary using microfossils, focus should be on those groups which did not experience major extinction, like benthic foraminifera and organic-cyst producing dinoflagellates (dinocysts). However, although combining dinocyst and benthic foraminifera analyses could provide crucial insight into benthic-pelagic coupling, no attempts have been made to integrate these records along these lines. Furthermore, although several benthic foraminiferal and dinocyst records have been published from the southern margin of the Tethyan Realm, no such records exist form its northeastern margin. Therefore, here, we integrate dinocyst and benthic foraminiferal records of the recently discovered, stratigraphically expanded Okçular section in Northwestern Turkey to reveal how the K-Pg boundary biotic crisis affected surface and bottom conditions, in a Tethyan-wide context. Our record confirms the post-impact dominance of epibenthic taxa and shows an increase in inferred heterotrophic dinocysts in the earliest Danian. These results indicate that during the initial post-impact phase, the collapse of export productivity likely resulted in lower nutrient availability on the sea floor, but with more nutrients being available for the earliest Paleocene planktic community.
124124
CHAPTER V

125125
K-PG BOUNDARY ENVIRONMENTAL CRISIS AND RECOVERY
1. IntroductionIt is now widely accepted that the Cretaceous-Paleogene (K-Pg) boundary (~66 Ma) is
associated with an impact of a large extra-terrestrial body, at present day Chicxulub, Yucatan, Mexico. The short- and long-term environmental implications of this impact resulted in the extinction of a large number of biological clades (Sepkoski 1996). Based on the fossilized remains, paleontological records indicate that approximately 50% of marine genera went extinct across the K-Pg boundary. This episode thus represents one of the largest mass-extinction events in Earth history (Sepkoski 1996; D’Hondt, 2005). Apart from short-term global environmental consequences, such as an initial ‘impact winter’ phase, (Vellekoop et al., 2014), the event likely also had major long-term consequences, as e.g., CO2 produced from Chicxulub target rocks and associated materials are thought to have caused greenhouse warming (Galeotti et al., 2004; Kring, 2007). In addition, the large-scale extinctions amongst primary producers must have caused a major restructuring of global food webs and global carbon cycling (D’Hondt, 2005; Coxall et al., 2006). A collapse in the oceanic stable carbon isotope gradient between surface and bottom persisted for hundreds of thousands to a few million years (Zachos et al., 1989; Kump, 1991). The breakdown of this gradient likely reflects a global collapse of export productivity (D’Hondt et al., 1998; Coxall et al., 2006). It is suggested that in the post-extinction ocean a smaller fraction of marine production sank to the deep waters (D’Hondt et al., 1998). This reduction in the organic flux to deep waters might be a consequence of the ecosystem reorganization that resulted from the mass extinction, since a general absence of large pelagic grazers (such as macrozooplankton and fish) or a shift in dominance from grazers that create fecal pellets (e.g. fish) to grazers that do not (e.g., jellyfish) could have greatly reduced the packaging of biomass into large particles that sink to the deep ocean (D’Hondt, 2005). Alternatively, some studies suggest that, especially in the deep-sea, the K-Pg boundary extinction might have resulted in a change in food source rather than a decrease in total nutrients on the sea floor, presenting a major stressor for the benthic community (Alegret and Thomas, 2009, 2013).
Although numerous studies have been performed to seek evidence of the K-Pg boundary impact globally, especially the millennial-scale biotic responses to this geologically instantaneous event are still poorly documented and understood. Crucially, many previous studies lack sufficient temporal resolution to reconstruct such millennial-scale environmental changes across the boundary interval (e.g. Alegret and Thomas, 2013). In addition, several microfossil groups commonly used for paleoenvironmental reconstructions, such as planktic foraminifera and calcareous nannoplankton, experienced major extinctions (Huber et al., 2002). Benthic foraminifera and organic-cyst producing dinoflagellates (dinocysts), on the other hand, are ideally suited to reconstruct changes in bottom and surface water conditions across the K-Pg boundary interval, as they show no significant extinction above background levels at the end of the Cretaceous (Brinkhuis and Zachariasse, 1988; Culver, 2003). Indeed, a few high resolution K-Pg boundary benthic foraminiferal and dinocyst records have been published, particularly from the southern shelfal margins of the Western Tethyan Ocean, from e.g. Tunisia, Israel, Egypt and Spain (Brinkhuis and Zachariasse, 1988; Eshet et al., 1992; Coccioni and Galeotti, 1994; Speijer and Van der Zwaan, 1996; Brinkhuis et al., 1998; Peryt et al., 2002; Alegret et al., 2003; see Figure 1). These records thus potentially provide a comprehensive, Tethyan ocean-wide portrayal of the surface and bottom water environmental changes across the K-Pg boundary. The benthic foraminiferal and dinocyst records from the southern margin of the Tethys do reveal indications for major, short-term changes in oceanography, including e.g., temperature, redox and trophic conditions across the K-Pg boundary (e.g. Brinkhuis

126126
CHAPTER V
and Zachariasse, 1988; Speijer and Van der Zwaan, 1996; Brinkhuis et al., 1998). Especially quantitative benthic foraminiferal records show a strong response to the K-Pg boundary impact, generally portraying an abrupt benthic community impoverishment across the boundary. At many of these K-Pg boundary sites, after a short-lived proliferation of endobenthic forms, epibenthic forms dominate the initial post-impact ‘disaster’ phase (Culver, 2003). Since in general endobenthic forms are considered indicative for a high flux of organic matter to the seafloor and/or relatively low oxygen conditions and epibenthic forms for more oligotrophic environments (Peryt et al., 2002; Culver, 2003; Jorissen et al., 2007), the post-impact abundance of epibenthic forms is often explained as food starvation at the sea floor (Culver, 2003). Following this ‘disaster’ phase, most benthic foraminiferal records show a relatively long recovery phase, with endobenthic forms slowly returning as diversity starts to increase again (Alegret et al., 2003; Culver, 2003).
Combining quantitative dinocyst and benthic foraminifera analyses could provide crucial insight into benthic-pelagic coupling. Remarkably, no such attempts have effectively been made so far. In addition, although the southern shelfal margins of the Western Tethys Ocean are quite reasonably covered geographically, no such combined and high resolution records exist from the northern shelfal margins of the Western Tethyan Ocean as yet. To be able to provide a comprehensive, ocean wide portrayal of the surface and bottom water environmental changes across the K-Pg boundary and the coupling between benthic and pelagic systems, additional dinocyst and benthic foraminiferal records need to be produced from the northern margin of the Tethys.
Amongst the potential localities for new high-resolution K-Pg boundary benthic foraminiferal and dinocyst records from the northern margins of the Tethys is the Mudurnu-Göynük Basin in the Central Sakarya Region, Turkey. Recently, well-preserved, largely unstudied outcrops of ancient
OceanicContinental shelfLand
Benthic foraminifera DinocystsDinocysts and benthicsThis study
1 2
34
567
8
500 km
N
Figure 1.The late Cretaceous-early Paleogene paleogeography of the Eastern Mediterranean after Scotese, (2004) and Scotese and Dreher (2012). Sites with high-resolution benthic foraminiferal and/or dinocyst records are indicated: 1) Caravaca, Spain (Keller, 1992; Coccioni and Galeotti, 1994; Brinkhuis et al., 1998); 2) Agost, Spain (Pardo et al., 1996; Alegret et al., 2003); 3) Ain Settara, Tunisia (Peyrt et al., 2002); 4) El Kef, Tunisia (Brinkhuis and Zachariasse, 1988; Speijer and Van der Zwaan, 1996; Brinkhuis et al., 1998); 5) Gebel Duwi, Egypt (Speijer and Van der Zwaan, 1996); 6) Nahal Avdat, Israel (Speijer and Van der Zwaan, 1996); 7) Hor Harar, Israel (Eshet et al., 1992); 8; Okçular section, Turkey (this study).

127127
K-PG BOUNDARY ENVIRONMENTAL CRISIS AND RECOVERY
continental shelf deposits spanning the K-Pg boundary were discovered in the Mudurnu-Göynük Basin; the Okçular section and the Göynük North section (Açikalin et al., 2014). Combining dinocyst and benthic foraminifera at this biostratigraphically well-constrained K-Pg boundary transition could provide crucial insight in changes in, and relationship between, surface and bottom water conditions in the Mudurnu-Göynük Basin. By integrating these records with previously generated bulk carbonate carbon isotope records of these sections (Açikalin et al., 2014), the recorded paleobiological changes can potentially be placed in the context of the K-Pg boundary pelagic crisis and collapse of export productivity and subsequent recovery in the earliest Paleocene in the entire Tethyan Ocean. Therefore, we here perform benthic foraminiferal analysis on the Okçular section and dinocyst analysis on the Okçular and Göynük North sections. The results are integrated with bulk δ13C records of these sections and compared with those from sections around the former Tethyan Ocean.
2. Geological setting and age assessmentThe Mudurnu-Göynük Basin is located in the Central Sakarya Region in Northwestern
Turkey (See Fig. 1). In most of the parts of the Mudurnu-Göynük Basin the Late Cretaceous is represented by the slope and basinal deposits of the Yenipazar and Tarakli formations (Saner, 1980; Altiner, 1991). The Tarakli Formation straddles the Cretaceous-Paleogene boundary (Açikalin et al., 2014). In the eastern side of the basin, the upper Maastrichtian is characterized by an intercalation of mudstones and turbidites, whereas in the western side of the basin the turbidites are absent. In the Tarakli Fm, the K-Pg boundary is marked by a reddish ejecta layer at the base of a 15-20 cm thick boundary clay layer. Throughout the basin, the lower 30-50 m of the Danian is characterized by a rhythmic alternation of fine-grained limestones and limey mudstones (Açikalin et al., 2014).
The studied Okçular and Göynük North sections encompass the K-Pg boundary interval of the Tarakli Fm. During the latest Cretaceous-earliest Paleocene these sites were characterized by mixed siliciclastic-carbonate sedimentation in an outer neritic to upper bathyal environment (Açikalin et al., 2014). Both sections have been analyzed for siderophile trace elements, including Ir and other platinum group elements (PGEs), planktic foraminifera, calcareous nannofossils and dinocysts. Based on these results, a detailed biostratigraphy was obtained (Açikalin et al., 2014), allowing a confident age assessment of the boundary interval. The age model shows that both sections contain a chronostratigraphically complete K-Pg boundary interval. The studied interval ranges from the top part of the Maastrichtian A. mayaroensis Zone up to the basal part of the Danian planktic foraminiferal Zone P1b and covers globally occurring FOs of dinocyst marker taxa such as Senoniasphaera inornata, Damassadinium californicum and Carpatela cornuta (Açikalin et al., 2014).
3. Materials and methods3.1 Sampling
For the present study, high-resolution (mm to cm-scale) sample sets were used that were acquired during 2 field campaigns, in 2010 and in 2011. For more detail on these sampling campaigns, see Açikalin et al. (2014). The samples from both sections were split for micropaleontological and palynological analyses. Samples from the Okçular section were analyzed for both benthic foraminifera and palynology. To verify the palynological results of the Okçular section, the K-Pg boundary transition of the nearby Göynük North section was subsequently also analyzed for palynology.

128128
CHAPTER V
3.2 ForaminiferaanalysisThe Okçular samples were processed at KU Leuven for foraminiferal studies following
standard micropaleontologic procedures. Rock samples were dried in a stove at 60°C for at least 24 hours. Depending on sample size, 4 to 60 grams of dry rock were soaked in a soda solution (50g/l Na2SO4). If necessary, the tenside Rewoquat was used to disintegrate strongly lithified samples. After disintegration, each sample was washed over 2 mm and 63-μm sieves. The dry residues were further sieved into three fractions: 63-125 μm, 125-630 μm and >630 μm. Representative aliquots of the >125 μm fraction, containing at least 300 benthic foraminiferal specimens, were obtained. Picked specimens from this size fraction were permanently stored in Plummer slides. Benthic foraminifera were identified using the taxonomy of Cushman (1946), Cushman (1951), Kellough (1965) and Berggren and Aubert (1975).
To recognize changes in assemblages, the main faunal associations were identified by means of cluster analysis, using Paired group (UPGMA) correlation distance. This cluster analysis allows the identification of 4 main benthic foraminiferal assemblages, Assemblages A to D (see Fig. 2).
Benthic foraminifera are commonly used as indicators for bottom water oxygenation and trophic conditions (e.g. Culver, 2003; Jorissen et al., 1995; Jorissen et al., 2007). It is generally assumed that particular foraminifera morphologies are characteristic for epibenthic habitats (rounded trochospiral, plano-convex trochospiral, biconvex trochospiral/planispiral, milioline and tubular morphotypes), whereas others are more characteristic for endobenthic habitats (rounded planispiral, flattened ovoid, tapered and cylindrical) (e.g. Peryt et al., 2002; Culver, 2003; Alegret et al., 2003). These forms are interpreted to reflect specific microhabitats in and on the sea floor. According to the TROX model of Jorissen et al. (1995), the main factors to explain the benthic foraminiferal microhabitats are food availability and oxygen concentration. In general, endobenthic forms are considered indicative for a higher flux of organic matter to the seafloor and/or relatively low oxygen conditions, while epibenthic forms are considered characteristic for more oligotrophic/oxygen rich environments (Peryt et al., 2002; Alegret et al., 2003; Jorissen et al., 2007).

129129
K-PG BOUNDARY ENVIRONMENTAL CRISIS AND RECOVERY
3.3 PalynologicalanalysisIn total, 48 samples from the Göynük North section and 45 samples from the Okcular section
were processed following standard palynological processing techniques. Briefly, approximately 10 gram of each sample was crushed, oven dried (60°C), weighted and a known amount (10679, error 5%) of Lycopodium clavatum spores is added. The samples were then treated with 10% HCl
Figure 2.A cluster analysis on the benthic foraminiferal data using paired group (UPGMA) correlation distance. This cluster analysis the identification of 4 main benthic foraminiferal assemblages, assemblages A to D.
-0,1
6
0,00
0,16
0,32
0,48
0,64
0,80
0,96
Praebulimina reussiSpiroplectammina spp.Bulimina trinidatensisDentalinoides spp..Pleurostomella spp.Dorothia spp.Lenticulina dissonaOolina acuticostaFrondicularia sp.Bathysiphon eocenicaBulimina prolixaPseudonodosaria spp.Tappanina selmensisCibicides alleniBulimina quadrataBolivinoides draco dracoSpiroplectinella sp. Nonionella sp.Ammodiscus spp.Bolivina midwayensisNeoflabellina sp.Bolivinoides decoratusQuinqeloculina spp.Pullenia sp.Quadrimorphina allomorphinoidesGyroidina depressaGyroidina girardanusHoeglundina sp.Lagena spp.Pseudouvigerina plummeraeHoeglundina eocenicaOridorsalis sp.Alabamina sp.Anomalinoides rubiginosusOolina orbignyana-entosolinaPulsiphonina primaCibicides sp.Nodosaria spp.Dorothia oxyconaTritaxia sp.Lenticulina sp.Guttulina sp.Haplophragmoides sp.Marginulina spp.Ramulina globuliferaStilostomella spp.Buliminella sp.Osangularia plummeraeDentalina spp.Anomalinoides praeacutusBolivina sp.Cibicides pseudoactusTrochammina spp.Glomospira spp.Gaudryina spp.
Assemblage A
Assemblage D
Assemblage C
Assemblage B

130130
CHAPTER V
to remove carbonate components and 40% HF to dissolve the siliceous components. No heavy liquid separation or oxidation was employed. After each acid step, samples were washed with water and centrifuged or settled for 24h and decanted. The residue was sieved over nylon mesh sieves of 250 μm and 15 μm and were given 5 minutes ultrasound to break up agglutinated particles of the residue. From the residue of the 15-250 μm fraction, quantitative slides are made on well mixed, representative fractions by mounting one droplet of homogenized residue and adding glycerin jelly. The mixture was homogenized and sealed. All slides are stored in the collection of the Laboratory of Palaeobotany and Palynology, Utrecht University, The Netherlands.
For the present study, ~30 samples per site were studied for palynology. Slides were counted for marine (e.g., dinocysts) an terrestrial palynomorphs (e.g., pollen and spores) up to a minimum of 300 dinocyst specimen. The taxonomy of dinocysts follows that cited in Fensome and Williams (2004). For the systematic palynology, see Açikalin et al. (2014).
To identify major changes in the dinocyst record, morphologically closely related taxa were grouped into complexes using a similar approach as Schioler et al. (1997) and in Sluijs and Brinkhuis (2009), In our study, the following morphological complexes were established: (1) the Spiniferites complex, combining all species of Spiniferites and the morphologically similar genus Achomopshaera; (2) hexaperidinioids, lumping all Peridinioid cysts with a hexaform archeopyle; (3) Manumiella spp., grouping all species of Manumiella; (4) other dinocysts, which includes all other dinocyst taxa and indeterminable dinocysts.
4. Results4.1 BenthicForaminifera
The benthic foraminiferal record of the Okçular section is characterized by a major turnover across the K-Pg boundary (See Fig. 3). For the foraminiferal countings, see Appendix 1. To assess changes in diversity across the studied interval the Shannon diversity index (H) was calculated. Based on the diversity index, 4 intervals can be recognized in the benthic foraminiferal record of the Okçular section (see Fig. 3).
The first interval comprises the uppermost Maastrichtian and is characterized by relatively high diversity, dominated by Assemblage A. In this assemblage, the buliminids represent the most dominant group (16-26%). About 50-60% of the assemblage consists of inferred endobenthic taxa. The K-Pg boundary marks an abrupt benthic community impoverishment and the decimation of Assemblage A.
The second interval, characterized by low diversity, comprises the lowermost Danian, approximately correlative to planktic foraminiferal Zone P0. In this interval epibenthic forms are most abundant (70-90%). It is dominated by Assemblage B, encompassing successive peak occurrences of the taxa Anomalinoides praeacutus, Trochammina spp., Cibicidoides pseudoacutus and Osangularia plummerae (See Appendix 1).
The third interval covers the interval approximately correlative to planktic foraminiferal Zone Pα. This interval is characterized by a recovery of the diversity, although the diversity is still lower than that of the top Maastrichtian. Assemblage B slowly decreases and Assemblage C, mainly represented by Cibicides sp., becomes abundant. Endobenthic forms recover and make up 30-40% of the total assemblage.
The fourth interval starts in the interval correlative to Planktic Foraminiferal Zone P1a. Here, the benthic community has recovered as the diversity is roughly back to pre-impact values. This interval is characterized by Assemblage D, a typical Paleocene Midway-type fauna (Berggren

131131
K-PG BOUNDARY ENVIRONMENTAL CRISIS AND RECOVERY
2,0
2,5
3,0
500
450
400
350
300
250
200
150
100
50 0 -50
-100
-150
-200
CC26bNP1Nanno Zonation
Distance from K-Pg boundary (cm)
Lithology
P. g
ral.
C. co
rn.
D. c
ali.
S. in
or.
D. c
f. ca
li.
M. d
rug.
acm
eD
. car
po. v
ar.
“cor
nuta
”M
. dru
g.
Din
ocyc
t ev
ents
0-1
-2
A. mayaroensis
P0
PαP1aP1bForam Zonation13C
δ ‰
Age
(Ma)
66.0
466
.00
65.7
2
66.0
6
Interval
020
40%
Assemblage A
020
4060
80%Assemblage D
020
40%
Assemblage C
020
40%
Assemblage B
020
40%
Indet forams
Div
ersi
ty
(Sha
nnon
-H)
4 3 2 1
020
4060
8010
0
endo
- and
epi
bent
hic
form
s
%
Epib
enth
icEn
dobe
nthi
c
Figu
re 3
.Th
e be
nthi
c fo
ram
inife
ral r
ecor
d of
the
Okç
ular
secit
on. Th
e bi
ostra
tigra
phy
and
bulk
stab
le ca
rbon
isot
ope
reco
rd a
re fr
om A
çikali
n et
al.
(201
4). D
. car
p. =
Disp
haer
ogen
a ca
rpos
phae
rops
is; M
. dru
g. =
Man
umiel
la d
rugg
i; D
. car
p. va
r. “co
rnut
a” =
Disp
haer
ogen
a cf.
carp
osph
aero
psis,
“cor
nuta
” var
iety
; M. D
rug.
Acr
me =
Man
umiel
la d
rugg
i acm
e; S.
inor
. =
Seno
nias
phae
ra in
orna
ta; D
. cf.
cali.
= D
amas
sadi
nium
cf. c
alifo
rnicu
m; C
. cf.
corn
. = C
arpa
tella
cf. c
ornu
ta; D
. cal
i. =
Dam
assa
dini
um ca
lifor
nicu
m; C
. cor
n. =
Car
patel
la co
rnut
a; P.
gral
. = P
alyn
odin
ium
gra
llato
r. R
elativ
e co
ncen
tratio
ns o
f the
4 m
ain
fora
min
ifera
l ass
embl
ages
, rela
tive
abun
danc
es o
f epi
bent
hic
and
endo
bent
hic
form
s and
the
dive
rsity
(S
hann
on-H
) are
plo
tted.
Bas
ed o
n th
e ben
thic
fora
min
ifera
l rec
od, 4
dev
elopm
enta
l sta
ges c
an b
e ide
ntifi
ed.

132132
CHAPTER V
and Aubert, 1975), with representatives such as Anomalinoides praeacutus, Bolivina midwayensis, Cibicidoides alleni and Osangularia plummerae.
4.2 PalynologyThe palynological records of the Okçular and Göynük North section are almost identical (See
Figs. 4 and 5). Samples from both sites yielded an abundance of well-preserved palynomorphs, dominated by dinocysts and with minor contributions of acritarchs, prasinophytes, organic foraminiferal linings and terrestrial palynomorphs. The dinocyst associations of the Mudurnu-Göynük Basin are relatively diverse, including components characteristic for both the Tethyan and Boreal realms (Açikalin et al., 2014).
At both sections, the Spiniferites complex is consistently the most dominant, in general making up 40-50% of the total assemblage. Hexaperidinioids generally make up a relatively small component of the Maastrichtian assemblage (3-17%), but show an increase across the K-Pg boundary. In the boundary clay layer, correlative to planktic foraminiferal Zone P0, this group increases up to 35% of the assemblage. After an initial drop in relative abundance at the top of Zone P0, this group remain relatively abundant (15-30%) through Zone Pα, reaching a second maximum in the basal part of Zone P1a, after which it slowly decreases up to the top of the studied interval. Similar to other K-Pg boundary sites worldwide (Habib and Saeedi, 2007), Manumiella spp. show an episode of high relative abundances near the top of the Maastrichtian, some 30-40 cm below the K-Pg boundary. This high relative abundance coincides with a spike in the absolute abundance of total dinocysts, suggesting that this spike is not the result of the closed-sum effect but truly signifies a true bloom of Manumiella spp. The rest group ‘other dinocysts’ generally makes up 25-50% of the assemblage.
To rule out the possibility that the observed assemblage changes across the K-Pg boundary are the result of changes in total dinocyst production or preservation, we made an estimation the dinocyst accumulation rates, here defined as the preserved part of the cysts that accumulated per cm2 sea floor per year.
To estimate the dinocyst accumulation rates, the dinocyst concentrations in cysts per gram were calculated. In the palynological records of the Mudurnu-Göynük Basin there is a strong increase in concentrations of dinocysts across the K-Pg boundary, from Maastrichtian abundances of ~1000 cysts/gram on average at Göynük North and ~1000-2000 cysts/gram at Okçular, to lowermost Danian values of up to ~6000 cysts/gram at Göynük North and up to 14000 cysts/gram at Okçular, representing a 6-7 fold increase across the boundary (Figs. 4 and 5). These high concentrations occur in the interval correlative to planktic foraminiferal Zones P0 and Pα, above which concentrations decrease again to ~1000-3000 cysts/gram in Göynük North and 2500-6500 cysts/gram in Okçular. Using the estimated sedimentation rates for the studied interval based on the biostratigraphic age model of Açikalin et al. (2014) and the estimated average density for the lithologies of the Tarakli Fm (2.5 g/cm3; Manger et al., 1963), the concentrations of dinocysts may be used to estimate the dinocyst accumulation rates (in cysts/cm2/year). The resulting records show that the estimated dinocyst accumulation rates do not change considerably across the boundary, implying that the change in absolute concentrations of dinocysts is mostly related to the decrease in sedimentation rates across the K-Pg boundary (Açikalin et al., 2014).

133133
K-PG BOUNDARY ENVIRONMENTAL CRISIS AND RECOVERY
500
450
400
350
300
250
200
150
100
50 0 -50
-100
-150
-200
CC26bNP1Nanno Zonation
Distance from K-Pg boundary (cm)
Lithology
P. g
ral.
C. co
rn.
D. c
ali.
S. in
or.
D. c
f. ca
li.
M. d
rug.
acm
eD
. car
po. v
ar.
“cor
nuta
”M
. dru
g.
Din
ocyc
t ev
ents
0-1
-2
A. mayaroensis
P0
PαP1aP1bForam Zonation13C
δ ‰
Age
(Ma)
66.0
466
.00
65.7
2
66.0
6
Spiniferites Group
Hexa-peridinioids0
5000
1000
015
000
Tota
l Din
ocys
tco
ncen
trat
ion
cyst
s pe
r gra
m
Din
ocys
t ac
cum
ulat
ion
rate
010
000
2000
0cy
st/c
m²/k
yr0
2040
600
2040
%0 %
020
4060
%%
Manumiella spp.
Other dinocysts
Interval
4 3 2 1
Figu
re 4
.Th
e or
gani
c-wa
lled
dino
flage
llate
cys
t re
cord
of
the
Okç
ular
sec
tion.
The
bios
tratig
raph
y an
d bu
lk s
tabl
e ca
rbon
iso
tope
rec
ord
are
from
Açik
alin
et a
l. (2
014)
. For
ab
brev
iatio
ns, s
ee F
ig. 3
. The
4 m
ain
dino
cyst
com
plex
es, t
otal
dino
cyst
abun
danc
es (i
n cy
sts p
er g
ram
dry
sedi
men
t) an
d es
timat
ed d
inoc
yst a
ccum
ulat
ion
rate
s (in
cys
t/cm
2 /ky
r) ar
e plo
tted.
The 4
stag
es b
ased
on
the b
enth
ic fo
ram
inife
ral r
ecor
d of
this
sect
ion
are i
ndica
ted.

134134
CHAPTER V
-10
12
‰0
2040
60%
020
40%
020
4060
80%
020
40%
Spiniferites Group
Hexa-peridinioids
Manumiella spp.
Other dinocysts
050
00cy
sts
per g
ram
Tota
l Din
ocys
tco
ncen
trat
ion
010
000
2000
0cy
st/c
m²/k
yr
Din
ocys
t ac
cum
ulat
ion
rate
350
300
250
200
150
100 50 0
-50
-100
-150
-200
P. g
ral.
D. c
ali.,
C. c
orn.
C.cf
. cor
n.
S. in
or.
D. c
f. ca
li.
M. d
rug.
acm
e D
. car
p. v
ar. c
orn.
M. d
rug.
D. c
arp.
Din
ocyc
t ev
ents
A. mayaroensis
P0
PαP1aP1bForam Zonation
66.0
466
.00
65.7
2
66.0
6
Age
(Ma)
Lithology
13C
δ
Distance from K-Pg boundary (cm)
Figu
re 5
.Th
e or
gani
c-wa
lled
dino
flage
llate
cys
t rec
ord
of th
e G
öynü
k N
orth
sec
tion.
The
bios
tratig
raph
y an
d bu
lk s
tabl
e ca
rbon
isot
ope
reco
rd a
re fr
om A
çikali
n et
al.
(201
4). F
or
abbr
evia
tions
, see
Fig
. 3. Th
e 4
mai
n di
nocy
st co
mpl
exes
, tot
al di
nocy
st ab
unda
nces
(in
cysts
per
gra
m d
ry se
dim
ent)
and
estim
ated
din
ocys
t acc
umul
atio
n ra
tes (
in c
yst/c
m2 /
kyr)
are p
lotte
d. N
ote t
hat t
he sp
ike i
n M
anum
iella
spp.
coin
cides
with
a lar
ge p
eak
in th
e esti
mat
ed d
inoc
yst a
ccum
ulat
ion
rate
.

135135
K-PG BOUNDARY ENVIRONMENTAL CRISIS AND RECOVERY
5. Discussion5.1 Benthicforaminiferalturnover
The major turnover in the benthic community is largely comparable to earlier published benthic foraminiferal records from shelfal K-Pg boundary sites in the Tethyan Realm (Culver, 2003), with a highly diverse Maastrichtian fauna, an abrupt benthic community impoverishment at the K-Pg boundary, followed by a first recovery phase in the interval correlative to Zone Pα and a final recovery in Zone P1a, returning to high diversity assemblages (Speijer and Van der Zwaan, 1996; Peryt et al., 2002; Culver, 2003). Although the specific taxa making up the foraminiferal assemblages differ per site, other Tethyan K-Pg boundary sites with faunas from outer neritic to upper bathyal depths generally portray a similar succession of assemblages (Speijer and Van der Zwaan, 1996; Peryt et al., 2002; Culver, 2003), involving the successive occurrences of (1) a typical high diversity assemblage in the Maastrichtian, (2) a low diversity ‘disaster’ assemblage following the K-Pg boundary impact, mostly characterized by epibenthic taxa, (3) a ‘recovery’ assemblage, characterized by an increasing diversity and returning endobenthic forms, and (4) a new, high diversity assemblage, often dominated by a Paleocene, Midway-type fauna, with both epi- and endobenthic forms present. Hence, based on the succession of benthic faunal assemblages, the Mudurnu-Göynük Basin K-Pg boundary interval can be characterized by four phases; the Maastrichtian or pre-impact phase, a disaster phase, a recovery phase and an early Paleocene phase (Fig. 3).
5.2 EnvironmentalcrisisattheK-PgboundaryThe palynological, benthic foraminiferal and bulk stable isotope records of the Mudurnu-
Göynük Basin show major changes across the K-Pg boundary interval, portraying the environmental crisis at the K-Pg boundary and subsequent recovery during the earliest Paleocene (Figs. 3-5). The late Maastrichtian of the Mudurnu-Göynük Basin was characterized by normal outer neritic to upper bathyal conditions. The dominance of endobenthic taxa, including the presence of buliminids, suggests a relatively high flux of organic matter to the seafloor and resulting relatively low oxygen concentrations within the sediment poor waters ( Jorissen et al., 2007). At the K-Pg boundary, the stable carbon isotope records reflect the pelagic crisis, i.e. the mass mortality amongst surface dwelling carbonate producers and the global collapse of export productivity (D’Hondt, 2005). Simultaneously, inferred endobenthic taxa almost disappear from the benthic community, indicating that also in the Mudurnu-Göynük Basin the K-Pg boundary marked a drastic decrease in food availability on the seafloor and, associated with this, a simultaneous increase in oxygen availability in sediment pore waters. These changes are likely caused by the major drop in food supply from the photic zone to the seafloor (Peryt et al., 2002; Culver, 2002), related to the major extinction amongst the dominant primary producers, calcareous nannoplankton, and larger pelagic grazers (such as macrozooplankton and fish) (D’Hondt et al., 1998; D’Hondt, 2005). The disappearance of these groups likely led to a strong reduction in the production of larger fecal pellets, which in turn decreased the portion of biomass transported to the sea floor (D’Hondt, 2005). Organic-walled cyst producing dinoflagellates, on the other hand, did not suffer extinctions and must have become a more important component in the earliest Paleocene phytoplankton community (Brinkhuis and Zachariasse, 1988; Brinkhuis et al., 1998). Hence, both the composition of food supplied form the photic zone, as well as the way it was transported down, likely changed significantly across the K-Pg boundary, both these changes presented a major stress factor for the benthic community (D’Hondt, 2005; Alegret and Thomas, 2009). In the benthic foraminiferal record of the Okçular section, this interval of major stress is represented by the ‘disaster’ phase.

136136
CHAPTER V
Also in the Mudurnu-Göynük Basin, the dinocyst record does not show major extinctions across the K-Pg boundary interval. In contrast, in the ‘disaster’ phase, approximately correlative to foraminiferal Zone P0, hexaperidinioids show an increase in relative abundance (Figs. 4 and 5). Similar changes have also been observed at other sections in the Tethys Realm, such as in Spain and across the Tunisian continental shelf, where the earliest Danian is characterized by blooms of hexaperidinioids (Brinkhuis et al., 1998; Chapter 4 of this thesis; see Fig. 6). At El Kef, the Global Stratotype Section and Point (GSSP) of the K-Pg boundary, the post-impact dominance of hexaperidinioids is nonetheless shorter-lived and less pronounced. This difference in expression might be related to small differences in paleogeographical and paleoceanographical settings between sites. In addition, the boundary interval at El Kef is stratigraphically considerably more expanded than in the Mudurnu-Göynük Basin. Therefore, the dinocyst record at El Kef more clearly portrays the large, short-term variability in the earliest Paleocene.
Although the exact expression clearly differs per site, an increase in abundance of hexaperidinioids in the early Paleocene appears to be common feature of all shelfal sites in the Tethyan Realm. Based on statistical correlations between palynological records and other palaeo-proxies, it has been suggested that this inferred heterotrophic group flourished best under high-nutrient conditions (Brinkhuis et al,. 1998; Sluijs and Brinkhuis, 2009). Therefore, the recorded increase in hexaperidinioids across the K-Pg boundary might be interpreted as an increase in nutrient availability in the photic zone in the first millennia following the impact. Hence, the combined dinocyst records from the Tethyan Realm suggest that, at least Tethyan-ocean wide, the earliest Paleocene shelves were characterized by an increase in nutrient availability in the photic zone, whereas coeval benthic foraminiferal records indicate a major decrease, or change, in nutrient supply to the seafloor. This inverse change in nutrient availability suggests a causal link. The replacement of larger fecal pellet producing pelagic grazers by smaller grazers, such as, amongst others, heterotrophic dinocysts, will have greatly reduced the transported of biomass produced in the photic zone down to the sea floor (D’Hondt, 2005). The decrease in transport of biomass from the photic zone to the seafloor could have resulted in high rates of nutrient recycling in the upper water column (D’Hondt, 2005). As a result, more nutrients would have been available for the earliest Paleocene phytoplankton community, in the Mudurnu-Göynük Basin indicated by the higher abundance of hexaperidinioids.
5.3 LongtermrecoveryFollowing the initial ‘disaster’ phase, the hexaperidinioid cysts decreased in abundance and the
abundance of endobenthic benthic forms started to increase again, as the recovery of the benthic community was initiated. This recovery phase is approximately correlative to Zone Pα, which, according the Geologic Time Scale (GTS) of Vandenberghe et al. (2012), represents approximately 280 kyr. During this phase the diversity of the benthic foraminiferal community has not yet fully recovered and also the carbon isotope records remain well below pre-impact values (Figs. 3-5). This indicates that the rapid and short-lived K-Pg boundary disaster was followed by a relatively long recovery phase. Various previous studies have suggested that this long recovery time for the benthic community could be related to the long-term evolutionary recovery of the pelagic community (D’Hondt, 2005; Coxall et al., 2006).
Interestingly, in the Mudurnu-Göynük Basin, the transition between the recovery phase and the early Paleocene phase marks the onset of the rhythmic alternation of fine-grained limestones and limey mudstones that characterize the lower 30-50 m of the Danian in this basin (Figs. 3-5). The age models of the Okçular and Göynük North sections (Açikalin et al., 2014), suggest that

137137
K-PG BOUNDARY ENVIRONMENTAL CRISIS AND RECOVERY
020
4060
%0
2040
6080
%
Spiniferites Group
Hexa-peridinioids
020
000
cyst
s pe
r gra
m
Tota
l Din
ocys
tco
ncen
trat
ion
010
0000
cyst
/cm
²/kyr
Din
ocys
t ac
cum
ulat
ion
rate
200
150
100 50 0
-50
-100
-150
-200
D. c
ali.
C. c
f. co
rn.
S. in
or.
D. c
f. ca
li. &
M. d
rug.
Din
ocyc
t ev
ents
C. co
rn.
A. mayaroensis
P0
PαForam Zonation
66.0
466
.00
Age
(Ma)
Lithology
13C
δ
Distance from K-Pg boundary (cm)
-10
1-2
‰0
2040
%
Other dinocysts
Interval Based on benthic assemblages
of Speijer & van der Zwaan (1996)
3 2 1
Figu
re 6
.Th
e or
gani
c-wa
lled
dino
flage
llate
cys
t rec
ord
of E
l Kef
sec
tion,
Tun
isia.
The
bulk
sta
ble
carb
on is
otop
e re
cord
is fr
om K
eller
and
Lin
ding
er, 1
989;
the
bios
tratig
raph
y is
from
Brin
khui
s et a
l. (1
998)
, Spe
ijer a
nd V
an d
er Z
waan
(199
6) a
nd M
olin
a et
al.
(200
6). P
alyn
olog
ical d
ata
is fro
m B
rinkh
uis e
t al.
(199
8). F
or a
bbre
viat
ions
, see
Fig
. 3.
The
4 m
ain
dino
cyst
com
plex
es, t
otal
dino
cyst
abun
danc
es (i
n cy
sts p
er g
ram
dry
sedi
men
t) an
d es
timat
ed d
inoc
yst a
ccum
ulat
ion
rate
s (in
cys
t/cm
2 /kyr
) are
plo
tted.
Spe
ijer
and
Van
der Z
waan
(199
6) sp
lit th
e be
nthi
c as
sem
blag
e in
6 S
tratig
raph
ic A
ssem
blag
es (S
A1-
6). S
A1-
3 ro
ughl
y co
rresp
ond
to A
ssem
blag
e A
of t
he O
kçul
ar se
ctio
n; S
A5
roug
hly
corre
spon
ds to
Ass
embl
age
D o
f the
Okç
ular
sect
ion
and
SA4
roug
hly
corre
spon
ds to
Ass
embl
age
C o
f the
Okç
ular
sect
ion.
Bas
ed o
n th
ese
asse
mbl
ages
, we
can
subd
ivid
e the
ben
thic
reco
rds i
n de
velo
pmen
tal s
tage
s in
a sim
ilar w
ay to
the O
kçul
ar re
cord
.

138138
CHAPTER V
Paleocene sedimentation rates are lower than those in the Maastrichtian. Hence, the appearance of limestones in the early Paleocene is most likely the result of a decrease in input of siliciclastics, resulting in higher relative concentrations of carbonate. Similar trends have also been recorded at various other K-Pg boundary successions, amongst others at the Zumaya section in Spain (ten Kate and Sprenger, 1993). Also there, the lower 50 meters of the Danian, representing the first 3-4 million years of the Paleocene (Dinarès-Turell et al., 2003), are characterized by higher carbonate concentrations (ten Kate and Sprenger, 1993). At Zumaya, Paleocene sedimentation rates are less than half those of the Maastrichtian (ten Kate and Sprenger, 1993). These results suggests that at both localities, the first 3-4 million years of the Paleocene were characterized by a lower input of siliciclastics. This change in the sedimentological regime occurred directly following the K-Pg boundary crisis and recovery, suggesting a causal relationship. Therefore, this change in sedimentological regime might constitute a long-term consequence of the Chicxulub impact.
6. ConclusionsThe marine palynological, benthic foraminiferal and bulk stable isotope records of the Turkish
sections reveal major changes across the K-Pg boundary interval, portraying the environmental crisis at the K-Pg boundary and subsequent recovery in the earliest Paleocene. Based on the succession of benthic faunal assemblages, four intervals can be recognized in K-Pg boundary interval of the Mudurnu-Göynük Basin; the Maastrichtian or pre-impact phase, a disaster phase, a recovery phase and an early Paleocene phase. This pattern has been recorded from sections all along the former Tethyan shelves, and suggest an ocean-wide phenomenon. The Tethyan Maastrichtian K-Pg boundary sites were characterized by stable neritic to upper bathyal conditions. In the initial disaster phase, the collapse of export productivity and changes in surface to bottom transport related to the ecosystem collapse likely resulted in lower nutrient availability on the sea floor, leading to an abrupt benthic community impoverishment. As the downward transport of nutrients was slowed down, and recycling in upper layers increased, more nutrients became available for the earliest Paleocene phytoplankton community. The rapid and short-lived K-Pg boundary disaster phase was followed by a relatively long (>250 kyr) recovery phase.

139139
K-PG BOUNDARY ENVIRONMENTAL CRISIS AND RECOVERY

140

141141
END-CRETACEOUS BOLIDE IMPACT INDUCED SEA SURFACE TEMPERATURE CHANGES
CHAPTER VI
End Cretaceous bolide impact induced sea surface temperature changes along the New Jersey Shelf, eastern USA

142142
CHAPTER VI

143143
END-CRETACEOUS BOLIDE IMPACT INDUCED SEA SURFACE TEMPERATURE CHANGES
AbstractIt has become widely accepted that the Cretaceous – Paleogene (K-Pg) boundary mass extinction (~66Ma) is related to the environmental consequences of an impact of a large extraterrestrial body. This impact likely invoked exceptionally rapid and profound global climate change, which occurred superimposed on ongoing, long-term environmental changes. The interplay between impact-related and long-term environmental changes is, however, still poorly documented. In a recent study, we showed evidence for rapid short-term cooling following the K-Pg impact, confirming for the first time the hypothesis of a so-called ‘impact winter’ invoked by dust and aerosols produced by the impact. To verify the record from Brazos River and to reveal, long-term climate change, we performed a high resolution marine palynological and organic geochemical study on four stratigraphically expanded and complete cores from the New Jersey Shelf, eastern USA, spanning the K-Pg boundary, using the TEX86 sea surface temperature (SST) proxy. Indeed, our new record confirms the brief cooler episode immediately following the K-Pg impact. This impact winter occurred superimposed on a long-term cooling trend that followed a warming phase related to Deccan Traps outpouring of greenhouse gases.

144144
CHAPTER VI

145145
END-CRETACEOUS BOLIDE IMPACT INDUCED SEA SURFACE TEMPERATURE CHANGES
1. IntroductionThe Cretaceous-Paleogene (K-Pg) boundary mass extinction (~66 Ma) was one of the most
devastating events in the history of life, marking the end of the dinosaur era (Bambach, 2006). It is by now widely acknowledged to be related to the global environmental consequences of the impact of an asteroid with a diameter of ~10 km, at Chicxulub, Mexico (e.g., Schulte et al, 2010). The impact likely caused a major perturbation of the global carbon cycle and rapid and profound global climate change (e.g., Kring, 2007; Vellekoop et al., 2014), occurring superimposed on long-term ongoing environmental changes. One of the most notable of these long-term changes is for example an episode of climatic warming between approximately 400 to 20 kyr prior to the K-Pg boundary (Kucera and Malmgren, 1998; Olsson et al., 2001; Olsson et al., 2002). This episode of climatic warming coincided with a major shift in Osmium and Strontium isotope records, consistent with increased basaltic weathering (Li and Keller, 1999; Olsson et al., 2002; Dessert et al., 2001), indicating that it is likely related to volcanic outgassing, possibly reflecting a phase of extensive volcanism of the Deccan Traps Large Igneous Province in present-day India (Courtillot et al., 1986). To understand the true extent of the K-Pg boundary impact related perturbations, the effects of the impact need to be disentangled from such long-term, ongoing environmental changes. Documentation of impact-related as well as long-term environmental K-Pg changes is still scarce. In part this is the result of records lacking sufficient temporal resolution, but also e.g. because biotic environmental proxy-carriers traditionally used to reconstruct environmental change, such as planktic foraminifera and calcareous nannoplankton, experienced major extinctions and are rare to absent in the earliest Paleocene (e.g. Huber et al., 2002). In contrast, however, the organic biomarker-based Sea Surface Temperature (SST) proxy TEX86 (Schouten et al., 2013) can be used across the K-Pg boundary (Vellekoop et al., 2014), potentially providing insight in climate change across this interval. In a recent study, we, for the first time, showed that the TEX86 based SST record of Brazos River (USA) indeed shows evidence of rapid short-term cooling following the Chixculub impact, presumably reflecting the often presumed so-called ‘impact winter’ (Vellekoop et al., 2014), but this ‘cold spike’ has so far not been confirmed by other studies. To be able to verify the results from Brazos River and place them in a context of longer termed environmental changes requires the examination of additional marine K-Pg boundary records with good preservation of organic matter, which are stratigraphically complete, and sufficiently expanded enough to allow detecting relatively fast, transient changes, and chronostratigraphically long ranging enough to show long term trends. The New Jersey Shelf K-Pg sections, characterized by clayey glauconitic sands deposited in a coastal, shallow marine setting (Miller et al., 2010), do provide such potentially suitable sites. In effect, in 2008 and 2009, four new, shallow (<25m) cores were drilled across these K-Pg boundary deposits in New Jersey (Miller et al., 2010), presenting near ideal records that may be used to unravel both the long term climate changes in the latest Maastrichtian – earliest Paleocene interval, as well as the impact-related perturbations. In general, in these coastal, shallow marine sections it is difficult to acquire sufficient biostratigraphic age control, since global marker taxa of e.g., planktic foraminifera and calcareous nannoplankton are often missing or sparse in such settings (e.g. Elliot et al., 1994). However, organic-walled dinoflagellate cyst (dinocyst), abundantly present in these deposits, have been proven to be reliable chronobiostratigraphic tools, especially at such ancient shallow marine sites (Brinkhuis and Schioler, 1996; Brinkhuis et al., 1998; Vellekoop et al., 2014). Hence, here, by combining high resolution foraminiferal and dinocyst biostratigraphy with the TEX86 sea surface temperature proxy we here aim to quantitatively portray long and short term changes across the K-Pg boundary.

146146
CHAPTER VI
2. Materials and methods2.1Sampling
For this study, 4 ‘shallow’ (<25m) drillcores from the ancient New Jersey Shelf were investigated: Meirs Farm, Search Farm, Fort Monmouth 1 and Fort Monmouth 3 (see Fig. 1 for locations). These cores were retrieved in 2008 and 2009 from 3 different localities across New Jersey
(Fig. 1).In the studied deposits, the Maastrichtian is characterized by the greyish, bioturbated clayey
glauconitic sands of the New Egypt Formation, superimposed by the heavily bioturbated clayey glauconitic sands of the Danian Hornerstown Formation (Miller et al., 2010). The K-Pg boundary is marked by a 3-5 cm thick layer of white clay rip-up clasts, containing uppermost Cretaceous foraminifera and dinocysts. This distinctive layer has been interpreted as deposited by a tsunami, triggered by slope failure on the US east coast due to earthquakes generated by the Chicxulub impact (Olsson et al., 2002; Miller et al., 2010). In the Meirs Farm core the clast layer is overlain by grey, burrowed glauconitic sands, with above this a transition to green, heavily bioturbated glauconitic sands. In the Search Farm and Fort Monmouth 3 cores, the K-Pg boundary is directly overlain by the green glauconitic sands (See Fig. 2; see Supplementary Information). For precise locations and a more detailed description of these cores, lithologies, including adjacent outcrops, see Miller et al. (2010). These cores were sampled and processed for palynology, planktic foraminifera
post-Paleocene
Lower Paleocene (Hornerstown Fm)Upper Paleocene (Vincenown Fm)
Maastrichtian (Tinton, New Egypt & Navesink Fms)Upper Campanian/ Lower Maastrichtian (Mt. Laurel & Wenonah Fms)pre-Maastrichtian
Fort Monmouth
Meirs FarmSearch Farm
Bass River (ODP Leg 174AX)
0 20 km
N
Figure 1Locations of the Bass River, Meirs Farm, Search Farm and Fort Monmouth cores, with location map showing outcropping Maastrichtian and Paleocene formations.

147147
END-CRETACEOUS BOLIDE IMPACT INDUCED SEA SURFACE TEMPERATURE CHANGES
and iridium to generate an age model and for organic geochemistry to quantitatively portray long and short term SST changes across the K-Pg boundary.
2.2 Organic-walleddinoflagellatecystsIn total, 88 samples were processed for palynological analyses following standard palynological
preparation techniques of the Laboratory of Palynology and Palaeobotany (see Vellekoop et al., 2014 for a more detailed description). All slides are stored in the collection of the Laboratory of Palaeobotany and Palynology, Utrecht University. For each sample, dinocysts were counted up to a minimum of 200 specimens. The taxonomy of dinocysts follows that cited in Fensome and Williams (2004), unless stated otherwise. A species list can be found in the taxonomic section (Supplementary Information).
2.3 PlankticforaminiferaThe Fort Monmouth 1 and 3 cores were analyzed for planktic foraminifera. 26 samples were
disintegrated using Calgon solution (5.5 g of sodium metaphosphate per one liter of water) and washed with tap water through a 63-μm sieve. After being dried in an oven at 40°C, samples were sieved through 250, 150, 125, and 63 μm sieves. Representatives of individual species were picked from the various size fractions and stored in slides. Planktic foraminiferal identifications follow the taxonomy of Premoli Silva and Verga (2004) for the Cretaceous and Olsson et al. (1999) for the Paleocene.
2.4 IridiumanalysisIridium analyses have previously been performed on the K-Pg boundary interval of the Meirs
Farm and Search Farm cores, showing an Ir anomaly characteristic for the K-Pg boundary layer (Miller et al., 2010). The lithology suggests that at the Fort Monmouth 3 core the K-Pg boundary layer has been eroded away (see Supplementary Information). To confirm this, we analyzed 16 additional samples from the K-Pg boundary interval of the Fort Monmouth 3 core for Ir. Concentrations of Ir were measured with high sensitivity Sector Field Inductively Coupled Plasma Mass Spectrometry at the Department of Marine and Coastal Sciences, Rutgers University with detection limits of 0.01 ppb. For the ICP-MS measurements preconcentration of Ir from sediments were done by NiS fire-assay technique modified after Ravizza and Pyle (1997). In this method 1-1.5 g of sample is ground to a powder and homogenized, then mixed with NiS (2:1 ratio of Ni:S), borax (2:1 ratio of borax to sediment mass) and 191Ir enriched isotope spike prepared in 6.2N HCl. This mixture is then heated to 1000°C for 75 minutes to allow fusion. After fusion process, beads obtained are dissolved on 190- 200°C hot plates, filtered and filters are digested.
2.5 OrganicgeochemicalanalysisIn total, 72 aliquot samples were investigated for the determination of TEX86 and BIT
indices following standard procedures. Briefly, we extracted glycerol dialkyl glycerol tetraethers (GDGTs) using organic solvents and quantified the various GDGTs using high performance liquid chromatography/atmospheric pressure positive ion chemical ionization mass spectrometry (HPLC/APCI-MS). Since we apply the TEX86 paleothermometer on samples from a mid-latitude site from a Cretaceous-Paleogene greenhouse world, unambiguously characterized by high Sea Surface Temperatures (SSTs) (>15⁰C), we applied the calibration from Kim et al. (2010) to calculate mean annual sea surface temperature. The branched and isoprenoid tetraether (BIT) index, indicative for the relative input of soil-derived organic matter, was calculated to following Hopmans et al. (2004).

148148
CHAPTER VI
Samples with BIT index values of >0.4 were discarded, since this may indicate elevated input of isoprenoid GDGTs from soil organic matter, obscuring TEX86 paleothermometry (Weijers et al., 2006). Five of the analyzed samples were run in duplicate, the reproducibility is better than 0.5 °C, and in most cases better than 0.25 °C. The residual standard error for the calibration model is 2.5 °C (Kim et al., 2010).
3. Results and discussion3.1 Agemodelandcorrelation
The age model of the studied cores is based on the presence of impact derived iridium (Miller et al., 2010 and this study) and planktic foraminifera and dinocyst biostratigraphies (this study; see Fig. 2 and Supplementary Information). In addition, the appearance a distinct level with abundant echinoid fecal pellets was used as a distinctive marker for the lowermost Danian in New Jersey (Miller et al., 2010)
Dinocyst biostratigraphy allows an excellent age control for both the Maastrichtian and Danian parts of the cores. Of the four studied cores, the Meirs Farm core ranges furthest down into the Maastrichtian. This core comprises the First Occurences (FOs) of the dinocyst marker taxa Palynodinium grallator and Disphaerogena carposphaeropsis, which have their First Appearance Datum (FAD) at ~ 67 Ma (De Gracianski et al 1998; Williams et al., 2004). In the earliest Danian interval, the characteristic early Danian marker taxa Senoniasphaera inornata, Damassadinium californicum and Carpatella cornuta are successively encountered (Fig. 2), with respective FADs at 66.00, 65.75 and 65.7 Ma (Brinkhuis et al., 1998; Williams et al., 2004).
Carbonate preservation is poor for the Maastrichtian interval of our cores. The Meirs Farm 1 and Search Farm 1 cores were barren in terms of planktic foraminifera, but the Fort Monmouth 1 and 3 cores comprised sufficient foraminifera to allow us to also construct planktic foraminiferal biostratigraphy (see Supplementary Information). Plankic foraminiferal analysis indicates the presence of zones P0/Pα, P1a, P1b and P1c (Olsson et al., 1999). Therefore, our combined records indicate that the resulting composite section ranges in age from approximately 1.1 million years before the K-Pg boundary up to approximately 2.5 million years after the boundary, using the absolute ages derived from Gradstein et al. (2012).
3.2 LatestMaastrichtianclimatechange The composite of the four cores allows highly detailed TEX86 SST records to be constructed
for this interval. The combined TEX86 records show consistent changes in SST across the studied interval (Fig. 3). The lowermost section, approximately representing the interval 67.1-66.9 Ma, is characterized by stable SSTs of 25.5-26.0 °C. This interval is followed by a cooling to ~24-25 °C at ~66.8 Ma and a subsequent steady warming until approximately 400-500 kyr before the K-Pg boundary. There, our TEX86 record show a strong warming of ~3° to about 29.0 °C. This warm phase lasts until 100-50 kyr before the K-Pg boundary. From there onwards the record shows a gradual cooling, straddling the K-Pg boundary. These results are consistent between all studied cores and are highly comparable to the previously reported δ18O temperature records from the nearby Bass River core (Olsson et al., 2001, Olsson et al., 2002; see Supplementary Information). Based on a coinciding global shift in Osmium and Strontium isotope records, previous studies on the New Jersey shelf have related this warming phase to a significant outpouring phase of the Deccan Traps Large Igneous Province (Vonhof and Smit, 1997; Dessert et al., 2001; Olsson et al., 2002), starting near the base of Subchron C29R (Courtillot et al., 1986; Hansen et al., 1996; Ravizza and Peucker-Ehrenbrink, 2003). This episode of Deccan Traps eruptions led to global

149149
END-CRETACEOUS BOLIDE IMPACT INDUCED SEA SURFACE TEMPERATURE CHANGES
greenhouse warming, which is well-documented for example by poleward migration of warm-water planktic foraminifera and subtropical vegetation (Olsson et al., 2001; Wilf et al., 2003).
8 10
11
12
13
14
15
16
17
18
19
20
21 9
Depth (m)
Formation Hornerstown New Egypt
Stage Danian Maastrichtian
Dinocyst events
LithologySamples 0.
00.
20.
40
1020
30fecal pellets
Iridium
ng/g
#/g
BARR
EN
1
35
6
8
9
Mei
rs F
arm
SamplesLithologyFormation HornerstownVincentown
Depth (m)
Foram zonation P1c (P1b?) P1a Pα?
9
10
11
12
13
14
15
16
17
Dinocyst events BARREN1
10
Fort
Mon
mou
th 1
Formation Hornerstown New Egypt
Samples
7
8
9
6 Depth (m)
Lithology
0.0
0.2
0.4
ng/gIridium
01
0#/
gfecal pellets
Dinocyst events
1
2
3
4
7
58
10
11
BARR
ENBA
RREN
Sear
ch F
arm
15
16
17
18
19
Formation Hornerstwn. New Egypt
Samples
Depth (m)
Lithology
Foram zonation P0/Pα A. mayar. Zone equiv.
Dinocyst events 1
2
3
4
8
10
0.0
0.2
fecal pellets
010
#/g
Iridium
ng/g
Fort
Mon
mou
th 3
Paleogene Cretaceous
Lege
nd
Gre
y sa
ndy,
gla
ucon
itic
clay
Whi
tish
clay
cla
sts
Gre
en c
laye
y gl
auco
nite
san
dG
rey
clay
ey g
lauc
onite
san
dG
rey-
brow
n gl
auco
nitic
silt
y cl
ayLi
thol
ogie
s
1 3 52 6 8 94 10 117Din
ocys
t mar
ker t
axa
Paly
nodi
nium
gra
llato
rD
isph
aero
gena
carp
osph
aero
psis
Dis
phae
roge
na ca
rpos
phae
rops
is v
ar. “
corn
uta”
Thal
assi
phor
a pe
lagi
caM
anum
iella
seel
andi
caSe
noni
asph
aera
cf.
inor
nata
Seno
nias
phae
ra in
orna
taM
embr
anila
rnac
ia? t
enel
la
Dam
assa
dini
um c
f. ca
lifor
nicu
mD
amas
sadi
nium
calif
orni
cum
Carp
atel
la co
rnut
a
2
Figure 2Stratigraphic correlation between the Meirs Farm, Search Farm, Fort Monmouth 3 and Fort Monmouth 1 cores. The ranges stratigraphic marker taxa of organic-walled dinoflagellate cyst are indicated for each core. Iridium and fecal pellet concentrations of the Meirs Farm and Search Farm cores are from Miller et al., 2010. In all cores, the basal part of the Hornerstown Formation is characterized by an interval of green, intensely burrowed glauconitic sand (shaded green in this figure). Preservation of organic material is relatively poor in this interval. The basis of this green glauconitic sand member appears erosive (red line).

150150
CHAPTER VI
22 24 26 28 30
TEX86 (BIT<0.3)
H
SST (ºC)
Lith
olog
y
?
New Jersey Composite core
Brazos River
SST (ºC)
Form
atio
nH
orne
rsto
wn
Vinc
ento
wn
New
Egy
pt
0.0 0.2 0.4
Iridi
um
ng/g
63.9 Ma
Fora
m z
onat
ion
P1c
(P1b
?)P1
aP0
/Pα
?
A. m
ayar
oens
is Z
one
equi
vale
ntSt
age
Dan
ian
Maa
stric
htia
n
Din
ocys
t eve
nts
67 Ma
66.04 Ma
1
2
3
4
5
6
7
89
10
11
Meirs Farm
Fort Monmouth 3Search Farm
Fort Monmouth 1
Fora
m z
onat
ion
PαP0
(Cre
tace
ous)
P1b
Nan
nofo
ssil
zona
tion
Kinc
aid
Cors
ican
aFo
rmat
ion
Mirc
ula
prin
sii
NP1
Din
ocys
t eve
nts
14
5
7
8
9
10
11
TEX86 (BIT<0.3)
H
-4
-3
-2
-1
0
1
2
3
4
24 26 28 30 32
Dep
th (m
)Li
thol
ogy
1
3
5
2
6
8
9
4
10
11
7
Dinocyst marker taxaPalynodinium grallator
Disphaerogena carposphaeropsis
Disphaerogena carposphaeropsis var. “cornuta”
Thalassiphora pelagica
Manumiella seelandica
Senoniasphaera cf. inornata
Senoniasphaera inornata
Membranilarnacia? tenella
Damassadinium cf. californicum
Damassadinium californicum
Carpatella cornuta
3
Figure 3A composite of the Meirs Farm, Search Farm, Fort Monmouth 1 and Fort Monmouth 3 cores, with the TEX86 Sea Surface Temperature (SST) records of the these cores, correlated to the TEX86 SST record of Brazos River (Vellekoop et al., 2014). The iridium record is from the Meirs Farm core (Miller et al., 2010). The New Jersey composite and the Brazos River record are on a scale of 1:2. The correlation is based on planktic foraminiferal zonation and ranges of dinocyst marker taxa. For further information on the construction of the New Jersey composite, and on the correlation to the Brazos River record, see Supplementary Information.

151151
END-CRETACEOUS BOLIDE IMPACT INDUCED SEA SURFACE TEMPERATURE CHANGES
3.3 K-PgImpactwinterandearlyPaleoceneclimatesImmediately above the K-Pg boundary, the composite record shows a short-lived (<5 kyr),
distinct cooling event of some ~2.5°, superimposed on the general cooling trend. This short cooling phase likely reflects the brief ‘impact winter’ phase, confirming the earlier reported record from Brazos River, USA (Vellekoop et al., 2014). Like at Brazos River, the impact winter phase at the New Jersey Shelf is recorded directly below the iridium anomaly (see Figure 4), indicating that the cool phase ended when the impact-derived dust settled. In contrast with the record of Brazos River, which shows relative warm temperatures directly following the impact winter, our TEX86 record shows that at the New Jersey shelf slightly cooler conditions persisted after the impact winter, with average temperatures of ca. 25 °C. The relative stable, cooler temperatures recorded in this interval might be resulting from the intense bioturbation in this interval, smoothing out potential high frequency changes. This could cause the signal of a short warming phase to be overprinted by that of the long-term cooling. Alternatively, the ancient New Jersey shelf might be influenced the
Figure 4A detailed depiction of the K-Pg boundary interval of the composite of the Meirs Farm, Search Farm and Fort Monmouth 3 cores, with the TEX86 Sea Surface Temperature (SST) records of the these cores. For the numbers of the dinocyst species, see Fig. 2. The iridium record is from the Meirs Farm core (Miller et al., 2010).
22 24 26 28 30
TEX86 (BIT<0.3)
H
SST (ºC)
Lith
olo
gy
Form
atio
nN
ew
Eg
ypt
0.0 0.2 0.4
Irid
ium
ng/g
Plan
ktic
Fo
ram
zo
nat
ion
P0
/Pα
Stag
eD
an
ian
Ma
ast
rich
tia
n
Din
ocy
st e
ven
ts
1
2
3
4
5
6
7
8
9
10
11
A. m
aya
roen
sis
Zo
ne
eq
uiv
ale
nt
Ho
rne
rsto
wn
1 m

152152
CHAPTER VI
upwelling of cold water formed during an impact winter, similar to Tunisian K-Pg boundary sites (Chapter 4 of this thesis).
The preservation of organic matter is poorer in the bioturbated green glauconitic sand of basal part of the Hornerstown formation, resulting in less reliable TEX86 results. The interval above this, correlative to planktic foraminiferal zones P1a-P1c, shows stable SSTs at approximately 26.5 °C. The relatively stable Danian temperatures documented here are in agreement with reconstructed long-term global trends for this time interval (e.g. Westerhold et al., 2011).
4. Summary and conclusionsHere, we are able to record both long-term environmental changes across the Cretaceous-
Paleogene boundary interval as well as short-term changes related to the K-Pg boundary impact. Our TEX86 SST record portrays the latest Cretaceous warming event, related to massive volcanism of the Deccan Traps, subsequent cooling across the K-Pg boundary and a short, transient ‘impact winter’ phase, thereby confirming the ‘impact winter’ earlier reported at Brazos River. This impact winter was characterized by rapid, short-term cooling, caused by sulphate aerosols and dust and soot particles ejected into the atmosphere by the impact. The K-Pg boundary perturbations are followed by relative stable temperatures in the Paleocene. These results indicate that the latest Cretaceous warming event and the K-Pg boundary impact are two separate events with distinctly different signatures in the geological record.

153153
END-CRETACEOUS BOLIDE IMPACT INDUCED SEA SURFACE TEMPERATURE CHANGES
5. Supplementary Information5.1 Geologicalsetting
The geology of the New Jersey coastal plain is characterized by Cretaceous, Paleogene and Neogene sediments deposited on the shelf of the western North Atlantic passive margin (Miller et al., 1998). The New Jersey shelf comprises a near-continues succession of mostly shallow marine deposits, ranging from the mid-Cretaceous up to the Miocene, with formations of different ages outcropping throughout the coastal plain (Miller et al., 1998). This succession has attained considerable attention, for example in terms of macrofossil studies (e.g. Landman et al., 2004), long-term sea level reconstructions (e.g. Miller et al., 2005) and climate reconstructions (e.g. Sluijs et al., 2007; Van Helmond et al., 2013), involving studies on both outcrops and core material, both offshore (e.g. ODP Leg 150, ODP Leg 174A) as well as onshore (e.g. ODP Leg 150X, ODP Leg 174AX).
5.2 DrillingtheK-PgboundaryIn addition to these ODP legs, in fall 2008 Rutgers University commissioned the drilling of 14
additional, shallow (<25m) holes at 7 sites, to investigate the nature of the Cretaceous-Paleogene boundary in New Jersey (Miller et al., 2010). Drilling was done by United States Geological Survey (USGS) drillers, using a truck mounted Multi-twin G-30 Drill (“Sonic Metaprobe”). Of these cores, 4 were used for the present study; the Meirs Farm 1 (40°06’15.48” N, 74°31’37.48” W), Search Farm 1 (40°05’29.20” N, 74°32’16.10” W), Fort Monmouth 1 (40°18’35.09” N, 74°02’34.17” W) and Fort Monmouth 3 (40°18’37.18’ N, 74°02’46.25” W) cores.
5.3 LithologyoftheK-PgboundaryintervalAt the New Jersey coastal plain, Maastrichtian and Paleocene deposits encompass 6
formations: the Navesink, New Egypt, Red Bank, Tinton, Hornerstown and Vincentown formations. The lower Maastrichtian Navesink Formation consists of burrow-mottled, glauconitic, clayey sand to sandy clays and the upper Maastrichtian Red bank and Tinton formations consist of micaecous, silty, fine grained, feldspathic quartz sand and glauconitic quartz sand, respectively, interpreted to be deposited in an inner shelf environment (Olsson, 1987; Landman et al., 2004). The upper Maastrichtian New Egypt Formation, consisting of dark gray, glauconitic, clayey sand to sandy clay, is the down-dip equivalent of the Red Bank and Tinton formations, representing a deeper-water facies of these units (Olsson, 1987; Landman et al., 2004). In all 4 cores selected for the current study, the uppermost Maastrichtian is represented by this deeper-water facies. Both the Tinton Formation and New Egypt Formation are unconformably overlain by the lower Paloecene Hornerstown Formation, consisting of green, burrow-mottled, glauconitic clayey sand to micaceous, quartzose, glauconite sand (Olsson, 1987; Landman et al., 2004). The abundant glauconite results in a dark greenish color, giving the formation its informal name of “Greensand Marl” (Landman et al., 2004). At most localities on the New Jersey coastal plain the contact between the Tinton/New Egypt formations and Hornerstown Formation marks the K-Pg boundary. In New Jersey records that are stratigraphically more complete, the K-Pg boundary is marked by a 3-5 cm thick layer of white clay rip-up clasts, containing uppermost Cretaceous foraminifera and dinocysts (Olsson et al., 2002; Miller et al., 2010), with, even further downdip, such as at Bass River (Ocean Drilling Program Leg 174AX), also a spherule bed (Olsson et al., 1997). The distinctive white clay clast layer has been interpreted as deposited by a tsunami, triggered by slope failure on the US east coast due to earthquakes generated by the Chicxulub impact (Olsson et al., 2002; Miller et al., 2010). In the

154154
CHAPTER VI
Meirs Farm core, the clay clast layer is overlain by ~60 of greyish, bioturbated clayey glauconitic sand, similar to that of the underlying New Egypt Formation, with above this the unconformable contact with the green, heavily bioturbated glauconitic sands of the Hornerstown Formation. Therefore, in this core the K-Pg boundary is still within the New Egypt formation, and is placed ~60 below the contact between the New Egypt and Hornerstown formations. In the Search Farm and Fort Monmouth 3 cores, the K-Pg boundary is directly overlain by the green glauconitic sands of the Hornerstown Formation. Hence, at these cores, the top of the New Egypt formation has been eroded away, up to the K-Pg boundary. In the Search Farm core, the remnants of the white clay clast layer are still visible at the highly burrowed, unconformable contact between the New Egypt and Hornerstown formations, whereas at the Fort Monmouth 3 core, no white clay clasts were observed, suggesting that there, the boundary layer was completely eroded away before the deposition of the Hornerstown Formation. The basal part of the Fort Monmouth 1 core consists of the Hornerstown Formation, so in that core, the K-Pg boundary was not reached.
Across the New Jersey coastal plain, the Hornerstown varies in thickness, form 1.5 m up to >10m. In the Fort Monmouth 1 core we note 2-3 possible sequence boundaries in the Hornerstown Formation, at ~15.8 meters below land surface (mbls), ~13.5 mbls and possibly at ~11.1 mbls.
The contact between the Hornerstown Formation and the overlying upper Paleocene Vincentown Formation is gradational. The Vincentown Formation consists of slightly glauconitic silty clays.
5.4 PreservationThe four studied cores were sampled in high resolution (see Tables 1-4) and analyzed for
organic-walled dinoflagellate cysts, planktic foraminifera and TEX86 paleothermometry (See SI Tables 1-4). Samples from the New Egypt Formation are generally characterized by excellent preservation of organic material (dinocysts and GDGTs). The basal part of the Hornerstown Formation, consisting of green, intensely burrowed glauconitic sands, is, on the other hand, characterized by poor preservation of organic material, obscuring application of the organic biomarker-based TEX86 paleothermometry and palynological analyses in this interval.
The Meirs Farm and Search Farm cores are characterized by poor carbonate preservation, not permitting planktic foram biostratigraphy. The Fort Monmouth 1 and 3 cores comprised sufficient foraminifera to allow planktic foraminiferal biostratigraphy.
5.5 TaxonomyThe taxonomy of dinocysts follows that cited in Fensome and Williams (2004). A few
divergent opinions, however, are listed below.
Damassadinium cf. californicum (Drugg 1967) Fensome et al. 1993Remarks: This species of Damassadinium occurs in Planktic Foraminiferal Zones P0 and Pα,
and shows resemblances to D. californicum, but distinguished from it by having a less broad process base. In this study, this morphotype is regarded as a predecessor for Damassadinium californicum s.s.
Disphaerogena carposphaeropsis var. cornuta nov. var.Remarks: This variety of Disphaerogena carposphaeropsis occurs in in the uppermost
Maastrichtian and lower Danian, with its first occurrence roughly at the base of the M. prinssii Zone. This variety closely resembles D. carposphaeropsis s.s., but is distinguished from it by having formed large antapical horn. According to the emended diagnosis of Sarjeant, 1985, Disphaerogena

155155
END-CRETACEOUS BOLIDE IMPACT INDUCED SEA SURFACE TEMPERATURE CHANGES
carposphaeropsis s.s is characterized by an apical horn that is always longer than the antapical horn, by a ratio varying between 1.2:1 to 3:1. In the uppermost Maastrichtian samples, specimen occur with an antapical horn that is as long or longer than the apical horn. Since this form first appears in the uppermost Maastrichtian (i.e. Vellekoop et al., 2014), it is used as a stratigraphic marker in the present study. Since this form clearly belongs to the species D. carposphaeropsis, but is characterized by an antapical horn similar to the taxon Carpatella cornuta, we used the informal name ‘Disphaerogena carposphaeropsis variety “cornuta” in study, after its characteristic horns.
Senoniasphaera cf. inornata (Drugg 1970) Stover and Evitt 1978Remarks: This species of Senoniasphaera occurs at the base of Planktic Foraminiferal Zones
P0, and shows resemblance to S. inornata. It is distinguished from it by having a smaller size and thinner outer wall. In this study this morphotype is regarded as a predecessor for Senoniasphaera inornata s.s.
Planktic foraminifera identifications follow the taxonomy of Premoli Silva and Verga (2004) for the Cretaceous and Olsson et al. (1999) for the Paleocene.
5.6 Agemodel5.6.1 Fecal pellets and iridium
The age model of the studied cores is based on the presence of impact derived iridium (Miller et al., 2010 and this study) and planktic foraminiferal and dinocyst biostratigraphy (this study; see SI Figure 1). In addition, the appearance a distinct level with abundant echinoid fecal pellets can be used as a distinctive marker for the lowermost Danian in New Jersey (Miller et al., 2010). The abundant presence of epifaunal echinoid fecal pellets in this interval is likely related to the dramatic decrease in export production following the K-Pg boundary extinction event, which resulted in increased benthic bulldozing (Miller et al., 2010).
Our iridium analysis of the Fort Monmouth 3 core shows that no iridium anomaly is present, confirming that there, the K-Pg boundary layer has been eroded away before the deposition of the Hornerstown Formation.
5.6.2 Dinocyst biostratigraphyDinocyst biostratigraphy allows a strong age control for both the Maastrichtian and Danian.
See SI Tables 5-8 for an overview of ranges of dinocyst marker taxa. Of the four studied cores, the Meirs Farm core ranges furthest down into the Maastrichtian. This core comprises the First Occurences (FOs) of the dinocyst marker taxa Palynodinium grallator and Disphaerogena carposphaeropsis, which have their First Appearance Datum (FAD) at approximately 67 Ma (De Gracianski et al 1998; Williams et al., 2004). In the upper Maastrichtian of the Meirs Farm, Search Farm and Fort Monmouth 3 cores, the FO’s of Manumiella seelandica and Thalassiphora pelagica are observed. In addition, these records show an acme of the marker taxa P. grallator. This acme is very characteristic for the topmost Maastrichtian (T. pelagica Subzone as described by Hanssen (1977) and Schiøler and Wilson (1993) for the North Sea basin) of the boreal realm. It is also recognized in for example the North Sea wells (Schiøler and Wilson, 1993) and Southern Sweden (Hultberg and Malmgren, 1987).
The Danian interval of the studied cores shows a succession of dinocyst marker taxa. The Meirs Farm core includes the FOs of the lowermost Danian markers Senoniasphaera inornata and Membranilarnacia? tenella and the FO of the marker taxon Damassadinium cf. californicum.

156156
CHAPTER VI
0,00
0,10
0,20
0,30
2224
2628
30
SST
(ºC)
Foram zonation P0/Pα A. mayar. Zone equiv.
15
16
17
18
19
Formation Hornerst. New EgyptDepth (m)
Lithology
Dinocyst events 1
2
3
4
8
10
0.0
0.2
010
#/gIridium &
fecal pellets
ng/g
Fort
Mon
mou
th 3
0.00
0.10
0.20
0.30
0.40
1517
1921
2325
2729
SST
(ºC)
TEX86 & BIT-index
BARR
EN
2325
2729
0.25
0.05
0.15
BIT
0.05
0.15
BIT
2224
2628
30SS
T (º
C)
8
10
11
12
13
14
15
16
17
18
19
20
21 9 Depth (m)
Formation Hornerstown New Egypt
Stage Danian Maastrichtian
Dinocyst events
Lithology 0.0
0.2
0.4
010
2030
Iridium & fecal pellets
ng/g
#/g
BARR
EN
1
35
2
6
8
9
Mei
rs F
arm
TEX86 & BIT-index
SST
(ºC)
BIT
inde
x
Feca
l pel
lets
(#/g
)Iri
dium
(ng/
g)
1 3 52 6 8 94 10 117Din
ocys
t mar
ker t
axa
Paly
nodi
nium
gra
llato
rD
isph
aero
gena
carp
osph
aero
psis
Dis
phae
roge
na ca
rpos
phae
rops
is v
ar. “
corn
uta”
Thal
assi
phor
a pe
lagi
caM
anum
iella
seel
andi
caSe
noni
asph
aera
cf.
inor
nata
Seno
nias
phae
ra in
orna
taM
embr
anila
rnac
ia? t
enel
la
Dam
assa
dini
um c
f. ca
lifor
nicu
mD
amas
sadi
nium
calif
orni
cum
Carp
atel
la co
rnut
a
Formation Hornersown. New Egypt
7 8 9 6
Depth (m)
Lithology 0.0
0.2
0.4
ng/gIridium &
fecal pellets
01
0#/
g
Dinocyst events
1
2
3
4
7
58
10
11
BARR
EN
Sear
ch F
arm
TEX86 & BIT-index
LithologyFormation HornerstownVincentown
Depth (m)
Foram zonation P1c (P1b?) P1a Pα?
9
10
11
12
13
14
15
16
17
Dinocyst events BARREN1
10Fo
rt M
onm
outh
1
TEX86 & BIT-index
SST
(ºC)
SI Figure 1Stratigraphic correlation between the Meirs Farm, Search Farm, Fort Monmouth 3 and Fort Monmouth 1 cores. The ranges stratigraphic marker taxa of organic-walled dinoflagellate cyst are indicated per core. Iridium and fecal pellet concentrations of the Meirs Farm and Search Farm cores are from Miller et al., 2010. In all cores, the basal part of the Hornerstown Formation is characterized by an interval of green, intensely burrowed glauconitic sand (shaded green in this figureThe basis of this green glauconitic sand member appears erosive (red line). TEX86 and BIT-index records are presented per core.

157157
END-CRETACEOUS BOLIDE IMPACT INDUCED SEA SURFACE TEMPERATURE CHANGES
In the Meirs Farm, Search Farm and Fort Monmouth cores, the basal part of the Hornerstown Formation comprises the FOs characteristic early Danian marker taxa Damassadinium californicum and Carpatella cornuta (SI Fig. 1). These results show that at the Meirs Farm core the K-Pg boundary interval is most complete, whereas the boundary interval at the Search Farm and Fort Monmouth 3 cores is characterized by a small hiatus.
The basal part of the Fort Monmouth 1 core was barren for dinocysts, but the upper part of the Hornerstown Formation comprises a typical Paleocene assemblage, characterized by taxa such as Palaeoperidinium pyrophorum, Hystrichosphaeridium tubiferum and Areoligera senonensis. This interval furthermore comprises the Last Occurrences (LO) of the marker taxa Palynodinium grallator and Damassadinium californicum, which have their Last Appearance Datums (LAD) at 65.1 Ma and 61 Ma, respectively (Heilmann-Clausen, 1985; Brinkhuis et al., 1998).
5.6.3 Planktic foraminiferal biostratigraphyThe Meirs Farm 1 and Search Farm 1 cores were barren in terms of planktic foraminifera, but
the Fort Monmouth 1 and 3 cores were productive, allowing us to construct planktic foraminiferal biostratigraphy. See SI Tables 9 and 10 for an overview of ranges of planktic foraminiferal marker taxa. The Maastrichtian interval is dominated by typical shallow marine Cretaceous planktic taxa like Heterohelix globulosa, H. navarroensis, Guembelitria cretacea, Globigerinelloides messinae, and G. praiehillensis. There are no keeled species present in the samples and uncoiled forms are more abundant than coiled forms. Since keeled taxa were not encountered, the keeled uppermost Maastrichtian marker taxon Abathomphalus mayaroensis is also absent. This planktic species likely developed its adult morphology in the deeper part of the water column and is therefore probably not present at these sites characterized by very shallow paleodepths (Miller et al., 1998). The presence of other planktic foraminifera and dinocyst taxa characteristic for the uppermost Maastrichtian, such as G. messinae, D. carposphaeropsis and P. grallator nevertheless indicate that the studied part of the New Egypt Formation is equivalent to the A. mayaroensis Zone, allowing us to tentatively assign this interval, using an approach similar to Miller et al. (1998).
In the Fort Monmouth 3 core, foraminifera are very scarce above the K-Pg boundary, with only rare specimens of Heterohelix present. At 15.1 mbls, the assemblage is dominated by G. cretacea. This survivor species of the K-Pg mass extinction commonly forms an acme in the earliest Danian (Brinkhuis and Zachariasse, 1988). In this sample the Cretaceous taxa H. globulosa, H. navarroensis, and Globigerinelloides spp. are also present. The high abundance of G. cretacea, the survivor species of the K-Pg mass extinction commonly forming an acme zone in the early Danian, suggests that these Cretaceous forms represent reworked specimen. These analyses suggest that at the Fort Monmouth 3 core, the basal part of the Hornerstown Formation is correlative to planktic foraminiferal zones P0 or Pα (Olsson, 1999)
At the Fort Monmouth 1 core, the oldest productive sample (17.4 mbls) contains the early Danian planktic foraminifera Globoconusa daubjergensis and Woodringina claytonensis, indicating that the K-Pg boundary is located below this level. In the intensely bioturbated lowermost Danian, the survivor species Guembelitria cretacea concurs with these newly evolved Danian species. Since the FOs of both G daubjergensis and W. claytonensis characterize the base of planktic foraminiferal Zone Pα (Olsson, 1999), we assign the basal part of the Fort Monmouth core to this zone. Carbonate preservation is poor between ~15.5 mbls and ~14.0 mbls, making it difficult to assign this interval to a Planktic Foraminiferal Zone. With the presence of typical marker taxa such as Parasubbotina pseudobulloides, Eoglobigerina eobulloides, Globanomalina planocompressa and E. edita, the overlying interval, between 13.7 – 13.5 mbls, is assigned to Zone P1a. We tentatively place the P1a/P1b zonal

158158
CHAPTER VI
boundary at the sequence boundary observed at approximately 13.5 mbls. Above this, the marker taxon Subbotina triloculinoides appears. The interval between 12.2 and 10.7 mbls is defined as Zone P1c and is characterized by Globanomalina compressa, Praemurica inconstans, and Parasubbotina varianta.
In conclusion, our plankic foraminiferal analysis indicates the presence of planktic foram zones P0/Pα, P1a, P1b and P1c. Therefore, our records ranges from approximately 1.1 million years before the K-Pg boundary up to approximately 5 million years after the boundary (Gradstein et al., 2012). With these four cores combined, our palynological and TEX86 SST records cover this interval.
5.7 CorrelationofthecoresOur detailed litho- and biostratigraphy allows a correlation between the four studied cores (see
SI Fig. 1). The Meirs Farm core clearly ranges furthest down into the Maastrichtian, comprising the FOs of P. grallator and D. carposphaeropsis. These taxa are already present at the base of the Search Farm and Fort Monmouth 3 cores. The top part of the New Egypt Formation is equiavalent to the A. mayaroensis Zone and is characterized by the FOs of D. carposphaeropsis var. “cornuta”, T. pelagica and M. seelandica and by the acme of P. grallator. These bio-events can be used to correlate the uppermost Maastrichtian interval between the cores. Based on this correlation it is evident that the topmost Maastrichtian is slightly more condensed at the Search Farm and Fort Monmouth 3 cores.
The distinctive white clay clast layer marking the K-Pg boundary is best preserved in the Meirs Farm core. There it is 3-5 cm thick and approximately 60 cm below the top of the New Egypt Formation. This top part of the New Egypt Fm comprises the subsequent FOs of the characteristic lowermost Danian dinocyst marker taxa S. cf. inornata, M.? tenella, S. inornata, D. cf. californicum, suggesting that this interval is equivalent to Planktic Foraminiferal Zone P0 and the basal part of Zone Pα (Vellekoop et al., 2014).
The lithology, biostratigraphy and iridium analyses indicate that this top part of the New Egypt Fm has been eroded away at the Search Farm and Fort Monmouth 3 cores. There, the K-Pg boundary is marked by the base of the Hornerstown Fm, which comprises the FO’s of the Danian dinocyst marker taxa D. californicum and C. cornuta and the Danian planktic foraminiferal marker taxa G daubjergensis and W. claytonensis, indicating that this base is equivalent to Planktic Foraminiferal Zone Pα. At the highly burrowed, unconformable contact between the New Egypt and Hornerstown Fms of the Search Farm core, the remnants of the white clay clast layer are visible and a small iridium anomaly was encountered. At the Fort Monmouth 3 core, no iridium anomaly or white clay clasts were encountered at the contact between the New Egypt and Hornerstown Fms. This indicates that at Fort Monmouth the K-Pg boundary has been eroded away completely. Based on the position of the acme of P. grallator, the top ~50 cm of the Maastrichtian have probably also been eroded away at this core.
Although the contact between the New Egypt and Hornerstown formations was not encountered at the Fort Monmouth 1 core, the base of this core is probably relatively close to the K-Pg boundary. The encountered sequence boundaries at ~13.5 mbls, likely marking the P1a-P1b zonal boundary, and possibly at ~11.1 mbls, marking the top of the Zone P1c, can be correlated to the Bass River core (Ocean Drilling Program Leg 174AX; Miller et al., 1998 (See SI Figure 2). The sequence boundary at ~13.5 mbls marks the top the basal, dark green part of the Hornerstown Fm. This top was not encountered at the other 3 cores, so an exact correlation is not possible. The proximity between the Fort Monmouth 1 and 3 cores nevertheless allows a tentative correlation between these cores. The Fort Monmouth 3 core can in turn be correlated to the Search Farm and

159159
END-CRETACEOUS BOLIDE IMPACT INDUCED SEA SURFACE TEMPERATURE CHANGES
SI Figure 2A composite of the Meirs Farm, Search Farm, Fort Monmouth 1 and Fort Monmouth 3 cores, with the TEX86 Sea Surface Temperature (SST) records of the these cores, correlated to ODP Leg 174AX (Bass River; Miller et al., 1998). The iridium record is from the Meirs Farm core (Miller et al., 2010). The New Jersey composite and Bass River core are to scale. The correlation is based on lithology, planktic foramineferal zonation and ranges of dinocyst marker taxa. The 87Sr/86Sr, δ18ORugoglobigerina and δ18OA. midwayensis records of Bass River are from Olsson et al. (2002).
384
385
386
387
388
389
390
-4,0-3,0-2,0-1,0
δ18O
0,70788 0,70792
87Sr/86Sr
381
382
383
1 m
380 Pl
ankt
ic F
oram
zon
atio
nN
anno
foss
il zo
natio
n
Vinc
ento
wn
Hor
ners
tow
nFo
rmat
ion
New
Egy
ptN
aves
ink
P3b
P1c
P1aP0/Pα
G. g
anss
eri
M. p
rinsi
iM
. mur
usA.
may
aroe
nsis
Zon
e eq
uiv.
P4a
Dep
th (m
)
22 24 26 28 30
TEX86 (BIT<0.3)
H
SST (ºC)
Lith
olog
y
New Jersey Composite core
Bass River
Form
atio
nH
orne
rsto
wn
Vinc
ento
wn
New
Egy
pt
0,0 0,2 0,4
Iridi
um
ng/g
63.9 Ma
Plan
ktic
For
am z
onat
ion
P1c
(P1b
?)P1
aP0
/Pα
?
A. m
ayar
oens
is Z
one
equi
vale
ntSt
age
Dan
ian
Maa
stric
htia
n
Din
ocys
t eve
nts
67 Ma
66.04 Ma
1
2
3
4
5
6
7
8
9
10
11
5
10
Meirs Farm
Fort Monmouth 3Search Farm
Fort Monmouth 1
87Sr/86Srδ18ORugoglobigerina
δ18OA. midwayensis
8
Din
ocys
t eve
nts 1
3
5
2
6
8
9
4
10
11
7
Dinocyst marker taxaP. grallatorD. carposphaeropsisD. carposphaeropsis var. “cornuta”T. pelagicaM. seelandicaS. cf. inornata
S. inornataM.? tenella
D. cf. californicumD. californicumC. cornuta

160160
CHAPTER VI
Meirs Farm cores. With these correlation possibilities, a composite can be constructed using the four studied cores (SI Fig. 1).
5.8 TEX86paleothermometryIn the samples analyzed for this study, concentrations of isoprenoidal GDGTs range from
40-150 ng/g dry-weight sediment. The overall chromatography of the GDGTs was excellent, with proper signal to noise ratios. To test the reproducibility of these signals, 5 of the samples were extracted and analyzed in duplicate, the reproducibility is better than 0.5 °C, and in most cases better than 0.25 °C.
The calibration used in this study has a standard error of ±2.5 °C (Kim et al., 2010), which should be considered as a systematic error. The reconstructed absolute temperatures should, therefore, be interpreted with care, but here we are more concerned with trends i.e. changes in SST rather than absolute temperatures. While TEX86 is calibrated to SST (Schouten et al., 2002), various studies suggested TEX86 might sometimes reflect deeper water temperatures (e.g. Huguet et al., 2007; Lopes dos Santos et al., 2010). However, the studied sedimentary succession was deposited at a shallow, shelf depositional environment (Miller et al., 2010), excluding the possibility that the recorded trends would significantly differ from trends in SST.
High concentrations of Soil Organic Matter (SOM) in sediments can cause a substantial bias in TEX86-reconstructed sea surface temperatures (Weijers et al., 2006). The relative amount of SOM in sediments can be approximated based on the analysis of tetraether lipids, using the so-called Branched and Isoprenoid Tetraether (BIT) index (Hopmans et al., 2004). To identify whether our TEX86 record is biased by the input of SOM, we have calculated the BIT index for all our samples. To exclude all TEX86-reconstructed sea surface temperatures possibly biased by high concentrations of terrestrial-derived GDGTs, we discarded samples with a BIT-index exceeding the recommended (Weijers et al., 2006) threshold of 0.3 (7 out of 72 analyzed samples; see SI Figure 3).

161161
END-CRETACEOUS BOLIDE IMPACT INDUCED SEA SURFACE TEMPERATURE CHANGES
SI Figure 3TEX86 derived sea surface temperatures of all analyzed samples plotted against BIT-index values. This plot indicates that there is correlation between SST and BIT, signifying our TEX86 record is not significantly biased by soil organic matter in our samples. Nevertheless, all samples with a BIT-index exceeding the recommended threshold of 0.3 are discarded, following Weijers et al. (2006).
10
15
20
25
30
0.00 0.20 0.40 0.60 0.80 1.00
SST
(TEX
h)
BIT index
TEX86 vs BIT-index

162162
CHAPTER VI
SI Tables Chapter 6SI Table 1
MEIRS FARM
Depth interval (ft) Depth midpoint (ft) Depth midpoint (cm)
Paly
nolo
gy
TEX8
6
Comments
24.0 – 24.1 24.05 733.0 X Poor organic matter preservation
27.3 – 27.4 27.35 833.6 X Poor organic matter preservation
29.4 – 29.5 29.45 897.6 X Poor organic matter preservation
32.4 – 32.5 32.45 989.1 X Poor organic matter preservation
34.9 – 35.0 34.95 1065.3 X Poor organic matter preservation
37.4 – 37.5 37.45 1141.5 X X Poor organic matter preservation
39.9 – 40.0 39.95 1217.7 X X
40.5 – 40.6 40.55 1236.0 X X
40.9 – 41.0 40.95 1248.2 X X
41.1 – 41.2 41.15 1254.3 X X
41.45 – 41.5 41.475 1264.2 X X
41.7 – 41.8 41.75 1272.5 X X
42.0 – 42.05 42.025 1280.9 X X
42.05 – 42.10 42.075 1282.4 X X
42.12 – 42.18 42.15 1284.7 X X
42.2 – 42.25 42.225 1287.0 X X
42.3 – 42.35 42.325 1290.1 X X
42.25 – 42.31 42.28 1288.7 X To little material for palynology
42.4 – 42.5 42.45 1293.9 X X
42.5 – 42.6 42.55 1296.9 X X
42.95 – 43.0 42.975 1309.9 X X
43.3 – 43.4 43.35 1321.3 X X
44.1 – 44.2 44.15 1345.7 X X
44.9 – 45.0 44.95 1370.1 X X
46.18 – 46.22 46.2 1408.2 X X
47.4 – 47.5 47.45 1446.3 X X
49.9 – 49.95 49.975 1523.2 X X
52.4 – 52.5 52.45 1598.7 X X
55.05 – 55.1 55.075 1678.7 X X
57.4 – 57.5 57.45 1751.1 X X
59.9 – 59.95 59.925 1826.5 X X
62.5 – 62.6 62.55 1906.5 X X
64.95 – 65.0 64.975 1980.4 X X
67.4 – 67.5 67.45 2055.9 X X
69.55 – 69.6 69.575 2120.6 X X

163163
END-CRETACEOUS BOLIDE IMPACT INDUCED SEA SURFACE TEMPERATURE CHANGES
71.7 – 71.8 71.75 2186.9 X X
SI Table 2SEARCH FARM
Depth interval (ft) Depth midpoint (ft) Depth midpoint (cm)
Paly
nolo
gy
TEX8
6
Comments
20.3 – 20.4 20.35 620.3 X X Poor organic matter preservation
21.3 – 21.4 21.35 650.7 X X Poor organic matter preservation
23.3 – 23.4 23.35 711.7 X X
24.0 – 24.1 24.05 733.0 X X
24.2 – 24.25 24.225 738.4 X X
24.3 – 24.35 24.325 741.4 X X
24.55 – 24.6 24.575 749.0 X To little material to analyze for OG
24.85 – 24.8 24.875 758.2 X
25.0 – 25.1 25.05 763.5 X X
25.5 – 25.6 25.55 778.8 X X
26.6 – 26.7 26.65 812.3 X X
28.2 – 28.3 28.25 861.1 X X
29.0 – 29.1 29.05 885.4 X X
SI Table 3FORT MONMOUTH 1
Depth interval (ft) Depth midpoint (ft) Depth midpoint (cm)
Paly
nolo
gy
TEX8
6
Fora
ms
Comments
3.5 – 3.6 3,55 108,2 X Poor organic matter preservation
6.3 – 6.4 6,35 193,5 X X Poor organic matter preservation
8.5 – 8.6 8,55 260,6 X Poor organic matter preservation
11.5 – 11.6 11,55 352,0 X
13.5 – 13.6 13,55 413,0 X
16.0 – 16.1 16,05 489,2 X
19.0 – 19.1 19,05 580,6 X X
21.0 – 21.1 21,05 641,6 X
24.0 – 24.1 24,05 733,0 X
26.0 – 26.1 26,05 794,0 X X
28.5 – 28.6 28,55 870,2 X X
31.0 – 31.1 31,05 946,4 X X

164164
CHAPTER VI
32.0 – 32.1 32,05 976,9 X
34.0 – 34.1 34,05 1037,8 X X
35cc 1066,8 X Core catcher
36.0 – 36.1 36.05 1098,8 X
36.5 – 36.6 36,55 1114,0 X X
38.7 – 38.8 38,75 1181,1 X X
39.5 – 39.6 39.55 1205,5 X
40cc 1219,2 X Core catcher
40.3 – 40.4 40,35 1229,9 X X
41.9 – 42.0 41,95 1278,6 X X
42.6 – 42.7 42.65 1399.0 X
43cc 1310,6 X Core catcher
44.5 – 44.6 44,55 1357,9 X X
44.6 – 44.7 44.65 1360,9 X
45cc 1371,6 X Core catcher
46.8 – 46.9 46,85 1428,0 X X
47.2 – 47.3 47.25 1440,2 X
49.0 – 49.1 49,05 1495,0 X X
50cc 1524.0 X Core catcher
51.3 – 51.4 51,35 1565,1 X X
52.3 – 52.4 52.35 1595,6 X
53.6 – 53.7 53,65 1635,3 X X Poor organic matter preservation
55cc 1676,4 X Core catcher
56.2 – 56.3 56,25 1714,5 X X Poor organic matter preservation
57cc 1737,4 X Core catcher

165165
END-CRETACEOUS BOLIDE IMPACT INDUCED SEA SURFACE TEMPERATURE CHANGES
SI Table 4FORT MONMOUTH 3
Depth (ft) Depth midpoint (ft) Depth midpoint (cm)
Paly
nolo
gy
TEX8
6
Fora
ms
Iridi
um
Comments
49.5 – 49.6 49.55 1510.3 X X Poor organic matter preservation
49.6 – 49.7 49.65 1513.3 X
50.6 – 50.7 50,65 1543,8 X
50.9 – 51.0 50,95 1553,0 X
51.00 -51.05 51.025 1555.2 X
51.0 – 51.1 51.05 1556.0 X X X
51.2 – 51.3 51,25 1562,1 X
51.35 – 51.40 51.375 1565.9 X
51.45 – 51.55 51,5 1569,7 X
51.60 – 51.65 51.625 1573.5 X
51.6 – 51.7 51,65 1574,3 X
51.7 – 51.8 51,75 1577,3 X
51.75 – 51.80 51.775 1578.1 X
51.85 – 51.95 51,9 1581,9 X
52.0 – 52.1 52.05 1586.5 X X X
52.15 – 52.25 52,2 1591,1 X
52.25 – 52.35 52,3 1594,1 X
52.3 – 52.4 52.35 1595.6 X
52.4 – 52.5 52,45 1598,7 X
52.55 – 52.60 52.575 1602.5 X
52.55 – 52.65 52,6 1603,2 X
52.60 – 52.65 52.625 1604.0 X
52.6 – 52.7 52.65 1604.8 X X
52.80 – 52.85 52.825 1610.1 X
52.8 – 52.9 52,85 1610,9 X
52.85 – 52.9 52.875 1611.6 X
52.95 – 53.00 52.975 1614.7 X
52.95 – 53.05 53.0 1615,4 X
53.2 – 53.3 53.25 1623.0 X
53.4 – 53.5 53.45 1629.2 X X
53.6 – 53.7 53.65 1635.3 X X
53.8 – 53.9 53.85 1641.3 X X
54.4 – 54.5 54.55 1662.7 X X
55.1 – 55.2 55.15 1681.0 X X
56.3 – 56.4 56.35 1717.5 X X
57.00 – 57.10 57.05 1738.9 X X

166166
CHAPTER VI
57.4 – 57.5 57.45 1751.1 X
58.5 58.6 58.55 1784.6 X X
59.5 – 59.6 59.55 1815.1 X X
61.00 – 61.10 61.05 1860.8 X X
62.00 – 62.10 62.05 1891.3 X X

167167
END-CRETACEOUS BOLIDE IMPACT INDUCED SEA SURFACE TEMPERATURE CHANGES
SI Table 5MEIRS FARM
P. g
ralla
tor
D. c
arpo
spha
erop
sis
D. c
arpo
. “co
rnut
a”
M. s
eela
ndic
a
M.?
tene
lla
S. c
f. in
orna
ta
S. in
orna
ta
D. c
f. ca
lifor
nicu
m
Depth (ft) Depth midpoint (ft)
Depth midpoint (cm)
24.0 – 24.1 24.05 733.0
27.3 – 27.4 27.35 833.6
29.4 – 29.5 29.45 897.6
32.4 – 32.5 32.45 989.1
34.9 – 35.0 34.95 1065.3
37.4 – 37.5 37.45 1141.5
39.9 – 40.0 39.95 1217.7 X X X
40.5 – 40.6 40.55 1236.0 X X X X
40.9 – 41.0 40.95 1248.2 X X
41.1 – 41.2 41.15 1254.3 X X
41.45 – 41.5 41.475 1264.2 X X X X
41.7 – 41.8 41.75 1272.5 X X
42.0 – 42.05 42.025 1280.9 X X X X
42.05 – 42.10 42.075 1282.4 X X X
42.12 – 42.18 42.15 1284.7 X X X X
42.2 – 42.25 42.225 1287.0 X X X
42.3 – 42.35 42.325 1290.1 X
42.4 – 42.5 42.45 1293.9 X X X
42.5 – 42.6 42.55 1296.9 XX X X X
42.95 – 43.0 42.975 1309.9 XX X X
43.3 – 43.4 43.35 1321.3 XX X X
44.1 – 44.2 44.15 1345.7 XX X X X
44.9 – 45.0 44.95 1370.1 XX X X X
46.18 – 46.22 46.2 1408.2 XX X X
47.4 – 47.5 47.45 1446.3 XX X X
49.9 – 49.95 49.975 1523.2 X X
52.4 – 52.5 52.45 1598.7 X
55.05 – 55.1 55.075 1678.7 X X
57.4 – 57.5 57.45 1751.1 X
59.9 – 59.95 59.925 1826.5 X
62.5 – 62.6 62.55 1906.5 X
64.95 – 65.0 64.975 1980.4 X
67.4 – 67.5 67.45 2055.9 X
69.55 – 69.6 69.575 2120.6 X
71.7 – 71.8 71.75 2186.9

168168
CHAPTER VI
SI Table 6SEARCH FARM
P. g
ralla
tor
D. c
arpo
spha
erop
sis
T. p
elag
ica
D. c
arpo
. “co
rnut
a”
M. s
eela
ndic
a
M.?
tene
lla
S. in
orna
ta
D. c
alifo
rnic
um
C. co
rnut
a
Depth interval (ft)
Depth midpoint (ft)
Depth midpoint (cm)
20.3 – 20.4 20.35 620.3
21.3 – 21.4 21.35 650.7
23.3 – 23.4 23.35 711.7 X X X X X
24.0 – 24.1 24.05 733.0 X X X X X
24.2 – 24.25 24.225 738.4 X X X
24.3 – 24.35 24.325 741.4 X X X
24.55 – 24.6 24.575 749.0 XX X X X
24.85 – 24.8 24.875 758.2 XX X X
25.0 – 25.1 25.05 763.5 XX X X X X
25.5 – 25.6 25.55 778.8 XX X X
26.6 – 26.7 26.65 812.3 XX X X
28.2 – 28.3 28.25 861.1 X
29.0 – 29.1 29.05 885.4 X X

169169
END-CRETACEOUS BOLIDE IMPACT INDUCED SEA SURFACE TEMPERATURE CHANGES
SI Table 7FORT MONMOUTH 1
P. g
ralla
tor
T. p
elag
ica
D. c
alifo
rnic
um
P. p
yrop
horu
m
Depth interval (ft)
Depth midpoint (ft)
Depth midpoint (cm)
3.5 – 3.6 3,55 108,2
6.3 – 6.4 6,35 193,5
8.5 – 8.6 8,55 260,6
11.5 – 11.6 11,55 352,0
13.5 – 13.6 13,55 413,0
16.0 – 16.1 16,05 489,2
19.0 – 19.1 19,05 580,6
21.0 – 21.1 21,05 641,6
24.0 – 24.1 24,05 733,0
26.0 – 26.1 26,05 794,0 X
28.5 – 28.6 28,55 870,2 X
31.0 – 31.1 31,05 946,4 X
34.0 – 34.1 34,05 1037,8
36.5 – 36.6 36,55 1114,0 X X
38.7 – 38.8 38,75 1181,1 X X
40.3 – 40.4 40,35 1229,9 X
41.9 – 42.0 41,95 1278,6 X
44.5 – 44.6 44,55 1357,9 X X X
46.8 – 46.9 46,85 1428,0 X X X X
49.0 – 49.1 49,05 1495,0
51.3 – 51.4 51,35 1565,1
53.6 – 53.7 53,65 1635,3
56.2 – 56.3 56,25 1714,5

170170
CHAPTER VI
SI Table 8FORT MONMOUTH 3
P. g
ralla
tor
D. c
arpo
spha
erop
sis
D. c
arpo
. “co
rnut
a”
T. p
elag
ica
S. in
orna
ta
D. c
alifo
rnic
um
Depth interval (ft)
Depth midpoint (ft)
Depth midpoint (cm)
49.5 – 49.6 49.55 1510.3
51.0 – 51.1 51.05 1556.0 X X X X X
52.0 – 52.1 52.05 1586.5 X X X X
52.6 – 52.7 52.65 1604.8 XX X X X X
52.85 – 52.9 52.875 1611.6 XX X X X
53.4 – 53.5 53.45 1629.2 XX X X
53.8 – 53.9 53.85 1641.3 XX X X
54.4 – 54.5 54.55 1662.7 X X X X
55.1 – 55.2 55.15 1681.0 X X
56.3 – 56.4 56.35 1717.5 X X X
57.00 – 57.10 57.05 1738.9 X X X
58.5 58.6 58.55 1784.6 X
59.5 – 59.6 59.55 1815.1 X
61.00 – 61.10 61.05 1860.8 X
62.00 – 62.10 62.05 1891.3 X X

171171
END-CRETACEOUS BOLIDE IMPACT INDUCED SEA SURFACE TEMPERATURE CHANGES
SI Table 9FORT MONMOUTH 1
Eogl
obig
erin
a ed
ita
Eogl
obig
erin
a eo
bullo
ides
Glo
boco
nusa
dau
bjer
gens
is
Glo
bano
mal
ina
com
pres
sa
Glo
bano
mal
ina
Gue
mbe
litria
cre
tace
a
Para
subb
otin
a
Para
subb
otin
a va
riant
a
Prae
mur
ica
inco
nsta
ns
Prae
mur
ica
Subb
otin
a tr
ilocu
linoi
des
Subb
otin
a tr
ivia
lis
Woo
drin
gina
cla
yton
ensi
s
Prae
para
rota
lia c
reta
cea
Depth interval (ft)
Depth midpoint (ft)
Depth midpoint (cm)
35cc 1066,8 X X X X X X
36.0 – 36.1 36.05 1098,8 X X X X X X X
39.5 – 39.6 39.55 1205,5 X X X X X X X X X
40cc 1219,2 X X X X X X
42.6 – 42.7 42.65 1399.0 X X X X
43cc 1310,6 X X X X
44.6 – 44.7 44.65 1360,9 X X
45cc 1371,6 X X X X X
47.2 – 47.3 47.25 1440,2
50cc 1524.0 X X
52.3 – 52.4 52.35 1595,6 X X
55cc 1676,4 X
57cc 1737,4 X X X

172172
CHAPTER VI
SI Table 10FORT MONMOUTH 3
G. p
raie
hille
nsis
G. m
essi
nae
G. c
reta
cea
H. n
avar
roen
sis
H. g
lobu
losa
H.h
olm
dele
nsis
Het
eroh
elix
sp.
H. p
lana
ta (?
)
Glo
bige
rinel
loid
es sp
.
COM
MEN
TS
Depth interval (ft)
Depth midpoint (ft)
Depth midpoint (cm)
49.6 – 49.7 49.65 1513.3 XX X X X X G. cretacea is abundant
51.00 -51.05 51.025 1555.2 No forams
51.35 – 51.40 51.375 1565.9 X Forams rare
51.60 – 51.65 51.625 1573.5 No forams
51.75 – 51.80 51.775 1578.1 No forams
52.3 – 52.4 52.35 1595.6 X X X
52.55 – 52.60 52.575 1602.5 No forams
52.60 – 52.65 52.625 1604.0 No forams
52.80 – 52.85 52.825 1610.1 No forams
52.95 – 53.00 52.975 1614.7 No forams
53.2 – 53.3 53.25 1623.0 X X X
53.6 – 53.7 53.65 1635.3 X Forams rare
57.4 – 57.5 57.45 1751.1 X X X X X

173173
END-CRETACEOUS BOLIDE IMPACT INDUCED SEA SURFACE TEMPERATURE CHANGES

174

175175
RECONSTRUCTING SEA LEVEL CHANGE ACROSS THE K-PG BOUNDARY
CHAPTER VII
Reconstructing sea level change across the Cretaceous-Paleogene boundary interval

176176
CHAPTER VII

177177
RECONSTRUCTING SEA LEVEL CHANGE ACROSS THE K-PG BOUNDARY
AbstractThe Cretaceous-Paleogene (K-Pg) boundary impact invoked exceptionally rapid and profound global climate change, which occurred superimposed on ongoing, long-term environmental changes. Several studies have shown that besides long-term global temperature changes, the late Maastrichtian to early Paleocene was also marked by long-term changes in relative sea level. Although many K-Pg boundary records worldwide show evidence for relative sea level changes across this interval, it is still unclear if these recorded sea level changes are globally synchronous, and, if so, what could have caused them. It is therefore crucial to accurately date, portray, correlate and compare sea level changes in suitable, stratigraphically complete Maastrichtian and Danian shallow marine successions on different continents and in different ocean basins, worldwide. Here we compare sedimentological, palynological and organic geochemical records from some of the most well-known marginal marine K-Pg boundary sections worldwide: Elles (Tunisia), Stevns Klint (Denmark), New Jersey (USA), Brazos River (USA), Mid-Waipara River (New Zealand) and Bajada del Jaguël (Argentina). The records suggest that indeed, a quasi-synchronous global maximum flooding occurred in the latest Maastrichtian, followed by a relatively strong regression across the K-Pg boundary, reaching a lowstand in the early Danian. This episode is followed by a marked marine transgression globally. These long-term globally synchronous relative sea level changes are in the order of tens of meters, occurring on a timescale of hundreds of thousands of years and are unrelated to the K-Pg impact. The mechanism(s) underlying these global sea level variations remain(s) enigmatic, but the fluctuations are matched by benthic δ18O and TEX86 records, suggesting a link between temperature and sea level. Possibly, such long-term sea level changes might be related to the presence of small Antarctic ice sheets and/or to Deccan Traps outpouring of greenhouse gasses.

178178
CHAPTER VII

179179
RECONSTRUCTING SEA LEVEL CHANGE ACROSS THE K-PG BOUNDARY
1. IntroductionIt is by now widely accepted that the Cretaceous – Paleogene (K-Pg) boundary mass
extinction (~66Ma) is related to the global environmental consequences of an impact of a large extraterrestrial body (Schulte et al., 2010). This impact invoked exceptionally rapid and profound global climate change, which occurred superimposed on ongoing, long-term environmental changes (Kring, 2007; Galeotti et al., 2004; Vellekoop et al., 2014; Chapter 3-6 of this thesis). In recent studies, we have documented the long- and short-term history of K-Pg sea surface temperature changes, unequivocally showing that indeed, there was an abrupt, impact-invoked cooling in the very earliest Paleocene (Vellekoop et al., 2014; Chapter 3 and 6 of this thesis). This short-lived cooler episode occurred superimposed on a latest Maastrichtian cooling trend (Chapter 6, this thesis). High resolution reconstructions of the short- and long-term environmental changes across the K-Pg boundary interval are largely based on land-based ancient shallow marine sections, as these are generally characterized by higher sedimentation rates and therefore allow a high temporal resolution (e.g. Brinkhuis et al., 1998; Vellekoop et al., 2014). The expression and stratigraphic completeness of these marginal marine K-Pg successions is typically highly variable (Macleod and Keller, 1991; Adatte et al., 2002a), complicating accurate dating and complete portrayal of the climatic and biotic changes across the K-Pg boundary. Some studies have shown that at least regionally, the late Maastrichtian to early Paleocene was also marked by relatively long-term changes in relative sea level, on timescales in the order of hundreds of thousands of years (Macleod and Keller, 1991; Adatte et al., 2002a; Habib et al., 1992; Miller et al., 2005; Schulte et al., 2006; Kominz et al., 2008). While such changes have been documented on a regional scale, it unclear how these, if at all, were acting on a global scale. Furthermore, it is also, as yet, unclear whether the impact-invoked short-term environmental changes affected regional or global sea level as well. In part, this uncertainty is due to the lack of sufficient temporal resolution in age dating and correlation. In addition, only a few of the many K-Pg sections globally are suitable for an accurate detection of sea level change, since most sites are either positioned too far inshore, and marked by one of more hiatii, or too far offshore, i.e. to ‘oceanic’, in nature to detect an unequivocal signature of sea level change.
In order to determine if the inferred sea level changes are globally synchronous, and to provide clues regarding underlying mechanisms, it is crucial to accurately date, portray, correlate and compare sea level changes in Maastrichtian and Danian shallow marine successions on different continents and in different ocean basins worldwide. Here we compile sedimentological, palynological and organic geochemical records from some of the most well-known marginal marine K-Pg boundary sections worldwide: Elles (Tunisia), Stevns Klint (Denmark), New Jersey (USA), Brazos River (USA), Mid-Waipara River (New Zealand) and Bajada del Jaguël (Argentina) (Fig. 1), to elucidate long-term, global sea level histories, and determine their synchronicity.
2. Sea level indicatorsAt relatively shallow marine settings a rise or fall in relative sea level usually results in a
change in coastal proximity. Across shelves, physical and chemical parameters, such as wave and current energy, salinity, oxygen availability, and nutrient loading typically change in relation to coastal proximity. Therefore, in marginal marine settings, sea level variations usually result in strong changes in these parameters. As a result, such variations can generally be recognized in the lithology/sedimentology, with marked surfaces related to changes in sedimentological, biological

180180
CHAPTER VII
and geochemical regimes, and can be employed as indicators for shifts towards more inshore or offshore conditions (sequence stratigraphy).
Several biological groups are commonly used to reconstruct changes in coastal proximity, such as planktic and benthic foraminifera, and organic-walled dinoflagellate cysts (dinocysts). Where planktic and benthic foraminifera show a major faunal turnover across the K-Pg boundary interval (Speijer and van der Zwaan, 1996; Culver, 2003), related to the extinctions and to changes in export productivity (D’Hondt, 2005), dinocysts do not (e.g., Brinkhuis and Zachariasse, 1988). This makes this group most qualified to reconstruct changes in relative sea level across this interval, notably in marginal marine settings, were organic-walled cyst producing dinoflagellates are most abundant (Sluijs et al., 2005; Sluijs et al., 2008b). Several dinocyst studies have indeed revealed apparent sea level variations in the Maastrichtian and Danian (e.g. Brinkhuis and Zachariasse, 1988; Moskovitch and Habib, 1993), with successive changes in typical coastal groups of dinocyst taxa.
Palynological assemblages from a coastal setting comprise both terrestrial and marine components. In such settings, the amount of terrestrially-derived material usually broadly co-varies with coastal proximity. Hence, variations in coastal proximity can also be assessed employing the absolute and relative abundance of terrestrial material, such as terrestrially derived palynomorphs (pollen en spores) (Sluijs et al., 2008b), but also the contribution of terrestrially derived organic biomarkers (Ménot-Combes et al. 2006), e.g. expressed as the BIT index (Hopmans et al., 2004). This index is based on the relative contribution of organic membrane lipids derived from bacteria that are mostly living non-marine environments such as soils, lakes and rivers (Hopmans et al., 2004; Sinninghe Damsté et al., 2009; De Jonge et al., 2014).
Figure 1Location of the studied sites within a paleogeographic reconstruction of the Earth around the K-Pg boundary; modified after Scotese and Dreher (2012). Brown indicates plateaus and mountainous areas, green indicates lowlands, light blue indicates shallow waters and dark blue deeper, oceanic waters. Numbers refer to the following sites: site 1: Elles El Kef, Tunisia, Northern Africa; site 2: Stevns Klint, Denmark, Northern Europe; site 3: Meirs Farm, New Jersey, USA, North America; site 4: Brazos River, Texas, USA, North America; site 5: mid-Waipara River, New Zealand, Southwestern Pacific; site 6: Bajada del Jaguël, Argentina, South America.

181181
RECONSTRUCTING SEA LEVEL CHANGE ACROSS THE K-PG BOUNDARY
In addition, where available, other proxy records indicative for coastal proximity are also used, notably grain size. Larger grain sizes are considered indicative for higher wave and/or current energy. Since, in coastal settings, coastal proximity is generally positively correlated with wave and current energy, changes in grainsize can potentially be used indications for relative sea level changes.
3. Sites and samples3.1 ElKefandElles,Tunisia
The El Kef section in Tunisia, the Global Stratotype Section and Point (GSSP) of the K-Pg boundary, provides one of the most complete and stratigraphically expanded palynological K-Pg boundary records known (Brinkhuis and Zachariasse, 1988; Brinkhuis et al., 1998). However, given the interpreted outer neritic setting of El Kef (Adatte et al., 2002a) relatively small changes in coastal proximity might be relatively difficult to record. The nearby Elles section, also NW Tunisia, is very similar to the K-Pg boundary GSSP at El Kef (Chapter 4 of this thesis), but is interpreted to be deposited in a slightly more proximal setting, at middle neritic depths (Adatte et al., 2002a) and is therefore even better suited to also record relative small changes in coastal proximity.
The K-Pg boundary occurs within the El Haria Formation. This formation mainly consists of marly and clayey sediments, that are interrupted at the K-Pg boundary by a dark, ~50 cm thick carbonate depleted interval, the so-called boundary clay layer. This boundary clay layer grades upwards into marly shales. The Elles section has a detailed planktic foraminifera, calcareous nannofossil and dinocyst biostratigraphy allowing a precise zonation of the boundary interval (Gardin, 2002; Karoui-Yaakoub et al., 2002; Chapter 4 of this thesis). The studied interval (from ~ 5 m below to ~4m above the boundary) comprises the uppermost part of the uppermost Maastrichtian A. mayaroensis (foraminiferal) Zone. With estimated Maastrichtian sedimentation rates of 3-4 cm/kyr (Adatte et al., 2002a; Stüben et al., 2003), it represents the last ~170-125 kyr of the Maastrichtian. The Danian part of the section comprise foraminiferal zones P0 to Pα).
For the present study, we use the extensive dataset of Chapter 4 of this thesis, comprising ~60 palynological data points.
3.2 StevnsKlint,DenmarkThe Stevns Klint section, a 14.5 km long coastal cliff south of Copenhagen, Denmark, is a
classical K-Pg boundary locality (Surlyk et al., 2006). It shows one of the clearest lithological responses to the sea level changes across the K-Pg boundary interval (Surlyk, 1997). The paleo water depth is estimated to have been in the region of 50 – 150 m (Hart et al., 2004). For this study, we focus on the classical Højerup locality. The Maastrichtian is represented by the chalks of the Tor Formation. The Tor Fm is subdivided in the gently wavy, almost horizontally bedded, benthos-poor chalk of the Sigerslev Mb and the small, assymetrical bryozoan mounds of the Højerup Mb. The contact between these members is marked by an incipient nodular hardground above a prominent flint layer, 2-5 m below the K-Pg boundary. At Stevns Klint, the K-Pg boundary marks the boundary between the Tor Fm and the overlying Rødvig Formation, which represents foraminiferal Zones P0 and Pα. At Stevns Klint, the 10 cm Fiskeler K-Pg boundary clay is overlain by the heavily burrowed, micritic Cerithium Limestone Member. The Cerithium Limestone Mb is truncated by a prominent erosion surface at the base of the overlying bryozoan mounds of the Stevns Klint Formation (Surlyk et al., 2006). The base of the Stevns Klint Fm is correlative to foraminifer Zone P1b.
The Stevns Klint locality is one most well-studied K-Pg boundary sections in the world and many palynological studies have been performed on this section (Hansen, 1977; Hultberg, 1986;

182182
CHAPTER VII
Damassa, 1988, Brinkhuis et al., 1998). For the present study we analyzed the same sample set as Brinkhuis et al. (1998), comprising 15 samples from the interval between 50 cm below the K-Pg boundary to 25 cm above it (Cerithium limestone). This sample set was further expanded with 7 additional samples, reaching up to ~7.2 m below the K-Pg boundary.
3.3 NewJersey,USAAt the New Jersey coastal plain, the K-Pg boundary succession is represented by the shallow
marine, clayey, glauconitic sands of the New Egypt and Hornerstown formations (Miller et al., 1998; Chapter 6 of this thesis). In 2008 Rutgers University commissioned the drilling of a series of shallow (<25m) holes to investigate the nature of the Cretaceous-Paleogene boundary in New Jersey (Miller et al., 2010). In Chapter 6 of this thesis a composite of 4 of these cores is presented. In New Jersey, the upper Maastrichtian New Egypt Formation, consisting of dark gray, glauconitic, clayey sand to sandy clay, is unconformably overlain by the lower Paleocene Hornerstown Formation, consisting of green, burrow-mottled, glauconitic clayey sand to micaceous, quartzose, glauconite sand (Olsson, 1987; Landman et al., 2004). In New Jersey records that are stratigraphically most complete, the K-Pg boundary is marked by a 3-5 cm thick layer of white clay rip-up clasts, approximately 60 cm below the unconformable contact with the green, heavily bioturbated glauconitic sands of the Hornerstown Formation. The Hornertown Fm is correlative to the interval from top part of foraminiferal Zone Pα up to the top of foraminiferal Zone P1a (Chapter 6 of this thesis). In slightly more proximal cores the white clay clast layer is absent and the contact between the New Egypt and the Hornerstown formations marks the K-Pg boundary (Chapter 6 of this thesis). Hence, there the top of the New Egypt Formation has been eroded away.
For the present study, we analyzed the sample set of the Meirs Farm core (Chapter 6 of this thesis). This sample set consists of 29 palynological samples and 30 BIT index values.
3.4 BrazosRiver,USAThe Brazos River section, between Waco and Hearne, Texas (USA) comprises an exceptionally
well-preserved K-Pg boundary succession (Vellekoop et al., 2014). This section has attracted considerable attention over the past decades and it has been studied for sedimentology, (macro) paleontology, nannofossils, planktic and benthic foraminifera, dinocysts and organic and inorganic geochemistry ( Jiang and Gartner, 1986; Hansen et al., 1993; Smit et al., 1996; Vellekoop et al., 2014), resulting in a robust and detailed age control. In the Late Cretaceous and early Paleogene, the Brazos area was characterized by nearly continuous and predominantly siliciclastic sedimentation on the shallow shelf of the northern Gulf of Mexico at estimated depths of 75 to 200 m (Bourgeois et al., 1988, Smit et al., 1996). The sedimentary successions in this region comprise the Maastrichtian fossiliferous shales of the Corsicana (Kemp Clay) Formation and the Paleocene basal and upper Littig members of the Kincaid Formation. The basal Littig Mb, consisting of a sequence of sandstone layers yielding multiple types of clasts and shell debris has been interpreted as impact-triggered tsunami deposits (Bourgeois et al., 1988; Smit et al., 1996), overlain by post-impact storm deposits (Vellekoop et al., 2014). Above this inferred tsunami-storm deposit are the silty clays of the Kincaid Fm. This basal part of the Danian is correlative to foraminiferal zones P0 and Pα. This unit is, in turn, unconformably overlain by a conglomerate of the Kincaid Formation, the upper Littig Member. This member is composed of a 0.3-0.6 meter thick glauconitic sandy clay with grains, granules and pebbles, followed by a marly claystone bed, which forms the top of the section. The base of the upper Littig Mb is correlative to foraminiferal Zone P1b, so at Brazos, the interval correlative to foraminiferal Zone P1a is represented by a hiatus (Vellekoop et al., 2014).

183183
RECONSTRUCTING SEA LEVEL CHANGE ACROSS THE K-PG BOUNDARY
The study of Vellekoop et al. (2014) provides a BIT-index record of the Brazos River section. For the present study we studied the palynological sample set of Vellekoop et al. (2014), comprising 88 samples. In addition to the palynological and organic geochemical record, at the Brazos River section the grainsize record of Vellekoop et al. (2014) also provides information concerning potential sea level changes. In Vellekoop et al. (2014), the siliciclastic grain size (on the Krumbein phi (φ) scale) were determined on a Fritsch A-22 laser particle sizer.
3.5 Mid-Waipara,NewZealandThe mid-Waipara River section is the stratigraphically most complete known neritic
K-Pg boundary record in the South Pacific. The section is well-studied and has a good chronobiostratigraphic age control, based on planktic foraminifera, radiolarians and dinocysts (Hollis and Strong, 2003; Willumsen, 2012). The K-Pg boundary interval is represented by the glauconitic sandstones of the Conway Formation and the glaucontic siltstones of the Loburn Mudstone. The Maastrichtian mud-rich, calcareous glauconitic sandstones are overlain by Danian largely non-calcareous, glauconitic sandstones of the uppermost Conway Fm. The K-Pg boundary is represented by an irregular, 1 cm thick, iron-stained interval. The boundary interval is characterized by intense bioturbation. At about 4 m above the boundary, the Conway Fm is conformably overlain by the Loburn Mudstone.
The mid-Waipara River section has been studied in high resolution for palynology (Willumsen, 2003; Willumsen, 2012), providing an extensive dataset for the present study. For the our study we focus on the interval from ~1m below the boundary up to ~8 m above the boundary, comprising 26 palynological datapoints.
3.6 BajadadelJaguël,ArgentinaThe Bajada del Jaguël section is located in the Neuquén Basin (Argentina). In the late
Cretaceous-early Paleocene, this basin encompassed a shallow epicontinental sea that was connected to the Atlantic Ocean to the east (Barrio, 1990). The Maastrichtian-Danian succession is represented by the homogenous, heavily burrowed silty claystones of the Jaguël Formation (Scasso et al., 2005). The lower 10-15 meters of the section consists of clays, whereas in the upper 5-10m below the K-Pg boundary the sediments gradually become more silty. The K-Pg boundary is marked by a 15-25 cm think, coarse-grained sandstone bed containing rip-up clasts, plagioclase grains, broken shells and shark teeth. This sandstone bed has been interpreted as a tsunami deposit related to the Chicxulub impact (Scasso et al., 2005). At approximately 2 m above the K-Pg boundary sandstone is a possible erosional surface.
The shallow and restricted setting of the Bajada del Jaguël section means that both nannofossil and planktic foraminiferal biostratigraphy is problematic at this site, because most important marker taxa are missing (Keller et al., 2007). However, dinocysts are very abundant in the Jaguël Fm (Papu et al., 1999) and are a powerful stratigraphic tool in such an environmental setting (Sluijs et al., 2005).
For the present study we collected 30 samples from 25m below the boundary up to 10 m above the boundary. All samples were analyzed for palynology and 24 samples for organic geochemistry.
4. Methods4.1 Palynologicalprocessing
Palynologyical processing was performed using standard palynological preparation techniques of the Laboratory of Palynology and Palaeobotany (see Vellekoop et al., 2014 for a more detailed

184184
CHAPTER VII
description). All slides are stored in the collection of the Laboratory of Palaeobotany and Palynology, Utrecht University. For each sample, dinocysts were counted up to a minimum of 200 specimens. The taxonomy of dinocysts follows that cited in Fensome and Williams (2004), unless stated otherwise.
4.2 DinocystsandsealevelIn general, marine dinoflagellates show a strong response to changes in physical and chemical
parameters of sea and ocean surface waters. Many species are precisely adapted to specific surface water conditions, but are also indirectly dependent of water depth, in order to successfully complete their lifecycle, involving a hypnozygotic benthic resting stage, the cyst. Marine dinocyst assemblages therefore generally express a strong proximal-distal signal (Brinkhuis, 1994; Sluijs et al., 2005; Pross and Brinkhuis, 2005). Since dinocyst assemblages reflect (at least a part of ) these dinoflagellate assemblages, they have successfully been used to reconstruct ancient changes is coastal proximity. In the past, various methods have been used to reconstruct relative sea level changes based on dinocysts assemblages (for an overview, see Sluijs et al., 2005). Based on empirical data, statistical correlations and the modern inshore-offshore distribution pattern of dinocysts, including taxa that occur since early Cretaceous times, environmental preferences for fossil dinocyst taxa are inferred (Sluijs et al., 2005; Sluijs et al., 2008b; Sluijs and Brinkhuis, 2009).
Here we apply inferred environmental preferences for Cretaceous-Paleogene dinocyst taxa, or groups of morphologically related taxa, to reconstruct changes in proximity to the coast. In general, nutrient loading, (changes in) salinity and other environmental stressors such as wave and current energy, are all positively correlated with coastal proximity. Therefore, dinocyst taxa indicative of high nutrient availability, hyper- or hyposaline conditions, or other forms of environmental stress represent the inshore component of the assemblage, whereas dinocyst taxa indicative for more stable, normal marine and oligotrophic conditions represent the offshore component of the assemblage.
Cretaceous-Paleogene dinocyst assemblages are mostly constituted by two types dinocysts: Gonyaulacales and Perdiniales. Notably Perininioid (P) cysts with a hexaform archeopyle are inferred to be indicative of low salinities and high nutrient availability (Sluijs and Brinkhuis, 2009). Since in a coastal setting lower salinities and high nutrient availability are typical for more inshore conditions, we use changes in the relative contribution of hexaperidinoid cysts as indicative for relative sea level changes.
Of the Cretaceous-Paleogene Gonyaulacoid dinocyst taxa, representatives of the Areoligera complex (cpx) and the Hystrichosphaeridium cpx are generally most abundant in inner neritic environments (Schioler et al., 1997; Sluijs and Brinkhuis, 2009). It has been suggested that these groups are better able to tolerate stressed environments and are therefore best adapted for extremely marginal marine settings (Schioler et al., 1997). In our study we group the Areoligera cpx and Hystrichosphaeridium cpx into a ‘coastal taxa’ group, broadly indicative of inshore conditions. All other Gonyaulacoid dinocyst taxa are grouped in the ‘normal marine’ group, indicative of more offshore conditions. We use the NM/C index (Normal Marine/(Normal Marine + Coastal)) to quantify the abundances of the these two groups, with the assumption that low NM/C represents a high coastal proximity, while NM/C represents a low coastal proximity.
4.3 BITindexOrganic geochemical analysis followed standard processing techniques (Schouten et al., 2007;
2013). Briefly, we extracted glycerol dialkyl glycerol tetraethers (GDGTs) using organic solvents

185185
RECONSTRUCTING SEA LEVEL CHANGE ACROSS THE K-PG BOUNDARY
and quantified the various GDGTs using high performance liquid chromatography/atmospheric pressure positive ion chemical ionization mass spectrometry (HPLC/APCI-MS). The branched and isoprenoid tetraether (BIT) index, indicative for the relative input of terrestrially-derived organic matter, was calculated following Hopmans et al., (2004).
5. Results and discussion5.1 Elles,Tunisia
Hexaperidinioids are relatively abundant in the Elles section record (10-80%), consistent with a high productivity setting. The NM/C index shows a generally decreasing trend in the Maastrichtian and earliest Danian. This suggest that this interval represents a s sea level regression, corresponding to a Highstand Systems Tract (HST). Between 5 and 2.5 meters below the boundary, hexaperidinioids become very abundant, peaking at ~80% of the assemblage at 4.5 m below the K-Pg boundary. In the same interval, terrestrial palynomorphs remain rare (Fig. 2). The increase in abundance of hexaperidinioids suggests an increase in nutrient availability and/or lower salinities, perhaps related to a relative sea level lowstand. However, the Elles section is located in, or close to, an upwelling region (Parrish and Curtis, 1982; Alsenz et al., 2013; Chapter 4 of this thesis) and since the peak is short-lived and terrestrial palynomorphs do not show a signal corresponding to an increase in coastal proximity, the recorded increase in nutrient availability might be related to enhanced upwelling instead of a change in relative sea level.
At the base of the boundary clay terrestrial palynomorphs show a marked increase, but since this short-lived peak directly follows the K-Pg boundary impact, it is more likely related to the biological crisis at the boundary, rather than of any changes in coastal proximity. The global decimation of terrestrial plant life will have resulted in a short-lived increase in soil erosion, increasing transport of plant material to the sea (Mizukami et al., 2013). In the lowermost Danian, correlative to foraminiferal zones P0 to Pα, terrestrial palynomorphs become slightly more abundance (max. 10% of the total assemblage). In the same interval, the NM/C index reaches lowest values (0.6-0.7). In foraminiferal Zone Pα also the hexaperidinoids are abundant. These results suggests that at the Elles section, the interval correlative to foraminiferal Zone Pα represents the shallowest facies, and hence a Lowstand Systems Tract (LST). In the interval correlative to Foraminiferal Zone Pα, hexaperidinioids remain abundant, but terrestrial palynomorphs and coastal dinocyst taxa appear to decrease in abundance at the top of the studied interval, suggesting a possible marine transgression. The sea level interpretation provided here is further corroborated by the changes in dinocyst assemblages across the studied interval, presented in Chapter 4 of this thesis.
5.2 StevnsKlint,DenmarkTerrestrial palynomorphs are most abundant at the base of the studied interval, ~7m below
the K-Pg boundary, decreasing in abundance across the Sigerslev Mb. In this member, the NM/C index is approximately 0.5-0.7. At the top of the Sigerslev Mb, marked by the nodular hardground approximately 2.5m below the K-Pg boundary, terrestrial palynomorphs reach a minimum, while the NM/C index increase to >0.75. These results suggest that the nodular hardground represents a maximum flooding surface (MFS) (Fig. 3-4).
In the overlying Højerup Mb, terrestrial palynomorphs remain low and the NM/C index remains high. These results signify that the Højerup Mb represents a relatively high sea level. The sedimentological/lithological transition, from the gently wavy, almost horizontally bedded, benthos-poor chalk of the Sigerslev Mb to the small, assymetrical bryozoan mounds of the Højerup Mb

186186
CHAPTER VII
nevertheless suggests that the Højerup Mb represents a shallowing facies (Surlyk, 1997), likely a HST, reaching a Sequence Boundary (SB) in the lowermost Danian. Similar to the Elles section, the base of the boundary clay is characterized by a peak in terrestrial palynomorphs, likely related to the K-Pg boundary catastrophe.
At Stevns Klint, the lower Danian succession is characterized by a hiatus, roughly spanning foraminiferal Zone P1a. This hiatus most likely represents an erosional event during a sea level
-5
-4
-3
-2
-1
0
1
2
3
4
Maa
stri
chti
anD
ania
n
Dis
tanc
e fr
om K
-Pg
boun
dary
(m)
Stag
e
Lith
olog
y
Sequ
ence
str
atig
raph
yH
STLS
T
SB
Inte
rpre
ted
rang
e SB
/mfs
CF1
P0
PαFo
ram
inife
ral Z
onat
ion
0 5 10% %
rationormal marine/coastal taxa H
exap
erid
inio
ids
terr
estr
ial p
alyn
omor
phs
Din
ocys
t mar
ker t
axa
1
3
4
56
7
?
800 20 40 600.0 0.2 0.4 0.6 0.8 1.0
Figure 2Elles El Kef, Tunisia: Foraminiferal zonation from Karoui-Yaakoub et al. (2002), dinocyst marker taxa from Chapter 4 of this theses. Normal Marine/Coastal taxa ratio and percentages of Hexaperidinioid DC and terrestrial palynomorphs across the K-Pg boundary interval. HST, Highstand Systems Tract; SB, Sequence Boundary; FSST, Falling Stage Systems Tract; LST, Lowstand Systems Tract. Numbers of dinocyst events refer to the following events: 1: FO Disphaerogena carposphaeropsis; 2: FO Hystrichokolpoma bulbosum; 3: FO Manumiella seelandica; 4: FO Disphaerogena carposphaeropsis var. cornuta; 5: base M. seelandica acme; 6: FO Senoniasphaera inornata; 7: FO Damassadinium cf. californicum; 8: FO D. californicum; 9: FO Carpatella cornuta; 10: LO Palynodinium grallator. The best-estimate range within which the interpreted SB falls is indicated in the figure.

187187
RECONSTRUCTING SEA LEVEL CHANGE ACROSS THE K-PG BOUNDARY
lowstand. Although our palynological record does not range into the overlying Stevns Klint Fm, the lithology of the succession suggests that the erosive contact between the Rødvig Fm and the Stevns Klint Fm represents the Transgressive Surface (TS) at the base of the TST. The sea level interpretation provided here is further supported by sedimentological changes in the Danish Basin (Surlyk, 1997).
5.3 NewJersey,USAIn comparison with the middle- to outer neritic Stevns Klint and Elles sections, the
sedimentary succession of the New Jersey composite core studied herein represents a shallower marine, inner- to middle neritic facies, indicated by the coarser grainsizes and abundance of coastal dinocyst taxa. Although these sites are interpreted to be deposited in a shallow coastal setting, the input of non-marine matter is still relatively low.
In the upper 9 m of the Maastrichtian, the equivalent of the A. mayaroensis Zone (Chapter 6 of this thesis), the BIT-index steadily decreases, from 0.13 to 0.05 (Fig. 5). In the upper 3 m of the Maastrichtian, the hexaperidinioids decrease from ~30% of the assemblage to <5% and in the last 2 m, terrestrial palynomorphs also show lower values, from 15-25% to ~10%. These results suggests decreasing coastal proximity, i.e. a marine transgression in the late Maastrichtian, indicative of a TST. In the last 2-3 meters of the Maastrichtian, the BIT-index and relative abundances of
Maa
stri
chti
anD
ania
n
Dis
tanc
e fr
om K
-Pg
boun
dary
(m)
Stag
e
Lith
olog
y
Sequ
ence
str
atig
raph
yH
STSB
TST
mfs
TST
P0Pα
Fora
min
ifera
l Zon
atio
nP1
b
Tor
FmSt
evn
s Fm
Sig
ersl
ev M
bH
øje
rup
Mb
Rød.
Ko
rsn
æb
Mb
Form
atio
n
Mem
ber
-8
-7
-6
-5
-4
-3
-2
-1
0
1
2 D
inoc
yst m
arke
r tax
a
1
2
3
4
56
9 10
Figure 3Stevns Klint, Denmark: Foraminiferal zonation from Stenestad (1976) and Rasmussen et al. (2005). Photo: courtesy of Jan Smit, VU University Amsterdam. TST, Transgressive Systems Tract; MFS, Maximum Flooding Surface. For the numbers of dinocyst events, see Figure 2.

188188
CHAPTER VII
terrestrial palynomorphs and hexaperidinioids reach their lowest values, indicating a mfs (Fig. 5). The NM/C index reaches highest values earlier than the BIT-index, terrestrial palynomorph and hexaperidinioid minimum, hampering the precise placement of the mfs.
Across the K-Pg boundary, the BIT-index rapidly increases and hexaperidinioids increase in abundance (Fig. 5), suggestive of a marine regression, corresponding to a HST. Above the unconformable, heavily burrowed contact with the lower Paleocene Hornerstown Formation, both palynomorphs and GDGTs are poorly preserved. This unconformable contact most likely represents lowstand conditions.
Maa
stri
chti
anD
ania
n
Dis
tanc
e fr
om K
-Pg
boun
dary
(m)
Stag
e
Lith
olog
y
Sequ
ence
str
atig
raph
yH
ST
SB
TST
mfs
TST
%
P0Pα
Fora
min
ifera
l Zon
atio
nP1
b
Tor
FmSt
evn
s Fm
Sig
ersl
ev M
bH
øje
rup
Mb
Rød.
Ko
rsn
æb
Mb
Form
atio
n
Mem
ber
Hex
aper
idin
ioid
s
rationormal marine/coastal taxaIn
terp
rete
d ra
nge
SB/m
fs
-8
-7
-6
-5
-4
-3
-2
-1
0
1
2
%
terr
estr
ial p
alyn
omor
phs
0 5 10 15
Din
ocys
t mar
ker t
axa
1
2
3
4
56
9 10
0 20 40 60 80 1000.0 0.2 0.4 0.6 0.8 1.0
Figure 4Stevns Klint, Denmark: Normal Marine/Coastal taxa ratio and percentages of Hexaperidinioid DC and terrestrial palynomorphs across the K-Pg boundary interval. For the numbers of dinocyst events, see Figure 2. The best-estimate ranges within which the interpreted MFS and SB fall are indicated in the figure.

189189
RECONSTRUCTING SEA LEVEL CHANGE ACROSS THE K-PG BOUNDARY
5.4 BrazosRiver,USAThe Brazos River palynological and geochemical record is rather complex, mostly because of
the tsunami- and post-impact storm deposits overprinting background signals. In addition to the palynological and BIT index record, at the Brazos River section the siliciclastic grainsize record of Vellekoop et al. (2014) also provides information concerning potential sea level changes.
At Brazos, the latest Maastrichtian is characterized by relatively low contribution of non-marine material (BIT-index values <0.17 and a low contribution of terrestrial palynomorphs <10%; Fig. 6), whereas the NM/C index and grain size are rather stable. These results suggest that at Brazos, the uppermost Maastrichtian represents a stable relative sea level, likely corresponding to a HST. The tsunami and post-impact storm deposits are characterized by higher BIT-index values and relatively high contributions of terrestrial palynomorphs, likely representing terrestrial material transported from the coast by the tsunami backwash. Above the K-Pg boundary, in the interval correlative to foraminiferal zones P0 and Pα, hexaperidinioids become slightly more abundant (10-25% of the assemblage) and BIT-index values rise. Across the same interval, the grainsize shows a steady increase up to the upper Littig Member. This suggests that this interval represents a late HST or FSST. On the other hand, the NM/C index slightly increases over this interval, which would be indicative of a marine transgression.
Maa
stri
chti
anD
ania
n
Dep
th (m
bls)
Stag
e
Lith
olog
y
Sequ
ence
str
atig
raph
yH
ST
SB
LST
mfs
TST
SB
%
Fora
min
ifera
l Zon
atio
nPα
-P1a
P0?
A. m
ayar
oens
is eq
uiva
lent
New
Eg
ypt
Ho
rner
sto
wn
Form
atio
n
Inte
rpre
ted
rang
e SB
/mfs
10
11
12
13
14
15
16
17
18
19
20
21
22
Hex
aper
idin
ioid
s
Din
ocys
t mar
ker t
axa
%0 10 20 30
terr
estr
ial p
alyn
omor
phs
BIT-
inde
x
1
4
3 5
6
7
0 20 400.0 0.2 0.4 0.6 0.8 1.0 0.01 0.05 0.10 0.15
rationormal marine/coastal taxa
Figure 5Meirs Farm, New Jersey: Foraminiferal zonation; dinocyst marker taxa and BIT-index data from Chapter 6 of this thesis. Normal Marine/Coastal taxa ratio and percentages of Hexaperidinioid DC and terrestrial palynomorphs and BIT-index data across the K-Pg boundary interval. For the numbers of dinocyst events, see Figure 2. The best-estimate ranges within which the interpreted MFS and SB fall are indicated in the figure.

190190
CHAPTER VII
The hiatus representing the interval correlative to foraminiferal Zone P1a likely signifies an erosional event, corresponding to a LST. Therefore, the interval below this hiatus most likely represents a regression. This could mean that, at Brazos, the NM/C index responds to environmental parameters that are not related to coastal proximity. The overlying upper Littig Member is characterized by a decrease in hexaperidinioids, the BIT-index and of the grainsize, suggesting that this member represents the base of a TST (Fig. 6).
5.5 Mid-Waipara,NewZealand Across the K-Pg boundary at mid-Waipara River, hexaperidinioid taxa increase in
abundance and terrestrial palynomorphs become more abundant (Fig. 7). The interval correlative to foraminiferal zones P0 and Pα, i.e. the lowermost Danian, is characterized by a strong decrease the NM/C index. At ~1 m above the K-Pg boundary, terrestrial palynomorphs are most abundant and the NM/C index is lowest. This suggest that at mid-Waipara, the K-Pg boundary transition is characterized by an increase in coastal proximity, representing a HST, with a SB in the interval representing Pα to P1a. Above this, hexaperidinioids the NM/C index increases and terrestrial palynomorphs decrease in abundance, suggesting a marine transgression. This transgression marks the transition to the Loburn Fm (Fig. 7).
Figure 6Brazos River, Texas: Foraminiferal zonation, dinocyst marker taxa and BIT-index data from Vellekoop et al. (2014). Normal Marine/Coastal taxa ratio and percentages of Hexaperidinioid DC and terrestrial palynomorphs and BIT-index data across the K-Pg boundary interval. For the numbers of dinocyst events, see Figure 2. Grainsize data from Vellekoop et al. (2014). The grey band indicates the interval with tsunami- and post-impact storm-deposits. The best-estimate range within which the interpreted SB falls is indicated in the figure.
Maa
stri
chti
anD
ania
n
Dis
tanc
e fr
om K
-Pg
boun
dary
(m)
Stag
e
Lith
olog
y
Sequ
ence
str
atig
raph
yH
ST?
SB
TST
CF1
P0Pα
P1b
Fora
min
ifera
l Zon
atio
n
%
Hex
aper
idin
ioid
s
?
Inte
rpre
ted
rang
e SB
/mfs
Din
ocys
t mar
ker t
axa
98
10
1 4
3
67
-4
-3
-2
-1
0
1
2
3
4
5
%
terr
estr
ial p
alyn
omor
phs
BIT-
inde
x
0 5 10 15 0.0 0.4 0.80.2 0.6
Co
rsic
ana
Kin
caid
Up
. Lit
tig
Form
atio
nM
embe
r
0 20 40Phi
9 68 7 5 4
Mea
n gr
ains
ize
rationormal marine/coastal taxa
0.0 0.2 0.4 0.6 0.8 1.0

191191
RECONSTRUCTING SEA LEVEL CHANGE ACROSS THE K-PG BOUNDARY
5.6 BajadadelJaguël,Argentina The palynological record of the Bajada del Jaguël section is dominated by normal
marine dinocyst taxa and hexaperidinioids, suggesting a depositional environment characterized by high nutrient availability and/or salinity changes. The lower 15 m of the studied interval are characterized by a decrease in abundance of hexaperidinioids, decreasing BIT-index values and decreasing abundances of terrestrial palynomorphs (Fig. 8), suggesting a marine transgression. Between 15 and 5 m below the boundary, the NM/C index also shows an increasing trend, confirming the transgression. Between 8 and 4 m below the K-Pg boundary, the NM/C index is highest and hexaperidinioids are relatively low in abundance (~20-40% of the assemblage). At ~4m below the boundary, BIT-index values are lowest (0.09; Fig. 8), suggesting maximum flooding. From ~4-5 m below the boundary, hexaperidinioids, terrestrial palynomorphs and the BIT-index show an increasing trend, while the NM/C index shows lower values, indicating increasing coastal influences. The gradual change to more silty (i.e. coarser) sediment is in agreement with this. These results suggest that the at Bajada del Jaguël, the K-Pg boundary interval represents a HST. At 1-1.5
Figure 7Mid-Waipara River, New Zealand: Foraminiferal zonation and dinocyst marker taxa from Willumsen et al. (2012), palynological data from Willumsen (2003). Normal Marine/Coastal taxa ratio and percentages of Hexaperidinioid DC and terrestrial palynomorphs across the K-Pg boundary interval. For the numbers of dinocyst events, see Figure 2. The best-estimate ranges within which the interpreted MFS and SB fall are indicated in the figure.
Maa
str.
Dan
ian
Dis
tanc
e fr
om K
-Pg
boun
dary
(m)
Stag
e
Lith
olog
y
Sequ
ence
str
atig
raph
yTS
T
SB
LST
mfs
HST
HST
%
Fora
min
ifera
l Zon
atio
nP1
a-P1
b
P0
PαP1
a-P1
cC
on
way
Lob
urn
Form
atio
n
Hex
aper
idin
ioid
s
Inte
rpre
ted
rang
e SB
/mfs
-2
-1
0
1
2
3
4
5
6
7
8
9
10
0 20 40 60 80%
terr
estr
ial p
alyn
omor
phs
0 10 20
Din
ocys
t mar
ker t
axa
3
6 7
0.6 0.8 1.0
rationormal marine/coastal taxa

192192
CHAPTER VII
m above the boundary, hexaperidinioids and the BIT-index peak, indicative of a SB. Above the possible erosional surface at ~2m above the boundary, BIT-index values drop, hexaperidinioids decrease in abundance and normal marine dinocyst taxa recover. This suggests that the surface at ~2m above the boundary represents a Transgressive Surface (TS) and the overlying interval a TST (Fig. 8).
5.7 K-PgdinocystchronobiostratigraphyApart from reconstructing changes in coastal proximity, dinocysts are also very useful as a
biostratigraphic tool. Notably across the K-Pg boundary interval, dinocyst biostratigraphy allows a very high resolution stratigraphic zonation (Brinkhuis et al., 1998; Vellekoop et al., 2014). The combined dinocyst records generated in this study show a distinct succession of global First and Last Occurrences (FO respectively LO) of dinocyst index taxa (Figs. 2-8). Based on the now established, robust ages of these dinocyst events, e.g., employing also earlier work of Brinkhuis et al. (1998), Williams et al. (2004) and Vellekoop et al. (2014), a very high resolution, global biochronology across the K-Pg boundary may now be established (Fig. 9).
Figure 8Bajada del Jaguël, Argentina: Foraminifieral zonation after Keller et al. (2007). Palynological and organic geochemical data from this study. Normal Marine/Coastal taxa ratio and percentages of Hexaperidinioid DC and terrestrial palynomorphs and BIT-index data across the K-Pg boundary interval. For the numbers of dinocyst events, see Figure 2. The best-estimate ranges within which the interpreted MFS and SB fall are indicated in the figure.
Maa
stri
chti
anD
ania
n
Dis
tanc
e fr
om K
-Pg
boud
nary
(m)
Stag
e
Lith
olog
y
Sequ
ence
str
atig
raph
yH
ST
SB
TST
mfs
TST
%
Fora
min
ifera
l Zon
atio
nP1
bno
mar
ker t
axa
P0/P
α?
Din
ocys
t mar
ker t
axa
1
4
56 7
98
Hex
aper
idin
ioid
s
-24 -22 -20 -18 -16 -14 -12 -10
-8 -6 -4 -2 0 2 4 6 8
10
-25
%te
rres
tria
l pal
ynom
orph
s
BIT-
inde
x
0 10 20 30 0.0 0.1 0.20 20 40 60
rationormal marine/coastal taxaIn
terp
rete
d ra
nge
SB/m
fs
0.6 0.7 0.8 0.9 1.0

193193
RECONSTRUCTING SEA LEVEL CHANGE ACROSS THE K-PG BOUNDARY
5.8 GlobalsealevelchangesacrosstheK-PgboundaryAlthough local expressions of sea level variations can differ substantially between sites and
basins, the sequence stratigraphic interpretations of the studied lithological, sedimentological, palynolgical and organic geochemical records are very consistent. Based on planktnic foraminiferal and dinocyst biochronology, the sites can now be highly accurately stratigraphically correlated (Fig. 9). Using best-estimate, absolute ages of biostratigraphic events, defined at chronostratigraphically well-constrained sections such as the El Kef K-Pg boundary GSSP, the reconstructed sea level changes can be tied to an absolute timescale (Fig. 9). The results show that at the six different sites, across five different continents, the records clearly demonstrate a globally quasi-isochronous maximum flooding occurring some ~250 kyrs before the end of the Maastrichtian, followed by a relatively strong regression across the K-Pg boundary. In all studied records, this long-term regressive trend continues across the boundary, in the interval correlative to foraminiferal Zone P0, reaching an ultimate lowstand in the interval correlative to foraminiferal zones Pα to P1a. Typically, in most of the more proximal sites, this lowstand is represented by a distinct hiatus (Adatte et al., 2002a; Abramovich et al., 2002; Macleod and Keller, 1991). Furthermore, the interval correlative to the basal part of foraminiferal Zone P1b, 0.75-1 Myr after the K-Pg boundary, is characterized by a marked, strong marine transgression, a distinctive feature in many K-Pg boundary sections worldwide. Collectively, these results suggest that the recorded sea level changes are indeed global in nature.
Although our records clearly indicate the globally quasi-synchronous nature of these long-term sea level changes, it is difficult to accurately constrain the amplitude of these changes. The few available paleodepth estimates of the sites investigated in this study widely diverge (e.g. Bourgeois et al., 1988; Smit et al., 1996), as estimating absolute water depth remains problematic. Since estimates of palaeodepth differ per study and per site, the estimated amplitude of sea level changes also greatly varies. However, the fact that sea level changes are recorded in the sedimentological and biological records of middle to outer neritic sties suggest that they are of considerable magnitude, i.e. in the order of some tens of meters (>10m).
5.9 MechanismsforglobalsealevelchangesWhen the K-Pg sea level trends are compared to available temperature proxy records across
this interval, a correlation is immediately apparent. In both bottom water temperature records (benthic foraminiferal δ18O; Westerhold et al., 2011) and surface water temperature records from a mid-latitude setting (planktic foraminiferal δ18O and TEX86; Olsson et al., 2002 and Chapter 6 of this thesis) relative warm temperatures appear to coincide with sea level maxima (Fig. 10).
This observation suggests a relationship between sea level and temperature. Thermal expansion of ocean water alone however appears insufficient to explain the inferred magnitude of the sea level changes, as the temperature-density relationship of seawater (1.9 x 10⁻² %volume/°C) requires unreasonable temperature changes (tens of degrees K) to explain tens of meters of sea level change.
Discussion exists on whether the Late Cretaceous-Paleocene greenhouse world had continental ice sheets of a size that could be responsible for glacioeustatic changes of tens of meters (DeConto and Pollard, 2003; Miller et al., 2005). Coupled climate-ice sheet modelling suggests that ice sheets with sufficient volume could have existed in alpine Antarctic regions in the Cretaceous-Paleogene greenhouse world (DeConto and Pollard, 2003). With varying atmospheric CO2 and orbital parameters, these ice sheets could have been responsible for sea level variations in the order of tens of meters. Supporting evidence for such a notion is however lacking.

194194
CHAPTER VII
Figu
re 9
Com
pilat
ion
of la
test
Maa
strich
tian
and
early
Dan
ian
sequ
ence
stra
tigra
phie
s; bi
ostra
tigra
phic
aga
cons
train
ts on
seq
uenc
e str
atig
raph
ic su
rface
s an
d in
terp
rete
d gl
obal
relat
ive
sea
leve
l cha
nges
. Abs
olut
e ag
es o
f mag
netic
reve
rsals
and
bio
strat
igra
phic
zona
tions
follo
wing
Gra
dste
in e
t al.
(201
2). A
ges o
f din
ocys
t eve
nts f
ollo
wing
Brin
khui
s et
al.
(199
8), W
illia
ms
et a
l. (2
004)
and
Vell
ekoo
p et
al.
(201
4). F
or th
e nu
mbe
rs o
f din
ocys
t eve
nts,
see
Figu
re 2
. Per
site
, the
obs
erve
d di
nocy
st str
atig
raph
ic ev
ents
are
indi
cate
d at
thei
r res
pect
ive l
evels
.
C29r
NP1NP2NP3
CretaceousPaleogeneMaastrichtianDanian
65
66
67
C30n
M. prinsii
CF3CF2CF1
P0Pα
P1aP1b
C29nC28r
M. murus
12
3456
8
7
9
10ChronPolarityNannoplankton ZonesForaminiferal Zones
Stage
Age
Ma
Dinocyst marker taxa
8
67
Elles El Kef (North Africa) Not studiedNot studied
HST
SBLST
5
Mid-Waipara (New Zealand)
45
67
9
Brazos River (North America)
Not studied
HST
SBTS
TST ?
8
Rela
tive
sea
leve
l
Low
High
Bios
trat
igra
phic
ag
e co
nstr
aint
sse
quen
ce s
trat
igra
phic
su
rfac
es
2456
9
Stevns Klint (Northern Europe)
HST
mfs
TST
SBTS
TST
10
1456
7
Meirs Farm (North America)
HST
mfs
TST
SB
LSTNot studied
??
67
Not studied
HST
TST SBLST
TS
mfs
1567
89
Bajada del Jaguël (South America)
HST
mfs
TST
SBTS
TST
4
mfs
K-PgSB
~66.
5
~66.
08~6
6.00
~65.
72
~65.
25
~64.
95
TS10

195195
RECONSTRUCTING SEA LEVEL CHANGE ACROSS THE K-PG BOUNDARY
The timing of the global latest Maastrichtian and subsequent early Danian transgression approximately correlate to the two largest outpouring phases of the Deccan Traps Large Igneous Province (LIP) in modern day India, respectively (Chenet et al., 2007; Keller et al., 2011). This may be taken to suggest a potential relationship to the global sea level variations as well. Rapid submarine uplift during outpouring phases could have decreased the total volume of the global ocean basins, potentially leading to sea level rises in the order of several meters (Müller et al., 2008). Since some of the strongest warming phases in the late Maastrichtian and Danian correlate to the outpouring phases of this LIP (Olsson et al., 2002; Keller et al., 2011; Chapter 6 of this thesis),
Cre
tace
ou
sP
ale
og
en
eM
aa
stri
chti
an
Da
nia
n
65
66
67 1 2
3
4
56
8
7
9
10
Sequ
ence
str
atig
raph
y
Din
ocys
t mar
ker t
axa
Chro
nPo
larit
yN
anno
plan
kton
Zon
esFo
ram
inife
ral Z
ones
Stag
eAg
e
Ma
Benthic foraminiferal δ18O stack
TEX86-basedsea surface temperature
CF2
CF3
CF1
P0
PαP1
aP1
b
M. m
urus
M. p
rinsi
iN
P1N
P2N
P3
C30n
C29r
C29n
C29r
Low High
HST
mfs
TST
TS
TST
SB
mfs
LST
Relative sea level
22 24 26 28 30
ODP site 1209Hole AODP site 1209Hole BODP site 1209Hole C
1.5 1.0 0.5 0.0δ18O (‰VPDB) SST
Figure 10Comparison of latest Maastrichtian and early Danian sequence stratigraphy; interpreted global relative sea level changes and bottom and surface water temperature proxy records across this interval. Benthic foraminiferal δ18O stack from ODP site 1209 (Westerhold et al., 2011) and TEX86 stack from New Jersey (Chapter 6 of this thesis). The age model of ODP site 1209 is adapted to the age model of the present study. For the numbers of dinocyst events, see Figure 9.

196196
CHAPTER VII
climate change related to the Deccan Traps might also play a significant role in explaining sea level change.
With all these different possible mechanisms in play, it remains difficult to identify the principal causes for the long term sea level variations. An interplay between different mechanisms seems very likely. If small Antarctic ice sheets were present, Deccan Traps outpouring of greenhouse gasses will not only have caused a decrease of the total volume of the global ocean basins, but the related global warming will also have resulted in the thermal expansion of ocean water and partial melting of ice sheets. The combination of these effects might be responsible for the observed sea level highs. The quiescence of the Deccan Traps and the build-up of small ice sheets will in turn have caused the observed regression across the K-Pg boundary.
6. ConclusionsPalynological, lithological and organic biomarker records show that geographically widely
separated sections from five different continents, across both hemispheres, show concurring changes in coastal proximity across the Cretaceous-Paleogene interval. Collectively, the evidence points towards globally synchronous, long term (~1 Myr) sea level change. The records indicate that the late Maastrichtian was characterized by maximum flooding, followed by a regression in the latest Maastrichtian and across the K-Pg boundary. A sea level lowstand is recorded in the earliest Danian in sections worldwide.
The mechanism(s) underlying these global sea level variations remain(s) enigmatic. An interplay between different mechanisms may be considered. For example, if relatively small Antarctic ice sheets were present around this time, they could have been effected by the global warming potentially caused by Deccan Traps outpouring of greenhouse gasses. In such a situation, the outpouring of the Deccan Traps will not only have caused a decrease of the total volume of the global ocean basins and the thermal expansion of ocean water, but will also have resulted in partial melting of these ice sheets. The combination of these effects might be responsible for the observed sea level highs. In such a setting, the strong regression across the K-Pg boundary will have been related to the quiescence of the Deccan Traps and the coinciding build-up of small Antarctic ice sheets.

197
ReferencesAbramovich, S., Keller, G., 2002. High stress late Maastrichtian paleoenvironment: inference from planktonic
foraminifera in Tunisia. Palaeogeography, Palaeoclimatology, Palaeoecology 178, 145-164.Abramovich, S., Keller, G., Adatte, T., Stinnesbeck, W., Hottinger, L., Stueben, D., Berner, Z., Ramanivosoa, B.,
Randriamanantenasoa, A., 2002. Age and paleoenvironment of the Maastrichtian to Paleocene of the Mahajanga Basin, Madagascar: a multidisciplinary approach. Marine Micropaleontology 47, 17-70.
Açıkalın, S., 2011. Orta Sakarya Bölgesi Kretase – Tersiyer istifinin kaynak bölge ve iklimsel açılardan incelenmesi. PhD Thesis, Eskisehir Osmangazi University, Turkey, 249 p.
Açıkalın S., Vellekoop, J., Ocakoğlu, F., Yılmaz, I. Ö., Smit, J., Altıner, S. O., Goderis, S., Vonhof, H., Speijer, R. P., Woelders, L., Fornaciari, E., Brinkhuis, H., 2015. Geochemical and paleontological characterization of a new K-Pg Boundary locality from the Northern branch of the Neo-Tethys: Mudurnu – Göynük Basin, NW Turkey. Cretaceous Research 51, 251-267
Adatte, T., Keller, G., Stinnesbeck, W., 2002a. Late Cretaceous to early Paleocene climate and sea-level fluctuations: the Tunisian record. Palaeogeography, Palaeoclimatology, Palaeoecology 178, 165-196.
Adatte, T., Keller, G., Burns, S., Stoykova, K. H., Ivanov, M. I., Vangelov, D., Kramer, U., Stueben, D., 2002b. Paleoenvironment across the Cretaceous-Tertiary transition in eatern Bulgaria. in Koeberl, C., MacLeod, K.G. (eds.), Catastrophic Events and Mass Extinctions: Impacts and Beyond: Boulder, Colorado, Geological Society of America Special Paper 356, 231 – 251.
Adatte, T., Keller, G., Stueben, D., Harting, M., Kramar, U., Stinnesbeck, W., Abramovich, S., Benjamini, C., 2005. Late Maastrichtian and K/T paleoenvironment of the eastern Tethys (Israel): mineralogy, trace element and platinum group elements, biostratigraphy and faunal turnovers. Bulletin Société Géologique de France 176 (1), 35 – 53.
Alegret, L., Molina, E., Thomas, E., 2003. Benthic foraminiferal turnover across the Cretaceous/Paleogene boundary at Agost (southeastern Spain): paleoenvironmental inferences. Marine Micropaleontology 48, 251-279.
Alegret, L., Thomas, E., 2009. Food supply to the seafloor in the Pacific Ocean after the Cretaceous/Paleogene boundary event. Marine Micropaleontology 73, 105-116.
Alegret, L., Thomas, E., 2013. Benthic foraminifera across the Cretaceous/Paleogene boundary in the Southern Ocean (ODP Site 690): Diversity, food and carbonate saturation. Marine Micropaleontology 105, 40-51.
Alroy, J., 2008. Dynamics of origination and extinction in the marine fossil record. Proceedings of the National Academy of Sciences of the United States of America 105, 11536-11542. DOI: 10.1073/pnas.0802597105
Alsenz, H., Regnery, J., Ashckenazi-Polivoda, S., Meilijson, A., Ron-Yankovich, L., Abramovich, S., Illner, P., Almogi-Labin, A., Feinstein, S., Berner, Z., Püttmann, W., 2013. Sea surface temperatura record of a Late Cretaceous tropical Southern Tethys upwelling system. Palaeogeography, Palaeoclimatology, Palaeoecology 392, 350-358.
Altıner, D., Koçyiğit, A., Farinacci, A., Nicosia, U. ve Conti, M.A., 1991. Jurassic-Lower Cretaceous stratigraphy and paleogeographic evolution of the southern part of north-western Anatolia (Turkey). Geologica Romana 27, 13-80.
Alvarez, L.W., W. Alvarez, F. Asara et al., 1980. Extraterrestrial Cause for the Cretaceous-Tertiary Extinction. Science 208 (4448), 1095-1108.
Anderson, R. L., 1987. Practical Statistics for Analytical Chemists. Van Nostrand Reinhold, New York.Arenillas, I., Arz, J.A., Molina, E., Dupuis, C., 2000. An independent test of planktic foraminiferal turnover across the
Cretaceous/Paleogene (K/P) boundary at El Kef, Tunisia: Catastrophic mass extinction and possible survivorship. Micropaleontology 46 (1), 31-49.
Arenillas, I., Arz, J.A., Molina, E., 2004. A new high-resolution planktic foraminiferal zonation and subzonation for the lower Danian. Lethaia 37, 79-95.

198
Asaro, F., Michel, H. V., Alvarez, W. Alvarez, L., W. Maddocks, R. F., Bunch, T., Iridium and other geochemical profiles near the Cretaceous-Tertiary boundary in a Brazos river section in Texas, in Texas ostracoda, International Symposium on Ostracoda, 8th, Guidebook of Excursion and Related Papers: R. F. Maddocks, Ed. (Univ. of Houston, Houston, 1982) pp. 238 – 241.
Bambach, R, K., 2006. Phanerozoic Biodiversity Mass Extinctions. Annual Review of Earth and Planetary Science 34, 127 – 155.
Barrio, C. A., 1990. Late Cretaceous-Early Tertiary sedimentation in a semi-arid foreland basin (Neuquén Basin, western Argentina). Sedimentary Geology 66, 255-275.
Benton, M. J., 1995. Diversification and extinction in the history of life. Science 268, 52-58.Berggren, W.A., Aubert, J., 1975. Paleocene benthonic foraminiferal biostratigraphy, paleobiogeography and
paleoecology of Atlantic – Tethyan regions: midway-type fauna. Palaeogeography, Palaeoclimatology, Palaeoecology 18, 73 – 192.
Berggren, W.A., Kent, D.V., Swisher, C.C. III, Aubry, M.P., 1995. A revised Cenozoic geochronology and chronostratigraphy, in Berggren, W.A., et al. Eds., l Geochronology, Time and Global Stratigraphic Correlation, Society of Economic Geologist and Paleontologist, Special Publication, 129-212.
Bijl, P. K., Houben, A. J. P., Schouten, S., Bohaty, S. M., Sluijs, A., Reichart, G. J., Sinninghe Damsté, J. S., Brinkhuis, H., 2010. Transient Middle Eocene Atmospheric Carbon Dioxide and Temperature Variations. Science 330. 819-821.
Blaga, C. I., Reichart, G. J., Heiri, O., Sinninghe Damsté, J. S., 2009. Tetraether membrane lipid distributions in lake particulate matter and sediments: a study of 47 European lakes along a North – South transect. Journal of Paleolimnology 41, 523 – 540.
Bourgeois, J., Hansen, T. A., Wiberg, P., Kauffman, E. G., 1988. A tsunami deposit at the Cretaceous – Tertiary boundary in Texas. Science 141, 567 – 570.
Brinkhuis, H., Zachariasse, W.J., 1988. Dinoflagellate cysts, sea level changes and planktonic foraminifers across the Cretaceous-Tertiary boundary at El Haria, northwest Tunisia. Marine Micropaleontology 13, 153-191.
Brinkhuis, H., Leereveld, H., 1988. Dinoflagellate cysts from the Cretaceous/Tertiary boundary sequence of El Kef, Northwest Tunisia. Review of Palaeobotany and Palynology 56, 5-19.
Brinkhuis, H. and Biffi, U., 1993. Dinoflagellate cyst stratigraphy of the Eocene/Oligocene transition in Central Italy. Marine Micropaleontology 22, 131-183.
Brinkhuis, H., 1994. Late Eocene to early Oligocene dinoflagellate cysts from the Priabonian type-area (northeast Italy); biostratigraphy and palaeoenvironmental interpretation. Palaeogeography, Palaeoclimatology, Palaeoecology 107, 121 – 163.
Brinkhuis, H., Schiøler, P., 1996. Palynology of the Geulhemmerberg Cretaceous/Tertiary boundary section (Limburg, SE Netherlands). Geologie en Mijnbouw 75 (2-3), 193-213.
Brinkhuis, H., Bujak, J.P., Smit, J., Versteegh, G.J.M., Visscher, H., 1998. Dinoflagellate-based sea surface temperature reconstructions across the Cretaceous-Tertiary boundary. Palaeogeography, Palaeoclimatology, Palaeoecology 141, 67-83.
Caron, M., 1985. Cretaceous planktic foraminifera. In Bolli, H.M., Saunders, J.B. and Perch-Nielsen, K. (eds), Plankton Stratigraphy: Volume 1, Planktic Foraminifera, Calcareous Nannofossils and Calpionellids. Cambridge (Cambridge University Press).
Chenet, A.-L., Quidelleur, X., Fluteau, F., Courtillot, V., Bajpai, S., 2007. 40K – 40Ar dating of the Main Deccan large igneous province: further evidence of the KTB age and short duration. Earth Planetary Sciecne Letters 263, 1 – 15.
Chenet, A.-L., Courtillot, V., Fluteau, F., Gerard, M., Quidelleur, X., Khadri, S.F.R., Subbarao, K.V., and Thordarson, T., 2009. Determination of rapid Deccan eruptions across the Cretaceous-Tertiary boundary using paleomagnetic

199
secular variation: 2. Constraints from analysis of eight new sections and synthesis for a 3500-m-thick composite section:Journal of Geophysical Research 114, B06103.
Claeys, P., Kiessling, W., Alvarez W., 2002. Distribution of Chicxulub ejecta at the Cretaceous-Tertiary Boundary, Geological Society of America Special Paper 356, 55 – 69.
Clarke, L.J. and Jenkyns, H.C., 1999, New oxygen isotope evidence for long-term Cretaceous climatic change in the Southern Hemisphere, Geology 27 (8), 699-702.
Coccioni, R., Galeotti, S., 1994. K-T boundary extinction: geologically instantaneous or gradual event? Evidence from deep-sea benthic foraminifera. Geology 22, 779-782.
Coccioni, R., Marsili, A., 2007. The response of benthic foraminifera to the K-Pg boundary biotic crisis at Elles (northwestern Tunisia). Palaeogeography, Palaeoclimatology, Palaeoecology 255, 157-180.
Courtillot, V., Besse, J., Vandamme, D., Montigny, R., Jaeger, J.J., Cappetta, H., 1986. Deccan flood basalts at the Cretaceous/Tertiary boundary?. Earth and Planetary Science Letters 80, 361-374.
Covey, C., Thompson, S.L., Weissman, P.R., MacCracken, M.C., 1994. Global climatic effects of atmospheric dust from an asteroid or comet impact on Earth. Global and Planetary Change 9, 263 – 273.
Coxall, H. K., D’Hondt, S., Zachos, J. C., 2006. Pelagic evolution and environmental recovery after the Cretaceous-Paleogene mass extinction. Geology 34 (4), 297-300. doi: 10.1130/G21702.1
Crouch, E.M., Brinkhuis, H. 2005. Environmental change across the Paleocene-Eocene transition from eastern New Zealand: a marine palynological approach. Marine micropaleontology 56 (3/4), 138-160.
Culver, S.J., 2003. Benthic foraminifera across the Cretaceous – Tertiary (K – T) boundary: a review. Marine Micropaleontology 47, 177 – 226.
Cushman, J. A., 1946. Upper Cretaceous foraminifera of the Gulf coastal region of the United States and adjacent areas. United States Geological Survey, Professional Paper 206, 241 pp.
Cushman J. A., 1951. Paleocene foraminifera of the Gulf Coastal Region of the United States and adjacent regions. United States Geological Survey, Professional Paper 232, 75 pp.
Damassa, S.P., 1988. Carpatella cornuta Grigorovich 1969 (Dinophyceae) – a member of the Aptiana – Ventriosum complex. Palynology 12, 167 – 177.
Davidoff, A. J., Yancey T. E., 1993. Eustatic cyclicity in the Paleocene and Eocene: data from the Brazos River valley, Texas. Tectonophysics 222 (3 – 4), 371 – 395.
De Jonge, C., Stadnitskaia, A., Hopmans, E. C., Cherkashov, G., Fedotov, A., Sinninghe Damsté, J. S., 2014. In situ produced branched glycerol dialkyl glycerol tetraethers in suspended particulate matter from the Yenesei River, Eastern Siberia. Geochimica et Cosmochimica Acta 125, 476-491.
DeConto, R. M., Pollard, D., 2003. A coupled climate-ice sheet modeling approach to the Early Cenozoic history of the Antarctic ice sheet. Palaeogeography, Palaeoclimatology, Palaeoecology 198, 39-52.
De Gracianski, P. C., Hardenbol, J., Jacquin, T., Vail, P. R., 1998. Mesozoic – Cenozoic Sequence Stratigraphy of European Basins. Society of Economic Paleontologists and Mineralogists Special Publication, SEPM, Tulsa, OK, Vol. 60, 786pp.
Dessert, C., Dupré, B., François, L.M., Schott, J., Gaillardet, J., Chakrapani, G., Bajpai, S., 2001. Erosion of Deccan Traps determined by river geochemistry: impact on the global climate and the 87Sr/86Sr ratio of seawater. Earth and Planetary Science Letters 188, 459-474.
D’hondt, S., Pilson, M. E. Q., Sigurdsson, H. Hanson, A. K. Carey, S., 1994. Surface-water acidification and extinction at the Cretaceous-Tertiary boundary. Geology 22, 983.
D’Hondt, S., Donaghay, P., Zachos, J. C., Luttenberg, D., Lindinger, M., 1998. Organic Carbon Fluxes and Ecological Recovery from the Cretaceous-Tertiary Mass Extinction. Science 282, 276-279.
D’Hondt, S., 2005. Consequences of the Cretaceous/Paleogene Mass Extinction for Marine Ecosytems. Annual Review of Ecology, Evolution, and Systematics 36, 295 – 317. doi: 10.1146/annurev.ecolsys.35.021103.105715

200
Dinarès-Turell, J., Baceta, J.I., Pujalte, V., Orue-Etxebarria, X., Bernaola, G., Lorito, S., 2003. Untangling the Palaeocene climatic rhythm: an astronomically calibrated Early Paleocene magnetostratigraphy and biostratigraphy at Zumaia (Basque Basin, northern Spain). Earth and Planetary Science Letters 216, 483-500.
Donnadieu, Y., Pierrehumbert, R., Jacob, R., Fluteau, F., 2006. Modelling the primary control of paleogeography on Cretaceous climate. Earth Planetary Science Letters 248, 426.
Egger, H., Koeberl, C., Wagreich, M., Stradner, H., 2009. The Cretaceous-Paleogene (K/Pg) boundary at Gams, Austria: Nannoplankton stratigraphy and geochemistry of a bathyal northwestern Tethyan setting. Stratigraphy 6 (4), 333-347.
Elliot, D. H., Askin, R. A., Kyte, F. T., Zinsmeister, W. J., 1994. Iridium and dinocysts at the Cretaceous-Tertiary boundary on Seymour Island, Antarctica: Implications for the K-T event: Geology 22, 675-678. doi: 10.1130/0091-7613(1994)022<0675:IADATC>2.3.CO;2
Emanuel, K. A., Speer, K., Rotunno, R., Srivastava, R., Molina, M., 1995. A possible link in global extinction scenarios. Journal of Geophysical Research-Atmospheres 100 (7), 13,755.
Eshet, Y., Moshkovitz, S., Habib, D., Benjamini, C., Magaritz, M., 1992. Calcareous nannofossil and dinoflagellate stratigraphy across the Cretaceous/Tertiary boundary at Hor Hahar, Israel. Marine Micropaleontology 18, 199-228.
Eshet, Y., Almogi-Labin, A., Bein, A., 1994. Dinoflagellate cysts, paleoproductivity and upwelling systems: A Late Cretaceous example from Israel. Marine Micropaleontology 23. 231-240.
Fensome, R. A., Williams, G. L., 2004. The Lentin and Williams Index of Fossil Dinoflagellages 2004 edition. American Association of Stratigraphic Palynologists Foundation Contr. Series.
Foley, E.J., 1938. Göynük civarında yapılan bir istikşaf gezisi. MTA Enstitüsü Raporu, Derleme No: 786, 17 s.Forster, A., Schouten, S., Baas, M., Sinninghe Damsté, J. S., 2007. Mid-Cretaceous (Albian-Santonian) sea surface
temperature record of the tropical Atlantic Ocean. Geology 35 (10), 919-922.Galeotti, S., Coccioni, R., 2002. Changes in coiling direction of Cibicides pseudoacutus (Nakkady) across the
Cretaceous-Tertiary boundary of Tunisia: palaeoecological and biostratigraphic implications. Palaeogeography, Palaeoclimatology, Palaeoecology 178, 197-210.
Galeotti, S., Brinkhuis H., Huber. M., 2004. Records of post – Cretaceous-tertiary boundary millennial-scale cooling from the western tethys: A smoking gun for the impact-winter hypothesis?. Geology 32 (6), 529-532.
Galeotti, S., Lanci, L., Baffa, E., Balzelli, G., Bucci, C., Brinkhuis, H., Monechi, S., Peeters, J., Smit, J., Speijer, R.P., Sprovieri, M., 2005. Orbitally paced cycles from the lowermost Danian Elles section (Tunisia): implications for high-resolution chronostratigraphy across the Cretaceous/Tertiary boundary. EGU General Assembly, Vienna, April 24-29, 2005. Geophysical Research Abstracts, Vol. 7.
Ganapathy, R. Gartner, S., Ming-Jung Jiang, 1981. Iridium anomaly at the Cretaceous-Tertiary boundary in Texas. Earth and Planetary Science Letters 54, 393-396.
Gardin, S., 2002. Late Maastrichtian to early Danian calcareous nannofossils at Elles (Northwest Tunisia). A tale of one million years across the K-T boundary. Palaeogeography, Palaeoclimatology, Palaeoecology 178, 211-231.
Gedl, P., 2004. Dinoflagellate cyst record of the deep-sea Cretaceous-Tertiary boundary at Uzgrun, Carpathian Mountains, Czech Republic, in Beadoin, A. B. and Head, M. J., (eds), The PalynoIogy and Micropalaeontology of Boundaries. Geological Society, London, Special Publications 230, 257-273.
Goderis, S., Tagle, R., Belza, J., Smit, J., Montanari, A., Vanhaecke, F., Erzinger, J., Claeys, P., 2013. Reevaluation of siderophile element abundances and ratios across the Cretaceous-Paleogene (K-Pg) boundary: Implications for the nature of the projectile. Geochimicia et Cosmochimica Acta 120, 417-446.
Göncüoglu, M. C., Turhan, N., Sentürk, K., Özcan, A., Uysal, S., Yaliniz, M. K., 2000. A Geotraverse Across Northwestern Turkey: Tectonic Units of the Central Sakarya Region and their Tectonic Evolution. Geological Society, London, Special Publications 173, 139-161.

201
Govindaraju K., 1994. Compilation of working values and description for 383 geostandards. Geostandards Newsletter 18, 1 – 154.
Govindaraju, K., Roelandts, I., 1993. Second report (1993) on the first three GIT-IWG rock reference samples: anorthosite from Greenland, AN-G; Basalte d’Essey-la-Côte, BE-N; Granite de Beauvoir, MA-N. Geostandards Newsletter 17, 227 – 294.
Gradstein, F.M., Ogg, J.G., Schmitz, M.D., and Ogg, G.M., 2012. The Geologic Time Scale 2012, v. 1&2: Boston, USA, Elsevier, 1144 p. DOI: 10.1016/B978-0-444-59425-9.00004-4.
Habib, D., Moshkovitz, S., Kramer, C., 1992. Dinoflagellate and calcareous nannofossil response to sea-level change in Cretaceous-Tertiary boundary sections. Geology 20, 165-168.
Habib, D., Olsson, R.K., Liu, C., Moshkovitz, 1996. High-resolution biostratigraphy of sea-level low, biotic extinction, and chaotic sedimentation at the Cretaceous-Tertiary boundary in Alabama, north of the Chicxulub crater. Geological Society of America Special Paper 307, 243-252.
Habib, D., Saeedi, F., 2007. The Manumiella seelandica global spike: Cooling during regression at the close of the Maastrichtian. Palaeogeography, Palaeoclimatology, Palaeoecology 255, 87-97.
Hammer, Ø., Harper, D.A.T., Ryan, P.D., 2001. PAST: Paleontological Statistics Software Package for Education and Data Analysis. Palaeontologia Electronica 4(1), 9pp
Hansen, J.M., 1977. Dinoflagellate stratigraphy and echinoid distribution in Upper Maastrichtian and Danian deposits from Denmark. Bull. Geol. Soc. Den., 26, 1-26.
Hansen, T. A., Farrand, R. B., Montgomery, H. A., Billman, H. G., Blechschmidt, G. L., 1987. Sedimentology and extinction patterns across the Cretaceous-Tertiary boundary interval in East Texas. Cretaceous Research 8, (3).
Hansen, T. A., Upshaw III, B., Kauffman, E. G., Gose, W., 1993. Patterns of molluscan extinction and recovery across the Cretaceous-Tertiary boundary in east Taxas; report on new outcrops. Cretaceous Research 14 (6), 685-706.
Hansen, H. J., Tof, P., Mohabey, D. M., Surkar, A., 1996. Lameta age: Dating the main pulse of the Deccan Traps volcanism, in National Symposium Deccan Flood Basalts, India. Gondwana Geology Magazine 2, 365-374.
Hancock, J.M., 1967. Some cretaceous-tertiary marine faunal changes. Geological Society, London, Special Publications 2 (1), 91-104. DOI: 10.1144/GSL.SP.1967.002.01.10
Hart, M. B., Feist, S. E., Prince, G. D., Leng, M. J., 2004. Reappraisal of the K-T boundary succession at Stevns Klint, Denmark. Journal of the Geological Society, London 161, 885-892.
Hart M. B., Yancey, T. E., Leighton, A. D., Miller, B., Liu, C., Smart, C., Twitchett, R. J., 2012. The Cretaceous-Paleogene Boundary on the Brazos River, Texas: New Stratigraphic Sections and Revised Interpretations. GCAGS Journal 1, 69 – 80.
Harvey, M. C., Brassell, S. C., Belcher, C. M., Montanari, A., 2008. Combustion of fossil organic matter at the Cretaceous-Paleogene (K-P) boundary. Geology 36, 355.
Hay, W. H., 2008. Evolving ideas about the Cretaceous climate and ocean circulation. Cretaceous Research 29, 725-753.
Heilmann-Clausen, C., 1985. Dinoflagellate stratigraphy of the uppermost Danian to Ypresian in the Viborg I borehole, central Jylland, Denmark. Danmarks Geologiske Undersøgelse, Serie A, no.7, 1-69, pl.1-15.
Heymann D., Yancey, T. E., Wolbach, W. S., Thiemens, M. H., Johnson, E. A., Roach, D., Moecker, S., 1998. Geochemical markers of the Cretaceous – Tertiary boundary event at Brazos River, Texas, USA. Geochimica et Cosmochimica Acta 62 (1), 173 – 181.
Hildebrand, A. R., Penfield, G. T., Kring, D. A., Pilkington, M., Camargo Z., A., Jacobsen, S. B., Boynton, W. V., 1991. Chicxulub crater: A possible Cretaceous/Tertiary boundary impact crater on the Yucatán Peninsula, Mexico. Geology 19 (9), 867-871.
Hill, M.O., Gauch, H.G.J., 1980. Detrended correspondence analysis: an improved. Vegetatio 42, 47-58.Hobbs, P.V., Radke, L.F., 1992. Airborne Studies of the Smoke from the Kuwait Oil Fires. Science 256, 5059.

202
Hollis, C. J., Strong, C. P., 2003. Biostratigraphic review of the Cretaceous/Tertiary boundary transition, mid-Waipara River section, North Canterbury, New Zealand. New Zealand Journal of Geology and Geophysics 46 (2), 243-253.
Hollis, C. J., Strong, C. P., Rodgers, K. A., Rogers, K. M., 2003. Paleoenvironmental changes across the Cretaceous/Tertiary boundary at Flaxbourne River and Woodside Creek, eastern Marlborough, New Zealand. New Zealand Journal of Geology & Geophysics 46, 177-197.
Hollis, C. J., Handley, L., Crouch, E. M., Morgans, H. E. G., Baker, J. A., Creech, J., Collins, K. S., Gibbs, S. J., Huber, M., Schouten, S., Zachos, J. C., Pancost, R. D., 2009. Tropical sea temperatures in the high-latitude South Pacific during the Eocene. Geology 37, 99 – 102.
Hollis, C. J., Taylor, K. W. R., Handley, L., Pancost, R. D., Huber, M., Creech, J. B., Hines, B. R., Crouch, E. M., Morgans, H. E. G., Crampton, S. G., Pearson, P. N., Zachos, J. C., 2012. Early Paleogene temperature history of the Southwest Pacific Ocean: Reconciling proxies and models. Earth and Planetary Science Letters 349-350, 53 – 66. http://dx.doi.org/10.1016/j.epsl.2012.06.024
Hopmans E. C., Weijers, J. W. H., Schefuss, E., Herfort, L., Sinninghe Damsté, J. S., Schouten, S., 2004. A novel proxy for terrestrial organic matter in sediments based on branched and isoprenoid tetraether lipids: Earth and Planetary Science Letters 224, 107-116.
Houben, A. J. P., Bijl, P. K., Guerstein, G. R., Sluijs, A., Brinkhuis, H., 2001. Malivnia escutiana, a new biostratigraphically important Oligocene dinoflagellate cyst from the Southern Ocean. Review of Palaeobotany and Palynology 165, 175-182.
Huber, B. T., Hodell, D. A., Hamilton, C. P., 1995. Middle-Late Cretaceous climate of the southern high latitudes: Stable isotopic evidence for minimal equator-to-pole thermal gradients. Geological Society of America Bulletin 107, 1164-1191.
Huber, M., and Sloan, L.C., 2001. Heat transport, deep waters, and thermal gradients: Coupled simulation of an Eocene “greenhouse” climate. Geophysical Research Letters 28, 3481 – 3484.
Huber, B. T., MacLeod, K. G., Norris, R. D., 2002. Abrupt extinction and subsequent reworking of Cretaceous foraminifera across the Cretaceous-Tertiary boundary: Evidence from the subtropical North Atlantic, in Koeberl, C, and MacLeod, K.G., eds., Catastrophic Events and Mass Extinctions: Impacts and Beyond: Boulder, Colorado, Geological Society of America Special Paper 356, 277-289.
Huguet, C., Hopmans, E. C., Febo-Ayala, W., Thompson, D. H., Sinninghe Damsté, J. S., Schouten, S., 2006. An improved method to determine the absolute abundance of glycerol dibiphytanyl glycerol tetraether lipids. Organic Geochemistry 37 (9), 1036 – 1041.
Huguet, C., Schimmelmann, A., Thunell, R., Lourens, L. J., Sinninghe Damsté, J. S., Schouten, S., 2007. A study of the TEX86 paleothermometer in the water column and sediments of the Santa Barbara Basin, California: Paleoceanography 22, PA3203. DOI: 10.1029/2006PA001310
Hull, P. M., Norris, R. D., Bralower, T. J., Schueth, J. D., 2011. A role for chance in marine recovery from the end-Cretaceous extinction. Nature Geoscience 4, 856-860. DOI: 10.1038/NGEO1302
Hultberg, S. U., 1986. Danian dinoflagellate zonation, the C – T boundary and the stratigraphical position of the fish clay in southern Scandinavia. Journal of Micropaleontology 5, 37 – 47.
Hultberg, S. U., 1987. Palynological evidence for a diachronous low-salinity event in the C-T boundary clay at Stevns Klint, Denmark. Journal of Micropalaeontology 6, 35-40.
Hultberg, S. U., Malmgren B. A., 1987. Quantitative biostratigraphy based on Late Maastrichtian dinoflagellates and planktonic foraminifera from Southern Scandinavia. Cretaceous Research 8, 211-228.
Hunter, S. J., Haywood, A. M., Valdes, P. J., Francis, J. E., Pound, M. J., 2013. Modelling equable climates of the Late Cretaceous: Can new boundary conditions resolve data-model discrepancies?. Palaeogeography, Palaeoclimatology, Palaeoecology 392, 41-51.

203
Jiang, H. J., Gartner, S., 1986. Calcareous nannofossil succession across the Cretaceous/Tertiary boundary in east/central Texas. Micropaleontology 32 (3), 232-255.
Jorissen, F. J., De Stigter, H. C., Widmark, J. G. V., 1995. A conceptual model explaining benthic foraminiferal microhabitats. Marine Micropaleontology, 22, 3 – 15.
Jorissen, F. J., Fontanier, C., and Thomas, E., 2007. Paleoceanographical proxies based on deep-sea benthic foraminiferal assemblage characteristics, in: Proxies in Late Cenozoic Paleoceanography: Pt. 2: Biological tracers and biomarkers, edited by C. Hillaire-Marcel and A. de Vernal, Elsevier, p. 263-326.
Karoui-Yaakoub, N., Zaghbib-Turki, D., Keller, G., 2002. The Cretaceous-Tertiary (K-T) mass extinction in planktic foraminifera at Elles I and El Melah, Tunisia. Palaeogeography, Palaeoclimatology, Palaeoecology 178, 233-255.
Keller, G., 1988a. Biotic turnover in benthic foraminifera across the Cretaceous/Tertiary boundary at El Kef, Tunisia. Palaeogeography, Palaeoclimatology, Palaeoecology 66, 153-182.
Keller, G., 1988b. Extinction, survivorship and evolution of planktic foraminifera across the Cretaceous/Tertiary boundary at El Kef, Tunisia. Marine Micropaleontology 13, 239-263.
Keller, G., 1989. Extended Cretaceous/Tertiary boundary extinctions and delayed population change in planktonic foraminifers from Brazos River, Texas. Paleoceanography 4 (3), 287 – 332.
Keller, G., 1992. Paleoecologic response of Tethyan benthic foraminifera to the Cretaceous-Tertiary boundary transition. In: Takayanagi, Y., Saito, T. (Eds.), Studies in Benthic Foraminifera. Tokai University Press, Tokyo, 77-91.
Keller, G., Li, L., MacLeod, N., 1995. The Cretaceous/Tertiary boundary stratotype section at El Kef, Tunisia: how catastrophic was the mass extinction?. Palaeogeography, Palaeoclimatology, Palaeoecology 119, 221-254.
Keller, G., 2004. Low-Diversity, Late Maastrichtian and Early Danian Planktic Foraminiferal Assemblages of the Eastern Tethys. Journal of Foraminiferal Research 34 (1), 49-73.
Keller, G., Adatte, T., Tantawy, A. A., Berner, Z., Stinnesbeck, W., Stueben, D., Leanza, H. A., 2007. High stress late Maastrichtian – early Danian palaeoenvironment in the Neuquén Basin, Argentina. Cretaceous Research 28, 939-960.
Keller, G., Abramovich, S., 2009, Lilliput effect in late Maastrichtian planktic foraminifera: Response to environmental stress. Palaeogeography, Palaeoclimatology, Palaeoecology 284, 47-62.
Keller, G., Bhowmick, P. K., Upadhyay, H., Dave, A., Reddy, A. N., Jaiprakash, B. C., Adatte, T., 2011. Deccan Volcanism Linked to the Cretaceous-Tertiary Boundary Mass Extinction: New Evidence from ONGC Wells in the Krishna-Godavari Basin. Journal Geolologcial Society of India 78, 399-428.
Keller, G,. Adette, T., Bhowmick, P. K., Upadhyay, H., Dave. A., Reddy, A. N., Jaiprakash, B. C., 2012. Nature and timing of extinctions in Cretaceous-Tertiary planktic foraminirefa preserved in Deccan intertappean sediments of the Krishna-Godavari Basin, India, Earth and Plenetary Science Letters 341-344, 211-221.
Kellough, G. R., 1965. Paleoecology of the Foraminiferida of the Wills Point Formation (Midway Group) in northeast Texas. Trans. Gulf Coast Assoc. Geol. Soc. 15, 73-153.
Kennedy, W. J., Landman, N. H., Christensen, W. K., Cobban, W. A., Hancock, J. M., 1998. Marine connections in North America during the late Maastrichtian: paleogeographic significance of Jeletzkytes nebrascensis Zone cephalopod fauna from the Elk Butte Member of the Pierre Shale, SE Dakota and NE Nebraska. Cretaceous Research 19 (6), 745 – 775.
Kim, J. H., Schouten, S., Hopmans, E. C., Donner, B, Sinninghe Damsté, J. S., 2008. Global sediment core-top calibration of the TEX86 paleothermometer in the ocean. Geochimica et Cosmochimica Acta 72 (4), 1154 – 1173.
Kim J. H., van der Meer, J., Schouten, S., Helmke, P., Willmott, V., Sangiorgi, F., Koç, N., Hopmans, E. C., Sinninghe Damsté, J. S., 2010. New indices and calibrations derived from the distribution of crenarchaeal isoprenoid tetraether lipids: Implications for past sea surface temperature reconstructions: Geochimica et Cosmochimica Acta 74, 4639-4654.

204
Kominz, M. A., Browning, J. V., Miller, K. G., Sugerman, P. J., Mizintseva, S., Scotese, C. R., 2008. Late Cretaceous to Miocene sea-level estimates from the New Jersey and Delaware coastal plain coreholes: an error analysis. Basin Research 20, 211-226. DOI: 10.1111/j.1365-2117.2008.00354.x
Kring, D. A., Durda, D. D., 2002. Trajectories and distribution of material ejected from the Chicxulub impact crater: Implications for postimpact wildfires. Journal of Geophysical Research-Planets 107 (8), 5062.
Kring, D.A., 2007. The chicxulub impact event and its environmental consequences at the Cretaceous – Tertiary boundary. Palaeogeography, Palaeoclimatology, Palaeoecology 255 (1-2), 4-21.
Kucera, M., Malmgren, B.A., 1998. Terminal Cretaceous warming event in the mid-latitude South Atlantic Ocean: evidence from poleward migration of Contusotruncana contuse (planktonic foraminifera) morphotypes: Palaeogeography, Palaeoclimatology, Palaeoecology 138, 1-15.
Kump, L.R., 1991. Interpreting carbon-isotope excursions: Strangelove oceans. Geology 19, 299-302.Lamolda, M. A., Melinte, M. C., Kaiho, K., 2005. Nannofloral extinction and survivorship across the K/T boundary at
Caravaca, southeastern Spain. Palaeogeography, Palaeoclimatology, Palaeoecology 224, 27-52.Landman, N. H., Johnson, R. O., Edwards, L. E., 2004. Cephalopods from the Cretaceous-Tertiary boundary interval
on the Atlantic coastal plain, with a description of the highest ammonite zones in North Amercia. Part 2. Northeastern Monmouth County, New Jersey. Bulletin of the American Museum of Natural History 287, 1-107. DOI: 10.1206/0003-0090(2004)287<0001:CFTTBI>2.0.CO;2
Lengger, S. K., Kraaij, M., Tjallingii, R., Baas, M., Stuut, J. B., Hopmans, E. C., Sinninghe Damste, J. S., Schouten, S., 2013. Differential degradation of intact polar and core glycerol dialkyl glycerol tetraether lipids upon post-depositional oxidation. Organic Geochemistry 65, 83 – 93.
Li, L., Keller, G., 1998. Maastrichtian climate, productivity and faunal turnovers in planktic foraminifera in South Atlantic DSDP sites 525A and 21. Marine Micropaleontology 33, 55-86.
Li, L., Keller, G., 1999. Variability in Late Cretaceous climate and deep waters: evidence from stable isotopes. Marine Geology 161, 171-190.
Littler, K., Robinson, S. A., Bown, P. R., Nederbragt, A. J., Pancost, R. D., 2011. High sea surface temperatures during the Early Cretaceous Epoch. Nature Geoscience 4, 169 – 172.
Liu, Z., Pagani, M., Zinniker, D., DeConto, R., Huber, M., Brinkhuis, H., Shah, S. R., Leckie, M., Pearson, A., 2009. Global cooling during the Eocene – Oligocene climate transition. Science 323, 1187 – 1190.
Lottaroli, F., Catrullo, D., 2000. The calcareous nannofossil biostratigraphic framework of the Late Maastrichtian – Danian North Sea chalk. Marine Micropaleontology 39, 239 – 263.
Lopes dos Santos, R., Prange, M., Castañeda, I.S., Schefuß, E., Mulitza, S., Schulz, M., Niedermeyer, E.M., Sinninghe Damsté, J.S., Schouten, S., 2010. Glacial – interglacial variability in Atlantic meridional overturning circulation and thermocline adjustments in the tropical North Atlantic. Earth and Planetary Science Letters 300, 407 – 414.
Luder, T., Benz, W., and Stocker, T.F., 2002. Modeling long-term climatic effects of impacts: First results, in Koeberl, C., and MacLeod, K.G., eds., Catastrophic Events and Mass Extinctions: Impacts and Beyond: Boulder, Colorado, Geological Society of America Special Paper 356, 717 – 729.
Mackinnon, I.D.R., Gooding, J.L., McKay, D.S. and Clanton, U.S., 1984. The E1 Chichón stratospheric cloud: solid particulates and settling rates, in: J.F. Luhr and J.C. Varekamp (Editors), E1 Chichón Volcano, Chiapas, Mexico. Journal of Volcanology and Geothermal Research 23, 125-146.
MacLeod, N., Keller, G., 1991. Hiatus distributions and mass extinctions at the Cretaceous/Tertiary boundary. Geology 19, 487-501.
Magaritz, M., Benjamini, C., Keller, G., Moshkovitz, S., 1992. Early diagenetic isotopic signal at the Cretaceous Tertiary boundary, Israel. Palaeogeography, Palaeoclimatology, Palaeoecology 91 (3-4), 291-304.
Manger, G. E., 1963. Porosity and Bulk Density of Sedimentary Rocks: Contributions to Geochemistry. USGS Bulletin 1144-E, 1963, 55 pp.

205
Meisel T., Moser J., 2004. Reference materials for geochemical PGE analysis: new analytical data for Ru, Rh, Pd, Os, Ir, Pt and Re by isotope dilution ICP-MS in 11 geological reference materials. Chemical Geology 208, 319 – 338.
Ménot-Combes, G., Bard, E., Rostek, F., Weijers, J. W. H., Hopmans, E.C., Schouten, S., Sinninghe Damsté, J.S., 2006. Early reactivation of European rivers during the last deglaciation. Science 313, 1623 – 1625.
Miller, K. G., Sugarman, P. J., Browning, J. V., Olsson, R. K., Pekar, S. F., Reilly, T. J., Cramer, B. S., Aubry, M. P., Lawrence, R. P., Curran, J., Stewart, M., Metzger, J. M., Uptegrove, J., Bukry, D., Burckle, L. H., Wright, J. D., Feigenson, M. D., Brenner, G. J., Dalton, R. F., 1998. Bass River Site. Proceedings of the Ocean Drilling Program, Initial Reports, Vol. 174AX 5
Miller, K. G., Wright, J. D., Browning, J. V., 2005. Visions of ice sheets in a greenhouse world. Marine Geology 217, 215-231. DOI: 10.1016/j.margeo.2005.02.007
Miller, K. G., Sherrell, R. M., Browning, J. V., Field, M. P., Gallagher, W., Olsson, R. K., Sugarman, P. J., Tuorto, S., Wahyudi, H., 2010. Relationship between mass extinction and iridium across the Cretaceous-Paleogene boundary in New Jersey. Geology 38 (10), 867-870.
Mizukami, T., Kaiho, K., Oba, M., 2013. Significant changes in land vegetation and oceanic redox across the Cretaceous/Paleogene boundary. Palaeogeography, Palaeoclimatology, Palaeoecology 369, 41-47.
Mohamed, O., Piller, W. E., Egger, H., 2012. The dinocyst record across the Cretaceous/Paleogene boundary of a bathyal mid-latitude Tethyan setting: Gosau Group, Gams Basin, Austria. Cretaceous Research 35, 143-168.
Molina, E., Arenillas, I., Arz, J.A., 1996. The Cretaceous/Tertiary boundary mass extinction in planktic foraminifera at Agost, Spain. Review of Micropaleontology 39, 225-243.
Molina, E., Alegret, L., Arenillas, I., Arz., J., 2006. The Global Boundary Stratotype Section and Point for the base of the Danian Stage (Paleocene, Paleogene,“ Tertiary”, Cenozoic) at El Kef, Tunisia-Original definition and revision. Episodes 29 (4), 263 – 273.
Moskovitz, S., Habib, D., 1993. Calcareous nannofossil and dinoflagellate stratigraphy of the Cretaceous-Tertiary boundary, Alabama and Georgia. Micropaleontology 39 (2), 167-191.
Müller, R. D., Sdrolias, M., Gaina, C., Steinberger, B., Heine, C., 2008. Long-Term Sea-Level Fluctuations Driven by Ocean Basin Dynamics. Science 319, 1357, DOI: 10.1126/science.1151540
Newell, N. D., 1963. Crises in the history of life. Scientific American 208, 76-92.Ocakoglu, F., Yilmaz, İ. Ö., Demircanö H., Altıner, Ö. S., Hakyemez, A., İslamoğlu, Y., Tekin, U.K., Önoğlu, N.,
Yıldız, Aç, Uchman, A., Szulc, A., Açıkalın, S., 2007. Orta Sakarya Bölgesi Geç Kretase-Paleojen Çökellerinin Sekans Stratigrafisi, The Scientific and Technological Research Council of Turkey (TUBİTAK, Project no:104Y153), Final Report, 450pp.
Ocakoğlu, F., Yılmaz, İ. Ö., Açıkalın S., 2009. Orta Sakarya Bölgesi, Kretase – Tersiyer istifinin kaynak bölge ve paleoiklimsel açılardan incelenmesi, ESOGÜ – Bilimsel Araştırma Projeleri, 200715024 no’lu proje Final Raporu.
Olsson, R. K., 1987. Cretaceous stratigraphy of the Atlantic Coastal Plain, Atlantic Highlands of New Jersey. Geological Society of America Centennial Field Guide-Northeastern Section: 87 – 90.
Olsson, R. K., Miller, K. G., Browning, J. V., Habib, D., Sugerman, P. J., 1997. Ejecta layer at the Cretaceous-Tertiary boundary, Bass River, New Jersey (Ocean Drilling Program Leg 174AX). Geology 25, 759-762.
Olsson R. K, Hemleben C, Berggren W. A., Huber B. T., Editors and Members of the Paleogene Planktonic Foraminifera Working Group, 1999. Atlas of Paleocene Planktonic Foraminifera. Smithsonian Contributions to Paleobiology 85, pp. 255.
Olsson, R. K., Wright, J.D., Miller, K. G., 2001. Paleobiogeography of Pseudotextularia elegans during the latest Maastrichtian global warming event. Journal of Foraminiferal Research 31 (3), 275-282.
Olsson, R. K., Miller, K. G., Browning, J. V., Wright, J. D., Cramer, B. S., 2002. Sequence stratigraphy and sea-level change across the Cretaceous-Tertiary boundary on the New Jersey passive margin, in Koeberl, C., and MacLeod,

206
K. G., eds., Catastrophic Events and Mass Extinctions: Impacts and Beyond: Boulder, Colorado, Geological Society of America Special Paper 356, 97-108.
Oman, L., Robock, A., Stenchikov, G. L., Thordarson, T., Koch, D., Shindell, D. T., Gao C., 2006. Modeling the distribution of the volcanic aerosol cloud from the 1783 – 1784 Laki eruption. Journal of Geophysical Research 111, D12209. DOI: 10.1029/2005JD006899
Papu, O. H., Pramparo, M. B. Nañez, C., Concheyro, A., 1999. Palinología y micropaleontología de la Formacíon Jaguël (Maastrichtiano-Daniano), perfil Opazo, cuenca Neuquina, Argentina. Simposio Paleógeno de América del Sur. Actas Servicio Geológico Minero Argentino, Anales 33, 17-31.
Pardo, A., Ortiz, N., Keller, G., 1996. Latest Maastrichtian foraminiferal turnover and its environmental implications at Agost, Spain, in MacLeod, N. and Keller, G. (eds.), Cretaceous/Tertiary boundary mass extinction: biotic and environmental changes, 139 – 172 (W.W. Norton & Co., New York).
Pardo, A., Adatte, T., Keller, G., Oberhänsli, H. 1999. Paleoenvironmental changes across the Cretaceous – Tertiary boundary at Koshak, Kazakhstan, based on planktic foraminifera and clay mineralogy. Palaeogeography, Palaeoclimatology, Palaeoecology 154 (3), 247 – 273.
Parrish, J. T., Curtis, R., 1982. Atmospheric circulation, upwelling, and organic-rich rocks in the Mesozoic and Cenozoic eras. Palaeogeography, Palaeoclimatology, Palaeoecology 40, 31-66.
Pearson, P. N., Ditchfield, P. W., Singano, J., Harcourt-Brown, K. G., Nicholas, C. J., Olsson, R. K., Shackleton, N. J., Hall, M. A., 2001. Warm tropical sea surface temperatures in the Late Cretaceous and Eocene epochs. Nature 413, 481-487.
Perch-Nielsen, K., 1981. New Maastrichtian and Paleocene calcareous nannofossils from Africa, Denmark, the USA and the Atlantic, and some Paleocene lineages. Eclogae Geologicae Helvetiae 73, 831 – 863.
Peryt, D., Alegret, L., Molina, E., 2002. The Cretaceous/Palaeogene (K/P) boundary at Aïn Settara, Tunisia: restructuring of benthic foraminiferal assemblages. Terra Nova 14 (2), 101 – 107.
Phillips, J., 1860. Life on the Earth: Its Origin and Succession, first ed. Cambridge, United Kingdom.Pierazzo, E., Kring, D. A.. Melosh, H. J., 1998. Hydrocode simulation of the Chicxulub impact event and the
production of climatically active gases. Journal of Geophysical Research-Planets 103, 28607.Pierazzo, E., Hahmann, A.N., Sloan, L.C., 2003. Chicxulub and Climate: Radiative Pertubations of Impact-Produced
S-Bearing Gases. Astrobiology 3, 99-118.Pope, K. O., Baines, K. H., Ocampo, A. C., Ivanov, B. A., 1994. Impact winter and the Cretaceous/Tertiary
extinctions: results of a Chicxulub asteroid impact model. Earth Planetary Science Letters 128, 719-725.Pope, K. O., Baines, K. H., Ocampo, A. C., Ivanov, B. A, 1997. Energy, volatile production, and climate effects of the
Chicxulub Cretaceous/Tertiary impact. Journal of Geophysical Research 102, E9, 21,645-21,664.Prámparo, M., Papú, O. H., 2006. Late Maastrichtian dinoflagellate cysts from the Cerro Butaló section, southern
Mendoza province, Argentina. Journal of Micropaleontology 25, 23 – 33.Premoli Silva I., Verga D., 2004. Practical Manual of Cretaceous Planktonic Foraminifera. International School
on Planktonic Foraminifera. 3 Course: Cretaceous. Verga & Rettori eds Universities of Perugia and Milan, Tipografia Pontefelcino, Perugia (Italy), 283 p.
Pross, J., Brinkhuis, H., 2005. Organic-walled dinoflagellates cysts as paleoenvironmental indicators in the Paleogene; a synopsis of concepts. Paläontologische Zeitschrift 79 (1), 53-59.
Raup, D., Sepkoski, J., 1982. Mass extinctions in the marine fossil record. Science 215 (4539), 1501 – 1503. doi:10.1126/science.215.4539.1501
Rasmussen, J.A., Heinberg, C., Håkansson, E., 2005. Planktonic foraminifers, biostratigraphy and the diachronous nature of the lowermost Danian Cerithium Limestone at Stevns Klint, Denmark. Bulletin of the Geological Society of Denmark 52, 113 – 131.
Ravizza, G., Pyle, D., 1997. PGE and Os isotopic analyses of single sample aliquots with NiS fire assay preconcentration. Chemical Geology 141, 251 – 268.

207
Ravizza, G., Peucker-Ehrenbrink, B., 2003. Chemostratigraphic Evidence of Deccan Volcanism from the Marine Osmium Isotope Record: Science 302 (5649), 1392-1395.
Robaszynski, F., and Caron, M., 1995. Foraminifères planctoniques du Crétacé: commentaire de la zonation Europe-Méditerranée. Bull. Soc. Geol. Fr., 166. 681-692.
Robertson, D. S., McKenna, M. C., Toon, O. B., Hope, S. Lillegraven, J. A., 2004. Survival in the first hours of the Cenozoic. Geological Society of America Bulletin 116 (5-6), 760-768.
Robin, E., Boclet, D., Bonté, P., Froget, L., Jéhanno, C., Rocchia, R., 1991. The stratigraphic distribution of Ni-rich spinels in Cretaceous-Tertiary boundary rocks at E1 Kef (Tunisia), Caravaca (Spain) and Hole 761C (Leg 122). Earth and Planetary Science Letters 107, 715-721.
Robock, A., Oman, L., Stenchikov, G. L., 2007. Nuclear winter revisited with a modern climate model and current nuclear arsenals: Still catastrophic consequences. Journal of Geophysical Research 112, D13107. DOI: 10.1029/2006JD008235.
Rocchia, R., Robin, E., Froget, L., Gayraud, J., 1996. Stratigraphic distribution of extraterrestrial markers at the Cretaceous-Tertiary boundary in the Gulf of Mexico area: implications for the temporal complexity of the event. Geological Society of America Special Papers 307, 279-286.
Rohde, R. A., Muller, R. A., 2005. Cycles in fossil diversity. Nature 434 (7030), 209 – 210. doi:10.1038/nature03339Romein A.J.T., Smit, J., 1981. The Cretaceous-Tertiary boundary: calcareous nannofossils and stable isotopes. Proc
Koninklijke Nederlandse Akademie van Wetenschappen 84, 295-314.Saner, S., 1980. Mudurnu-Göynük Havzasının Jura ve Sonrası çökelim nitelikleriyle paleocoğrafya yorumlaması. TJK
Bülteni 23 (1), 39-52.Scasso, R. A., Concheyro, A., Kiessling, W., Aberhan, M., Hecht, L., Medina, F. A., Tagle, R., 2005. A tsunami
deposit at the Cretaceous/Paleogene boundary in the Neuquén Basin of Argentina. Cretaceous Research 26, 283-297.
Schiøler, P., Wilson, G.J., 1993. Maastrichtian dinoflagellate zonation in the Dan Field, Danish North Sea. Review of Palaeobotany and Palynology 78, 321-351.
Schioler, P., Brinkhuis, H., Roncaglia, L., Wilson, G. J., 1997. Dinoflagellate biostratigraphy and sequence stratigraphy of the Type Maastrichtian (Upper Cretaceous), ENCI Quarry, The Netherlands. Marine Micropaleontology 31, 65-95.
Schmitz, B., Keller, G., Stenvall, O., 1992. Stable isotope and foraminiferal changes across the Cretaceous-Tertiary boundary at Stevns Klint, Denmark: Arguments for long-term oceanic instability before and after bolide-impact event. Palaeogeography, Palaeoclimatology, Palaeoecology 96, 233-260.
Schouten, S., Hopmans, E.C., Schefuß, E. and Sinninghe Damsté, J.S., 2002. Distributional variations in marine crenarchaeotal membrane lipids: a new tool for reconstructing ancient sea water temperatures?. Earth and Planetary Science Letters 204, 265-274.
Schouten, S., Hopmans, E. C., Forster, A., van Breugel, Y., Kuypers, M. M. M., Sinninghe Damsté, J. S., 2003. Extremely high sea-surface temperatures at low latitudes during the middle Cretaceous as revealed by archaeal membrane lipids. Geology 31 (12), 1069-1072.
Schouten, S., Huguet, C., Hopmans, E. C., Keinhuis, M., V., M., Sinninghe Damsté, J. S., 2007. Analytical Methodology for TEX86 Paleothermometry by High-Performance Liquid Chromatography/Atmospheric Pressure Chemical Ionization-Mass Spectrometry. Analytical Chemistry 79 (7), 2940-2944.
Schouten, S., Hopmans, E. C., Sinninghe Damsté, J. S., 2013. The organic geochemistry of glycerol dialkyl glycerol tetraether lipids: A review. Organic Geochemistry 54, 19-61.
Schulte, P., Speijer, R., Mai, H., Kontny, A., 2006. The Cretaceous-Paleogene (K-P) boundary at Brazos, Texas: Sequence stratigraphy, depositional events and the Chicxulub impact. Sedimentary Geology 184, 77-109.
Schulte, P., Speijer, R.P., 2009. Late Maastrichtian-Early Paleocene sea level and climate changes in the Antioch Church Core (Alabama, Gulf of Mexico margin, USA): A multi-proxy approach. Geologica Acta 7 (1-2), 11-34.

208
Schulte, P., Alegret, L., Arenillas, I., Arz, J.A., Barton, P.J., Brown, P.R., Bralower, T.J., Christeson, G.L., Claeys, P., Cockell, C.S., Collins, G.S., Deutsch, A., Goldin, T.J., Goto, K., Grajales-Nishimura, J.M., Grieve, R.A.F., Gulick, S.P.S., Johnson, K.R., Kiessling, W., Koeberl, C., Kring, D.A., Macleod, K.G., Matsui, T., Melosh, J., Montanari, A., Morgan, J.V., Neal, C.R., Nichols, D.J., Norris, R.D., Pierazo, E., Ravizza, G., Rebolledo-Vieyra, M., Reimond, W.U., Robin, E., Salge, T., Speijer, R.P., Sweet, A.R., Urrutia-Fucugauchi, J., Vajda, V., Whalen, M.T., Willumsen, P.S., 2010. The chicxulub asteroid impact and mass extinction at the Cretaceous-Paleogene boundary. Science 327, 1214-1218.
Scotese, C. R., 2004. A continental drift flipbook. The Journal of Geology 112 (6), 729-741.Scotese, C.R., Dreher, C., 2012. GlobalGeology, http:/www.GlobalGeology.comŞeker, H., Kesgin, Y., 1991. Nallıhan-Mudurnu-Seben-Beypazarı arasında kalan bölgenin jeolojisi ve petrol olanakları.
TPAO Arama Grubu Bşk.Rapor No: 2907, 42p.Seki, O., Sakamoto, T., Sakai, S., Schouten, S., Hopmans, E. C., Sinninghe Damsté, J. S., Pancost, R. D., 2009.
Large changes in seasonal sea ice distribution and productivity in the Sea of Okhotsk during the deglaciations. Geochemistry Geophysics Geosystems 10, Q10007. http://dx.doi.org/10.1029/2009GC002613.
Şengör, A.M.C.,Yılmaz, Y., 1981, Tethyan evolution of Turkey: A plate tectonic approach. Tectonophysics, 75, 181-241.
Sepkoski, J. J., 1996. Patterns of Phanerozoic extinction: a perspective from global data bases, in O.H. Walliser. Global Events and Event Stratigraphy. Berlin: Springer. p. 35 – 5.
Siggurdsson, H., D’Hondt, S., Carey, S., 1992. The impact of the Cretaceous/Tertiary bolide on evaportie terrane and generation of major sulfuric acid aerosol. Earth and Planetary Science Letters 109, 543-559.
Sinninghe Damsté, J.S., Ossebaar, J., Abbas, B., Schouten, S., Verschuren, D., 2009. Fluxes and distribution of tetraether lipids in an equatorial African lake: constraints on the application of the TEX86 palaeothermometer and branched tetraether lipids in lacustrine settings. Geochimica et Cosmochimica Acta 73, 4232 – 4249.
Slimani, H., Louwye, S., Toufiq, A., 2010. Dinoflagellate cysts from the Cretaceous-Paleogene boundary at Ouled Haddou, southeastern Rif, Morocco: biostratigraphy, paleoenvironments and paleobiogeography: Palynology 34 (1), 90-124.
Slimani, H., Louwye, S., Dusar, M., Lagrou, D., 2011. Connecting the Chalk Group of the Campine Basin to the dinoflagellate cyst biostratigraphy of the Campanian to Danian in borehole Meer (northern Belgium): Netherlands Journal of Geosciences 90 (2/3), 129-164.
Sluijs, A., Pross, J., Brinkhuis, H., 2005. From greenhouse to icehouse; organic-walled dinoflagellate cysts as paleoenvironmental indicators in the Paleogene. Earth-Science Reviews 68, 281-315.
Sluijs, A., Brinkhuis, H., Schouten, S., Bohaty, S. M., John, C. M., Zachos, J. C., Reichart, G. J., Sinninghe-Damsté, J. S., Crouch, E. M., Dickens, G. R., 2007. Environmental precursors to rapid light carbon injection at the Palaeocene/Eocene boundary. Nature 450, 1218-1221.
Sluijs, A., Röhl, U., Schouten, S., Brumsack, H.J., Sangiorgi, F., Sinninghe Damsté, J.S., Brinkhuis, H., 2008a. Arctic late Paleocene-early Eocene paleoenvironments with special emphasis on the Paleocene-Eocene thermal maximum (Lomonosov Ridge, Integrated Ocean Drilling Program Expedition 302). Paleoceanography 23, PA1S11. DOI: 10.1029/2007PA001495
Sluijs, A., Brinkhuis, H., Crouch, E. M., John, C. M., Handley, L., Munsterman, D., Bohaty, S., Zachos, J. C., Reichart, G. J., Schouten, S., Pancost, R. D., Sinninghe Damsté, J. S., Welters, N. L. D., Lotter, A. F., Dickens, G. R., 2008b. Eustatic variations during the Paleocene-Eocene greenhouse world. Paleoceanography 23, PA4216. DOI: 10.1029/2008PA001615.
Sluijs, A., Brinkhuis, H., 2009. A dynamic climate and ecosystem state during the Paleocene-Eocene Thermal Maximum: inferences from dinoflagellate cyst assemblages on the New Jersey Shelf. Biogeosciences 6 (8), 1755-1781.

209
Smit, J., 1977. Discovery of a planktonic foraminiferal association between the Abathomphalus mayaroensis zone and the “Globigerina” eugubina zone at the Cretaceous/Tertiary boundary in the Barranco del Gredero (Caravaca, SE Spain): a preliminary report. Proc. Koninklijke Nederlandse Akademie van Wetenschappen 80, 280-301.
Smit, J., Hertogen, J., 1980. An extraterrestrial event at the Cretaceous-Tertiary boundary. Nature 285, 198-200.Smit, J., 1982. Extinction and evolution of planktonic foraminifera after a major impact at the Cretaceous/Tertiary
boundary. Geological Society of America Special Papers 190, 329 – 352.Smit, J., Romein, A. J. T., 1985. A sequence of events across the Cretaceous-Tertiary boundary. Earth and Planetary
Science Letters 74, 155-170.Smit, J., 1990. Meteorite impact, extinctions and the Cretaceous-Tertiary Boundary. Geologie en Mijnbouw 69, 187-
204.Smit, J., Brinkhuis, H., 1996. The Geulhemmerberg Cretaceous/Tertiary boundary section (Maastrichtian type area,
SE Netherlands); summary of results and a scenario of events. Geologie en Mijnbouw 75, 283-293.Smit, J., Roep, T. B., Alvarez, W., Montenari, A., Claeys, P., Grajales-Nishimura, J. M., Bermudez, J., 1996. Coarse-
grained, clastic sandstone complex at the K/T boundary around the Gulf of Mexico: Deposition by tsunami waves induced by the Chicxulub impact?. Geological Society of America Special Papers 307, 151-182. DOI: 10.1130/0-8137-2307-8.151
Smit, J., 1999. The Global Stratigraphy of the Cretaceous-Tertiary Boundary Impact Ejecta. Annual Review of Earth and Planetary Science 27, 75 – 113.
Speijer, R. P., Van Der Zwaan, G. J., 1996. Extinction and survivorship of southern Tethyan benthic foraminifera across the Cretaceous/Paleogene boundary. in Hart, M. B. (ed) Biotic recovery from mass extinction events, Geological Society, London, Special Publication 102, 343 – 371.
Stchepinsky, V., 1940. Göynük-Mudurlu-Nallıhan mıntıkası cevher zenginlikleri hakkında rapor. MTA Enstitüsü Raporu,Derleme No: 1058.
Stenestad, E., 1976. Københavnsområdets geologi især baseret på citybaneundersøgelserne. Geological Survey of Denmark, 3 Række 45, 1 – 149.
Stéphan, J. F., Mercier de Lepinay, B., Calais, E., Tardy, M., Beck, C., Carfantan, J. C., Olivet, J. L., Vila, J. M., Bouysse, P., Mauffret, A., Bourgois, I., Thery, I. M., Tournon, J., Blanchet, R., Dercourt, J., 1990. Paleogeodynamic maps of the Caribbean: 14 steps from Lias to Present. Bulletin de la Societe Géologique de France 8 (6), 915-919.
Steuber, T., Rauch, M., Masse, J. P., Graaf, J., Malkoc, M., 2005. Low-latitude seasonality of Cretaceous temperatures in warm and cold episodes. Nature 437, 1341-1344.
Stüben, D., Kramar, U., Berner, Z., Stinnesbeck, W., Keller, G., Adatte, T., 2002. Trace elements, stable isotopes, and clay mineralogy of the Elles II K-T boundary section in Tunisia: indications for sea level fluctuations and primary productivity. Palaeogeography, Palaeoclimatology, Palaeoecology 178, 321-345.
Stüben, D., Kramar, U., Berner, Z.A., Meudt, M., Keller, G., Abramovich, S., Adatte, T., Hambach, U., Stinnesbeck, W., 2003. Late Maastrichtian paleoclimatic and paleoceanographic changes inferred from Sr/Ca ratio and stable isotopes. Palaeogeography, Palaeoclimatology, Palaeoecology 199, 107-127.
Surlyk, F., 1997. A cool-water carbonate ramp with bryozoan mounds: Late Cretaceous-Danian of the Danish Basin. Soc. Econ. Paleontol. Mineral., Spec. Publ. 56, 296 – 307.
Surlyk, F., Damholt, T., Bjerager, M., 2006. Stevns Klinkt, Denmark: Uppermost Maastrichtian chalk, Cretaceous-Tertriary boundary, and lower Danian bryozoan mound complex. Bulletin of the Geological Society of Denmark 54, 1-48.
Ten Kate, W. G. H. Z., Sprenger, A., 1993. Orbital cyclicities above and below the Cretaceous/Paleogene boundary at Zumaya (N Spain), Agost and Relleu (SE Spain). Sedimentary Geology 87, 69-101.
Ter Braak, C. J. F., Smilauer, P., 2002. CANOCO Reference Manual and User’s Guide to Canoco for Windows: Software for Canonical Community Ordination (version 4.5), Microcomputer Power, Ithaca, NY, USA.

210
Vandenberghe, N., Hilgen, F. J., Speijer, R. P., 2012. The Paleogene Period. in: The Geological Timescale 2012, Gradstein, F. M., Ogg, J. G., Schmitz, M. D., Ogg, G. M. (eds), Elsevier, 855 – 922. DOI: 10.1016/B978-0-444-59425-9.00028-7
Van Helmond, N. A. G. M., Sluijs, A., Reichart, G. J., Sinninghe-Damsté, J. S., Slomp, C. P., Brinkhuis, H., 2013. A perturbed hydrological cycle during Oceanic Anoxic Event 2. Geology 42, 123-126. DOI: 10.1130/G34929.1
Vellekoop, J., Sluijs, A., Smit, J., Schouten, S., Weijers, J.W.H., Sinninghe Damsté, J.S., Brinkhuis, H., 2014. Rapid short-term cooling following the Chicxulub impact at the Cretaceous-Paleogene boundary. Proceedings of the National Academy of Sciences of the United States of America 111 (21), 7537 – 7541. DOI: 10.1073/pnas.1319253111
Versteegh, G.J.M., 1994. Recognition of cyclic and non-cyclic environmental changes in the Mediterranean Pliocene. Marine Micropaleontology 23, 141 – 171.
Versteegh, G.J.M., Zonneveld, K.A.F., 1994. Determination of (palaeo-)ecological preferences of dinoflagellates by applying Detrended and Canonical Correspondence analysis to Late Pliocene dinoflagellate cyst assemblages of the south Italian Singa section. Review of Palaeobotany and Palynology 84, 181-199.
Vonhof, H. B., Smit, J., 1997. High-resolution late Maastrichtian-early Danian oceanic 87Sr/86Sr record: Implications for Cretaceous-Tertiary boundary events: Geology 25 (4), 347 – 350.
Wade, B. S., Houben, A. J. P., Quaijtaal, W., Schouten, S., Rosenthal, Y., Miller, K.G., Katz, M.E., Wright, J.D., Brinkhuis, H., 2012. Multiproxy record of abrupt sea surface temperature cooling across the Eocene – Oligocene transition in the Gulf of Mexico. Geology 40, 159 – 162.
Weijers, J. W. H., Schouten, S., Spaargaren, O. C., Sinninghe Damsté, J. S., 2006. Occurrence and distribution of tetraether membrane lipids in soils: Implications for the use of the TEX86 proxy and the BIT index. Organic Geochemistry 37, 1680-1693.
Weijers, J.W.H., Lima, K.H.L., Aquilina, A., Sinninghe Damsté, J.S., Pancost, R.D., 2011. Biogeochemical controls on glycerol dialkyl glycerol tetraether lipid distributions in sediments characterized by diffusive methane flux. Geochemistry Geophysics Geosystems 12, Q10010. http://dx.doi.org/10.1029/2011GC003724.
Westerhold, T., Röhl, U., Donner, B., McCarren, H. K., Zachos, J. C., 2011. A complete high-resolution Paleocene benthic stable isotope record for the central Pacific (ODP Site 1209). Paleoceanography 26, PA2216. DOI: 10.1029/2010PA002092.
Wilf, P., Johnson, K. R., Huber, B. T., 2003. Correlated Terrestrial and Marine Evidence for Global Climate Changes before Mass Extinction at the Cretaceous-Paleogene Boundary. Proceedings of the National Academy of Sciences of the United States of America 100 (2), 599-604.
Williams, G.L., Brinkhuis, H., Pearce, M.A., Fensome, R.A., Weegink, J.W., 2004. Southern Ocean and global dinoflagellate cyst events compared: index events for the Late Cretaceous – Neogene. In Exon, N.F., Kennett, J.P., and Malone, M.J. (Eds.), Proc. ODP, Sci. Results 189, 1 – 98. DOI: 10.2973/odp.proc.sr.189.107.2004
Willumsen PS. 2003. Marine palynology across the Cretaceous-Tertiary boundary in New Zealand [Ph.D. dissertation]. [Wellington (New Zealand)]: Victoria University of Wellington.
Willumsen, P. S., 2012. Three new species of dinoflagellate cyst from Cretaceous-Paleogene (K-Pg) boundary sections at mid-Waipara River and Fairfield Quarry, South Island, New Zealand. Palynology 36, 48-62.
Wuchter, C., Schouten, S., Coolen, M.J.L., Sinninghe Damsté, J.S., 2004. Temperature dependent variation in the distribution of tetraether membrane lipids of marine Crenarchaeota: implications for TEX86 paleothermometry. Paleoceanography 19, PA4028. http://dx.doi.org/10.1029/2004PA001041.
Wuchter, C., Schouten, S., Wakeham, S.G., Sinninghe Damsté, J.S., 2006. Archaeal tetraether membrane lipid fluxes in the northeastern Pacific and the Arabian Sea: implications for TEX86 paleothermometry. Paleoceanography 21, PA4208. http://dx.doi.org/10.1029/2006PA001279.
Yamamoto, M., Ficken, K., Baas, M., Bosch, H. J. de Leeuw, J. W., 1996. Molecular palaeontology of the earliest Danian at Geulhemmerberg (the Netherlands). Geologie en Mijnbouw 75, 255-267.

211
Yancey, T. E., 1996. Stratigraphy and depositional environments of the Cretaceous/Tertiary boundary complex and basal section, Brazos River, Texas. Gulf Coast Association of Geological Societies Transactions 46, 433 – 442.
Yılmaz, İ. Ö., 2008. Cretaceous pelagic red beds and black shales (Aptian – Santonian), NW Turkey: Global Oceanic Anoxic and Oxic Events. Turkish J. Earth Sci. 17, 263 – 296.
Yılmaz, İ. Ö., Altıner, D., Tekin, U. K., Tüysüz O., Ocakoğlu, F., Açıkalın S., 2010. Cenomanian – Turonian Oceanic Anoxic Event (OAE2) in the Sakarya Zone, Northwestern Turkey: Sedimentological, cyclostratigraphic and geochemical records. Cretaceous Research 31, 207 – 226.
Zachos, J. C., Arthur, M. A., Dean, W. E.. 1989. Geochemical evidence for suppression of pelagic marine productivity at the Cretaceous/Tertiary boundary. Nature 337 (5), 61 – 64.
Zhang, Y. G., Zhang, C. L., Liu, X. L., Li, L., Hinrichs, K. U., Noakes, J. E., 2011. Methane Index: a tetraether archaeal lipid biomarker indicator for detecting the instability of marine gas hydrates. Earth and Planetary Science Letters 307, 525 – 534.

212

213
Nederlandse samenvattingOngeveer 66 miljoen jaar geleden, op de grens tussen de geologische tijdperken Krijt en
Paleogeen, vond een massa-uitsterving plaats, een van de meest catastrofale gebeurtenissen in de geschiedenis van het leven. Deze gebeurtenis betekende het einde van het tijdperk van de Dinosauriërs. Naast de Dinosauriërs stierven ook vele andere planten en dieren uit, uiteindelijk ongeveer de helft van alle soorten op Aarde. De catastrofe op de Krijt-Paleogeengrens (afgekort als de K-Pg-grens) staat bekend als een van de ‘grote vijf ’ massa-extincties die de geschiedenis van de Aarde kenmerken. Het is tegenwoordig algemeen geaccepteerd dat dit massale uitsterven werd veroorzaakt door de gevolgen van de inslag van een asteroïde met een diameter van ongeveer 10 km, op het huidige schiereiland Yucatan in Mexico. Bewijzen voor deze inslag bestaan onder andere uit de grote inslagkrater op Yucatan en een wereldwijde sedimentlaag met materiaal dat bij de inslag is vrijgekomen, een zogenaamde ejectalaag. Deze ejectalaag wordt gekenmerkt door uitzonderlijk hoge concentraties van iridium en andere elementen uit afkomstig van de asteroïde en door andere bewijzen voor een kosmische inslag, zoals zogenaamde microkrystieten en door de inslag ‘geschokte’ kwartskorrels.
Na decennia van onderzoek begint de internationale wetenschappelijke focus langzamerhand te verschuiven van de vraag óf zulke inslagen inderdaad kunnen plaatsvinden, naar de vraag wat de gevolgen van zulke inslagen voor ecosystemen wereldwijd kunnen zijn en hoe het ecologische en biologische herstel verloopt na dergelijke grote milieuverstoringen. Een uniek aspect van de K-Pg-grens is de tijdschaal waarop deze verstoringen plaatsvonden. De catastrofe op de K-Pg-grens kan worden gezien als één van de meest abrupte gebeurtenissen uit de geschiedenis van het leven.
De inslag leidde tot een opeenvolging van regionale en wereldwijde catastrofes, waaronder aardbevingen, tsunami’s, een zogenaamde ‘vuurbalfase’ met wereldwijde bosbranden, afbraak van de ozonlaag, zure regen en een wereldwijde ‘inslagwinter’ als gevolg van stof en roetdeeltjes die door de inslag in de stratosfeer werden geschoten. Dit stof werd deels rechtstreeks in the stratosfeer gebracht door de kracht van de inslag, maar waarschijnlijk ook door hypothetische super-orkanen, zogenaamde ‘hypercanes’. Inslagmodellen voorspellen dat het stof en roet in de stratosfeer het zonlicht geheel of gedeeltelijk blokkeerde, wat leidde tot een kortstondige, maar sterke daling van de temperatuur op aarde, een zogenaamde ‘inslagwinter’. Verschillende scenario’s suggereren dat deze periode, gekenmerkt door zowel duisternis als sterke afkoeling, een duur had van tussen de zes maanden tot meer dan een decennium. Een dergelijke inslagwinter zou een ongekend grote milieuverandering betekend hebben en daarom buitengewoon stressvol zijn geweest voor het leven op Aarde. Het valt daarom te verwachten dat deze kortstondige periode een van de belangrijkste oorzaken is geweest voor het massale uitsterven op de Krijt-Paleogeengrens.
De initiële, kortstondige catastrofes werden waarschijnlijk opgevolgd door de langetermijngevolgen van de inslag op de K-Pg-grens. Koolstofdioxide (CO2) dat vrijkwam uit de bij de inslag getroffen gesteentes zorgde waarschijnlijk voor een verstrekt broeikaseffect nadat het stof en roet uit de atmosfeer waren neergeregend. Uiteindelijk zal dit tot sterke, wereldwijde klimaatverandering geleid hebben. Door het uitsterven van planktongroepen op de K-Pg-grens en de wijdverbreide vernietiging van vegetatie werd het CO2 waarschijnlijk minder snel weer afgevangen. Het versterkte broeikaseffect, zoals dat na de inslag ontstond, bleef daardoor waarschijnlijk duizenden tot tienduizenden jaren in stand.

214
Hier bovenop moet het grootschalige uitsterven onder primaire producenten (planten, plankton en algen) geleid hebben tot herstructureringen van voedselwebben en de korte- en lange koolstofcyclus. Het verdwijnen van het verschil in koolstofisotopenwaardes tussen het oppervlaktewater van de oceanen en de zeebodem, zoals plaatsvond op de K-Pg grens, wordt geïnterpreteerd als een beperking of verandering van het transport van organisch materiaal naar de zeebodem. Het uitsterven van grotere in het zeewater levende grazers (zoals macrozoöplankton en vissen), of een verschuiving van dominantie van grazers die zogeheten fecal pellets (kleine ‘keutels’) maken (bijvoorbeeld vissen) naar grazers de dat niet doen (bijvoorbeeld kwallen) zou het samenklonteren van biomassa kunnen hebben doen afnemen. Hierdoor zouden uiteindelijk minder snel deeltjes gevormd kunnen worden die groot genoeg zijn om naar de zeebodem te zinken. Deze situatie hield de eerste 1-3 miljoen na de inslag stand.
De wereldwijde klimatologische en biologische gevolgen van de inslag op de K-Pg-grens vonden plaats bovenop ‘achtergrond’-milieuveranderingen over langere tijdschalen, die niet gerelateerd waren aan de inslag. Eén van de klimaatveranderingen die mogelijk over langere tijdschalen plaatsvonden over het K-Pg-interval is de veronderstelde opwarming van de Aarde ten gevolge van de uitstoot van broeikasgassen tijdens uitvloeïngsfases van de vulkanen van de Deccan Traps, in hedendaags India, een zogenoemde large igneous province. De eruptieve fases van de Deccan Traps zijn herkenbaar aan grote verschuivingen in de isotopenwaardes van osmium en strontium, wat gelinkt wordt aan een toename van de verwering van basalten.
De broeikaswereld aan het einde van het Krijt werd gekenmerkt door een wereldwijd hoge zeespiegel, wat resulteerde in de verbreiding van grote, ondiepe zeeën op bijna alle continenten. Desondanks lijken het laat-Krijt en vroege Paleogeen gekenmerkt door raadselachtige zeespiegelveranderingen over langere tijdschalen. Hierdoor varieert de expressie en stratigrafische volledigheid van ondiep-mariene afzettingen van de K-Pg-grens, wat complete en accurate reconstructie van klimatologische en biologische veranderingen over de K-Pg-grens bemoeilijkt.
Om de ware schaal van de consequenties van de K-Pg-grens inslag te doorgronden zullen de gevolgen van de inslag moeten worden onderscheiden van de langetermijnmilieuveranderingen. ‘op de achtergrond’. Echter, hoewel decennia aan onderzoek aan de K-Pg-grens tot veel nieuwe inzichten hebben geleid, ontbreken nog steeds studies die gedetailleerd en gekwantificeerd genoeg zijn om eventuele wereldwijde milieuveranderingen ten gevolge van de inslag te achterhalen. Daarom zijn de drie belangrijkste doelen van dit proefschrift (1) het documenteren van regionale en wereldwijde klimatologische, oceanografische en biologische gevolgen van inslag op de K-Pg-grens, in het bijzonder de veranderingen over korte tijdschalen (10-1000 jaar), (2) het documenteren van de ecologische opeenvolging en het biologisch herstel op de lange termijn na de K-Pg-catastrofe en (3) het plaatsen van deze veranderingen in een context van mileuveranderingen die op de achtergrond, over langere tijdschalen plaatsvonden.
In de afgelopen decennia zijn uiteenlopende biologische en geochemische technieken gebruikt in een poging om de kortstondige globale veranderingen en verstoringen van de koolstofcyclus over de K-Pg grens heen te ontrafelen. De gebruikte technieken hebben elk hun krachten en zwaktes. Daarom wordt in dit proefschrift een multi-proxy aanpak toegepast, waarbij verschillende tools en technieken gecombineerd worden.
Veel van de organismen die traditioneel gebruikt worden voor palaeomilieu-reconstructies, zoals planktische foraminiferen, werden op de K-Pg-grens zwaar getroffen, waardoor accurate reconstructies over dit tijdsinterval problematisch zijn. De dinoflagellaten, een in de zee levende planktongroep, werden echter nauwelijks getroffen door de K-Pg-crisis. Brinkhuis et al. (1998)

215
hebben aangetoond dat kwantitatieve analyse van de door dinoflagellaten gemaakte cysten gebruikt kan worden om hypotheses omtrent de effecten van de K-Pg-inslag te testen. De migratie van dinoflagellaten kenmerkend voor hogere breedtegraden richting de tropen, zoals over de K-Pg- grens heen plaatsvond, suggereert dat de K-Pg-inslag resulteerde in oceanografische veranderingen over millennia, waarschijnlijk gerelateerd aan een korte ‘inslagwinter’-fase. Deze migraties zijn tot nu toe echter nog niet bevestigd door andere studies en het is onduidelijk of, en zo ja hoe ze gerelateerd zijn aan klimaatveranderingen onafhankelijk van de inslag. Daarnaast suggereren voorgaande studies dat deze eerste fase juist werd opgevolgd door een toename in concentraties van tropische dinoflagellaten. Deze toename wordt geïnterpreteerd als een tienduizenden jaren durende opwarming van het klimaat, volgend op de inslagwinter. Regionaal kunnen dit soort signalen echter getemperd worden door langetermijngevolgen van de afkoeling van oppervlakte en dieper oceaanwater gedurende de inslagwinter.
Vorige studies gebaseerd op de organische cysten van dinoflagellaten, zogenaamde dinocysten, geven ook raadselachtige zeespiegelveranderingen weer gedurende het tijdinterval van de K-Pg-grens. Hoewel deze zeespiegelveranderingen een accurate reconstructie van klimatologische en biologische veranderingen over de K-Pg-grens heen bemoeilijken kan de mate van stratigrafische volledigheid worden uitgezocht door biostratigrafie op basis van dinocysten en planktische foraminiferen te combineren.
Hieruit kunnen wij concluderen dat de kwantitatieve studie van dinocysten, ook wel mariene palynologie genoemd, gebruikt kan worden om zowel milieuveranderingen op de K-Pg-grens alsmede ook ‘achtergrond’-milieuveranderingen, zoals de globale zeespiegelhistorie, te documenteren. Deze tool is vooral zeer effectief wanneer toegepast op relatief kustnabije afzettingen. Dergelijke milieus worden gekenmerkt door hoge sedimentatiesnelheden, waardoor relevante informatie over bijvoorbeeld zeespiegel, productiviteit en het zoutgehalte en temperatuur van het zeewater het duidelijkste gereconstrueerd kan worden. Daarnaast kunnen met de hoge temporale resolutie die op deze manier verkregen wordt leads and lags tussen deze parameters herkent worden. Daarom wordt in dit proefschrift de focus gelegd op dergelijke, ondiep mariene sedimentaire afzettingen van de K-Pg-grens.
Net als bij soortgelijke studies op stratigrafisch uitgebreide afzettingen van het Paleoceen-Eoceen Thermisch Maximum kunnen op deze manier ecologische en klimatologische veranderingen over tijdschalen van millennia worden gereconstrueerd over de Krijt-Paleogeengrens. Tot nu toe hebben er echter heel weinig van dergelijke studies plaatsgevonden over de K-Pg-grens, resulterend in een beperkte geografische dekkingsgraad.
Daarnaast, hoewel met behulp van de analyse van dinocysten duidelijke trends in parameters als zoutgehalte en temperatuur van het zeewater onderscheiden kunnen worden, is de kwantificatie van dergelijke trends niet mogelijk met alleen palynologie. Naast mariene palynologie kunnen organisch-geochemische technieken extra inzichten verschaffen in de biologische- en milieuveranderingen over de K-Pg-grens heen. Belangrijker nog, met behulp van deze toolbox kunnen deze veranderingen ook gekwantificeerd worden. In de afgelopen jaren is onder andere een nieuwe techniek ontwikkeld om de absolute temperatuur van oppervlaktezeewater te reconstrueren aan de hand van vetten, zogeheten GDGTs, afkomstig van de celwanden van in zeewater levende archaea (microben): de TEX86 index. Deze ‘paleo-thermometer’ is gebaseerd op de analyse van de distributies van deze vetten in mariene sedimenten. Deze techniek is bijzonder succesvol in combinatie met mariene palynologie en is reeds succesvol toegepast in deep time. Daarnaast kunnen ander organische biomarker technieken op basis van GDGTs, zoals de Brached and Isoprenoid Tetraether (BIT) index, ook toegepast worden om relatieve zeespiegelveranderingen te

216
reconstrueren. Tot nu toe zijn er echter nog geen hoge-resolutie studies op de K-Pg-grens geweest die waren gebaseerd op GDGTs. Daarom kan de combinatie van palynologische en organisch geochemische analyses gebruikt worden om de inzichten in zowel de kortstondige als langetermijn biologische en klimatologische veranderingen over de K-Pg-grens heen te vergroten.
In dit proefschrift zullen dus hoofdzakelijk ‘organic tools’, zoals kwantitatieve dinocysten analyse (mariene palynologie) en op GDGTs gebaseerde technieken, gebruikt worden op nieuwe inzichten te verkrijgen in de klimatologische en biologische gevolgen van de inslag op de Krijt-Paleogeengrens, zowel op de korte- als lange termijn.
Alleen door te richten op sedimentaire archieven die gekenmerkt worden door hoge sedimentatiesnelheden maar toch stratigrafisch compleet zijn kunnen we de biologische- en milieuveranderingen over zeer korte tijdschalen achterhalen en daarmee het onderscheid maken tussen ‘achtergrond’-milieuveranderingen over langere tijdschalen en die ten gevolge van de inslag.
Het is bovendien essentieel om een werkelijk globaal beeld te vormen van de milieuveranderingen rond de inslag. In onze poging om bruikbare locaties te vinden hebben we ons daarom ook gericht op regio’s waar tot nu toe weinig K-Pg locaties zijn.
Daarom wordt in Hoofdstuk 2 een nieuwe K-Pg-grens lokaliteit gepresenteerd, waarbij een geochemische en paleontologische kenschets van een nieuwe, stratigrafisch complete K-Pg-grens afzetting in het Turkse Mudurnu-Göynük bekken wordt verschaft.
Dit hoofdstuk behandelt de kalk-nannofossiel-, planktische foraminifeer- en dinocysten-biostratigrafie van de K-Pg-grens, stabiele koolstoefisotopen en de klassieke geochemische merkers van de K-Pg-grens: siderofiele sporenelementen, waaronder iridium en andere elementen afkomstig van de asteroïde.
In Hoofdstuk 3 worden de klimatologische gevolgen van de inslag op de K-Pg-grens over zeer korte tijdschalen (<1000 kyr) onderzocht met behulp van een belangrijke, stratigrafisch uitgebreide sectie gesitueerd in de midden-breedtegraden.
In dit hoofdstuk zijn we in staat om veranderingen van de temperatuur van het zeewateroppervlakte over de K-Pg-grens heen te reconstrueren op een tot nu toe onovertroffen temporale resolutie, met behulp van de TEX86 paleo-thermometer, toegepast op de sedimenten van de Brazos River sectie in Texas, in de Verenigde Staten. Wij documenteren een substantiële (i.e. >7 graden C) afname in de temperatuur van het oppervlaktezeewater tijdens de eerste maanden tot decennia na de inslag. We interpreteren deze koudegolf als het eerste rechtstreekste bewijs voor de effecten van de vorming van stof en roet bij de inslag en van hun injectie in de stratosfeer, waardoor inkomend zonlicht werd geblokkeerd. Deze inslagwinter was waarschijnlijk een belangrijke oorzaak van de massa-extinctie, omdat fotosynthese ineenstortte, zowel op land als in de zee.
In Hoofdstuk 4 worden de biologische consequenties van klimaatverandering over korte tijdschalen op de K-Pg-grens geëvalueerd. We hebben een hoge-resolutie mariene palynologische studie uitgevoerd op een nauw gespatieerde set monsters van de Elles-sectie in Tunesië. Het doel was om een reconstructie te maken van het paleomilieu en paleoklimaat rond de K-Pg-grens, om de eerder op de nabijgelegen El Kef-sectie (de Global Stratotype Section and Point van de K-Pg-grens) gereconstrueerde milieuveranderingen te verifiëren en verfijnen.
De diverse en goed gepreserveerde dinocysten assemblages van Elles laten sterke fluctuaties zien, gelijkend op die van El Kef. Daarmee bevestigt deze record de eerder gereconstrueerde signalen, duidend op snelle, regionaal consistente milieuveranderingen. Tezamen tonen de dinocyst records van Tunesië aan dat het laatste deel van het Krijt werd gekenmerkt door een graduele afkoeling, die samenging met het begin van een relatieve zeespiegeldaling. De dinocyst-assemblages

217
onthullen meerdere invasies van dinocyst-soorten kenmerkend voor hogere breedtegraden in het tijdsinterval onmiddellijk na de extinctie, de eerste duizenden jaren na de inslag. Dit wordt geïnterpreteerd als herhaalde afkoelingspulsen. Deze resultaten suggereren dat het klimaat en milieu van het vroegste deel van het Paleogeen onstabiel was op het continentaal plat van Tunesië.
In Hoofdstuk 5 wordt het biologisch herstel op korte- en lange termijn volgend op de K-Pg-grens catastrofe verder geëvalueerd.
Om reconstructies van mariene milieus over het K-Pg-interval heen, dus voor en na de inslag, mogelijk te maken moet de focus liggen op biologische groepen die geen noemenswaardige extinctie ondervonden door de inslag, zoals benthische foraminifera en dinoflagellaten. Daarom integreren we in dit hoofdstuk analyse van dinocysten en benthische forminifera van de recentelijk ontdekte, stratigrafisch complete Okçular en Göynük North secties in noordwest Turkije, met als doel uit te zoeken hoe de biologische crisis op de K-Pg-grens in de Tethys Oceaan zowel het oppervlaktewater als de bodem van de zee beïnvloedde.
Onze resultaten tonen aan dat gedurende de initiële fase na de inslag de ineenstorting van export productivity (het transport van biomassa van het oppervlaktewater naar de zeebodem) resulteerde in de toename van de recycling van nutriënten in het oppervlaktewater. Dit zorgde voor een beperktere beschikbaarheid van voedingstoffen op de zeebodem, terwijl meer voedingstoffen beschikbaar waren voor de aan het zeeoppervlak levende organismen van het vroegste Paleogeen.
In Hoofdstuk 6 worden de bewijzen voor een zogenoemde ‘inslagwinter’ na de inslag op de K-Pg-grens geverifieerd en gepresenteerd in een bredere context van klimaatverandering over langere tijdschalen.
Met dit doel hebben we gebruik gemaakt van hoge resolutie mariene palynologie en de TEX68 methode om de temperatuur van het oppvervlaktezeewater te reconstrueren. Deze technieken werden toegepast op 4 stratigrafisch uitgebreide boorkernen, genomen op het voormalige continentaal plat van New Jersey, in het oosten van de VS. Deze boorkernen omvatten het K-Pg-grensinterval. Dit nieuwe archief geeft klimaatverandering op een langere tijdschaal weer, onder andere ten gevolge van het vulkanisme van de Deccan Traps, en bevestigd de korte inslagwinter-fase direct na de K-Pg inslag.
In Hoofdstuk 7 worden de raadselachtige zeespiegelveranderingen over het K-Pg-grensinterval heen onderzocht.
In dit hoofdstuk vergelijken wij sedimentologische, palynologische en organisch-geochemische records van enkele van de meest bekende marginaal-mariene K-Pg-grenssecties wereldwijd: Elles El Kef (Tunesië), Stevns Klint (Denemarken), New Jersey (de VS), Brazos River (de VS), Mid-Waipara River (Nieuw Zeeland) en Bajada del Jaguël (Argentinië).
Gezamenlijk wijzen deze records richting globaal synchrone zeespiegelveranderingen over het K-Pg-interval. De bewijzen suggereren dat het hoogste zeespiegel wereldwijd werd bereikt in het laatste deel van het Krijt, gevolg door een relatief sterke zeespiegeldaling over de K-Pg-grens heen, om uiteindelijk het laagste zeespiegel te bereiken in het vroegste Paleogeen. Deze episode werd globaal gevolgd door een duidelijke zeespiegelstijging
Deze globaal synchrone relatieve zeespiegelveranderingen zijn niet gerelateerd aan de inslag op de K-Pg-grens. De fluctuaties lijken synchroon te lopen met zuurstofisotopencurves van benthische foraminiferen en TEX86 curves, wat een koppeling tussen temperatuur en zeespiegel suggereert.
Samenvattend levert dit proefschrift een gedetailleerde weergave van de milieuveranderingen over langere tijdschalen over het K-Pg-grensinterval en van de regionale en globale klimatologische en biotische effecten van de inslag op de K-Pg-grens. Deze inslag was een van de meest catastrofale

218
gebeurtenissen uit de geschiedenis van het leven, resulterend in een opeenvolging van regionale en globale rampen, waaronder tsunami’s, een ‘vuurbalfase’ en een daaropvolgende globale inslagwinter, als gevolg van stof en roet dat de atmosfeer in werd geschoten. Deze inslagwinter, gekenmerkt door duisternis en afkoeling, was waarschijnlijk een van de belangrijkste oorzaken van de massa-extinctie, omdat het resulteerde in de globale ineenstorting van fotosynthese.
De extincties leidden tot een afname van het transport van organisch materiaal van het oppervlaktewater naar de zeebodem, waardoor meer voedingsstoffen beschikbaar bleven voor de overlevende planktongroepen, waaronder dinoflagellaten. Het evolutionaire herstel van de planktongemeenschappen kostte honderdduizenden tot enkele miljoenen jaren, waaruit blijkt dat de snelle en kortstondige catastrofe op de K-Pg-grens bijzonder langdurige gevolgen had. De inslag en resulterende extincties veroorzaakten dus een grote verstoring van de globale koolstofcyclus en aanzienlijke globale klimaatverandering. De klimaatverandering over langere tijdschalen verschilde echter substantieel tussen verschillende locaties, bijvoorbeeld door onderlinge verschillen in oceanografische setting.
Deze klimatologische en biologische gevolgen van de K-Pg-inslag vonden plaats bovenop milieuveranderingen die over langere tijdschalen over dit tijdsinterval plaatsvonden, zoals een mondiale zeespiegeldaling en graduele afkoeling.

219
Acknowledgements/DankwoordToen ik zeven jaar geleden als derdejaars student van de bachelor Aardwetenschappen op zoek was naar een leuk onderwerp voor mijn bachelorscriptie voorzag ik niet waartoe de keuze die ik zou maken allemaal zou leiden.
Het was het vak Introductie in de Biogeologie dat mij deed kennis maken met Henk Brinkhuis en Appy Sluijs. Deze twee docenten maakten een buitengewone indruk op mij. Wat een bijzonder enthousiaste wetenschappers en wat een geweldig interessant onderzoek werd er gedaan op die vakgroep Palaeoecologie! Het moet ergens in het voorjaar van 2008 zijn geweest dat ik uiteindelijk bij Henk kwam vragen of hij misschien een leuk project had voor mijn bacheloronderzoek. Niet veel later maakte ik voor het eerst kennis met de wondere wereld van de dinoflagellaten. Na een bachelorproject over dinoflagellatencysten van het midden-Krijt volgde een masteronderzoek, over dinoflagellatencysten van de Krijt-Paleogeengrens. Hier werd mijn fascinatie voor deze geologische grens geboren. De passie voor dinoflagellaten, de fascinatie voor die broeikaswerelden uit het verleden, voor grote klimatologische events en voor vette wetenschap, ik heb het allemaal dankzij Henk, mijn grote inspiratiebron. Henk, bedankt voor alles, voor de steun, de adviezen en de briljante inzichten. Je hebt mij geïnspireerd vanaf het begin, gesteund in moeilijke tijden, mij achter mijn broek gezeten wanneer dat nodig was en misschien wel het belangrijkste, je hebt mij altijd het gevoel gegeven vertrouwen in me te hebben. Duizend maal dank voor dit alles.
Hoewel de palynologie altijd de hoofdcomponent is geweest van het onderzoek aan het Laboratorium voor Palaeobotanie en Palynologie (LPP), werd er vanaf het begin voor gekozen om het palynologisch onderzoek te combineren met zo veel mogelijk andere onderzoekstechnieken. Multi-disciplinair onderzoek leidt immers tot geweldige nieuwe inzichten. Zo speelde ook bij mijn promotieonderzoek de combinatie met organische geochemie een belangrijke rol. Het was mijn andere promotor, Jaap Sinninghe Damsté, die mij hielp die bijzondere wereld van de GDGTs te begrijpen. Hoewel het contact met Jaap niet zo frequent was als met Henk, mijn dagelijks begeleider, waren de besprekingen met Jaap altijd bijzonder intensief en enerverend. Elke keer waren er de wijze adviezen en goede aanwijzingen. Ik kon er altijd vanuit gaan dat elke mail, elk abstract en elk manuscript met detail werd bekeken en dat ik buitengewoon snel een reactie kreeg. Jaap, bedankt voor al deze hulp.
Naast mijn promotoren was er een andere begeleider die altijd mijn K-Pg-steun en toeverlaat is geweest. Het is een voor mij een grote eer om meerdere keren samen met niemand anders dan Jan Smit, aka ‘mister KT boundary’, op veldwerk te zijn geweest. Er is niemand op aarde die zo veel ontsluitingen van de K-Pg-grens heeft gezien. De veldwerken in Nieuw Zeeland, Turkije en Argentinië waren geweldige ervaringen en zullen waarschijnlijk enkele van de meest leerzame momenten van mijn promotieonderzoek zijn geweest. Naast de veldwerken waren er de talloze bezoekjes aan de VU, met zowel diepgaande wetenschappelijke discussies als geweldige gespreken over volledig niet gerelateerde onderwerpen. Jan, je bent voor mij een voorbeeld.
Tijdens het dagelijks werk werd ik gesteund door alle andere mensen van de LPP. Appy, jouw geweldige enthousiaste en goede hulp met het schrijfwerk hebben mij fantastisch geholpen, zeker de laatste jaren, toen je als dagelijkse begeleider optrad. Je stond altijd die altijd voor mij klaar.

220
Samen met de andere mensen van de vakgroep(en); Bas, Francesca, Timme, Rike, Peter, Sander, Emmy, Linda, Henk Visscher, Zwier, Gea, Han en Johan, jullie hebber er voor gezorgd dat ik mij altijd thuis voelde op de LPP. De LPP zou niets zijn zonder Marjolein Mullen, de spin in het web dat de vakgroep is en zonder Jan, Natasja en Hans, bedankt dat jullie altijd klaar stonden om te helpen!
Natuurlijk ook de collega-promovendi en studenten zijn een belangrijk onderdeel geweest van mijn jaren op de vakgroep. Niels, we begonnen samen aan het promotieavontuur en zijn samen klaar, het waren 4 bijzondere jaren. Arjen, Joost, Mariska Loes, Julian, Margot bedankt voor de mooie tijd en de vele potjes tafelvoetbal! Tjerk, vriend, collega en kamergenoot, het was prachtig om het laatste jaar met jou op de kamer te mogen zitten. Of het nou het dagelijkse nieuws, de nieuwste wetenschappelijke artikelen of de beslommeringen van het dagelijks leven waren die werken besproken, op het kantoor, of tot s ’avonds laat boven een goed glas Spaanse wijn, het was super! Aan jullie allemaal: nog veel succes met jullie eigen promotieonderzoeken!
Verder op de universiteit was daar Johan Weijers, die mij de fijne kneepjes van het organisch geochemisch labwerk heeft geleerd, bedankt daarvoor, en Stefan Schouten, of het nou in Utrecht of op Texel was, altijd bereid om tijd voor mij vrij te maken om naar mijn data of manuscripten te kijken of mij van adviezen te zien, ik heb dit bijzonder gewaardeerd. Verder was op het NIOZ de hulp en Ellen Hopmans en Jort Ossebaar onmiskenbaar.
De laatste twee jaar was ik dankzij Lineke niet meer in mijn eentje bezig met de problematiek van de Krijt-Paleogeengrens. Het was en is nog steeds heel fijn om jou als mijn sparringpartner te hebben. Zodra de positie vrij kwam heb ik je aangespoord om te solliciteren, mede vanuit eigen belang. Ik ben dan ook heel blij met dat ik nu met jou kan samenwerken en hoop dit nog vele jaren te kunnen doen. We vormen wat mij betreft een geweldig K-Pg-team! Nog veel succes de komende jaren!
Willemijn, bedankt voor onze tijd samen, voor dat je er was toen ik het nodig had. Jij hebt mij door moeilijke momenten geholpen en vreugde met mij gedeeld. Ik kan mijn dankbaarheid niet in woorden uitdrukken. I furthermore wish to thank all those foreign co-workers that provided excellent scientific input and a wonderful collaboration. I am especially grateful to Sanem Açikalin, Mercedes Pramparo, Silvio Cassadio and Chris Hollis for our great time in the field and the incredible hospitality.
Buiten de directe academische omgeving zijn er natuurlijk ook een heleboel mensen zonder wie deze promotie nooit was gelukt. Richard, goede vriend, wat fijn om mijn passie voor fossielen te kunnen delen! David, onze wandelingen en paddenstoel-strooptochten samen waren welkome afleidingen van de hectiek van het promoveren. Veel succes met jou eigen promotie! Ko, Corine, Pim, Timothy: allen bedankt voor de steun door de jaren heen!

221
Uiteraard is dit alles mogelijk gemaakt door mijn ouders, die mij altijd gesteund hebben en mij aangespoord hebben om mijn dromen te volgen. Heel erg bedankt voor jullie interesse en niet aflatende vertrouwen in mijn kunnen. Ella, mjin lieve zus, en Gert-Jan, bedankt voor al jullie liefde en steun!
En tot slot, Susan: Heel erg bedankt voor je liefde, interesse en steun en de fantastische tijd samen!

222

223
Curriculum VitaeJohan Vellekoop werd geboren op 4 mei 1987 in Smilde. In 2005 behaalde hij zijn VWO diploma op de Christelijke School Vincent Van Gogh in Assen en begon datzelfde jaar met de studie Aardwetenschappen aan de Universiteit van Utrecht. In het tweede jaar volgde hij het Bachelor track Biogeology, dat hij afsloot met een bacheloronderzoek bij de leerstoelgroep Palaeoecologie, van de Universiteit Utrecht. Zijn bacheloronderzoek, naar dinocystenassociaties uit het Albiaan van Hannover, Duitsland, werd begeleid door Henk Brinkhuis. In 2008 startte Johan de Master Biogeology aan de Universiteit, waarin hij in april 2009 zijn afstudeerscriptie begon bij Henk Brinkhuis. Hierbij reconstrueerde hij aan de hand van assemblages van dinoflagellatencysten paleomilieuveranderingen in Tunesië ten gevolge van de inslag op de Krijt-Paleogeengrens. In augustus 2009 ging hij naar Nieuw Zeeland voor een tweede onderzoeksproject, onder begeleiding van Chris Hollis van GNS Science en Jan Smit van de Vrije Universiteit van Amsterdam en in samenwerking met de leerstoelgroep Biomarine Sciences van de Universiteit Utrecht. Voor dit onderzoeksproject deed hij veldwerk aan verschillende Nieuw-Zeelandse ontsluitingen van de Krijt-Paleogeengrens en bestudeerde hij assemblages van dinoflagellatencysten van enkele van deze onsluitingen, zowel voor stratigrafische doeleinden als voor de reconstructie van paleomilieuveranderingen. Na het behalen van zijn MSc. in 2010 begon hij in september dat jaar zijn promotieonderzoek bij de leerstoelgroep Biomarine Sciences, onder begeleiding van Henk Brinkhuis, Jaap Sinninghe Damsté, Appy Sluijs en Bas van de Schootbrugge. De resultaten van zijn promotieonderzoek zijn beschreven in dit proefschrift.
Publications in peer-reviewed journalsVellekoop, J., Sluijs, A., Smit, J., Schouten, S., Weijers, J.W.H., Sinninghe Damsté, J.S., Brinkhuis, H., 2014. Rapid
short-term cooling following the Chicxulub impact at the Cretaceous-Paleogene boundary. Proceedings of the National Academy of Sciences of the United States of America 111 (21), 7537 – 7541. DOI: 10.1073/pnas.1319253111
Açikalin, S., Vellekoop, J., Ocakoğlu, F., Yilmaz, I. Ö., Smit, J., Altiner, S. Ö., Goderis, S., Vonhof, H., Speijer, R. P., Woelders, L., Fornaciari, E., Brinkhuis, H., 2015. Geochemical and palaeontological characterization of a new K-Pg Boundary locality from the Northern branch of the Neo-Tethys: Mudurnu – Göynük Basin, NW Turkey. Cretaceous Research 51, 251-267

Related Documents