Analyzing Client Interactivity in Streaming Media Cristiano Costa , Italo Cunha , Alex Borges , Claudiney Ramos , Marcus Rocha Jussara Almeida , Berthier Ribeiro-Neto Computer Science Department Akwan Information Technologies Federal University of Minas Gerais http://www.akwan.com.br http://www.dcc.ufmg.br Belo Horizonte, Brazil {krusty, cunha, borges, cvramos, mvrocha, jussara, berthier}@dcc.ufmg.br ABSTRACT This paper provides an extensive analysis of pre-stored stream- ing media workloads, focusing on the client interactive behavior. We analyze four workloads that fall into three different domains, namely, education, entertainment video and entertainment audio. Our main goals are: (a) to identify qualitative similarities and dif- ferences in the typical client behavior for the three workload classes and (b) to provide data for generating realistic synthetic workloads. Categories and Subject Descriptors H.1.0 [Models and Principles]: General General Terms Measurement, Performance Keywords Streaming Media, Workload Characterization 1. INTRODUCTION The rapid increase in popularity of streaming media traffic in the Internet [7] has led to the development of a number of new applica- tions including online distance education, radio and TV programs. Three key characteristics of streaming media are: the high band- width requirements, which motivated the development of new scal- able streaming protocols [9, 13], the real time constraints on media delivery, and the possibility of partial or interactive access. By in- teractive access, we mean that a client may pause, fast forward, rewind, or jump to specific points in the video/audio file. Thus, a streaming media file may not be fully and sequentially requested. To illustrate, clients of a media server delivering educational con- tent may pause the transmission of a lecture to take notes or jump backwards to review a previously watched portion of the lecture. Despite various previous studies on characterization of stream- ing media workloads [4, 5, 6, 7, 11, 12, 15, 19], understanding of client behavior is still superficial. This is because previous work has focused on only a few workload aspects, such as arrival process and file access frequencies, and, thus, does not provide a complete Copyright is held by the author/owner(s). WWW2004, May 17–22, 2004, New York,New York, USA. ACM 1-58113-844-X/04/0005. analysis, or because only one type of workload (e.g., educational) has been considered. Thus, it is not clear whether their results hold to other workload domains (e.g., entertainment). Furthermore, a more complete characterization of interactive client behavior is still needed, as interactivity has been shown to significantly impact the scalability of streaming media protocols [5, 14, 17]. This paper provides a more thorough analysis of pre-stored streaming media workloads, focusing on the typical characteristics of client interactive behavior. Our main goal is to provide data for generating more realistic synthetic workloads, which can then be used in the evaluation of alternative media distribution methods. We also confirm previously derived insights into media caching [5], extending them for a richer and more diverse set of workloads. As in [19], we use a hierarchical approach to deconstruct the workload into two levels: a client session level and an interactive request level. We characterize a long list of workload parameters in each level, including file access frequencies, session inter-arrival times, number, type and duration of interactive requests within a session and amount of media skipped between consecutive client interactions. Moreover, we pay special attention to the temporal variations of the workload and analyze each parameter for a number of selected high load days and also for shorter time periods during which the distributions are expected to remain roughly stable. Another key point that distinguishes our work from previous studies is that we characterize workloads that fall into three dif- ferent domains: educational video, entertainment video and enter- tainment audio. By characterizing this rich set of workloads, we are able to compare our findings and identify those that hold in general and those that are specific to each workload type. The educational workload consists of requests to the eTeach server [3], which de- livers high bitrate educational content at one major US University. A one-month log of accesses to eTeach were previously analyzed in [5]. The eTeach logs analyzed in this work cover a longer and more recent time period, allowing us to contrast our results with those reported in [5]. The other three workloads analyzed are for entertainment content, two containing only audio files and a third one containing short video files. These workloads, obtained from two of the largest content and service providers in Latin America, are much heavier than the ones previously studied in the literature, with an average daily load ranging from 34K to 520K user requests. Key observations from the analysis of our workloads are: A large number of client requests is for a small fraction of the media files and the fraction decreases with file size. 534

Welcome message from author
This document is posted to help you gain knowledge. Please leave a comment to let me know what you think about it! Share it to your friends and learn new things together.
Transcript

Analyzing Client Interactivity in Streaming Media
Cristiano Costa�, Italo Cunha
�, Alex Borges
�, Claudiney Ramos
�, Marcus Rocha
�
Jussara Almeida�, Berthier Ribeiro-Neto
��� �
�Computer Science Department
�Akwan Information Technologies
Federal University of Minas Gerais http://www.akwan.com.brhttp://www.dcc.ufmg.br
Belo Horizonte, Brazil{krusty, cunha, borges, cvramos, mvrocha, jussara, berthier}@dcc.ufmg.br
ABSTRACTThis paper provides an extensive analysis of pre-stored stream-ing media workloads, focusing on the client interactive behavior.We analyze four workloads that fall into three different domains,namely, education, entertainment video and entertainment audio.Our main goals are: (a) to identify qualitative similarities and dif-ferences in the typical client behavior for the three workload classesand (b) to provide data for generating realistic synthetic workloads.
Categories and Subject DescriptorsH.1.0 [Models and Principles]: General
General TermsMeasurement, Performance
KeywordsStreaming Media, Workload Characterization
1. INTRODUCTIONThe rapid increase in popularity of streaming media traffic in the
Internet [7] has led to the development of a number of new applica-tions including online distance education, radio and TV programs.Three key characteristics of streaming media are: the high band-width requirements, which motivated the development of new scal-able streaming protocols [9, 13], the real time constraints on mediadelivery, and the possibility of partial or interactive access. By in-teractive access, we mean that a client may pause, fast forward,rewind, or jump to specific points in the video/audio file. Thus, astreaming media file may not be fully and sequentially requested.To illustrate, clients of a media server delivering educational con-tent may pause the transmission of a lecture to take notes or jumpbackwards to review a previously watched portion of the lecture.
Despite various previous studies on characterization of stream-ing media workloads [4, 5, 6, 7, 11, 12, 15, 19], understandingof client behavior is still superficial. This is because previous workhas focused on only a few workload aspects, such as arrival processand file access frequencies, and, thus, does not provide a complete
Copyright is held by the author/owner(s).WWW2004, May 17–22, 2004, New York, New York, USA.ACM 1-58113-844-X/04/0005.
analysis, or because only one type of workload (e.g., educational)has been considered. Thus, it is not clear whether their results holdto other workload domains (e.g., entertainment). Furthermore, amore complete characterization of interactive client behavior is stillneeded, as interactivity has been shown to significantly impact thescalability of streaming media protocols [5, 14, 17].
This paper provides a more thorough analysis of pre-storedstreaming media workloads, focusing on the typical characteristicsof client interactive behavior. Our main goal is to provide datafor generating more realistic synthetic workloads, which can thenbe used in the evaluation of alternative media distribution methods.We also confirm previously derived insights into media caching [5],extending them for a richer and more diverse set of workloads.
As in [19], we use a hierarchical approach to deconstruct theworkload into two levels: a client session level and an interactiverequest level. We characterize a long list of workload parametersin each level, including file access frequencies, session inter-arrivaltimes, number, type and duration of interactive requests within asession and amount of media skipped between consecutive clientinteractions. Moreover, we pay special attention to the temporalvariations of the workload and analyze each parameter for a numberof selected high load days and also for shorter time periods duringwhich the distributions are expected to remain roughly stable.
Another key point that distinguishes our work from previousstudies is that we characterize workloads that fall into three dif-ferent domains: educational video, entertainment video and enter-tainment audio. By characterizing this rich set of workloads, we areable to compare our findings and identify those that hold in generaland those that are specific to each workload type. The educationalworkload consists of requests to the eTeach server [3], which de-livers high bitrate educational content at one major US University.A one-month log of accesses to eTeach were previously analyzedin [5]. The eTeach logs analyzed in this work cover a longer andmore recent time period, allowing us to contrast our results withthose reported in [5]. The other three workloads analyzed are forentertainment content, two containing only audio files and a thirdone containing short video files. These workloads, obtained fromtwo of the largest content and service providers in Latin America,are much heavier than the ones previously studied in the literature,with an average daily load ranging from 34K to 520K user requests.
Key observations from the analysis of our workloads are:� A large number of client requests is for a small fraction of
the media files and the fraction decreases with file size.
534
� Clients requesting audio content exhibit a very distinct inter-active behavior from video clients. Almost 100% of audiosessions start at the beginning of the file and have only oneinteractive request. Furthermore, clients either listen to thewhole audio or stop at an arbitrary position, with roughlyequal probability. In contrast, a non-negligible fraction ofvideo sessions starts at arbitrary positions in the file, espe-cially for longer videos. The number of interactive requestswithin a video session increases with the file size.
� Pause is, by far, the most common client interaction in thevideo workloads. Jump backwards and jump forwards areroughly equally frequent for longer videos. Furthermore, theprobabilities of a client pausing, jumping forwards or jump-ing backwards seem to strongly depend on the type of his/herprevious interaction but not on the number of interactionssince the beginning of the session. For either pause, jumpforwards, or jump backwards, any interaction type is alwaysmore frequently followed by an interaction of the same type.
� There seems to be a strong spatial locality in the interactionswithin a client session. On average, a client skips up to 45seconds of media between consecutive requests, in our logs.
� Client access patterns to the files in our three entertainmentworkloads tend to be more evenly distributed in time, whereasaccesses to the educational content are usually more skewedtowards the middle of the day and weekdays.
� Distribution of file access frequencies is better modeled withthe concatenation of two Zipf-like distributions for accessesto audio and educational videos (as in [5]). However, theaccess frequencies of short entertainment videos can be wellapproximated with a single Zipf-like distribution.
� Session arrivals for the educational workload are well ap-proximated by either a Weibull or a Lognormal distribution,depending on file size. A heavy-tailed Pareto distributionwas found to be a good model for session arrivals at oneof the entertainment workloads, whereas exponentially dis-tributed session arrivals were observed in the other two.
� The insights into caching strategies previously drawn in [5]also hold for more recent educational workloads and enter-tainment workloads. In particular, we found that there isa large fraction of files that are accessed only sporadically,motivating the need to take popularity into account when de-ciding whether to store new content into a cache. We alsofound that file segment access frequencies are either roughlyuniformly distributed (for the most popular and longer ed-ucational files) or skewed towards early segments (for lesspopular educational files and entertainment content).
The rest of this paper is organized as follows. Section 2 dis-cusses related work. Section 3 describes our workloads and thehierarchical model used to characterize them. Overall character-istics of servers’ load are analyzed in section 4, and a thoroughcharacterization of file accesses is provided in section 5. Section 6extends previously derived insights into streaming media cachingto our workloads. Section 7 concludes the paper.
2. RELATED WORKA number of previous streaming media workload characteriza-
tions are available in the literature [4, 5, 6, 7, 11, 12, 15, 19]. Stud-ies of interactive client accesses have been done for the MANICaudio content system [15], the low-bitrate Classroom 2000 system[11], the educational eTeach and BIBS media servers [5] and theeducational internal server of a large international corporation [12].These studies have analyzed a number of media workload aspects
including session arrival process [5], distributions of ON and OFFtimes within sessions [5, 11, 12, 15], and frequency of each typeof client interaction [5, 11, 12, 15]. The authors in [5] also drawinsights into efficient caching strategies and quantify the scalabilityof a multicast streaming protocol for an interactive workload.
Client session duration, object and server popularity and shar-ing patterns of media objects among clients are analyzed in [7] forthe client-side workload of a large university. Locality, dynamicsand evolution of the accesses to objects in two enterprise mediaservers are analyzed in [6, 18]. A thorough characterization of alive streaming media workload is provided in [19].
Although collectively these previous studies cover a large set ofdifferent characteristics, most of them focuses on a few specificworkload parameters. Key aspects for generating realistic syntheticworkloads, such as the dependence between consecutive client in-teractions within a session, have not been previously analyzed. Fur-thermore, given the diversity of media workload types, it is notclear whether previous results hold for different workload domains.
To the best of our knowledge, the only previous attempt to com-pare characteristics of workloads from different domains, such asthe one we do here, is the analysis of client accesses to the mModsystem, which delivers both educational and entertainment videosat an university in Sweden [4]. However, that work provides a verylimited characterization of the workload.
In comparison with previous work, our study: (1) provides amore thorough characterization of client interactive behavior; (2)analyzes the characteristics of a richer and more diverse set ofworkloads including educational and entertainment content, videoand audio content, and (3) analyzes much heavier workloads.
3. METHODOLOGYThe data sources used in this paper are anonymized access logs
to the eTeach media server [3], which delivers educational contentat a major US University, and to two major Latin America serviceand content providers. One of these providers is Universo Online[1], or simply UOL, one of the largest ISP in Latin America. UOLprovides a variety of online services, including streaming mediaentertainment audio and video services. The other data source,referred to, throughout this paper, as simply ISP, provides an on-line radio service, delivering, on demand, music files from a largecollection. Section 3.1 describes the data sources and provides anoverview of the log data used in our analysis. Section 3.2 describesthe approach we use to deconstruct the workload into a two-levelhierarchy consisting of client sessions, at a higher level, and inter-active requests within each session, at a lower level.
3.1 Server Log DataThe eTeach media server [3] delivers educational content at the
University of Wisconsin-Madison. Students have no classroom lec-tures and obtain all course material, including short announcementsand variable length lectures directly from the server, accessing itmainly from within campus, using a high bandwidth network.
UOL and ISP deliver, on demand, media content to thousands ofusers across the Internet. We analyze the workloads of two UOLservices: RADIO/UOL, which delivers only audio music files andTV/UOL, which delivers mainly short video files. The music filesat RADIO/UOL are organized into pre-defined channels where theusers can tune in to retrieve their favorite songs. The video files atTV/UOL consist of a variety of short TV programs, advertisements,interviews and social events. Access to both services is restricted topre-registered users. ISP, on the other hand, provides a free onlineradio service offering both pre-compiled and user-defined channels.We refer to this workload as ISP/Audio.
535
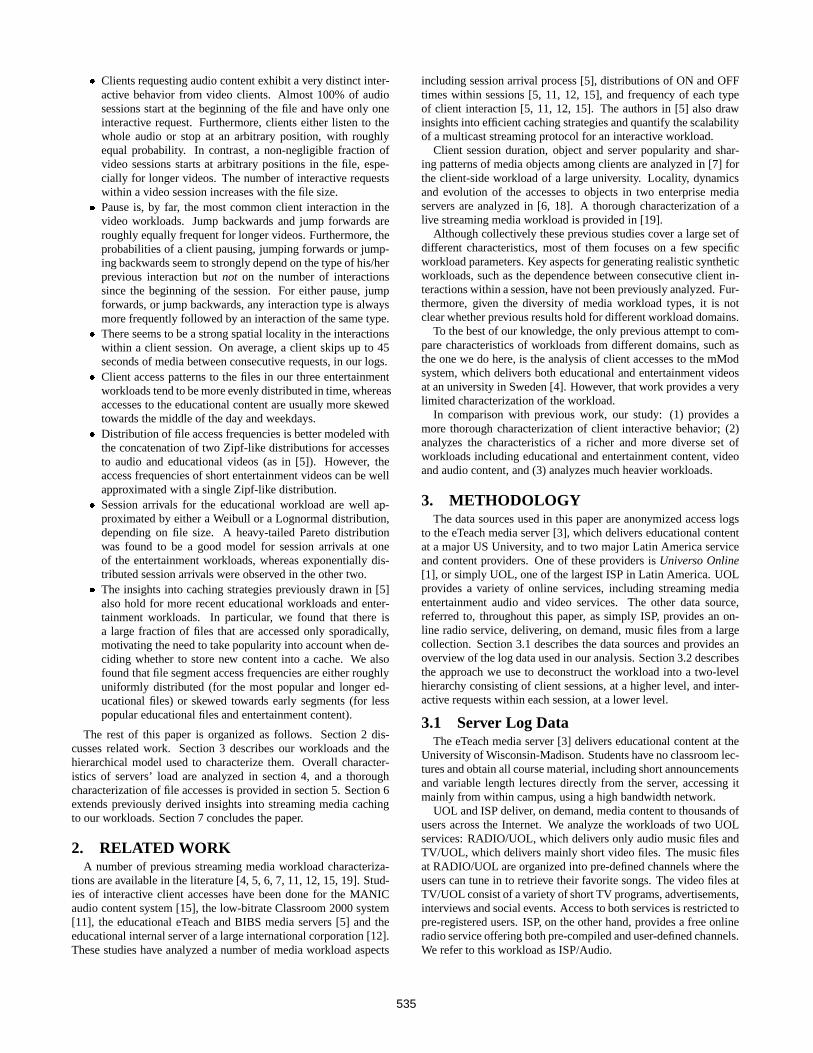
Workload eTeach TV/UOL RADIO/UOL ISP/AudioPeriod 09/02/00 - 10/17/01 01/18/02 - 03/01/02 01/07/02 - 01/30/02 06/01/03 - 06/07/03Days 411 43 24 7
Total # of unique files 230 42,439 70,479 42,746Total # of requests 46,958 1,453,117 5,385,822 4,160,889
Total media stored(hours) 80 1,303 4,775 2,765Total media retrieved(hours) 1,522 25,090 228,018 164,332Avg. # Requests / Day (CV) 114 (2.3) 33,793 (0.4) 224,409 (0.2) 594,413 (0.2)Avg. # Sessions / Day (CV) 31 (2.4) 27,718 (0.4) 209,426 (0.2) 572,032 (0.2)
Avg. # Hours Req./ Day (CV) 4 (2.3) 583 (0.4) 9,501 (0.2) 23,476 (0.2)Avg. # Unique File / Day (CV) 6 (1.3) 5,652 (0.3) 29,286 (0.1) 31,247 (0.03)
Avg. # Clients / Day (CV) 14 (1.9) 5,732 (0.4) 15,194 (0.2) 41,481 (0.1)
Table 1: Summary of the Workloads (CV = Coefficient of Variation).
Client
ServerStartposition
ONtime
OFFtime
Jump Distance
OFF time > threshold or request to another file terminates session
Interactive requestswithin session 1
Interactive requestswithin session 2
Startposition
UserInteraction
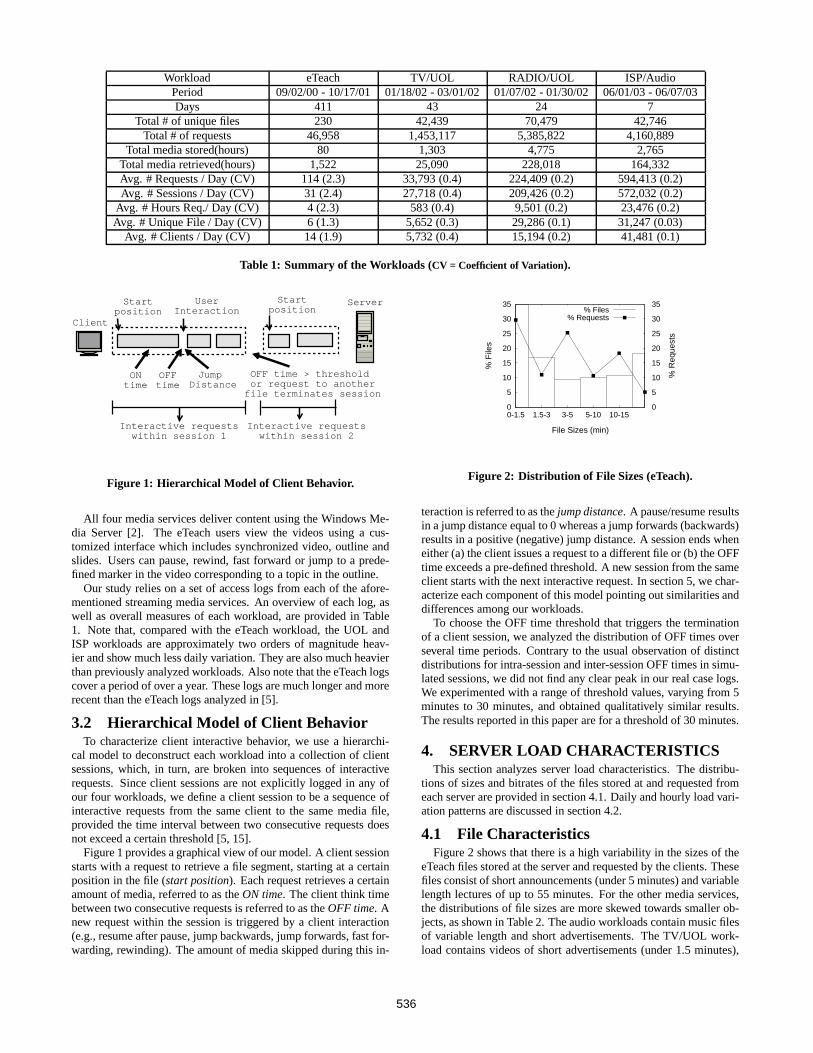
Figure 1: Hierarchical Model of Client Behavior.
All four media services deliver content using the Windows Me-dia Server [2]. The eTeach users view the videos using a cus-tomized interface which includes synchronized video, outline andslides. Users can pause, rewind, fast forward or jump to a prede-fined marker in the video corresponding to a topic in the outline.
Our study relies on a set of access logs from each of the afore-mentioned streaming media services. An overview of each log, aswell as overall measures of each workload, are provided in Table1. Note that, compared with the eTeach workload, the UOL andISP workloads are approximately two orders of magnitude heav-ier and show much less daily variation. They are also much heavierthan previously analyzed workloads. Also note that the eTeach logscover a period of over a year. These logs are much longer and morerecent than the eTeach logs analyzed in [5].
3.2 Hierarchical Model of Client BehaviorTo characterize client interactive behavior, we use a hierarchi-
cal model to deconstruct each workload into a collection of clientsessions, which, in turn, are broken into sequences of interactiverequests. Since client sessions are not explicitly logged in any ofour four workloads, we define a client session to be a sequence ofinteractive requests from the same client to the same media file,provided the time interval between two consecutive requests doesnot exceed a certain threshold [5, 15].
Figure 1 provides a graphical view of our model. A client sessionstarts with a request to retrieve a file segment, starting at a certainposition in the file (start position). Each request retrieves a certainamount of media, referred to as the ON time. The client think timebetween two consecutive requests is referred to as the OFF time. Anew request within the session is triggered by a client interaction(e.g., resume after pause, jump backwards, jump forwards, fast for-warding, rewinding). The amount of media skipped during this in-
0
5
10
15
20
25
30
35
0-1.5 1.5-3 3-5 5-10 10-15 0
5
10
15
20
25
30
35
% F
iles
% R
eque
sts
File Sizes (min)
% Files% Requests
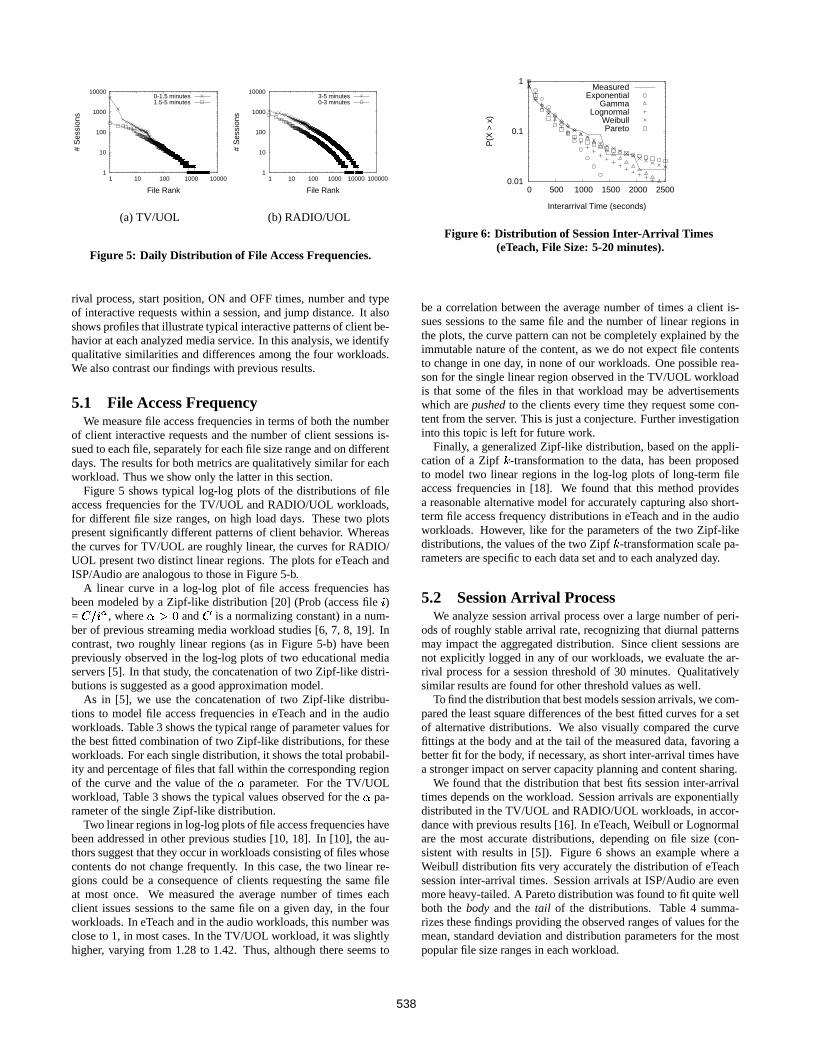
Figure 2: Distribution of File Sizes (eTeach).
teraction is referred to as the jump distance. A pause/resume resultsin a jump distance equal to 0 whereas a jump forwards (backwards)results in a positive (negative) jump distance. A session ends wheneither (a) the client issues a request to a different file or (b) the OFFtime exceeds a pre-defined threshold. A new session from the sameclient starts with the next interactive request. In section 5, we char-acterize each component of this model pointing out similarities anddifferences among our workloads.
To choose the OFF time threshold that triggers the terminationof a client session, we analyzed the distribution of OFF times overseveral time periods. Contrary to the usual observation of distinctdistributions for intra-session and inter-session OFF times in simu-lated sessions, we did not find any clear peak in our real case logs.We experimented with a range of threshold values, varying from 5minutes to 30 minutes, and obtained qualitatively similar results.The results reported in this paper are for a threshold of 30 minutes.
4. SERVER LOAD CHARACTERISTICSThis section analyzes server load characteristics. The distribu-
tions of sizes and bitrates of the files stored at and requested fromeach server are provided in section 4.1. Daily and hourly load vari-ation patterns are discussed in section 4.2.
4.1 File CharacteristicsFigure 2 shows that there is a high variability in the sizes of the
eTeach files stored at the server and requested by the clients. Thesefiles consist of short announcements (under 5 minutes) and variablelength lectures of up to 55 minutes. For the other media services,the distributions of file sizes are more skewed towards smaller ob-jects, as shown in Table 2. The audio workloads contain music filesof variable length and short advertisements. The TV/UOL work-load contains videos of short advertisements (under 1.5 minutes),
536

Workload File Size (min) % Files % Requests< 1.5 82 61
TV/UOL 1.5 - 5 15 335 - 15 3 6
< 3 27 18RADIO/UOL 3 - 5 57 68
5 - 10 16 14< 3 27 34
ISP/Audio 3 - 5 59 555 - 10 14 11
Table 2: Distribution of File Sizes (entertainment workloads).
clips, trailers and commercials (1.5-5 minutes), and news, socialevents and interviews (5-15 minutes).
In the entertainment workloads, the distributions of file sizesamong client sessions are similar to the distributions of file sizesamong client requests, shown in Table 2. In eTeach, on the otherhand, around 52% of the sessions are for short files (under 5 min-utes). The other sessions are roughly uniformly distributed acrossall size ranges. In comparison with the distribution of requested filesizes (Figure 2), this skewness suggests a larger number of requestswithin sessions for longer files, as discussed in section 5.
In both audio workloads, all files have low average bitrates (un-der 50 kbps). The TV/UOL workload has a more variable distribu-tion of file bitrates. Around 87% of the stored files and 49% of therequested files have average bitrates under 50 kbps. Most of the re-maining files have intermediate average bitrates of up to 250 kbps.The eTeach files are encoded at higher bitrates: around 91% of therequested files and 54% of the stored files have average bitrates inthe range of 300-350 kbps. The average bitrates of the remainingfiles are lower, mainly in the range of 200-300 kbps. The high bi-trates are not a problem for eTeach as its clients access the systemmainly from a high bandwidth network within campus.
4.2 Daily and Hourly Load VariationsFigure 3 shows daily load variation, measured in terms of the
number of requests and the average amount of media delivered perrequest, for each workload. The eTeach workload is the lightestone in terms of number of requests. However, the average amountof media delivered per request is around a couple of minutes foreTeach and the audio-only workloads but only one minute for theTV/UOL workload. Note that Figure 3-a shows load variations foreTeach over only 43 days (from Sept.
�����to Oct. ��� ��� , 2001), the
longest period of uninterrupted server activity in our 441-day log.Figure 3-a shows that eTeach presents weekly load patterns with
peaks around the middle of the week, when students have to turnin assignments, like observed in [5]. Such load variations are muchless pronounced in our entertainment workloads. In fact, accessesto content in our entertainment workloads tend to be more evenlydistributed in time, whereas accesses to the educational eTeach filestend to be concentrated around exam or assignment due dates. Thisresult confirms those in [4] for the accesses to the mMod serverdelivering content at an university in Sweden.
Figures 4-a and 4-b show hourly load variations for typical highload days in eTeach and TV/UOL, respectively. Unlike the eTeachworkload, which presents clear daily access patterns, the entertain-ment workload remains heavy during most of the day, droppingfor only a few hours early in the morning. The audio workloadspresent hourly load variations similar to the one in Figure 4-b. Theload peaks reach 18K (59K) requests and 850 (2400) hours of me-dia delivered per hour at RADIO/UOL (ISP/Audio).
Daily and hourly variations in the number of client sessions in
0
0.5
1
1.5
2
2.5
3
0 5 10 15 20 25 30 35 40 0
1
2
3
4
5
6
7
# R
eque
sts
(x 1
000)
Avg
. Med
ia /
Req
uest
(m
in)
Day
# RequestsMedia Delivered / Request
(a) eTeach
0
1
2
3
4
5
6
7
0 5 10 15 20 25 30 35 40 0
0.5
1
1.5
2
# R
eque
sts
(x 1
0000
)
Avg
. Med
ia /
Req
uest
(m
in)
Day
# RequestsMedia Delivered/ Request
(b) TV/UOL
0
0.5
1
1.5
2
2.5
3
3.5
4
0 5 10 15 20 0
0.5
1
1.5
2
2.5
3
3.5
4
# R
eque
sts
(x 1
0000
0)
Avg
. Med
ia /
Req
uest
(m
in)
Day
# RequestsMedia Delivered / Request
(c) RADIO/UOL
0 1 2 3 4 5 6 7 8 9
0 1 2 3 4 5 6 7 8 0
0.5
1
1.5
2
2.5
3
3.5
4
# R
eque
sts
(x 1
0000
0)
Avg
. Med
ia /
Req
uest
(m
in)
Day
# RequestsMedia Delivered / Request
(d) ISP/Audio
Figure 3: Daily Server Load Variations.
0
50
100
150
200
250
300
350
0 5 10 15 20 0
1
2
3
4
5
6
7
8
# R
eque
sts
# H
ours
Del
iver
edHour
# Requests# Hours
(a) eTeach
0
500
1000
1500
2000
2500
3000
3500
4000
4500
0 5 10 15 20 0
10
20
30
40
50
60
70
80
# R
eque
sts
# H
ours
Del
iver
ed
Hour
# Requests# Hours
(b) TV/UOL
Figure 4: Hourly Server Load Variations.
each workload follow similar patterns to those shown in Figures 3and 4, scaled down by a factor equal to the average number of in-teractive requests per session. We also measured the number of si-multaneous client sessions, observing peaks in the ranges of 10-13,80-130, 700-1000 and 2500-3000 sessions, for eTeach, TV/UOL,RADIO/UOL and ISP/Audio, respectively. Note that the numberof simultaneous client sessions reflects the number of simultane-ously open socket connections, which, in turn, has a direct impacton memory allocation and processing overheads at each service.
We selected a number of high load days (such as the ones inFigure 4) for deeper analysis, recognizing that the statistical char-acteristics of different workload aspects may vary with time. Wealso analyze the workload for files falling into different size rangesseparately, as the distributions may also depend on the file size andcontent type. Per day and per file size analyses of a large set ofworkload characteristics are provided in sections 5 and 6.
5. FILE ACCESS CHARACTERISTICSThis section analyzes each component of the workload model
described in section 3.2, namely, file access frequency, session ar-
537
1
10
100
1000
10000
1 10 100 1000 10000
# S
essi
ons
File Rank
0-1.5 minutes1.5-5 minutes
(a) TV/UOL
1
10
100
1000
10000
1 10 100 1000 10000 100000
# S
essi
ons
File Rank
3-5 minutes0-3 minutes
(b) RADIO/UOL
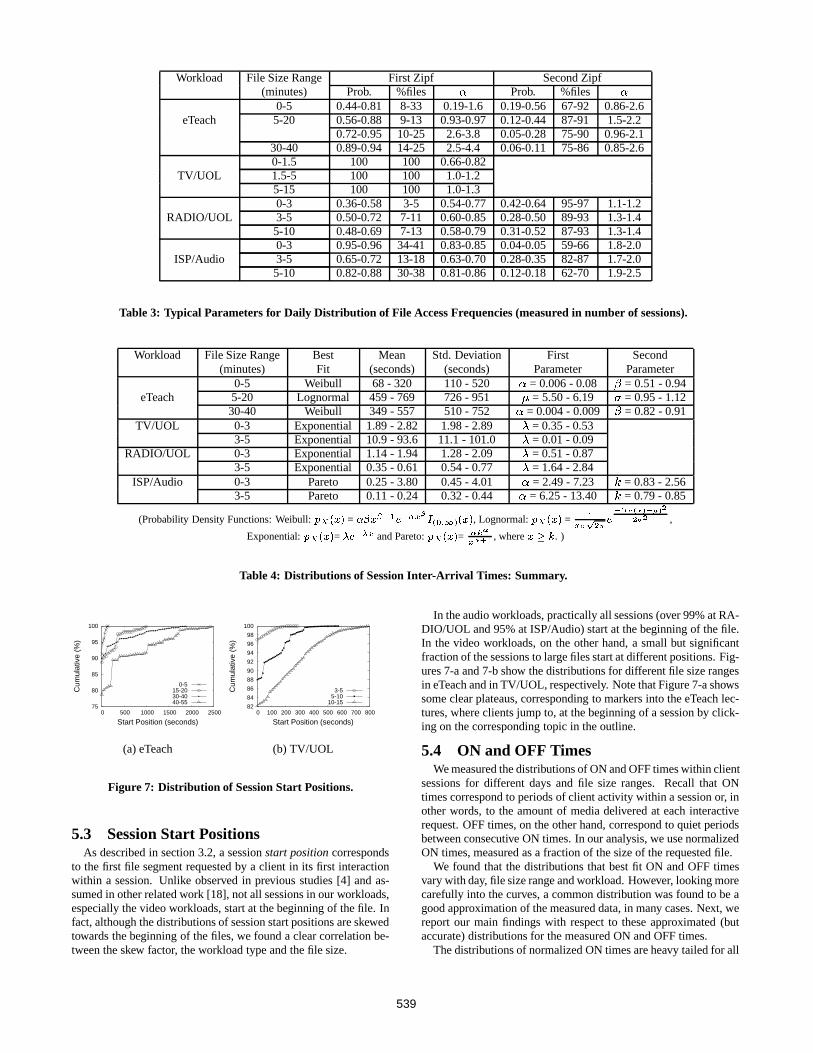
Figure 5: Daily Distribution of File Access Frequencies.
rival process, start position, ON and OFF times, number and typeof interactive requests within a session, and jump distance. It alsoshows profiles that illustrate typical interactive patterns of client be-havior at each analyzed media service. In this analysis, we identifyqualitative similarities and differences among the four workloads.We also contrast our findings with previous results.
5.1 File Access FrequencyWe measure file access frequencies in terms of both the number
of client interactive requests and the number of client sessions is-sued to each file, separately for each file size range and on differentdays. The results for both metrics are qualitatively similar for eachworkload. Thus we show only the latter in this section.
Figure 5 shows typical log-log plots of the distributions of fileaccess frequencies for the TV/UOL and RADIO/UOL workloads,for different file size ranges, on high load days. These two plotspresent significantly different patterns of client behavior. Whereasthe curves for TV/UOL are roughly linear, the curves for RADIO/UOL present two distinct linear regions. The plots for eTeach andISP/Audio are analogous to those in Figure 5-b.
A linear curve in a log-log plot of file access frequencies hasbeen modeled by a Zipf-like distribution [20] (Prob (access file � )= ������� , where ��� and � is a normalizing constant) in a num-ber of previous streaming media workload studies [6, 7, 8, 19]. Incontrast, two roughly linear regions (as in Figure 5-b) have beenpreviously observed in the log-log plots of two educational mediaservers [5]. In that study, the concatenation of two Zipf-like distri-butions is suggested as a good approximation model.
As in [5], we use the concatenation of two Zipf-like distribu-tions to model file access frequencies in eTeach and in the audioworkloads. Table 3 shows the typical range of parameter values forthe best fitted combination of two Zipf-like distributions, for theseworkloads. For each single distribution, it shows the total probabil-ity and percentage of files that fall within the corresponding regionof the curve and the value of the � parameter. For the TV/UOLworkload, Table 3 shows the typical values observed for the � pa-rameter of the single Zipf-like distribution.
Two linear regions in log-log plots of file access frequencies havebeen addressed in other previous studies [10, 18]. In [10], the au-thors suggest that they occur in workloads consisting of files whosecontents do not change frequently. In this case, the two linear re-gions could be a consequence of clients requesting the same fileat most once. We measured the average number of times eachclient issues sessions to the same file on a given day, in the fourworkloads. In eTeach and in the audio workloads, this number wasclose to 1, in most cases. In the TV/UOL workload, it was slightlyhigher, varying from 1.28 to 1.42. Thus, although there seems to
0.01
0.1
1
0 500 1000 1500 2000 2500
P(X
> x
)
Interarrival Time (seconds)
MeasuredExponential
GammaLognormal
WeibullPareto
Figure 6: Distribution of Session Inter-Arrival Times(eTeach, File Size: 5-20 minutes).
be a correlation between the average number of times a client is-sues sessions to the same file and the number of linear regions inthe plots, the curve pattern can not be completely explained by theimmutable nature of the content, as we do not expect file contentsto change in one day, in none of our workloads. One possible rea-son for the single linear region observed in the TV/UOL workloadis that some of the files in that workload may be advertisementswhich are pushed to the clients every time they request some con-tent from the server. This is just a conjecture. Further investigationinto this topic is left for future work.
Finally, a generalized Zipf-like distribution, based on the appli-cation of a Zipf � -transformation to the data, has been proposedto model two linear regions in the log-log plots of long-term fileaccess frequencies in [18]. We found that this method providesa reasonable alternative model for accurately capturing also short-term file access frequency distributions in eTeach and in the audioworkloads. However, like for the parameters of the two Zipf-likedistributions, the values of the two Zipf � -transformation scale pa-rameters are specific to each data set and to each analyzed day.
5.2 Session Arrival ProcessWe analyze session arrival process over a large number of peri-
ods of roughly stable arrival rate, recognizing that diurnal patternsmay impact the aggregated distribution. Since client sessions arenot explicitly logged in any of our workloads, we evaluate the ar-rival process for a session threshold of 30 minutes. Qualitativelysimilar results are found for other threshold values as well.
To find the distribution that best models session arrivals, we com-pared the least square differences of the best fitted curves for a setof alternative distributions. We also visually compared the curvefittings at the body and at the tail of the measured data, favoring abetter fit for the body, if necessary, as short inter-arrival times havea stronger impact on server capacity planning and content sharing.
We found that the distribution that best fits session inter-arrivaltimes depends on the workload. Session arrivals are exponentiallydistributed in the TV/UOL and RADIO/UOL workloads, in accor-dance with previous results [16]. In eTeach, Weibull or Lognormalare the most accurate distributions, depending on file size (con-sistent with results in [5]). Figure 6 shows an example where aWeibull distribution fits very accurately the distribution of eTeachsession inter-arrival times. Session arrivals at ISP/Audio are evenmore heavy-tailed. A Pareto distribution was found to fit quite wellboth the body and the tail of the distributions. Table 4 summa-rizes these findings providing the observed ranges of values for themean, standard deviation and distribution parameters for the mostpopular file size ranges in each workload.
538
Workload File Size Range First Zipf Second Zipf(minutes) Prob. %files � Prob. %files �
0-5 0.44-0.81 8-33 0.19-1.6 0.19-0.56 67-92 0.86-2.6eTeach 5-20 0.56-0.88 9-13 0.93-0.97 0.12-0.44 87-91 1.5-2.2
0.72-0.95 10-25 2.6-3.8 0.05-0.28 75-90 0.96-2.130-40 0.89-0.94 14-25 2.5-4.4 0.06-0.11 75-86 0.85-2.60-1.5 100 100 0.66-0.82
TV/UOL 1.5-5 100 100 1.0-1.25-15 100 100 1.0-1.30-3 0.36-0.58 3-5 0.54-0.77 0.42-0.64 95-97 1.1-1.2
RADIO/UOL 3-5 0.50-0.72 7-11 0.60-0.85 0.28-0.50 89-93 1.3-1.45-10 0.48-0.69 7-13 0.58-0.79 0.31-0.52 87-93 1.3-1.40-3 0.95-0.96 34-41 0.83-0.85 0.04-0.05 59-66 1.8-2.0
ISP/Audio 3-5 0.65-0.72 13-18 0.63-0.70 0.28-0.35 82-87 1.7-2.05-10 0.82-0.88 30-38 0.81-0.86 0.12-0.18 62-70 1.9-2.5
Table 3: Typical Parameters for Daily Distribution of File Access Frequencies (measured in number of sessions).
Workload File Size Range Best Mean Std. Deviation First Second(minutes) Fit (seconds) (seconds) Parameter Parameter
0-5 Weibull 68 - 320 110 - 520 � = 0.006 - 0.08 � = 0.51 - 0.94eTeach 5-20 Lognormal 459 - 769 726 - 951 � = 5.50 - 6.19 � = 0.95 - 1.12
30-40 Weibull 349 - 557 510 - 752 � = 0.004 - 0.009 � = 0.82 - 0.91TV/UOL 0-3 Exponential 1.89 - 2.82 1.98 - 2.89 � = 0.35 - 0.53
3-5 Exponential 10.9 - 93.6 11.1 - 101.0 � = 0.01 - 0.09RADIO/UOL 0-3 Exponential 1.14 - 1.94 1.28 - 2.09 � = 0.51 - 0.87
3-5 Exponential 0.35 - 0.61 0.54 - 0.77 � = 1.64 - 2.84ISP/Audio 0-3 Pareto 0.25 - 3.80 0.45 - 4.01 � = 2.49 - 7.23 � = 0.83 - 2.56
3-5 Pareto 0.11 - 0.24 0.32 - 0.44 � = 6.25 - 13.40 � = 0.79 - 0.85
(Probability Density Functions: Weibull: ������� = �� ����� ��� � ����������� � � � ��� , Lognormal: ��� ��� =�
��!�" �$#�&%�'�( )*'�+-,.%�/0,211$3 1 ,
Exponential: � � �4�� = 5 � �76 � and Pareto: � � �4�� = ��8�9� 9;:�< , where >=@? . )
Table 4: Distributions of Session Inter-Arrival Times: Summary.
75
80
85
90
95
100
0 500 1000 1500 2000 2500
Cum
ulat
ive
(%)
Start Position (seconds)
0-515-2030-4040-55
(a) eTeach
82
84
86
88
90
92
94
96
98
100
0 100 200 300 400 500 600 700 800
Cum
ulat
ive
(%)
Start Position (seconds)
3-55-10
10-15
(b) TV/UOL
Figure 7: Distribution of Session Start Positions.
5.3 Session Start PositionsAs described in section 3.2, a session start position corresponds
to the first file segment requested by a client in its first interactionwithin a session. Unlike observed in previous studies [4] and as-sumed in other related work [18], not all sessions in our workloads,especially the video workloads, start at the beginning of the file. Infact, although the distributions of session start positions are skewedtowards the beginning of the files, we found a clear correlation be-tween the skew factor, the workload type and the file size.
In the audio workloads, practically all sessions (over 99% at RA-DIO/UOL and 95% at ISP/Audio) start at the beginning of the file.In the video workloads, on the other hand, a small but significantfraction of the sessions to large files start at different positions. Fig-ures 7-a and 7-b show the distributions for different file size rangesin eTeach and in TV/UOL, respectively. Note that Figure 7-a showssome clear plateaus, corresponding to markers into the eTeach lec-tures, where clients jump to, at the beginning of a session by click-ing on the corresponding topic in the outline.
5.4 ON and OFF TimesWe measured the distributions of ON and OFF times within client
sessions for different days and file size ranges. Recall that ONtimes correspond to periods of client activity within a session or, inother words, to the amount of media delivered at each interactiverequest. OFF times, on the other hand, correspond to quiet periodsbetween consecutive ON times. In our analysis, we use normalizedON times, measured as a fraction of the size of the requested file.
We found that the distributions that best fit ON and OFF timesvary with day, file size range and workload. However, looking morecarefully into the curves, a common distribution was found to be agood approximation of the measured data, in many cases. Next, wereport our main findings with respect to these approximated (butaccurate) distributions for the measured ON and OFF times.
The distributions of normalized ON times are heavy tailed for all
539
Workload File Size Range Best Mean Std. Deviation First Second(minutes) Fit (% of file size) (% of file size) Parameter Parameter
0-5 Pareto 54 - 61 39 - 40 � = 0.23 - 0.32 � = 3.9 - 4.7eTeach 5-20 Weibull 3 - 32 2 - 36 � = 0.13 - 0.37 � = 0.62 - 1.5
20-55 Weibull 0.94 - 13 1.4 - 24 � = 0.21 - 1.2 � = 0.60 - 1.0TV/UOL 0-5 Pareto 46 - 85 28 - 41 � = 0.09 - 0.40 � = 3.0 - 6.4
5-15 Weibull 18 - 40 23 - 39 � = 0.03 - 0.15 � = 0.71 - 0.91RADIO/UOL 0-10 Pareto 58 - 79 32 - 42 � = 0.10 - 0.20 � = 2.2 - 4.6
ISP/Audio 0-10 Pareto 58 - 90 23 - 43 � = 0.06 - 0.19 � =1.9 - 6.8
Table 5: Distributions of Session ON Times: Summary.
Workload File Size Range Best Mean Std. Deviation First Second(minutes) Fit (seconds) (seconds) Parameter Parameter
eTeach 0-55 Weibull 55 - 82 134 - 214 � = 0.08 - 0.14 � = 0.54 - 0.66TV/UOL 0-15 Weibull 25 - 61 69 - 153 � = 0.09 - 0.17 � = 0.57 - 0.79
RADIO/UOL 0-10 Weibull 75 - 125 171 - 242 � = 0.06 - 0.07 � = 0.61 - 0.71ISP/Audio 0-1.5 Weibull 555 557 � = 0.01 � = 0.75
1.5-10 Weibull 176 - 236 307 - 381 � = 0.09 - 0.10 � = 0.50 - 0.52
Table 6: Distributions of Session OFF Times: Summary.
file sizes in all four workloads. For short videos and audio files, aPareto distribution fits well the measured data. For large videos, thedistribution of normalized ON times is better modeled by a Weibulldistribution. Table 5 summarizes these results.
One interesting observed trend is that clients usually request alarger fraction of audio and shorter video files. In fact, these filesare frequently fully requested, which generates a heavy tail in thedistribution of measured ON times. A Pareto distribution capturesthis tail much more accurately than the other distributions we tested(Exponential, LogNormal, Weibull and Gamma). Pareto was alsofound to be a good model for the body of the distribution. Note that,in absolute terms, the amount of media retrieved by each interactiverequest increases with file size, as observed in [5].
A Weibull distribution was also found to be a good fit for thedistribution of OFF times, in all four workloads, for all file sizes,as shown in Table 6. Note that heavy tailed distributions were alsoobserved for the ON and OFF times in the workloads analyzed in[5, 15]. However, an exponential distribution was found to be agood fit for the ON times of short files in [5].
5.5 Session Interactive RequestsTo create a realistic synthetic workload, one needs a model for
the interactive requests a client issues within a session. In particu-lar, one needs the distribution of the number of interactive requests,the relative frequency of each interaction type (e.g., pause, jumpforwards, jump backwards) and the distribution of jump distances.This section analyzes these three workload aspects.
Our results show that, like for the session start position, clientinteractive behavior is strongly correlated to content type and filesize. In particular, clients of the video files, especially the longereducational videos, have a highly interactive behavior, issuing anumber of requests within the same session. On the other hand,our audio sessions have, on average, only one client request.
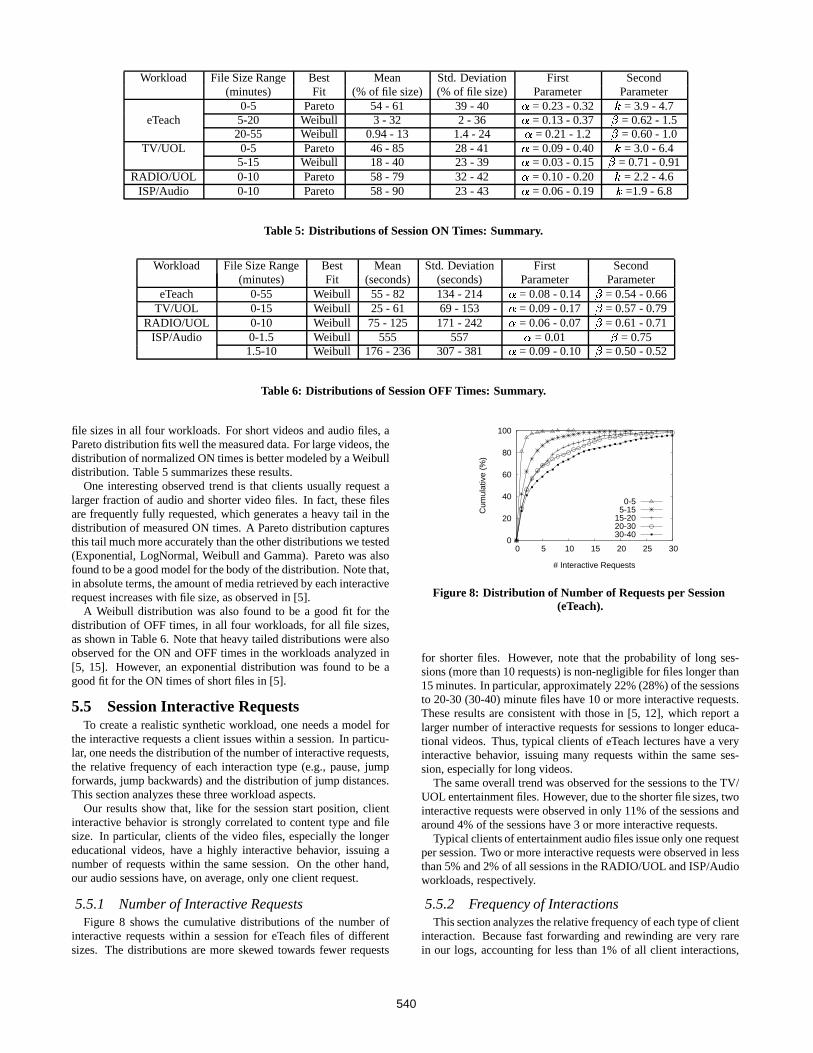
5.5.1 Number of Interactive RequestsFigure 8 shows the cumulative distributions of the number of
interactive requests within a session for eTeach files of differentsizes. The distributions are more skewed towards fewer requests
0
20
40
60
80
100
0 5 10 15 20 25 30
Cum
ulat
ive
(%)
# Interactive Requests
0-55-15
15-2020-3030-40
Figure 8: Distribution of Number of Requests per Session(eTeach).
for shorter files. However, note that the probability of long ses-sions (more than 10 requests) is non-negligible for files longer than15 minutes. In particular, approximately 22% (28%) of the sessionsto 20-30 (30-40) minute files have 10 or more interactive requests.These results are consistent with those in [5, 12], which report alarger number of interactive requests for sessions to longer educa-tional videos. Thus, typical clients of eTeach lectures have a veryinteractive behavior, issuing many requests within the same ses-sion, especially for long videos.
The same overall trend was observed for the sessions to the TV/UOL entertainment files. However, due to the shorter file sizes, twointeractive requests were observed in only 11% of the sessions andaround 4% of the sessions have 3 or more interactive requests.
Typical clients of entertainment audio files issue only one requestper session. Two or more interactive requests were observed in lessthan 5% and 2% of all sessions in the RADIO/UOL and ISP/Audioworkloads, respectively.
5.5.2 Frequency of InteractionsThis section analyzes the relative frequency of each type of client
interaction. Because fast forwarding and rewinding are very rarein our logs, accounting for less than 1% of all client interactions,
540
Workload File # Reqs / % % Jump % JumpSize Session Pause Back Forward0-5 1.66 72 20 7
5-15 2.87 64 19 17eTeach 15-20 4.74 57 25 17
20-30 5.18 56 26 1830-40 7.01 56 22 2240-55 4.19 48 17 350-1.5 1.12 92 7 1
TV/UOL 1.5-3 1.24 87 8 53-5 1.29 83 13 4
5-10 1.28 85 8 7
Table 7: Relative Frequency of Each Type of Client Interaction.
Figure 9: Variations in the Probabilities of Two ConsecutiveClient Interactions (eTeach).
we measure only the probabilities of a client pausing, jumping for-wards and jumping backwards within a session. Since the vast ma-jority of the audio sessions have only one interactive request, wefocus only on the video workloads (eTeach and TV/UOL).
Table 7 shows the average number of interactive requests andthe average frequencies of pause, jump forwards and jump back-wards observed in the eTeach and TV/UOL sessions. Note thatthe last request within a session is accounted for as a pause in ouranalysis. As in [5, 12], the average number of interactive requestssomewhat increases with the file size, especially in eTeach sessions.Pause is the most common interaction in both workloads, especiallyfor short files. As file size increases, the percentage of pauses de-creases, and the percentage of jump forwards increases. In otherwords, clients tend to skip more uninteresting file segments as theywatch longer videos. The frequency of jump backwards remainsroughly stable across all file size ranges in both workloads. Forlarge files, the probabilities of jump forwards and jump backwardsare roughly the same (except for eTeach files in the range of 40-55minutes), as in [5, 11]. In contrast, the educational workload ana-lyzed in [15] had a much stronger predominance of jump forwards.
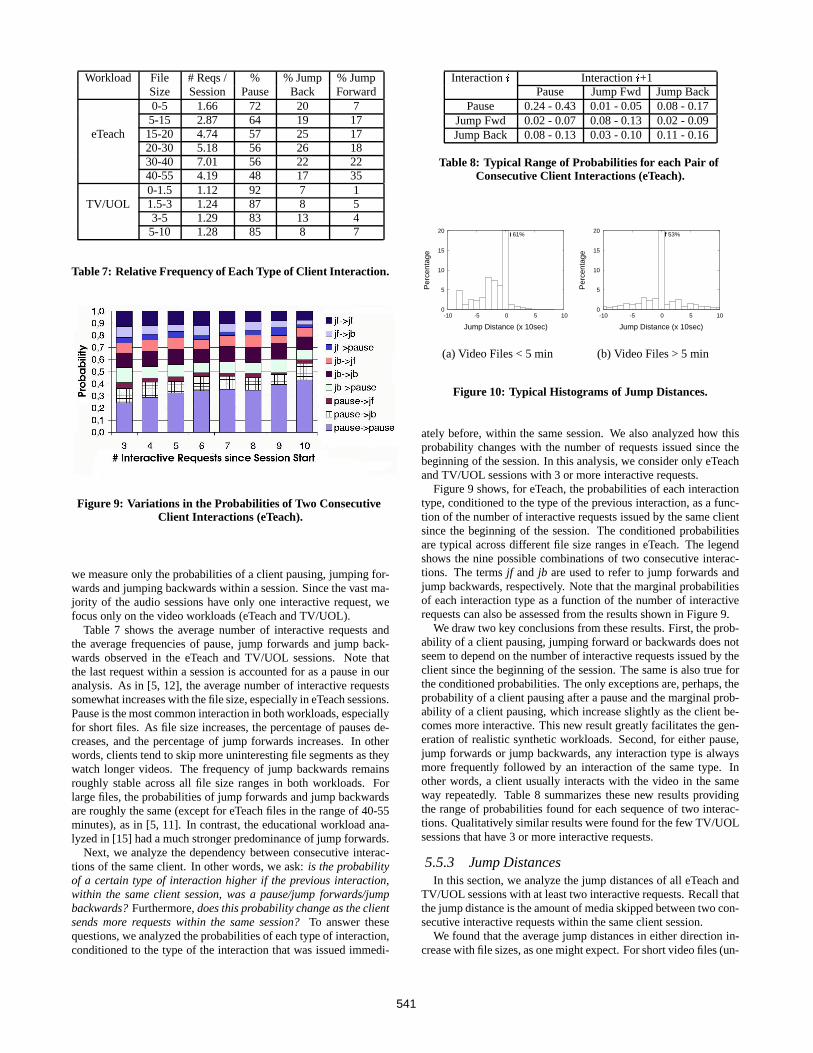
Next, we analyze the dependency between consecutive interac-tions of the same client. In other words, we ask: is the probabilityof a certain type of interaction higher if the previous interaction,within the same client session, was a pause/jump forwards/jumpbackwards? Furthermore, does this probability change as the clientsends more requests within the same session? To answer thesequestions, we analyzed the probabilities of each type of interaction,conditioned to the type of the interaction that was issued immedi-
Interaction � Interaction � +1Pause Jump Fwd Jump Back
Pause 0.24 - 0.43 0.01 - 0.05 0.08 - 0.17Jump Fwd 0.02 - 0.07 0.08 - 0.13 0.02 - 0.09Jump Back 0.08 - 0.13 0.03 - 0.10 0.11 - 0.16
Table 8: Typical Range of Probabilities for each Pair ofConsecutive Client Interactions (eTeach).
0
5
10
15
20
-10 -5 0 5 10
Per
cent
age
Jump Distance (x 10sec)
61%
(a) Video Files < 5 min
0
5
10
15
20
-10 -5 0 5 10
Per
cent
age
Jump Distance (x 10sec)
53%
(b) Video Files > 5 min
Figure 10: Typical Histograms of Jump Distances.
ately before, within the same session. We also analyzed how thisprobability changes with the number of requests issued since thebeginning of the session. In this analysis, we consider only eTeachand TV/UOL sessions with 3 or more interactive requests.
Figure 9 shows, for eTeach, the probabilities of each interactiontype, conditioned to the type of the previous interaction, as a func-tion of the number of interactive requests issued by the same clientsince the beginning of the session. The conditioned probabilitiesare typical across different file size ranges in eTeach. The legendshows the nine possible combinations of two consecutive interac-tions. The terms jf and jb are used to refer to jump forwards andjump backwards, respectively. Note that the marginal probabilitiesof each interaction type as a function of the number of interactiverequests can also be assessed from the results shown in Figure 9.
We draw two key conclusions from these results. First, the prob-ability of a client pausing, jumping forward or backwards does notseem to depend on the number of interactive requests issued by theclient since the beginning of the session. The same is also true forthe conditioned probabilities. The only exceptions are, perhaps, theprobability of a client pausing after a pause and the marginal prob-ability of a client pausing, which increase slightly as the client be-comes more interactive. This new result greatly facilitates the gen-eration of realistic synthetic workloads. Second, for either pause,jump forwards or jump backwards, any interaction type is alwaysmore frequently followed by an interaction of the same type. Inother words, a client usually interacts with the video in the sameway repeatedly. Table 8 summarizes these new results providingthe range of probabilities found for each sequence of two interac-tions. Qualitatively similar results were found for the few TV/UOLsessions that have 3 or more interactive requests.
5.5.3 Jump DistancesIn this section, we analyze the jump distances of all eTeach and
TV/UOL sessions with at least two interactive requests. Recall thatthe jump distance is the amount of media skipped between two con-secutive interactive requests within the same client session.
We found that the average jump distances in either direction in-crease with file sizes, as one might expect. For short video files (un-
541
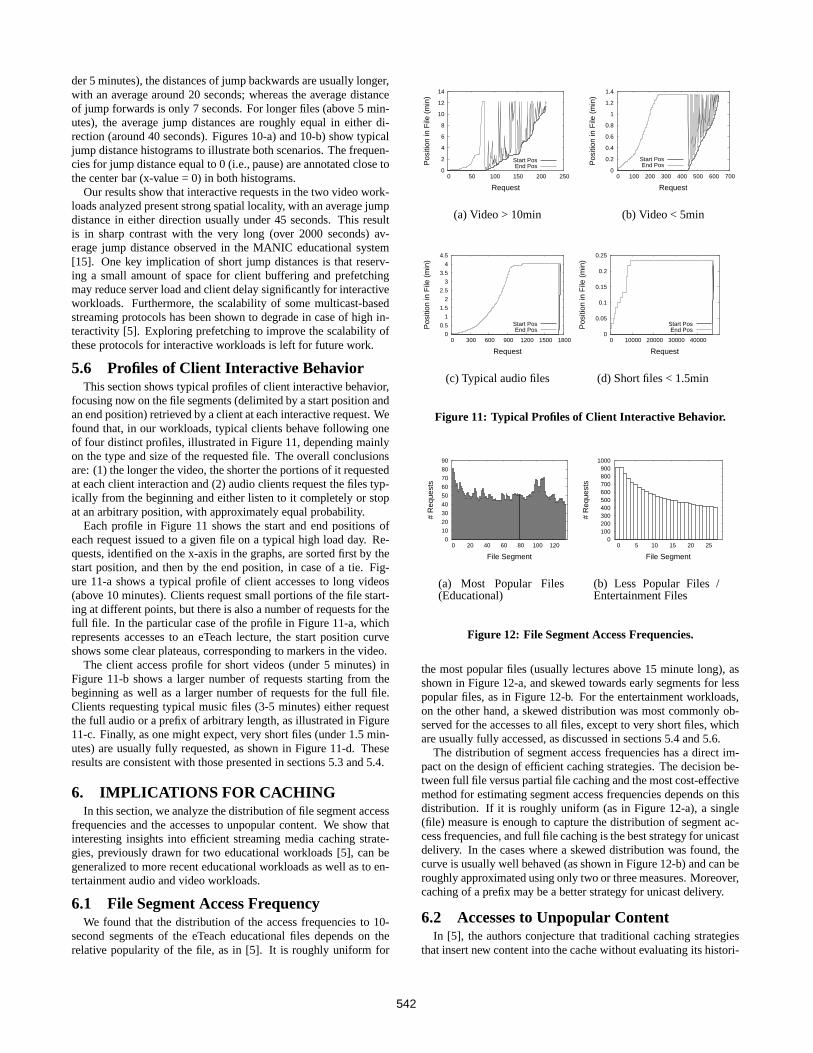
der 5 minutes), the distances of jump backwards are usually longer,with an average around 20 seconds; whereas the average distanceof jump forwards is only 7 seconds. For longer files (above 5 min-utes), the average jump distances are roughly equal in either di-rection (around 40 seconds). Figures 10-a) and 10-b) show typicaljump distance histograms to illustrate both scenarios. The frequen-cies for jump distance equal to 0 (i.e., pause) are annotated close tothe center bar (x-value = 0) in both histograms.
Our results show that interactive requests in the two video work-loads analyzed present strong spatial locality, with an average jumpdistance in either direction usually under 45 seconds. This resultis in sharp contrast with the very long (over 2000 seconds) av-erage jump distance observed in the MANIC educational system[15]. One key implication of short jump distances is that reserv-ing a small amount of space for client buffering and prefetchingmay reduce server load and client delay significantly for interactiveworkloads. Furthermore, the scalability of some multicast-basedstreaming protocols has been shown to degrade in case of high in-teractivity [5]. Exploring prefetching to improve the scalability ofthese protocols for interactive workloads is left for future work.
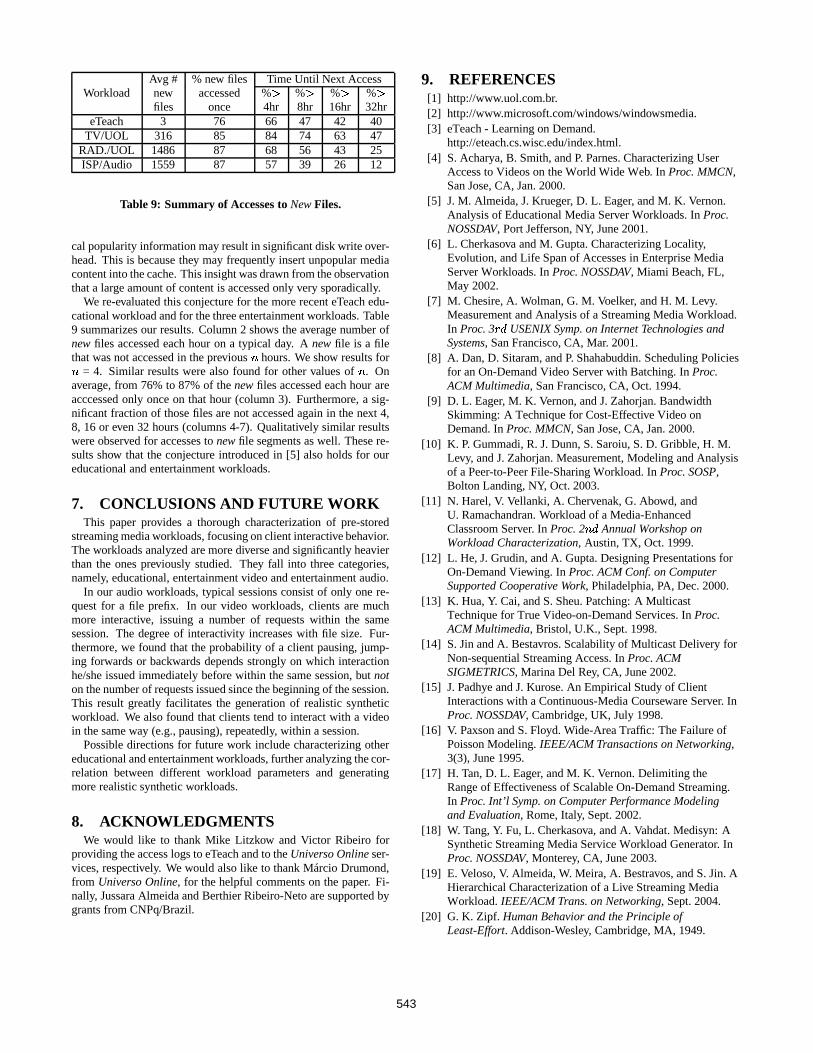
5.6 Profiles of Client Interactive BehaviorThis section shows typical profiles of client interactive behavior,
focusing now on the file segments (delimited by a start position andan end position) retrieved by a client at each interactive request. Wefound that, in our workloads, typical clients behave following oneof four distinct profiles, illustrated in Figure 11, depending mainlyon the type and size of the requested file. The overall conclusionsare: (1) the longer the video, the shorter the portions of it requestedat each client interaction and (2) audio clients request the files typ-ically from the beginning and either listen to it completely or stopat an arbitrary position, with approximately equal probability.
Each profile in Figure 11 shows the start and end positions ofeach request issued to a given file on a typical high load day. Re-quests, identified on the x-axis in the graphs, are sorted first by thestart position, and then by the end position, in case of a tie. Fig-ure 11-a shows a typical profile of client accesses to long videos(above 10 minutes). Clients request small portions of the file start-ing at different points, but there is also a number of requests for thefull file. In the particular case of the profile in Figure 11-a, whichrepresents accesses to an eTeach lecture, the start position curveshows some clear plateaus, corresponding to markers in the video.
The client access profile for short videos (under 5 minutes) inFigure 11-b shows a larger number of requests starting from thebeginning as well as a larger number of requests for the full file.Clients requesting typical music files (3-5 minutes) either requestthe full audio or a prefix of arbitrary length, as illustrated in Figure11-c. Finally, as one might expect, very short files (under 1.5 min-utes) are usually fully requested, as shown in Figure 11-d. Theseresults are consistent with those presented in sections 5.3 and 5.4.
6. IMPLICATIONS FOR CACHINGIn this section, we analyze the distribution of file segment access
frequencies and the accesses to unpopular content. We show thatinteresting insights into efficient streaming media caching strate-gies, previously drawn for two educational workloads [5], can begeneralized to more recent educational workloads as well as to en-tertainment audio and video workloads.
6.1 File Segment Access FrequencyWe found that the distribution of the access frequencies to 10-
second segments of the eTeach educational files depends on therelative popularity of the file, as in [5]. It is roughly uniform for
0
2
4
6
8
10
12
14
0 50 100 150 200 250
Pos
ition
in F
ile (
min
)
Request
Start PosEnd Pos
(a) Video > 10min
0
0.2
0.4
0.6
0.8
1
1.2
1.4
0 100 200 300 400 500 600 700
Pos
ition
in F
ile (
min
)
Request
Start PosEnd Pos
(b) Video < 5min
0
0.5
1
1.5
2
2.5
3
3.5
4
4.5
0 300 600 900 1200 1500 1800
Pos
ition
in F
ile (
min
)
Request
Start PosEnd Pos
(c) Typical audio files
0
0.05
0.1
0.15
0.2
0.25
0 10000 20000 30000 40000
Pos
ition
in F
ile (
min
)
Request
Start PosEnd Pos
(d) Short files < 1.5min
Figure 11: Typical Profiles of Client Interactive Behavior.
0
10
20
30
40
50
60
70
80
90
0 20 40 60 80 100 120
# R
eque
sts
File Segment
(a) Most Popular Files(Educational)
0 100 200 300 400 500 600 700 800 900
1000
0 5 10 15 20 25
# R
eque
sts
File Segment
(b) Less Popular Files /Entertainment Files
Figure 12: File Segment Access Frequencies.
the most popular files (usually lectures above 15 minute long), asshown in Figure 12-a, and skewed towards early segments for lesspopular files, as in Figure 12-b. For the entertainment workloads,on the other hand, a skewed distribution was most commonly ob-served for the accesses to all files, except to very short files, whichare usually fully accessed, as discussed in sections 5.4 and 5.6.
The distribution of segment access frequencies has a direct im-pact on the design of efficient caching strategies. The decision be-tween full file versus partial file caching and the most cost-effectivemethod for estimating segment access frequencies depends on thisdistribution. If it is roughly uniform (as in Figure 12-a), a single(file) measure is enough to capture the distribution of segment ac-cess frequencies, and full file caching is the best strategy for unicastdelivery. In the cases where a skewed distribution was found, thecurve is usually well behaved (as shown in Figure 12-b) and can beroughly approximated using only two or three measures. Moreover,caching of a prefix may be a better strategy for unicast delivery.
6.2 Accesses to Unpopular ContentIn [5], the authors conjecture that traditional caching strategies
that insert new content into the cache without evaluating its histori-
542
Avg # % new files Time Until Next AccessWorkload new accessed % � % � % � % �
files once 4hr 8hr 16hr 32hreTeach 3 76 66 47 42 40
TV/UOL 316 85 84 74 63 47RAD./UOL 1486 87 68 56 43 25ISP/Audio 1559 87 57 39 26 12
Table 9: Summary of Accesses to New Files.
cal popularity information may result in significant disk write over-head. This is because they may frequently insert unpopular mediacontent into the cache. This insight was drawn from the observationthat a large amount of content is accessed only very sporadically.
We re-evaluated this conjecture for the more recent eTeach edu-cational workload and for the three entertainment workloads. Table9 summarizes our results. Column 2 shows the average number ofnew files accessed each hour on a typical day. A new file is a filethat was not accessed in the previous � hours. We show results for
� = 4. Similar results were also found for other values of � . Onaverage, from 76% to 87% of the new files accessed each hour areacccessed only once on that hour (column 3). Furthermore, a sig-nificant fraction of those files are not accessed again in the next 4,8, 16 or even 32 hours (columns 4-7). Qualitatively similar resultswere observed for accesses to new file segments as well. These re-sults show that the conjecture introduced in [5] also holds for oureducational and entertainment workloads.
7. CONCLUSIONS AND FUTURE WORKThis paper provides a thorough characterization of pre-stored
streaming media workloads, focusing on client interactive behavior.The workloads analyzed are more diverse and significantly heavierthan the ones previously studied. They fall into three categories,namely, educational, entertainment video and entertainment audio.
In our audio workloads, typical sessions consist of only one re-quest for a file prefix. In our video workloads, clients are muchmore interactive, issuing a number of requests within the samesession. The degree of interactivity increases with file size. Fur-thermore, we found that the probability of a client pausing, jump-ing forwards or backwards depends strongly on which interactionhe/she issued immediately before within the same session, but noton the number of requests issued since the beginning of the session.This result greatly facilitates the generation of realistic syntheticworkload. We also found that clients tend to interact with a videoin the same way (e.g., pausing), repeatedly, within a session.
Possible directions for future work include characterizing othereducational and entertainment workloads, further analyzing the cor-relation between different workload parameters and generatingmore realistic synthetic workloads.
8. ACKNOWLEDGMENTSWe would like to thank Mike Litzkow and Victor Ribeiro for
providing the access logs to eTeach and to the Universo Online ser-vices, respectively. We would also like to thank Márcio Drumond,from Universo Online, for the helpful comments on the paper. Fi-nally, Jussara Almeida and Berthier Ribeiro-Neto are supported bygrants from CNPq/Brazil.
9. REFERENCES[1] http://www.uol.com.br.[2] http://www.microsoft.com/windows/windowsmedia.[3] eTeach - Learning on Demand.
http://eteach.cs.wisc.edu/index.html.[4] S. Acharya, B. Smith, and P. Parnes. Characterizing User
Access to Videos on the World Wide Web. In Proc. MMCN,San Jose, CA, Jan. 2000.
[5] J. M. Almeida, J. Krueger, D. L. Eager, and M. K. Vernon.Analysis of Educational Media Server Workloads. In Proc.NOSSDAV, Port Jefferson, NY, June 2001.
[6] L. Cherkasova and M. Gupta. Characterizing Locality,Evolution, and Life Span of Accesses in Enterprise MediaServer Workloads. In Proc. NOSSDAV, Miami Beach, FL,May 2002.
[7] M. Chesire, A. Wolman, G. M. Voelker, and H. M. Levy.Measurement and Analysis of a Streaming Media Workload.In Proc. 3 �
�USENIX Symp. on Internet Technologies and
Systems, San Francisco, CA, Mar. 2001.[8] A. Dan, D. Sitaram, and P. Shahabuddin. Scheduling Policies
for an On-Demand Video Server with Batching. In Proc.ACM Multimedia, San Francisco, CA, Oct. 1994.
[9] D. L. Eager, M. K. Vernon, and J. Zahorjan. BandwidthSkimming: A Technique for Cost-Effective Video onDemand. In Proc. MMCN, San Jose, CA, Jan. 2000.
[10] K. P. Gummadi, R. J. Dunn, S. Saroiu, S. D. Gribble, H. M.Levy, and J. Zahorjan. Measurement, Modeling and Analysisof a Peer-to-Peer File-Sharing Workload. In Proc. SOSP,Bolton Landing, NY, Oct. 2003.
[11] N. Harel, V. Vellanki, A. Chervenak, G. Abowd, andU. Ramachandran. Workload of a Media-EnhancedClassroom Server. In Proc. 2 �
�Annual Workshop on
Workload Characterization, Austin, TX, Oct. 1999.[12] L. He, J. Grudin, and A. Gupta. Designing Presentations for
On-Demand Viewing. In Proc. ACM Conf. on ComputerSupported Cooperative Work, Philadelphia, PA, Dec. 2000.
[13] K. Hua, Y. Cai, and S. Sheu. Patching: A MulticastTechnique for True Video-on-Demand Services. In Proc.ACM Multimedia, Bristol, U.K., Sept. 1998.
[14] S. Jin and A. Bestavros. Scalability of Multicast Delivery forNon-sequential Streaming Access. In Proc. ACMSIGMETRICS, Marina Del Rey, CA, June 2002.
[15] J. Padhye and J. Kurose. An Empirical Study of ClientInteractions with a Continuous-Media Courseware Server. InProc. NOSSDAV, Cambridge, UK, July 1998.
[16] V. Paxson and S. Floyd. Wide-Area Traffic: The Failure ofPoisson Modeling. IEEE/ACM Transactions on Networking,3(3), June 1995.
[17] H. Tan, D. L. Eager, and M. K. Vernon. Delimiting theRange of Effectiveness of Scalable On-Demand Streaming.In Proc. Int’l Symp. on Computer Performance Modelingand Evaluation, Rome, Italy, Sept. 2002.
[18] W. Tang, Y. Fu, L. Cherkasova, and A. Vahdat. Medisyn: ASynthetic Streaming Media Service Workload Generator. InProc. NOSSDAV, Monterey, CA, June 2003.
[19] E. Veloso, V. Almeida, W. Meira, A. Bestravos, and S. Jin. AHierarchical Characterization of a Live Streaming MediaWorkload. IEEE/ACM Trans. on Networking, Sept. 2004.
[20] G. K. Zipf. Human Behavior and the Principle ofLeast-Effort. Addison-Wesley, Cambridge, MA, 1949.
543
Related Documents