Analytically derived fragility curves for unreinforced masonry buildings in urban contexts D. D’Ayala University of Bath, United Kingdom E. Kishali Kocaeli University, Turkey SUMMARY: Masonry buildings are the most common form of dwelling worldwide and at the same time one of the most vulnerable to seismic action. Large numbers of casualties and substantial economic losses are associated with masonry building partial and total collapses in urban and rural areas. Usually studies of vulnerability of masonry structures are conducted within an empirical framework, based on past observation and historic damage data. However empirical approaches have limitation in terms of regional applicability and comparison among different typological and geographical context. The paper presents an analytical approach, FaMIVE, based on limit state analysis, which allows defining capacity curves and performance points for masonry structures. The analytical development of the procedure from derivation of the ultimate capacity to the identification of the damage states in terms of drift, to the convolution of the capacity and spectral curves to identify performance points for given level of shaking is presented. Fragility curves are then derived. An application to masonry structures in Turkey shows the advantages of this approach. This work was carried out within the framework of the WHE-PAGER project (http://pager.world-housing.net/) Keywords: Vulnerability functions, Masonry, Performance based assessment, 1. INTRODUCTION Masonry buildings are vulnerable to seismic actions. A number of analytical procedures exist in literature for the evaluation of the vulnerability of unreinforced masonry structures. However they focus mainly on the in-plane behaviours of walls, considering only mechanisms of failure associated with the shear capacity of piers. For this mechanism to be the effective failure behaviour several conditions need to be met, among which, small size opening resulting in stiff spandrel and stock piers, and walls being stabilised by the load of the horizontal structures. However the limits of this approach has been clearly demonstrated by the analysis of damage patterns and collapses of substantially different unreinforced masonry building stocks such as the ones recently exposed to the l'Aquila, Italy and Christchurch, New Zealand earthquake. In both cases the majority of collapses and serious structural damage are due to out-of-plane failures of walls. The paper presents a procedure FaMIVE, based on a mechanical approach, which allows to define capacity curves and performance points for masonry structures of Turkey within the framework of the N2 method (Fajfar 1999) at the basis of the EC8 assessment guidelines for existing structures. Twelve different mechanisms are considered and capacity curves are derived to d in terms of lateral capacity and ultimate displacement. This allows for direct comparison of vulnerability functions and fragility functions of building stocks in Turkish urban and rural areas, comprised mainly of masonry buildings. The paper also presents the analytical development of the procedure from derivation of the ultimate capacity to the identification of the damage states in terms of drift, to the convolution of the capacity and spectral curves to identify performance points for given level of shaking.

Welcome message from author
This document is posted to help you gain knowledge. Please leave a comment to let me know what you think about it! Share it to your friends and learn new things together.
Transcript
Analytically derived fragility curves for unreinforced
masonry buildings in urban contexts
D. D’Ayala University of Bath, United Kingdom
E. Kishali Kocaeli University, Turkey
SUMMARY:
Masonry buildings are the most common form of dwelling worldwide and at the same time one of the most
vulnerable to seismic action. Large numbers of casualties and substantial economic losses are associated with
masonry building partial and total collapses in urban and rural areas. Usually studies of vulnerability of masonry
structures are conducted within an empirical framework, based on past observation and historic damage data.
However empirical approaches have limitation in terms of regional applicability and comparison among different
typological and geographical context. The paper presents an analytical approach, FaMIVE, based on limit state
analysis, which allows defining capacity curves and performance points for masonry structures. The analytical
development of the procedure from derivation of the ultimate capacity to the identification of the damage states
in terms of drift, to the convolution of the capacity and spectral curves to identify performance points for given
level of shaking is presented. Fragility curves are then derived. An application to masonry structures in Turkey
shows the advantages of this approach. This work was carried out within the framework of the WHE-PAGER
project (http://pager.world-housing.net/)
Keywords: Vulnerability functions, Masonry, Performance based assessment,
1. INTRODUCTION
Masonry buildings are vulnerable to seismic actions. A number of analytical procedures exist in
literature for the evaluation of the vulnerability of unreinforced masonry structures. However they
focus mainly on the in-plane behaviours of walls, considering only mechanisms of failure associated
with the shear capacity of piers. For this mechanism to be the effective failure behaviour several
conditions need to be met, among which, small size opening resulting in stiff spandrel and stock piers,
and walls being stabilised by the load of the horizontal structures. However the limits of this approach
has been clearly demonstrated by the analysis of damage patterns and collapses of substantially
different unreinforced masonry building stocks such as the ones recently exposed to the l'Aquila, Italy
and Christchurch, New Zealand earthquake. In both cases the majority of collapses and serious
structural damage are due to out-of-plane failures of walls.
The paper presents a procedure FaMIVE, based on a mechanical approach, which allows to define
capacity curves and performance points for masonry structures of Turkey within the framework of the
N2 method (Fajfar 1999) at the basis of the EC8 assessment guidelines for existing structures. Twelve
different mechanisms are considered and capacity curves are derived to d in terms of lateral capacity
and ultimate displacement. This allows for direct comparison of vulnerability functions and fragility
functions of building stocks in Turkish urban and rural areas, comprised mainly of masonry buildings.
The paper also presents the analytical development of the procedure from derivation of the ultimate
capacity to the identification of the damage states in terms of drift, to the convolution of the capacity
and spectral curves to identify performance points for given level of shaking.
2. APPLICATION OF FAMIVE METHODOLOGY TO MASONRY TYPOLOGIES
2.1 General Information
For the computation of capacity curves for masonry structures a number of procedures are available in
literature. These are based either on the equivalent frame approach or on the mechanism approach.
Among the first, in the past decade a relatively significant number of procedures aimed at defining
reliable analytical vulnerability function for masonry structures in urban context have been published
(Lang and Bachmann (2004), Erberik (2008), Borzi et al. (2008), Erdik et al. (2003)). Although they
share similar conceptual hypotheses they differ substantially by modelling complexity, numerical
complexity, geographic validity of the model, treatment of uncertainties. Far fewer are the approaches
based on mechanical behaviour, VULNUS (Bernardini et al., 2000) and FaMIVE (D’Ayala &
Speranza 2003).
2.2. Masonry Typologies
The residential building stock in Turkey is still largely dominated by masonry construction both in
rural and urban areas. The data related to masonry structures in Turkey is provided by Middle East
Technical University (METU) (Erberik 2008, Erberik 2010). For the present study METU provided
data and description of index buildings for the following PAGER structure typologies (Jaiswal et al.
2008) : adobe (A1), rubble stone masonry in mud mortar with earth or metal roof (RS2), massive stone
masonry in lime mortar with timber floors (MS), unreinforced bricks in mud mortar (UFB1),
unreinforced bricks in cement mortar with timber floors (UFB4), unreinforced bricks in cement mortar
with reinforced concrete floors (UFB5) and unreinforced concrete blocks in lime/cement mortar
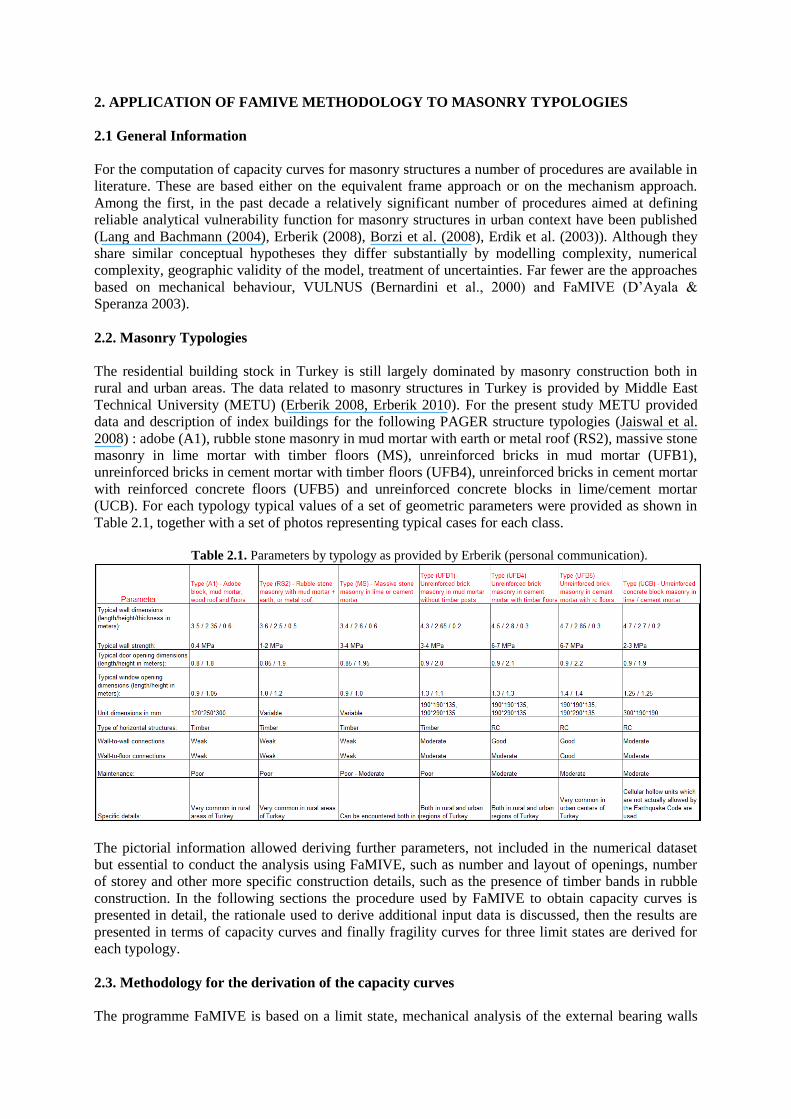
(UCB). For each typology typical values of a set of geometric parameters were provided as shown in
Table 2.1, together with a set of photos representing typical cases for each class.
Table 2.1. Parameters by typology as provided by Erberik (personal communication).
The pictorial information allowed deriving further parameters, not included in the numerical dataset
but essential to conduct the analysis using FaMIVE, such as number and layout of openings, number
of storey and other more specific construction details, such as the presence of timber bands in rubble
construction. In the following sections the procedure used by FaMIVE to obtain capacity curves is
presented in detail, the rationale used to derive additional input data is discussed, then the results are
presented in terms of capacity curves and finally fragility curves for three limit states are derived for
each typology.
2.3. Methodology for the derivation of the capacity curves
The programme FaMIVE is based on a limit state, mechanical analysis of the external bearing walls
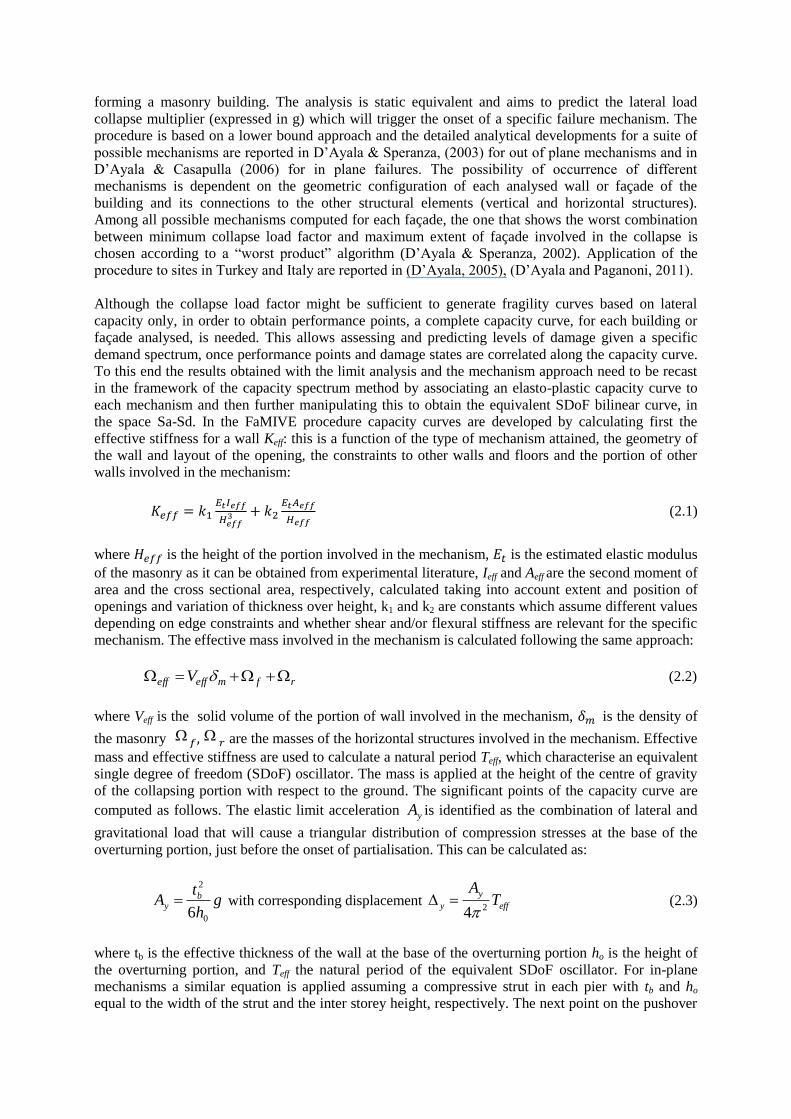
forming a masonry building. The analysis is static equivalent and aims to predict the lateral load
collapse multiplier (expressed in g) which will trigger the onset of a specific failure mechanism. The
procedure is based on a lower bound approach and the detailed analytical developments for a suite of
possible mechanisms are reported in D’Ayala & Speranza, (2003) for out of plane mechanisms and in
D’Ayala & Casapulla (2006) for in plane failures. The possibility of occurrence of different
mechanisms is dependent on the geometric configuration of each analysed wall or façade of the
building and its connections to the other structural elements (vertical and horizontal structures).
Among all possible mechanisms computed for each façade, the one that shows the worst combination
between minimum collapse load factor and maximum extent of façade involved in the collapse is
chosen according to a “worst product” algorithm (D’Ayala & Speranza, 2002). Application of the
procedure to sites in Turkey and Italy are reported in (D’Ayala, 2005), (D’Ayala and Paganoni, 2011).
Although the collapse load factor might be sufficient to generate fragility curves based on lateral
capacity only, in order to obtain performance points, a complete capacity curve, for each building or
façade analysed, is needed. This allows assessing and predicting levels of damage given a specific
demand spectrum, once performance points and damage states are correlated along the capacity curve.
To this end the results obtained with the limit analysis and the mechanism approach need to be recast
in the framework of the capacity spectrum method by associating an elasto-plastic capacity curve to
each mechanism and then further manipulating this to obtain the equivalent SDoF bilinear curve, in
the space Sa-Sd. In the FaMIVE procedure capacity curves are developed by calculating first the
effective stiffness for a wall Keff: this is a function of the type of mechanism attained, the geometry of
the wall and layout of the opening, the constraints to other walls and floors and the portion of other
walls involved in the mechanism:
(2.1)
where is the height of the portion involved in the mechanism, is the estimated elastic modulus
of the masonry as it can be obtained from experimental literature, Ieff and Aeff are the second moment of
area and the cross sectional area, respectively, calculated taking into account extent and position of
openings and variation of thickness over height, k1 and k2 are constants which assume different values
depending on edge constraints and whether shear and/or flexural stiffness are relevant for the specific
mechanism. The effective mass involved in the mechanism is calculated following the same approach:
rfmeffeff V (2.2)
where Veff is the solid volume of the portion of wall involved in the mechanism, is the density of
the masonry are the masses of the horizontal structures involved in the mechanism. Effective
mass and effective stiffness are used to calculate a natural period Teff, which characterise an equivalent
single degree of freedom (SDoF) oscillator. The mass is applied at the height of the centre of gravity
of the collapsing portion with respect to the ground. The significant points of the capacity curve are
computed as follows. The elastic limit acceleration yA is identified as the combination of lateral and
gravitational load that will cause a triangular distribution of compression stresses at the base of the
overturning portion, just before the onset of partialisation. This can be calculated as:
gh
tA b
y
0
2
6
with corresponding displacement eff
y
y TA
24
(2.3)
where tb is the effective thickness of the wall at the base of the overturning portion ho is the height of
the overturning portion, and Teff the natural period of the equivalent SDoF oscillator. For in-plane
mechanisms a similar equation is applied assuming a compressive strut in each pier with tb and ho
equal to the width of the strut and the inter storey height, respectively. The next point on the pushover
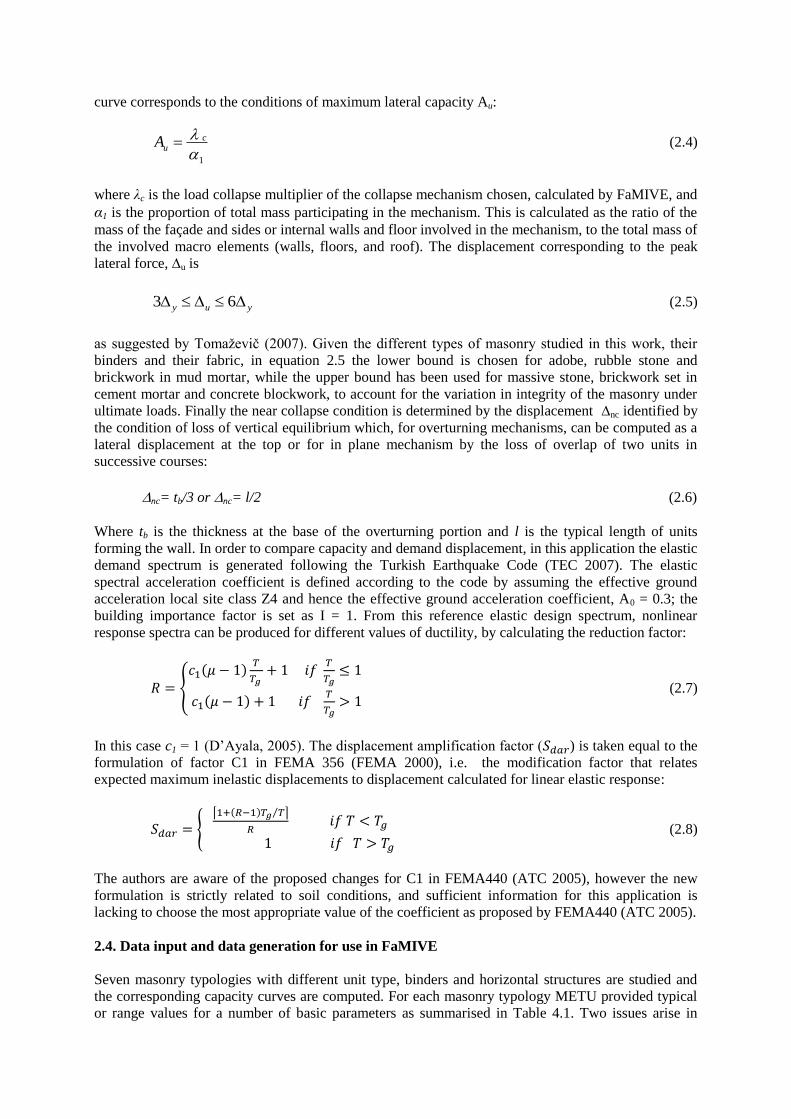
curve corresponds to the conditions of maximum lateral capacity Au:
1
cuA
(2.4)
where λc is the load collapse multiplier of the collapse mechanism chosen, calculated by FaMIVE, and
α1 is the proportion of total mass participating in the mechanism. This is calculated as the ratio of the
mass of the façade and sides or internal walls and floor involved in the mechanism, to the total mass of
the involved macro elements (walls, floors, and roof). The displacement corresponding to the peak
lateral force, ∆u is
yuy 63 (2.5)
as suggested by Tomaževič (2007). Given the different types of masonry studied in this work, their
binders and their fabric, in equation 2.5 the lower bound is chosen for adobe, rubble stone and
brickwork in mud mortar, while the upper bound has been used for massive stone, brickwork set in
cement mortar and concrete blockwork, to account for the variation in integrity of the masonry under
ultimate loads. Finally the near collapse condition is determined by the displacement ∆nc identified by
the condition of loss of vertical equilibrium which, for overturning mechanisms, can be computed as a
lateral displacement at the top or for in plane mechanism by the loss of overlap of two units in
successive courses:
nc= tb/3 or nc= l/2 (2.6)
Where tb is the thickness at the base of the overturning portion and l is the typical length of units
forming the wall. In order to compare capacity and demand displacement, in this application the elastic
demand spectrum is generated following the Turkish Earthquake Code (TEC 2007). The elastic
spectral acceleration coefficient is defined according to the code by assuming the effective ground
acceleration local site class Z4 and hence the effective ground acceleration coefficient, A0 = 0.3; the
building importance factor is set as I = 1. From this reference elastic design spectrum, nonlinear
response spectra can be produced for different values of ductility, by calculating the reduction factor:
{ ( )
( )
(2.7)
In this case c1 = 1 (D’Ayala, 2005). The displacement amplification factor ( ) is taken equal to the
formulation of factor C1 in FEMA 356 (FEMA 2000), i.e. the modification factor that relates
expected maximum inelastic displacements to displacement calculated for linear elastic response:
{⌈ ( ) ⁄ ⌉
(2.8)
The authors are aware of the proposed changes for C1 in FEMA440 (ATC 2005), however the new
formulation is strictly related to soil conditions, and sufficient information for this application is
lacking to choose the most appropriate value of the coefficient as proposed by FEMA440 (ATC 2005).
2.4. Data input and data generation for use in FaMIVE
Seven masonry typologies with different unit type, binders and horizontal structures are studied and
the corresponding capacity curves are computed. For each masonry typology METU provided typical
or range values for a number of basic parameters as summarised in Table 4.1. Two issues arise in
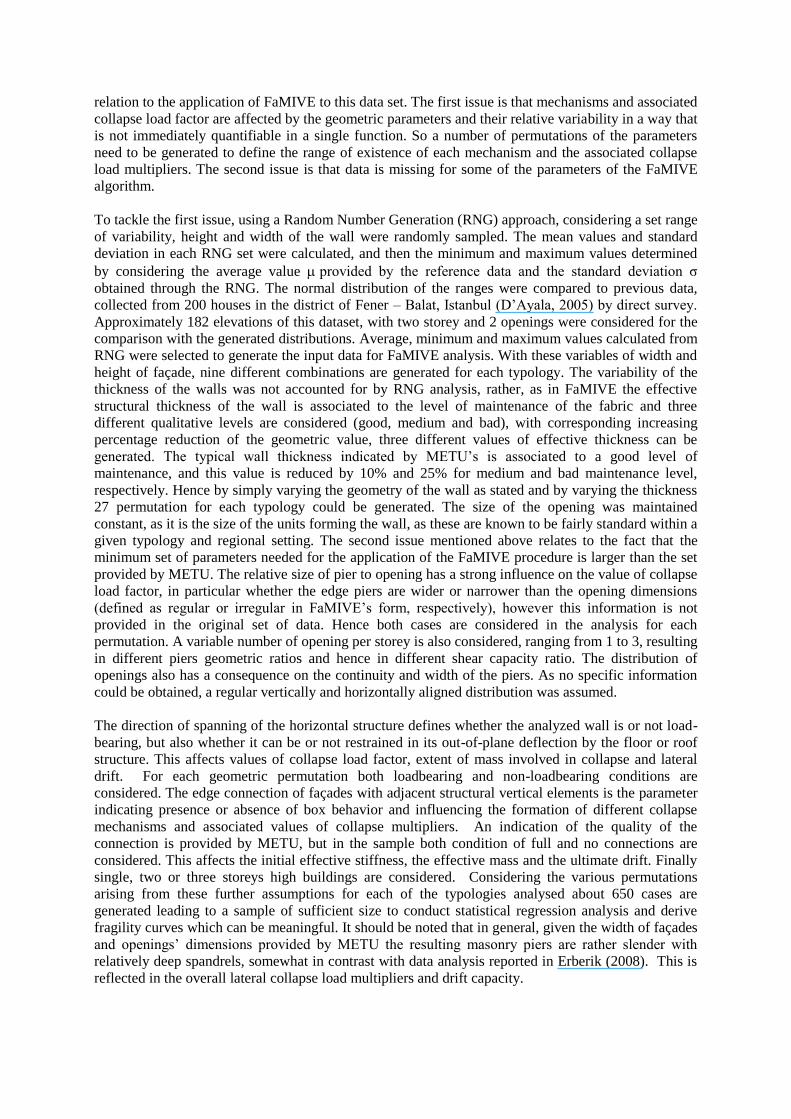
relation to the application of FaMIVE to this data set. The first issue is that mechanisms and associated
collapse load factor are affected by the geometric parameters and their relative variability in a way that
is not immediately quantifiable in a single function. So a number of permutations of the parameters
need to be generated to define the range of existence of each mechanism and the associated collapse
load multipliers. The second issue is that data is missing for some of the parameters of the FaMIVE
algorithm.
To tackle the first issue, using a Random Number Generation (RNG) approach, considering a set range
of variability, height and width of the wall were randomly sampled. The mean values and standard
deviation in each RNG set were calculated, and then the minimum and maximum values determined
by considering the average value provided by the reference data and the standard deviation σ
obtained through the RNG. The normal distribution of the ranges were compared to previous data,
collected from 200 houses in the district of Fener – Balat, Istanbul (D’Ayala, 2005) by direct survey.
Approximately 182 elevations of this dataset, with two storey and 2 openings were considered for the
comparison with the generated distributions. Average, minimum and maximum values calculated from
RNG were selected to generate the input data for FaMIVE analysis. With these variables of width and
height of façade, nine different combinations are generated for each typology. The variability of the
thickness of the walls was not accounted for by RNG analysis, rather, as in FaMIVE the effective
structural thickness of the wall is associated to the level of maintenance of the fabric and three
different qualitative levels are considered (good, medium and bad), with corresponding increasing
percentage reduction of the geometric value, three different values of effective thickness can be
generated. The typical wall thickness indicated by METU’s is associated to a good level of
maintenance, and this value is reduced by 10% and 25% for medium and bad maintenance level,
respectively. Hence by simply varying the geometry of the wall as stated and by varying the thickness
27 permutation for each typology could be generated. The size of the opening was maintained
constant, as it is the size of the units forming the wall, as these are known to be fairly standard within a
given typology and regional setting. The second issue mentioned above relates to the fact that the
minimum set of parameters needed for the application of the FaMIVE procedure is larger than the set
provided by METU. The relative size of pier to opening has a strong influence on the value of collapse
load factor, in particular whether the edge piers are wider or narrower than the opening dimensions
(defined as regular or irregular in FaMIVE’s form, respectively), however this information is not
provided in the original set of data. Hence both cases are considered in the analysis for each
permutation. A variable number of opening per storey is also considered, ranging from 1 to 3, resulting
in different piers geometric ratios and hence in different shear capacity ratio. The distribution of
openings also has a consequence on the continuity and width of the piers. As no specific information
could be obtained, a regular vertically and horizontally aligned distribution was assumed.
The direction of spanning of the horizontal structure defines whether the analyzed wall is or not load-
bearing, but also whether it can be or not restrained in its out-of-plane deflection by the floor or roof
structure. This affects values of collapse load factor, extent of mass involved in collapse and lateral
drift. For each geometric permutation both loadbearing and non-loadbearing conditions are
considered. The edge connection of façades with adjacent structural vertical elements is the parameter
indicating presence or absence of box behavior and influencing the formation of different collapse
mechanisms and associated values of collapse multipliers. An indication of the quality of the
connection is provided by METU, but in the sample both condition of full and no connections are
considered. This affects the initial effective stiffness, the effective mass and the ultimate drift. Finally
single, two or three storeys high buildings are considered. Considering the various permutations
arising from these further assumptions for each of the typologies analysed about 650 cases are
generated leading to a sample of sufficient size to conduct statistical regression analysis and derive
fragility curves which can be meaningful. It should be noted that in general, given the width of façades
and openings’ dimensions provided by METU the resulting masonry piers are rather slender with
relatively deep spandrels, somewhat in contrast with data analysis reported in Erberik (2008). This is
reflected in the overall lateral collapse load multipliers and drift capacity.
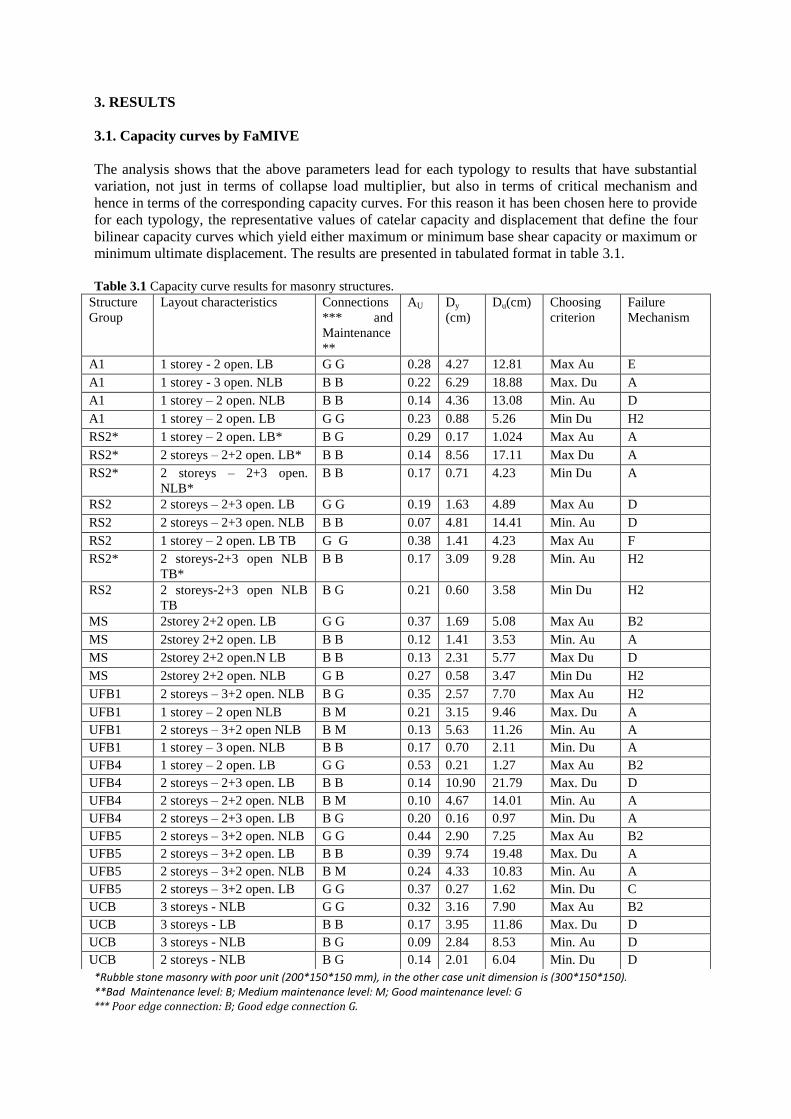
3. RESULTS
3.1. Capacity curves by FaMIVE
The analysis shows that the above parameters lead for each typology to results that have substantial
variation, not just in terms of collapse load multiplier, but also in terms of critical mechanism and
hence in terms of the corresponding capacity curves. For this reason it has been chosen here to provide
for each typology, the representative values of catelar capacity and displacement that define the four
bilinear capacity curves which yield either maximum or minimum base shear capacity or maximum or
minimum ultimate displacement. The results are presented in tabulated format in table 3.1.
Table 3.1 Capacity curve results for masonry structures.
*Rubble stone masonry with poor unit (200*150*150 mm), in the other case unit dimension is (300*150*150). **Bad Maintenance level: B; Medium maintenance level: M; Good maintenance level: G *** Poor edge connection: B; Good edge connection G.
Structure
Group
Layout characteristics Connections
*** and
Maintenance
**
AU Dy
(cm)
Du(cm) Choosing
criterion
Failure
Mechanism
A1 1 storey - 2 open. LB G G 0.28 4.27 12.81 Max Au E
A1 1 storey - 3 open. NLB B B 0.22 6.29 18.88 Max. Du A
A1 1 storey – 2 open. NLB B B 0.14 4.36 13.08 Min. Au D
A1 1 storey – 2 open. LB G G 0.23 0.88 5.26 Min Du H2
RS2* 1 storey – 2 open. LB* B G 0.29 0.17 1.024 Max Au A
RS2* 2 storeys – 2+2 open. LB* B B 0.14 8.56 17.11 Max Du A
RS2* 2 storeys – 2+3 open.
NLB*
B B 0.17 0.71 4.23 Min Du A
RS2 2 storeys – 2+3 open. LB G G 0.19 1.63 4.89 Max Au D
RS2 2 storeys – 2+3 open. NLB B B 0.07 4.81 14.41 Min. Au D
RS2 1 storey – 2 open. LB TB G G 0.38 1.41 4.23 Max Au F
RS2* 2 storeys-2+3 open NLB
TB*
B B 0.17 3.09 9.28 Min. Au H2
RS2 2 storeys-2+3 open NLB
TB
B G 0.21 0.60 3.58 Min Du H2
MS 2storey 2+2 open. LB G G 0.37 1.69 5.08 Max Au B2
MS 2storey 2+2 open. LB B B 0.12 1.41 3.53 Min. Au A
MS 2storey 2+2 open.N LB B B 0.13 2.31 5.77 Max Du D
MS 2storey 2+2 open. NLB G B 0.27 0.58 3.47 Min Du H2
UFB1 2 storeys – 3+2 open. NLB B G 0.35 2.57 7.70 Max Au H2
UFB1 1 storey – 2 open NLB B M 0.21 3.15 9.46 Max. Du A
UFB1 2 storeys – 3+2 open NLB B M 0.13 5.63 11.26 Min. Au A
UFB1 1 storey – 3 open. NLB B B 0.17 0.70 2.11 Min. Du A
UFB4 1 storey – 2 open. LB G G 0.53 0.21 1.27 Max Au B2
UFB4 2 storeys – 2+3 open. LB B B 0.14 10.90 21.79 Max. Du D
UFB4 2 storeys – 2+2 open. NLB B M 0.10 4.67 14.01 Min. Au A
UFB4 2 storeys – 2+3 open. LB B G 0.20 0.16 0.97 Min. Du A
UFB5 2 storeys – 3+2 open. NLB G G 0.44 2.90 7.25 Max Au B2
UFB5 2 storeys – 3+2 open. LB B B 0.39 9.74 19.48 Max. Du A
UFB5 2 storeys – 3+2 open. NLB B M 0.24 4.33 10.83 Min. Au A
UFB5 2 storeys – 3+2 open. LB G G 0.37 0.27 1.62 Min. Du C
UCB 3 storeys - NLB G G 0.32 3.16 7.90 Max Au B2
UCB 3 storeys - LB B B 0.17 3.95 11.86 Max. Du D
UCB 3 storeys - NLB B G 0.09 2.84 8.53 Min. Au D
UCB 2 storeys - NLB B G 0.14 2.01 6.04 Min. Du D
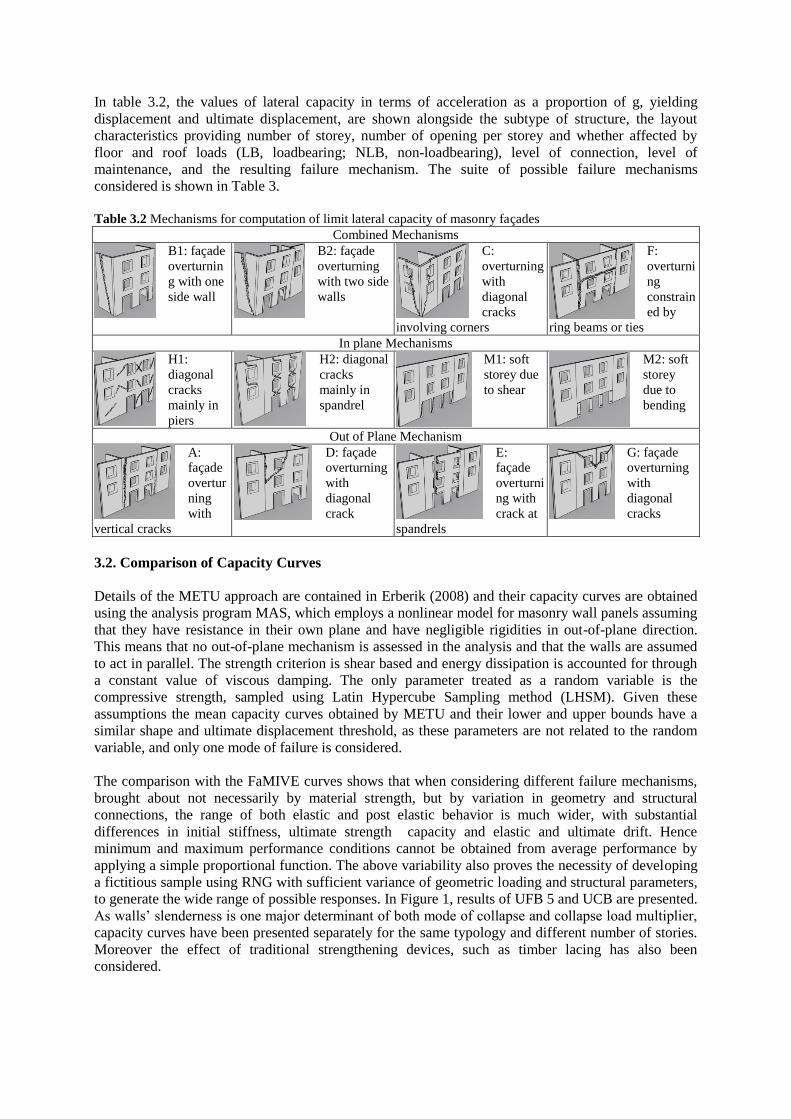
In table 3.2, the values of lateral capacity in terms of acceleration as a proportion of g, yielding
displacement and ultimate displacement, are shown alongside the subtype of structure, the layout
characteristics providing number of storey, number of opening per storey and whether affected by
floor and roof loads (LB, loadbearing; NLB, non-loadbearing), level of connection, level of
maintenance, and the resulting failure mechanism. The suite of possible failure mechanisms
considered is shown in Table 3.
Table 3.2 Mechanisms for computation of limit lateral capacity of masonry façades
Combined Mechanisms
B1: façade
overturnin
g with one
side wall
B2: façade
overturning
with two side
walls
C:
overturning
with
diagonal
cracks
involving corners
F:
overturni
ng
constrain
ed by
ring beams or ties
In plane Mechanisms
H1:
diagonal
cracks
mainly in
piers
H2: diagonal
cracks
mainly in
spandrel
M1: soft
storey due
to shear
M2: soft
storey
due to
bending
Out of Plane Mechanism
A:
façade
overtur
ning
with
vertical cracks
D: façade
overturning
with
diagonal
crack
E:
façade
overturni
ng with
crack at
spandrels
G: façade
overturning
with
diagonal
cracks
3.2. Comparison of Capacity Curves
Details of the METU approach are contained in Erberik (2008) and their capacity curves are obtained
using the analysis program MAS, which employs a nonlinear model for masonry wall panels assuming
that they have resistance in their own plane and have negligible rigidities in out-of-plane direction.
This means that no out-of-plane mechanism is assessed in the analysis and that the walls are assumed
to act in parallel. The strength criterion is shear based and energy dissipation is accounted for through
a constant value of viscous damping. The only parameter treated as a random variable is the
compressive strength, sampled using Latin Hypercube Sampling method (LHSM). Given these
assumptions the mean capacity curves obtained by METU and their lower and upper bounds have a
similar shape and ultimate displacement threshold, as these parameters are not related to the random
variable, and only one mode of failure is considered.
The comparison with the FaMIVE curves shows that when considering different failure mechanisms,
brought about not necessarily by material strength, but by variation in geometry and structural
connections, the range of both elastic and post elastic behavior is much wider, with substantial
differences in initial stiffness, ultimate strength capacity and elastic and ultimate drift. Hence
minimum and maximum performance conditions cannot be obtained from average performance by
applying a simple proportional function. The above variability also proves the necessity of developing
a fictitious sample using RNG with sufficient variance of geometric loading and structural parameters,
to generate the wide range of possible responses. In Figure 1, results of UFB 5 and UCB are presented.
As walls’ slenderness is one major determinant of both mode of collapse and collapse load multiplier,
capacity curves have been presented separately for the same typology and different number of stories.
Moreover the effect of traditional strengthening devices, such as timber lacing has also been
considered.
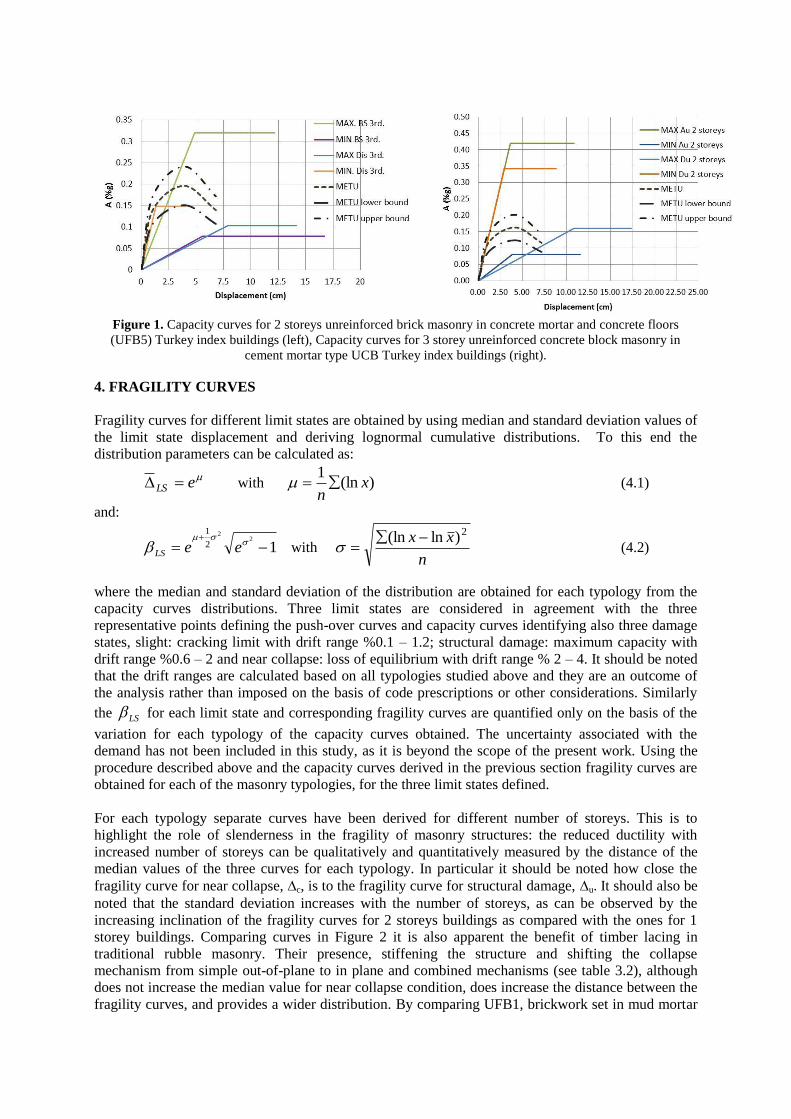
Figure 1. Capacity curves for 2 storeys unreinforced brick masonry in concrete mortar and concrete floors
(UFB5) Turkey index buildings (left), Capacity curves for 3 storey unreinforced concrete block masonry in
cement mortar type UCB Turkey index buildings (right).
4. FRAGILITY CURVES
Fragility curves for different limit states are obtained by using median and standard deviation values of
the limit state displacement and deriving lognormal cumulative distributions. To this end the
distribution parameters can be calculated as:
eLS with )(ln1
xn (4.1)
and:
12
2
2
1
eeLS with n
xx 2)ln(ln (4.2)
where the median and standard deviation of the distribution are obtained for each typology from the
capacity curves distributions. Three limit states are considered in agreement with the three
representative points defining the push-over curves and capacity curves identifying also three damage
states, slight: cracking limit with drift range %0.1 – 1.2; structural damage: maximum capacity with
drift range %0.6 – 2 and near collapse: loss of equilibrium with drift range % 2 – 4. It should be noted
that the drift ranges are calculated based on all typologies studied above and they are an outcome of
the analysis rather than imposed on the basis of code prescriptions or other considerations. Similarly
the LS for each limit state and corresponding fragility curves are quantified only on the basis of the
variation for each typology of the capacity curves obtained. The uncertainty associated with the
demand has not been included in this study, as it is beyond the scope of the present work. Using the
procedure described above and the capacity curves derived in the previous section fragility curves are
obtained for each of the masonry typologies, for the three limit states defined.
For each typology separate curves have been derived for different number of storeys. This is to
highlight the role of slenderness in the fragility of masonry structures: the reduced ductility with
increased number of storeys can be qualitatively and quantitatively measured by the distance of the
median values of the three curves for each typology. In particular it should be noted how close the
fragility curve for near collapse, ∆c, is to the fragility curve for structural damage, ∆u. It should also be noted that the standard deviation increases with the number of storeys, as can be observed by the
increasing inclination of the fragility curves for 2 storeys buildings as compared with the ones for 1
storey buildings. Comparing curves in Figure 2 it is also apparent the benefit of timber lacing in
traditional rubble masonry. Their presence, stiffening the structure and shifting the collapse
mechanism from simple out-of-plane to in plane and combined mechanisms (see table 3.2), although
does not increase the median value for near collapse condition, does increase the distance between the
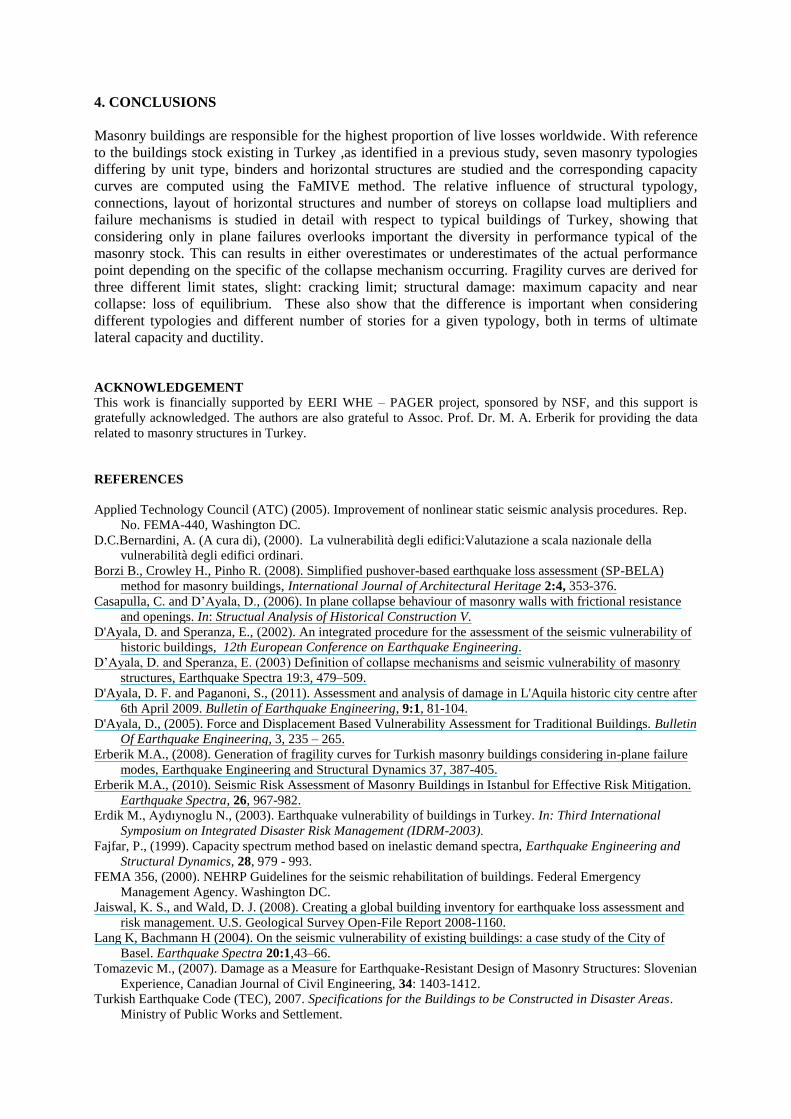
fragility curves, and provides a wider distribution. By comparing UFB1, brickwork set in mud mortar
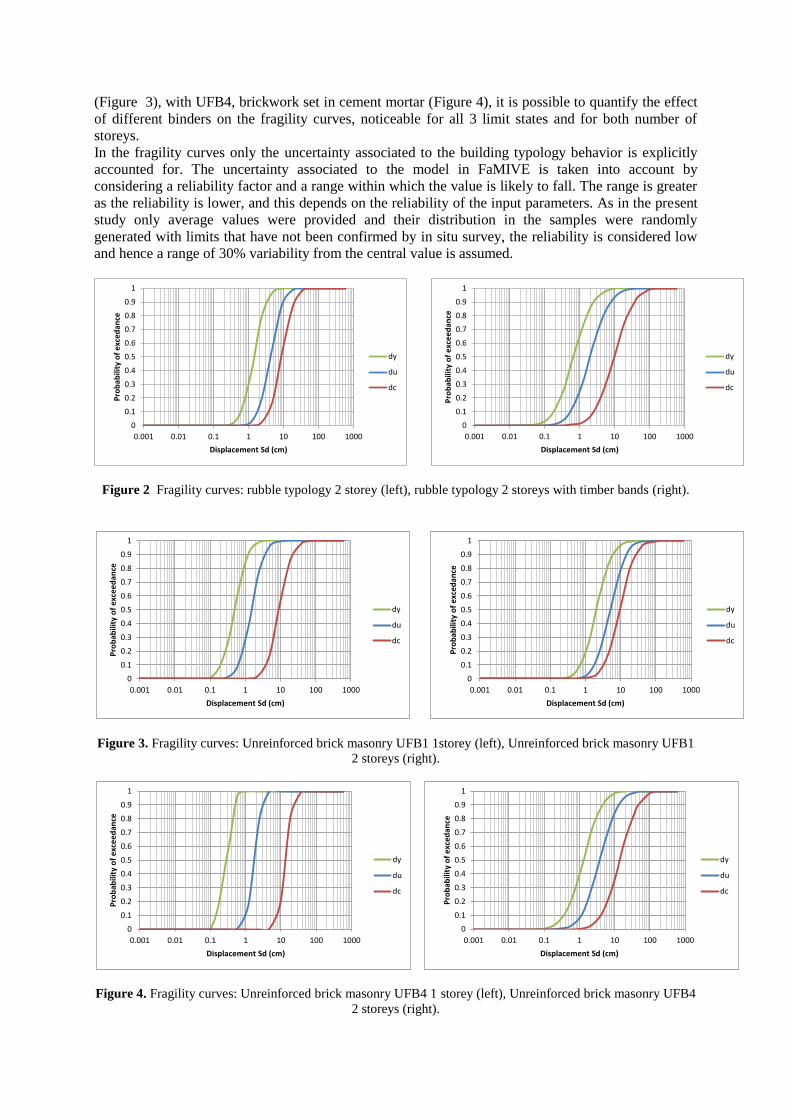
(Figure 3), with UFB4, brickwork set in cement mortar (Figure 4), it is possible to quantify the effect
of different binders on the fragility curves, noticeable for all 3 limit states and for both number of
storeys.
In the fragility curves only the uncertainty associated to the building typology behavior is explicitly
accounted for. The uncertainty associated to the model in FaMIVE is taken into account by
considering a reliability factor and a range within which the value is likely to fall. The range is greater
as the reliability is lower, and this depends on the reliability of the input parameters. As in the present
study only average values were provided and their distribution in the samples were randomly
generated with limits that have not been confirmed by in situ survey, the reliability is considered low
and hence a range of 30% variability from the central value is assumed.
Figure 2 Fragility curves: rubble typology 2 storey (left), rubble typology 2 storeys with timber bands (right).
Figure 3. Fragility curves: Unreinforced brick masonry UFB1 1storey (left), Unreinforced brick masonry UFB1
2 storeys (right).
Figure 4. Fragility curves: Unreinforced brick masonry UFB4 1 storey (left), Unreinforced brick masonry UFB4
2 storeys (right).
0
0.1
0.2
0.3
0.4
0.5
0.6
0.7
0.8
0.9
1
0.001 0.01 0.1 1 10 100 1000
Pro
bab
ility
of
exc
ed
ance
Displacement Sd (cm)
dy
du
dc
0
0.1
0.2
0.3
0.4
0.5
0.6
0.7
0.8
0.9
1
0.001 0.01 0.1 1 10 100 1000P
rob
abili
ty o
f e
xce
ed
ance
Displacement Sd (cm)
dy
du
dc
0
0.1
0.2
0.3
0.4
0.5
0.6
0.7
0.8
0.9
1
0.001 0.01 0.1 1 10 100 1000
Pro
bab
ility
of
exc
ee
dan
ce
Displacement Sd (cm)
dy
du
dc
0
0.1
0.2
0.3
0.4
0.5
0.6
0.7
0.8
0.9
1
0.001 0.01 0.1 1 10 100 1000
Pro
bab
ility
of
exc
ed
ance
Displacement Sd (cm)
dy
du
dc
0
0.1
0.2
0.3
0.4
0.5
0.6
0.7
0.8
0.9
1
0.001 0.01 0.1 1 10 100 1000
Pro
bab
ility
of
exc
ee
dan
ce
Displacement Sd (cm)
dy
du
dc
0
0.1
0.2
0.3
0.4
0.5
0.6
0.7
0.8
0.9
1
0.001 0.01 0.1 1 10 100 1000
Pro
bab
ility
of
exc
ed
ance
Displacement Sd (cm)
dy
du
dc
4. CONCLUSIONS
Masonry buildings are responsible for the highest proportion of live losses worldwide. With reference
to the buildings stock existing in Turkey ,as identified in a previous study, seven masonry typologies
differing by unit type, binders and horizontal structures are studied and the corresponding capacity
curves are computed using the FaMIVE method. The relative influence of structural typology,
connections, layout of horizontal structures and number of storeys on collapse load multipliers and
failure mechanisms is studied in detail with respect to typical buildings of Turkey, showing that
considering only in plane failures overlooks important the diversity in performance typical of the
masonry stock. This can results in either overestimates or underestimates of the actual performance
point depending on the specific of the collapse mechanism occurring. Fragility curves are derived for
three different limit states, slight: cracking limit; structural damage: maximum capacity and near
collapse: loss of equilibrium. These also show that the difference is important when considering
different typologies and different number of stories for a given typology, both in terms of ultimate
lateral capacity and ductility.
ACKNOWLEDGEMENT
This work is financially supported by EERI WHE – PAGER project, sponsored by NSF, and this support is
gratefully acknowledged. The authors are also grateful to Assoc. Prof. Dr. M. A. Erberik for providing the data
related to masonry structures in Turkey.
REFERENCES
Applied Technology Council (ATC) (2005). Improvement of nonlinear static seismic analysis procedures. Rep.
No. FEMA-440, Washington DC.
D.C.Bernardini, A. (A cura di), (2000). La vulnerabilità degli edifici:Valutazione a scala nazionale della
vulnerabilità degli edifici ordinari.
Borzi B., Crowley H., Pinho R. (2008). Simplified pushover-based earthquake loss assessment (SP-BELA)
method for masonry buildings, International Journal of Architectural Heritage 2:4, 353-376.
Casapulla, C. and D’Ayala, D., (2006). In plane collapse behaviour of masonry walls with frictional resistance
and openings. In: Structual Analysis of Historical Construction V.
D'Ayala, D. and Speranza, E., (2002). An integrated procedure for the assessment of the seismic vulnerability of
historic buildings, 12th European Conference on Earthquake Engineering.
D’Ayala, D. and Speranza, E. (2003) Definition of collapse mechanisms and seismic vulnerability of masonry
structures, Earthquake Spectra 19:3, 479–509.
D'Ayala, D. F. and Paganoni, S., (2011). Assessment and analysis of damage in L'Aquila historic city centre after
6th April 2009. Bulletin of Earthquake Engineering, 9:1, 81-104.
D'Ayala, D., (2005). Force and Displacement Based Vulnerability Assessment for Traditional Buildings. Bulletin
Of Earthquake Engineering, 3, 235 – 265.
Erberik M.A., (2008). Generation of fragility curves for Turkish masonry buildings considering in-plane failure
modes, Earthquake Engineering and Structural Dynamics 37, 387-405.
Erberik M.A., (2010). Seismic Risk Assessment of Masonry Buildings in Istanbul for Effective Risk Mitigation.
Earthquake Spectra, 26, 967-982.
Erdik M., Aydıynoglu N., (2003). Earthquake vulnerability of buildings in Turkey. In: Third International
Symposium on Integrated Disaster Risk Management (IDRM-2003).
Fajfar, P., (1999). Capacity spectrum method based on inelastic demand spectra, Earthquake Engineering and
Structural Dynamics, 28, 979 - 993.
FEMA 356, (2000). NEHRP Guidelines for the seismic rehabilitation of buildings. Federal Emergency
Management Agency. Washington DC.
Jaiswal, K. S., and Wald, D. J. (2008). Creating a global building inventory for earthquake loss assessment and
risk management. U.S. Geological Survey Open-File Report 2008-1160.
Lang K, Bachmann H (2004). On the seismic vulnerability of existing buildings: a case study of the City of
Basel. Earthquake Spectra 20:1,43–66.
Tomazevic M., (2007). Damage as a Measure for Earthquake-Resistant Design of Masonry Structures: Slovenian
Experience, Canadian Journal of Civil Engineering, 34: 1403-1412.
Turkish Earthquake Code (TEC), 2007. Specifications for the Buildings to be Constructed in Disaster Areas.
Ministry of Public Works and Settlement.
Related Documents