
Welcome message from author
This document is posted to help you gain knowledge. Please leave a comment to let me know what you think about it! Share it to your friends and learn new things together.
Transcript
Analytical and Empirical Evaluation of Software Reuse Metrics �Prem Devanbu, Sakke Karstu, Walcelio Melo and William ThomasTo appear in the Proc. of the 18th Int'l Conf. on Software Engineering, Berlin, Germany, 1996.IEEE Press. [Also available as a Technical Report, University of Maryland, Department ofComputer Science, College Park, MD, 20770. July 1995. CS-TR-3505. (Cross referenced asUMIACS-95-82)]AbstractHow much can be saved by using existing software components when developing new softwaresystems? With the increasing adoption of reuse methods and technologies, this question becomescritical. However, directly tracking the actual cost savings due to reuse is di�cult. A worthy goalwould be to develop a method of measuring the savings indirectly by analyzing the code for reuse ofcomponents. The focus of this paper is to evaluate how well several published software reuse metricsmeasure the \time, money and quality" bene�ts of software reuse. We conduct this evaluation bothanalytically and empirically. On the analytic front, we introduce some properties that should arguablyhold of any measure of \time, money and quality" bene�t due to reuse. We assess several existingsoftware reuse metrics using these properties. Empirically, we constructed a toolset (using GEN++)to gather data on all published reuse metrics from C++ code; then, using some productivity andquality data from \nearly replicated" student projects at the University of Maryland, we evaluatethe relationship the known metrics and the process data. Our empirical study sheds some light theapplicability of our di�erent analytic properties, and has raised some practical issues to be addressedas we undertake broader study of reuse metrics in industrial projects.1 IntroductionSoftware reuse is considered to be one of the most promising approaches for increasing productivity. Byre-using existing software, in addition not having to re-implement it, one can avoid downstream costs ofmaintaining additional code, and (if the re-used artifact has been thoroughly tested) increase the overallquality of the software product. Several industrial and governmental initiatives are underway to increasethe reuse of software, involving both adjustments to process, and the adoption of new technologies. Asthese e�orts mature, it is very important to demonstrate to management and funding agencies thatreuse makes good business sense; to this end, it is necessary to have methods to gather and furnish clear�nancial evidence of the bene�ts of reuse in real projects. Thus, we need to de�ne good metrics thatcapture these bene�ts, and develop tools and processes to allow the e�ective use of these metrics.We can think of reuse bene�t of a project or system, as being the normalized (percentage) �nancialgain due to reuse. This is an example of an external process attribute (see [7]), concerned with anexternal input (money) into the software development process. Unfortunately, the direct measurementof the actual �nancial impact of reuse in a system can be di�cult. The project as a whole may nothave the machinery in place to gather �nancial data. There are also other di�culties associated withmeasuring the �nancial impact of reuse. There are di�erent types of reuse|reuse of speci�cations,of design, and code. Speci�cation and design processes often have informal products (such as natural�Devanbu is with the Software & Systems Research Laboratory, AT&T Bell Laboratories, 600 Mountain Av., MurrayHill NJ 07974, USA. Karstu is with Michigan Technological University, Houghton, MI. Melo and Thomas are with theUniversity of Maryland, Institute for Advanced Computer Studies and Computer Science Dept., College Park, MD 20742USA. E-mails: fprem,[email protected], fmelo,[email protected]

language documents) which can be quite incommensurate. Even in reuse of code, there are di�erentmodus operandi, from the primitive \cut, edit, and paste", to the formal, controlled language basedapproaches provided in languages such as C++ and ML. In any case, to determine cost savings, onemay have to ask individual developers to estimate the �nancial bene�t of the code that they reused.This information may be unreliable and inconsistent.Fortunately, one of the key approaches to reuse is the use of features such as functions and modulesin modern programming languages. In this context, one can �nd evidence of (some kinds of) reusedirectly in the code; thus, it may be possible to �nd an indirect measure of the bene�ts of software(code) reuse directly in the code. Measures derivable directly from the code are internal measures.Several such measures of software reuse have been proposed in the literature [8, 14, 3, 10, 13]. Thispaper is concerned with the evaluation of how well various indirect, internal measures of software reuseactually measure the relevant external process attribute: reuse bene�t.The rest of the paper is organized as follows. First, following the lead of Weyuker [17] in the �eldof complexity measures, we develop some general properties or axioms that (we argue) should applyto any measure of reuse bene�t. Although (for reasons discussed above) it is di�cult to develop adirect, external measure of reuse bene�t, these axioms give us a yardstick to evaluate candidate internalmeasures. We then look at the internal measures of reuse reported in the literature and analyticallyexamine their relationship to these properties. Finally, we describe an empirical evaluation of thesemetrics. We have constructed tools to gather the internal metrics, and methods to gather correspondingprocess data. We use statistical methods to assess the relationship of the various internal metrics withthe corresponding process data. The results suggest some possible improvements to the publishedinternal measures of software reuse. This paper is aimed at establishing a broad framework to assist inthe study of reuse metrics, covering: a) the formulation of analytic properties, b) analytic evaluation ofpublished metrics, c) construction of metrics gathering tools, and d) empirical evaluation which in turnshed some light on the analytic properties.2 Indirect Measurement of Reuse Bene�tFenton [7] categorizes software measures along two orthogonal axes. The �rst is the process/productaxis: a metric may measure an attribute of software product, (e.g., quality of code), or an attribute ofsoftware process (e.g., cost of design review meetings). Another, orthogonal axis is the internal/externalaxis. A metric may measure an internal attribute (e.g., the number of loops in a module), or an externalattribute (e.g., maintainability of a module). Our goal is to develop a reasonable way of measuring theactual �nancial impact of reusing software. By Fenton's categorization, this is an external processattribute. We would like to measure reuse bene�t as a normalized measure of the degree of cost savingsachieved by adopting software reuse. Thus, we de�ne Rb, the reuse bene�t of a system S, as follows:Rb(S) = cost of developing S without reuse � cost of developing S with reusecost of S without reuse (1)It is important to note here that we are really concerned with the cost of development, which isquite di�erent from the incremental bene�t to revenue from the product. It may be possible that bydoing reuse, we bring out the product to market earlier, and with greater functionality. This may wellincrease revenue. Our model ignores this: Rb is solely concerned with the e�ect on coding costs.For reasons given in the introduction, it can be di�cult to get a reasonable direct measure ofRb. In cases like this, indirect measures have been used. For example, the external process attributeof maintainability is often measured indirectly1 by internal product measures of complexity such ascyclomatic complexity. Likewise, the internal product measure of software size (in units of NCSL)is considered be a reasonable indirect measure of the external process attribute of development cost.1Indirect measures are also used often in the physical and social sciences. For example the attribute of temperature ismeasured indirectly by the length of a mercury column in a thermometer.2
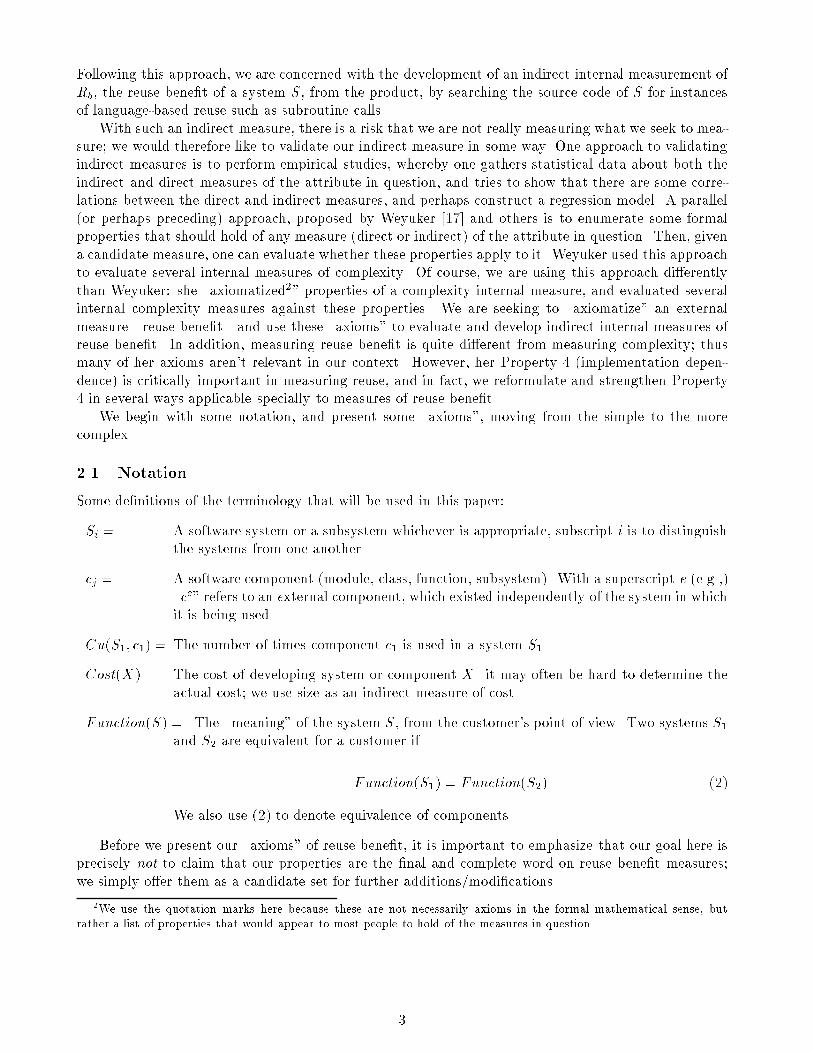
Following this approach, we are concerned with the development of an indirect internal measurement ofRb, the reuse bene�t of a system S, from the product, by searching the source code of S for instancesof language-based reuse such as subroutine calls.With such an indirect measure, there is a risk that we are not really measuring what we seek to mea-sure; we would therefore like to validate our indirect measure in some way. One approach to validatingindirect measures is to perform empirical studies, whereby one gathers statistical data about both theindirect and direct measures of the attribute in question, and tries to show that there are some corre-lations between the direct and indirect measures, and perhaps construct a regression model. A parallel(or perhaps preceding) approach, proposed by Weyuker [17] and others is to enumerate some formalproperties that should hold of any measure (direct or indirect) of the attribute in question. Then, givena candidate measure, one can evaluate whether these properties apply to it. Weyuker used this approachto evaluate several internal measures of complexity. Of course, we are using this approach di�erentlythan Weyuker: she \axiomatized2" properties of a complexity internal measure, and evaluated severalinternal complexity measures against these properties. We are seeking to \axiomatize" an externalmeasure|reuse bene�t|and use these \axioms" to evaluate and develop indirect internal measures ofreuse bene�t. In addition, measuring reuse bene�t is quite di�erent from measuring complexity; thusmany of her axioms aren't relevant in our context. However, her Property 4 (implementation depen-dence) is critically important in measuring reuse, and in fact, we reformulate and strengthen Property4 in several ways applicable specially to measures of reuse bene�t.We begin with some notation, and present some \axioms", moving from the simple to the morecomplex.2.1 NotationSome de�nitions of the terminology that will be used in this paper:Si = A software system or a subsystem whichever is appropriate, subscript i is to distinguishthe systems from one another.cj = A software component (module, class, function, subsystem). With a superscript e (e.g.,)\ce" refers to an external component, which existed independently of the system in whichit is being used.Cu(S1; c1) = The number of times component c1 is used in a system S1Cost(X) = The cost of developing system or component X . it may often be hard to determine theactual cost; we use size as an indirect measure of cost.Function(S) = The \meaning" of the system S, from the customer's point of view. Two systems S1and S2 are equivalent for a customer ifFunction(S1) = Function(S2) (2)We also use (2) to denote equivalence of components.Before we present our \axioms" of reuse bene�t, it is important to emphasize that our goal here isprecisely not to claim that our properties are the �nal and complete word on reuse bene�t measures;we simply o�er them as a candidate set for further additions/modi�cations.2We use the quotation marks here because these are not necessarily axioms in the formal mathematical sense, butrather a list of properties that would appear to most people to hold of the measures in question.3
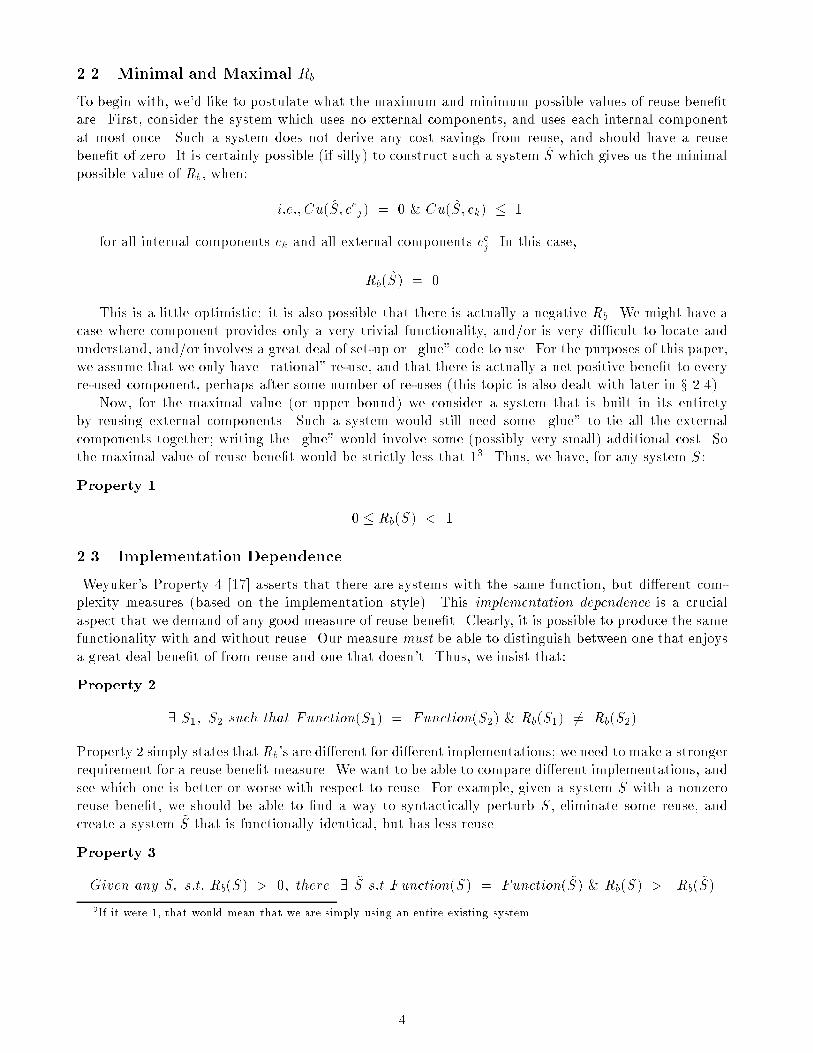
2.2 Minimal and Maximal RbTo begin with, we'd like to postulate what the maximum and minimum possible values of reuse bene�tare. First, consider the system which uses no external components, and uses each internal componentat most once. Such a system does not derive any cost savings from reuse, and should have a reusebene�t of zero. It is certainly possible (if silly) to construct such a system S which gives us the minimalpossible value of Rb, when: i:e:; Cu(S; cej) = 0 & Cu(S; ck) � 1for all internal components ck and all external components cej . In this case,Rb(S) = 0This is a little optimistic: it is also possible that there is actually a negative Rb. We might have acase where component provides only a very trivial functionality, and/or is very di�cult to locate andunderstand, and/or involves a great deal of set-up or \glue" code to use. For the purposes of this paper,we assume that we only have \rational" re-use, and that there is actually a net positive bene�t to everyre-used component, perhaps after some number of re-uses (this topic is also dealt with later in x 2.4).Now, for the maximal value (or upper bound) we consider a system that is built in its entiretyby reusing external components. Such a system would still need some \glue" to tie all the externalcomponents together; writing the \glue" would involve some (possibly very small) additional cost. Sothe maximal value of reuse bene�t would be strictly less that 13. Thus, we have, for any system S:Property 1 0 � Rb(S) < 12.3 Implementation DependenceWeyuker's Property 4 [17] asserts that there are systems with the same function, but di�erent com-plexity measures (based on the implementation style). This implementation dependence is a crucialaspect that we demand of any good measure of reuse bene�t. Clearly, it is possible to produce the samefunctionality with and without reuse. Our measure must be able to distinguish between one that enjoysa great deal bene�t of from reuse and one that doesn't. Thus, we insist that:Property 2 9 S1; S2 such that Function(S1) = Function(S2) & Rb(S1) 6= Rb(S2)Property 2 simply states thatRb's are di�erent for di�erent implementations; we need to make a strongerrequirement for a reuse bene�t measure. We want to be able to compare di�erent implementations, andsee which one is better or worse with respect to reuse. For example, given a system S with a nonzeroreuse bene�t, we should be able to �nd a way to syntactically perturb S, eliminate some reuse, andcreate a system ~S that is functionally identical, but has less reuse.Property 3Given any S; s:t: Rb(S) > 0; there 9 ~S s:t Function(S) = Function( ~S) & Rb(S) > Rb( ~S)3If it were 1, that would mean that we are simply using an entire existing system.4
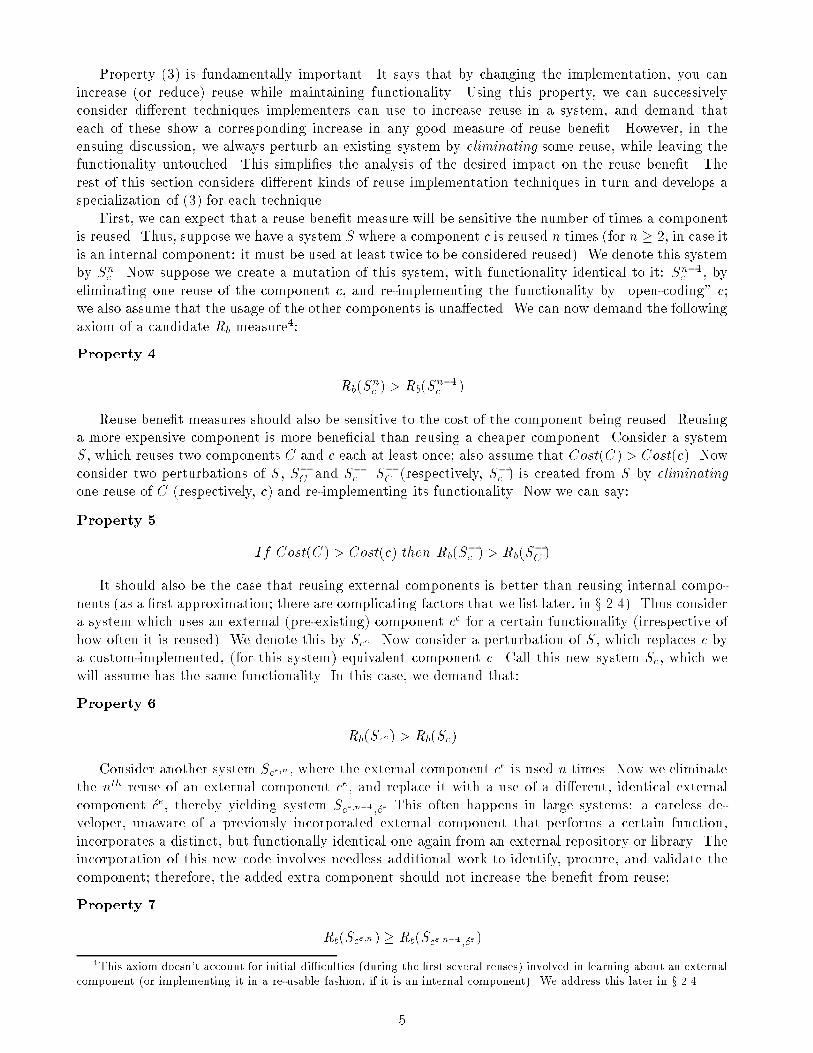
Property (3) is fundamentally important. It says that by changing the implementation, you canincrease (or reduce) reuse while maintaining functionality. Using this property, we can successivelyconsider di�erent techniques implementers can use to increase reuse in a system, and demand thateach of these show a corresponding increase in any good measure of reuse bene�t. However, in theensuing discussion, we always perturb an existing system by eliminating some reuse, while leaving thefunctionality untouched. This simpli�es the analysis of the desired impact on the reuse bene�t. Therest of this section considers di�erent kinds of reuse implementation techniques in turn and develops aspecialization of (3) for each technique.First, we can expect that a reuse bene�t measure will be sensitive the number of times a componentis reused. Thus, suppose we have a system S where a component c is reused n times (for n � 2, in case itis an internal component: it must be used at least twice to be considered reused). We denote this systemby Snc . Now suppose we create a mutation of this system, with functionality identical to it: Sn�1c , byeliminating one reuse of the component c, and re-implementing the functionality by \open-coding" c;we also assume that the usage of the other components is una�ected. We can now demand the followingaxiom of a candidate Rb measure4:Property 4 Rb(Snc ) > Rb(Sn�1c )Reuse bene�t measures should also be sensitive to the cost of the component being reused. Reusinga more expensive component is more bene�cial than reusing a cheaper component. Consider a systemS, which reuses two components C and c each at least once; also assume that Cost(C) > Cost(c). Nowconsider two perturbations of S, S�C and S�c . S�C (respectively, S�c ) is created from S by eliminatingone reuse of C (respectively, c) and re-implementing its functionality. Now we can say:Property 5 If Cost(C) > Cost(c) then Rb(S�c ) > Rb(S�C )It should also be the case that reusing external components is better than reusing internal compo-nents (as a �rst approximation; there are complicating factors that we list later, in x 2.4). Thus considera system which uses an external (pre-existing) component ce for a certain functionality (irrespective ofhow often it is reused). We denote this by Sce . Now consider a perturbation of S, which replaces c bya custom-implemented, (for this system) equivalent component c. Call this new system Sc, which wewill assume has the same functionality. In this case, we demand that:Property 6 Rb(Sce) > Rb(Sc)Consider another system Sce;n , where the external component ce is used n times. Now we eliminatethe nth reuse of an external component ce, and replace it with a use of a di�erent, identical externalcomponent �ce, thereby yielding system Sce;n�1 ;�ce This often happens in large systems: a careless de-veloper, unaware of a previously incorporated external component that performs a certain function,incorporates a distinct, but functionally identical one again from an external repository or library. Theincorporation of this new code involves needless additional work to identify, procure, and validate thecomponent; therefore, the added extra component should not increase the bene�t from reuse:Property 7 Rb(Sce;n) � Rb(Sce;n�1 ;�ce)4This axiom doesn't account for initial di�culties (during the �rst several reuses) involved in learning about an externalcomponent (or implementing it in a re-usable fashion, if it is an internal component). We address this later in x 2.4.5
Finally, we have an axiom that relates to \cut & paste" reuse. For this, consider a system S withthree variants that are functionally identical: S� Scm and Scv . S� is implemented by simply addingcustom-crafted code to S. Scm is implemented by obtaining a component cm from somewhere (internalor external) modifying it \slightly"5 and linking it into S. Scv is created in a similar manner to Scm ,except that an additional verbatim use cv has been included to implement it. In this case, we shouldexpect that verbatim reuse is better than \cut & paste" reuse which is better than no reuse at all:Property 8 Rb(Scv) > Rb(Scm) > Rb(S�)Since "slightly modi�ed" is hard to de�ne, Property 8 can be particularly di�cult to measurea repeatable way; perhaps for this reason, most published measures ignore this property, with theexception of [13]. However, as discussed below, our empirical study suggests that this in an importantproperty.Most existing measures of reuse bene�t turn out to be not strictly consistent with one or more ofthe properties listed above; in fact, as we shall see below, there are some inherent di�culties in anyapproach to measuring reuse.2.4 Di�culties in Measuring ReuseThere are some critical factors that complicate the measurement of reuse from code. Some of them aredue to theoretical (computability) considerations, and some are due to human performance factors inreuse. Both kinds of di�culties complicate the application of the \axioms" (discussed in the previoussection) to candidate indirect measures of reuse bene�t, and make it di�cult to implement tools togather these measures.It is certainly possible to write the same program in ways that can arti�cially in ate internal measuresof reuse. Thus, one can arti�cially insert function invocations into the di�erent branches of a conditional(this would in ate a reuse measure conformat with Property 4); the invocation could perhaps just aswell been \hoisted above" the conditional. Likewise, one could re-use a component that was needlesslylarge (or more expensive) to arti�cially in ate a measure that was conformant with Property 5. In mostcases, it is infeasible to detect occurrences of spurious in ation.There are so some practical di�culties with Property (4), which takes the position that reuse bene�tincreases monotonically with the number of reuses. In the case of external components, there is theoverhead of �rst �nding a suitable component and learning how to use it (or with internal components,the cost of building it). This is an initial cost that would be amortized over a number of uses ofthe component. There may often be an initial negative cost to re-use, which is later amortized overmany uses. Moreover, the parameters of this \learning curve" is likely to vary with the functionalityof component, the complexity of the component, the talents of the re-user, and the type of system inwhich it is being reused. This is di�cult to quantifyThese two problems: detecting \computationally gratuitous" reuse and modeling the \learningcurve" seem endemic to any tool that measures re-use, and do not appear to admit of any immediatesolutions. Now, we survey several related research e�orts that deal with the measurement of reuse anddiscuss their relationship to the properties laid out in this section.3 Analytic Evaluation of Reuse MetricsThere are many models and metrics [2, 4, 10, 9, 3, 14] in the literature that try to evaluate thedegree of reuse in a software system. Most of these measures are concerned with estimating the actual5The precise de�nition \slight" modi�cation will vary with the circumstances.6
�nancial bene�ts due to reuse. Bieman suggests a range of measures of various reuse occurrences inobject oriented software. Our theoretical framework, as well the empirical study, is concerned morewith measures that yield a single number that could potentially estimate the savings due to reuse. Inthis section we will compare some of these models to our proposed set of properties of reuse bene�tmeasures.3.1 Producer/Consumer models of Software ReuseSeveral researchers [4, 10, 9, 3, 14] seek to evaluate the bene�ts of reuse in a corporation. They usedi�erent models, but essentially, they all comprise a producer-consumer framework. Reusable artifactsare created by the producer (e.g., a domain engineering group which produces reusable software) andre-used by several consumers. The producer groups have to undertake extra cost burdens to createhigh-quality reusable assets. Consumers save by avoiding re-implementation costs. The return onthe asset producer's investment is proportional to use by consumers. Business-case oriented modelsof reuse metrics seek to measure the overall bene�t to the corporation of re-use practices: thus theyinclude measurements of code size, relative cost of producing re-usable software, number of reuses etc,into a uni�ed model that can combine all these numbers into a �gure for overall cost bene�t of reuse.Ga�ney et al have investigated di�erent models for computing the �nancial bene�ts of reuse [10, 9].Poulin et al [14] have developed and institutionalized a comprehensive reuse program that incorporatesa producer/consumer �nancial model of reuse bene�ts. Bollinger and P eeger [3] propose �nancial andaccounting practices to motivate multi-project reuse, based on the producer/consumer model.A key component of all these e�orts is a model for the amount of savings during the coding phase,directly attributable to reuse. However, the methods used for computing coding-phase savings in [3, 14,10, 9] do not necessarily conform to the properties presented in x 2.3. For example Poulin [14] gives reusebene�t credit only for external components, and for each reused component just once, regardless of thenumber of times it is called. His argument is that the cost of implementing the component is saved onlyonce; after that each additional use should not get additional credit. Programmers should be expectedto use components that are in the system as a matter of course, and should not get credit for that. Sincelarger components are given more credit, their treatment of external component is consistent with theProperty 5. However, the \credit for one use only" assumption is not consistent with our Property (4).For his computation of the cost savings due to re-use, he uses a product reuse level number, which is anormalized ratio of the number of lines of reused source instructions (RSI) to the total number of lines.To estimate the actual cost savings (Reuse Cost Avoidance, or RCA) he multiplies the RSI numberby the a per-line cost savings. Chen et al [4] use a very similar computation, but have constructed arepeatable, tool-based measurement apparatus6.Given a project where all the programmers can be always expected to be aware of and likely to useall the re-usable components, Poulin's argument for giving credit only once, to just the linecount of theexternal components, seems applicable. But in many large, long-lived software systems, with frequentpersonnel turnover, programmers may be unaware of reusable components, whether internal or external.Conversations with developers have revealed cases where the same function had been re-implementeddozens of times in a very large project. Such practices complicate the calculation of the reuse bene�t. Asa speci�c example, consider a 1,000,000 line system S with 400,000 lines of RSI7 (including a 2000-linecomponent c1) Now, assume that subsequently, a programmer (unaware of the existence of c1) createsS1, with some new functionality, by retrieving and using a component c2 (with functionality identicalto c1, but implemented di�erently) of the same length (2000 lines) from an external repository. Nowsuppose a more careful programmer, creates S2 from S1, by adding another reuse of the componentc1. By Property (7), S1 should be assigned a higher reuse bene�t. However, using the RSI count, S2would be assigned a higher normalized reuse bene�t. Even if the existing component was hard to �nd6They are also concerned with the measurement of e�ectiveness of di�erent component libraries; which libraries areused more often ? Our focus is on the consumer of reusable components7Poulin's method assigns this system a normalized reuse level of 0.4.7
(because of poor retrieval support), it is unclear whether the needless introduction of a new externalcomponent predicates a greater bene�t from reuse.This kind of needless re-use, by \re-discovering" external components, might in ate the RSI countand thus complicate the return on investment computations. This would appear to present di�cultiesfor both of [10] and [14]. Intuitively, the problem seems to arise from the exclusive focus on thereused code (RSI) rather than the manner in which it is reused in the rest of the code. Thus simply byin ating RSI, without re-using it e�ectively, one can get an in ated relative bene�t number. On theother hand, consider a system that is implemented without any external components at all, but whichincorporates a highly modularized and parametrized architecture which allows a high degree of reuse ofinternal (custom crafted) components. Such a system would have an RSI of zero, but might well realizehigh levels of reuse bene�t. Our empirical data (See x 4) includes some student projects that illustratethis possibility.Some of the other measures discussed in this section, notably the measures of Frakes and Terry,and the Rsf measure, don't focus solely on the RSI, but give credit for each reuse of a component.However, these measures are still susceptible to the intractable problems noted in x 2.4: Poulin alsogives examples of spuriously in ated reuse bene�t resulting from such measures. Thus both methodsare subject to anomalies, albeit in di�erent contexts.Finally, the RSI measure, (like all measures discussed in this section with the exception of RR(Section x 3.4) does not give any credit for non-verbatim reuse, i.e, the reuse of components that havebeen adapted somewhat; RSI is thus not consistent with Property 8 .3.2 Reuse Level models of Frakes and TerryUnlike the work described in the previous chapter, which is concerned exclusively with how much codeis being reused, Frakes and Terry [8] focus on how code is being reused. Their reuse level and frequencymeasures are concerned with how frequently components are being used. They distinguish betweeninternal and external reuse; total reuse is the sum of these two.In calculation of their reuse level and reuse frequency, Frakes and Terry use threshold levels todetermine when a component is considered being reused. This o�ers a pragmatic approach to dealingwith the learning curve issue discussed above in x 2.4 A threshold is a value that determines whena module will be reused. If a threshold is 2 then an item that has been used more than two times isconsidered to be reused. Di�erent threshold values (respectively, ETL and ITL) can be used for externalreuse and internal reuse. Given these numbers, the number of internal and external components (resp.,IU and EU) which are used more than the threshold can be counted; the total number of componentsis given by T. Frakes and Terry also count the frequency of reuse: the number of references to internaland external items (which are reused more than the threshold) are counted by IUF and EUF, and thetotal number of references is denoted by TF. Given these numbers, the overall reuse level (RL) andreuse frequency (RF ) measures are computed thus:Internal RL = IU / T; External RL = EU / T; Total RL = (IU + EU) / TInternal RF = IUF / TF; External RF = EUF / TF ; Total RF = (IUF + EUF) / TFThe RL & RF measures are two di�erent measures of reuse level, which could both be used asindirect measures of reuse bene�t. For this purpose, these measures di�er from the RSI measure usedby [14]; here, there is actually a focus on how the reusable components are used, rather than just thetotal line count of reused code. In addition Frakes and Terry give credit for both internal and externalcomponents. However, RL and RF are di�erent. After a given threshold value, RL is not sensitive tothe number of uses of a particular component; therefore, it does not strictly conform to Property (4).RF, on the other hand, is usage sensitive.However, these measures are insensitive to the cost of the modules being reused; thus, they don'tincorporate Property (5). However, [8] does describe a simple method to weight these measures based8
on computation of certain ratios of the average sizes of reused modules. While this \size weighting"method accounts for the size to some extent, it is not sensitive to the level of reuse of modules of varioussizes. According to Property(5), it is better to reuse larger modules (if size is taken as a good proxy forcost).Finally, RL and RF only count verbatim reuse; if a slightly modi�ed version of an existing componentis used again, it would be treated as a use of a new component; depending on the level at which thethreshold is set, this may not be recognized as being re-used. Thus, RL and RF may not always conformto Property 8.3.3 Size and Frequency metric - RsfIn this section, we describe another normalized indirect measure of reuse bene�t, Rsf , �rst described in[6]. This measure tries to account for both how much code is being reused, as well as in what manner itis being reused (sf stands for size and frequency) It uses a notion of expanded code size Sizesf , whichindicates how much code would have to be written to implement the system, had there not been anyreuse. The actual code size is denoted by Sizeact. We model our measures in general thus:Rsf(S) = Sizesf � SizeactSizesf (3)The form of this equation is almost identical with the form of the equation (1) on page 2. In fact,equation (3) follows directly from equation (1) using a simple two step argument. First, we take thesize of a system to be a good indicator of the e�ort taken to implement (and thus the cost of) thesystem. Second, we take the expanded size Sizesf of the system as a proxy for the cost of the systemwithout reuse, and Sizeact be a proxy of the actual cost of implementing the system. Sizeact is simplythe number of statements in the newly written functions of implemented system (not counting reusedpre-existing code from external repositories). This is a �xed number, computed in the usual way. Itshould be immediately clear (since Sizeact is a positive non zero number) that if Sizesf � Sizeact, theindirect measure de�ned above conforms strictly to Property (1) on page 4.The de�nition of Rsf makes use of the function call graph of a program:De�nition 1 A callgraph CG(S) for a system S is a connected, directed graph rooted at the mainprocedure, and described by a pair h NS ; ES i where the nodes NS represent the functions in the system,and the edges ES represent the function invocations. For each node n in NS, the in-degree (the numberof calls to n) of n is denoted by calls(n), and the code size of n by size(n). EXT (S) is the set of nodesin NS that represent functions from external libraries, and INT (S) is the rest.Sizeact(S) = Xfor all nodes n in INT (S)size(n) (4)Sizesf(S) = Xfor all nodes n in NS size(n) � calls(n) (5)Rsf (S) = Sizesf(S)� Sizeact(S)Sizesf (S) (6)With this de�nition, it's easy to see that Rsf satis�es Property (1). In the case where there is noexternal component use, and each internal component is used only once, we get Sizesf = Sizeact; inall other cases, Sizesf > Sizeact, as desired.The Sizesf measure is sensitive both to the size of the function being reused, and the number oftimes it is being used. It is easy to see that it conforms to Properties (4) and (5) provided we assumethat size is a good proxy for cost. We remind the reader here that Properties (2 & 3) are weakerpreliminaries to Property (4). 9
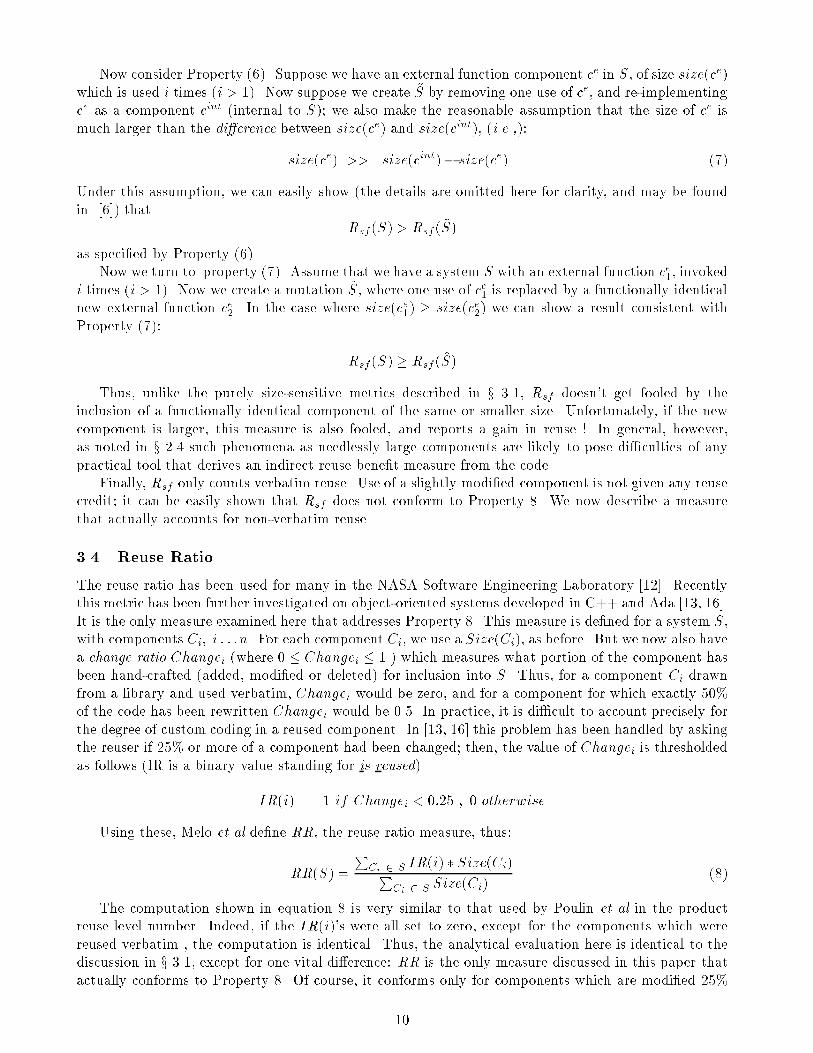
Now consider Property (6). Suppose we have an external function component ce in S, of size size(ce)which is used i times (i > 1). Now suppose we create ~S by removing one use of ce, and re-implementingce as a component cint (internal to S); we also make the reasonable assumption that the size of ce ismuch larger than the di�erence between size(ce) and size(cint), (i.e.,):size(ce) >> j size(cint)� size(ce) j (7)Under this assumption, we can easily show (the details are omitted here for clarity, and may be foundin [6]) that Rsf (S) > Rsf ( ~S)as speci�ed by Property (6).Now we turn to property (7). Assume that we have a system S with an external function ce1, invokedi times (i > 1). Now we create a mutation S, where one use of ce1 is replaced by a functionally identicalnew external function ce2. In the case where size(ce1) � size(ce2) we can show a result consistent withProperty (7): Rsf (S) � Rsf (S)Thus, unlike the purely size-sensitive metrics described in x 3.1, Rsf doesn't get fooled by theinclusion of a functionally identical component of the same or smaller size. Unfortunately, if the newcomponent is larger, this measure is also fooled, and reports a gain in reuse ! In general, however,as noted in x 2.4 such phenomena as needlessly large components are likely to pose di�culties of anypractical tool that derives an indirect reuse bene�t measure from the code.Finally, Rsf only counts verbatim reuse. Use of a slightly modi�ed component is not given any reusecredit; it can be easily shown that Rsf does not conform to Property 8. We now describe a measurethat actually accounts for non-verbatim reuse.3.4 Reuse RatioThe reuse ratio has been used for many in the NASA Software Engineering Laboratory [12]. Recentlythis metric has been further investigated on object-oriented systems developed in C++ and Ada [13, 16].It is the only measure examined here that addresses Property 8. This measure is de�ned for a system S,with components Ci; i : : :n. For each component Ci, we use a Size(Ci), as before. But we now also havea change ratio Changei (where 0 � Changei � 1 ) which measures what portion of the component hasbeen hand-crafted (added, modi�ed or deleted) for inclusion into S. Thus, for a component Ci drawnfrom a library and used verbatim, Changei would be zero, and for a component for which exactly 50%of the code has been rewritten Changei would be 0.5. In practice, it is di�cult to account precisely forthe degree of custom coding in a reused component. In [13, 16] this problem has been handled by askingthe reuser if 25% or more of a component had been changed; then, the value of Changei is thresholdedas follows (IR is a binary value standing for is reused)IR(i) = 1 if Changei < 0:25 ; 0 otherwiseUsing these, Melo et al de�ne RR, the reuse ratio measure, thus:RR(S) = PCi 2 S IR(i) � Size(Ci)PCi 2 S Size(Ci) (8)The computation shown in equation 8 is very similar to that used by Poulin et al in the productreuse level number. Indeed, if the IR(i)'s were all set to zero, except for the components which werereused verbatim , the computation is identical. Thus, the analytical evaluation here is identical to thediscussion in x 3.1, except for one vital di�erence: RR is the only measure discussed in this paper thatactually conforms to Property 8. Of course, it conforms only for components which are modi�ed 25%10
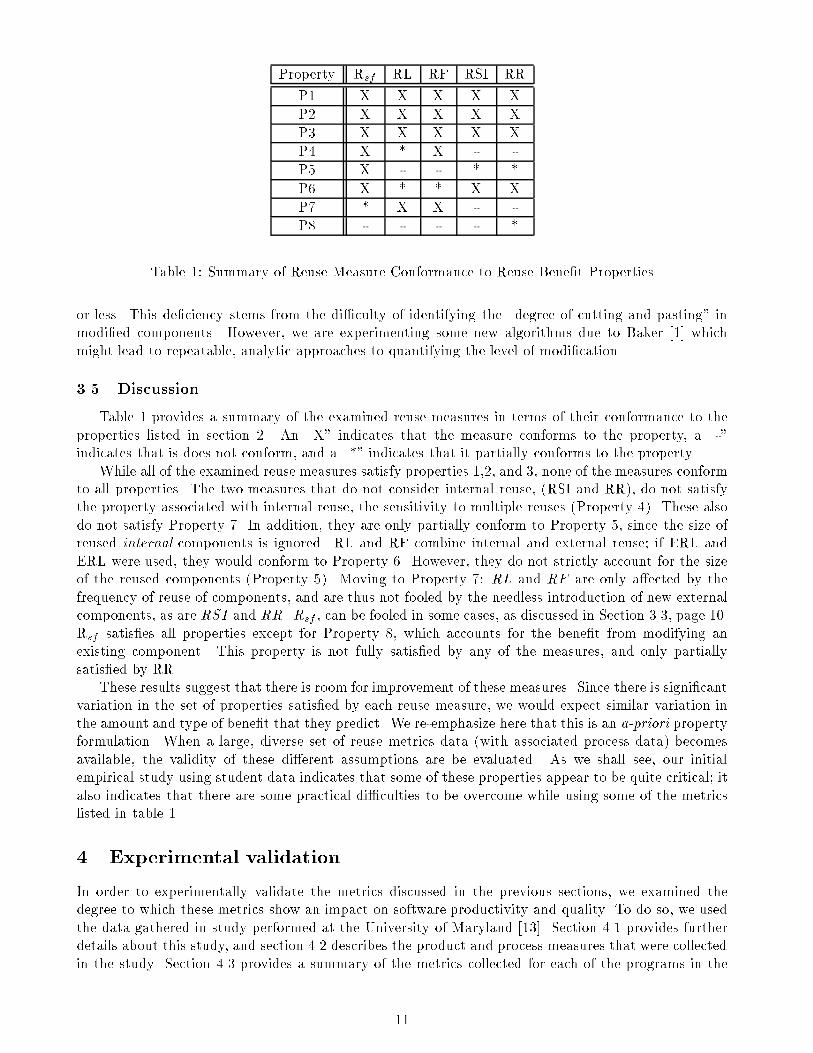
Property Rsf RL RF RSI RRP1 X X X X XP2 X X X X XP3 X X X X XP4 X * X - -P5 X - - * *P6 X * * X XP7 * X X - -P8 - - - - *Table 1: Summary of Reuse Measure Conformance to Reuse Bene�t Propertiesor less. This de�ciency stems from the di�culty of identifying the \degree of cutting and pasting" inmodi�ed components. However, we are experimenting some new algorithms due to Baker [1] whichmight lead to repeatable, analytic approaches to quantifying the level of modi�cation.3.5 DiscussionTable 1 provides a summary of the examined reuse measures in terms of their conformance to theproperties listed in section 2. An \X" indicates that the measure conforms to the property, a \-"indicates that is does not conform, and a \*" indicates that it partially conforms to the property.While all of the examined reuse measures satisfy properties 1,2, and 3, none of the measures conformto all properties. The two measures that do not consider internal reuse, (RSI and RR), do not satisfythe property associated with internal reuse, the sensitivity to multiple reuses (Property 4). These alsodo not satisfy Property 7. In addition, they are only partially conform to Property 5, since the size ofreused internal components is ignored. RL and RF combine internal and external reuse; if ERL andERL were used, they would conform to Property 6. However, they do not strictly account for the sizeof the reused components (Property 5). Moving to Property 7: RL and RF are only a�ected by thefrequency of reuse of components, and are thus not fooled by the needless introduction of new externalcomponents, as are RSI and RR. Rsf , can be fooled in some cases, as discussed in Section 3.3, page 10.Rsf satis�es all properties except for Property 8, which accounts for the bene�t from modifying anexisting component. This property is not fully satis�ed by any of the measures, and only partiallysatis�ed by RR.These results suggest that there is room for improvement of these measures. Since there is signi�cantvariation in the set of properties satis�ed by each reuse measure, we would expect similar variation inthe amount and type of bene�t that they predict. We re-emphasize here that this is an a-priori propertyformulation. When a large, diverse set of reuse metrics data (with associated process data) becomesavailable, the validity of these di�erent assumptions are be evaluated. As we shall see, our initialempirical study using student data indicates that some of these properties appear to be quite critical; italso indicates that there are some practical di�culties to be overcome while using some of the metricslisted in table 1.4 Experimental validationIn order to experimentally validate the metrics discussed in the previous sections, we examined thedegree to which these metrics show an impact on software productivity and quality. To do so, we usedthe data gathered in study performed at the University of Maryland [13]. Section 4.1 provides furtherdetails about this study, and section 4.2 describes the product and process measures that were collectedin the study. Section 4.3 provides a summary of the metrics collected for each of the programs in the11

study. In section 4.4 we present and interpret results obtained from the statistical analysis performedon the data.4.1 Description of the studyThis study was run for four months (from September to December, 1994). The population under studywas a graduate level class o�ered by the Department of Computer Science at the University of Maryland.All students had some experience with C or C++ programming and relational databases.The students were randomly grouped into teams. Each team developed a medium-size managementinformation system that supports the rental/return process of a hypothetical video rental business andmaintains customer and video databases.The development process was performed according to a sequential software engineering life-cyclemodel derived from the Waterfall model. This model includes the following phases: Analysis, Design,Implementation, Testing, and Repair. At the end of each phase, a document was delivered: Requirementspeci�cation, design document, code, error report, and �nally, modi�ed code, respectively. Requirementspeci�cation and design documents were checked in order to verify if they matched the system require-ments. Errors found in these two �rst phases were reported to the students. This guaranteed thatthe implementation began with a correct OO analysis/design. The testing phase was accomplished byan independent group composed of experienced software professionals. This group tested all systemsaccording to similar test plans and using functional testing techniques. During the repair phase, thestudents were asked to correct their system based on the errors found by the independent test group.OMT, an OO Analysis/Design method, was used during the analysis and design phases [15]. TheC++ programming language, the GNU software development environment, and OSF/MOTIF were usedduring the implementation. Sun Sparcstations were used as the implementation platform. Therefore,the development environment and technology we used are consistent with what is currently used inindustry and academia.The following libraries were provided to the students:� MotifApp. This public domain library provides a set of C++ classes on top of OSF/MOTIF formanipulation of windows, dialogs, menus, etc. [18]. The MotifApp library provides a way to usethe OSF/Motif library in an OO programming/design style.� GNU library. This library is a public domain library provided in the GNU C++ programmingenvironment. Its contains functions for manipulation of string, �les, lists, etc.� C++ database library. This library provides the implementation in C++ of multi-indexed B-Trees.A hundred small programs exemplifying how to use OSF/Motif widgets were also provided. Finally,the code sources and the complete documentation of the libraries were made available. It is importantto note that the students were not mandated to use the libraries and, depending on the particular designthey adopted, di�erent reuse choices were expected. We also provided a domain speci�c applicationlibrary in order to make our experiment more representative of the \real world". This library imple-mented the graphical user interface for insertion/removal of customers and was implemented in such away that the main resources of the OSF/Motif and MotifApp libraries were used.4.2 Data collectedBoth product and process data were gathered as a part of this study. We describe here only the productand process data that are relevant to help us validate the suite of reuse metrics presented in this paper.For further details about how these data were gathered and validated see [13].12

4.2.1 Product dataWe have built the software tool infrastructure to gather data about 4 di�erent reuse measures: our Rsfmetrics, the RSI metric used by Poulin and others, and the RL and RF metrics of Frakes and Terry.Our tools have 3 elements. First, we have a static analyzer, built with the GEN++ [5] analyzergenerator, which analyses C++ programs and generates call graph and function size information. Thisinformation is generated into at �les. These are then processed by a relational database system(Daytona [11]) which supports such features as transitive closure (which is needed to identify a connectedcall graph), and aggregate queries (which are needed to compute the di�erent summary metrics).Unfortunately, we did not have a software tool to calculate reuse ratio. We used a form, thecomponent origination form [13], to capture whether a component has been developed from scratch orhas been developed from a reused component. In the latter case, we asked the developers to tell us ifmore or less than 25 percent of a component had been changed. In the former case, the component waslabeled: Extensively modi�ed and in the latter case: slightly modi�ed . If the component was insertedinto the system without any modi�cation it was labeled: verbatim reuse. Only verbatim reuse andslightly modi�ed have been used to calculate reuse ratio [13].4.2.2 E�ortHere we are interested in estimating the e�ort breakdown for development phases, and for error cor-rection. Again, we used forms �lled out by the developers to track person-hours expended acrossdevelopment activities. These activities include:� Analysis. The number of hours spent understanding the concepts embedded in the system beforeany actual design work. This activity includes requirements de�nition and requirements analysis.It also includes the analysis of any changes made to requirements or speci�cations, regardless ofwhere in the life cycle they occur.� Design. The number of hours spent performing design activities, such as high-level partitioning ofthe problem, drawing design diagrams, specifying components, writing class de�nitions, de�ningobject interactions, etc. The time spent reviewing design material, such as walk-throughs andstudying the current system design, was also taken into account.� Implementation. The number of hours spent writing code and testing individual system compo-nents� Rework. This includes the number of hours spent on isolating errors, as well as correcting them.4.2.3 Number of DefectsHere we analyze the number of defects found for each system/component. We will use the term defectas a generic term, to refer to either an error or a fault. Errors and faults are two pertinent ways tocount defects, thus they were both considered in this study. Errors are defects in the human thoughtprocess made while trying to understand given information, to solve problems, or to use methods andtools. Faults are concrete manifestations of errors within the software. One error may cause severalfaults and various errors may cause identical faults. In our study, an error is assumed to be representedby a single error report form; a fault is represented by a physical change to a component.4.3 Overview of the projectsTable 2 provides descriptive measures of the projects included in the study, showing the project ID,project size (source lines of code (SLOC)), total lifecycle productivity (SLOC/Hour), fault density(Faults/KSLOC), and error density (Errors/KSLOC).13

Number SLOC Prod. Fault Dens. Error Dens.1 5105 18.23 8.23 6.462 11687 32.02 3.76 3.593 10390 34.30 3.95 3.174 8173 51.40 8.20 3.185 8216 31.12 3.41 3.046 9736 69.54 1.64 1.547 5255 19.91 14.27 8.37Table 2: Size, Productivity, Fault Density, and Error Density in the Examined ProjectsNumber Rsf RL RF RSI RR1 0.45 0.52 0.79 0.00 0.022 0.86 0.37 0.78 0.08 0.263 0.45 0.28 0.64 0.00 0.154 0.93 0.52 0.92 0.00 0.405 0.74 0.38 0.76 0.11 0.386 0.83 0.38 0.76 0.11 0.437 0.51 0.45 0.81 0.00 0.00Table 3: Experimental Results: Reuse MeasuresTable 3 shows for each project the reuse measures discussed in the previous sections: reuse bene�t,reuse level, reuse frequency, Pct. RSI, and reuse ratio. As one can see, RSI shows very little variationacross the projects: most of the projects have RSI equal to zero. Given that, we will not analyze theimpact of RSI on productivity and quality, since the poor distribution in our sample can easily bias thestastistical analysis.4.4 ResultsTo provide some evidence of the usefulness of the measure of reuse bene�t, we examined the relationshipbetween reuse bene�t and the quality factors of productivity, defect density, and rework e�ort. Thecoe�cients of correlation between these quality measures and the measures of reuse bene�t are shownin table 4. The following sections describe our observations on the relationship between these qualityfactors and the various reuse measures.Measure Rsf RL RF RRProductivity 0.66 -0.16 0.12 0.82Fault Density -0.39 0.62 0.47 -0.67Error Density -0.62 0.49 0.20 -0.79Percent Rework 0.09 0.62 0.69 -0.24Table 4: Experimental Results: Correlations with Product Quality Factors14
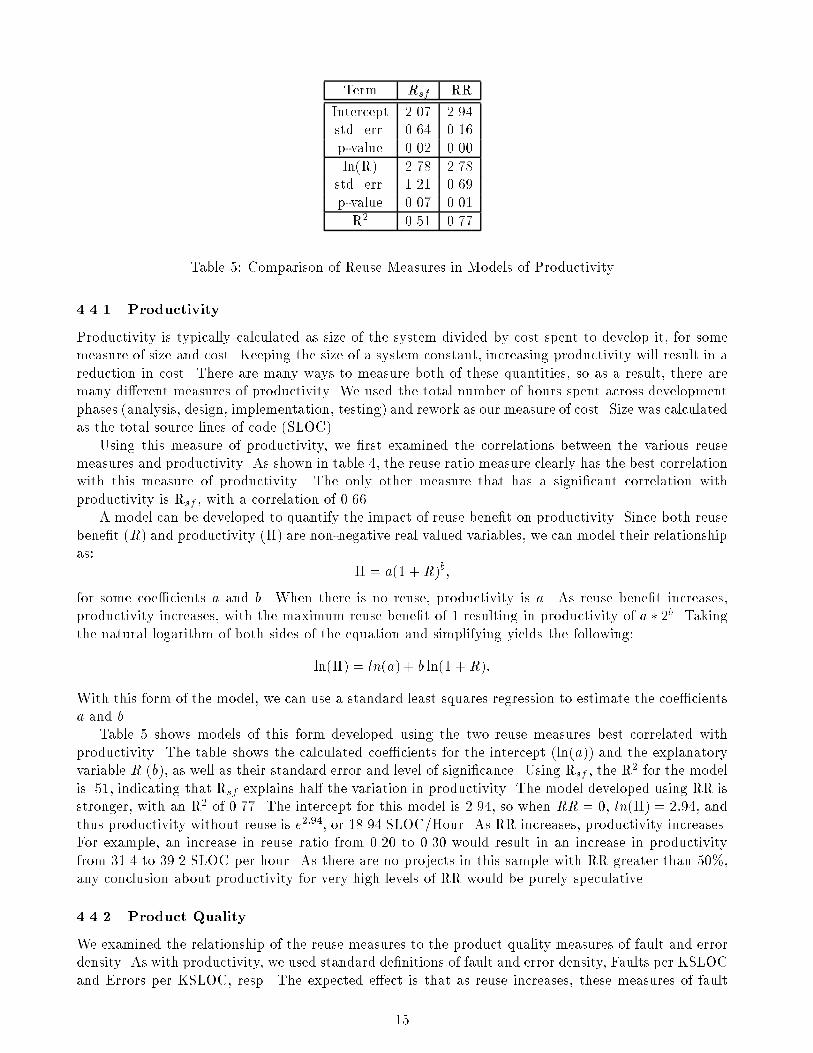
Term Rsf RRIntercept 2.07 2.94std. err. 0.64 0.16p-value 0.02 0.00ln(R) 2.78 2.78std. err. 1.21 0.69p-value 0.07 0.01R2 0.51 0.77Table 5: Comparison of Reuse Measures in Models of Productivity4.4.1 ProductivityProductivity is typically calculated as size of the system divided by cost spent to develop it, for somemeasure of size and cost. Keeping the size of a system constant, increasing productivity will result in areduction in cost. There are many ways to measure both of these quantities, so as a result, there aremany di�erent measures of productivity. We used the total number of hours spent across developmentphases (analysis, design, implementation, testing) and rework as our measure of cost. Size was calculatedas the total source lines of code (SLOC).Using this measure of productivity, we �rst examined the correlations between the various reusemeasures and productivity. As shown in table 4, the reuse ratio measure clearly has the best correlationwith this measure of productivity. The only other measure that has a signi�cant correlation withproductivity is Rsf , with a correlation of 0.66.A model can be developed to quantify the impact of reuse bene�t on productivity. Since both reusebene�t (R) and productivity (�) are non-negative real valued variables, we can model their relationshipas: � = a(1 +R)b;for some coe�cients a and b. When there is no reuse, productivity is a. As reuse bene�t increases,productivity increases, with the maximum reuse bene�t of 1 resulting in productivity of a � 2b. Takingthe natural logarithm of both sides of the equation and simplifying yields the following:ln(�) = ln(a) + b ln(1 +R):With this form of the model, we can use a standard least squares regression to estimate the coe�cientsa and b.Table 5 shows models of this form developed using the two reuse measures best correlated withproductivity. The table shows the calculated coe�cients for the intercept (ln(a)) and the explanatoryvariable R (b), as well as their standard error and level of signi�cance. Using Rsf , the R2 for the modelis .51, indicating that Rsf explains half the variation in productivity. The model developed using RR isstronger, with an R2 of 0.77. The intercept for this model is 2.94, so when RR = 0, ln(�) = 2:94, andthus productivity without reuse is e2:94, or 18.94 SLOC/Hour. As RR increases, productivity increases.For example, an increase in reuse ratio from 0.20 to 0.30 would result in an increase in productivityfrom 31.4 to 39.2 SLOC per hour. As there are no projects in this sample with RR greater than 50%,any conclusion about productivity for very high levels of RR would be purely speculative.4.4.2 Product QualityWe examined the relationship of the reuse measures to the product quality measures of fault and errordensity. As with productivity, we used standard de�nitions of fault and error density, Faults per KSLOCand Errors per KSLOC, resp. The expected e�ect is that as reuse increases, these measures of fault15
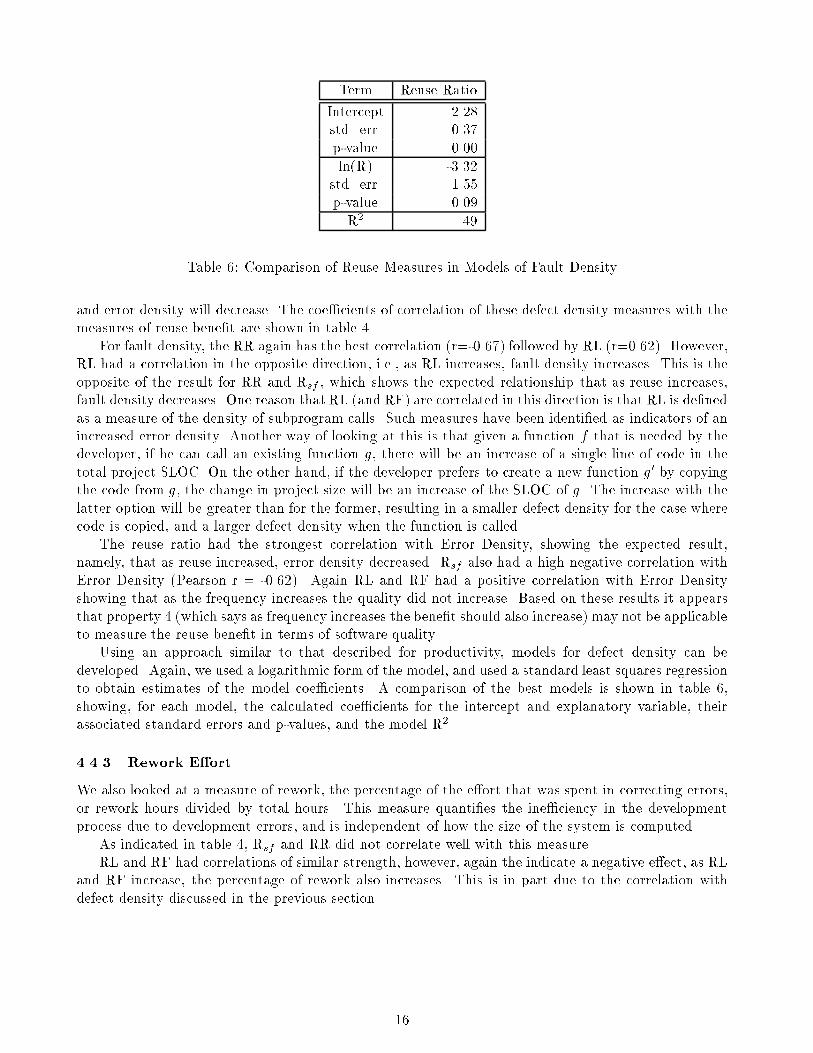
Term Reuse RatioIntercept 2.28std. err. 0.37p-value 0.00ln(R) -3.32std. err. 1.55p-value 0.09R2 .49Table 6: Comparison of Reuse Measures in Models of Fault Densityand error density will decrease. The coe�cients of correlation of these defect density measures with themeasures of reuse bene�t are shown in table 4.For fault density, the RR again has the best correlation (r=-0.67) followed by RL (r=0.62). However,RL had a correlation in the opposite direction, i.e., as RL increases, fault density increases. This is theopposite of the result for RR and Rsf , which shows the expected relationship that as reuse increases,fault density decreases. One reason that RL (and RF) are correlated in this direction is that RL is de�nedas a measure of the density of subprogram calls. Such measures have been identi�ed as indicators of anincreased error density. Another way of looking at this is that given a function f that is needed by thedeveloper, if he can call an existing function g, there will be an increase of a single line of code in thetotal project SLOC. On the other hand, if the developer prefers to create a new function g0 by copyingthe code from g, the change in project size will be an increase of the SLOC of g. The increase with thelatter option will be greater than for the former, resulting in a smaller defect density for the case wherecode is copied, and a larger defect density when the function is called.The reuse ratio had the strongest correlation with Error Density, showing the expected result,namely, that as reuse increased, error density decreased. Rsf also had a high negative correlation withError Density (Pearson r = -0.62). Again RL and RF had a positive correlation with Error Densityshowing that as the frequency increases the quality did not increase. Based on these results it appearsthat property 4 (which says as frequency increases the bene�t should also increase) may not be applicableto measure the reuse bene�t in terms of software quality.Using an approach similar to that described for productivity, models for defect density can bedeveloped. Again, we used a logarithmic form of the model, and used a standard least squares regressionto obtain estimates of the model coe�cients. A comparison of the best models is shown in table 6,showing, for each model, the calculated coe�cients for the intercept and explanatory variable, theirassociated standard errors and p-values, and the model R2.4.4.3 Rework E�ortWe also looked at a measure of rework, the percentage of the e�ort that was spent in correcting errors,or rework hours divided by total hours. This measure quanti�es the ine�ciency in the developmentprocess due to development errors, and is independent of how the size of the system is computed.As indicated in table 4, Rsf and RR did not correlate well with this measure.RL and RF had correlations of similar strength, however, again the indicate a negative e�ect, as RLand RF increase, the percentage of rework also increases. This is in part due to the correlation withdefect density discussed in the previous section. 16
5 ConclusionThis paper is concerned with an evaluation of indirectmeasurement of the bene�t of software reuse. Fivemetrics proposed in the literature have been analytically and empirically assessed with regard to theircapabilities to predict productivity and quality in object-oriented systems. To analytically evaluate themetrics, we have proposed a set of desirable properties of reuse bene�t measures, and evaluated thesemetrics in terms of their compliance with these properties.None of the metrics satis�ed all the properties, as all had strengths in some areas and weaknessesin others. RL and RF fall short in terms of the sensitivity to the cost of the reused object and theadditional bene�t from external reuse. RSI and RR do not cover the bene�t of internal reuse. Rsfappears to provide a good balance, accounting for the bene�t of both internal and external reuse.However, it does not account for reuse via modi�cation, a weakness of all the measure except for RR.To empirically evaluate the metrics, we have (1) constructed a set of tools to extract these metricsfrom C++ programs, (2) collected process data on the development of a set of small object-orientedsystems, and then, based on the product and process data collected on these systems, (3) veri�edstatistically the correlations between these metrics and the quality factors of productivity and defectdensity. Finally, for those metrics that correlated well with productivity and defect density, we alsodeveloped predictive models.RR is well correlated with productivity, fault density and error density, but, not with the percentageof rework e�ort. Rsf has signi�cant correlations with productivity and error density, but not with faultdensity of the percentage of rework e�ort. RL and RF appear correlated with fault and error density,and the percentage of rework e�ort, but interestingly, in the wrong direction. as RL and RF increase,we see an increase in fault density, rework density, and the percentage of rework e�ort.A major di�erence between Rsf andRL/RF is thatRsf accounts for component size. This importantdi�erence may be the reason for the markedly di�erent results found with these measures, with Rsfshowing some correlation with the quality factors, and RL/RF showing either no correlation, or asigni�cant correlation, but in the wrong direction.Another interesting point raised with this work is the fact that the modi�ed components also appearto have a signi�cant e�ect in terms of increasing productivity and quality, and, thus, should be alsoconsidered in a comprehensive de�nition of a reuse metric. Nevertheless, this raises some questions. Forinstance, how can we accurately verify the extent to which component has been changed? What shouldthe modi�cation threshold be? In this work we assumed that only components changes less than 25percent should be counted. This threshold may be domain dependent, i.e., di�erent organizations shouldconduct empirical work in order to determine which threshold is most signi�cant in their environment.In addition, tools must be built in order to determine automatically how much a component has beenchanged. This can, in fact, reduce the human error introduced in the analysis, thus increasing theaccuracy and reliability of the results.Finally, our empirical study has highlighted a practical di�culty in using RSI . In four out of theseven student projects used in our data, there was no verbatim reuse of components from externallibraries. For this reason, RSI was zero in four out of seven data points. This precludes any usefulanalysis of the predictive power of the RSI data; however, our experience indicates that RSI may notprovide helpful data in projects where a signi�cant number of external components are used only aftermodi�cations. From our experience, it appears that that other metrics o�er some ability to explain thevariance in productivity and quality data even in such cases; this suggests that RSI may be taking toostrict a view of what constitutes reuse.The results indicate that di�erent reuse metrics can be used as predictors of di�erent quality at-tributes. For example, reuse ratio and size/frequency reuse metric each appeared to be well correlatedwith productivity and error density, but this size/frequency metric did not show any signi�cant resultwith regard to faulty density. Further empirical validation is, thus, still necessary in order to evaluatethese metrics in actual software organizations. Empirical work is (in general) hobbled by the di�cultyin obtaining su�cient process data to allow for empirical validation of the metrics. This work provides17

a framework by which reuse metrics can be analytically and empirically evaluated prior to their use:the analytical properties, software tools and data collection programs developed in the framework ofthis study can be used in other studies, thus facilitating the replication of this work in academia andindustry. As a continuation of this work, we intend to (1) perform case studies at the Software Engi-neering Laboratory (SEL) to assess the feasibility automated methods of determining the amount ofmodi�cation in a component and to further identify what is an appropriate threshold of modi�cationto still achieve a reuse bene�t, (2) evaluate the set of metrics analyzed in this paper using the productand process data extracted from object-oriented systems under development at the SEL, (3) evaluatethe capabilities of prediction of these metrics with regard to fault density, rework and maintainability,(4) continue the empirical analyses to better understand the importance of the proposed properties ofreuse measures identi�ed in this paper.References[1] B. Baker. A theory of parametrized pattern matching: algorithms and applications. Journal ofComput. Sys. Sci., to appear, 1995.[2] J. M. Bieman. Deriving measures of softwre reuse in object oriented systems. In T. Denvir,R. Herman, and R. W. Whittey, editors, Formal Aspects of Measurement, pages 79{82. Springer{Verlag, 1992.[3] T. Bollinger and S P eeger. Economics of reuse: issues and alternatives. Information and SoftwareTechnology, 32(10):643{652, 1990.[4] Y-F. Chen, B. Krishnamurthy, and K-P. Vo. An Objective Reuse Metric: Model and Methodology.In Fifth European Software Engineering Conference, 1995.[5] P. Devanbu. genoa a customizable, language and front{end independent code analyzer. In Proc.of 14th Int'l Conf. on Software Engineering (ICSE), pages 307{317. IEEE Press, 1992.[6] P. Devanbu and S. Karstu. Measuring the bene�ts of software reuse. Technical report, AT&T BellLaboratories, 1994.[7] N. E. Fenton. Software Metrics: A Rigorous Approach. Chapman & Hall, 1991.[8] W. Frakes and C. Terry. Reuse level metrics. Technical Report TR 94-03, Virginia PolytechnicInstitute and State University, 1991.[9] J. E. Ga�ney and R. Cruickshank. A general economic model for software reuse. In Proc. of the14th Int'l Conf. on Software Engineering. IEEE Press, 1992.[10] J. E. Ga�ney and T. A. Durek. Software reuse | key to enhanced productivity: some quantitativemodels. Information and Software Technology, 31(5):258{267, 1989.[11] R. Greer. All about daytona. Technical report, AT&T Bell Laboratories, 1994.[12] F. McGarry, R. Pajerski, G. Page, S. Waligora, V. Basili, and M. Zelkowitz. Software processimprovement in the nasa software engineering laboratory. Technical Report CMU/SEI-95-TR-22,Carniege-Mellon Unv., S/W Eng. Institute, Dec. 1994.[13] W. Melo, L.Briand, and V. Basili. Measuring the impact of reuse on quality and productivity inobject-oriented systems. Technical Report CS-TR-3395, University of Maryland, Computer ScienceDepartment, 1995.[14] J. Poulin, J. Caruso, and D. Hancock. The business case for software reuse. IBM Systems Journal,32(4):567{594, 1993. 18
[15] J. Rumbaugh, M. Blaha, W. Premerlani, F. Eddy, and W. Lorensen. Object-Oriented Modelingand Design. Prentice-Hall, 1991.[16] W. Thomas, A. Delis, and V. Basili. An analysis of errors in a reuse-oriented development environ-ment. Technical Report CS-TR-3424, Dept. of Computer Science, University of Maryland, CollegePark, MD, 20742, Feb. 1995.[17] E. J. Weyuker. Evaluating software complexity metrics. IEEE Transacations on Software Engi-neering, 14(9):1357{1365, 1988.[18] A. Young. Object-Oriented Programming with C++ and OSF/MOTIF. Prentice-Hall, 1992.
19
Related Documents


