1 Analysts Day November 15, 2013

Welcome message from author
This document is posted to help you gain knowledge. Please leave a comment to let me know what you think about it! Share it to your friends and learn new things together.
Transcript

1
Analysts Day November 15, 2013
Disclaimer
2
The information (“Confidential Information”) contained in this presentation is strictly confidential and is provided by Ananda Development Public Company Limited (the “Company”) to you solely for your reference. Neither this presentation nor any part thereof may be (i) used or relied upon by any other party or for any other purpose; (ii) copied, photocopied, duplicated or otherwise reproduced in any form or by any means; or (iii) redistributed, passed on or otherwise disseminated, to any other person either in your organization or elsewhere, without the prior written consent of the Company. By attending this presentation, participants agree not to remove this document, or any materials provided in connection herewith, from the conference room where such documents are provided without express consent from the Company. Although care has been taken to ensure that the Confidential Information in this presentation is accurate, and that the opinions expressed are fair and reasonable, the Confidential Information is subject to change without notice, its accuracy is not guaranteed, has not been independently verified and it may not contain all material information concerning the Company. None of the Company, or any of their respective members, directors, officers, employees or affiliates nor any other person accepts any liability (in negligence, or otherwise) whatsoever for any loss howsoever arising from any use of this presentation or its contents or otherwise arising in connection therewith. This presentation is for information purposes only and does not constitute or form part of any offer or invitation for sale or subscription of or solicitation or invitation of any offer to or recommendation to buy or subscribe for any securities, nor shall it or any part of it form the basis of or be relied on in connection with any contract, commitment or investment decision in relation thereto in Thailand, United States or any other jurisdiction. Any such purchase should be made solely on the basis of the information contained in the announcements to the Stock Exchange of Thailand relating to such securities. No reliance may be placed for any purposes whatsoever on the information set forth in this presentation or on its completeness. This presentation contains projections and forward‐looking statements that reflect the Company's current views with respect to future events and financial performance. These views are based on a number of estimates and current assumptions which are subject to business, economic and competitive uncertainties and contingencies as well as various risks and these may change over time and in many cases are outside the control of the Company. You are cautioned not to place undue reliance on these forward looking statements. No assurance can be given that future events will occur, that projections will be achieved, or that the Company's assumptions are correct. Such forward‐looking statements are not guarantees of future performance and accordingly, the actual results, financial condition, performance or achievements of the Company may differ materially from those forecasted and projected or in the forward‐looking statements.
Agenda
1. Q3 financial results
2. Revised guidance
3. Sales progress
3.1) International sales
4. Backlog
5. Construction updates
5.1) ADO construction numbers and
aerial photos
6. 2014 Business Plan
7. Perp
7.1) Common Q&A
8. Dividend
3
Reviewed FS 3Q13: Statements of comprehensive income
4
% GP 37.1
% GP 38.2
% EBITDA
12.9 % EBITDA
0.1
3Q12 3Q13 9 months
% GP 40.2
% GP 36.2
% EBITDA
20.0
% EBITDA
(4.6)
3Q12 3Q13 3 months
Consolidated 3 Months 9 Months
Currency: Bt. Millions 3Q12 4Q12 1Q13 2Q13 3Q13 3Q12 3Q13
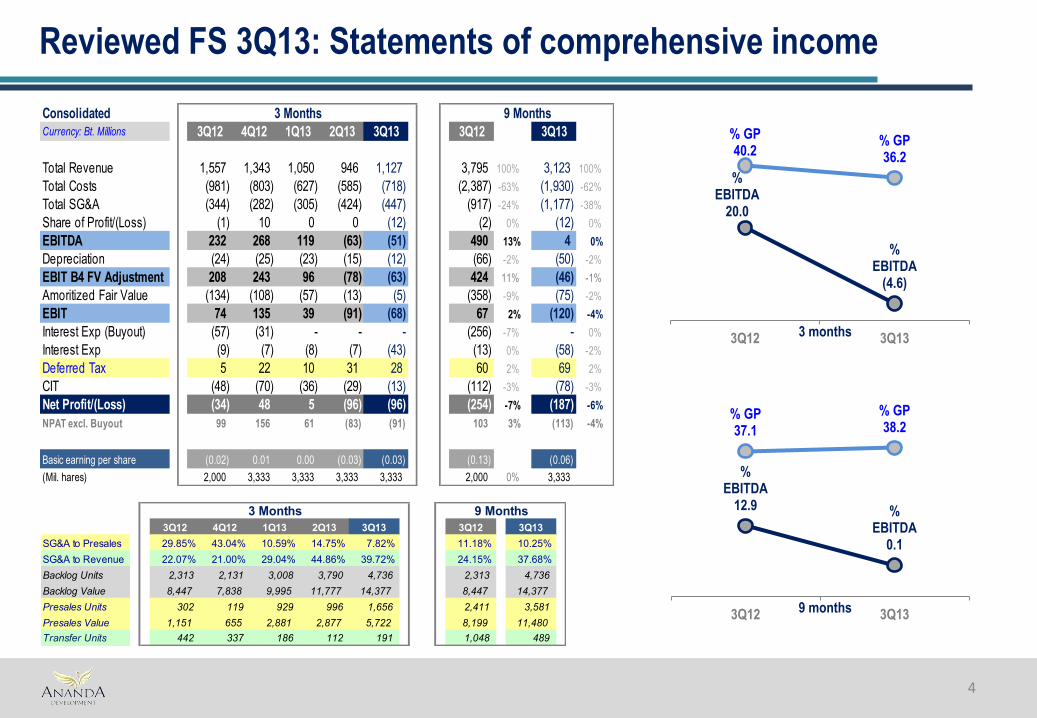
Total Revenue 1,557 1,343 1,050 946 1,127 3,795 100% 3,123 100%
Total Costs (981) (803) (627) (585) (718) (2,387) -63% (1,930) -62%
Total SG&A (344) (282) (305) (424) (447) (917) -24% (1,177) -38%
Share of Profit/(Loss) (1) 10 0 0 (12) (2) 0% (12) 0%
EBITDA 232 268 119 (63) (51) 490 13% 4 0%
Depreciation (24) (25) (23) (15) (12) (66) -2% (50) -2%
EBIT B4 FV Adjustment 208 243 96 (78) (63) 424 11% (46) -1%
Amoritized Fair Value (134) (108) (57) (13) (5) (358) -9% (75) -2%
EBIT 74 135 39 (91) (68) 67 2% (120) -4%
Interest Exp (Buyout) (57) (31) - - - (256) -7% - 0%
Interest Exp (9) (7) (8) (7) (43) (13) 0% (58) -2%
Deferred Tax 5 22 10 31 28 60 2% 69 2%
CIT (48) (70) (36) (29) (13) (112) -3% (78) -3%
Net Profit/(Loss) (34) 48 5 (96) (96) (254) -7% (187) -6%
NPAT excl. Buyout 99 156 61 (83) (91) 103 3% (113) -4%
Basic earning per share (0.02) 0.01 0.00 (0.03) (0.03) (0.13) (0.06)
(Mil. hares) 2,000 3,333 3,333 3,333 3,333 2,000 0% 3,333
3 Months 9 Months
3Q12 4Q12 1Q13 2Q13 3Q13 3Q12 3Q13
SG&A to Presales 29.85% 43.04% 10.59% 14.75% 7.82% 11.18% 10.25%
SG&A to Revenue 22.07% 21.00% 29.04% 44.86% 39.72% 24.15% 37.68%
Backlog Units 2,313 2,131 3,008 3,790 4,736 2,313 4,736
Backlog Value 8,447 7,838 9,995 11,777 14,377 8,447 14,377
Presales Units 302 119 929 996 1,656 2,411 3,581
Presales Value 1,151 655 2,881 2,877 5,722 8,199 11,480
Transfer Units 442 337 186 112 191 1,048 489
5
Reviewed FS 3Q13: Statements of financial position
Cash Flows
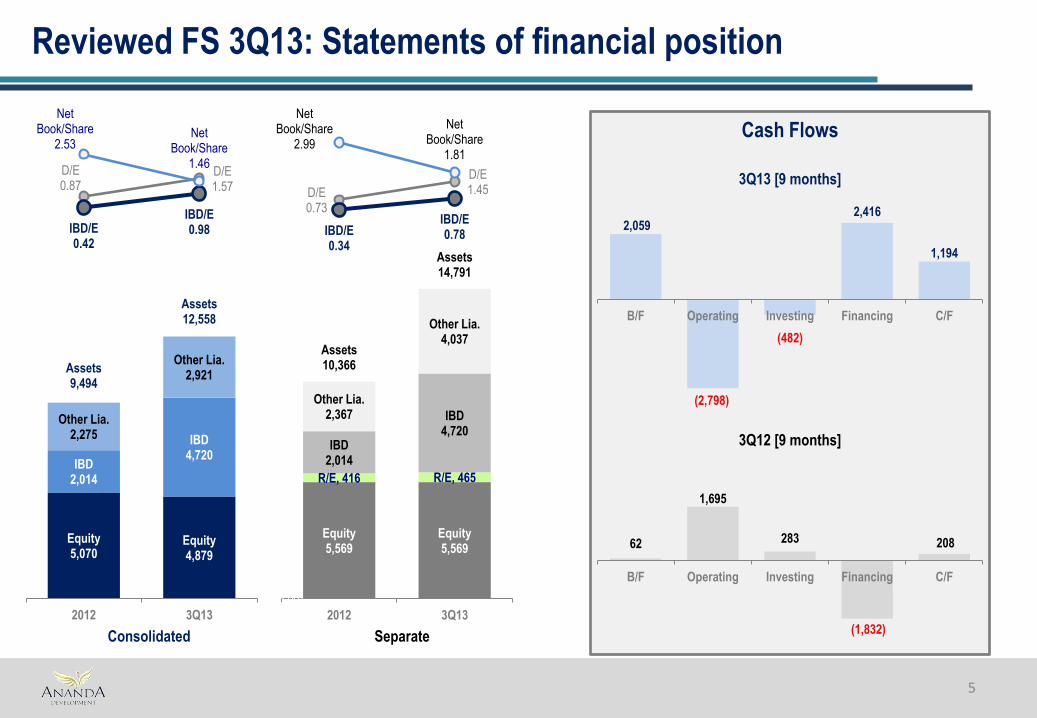
2,059
(2,798)
(482)
2,416
1,194
B/F Operating Investing Financing C/F
3Q13 [9 months]
62
1,695
283
(1,832)
208
B/F Operating Investing Financing C/F
3Q12 [9 months]
Equity 5,569
Equity 5,569
R/E, 416 R/E, 465
IBD 2,014
IBD 4,720
Other Lia. 2,367
Other Lia. 4,037
Assets 10,366
Assets 14,791
D/E 0.73
D/E 1.45
IBD/E 0.34
IBD/E 0.78
Net Book/Share
2.99
Net Book/Share
1.81
(15.00)
(13.00)
(11.00)
(9.00)
(7.00)
(5.00)
(3.00)
(1.00)
1.00
3.00
-
2,000
4,000
6,000
8,000
10,000
12,000
14,000
16,000
18,000
20,000
22,000
2012 3Q13
Separate
Equity 5,070
Equity 4,879
IBD 2,014
IBD 4,720
Other Lia. 2,275
Other Lia. 2,921
Assets 9,494
Assets 12,558
D/E 0.87
D/E 1.57
IBD/E 0.42
IBD/E 0.98
Net Book/Share
2.53 Net
Book/Share 1.46
(15.00)
(13.00)
(11.00)
(9.00)
(7.00)
(5.00)
(3.00)
(1.00)
1.00
3.00
-
2,000
4,000
6,000
,000
10,000
12,000
14,000
16,000
,000
,000
,000
2012 3Q13
Consolidated
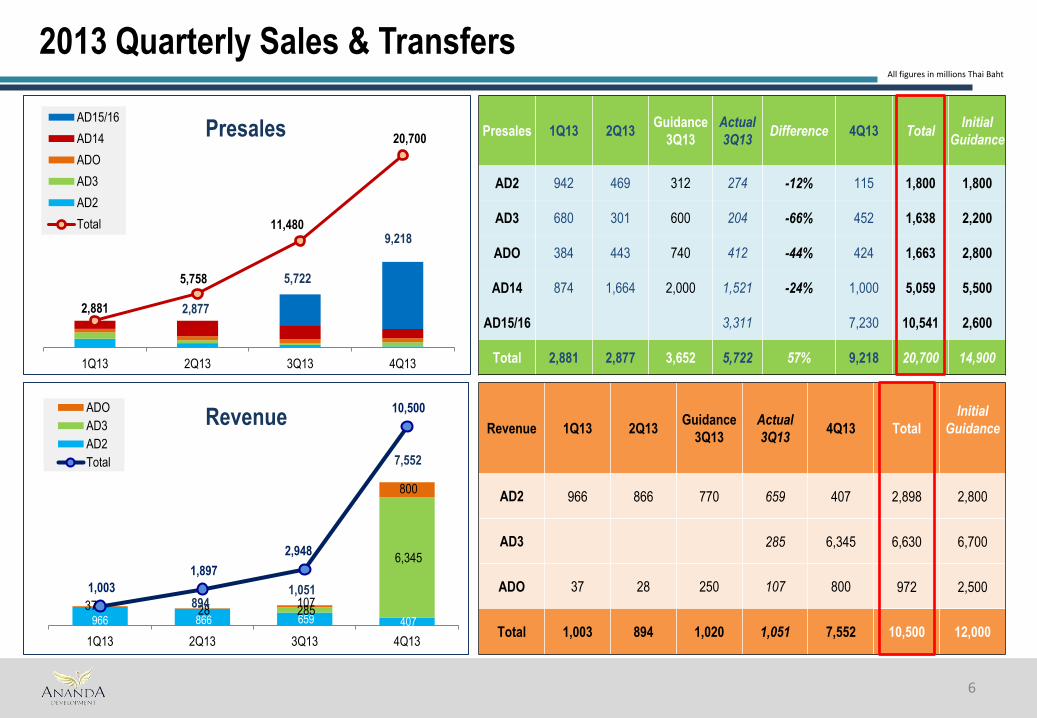
2013 Quarterly Sales & Transfers
6
All figures in millions Thai Baht
966 866 659 407 285
6,345
37 28 107
800
1,003
1,897
2,948
10,500
1Q13 2Q13 3Q13 4Q13
ADO
AD3
AD2
Total
894 1,051
7,552
Revenue Revenue 1Q13 2Q13
Guidance
3Q13
Actual
3Q13 4Q13 Total
Initial
Guidance
AD2 966 866 770 659 407 2,898 2,800
AD3 285 6,345 6,630 6,700
ADO 37 28 250 107 800 972 2,500
Total 1,003 894 1,020 1,051 7,552 10,500 12,000
Presales 1Q13 2Q13 Guidance
3Q13
Actual
3Q13 Difference 4Q13 Total
Initial
Guidance
AD2 942 469 312 274 -12% 115 1,800 1,800
AD3 680 301 600 204 -66% 452 1,638 2,200
ADO 384 443 740 412 -44% 424 1,663 2,800
AD14 874 1,664 2,000 1,521 -24% 1,000 5,059 5,500
AD15/16 3,311 7,230 10,541 2,600
Total 2,881 2,877 3,652 5,722 57% 9,218 20,700 14,900
2,881
5,758
11,480
20,700
1Q13 2Q13 3Q13 4Q13
AD15/16
AD14
ADO
AD3
AD2
Total
2,877
Presales
5,722
9,218
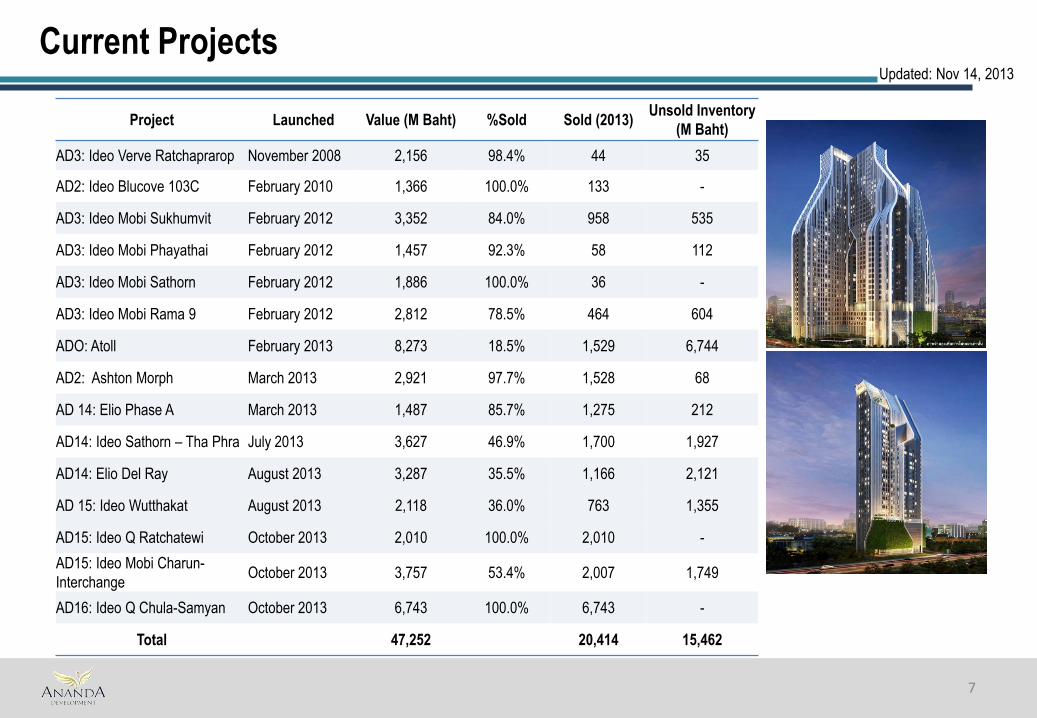
Current Projects
7
Project Launched Value (M Baht) %Sold Sold (2013) Unsold Inventory
(M Baht)
AD3: Ideo Verve Ratchaprarop November 2008 2,156 98.4% 44 35
AD2: Ideo Blucove 103C February 2010 1,366 100.0% 133 -
AD3: Ideo Mobi Sukhumvit February 2012 3,352 84.0% 958 535
AD3: Ideo Mobi Phayathai February 2012 1,457 92.3% 58 112
AD3: Ideo Mobi Sathorn February 2012 1,886 100.0% 36 -
AD3: Ideo Mobi Rama 9 February 2012 2,812 78.5% 464 604
ADO: Atoll February 2013 8,273 18.5% 1,529 6,744
AD2: Ashton Morph March 2013 2,921 97.7% 1,528 68
AD 14: Elio Phase A March 2013 1,487 85.7% 1,275 212
AD14: Ideo Sathorn – Tha Phra July 2013 3,627 46.9% 1,700 1,927
AD14: Elio Del Ray August 2013 3,287 35.5% 1,166 2,121
AD 15: Ideo Wutthakat August 2013 2,118 36.0% 763 1,355
AD15: Ideo Q Ratchatewi October 2013 2,010 100.0% 2,010 -
AD15: Ideo Mobi Charun-
Interchange October 2013 3,757 53.4% 2,007 1,749
AD16: Ideo Q Chula-Samyan October 2013 6,743 100.0% 6,743 -
Total 47,252 20,414 15,462
Updated: Nov 14, 2013
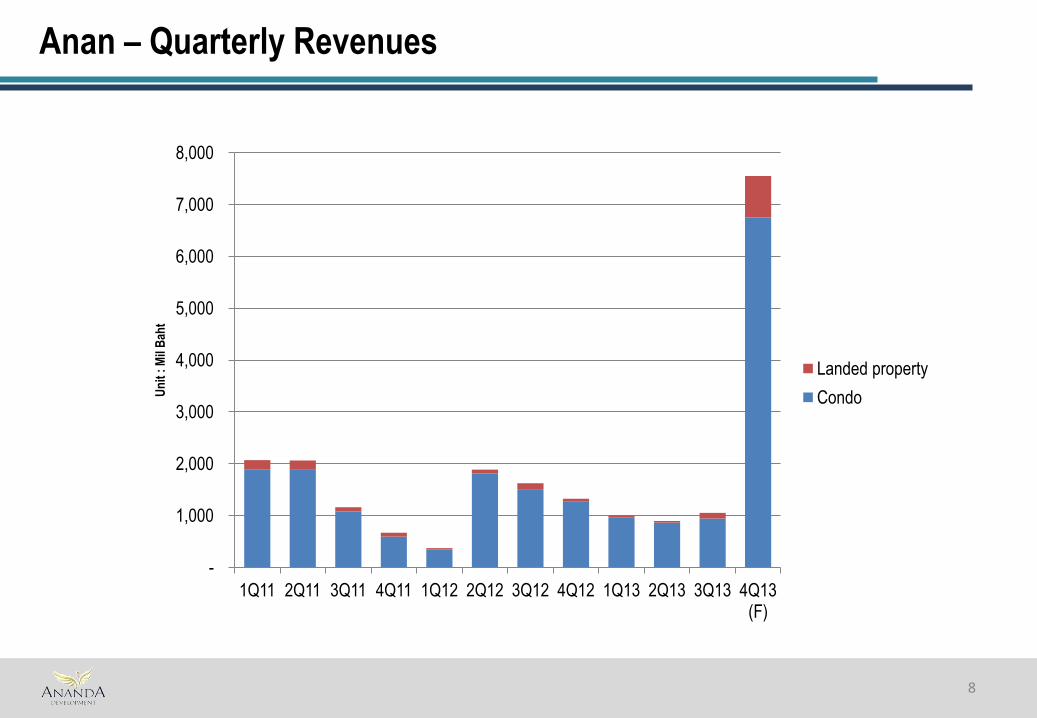
Anan – Quarterly Revenues
8
-
1,000
2,000
3,000
4,000
5,000
6,000
7,000
8,000
1Q11 2Q11 3Q11 4Q11 1Q12 2Q12 3Q12 4Q12 1Q13 2Q13 3Q13 4Q13 (F)
Un
it :
Mil
Bah
t
Landed property
Condo
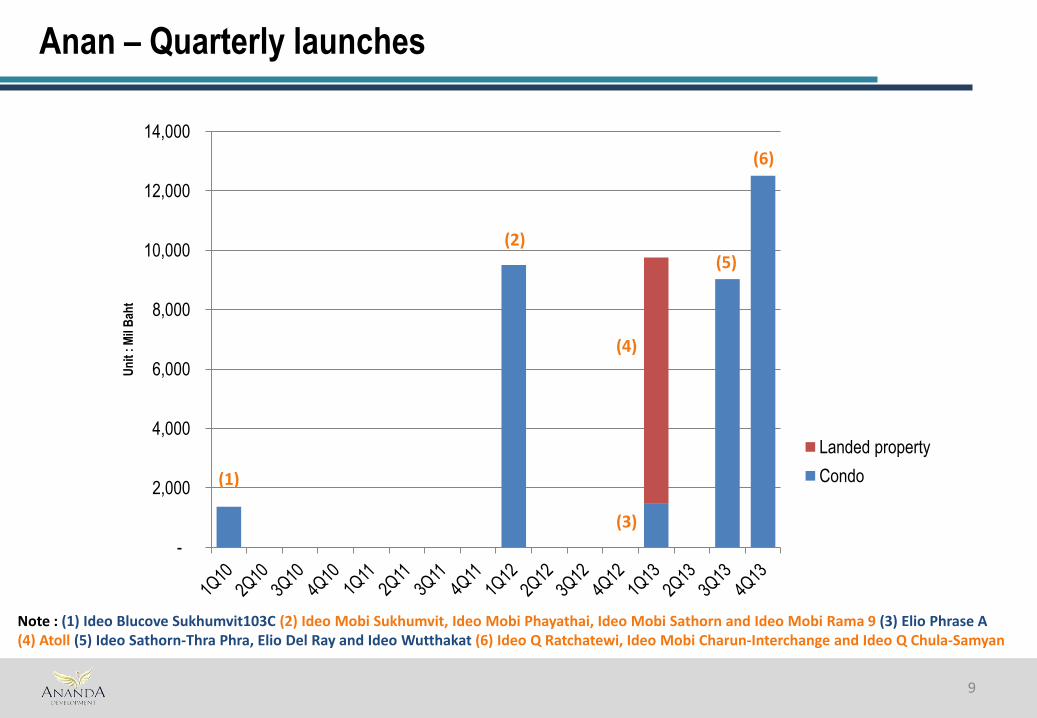
Anan – Quarterly launches
9
-
2,000
4,000
6,000
8,000
10,000
12,000
14,000 U
nit
: M
il B
aht
Landed property
Condo (1)
(2)
(3)
(4)
(5)
(6)
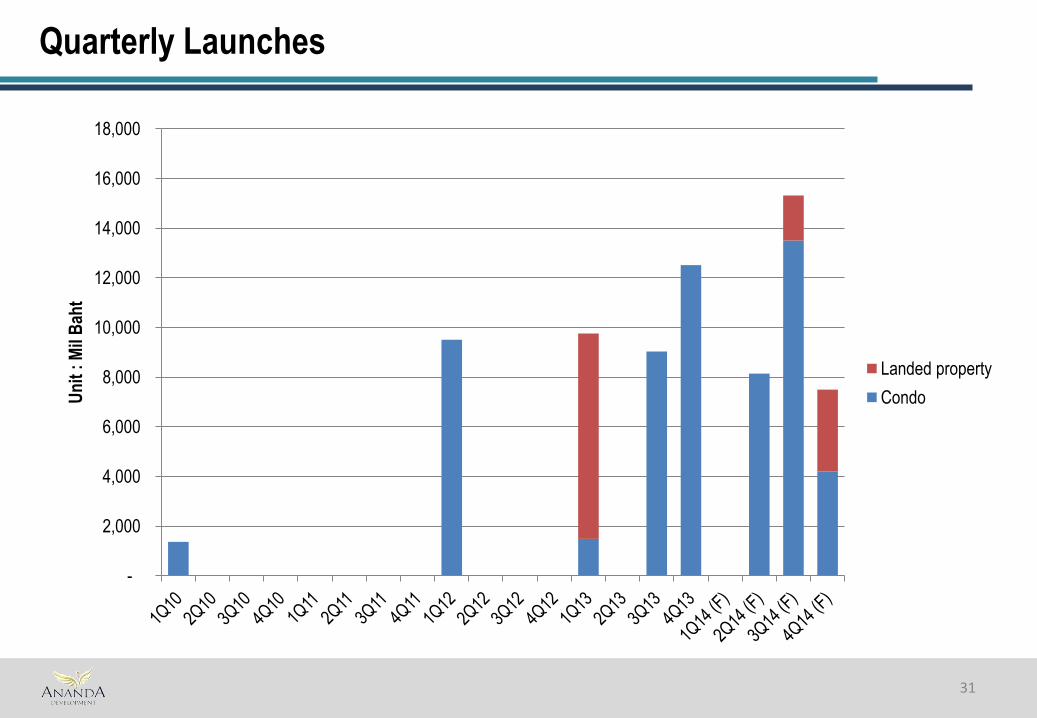
Note : (1) Ideo Blucove Sukhumvit103C (2) Ideo Mobi Sukhumvit, Ideo Mobi Phayathai, Ideo Mobi Sathorn and Ideo Mobi Rama 9 (3) Elio Phrase A (4) Atoll (5) Ideo Sathorn-Thra Phra, Elio Del Ray and Ideo Wutthakat (6) Ideo Q Ratchatewi, Ideo Mobi Charun-Interchange and Ideo Q Chula-Samyan
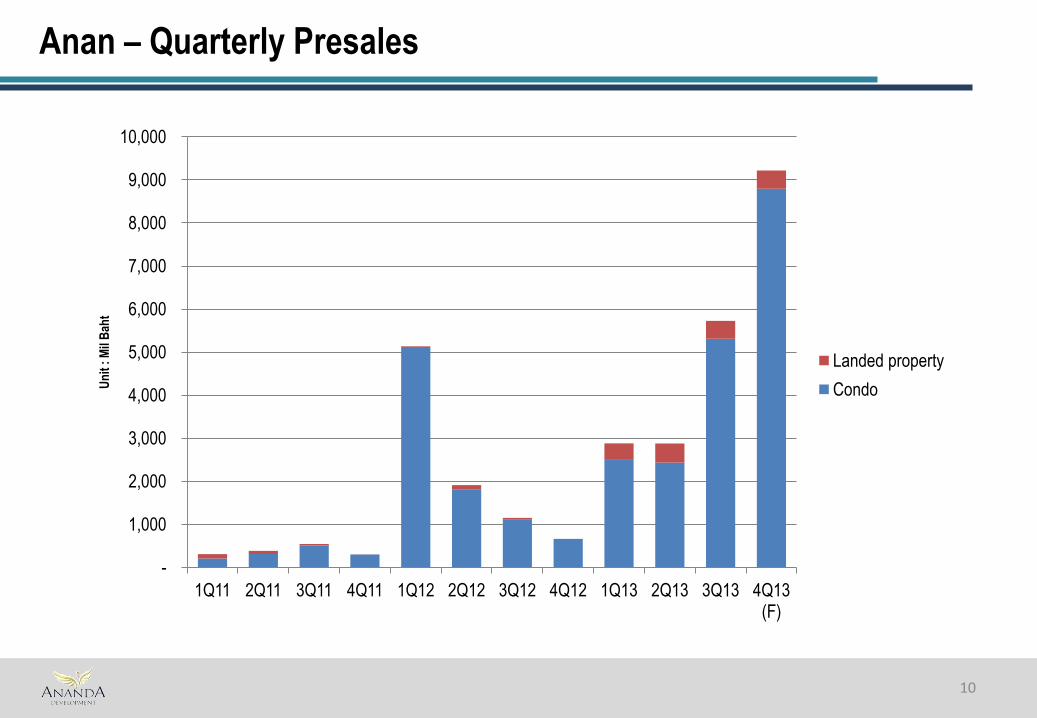
Anan – Quarterly Presales
10
-
1,000
2,000
3,000
4,000
5,000
6,000
7,000
8,000
9,000
10,000
1Q11 2Q11 3Q11 4Q11 1Q12 2Q12 3Q12 4Q12 1Q13 2Q13 3Q13 4Q13 (F)
Un
it :
Mil
Bah
t
Landed property
Condo
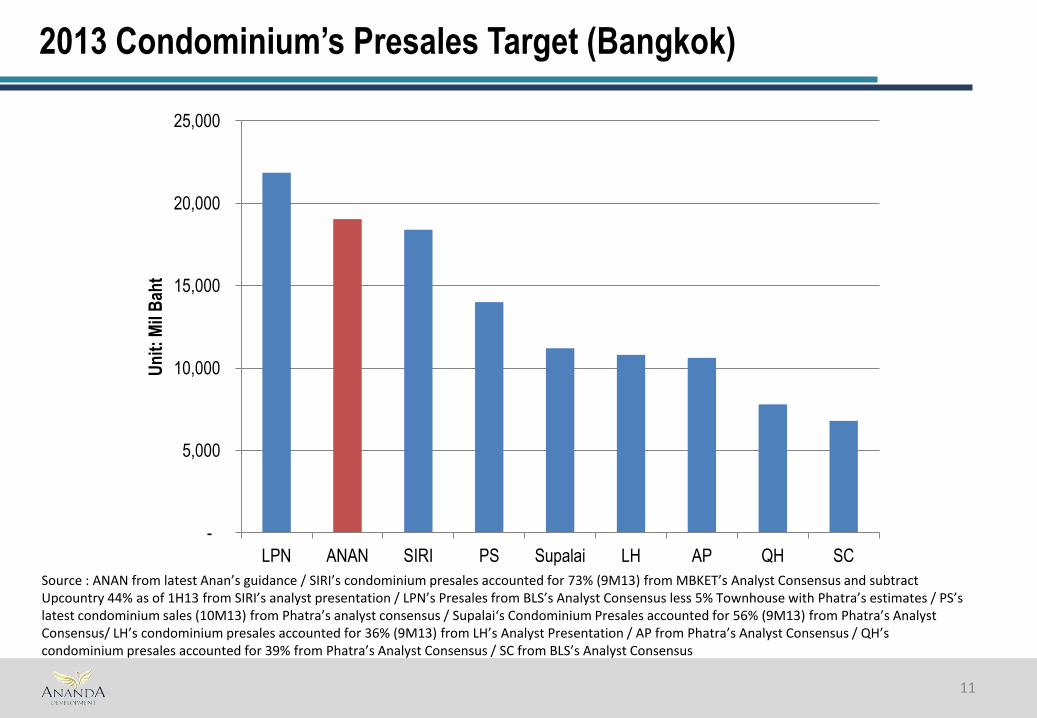
2013 Condominium’s Presales Target (Bangkok)
11
-
5,000
10,000
15,000
20,000
25,000
LPN ANAN SIRI PS Supalai LH AP QH SC
Un
it:
Mil
Bah
t
Source : ANAN from latest Anan’s guidance / SIRI’s condominium presales accounted for 73% (9M13) from MBKET’s Analyst Consensus and subtract Upcountry 44% as of 1H13 from SIRI’s analyst presentation / LPN’s Presales from BLS’s Analyst Consensus less 5% Townhouse with Phatra’s estimates / PS’s latest condominium sales (10M13) from Phatra’s analyst consensus / Supalai‘s Condominium Presales accounted for 56% (9M13) from Phatra’s Analyst Consensus/ LH’s condominium presales accounted for 36% (9M13) from LH’s Analyst Presentation / AP from Phatra’s Analyst Consensus / QH’s condominium presales accounted for 39% from Phatra’s Analyst Consensus / SC from BLS’s Analyst Consensus
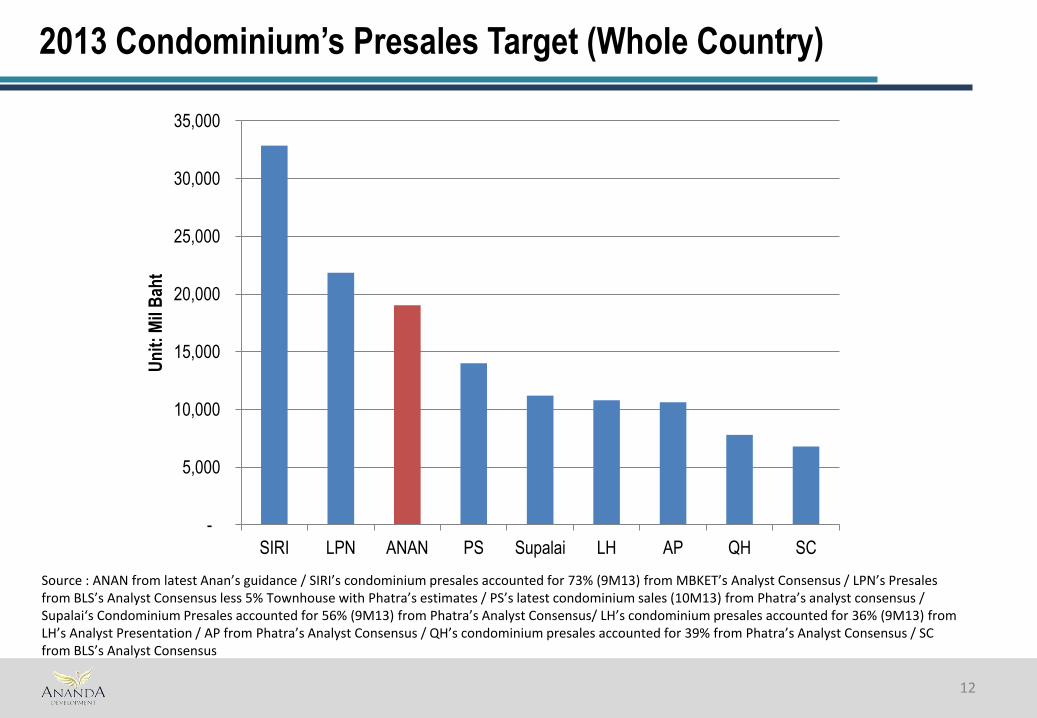
2013 Condominium’s Presales Target (Whole Country)
12
Source : ANAN from latest Anan’s guidance / SIRI’s condominium presales accounted for 73% (9M13) from MBKET’s Analyst Consensus / LPN’s Presales from BLS’s Analyst Consensus less 5% Townhouse with Phatra’s estimates / PS’s latest condominium sales (10M13) from Phatra’s analyst consensus / Supalai‘s Condominium Presales accounted for 56% (9M13) from Phatra’s Analyst Consensus/ LH’s condominium presales accounted for 36% (9M13) from LH’s Analyst Presentation / AP from Phatra’s Analyst Consensus / QH’s condominium presales accounted for 39% from Phatra’s Analyst Consensus / SC from BLS’s Analyst Consensus
-
5,000
10,000
15,000
20,000
25,000
30,000
35,000
SIRI LPN ANAN PS Supalai LH AP QH SC
Un
it:
Mil
Bah
t
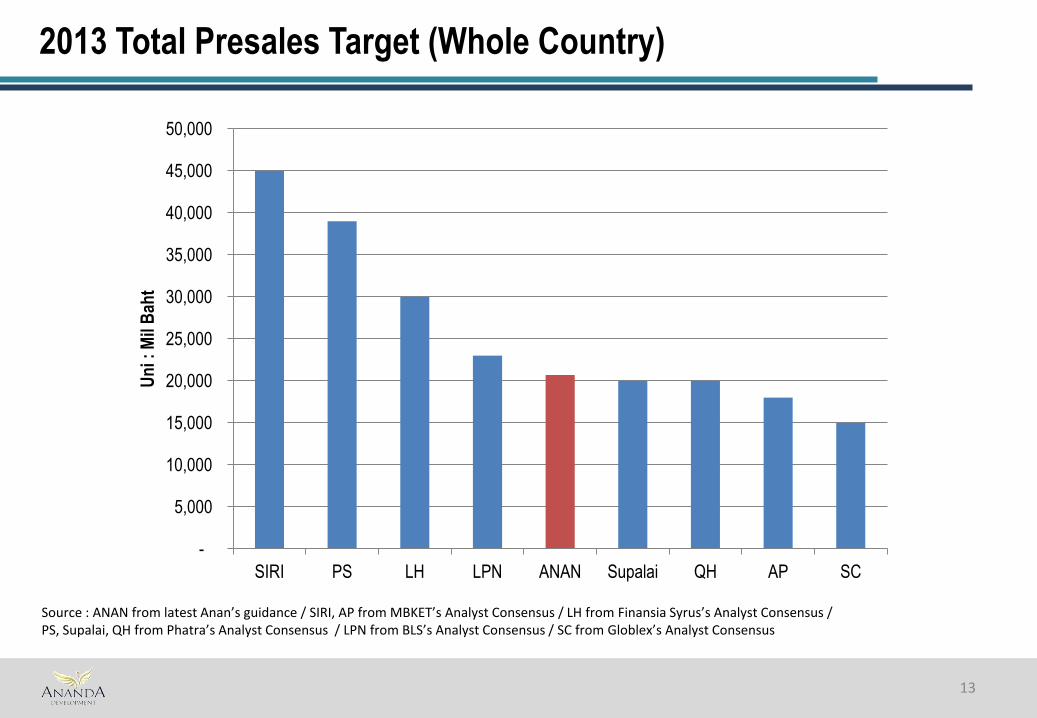
2013 Total Presales Target (Whole Country)
13
Source : ANAN from latest Anan’s guidance / SIRI, AP from MBKET’s Analyst Consensus / LH from Finansia Syrus’s Analyst Consensus / PS, Supalai, QH from Phatra’s Analyst Consensus / LPN from BLS’s Analyst Consensus / SC from Globlex’s Analyst Consensus
-
5,000
10,000
15,000
20,000
25,000
30,000
35,000
40,000
45,000
50,000
SIRI PS LH LPN ANAN Supalai QH AP SC
Un
i : M
il B
aht
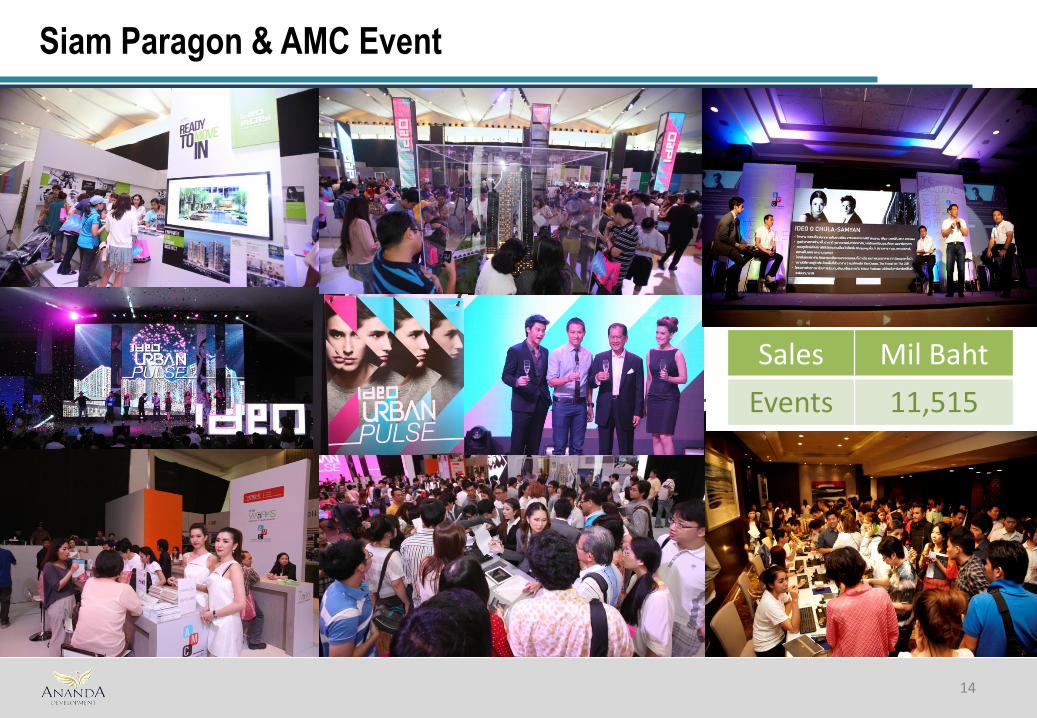
Siam Paragon & AMC Event
14
Sales Mil Baht
Events 11,515
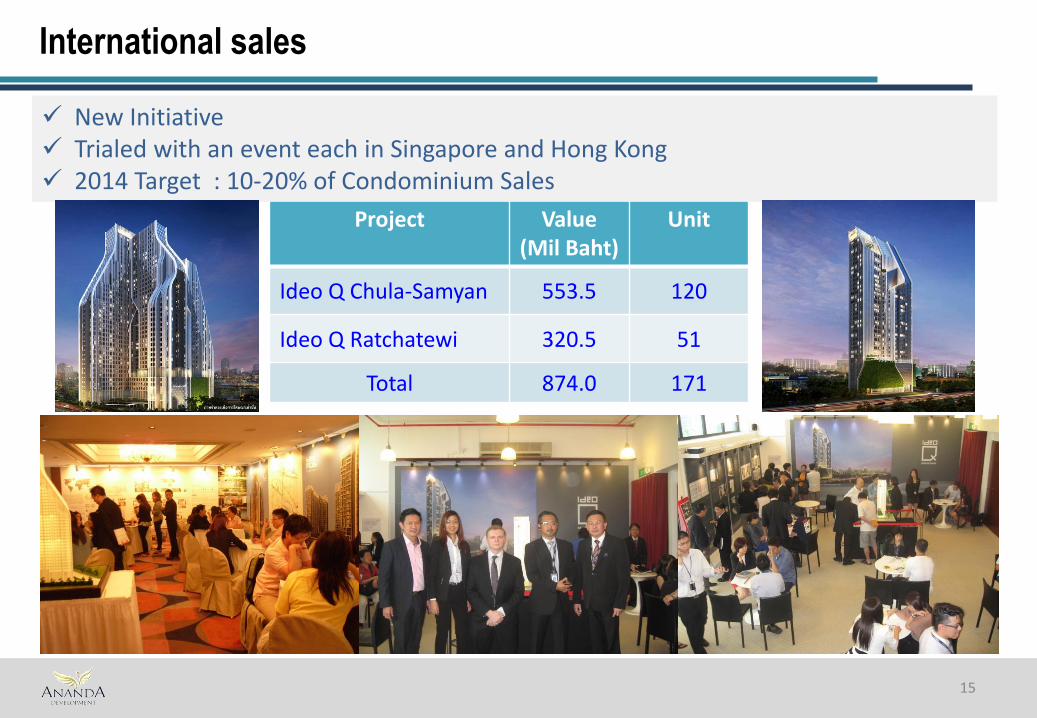
International sales
15
Project Value (Mil Baht)
Unit
Ideo Q Chula-Samyan 553.5 120
Ideo Q Ratchatewi 320.5 51
Total 874.0 171
New Initiative Trialed with an event each in Singapore and Hong Kong 2014 Target : 10-20% of Condominium Sales
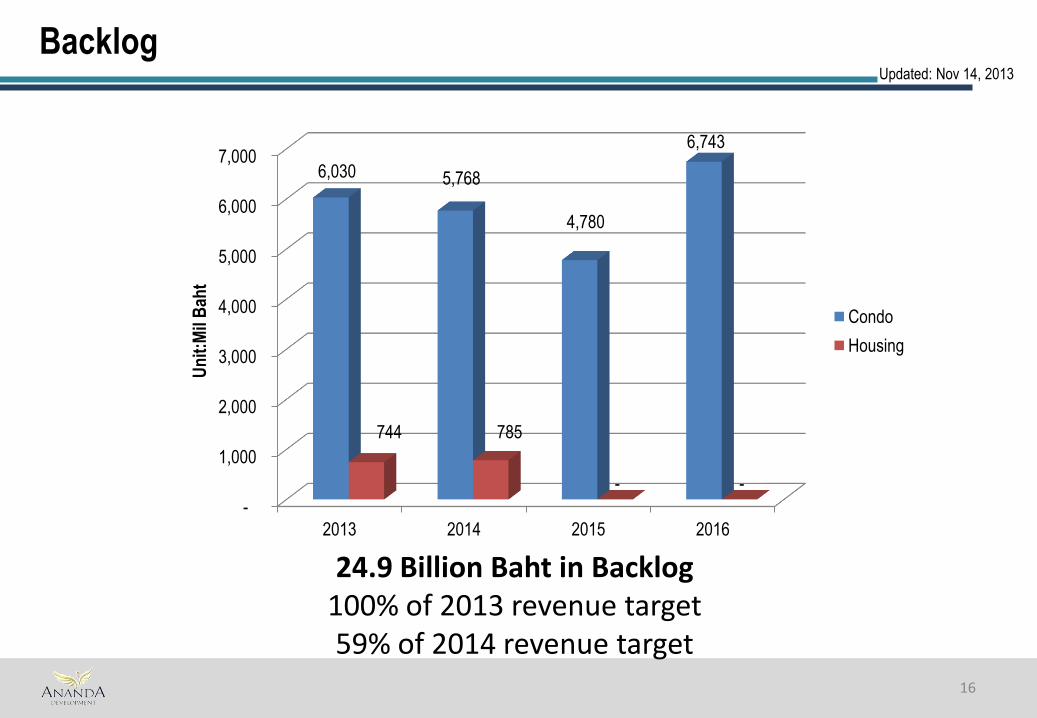
Backlog
16
24.9 Billion Baht in Backlog 100% of 2013 revenue target 59% of 2014 revenue target
Updated: Nov 14, 2013
-
1,000
2,000
3,000
4,000
5,000
6,000
7,000
2013 2014 2015 2016
6,030 5,768
4,780
6,743
744 785
- -
Un
it:M
il B
aht
Condo
Housing
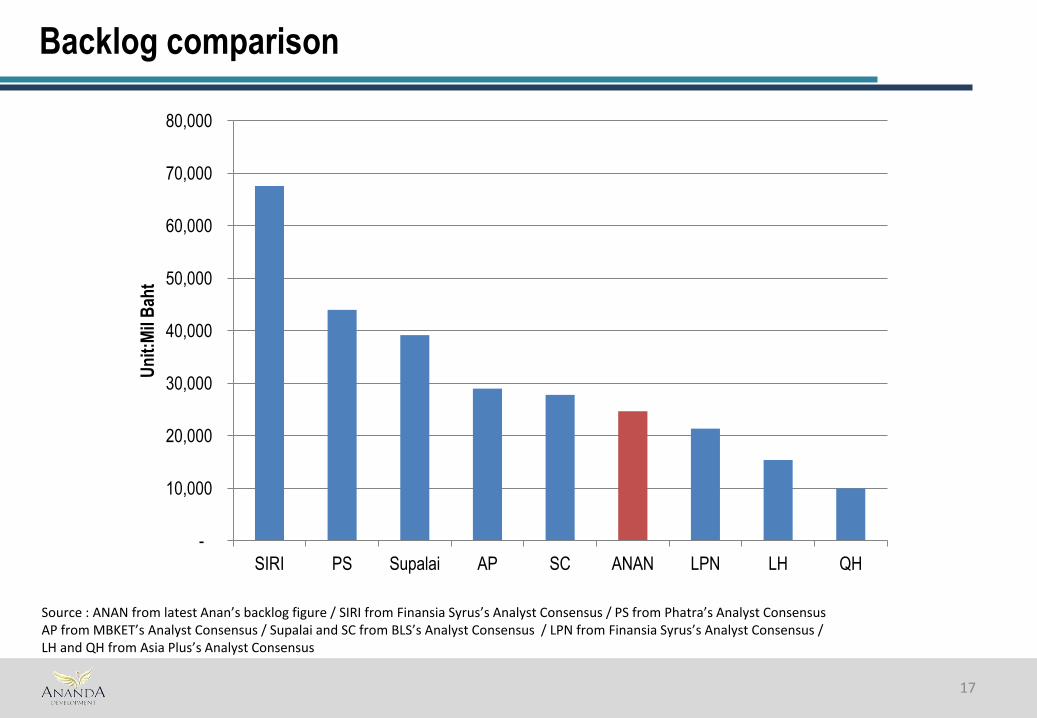
Backlog comparison
17
-
10,000
20,000
30,000
40,000
50,000
60,000
70,000
80,000
SIRI PS Supalai AP SC ANAN LPN LH QH
Un
it:M
il B
aht
Source : ANAN from latest Anan’s backlog figure / SIRI from Finansia Syrus’s Analyst Consensus / PS from Phatra’s Analyst Consensus AP from MBKET’s Analyst Consensus / Supalai and SC from BLS’s Analyst Consensus / LPN from Finansia Syrus’s Analyst Consensus / LH and QH from Asia Plus’s Analyst Consensus
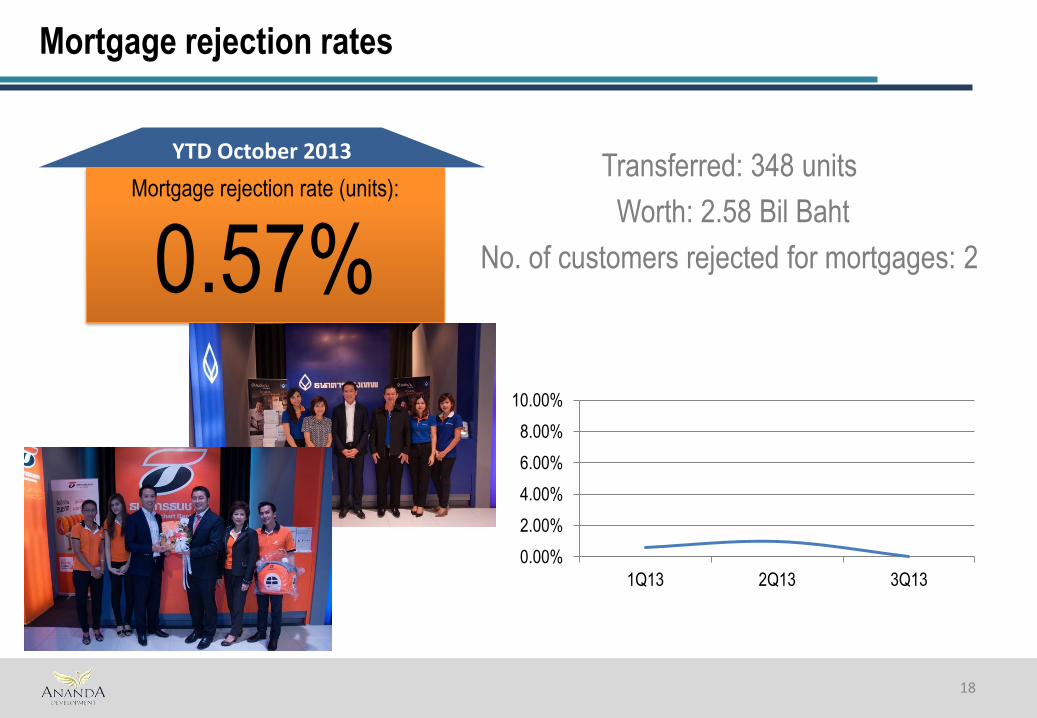
Mortgage rejection rates
Transferred: 348 units
Worth: 2.58 Bil Baht
No. of customers rejected for mortgages: 2
18
YTD October 2013
Mortgage rejection rate (units):
0.57%
0.00%
2.00%
4.00%
6.00%
8.00%
10.00%
1Q13 2Q13 3Q13
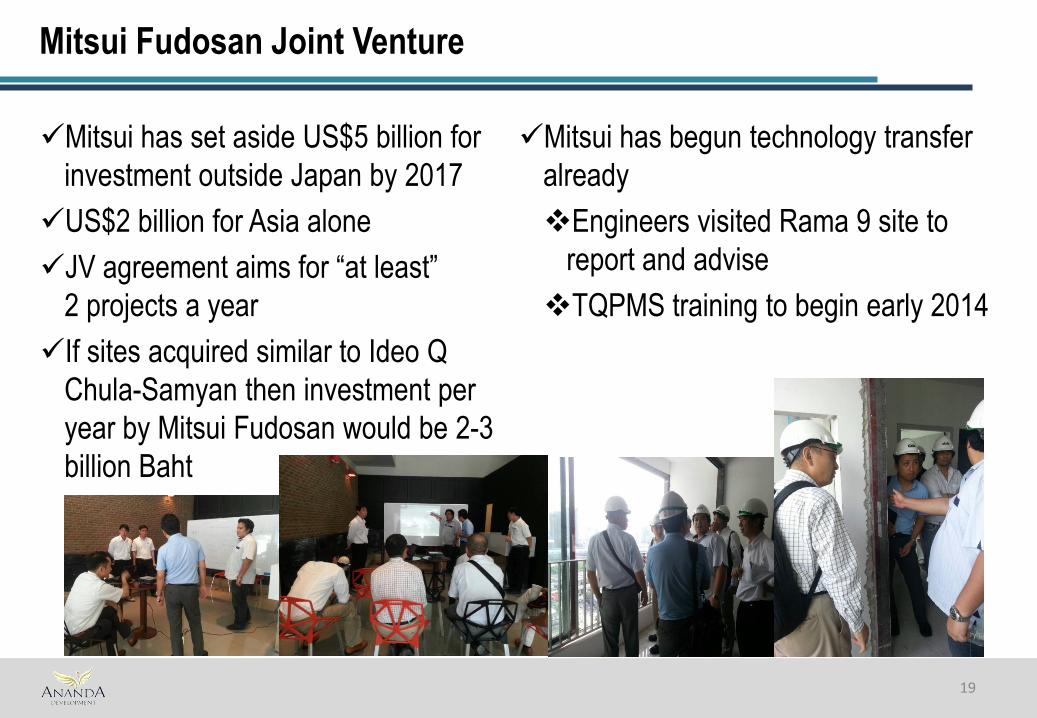
Mitsui Fudosan Joint Venture
Mitsui has set aside US$5 billion for
investment outside Japan by 2017
US$2 billion for Asia alone
JV agreement aims for “at least”
2 projects a year
If sites acquired similar to Ideo Q
Chula-Samyan then investment per
year by Mitsui Fudosan would be 2-3
billion Baht
Mitsui has begun technology transfer
already
Engineers visited Rama 9 site to
report and advise
TQPMS training to begin early 2014
19
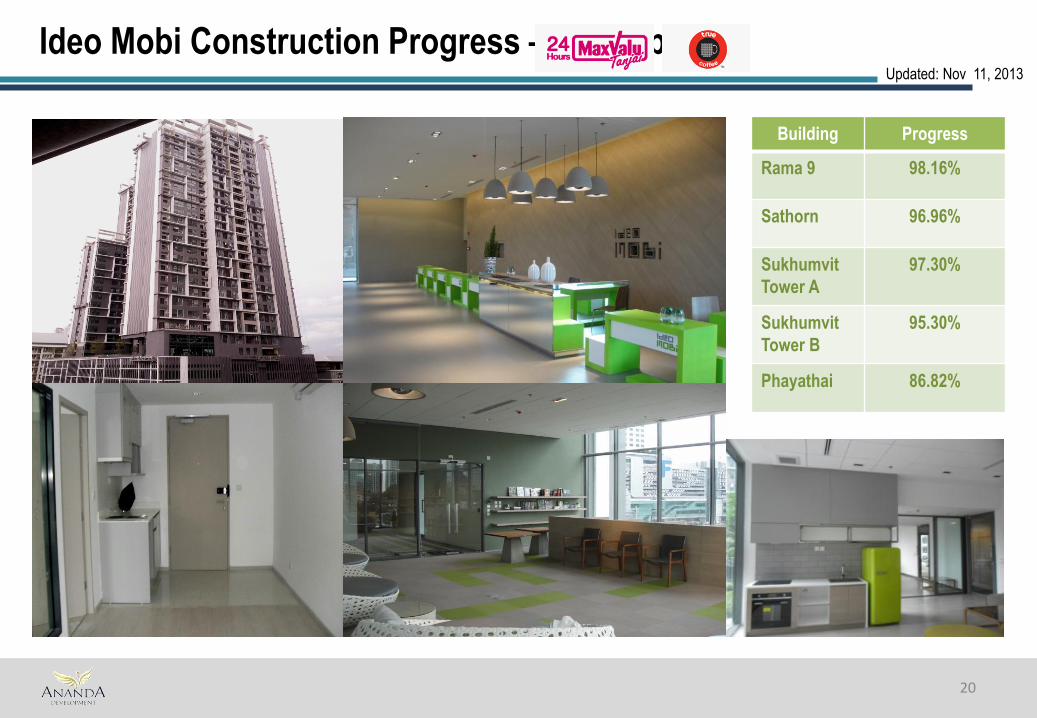
Ideo Mobi Construction Progress – better picture
20
Building Progress
Rama 9 98.16%
Sathorn 96.96%
Sukhumvit
Tower A
97.30%
Sukhumvit
Tower B
95.30%
Phayathai 86.82%
Updated: Nov 11, 2013
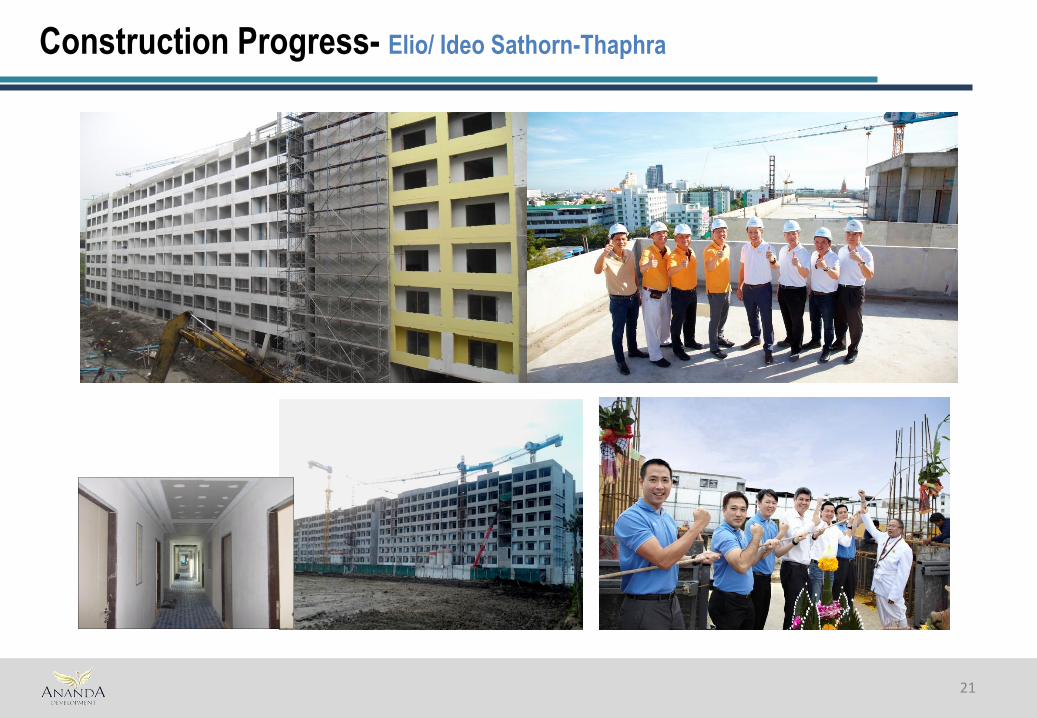
Construction Progress- Elio/ Ideo Sathorn-Thaphra
21
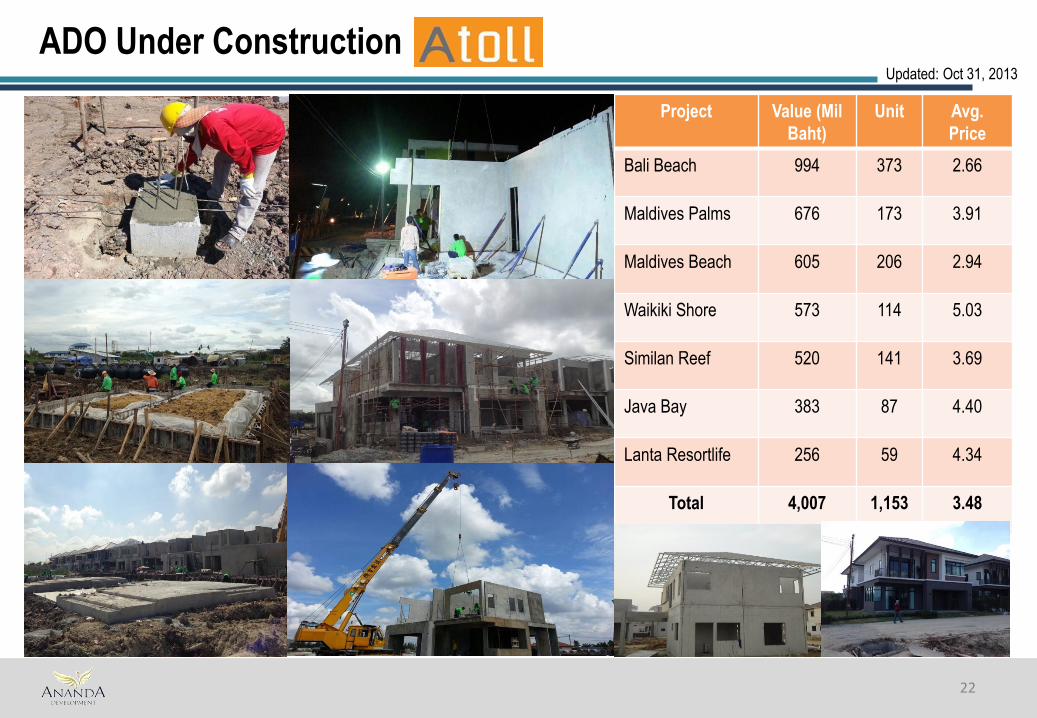
ADO Under Construction
22
Updated: Oct 31, 2013
Project Value (Mil
Baht)
Unit Avg.
Price
Bali Beach 994 373 2.66
Maldives Palms 676 173 3.91
Maldives Beach 605 206 2.94
Waikiki Shore 573 114 5.03
Similan Reef 520 141 3.69
Java Bay 383 87 4.40
Lanta Resortlife 256 59 4.34
Total 4,007 1,153 3.48
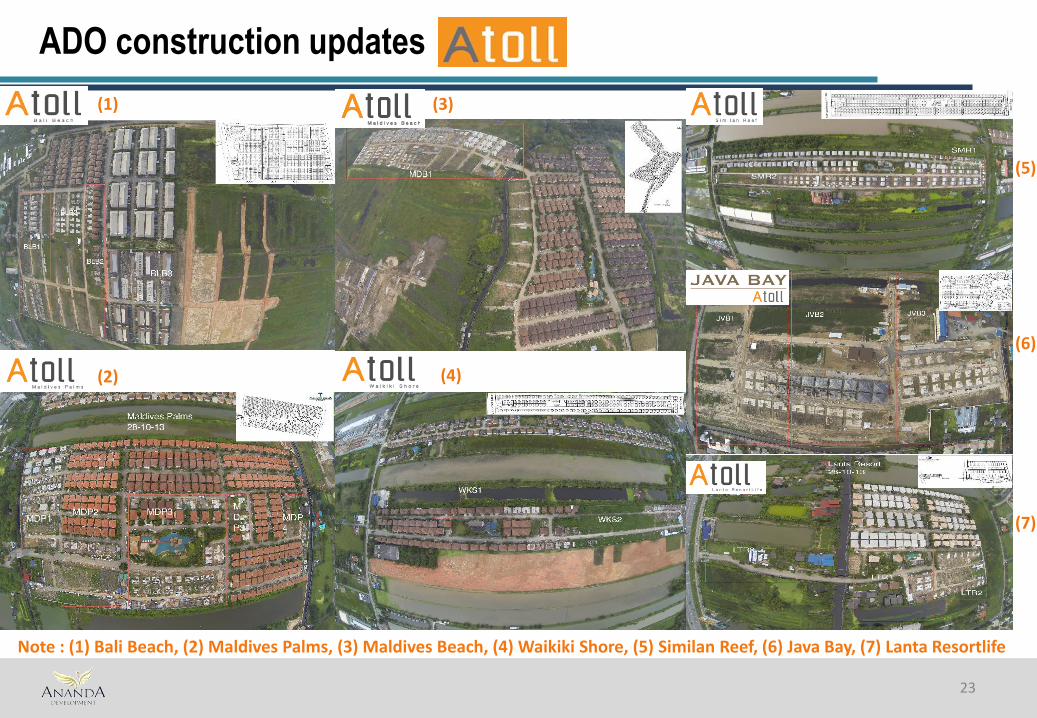
ADO construction updates
23
(1)
(2)
(3)
(4)
(5)
(6)
(7)
Note : (1) Bali Beach, (2) Maldives Palms, (3) Maldives Beach, (4) Waikiki Shore, (5) Similan Reef, (6) Java Bay, (7) Lanta Resortlife
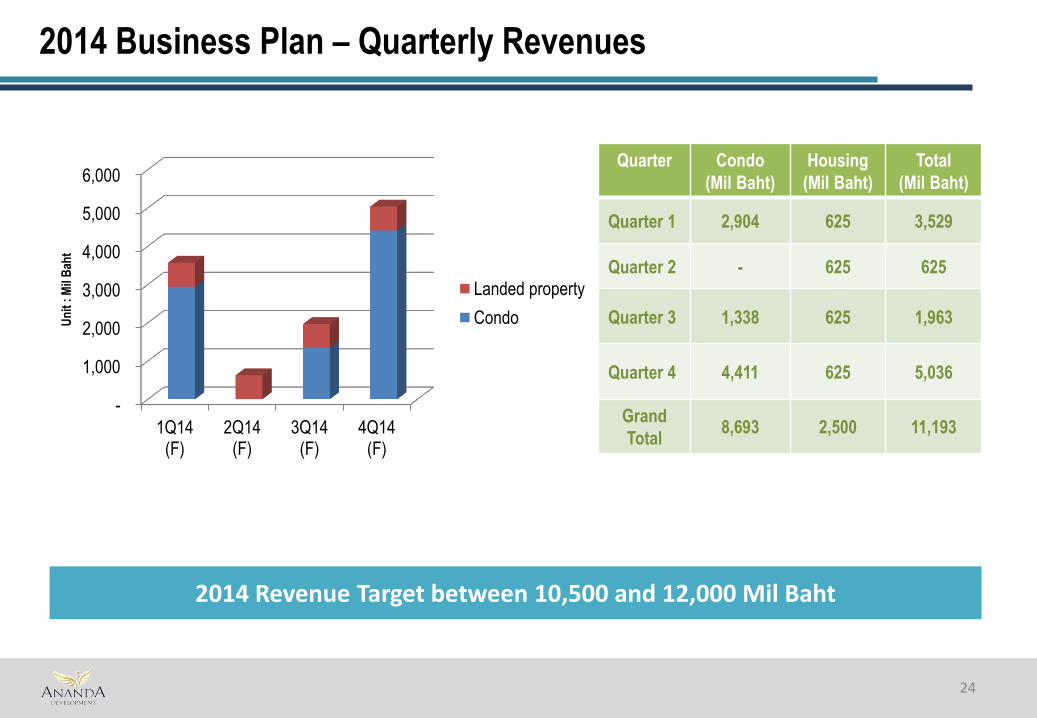
2014 Business Plan – Quarterly Revenues
24
-
1,000
2,000
3,000
4,000
5,000
6,000
1Q14 (F)
2Q14 (F)
3Q14 (F)
4Q14 (F)
Un
it :
Mil
Bah
t
Landed property
Condo
Quarter Condo
(Mil Baht)
Housing
(Mil Baht)
Total
(Mil Baht)
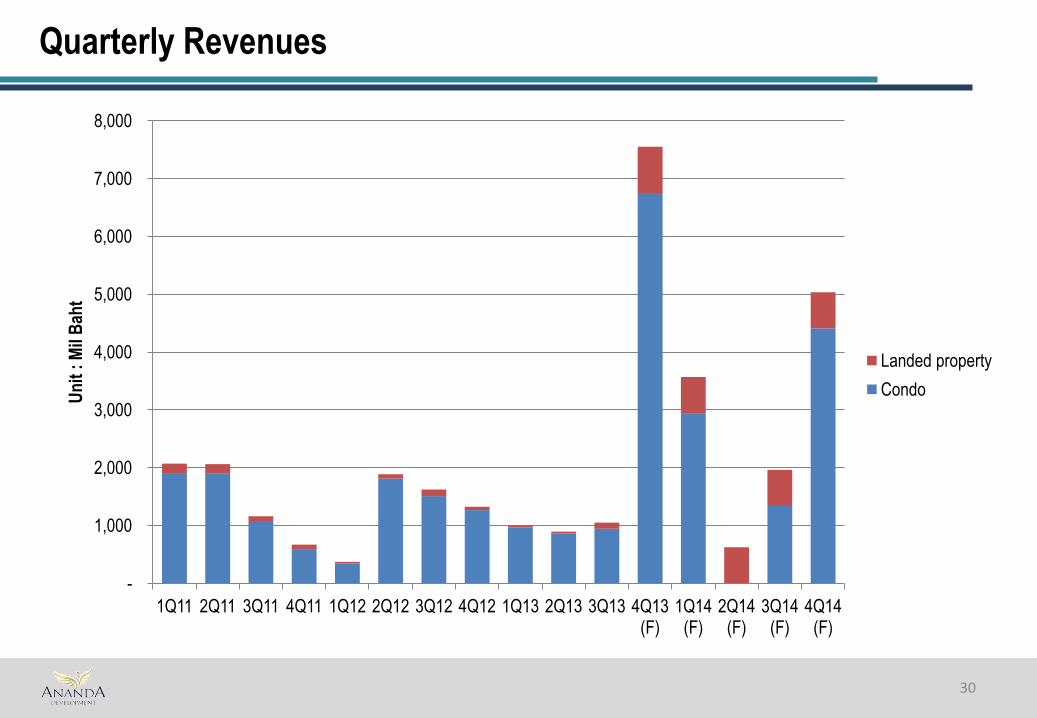
Quarter 1 2,904 625 3,529
Quarter 2 - 625 625
Quarter 3 1,338 625 1,963
Quarter 4 4,411 625 5,036
Grand
Total 8,693 2,500 11,193
2014 Revenue Target between 10,500 and 12,000 Mil Baht
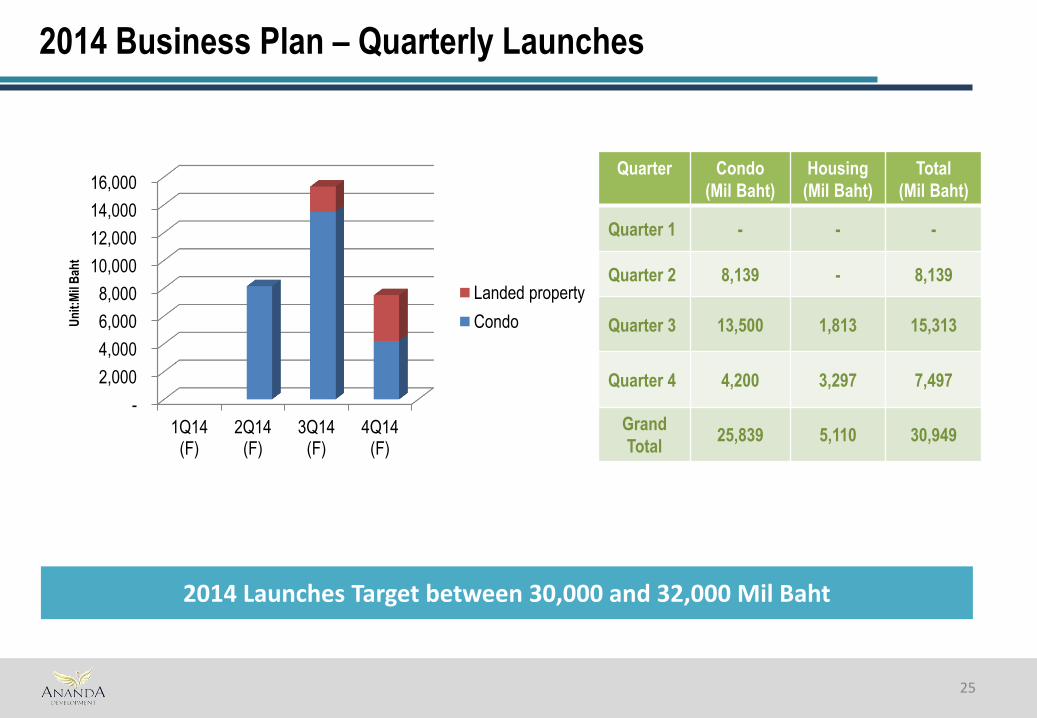
2014 Business Plan – Quarterly Launches
25
-
2,000
4,000
6,000
8,000
10,000
12,000
14,000
16,000
1Q14 (F)
2Q14 (F)
3Q14 (F)
4Q14 (F)
Un
it:M
il B
aht
Landed property
Condo
2014 Launches Target between 30,000 and 32,000 Mil Baht
Quarter Condo
(Mil Baht)
Housing
(Mil Baht)
Total
(Mil Baht)
Quarter 1 - - -
Quarter 2 8,139 - 8,139
Quarter 3 13,500 1,813 15,313
Quarter 4 4,200 3,297 7,497
Grand
Total 25,839 5,110 30,949
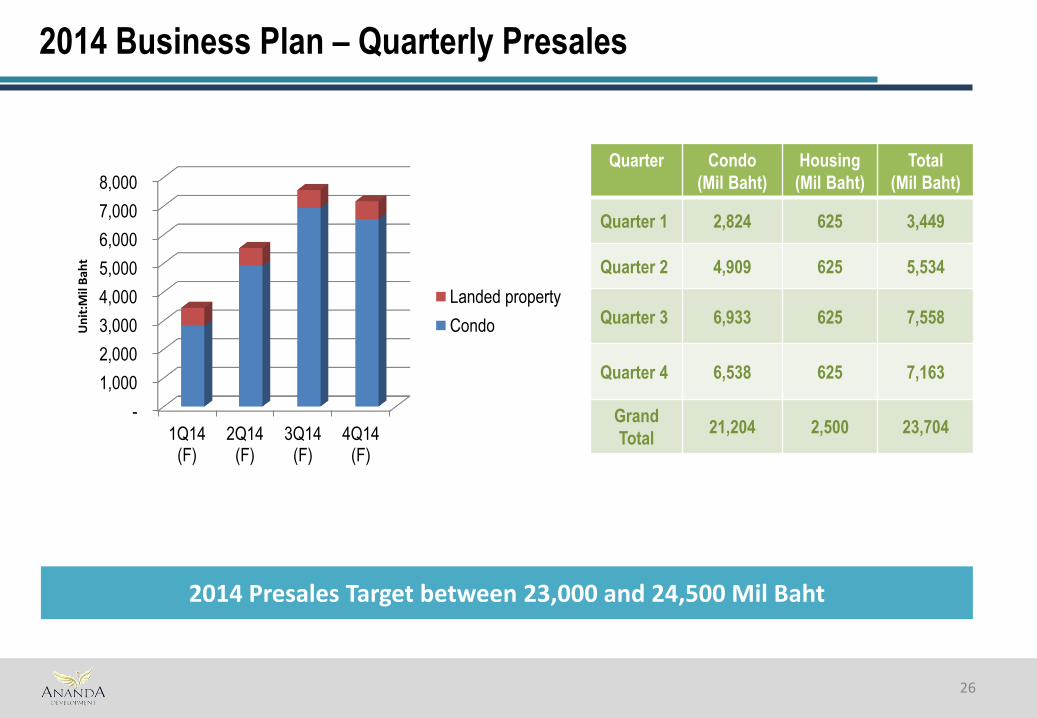
2014 Business Plan – Quarterly Presales
26
-
1,000
2,000
3,000
4,000
5,000
6,000
7,000
8,000
1Q14 (F)
2Q14 (F)
3Q14 (F)
4Q14 (F)
Un
it:M
il B
aht
Landed property
Condo
2014 Presales Target between 23,000 and 24,500 Mil Baht
Quarter Condo
(Mil Baht)
Housing
(Mil Baht)
Total
(Mil Baht)
Quarter 1 2,824 625 3,449
Quarter 2 4,909 625 5,534
Quarter 3 6,933 625 7,558
Quarter 4 6,538 625 7,163
Grand
Total 21,204 2,500 23,704
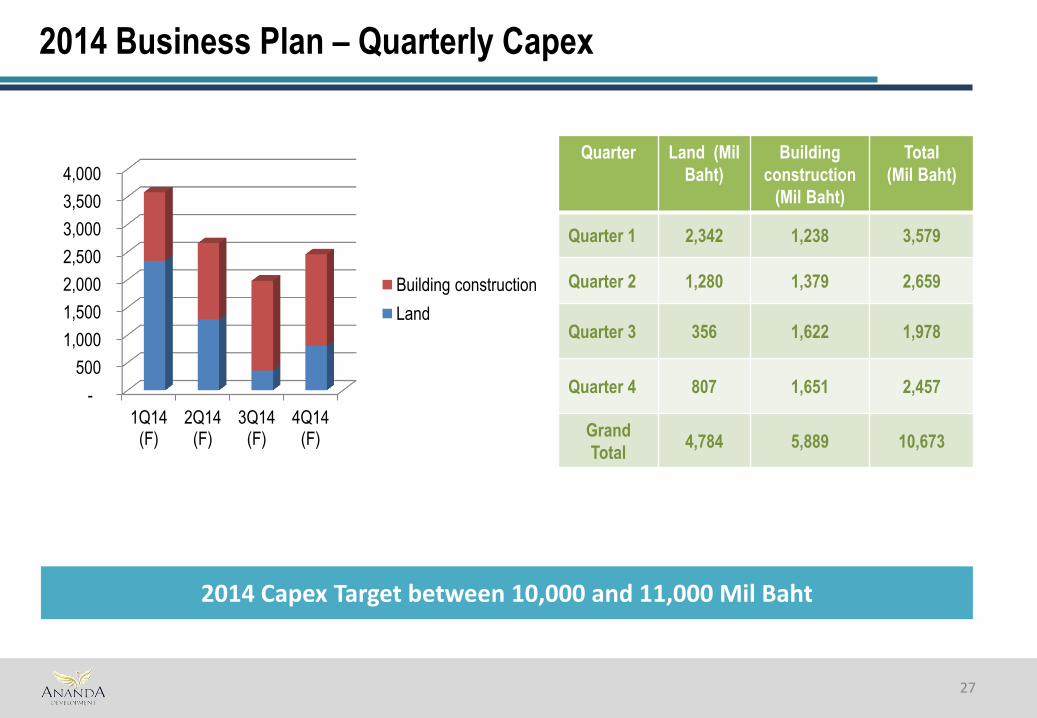
2014 Business Plan – Quarterly Capex
27
2014 Capex Target between 10,000 and 11,000 Mil Baht
Quarter Land (Mil
Baht)
Building
construction
(Mil Baht)
Total
(Mil Baht)
Quarter 1 2,342 1,238 3,579
Quarter 2 1,280 1,379 2,659
Quarter 3 356 1,622 1,978
Quarter 4 807 1,651 2,457
Grand
Total 4,784 5,889 10,673
-
500
1,000
1,500
2,000
2,500
3,000
3,500
4,000
1Q14 (F)
2Q14 (F)
3Q14 (F)
4Q14 (F)
Building construction
Land
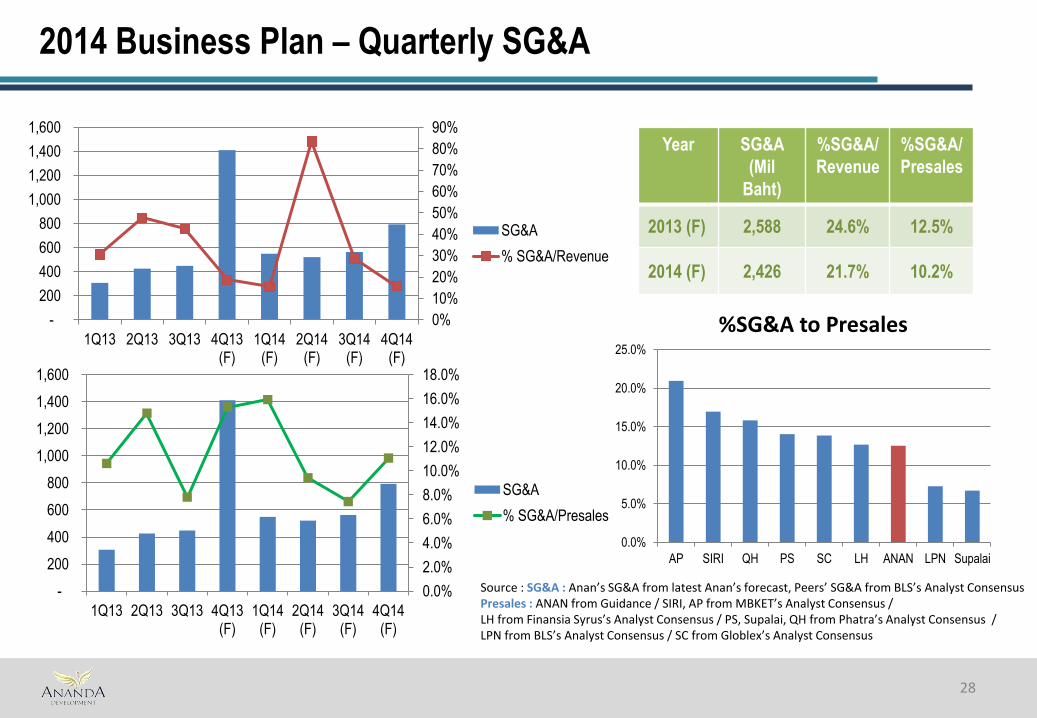
2014 Business Plan – Quarterly SG&A
28
0%
10%
20%
30%
40%
50%
60%
70%
80%
90%
-
200
400
600
800
1,000
1,200
1,400
1,600
1Q13 2Q13 3Q13 4Q13 (F)
1Q14 (F)
2Q14 (F)
3Q14 (F)
4Q14 (F)
SG&A
% SG&A/Revenue
Year SG&A
(Mil
Baht)
%SG&A/
Revenue
%SG&A/
Presales
2013 (F) 2,588 24.6% 12.5%
2014 (F) 2,426 21.7% 10.2%
0.0%
2.0%
4.0%
6.0%
8.0%
10.0%
12.0%
14.0%
16.0%
18.0%
-
200
400
600
800
1,000
1,200
1,400
1,600
1Q13 2Q13 3Q13 4Q13 (F)
1Q14 (F)
2Q14 (F)
3Q14 (F)
4Q14 (F)
SG&A
% SG&A/Presales
%SG&A to Presales
Source : SG&A : Anan’s SG&A from latest Anan’s forecast, Peers’ SG&A from BLS’s Analyst Consensus Presales : ANAN from Guidance / SIRI, AP from MBKET’s Analyst Consensus / LH from Finansia Syrus’s Analyst Consensus / PS, Supalai, QH from Phatra’s Analyst Consensus / LPN from BLS’s Analyst Consensus / SC from Globlex’s Analyst Consensus
0.0%
5.0%
10.0%
15.0%
20.0%
25.0%
AP SIRI QH PS SC LH ANAN LPN Supalai
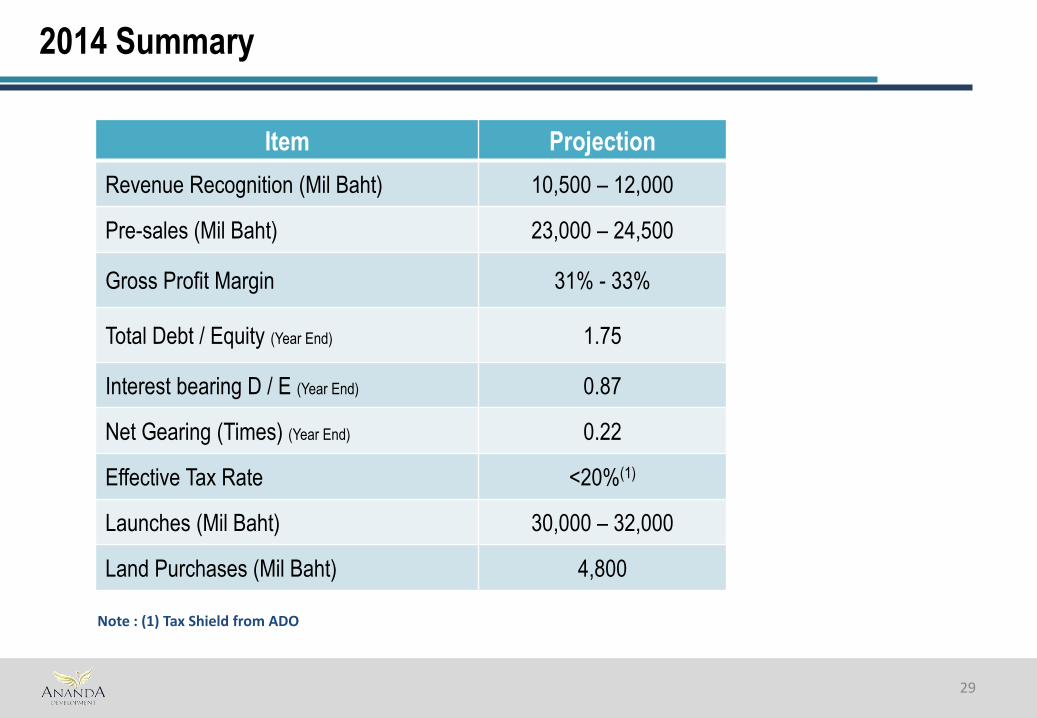
2014 Summary
29
Item Projection
Revenue Recognition (Mil Baht) 10,500 – 12,000
Pre-sales (Mil Baht) 23,000 – 24,500
Gross Profit Margin 31% - 33%
Total Debt / Equity (Year End) 1.75
Interest bearing D / E (Year End) 0.87
Net Gearing (Times) (Year End) 0.22
Effective Tax Rate <20%(1)
Launches (Mil Baht) 30,000 – 32,000
Land Purchases (Mil Baht) 4,800
Note : (1) Tax Shield from ADO
30
Quarterly Revenues
-
1,000
2,000
3,000
4,000
5,000
6,000
7,000
8,000
1Q11 2Q11 3Q11 4Q11 1Q12 2Q12 3Q12 4Q12 1Q13 2Q13 3Q13 4Q13 (F)
1Q14 (F)
2Q14 (F)
3Q14 (F)
4Q14 (F)
Un
it :
Mil
Bah
t
Landed property
Condo
31
Quarterly Launches
-
2,000
4,000
6,000
8,000
10,000
12,000
14,000
16,000
18,000
Un
it :
Mil
Bah
t
Landed property
Condo
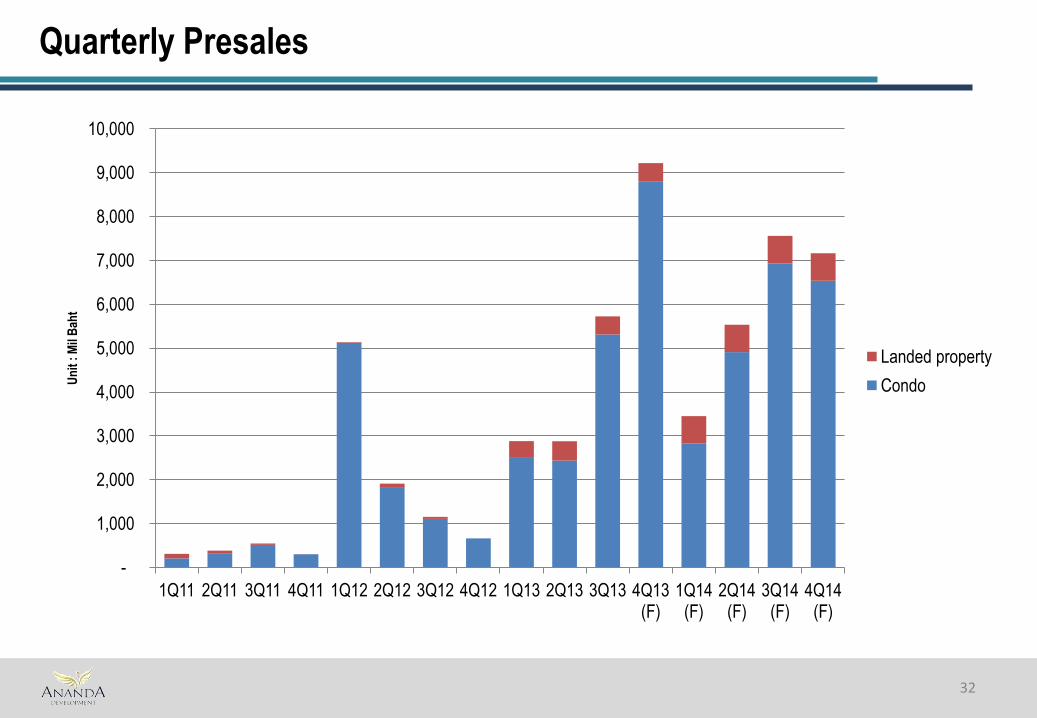
Quarterly Presales
32
-
1,000
2,000
3,000
4,000
5,000
6,000
7,000
8,000
9,000
10,000
1Q11 2Q11 3Q11 4Q11 1Q12 2Q12 3Q12 4Q12 1Q13 2Q13 3Q13 4Q13 (F)
1Q14 (F)
2Q14 (F)
3Q14 (F)
4Q14 (F)
Un
it :
Mil
Bah
t
Landed property
Condo
Hybrid
Update
• The company issued a mandate to Barclays bank to explore
pricing for a proposed perpetual bond to be issued in
remimbi.
• The pricing indications came back higher than we were
comfortable with and since the company does not need the
money to execute on its business plan, which is fully
funded, we declined to proceed to launch a transaction.
• The reason for going with a Perp structure as an instrument
was that our implied cost of equity at the current PE was
higher than the expected cost of a perp. The perp is treated
100% as equity on the balance sheet so when the project
loan is added the weighted average cost of capital on a
project basis is lower than using the existing equity on our
balance sheet. This means our balance sheet would be
more efficient and our total WACC would be lower. Yet there
would be no dilution of existing shareholders.
• We promised our investors at the IPO that we would
keep our interest bearing D/E ratio below 1:1. The
perp, being equity treated, would have allowed us to
keep this ratio and add additional projects in addition
to our existing business plan.
• We went offshore as the perpetual product is not
available onshore
• We went with RMB rather than USD or SGD as we
wanted to be 100% hedged from day 1 and take zero
currency risk and the swap cost on RMB is
significantly lower making the all in cost lower.
• There are no issues with local lending.
33
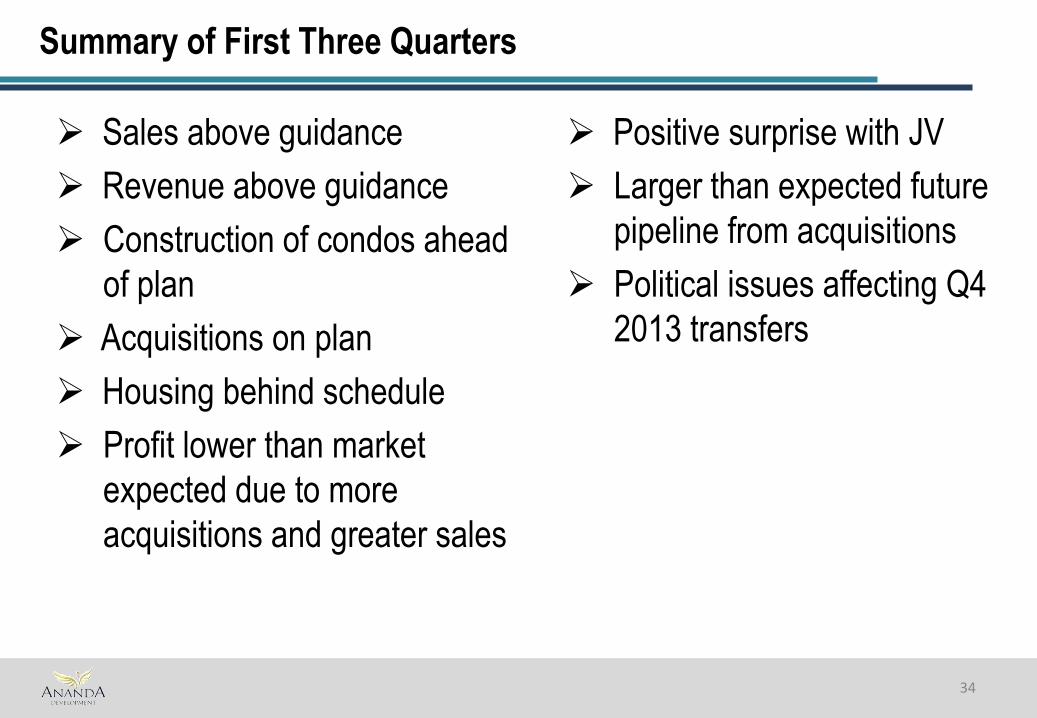
Summary of First Three Quarters
Sales above guidance
Revenue above guidance
Construction of condos ahead
of plan
Acquisitions on plan
Housing behind schedule
Profit lower than market
expected due to more
acquisitions and greater sales
Positive surprise with JV
Larger than expected future
pipeline from acquisitions
Political issues affecting Q4
2013 transfers
34
Dividend
The company’s intention has always been to provide investors with a good
dividend as well as capital growth.
Our stated policy has been to pay a dividend when the Board thought it
was appropriate and prudent.
The company has over 465 million Baht in retained earnings as of the end
of the third quarter with all of our profits for the year still to come in the
fourth quarter.
Our expectation is that when we look at the year end results the company
will be in a position that makes paying a dividend the correct decision for
the company.
35
Thank you
Ananda Development PLC
2013
36
Contact: Dr. John Millar Head of Financial Strategy and Investor Relations Ananda Development Public Company Limited [email protected] +662 697 3300 Mobile: +66 877 99 1946
Related Documents