ANALYSIS OF THE IMPACT OF EXCEEDANCES OF GROUND-WATER PROTECTION STANDARDS IN INJECTION WATER PREPARED FOR: HOMESTAKE MINING COMPANY George L. Hoffinan, P .E. Hydrologist PREPARED BY: HYDRO-ENGINEERING, L.L .C. July 2017 Thomas G. Michel, Ph.D. Hydrologist

Welcome message from author
This document is posted to help you gain knowledge. Please leave a comment to let me know what you think about it! Share it to your friends and learn new things together.
Transcript

ANALYSIS OF THE IMPACT OF EXCEEDANCES OF GROUND-WATER
PROTECTION STANDARDS IN INJECTION WATER
PREPARED FOR: HOMESTAKE MINING COMPANY
George L. Hoffinan, P .E. Hydrologist
PREPARED BY: HYDRO-ENGINEERING, L.L.C.
July 2017
Thomas G. Michel, Ph.D. Hydrologist

Table of Contents
1. INTRODUCTION AND DESCRIPTION OF SP2 EXCEEDANCES ... .......... .... ...... ... ..... 1-1 1.1 Methodology ... ..... .. ................ .. .. ...... ... ... ....... ...... ... .. ..... .... .... ............ .................. ......... 1-1
1.1.1 Areas of Review .... ........... ..... ....... .. ... ............. .. ... .. ............. ..... ......... ... .. ...... .. ... ...... .. 1-1 1.1.2 Review Procedures ............ .. ........ ... ... ..... ... ... .... .... ... .. ................... .. ..... ... .... ..... ...... ... 1-2 1.1.3 Acceptance Criteria .. .. ..... ......... ..... ................ ....... .. ... ... ..... ... .. ..... .... ....... ... .... ...... .. ... 1-2 1.1.4 Evaluation Findings ..... ... ... .... ...... .... ....... ... .... .... .. .. ...... .. ........... .. ....... ..... ... ...... ....... . 1-2
1.2 Description of SP2 Exceedances .. ......... .. ................. ... ..... ..... ........ .. ... ........ ..... ... ... ...... 1-2 2. MAGNITUDE AND DURATION OF EXCEEDANCES ... .... .. ... ....... ... ........ ....... .. .... ....... 2-1
2.1 Injection System Operation During Selected Exceedance Periods .. .. ....... .. .. ...... .... ... .. 2-2 2.2 Injection Rates During Selected Exceedance Periods ...... ..................... .... .. .. .. .... ...... .. 2-2 2.3 Magnitude of Exceedances .... ..... .. ...... .. .... .................... ...... .... .... .. ... ... ..... ... .. ....... .. ..... . 2-3
3. IMPACT OF EXCEEDANCES .... .. ... .. ...... ....... ....... ....... ...... ..... .. .. ..... .. .... ... ....................... 3-1 3.1 Area of SP2 Water Injection .............. ... .... ... .... ..... .. .... ..... .... .. ... .. ... .. ...... ... .. .. .... ........... 3-1 3.2 Injection Mass and Volume During Exceedance .. ..... .. ...... .... ........... ..... ........ ... ...... ..... 3-2 3.3 Potential SP2 Injection Impact Area ..... ......... ... .. ..... ....... ... .... .............. ............. .. ...... ... 3-2 3.4 Potential Change in COC Concentration in Hypothetical Spread Area ... .. ................. 3-2
4. WATER QUALITY MONITORING RES UL TS ......... .... ... ..... ..... .... ..... .. ..... ..... .. ..... ...... ... 4-1 4.1 Molybdenum ...... .... ..... ... .......... ......... ..... ...... ... .. ........... ..... .. ......... ... .. .. .. ...... .. .. .... ......... 4-1 4.2 Uranium .. .. ..... .. .. .... ........ .. ...... .. .......... ..... ... ........ ...... .... .. ... ...... .. .... ......... .... .... .... .......... 4-2
5. SUMMARY AND CONCLUSIONS ... ..... ...... .. ...... ..... .... .. .. .. .... ........ .... .... ......................... 5-1 5 .1 Mitigating Factors .. ..... .... .. ... ..... ........ ...... ............. ..... .. ... ... .. .... .... .. .. .... ... ... .. ... ..... .. .... .. . 5-1 5 .2 Quantitative Assessment ............ .......... ... ... ........ ... ... .......... .. .. ... ... ........ .. ...... .... ... ......... 5-1 5 .3 Water Quality Monitoring ... ... .......................... .... .. .... .. .. .... ..... ..... ... .. ... ... ...... .. ... ..... ..... 5-1
List of Tables
Table 1-1. Exceedances of Current GWPSs at SP2 .... ....... ...... ...... ..... ........ .... ........... .. ...... ... 1-3 Table 1-2. Exceedances of Current and Former GWPSs at SP2 .. .... ..... ... ........ .......... ......... l-4
List of Figures
Figure 2-1. Alluvial Well Locations and Operational Configuration (Figure 4.1-1 from 2003 Annual Report) ................................................................................................ 2-4
Figure 2-2. Average Monthly Injection Rates (Figure 2.1-3 from 2004 Annual Report) ... 2-5
Figure 3-1. SP2 and Fresh Water Injection Areas in 2003 and 2004 ................................... 3-4 Figure 3-2. Hypothetical SP2 Exceedance Impact Area ........................................................ 3-5
Figure 4-1. Location of Downgradient Monitoring Wells ..................................................... 4-3 Figure 4-2. Molybdenum Concentration in Downgradient Wells ........................................ 4-4 Figure 4-3. Molybdenum Concentration in Well L ............................................................... 4-5 Figure 4-4. Uranium Concentration in Downgradient Wells ............................................... 4-6 Figure 4-5. Uranium Concentration in Well L ....................................................................... 4-7
SP2 Exceedances July 2017

List of Acronyms and Abbreviations
CO Confirmatory Order
COC constituent(s) of concern
gpm gallon(s) per minute
GRP Grants Reclamation Project
GWPS Ground Water Protection Standard(s)
HMC Homestake Mining Company
L TP Large Tailings Pile
NRC United States Nuclear Regulatory Commission
RO Reverse Osmosis
STP Small Tailings Pile
SP2 Exceedances July 2017
1. INTRODUCTION AND DESCRIPTION OF SP2 EXCEEDANCES
This report is submitted as part of the Confirmatory Order (CO) issued on March 28, 2017 by the
United States Nuclear Regulatory Commission (NRC) regarding Homestake Mining Company
(HMC) of California' s Grants Reclamation Project (GRP). Confirmatory Order Condition 10 requires analysis of the impact of exceedances of Ground Water Protection Standards (GWPS)
documented in the NRC's Oct 4, 2016 letter to HMC. Exceedances occurring in 2015 are also considered in this analysis, per the NRC's letter of April 20, 2017.
In CO Condition 10, the NRC states that the methodology described in NUREG-1620 should be used in analyzing the impact of exceedances of G WPS. NUREG-1620 is a comprehensive document for review of Title II Mill Tailings Site Reclamation Plans. In NUREG-1620, portions of Section 4.4 are generally applicable to the required analysis of impacts. However, the exceedances
of GWPS occurred as a result of Reverse Osmosis (RO) treatment plant underperformance, malfunction or other disruption during the ongoing ground-water corrective action efforts for the restoration program at the site. Hence, the analysis of the impact of exceedances is adapted to the methodology described in NUREG-1620 in order to address the major concerns associated with the exceedances.
1.1 Methodology
Section 4.4 of NUREG-1620 is within the major section ( 4.0) dealing with protection of water resources and is titled "Ground-Water Corrective Action and Compliance Monitoring Plans". Subsections within Section 4.4 include: Section 4.4.1 Areas of Review, Section 4.4.2 Review
Procedures, Section 4.4.3 Acceptance Criteria, Section 4.4.4 Evaluation Findings, and Section 4.4.5 References. The following sections address the topics described in Sections 4.4. l through 4.4.4 of NUREG-1620. As previously mentioned, the exceedances occurred as a slight underperformance or treatment disruption in the removal of molybdenum or uranium for the RO treatment plant. While the molybdenum and/or uranium concentration in the RO product water exceeded the corresponding GWPS, the RO was still typically removing more than 99% of the molybdenum or uranium in the collection stream feeding the RO.
1.1.1 Areas of Review
The areas of review described in this report are limited to those areas where the injection of waters represented by sample location SP2 with molybdenum or uranium concentration exceeding the
respective GWPS could plausibly affect the ambient alluvial ground-water quality. These areas are reasonably well defined by the known injection areas for SP2 waters. Areas where only fresh water was injected or those at a large distance from the SP2 injection wells were not considered in the analysis of impacts.
SP2 Exceedances July 2017 1-1

1.1.2 Review Procedures
The review procedures described in Section 4.4.2 ofNUREG-1620 include a broad range of
concerns on developing a Corrective Action Plan and those procedures for assessing the adequacy of the plan. As the impact of exceedances analysis included in this report deals with a minor i.mderperformance of a component (injection of SP2 waters into the alluvial aquifer), the analysis is focused on the very specific issue of minor changes in ground-water quality that could have resulted from the exceedances, and the health and safety implications of those changes.
1.1.3 Acceptance Criteria
The acceptance criteria described in Section 4.4.3 of NUREG-1620 is largely guidance for NRC reviewers in determining if a Corrective Action Plan, the associated monitoring plan, the inputs/data
used to develop the plan, and any modeling or forecasting ofrestoration progress are adequate to address the ground-water impacts. In the case of the impact of exceedances analysis included in this
report, the acceptance criterion consists basically of establishing a threshold at which the exceedances are considered to have measurably changed the restoration progress and/or impacted
other ground-water users.
1.1.4 Evaluation Findings
Like the review procedures, the evaluation findings described in Section 4.4.4 of NUREG-1620 include a broad range of considerations in accepting a Corrective Action Plan and the associated monitoring. For the impact of exceedances analysis, the findings and conclusions of the analysis are
that the minor exceedances of GWPS in the SP2 injection water had no measurable impact on the restoration progress and did not impact nearby landowners as described in the following sections.
1.2 Description of SP2 Exceedances
The licensed monitoring point for the injection water supply is SP2 with a prescribed monthly sampling frequency. During the period of interest from 1999 through 2014, sample location SP2 represented a combination of the RO product water and fresh water from San Andres wells at a variable rate.
The primary constituents of concern (COCs) in the treated water are molybdenum and uranium. The
current GWPS for molybdenum is 0.10 mg/I. A measured concentration greater than 0.10 mg/I exceeds the GWPS. The current GWPS for uranium is 0.16 mg/I. A measured concentration greater than 0.16 mg/I exceeds the GWPS. Prior to 2006 when the present GWPSs were approved, the
GWPS for molybdenum was 0.03 mg/I and the GWPS for uranium was 0.04 mg/I. Because the molybdenum and uranium GWPSs prior to 2006 have been superseded, the current GWPSs are used both in defining an exceedance warranting evaluation and in evaluating the impacts of exceedance.
The SP2 sample data for August of 2000 through December of2014 were reviewed and the results are as follows:
SP2 Exceedances July 2017 1-2
• There were 34 monthly samples with molybdenum concentration greater than 0.10 mg/I (exceeding current GWPS).
• There were 4 monthly samples with uranium concentration greater than 0.16 mg/I (exceeding current GWPS).
• All exceedances of uranium GWPS coincided with sample dates when the molybdenum GWPS was also exceeded.
There were also occasions where two or more samples were taken in a single month with only one of the samples resulting in an exceedance. The exceedances are presented Table 1-1.
Table 1-1. Exceedances of Current GWPS at SP2 Sample Sample Location Date Uranium Molybdenum Notes Location Date Uranium Molybdenum Notes
(mg/L) (mg/L) (mg/L) (mg/L)
RO SP2 3/21/2001 -- 0.1382 5 Months
15 Months RO SP2 12/5/2011 -- 0.07* Two Samples ROSP2 7/16/2002 -- 0.11 RO SP2 12/8/2011 -- 0.12
6 Months 4 Months
RO SP2 2/ 18/2003 -- 0.11 RO SP2 5/ 1/ 2012 -- 0.07* Two Samples RO SP2 3/ 10/2003 -- 0.13 RO SP2 5/18/ 2012 -- 0.11 RO SP2 4/21/2003 -- 0. 12 1 Month
RO SP2 5/13/2003 -- 0.164 RO SP2 7/2/ 2012 -- 0.172 RO SP2 6/24/ 2003 -- 0.18 Longest Continuous RO SP2 8/7/2012 -- 0.32 RO SP2 7/15/2003 -- 0.13 Period of Exceeda nce RO SP2 9/ 13/2012 -- 0.11 RO SP2 8/12/ 2003 -- 0.21 of GWPS for 1 Month
RO SP2 9/19/2003 -- 0.11 Molybdenum RO SP2 11/8/2012 -- 0.12 RO SP2 10/9/2003 -- 0.23 13 Months
RO SP2 11/11/ 2003 -- 0.38 RO SP2 1/ 21/2014 -- 0.117 RO SP2 12/9/2003 -- 0.18 9 Months
RO SP2 1/ 14/ 2004 -- 0. 143 RO SP2 11/5/2014 -- 0.11 9Months 1 Month
RO SP2 11/17/ 2004 0.369 0.72 Greatest Exceeda nee RO SP2 1/13/2015 0.164 0.14 36 Months 3 Months
RO SP2 12/ 10/2007 -- 0.12 RO SP2 5/ 27/ 2015 -- 0.28 14 Months 2 Months
RO SP2 3/5/2009 -- 0.19 RO 5P2 8/5/2015 -- 0.162 11 Months RO SP2 9/17/2015 0.247 0.23 Duplicate Sample
RO SP2 3/ 3/2010 0.165 0.24 RO SP2 9/17/2015 0.278 0.25 14 Months RO SP2 10/6/2015 -- 0.14 Duplicate Sample
RO SP2 6/10/2011 -- <0.03* Dupl icate Sample RO SP2 10/6/2015 -- 0.14 RO SP2 6/10/ 2011 -- 0.11
• Duplicate or multiple monthly sample not in exceedance of GWPS
To avoid unnecessary complexity and to aid in clarity of presentation of calculations pertaining to the exceedances and their potential impacts, each exceedance shown in Table 1-1 is assumed to represent the entire month in which it occurred with an average month length of 30.4 days. This
allows discussion and calculation in terms of individual "generic" months rather than beginning and ending dates, and will not significantly affect the evaluation of the impacts of exceedances.
SP2 Exceedances July 2017 1-3
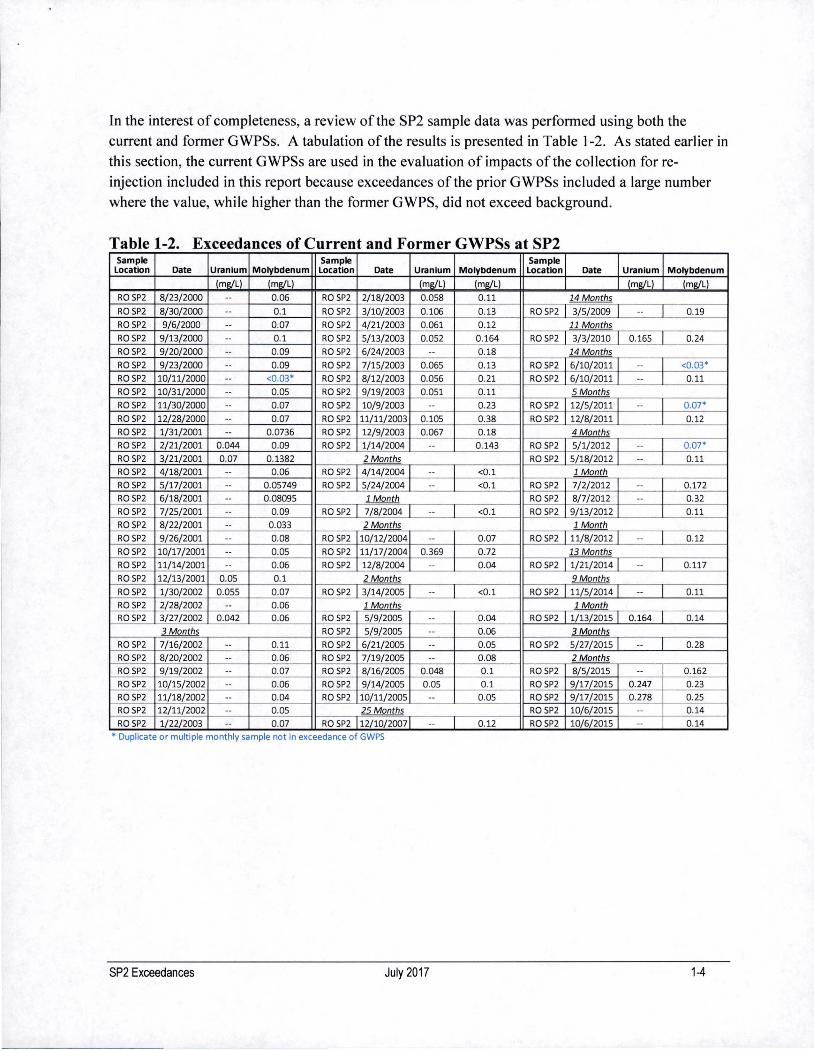
In the interest of completeness, a review of the SP2 sample data was performed using both the
current and former GWPSs. A tabulation of the results is presented in Table 1-2. As stated earlier in this section, the current GWPSs are used in the evaluation of impacts of the collection for re
injection included in this report because exceedances of the prior GWPSs included a large number where the value, while higher than the former GWPS, did not exceed background.
Table 1-2. Exceedances of Current and Former GWPSs at SP2 Sample Sample Sample
Location Date Uranium Molybdenum Location Date Uranium Molybdenum Location Date Uranium Molybdenum
(ml!!L) (mg/L) (mg/L) (mg/L) (mg/L) (mg/L)
RO SP2 8/23/2000 -- 0.06 RO SP2 2/18/2003 0.058 0.11 14 Months
RO SP2 8/30/2000 -- 0.1 RO SP2 3/10/2003 0.106 0.13 RO SP2 3/5/2009 -- 0.19 RO SP2 9/6/2000 -- 0.07 RO SP2 4/21/2003 0.061 0.12 11 Months
RO SP2 9/13/2000 -- 0.1 RO SP2 5/13/2003 0.052 0.164 RO SP2 3/3/2010 0.165 0.24 RO SP2 9/20/2000 -- 0.09 RO SP2 6/24/2003 -- 0.18 14 Months
ROSP2 9/23/2000 -- 0.09 RO SP2 7/15/2003 0.065 0.13 ROSP2 6/10/2011 -- <0.03*
RO SP2 10/11/2000 -- <0.03* RO SP2 8/12/2003 0.056 0.21 ROSP2 6/10/2011 -- 0.11 RO SP2 10/31/2000 -- 0.05 RO SP2 9/19/2003 0.051 0.11 5 Months
ROSP2 11/30/2000 -- 0.07 RO SP2 10/9/2003 -- 0.23 ROSP2 12/5/2011 -- 0.07*
RO SP2 12/28/2000 -- 0.07 RO SP2 11/11/2003 0.105 0.38 RO SP2 12/8/2011 0.12 RO SP2 1/31/2001 -- 0.0736 RO SP2 12/9/2003 0.067 0.18 4 Months
RO SP2 2/21/2001 0.044 0.09 RO SP2 1/14/2004 -- 0.143 RO SP2 5/1/2012 -- 0.07* RO SP2 3/21/2001 0.07 0.1382 2 Months RO SP2 5/18/2012 -- 0.11 RO SP2 4/18/2001 -- 0.06 RO SP2 4/14/2004 -- <0.1 1 Month
RO SP2 5/17/2001 -- 0.05749 RO SP2 5/24/2004 -- <0.1 RO SP2 7/2/2012 -- 0.172 RO SP2 6/18/2001 -- 0.08095 1 Month RO SP2 8/7/2012 -- 0.32 RO SP2 7/25/2001 -- 0.09 RO SP2 7/8/2004 -- <0.1 RO SP2 9/13/2012 0.11 RO SP2 8/22/2001 -- 0.033 2 Months 1 Month
RO SP2 9/26/2001 -- 0.08 RO SP2 10/12/2004 -- 0.07 ROSP2 11/8/2012 -- 0.12
RO SP2 10/17/2001 -- 0.05 RO SP2 11/17/2004 0.369 0.72 13 Months
RO SP2 11/14/2001 -- 0.06 RO SP2 12/8/2004 -- 0.04 ROSP2 1/21/2014 -- 0.117 RO SP2 12/13/2001 0.05 0.1 2Months 9Months
RO SP2 1/30/2002 0.055 0.07 RO SP2 3/14/2005 -- <0.1 RO SP2 11/5/2014 -- 0.11 RO SP2 2/28/2002 -- 0.06 1 Months 1 Month RO SP2 3/27/2002 0.042 0.06 RO SP2 5/9/2005 -- 0.04 ROSP2 1/13/2015 0.164 0.14
3 Months RO SP2 5/9/2005 -- 0.06 3 Months
RO SP2 7/16/2002 -- 0.11 RO SP2 6/21/2005 -- 0.05 ROSP2 5/27/2015 -- 0.28 RO SP2 8/20/2002 -- 0.06 RO SP2 7/19/2005 -- 0.08 2 Months
RO SP2 9/19/2002 -- 0.07 RO SP2 8/16/2005 0.048 0.1 ROSP2 8/5/2015 -- 0.162
RO SP2 10/15/2002 -- 0.06 RO SP2 9/14/2005 0.05 0.1 ROSP2 9/17/2015 0.247 0.23 RO SP2 11/18/2002 -- 0.04 RO SP2 10/11/2005 -- 0.05 RO SP2 9/17/2015 0.278 0.25 RO SP2 12/11/2002 -- 0.05 25 Months RO SP2 10/6/2015 -- 0.14 RO SP2 1/22/2003 -- 0.07 RO SP2 12/10/2007 -- 0.12 ROSP2 10/6/2015 -- 0.14
•Duplicate or multiple monthly sample not in exceedance of GWPS
SP2 Exceedances July 2017 1-4
2. MAGNITUDE AND DURATION OF EXCEEDANCES
The feed to the RO system consists primarily of severely impacted alluvial ground water collected
from within the hydraulic control area. The exceedance of GWPSs for molybdenum and uranium
presented in Table 1-1 occurred when there was a malfunction, disruption or other underperformance
issue with the RO treatment system.
The molybdenum and uranium concentrations in the collection water feed to the RO system have
gradually diminished since the RO treatment began, but typical concentrations are two orders of
magnitude or more greater than the respective GWPS for the COCs. Unfortunately, the very large
ratio of RO feed concentration to GWPSs for molybdenum and uranium results in a condition where
a removal of more than 99% of the COCs by RO treatment may not be adequate for the discharge to
meet the GWPSs at SP2. Although the high level of RO performance required to meet the GWPS
has resulted in a number of exceedances ofrespective GWPSs, the magnitude of the exceedance has
typically been relatively small. With a few exceptions, the value of an exceedance for molybdenum
at SP2 was less than 0.20 mg/I. The relatively slight level of underperformance of the RO that can
cause an exceedance explains, in part, the numerous but relatively minor exceedances of the molybdenum standard.
Both the duration and magnitude of the exceedance of a GWPS can affect the impact of that
exceedance on the ground-water quality. In considering the impact of exceedances, each exceedance
presented in Table 1-1 is considered to generically represent the month in which it occurred. Table
1-1 also lists the number of months elapsed between non-consecutive exceedances. The longest continuous period of exceedance for molybdenum concentration occurred from February of 2003
through January of 2004. The largest magnitude of exceedance for both molybdenum and uranium concentration occurred in November of 2004. With the exception of three consecutive months of
exceedance of the molybdenum GWPS in July through September of2012, the remainder of the exceedances through the end of2014 occur in a single month preceded and followed by at least a
month of non-exceedance. There were also three consecutive months of exceedance (August
through October) of the molybdenum GWPS in 2015. However, the operational records indicate the RO treatment rates were small during this period and thus the potential impacts of the three month
period of exceedance in late 2015 would be small in comparison to the longer duration or more
severe exceedances described below.
Two periods where exceedances occurred were selected as representing the maximum potential for
impacts. The longest period of consecutive exceedances of the molybdenum GWPS -- from February of 2003 through January of 2004 -- was selected for evaluation of impacts. This period is
significantly longer than the three month exceedance that occurred in 2012 (see Table 1-1) and
results in a significantly larger estimate of the mass of molybdenum in the SP2 injection water. The
second period selected for evaluation is November of 2004 because the magnitude of the exceedance for both molybdenum and uranium was greatest during this month. The other exceedances of the
SP2 Exceedances July 2017 2-1
uranium G WPS in Table 1-1 are at a lower concentration and thus the critical exceedance for
evaluation is that during November of 2004.
2.1 Injection System Operation During Selected Exceedance Periods
Figure 2-1 presents the operational alluvial aquifer configuration for 2003. During 2003 and 2004,
the injection system, consisting of injection wells and horizontal infiltration lines, was operated with two distribution systems. As shown in Figure 2-1 , the SP2 combination of RO product water mixed with fresh water was distributed to wells located on the southern and eastern periphery of the Small Tailings Pile (STP). For operational purposes, fresh water supplied from San Andres wells was
injected into wells and horizontal infiltration lines within the hydraulic barrier in an area extending from south of the STP to west of the Large Tailings Pile (LTP). The operational configuration for
2004 was very similar to that shown in Figure 2-1 , and use of the 2003 well configuration is appropriate for the purposes of evaluation of the impact of exceedances occurring in 2003 and 2004.
The segregation of the SP2 injection water to wells on the southern and eastern periphery of the STP
is beneficial in that the injection of water exceeding a GWPS is on the interior side of the hydraulic boundary. With a series of fresh water injection wells located to the south of the SP2 injection wells, the impact of exceedance of GWPSs is diminished as the SP2 water is generally pushed
inward towards the active collection. Additionally, the active collection efforts in the area of the L series of wells (see Figure 2-1) will potentially capture injection water from the area of the STP.
2.2 Injection Rates During Selected Exceedance Periods
Figure 2-2 presents the injection rates occurring through 2004. The average rate of RO product discharge during 2003 was 266 gpm while the total fresh water injection rate was 431 gpm. This fresh water injection rate includes both the fresh water added to RO product to comprise the SP2 injection water, and the fresh water injected separately in wells and infiltration lines. In 2004, the average rate of RO product discharge was 249 gpm while the total fresh water injection rate was 501 gpm. The SP2 sample location represents a combination of the RO product and fresh water supplied to the RO plant. The rate of addition of fresh water to the RO product stream at SP2 was variable, but would generally be on the order of 100 to 200 gpm with the remaining fresh water used in the separate injection supply system.
For the evaluation of the impact of exceedances in the following sections, the rate of injection of SP2 water during the periods of exceedance is estimated as the average rate of RO product discharge plus an estimated rate of fresh water addition to the RO product water. For the exceedance period of February 2003 through January 2004, the average RO product discharge was calculated as 265 gpm
(eleven months at 266 gpm and one month at 249 gpm). The rate of fresh water added to produce
the SP2 injection water was estimated as 100 gpm, totaling 365 gpm of SP2 injection for the impacts scenario. The remaining fresh water distributed to the other injection wells would therefore be
SP2 Exceedances July 2017 2-2

approximately 337 gpm (subtracting 100 gpm from the average of eleven months at 431 gpm and one month at 501 gpm).
The SP2 injection rate for the November 2004 exceedance period was estimated as the sum of the average RO product discharge rate of249 gpm and 100 gpm of fresh water addition. The remaining fresh water distributed to the other injection wells would be approximately 401 gpm.
2.3 Magnitude of Exceedances
The exceedance of molybdenum GWPS occurring from February 2003 through January 2004 was at
concentrations ranging from 0.11to0.38 mg/I. The simple average of the molybdenum concentrations for the twelve monthly samples is 0.174 mg/I, which represents an exceedance of the
GWPS of 0.10 mg/I by 0.074 mg/I. This value (0.074 mg/I) is used in the following sections in evaluating the impacts of the exceedances.
The exceedance of molybdenum GWPS occurring in November of2004 was at a concentration of 0.72 mg/I which exceeds the GWPS by 0.62 mg/I. The corresponding uranium concentration was
0.369 mg/I which exceeds the uranium GWPS by 0.209 mg/I. These values of 0.62 mg/I for molybdenum and 0.209 mg/I for uranium are used in the following sections in evaluating the impacts of the exceedances.
..
SP2 Exceedances July 2017 2-3

... ~ ·'
•• +
""· "$ ./' .
#.
~·
!' .:-'
$'- " .
·~
IJELLS OUTSIDE THIS BORDER ARE JN
REGIONAL TABLE 4.1-4
.........
Figure 2-1 . Alluvl•I Well Loc•tlons •nd Oper•tlon•I Configur•tlon (Figure 4.1-1 from 2003 Annu•I Report)
SP2 Exceodances Ju~ 2017 2-4
--LE:OCND--
.... ~flllllCDl.ctT~
:t :---~~w.J. :: .. ~~~ =rDt vw.
. -.b l'CDNTS or CtlPU-=t
t__.) lill..LWVILMUl'DI
FIGURE 4.1- 1. ALLUVIAL WELL LOCATIONS
4.1-3

w I-::::> 2 ::z: ex: w a. (/) z 0 ...J ...J
"" <{
.... (!)
w u..i I-
~ z Q t-u w ..., ~
700
650
600
550
500
450
400
350 Ltgtnd
300 • UlJ FPES"\V..l·TE°' {f'N ) INJEC'1<*
• 250
200
150
100
50
0 I T I
1997 1998 1999 2001 2002 2003 2004 YEAR
FIGURE 2.1-3. AVERAGE MONTHLY INJECTION RATES FOR THE ALLUVIAL UPPER CHINLE AND MIDDLE CHINLE AQUIFERS.
Figure 2-2. Average Monthly Injection Rates (Figure 2.1-3 from 2004 Annual Report)
SP2 Exceedances July 2017 2-5

3. IMPACT OF EXCEEDANCES
The impact of the two periods of exceedance of G WPSs described in preceding sections is evaluated
by estimating the area into which the injection water could potentially spread and also the expected
increase in COC concentrations within that impact area. With this area and magnitude of potential
impacts, an assessment can be made of the impacts to affected residents and/or landowners including
their potential usage of ground water for irrigation (crop, garden or landscaping) or livestock
watering.
3.1 Area of SP2 Water Injection
Figure 3-1 presents the location of the general injection areas during 2003 and 2004. As mentioned
previously, the SP2 injection occurred in wells on the southern and eastern periphery of the STP.
Simultaneously, there was injection of fresh water from the San Andres aquifer in a line of wells
roughly 200 to 600 feet to the south of the SP2 injection area (see Figure 3-1 ). This injection configuration would have substantially mitigated any impacts of the SP2 GWPS exceedances as discussed below.
The hydraulic barrier formed by the series of injection wells (and horizontal infiltration lines) results
in (1) a radially inward flow towards collection wells near the toe of the LTP, and (2) an outward
flow of alluvial ground water from the hydraulic barrier (see cyan arrows on Figure 3-1 ). The
location of the SP2 and fresh water injection areas shown on Figure 3-1 results in a significant
portion of SP2 injection water flowing preferentially inward towards collection wells while the fresh water injected into wells farther south would preferentially flow outward from the hydraulic barrier.
This configuration was used to contain the SP2 water (RO product and fresh water) in the main area of ground-water restoration. Because the San Andres fresh water supply wells have molybdenum and uranium concentrations far below the respective GWPS, the COC concentrations in ground water flowing outward from the hydraulic barrier were likely below the respective GWPS despite the
exceedances in the SP2 injection area. While it is difficult to quantify the degree to which the
injection configuration prevented or reduced measurable impacts of the exceedances, the water
quality monitoring data discussed later in this report indicate that no measurable impacts attributable to the SP2 exceedances were observed.
A second mitigating factor in the injection configuration is the proximity to the L area collection
wells (see Figure 3-1). The operating collection wells in the area included L, L5 , L7, L8, L9, LIO,
521 , 522 and 639 (see Figure 2-1), where much of the SP2 injection water that potentially moved outward or south from the hydraulic barrier would be captured. The L area collection wells were
operated to capture slightly to moderately impacted alluvial ground water that was outside of the
hydraulic barrier. The concentration of molybdenum and uranium at the L area collection wells was
significantly greater than that in the SP2 injection water during the periods of exceedance.
SP2 Exceedances July 2017 3-1

Therefore, any migration of SP2 injection water to the L area collection wells would improve rather than degrade the overall ground-water quality.
3.2 Injection Mass and Volume During Exceedance
As described in preceding sections, the SP2 injection rate during the exceedance period of February
2003 through January 2004 was estimated at 365 gpm with an exceedance of the molybdenum GWPS by 0.074 mg/I. This results in an estimated injection volume of 191 ,844,000 gallons of water containing an estimated 54 kg of molybdenum in excess of the GWPS.
The November of 2004 exceedance occurred at an estimated injection rate of 349 gpm with an exceedance of the molybdenum GWPS by 0.62 mg/I. This results in an estimated injection volume
of 15,277,800 gallons of water containing an estimated 36 kg of molybdenum in excess of the GWPS. During this period, the GWPS for uranium at SP2 was also exceeded by 0.209 mg/I. This
results in an estimated 12 kg of uranium in excess of the GWPS being injected into the alluvial ground water.
3.3 Potential SP2 Injection Impact Area
In order to quantify potential impacts of SP2 injection during periods of exceedance of one or both COC GWPSs, an area representing the hypothetical spread of the excess mass injected during the exceedance was developed. This area is presented in Figure 3-2 and extends to the edge of the downgradient subdivision where residents would potentially be affected.
The hypothetical spread area displayed in Figure 3-2 extends into the hydraulic control area as well as to the south to the L area in a roughly radial outward pattern. This hypothetical spread area is considered to be an extremely conservative interpretation of potential exceedance impacts because it does not consider either the preferential SP2 injection water flow towards the collection wells inside
the hydraulic control area, or the likely capture by L area collection of any SP2 injection water migrating to the south. Both of these mitigation factors are described in preceding sections.
The volume of water contained in the hypothetical spread area was estimated with an AUTOCAD® based surface and volume analysis program (QUICKSURF) using the typical saturated thickness mapping for the site. An effective porosity of 0.20 was used with a resulting estimate of 354,291, 100 gallons of alluvial ground water contained within the hypothetical spread area. The value of alluvial aquifer effective porosity of 0.20 has been used in ground-water modeling and mass
balance analyses for the site.
3.4 Potential Change in CCC Concentration in Hypothetical Spread Area
The alluvial ground-water volume of354,291 ,100 gallons discussed in the preceding section and the
mass of molybdenum or uranium injected in SP2 water as described in Section 3.2 are used in estimating the potential changes in COC concentration within the hypothetical spread area. The
SP2 Exceedances July 2017 3-2
impacts are expressed as a potential increase in the resident COC concentration in alluvial ground
water with the addition of the calculated mass of the COC injected in excess of the GWPS.
For the exceedance period of February 2003 through January 2004, an estimated 54 kg of
molybdenum in excess of the GWPS was added to the alluvial ground water in the SP2 injection
wells. If the 54 kg of molybdenum were uniformly distributed within the alluvial ground-water
volume in the hypothetical spread area, it would cause an increase in molybdenum concentration of
0.04 mg/I. As described previously, this estimated increase is considered a conservatively large
representation of potential impacts. Section 4.0 of this report describes water quality monitoring in
selected wells located within and adjacent to the hypothetical spread area. For a key well (well I)
located between the SP2 injection area and the Broadview Acres subdivision, the typical
molybdenum concentration is below detection at 0.03 mg/I and is interpreted as one-half of the
detection limit or 0.015 mg/I. Even with the conservatively large estimate of molybdenum
concentration increase of 0.04 mg/I and the assumption of a resident concentration at the detection
level of 0.03 mg/I, the resulting concentration would not exceed the G WPS.
For the exceedance in November 2004, an estimated 36 kg of molybdenum in excess of the GWPS was added to the alluvial ground water in the SP2 injection wells. If the 36 kg of molybdenum were
uniformly distributed within the alluvial ground-water volume in the hypothetical spread area, it
would cause an increase in molybdenum concentration of 0.027 mg/1. The corresponding increase in
uranium concentration with 12 kg of excess uranium added is approximately 0.009 mg/I. Like the
assessment for the twelve month period of exceedance in the preceding paragraph, the increase in
molybdenum concentration would not result in an exceedance of the GWPS in the alluvial ground
water near the Broadview Acres subdivision. The measured uranium concentration in well I during 2004 was 0.0637 mg/I so the very small estimated increase in uranium concentration of 0.009 mg/I would not result in an increase to levels that would potentially impact subdivision residents or
landowners.
The evaluation of impacts of exceedances using the hypothetical spread area indicates that, even
with a method that yields a conservatively large estimate of the magnitude of impacts, the changes in ground-water quality would not significantly impact the nearest residents or landowners in the
Broadview Acres subdivision. The potential use of alluvial ground water for irrigation of crops, gardens or landscaping, or for watering of livestock would not have been affected by the past
exceedances of GWPSs in SP2 injection water. The State of New Mexico irrigation standard for
molybdenum is 1.0 mg/I and this is an appropriate standard for the most likely use of the ground
water by the residents and landowners in the Broadview Acres subdivision.
SP2 Exceedances July 2017 3-3

I •
LARGE-TAILINGS-PILE
Fresh Water 26 Injection 35 H Area 2~25
+ 35 36
' TT 'ff ....
Figure 3-1. SP2 and Fresh Water Injection Areas in 2003 and 2004
SP2 Exceedances July 201 7 3-4

26 35 + ,_,
LARGE-TAILINGS-PILE
Figure 3-2. Hypothetical SP2 Exceedance Impact Area
SP2 Exceedances July 2017
Hnothetical SP2 lniection Water Spread Area
3-5

4. WATER QUALITY MONITORING RESULTS
Water quality monitoring has been done at numerous wells over the life of the restoration program at
the GRP, and the water quality results from five key wells located between the hydraulic barrier and
downgradient subdivisions are very useful in demonstrating that the exceedances of GWPSs in the
SP2 injection water did not significantly impact the alluvial ground water. The locations of wells FB, F, I, GN and Lare shown on Figure 4-1. The water quality sampling record for these five wells
is sufficient to reveal general water quality, trends in COC concentrations, and any significant
changes that might be attributable to the exceedances of the GWPSs in injection waters.
4.1 Molybdenum
Figure 4-2 presents the measured molybdenum concentration in wells I, F, FB and GN. The data
symbols and connector lines on the graph indicate whether the measured molybdenum concentration
occurred for consecutive samples or if there were intermediate samples taken without analysis for molybdenum concentration. The presence of a connector line between data symbols indicates that
consecutive samples were analyzed for molybdenum concentration.
In Figure 4-2, there is a single sample from well FB with a molybdenum concentration greater than
0.10 mg/I, and this sample is considered to be an anomalous result. The corresponding uranium and
selenium concentrations for this particular sample were consistent with preceding and subsequent
sample results, so a dramatic spike in molybdenum concentration is very unlikely. Additionally, the
anomalous result occurred in 2001 prior to the more significant exceedances, and had a measured molybdenum concentration greater than that in the SP2 exceedances prior to 2004. The molybdenum concentration in the majority of the remaining sample results for the four wells were less than the typical detection limit of0.03 mg/I and were posted on the graph as one-half of the
detection limit or 0.015 mg/I to make them more easily distinguishable from samples at the detection limit. The location of the four wells, and in particular well I, would be expected to reveal any
measurable impacts from the exceedances of the molybdenum GWPS at SP2. Excluding the noted anomalous sample value, there are no measured molybdenum concentrations that indicate measurable impacts resulting from the exceedances. A single sample molybdenum concentration of
0.06 mg/I for well I occurred before the RO was operating, and two sample concentrations at the .
minimum detection level of 0.03 mg/I were at well FB which is the greatest distance from the likely
impact area.
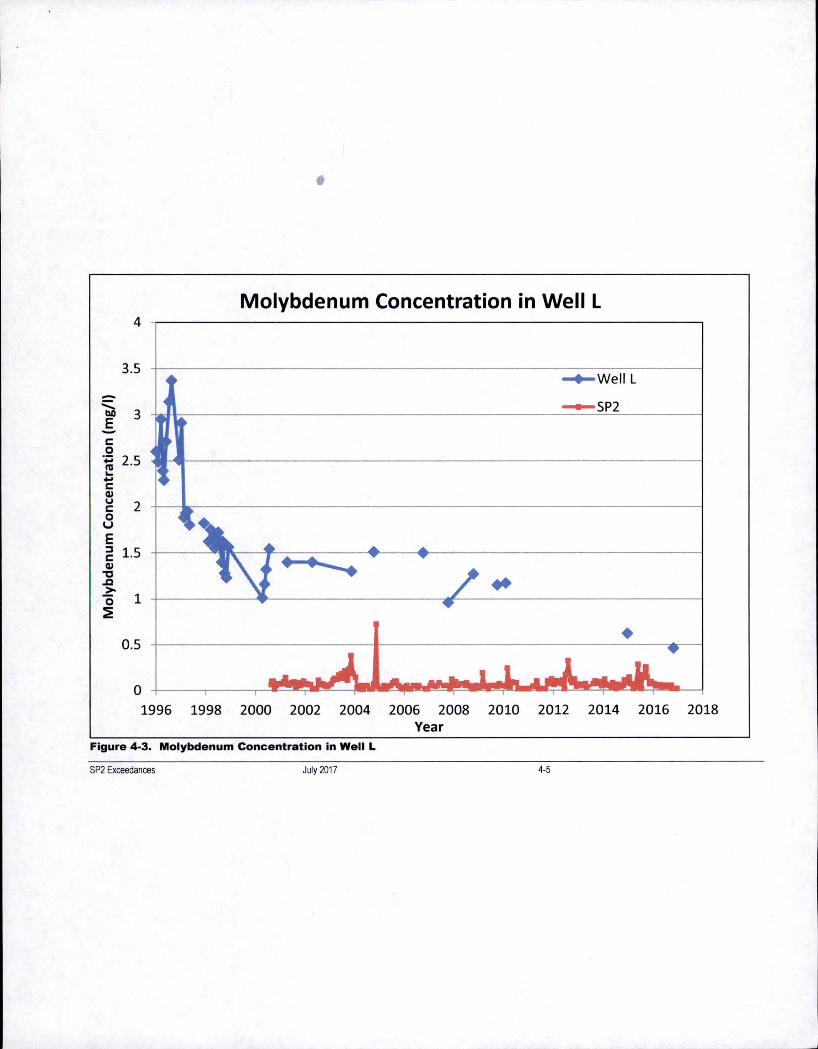
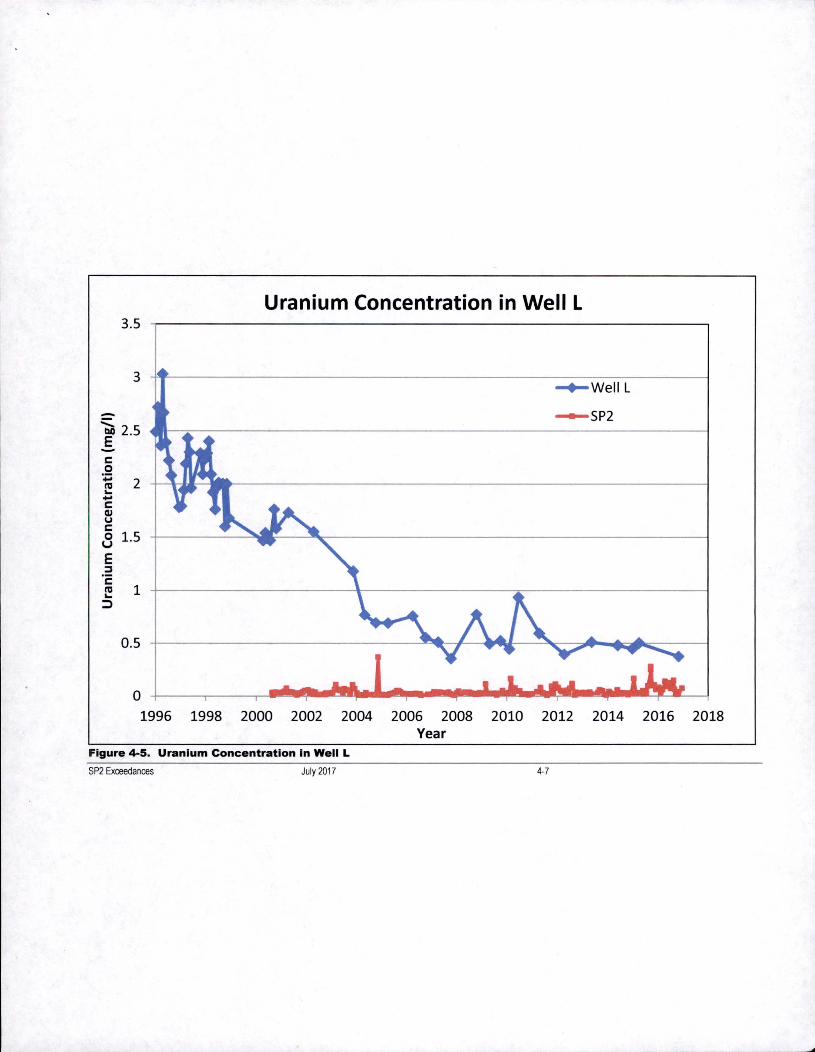
Figure 4-3 presents the measured molybdenum concentration in well L, which is one of the
collection wells in the L area used to capture slightly to moderately impacted alluvial ground water.
The molybdenum concentrations in well Lare significantly greater than those in the SP2 samples
during a period of exceedance of the GWPS (see Figure 4-3). This makes it extremely unlikely that
impacts from the exceedance would be detectable at well L, but the well is included to illustrate that
SP2 Exceedances July 2017 4-1
the L area collection wells would likely capture any increased molybdenum concentrations resulting from the exceedance.
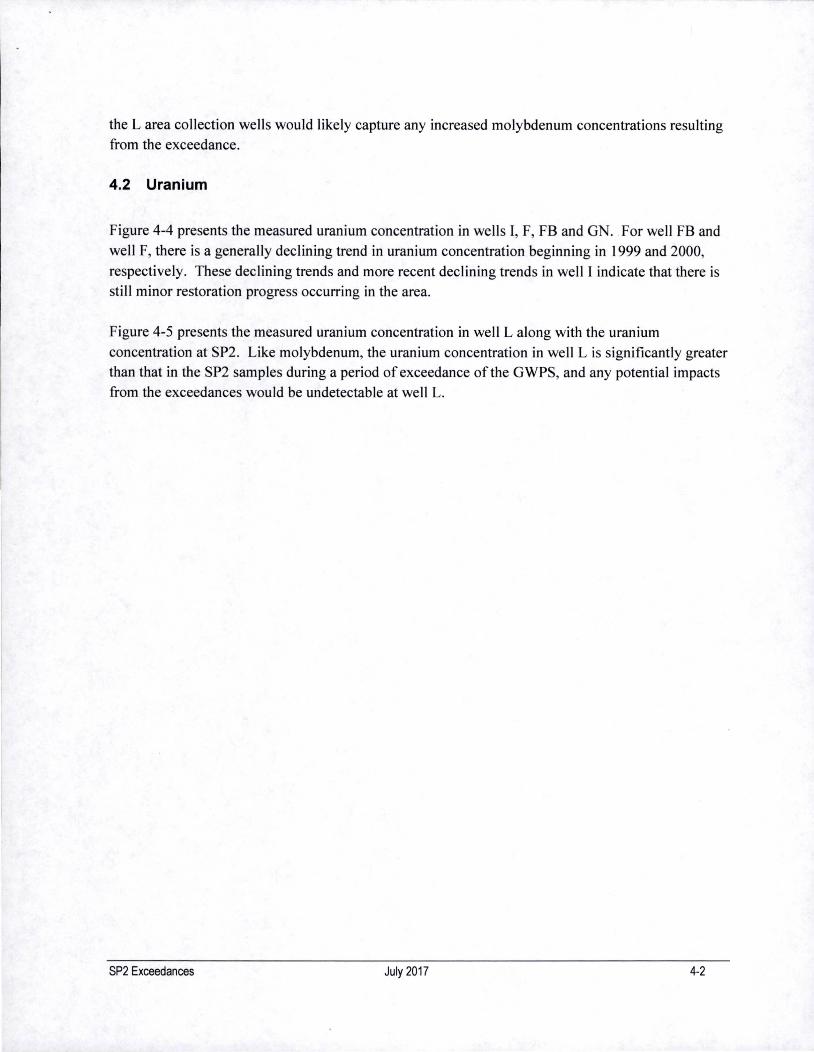
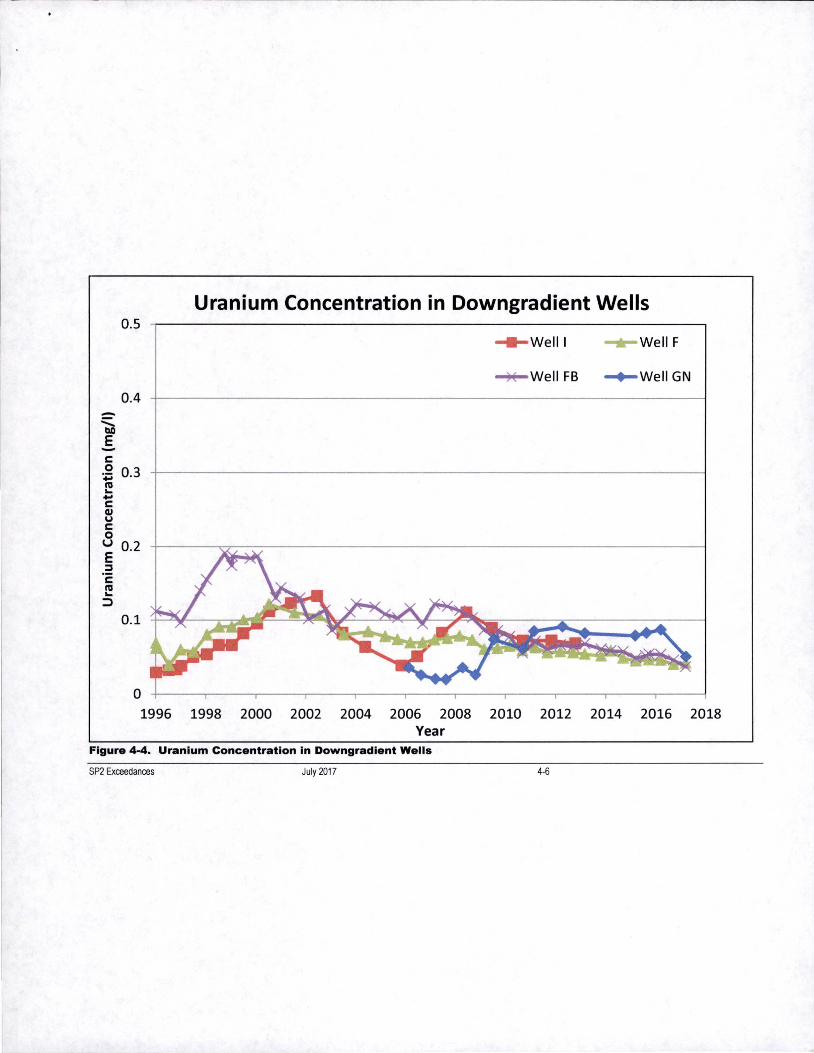
4.2 Uranium
Figure 4-4 presents the measured uranium concentration in wells I, F, FB and GN. For well FB and
well F, there is a generally declining trend in uranium concentration beginning in 1999 and 2000,
respectively. These declining trends and more recent declining trends in well I indicate that there is
still minor restoration progress occurring in the area.
Figure 4-5 presents the measured uranium concentration in well L along with the uranium
concentration at SP2. Like molybdenum, the uranium concentration in well L is significantly greater than that in the SP2 samples during a period of exceedance of the GWPS, and any potential impacts
from the exceedances would be undetectable at well L.
SP2 Exceedances July 2017 4-2
2 23
27 26
LARGE-TAIUNGS-PILE
'\ •
+ 2~+2 35 3
' TT
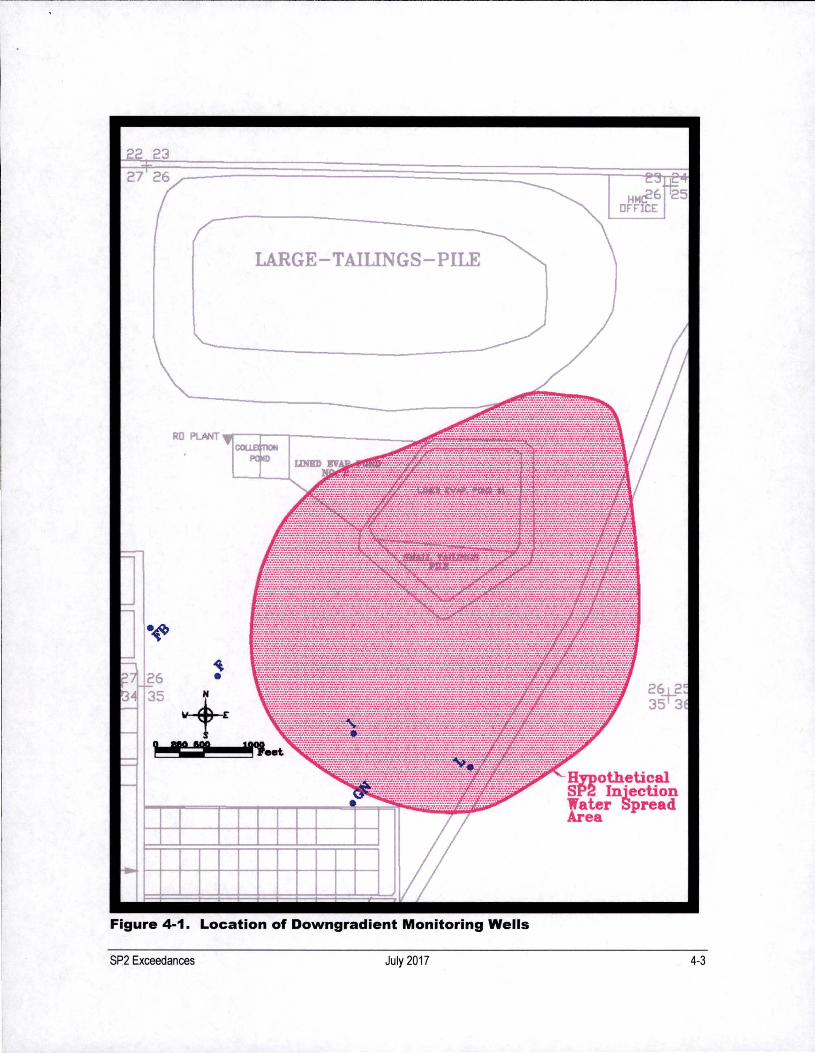
Figure 4-1. Location of Downgradient Monitoring Wells
SP2 Exceedances July 2017 4-3

-"tic E -
0.3
0.25
g 0.2 ·.;;
"' ... .... c QI
~ 0.15 0 u E :::I c ~ 0.1 ..c > 0 ::?!
0.05
0
Molybdenum Concentration in Downgradient Wells ,
- Well I ..,._WellF
~WellFB ~WellGN
• ~-llQ VJ ~A - I •• -~~~ ·- .. i'- A ''-... •- i-. .a. . .. .... .... , , _____ ·--
I I
1996 1998 2000 2002 2004 2006 2008 2010 2012 2014 2016 2018 Year
Figure 4-2. Molybdenum Concentration in Downgradient Wells
SP2 Exceedances July 2017 4-4
4
3.5
-' 3 tlO E c 0 ~ 2.5 nl ... .... c QI u 2 c 0 u E :J 1.5 c QI
"C .£J ~ 1 0 ~
0.5
0
•
Molybdenum Concentration in Well L
-+-Well L
---sP2
.. •
1996 1998 2000 2002 2004 2006 2008 2010 2012 2014 2016 2018 Year
Figure 4-3. Molybdenum Concentration in Well L
SP2 Exceedances July 2017 4-5
_j
-.::::. b.O E c 0
·.;::; !U ... ... c C1I u c 0 u E :::s c !U ... ::>
0.5
0.4
0.3
0.2
0.1
Uranium Concentration in Downgradient Wells
- Well I ...-well F
~Well FB -..well GN
1996 1998 2000 2002 2004 2006 2008 2010 2012 2014 2016 2018 Year
Figure 4-4. Uranium Concentration in Downgradient Wells
SP2 Exceedances July 2017 4-6
3.5
3
-::::. bO 2.5 E c: 0 ~ 2 IU ... +' c: Cl> u c: 0 1.5 u E ::::J
c: IU 1 ...
::::>
0.5
0
Uranium Concentration in Well L
-.-well L
- SP2
1996 1998 2000 2002 2004 2006 2008 2010 2012 2014 2016 2018 Year
Figure 4-5. Uranium Concentration in Well L
SP2 Exceedances July 2017 4-7

5. SUMMARY AND CONCLUSIONS
The evaluation of the impact of exceedances ofGWPSs in the injection water represented by SP2 indicated that no significant impacts occurred. The evaluation was done from the
standpoint of a qualitative consideration of mitigating factors, a quantitative assessment of potential impacts, and a review of water quality monitoring data that could reveal impacts.
5.1 Mitigating Factors
Two mitigating factors related to the location of the SP2 injection wells and surrounding injection or collection wells were identified. The first and most significant factor is the location of the injection wells receiving SP2 injection water in relation to injection wells receiving fresh water. With the line of fresh water injection wells acting to form the southern edge of the hydraulic barrier, the SP2 injection wells generally act to form the northern edge of the hydraulic barrier. The injection water on the northern edge would preferentially flow inward towards the depression in the potentiometric surface created by active collection, and would effectively be
contained within the hydraulic control area. This should largely mitigate any potential impacts from the exceedances.
The second mitigating factor is the proximity of the active collection in the L area to the SP2 injection wells. Any ground water flowing from the SP2 injection area to the south would very
likely be intercepted and captured by the L area collection.
5.2 Quantitative Assessment
The quantitative assessment involved calculation and comparison of mass transferred to the ground water during exceedances and the resulting impacts on water quality. Two key exceedance periods were identified and evaluated as the longest duration and most severe exceedances. The other exceedances listed in Table 1-1 were of shorter duration and/or reduced severity and the potential impacts would be much less than those of the exceedances evaluated.
The quantitative assessment used a hypothetical spread area within which excess molybdenum or uranium mass from the exceedance was uniformly distributed. The resulting estimate of increase in COC concentration within the hypothetical spread area ranged from 0.027 to 0.04 mg/I for molybdenum and was 0.009 mg/I for uranium. If combined with the COC concentrations in the typical resident ground water represented by wells F, FB, I and GN, these potential increases in
COC concentrations would not exceed the respective GWPS.
5.3 Water Quality Monitoring
The water quality monitoring data for wells located downgradient of the hydraulic barrier in the
area of SP2 water injection are likely the most definitive indicator that no significant groundwater quality impacts are attributable to the exceedances at SP2. The molybdenum and uranium
SP2 Exceedances July 2017 5-1
concentration data for wells FB, F, I and GN appear to be entirely unaffected by the injection of SP2 water with COC concentrations greater than respective GWPSs.
SP2 Exceedances July 2017 5-2
Related Documents