ORIGINAL ARTICLE Analysis of surrogate gene expression markers in peripheral blood of melanoma patients to predict treatment outcome of adjuvant pegylated interferon alpha 2b (EORTC 18991 side study) Antonia Busse • Je ´ro ˆme Rapion • Alberto Fusi • Stefan Suciu • Anika Nonnenmacher • Mario Santinami • Wim H. J. Kruit • Alessandro Testori • Cornelis J. A. Punt • Angus G. Dalgleish • Alan Spatz • Alexander M. M. Eggermont • Ulrich Keilholz Received: 11 October 2012 / Accepted: 10 April 2013 Ó Springer-Verlag Berlin Heidelberg 2013 Abstract We analysed mRNA levels of interferon response genes (ISG15, STAT1, CXCL10) of inhibitors of the JAK/STAT pathway (STAT3, SOCS1, SOCS3) and of cytokines (TNFa, IL10, TGFß1) in peripheral blood of 91 stage III melanoma patients enrolled in EORTC 18991 trial to find biomarkers indicative for disease stage and pre- dictive for efficacy of pegylated interferon alpha-2b (PEG- IFNa-2b) therapy. mRNA levels were analysed at baseline and after 6 months. Univariate and multivariate analyses were performed to estimate the prognostic and predictive role of mRNA levels for distant metastasis-free survival (DMFS) and relapse-free survival (RFS). Compared to healthy controls, melanoma patients showed significantly higher TGFb1 mRNA levels. In a multivariate model, increasing SOCS1 and SOCS3 mRNA levels were associ- ated with worse RFS (P = 0.02 and P = 0.04, respec- tively) and DMFS (P = 0.05 and P = 0.05, respectively) due to negative correlation between, respectively, SOCS1/ SOCS3 mRNA levels and ulceration or Breslow thickness. No impact of PEG-IFNa-2b on mRNA levels was observed except for ISG15 mRNA levels, which decreased in the treatment arm (P = 0.001). It seems that patients with a decrease [ 60 % of ISG15 mRNA levels during 6 months PEG-IFNa-2b had inferior outcome. Keywords RT-PCR Melanoma Adjuvant pegylated interferon alpha-2b EORTC Immunosuppressive cytokines Interferon response genes Abbreviations PEG-IFNa-2b Pegylated interferon alpha-2b SOCS Suppressors of cytokine signalling DMFS Metastasis-free survival RFS Relapse-free survival pB Peripheral blood Introduction Adjuvant interferon (IFN)-a therapy in melanoma is still a matter of debate due to its toxicity and costs in relation to A. Busse (&) A. Fusi A. Nonnenmacher U. Keilholz Department of Medicine III, Charite ´-CBF, Hindenburgdamm 30, 12200 Berlin, Germany e-mail: [email protected] J. Rapion S. Suciu European Organisation for Research and Treatment of Cancer Headquarters, Brussels, Belgium M. Santinami Istituto Nazionale dei Tumori, Milan, Italy W. H. J. Kruit A. M. M. Eggermont Erasmus MC-Daniel den Hoed Cancer Center, Rotterdam, The Netherlands A. Testori Istituto Europeo di Oncologia, Milan, Italy C. J. A. Punt Academic Medical Center, University of Amsterdam, Amsterdam, The Netherlands A. G. Dalgleish St. Georges Hospital, London, UK A. Spatz Jewish General Hospital, Montreal, Canada A. M. M. Eggermont Cancer Institute Gustave Roussy, Villejuif-Paris, France 123 Cancer Immunol Immunother DOI 10.1007/s00262-013-1428-4

Welcome message from author
This document is posted to help you gain knowledge. Please leave a comment to let me know what you think about it! Share it to your friends and learn new things together.
Transcript

ORIGINAL ARTICLE
Analysis of surrogate gene expression markers in peripheral bloodof melanoma patients to predict treatment outcome of adjuvantpegylated interferon alpha 2b (EORTC 18991 side study)
Antonia Busse • Jerome Rapion • Alberto Fusi • Stefan Suciu • Anika Nonnenmacher •
Mario Santinami • Wim H. J. Kruit • Alessandro Testori • Cornelis J. A. Punt •
Angus G. Dalgleish • Alan Spatz • Alexander M. M. Eggermont • Ulrich Keilholz
Received: 11 October 2012 / Accepted: 10 April 2013
� Springer-Verlag Berlin Heidelberg 2013
Abstract We analysed mRNA levels of interferon
response genes (ISG15, STAT1, CXCL10) of inhibitors of
the JAK/STAT pathway (STAT3, SOCS1, SOCS3) and of
cytokines (TNFa, IL10, TGFß1) in peripheral blood of 91
stage III melanoma patients enrolled in EORTC 18991 trial
to find biomarkers indicative for disease stage and pre-
dictive for efficacy of pegylated interferon alpha-2b (PEG-
IFNa-2b) therapy. mRNA levels were analysed at baseline
and after 6 months. Univariate and multivariate analyses
were performed to estimate the prognostic and predictive
role of mRNA levels for distant metastasis-free survival
(DMFS) and relapse-free survival (RFS). Compared to
healthy controls, melanoma patients showed significantly
higher TGFb1 mRNA levels. In a multivariate model,
increasing SOCS1 and SOCS3 mRNA levels were associ-
ated with worse RFS (P = 0.02 and P = 0.04, respec-
tively) and DMFS (P = 0.05 and P = 0.05, respectively)
due to negative correlation between, respectively, SOCS1/
SOCS3 mRNA levels and ulceration or Breslow thickness.
No impact of PEG-IFNa-2b on mRNA levels was observed
except for ISG15 mRNA levels, which decreased in the
treatment arm (P = 0.001). It seems that patients with a
decrease [60 % of ISG15 mRNA levels during 6 months
PEG-IFNa-2b had inferior outcome.
Keywords RT-PCR � Melanoma � Adjuvant pegylated
interferon alpha-2b � EORTC � Immunosuppressive
cytokines � Interferon response genes
Abbreviations
PEG-IFNa-2b Pegylated interferon alpha-2b
SOCS Suppressors of cytokine signalling
DMFS Metastasis-free survival
RFS Relapse-free survival
pB Peripheral blood
Introduction
Adjuvant interferon (IFN)-a therapy in melanoma is still a
matter of debate due to its toxicity and costs in relation to
A. Busse (&) � A. Fusi � A. Nonnenmacher � U. Keilholz
Department of Medicine III, Charite-CBF, Hindenburgdamm 30,
12200 Berlin, Germany
e-mail: [email protected]
J. Rapion � S. Suciu
European Organisation for Research and Treatment of Cancer
Headquarters, Brussels, Belgium
M. Santinami
Istituto Nazionale dei Tumori, Milan, Italy
W. H. J. Kruit � A. M. M. Eggermont
Erasmus MC-Daniel den Hoed Cancer Center, Rotterdam,
The Netherlands
A. Testori
Istituto Europeo di Oncologia, Milan, Italy
C. J. A. Punt
Academic Medical Center, University of Amsterdam,
Amsterdam, The Netherlands
A. G. Dalgleish
St. Georges Hospital, London, UK
A. Spatz
Jewish General Hospital, Montreal, Canada
A. M. M. Eggermont
Cancer Institute Gustave Roussy, Villejuif-Paris, France
123
Cancer Immunol Immunother
DOI 10.1007/s00262-013-1428-4
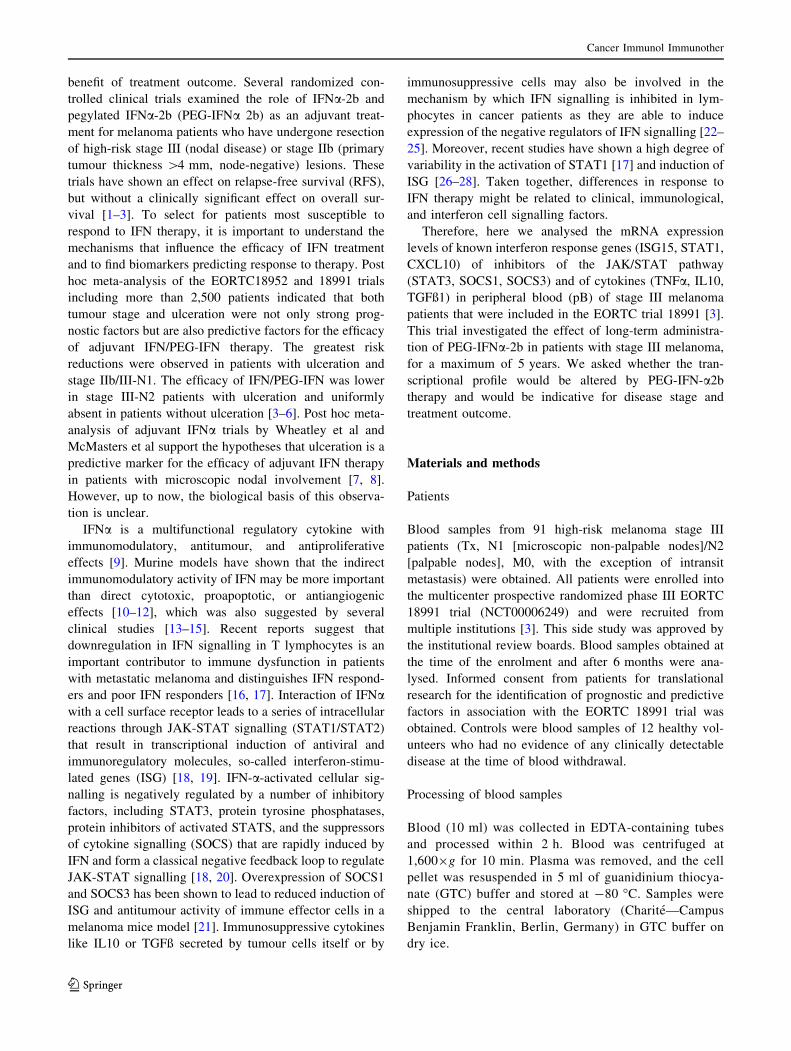
benefit of treatment outcome. Several randomized con-
trolled clinical trials examined the role of IFNa-2b and
pegylated IFNa-2b (PEG-IFNa 2b) as an adjuvant treat-
ment for melanoma patients who have undergone resection
of high-risk stage III (nodal disease) or stage IIb (primary
tumour thickness [4 mm, node-negative) lesions. These
trials have shown an effect on relapse-free survival (RFS),
but without a clinically significant effect on overall sur-
vival [1–3]. To select for patients most susceptible to
respond to IFN therapy, it is important to understand the
mechanisms that influence the efficacy of IFN treatment
and to find biomarkers predicting response to therapy. Post
hoc meta-analysis of the EORTC18952 and 18991 trials
including more than 2,500 patients indicated that both
tumour stage and ulceration were not only strong prog-
nostic factors but are also predictive factors for the efficacy
of adjuvant IFN/PEG-IFN therapy. The greatest risk
reductions were observed in patients with ulceration and
stage IIb/III-N1. The efficacy of IFN/PEG-IFN was lower
in stage III-N2 patients with ulceration and uniformly
absent in patients without ulceration [3–6]. Post hoc meta-
analysis of adjuvant IFNa trials by Wheatley et al and
McMasters et al support the hypotheses that ulceration is a
predictive marker for the efficacy of adjuvant IFN therapy
in patients with microscopic nodal involvement [7, 8].
However, up to now, the biological basis of this observa-
tion is unclear.
IFNa is a multifunctional regulatory cytokine with
immunomodulatory, antitumour, and antiproliferative
effects [9]. Murine models have shown that the indirect
immunomodulatory activity of IFN may be more important
than direct cytotoxic, proapoptotic, or antiangiogenic
effects [10–12], which was also suggested by several
clinical studies [13–15]. Recent reports suggest that
downregulation in IFN signalling in T lymphocytes is an
important contributor to immune dysfunction in patients
with metastatic melanoma and distinguishes IFN respond-
ers and poor IFN responders [16, 17]. Interaction of IFNawith a cell surface receptor leads to a series of intracellular
reactions through JAK-STAT signalling (STAT1/STAT2)
that result in transcriptional induction of antiviral and
immunoregulatory molecules, so-called interferon-stimu-
lated genes (ISG) [18, 19]. IFN-a-activated cellular sig-
nalling is negatively regulated by a number of inhibitory
factors, including STAT3, protein tyrosine phosphatases,
protein inhibitors of activated STATS, and the suppressors
of cytokine signalling (SOCS) that are rapidly induced by
IFN and form a classical negative feedback loop to regulate
JAK-STAT signalling [18, 20]. Overexpression of SOCS1
and SOCS3 has been shown to lead to reduced induction of
ISG and antitumour activity of immune effector cells in a
melanoma mice model [21]. Immunosuppressive cytokines
like IL10 or TGFß secreted by tumour cells itself or by
immunosuppressive cells may also be involved in the
mechanism by which IFN signalling is inhibited in lym-
phocytes in cancer patients as they are able to induce
expression of the negative regulators of IFN signalling [22–
25]. Moreover, recent studies have shown a high degree of
variability in the activation of STAT1 [17] and induction of
ISG [26–28]. Taken together, differences in response to
IFN therapy might be related to clinical, immunological,
and interferon cell signalling factors.
Therefore, here we analysed the mRNA expression
levels of known interferon response genes (ISG15, STAT1,
CXCL10) of inhibitors of the JAK/STAT pathway
(STAT3, SOCS1, SOCS3) and of cytokines (TNFa, IL10,
TGFß1) in peripheral blood (pB) of stage III melanoma
patients that were included in the EORTC trial 18991 [3].
This trial investigated the effect of long-term administra-
tion of PEG-IFNa-2b in patients with stage III melanoma,
for a maximum of 5 years. We asked whether the tran-
scriptional profile would be altered by PEG-IFN-a2b
therapy and would be indicative for disease stage and
treatment outcome.
Materials and methods
Patients
Blood samples from 91 high-risk melanoma stage III
patients (Tx, N1 [microscopic non-palpable nodes]/N2
[palpable nodes], M0, with the exception of intransit
metastasis) were obtained. All patients were enrolled into
the multicenter prospective randomized phase III EORTC
18991 trial (NCT00006249) and were recruited from
multiple institutions [3]. This side study was approved by
the institutional review boards. Blood samples obtained at
the time of the enrolment and after 6 months were ana-
lysed. Informed consent from patients for translational
research for the identification of prognostic and predictive
factors in association with the EORTC 18991 trial was
obtained. Controls were blood samples of 12 healthy vol-
unteers who had no evidence of any clinically detectable
disease at the time of blood withdrawal.
Processing of blood samples
Blood (10 ml) was collected in EDTA-containing tubes
and processed within 2 h. Blood was centrifuged at
1,6009g for 10 min. Plasma was removed, and the cell
pellet was resuspended in 5 ml of guanidinium thiocya-
nate (GTC) buffer and stored at -80 �C. Samples were
shipped to the central laboratory (Charite—Campus
Benjamin Franklin, Berlin, Germany) in GTC buffer on
dry ice.
Cancer Immunol Immunother
123

RNA extraction and reverse transcription
The method is described by us in detail elsewhere [29]. In
brief, total cellular RNA was extracted from 10 ml of EDTA-
stabilized blood by acid guanidinium thiocyanate/phenol
chloroform isolation. For reverse transcription, Omniscript
Reverse Transcriptase kit (Qiagen, Hilden, Germany) was
used following the manufactures instructions.
Quantitative real-time PCR
Quantitative real-time RT-PCR was done by LightCycler
Technology (Roche Diagnostics) as described [29]. Primer
and probe sequences were designed using the LightCycler
Probe Design software, version 1.0. Sequences and PCR
conditions are listed in Table 1. About 2 ll of each cDNA
was diluted to a volume of 20 ll PCR mix (LightCycler
Fast Start DNA Master Hybridization Probes, Roche
Diagnostics) containing the appropriate MgCl2 concentra-
tion, 0.5 pmol of each primer, and 0.2 pmol of each probe.
For each target, an initial denaturation cycle at 95 �C for
10 min, followed by 50 cycles with a final extension of
2 min at 72 �C, was used. The specificity of the PCR
products was confirmed by melting curve analysis as well
as by gel electrophoresis. For quantification, PCR products
generated from the proteasome subunits cDNAs and from
HMBS cDNAs were cloned into the vector pCR2.1-TOPO
(Invitrogen, Groningen, the Netherlands). A standard curve
with 3 dilutions of the appropriate plasmid in duplicates
was included in each PCR run. Analysis of RT-PCR
expression data was done with the LightCycler software
(version 3). All samples were analysed in duplicate. The
average value of both duplicates was used as a quantitative
value. To correct for differences in cDNA amount on a per-
sample basis, results were provided as ratio to house-
keeping gene HMBS expression.
Statistical analysis
mRNA expression levels have been transformed to LOG2
(mRNA levels) in order to obtain variables which had a
normal distribution. To compare LOG2 of mRNA expres-
sion levels of melanoma patients (at baseline) with that of
healthy controls, a generalized linear model (GLM) has
Table 1 Primer/hybridization probe sequences, amplicon length, MgCl2 concentration, and annealing temperature (AT) for the real-time RT-
PCR; (P, dephosphorylated; X, Fluorescein; Y, LC Red 640)
Target Fwd/Rev primer LC/FL probe Amplicon/
bp
MgCl2 AT/�C
CXCL10 50-TCTAGAACTGTACGCTGTACC
50-GATTCAGACATCTCTTCTCACC
50-Y-TCCACGTGTTGAGATCATTGCTACAATG-P
50-AAACTTGAAATTATTCCTGCAAGCCAATTT-X
157 5 63
HMBS 50-TGCAGGCTACCATCCATGTCCCTGC
50-AGCTGCCGTGCAACATCCAGGATGT
50-Y-TGTGGGTCATCCTCAGGGCCATCTTC-P
50-CGTGGAATGTTACGAGCAGTGATGCCTACC-X
187 4 65
IL10 50-CCTTCCAGTGTCTCGG
50-TGGAGTACAGGGGCAT
50-Y-AGGTCAGGAGTTCCTAACCAG-P
50-AGGCGGGTGGATCACT-X
357 4 60
ISG15 50-GCCAGTACAGGAGCTTG
50-GCCGATCTTCTGGGTGA
50-Y-CAACGAATTCCAGGTGTCCCTGAGC-P
50-GACGGTGAAGATGCTGGCG-X
159 4 62
SOCS3 50-ATGTAGCAGCGATGGA
50-GTGCAAAGTTTGACTTGG
50-Y-CTACTCAGGCCCTTGAGGC-P
50-CTCCAGTCCTCTCTCCTCCC-X
325 4 61
SOCS1 50-CCGTGTTATTTTGTTATTACTTGC
50-AGATACTGGGTATATGTAAACATGA
50-Y-GGAGCCAGGACCTGAACT-P
50-TGGTTGTTGTAGCAGCTTAACTGTAT-X
267 5 57
STAT1 50-GAATGAGGGTCCTCTCATCGTTA
50-CGCCACCAGCATGTTGTA
50-Y-CCAACGTCAGCCAGCTCCC-P
50-TCTCTGCCCGTTGTGGTGAT-X
181 2 60
STAT3 50-TACTAAAGTCAGGTTGCTGGT
50-TGGATTCTTCCATGTTCATCAC
50-Y-TCCCGGAAATTTAACATTCTGGGCACAAA
CAC-P
50-GGGACGTTGCAGCTCTCAGAG-X
161 4 64
TGFb1 50-CCCACAACGAAATCTATGAC
50-GCTAAGGCGAAAGCCC
50-Y-AGAGTGGTTATCTTTTGATGTCACCG-P
50-GGCACCCAGCGACTCG-X
314 5 57
TNFa 50-CCTCCACCCATGTGC
50-CTCCCAGATAGATGGGCTCATA
50-Y-CCTGCCAGAGGGAGACCC-P
50-AACCTCCTCTCTGCCATCAAGAG-X
156 4 63
Cancer Immunol Immunother
123
been used, adjusted by age and sex. Association with
clinicopathologic features has been analysed by variance
(ANOVA). Clinicopathologic features included age (in 3
classes: \35 years, 35–49 years, and C50 years), sex,
presence of ulceration, tumour stage (N1 for microscopic
non-palpable nodes; N2 for palpable nodes), number of
lymph nodes involved (0–1/2–4/5?), and Breslow thick-
ness (\1.5 mm/1.5–4 mm/[4 mm). Adjusting of p-values
because of multiple testing was done with Benjamini and
Hochberg’s method. To analyse change of mRNA levels
between baseline and after 6 months therapy, for each
mRNA marker, the percentage of variation from baseline
of the LOG2 of mRNA level between 6 months and base-
line was determined as follows: %Diff of LOG2
(mRNA) = [LOG2 (mRNA 6 months)—LOG2 (mRNA base-
line)] 9 100/LOG2 (mRNA baseline). Two time-to-event
endpoints were considered: relapse-free survival (RFS) and
distant metastasis-free survival (DMFS) from randomiza-
tion in the study. Events for each these endpoints included:
any type of disease recurrence and death due to any cause
(for RFS), distant metastasis and death due to any cause
(for DMFS). For these two endpoints, patients were cen-
sored at the last follow-up date if the event of interest did
not occur. Relationship between mRNA markers and sur-
vival was examined in univariate analyses and subse-
quently by multivariate analysis using a Cox regression
model. Survival curves were plotted according to the
Kaplan–Meier method and were compared with the two-
tailed log-rank test.
Statistical analyses were performed with SAS 9.2 soft-
ware (SAS Institute, Cary, NC).
Results
Patients’ characteristics
A total of 91 patients out of 1,256 patients enrolled in the
EORTC 18991 trial were evaluable for the RT-PCR study.
Forty-four patients had been randomly assigned to the
treatment arm and 47 to the control arm. The median
actuarial follow-up was 7.7 years. Clinical characteristics
of patients in the RT-PCR study are listed in Table 2.
There were no marked differences between the entire
patient population and the patient subset included in the
RT-PCR study for the most important variables (treatment
arm, type of nodal involvement, and number of positive
lymph nodes; data not shown) [3]. However, there were
more patients with microscopic nodal involvement in the
RT-PCR-study population compared to the entire popula-
tion (54.5 vs. 43.2 %, respectively). Within 6 months from
randomization, one patient had a disease recurrence and 6
patients discontinued treatment due to toxicity.
mRNA expression levels at baseline
mRNA expression levels at baseline have been determined
for the interferon response genes ISG15, STAT1, CXCL10;
inhibitors of the JAK/STAT pathway STAT3, SOCS1,
SOCS3; and for the cytokines TNFa, IL10 and TGFb1. As
crude levels had a quite skewed distribution, each mRNA
level has been transformed to LOG2 (mRNA expression
level) in order to obtain variables, which had a distribution
close to a normal one. Analysis of variance (ANOVA) for
each LOG2 transformation of mRNA levels with all clini-
copathologic features revealed that ISG15 mRNA levels
were higher in N2 compared to N1 patients; in contrast,
patients with higher Breslow thickness had lower mRNA
expression levels of the IFN inducible genes STAT1 and
CXCL10. Moreover, patients with ulcerations or with high
Breslow thickness showed lower SOCS1 and SOCS3
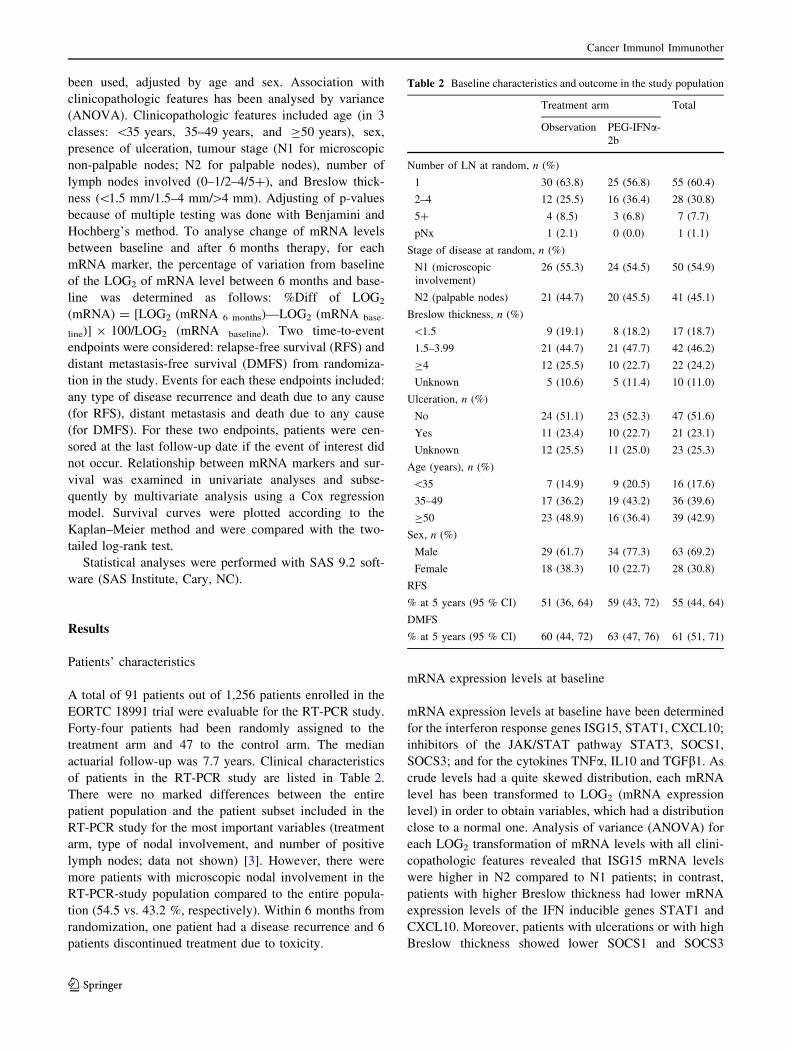
Table 2 Baseline characteristics and outcome in the study population
Treatment arm Total
Observation PEG-IFNa-
2b
Number of LN at random, n (%)
1 30 (63.8) 25 (56.8) 55 (60.4)
2–4 12 (25.5) 16 (36.4) 28 (30.8)
5? 4 (8.5) 3 (6.8) 7 (7.7)
pNx 1 (2.1) 0 (0.0) 1 (1.1)
Stage of disease at random, n (%)
N1 (microscopic
involvement)
26 (55.3) 24 (54.5) 50 (54.9)
N2 (palpable nodes) 21 (44.7) 20 (45.5) 41 (45.1)
Breslow thickness, n (%)
\1.5 9 (19.1) 8 (18.2) 17 (18.7)
1.5–3.99 21 (44.7) 21 (47.7) 42 (46.2)
C4 12 (25.5) 10 (22.7) 22 (24.2)
Unknown 5 (10.6) 5 (11.4) 10 (11.0)
Ulceration, n (%)
No 24 (51.1) 23 (52.3) 47 (51.6)
Yes 11 (23.4) 10 (22.7) 21 (23.1)
Unknown 12 (25.5) 11 (25.0) 23 (25.3)
Age (years), n (%)
\35 7 (14.9) 9 (20.5) 16 (17.6)
35–49 17 (36.2) 19 (43.2) 36 (39.6)
C50 23 (48.9) 16 (36.4) 39 (42.9)
Sex, n (%)
Male 29 (61.7) 34 (77.3) 63 (69.2)
Female 18 (38.3) 10 (22.7) 28 (30.8)
RFS
% at 5 years (95 % CI) 51 (36, 64) 59 (43, 72) 55 (44, 64)
DMFS
% at 5 years (95 % CI) 60 (44, 72) 63 (47, 76) 61 (51, 71)
Cancer Immunol Immunother
123

mRNA levels. IL10 mRNA levels decreased with age
(Fig. 1), but we did not see any influence of age or sex on
TGFb1 mRNA expression levels. However, after adjusting
p-values because of multiple testing, none of the associa-
tions remained significant.
Compared to 12 healthy controls (6 males, 6 females;
median age 36 years, age range 27–93 years), melanoma
patients showed significant higher TGFb1 mRNA levels
(P \ 0.0001) and lower IL10 mRNA levels (P = 0.023,
Fig. 2). After adjustment for multiple testing, this
remained only significant for TGFb1 mRNA levels
(P = 0.0005).
Prognostic impact of baseline mRNA levels
on outcome
None of the transformed mRNA expression levels at
baseline had influence on RFS and DMFS and RFS when
taken alone. However, as some of these variables were
correlated with initial clinical/disease features, a
Fig. 1 Boxplots showing the
association of the LOG2 of
mRNA levels with
clinicopathologic features. The
relative amount was calculated
as ratio marker [(pg/ml)/HMBS
(pg/ml)] and then LOG2-
transformed in order to obtain
variables which have a normal
distribution. Horizontal lineinside the boxes = median
values; upper and lowerboundaries of the boxes = first
and third quartiles of the
distribution; whiskers = mild
outliers, open dots outliers
Cancer Immunol Immunother
123

multivariate Cox model including not only basal log-
transformed mRNA levels but also stage, sex, Breslow
thickness, number of lymph nodes, and ulceration was set
up. In this multivariate model, increasing SOCS1 mRNA
levels and SOCS3 mRNA levels adjusted by the other
baseline factors were associated with worse RFS
(P = 0.02, Hazard Ratio [95 % CI] = 1.43 [1.07–1.91]
and P = 0.04, Hazard Ratio [95 % CI] = 1.27
[1.01–1.61], respectively) and DMFS (P = 0.05, Hazard
Ratio [95 % CI] = 1.35 [1–1.83] and P = 0.05, Hazard
Ratio [95 % CI] = 1.27 [1–1.62], respectively). This
influence is due to the negative correlation between,
respectively, SOCS1/SOCS3 mRNA levels and ulceration,
and Breslow thickness.
Impact of PEG-IFNa-2b therapy versus observation
on the change of mRNA expression levels
To analyse whether PEG-IFN therapy had any influence on
mRNA levels, mRNA levels have also been determined
after 6 months in PEG-IFNa-2b treated and untreated
patients. Data of 33 patients in the observation arm and 22
patients in the PEG-IFNa-2b arm were available. For each
mRNA marker, the percentage of variation from baseline
of the LOG2 (mRNA) expression level between 6 months
and baseline was determined.
Comparing the values of the PEG-IFNa-2b arm with
that of the observation arm by ANOVA showed a decrease
in IL10 mRNA levels (P = 0.029, not significant after
Fig. 2 Expression levels of IL10- and TGFb1-specific mRNA in
melanoma patients (n = 91) compared to healthy controls (n = 12).
The relative amount was calculated as ratio marker [(pg/ml)/HMBS
(pg/ml)] and then LOG2-transformed in order to obtain variables
which have a normal distribution. Dotted line indicates mean value:
LOG2 (TGFb1): -4.8 in melanoma patients versus -15.8 in healthy
controls; LOG2 (IL10): -16.2 in melanoma patients versus -14.9 in
healthy controls
Fig. 3 Change of ISG15- and IL10-specific mRNA in melanoma
patients after 6 months treatment with pegylated interferon a-2b
(PEG-IFNa-2b) compared to observation. The relative amount was
calculated as ratio marker [(pg/ml)/HMBS (pg/ml)] and then LOG2-
transformed in order to obtain variables, which have a normal
distribution. Differences are expressed as % variation from baseline
levels
Cancer Immunol Immunother
123
adjustment for multiple testing, Fig. 3); however, TGFb1
mRNA levels as well as TNFa mRNA levels remained
constant in both treatment groups. Moreover, we observed
no impact of PEG-IFNa-2b on mRNA levels of STAT or
SOCS proteins, nor on mRNA levels of the IFN inducible
gene CXCL10. However, mRNA levels of ISG15 surpris-
ingly decreased in the PEG-IFNa-2b arm (P = 0.0001,
after adjustment for multiple testing P = 0.001), Fig. 3).
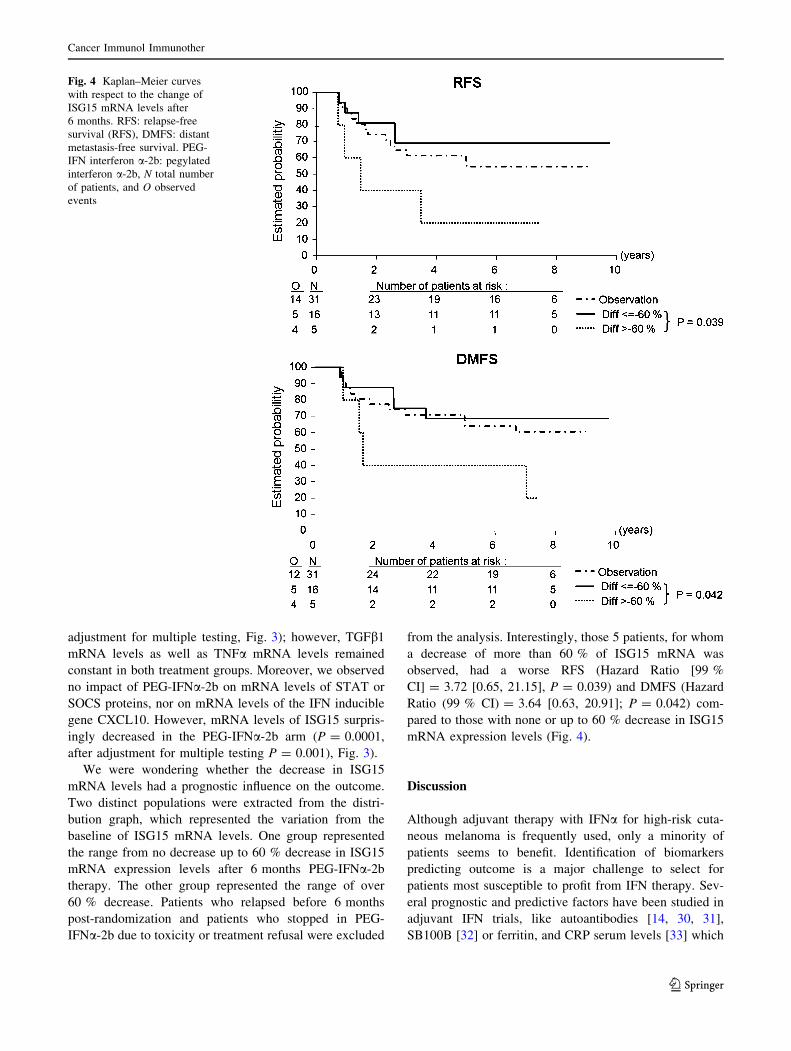
We were wondering whether the decrease in ISG15
mRNA levels had a prognostic influence on the outcome.
Two distinct populations were extracted from the distri-
bution graph, which represented the variation from the
baseline of ISG15 mRNA levels. One group represented
the range from no decrease up to 60 % decrease in ISG15
mRNA expression levels after 6 months PEG-IFNa-2b
therapy. The other group represented the range of over
60 % decrease. Patients who relapsed before 6 months
post-randomization and patients who stopped in PEG-
IFNa-2b due to toxicity or treatment refusal were excluded
from the analysis. Interestingly, those 5 patients, for whom
a decrease of more than 60 % of ISG15 mRNA was
observed, had a worse RFS (Hazard Ratio [99 %
CI] = 3.72 [0.65, 21.15], P = 0.039) and DMFS (Hazard
Ratio (99 % CI) = 3.64 [0.63, 20.91]; P = 0.042) com-
pared to those with none or up to 60 % decrease in ISG15
mRNA expression levels (Fig. 4).
Discussion
Although adjuvant therapy with IFNa for high-risk cuta-
neous melanoma is frequently used, only a minority of
patients seems to benefit. Identification of biomarkers
predicting outcome is a major challenge to select for
patients most susceptible to profit from IFN therapy. Sev-
eral prognostic and predictive factors have been studied in
adjuvant IFN trials, like autoantibodies [14, 30, 31],
SB100B [32] or ferritin, and CRP serum levels [33] which
Fig. 4 Kaplan–Meier curves
with respect to the change of
ISG15 mRNA levels after
6 months. RFS: relapse-free
survival (RFS), DMFS: distant
metastasis-free survival. PEG-
IFN interferon a-2b: pegylated
interferon a-2b, N total number
of patients, and O observed
events
Cancer Immunol Immunother
123

have at its best a prognostic value, but no predictive value
for IFN outcome. Here, we studied the prognostic and
predictive value of mRNA levels of interferon response
genes (ISG15, STAT1, CXCL10) of inhibitors of the JAK/
STAT pathway (STAT3, SOCS1, SOCS3) and of cytokines
(TNFa, IL10, TGFß1) in pB of stage III melanoma patients
receiving adjuvant PEG-IFNa-2b therapy within the EO-
RTC trial 18991 [3].
IFNa can act directly on tumour cells and vasculature,
but in melanoma, immunomodulatory properties may play
a more important role [21, 34]. Dysfunction of the immune
system arises already during the early stages of melanoma
and increases throughout progression to metastatic disease:
Low IL-2 and high IL-5 serum levels were observed in
stage III melanoma patients and Treg cell frequencies as
well as accumulation of non-mature DCs in lymph nodes
seem to increase with stage and tumour thickness,
respectively [35–37]. In accordance with those results, we
observed in our patient cohort of stage III melanoma
patients higher TGFb1 mRNA levels in pB compared to
healthy controls. However, differences in IL10 mRNA
expression levels between melanoma patients and healthy
controls were not significant, although we cannot exclude
subtle differences in mRNA expression levels as the cohort
of control samples was quite small.
We were wondering whether immune dysregulation is
related to tumour stage and outcome of IFNa therapy.
However, we found no association of mRNA levels of
immunosuppressive cytokines like TGFb1 or IL10 with
clinicopathological features like lymph node status, Bre-
slow thickness, or ulceration. Yurkovetsky et al. showed
that in melanoma patients treated with high-dose IFNa,
pre-treatment levels of the proinflammatory cytokines and
chemokines were significantly higher in high-risk patients
and that inflammatory cytokines positively correlate with
RFS [38]. STAT1, CXCL10, and ISG15 were reported to
be decreased in stage IV melanoma patients associated
with reduced pSTAT1 [16]. In our cohort of stage III
melanoma patients, we observed no difference in mRNA
levels of proinflammatory cytokines or ISGs compared to
healthy controls, but CXCL10 and STAT1 were negatively
associated with Breslow thickness, although not significant
after adjustment for multiple testing.
Recent studies have shown a high degree of (inter-
patient) variability in the activation of STAT1 [17] and
induction of ISGs [26–28]. This includes also the induction
of negative regulators of the immune response like SOCS1
and SOCS3, which have been shown to play a major role in
antitumour activity [21, 34]. In a multivariate model, when
other variables like ulceration and Breslow thickness were
taken into consideration, SOCS1 and SOCS3 mRNA levels
had a negative influence on RFS and DMFS. However,
they were not predictive factors. Expression of SOCS
proteins within immune effector cells may not only influ-
ence response to exogenous IFNa but also to endogenous
IFNa activity. Sustained SOCS1 and SOCS3 expressions
have been shown to play important roles in immune tol-
erance in a mice tumour model [39].
This influence of SOCS1/SOCS3 mRNA levels on RFS
and DMFS is due to their negative correlation with ulcer-
ation and Breslow thickness. As SOCS1/SOCS3 are
induced by IFN-a but also by various other inflammatory
cytokines in context of a negative feedback loop, their low
expression levels in blood cells of ulcerated and thick
melanomas might simply mirror a different cytokine
microenvironment [37]. Interestingly, it has been shown
that SOCS1 expression significantly downregulates
expression of VEGF, bFGF, and MMP-2 in melanoma cells
[40]. Downregulation of SOCS1/SOCS3 not only in
tumour cells but also in stromal and immune effector cells
may promote lymphovascular invasion and metastasis [40].
In vitro experiments have shown that high doses of
IFNa were able to overcome the signalling defects of T
cells of metastatic melanoma patients and were able to
induce effective polarization of dendritic cells [16].
Immunoregulatory effects associated with tumour regres-
sion have also been observed in vivo using the high-dose
regimen of IFNa-2b [15, 35, 38, 41] and were also linked
to restoration of impaired pSTAT1 signalling capacity as
shown by Simons et al in a small exploratory study
including 14 stage IIIB-C melanoma patients [42]: Patients,
who had a clinical response to high-dose IFN-a2b therapy,
showed a lower PBL interferon signalling capacity in T
cells at baseline than non-responders, but had a significant
increase in STAT1 activation in peripheral blood T cells
over the 4-week induction phase of neoadjuvant therapy.
Interestingly, only patients who displayed modest aug-
mentation had good clinical outcome; patients who had
minimal or negative changes in pSTAT1 response, but also
patients who had ‘‘hyper’’ IFN signalling responses had
poor outcome.
Although in our cohort, IL10 mRNA levels decreased
slightly after 6 months PEG-IFNa-2b therapy, elevated
TGFb1 mRNA levels did not. We also did not observe any
increase in mRNA levels of ISGs [27]. Surprisingly, we
rather detected a decrease in ISG15 mRNA levels after
6 months PEG-IFNa-2b therapy. mRNA levels of
CXCL10 or STAT1, which are early response genes, might
be only transiently induced and do not reach a steady-state
level over the treatment period as observed in PEG-IFNaand Ribaverin-treated Hepatitis C patients [27]. However,
the reason for the decrease of ISG15 is not clear, because
ISG15 induction is primarily triggered by type I IFNs.
ISG15 is an ubiquitin-like protein and modifier. ISG15
conjugation might promote degradation of targeted pro-
teins via a non-proteasomal pathway, but might also
Cancer Immunol Immunother
123

regulate enzymatic or DNA binding activity of target
proteins similar to other ubiquitin-like modifiers. Several
key regulators of signal transduction are targeted by ISG15.
Some of them are type I IFN-induced proteins, such as
PKR and RIG-I, others are key regulators that are involved
in IFN signalling, such as JAK1 and STAT1, implicating
the role of ISG15 and its conjugates in type I IFN-mediated
innate immune responses [43], that is, ISG15 enhances
IRF3 activity by ISGylation of IRF3 to prevent its ubiq-
uitylation and degradation [44] and mice with a massive
accumulation of ISG15 conjugates in various tissues,
exhibited a hypersensitivity to IFN stimulation [45].
Interestingly, patients with a decrease of more than 60 % of
ISG15 mRNA level compared to the respective ISG15
mRNA level at baseline had an inferior outcome. This is in
line with studies in Hepatitis C patients, reporting higher
levels of ISG15 in Kupffer cells of IFN responders [46].
However, our patient population was quite small; therefore,
it needs to be confirmed in further studies, if the course of
ISG15 mRNA levels in fact is a predictive factor.
In conclusion, melanoma stage III patients had an
immunosuppressive phenotype characterized by signifi-
cantly higher TGFb1 mRNA levels in peripheral blood.
Adjuvant PEG-IFN-a therapy did not resolve this immu-
nosuppressive phenotype. High SOCS1 and SOCS3 mRNA
expression levels were negatively associated with ulcera-
tion and Breslow index and had a significantly negative
prognostic influence on RFS and DMFS in a multivariate
COX model. Moreover, our results indicate that the course
of ISG15 mRNA levels during PEG-IFNa-2b therapy
might be of potential value to predict outcome; however,
this needs to be confirmed in larger studies.
Acknowledgments This study was supported by Sonnenfeld Stif-
tung from Germany, Berliner Krebsgesellschaft from Germany, and
Fonds Cancer (FOCA) from Belgium.
Conflict of interest The authors declare that they have no conflict
of interest.
References
1. Wheatley K, Ives N, Hancock B, Gore M, Eggermont A, Suciu S
(2003) Does adjuvant interferon-alpha for high-risk melanoma
provide a worthwhile benefit? A meta-analysis of the randomised
trials. Cancer Treat Rev 29(4):241–252
2. Kirkwood JM, Manola J, Ibrahim J, Sondak V, Ernstoff MS, Rao
U (2004) A pooled analysis of eastern cooperative oncology
group and intergroup trials of adjuvant high-dose interferon for
melanoma. Clin Cancer Res 10(5):1670–1677
3. Eggermont AM, Suciu S, Santinami M, Testori A, Kruit WH,
Marsden J, Punt CJ, Sales F, Gore M, Mackie R, Kusic Z,
Dummer R, Hauschild A, Musat E, Spatz A, Keilholz U (2008)
Adjuvant therapy with pegylated interferon alfa-2b versus
observation alone in resected stage III melanoma: final results of
EORTC 18991, a randomised phase III trial. Lancet 372(9633):
117–126
4. Anaya DA, Xing Y, Feng L, Huang X, Camacho LH, Ross MI,
Gershenwald JE, Lee JE, Mansfield PF, Cormier JN (2008)
Adjuvant high-dose interferon for cutaneous melanoma is most
beneficial for patients with early stage III disease. Cancer
112(9):2030–2037
5. Eggermont AM, Suciu S, MacKie R, Ruka W, Testori A, Kruit
W, Punt CJ, Delauney M, Sales F, Groenewegen G, Ruiter DJ,
Jagiello I, Stoitchkov K, Keilholz U, Lienard D (2005) Post-
surgery adjuvant therapy with intermediate doses of interferon
alfa 2b versus observation in patients with stage IIb/III melanoma
(EORTC 18952): randomised controlled trial. Lancet 366(9492):
1189–1196
6. Eggermont AM, Suciu S, Testori A, Kruit WH, Marsden J, Punt
CJ, Santinami M, Sales F, Schadendorf D, Patel P, Dummer R,
Robert C, Keilholz U, Yver A, Spatz A (2012) Ulceration and
stage are predictive of interferon efficacy in melanoma: results of
the phase III adjuvant trials EORTC 18952 and EORTC 18991.
Eur J Cancer 48(2):218–225
7. McMasters KM, Edwards MJ, Ross MI, Reintgen DS, Martin RC,
2nd, Urist MM, Noyes RD, Sussman JJ, Stromberg AJ, Scoggins
CR (2010) Ulceration as a predictive marker for response to
adjuvant interferon therapy in melanoma. Ann Surg 252(3):
460–465; discussion 465–466
8. Wheatley KIN, Eggermont A (2007) Interferon-a as adjuvant
therapy for melanoma: an individual patient data meta-analysis of
randomised trials. ASCO Annual Meeting Proceedings Part 1.
J Clin Oncol 25(suppl 18S):abstract 8526
9. Ferrantini M, Capone I, Belardelli F (2007) Interferon-alpha and
cancer: mechanisms of action and new perspectives of clinical
use. Biochimie 89(6–7):884–893
10. Lesinski GB, Anghelina M, Zimmerer J, Bakalakos T, Badgwell
B, Parihar R, Hu Y, Becknell B, Abood G, Chaudhury AR,
Magro C, Durbin J, Carson WE 3rd (2003) The antitumor effects
of IFN-alpha are abrogated in a STAT1-deficient mouse. J Clin
Investig 112(2):170–180
11. Badgwell B, Lesinski GB, Magro C, Abood G, Skaf A, Carson W
3rd (2004) The antitumor effects of interferon-alpha are main-
tained in mice challenged with a STAT1-deficient murine mela-
noma cell line. J Surg Res 116(1):129–136
12. Astsaturov I, Petrella T, Bagriacik EU, de Benedette M, Uger R,
Lumber G, Berinstein N, Elias I, Iscoe N, Hammond C, Hamilton
P, Spaner DE (2003) Amplification of virus-induced antimel-
anoma T-cell reactivity by high-dose interferon-alpha2b: impli-
cations for cancer vaccines. Clin Cancer Res 9(12):4347–4355
13. Ascierto PA, Kirkwood JM (2008) Adjuvant therapy of melanoma
with interferon: lessons of the past decade. J Transl Med 6:62
14. Gogas H, Ioannovich J, Dafni U, Stavropoulou-Giokas C, Frangia
K, Tsoutsos D, Panagiotou P, Polyzos A, Papadopoulos O,
Stratigos A, Markopoulos C, Bafaloukos D, Pectasides D,
Fountzilas G, Kirkwood JM (2006) Prognostic significance of
autoimmunity during treatment of melanoma with interferon.
N Engl J Med 354(7):709–718
15. Moschos SJ, Edington HD, Land SR, Rao UN, Jukic D, Shipe-
Spotloe J, Kirkwood JM (2006) Neoadjuvant treatment of
regional stage IIIB melanoma with high-dose interferon alfa-2b
induces objective tumor regression in association with modula-
tion of tumor infiltrating host cellular immune responses. J Clin
Oncol 24(19):3164–3171
16. Critchley-Thorne RJ, Yan N, Nacu S, Weber J, Holmes SP, Lee
PP (2007) Down-regulation of the interferon signaling pathway in
T lymphocytes from patients with metastatic melanoma. PLoS
Med 4(5):e176
17. Lesinski GB, Kondadasula SV, Crespin T, Shen L, Kendra K,
Walker M, Carson WE 3rd (2004) Multiparametric flow
Cancer Immunol Immunother
123

cytometric analysis of inter-patient variation in STAT1 phos-
phorylation following interferon Alfa immunotherapy. J Natl
Cancer Inst 96(17):1331–1342
18. Schindler C, Plumlee C (2008) Inteferons pen the JAK-STAT
pathway. Semin Cell Dev Biol 19(4):311–318
19. Theofilopoulos AN, Baccala R, Beutler B, Kono DH (2005) Type
I interferons (alpha/beta) in immunity and autoimmunity. Annu
Rev Immunol 23:307–336
20. Dalpke A, Heeg K, Bartz H, Baetz A (2008) Regulation of innate
immunity by suppressor of cytokine signaling (SOCS) proteins.
Immunobiology 213(3–4):225–235
21. Zimmerer JM, Lesinski GB, Kondadasula SV, Karpa VI, Lehman
A, Raychaudhury A, Becknell B, Carson WE 3rd (2007) IFN-
alpha-induced signal transduction, gene expression, and antitu-
mor activity of immune effector cells are negatively regulated by
suppressor of cytokine signaling proteins. J Immunol 178(8):
4832–4845
22. Ito S, Ansari P, Sakatsume M, Dickensheets H, Vazquez N,
Donnelly RP, Larner AC, Finbloom DS (1999) Interleukin-10
inhibits expression of both interferon alpha- and interferon
gamma- induced genes by suppressing tyrosine phosphorylation
of STAT1. Blood 93(5):1456–1463
23. Cassatella MA, Gasperini S, Bovolenta C, Calzetti F, Vollebregt
M, Scapini P, Marchi M, Suzuki R, Suzuki A, Yoshimura A
(1999) Interleukin-10 (IL-10) selectively enhances CIS3/SOCS3
mRNA expression in human neutrophils: evidence for an IL-10-
induced pathway that is independent of STAT protein activation.
Blood 94(8):2880–2889
24. Park IK, Shultz LD, Letterio JJ, Gorham JD (2005) TGF-beta1
inhibits T-bet induction by IFN-gamma in murine CD4 ? T cells
through the protein tyrosine phosphatase Src homology region 2
domain-containing phosphatase-1. J Immunol 175(9):5666–5674
25. Fox SW, Haque SJ, Lovibond AC, Chambers TJ (2003) The
possible role of TGF-beta-induced suppressors of cytokine sig-
naling expression in osteoclast/macrophage lineage commitment
in vitro. J Immunol 170(7):3679–3687
26. Brassard DL, Delorenzo MM, Cox S, Leaman DW, Sun Y, Ding
W, Gavor S, Spond J, Goodsaid F, Bordens R, Grace MJ (2004)
Regulation of gene expression by pegylated IFN-alpha2b and
IFN-alpha2b in human peripheral blood mononuclear cells.
J Interferon Cytokine Res 24(8):455–469
27. Taylor MW, Tsukahara T, Brodsky L, Schaley J, Sanda C, Ste-
phens MJ, McClintick JN, Edenberg HJ, Li L, Tavis JE, Howell
C, Belle SH (2007) Changes in gene expression during pegylated
interferon and ribavirin therapy of chronic hepatitis C virus dis-
tinguish responders from nonresponders to antiviral therapy.
J Virol 81(7):3391–3401
28. Zimmerer JM, Lehman AM, Ruppert AS, Noble CW, Olencki T,
Walker MJ, Kendra K, Carson WE 3rd (2008) IFN-alpha-2b-
induced signal transduction and gene regulation in patient
peripheral blood mononuclear cells is not enhanced by a dose
increase from 5 to 10 mega units/m2. Clin Cancer Res 14(5):
1438–1445
29. Keilholz U, Goldin-Lang P, Bechrakis NE, Max N, Letsch A,
Schmittel A, Scheibenbogen C, Heufelder K, Eggermont A, Thiel
E (2004) Quantitative detection of circulating tumor cells in
cutaneous and ocular melanoma and quality assessment by real-
time reverse transcriptase-polymerase chain reaction. Clin Cancer
Res 10(5):1605–1612
30. Bouwhuis MG, Suciu S, Collette S, Aamdal S, Kruit WH, Bas-
tholt L, Stierner U, Sales F, Patel P, Punt CJ, Hernberg M, Spatz
A, ten Hagen TL, Hansson J, Eggermont AM (2009) Autoim-
mune antibodies and recurrence-free interval in melanoma
patients treated with adjuvant interferon. J Natl Cancer Inst
101(12):869–877
31. Bouwhuis MG, Suciu S, Testori A, Kruit WH, Sales F, Patel P,
Punt CJ, Santinami M, Spatz A, Ten Hagen TL, Eggermont AM
(2010) Phase III trial comparing adjuvant treatment with pegy-
lated interferon Alfa-2b versus observation: prognostic signifi-
cance of autoantibodies–EORTC 18991. J Clin Oncol 28(14):
2460–2466
32. Bouwhuis MG, Suciu S, Kruit W, Sales F, Stoitchkov K, Patel P,
Cocquyt V, Thomas J, Lienard D, Eggermont AM, Ghanem G
(2011) Prognostic value of serial blood S100B determinations in
stage IIB-III melanoma patients: a corollary study to EORTC trial
18952. Eur J Cancer 47(3):361–368
33. Bouwhuis MG, Collette S, Suciu S, de Groot ER, Kruit WH, Ten
Hagen TL, Aarden LA, Eggermont AM, Swaak AJ (2011)
Changes of ferritin and CRP levels in melanoma patients treated
with adjuvant interferon-alpha (EORTC 18952) and prognostic
value on treatment outcome. Melanoma Res 21(4):344–351
34. Guenterberg KD, Lesinski GB, Mundy-Bosse BL, Karpa VI,
Jaime-Ramirez AC, Wei L, Carson WE 3rd (2011) Enhanced
anti-tumor activity of interferon-alpha in SOCS1-deficient mice is
mediated by CD4(?) and CD8(?) T cells. Cancer Immunol
Immunother 60(9):1281–1288
35. Ascierto PA, Napolitano M, Celentano E, Simeone E, Gentilcore
G, Daponte A, Capone M, Caraco C, Calemma R, Beneduce G,
Cerrone M, De Rosa V, Palmieri G, Castello G, Kirkwood JM,
Marincola FM, Mozzillo N (2010) Regulatory T cell frequency in
patients with melanoma with different disease stage and course,
and modulating effects of high-dose interferon-alpha 2b treat-
ment. J Transl Med 8:76
36. Cesana GC, DeRaffele G, Cohen S, Moroziewicz D, Mitcham J,
Stoutenburg J, Cheung K, Hesdorffer C, Kim-Schulze S, Kauf-
man HL (2006) Characterization of CD4 ? CD25 ? regulatory
T cells in patients treated with high-dose interleukin-2 for met-
astatic melanoma or renal cell carcinoma. J Clin Oncol 24(7):
1169–1177
37. Elliott B, Scolyer RA, Suciu S, Lebecque S, Rimoldi D, Gugerli
O, Musat E, Sharma RN, Lienard D, Keilholz U, Testori A,
Eggermont A, MacKie R, Robert C, Cook M, Thompson JF,
Angevin E, Spatz A (2007) Long-term protective effect of mature
DC-LAMP ? dendritic cell accumulation in sentinel lymph
nodes containing micrometastatic melanoma. Clin Cancer Res
13(13):3825–3830
38. Yurkovetsky ZR, Kirkwood JM, Edington HD, Marrangoni AM,
Velikokhatnaya L, Winans MT, Gorelik E, Lokshin AE (2007)
Multiplex analysis of serum cytokines in melanoma patients
treated with interferon-alpha2b. Clin Cancer Res 13(8):
2422–2428
39. Worschech A, Kmieciak M, Knutson KL, Bear HD, Szalay AA,
Wang E, Marincola FM, Manjili MH (2008) Signatures associ-
ated with rejection or recurrence in HER-2/neu-positive mam-
mary tumors. Cancer Res 68(7):2436–2446
40. Huang FJ, Steeg PS, Price JE, Chiu WT, Chou PC, Xie K,
Sawaya R, Huang S (2008) Molecular basis for the critical role of
suppressor of cytokine signaling-1 in melanoma brain metastasis.
Cancer Res 68(23):9634–9642
41. Gogas H, Paterakis G, Frangia K, Bafaloukos D, Pectasides D,
Kalofonos HP, Loukopoulos D, Stavropoulou-Giokas C, Ioan-
novich J, Mihm MC Jr (2002) Lymphocyte subpopulations and
interleukin levels in high-risk melanoma patients treated with
high-dose interferon A-2B. Am J Clin Oncol 25(6):591–596
42. Simons DL, Lee G, Kirkwood JM, Lee PP (2011) Interferon
signaling patterns in peripheral blood lymphocytes may predict
clinical outcome after high-dose interferon therapy in melanoma
patients. J Transl Med 5(9):52–60
43. Malakhov MP, Kim KI, Malakhova OA, Jacobs BS, Borden EC,
Zhang DE (2003) High-throughput immunoblotting. Ubiquitin-
Cancer Immunol Immunother
123

like protein ISG15 modifies key regulators of signal transduction.
J Biol Chem 278(19):16608–16613
44. Shi HX, Yang K, Liu X, Liu XY, Wei B, Shan YF, Zhu LH,
Wang C (2010) Positive regulation of interferon regulatory factor
3 activation by Herc5 via ISG15 modification. Mol Cell Biol
30(10):2424–2436
45. Malakhova OA, Yan M, Malakhov MP, Yuan Y, Ritchie KJ, Kim
KI, Peterson LF, Shuai K, Zhang DE (2003) Protein ISGylation
modulates the JAK-STAT signaling pathway. Genes Dev 17(4):
455–460
46. Chen L, Borozan I, Sun J, Guindi M, Fischer S, Feld J, Anand N,
Heathcote J, Edwards AM, McGilvray ID (2010) Cell-type spe-
cific gene expression signature in liver underlies response to
interferon therapy in chronic hepatitis C infection. Gastroenter-
ology 138(3):1123–1133, e1121–e1123
Cancer Immunol Immunother
123
Related Documents


