ANALYSIS OF MILK VALUE CHAIN: THE CASE OF ADA’A DAIRY COOPERATIVE IN ADA’A DISTRICT, EAST SHAWA ZONE OF OROMIA REGIONAL STATE, ETHIOPIA Professional Master Thesis A research Project submitted to the van Hall Larenstein University of applied Science In Partial fulfilment of the requirements for the Master Degree in Agricultural Production Chain Management with Specialization in Livestock Chain By Girma Debele September 2012

Welcome message from author
This document is posted to help you gain knowledge. Please leave a comment to let me know what you think about it! Share it to your friends and learn new things together.
Transcript

ANALYSIS OF MILK VALUE CHAIN: THE CASE OF ADA’A DAIRY COOPERATIVE IN ADA’A DISTRICT, EAST SHAWA ZONE OF OROMIA REGIONAL STATE, ETHIOPIA
Professional Master Thesis
A research Project submitted to the van Hall Larenstein University of applied Science
In Partial fulfilment of the requirements for the Master Degree in Agricultural Production
Chain Management with Specialization in Livestock Chain
By
Girma Debele
September 2012

i
Acknowledgement Frist of all my deepest thanks goes to almighty God for enabling me through strength, knowledge and courage during my stay in the Netherlands-an experience that I thought would be impossible before and a dream come true in my life. I am very grateful to the Royal Netherlands Government through the Netherlands Fellowship programme (NFP) for offering me this golden opportunity to pursue postgraduate studies in Agricultural Production Chain Management (APCM) specializing in Livestock chain and Van Hall Larenstein administration for the on time communication to ensure that the scholarship is processed. Special thanks to my supervisor to Mr. Marco Verschuur co-ordinator of professional Master programme Agricultural production chain management (APCM) and Co-ordinator of APCM specialisation Livestock Chains for his tireless efforts for valuable comments and guidance throughout my the study period. I would like also to express my deep appreciation to all lecturers and staffs for their immense contribution to knowledge, valuable support provided during my study at Van Hall Larenstein University of Applied science. My appreciation goes to fellow students in professional Master at Van Hall Larenstein Especially colleagues in livestock production chain management (LPC) at Van Hall for their encouragement during the preparation of thesis. Last but not least, my family back home especially my wife Elisabeth Tadesse Balcha and daughter Fenet Girma you endured the pain of staying without me throughout my study period and to all who in one way or another contributed to my study, May God bless you abundantly. Glory is to God.

ii
Dedication This research work is dedicated for my beloved wife Elisabeth Tadesse Balcha for her endurance shown in my absence, I love you and our child Feni.
iii
Table of contents Acknowledgement .......................................................................................................................................... i
Dedication ....................................................................................................................................................... ii
List of photos .................................................................................................................................................. v
List of Figures ................................................................................................................................................ v
List of Tables ................................................................................................................................................. vi
Abstract ........................................................................................................................................................ viii
CHAPTER ONE: INTRODUCTION ............................................................................................................1
1.1. Background information ...............................................................................................................1
1.2. Problem statement ........................................................................................................................2
1.3. Research objective........................................................................................................................2
1.4. Research questions ......................................................................................................................2
1.5. Scope and significance of the study ...........................................................................................3
CHAPTER TWO: CONCEPT OF MILK VALUE CHAIN ........................................................................4
2.1. Conceptual frame work ................................................................................................................4
2.2.1. Definition of terms .................................................................................................................5
2.2.2. Profit margins of chain actors ..............................................................................................6
2.2.3. Information and cash flow ....................................................................................................7
2.3. Milk production potential of Ethiopia and Ada’a district ...........................................................7
2.4. Milk marketing channel of the study area ..................................................................................9
2.5. Role of dairy cooperative .............................................................................................................9
2.6. Benefit of formal and informal milk marketing channels..........................................................9
2.7. Factors affecting milk production and marketing ................................................................... 10
2.8. Milk Collectors, transporters and processers ......................................................................... 10
2.9. Demand for milk and milk products in Ethiopia ..................................................................... 10
2.9.1. Milk and milk product consumption in urban areas ....................................................... 11
2.9.2. Milk and milk product consumption in rural areas ......................................................... 11
2.10. Milk quality control measures ............................................................................................... 11
CHAPTER THREE: RESEARD DESIGN AND METHODOLOGY ..................................................... 12
3.1. Description of the study areas ...................................................................................................... 12
3.2. Type of research ............................................................................................................................. 14
3.3. Study design and strategy ............................................................................................................. 14
3.4. Sample size and sampling procedures ....................................................................................... 15
3.5. Method of data collection .............................................................................................................. 16
iv
3.5.1. Desk study ................................................................................................................................ 16
3.5.2. Case study ............................................................................................................................... 16
3.5.3. Survey ....................................................................................................................................... 17
3.6. Method of data analysis................................................................................................................. 18
3.7. Limitation of the study .................................................................................................................... 18
CHAPTER FOUR ....................................................................................................................................... 19
4.1. Milk value chain analysis ............................................................................................................... 19
4.1.1. Milk chain map ......................................................................................................................... 19
4.1.2. Dairy cooperative and its role in milk value chain .............................................................. 20
4.1.3. Milk chain supporters and their roles in milk value chain .................................................. 27
4.1.4. Competitors of Ada’a dairy cooperative .............................................................................. 30
4.2. Dairy producers in Ada’a district .................................................................................................. 33
4.2.1. Demographic characteristics of dairy producers ................................................................ 33
4.2.2. Quantity of milk produced, consumed and sold by smallholder farmers ....................... 35
4.2.3. Dairy activities and source of animals feeds ...................................................................... 37
4.2.4.Factors and actors affecting milk supply to Ada’a dairy cooperative ............................... 39
4.2.5. Major constriants of milk value chain in the study area..................................................... 40
4.3. Actors’ shares in formal and informal milk value chain ............................................................ 41
4.4. SWOT analysis of Ada’ a dairy cooperative ............................................................................... 45
CHAPTER FIVE: DISCUSSION .............................................................................................................. 46
5.1. Inputs providers .............................................................................................................................. 46
5.3. Milk production ................................................................................................................................ 46
5.4. Milk marketing channels ................................................................................................................ 47
5.5. Function of Ada’a dairy cooperative in milk value chain .......................................................... 48
5.6. Factors affecting volume of milk procurment by Ada’a dairy cooperative ................................. 48
5.6.1. Side selling ............................................................................................................................... 48
5.6.2. Reduction in volume of milk production ............................................................................... 49
5.6.3. Production cost ........................................................................................................................ 49
5.6.4. Miss trust .................................................................................................................................. 49
5.6.5. Competitors .............................................................................................................................. 50
CHAPTER SIX: CONCLUSION AND RECOMMENDATION .............................................................. 51
6.1.Conclusion ........................................................................................................................................ 51
6.2. Recommendation ........................................................................................................................... 53
REFERENCES ........................................................................................................................................... 54

v
ANNEXES ................................................................................................................................................... 58
Annex 1: Questionnaire survey for smallholders’ dairy farmers. ........................................................ 58
Annex 2: check list for interviewing of Chain Supporters, Influencers’ and Competitors ................ 61
Annex 3: Result of Chi-Square Tests ...................................................................................................... 65
List of photos
Photo 1: Interview made with the General Manager of Ada’a Dairy Cooperative ............................ 21
Photo 2: Indicate milk collection and transportation to dairy plant ..................................................... 24
Photo 3: Sample of processed dairy product by Ada’a dairy cooperative ......................................... 25
Photo 4: Indicate testing of milk with lactometer and alcohol test at collection centres .................. 26
Photo 5: Indicated retailing of processed products at Addis Ababa city. .......................................... 27
Photo 6: Interview made with Ada’a district livestock development and health officer ................... 27
Photo 7: Indicate interview made with farm Manager of Genesis Farm ............................................ 30
Photo 8: Indicate cross breed dairy cow currently exist in Genesis farm at Debrezeit ................... 31
Photo 9: Indicate different dairy products produced by Genesis farm ............................................... 31
Photo 10: Indicate different processed dairy products processed by Holland dairy ........................ 32
Photo 11: Indicate marketing of crop residues for animal feeds ........................................................ 38
Photo 12: Indicate interviewed made with dairy farmers in rural and urban area .......................... 39
List of Figures
Figure 1: Formal and informal milk chain map .........................................................................................4
Figure 2: Milk production and allocation for different purpose in Ethiopia............................................8
Figure 3: Map of the stud area ................................................................................................................. 12
Figure 4: Land using pattern of the study district .................................................................................. 13
Figure 5: Livestock population of Ada’a district in the year of 2011/2012 ......................................... 13
Figure 6: Study design and strategy used to conduct milk value chain in the study area .............. 14
Figure 7: Show sampling size and sampling procedures used for survey and case study ............ 15
Figure 8: Formal milk Chain Map ............................................................................................................. 19
Figure 9: Informal Milk Chain Map ........................................................................................................... 20
Figure 10: Volume of milk collected at each collection centres per day (litres) ................................ 23
Figure 11: Volume of milk collected by Ada’a dairy cooperative in each month in 2011/12 .......... 23
Figure 12: Indicate different actors’ linkage with the members of Ada’a dairy cooperative............ 28
Figure 13: Sex of interviewed farmers at study area ............................................................................ 34
Figure 14: Educational back ground of the interviewed farmers......................................................... 35
Figure 15: Indicate utilization of smallholder in Ada’a district ............................................................ 37
Figure 16: Indicate milk marketing in urban and rural area. ................................................................ 39
Figure 17: Indicate milk marketing channel of members and non mebers ...................................... 40
Figure 18: Indicate core constraints in milk value chain in the study area ........................................ 41
Figure 19: Indicate formal and Informal milk value shares ................................................................. 44

vi
List of Tables Table 1: List of different stakeholders interviewed during field study period .................................... 16
Table 2: Indicate members of Ada’a dairy cooperative at each collection centres. ......................... 22
Table 3: Volume of milk collected per day by Ada’a dairy cooperative from (2008-2012).............. 22
Table 4: Indicate amount of milk processed and marketing by Ada’a dairy cooperative ................ 25
Table 5: Indicate the role of different actors in milk value chain ......................................................... 29
Table 6: Average volume of milk collected/day by Genesis farm from (2008-2012) ....................... 30
Table 7: Comparison of purchasing and selling prices of different dairy products .......................... 33
Table 8: Indicate age distribution of interviewed farmers in study area. ........................................... 33
Table 9: Indicate type of religion of the interviewed farmers in the study area ................................ 34
Table 10: Average milk production and consumption by small holder farmers/day ........................ 36
Table 11: Indicate labour division of sampled farmers in milk value chain analysis ........................ 38
Table 12: Indicate profit/loss of dairy farmers in urban area per cow per year ................................ 42
Table 13: Variable cost of dairy cooperative incurred to collect and processing milk per day ....... 43
Table 14: Indicate value share of dairy cooperative in milk value chain/ litre of milk. ..................... 43
Table 15: Indicate value share of private milk processor and other actors/ litre of milk. ................ 43
Table 16: Indicate value share of producers involved in informal milk marketing channel ............. 44
Table 17: Value share of smallscale dairy farmers sell of their raw milk to local consumers ....... 44
Table 18: Indicate date of fasting period of Ethiopian Orthodox church ............................................ 47
vii
Lists of Acronyms
AI Artificial Insemination
CSA Central statistical Agency
DDE Dairy Development Enterprise
ETB Ethiopian Birr
FAO Food and Agricultural Organization
GDP Gross Domestic Product
ILRI International Livestock Research Institute
MCC Milk Collection Center
MOA Ministry Of Agriculture
NGO Non- Governmental Organization
PASDEP Plan for Accelerated and Sustained Development to End Poverty
SPSS Statistical Package for social science
UNIDO United Nations Industrial Development Organization
VCA Value Chain Analysis
viii
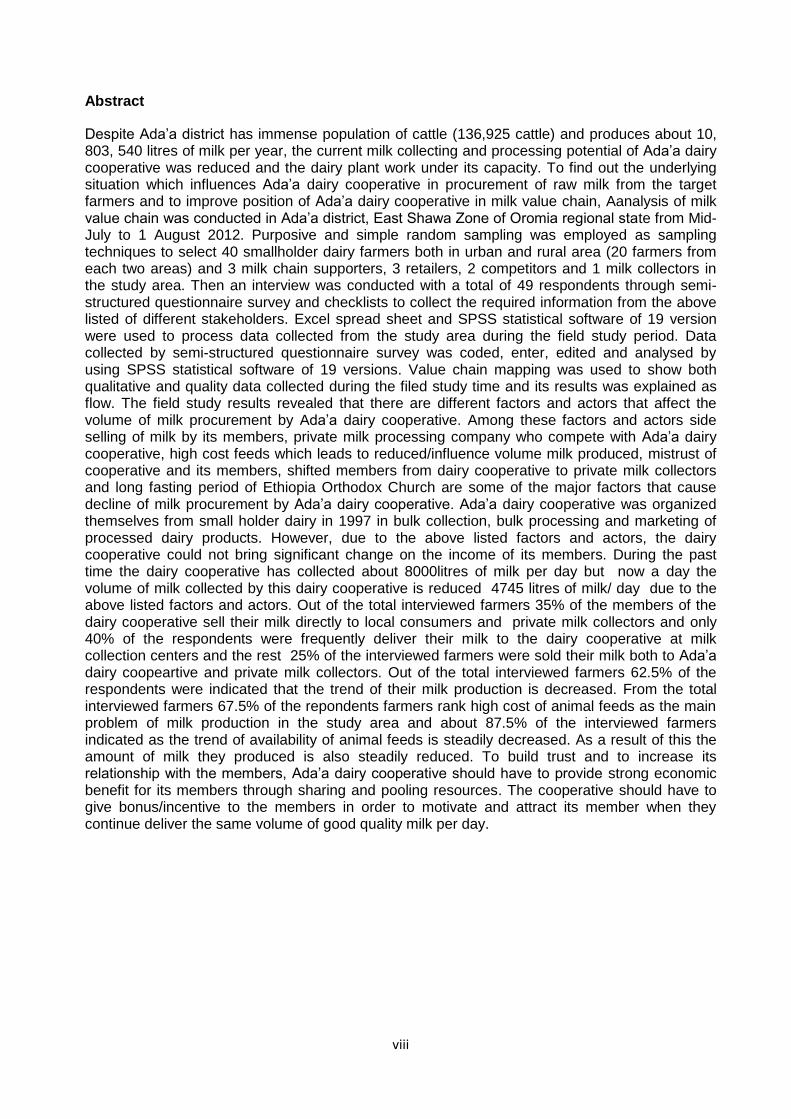
Abstract
Despite Ada’a district has immense population of cattle (136,925 cattle) and produces about 10, 803, 540 litres of milk per year, the current milk collecting and processing potential of Ada’a dairy cooperative was reduced and the dairy plant work under its capacity. To find out the underlying situation which influences Ada’a dairy cooperative in procurement of raw milk from the target farmers and to improve position of Ada’a dairy cooperative in milk value chain, Aanalysis of milk value chain was conducted in Ada’a district, East Shawa Zone of Oromia regional state from Mid-July to 1 August 2012. Purposive and simple random sampling was employed as sampling techniques to select 40 smallholder dairy farmers both in urban and rural area (20 farmers from each two areas) and 3 milk chain supporters, 3 retailers, 2 competitors and 1 milk collectors in the study area. Then an interview was conducted with a total of 49 respondents through semi-structured questionnaire survey and checklists to collect the required information from the above listed of different stakeholders. Excel spread sheet and SPSS statistical software of 19 version were used to process data collected from the study area during the field study period. Data collected by semi-structured questionnaire survey was coded, enter, edited and analysed by using SPSS statistical software of 19 versions. Value chain mapping was used to show both qualitative and quality data collected during the filed study time and its results was explained as flow. The field study results revealed that there are different factors and actors that affect the volume of milk procurement by Ada’a dairy cooperative. Among these factors and actors side selling of milk by its members, private milk processing company who compete with Ada’a dairy cooperative, high cost feeds which leads to reduced/influence volume milk produced, mistrust of cooperative and its members, shifted members from dairy cooperative to private milk collectors and long fasting period of Ethiopia Orthodox Church are some of the major factors that cause decline of milk procurement by Ada’a dairy cooperative. Ada’a dairy cooperative was organized themselves from small holder dairy in 1997 in bulk collection, bulk processing and marketing of processed dairy products. However, due to the above listed factors and actors, the dairy cooperative could not bring significant change on the income of its members. During the past time the dairy cooperative has collected about 8000litres of milk per day but now a day the volume of milk collected by this dairy cooperative is reduced 4745 litres of milk/ day due to the above listed factors and actors. Out of the total interviewed farmers 35% of the members of the dairy cooperative sell their milk directly to local consumers and private milk collectors and only 40% of the respondents were frequently deliver their milk to the dairy cooperative at milk collection centers and the rest 25% of the interviewed farmers were sold their milk both to Ada’a dairy coopeartive and private milk collectors. Out of the total interviewed farmers 62.5% of the respondents were indicated that the trend of their milk production is decreased. From the total interviewed farmers 67.5% of the repondents farmers rank high cost of animal feeds as the main problem of milk production in the study area and about 87.5% of the interviewed farmers indicated as the trend of availability of animal feeds is steadily decreased. As a result of this the amount of milk they produced is also steadily reduced. To build trust and to increase its relationship with the members, Ada’a dairy cooperative should have to provide strong economic benefit for its members through sharing and pooling resources. The cooperative should have to give bonus/incentive to the members in order to motivate and attract its member when they continue deliver the same volume of good quality milk per day.

1
CHAPTER ONE: INTRODUCTION 1.1. Background information Agriculture is the basis of Ethiopia’s economy and is the most important economic sector in terms of generation of foreign currency. The sector is the primary sources for livelihood for more than 85%of Ethiopian rural households who practice subsistence crop and livestock production (MOARD, 2005). The significance of agriculture to Ethiopian economy arises from the facts that it contributed to 45.9% GDP, more than 88% export and about 85% employment (CSA, 2008).
The livestock sub sectors play vital roles as sources of food, income and foreign exchange to Ethiopia economy and contribute about 12 and 33% of the total and agricultural GDP respectively. Ethiopia holds the largest livestock population in Africa estimated about 63.1million head of cattle, 23.6 million of sheep, 16 Millions goats (CSA, 2008). Livestock and their products are estimated to compose a third of total value of agricultural gross output in developing countries and this share is rising from time to time (CSA, 2008).
The total annual national milk production in Ethiopia from about 10 million milking cows is estimated about 3.2 billion litres, which is 1.54liters/cow on average (CSA, 2008). The dairy value chain entailed about 500,000 smallholder rural farmers who produce about 1,130 million litres of milk of which 370 million litres of raw milk, 280 million litres of butter and cheese and 165 million litres is consumed by the calves (Mohammed, 2009). The remaining 315 million litres was marketed through both informal and formal retailers through cooperatives and farmers’ organizations.
The promotion of dairy product marketing through cooperative as a means of linking smallholders to market is a key pillar of Ethiopia’s rural development strategy (PASDEP, 2010). Cooperatives can be expected to help the smallholders to increase market access and so help them to increase their wealth. In1997 thirty four farmers established Ada’a dairy cooperative in Ada’a district East Shawa Zone of Oromia regional state for marketing of dairy products (Hiller, 2003). Despite Ada’a district has immense population of cattle (136925 cattle) and produces about 10 803, 540 litres of milk per year, the current milk collecting and processing potential of Ada’a dairy cooperative found in this district was reduced and the dairy plant work under its efficiency.
The idea of starting this dairy cooperative became more feasible; the founding members bought cross-bred cows to produce more milk that could be sold through the cooperative. The impact of the dairy cooperative and initial assets on the accumulation of dairy stock the cooperative aims to reduce transaction costs and increase market access by providing the smallholders with better supply canals (physical and institutional), fixed prices, information and other services that facilitate the process of higher dairy production (Hiller, 2003).
Dairy cooperatives can reduce the risk of price variability by offering information and other means to access the market. They can play a role in distributing the public knowledge and technology to the smallholders in a more efficient way and function as a source of knowledge and technology itself (Hiller, 2003). Commonly farmers in the cooperative have the benefit of assured supplies of the right inputs at the right time, credit against output deliveries, and an assured market for the output at a price that is not always known in advance, but applied equally to all farmers in given location and time period. Cooperatives by providing bulking and bargaining services, increase outlet market access and help farmers avoid the hazards of being encumbered with perishable milk with no rural demand (Holloway, 2000). According to Francesconi (2006) when farms are located close to the cooperation headquarters, the land available for the herd is limited and this leads to reducing the quantity of milk yield because of the availability of land for forage production is also limited hence the animal could not get enough amount of feeds to express their genetic potential for milk production.

2
1.2. Problem statement Despite Ada’a dairy cooperative have played a great role in bulk collection, processing and marketing of processed dairy products, the average raw milk procurement by Ada’a dairy cooperative was declined and similar patterns are observed for most of dairy cooperative(Van der Valk and Tessema, 2010). As a result of decline in the volume of milk collected by dairy cooperative, the dairy cooperative could not get enough amounts of milk and the processing plant work under its capacity. This reduction in volume of milk supply to the dairy cooperative forces the dairy cooperative to operate under its capacity and this have an effect on the profitability of the dairy cooperative what they can get from dairy products marketing to improve the income of its members.
Due to this continues reduction in volume of milk supply to dairy cooperative the current levels of cooperative milk collecting, processing and marketing activities are not large enough to have significant impact on the income of smallholder dairy farmers because of the quantity of milk collected is low as compare to what the cooperative collected in the previous time. Identification of factors and actors that affected the volume milk procurement by dairy cooperative is very crucial to strength the position of dairy cooperative in milk value chain.
Land O’Lakes (2010) reported that there two milk marketing channels through which the milk leaving the farm gates, these channels are formal and informal channel. The formal channel is the flow of milk that falls within the local business regulatory net including registered business, payment of taxes etc. This channel of milk distribution from farm is including the dairy cooperative which involves collecting, processing and marketing of dairy products. The informal sector is everything out side of the formal handling of milk.
The main players in the informal sectors is “milk collectors” who buy directly from farmers and sell directly to end market such as small milk bars, cafes and milk shops. If the informal milk marketing channel is dominating the formal milk marketing channel, the dairy cooperative could not get huge volume of milk to process the raw milk into different dairy products. Having these facts in mind the current analysis of milk value chain of Ada’a district using Ada’a dairy cooperative as case study is conducted to find out the following objective.
1.3. Research objective
To identify the main causes of decline the quantity of milk supply to dairy cooperative which affect the profitability of dairy cooperative in order to improve their position in milk value chain in the study area.
1.4. Research questions 1. What are the different factors and actors that affect the volume of milk procurement by dairy
cooperative in the study area? a. What is the current potential of milk production in the study area? b. What is the role of dairy cooperative in milk value chain in the study area? c. What are the different factors that determine farmers to choose formal and informal milk
marketing channels in the study area? d. What quality control measures are applied by actor in the chain?
2. What is the benefit of different actors get from formal and informal milk value chain in the study area? a. What is the value share of different actor gets from formal and informal milk value chain in
the study area b. How formal milk value chain is organized in the study area?

3
1.5. Scope and significance of the study Scope of the study The study limited to one district in terms of coverage and depth to address the above mentioned research objective in order to collect relevant data and information on milk value chain and associated problems in the study area.
Significance of the study The study was generated valuable information on milk value chain that will assist Adami Tulu agricultural research centre for better intervention through the identified research gaps to change the livelihood of smallholder dairy farmers and other chain actors in our research mandate areas. The result of this study is very useful to formulate policy to strength the position of smallholder dairy farmers and Ada’a dairy cooperative in milk value chain development. The result also useful for other stakeholders and NGO to design strategies based on the identified research gaps to make the end users more beneficiaries.

4
CHAPTER TWO: CONCEPT OF MILK VALUE CHAIN This study was conducted based on a value chain analysis (VCA) concept which is structured and showed in figure 1.
2.1. Conceptual frame work
Under this heading different issues related to milk value chain analysis with particularly emphasis on basic concept of value chain, definition of terms, dairy cooperative and other associated issue related to milk production, milk marketing channels and consumption will be assessed from different sources. To conduct this research work the following conceptual frame work was used to generate the required information from the study area.
Actors
Consuming
Retailing
Processing
Collecting
Producing
Input
Supplying
Functions
Formal milk value chain map
Whole salers
Whole
saling
Urban & rual dairy farmers
Urban
consumers
Retailers
Chain supporters Influencers
Min
est
ry o
f h
eal
th a
nd
Lo
cal g
ove
rnm
en
tal a
dm
inis
trat
ion
DLD
O &
DC
DO
NA
IC
ATA
RC
NA
RI &
RA
RI
Input
supplier
Dairy
cooperative
Processor
Input supplier
Rural & urban dairy
farmers
Urban & local
consumers
Trader/
collectors
Shops,
cafe
Actors
Informal milk value chain map
Rural dairy farmers
Local consumers
Home processing milk
Input supplier
Actors
Figure 1: Formal and informal milk chain map
Source: adapted from survey report of Land O’Lakes, 2010 2.2. Value Chain Concept
The value chain concept can be divided into two main streams of literature: one is based on porter’s value chain model and other is known as Global Value Chains (Gerfti and Korzeniewicf, 1994). The concept of value was incorporated into the framework when researchers started to use the analysis of to show where value is captured within a particular industry (Gerefti and Christian, 2010). Value chain analyses are very important for understanding how different products are flow from the producers to the final consumers.

5
The value chain perspective provides an important means to understand the business-business relationships, mechanism for increasing efficiency and ways to enable a business to increase productivity and add value (J.E.Austin Associates, 2007). Porter (2004) claims that value chain analysis is a basic tool for diagnosis competitive advantages and finding ways to create and sustain it over it. KIT et al., (2006) defines value chains as set linkages between actors who seek to support each other with the objective of increasing effectiveness and competitiveness. According to Roduner (2007) value chains analyses the links and information flows within the Chain and reveals the strengths and weaknesses in the process. It also analyses the boundaries between national and international chains, takes into consideration buyers’ requirements and international standards. 2.2.1. Definition of terms
Value addition is simply the act of adding value (s) to a product to create form, whether you have grown the initial product or not. It involves taking any product from one level to the next (Kahan, 2004). Value chain mapping: a value chain analysis systematically maps the actors involved in production, collection, processing, wholesaling, retailing and consumption of a particular product/ products. This mapping assesses the characteristics of actors profit and cost structure and flow of goods, money and information through the chain (Rduner, 2007). Chain actors: These are the chain players who directly deal with the products either through production, processing, trading and consuming. They actually own the products as it passes through their hands in the chain (Rduner, 2007). According to KIT and IIRR (2008), value chain actors include input suppliers, producers, processors, traders and consumers. These are actors who commercially involved in the chain.
Chain supporters: are the service providers by actors who never directly deal with the product but whose service add value to the product for instance like banks, microfinance institutions, insurance companies, transporters, brokers; and other supporters including NGOs, government agencies, and research centres (KIT and IIRR 2010).
The financial services they provide include loans, pre-financing, shareholdings, factoring, leasing arrangements, and so on. It is not just financial institutions that provide financial services; for example, an input supplier may give a farmer a loan in the form of fertilizer, in return for repayment plus interest after harvest (KIT and IIRR 2010).
Value chain development- Value chain development is understood to be strategies used to improve small-scale dairy farmers’ participation in chain activities and their involvement in management of the chain (Kahan,2004).
Formal chain: Supply chain where actors support each other so that they can increase their efficiency and competiveness. They strive to satisfy consumer needs so they can increase profits (Land O’Lakes, 2010).
Informal chain: Set of linkage between actors in a chain who do not seek to support each other and have no binding relationships either formal or informal apart from when transacting agreements involving exchange of products and money.

6
Bargaining power: is the ability to influence the price or term of a business transaction and can enable smallholder farmers to negotiate for better price such as a long term agreement or access different service delivery system. Bargaining power depends on many different factors but the most important are scarcity, the availability of alternative marketing options and market information’s (Kahan 2004) Profitability: It is the return to investment given by profit divided by cost price expressed as percentage (Kahan,2004). Stakeholder: People who are directly involved in milk value chain in Ada’a District. These include actors, chain supporters and chain influencers. Marketing channel: Formally, a marketing channel is a business structure of interdependent organization that reaches from the point of product origin to the consumer with the purpose of moving product to their final consumption. Milk shed: Is an area where milk production is a major activity. Milk shed may serve one or more consumption centres or cities. In addition, a consumption centre may be served by more than one milk shed (Redda, 2001). Cooperative According to the definition of Koopmans (2006) cooperative is a member-controlled organization for producing goods and services in which the participating members, individual smallholder farmers, share the risks and profits or benefit of a jointly established by cooperative and economic owned members. Center for Cooperatives (2004) defined cooperative as a private business organization that is owned and controlled by the people who use its products, supplies or services. Although cooperatives vary in type and membership size, all were formed to meet the specific objectives of members, and are structured to adapt to members changing needs. According to this definition a cooperative is established by farmers in response to unfavorable market conditions, which is a shared problem. According to Rahmato (2002) farmers’ cooperatives and unions are arguably the most significant private sector for emerging in Ethiopia’s innovations system. Although Ethiopia’s cooperative movement dates back to the previous derge regime, the experience was less than positive for many smallholders. Since then government policy has become more facilitative: measures such as voluntary membership, rights of withdrawal, and profit-sharing arrangements, have encouraged the cooperative movement significantly. Ccooperatives in Ethiopia may be able to generate even greater benefits for smallholders through resource pooling and collective marketing of agricultural products like livestock products(dairy), fruits and vegetables (Spielman et al., 2006).
2.2.2. Profit margins of chain actors In participating in chain activities, actors incur costs. Some incur more costs than others do depending on the investments and risks they have to bear (KIT and IIRR, 2008). In products where no or very value addition done, the value share of the farmer is usually more than in situation where final products have undergone processing and adding value to them. The more perishable a product and extent of value addition the higher the risk and transaction costs along the value chain (Ruben et al., 2007). According to KIT and IIRR (2008), calculating profit and value shares of the actors in value chain is not straight forward since it requires different types of information that the small scale farmers find difficult to record. It gives a better outlook of the benefits each that actor in the chain receives and it more preferred. Operating profit which is also referred to as gross income is simpler to calculate, however the above authors point out that it does not include fixed costs and therefore not very reliable. It is defined as the difference between revenue and includes fixed costs and can be indicate the operating profit of the chain actors. On the other hand, the value share which is the percentage of final retail price earned by the actor can be used to show how the various actors share the value added to the product. In order to remain and actively participate in the value chains Lazzarini et al (2001) suggest that small

7
scale producers should exploit existing network of social relationships which provides social capital to enable them to vertically integrate their activities in the value chain. According to KIT, et al (2006), this vertical integration enables small scale producers to be involved many activities such as marketing as a group and processing and not only production. In addition to vertical integration small scale producers can engage in horizontal integration where they get involved in chain management that include product development and price negation in a business cooperative venture. 2.2.3. Information and cash flow Information needs and flows when handling perishable product such milk require a good fast and adequate information system to sell the product. It is therefore important to recognized key information system issues to chain management for an efficient flow of physical products, information and money flows since they are vital to creating a transparent and successive value chain (Vorst, 2000). Material flow is from input supplier to consumer while money flow is from consumers to input supplier, however information flows is both direction with actors proactively sharing relevant information. Kotaet al.,(2003) found out that communication and information sharing accelerates improvement in chain coordination and efficiency through reduction of transaction costs and fast relaying of necessary information leading to achieving greater operational efficiencies. Similarly a study conducted by Coronado et al., (2010) concluded that information exchange between chain actors is positively related efficiency. Moreover, sustainability trading relationships are founded on well-established information exchange along and within the chain. 2.3. Milk production potential of Ethiopia and Ada’a district In Ethiopia, milk production system is mainly divided into three production system namely rural (where majority of milk is produced), peri urban, urban production systems which is located at high land of the country (Redaa, 2002) The milk produced in urban and peri urban production system take more marketing advantage than the milk produced in rural area. According to this author traditionally small holder dairy farmers which found in rural area produces 97% of the total milk produced in the country (Redda, 2001). In Ethiopia there are 10 million of dairy cows which production 3.2 billion litres of milk per year (Staal, 2008). In this country approximately, 1.5 litre of milk produced per day for about seven month lactation period. The milk production potential of the country is varied from region to region. Oromia region is one of the largest regions of the country produces 1.3 billion litres of milk per year. Next to Oromia region South Nations and Nationality people is the second largest milk producing region in the country which produced 572 million litres of milk per year (CSA, 2008). Ada’a district is one of the 12 districts of East Shawa Zone of Oromia regional state which produces approximately 10,804,540 litres of milk per year.

8
Allocation of milk produced in Ethiopia
Calf consumption and
wastage 32%
National milk production 3.2 billion
with a farm value birr 16 billion
Producers consumption of
fluid milk 85%
Household milk sales off
farm 7%
Human consumption of milk 68%
Household consumption of
processed milk
Cooperative and
coop union
Household processing into butter,ayib,
cheese and ghee 8%
Household sales of
processed milk
Collectors into
informal milk
sales
Sale of loose of rural house
hold
Urban
sales of
loose milk
Urban sales of
milk
Milk processing,
pasteurizing
butter cheese
yoghurt
Figure 2: Milk production and allocation for different purpose in Ethiopia
Source: Compiled from report of Land O’Lakes, 2010 of Ethiopia Dairy Value Chains.

9
2.4. Milk marketing channel of the study area There are two different channels namely formal and informal milk marketing channels through which milk produced in different area of the country reaches the final consumers. Out of the total milk produced in the country only 2% of milk reaches the final market through formal milk marketing channel. However, 98% of it reaches through informal channel (Van der Valk and Tessema 2010)
Milk produced in rural and urban area leaves the farm gate in three channels such as collector (who sale their milk to the informal channel, sale to dairy cooperative formal channel and sale within the community. Except the commercial farms farmers are responsible for supplying of their milk into milk marketing chain (Land O’Lakes, 2010). Whereas commercial farm which found in high land area particularly those located in peri-urban areas, bulk milk collection is conducted by milk Processor Company.
The informal milk marketing channel is more dominate than the formal one and the milk is traditional processed into different products like butter and cottage cheese(Ayib) and reach the final market through this system..
Informal milk marketing channels involves direct supplying of fresh raw milk by smallholder dairy farmers to the neighboring final consumers and to trader or individual to the nearby city. This channel (informal) is characterized by no licensing to run the work, low cost of operation, high selling price and no regulation of operation (Redda in Rngneker and thrope 2001)
Until the year of 1991 the formal marketing of cold chain and pasteurized exclusively marketed by the dairy development Enterprises (DDE) which comprise 12% of the total fresh raw milk in Addis Ababa area (Hollow et al., 2000) Now a day different private milk processing company such as Lema, Sebeta agro-industry, Mama, Genesis farm, Holland dry, family milk and different dairy cooperative like Ada’a dairy cooperative are involved in formal pasteurized milk marketing in Addis Ababa city and in the nearby urban towns (van der Valk and Tessema, A., 2010).
2.5. Role of dairy cooperative According to the report of Asfaw (2010) milk marketing cooperative are the main milk market out let for the buyer of raw milk. Dairy cooperative are mainly involved in bulk collecting of raw milk from the members in order to process the collected milk into different dairy products. The milk supplies by the members are received at collection centre mainly in the morning and less milk is collected in the evening. This Author also reported that the quantities of milk collected by dairy cooperative vary seasonally. The quantity of milk collected by the dairy cooperative during the month of January to April is very low because of this month is correspond to dry season of the year. Cooperative has limited milk collecting, storage and processing equipment and facilities. Asfaw (2010) reported that more 95 % of the dairy cooperative have butter churner and only about 44% of them have power supply.
2.6. Benefit of formal and informal milk marketing channels Van der Valk and Tessema (2010) reported that there are many advantage of formal and informal milk marketing channels. Formal milk marketing channel involves the route through which smallholder dairy farmers deliver their milk directly to the processing company or to a milk collection center who buy milk from farmers and subsequently sell to the dairy plant. The advantage of this channel is farmers are more organized and have more responsibility, easy access to inputs and service, easy access and assurance of the market through bulk supplying of raw milk to the dairy cooperative where they can get market niche. As compare to informal milk marketing channel this channel is less advantage because of there is tax payment, regulation of work, strict quality control which leads to rejection of milk (Van der Valk and Tessema, 2010). The informal milk marketing channel involves the direct delivery of fresh milk by dairy farmers to consumers or may pass via two or more private milk collectors. It is a way of traditional milk

10
marketing system where the dairy farmers develop customer who buy their milk and milk products like butter an cottage cheese. The advantage of this informal milk marketing channel is high farm gate price for dairy farmer, simple decision making by farmers (farmer have no any contract agreement with processing plant so that if they do not agree with their customer they easily decided to stop delivering of milk to milk buyers), low investment costs and high consumers demand because of low price. However, the dis advantage of this channel of milk marketing way is no quality control and traceability of product, high risks and loss of milk during less demand for milk (long fasting period). These the above listed advantages of formal and informal milk marketing channel determine farmer’s choice to sell their dairy products.
2.7. Factors affecting milk production and marketing The research carried out by FAO (2008) the frequently reported constrains by farmers are poor animal genetic potential(92%), Low milk supply (88%) and of animal feed (83%). Van der Valk and Tessema (2010) reported that highly fluctuating demand because of long fasting days, seasonal fluctuation in supply of quality milk and fragmented market at supply side affects milk production, In addition to this negative consumers perception of product quality and hygiene of industrial dairy products, absence of minimum standard set by dairy industry are the main constraints milk production and marketing of Ethiopian country. These affect smallholder milk production potential of the country. More over a higher level on expenditure on feeds does not always result in more milk of a higher quality if the feed quality is low.
2.8. Milk Collectors, transporters and processers In Ethiopia collection of milk is carried out at milk collection centres by dairy cooperative or private milk collectors where most of smallholder dairy farmers are delivered their milk to the nearby collection centres or along a main road. Most of milk collection centres is concentrated in highland area where huge milk production is takes place. This milk collection centres is either owned by dairy cooperative or private milk processing company to collect the milk from milk collection centres (Land O’Lakes, 2010). Milk producers and other traders transport their milk on foot, by horse, by donkey and private milk transporter to deliver the milk to milk collection Centre’s, and the processing plant. In scarcely populated areas or where individual suppliers are far away from the dairy plant and difficult to reach, milk has to be transported over long distances. Smallholder farmers take their raw milk to milk collection points, where the milk is weighted and tested by lactometer and alcohol test to assure the quality of milk delivered by farmers (Van der Valk and Tessema, 2010). From the milk collection points the milk is transported to dairy plant or to milk collection centers where the milk is bulked and cooled and transported to dairy plant. Private milk collector and dairy cooperative operate milk collection point and milk collection centers. According to the report of Land O'Lakes, (2010) in 2000 the Ethiopia dairy product line consisted of pasteurized milk and butter. But in 2010 consumers can find a wide variety of domestic processed dairy products like yogurt, fruit flavored yogurt, UHT milk, ice cream, cultured milk and cheese such as Mozzarella and Gouda cheese.
2.9. Demand for milk and milk products in Ethiopia According to the report of GOE, LMP, (2007) the consumption of milk and milk products in Ethiopia is approximately 17kg/capita. About 83 % of the total milk produced in Ethiopia is consumed at farm gate but only 7% is supplied to formal and informal markets. The remaining is distributed in kind wages and used for processing local butter, yogurt and cheese.

11
2.9.1. Milk and milk product consumption in urban areas In Ethiopia income will be the key driver of milk consumption. As the income of the individuals’ income rises there is a greater proportional rise in their expenditures on dairy products. The highest expenditure group which make up around 10% of the Addis Ababa city consumes 38% of the milk. On the other hand 61% of the population who are in the lowest expenditure group consumed only 23% of the milk.
On the other hand, 61% of the population who are in the lowest expenditure group consumed only 23% of the milk. According to the information obtained from MOA (2005) worker in the lowest income would have to work 2.71 hours for one kg of milk, 27 hours for one kg of butter and five hours for one kg of cheese. In Addis Ababa market 5000 commercial producers estimated in 2002 sold 73% of their production went to household consumption, 10% to calves and 8 5 was processed (Azage et al, 2002). The primarily milk marketing for processed milk is Ethiopia’s urban centres namely Addis Ababa, Debrezeit and Awassa. However, the majority of the milk consumed by most urban and semi urban homes is supplied through the informal sector. 2.9.2. Milk and milk product consumption in rural areas In the rural areas, the consumption of milk will be determined by livestock ownership and season. The demand for milk is mainly for fresh whole milk which is satisfied by own production or purchased from neighbours. In the rural producers will consume fresh milk and will convert their to butter. It is estimated that 40% of the milk produced is converted to butter, while only 9% is converted to cheese (GOE’s Livestock Master plan-LMP, 2007).
2.10. Milk quality control measures Van der Valk and Tessema (2010) (2010) reported that monitoring and control of milk quality in Ethiopia is not well controlled and monitored. Since most of the consumer in the country is not give more emphasis on the quality of milk consumed, milk trader and collectors who participating in informal milk marketing channel did not give much attention on the quality of they deliver to the final consumers. The final consumers also run for cheap price and not for good quality of milk. As a result of this monitoring and control of milk quality is still remain limited. There is no bacteriological test of milk before the milk is delivered to the final consumers. Milk is only tested for physical and chemical hazards. Milk pass through dairy processing plant to final consumers is tested by lactometer and alcohol test (Van der Valk and Tessema (2010)). This author also reported that milk production at farm get is not optimal and clean and proper milk equipment is not used by farmers when they bring their milk to milk collection centers.

12
CHAPTER THREE: RESEARD DESIGN AND METHODOLOGY This chapter deals with the description of the study area, type of research conducted, study design and strategy , sample size and sampling procedures, method of data collection, method of data analysis and limitation of the study through which this research is organized and carry out.
3.1. Description of the study areas The study was conducted in Ada’a district which located at 38 km South East of Addis Ababa the capital city of Ethiopia at 8o44N and 39o02E, an altitude of 1880 meter above sea level. The area receive a mean annually rain fall of 865 mm with mean minimum and maximum annual temperature of 15oc and 28 oc respectively. This district covers an area of 1750km2, stretching East of the Bole international airport to the North of the Koka dam. The district is surrounding by four districts such as Lume district in East, Akaki district in West, Ginbichu district in South and Liban district in North in Oromia regional state. The following figure 3 showed map of Ethiopia and map of Oromia.
Figure 3: Map of the stud area
Source: www.travelblog.org>Africa>Ethiopia>Oromia Region
The population in Adama, Addis Ababa, Mojo, and Bushoftu create a large market opportunities for most dairy products produced in this district. The area is very useful for different purposes such as for cultivation of different crops like white teff, wheat, barley, for livestock production and for plantation of trees. Land using pattern of the study district is depicted in figure 4.
Study area
Map of Ethiopia Map of Oromia

13
Figure 4: Land using pattern of the study district
The district has an immense population of livestock population such as cattle, sheep, goat, donkey and poultry. There is an existing market oriented dairy production system especially in the urban area of Debrezeit town. There is huge smallholder dairy production system with a strong milk cooperative which involves over 850 smallholder dairy farmers and other private milk processing company such as Genesis farm, Holland dairy, Mama, Lema and family milk who compete with Ada’a dairy cooperative. The area of Debrezeit is certainly the most developed milk shed of the country, providing most of the dairy products available in the market of Addis Ababa, the largest and most diversified market of Ethiopia. The total livestock population of this district showed in 5.
Figure 5: Livestock population of Ada’a district in the year of 2011/2012
73087,78
7751,15
6011,5
2693,4
Arable land
Others
Forest land
Grazing land
Ha.
81217
33171
22537
32715
20279
3102
32004
994
84564
Oxen Cows Heifers Sheep Goat Horses Donkey Mules Poultry
Number of Livestockes

14
3.2. Type of research In this research work case study and survey was implemented to collect both quantitative and qualitative data from different chain actors, chain supporters, chain influencers and competitors in the study area. 3.3. Study design and strategy In order to have a clear direction to carry out this research work the following study design and strategy was developed and used to undertake the current milk value chain analysis of Ada’a district. See figure 6.
Desk study
Field study
Case study
9 different
actors
Survey
40 dairy producers
Focus on collection of
relevant data from dairy
producers in urban and
rural areas through semi-
structured questionnaries
survey
Focus on collection of data
from dairy cooperative,
retailers, supporters, milk
collector and compitotors
through check list
Analysis of result and dicussion
Conclusion
Recommendation
Research strategy
Figure 6: Study design and strategy used to conduct milk value chain in the study area

15
3.4. Sample size and sampling procedures To determine the total sample size of the respondents going to interview both in urban and rural area, discussion was made with head of Ada’a district of livestock development and health office. Based on these information 20 small scale dairy farmers from urban and 20 from rural areas were purposively selected to generate the required information on milk value chain. Then after from each places 10 members of Ada’a dairy cooperative both in urban and rural and 10 non-members of Ada’a dairy cooperative were selected with the help of Ada’a dairy Cooperative. To generate the relevant data an interview was conducted with the selected small scale dairy farmers with the help of semi-structured questionnaire survey. For case study Ada’a dairy cooperative and other milk chain supporters and competitors shown in figure 7 were purposively selected to collect the required data through check list.
40 respondents
20 farmers from urban 20 farmers from rural
10 farmers from
members of dairy
cooperative
10 farmers from non
members of dairy
cooperative
10 farmers from
members of dairy
cooperative
10 farmers from non
members of dairy
cooperative
Stratifying
Purposive
selecting
Purposive
selecting
3 retailers
1 wholesaler
Actors
Dis
tric
t liv
es
to
ck
de
ve
lo
pm
en
t a
nd
ma
rk
etin
g o
ffic
e
Supportes
Dis
tric
t c
oo
pe
ra
tiv
e
de
ve
lo
pm
en
t o
ffic
e
40 dairy
producers
Competitors
Ge
ne
sis
fa
rm
Ho
lla
nd
da
iry2 dairy
cooperative
Dis
tric
t liv
es
to
ck
he
alth
Figure 7: Show sampling size and sampling procedures used for survey and case study

16
Number of different actors, supporters and competitors who were interviewed during the field study time was depicted in table 1. Table 1: List of different stakeholders interviewed during field study period
No
Different Stakeholders
Number of interviewed
Chain
1 Small scale farmers 40 Chain actors
2 Milk collectors 1 Chain actor
3 Ada’a dairy cooperative 1 Chain actors
4 Retailers 3 Chain actor
5 Ada’a district livestock development and health office 1 Chain supporter
6 Ada’a district cooperative development office 1 Chain supporter
7 Genesis farm 1 competitor
8 Holland dairy 1 competitor
Total 49
3.5. Method of data collection To execute the current field study in Ada’a district the following procedures of data collection method was implemented. After the total sample size and area of small holder dairy farmers going to interviewed was identified, detail explanation of each questionnaire survey was made for head of Ada’a district livestock development and health office who assisting me in collecting of data from smallholder dairy farmers both in rural and urban area. Then to identify the member of dairy cooperative who deliver their milk to dairy cooperative in rural and urban area an interview was made with the general manager of Ada’a dairy cooperative to gathered relevant information on this issues. Then before the actually implementation of the field survey, pretesting of the semi-structured questionnaire survey was carry out by interviewing of two smallholder dairy farmers in rural area as well as two dairy farmers in urban of area of Debrezeit town. Based on the responses of the interviewed farmers, the prepared semi-structure questionnaire survey was modified. To solve the problems encountered during data collection, head of livestock development and health office of was assisting me by introducing the objective of this research and as the finding of this research work is very important for small scale farmers to strengthen their position in milk value chain. 3.5.1. Desk study This method was used to generate data from existing literature necessary to lay down the foundation information of this research work before setting of for field study. For this desk study information was extracted from different source such as from internet, text books, scientific journals, MSc thesis and different reports. 3.5.2. Case study For this field study different chain actors, supporters and competitors of dairy cooperative were interviewed to gather relevant information on milk value chain in the study area. Accordingly the following different stakeholders found in Ada’a district and actively participating in milk value chain were interviewed by using checklist to gather the required information. Interview made with Ada’a district livestock development and health office Before the actually implementation of the field survey on milk value chain analysis, secondary data on livestock population of the district, sources of animal feeds, trend of animal feeds, trend of milk production and other relevant information were collected by interviewing of head of Ada’a district livestock development and health office.
17
Based on the collected information the number of small holder dairy farmers who have dairy cows and living in urban and rural area were identified in order to conduct field study through semi-structured questionnaire survey.
More over Ada’a district cooperative development office was interviewed to get the total number of dairy cooperative exist in the district, how the dairy cooperative are organized, what is the rule and regulation farmers should be fulfilled to organized into dairy cooperative, what kind of service are provided for dairy cooperative, the role of government in dairy cooperative, the relationship between dairy cooperative and different chain actors.
Interview made with Ada’a dairy cooperative In depth interview was made with the general manager of Ada’a dairy cooperative in order to investigate the underlying causes of decline in the volume of milk procurement by Ada’a dairy cooperative, their daily processing capacity, the number of activity members who deliver their milk, membership criteria and other associated problems which directly or indirectly affect the performance of the dairy cooperative. More over to collect more information on problems associated with collection of milk from the members an interview was also made with the person who is in charge in financial administration of the dairy cooperative. Interview made with dairy products retailers An Interview was made with dairy product retailers which are found in Debrezeit town and Addis Ababa city to collect the required information on the type of dairy products they handled, purchase price, selling price, potential suppliers and buyers of processed products. A dairy product retailer which was found in Addis Ababa city was selected and an interview was made with them. There is no wholesaler in this milk value chain. However the dairy cooperative works as wholesaling function to distribute processed products to retailer’s in this city. There are about three dairy product retailers in Addis Ababa city which is closely supervised by Ada’a dairy cooperative. Interview made with competitors of Ada’a dairy cooperative Based on the information obtained from Ada’a dairy cooperative on the role of other competitors on procurement of milk from its members and other dairy producers in the study district two major competitors who compete with the dairy cooperative was purposively selected to conduct an interview with them. Accordingly Genesis farm and Holland dairy private milk processing companies which are found in this district and actively involved in collection of milk and processing of milk were interviewed. Data was collected on the volume of milk collect, purchasing price of raw milk, selling price and cost they incurred to collect raw milk from the farmers.
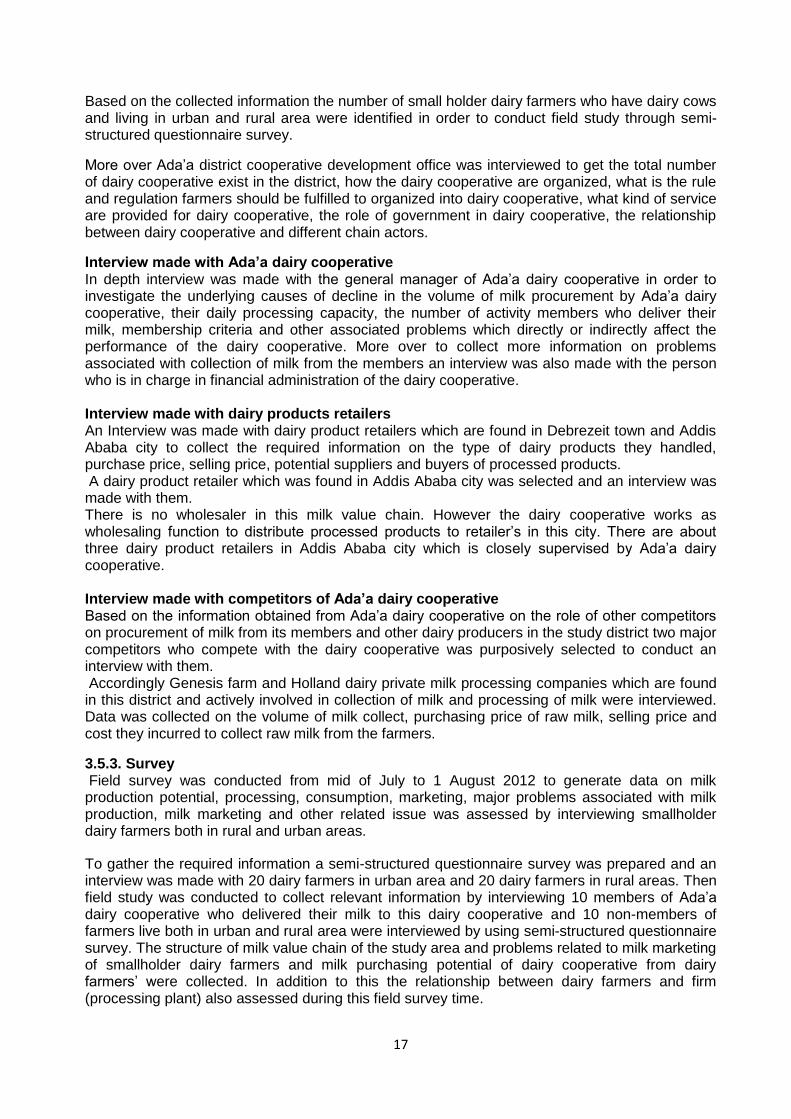
3.5.3. Survey Field survey was conducted from mid of July to 1 August 2012 to generate data on milk production potential, processing, consumption, marketing, major problems associated with milk production, milk marketing and other related issue was assessed by interviewing smallholder dairy farmers both in rural and urban areas.
To gather the required information a semi-structured questionnaire survey was prepared and an interview was made with 20 dairy farmers in urban area and 20 dairy farmers in rural areas. Then field study was conducted to collect relevant information by interviewing 10 members of Ada’a dairy cooperative who delivered their milk to this dairy cooperative and 10 non-members of farmers live both in urban and rural area were interviewed by using semi-structured questionnaire survey. The structure of milk value chain of the study area and problems related to milk marketing of smallholder dairy farmers and milk purchasing potential of dairy cooperative from dairy farmers’ were collected. In addition to this the relationship between dairy farmers and firm (processing plant) also assessed during this field survey time.

18
3.6. Method of data analysis To process and analysis the collected data value chain mapping, excel spread sheet and SPSS statistical software of 19 version and SWOT were used. Value chain mapping of was implemented to show the qualitative data as well as the quantitative data collected during the field study time. Excel spread sheet was used for processing of financial data and to draw some graphs of land using pattern of the district, livestock population and amount of milk collected by dairy cooperative and Genesis farm etc. Data collected through semi- structured questionnaire survey was processed by using SPSS statistical software version 19.To analysis the collected information, the collected data was coded, entered, edited and analysed by using SPSS statistical software. Chi-Square tests and descriptive statistics were used to analysis the survey data collected from smallholder dairy farmers through semi- structured questionnaire survey in the study area. SWOT analysis tool was implemented to analysis the strength, weakness, opportunity and threat of Ada’a dairy cooperative. 3.7. Limitation of the study Some of the limitation of the study while collecting of data from the study area was mentioned as flow:
Ada’a dairy cooperative is very price sensitive due to they have many strong competitors’ who compete with them in raw milk collecting, processing and marketing of processed dairy products. Because of this they did not voluntary to give me the cost of durable items and other fixed costs. As a result of this cost- benefit analysis and profit share of the Ada’a dairy cooperative and other actors are not conducted.
Due to strong competition on procurement of raw milk from small holder farmers, some of the private milk collector like Holland dairy did not want to give me much information on the cost they incurred to collect and processing of raw milk. Because of this the profit of this private milk processing company is not performed.
The district livestock expert and farmers in the study area were well adapted to collect money from many international livestock research institute, PhD students and NGO while an interview was carried out. This creates a big challenge to collect the required information. However, with the help of head of Ada’a district livestock development and health office the required information was successfully collected.
The members of Ada’a dairy cooperative were very sensitive to give information on the volume of milk selling to other private milk collectors (side selling). Because of this the exact volume milk sold by dairy farmers to other private milk processing company was not collected. However other members are very hate Ada’a dairy cooperative and they told me as they did not deliver any volume to the dairy cooperative.
Lack of internet service/ access creates unfavourable condition to assess information from internet.
19
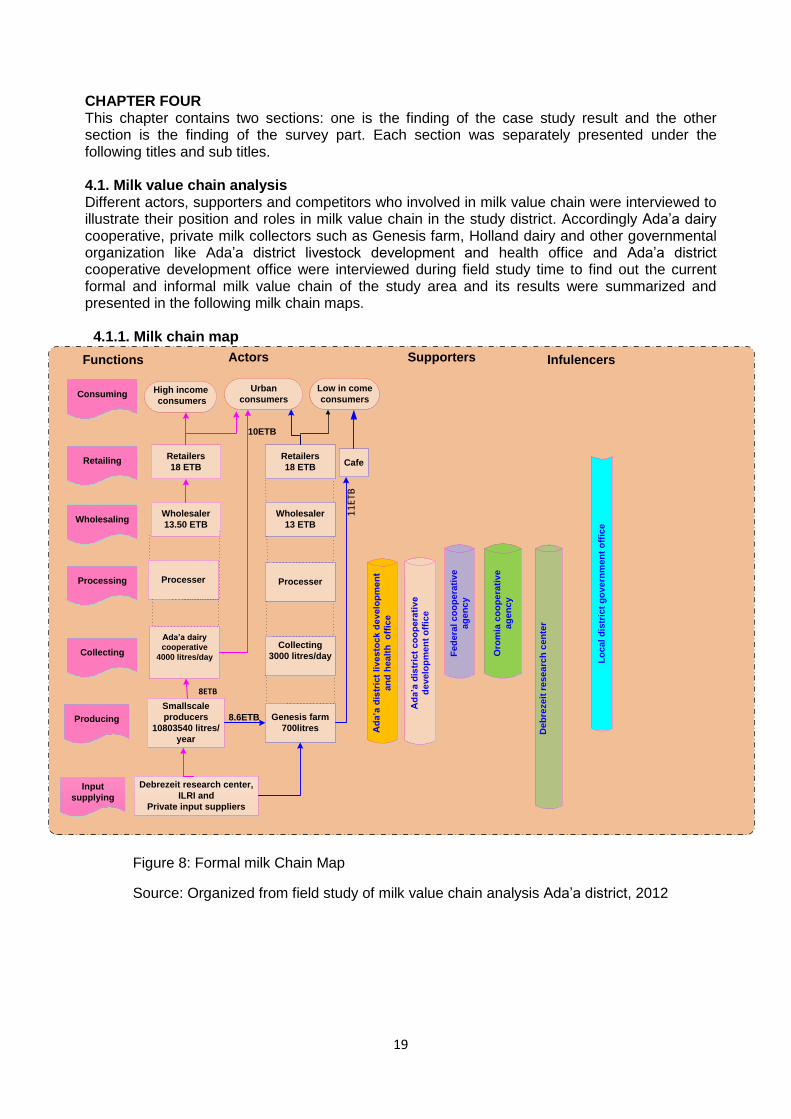
CHAPTER FOUR This chapter contains two sections: one is the finding of the case study result and the other section is the finding of the survey part. Each section was separately presented under the following titles and sub titles. 4.1. Milk value chain analysis Different actors, supporters and competitors who involved in milk value chain were interviewed to illustrate their position and roles in milk value chain in the study district. Accordingly Ada’a dairy cooperative, private milk collectors such as Genesis farm, Holland dairy and other governmental organization like Ada’a district livestock development and health office and Ada’a district cooperative development office were interviewed during field study time to find out the current formal and informal milk value chain of the study area and its results were summarized and presented in the following milk chain maps. 4.1.1. Milk chain map
Input
supplying
Processing
Wholesaling
Retailing
Consuming
Producing
Wholesaler
13.50 ETB
Ada’a dairy
cooperative
4000 litres/day
Smallscale
producers
10803540 litres/
year
Debrezeit research center,
ILRI and
Private input suppliers
Processer
Collecting
Functions
Urban
consumersHigh income
consumers
Fe
de
ral c
oo
pe
rati
ve
ag
en
cy
Oro
mia
co
op
era
tiv
e
ag
en
cy
De
bre
ze
it r
es
ea
rch
ce
nte
r
Ad
a’a
dis
tric
t c
oo
pe
rati
ve
de
ve
lop
me
nt
off
ice
Ad
a’a
dis
tric
t liv
es
toc
k d
ev
elo
pm
en
t
an
d h
ea
lth
o
ffic
e
Supporters Infulencers
Lo
ca
l d
istr
ict
go
ve
rnm
en
t o
ffic
e
10ETB
Retailers
18 ETB
Collecting
3000 litres/day
Processer
Retailers
18 ETB
Genesis farm
700litres
Actors
Low in come
consumers
8.6ETB
8ETB
Wholesaler
13 ETB
11
ETB
Cafe
Figure 8: Formal milk Chain Map
Source: Organized from field study of milk value chain analysis Ada’a district, 2012

20
Input
supplying
Consuming
Producing
Private milk collectors
Smallscale
producers
8.60 ETB
Debrezeit research
center, ILRI and
Private input suppliers
Collecting
Functions
Low income
consumers
De
bre
ze
it r
es
ea
rc
h c
en
ter
Ad
a’a
dis
tric
t
liv
es
toc
k
de
ve
lop
me
nt
an
d h
ea
lth
off
ice
Supporters
Tea cafe
Actors
Retailing
Institutional
consumers
Retailers
Figure 9: Informal Milk Chain Map Source: Organized from field study result of milk value chain analysis, 2012 4.1.2. Dairy cooperative and its role in milk value chain From the case study conducted it was observed that there is only two dairy cooperative namely Ada’a dairy cooperative and Godino dairy cooperative which are found in the study district. Godino dairy cooperative is established in 2000 by 26 members to collect milk from its members and subsequently to deliver the collected milk to Ada’a dairy cooperative. Currently the members of this Dairy cooperative is increased to 32 and 140 litres of milk is collected per day. Since this dairy cooperative is not well organized they do not involved in milk processing activities. They only supply the collected raw milk at one collection centre of Ada’a dairy cooperative. Ada’a dairy cooperative is the biggest dairy cooperative in Ada’a district which is located at 47 km south east of Addis Ababa, the capital city of Ethiopia. It was established in 1997 by 27 males and 7 females totally by 34 members who have at least one pure breed/crossbreed dairy cow and have strong willing to organize into dairy cooperative. To gather detail information an interview was made with the general manger of Ada’a dairy cooperative. See photo1.

21
Photo 1: Interview made with the General Manager of Ada’a Dairy Cooperative
The main objective of Ada’a dairy cooperative during its establishment were to minimize the high transaction cost and reduce price fluctuations in each season and particularly during long fasting period of Ethiopia orthodox church and to improve the incomes of members. Moreover the cooperative also provides inputs such as different feed, veterinary and AI services to its members. Now a day the dairy cooperative only provided health and AI service to its members. At the establishment, Ada’a dairy cooperative had an initial capital of 3400 birr and the cooperative took credit from Oromia cooperative bank and the income and the members of the cooperative is gradually increased. After the establishment of the dairy cooperative in 1997 up to the year of 2004, the number of the members and the amount of milk collected by this dairy cooperative was increased. But after the year of 2004 even if the total number of members of the cooperative has increased, the amount of milk collected by this cooperative is decreased steadily because of there is side selling of milk by its members. Ada’a dairy cooperative and its membership criteria Ada’a dairy cooperative membership is open to any dairy farmers who has at least one pure or crossbreed dairy cow and live in Debrezeit town and capable of paying a registration fee and buys at least one share from the organization. At the establishment of the cooperative the registration fee was 50 birr and the share had been sold for 100 birr. Now a day the registration fee is increased to 250 birr. The cooperative has organized by the law set by the head of cooperative development office which found at zonal level. The board or the general executive committee of the cooperative was elected in every two year by its members. The total executive committee of Ada’a dairy cooperative comprise 5 people such as Chairman, Vice chairman, 2 members and one secretary. After every two years the newly elected committee has took the position of the previous executive committee to run the work of the organization according to the rule setted by the head of the organization. The interviewed made with the general manager of the cooperative revealed that there is no contractual agreement between the dairy cooperative and its members on the volume of milk they should have to deliver. But their relation is based on trust building and the members should have to deliver all the volume of milk they produced to Ada’a dairy cooperative. The cooperative uses two car to transport milk from each collection centres to the dairy plant and to transport processed dairy products to retailers in Addis Ababa city. During the field survey time, there are 71 workers who are currently working in Ada’a dairy cooperative. The cooperative have established 14 milk collection centres in Debrezeit town to collected raw milk from the members at each collection centres.

22
Table 2: Indicate members of Ada’a dairy cooperative at each collection centres.
Year Numbers of milk collection centers Total
1 2 3 4 5 6 7 8 9 10 11 12 13 14
2010 34 79 32 19 50 6 13 20 13 4 24 16 11 6 327
2011 32 57 26 17 43 0 11 16 12 3 29 9 11 33 299
2012 20 36 20 15 29 0 12 13 9 4 0 7 11 30 206
Source: Compiled from field study of Ada’a dairy cooperative, 2012 Volume of milk procurement by Ada’a dairy cooperative The field study result showed that Ada’a dairy cooperative has collected up to 8000 litres of milk per day during the past time. Now a day due to strong competition with different private milk processing company, the dairy cooperative only collected up to 4745 litres of milk per day from 14 milk collection centres. On average each members of the cooperative have delivered 23 litres of milk per day. Since the establishment of Ada’a dairy cooperative in 1997 up to the year of 2008 the volume of milk procurement by dairy cooperative was fluctuated. But after the year of 2008 onwards till now, the volume of milk collected by this dairy cooperative was steadily decreased. The volume of milk collected per day for the last five year by this dairy cooperative is depicted in table 3.
Table 3: Volume of milk collected per day by Ada’a dairy cooperative from (2008-2012)
Year 2008 2009 2010 2011 2012
Average volume of milk collected/day (Litres)
6422.5 6036 5789.5 5148.5 4745
Source: Collected from internal data of Ada’a dairy cooperative, 2012 Milk collection and transportation of Ada’a dairy cooperative Ada’a dairy cooperative has collected milk from each collection centre in the morning starting from 7:30 to 9:00 and in the afternoon from 2:30 to 5:30 by round each collection centres and transports the milk to the processing plant. All the members of the dairy cooperative deliver their milk to the respected milk collection centre by using bicycle where other members go on foot to deliver their milk. From the study conducted it was observed that majority of the milk was delivered to the nearest collection by children.
On average 365 litres of milk was collected per day at each collection centres. To collect this volume of milk, Ada’a dairy cooperative has assigned 4 works at each collection centre who is in charge of milk quality control, record keeping, measuring and receiving of milk from the members. After the milk was tested by using lactometer and alcohol test, the milk was transported to the dairy plant and screening of milk for its quality was carried out to check whether the milk collected from each collection centre was good in quality or not.
Unfortunately if the milk received from the members is poor in quality, the dairy plant processes the milk into butter and cheese. But they do not process poor quality of milk into pasteurized milk because of they have higher income customers who need high quality of pasteurized milk. The results of the field study revealed that Ada’a dairy cooperative has collected different volume of milk in each month of the year due to strong competition with private milk processing company. However, during the month of September and October when availability of animal feeds is very high and the volume of milk produced during this time is relatively high, Ada’a dairy cooperative has collected high volume of milk. The volume of milk collected by Ada’a dairy cooperative per day at each milk collection centres and in each month of the year during the year of 2011/12 is showed in Figure 10 and 11.

23
Figure 10: Volume of milk collected at each collection centres per day (litres)
Source: Compiled from case study of Ada’a dairy cooperative, 2012
Figure 11: Volume of milk collected by Ada’a dairy cooperative in each month in 2011/12
Source: Compiled from case study of Ada’a dairy cooperative, 2012
339
421 431
367
311 280
365 345
52
504
82
231
432
1 2 3 4 5 6 7 8 9 10 11 12 13
Volume of milk collected at collection centers per day (litres)
72505
130234 119945
95376 98005 97943
139549 152356
226681 217834
147218 144937
Jan Feb Mar Apr May Jun July Aug Sept Oct Nov Dec
Volume of milk collected (Litre)

24
The following picture indicated collection and transportation of milk from MCC to Dairy plant.
Photo 2: Indicate milk collection and transportation to dairy plant
Source: Compiled from case study of Ada’a dairy cooperative, 2012 Milk processing and marketing of Ada’ a dairy cooperative The dairy cooperative has a capacity to process 15,000litres of milk per day. This processing plant has a big capacity to process huge volume of milk per day. But due to low supply of milk from the members’ side, the processing plant only process 4745 litres of milk per day. In addition to this because of high cost of plastic cup which is used for packaging of processed milk, the dairy cooperative could not process yogurt and they only limited to process pasteurized milk. This also limits the daily potential of the dairy plant to process raw milk. Before the cost of the plastic cup was increased, the dairy cooperative process different products like soft cheese, yogurt, butter and pasteurized milk. Now during the field study period the dairy plant only process pasteurized milk because of processing of pasteurized milk more advantages than other products like butter and soft cheese. But when there is low market for pasteurized milk during long fasting period of Ethiopian Orthodox Church, the dairy plant process pasteurized milk into butter and soft cheese. The amount of raw milk collected, processed into different products and sold during the year of 2011/2012 was depicted in table 4.

25
Table 4: Indicate amount of milk processed and marketing by Ada’a dairy cooperative
No. Type of dairy products Unit Year Remark
2011 2012
1 Total raw milk collected Litre 1853460 1708200
2 Processed products - -
2.1 Pasteurized milk Litre 596716.5 509063
2.2 Butter Kg 28281 25698.6 17.5litres of milk=1kg butter
2.3 Soft cheese kg 21745.5 22678 Made after butter is removed from raw milk.
2.4 Yogurt litre 38790 39678
3 Products sold - - -
3.1 Raw milk Litre 723036 686132
3.3 Pasteurized milk Lire 506716.5 487936
3.4 Butter Kg 28281 25698.6
3.5 Cheese Kg 20746 21564
3.6 Yogurt Litre 32790 30386
Source: compiled from field study of milk value chain analysis, 2012 The sample of pasteurized milk processed by Ada’a dairy cooperative during the year of 2012
Photo 3: Sample of processed dairy product by Ada’a dairy cooperative
Source: compiled from field study of milk value chain analysis Ada’a district, 2012 Milk quality management system To test the quality of milk at MCC the dairy cooperative has assigned one person who controls the quality of milk delivered by its members. Both lactometer and alcohol test was conducted before the milk was received from the members. The dairy cooperative has used lactometer to measure the density of milk. Normal pure milk has a density (specific gravity) of 1.026-1.032 gram per ml (or 26-32) on lactometer reading. If water has been added the lactometer reading will be below 26, if any solid such flour has been added the reading will be above 32. During screening of milk at collection centres, if the result of the lactometer test is below 25 the milk will be rejected because of the farmers add some water into milk and if the fat contents above 32 again the milk will be rejected because of there is addition of some foreign bodies such as milk powder, wheat flour and dried banana in the milk.

26
On average 20 litres of milk was rejected per day at each milk collection centres due to poor quality of milk. The dairy cooperative are very strict in controlling of milk quality because of they have many customer in Addis Ababa city who need high quality of milk. Poor quality milk which has rejected by Ada’a cooperative is received by other private milk collector to attract farmers from dairy cooperative. Because of this the dairy cooperative could not collected huge volume of milk. The farmers do not have any problem if his milk is rejected by the dairy cooperative, he delivered his milk to other private milk collectors who purposively received poor quality of milk to oppose Ada’a dairy cooperative.
To cross check the quality of milk has been collected from each milk collection centre the dairy cooperative use separate tanks which contain 45- 50 litres of milk. After the milk was tested and received from the members the milk was transported to the processing plant. At the processing plant, screening of milk was carried out before the milk was mixed. If the quality of milk tested at processing plant is not good in quality, the dairy plant gives first warning to the worker of the milk collection centre who passes poor quality of milk to the processing plant. The following photo’s indicates screening of milk at collection centre (photo 4).
Photo 4: Indicate testing of milk with lactometer and alcohol test at collection centres
Source: compiled from field study of milk value chain analysis, 2012 Dairy product retailers From retailers interviewed in Debrezeit town and Addis Ababa city it was observed that most of the processed dairy product was marketed before and after long fasting of Ethiopian Orthodox Church which is before the month of February and after the month of April when there is no fasting/abstaining of animal origin. However, during fasting period there is a great problem in marketing of processed dairy products. Most of the interviewed private milk processing company and Ada’a dairy cooperative have their own retailer shops where they sell their processed dairy products. For instance Ada’a dairy cooperative have 5 retailer shops in Addis Ababa, the capital city of Ethiopia. Because of this the dairy cooperative work as wholesaling function to distribute the processed dairy products to their retailers shops in Addis Ababa from where other retailers purchased the processed dairy products. See picture 5.

27
Photo 5: Indicated retailing of processed products at Addis Ababa city.
Source: compiled from field study of milk value chain analysis Adda’a, Ethiopia, 2012 4.1.3. Milk chain supporters and their roles in milk value chain During the field study time the main milk chain supporters of the study area were identified and an interview was made with them. The result of the interviewed was separately presented in the following sections. Ada’a district livestock development and health office The interview made with the head of Ada’a district livestock development and health office revealed that, the district livestock development office provided technical support to farmers, facilitate different inputs such as forage varieties, improved heifers and AI and animal health services for small scale farmers in the study area.
There are many potential of livestock staffs who provide different services to smallholder dairy farmers to improve position of small scale farmers in milk value chain. The following photo’s indicated while an interview was made with head of Ada’a district livestock development and health office.
Photo 6: Interview made with Ada’a district livestock development and health officer
Ada’a district cooperative development office Ada’a district cooperative development office is provided different service to Ada’a dairy cooperative in the district. Some of the supports provided by this organization to the target farmers are organizing of farmers into different type of cooperative, giving of licence to the cooperative, arranging of credit facilities to the members by linking the cooperative with local micro financial institution and provision of training for the members on the rule and regulation of the cooperative
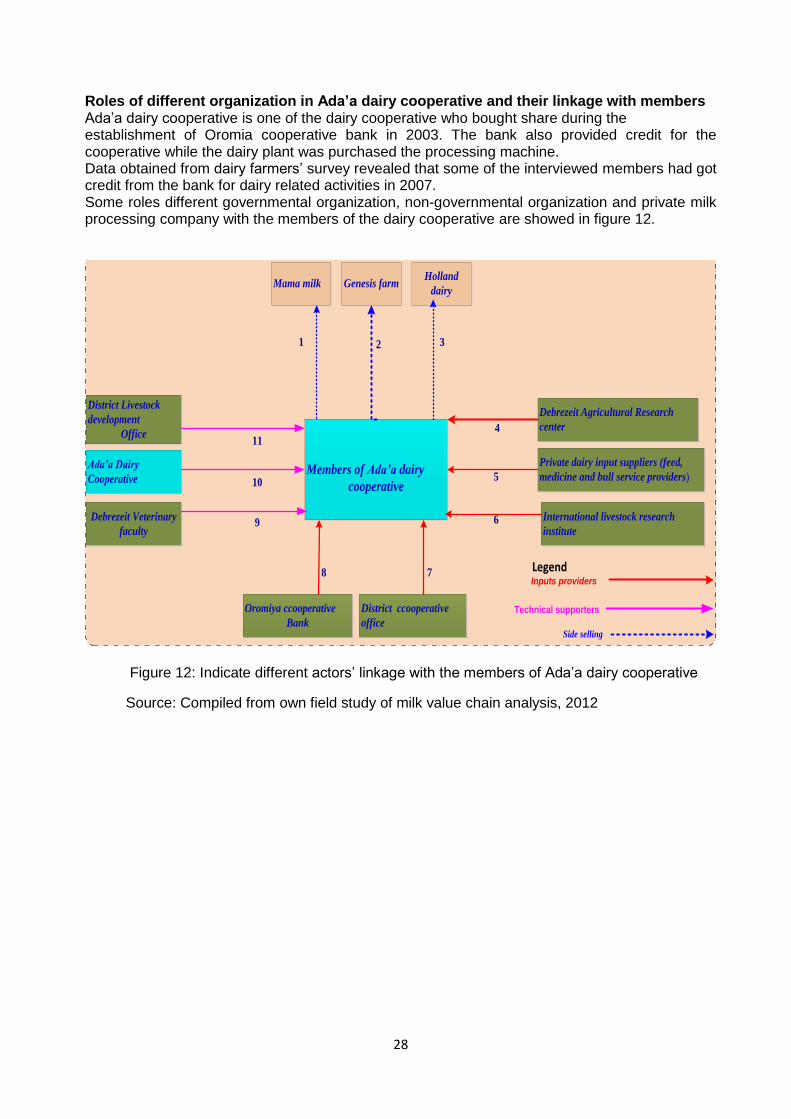
28
Roles of different organization in Ada’a dairy cooperative and their linkage with members Ada’a dairy cooperative is one of the dairy cooperative who bought share during the establishment of Oromia cooperative bank in 2003. The bank also provided credit for the cooperative while the dairy plant was purchased the processing machine. Data obtained from dairy farmers’ survey revealed that some of the interviewed members had got credit from the bank for dairy related activities in 2007. Some roles different governmental organization, non-governmental organization and private milk processing company with the members of the dairy cooperative are showed in figure 12.
Members of Ada’a dairy
cooperative
District Livestock
development
Office
Oromiya ccooperative
Bank
Private dairy input suppliers (feed,
medicine and bull service providers)
International livestock research
institute
Mama milkHolland
dairy
District ccooperative
office
Debrezeit Veterinary
faculty
2
4
5
6
78
9
10
11
1 3
Debrezeit Agricultural Research
center
Ada’a Dairy
Cooperative
Genesis farm
LegendInputs providers
Side selling
Technical supporters
Figure 12: Indicate different actors’ linkage with the members of Ada’a dairy cooperative
Source: Compiled from own field study of milk value chain analysis, 2012

29
Table 5: Indicate the role of different actors in milk value chain
No. Stockholders Roles
1 Mama Collecting milk from smallholders farmers and transporting of milk to Sebeta Agro-industry in Addis Ababa
2 Genesis Farm -Production of milk -Collecting of milk from small scale producers -Processing of milk into different dairy products -Producing of different improved forage varieties -Selling of different dairy products
3 Holland dairy -Collecting of raw milk from farmers -Processing of milk into different dairy products. - Retailing of processed products
4 Debrezeit research center
-Provision of training, advisory, crossbred cows, AI and bull services
5 Private dairy inputs suppliers
-Provision of different dairy inputs such as animal feeds, animal health and bull services to smallholder farmers
6 International livestock research institute
-Provision of AI service, training and advisory -Provision of veterinary services
7 District cooperative development office
-Provision of training and advisory services. -Organizing farmers into cooperative -Giving licence to the dairy cooperative -Control of the overall activities of the cooperative
8 Oromia cooperative bank
-Provision of credit service for some members of the dairy cooperative
9 Debrezeit Veterinary Faculty Medicine
-Provision of animal health services
10 Ada’a Dairy Cooperative
-Provision of marketing services (buying of milk from members) and selling of processed dairy products to members. -Provision of dairy inputs such as AI, feeds, animal health services and creates a forum for member to member extension, dividend to members and provision of training and advisory services
11 District livestock development office
-Provision of technical support for Ada’a dairy cooperative such training, different inputs and health services.
Source: Compiled from own field study of milk value chain analysis in Ada’a district, 2012

30
4.1.4. Competitors of Ada’a dairy cooperative In this section the results of the interview made with different private milk processing companies (competitors) who compete with Ada’a dairy cooperative in collecting of raw milk, processing and marketing of processed dairy products in Ada’a district is presented in the following sections.
Genesis Farm The interview made with the farm manager of Genesis farm revealed that, the farm was a private owned dairy farm which was established in 2000 by three people from Ethiopian, from Holland and America. During its establishment the farm was started with 19 crossbred of Holstein-Friesian dairy cows of unknown blood level.
Photo 7: Indicate interview made with farm Manager of Genesis Farm
During the field study time the farm was increased the number of crossbreed dairy cow up to 100 of 75% to 83.5% exotic blood level. Current the farm has 50 milking cows and produce 700litres of milk per day. See photo 8.
The amount of milk produced per day from these cross breed dairy cows did not enough to sell raw milk at the farm’s café and to process the milk into different dairy products such as pasteurized milk, Gouda cheese, soft cheese, yoghurt and butter. Because of this the farm need additional milk from other farmers and collection of milk was started from smallholder farmers.
To collect the required volume of milk from the farmers, the farm owner was made an agreement with 150 smallholder dairy farmers in Debrezeit town for about one year. After every one year the farm owners made another new agreement with the farmers.
During this agreement there is no fixed amount of milk which the farmers should have to deliver to the farm but the farmers should have to supply his/her milk to the farm without interrupting the amount milk he/she want to deliver. During the filed study time, the farm was collected 3208 litres of milk per day. Table 6 indicate average volume of milk collected per day by Genesis Farm started from 2008 to 2012.
Table 6: Average volume of milk collected/day by Genesis farm from (2008-2012)
Year 2008 2009 2010 2011 2012
Amount collected per day(litres) 880 1075 1518 2391 3208
Source: Collected from Genesis farm internal data at Debrezeit, 2012

31
The following picture is indicated the type of dairy cows found at Genesis farm during the filed study period.
Photo 8: Indicate cross breed dairy cow currently exist in Genesis farm at Debrezeit
Source: compiled from Genesis farm, 2012
To create good relationship with the milk suppliers, the farm also give compensation up to 2000 to 3000 ETB to the target farmers when their milking cow was died. The farm also increases the price of milk when there is high demand for milk before and after long fasting period.
More over the farm also increase the price of milk based of the fat percentage and the quality of milk delivered by smallholder farmers. During the long fasting period of Ethiopian Orthodox religion (for 56day from mid-February to mid-April), the farm did not decrease the price of milk while other competitors like Ada’a dairy cooperative and Holland dairy were decreased. The farm also involved in processing of the collected milk into different dairy products like pasteurized milk, yogurt, Gouda cheese, soft cheese and butter. Some of the processed dairy products which are produced by Genesis farm were showed in picture 9.
Photo 9: Indicate different dairy products produced by Genesis farm
Source: compiled from Genesis farm Debrezeit, 2012

32
Holland dairy
From the case study conducted it was observed that this private milk processing company is one of the competitors of Ada’a Dairy cooperative next to Genesis farm to collect milk from small scale farmers in Debrezeit town. As Genesis farm the company do not have its own milking cow to produce milk but they collect milk from small scale farmers in the town. On Average the company has collected 2800 litres of milk per day from small scale dairy farmers in the study area
Like Genesis farm Holland dairy also have processing plant and process the milk collected into pasteurized milk, yogurt, soft cheese and two type of butter (butter used for bread eating and butter used for painting of hair).The processing company has its own two retailer’s shops in Debrezeit town where they sold their processed dairy products and raw milk.
Photo 10: Indicate different processed dairy products processed by Holland dairy
Source: compiled from Holland dairy at Debrezeit, 2012

33
The selling and purchasing price of different processed dairy products produced by Ada’a dairy cooperative and other two competitors are indicated in table 7.
Table 7: Comparison of purchasing and selling prices of different dairy products
Type of dairy products
Unit Purchasing price and selling price of dairy products
Ada’a dairy cooperative
Genesis farm Holland dairy
Raw milk Litre 8 8.6 8.25
Pasteurized milk Litre 13.5 13 15
Soft cheese Kg 30 28 32
Gouda cheese Kg Not processed 110 Not processed
Butter Kg 150 130 150
Yogurt Litre 18 20 24
Source: compiled from analysis of milk value chain of Ada’a district, 2012 4.2. Dairy producers in Ada’a district This section is deals with the survey results of an interviewed made with 40 smallholder dairy farmers in urban and rural area of the study district through semi-structured questionnaire survey. The detail find of the survey result is separately present in the following sections.
4.2.1. Demographic characteristics of dairy producers Demographic characteristics of dairy producers interviewed with semi-structured questionnaire survey during the field study period were presented in the following sections.
Age Member of Ada’a dairy cooperative had an average age of 39 while non-member of the dairy cooperative who do not involved in formal milk value chain had an average age of 37 years old. The following tables indicate the age distribution of the members and non-members of Ada’a dairy cooperative. Table 8: Indicate age distribution of interviewed farmers in study area.
N Minimum age Maximum age Mean Std. Deviation Std. Error
Members 20 21 51 39 10,110 2,261
Non-members 20 18 46 37 6,996 1,564
Source: compiled from filed study milk value chain analysis at Ada’a district, 2012 Religion Due to long fasting period of Ethiopia Orthodox religion most of the consumers in the study area do not consumed animal origin during this period. The survey result revealed that Orthodox religion is the most dominate type of religion in the study area and has great influence on milk marketing system in the study area.

34
Table 9: Indicate type of religion of the interviewed farmers in the study area
No. Type of religions N Percentage
1 Orthodox 23 57.5%
2 Protestant 10 25%
3 Muslim 7 17.5%
Total 40 100
Source: compiled from filed study milk value chain analysis at Ada’a district, 2012 Sex Out of the total 32.5% of the interviewed small scale dairy farmers who involved in formal milk value chain are male whereas 12.5% who involved in informal milk marketing channel are female. The following figure showed us the proportion of male and female who involved in different milk marketing channels in the study district.
Figure 13: Sex of interviewed farmers at study area Source: Compiled from field survey of milk value chain analysis of Ada’a district, 2012 Educational background The findings of the survey results show that 5% of farmers who have not been in school did not deliver their milk to the dairy cooperative and they sell their raw milk to private milk collectors and direct to local consumers. Only 5% of the interviewed farmers who have diploma and live in urban area have delivered their milk to Ada’a dairy cooperative. All of the members of the dairy cooperative in the study district has reached primary education and above it. In rural area out of the total interviewed farmers only 37.5% farmers have reached primary level education whereas in urban area only 45% of the respondents have reached primary and secondary school. See figure 14.
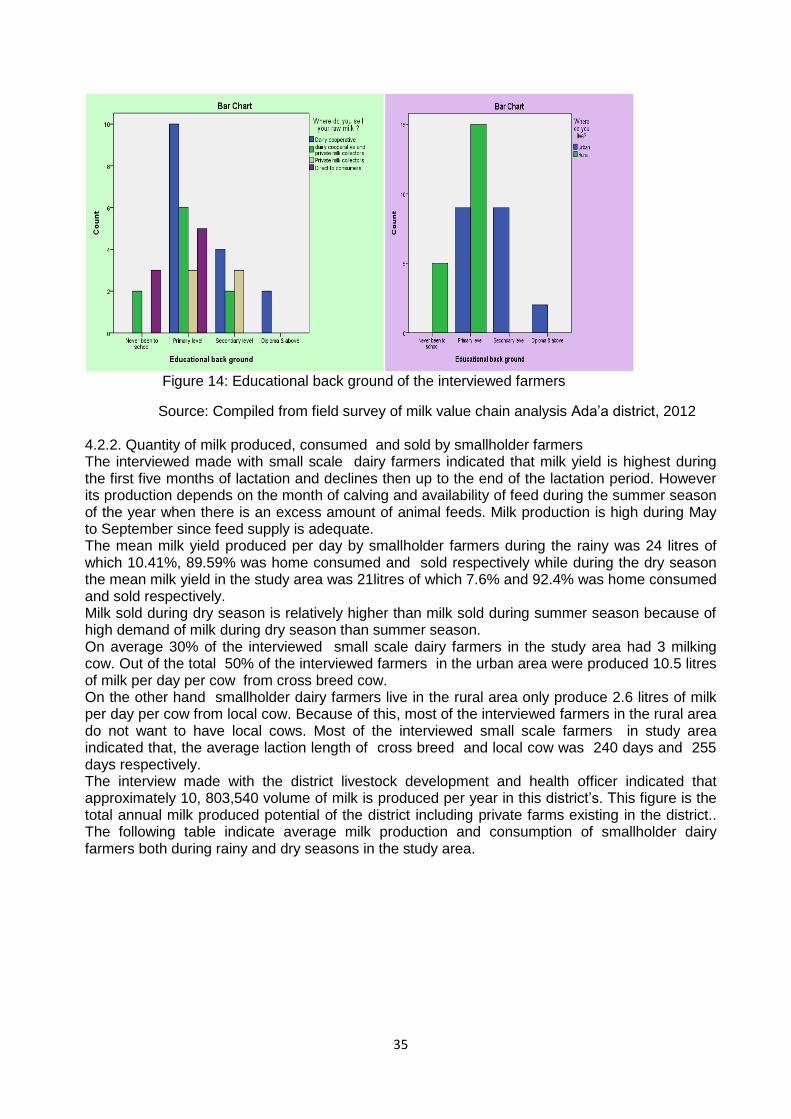
35
Figure 14: Educational back ground of the interviewed farmers
Source: Compiled from field survey of milk value chain analysis Ada’a district, 2012 4.2.2. Quantity of milk produced, consumed and sold by smallholder farmers The interviewed made with small scale dairy farmers indicated that milk yield is highest during the first five months of lactation and declines then up to the end of the lactation period. However its production depends on the month of calving and availability of feed during the summer season of the year when there is an excess amount of animal feeds. Milk production is high during May to September since feed supply is adequate. The mean milk yield produced per day by smallholder farmers during the rainy was 24 litres of which 10.41%, 89.59% was home consumed and sold respectively while during the dry season the mean milk yield in the study area was 21litres of which 7.6% and 92.4% was home consumed and sold respectively. Milk sold during dry season is relatively higher than milk sold during summer season because of high demand of milk during dry season than summer season. On average 30% of the interviewed small scale dairy farmers in the study area had 3 milking cow. Out of the total 50% of the interviewed farmers in the urban area were produced 10.5 litres of milk per day per cow from cross breed cow. On the other hand smallholder dairy farmers live in the rural area only produce 2.6 litres of milk per day per cow from local cow. Because of this, most of the interviewed farmers in the rural area do not want to have local cows. Most of the interviewed small scale farmers in study area indicated that, the average laction length of cross breed and local cow was 240 days and 255 days respectively. The interview made with the district livestock development and health officer indicated that approximately 10, 803,540 volume of milk is produced per year in this district’s. This figure is the total annual milk produced potential of the district including private farms existing in the district.. The following table indicate average milk production and consumption of smallholder dairy farmers both during rainy and dry seasons in the study area.

36
Table 10: Average milk production and consumption by small holder farmers/day
Volume of milk produced, consumed and sold
Season
Rainy Dry
Average milk production per day (litre) 23.95 21
Average milk consumed per day (litre) 2.5 1.23
Average milk sold per day (litre) 21.78 20.14
Source: Compiled from field study of milk value chain analysis at Debrezeit, 2012 In the study area most of smallholder farmers in urban area use zero grazing to feed their cows. As a result of this there is no big difference in the volume of milk produced during the rainy and dry season. There is no big difference in amount of feeds farmers practice in zero grazing area to provided feeds to his milking cows during the rainy and dry season of the year.
The interviewed made with rural dairy farmers indicated that large portion of milk produced in this area was directly sold to consumers where the producers can earn high price per litre of milk. About 62.5% of the interviewed farmers in the study district reported that the trend of their milk production was decreased because of the herd size is reduced as a result of shortage of animal feeds.
Out of the total interviewed farmers 55% of the respondents farmers indicated that average herd size they have decrease as compare to the previous year. Out of the total interviewed 65% of the respondents indicated that dairy derived income was decreased due to reduction in volume of milk produced as a result of limited number of herd size and shortage of availability of animal feeds.
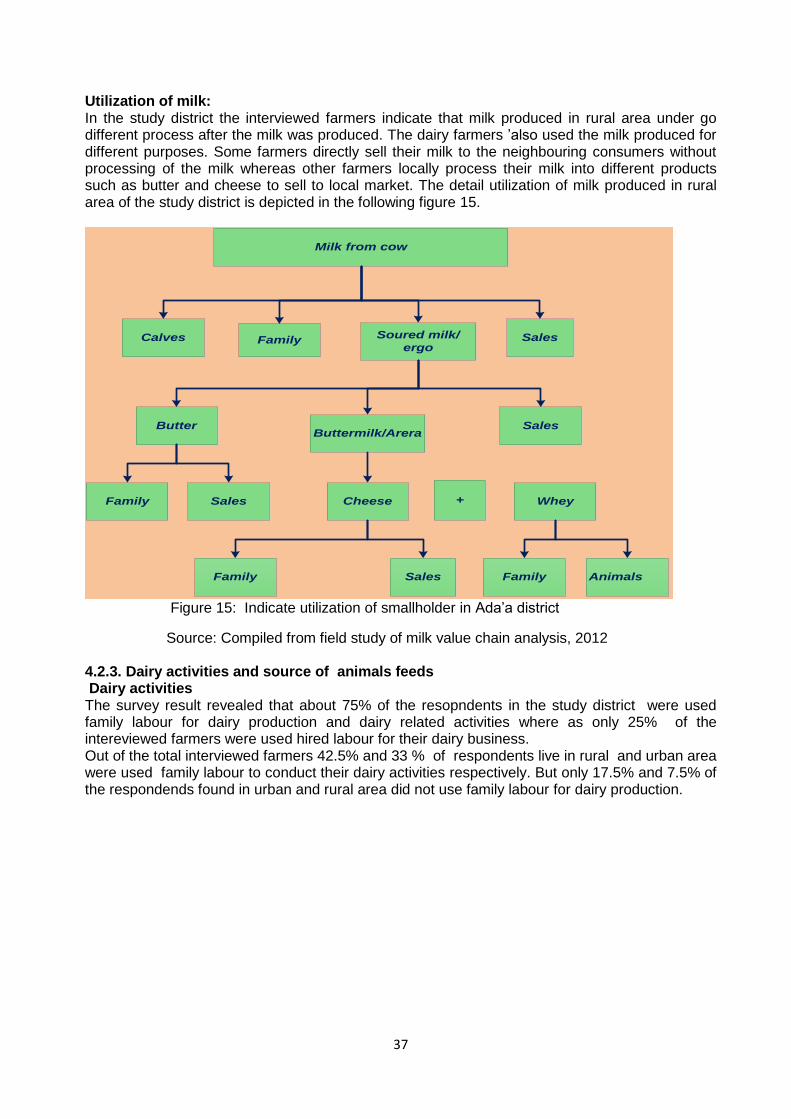
37
Utilization of milk: In the study district the interviewed farmers indicate that milk produced in rural area under go different process after the milk was produced. The dairy farmers ’also used the milk produced for different purposes. Some farmers directly sell their milk to the neighbouring consumers without processing of the milk whereas other farmers locally process their milk into different products such as butter and cheese to sell to local market. The detail utilization of milk produced in rural area of the study district is depicted in the following figure 15.
Milk from cow
Calves Family SalesSoured milk/
ergo
Butter Sales
Family Sales
Buttermilk/Arera
Cheese
Family Sales
+ Whey
Family Animals
Figure 15: Indicate utilization of smallholder in Ada’a district
Source: Compiled from field study of milk value chain analysis, 2012 4.2.3. Dairy activities and source of animals feeds Dairy activities The survey result revealed that about 75% of the resopndents in the study district were used family labour for dairy production and dairy related activities where as only 25% of the intereviewed farmers were used hired labour for their dairy business. Out of the total interviewed farmers 42.5% and 33 % of respondents live in rural and urban area were used family labour to conduct their dairy activities respectively. But only 17.5% and 7.5% of the respondends found in urban and rural area did not use family labour for dairy production.

38
Table 11: Indicate labour division of sampled farmers in milk value chain analysis
Activities Male (%) Female (%) Children (%) Hired labour (%)
Purchasing of inputs 52.5 47.5 0 0
Feeding of cows 20 50 17.5 12.5
Cleaning of barns 40 35 7.5 17.5
Milking of cows 5 95 0 0
Selling of milk 30 57.5 5 7.5
Controll of revenue from sale of milk 15 85 0 0
Source: Compiled from own field study of milk value chain analysis Ada’a, 2012 Source of animals feeds The survey result revealed that all of the interviewed dairy farmers live in urban area do not have any grazing land where as smallholder dairy farmers found in rural area have on average 1.3ha of crop land and they use crop residues for feeding of milking cow especially during the dry season of the year when there is a critical shortage of animal feeds. ( see photo 11)
Photo 11: Indicate marketing of crop residues for animal feeds Source: Compiled from field study of milk value chain analysis Ada’a District, 2012

39
The survey result indicated that most of the respondant in the study district were used purchased feeds such as nough cake, wheat bran, mixed feed, grass hay and crop residues for feeding of their animals and they provide on average 2.5kg of concentrate feeds per day per milking cow. However, if they want to get high volume of milk from their cow they also slightly increase the amount of cencentrate given for their cow. The following photo’s is indicated while an interview was conducted with rural and urban farmers.
Photo 12: Indicate interviewed made with dairy farmers in rural and urban area
Source: Complied from survey result of smallholders in Ada’a district, 2012 4.2.4.Factors and actors affecting milk supply to Ada’a dairy cooperative Side selling In urban area out of the total interviewed farmers 22.5%, 15%, 7.5% and 5% of the interviwed farmerswere were sold their raw milk to dairy cooperative, private milk collectors, both Ada’a dairy cooperative and private milk collectors and direct to local consumers respectively. Where as in rural area out of the total interviewed farmers 17.5%, 17.5% and 15% of the respondents were sold their milk to private milk collectors, Ada’a dairy cooperative and private milk collectors and dirtect to local consumers respectively. Some of the interviewed farmers have sold half of the volume of milk they produced to private milk collectors and the rest half volume of milk to Ada’a dairy cooperative. See figure 16.
Figure 16: Indicate milk marketing in urban and rural area.
Source: Compiled from field study of milk value chain analysis, 2012

40
Shiting from dairy cooperative to other private milk collectors The survey result show that out of the total interviewed farmers 12.5% of the respondent were shifting from Ada’a dairy cooperative and do not sell their milk to the cooperative. They have sold their milk to private milk collectors and directly to the local consumers.
Figure 17: Indicate milk marketing channel of members and non mebers
Source: Compiled from field study of milk value chain analysis, 2012 All the interviewed members of dairy cooperative in the study area mentioned that they did not receive any dividend since the estabilshement of the dairy cooperative. Some of the members also raised that the cooperative received an extra 1 litre of milk whenever the memebers deliver 10 litres of milk and from one litre half litre of milk for the purpose of serve charge. More over during long fasting period of Ethiopian Orthodox Church Ada’a dairy cooperative decrease the price of 1litre of milk to 7.5 Birr when other private milk collectors did not decease the price of of milk during this period. Because of this issues the members of the cooperative were shifted from dairy cooperative to other private milk collectors who paid them high price per litre of milk. During the field study time barging power of private milk collectors, high feed cost, weak relationship of Ada’a dairy cooperative and its members, reduction in volme of milk produced by smallholder farmers due to low availability and high cost of animal feeds and strong competitors are identified as the major factors and actors that directly and/or indirectly affects the volume of milk procurment by Ada’a dairy cooperative in the study district.
4.2.5. Major constriants of milk value chain in the study area During the field study time, some of the major problems/constraints that faced different actors involved in milk value chain of the study area were assessed and it resuluts is summaried and presented in figure 18.

41
-Perishability of the
products during long
fasting of Ethiopia
Orthodox church,-Mismatched between supply and demand
-Lack of
processing
facilities such as
plastic cup and
others
-High cost of plastic
cup
-Lack of
facilities for storage
of processed
products
-Low income
consumers did not
want to buy
pasteurized milk
-Low volume of milk
production due to
high cost feeds
-Low availability of
animal feeds
-Shortage of improved
breeds/ cross breed
cow.
-Shortage of animal
feeds.
-High cost of artificial
insemination
Input
supplyingProducing marketing processing ConsumingRetailing
Core constraints of milk value chain in study area
Figure 18: Indicate core constraints in milk value chain in the study area
Source: Compiled from field study of milk value chain analysis Ada’a district, 2012 4.3. Actors’ shares in formal and informal milk value chain Based on the collected information during the filed study period the value share of each actors involved in formal and informal milk value chain of the study area were calculated. The data used to calculate the variable costs of smallscale dairy farmers incurred to produce 2520litres of milk per cow per year is indicated in table12 . To produce this volume of milk, on average small holder farmers provided 2.5kg of concentrate feed and two sacks of crop residues per day per cow for cross breed dairy cow upto 7months to produce 10.5 litres of milk per day per cow. From 7 months on wards for about 5 months the farmers provided 1.5 kg of concentrate feed and 2.5 sacks of crop residue for his cow per day per cow. Data gathered from survey, case study and secondary data was used to calculate the value share of different actors involved in formal and informal milk marketing channels. The following parameters were used to calculate simplified gross margins according to HPC (2007) and share of actors in milk value chain based on Kahan (2004).
Gross output– milk produced by small scale farmers.
Variable cost (direct costs)- cost that are directly relate to the amount of milk producted.
Fixed costs (indirect costs)- cost incurred on durable assests (depreciation, interest, maintenance).
Gross margin(gross profit)- gross output minus variable costs
Profit/loss- gross out minus total cost (total variable costs+ total fixed costs) this can be expressed per unit of product (litre of milk) or per whole products.
For the following net profit caculation only farmers using zero grazing system and have cross breed dairy cow live in urban area were used for this value share calculation of producers and other chain actors. All the costs used in this value share and net profit calculation is based on farmers and other chain actors estimation what they incurred to run their business activities. Farmers and other actors in study area do not well adapted in record keeping system because of this estimation of cost they incurred is used for this net profit calculation.
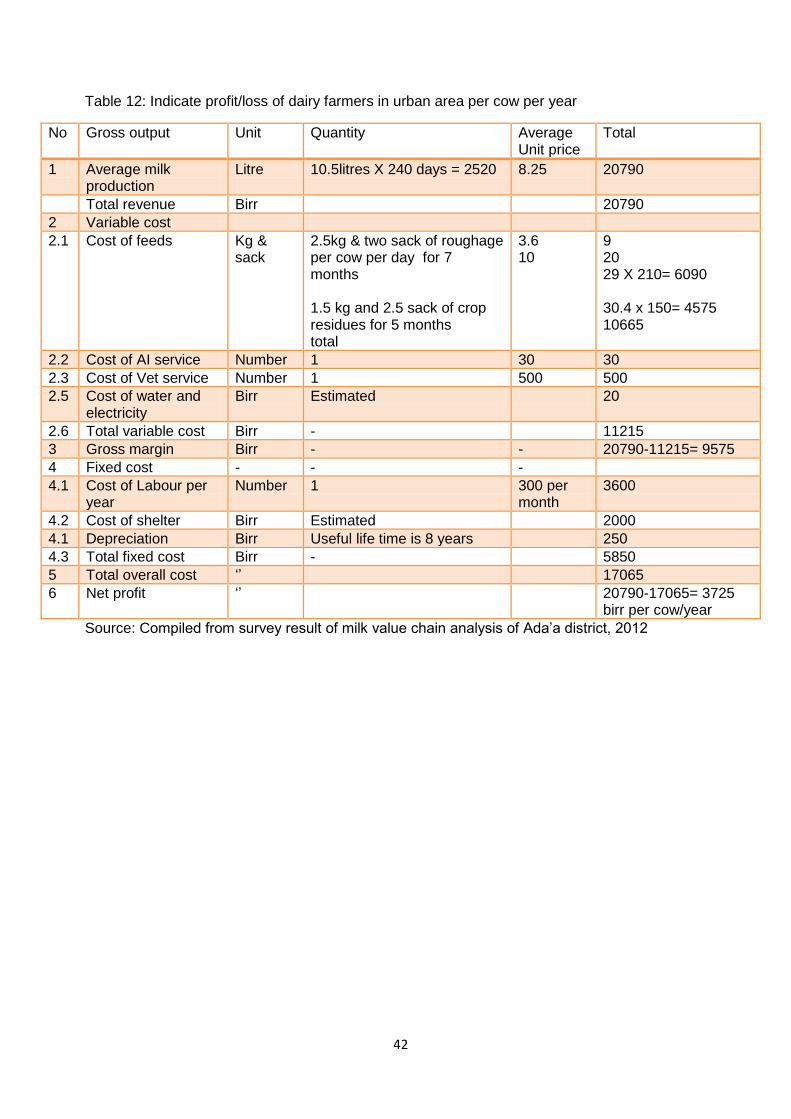
42
Table 12: Indicate profit/loss of dairy farmers in urban area per cow per year
No Gross output Unit Quantity Average Unit price
Total
1 Average milk production
Litre 10.5litres X 240 days = 2520 8.25
20790
Total revenue Birr 20790
2 Variable cost
2.1 Cost of feeds Kg & sack
2.5kg & two sack of roughage per cow per day for 7 months 1.5 kg and 2.5 sack of crop residues for 5 months total
3.6 10
9 20 29 X 210= 6090 30.4 x 150= 4575 10665
2.2 Cost of AI service Number 1 30 30
2.3 Cost of Vet service Number 1 500 500
2.5 Cost of water and electricity
Birr Estimated 20
2.6 Total variable cost Birr - 11215
3 Gross margin Birr - - 20790-11215= 9575
4 Fixed cost - - -
4.1 Cost of Labour per year
Number 1 300 per month
3600
4.2 Cost of shelter Birr Estimated 2000
4.1 Depreciation Birr Useful life time is 8 years 250
4.3 Total fixed cost Birr - 5850
5 Total overall cost ‘’ 17065
6 Net profit ‘’ 20790-17065= 3725 birr per cow/year
Source: Compiled from survey result of milk value chain analysis of Ada’a district, 2012

43
Table 13: Variable cost of dairy cooperative incurred to collect and processing milk per day
Variable cost Quantity Unit price Total cost
Cost of transportation of milk from MCC to processing plant
6 litres of diesel
13 ETB 78
Cost of plastic bag for packaging of milk
one 2 ETB 8000
Cost of electriccity (generator) One day 500 500
Cost of transportaion of processed dairy products to retailers
111 litres of diesel
13/litre 1448
Cost of milk collectors for collection of milk from MCC.
4 persons 19 76
Total variable cost to collect and process 400 0litres of milk/day
10102
Source: compiled from filed stud of milk value chain analysis of Ada’a dairy cooperative, 2012 The share of smallholder farmers and other actors involved in different milk marketing channel of the study district is depicted in table 14. Table 14: Indicate value share of dairy cooperative in milk value chain/ litre of milk.
Chain actors
Variable cost (ETB)
Revenue Gross income
Added value
Gross margin Value share
Small scale producer
4.5 8.0 3.5 8.0 43.6% 44.4%
Dairy cooperative
2.5 13.5 11 5.5 81.5% 30.6%
Retailer 1.25 18 16.75 4.5 93.1% 25%
Source: compiled from filed stud of milk value chain analysis of Ada’a district, 2012 Table 15: Indicate value share of private milk processor and other actors/ litre of milk.
Chain actors Variable cost (ETB) Revenue Gross income
Added value
Gross margin Value share
Small scale producer
4.5 8.6 4.2 8.6 48.8% 47.8
Private milk processor
2 14 12 5.4 38.6% 30%
Retailer 1.25 18 16.75 4 93.1% 22.2%
Source: compiled from filed stud of milk value chain analysis of Ada’a district, 2012

44
Table 16: Indicate value share of producers involved in informal milk marketing channel
Chain actors Variable cost (ETB)
Revenue Gross income
Added value
Gross margin
Value share
Small scale producer
4.5 8.4 3.9 8.4 46.4% 76.4%
Private milk collectors
1.25 11 9.75 2.6 88.6% 23.6%
Source: compiled from filed stud of milk value chain analysis of Ada’a district, 2012
The value share of smallholder dairy farmers obtained from milk marketing by direct selling of their milk to the neighbouring local consumers is depicted in table 17. This value share is calculated for comparison of value share of different actors in table 14, 15 and 16 above.
Table 17: Value share of smallscale dairy farmers sell of their raw milk to local consumers
Chain actors Variable cost (ETB)
Revenue Gross income
Added value
Gross margin
Value share
Smallscale producers
4.5 10 5,5 10 55% 100%
Consumers 10 0 0 0 0 0
Source: compiled from filed stud of milk value chain analysis of Ada’a district, 2012 Data gathered from survey, case study and secondary data was used to calculate the value share of different actors involved in formal and informal milk value chain of the study district is showed in figure 19.
Figure 19: Indicate formal and Informal milk value shares
Source: compiled from filed stud of milk value chain analysis of Ada’a district, 2012
44.4%
30.6%
25%
Formal milk value share
Producers
Processors
Retailers 76.4%
23.6%
Informal milk value share
Producers
Private milkcollectors

45
4.4. SWOT analysis of Ada’ a dairy cooperative Strength
Ada’a dairy cooperative has created strong marketing segments (opportunity) for its members in Addis Ababa city for sustainable marketing of processed dairy products.
Ada’a dairy cooperative has established 14 milk collection centres which are easily accessible for its members for easily deliver of their milk.
The cooperative provides mobile AI and animal health services for its member’s by reasonable prices.
Weaknesses
Less accountability and transparency from the management of Ada’a dairy cooperative to inform its members on financial status and the progress of their cooperative.
Low commitment from members’ side to deliver all volume of milk they produced to fulfil the capacity of the processing plant.
Low linkage of cooperative with external support to get financial support from different business environment such as different NGO and actors.
Lack of cooling tanks and laboratory equipment at milk collection centres for better milk quality control.
Opportunities
The established processing machine has a capacity of processing 15,000litres of milk per day create an opportunity to collect huge volume of milk from its members.
Presence of good government policy which help dairy cooperative to improve its position in milk value chain. This role is mainly played by Ada’a district cooperative development office.
Presence of high income customers from the capital city of the country who need Ada’a milk and milk products.
Threat
There are more than 200 days that the believers of Orthodox Christians abstain from eating of animal origin. This has great effect on milk marketing during potential dairy cooperative during these periods.
High competition for milk from informal/ local markets.
Pasteurized milk consumption is not familiarized by local markets and people prefer to drink boiled whole milk.
Absence of milk quality control from government side creates great chance for private milk collectors who do not care about the quality of milk. This influence the milk collecting potential of Ada’a dairy cooperative who need to collect high quality of milk to satisfied its customers.
There are strong competitors/ new entry who compete with Ada’a dairy cooperative and play great role in collecting of high volume of milk from smallholder farmers.

46
CHAPTER FIVE: DISCUSSION 5.1. Inputs providers During the field study period some of the governmental and non governmental organization who involved in provision of AI service, veterinary service, improved forage varieties and value addition technologies were identified. Among these actors Debrezeit agricultural research center, Addis Ababa university faculty of Veterinary medicine, National artificial insemination center, Ada’a dairy cooperative and private sectors are some of the major actors who closely support smallholder dairy farmers in provision of different inputs to improve the production and productivity of livestock in the study area. This field study result and the finding of Anteneh(2008) have similarity who reported that governmental organiaztion and private sector play a vital role in provision of different inputs. He also categorized the service delivery system of the study area into four main types such as animal feed suppliers, animal health providers, Al and improved bull service providers and financial service providers Non governmental organizations also provided improved forage and pasture seeds, trainings and demonstrate dairy technologies for the target farmers in the study area. However there is limited capacity of value chain actors in supplying inputs and there is high demand for cross breed dairy cow and other inputs from regional government. Some farmers indicated that AI service provided by private sector is very expensive (50 to 70ETB per cow) as compare to AI service provided by Ada’a dairy cooperative which cost 30ETB per cow. SNV(2006) reported that the cost of bull service is 15 ETB and the cost of AI service is 12ETB. This variation in cost of AI service is because of the cost of crossed breed heifer/cow is very expensive now a day. Hence farmer prefer to have crossbreed heifer by inseminating his loca cow with exotic semen rather than buying cross breed heifer with high cost. 5.3. Milk production Most of the interviewed small scale dairy producers in the study area produce on average 10.5 and 2.6 litres of milk/ day/ cow from crossbreed and local cow respectively. This finding is aligned with the finding of Anteneh(2008) who reported that average milk yield per cow per day from cross breed and local cow were 9.63 and 2.10 litres respectively.This variation in the average milk yield per cow between cross breed and local cow is attributed due to the difference in breed, management and feed systems. On average farmers in the study area produces 2520 and 535.5 litres of milk per cow per year from cross breed and local cow respectively. The current average milk produced from local breed cow is comparable with the study conducted by Alemuet..et.al (2000) who report that the milk yield of local cow was 400-680 kg of milk per cow per lactation period. Holloway et al. (2002) reported that cross breed cow produced 1120-2500 liter over a 279 day lactation period.
The survey result revealed that average lactaion length of cross breed and local cows in the study area was found to be 240 and 255 days respectively. This because of the fact that some of dairy farmers reported that they have milked their cow even during the whole pregancy period. This finding have similarity with the finding Solomon (2008) who reported that the average lactation lengeth of cross breed daiy cow is 249.9 days. According to Holloway et al. (2002) the average lactation length of cross bred was 279 days. This difference in lactaion lengeth of cross breed dairy cow is because of the effect of the availability of animal feeds during rainy and dry season which prolonged or shorted the heat period. Smallscale dairy farmers in the study area have 3 crossbreed and 1 to 2 local milking cows and they produced 23.95 and 21 litres of milk per day during rainy and dry season respectively.

47
5.4. Milk marketing channels Out of the total interviewded smallholder dairy farmers 35% of the respondents were sold their raw milk through informal milk marketing channels. Where as 25% of the respondents farmers were sold their milk through both informal and formal channels. There are many milk marketing channels through which smallholder dairy farmers sell their dairy products. However, most of the dairy farmers in the study area were preferred to sell their milk through informal chain where they get high price per litre of milk. This finding have similarity with the finding of (Van der Valk and Tessema 2010) who reported that 98% of milk produced in rural area were sold through informal chain where as only 2% of the milk produced is reached the final consumers through formal chain. Muriukiet. et.al (2001) also reported that the proportion of total production being marketed through the formal markets still remains small. Formal markets are particularly limited to peri-urban areas and to Addis Ababa. Van der Valk and Tessema (2010) reported that informal milk marketing channel is characherized by no licensing requirement to operate, low cost of operations, high producer price compared to formal milk marketing channel and no regulation of operations. Because of this most of smallholder farmers in study area want to sell their dairy products where they get high price.This system of milk marketing channel is still remained dominant in the study area.
The interviewed made with the General manager of Ada’a dairy cooperative indicated that Ada’a cooperative flow both formal and informal milk marketing channels to sell their raw milk and processed dairy products. On average this organization sell 134 litres of raw milk per day to low income urban consumers at each milk collection centres soon after collection of milk. The reason why this cooperative is involved in direct selling of raw milk to low income urban consumer is there high demand of milk in the study area. In this area supply is very far below than demand as a rseult of this the dairy cooperative sell one litre of milk by 10ETB to low income urban consumers. Some time when the demand is very high during dry season and before long fasting of Ethiopia Orthodox church, the dairy cooperative sell one litre of milk by 12 ETB.
However, during long fasting period of Ethiopian Orthodox church almost for about two month started from mid-February to mid-April most of the people in the study district abstain eating of animal origin. During this time the demand of milk and milk product is very low and the cooperative and dairy farmers in the study area faced big challenge to sell their dairy products.
Van der Valk and Tessema (2010) indicate that the calendar of orthodox Christian church involves three prolong fasting period per year (before Easter, in August, in December) and two fasting period every two weeks (Wednesday and Friday ) for a total of more than 200 days per year. During fasting period most of most of Orthodox Christian abstain from consuming products of animal origin. The survey result showed that about 57.5% of the interviewed farmers are Orthodox religion follower and they do not consume animal origin during this time. The study conducted by SNV (2006) also indicated that orthodox Christian comprises about 60% of population of his study areas. This indicates that many people of Ethiopia are Orthodox religion believers and they have great role in milk marketing during the long fasting period. See table 19.
Table 18: Indicate date of fasting period of Ethiopian Orthodox church
Fasting periods in Orthodox church
Jan Feb Mar April May June July August Sept Oct Nov Dec
55days 16days 30 days
There is also mismatching in the supply and demand of dairy products during long fasting and after fasting period. After fasting most of the members of the dairy cooperative start to sell their milk to private milk collectors and directly to local consumers. As a result of this Ada’a dairy

48
cooperative did not get enough amount of milk. But during the long fasting period all the members of the dairy cooperative return back to the dairy cooperative to sell their raw milk. Even though the dairy cooperative decrease the purchasing price of milk, the members accept what the cooperative paid for them due to they do not have any option. There is price difference during long fasting period and after long fasting periods. During long fasting period Ada’a dairy cooperative purchase one litre of milk by 7.25 ETB from its members and other private milk collectors did not change the purchasing price of milk from the farmers. 5.5. Function of Ada’a dairy cooperative in milk value chain Ada’a dairy cooperative is one of the largest dairy cooperative in Ethiopia and have 206 members who actively deliver their milk to the dairy cooperative. SNV (2008) reported that the cooperative has 813 members and has grown from its inception of 34 members in 1996. This Author also indicates that during the year of 2008 Ada’a dairy cooperative has collected about 8000litres of milk per day from its members. At that time this dairy cooperative is involved in collecting, processing and marketing of processed products like pasteurized milk, butter, soft cheese and yogurt and distributing of processed products to its retailers in Debrezeit town and Addis Ababa city.
Now a day the dairy cooperative collects 4745 litres of milk per day from 206 members. The volume of milk they procurement almost decreased by half because of there is strong competitors who collect huge volume of milk from the members. Because of this the dairy cooperative have got a value share of 30.6% which is almost the same to the value share private milk collectors which is 30%. This finding is similar with the finding of Gizachew (2005) who reported that dairy cooperative have got 28.3% milk value share. SNV (2008) reported that the revenue share 51% and 26% for producers and processer respectively.
Even though Ada’a dairy cooperative has bought the processing machine which has a capacity of processing 15000litres of milk per day, the processing machine operate under its capacity due to low supply of milk by its members. This report is similar with the finding of SNV (2008) who reported that most dairy plant in the country are operating under capacity, i.e., less than 40% due to low supply of milk from supply side. 5.6. Factors affecting volume of milk procurment by Ada’a dairy cooperative 5.6.1. Side selling Out of the total interviewed farmers 35% of the members of the dairy cooperative sell their milk directly to local consumers and private milk collectors. Out of the total interviewed farmers only 40% of the respondents were frequently deliver their milk to dairy cooperative at the collection centers and other 25% of the interviewed farmers sell their milk both to dairy coopeartive and private milk collectors. As a result of side selling, the dairy cooperative did not get sufficient amount of milk to process raw milk in to different dairy products and the processing plant worked under its capacity. Due to there is price difference what Ada’a dairy cooperative is paid for its members and other competitors paid for farmers, the members always looking for better price to sell their dairy products. Ada’a Dairy cooperative buy one 1litre of milk by 8ETB from its members whereas other competitors’ like Genesis farm buy one litre of milk by 8.6 ETB. This price difference per litre of milk attracts farmers from Ada’a Dairy cooperative to sell their milk to private milk processing company. The private milk processing company is known as Ada’a dairy cooperative bought the processing machine by credit and the dairy cooperative paid 17,567ETB per month to return the money borrowed from cooperative bank of oromia. Because of this the private milk processing company purposively increase the price of milk to push out the Ada’a dairy cooperative from the market.

49
5.6.2. Reduction in volume of milk production Out of the total interviewed farmers 62.5% of the respondents were indicated that the trend of their milk production is decreased. Especially respondents in the rural area mentioned that there is a shrinkage of grazing land in the study area because an expansion of cereal production due to an ever increasing of human population. As a result of shrinkage of grazing land some of the interviewed farmers reduced their herd size and has changed large number of local cow to few number of crossbreed cows due to the problem of animal feeds. From the field study result it was observed that 55% of the respondents were mentioned as the trend of their herd size is steadily decreased as compare to the previous year. This reduction in herd size in the study district lead to an overall reduction in volume milk produced in the study areas.
As a result of reduction in volume milk produced by small scale dairy farmers, the members could not deliver the same volume of milk as they have been delivered. On top of this availability of the required amount of feeds also create a big problem to produce and deliver the volume of milk needed by the processing plant.
5.6.3. Production cost From the total interviewed farmers 67.5% of the respondents farmers rank high cost of animal feeds as the main problem of milk production in the study area. UNIDO(2009) reported that due to severe shortages of animal feed supplies, the cost of running a dairy farm is becoming more expensive. He also indicate thate ever increasing cost of feed was the primary reason that one of company assessed was closed its dairy farm and continuning processing by outsourcing the milk. Similarly some small holders in regional towns are also closed their farms because of the scarcity of feed supply or excessive cost of feed. Similar to this finding SNV(2006) reported that in cmmercial dairy production system, feed costs constitute 74% of the total on farm production costs while labour cost accounts for only 6% of farm costs. This Author also stated that Ethiopia has high cost of production because of about 70% of the farmers produce less than half of their fodder requriment and rely on bought commericial cut and carry fodder, brewer’s waste and oilseed cakes.
The current field study also indicated on average smallholder dairy farmers in urban area cost 29 ETB to feed one milking cow per day to produce 10.5 litres of milk per day per cow from crossbreed cow. Most of the interviewed farmers indicated that the cost of animal feeds increase from time to time but the price of milk is very cheap as compare to the cost of animal feeds.
The study district is well known by cereal production especially white teff and other cereal crops. As a result of this there is no free grazing land, this make the price of animal feed very high relative to other places. There is a big problem in availability of animal feeds both in quantity and in quality which affect the volume of milk produced by the farmers consequently which influence the volume of milk collected by the Ada’a dairy cooperative.
Out of the total interviewed farmers 87.5% of the interviewed farmers indicate as the trend of availability of animal feeds is decreased. Not only cost of animal feeds but also the availability of animal feed is also very challenge for small-scale dairy farmers to feed their animals. This is because of an ever increase of human population which leads to expansion of cropping land and construction house for human dwelling. This leads to shrinkage of grazing land which is consequently affects milk production.
5.6.4. Miss trust From the field study conduct it was observed that there is strong distrust between the dairy cooperative and its members on the income of the dairy cooperative to collect their dividend. Even though 40% of the benefit of the Ada’a dairy cooperative is planed to distribut dividend to its members when the total capital of the cooperative reached 15 million ETB, all of the interviewed members of the dairy cooperative raised as they did not receive any dividend from the organization since the establishment of the cooperative in 1997.
50
This issue made the members distrusted the cooperative as the income generated from dairy product marketing business do not properly used for the cooperative development. During the interviewed time some members said that beyound to be the members of the cooperative they did not get any benefit from the cooperative where as other members still have strong vision about the development of the cooperative for the future time in order to get high benefit from the organization. The cooperative also well aware as the members’ sell their milk to private milk collectors and the private milk processing company purposively increase the price of milk above the normal price to fail Ada’a dairy cooperative. Because of this the cooperative try to control the members who involved in side selling of their milk by receiving the same volume of milk during fasting and after fasting period. Since most of private milk processing company do not want to purchase huge volume of milk during long fasting of Ethiopia Orthodox Church, the members who involved in side selling of their milk faced big challenges to sell their dairy products during this period.
5.6.5. Competitors There are different private milk processing companies who strongly compete with Ada’a dairy cooperative to purchase milk from small scale dairy farmers in the study district. Due to strong competition especially with Genesis farm and Holland dairy, the Ada’a dairy cooperative could not collect huge volume of milk. This dairy cooperative has bought the processing machine on credit and they paid 17,567ETB per month to return the money borrowed from Oromia cooperative bank. The private milk processing company they known this issue and they purposively increase the price of milk to attract more farmers and to make Ada’a dairy cooperative out from competition. The survey conducted by Anteneh(2008) indicated that Genesis farm use its own farm milk and purchased milk to produced processed dairy products. This Author also showed that the farm use 40% its own farm milk and 60% of milk from small scale dairy farmers to process into different dairy products. Now a day the farm increased its volume of milk collected from smallholder dairy farmers to 3000 litres per day while the volume of milk collected by the dairy cooperative per day is decreased to 4745litres from 8000litres. In addition to this unlike the dairy cooperative the farm collects milk only at the processing site from 151 customers by paying highest price. More over the farm offers compensation for dairy farmers when their milking cow was died and provides feed for the customers on credit basis. Because of this small scale dairy farmers are very interested to sell their milk to Genesis farm rather than dairy cooperative who did not give any compensation when the members lost their milk cow.
51
CHAPTER SIX: CONCLUSION AND RECOMMENDATION 6.1.Conclusion From the field study conducted the main cause of declining the volume of milk procurement by Ada’a dairy cooperative was identified and mentioned as flow: 1. Side selling is one of the main causes of decline in the volume of milk procurement by Ada’a dairy cooperative. There is a high demand for milk and milk products especially before and after long fasting period of Ethiopia Orthodox Church. During this time the supply of milk is very far below than demand of milk. The price of milk also vary which is high before and after long fasting period and very low during long fasting period. Because of this most of the members of Ada’a dairy cooperative are involved in side selling their milk to other private milk processing company.
2. There is no transparency between the members and Ada’a dairy cooperative on financial status of the organization. The members of Ada’a dairy cooperative looking forward to receive their dividend which is equal to 40% of the total benefit the dairy cooperative earned from bulk marketing. However, Ada’a dairy coopetative did not pay the dividend to its members since the establishement of the dairy cooperative in 1997. Because of this the members do not trust the cooperative and some members totally stop deliverying of milk to Ada’a dairy cooperative and shift to private milk collectors where they can get high price. Where as other members divided the volume of milk they produced into two and sell more than half of the milk to private milk collectors and the rest few volume of milk they delivered to Ada’a dairy cooperative. Since there is no contractual agreement between Ada’a dairy coopertative and its members on the amount of milk the members should to delivered to Ada’a dairy cooperative per day, they members do not oblige to deliver fixed volume of milk per day. Their relationship is based on trust building and the members did not trust the Ada’ a dairy cooperative to deliver all the volume of milk they produced. Because of the members did not get economic benefit from the organization/the cooperative. 3. High competitors/private milk processers company such as Genesis Farm, Holland dairy, Mama, Lema and Family milk affected the volume of milk procurement by Ada’a dairy cooperative. Ada’a dairy cooperative bought its processing machine by tooking loan from Oromia cooperative bank and now they return this loan to Oromia cooperative bank. As a result of this the dairy cooperative could not compete with other competitors before and after long fasting period when the price of milk is very high. During this time other competitors increase the price of one litre of milk above normal price to attract the member of Ada’a dairy cooperative subequently to collect huge volume of milk. During the long fasting period (56 days) when there is low demand of milik and milk products all the members return to Ada’a dairy cooperative. During this time all private milk collecters, traders and other actors who directly involved in raw milk marketing faced big challenges to sell their milk. However, Ada’a dairy cooperative and other private milk processing company are involved in processing of raw milk into butter and cheese to avoid spoilage of raw milk to increase the shelf life of processed dairy product upto long fasting is passed. 4. High cost of inputs especially feed cost negatively affects expansion of dairy farming activities as rural farmers do not use concetrate feeds to improve their milk production. This conesuqently affects overall reduction of volume of milk produced by smallholder dairy farmers to deliver the requried volume of milk to the dairy cooperative. In addition to this delays above fortnightly (14days) in payement of the price of milk collected by Ada’a dairy cooperative from its members the members faced financial shortage to purchase concenterated feeds for their milking cow. Some times the members stayed up to one month without receiving of the price of milk they delivered to the cooperative This force the members to rush out from Ada’a dairy cooperative and to search other private milk processing company who paid the cost of their milk on time.

52
5. Only Ada’a dairy coopeartive and few private milk processing comapny has conducted milk quality control at milk collection centres and at dairy plant by using lactometer and alcohol test to check whether the farmers add water and foreign bodies to their milk or not. Milk rejected by Ada’a dairy cooperative is accepted by other private milk processing company due to this there is weak relation ship between Ada’a dairy coopertive and its members. Because of the members seems as Ada’a dairy cooperative simple reject what milk milk can not be rejected.

53
6.2. Recommendation
To build trust and to increase its relationship with the members, Ada’a dairy cooperative should have to provide strong economic benefit for its members through sharing and pooling resources. This will be accomplished through adapting the following cooperative success factors:
Commitment, accountability and transparency of executive committee of Ada’a dairy cooperative play a vital role for the success of Ada’a dairy cooperative. Therefore, there must be training for management and the management must be willing to use modern value added technologies such as diversification of processed products by focusing on consumers’ interest/ consumer segmentation.
Members must be delivered all volume of milk they produced to dairy cooperative in order to get equal benefit from the organization.
Ada’a dairy cooperative should have an external support who support the cooperative in order to compete with the current high competitors in the study area.
Service must be member-oriented to attract, motivate and satisfy the members because of commitment the members are very crucial for the success of Ada’a cooperative.
To overcome the problem of side selling the dairy cooperative should have to modify the agreement made with its members by specified the volume of milk the members should have to deliver to the cooperative per day
The cooperative should have to give bonus/incentive to its members when the member’s continue deliver the same volume of good quality milk before and during long fasting period of Ethiopia Orthodox church to make the members more commitment.
There should be auditing of the organization by external auditors once a year and the result of the Audit report should be officially announced to the members to build trust between the cooperative and its members.
The cooperative should have to expand its collection centres to rural area where they can collect huge volume of milk per day to fulfil the efficiency of the processing plant.

54
REFERENCES
Ahmed M., M., Whui, S. and Yemesrach A., 2004. Dairy development in Ethiopia EPTDD discussion Paper No.23 International Food policy research Institute, Washington. DC.
Alemu, G., Alemayhu, .M, Solomon, D., Seyuom, B., and Aynale, 2000. Status of Dairy research in Development project (SDDP)Proceeding, Ministry of Agriculture (MOA). Addis Ababa, Ethiopia.
Anteneh, G., 2008. Dairy Service Delivery in Debrezeit Milk shed of Ada’a district Central Ethiopia: Analyzing options To Develop Pluralistic Service Delivery in the Dairy Sector. M.Sc. Thesis. Haramaya University Department of Rural development and Agricultural Extension. Haramaya. Ethiopia
Asfaw,N., 2010. Improving of smallholder farmers marketed supply and Marketed supply and market access for dairy products in Arsi Zone Ethiopia.
Asian Development Bank, 2005. Making Value chain work Better the for Proor. Hanoi/vetnam
Azage, T., Z sileshi, M. Tadesse and M.Alemayehu, 2002. Scoping study on urban and peri-urban livestock keeping practices in Addis Ababa. Part 1. Literature reveiew on dairy production management and marketin ILRI and EARO.
Bernard T., A. Birhanu, E. Gabre-Madhin, 2006, Linking Ethiopian smallholders to markets: The promise and pitfalls of collective ation, ESSP Policy conference brief, IFPRI and EDRI no.10, IFPRI-EDRI, Washington.
Center for Cooperatives, 2004. Working togather for strong cooperative. University of Wisconsin, Madison,U.S.A
Central statical agency (CSA), 2008. Ethiopia Sample survey Enumeration. Addis Ababa. Ethiopia
Community of Practice on value Chain in Rural Development, 2007. SDC conference
Coronado, J.J.A,BiJmna,J.,Omta,O.,and Lansink, A.O.2010. Relationshiop characteristics and performance in fresh produce supply chains: the case study of the Mexican avocado industry. Journal on chain and Network science 10(1): 1-15.
Eshetu, T., 2008. The role of Dairy Cooperatives in stimulating innovation and market oriented smallholders Development: MSc. Thesis, the case of Ada’a Dairy cooperative Centeral Ethiopia, Haramaya University.
FAO, 20008 Improving smallholder farmers marketed supply and Market access for dairy and dairy products in Arsi Zone,, Asela. Ethiopia
Gereffi,G.,and Christian, M.2010. Trade transnational corporations and food consumption:A Global value chain approach. In G. Hawkes, C. Blovins, S.Henson N.Drager.and L, Dube(EDs). Trade, food diet and health: Perspective and policy options (PP91-1100). Oxford. United kingdam: wiley-Blackell.
Gereffi, G., and Korzeniewicz, M. eds. 1994. Commodity chains and global capitalism. Westport.CT.
Gizachew, G., 2005. Dairy Marketing patterns and Efficiency: The case of Ada’a District Eastern Oromia. M.Sc. Thesis Presented to Alemaya University, Ethiopia.

55
Government of Ethiopia, 2007. The Livestock Master Plan Study Report. Addis Ababa, Ethiopia
Francesconi G.N., 2006. Promoting milk quality in smallholders cooperatives: Evidence from Ethiopia, ESSP Policy conference brief No.9, IFPRI-EDRI, Washington.
Haese M.D, G.N. Francesconi and R. Ruben, Ruben, 2005. Network management for dairy productivity and quality in Ethiopia. A paper Presented on the 92nd seminar of quality Management and Quality assurance in Food Chains, Gottingen.
Hiller, S., 2003. Accumulating to A Future in Dairy, A multinomial logit analysis of the impact of the dairy cooperative and initial assets on the accumulation of dairy stock in Debrezeit, Ethiopia.
Holloway, G., Nicholson C., Delgado C., Staal S., and Ehui s., 2000. Agro industrialization through institutional Innovation: Transaction costs, Cooperatives and Milk-Market Development in The East-African Highlands. Agricultural Economics, 23:279-288. A collection of studies employing Gibbs sampling and data from the Ethiopia highlands, socio-economic and policy research working paper 48. ILRL. Nairobi, Kenya.
HPC, 2006. Value chain concept, Training course manual HPC and MDF, Ede, The Netherlands
J.E. Austin Associates (2007). Using Value chain approaches in agribusiness and agriculture in Sub-Saharan Africa (Paper). Retrieved July 13, 2012, From htt;//www.technoserve.org/assets/documents/Vcguidenovpdf
Kahan, D., 2004. Farm economics hand book: Working with market oriented-farmers Agriculture management and financial service of FAO, Rome.
KIT, Faida Mali and IIRR, 2006. Chain Empowerment: Supporting African farmers to develop markets. Royal Tropical Institute, Amsterdam, the Netherlands.
KIT and IIRR. 2008. Trading up: building cooperation between farmers and traders in Africa. Royal Tropical Institute, Amsterdam, The Netherlands and International Institute of Rural reconstruction, Nairobi, Kenya.
KIT and IIRR. 2010. Value chain finance: Beyond microfinance for rural entrepreneurs. Royal Tropical Institute, Amsterdam: and International Institute of rural reconstruction, Nairobi
Koler,P. and G. Armsrong, 2003. Principle of marketing, 10th Edition, Hall of India PVt.Ltd. New Delhi. pp 5-12.
Koopmans, R., 2006. Starting a cooperative: Farmer-controlled economic initiatives, (2nd ed.). Wageningen: CTA.
Kotabe, M.,Martin, X., and Domoto, H. 2003. Gaining from vertical partnership: knowledge transfer, relationship duration and supplier performance improvement in the US and Japanese automotive industries. Strategic management journal, 24(4)293-316.
Land O’Lakes, 2010. The Next stage in Dairy Development for Ethiopia. Dairy value chain, End markete and Food security, Addis Ababa, Ethiopia.
Lazzarini, S.G., chaddad, F.R. and Cook, M.L. 2001. Integrating supply chain and Network analysis: the study of Net chains, Journal on Chain and Network Science 1:7-22
MoARD(Ministry of Agriculture and Rural Development), 2005. Agricultural Input and products marketing strategy State ministry, Addis Ababa, Ethiopia.

56
Mohammed, A.M., Ahmed, Simeon Ehui and Yemeserach Assefa, 2004. Dairy Development in Ethiopia. EPTD Discussion Paper No.123. International Food Policy Research Institute, NW Washington, D.C.
Mohammed,L, Sardana, G.D., Sahay, B.S., Waheed,K.A., and Sahay, 2009. Supply Chain Partners’ trust building process through risk evaluation: the perspective of UAE packaged food industry, supply chain management: An international Journal, vol 4, and no.2 pp280-290..
Plan for Accelerated and sustained development to End Poverty (PASDEP), 2010. Ethiopia’s Agricultural sect oral policy and investment frame work. Federal Democratic Republic of Ethiopia, Ministry of agriculture and rural development. Draft final report. Addis Ababa, Ethiopia
Porter, M.E, 2004. Competitive advantage: creating and sustaining superior performance (3rd ed,). New York, NY: The free press.
Rahmato, D., 2002. Civil society organizations in Ethiopia. In B. Zewde and S. Pausewang, Ethiopia: The Challenge of Democracy from Below. Stockholm, Sweden: Nordiska Africa institute and Forum for social studies. Pp.103-119.
Rangnekar, D., and W. Thorpe (eds), 2000. Smallholder dairy production and marketing opportunities and constraints. Proceeding of South workshop held at National dairy development Board .Anand. India
Redda, T., 2001. Small scale milk marketing and processing In Ethiopia. In Proceedings of South-South Workshop on Smallholder dairy and marketing Constraints and opportunities Anand. March12-16.
Redda, T., 2002. Small scale milk marketing and processing in Ethiopia. In smallholder dairy production and market opportunity and constraints. Proceeding of a South workshop Held at NDDB, Anand, March 12-16.
Roduner, D., 2007. Donor intervention in value chain development, working paper.
Ruben, R., Boekel, M., Tilburg, A and Trienekens, 2007. Tropical food chains: governance regimes for quality management.Wageningen academic Publishers, wageningen,The Netherlands.
SNV, 2006. Developing a market led strategy for Ethiopian Dairy Industry. A dairy value chain: case study, Addis Ababa, Ethiopia
SNV, 2008. Development Organization Study on Dairy Investment opportunities in Ethiopia, SNV, the Netherlands.
Solomon. W, 2008. Dairy marketing Chains Analysis: The case of Shashemane, Hawassa and Dale District’s Milk Shed, Souhern Ethiopia. M.Sc. Thesis. Haramaya University.
Spielman D., Martha negash,K.,Davis, and Gezahegn Ayele, 2006. The smallholder farmer in a changing world: The role of research, Extension and Education in Ethiopian Agriculture. Paper submitted for ESSP policy Conference Bridging, Balancing and Scaling up: Advancing the rural Growth Agenda in Ethiopia, Addis Ababa.
Staal, S.J., A.N. Pratt, and M.Jabbar, 2008. Dairy development for the resource poor, Part II. Kenya and Ethiopia dairy development studies. PPLPI (Pro-poor Livestock Policy Initative).Working Paper No. 44-2. ILRI. Nairobi, Kenya.

57
United Nations Industrial development organization (UNIDO), Impact of the Global economic crisis on LSD’s productive capacity and trade prospect: threat and opportunities’. A case study of the dairy sector in Ethiopia.
Valk, van der, O. and Tessama, A., 2010. The formal dairy chain of Addis Ababa, an analysis of the integration of small -scale dairy farmers in Ethiopian, Addis Ababa
Vermeulen, S., Woodhill, J., Proctor, F.J. and Delnoye, R.2008. Chain-wide learning for inclusive agrifood market development: a guide to multi-stakeholder processes for linking small-scale producers with modern markets. International Institute for Environment and Development, London, Uk, and Wageningen University and research center, Wageningen, the Netherlands.
Vorst, J.G.A.J.2000. Effective Food supply Chains: Generating, Modeling and evaluating Supply chain scenarios, wageningen: Doctoral Thesis, Wageningen University.

58
ANNEXES
Annex 1: Questionnaire survey for smallholders’ dairy farmers.
A. Survey questionnaire for Dairy producers 1. Name of respondent---------------------------------Sex -------- Village------------------District…… 2. What is your religion? 3. How old ary you?
Type of Religions
Christian Protestant Muslim Other
Code, 1 = Christian, 2 =Protestant , 3 = Muslim 4 = Other (specify)
4. Educational background
Dairy farmers Never been to school
Primary level
Secondary level
Certificate level Diploma & above
Educational background
Code= Never been to school-1, Primary level-2, Secondary level-3, Certificate level-4, Diploma & above-5
5. What is the total size of the land in acres?
Land Less than one acre
1- 2 acres 3- 4 acres 5 acres & above
Size of grazing land
Code= Less than one acre-1, 1- 2 acres-2, 3- 4 acres-3, 5 acres & above-4
6. Is dairy production is your main business? Yes /No 7. Do you use family labour to run your dairy business? Yee/No 8. Labour division in your dairy activities?
Activities
By whom
Male Female Children Hired labour
Purchasing inputs
Feeding of cows
Cleaning barns
Selling of milk
Controlling revenue from sale of milk
Code= male-1, Female-2, Children-3, Hired labour-4

59
9. Dairy animals and milk yields/production
Dairy farmer Exotic cow Cross-bred Local cow
Rainy Dry Rainy Dry Rainy Dry
Average herd size
Milk production /day/cow
Av. lactation length (days)
Av. lactation yield (kg)
10. What methods you use for breeding your dairy animals?
Method of animal breeding
Artificial insemination Natural method Both AI and Natural method
Code=Artificial insemination-1, natural mating-2, Both AI and natural mating-3
11. What are the sources of feeds for you dairy animals? 1= concentrate, 2= roughage, 3= both, Other specify------------------------------------------------------------------------------------------------------
12. What costs do you incur per year for your dairy production?
Particular Amount/ number Unit cost Total cost
Variable cost
Cost of AI service per cow per year
Concentrate feeds per kg
Cost of grass/ bale/kg
Cost of crop residues bale/kg
Cost of service per/cow/per
Fixed cost
Rent of grazing land
Hired labour (hours)
Cost of shelter /fence/ shed for dairy cow)
Cost of other implements/machinery
13. How much volume of feeds provide for your animal per day/cow
Type of dairy animals Concentrate feed(kg)
Hay grass(kg/bale)
Crop residues(kg)
Other feeds
Pure breed per cow/d
Cross breed per cow/d
Local breed per cow/d

60
14. Milk production and consumption at farm gate
Milk Rainy season Dry season
Volume (lit.) Volume (lit.)
Total produced/day
Total consumed/day
Total sold/day
15. Do you organized into dairy cooperative? 1= yes, 2=NO 16. Do you get extension services from dairy cooperative? Yes =1, No= 2 17. Where do you sell your dairy product (raw milk)?
Milk buyers Price/ litre Means of transportation use to sell your milk
18. Give the reason(s) for the choice above channel of milk marketing in question number 17?
----------------------------------------------------------------------------------------------------------------------------------------------------------------------------------------------------------------------------------------------
19. History of dairy development the herd size group
S. No
Issues (according to producers opinion) Code
1 Herd size of dairy animal increased or decreased?
2 Milk production increased or decreased?
4 Productivity of dairy animals increased or decreased
4 Dairy derived income increased or decreased?
5 Grazing to dairy animals increased or decreased?
6 Stall feeding to dairy animals increased or decreased?
7 Marketing infrastructure increased or decreased?
Codes: increased-1; decreased-2; constant-3; other (specify)-4
20. What are the major problems in milk production? 21. What are the major problems in milk marketing? 22. Who mostly provides you with information about dairy production and marketing?
Information provider
Livestock extension service
Dairy cooperative
Trader Other farmers
From media
Code= Livestock extension service-1, Dairy cooperative-2, Trader-3, Other farmers-4, From media-5

61
Annex 2: check list for interviewing of Chain Supporters, Influencers’ and Competitors
B. Checklist for interviewing of dairy cooperative 1. From how many producers did you buy milk last year? 2. From where do you commonly collect milk?
Type of producer Number of producer sells to you?
Average volume of milk collected/day (lit.)
Number of times a day milk collected
Type of vehicle used for transportation
Mode of payment
Small scale producer (<3 animal)
Large scale producer (>3 animal)
Type of vehicle used: head load-1; by-cycle-2; van-3; truck-4; other (specify)-5
Mode of payment: cash-1; paid in 7 days-2; paid in 7-15 days-3; paid in 15-30 days-4; more than one month-5; other (specify)-6
3. Apart from milk collection, do you provide other services to producer? -------------------------- 4. Month wise per day average milk collection last year by dairy cooperative
months Jan 2011
Feb 2011
March 2011
April 2011
May 2011
June 2011
July 2011
August 2011
Sep 2011
Oct 2011
Nov 2011
Dec 2011
Litre/day
5. Total volume of milk collected per day for the last five years
Year Total volume (lit.)
Price/liter Major suppliers Remark
2008
2009
2010
2011
2012
6. Registered number of milk suppliers --------------------------- 7. No of workers involve in cooperative? 8. Service provided by cooperative to the members 9. Active number of milk suppliers---------------------------------- 10. Number of collection centers-------------------------------------- 11. Average distance of collection centers from cooperative----------------- 12. What tests do you use for screening milk? ---------- 13. What problems do you commonly find with the milk? -----------------------------------

62
14. Principal buyer(s) of milk from producers/farmers
No.
Type of milk and milk products
Type of buyers (Code)
Price of/liter/ kg
Total volume buy per day
Place of purchase (code)
1 Raw milk
2 Butter
3 Soft cheese
4 Ghee
15. Is there a difference in price setting between the dry and rainy seasons? 1=Yes 2= No, give
your explanation-------------------------------------------------------------------------- 16. Is there a difference in price setting during fasting periods? 1=yes 2=No, give your
explanation------------------------------------------------------------------------------------------------------- 17. What type of dairy products do you sell and who are you main customers (market
segmentation)?
18. From the total volume of collected milk how much volume are processing into different products
19. What is the daily capacity of dairy processing plant------------- 20. Who are the competitors and supporters of your dairy activities?--------------------------------- 21. Main problems with purchase and sale of dairy products
Products Problems related to purchase Problems related to sale
Dry season Rainy season Dry season Rainy season
Raw milk
Pasteurized milk
Cheese
Cream
Ghee
22. What tests do you use for screening milk during milk collection? -------------------------- 23. Quantity of milk rejected per day--------------- or per month----------------------- 24. What contribution has your dairy cooperative towards improving the position of small scale
farmers in milk value chain? ------------------------------------------------------------------------------------ 25. What are the main problems faced by milk buyer (dairy processer)? 26. Suggestion to improve present collection and processing capacities 27. Who are the supporters of your dairy cooperative? 28. Who are the competitors of your dairy cooperative 29. Who are the influencers of your business activities? 30. What is your basis to pay the price of the milk 1=. Quantity, 2=. Quality, 3= Others, specify: 31. What is the criterion of your milk quality control/measure?

63
C. Checklist for dairy wholesalers and retailers What are the types of dairy products handled for selling?
Actors Product(s) handled
Number actors
Purchasing price
Added cost due to added value to the product
Selling price
Volume/day
Principal source of supply
Principal buyer(s)
Wholesaler
1.
2.
3.
4.
Retailer 1.
2.
3.
4.
D. Check list for Ada’a district livestock development and health office 1. What is the trend of number of milking of dairy cow and milk production for the last 5 years? 2. What is the potential for developing milk value chain in small holder dairy farmers in the
district? ----------------------------------------------------------------------------------------------------------------------
3. What support do smallholder dairy farmers need to improve their position in milk value chain? 4. What do you think is the reason why many smallholder dairy farmers participating in informal
marketing channel?---------------------------------------------------------------------------------------------------------------------------------------------------------------------------------------------------------------------
5. Do you think formal chains can improve small scale dairy farmers’ position /profits? Yes /no Explain----------------------------------------------------------------------------------------------------------------------------------------------------------------------------------------------------------------------------------- E. Check list for Ada’a district cooperative development office
1. What kinds of service or support do you provided for dairy cooperative? ----------------------------------------------------------------------------------------------------------------------------
2. How dairy cooperative are organized in your district? ---------------------------------------------------------------------------------------------------------------------------------------------------------------------------
3. What are the criterions the dairy cooperative to fulfil to get licence from your organization? ------------------------------------------------------------------------------------------------------------------------------
4. Currently how many dairy cooperative are existing in the district? - 5. How many dairy cooperative have their own milking cow and how many of them do not have
milking cow? -------------------------------------------------------------------------------------------------- 6. What do you think the relationship between dairy cooperative and other chain actors in your
district?

64
F. Check list for competitors of Ada’a dairy cooperative?
1. From how many producers did you buy milk last year? ------------------------- 2. From where do you commonly collect milk?
Type of producer Number of producer sells to you?
Average volume of milk collected/day (lit.)
Type of vehicle used for transportation
Mode of payment
Small scale producer (<3 animal)
Large scale producer (>3 animal)
3. Apart from milk collection, do you provide other services to producer? -------------------------- 4. Month wise per day average milk collection last year by dairy cooperative
months Jan 2011
Feb 2011
March 2011
April 2011
May 2011
June 2011
July 2011
August 2011
Sep 2011
Oct 2011
Nov 2011
Dec 2011
Litre/day
5. Total volume of milk collected per day for the last five years
Year Total volume (lit.)
Price/liter Major suppliers Remark
2008
2009
2010
2011
2012
6. Is there a difference in price setting between the dry and rainy seasons? 1=Yes 2= No, 7. Is there a difference in price setting during fasting periods? 1=yes 2=No, 8. What type of dairy products do you sell and who are you main customers? 9. What is the daily capacity of dairy processing plant------------- 10. Who are the competitors and supporters of your dairy activities?----------------------- 11. Main problems with purchase and sale of dairy products 12. What tests do you use for screening milk during milk collection? -------------------------- 13. Quantity of milk rejected per day--------------- or per month----------------------- 14. What are the main problems faced by milk buyer (dairy processer)? 15. Suggestion to improve present collection and processing capacities 16. Who are the competitors of your dairy cooperative 17. Who are the influencers of your business activities? 18. What is your basis to pay the price of the milk 1=. Quantity, 2=. Quality, 3= Others,
specify: 19. What is the criterion of your milk quality control/measure?

65
Annex 3: Result of Chi-Square Tests What is your sex * Where do you sell your raw milk? Cross tabulation
Where do you sell your raw milk?
Total Dairy cooperative
dairy cooperative and private milk collectors
Private milk collectors
Direct to consumers
What is your sex
Male Count 13 5 3 3 24
Expected Count
9,6 6,0 3,6 4,8 24,0
Female Count 3 5 3 5 16
Expected Count
6,4 4,0 2,4 3,2 16,0
Total Count 16 10 6 8 40
Expected Count
16,0 10,0 6,0 8,0 40,0
Chi-Square Tests
Value df
Asymp. Sig. (2-sided)
Pearson Chi-Square 5,365a 3 ,147 Likelihood Ratio 5,633 3 ,131 Linear-by-Linear Association
4,419 1 ,036
N of Valid Cases 40
a. 5 cells (62,5%) have expected count less than 5. The minimum expected count is 2,40.

66
Educational back ground * Where do you sell your raw milk ? Crosstabulation
Where do you sell your raw milk ?
Total
Dairy cooperative
dairy cooperative and private milk collectors
Private milk collectors
Direct to consumers
Educational back ground
Never been to school
Count 0 2 0 3 5
Expected Count
2,0 1,3 ,8 1,0 5,0
Primary level Count 10 6 3 5 24
Expected Count
9,6 6,0 3,6 4,8 24,0
Secondary level Count 4 2 3 0 9
Expected Count
3,6 2,3 1,4 1,8 9,0
Diploma & above Count 2 0 0 0 2
Expected Count
,8 ,5 ,3 ,4 2,0
Total Count 16 10 6 8 40
Expected Count
16,0 10,0 6,0 8,0 40,0
Chi-Square Tests
Value df
Asymp. Sig. (2-sided)
Pearson Chi-Square 14,214a 9 ,115 Likelihood Ratio 17,430 9 ,042 Linear-by-Linear Association
5,235 1 ,022
N of Valid Cases 40
a. 14 cells (87,5%) have expected count less than 5. The minimum expected count is, 30.

67
Do you organized into dairy cooperative? * Where do you sell your raw milk? Crosstabulation
Where do you sell your raw milk?
Total
Dairy cooperative
dairy cooperative and private milk collectors
Private milk collectors
Direct to consumers
Do you organized into dairy cooperative?
yes Count 15 5 0 0 20
Expected Count
8,0 5,0 3,0 4,0 20,0
no Count 1 5 6 8 20
Expected Count
8,0 5,0 3,0 4,0 20,0
Total Count 16 10 6 8 40
Expected Count
16,0 10,0 6,0 8,0 40,0
Chi-Square Tests
Value df
Asymp. Sig. (2-sided)
Pearson Chi-Square 26,250a 3 ,000 Likelihood Ratio 34,107 3 ,000 Linear-by-Linear Association
23,797 1 ,000
N of Valid Cases 40
a. 4 cells (50,0%) have expected count less than 5. The minimum expected count is 3,00.

68
Where do you live? * Where do you sell your raw milk ? Crosstabulation
Where do you sell your raw milk ?
Total Dairy cooperative
dairy cooperative and private milk collectors
Private milk collectors
Direct to consumers
Where do you live?
Urban Count 9 3 6 2 20
Expected Count
8,0 5,0 3,0 4,0 20,0
Rural Count 7 7 0 6 20
Expected Count
8,0 5,0 3,0 4,0 20,0
Total Count 16 10 6 8 40
Expected Count
16,0 10,0 6,0 8,0 40,0
Chi-Square Tests
Value df
Asymp. Sig. (2-sided)
Pearson Chi-Square 9,850a 3 ,020 Likelihood Ratio 12,307 3 ,006 Linear-by-Linear Association
,294 1 ,588
N of Valid Cases 40
a. 4 cells (50,0%) have expected count less than 5. The minimum expected count is 3,00.
Related Documents