Murray, R.W., Miller, D.J., and Kryc, K.A. ODP Technical Note 29 ANALYSIS OF MAJOR AND T RACE ELEMENTS IN ROCKS, SEDIMENTS, AND INTERSTITIAL WATERS BY INDUCTIVELY COUPLED PLASMA–ATOMIC EMISSION SPECTROMETRY (ICP-AES) 1,2 R.W. Murray, 3 D. Jay Miller, 4 and K.A. Kryc 3 INTRODUCTION This Technical Note is designed to offer principles and guidelines for geochemical analysis by inductively coupled plasma–atomic emission spectrometry (ICP-AES) on board the Ocean Drilling Program (ODP) drillship JOIDES Resolution. The goal is to provide background instruc- tions so that various types of samples (including igneous rocks, sedi- mentary rocks, sediments, and interstitial waters) may be analyzed for a comprehensive suite of major and trace elements. This Technical Note is not intended to be a stand-alone document explaining all the param- eters of ICP-AES (appropriate references to that end are supplied below), but instead we hope to provide the fundamentals of sample prepara- tion, analysis, and data reduction, resulting in high-quality shipboard analytical data. The critical advantage of ICP-AES is that rapid and quantitative analysis of a variety of sample types can be conducted rela- tively easily with a single instrument. Care has been taken to ensure that these instructions are not overly instrument or software specific. The sections on basic ICP principles, sample preparation, recommended wavelengths, and the like are not unique to the Jobin-Yvon JY2000 instrument currently on board the Resolution. Where necessary, however, instrument-specific guidelines are provided. Accordingly, several passages in this technical note have been based on the owner’s manual provided by Jobin-Yvon (JY), manu- 1 Murray, R.W., Miller, D.J., Kryc, K.A., 2000. Analysis of major and trace elements in rocks, sediments, and interstitial waters by inductively coupled plasma–atomic emission spectrometry (ICP-AES). ODP Tech. Note, 29 [Online]. Available from World Wide Web: <http://www-odp.tamu.edu/ publications/tnotes/tn29/INDEX.HTM>. [Cited YYYY-MM-DD] 2 See Disclaimer, p. 23. 3 Department of Earth Sciences, Boston University, Boston MA 02215, USA. [email protected] 4 Ocean Drilling Program, Texas A&M University, 1000 Discovery Drive, College Station TX 77845-9547, USA.

Welcome message from author
This document is posted to help you gain knowledge. Please leave a comment to let me know what you think about it! Share it to your friends and learn new things together.
Transcript

Murray, R.W., Miller, D.J., and Kryc, K.A.ODP Technical Note 29
ANALYSIS OF MAJOR AND TRACE ELEMENTS IN ROCKS, SEDIMENTS, AND INTERSTITIAL WATERS BY INDUCTIVELY COUPLED PLASMA–ATOMIC EMISSION SPECTROMETRY (ICP-AES)1,2
R.W. Murray,3 D. Jay Miller,4 and K.A. Kryc3
INTRODUCTION
This Technical Note is designed to offer principles and guidelines forgeochemical analysis by inductively coupled plasma–atomic emissionspectrometry (ICP-AES) on board the Ocean Drilling Program (ODP)drillship JOIDES Resolution. The goal is to provide background instruc-tions so that various types of samples (including igneous rocks, sedi-mentary rocks, sediments, and interstitial waters) may be analyzed for acomprehensive suite of major and trace elements. This Technical Noteis not intended to be a stand-alone document explaining all the param-eters of ICP-AES (appropriate references to that end are supplied below),but instead we hope to provide the fundamentals of sample prepara-tion, analysis, and data reduction, resulting in high-quality shipboardanalytical data. The critical advantage of ICP-AES is that rapid andquantitative analysis of a variety of sample types can be conducted rela-tively easily with a single instrument.
Care has been taken to ensure that these instructions are not overlyinstrument or software specific. The sections on basic ICP principles,sample preparation, recommended wavelengths, and the like are notunique to the Jobin-Yvon JY2000 instrument currently on board theResolution. Where necessary, however, instrument-specific guidelinesare provided. Accordingly, several passages in this technical note havebeen based on the owner’s manual provided by Jobin-Yvon (JY), manu-
1Murray, R.W., Miller, D.J., Kryc, K.A., 2000. Analysis of major and trace elements in rocks, sediments, and interstitial waters by inductively coupled plasma–atomic emission spectrometry (ICP-AES). ODP Tech. Note, 29 [Online]. Available from World Wide Web: <http://www-odp.tamu.edu/publications/tnotes/tn29/INDEX.HTM>. [Cited YYYY-MM-DD]2See Disclaimer, p. 23.3Department of Earth Sciences, Boston University, Boston MA 02215, USA. [email protected] Drilling Program, Texas A&M University, 1000 Discovery Drive, College Station TX 77845-9547, USA.

R.W. MURRAY ET AL.ANALYSIS OF MAJOR AND TRACE ELEMENTS BY ICP-AES 2
facturer of the JY2000, as well as on notes from the Boston UniversityAnalytical Geochemistry Laboratory. A companion booklet of detailedsoftware notes from Boston University has also been provided to theODP Chemistry Laboratory. Additional information may be found inthe “Explanatory Notes” of the Legs 187–189 Initial Reports volumes ofthe Proceedings of the Ocean Drilling Program (Shipboard Scientific Party,in press a, in press b, in press c) because these legs were the first to usethe shipboard ICP-AES for igneous rock (Leg 187) and interstitial water(Legs 188 and 189) analyses.
A list of ICP-AES references is included in “Useful References Dis-cussing ICP-AES Techniques,” p. 19, copies of which are available onboard the Resolution. Although in some cases there is more informationin these publications than is necessary to operate the JY2000 instru-ment, readers are encouraged to become familiar with the content toenable them to customize key aspects of the sample preparation andanalytical procedures to best meet project-specific needs. Furthermore,the methodologies and procedures described here do not maximize thecapabilities of the instrument, and individual shipboard scientists maychoose to target particular chemical elements not discussed below.These publications will assist them in their endeavors.
BASIC OVERVIEW OF ICP-AES
ICP-AES is an emission spectrophotometric technique, exploiting thefact that excited electrons emit energy at a given wavelength as they re-turn to ground state. The fundamental characteristic of this process isthat each element emits energy at specific wavelengths peculiar to itschemical character. Although each element emits energy at multiplewavelengths, in the ICP-AES technique it is most common to select asingle wavelength (or a very few) for a given element. The intensity ofthe energy emitted at the chosen wavelength is proportional to theamount (concentration) of that element in the analyzed sample. Thus,by determining which wavelengths are emitted by a sample and by de-termining their intensities, the analyst can quantify the elemental com-position of the given sample relative to a reference standard.
ICP-AES analysis requires a sample to be in solution. Thus, interstitialwaters can be analyzed simply, requiring only dilution in most cases. Ig-neous rocks, sedimentary rocks, and sediments, however, must be dis-solved. This can be achieved either by a combined acid attackemploying HF, HNO3, and HCl acids, or by a LiBO2 flux-fusion tech-nique similar to that used for XRF preparation. In addition to beingsomewhat dangerous for routine shipboard work (because of the highlyreactive nature of HF), the acid attack is not able to generate consistentand reliable data for Si because it volatilizes in the presence of HF. Theacid digestion procedure also often results in incomplete analysis of re-fractory elements such as Ti, Cr, and Zr because their host minerals areoften difficult to dissolve. The flux-fusion approach is employed onboard the Resolution for several reasons: (1) it is safer because HF is notinvolved; (2) it is a complete dissolution technique, allowing determi-nation of all elements, including Si and the refractory elements; (3) theresultant solutions are similar in composition (or matrix) because theyare dominated by the presence of the LiBO2 flux; and (4) the solutionsare stable in dilute HNO3 acid and can be transported safely back to thescientist's laboratory for further shore-based study.
R.W. MURRAY ET AL.ANALYSIS OF MAJOR AND TRACE ELEMENTS BY ICP-AES 3
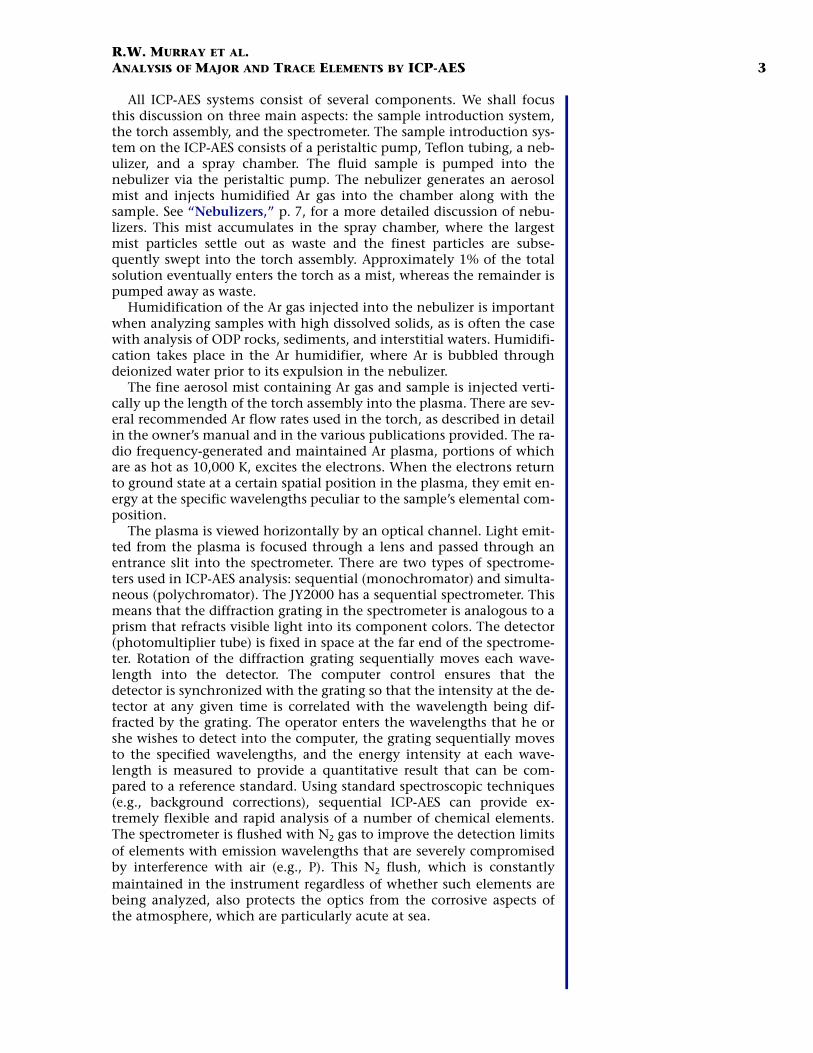
All ICP-AES systems consist of several components. We shall focusthis discussion on three main aspects: the sample introduction system,the torch assembly, and the spectrometer. The sample introduction sys-tem on the ICP-AES consists of a peristaltic pump, Teflon tubing, a neb-ulizer, and a spray chamber. The fluid sample is pumped into thenebulizer via the peristaltic pump. The nebulizer generates an aerosolmist and injects humidified Ar gas into the chamber along with thesample. See “Nebulizers,” p. 7, for a more detailed discussion of nebu-lizers. This mist accumulates in the spray chamber, where the largestmist particles settle out as waste and the finest particles are subse-quently swept into the torch assembly. Approximately 1% of the totalsolution eventually enters the torch as a mist, whereas the remainder ispumped away as waste.
Humidification of the Ar gas injected into the nebulizer is importantwhen analyzing samples with high dissolved solids, as is often the casewith analysis of ODP rocks, sediments, and interstitial waters. Humidifi-cation takes place in the Ar humidifier, where Ar is bubbled throughdeionized water prior to its expulsion in the nebulizer.
The fine aerosol mist containing Ar gas and sample is injected verti-cally up the length of the torch assembly into the plasma. There are sev-eral recommended Ar flow rates used in the torch, as described in detailin the owner’s manual and in the various publications provided. The ra-dio frequency-generated and maintained Ar plasma, portions of whichare as hot as 10,000 K, excites the electrons. When the electrons returnto ground state at a certain spatial position in the plasma, they emit en-ergy at the specific wavelengths peculiar to the sample’s elemental com-position.
The plasma is viewed horizontally by an optical channel. Light emit-ted from the plasma is focused through a lens and passed through anentrance slit into the spectrometer. There are two types of spectrome-ters used in ICP-AES analysis: sequential (monochromator) and simulta-neous (polychromator). The JY2000 has a sequential spectrometer. Thismeans that the diffraction grating in the spectrometer is analogous to aprism that refracts visible light into its component colors. The detector(photomultiplier tube) is fixed in space at the far end of the spectrome-ter. Rotation of the diffraction grating sequentially moves each wave-length into the detector. The computer control ensures that thedetector is synchronized with the grating so that the intensity at the de-tector at any given time is correlated with the wavelength being dif-fracted by the grating. The operator enters the wavelengths that he orshe wishes to detect into the computer, the grating sequentially movesto the specified wavelengths, and the energy intensity at each wave-length is measured to provide a quantitative result that can be com-pared to a reference standard. Using standard spectroscopic techniques(e.g., background corrections), sequential ICP-AES can provide ex-tremely flexible and rapid analysis of a number of chemical elements.The spectrometer is flushed with N2 gas to improve the detection limitsof elements with emission wavelengths that are severely compromisedby interference with air (e.g., P). This N2 flush, which is constantlymaintained in the instrument regardless of whether such elements arebeing analyzed, also protects the optics from the corrosive aspects ofthe atmosphere, which are particularly acute at sea.

R.W. MURRAY ET AL.ANALYSIS OF MAJOR AND TRACE ELEMENTS BY ICP-AES 4
MASS, VOLUME, AND UNITS
Throughout the following sections, all units and dilution factors ofrocks and sediments (i.e., materials that are initially solid) are given ona per mass basis, and all units and dilution factors for interstitial watersare given on a per volume basis. This allows the ease of working withthese different matrices on a weight vs. volume basis, and also followsstandard conventions (e.g., µM in interstitial water data is given in mi-cromoles per liter, that is, per volume).
Acid concentrations in analyte solutions are given in percentage (%)units, as opposed to molarity (M). Although either unit system is appro-priate and equally accurate, much of the ICP-AES literature refers toacid concentrations in percentage units, and so that convention is fol-lowed here. Concentrated HNO3 acid (16 M) is 70% HNO3. Therefore,preparation of 10% HNO3 (by volume) involves a 7× dilution of con-centrated acid (e.g., 1 mL of concentrated acid added to 6 mL of deion-ized water [DI]).
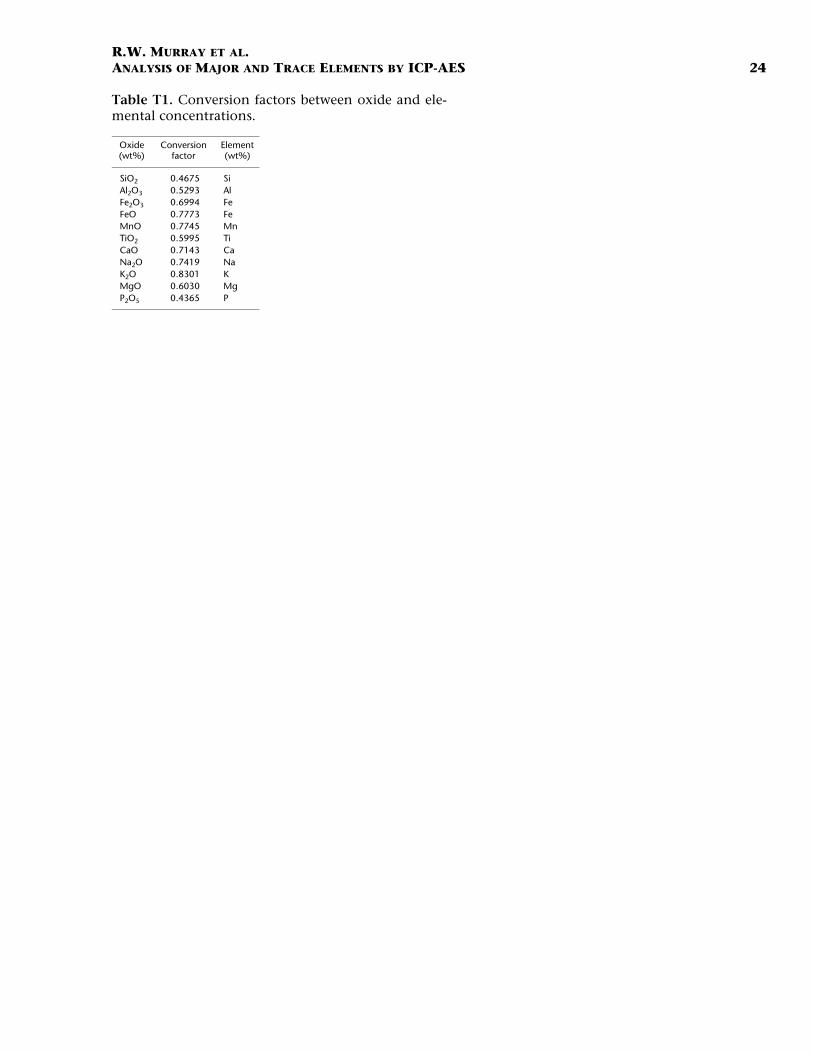
Concentrations of the 10 major elements in rocks and sediments arecommonly given in weight percent units of the oxide (e.g., SiO2),whereas in calibration standards and prime standards purchased from avendor such as Fisher or VWR the concentrations are sometimes givenin µg/mL (ppm) for an element (e.g., Si). Table T1 provides conversionfactors between oxide and elemental concentrations. (These are multi-plicative factors; to convert SiO2 to Si, multiply by 0.4675.) The conver-sion from ppm to weight percent (part per hundred) involves divisionby 104.
SAMPLE PREPARATION
Overview
There are three fundamental guiding principles of ICP-AES samplepreparation that must be followed for every calibration and analysis, re-gardless of what is being analyzed (rocks, sediments, or interstitial wa-ters).
1. Filtration: All solutions introduced to the instrument must be fil-tered. This is most efficiently performed through Acrodisc filters that fitover a syringe. Failure to filter every solution may lead to a partially orcompletely clogged nebulizer, resulting in poor analytical precision oranalysis failure. Clogged nebulizers are also extremely difficult to clean(see “Basic Maintenance Suggestions,” p. 18).
2. Matrix Matching: The term “matrix” refers to the sum of all com-positional characteristics of a solution, including its acid composition.Calibration standards and samples must be matrix-matched in terms ofcomposition, total dissolved solids (TDS), and acid concentration (inpercent) of the solution. For analysis of solid materials that have beendissolved, the use of LiBO2 flux effectively means that the standardsand samples have been compositionally matrix matched (as will be de-tailed in “Preparation of Rock/Sediment Samples,” p. 6), but it is alsoimportant to have the standards and samples be of the same acid con-centration. TDS refers to the total mass (in milligrams) of powder (sam-ple plus flux) dissolved in a given mass of solution, and is commonlyquantified as a function of dilution factor (see “Dilution Factors,”p. 7). There is a wide range of acceptable acid concentrations, any one
T1. Conversion factors between oxide and elemental concentra-tions, p. 24.

R.W. MURRAY ET AL.ANALYSIS OF MAJOR AND TRACE ELEMENTS BY ICP-AES 5
of which is likely to suffice, but it is of critical importance that whateveracid concentration is used during a particular run, that it be the samefor all standards and samples in that run. Typical concentrations forrock and sediment samples are 5% or 10% HNO3. For interstitial wateranalysis, the calibration standards must be prepared with the samebackground salt concentration.
3. Cleaning: Throughout the laboratory, great care and diligencemust be exercised to keep sample bottles and ICP glassware used for theanalysis of difference matrices separate. Because Li and B are of particu-lar interest to interstitial water chemists, all sample bottles, autosamplervials and tubes, Teflon tubing, peristaltic pump tubing, and torch as-sembly glassware that are used during the analysis of rocks and sedi-ments (and thus have been exposed to tremendous amounts of Li and Bin the LiBO2 flux) must be kept separate from those items used in thepreparation and analysis of interstitial waters. As importantly, bottlesand glassware that have been used in the preparation and analysis ofthe LiBO2 flux solutions must be cleaned separately from interstitial wa-ter apparatus. Duplicate acid baths and other cleaning routines need tobe maintained with the greatest rigor.
Flux-Fusion Preparationof Rocks and Sediments
The procedure used here is similar to that used previously on boardthe Resolution for major element X-ray fluorescence (XRF) analysis.Whereas in major element XRF the fused glass disk serves as a solid tar-get for the X-ray beam, in ICP-AES preparation the glass bead is dis-solved in 10% HNO3, the solution is filtered and diluted, and theresultant aqueous solution is subsequently introduced into the ICP-AESfor analysis.
In the following presentation, the analyst must decide whether touse ignited samples, depending on the analytical needs. It is most com-mon to use ignited samples for igneous rocks, with the final analysis in-cluding a determination of loss on ignition (LOI). For sediments andsedimentary rocks, particularly carbonate-rich sediments, determina-tion of LOI is often not performed, partly because LOI comprises a sig-nificant proportion of the total weight percent. Regardless, thefollowing guidelines apply to the use of ignited or nonignited samplesequally well. The most important consideration is that the proper sam-ple and acid concentrations be used during calibration and analysis.
LiBO2 flux without La absorber, and indeed only ultrapure gradeLiBO2, should be used. The heavy La absorber also contains other rareearth elements (REEs), and thus the standard and sample solutions willbe compromised for future analyses, and the ICP-AES will be contami-nated with background concentrations of REEs.
The most critical aspect of the preparation is the need to maintain aconstant sample to flux ratio. This can be adjusted as needed on a caseby case basis, but a ratio of 1:4 should suffice in most situations. ICP-AES analysis requires a far smaller sample mass than XRF. Typically, 0.1g of sample powder mixed with 0.4 g of LiBO2 flux will result in ade-quate solution for a thorough major and trace elemental analysis. How-ever, if only limited sample mass is available (e.g., for the analysis ofvolcanic glasses), a smaller sample mass may be used, but the same sam-ple:flux ratio must be maintained for all samples and calibration stan-dards (otherwise the matrix will not match). For example, 0.05 g of

R.W. MURRAY ET AL.ANALYSIS OF MAJOR AND TRACE ELEMENTS BY ICP-AES 6
sample would require 0.2 g flux to maintain the suggested 1:4 ratio. Useof such smaller masses results in a smaller mass (volume) of analyte so-lution, but if a complete geochemical analysis is not required, verysmall sample masses (e.g., basaltic glass rims) can be analyzed for only afew target elements of high interest.
Preparation of Rock/Sediment Samples
1. Weigh 0.1 g of powdered, dried sample. ODP standard practice isto weigh within a range of 0.0995–0.1005 g, with a precision of 0.5% ofthe measured value. If the sample weight falls within this range, weigh-ing differences need not be accounted for during data reduction.
2. Mix the sample powder with 0.4 g of LiBO2 flux. In practice, thismass can be weighed out between 0.395 and 0.405 g. Transfer the pow-der mix into a Pt-Au crucible, add 10 µL of 0.172 mM LiBr wettingagent, and fuse at 1050°C for 10-12 min. The wetting agent is preparedby dissolving 0.15 mg of ultrapure LiBr powder into 10 g of DI.
3. Let the bead cool and solidify in the bottom of the crucible. Aftercooling, pop the bead off the crucible bottom. A sharp “whack”squarely on the hard desktop facilitates release.
4. Dissolve the bead in 50 mL of 10% HNO3 acid solution and shake.Dissolution is effective in a sonicator bath or a wrist-action shaker, andshould take ~45 min to 1 hr in most cases. This solution is now at whatis broadly termed a 100× dilution for TDS because the 0.5 g of flux +sample has been dissolved in ~50 g of HNO3 (50 g/0.5 g = 100). This isalso referred to as a 1% solution because 1% of the total mass consists ofTDS. It is important to note that the dilution of the sample is signifi-cantly greater (500×), because 0.1 g of powdered sample has been dis-solved in 50 g of HNO3 (50 g/0.1 g = 500). The very small addition ofLiBr does not significantly increase the TDS. The exact mass of the acidsolution is not critical (i.e., 50 mL HNO3 is ~50 g), but it is extremelyimportant that the unknown samples, blanks, replicates, etc., be pre-pared identically to the rock SRMs used for calibration (see “DilutionFactors,” p. 7).
5. After complete dissolution of the bead, the solution should be fil-tered. This is best achieved by aspirating ~20 mL of the solution into asyringe and filtering through an Acrodisc into a cleaned scintillationvial. The remaining unfiltered solution can be saved for additional anal-ysis, replicate analysis, or transport to a shorebased laboratory.
6. The final analyte solution is prepared by pipetting a 5-mL aliquotof the filtered solution and diluting it with 35 mL of 10% HNO3 (to atotal of 40 mL). This is an additional 8× dilution (40 mL/5 mL = 8) ofthe original 500× diluted solution described in Step 4 above (to arrive ata total 4000× dilution of the sample [not of the sample + flux]). This so-lution is dilute enough to enable use of a type-C Meinhard concentricnebulizer (see “Nebulizers,” p. 7).
7. An analytical procedural blank is prepared identically to the sam-ples, with the exception that only 0.4 g of flux is fused and dissolved.An additional 0.1 g of flux is not added to mimic the TDS of the 0.5 gmix of sample + flux because this would provide an inaccurate quanti-tation of the impurities introduced by the amount of flux used in prep-aration of the unknowns.

R.W. MURRAY ET AL.ANALYSIS OF MAJOR AND TRACE ELEMENTS BY ICP-AES 7
Preparation of Interstitial Waters
1. After HNO3 acidification of an aliquot of interstitial water sample,the preparation of interstitial water for ICP-AES analysis primarily in-volves dilution. Because the pore-water solutions have already been fil-tered during squeezing, additional filtration is not required.
2. The most common dilution for interstitial water samples is 10×.Depending on the analysis speed and the number of elements analyzed,one can usually generate enough analyte with 0.5 mL of interstitial wa-ter diluted with 4.5 mL of DI (for a total analyte of 5.0 mL). A 1-mLsample + 9 mL DI solution allows for replicate analysis. In some cases,undiluted interstitial water may be analyzed, but care must be taken tonot clog the nebulizer, as the likelihood of salt buildup at the nebulizerorifice is greatly increased.
3. An analytical blank is prepared identically by analyzing pure DIacidified to matrix match the samples. Be sure to use DI from the samebottle as used during dilution of the samples.
GUIDELINES TO ANALYTICALOPERATING CONDITIONS
This section describes some basic considerations and guidelines foranalytical conditions to be used during ICP-AES analysis.
Dilution Factors
Rocks and Sediments
The dissolution procedure described in “Flux-Fusion Preparation ofRocks and Sediments,” p. 5, results in an aqueous solution that can beanalyzed in a single analytical session for major and trace elements. Itrepresents a 4000× (nominal) dilution of the sample. This dilution fac-tor is appropriate for igneous rocks, sedimentary rocks, and sediments.We suggest working from this 4000× dilution as a baseline. Should therebe leg-specific analytical requests, different dilutions can be prepared,as long as the overall goal of generating enough analyte at an appropri-ate concentration is fulfilled. See additional discussion in “Nebulizers,”p. 7. As always, prepare the standard reference materials used to cali-brate the ICP-AES at the same dilution factor and acid concentration asthe unknown samples.
Interstitial Waters
As mentioned previously, the most common dilution factor for inter-stitial waters is a simple 10× dilution in DI. Undiluted seawater may beanalyzed, particularly when low concentration elements are to of con-cern, but salting of the nebulizer must be monitored carefully. Use ofthe Ar humidifier will improve results for undiluted seawater analysis.
Nebulizers
In all circumstances, great care must be taken to avoid nebulizer clog-ging. Thus, all samples and standards should be filtered prior to analy-sis. Clogging can result from either a physical blockage of the smallcapillary inside the nebulizer or from the formation of a precipitate

R.W. MURRAY ET AL.ANALYSIS OF MAJOR AND TRACE ELEMENTS BY ICP-AES 8
around the ejection orifice. Nebulizer clogging can be easily diagnosedwhen the nebulizer Ar flow rate decreases simultaneously with an in-crease in Ar backpressure, which signals inhibition of Ar transportthrough the nebulizer. When the nebulizer begins to clog, the stabilityof the analysis greatly decreases and drift becomes insurmountable. Theanalytical run must be discontinued, the instrument shut down, andthe nebulizer cleaned before the run can be resumed. It is very difficultto clean a nebulizer, and it can become tremendously time consumingto have to repeatedly deal with such clogging (see “Basic MaintenanceSuggestions,” p. 18).
A great deal of effort goes into selecting the proper nebulizer for aparticular application. The most commonly used nebulizer is a concen-tric nebulizer (commonly referred to as a Meinhard nebulizer althoughother companies also manufacture them). See the literature on boardthe ship for a description of how this nebulizer operates. Meinhard andother concentric nebulizers provide excellent stability and signal tonoise ratios, although they are more prone to clogging than other neb-ulizer types. Wide orifice type-C concentric nebulizers are appropriatefor use with rocks and sediments as well as with interstitial water sam-ples. For the dilutions described above, these nebulizers work very well,with minimal clogging, as long as proper cleaning procedures are fol-lowed.
ODP has also acquired several V-groove nebulizers, which allow forthe analysis of samples with very high TDS. This type of nebulizer re-quires a slightly higher sample aspiration speed (controlled through theperistaltic pump) than a concentric nebulizer and thus consumes moreanalyte solution; however, the flexibility to easily analyze variable TDSsolutions makes this nebulizer particularly well suited for very high TDSoperations. It is important to note, however, that signal stability is sig-nificantly poorer for V-groove nebulizers, and they should only be usedin exceptional circumstances. Testing of type-C concentric and V-groovenebulizers during Leg 187 and at Boston University documents that theconcentric nebulization scheme provides a greater signal, better stabil-ity, and less noise for the analysis of rocks, sediments, and interstitialwaters, at the dilution factors suggested here for routine operation.
Stability of Solutions
Rocks and Sediments
After a period of time, flux-fusion solutions may become unstable re-sulting in the precipitation of major and trace elements or the forma-tion of a gel. These are not always immediately visible (the gel is clear),so solutions must be visually inspected carefully prior to analysis. Anunstable solution must be discarded because the gel will strip dissolvedtrace metals from the analyte.
The stability of a solution is directly proportional to the dilution fac-tor and acid content, and inversely proportional to the SiO2 content. Adilute solution is more stable than a concentrated one, and there islikely to be a noticeable difference in the shelf life of a flux-fusion solu-tion prepared at 100× TDS vs. 1000× TDS. Likewise, a solution preparedin a 10% HNO3 matrix is more stable than one prepared in 1% HNO3.Conversely, a flux-fusion solution resulting from the dissolution of di-atomaceous ooze or rhyolite (either of which are enriched in SiO2), islikely to be less stable than a solution prepared from a low-Si basalt orshale.
R.W. MURRAY ET AL.ANALYSIS OF MAJOR AND TRACE ELEMENTS BY ICP-AES 9
As with many aspects of analytical geochemistry, a balance exists be-tween these parameters. The dilution factor from the procedure de-scribed herein should yield solutions that are stable at least for severaldays, and perhaps for up to several weeks.
Interstitial Waters
Diluted and undiluted interstitial waters are stable indefinitely, par-ticularly if they are acidified. The most common contributing factor toa solution's demise is evaporation. All solutions must be stored tightlysealed (e.g., with a Parafilm gasket between the cap and the solution)and refrigerated, if possible. Samples should not be analyzed, however,until they have returned to room temperature.
Drift Solution
It is necessary to analyze a drift solution multiple times throughoutan analytical run (see “Setting Up A Typical Analytical Run,” p. 14).This solution will be used to identify and correct for instrumental drift.Typical drift observed for pore waters and igneous rock analyses duringLeg 189 and the Leg 189 transit is on the order of 1%–2% per hour.
There are two important considerations in selecting a drift solution.(1) The drift solution must be matrix matched to the samples and stan-dards that are being analyzed. If the matrix of the drift solution doesnot match the matrix of the samples and standards, then the behaviorof the ICP-AES throughout the day may differ for the two different ma-trices, and thus the quantified drift would not accurately reflect varia-tions in the sample analysis. (2) There must be an adequate concentra-tion of target elements in the drift solution so the instrument canaccurately quantify the intensity of each element.
It is not necessary to know the exact concentration of each elementin the drift solution; however, it is critical that the composition of thissolution remain uniform throughout the run. The analyst will not usethe element concentrations during data reduction but rather the rela-tive change in response to each element. This indicates the change inthe ability of the ICP-AES to consistently measure these concentrationsthroughout the run.
Rocks and Sediments
The best drift monitors are samples that have been previously ana-lyzed and are no longer needed. Thus, such finished solutions shouldbe combined into a larger storage container for use as drift solution inthe future. Solutions that have become unstable and thus unsuitable forquantitative analysis can also be added to this drift solution, providedthey have been filtered to remove any gel that has formed and that nofurther gels are forming. Drift solutions are also useful, for example, tosupply experimental solutions for nebulizer testing, checking or adjust-ing instrument parameters, setting up an analytical run, and other diag-nostic purposes. Because of the importance of matrix matching, it maybe advisable to keep separate drift solutions for carbonate-rich sedi-ments, mid-ocean-ridge basalts (MORBs), shaley-type sediments, arc la-vas, etc. There is no need to oversegregate, however, because thedominant matrix component is LiBO2 in all cases. Finally, even in natu-ral samples, if the concentration of any element is too low, the analyst
R.W. MURRAY ET AL.ANALYSIS OF MAJOR AND TRACE ELEMENTS BY ICP-AES 10
should spike the drift solution with a single element standard of thelow element so that the peak is easily detected by the ICP-AES.
Interstitial Waters
Because of the limited availability of interstitial water and its greatvalue, unused sample solutions are likely to be archived or retained bythe shipboard chemists. Thus, such solutions should not be used as driftsolutions.
An artificial drift solution for interstitial waters can be constructedfrom filtered surface seawater. Recall that the concentrations need notbe exact. To construct such a drift solution, the following equation canbe used:
(V1)(C1) = (V2)(C2)(1/FW), (1)
where
V1 = volume of drift solution to be prepared, in liters.C1 = target concentration of element in drift solution, in micromoles
per liter.V2 = volume of single-element standard (VWR, Fisher, etc.) to add to
solution, in milliliters.C2 = concentration of single-element standard supplied by vendor, in
micrograms per milliliter.FW = formula weight of element, in micromoles per microgram.
For example, most single element standard solutions are supplied at aconcentration of 1000 µg/mL (C2). To prepare 1 L of drift solution (V1)containing Fe at a concentration of 10 µmol (C1)(to mimic a 10× dilutionof pore water that would have an undiluted concentration of 100 µmol),equation 1 is set up as follows:
(1 L)(10 µmol/L) = (V2 mL)(1000 µg/mL)(1/55.8 µmol/µg). (2)
Solving the equation for V2 results in 0.6 mL of Fe single-element so-lution to be added to prepare the 1-L drift solution. In practice, the bestway to do this is to take 100 mL of filtered surface seawater, add 900 mLof DI (to yield 1 L), and then spike this solution with 0.6 mL of 1000µg/mL Fe standard solution. Although this will result in a total volumeof 1000.6 mL, the deviation from exact volume is not significantenough to affect the utility of this solution as a drift monitor (whichneed not be quantitative).
Equation 1 can be applied for each element commonly analyzed byICP-AES (Li, B, Fe, Mn, Sr, and Ba), and a single multielement drift solu-tion can be prepared. B, Li, and Sr do not need to be added to the artifi-cial drift solution because their concentrations in seawater are highenough to be measured without an additional spike. Spiking with onlythe small amount of Ba indicated in Table T2 does not cause precipita-tion of barite (BaSO4).
Table T2 provides the calculated results (from Equation 1) for prepa-ration of a comprehensive artificial interstitial water drift solution. Acompanion Excel spreadsheet to Table T2, complete with linked Excelformulas and explanatory annotations, has been provided to ODP to as-sist in the construction of this drift solution.
T2. Construction of interstitial wa-ter drift solution, p. 25.

R.W. MURRAY ET AL.ANALYSIS OF MAJOR AND TRACE ELEMENTS BY ICP-AES 11
Rinse Solution and Rinse Times
It is necessary to rinse the sample uptake tubing and torch glasswarebetween each sample and each standard to prevent carryover from theprevious sample or standard. Rinsing also helps combat nebulizer clog-ging. The critical parameter of constraint is that the acid concentrationof the rinse should be the same as the acid concentration of the samplesand standards. This ensures that the plasma is not exposed to differentmatrices spaced closely together, which would negatively affect instru-ment stability throughout the run.
Rocks and Sediments
For the LiBO2 matrix, a 10% HNO3 rinse solution works very well. Atypical rinse time is ~1.5 min between each sample or standard. This isa minimum time; it is in the analyst's best interest to use an adequaterinse time because the analytical run will be of higher quality and therewill be less buildup of deposits on the torch glassware. Longer rinsetimes result in improvement of (i.e., reduction of) instrumental driftthroughout the run.
Interstitial Waters
There is essentially no acid in the interstitial water samples, becausethe minimal acid amounts added during acidification of the initialsqueezed sample is not enough to be of concern. However, rinsing withDI alone does not adequately keep the nebulizer orifice free of precipi-tating salts. A weak acid rinse (~0.5% HNO3) performs very well anddoes not present a sufficient matrix difference to adversely affect theanalysis. Again, rinse times should be ~1.5 min between each sampleand standard.
Analytical Wavelengthsand Element Menus
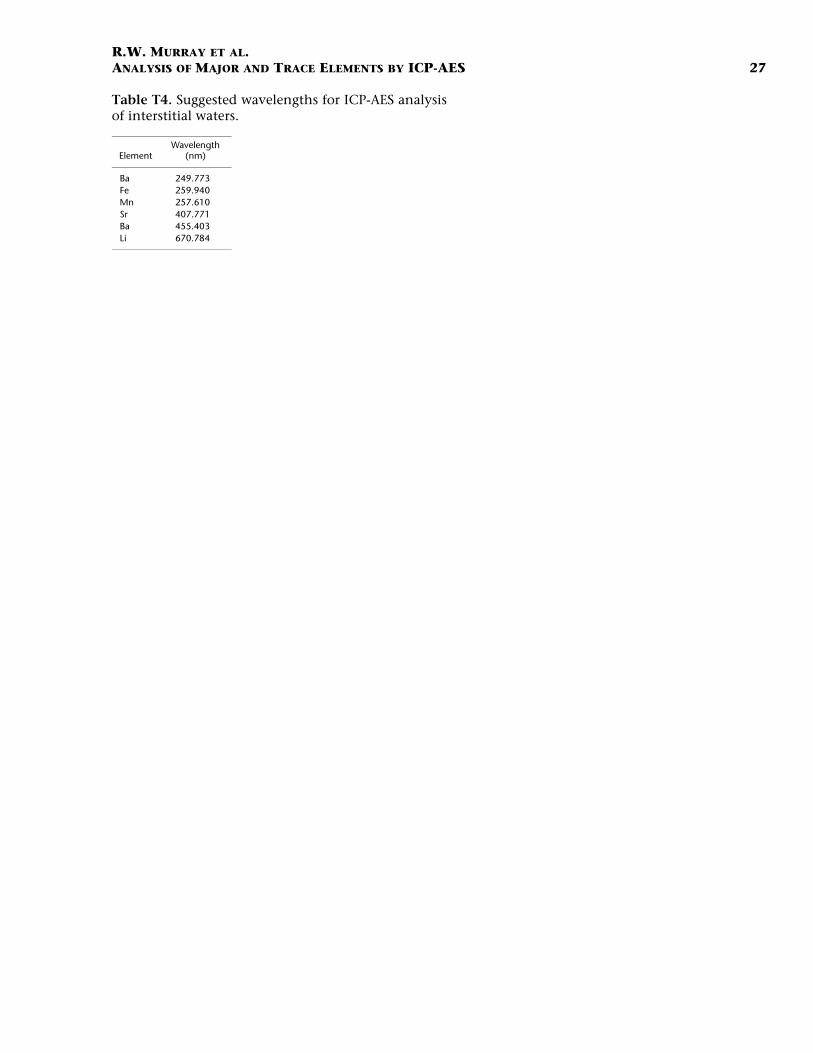
Wavelength selection is somewhat of an individual choice that com-monly varies from analyst to analyst. However, there is a developingconsensus regarding the wavelengths best suited for a particular targetanalyte. The wavelengths provided in Tables T3 and T4 have yieldedgood results in a variety of studies but should be considered to be sug-gestions only. If a particular shipboard scientist wishes to select a differ-ent wavelength that he or she has had better success with in theanalysis of some type of sample, this can easily be accommodated bythe JY2000 software. In the ICP-AES literature on board the ship, mostof the publications suggest wavelengths appropriate for geological ma-trices, not only for the elements included here but also for others that ascientist may be interested in analyzing.
Rocks and Sediments
Appropriate wavelengths for ICP-AES analysis of rocks and sedimentsare listed in Table T3.
T3. Suggested wavelengths for ICP-AES analysis of rocks and sedi-ments, p. 26.
T4. Suggested wavelengths for ICP-AES analysis of interstitial wa-ters, p. 27.
R.W. MURRAY ET AL.ANALYSIS OF MAJOR AND TRACE ELEMENTS BY ICP-AES 12
Interstitial Waters
For interstitial waters, use of spectrophotometric procedures (Gieskeset al., 1991) is preferred for the analysis of P and Si, particularly forthose samples with relatively low concentrations. Similarly, ion chro-matography (IC) is preferred for the analysis of Ca, Mg, and K (with Nabeing calculated by charge balance). However, ICP-AES analyses ofthese elements can provide important confirmation of spectrophoto-metric or IC results and is also worthwhile if there are difficulties withthese other instruments. Experiments conducted during Leg 189 for themajor cations provided excellent results, and preliminary work duringthe Leg 189 transit documented that total S can potentially be analyzedby ICP-AES in interstitial waters as well.
For higher concentration elements (such as the major cations),greater dilution factors may be required so the intensity of the wave-length remains within photomultiplier range. Additionally, to conservesample, the greatest dilution possible should be used.
In summary, routine ICP-AES analyses can be relatively easily per-formed on interstitial water samples for Fe, Mn, Sr, Ba, B, and Li, withother elements added or deleted as deemed appropriate by the ship-board scientists and technical staff. These six elements can be deter-mined on a single 10× dilution, based on 0.5 mL of sample and 4.5 mLof DI. Suggested wavelengths appropriate to the analysis of interstitialwaters are given in Table T4.
Calibration Standards
ICP-AES is a comparative analytical technique, in that the instru-ment response (measured in “counts” units) must be calibrated againststandards in which the concentrations of the various elements areknown. There are two main calibration methods: (1) calibration againstinternationally recognized and approved standard reference materials(SRMs), or (2) calibration against synthetically prepared calibrationstandard solutions that have been constructed to closely mimic the ma-trix of the unknown samples. Each method has its strengths and weak-nesses.
Rocks and Sediments
Calibration is best achieved through comparison to SRMs in a similarmanner to that used in XRF analysis; however, whereas the XRF can re-tain a given calibration for several months, the ICP-AES must be cali-brated before each analytical run. Selection of appropriate SRMs forcalibration is dependent on the anticipated range of concentrations inthe samples. Unlike the XRF, which is commonly calibrated on the basisof tens of individual SRMs, for ICP-AES analysis, robust linear calibra-tion can be achieved with five SRMs and a blank. Because LiBO2 is thedominant matrix component, SRMs of differing lithologies can be usedin the same calibration. For example, a single calibration composed ofshale, andesite, basalt, and obsidian SRMs yields strong linearity formany elements. It is essential that the SRMs used for calibration be pre-pared with exactly the same TDS and acid concentration as the samples.
Because standard calibrations are required for each run, SRMs tend tobe consumed relatively rapidly. In the interest of conservation, if thereare enough calibration solutions left over from a previous run, and if

R.W. MURRAY ET AL.ANALYSIS OF MAJOR AND TRACE ELEMENTS BY ICP-AES 13
these solutions were prepared identically, then it is appropriate to reusethose SRM solutions until they are depleted.
It is common for laboratories to develop their own in-house calibra-tion powders, to ease consumption of the often expensive and analyti-cally valuable SRMs. The ODP laboratory should build a library ofcalibration standards using available rocks and sediments. After severalpreparations and analyses of these in-house samples, they can then beused for calibration purposes, as long as at least one independent certi-fied SRM is analyzed as an unknown in each run to verify the calibra-tion.
Basalts
We recommend calibration using the SRMs abbreviated as DNC-1,BIR-1, BHVO-2, W-2, and BCR-2. Additional well-characterized rocks(although not certified SRMs) used to check calibration results includeK1919 and BAS140. For other igneous rock types, the above suite ofSRMs can be modified to bracket the anticipated dynamic range of thedata set.
Sediments
Variability in sedimentary compositions precludes use of a single setof SRMs to cover all sediment ranges. The three end-member composi-tions of sediments are shales, carbonates, and siliceous deposits. At thistime, ODP has only a few sedimentary SRMs available. For shales, MAG-1, SCo-1, and other shales such as BCSS-1 or MESS-1, used in combina-tion with high silica basalts will usually suffice. For carbonates, inclu-sion of NIST-1C (an argillaceous limestone) and other carbonate SRMs isessential. Variations in Ca are widely known to cause matrix effects, socare must be taken to select appropriate SRMs. Depending on the lithol-ogy of the targeted unknowns, a calibration using a blank (as a zeropoint), and two or three carbonate SRMs works moderately well. For sil-iceous sediments, use of rhyolite, as a high-silica standard, along withshale and basalt SRMs, works adequately.
Interstitial Waters
Calibration standards for interstitial waters must be constructed bythe analyst, because an extended suite of seawater SRMs does not exist.Such standards can be prepared using one of the two following similarmethods. In the first (less preferred) method, a spiked International As-sociation for the Physical Sciences of the Ocean (IAPSO) solution is usedas a master standard from which serial dilutions (approximately matrixmatched to seawater by diluting with the synthetic seawater of Gieskeset al. [1991]) are prepared for eventual analysis. This technique has theadvantage that the concentrations of the elements in the standards areexactly known, although the matrix match is not ideal. In the rare cir-cumstances where the surface seawater method described below is notappropriate (low salinity due to rain or river input), this IAPSO methodcan be used to construct standards, although it is somewhat expensive.
The second approach (recommended here) is to use filtered surfaceseawater as the primary matrix, spiked accordingly to create a masterstandard solution from which serial dilutions in seawater are prepared.Surface seawater can be assumed to have concentrations of Li = 25 µM,B = 416 µM, and Sr = 90 µM (Millero, 1996), and the analyst can easilyverify by ICP-AES that the concentrations of Fe, Mn, and Ba (found innanomolar concentrations in surface seawater [Millero, 1996]) are es-

R.W. MURRAY ET AL.ANALYSIS OF MAJOR AND TRACE ELEMENTS BY ICP-AES 14
sentially zero. If dissolved silica will be measured by ICP-AES, the con-centration in the surface water standard can be determinedspectrometrically. This technique using surface seawater to constructthe intermediate standard has the advantage that the matrix match isvery robust but has the disadvantage that the initial concentrations ofLi, B, and Sr (given above) may not be precise. However, in practice, thislimitation is deemed to be minimal and can be easily verified usingstandard additions. The IAPSO solution can also be used as an appropri-ate check of accuracy.
For the preparation of these standards, we have provided ODP with adetailed series of numbered steps and explanations in spreadsheet form.Using the linked Excel formulas throughout the spreadsheet, the ana-lyst can vary a number of parameters to construct different volumesand concentrations as needed.
SETTING UP A TYPICALANALYTICAL RUN
Described here is the process that is usually performed on a daily ba-sis when the ICP-AES is used to perform a series of quantitative analy-ses. Because of the instrument’s ability to provide rapid analysis, it ismost efficient to analyze 20–25 samples per run. Along with calibrationSRMs, drift solutions, blanks, replicate samples, calibration verifica-tions, and other items, these tasks will fill an analytical day.
Additionally, for reasons relating to good analytical practice, this rec-ommended general number of samples also makes sense—analyticalprecision is optimal when as many samples from a given site/hole areanalyzed at the same time. For interstitial waters, samples from an en-tire site can be analyzed for a number of different trace elements in onerun.
In all situations, it is advisable to analyze samples in random order(i.e., not in order of depth). Although analytical drift is accommodatedthroughout the run (see “Data Reduction,” p. 17) analyzing samples inrandom depth order ensures that the final observed downhole trendsare not caused artificially. All samples should analyzed at room temper-ature. Aspirating cold solutions (e.g., interstitial waters from the refrig-erator) leads to high relative standard deviations and increasedinstrument drift.
The following descriptions apply to rocks and sediments as well as tointerstitial waters and assumes that the method has been developed(complete with background corrections, selection of analytical mode,and all other parameters), calibration standards are constructed, sam-ples have been diluted and are ready to run, and the sample file hasbeen built. Some of the terminology may be unique to the JY instru-ment.
1. Warm up for at least 30 minutes. Do not be tempted to rush this.The warm-up period is not only for the generator but also for the glass-ware, torch box, and other aspects of the sample introduction system. Besure to aspirate DI during the warm-up period. It is commonly helpfulto aspirate a solution of the same matrix as the samples for the last ~5min of the warm-up period. The plasma should not be run dry for longperiods of time (exceeding 3 min). A representative start-up procedure isprovided in “Appendix,” p. 22.

R.W. MURRAY ET AL.ANALYSIS OF MAJOR AND TRACE ELEMENTS BY ICP-AES 15
2. Perform a zero-order check, if needed. Zero order is the term used todefine when the grating within the spectrometer behaves as a mirror,reflecting incoming light rather than refracting it into several wave-lengths. A zero-order check physically moves the diffraction grating toits zero position, where all light is reflected. Although the software willcheck whether zero order is okay or not whenever the instrument isturned on, this internal software check is not a true mechanical test. Itis instead a test of whether the electronics have been compromised (i.e.,turned on or off, been subjected to a surge, etc.) since the ICP was lastused. Therefore, it is advisable to perform a zero-order check (Shift-F2;Center Control) every few days. It is also helpful to record in a logbookat what position (step number) zero order was found, as this parameteris useful for diagnostics, should the need arise.
3. Perform an autosearch. During elemental analysis (e.g., Fe at238.204 nm), the spectrometer searches for a reference peak (the carbonline at 193.031 nm) and subsequently moves to the chosen wavelengthas a function of its distance (in motor steps, which corresponds to nm)from the reference peak. Prior to each analysis, the ICP searches for thereference peak and locates it. The autosearch function calibrates the in-strument exactly for each peak location with respect to the reference, soduring analysis it can locate the wavelength precisely. The autosearchalso quantifies an offset, which is the distance (in nanometers) that thereference peak was found from where it was expected. Typical offsetsare on the order of 0.005 nm or less. Perform autosearch repeatedly un-til the peaks are visually on-line each time, paying attention to theamount of offset (in nanometers). Offsets significantly and consistentlygreater than ~0.005 nm may indicate something is amiss (in practicethis will depend on ODP’s exact instrument). We recommend perform-ing several autosearch commands in a series immediately prior to cali-bration. The first time an element is autosearched, or whenever amethod has been changed significantly, be sure to use a single elementsolution to ensure that the peak found during an autosearch is in fact apeak for the element of interest. Subsequently, a standard or drift solu-tion can be used to Autosearch. Using the Small Window option on theJY2000 software also helps ensure that the peak found is the one of in-terest.
4. Perform a calibration. If the calibration feature of the software ischosen, the instrument must be calibrated for every analyte of interestprior to each run (see “Constructing a Sample File and PerformingData Reduction,” p. 16, for details on calibration options). The operat-ing conditions of the ICP during the calibration must be identical toanalysis conditions, so all manipulation of gas flows, pump speeds, andthe like must have taken place prior to this stage. In fact, if any operat-ing conditions have changed, a new Autosearch will need to be per-formed. Using the autosampler helps ensure that the calibrationconditions (e.g., rinse time) will be identical. Note: the JY2000 softwaredoes not allow for correction of drift between calibration standards, sothe analyst is forced to assume that only minimal drift takes place dur-ing this aspect of a run. This assumption has been shown to be rela-tively robust and its effects minimized during data reduction.
5. Start Run. Initiation of the analytical run must occur as soon aspossible after the calibration is completed (usually within 5–10 min).This is of vital importance because the first item in the sample file is adrift solution, which will be used as the master drift to correct the entirerun. Provided the sample file is ready, the autosampler is loaded, and all

R.W. MURRAY ET AL.ANALYSIS OF MAJOR AND TRACE ELEMENTS BY ICP-AES 16
other preparations are completed, starting the run this quickly is notdifficult.
CONSTRUCTING A SAMPLE FILE AND PERFORMING DATA REDUCTION
Because the mechanics of data reduction are a direct result of the or-der that standards, unknowns, drift solutions, and other standard refer-ence materials are analyzed, it is most appropriate to consider samplefile and data reduction together.
There is no single correct method to reduce the data acquired duringan ICP run. The discussion below outlines several alternatives and isnot a comprehensive list. Each of these procedures has been demon-strated to work well. This section is intended to outline some of thegeneral principles and goals of data reduction. We have provided toODP specially designed Excel spreadsheets to perform these calcula-tions in a fashion that is based on results from Legs 187–189 and at Bos-ton University. These spreadsheets are located onboard the Resolution.
The one commonality to all data reduction methods is that the anal-yses of one or more SRMs in the analytical run, when treated as un-known samples, yields a result that is in agreement with theinternationally recognized values. SRMs can be used in the analysis ofrocks and sediments, and IAPSO seawater can be used (for some ele-ments) in the analysis of interstitial waters. For Fe, Mn, and Ba (thoseelements not contained in IAPSO solution), accuracy can be assessed bycomparison to a spiked IAPSO sample.
Sample File
A sample file is constructed by the analyst and is accessed by the ICPand the autosampler to analyze a series of analytes, including unknownsamples, drift solutions, blanks, and any other solutions desired. In ad-dition to specifying the physical position of each solution in the au-tosampler rack, the sample file tells the ICP the order in which thesesolutions are analyzed. A sample file is not used for calibration. For de-tails on how to build a sample file using the JY software, please refer tothe companion “Software Notes” that are located on the Resolution.
The critical component in the sample file is the order in which thesamples are run, for this will affect the ability to perform an appropriatedata reduction. A typical sample file may look like the following (notethat this would be for a short run; a total of up to 30–40 items is moretypical):
Drift 1SRM-1Drift 2Sample ASample BDrift 3SRM-2Sample CSample DDrift 4SRM-3

R.W. MURRAY ET AL.ANALYSIS OF MAJOR AND TRACE ELEMENTS BY ICP-AES 17
ZIPSample EDrift 5, and so on...
There are several critical aspects to this sample file:
1. The run starts and finishes with a drift solution.2. Drift solutions are run more frequently at the beginning of the
run, when the ICP is more prone to instability.3. Drift solutions should be run no less frequently than every 20–
30 min of instrument time after the first few drifts have beenrun. Thus, the frequency of drift analyses depends on how manyelements are being analyzed in that particular method.
4. The item identified as ZIP is a procedural blank. Avoid use of theword Blank or Blk in the Sample File, as well as of Standard orStd, as these at times have specific meaning to the JY softwareand may cause an unintended data manipulation.
5. Standards and check solutions are spaced throughout the run.For the analysis of rocks and sediments, these may be SRMs; forthe analysis of interstitial waters, these may be calibration stan-dards rerun as part of the Sample File, as well as Ba calibrationstandards.
Data Reduction
There are two main approaches to calibration and data reduction. Wehave tested calibration routines for both interstitial waters and igneousrocks using the calibration software (Option 1, below). Accordingly, thespreadsheets we have provided to ODP are tailored to Option 1.
1. Using the calibration feature. If a calibration is performed imme-diately prior to launching the Sample File, the JY software willprovide concentration data for each item as the run proceeds.Thus, the first steps of the data reduction are performed by theJY software. Although the concentrations calculated during therun are preliminary because they have not been drift corrected,the analyst can immediately determine if the data appear to bereasonable as the run proceeds. If not, the run can be terminatedand an explanation sought. The final data can be drift correctedusing the Excel spreadsheets provided to ODP.
2. Without use of calibration feature. If the JY calibration softwareoption is not selected, the analyst can construct a sample filesimilar to one shown above and perform all data reduction off-line using the following steps.a. Drift correct all counts data, by assuming a constant linear
change between drifts.b. Blank subtract, by subtracting the counts of each element in
the Zip item from each unknown.c. Construct a calibration line for each element, based on the
drift-corrected, blank-subtracted counts plotted on an x-ygraph against the known concentration of the SRM (or in thecase of interstitial waters of the synthetically constructedstandard). Because the items were blank subtracted, the cali-bration line can be forced through the origin (0,0) if desired.

R.W. MURRAY ET AL.ANALYSIS OF MAJOR AND TRACE ELEMENTS BY ICP-AES 18
d. Calculate the concentration of each element in each un-known, using the equation of the calibration line derivedabove.
The main advantages of Option 2 are that it gives the analyst flexibil-ity in all aspects of data reduction and it is not affected by the assump-tion of zero drift during the calibration because the SRMs used in the cal-ibration are drift corrected along with the samples. In addition to beingvery time consuming, the main disadvantage to the manual data reduc-tion of Option 2 is that the analyst can not assess if a run has been suc-cessful until the run is completed and all the data have been reduced. Assolutions are somewhat precious and there is commonly a delay betweena series of data acquisition runs and the associated data reduction, thisoften is not desirable.
BASIC MAINTENANCE SUGGESTIONS
Unclogging a Nebulizer
Sometimes in the course of human events a nebulizer will becomeclogged. Clogging can be diagnosed by a steady decrease in the Ar flowrate with a corresponding rise in the Ar backpressure. Additionally, thestability of the instrument will greatly decrease. Because of the impor-tance of the nebulizer to the analytical process, great care must be takento be prevent clogging.
The best way to unclog a nebulizer is to never let it clog in the firstplace. This can be accomplished by filtering all samples, standards,drifts, and any other solution that is aspirated. Keep the wash bottle,rinse bottle, and other solutions covered whenever possible. If a wide-mouth bottle is used for the rinse bottle, boring a small hole in the capwill minimize the input of dust into the solution.
Never use an ultrasonic bath to unclog a nebulizer. The vibrations insuch a bath will harm the delicate glass channel of the nebulizer. Be-cause the channel of a concentric nebulizer gets successively more nar-row towards the tip, never try to clean a nebulizer by forcing gas orwater in the forward direction.
Soaking the nebulizer in 20% (or greater) HNO3 or in aqua regia solu-tion (1 part HNO3:3 parts HCl) greatly assists the unclogging process.Inject the acid solution (wearing gloves) into the front of the nebulizer,and also gently inject some acid up from the Ar channel. This will en-sure that the clogged tip will be inundated from all directions. Such in-jection can be achieved by outfitting a syringe with the appropriatesized Tygon tubing. Let the nebulizer soak overnight, in a heated bath ifpossible. Additionally, provided the nebulizer has been thoroughlyrinsed with deionized water (and thus there is no remaining acidpresent), the nebulizer can be sometimes unclogged by unhooking oneof the Ar gas flow lines from the ICP torch assembly, placing the end ofthe tube over the tip of the nebulizer, and using the high Ar pressure toblow back through the nebulizer. Be sure to hold the nebulizer tightlyto prevent it from launching across the room.

R.W. MURRAY ET AL.ANALYSIS OF MAJOR AND TRACE ELEMENTS BY ICP-AES 19
Cleaning the Quartz Glasswareand Alumina Injector Tip
The fully demountable torch assembly from JY lends itself to easycleaning. Precipitate will build up on the surfaces of the outer tube, in-ner tube, and alumina injector. This is detrimental to the analysis be-cause it affects plasma shape and stability and inhibits analyteionization. Depending on the concentration of acid and the dilutionfactor of the LiBO2 fusions, the quartz tube surfaces will chip andabrade. For the fused rock and sediment samples, it is recommended toclean the glassware frequently (after 2–4 analytical runs) to help main-tain instrument stability and minimize glassware corrosion.
There is a difference between precipitate buildup and staining. Stain-ing is inevitable and can be tolerated. Precipitate on the surfaces of theglassware, however, is more serious and must be monitored. The key is-sue is that the glassware must be smooth, with the unchipped andhigh-quality edges. The outer quartz tube must be very clean with min-imal stains.
Soaking all glassware in 20% (or stronger) HNO3 or aqua regia solu-tion helps the cleaning process. As with the nebulizer, let the glasswaresoak overnight, in a heated bath if possible. Avoid the use of an ultra-sonic bath. Use KimWipes or other clean lint-free cloths to polish theoutside of the tube, and pass the KimWipe through the inside of thecylinder and pass back and forth.
The inner quartz tube can be inverted (reversed) so the stained end isat the bottom of the torch assembly, but if this is done be sure that theedges of the tube are smooth and sharp so that the bottom of the tubeis seated properly. Soaking the upper end of the alumina tip, even inrelatively weak HNO3, helps clean away precipitate easily.
USEFUL REFERENCES DISCUSSINGICP-AES TECHNIQUES
The following articles provide excellent background information onmany aspects of ICP-AES, including much information specific to theanalysis of geological matrices. Copies of each of these articles are avail-able in the Chemistry Laboratory on the drillship. Additionally, notethat two of these articles come from a special issue of Chemical Geologythat is devoted to ICP-AES and ICP–mass spectrometry (ICP-MS). Otherarticles in this issue (not listed here) may also be of interest.
Jarvis, I., and Jarvis, K.E., 1992a. Inductively coupled plasma-atomicemission spectrometry in exploration geochemistry. J. Geochem.Expl., 44:139–200.
————, 1992b. Plasma spectrometry in the earth sciences: tech-niques, applications and future trends. Chem. Geol., 95:1–33.
Montaser, A., and Golightly, D.W., 1992. Inductively Coupled Plasmasin Analytical Atomic Spectrometry: New York (VCH Publ.).
Potts, P.J., 1987. Inductively coupled plasma-emission spectrometry.In Potts., P.J. (Ed.), A Handbook of Silicate Rock Analysis: London(Blackie Academic and Professional), 153–197.
Totland, M., Jarvis, I., and Jarvis, K.E., 1992. An assessment of disso-lution techniques for the analysis of geological samples by plas-ma spectrometry. Chem. Geol., 95:35–62.

R.W. MURRAY ET AL.ANALYSIS OF MAJOR AND TRACE ELEMENTS BY ICP-AES 20
Walsh, J.N., and Howie, R.A., 1986. Recent developments in analyti-cal methods: uses of inductively coupled plasma source spec-trometry in applied geology and geochemistry. Appl. Geochem.,1:161–171.
ACKNOWLEDGMENTS
In the construction of this Technical Note we have drawn heavily onthe expertise and input of a number of different individuals and institu-tions. At Boston University, we particularly thank Terry Plank, KatieKelley, Lauren Vigliotti, Joel Sparks, and Eric Grunwald for their feed-back and assistance during the refinement of some of the methodolo-gies described herein. We also thank Gilles Poncet and his colleagues atthe Jobin-Yvon Emission Division of Instruments SA, Inc., for their re-sponsiveness and assistance. At the Ocean Drilling Program, the effortsof Dennis Graham, Chieh Peng, Anne Pimmel, Jaque Ledbetter, BradJulson, Tim Bronk, Don Sims, Johanna Suhonen, and other members ofthe scientific and technical staff eased the transition of installing anderating the ICP-AES device on board the ship during Legs 187–189.
The scientific community responded positively to this installationand development effort, and in particular we acknowledge the supportof the Leg 185 igneous and pore-water scientists, as well as Eric De-Carlo, Dave Christie, Vaughn Balzer, Mitch Malone, and other membersof the Legs 187–189 scientific and technical parties.
We acknowledge the support of the U.S. National Science Founda-tion and the U.S. Geological Survey of the Boston University AnalyticalGeochemistry Facility, where protocols were tested for the ODP ship-board environment. We also thank the US Department of Energy for financial support associated with the acquisition of the ODP shipboard
ICP-AES instrument.
R.W. MURRAY ET AL.ANALYSIS OF MAJOR AND TRACE ELEMENTS BY ICP-AES 21
REFERENCES
Gieskes, J.M., Gamo, T., and Brumsack, H., 1991. Chemical methods for interstitialwater analysis aboard JOIDES Resolution. ODP Tech. Note, 15.
Millero, F. J., 1996, Chemical Oceanography (2nd ed): New York (CRC Press).Shipboard Scientific Party, in press a. Explanatory notes. In Christie, D.M., Pedersen,
R.B., Miller, D.J., et al., Proc. ODP, Init. Repts., 187 [CD-ROM]. Available from:Ocean Drilling Program, Texas A&M University, College Station TX 77845-9547,USA.
Shipboard Scientific Party, in press b. Explanatory notes. In Cooper, A.K., O’Brien,P.E., Richter, C., et al., Proc. ODP, Init. Repts., 188 [CD-ROM]. Available from: OceanDrilling Program, Texas A&M University, College Station TX 77845-9547, USA.
Shipboard Scientific Party, in press c. Explanatory notes. In Exon, N.F., Kennett, J.P.,Malone, M.J., et al., Proc. ODP, Init. Repts., 189 [CD-ROM]. Available from: OceanDrilling Program, Texas A&M University, College Station TX 77845-9547, USA.

R.W. MURRAY ET AL.ANALYSIS OF MAJOR AND TRACE ELEMENTS BY ICP-AES 22
APPENDIX
Start-Up Procedure
1. Empty drain bottle if needed.2. Check peristaltic pump tubing is not flattened. Replace if necessary.3. Turn on cooling water.4. Turn on exhaust fan.5. Turn on argon at tank/regulator.6. Turn on peristaltic pump and begin pumping DI water.
Operating Conditions
Plasma flow: 12–14 L/minPump speed: 20Nebulizer pressure: ~3 barArgon humidifier: ON for basalts and fusions, OFF for interstitial waters
7. Pump DI at least 5 min prior to ignition. Check IN and OUT flow.8. Initiate start-up procedure through the Windows software.9. Recheck plasma.
10. Let instrument warm up for at least one-half hour...
Shut-Down Procedure
1. Pump rinse solution for at least 5 min.2. Pump DI for at least 3 min.3. Initiate stop procedure through the Windows software.4. Maintain gas flow and pump DI for 3 min.5. Remove input tubing from DI and pump until nebulizer and spray chamber are dry.6. Turn peristaltic pump off, release clamp, and unhook pump tubing.7. Turn off recirculating water.

R.W. MURRAY ET AL.ANALYSIS OF MAJOR AND TRACE ELEMENTS BY ICP-AES 23
PUBLISHER’S NOTES
Material in this publication may be copied without restraint for library, abstract service, educational, orpersonal research purposes; however, this source should be appropriately acknowledged.
Murray, R.W., Miller, D.J., Kryc, K.A., 2000. Analysis of major and trace elements in rocks, sediments, andinterstitial waters by inductively coupled plasma–atomic emission spectrometry (ICP-AES). ODP Tech. Note,29 [Online]. Available from World Wide Web: <http://www-odp.tamu.edu/publications/tnotes/tn29/INDEX.HTM>. [Cited YYYY-MM-DD]
Distribution: Electronic copies of this publication may be obtained from the ODP Publications homepageon the World Wide Web at: http://www-odp.tamu.edu/publications.
This publication was prepared by the Ocean Drilling Program, Texas A&M University, as an account ofwork performed under the international Ocean Drilling Program, which is managed by Joint Oceanograph-ic Institutions, Inc., under contract with the National Science Foundation. Funding for the program is pro-vided by the following agencies:
Australia/Canada/Chinese Taipei/Korea Consortium for Ocean Drilling Deutsche Forschungsgemeinschaft (Federal Republic of Germany)Institut National des Sciences de l'Univers-Centre National de la Recherche Scientifique (INSU CNRS;
France)Ocean Research Institute of the University of Tokyo (Japan)National Science Foundation (United States)Natural Environment Research Council (United Kingdom)European Science Foundation Consortium for Ocean Drilling (Belgium, Denmark, Finland, Iceland, Ire-
land, Italy, The Netherlands, Norway, Portugal, Spain, Sweden, and Switzerland)Marine High-Technology Bureau of the State Science and Technology Commission of the People’s Re-
public of China
DISCLAIMER
Any opinions, findings, and conclusions or recommendations expressed in this publication are those ofthe author(s) and do not necessarily reflect the views of the National Science Foundation, the participat-ing agencies, Joint Oceanographic Institutions, Inc., Texas A&M University, or Texas A&M Research Foun-dation.
R.W. MURRAY ET AL.ANALYSIS OF MAJOR AND TRACE ELEMENTS BY ICP-AES 24
Table T1. Conversion factors between oxide and ele-mental concentrations.
Oxide(wt%)
Conversionfactor
Element(wt%)
SiO2 0.4675 SiAl2O3 0.5293 AlFe2O3 0.6994 FeFeO 0.7773 FeMnO 0.7745 MnTiO2 0.5995 TiCaO 0.7143 CaNa2O 0.7419 NaK2O 0.8301 KMgO 0.6030 MgP2O5 0.4365 P

R.W. MURRAY ET AL.ANALYSIS OF MAJOR AND TRACE ELEMENTS BY ICP-AES 25
Table T2. Construction of interstitial water drift solution.
Notes: From “Equation 1,” p. 10: * = C1, ** = FW, *** = V1, † = C2, †† = V2. Concentration in drift solution = 10× dilution of concen-tration in undiluted sample.
Element
Concentration in undiluted sample
(µM)
Concentration in drift solution*
(µM)Formula weight**
(µg/µmol)
Volume of drift solution***
(L)
Concentration of primary standard†
(µg/ml)
Volume of primary standard to add
(L)
Volume of primary standard to add††
(ml)
Li 25 2.5 6.9 1 1000 0 0B 416 40 10.8 1 1000 0 0Mn 100 10 54.9 1 1000 0.0005 0.5Fe 100 10 55.8 1 1000 0.0006 0.6Sr 90 9 87.6 1 1000 0 0Ba 500 50 137.3 1 1000 0.0069 6.9

R.W. MURRAY ET AL.ANALYSIS OF MAJOR AND TRACE ELEMENTS BY ICP-AES 26
Table T3. Suggested wavelengths for ICP-AES analysisof rocks and sediments.
ElementWavelength
(nm) Remarks
Si 251.611Al 396.152Ti 334.941 This line is a doublet but is preferredTi 308.802Fe 259.940Mn 257.610Ca 393.366Mg 285.213Na 589.592K 766.490P 178.229 This line requires N2 flush and is preferredP 213.618Zr 343.823Y 371.030Sr 407.771Zn 213.856Cu 324.754Ni 231.604Cr 267.716V 292.402Sc 361.384Ba 455.403
R.W. MURRAY ET AL.ANALYSIS OF MAJOR AND TRACE ELEMENTS BY ICP-AES 27
Table T4. Suggested wavelengths for ICP-AES analysisof interstitial waters.
ElementWavelength
(nm)
Ba 249.773Fe 259.940Mn 257.610Sr 407.771Ba 455.403Li 670.784
Related Documents