Citation: Nam, K.; Qiao, Y.; Ahn, B.-i. Analysis of Consumer Preference for Green Tea with Eco-Friendly Certification in China. Sustainability 2022, 14, 211. https://doi.org/ 10.3390/su14010211 Academic Editors: Luigi Roselli and Flavio Boccia Received: 2 November 2021 Accepted: 23 December 2021 Published: 26 December 2021 Publisher’s Note: MDPI stays neutral with regard to jurisdictional claims in published maps and institutional affil- iations. Copyright: © 2021 by the authors. Licensee MDPI, Basel, Switzerland. This article is an open access article distributed under the terms and conditions of the Creative Commons Attribution (CC BY) license (https:// creativecommons.org/licenses/by/ 4.0/). sustainability Article Analysis of Consumer Preference for Green Tea with Eco-Friendly Certification in China Kyungsoo Nam 1 , Yiyang Qiao 2 and Byeong-il Ahn 2, * 1 Korea Rural Economic Institute, Naju 58321, Korea; [email protected] 2 Department of Food and Resource Economics, Korea University, Seoul 02841, Korea; [email protected] * Correspondence: [email protected] Abstract: The eco-friendly certification system is designed to ensure safe agricultural products to consumers while minimizing environmental pollution. However, despite its advantages, it is not widely adopted due to a possible decrease of farmers’ income. In order to provide implication for activating the eco-friendly certification system, this paper examines the attributes of green tea which affect consumers’ preferences and estimates consumers’ willingness to pay (WTP) for the eco-friendly certification in China. A choice experiment survey is employed for data collection, and the random utility model is used to estimate the preference for the certification and quality of green tea. The attribute that yields the highest marginal WTP turns out to be the organic certification for which WTP is $115.9/250 g higher than for no certification. Also, the analytical results indicate that the group with high trust is willing to pay up to $214.6/250 g more for green tea with organic certification compared to the one with no certification. The empirical results suggest that it is important to build the consumers’ awareness and trust toward the certification to activate the eco-friendly certification system. Keywords: eco-friendly agriculture; certification system; organic green tea; marginal willingness to pay; choice experiment; consumer preference 1. Introduction Food consumption behavior has changed due to the changes in consumption con- ditions, demographic structure, and climate change [1,2]. In the past, the strategy of increasing productivity in agriculture rather than considering the environment has been pursued [3,4]. However, as consumers’ preferences for food safety and health increase [5,6], more consumers value environmental conservation by linking agricultural production with the environment. The eco-friendly certification system is the most representative policy implemented to ensure food safety and preserve the environment in the agricultural sector. The eco-friendly certification system applies detailed certification standards in the different ways to each country. In China, based on different certification standards, the eco-friendly agriculture certification system is divided into organic certification, green food certification, and non-pollution certification [7]. Although eco-friendly certified agricultural products, safe agricultural products, and certified foods cannot be regarded as exactly the same expression, eco-friendly agricultural products are recognized as safe foods by consumers since they restrict chemical materials such as fertilizers and pesticides during production. Therefore, the eco-friendly certification system is implemented to provide safe agricultural products to consumers while minimizing environmental pollution [8]. Despite the advantages of the eco-friendly certification system, it is not easy to estab- lish and activate the system. One of the main reasons for this difficulty can be the high cost of eco-friendly production methods. A possible explanation is that the increase in price cannot cover the increase in production costs due to the low awareness and trust of the consumers [9]. Previous studies have shown that promoting consumers’ awareness could increase their willingness to pay (WTP) for eco-friendly agricultural products [10,11]. Sustainability 2022, 14, 211. https://doi.org/10.3390/su14010211 https://www.mdpi.com/journal/sustainability

Welcome message from author
This document is posted to help you gain knowledge. Please leave a comment to let me know what you think about it! Share it to your friends and learn new things together.
Transcript

�����������������
Citation: Nam, K.; Qiao, Y.; Ahn, B.-i.
Analysis of Consumer Preference for
Green Tea with Eco-Friendly
Certification in China. Sustainability
2022, 14, 211. https://doi.org/
10.3390/su14010211
Academic Editors: Luigi Roselli and
Flavio Boccia
Received: 2 November 2021
Accepted: 23 December 2021
Published: 26 December 2021
Publisher’s Note: MDPI stays neutral
with regard to jurisdictional claims in
published maps and institutional affil-
iations.
Copyright: © 2021 by the authors.
Licensee MDPI, Basel, Switzerland.
This article is an open access article
distributed under the terms and
conditions of the Creative Commons
Attribution (CC BY) license (https://
creativecommons.org/licenses/by/
4.0/).
sustainability
Article
Analysis of Consumer Preference for Green Tea withEco-Friendly Certification in China
Kyungsoo Nam 1, Yiyang Qiao 2 and Byeong-il Ahn 2,*
1 Korea Rural Economic Institute, Naju 58321, Korea; [email protected] Department of Food and Resource Economics, Korea University, Seoul 02841, Korea; [email protected]* Correspondence: [email protected]
Abstract: The eco-friendly certification system is designed to ensure safe agricultural products toconsumers while minimizing environmental pollution. However, despite its advantages, it is notwidely adopted due to a possible decrease of farmers’ income. In order to provide implication foractivating the eco-friendly certification system, this paper examines the attributes of green tea whichaffect consumers’ preferences and estimates consumers’ willingness to pay (WTP) for the eco-friendlycertification in China. A choice experiment survey is employed for data collection, and the randomutility model is used to estimate the preference for the certification and quality of green tea. Theattribute that yields the highest marginal WTP turns out to be the organic certification for which WTPis $115.9/250 g higher than for no certification. Also, the analytical results indicate that the group withhigh trust is willing to pay up to $214.6/250 g more for green tea with organic certification compared tothe one with no certification. The empirical results suggest that it is important to build the consumers’awareness and trust toward the certification to activate the eco-friendly certification system.
Keywords: eco-friendly agriculture; certification system; organic green tea; marginal willingness topay; choice experiment; consumer preference
1. Introduction
Food consumption behavior has changed due to the changes in consumption con-ditions, demographic structure, and climate change [1,2]. In the past, the strategy ofincreasing productivity in agriculture rather than considering the environment has beenpursued [3,4]. However, as consumers’ preferences for food safety and health increase [5,6],more consumers value environmental conservation by linking agricultural production withthe environment. The eco-friendly certification system is the most representative policyimplemented to ensure food safety and preserve the environment in the agricultural sector.The eco-friendly certification system applies detailed certification standards in the differentways to each country. In China, based on different certification standards, the eco-friendlyagriculture certification system is divided into organic certification, green food certification,and non-pollution certification [7]. Although eco-friendly certified agricultural products,safe agricultural products, and certified foods cannot be regarded as exactly the sameexpression, eco-friendly agricultural products are recognized as safe foods by consumerssince they restrict chemical materials such as fertilizers and pesticides during production.Therefore, the eco-friendly certification system is implemented to provide safe agriculturalproducts to consumers while minimizing environmental pollution [8].
Despite the advantages of the eco-friendly certification system, it is not easy to estab-lish and activate the system. One of the main reasons for this difficulty can be the highcost of eco-friendly production methods. A possible explanation is that the increase inprice cannot cover the increase in production costs due to the low awareness and trust ofthe consumers [9]. Previous studies have shown that promoting consumers’ awarenesscould increase their willingness to pay (WTP) for eco-friendly agricultural products [10,11].
Sustainability 2022, 14, 211. https://doi.org/10.3390/su14010211 https://www.mdpi.com/journal/sustainability

Sustainability 2022, 14, 211 2 of 16
In other words, the activation of eco-friendly agricultural production and the certifica-tion system is determined by the consumer’s WTP for eco-friendly agricultural products.Therefore, in order to activate the eco-friendly certification system in China, it is necessaryto examine the current status of the certification system and consumers’ preferences forthe system.
The eco-friendly certification system for agricultural product aims to reduce the impactof agriculture on the environment and provide safe agri-food to consumers. However,additional cost and effort are required, which can lead to a decrease in farmers’ income. Inorder to activate the eco-friendly certification, certified agricultural products need to bepriced higher than that of products with no certification. Also, the higher price should becaused by consumer’s WTP. In this context, two research questions are investigated in thispaper. First, which one will have a more positive effect on farm income: whether farmsshould produce eco-friendly agricultural products or just produce high-quality agriculturalproducts? Second, which one among the awareness of the eco-friendly certification sys-tem and consumers trust in the certification schemes has a greater effect on consumer’swillingness to pay? The product we chose to investigate these research questions is tea.Tea is a product that many Chinese consumers consume on a daily basis, and the qualityof tea is relatively clear to Chinese consumers. In addition, consumers’ awareness andtrust in the eco-friendly certification are easily distinguished. Therefore, we examine theattributes of tea that affect consumers’ preferences the most and estimate consumers’ WTPfor the eco-friendly certification. We analyze the differences in the consumers’ WTP for theeco-friendly certification according to consumers’ awareness and trust of the certification.The other purpose of this study is to suggest policy recommendations for activating theeco-friendly certification based on the estimated results.
This study ensure the objectivity of the results by using the most frequently used choiceexperiment for estimating the amount of WTP. The novelty of this study can be stated inthree points. First, we compare consumers’ WTP for eco-friendly certified products withthat for high-quality products. Second, we classify consumers into two groups and comparetheir WTP according to consumers’ awareness and trust in the eco-friendly certification.Third, we compare changes in consumer preference share by composing scenarios accordingto changes in the quality and the certification.
2. Literature Review
A number of studies have been conducted on consumers’ preferences for eco-friendlyagricultural products worldwide. The literature review of this study focuses on the con-sumers’ WTP for eco-friendly agricultural products, and it is divided into worldwideand China’s eco-friendly certification. Some studies compared eco-friendly food withlocal food and analyzed consumers’ consumption behaviors, awareness, and WTP [12–14].Xie et al. [15] estimated consumers’ WTP for US organic broccoli and imported broccoli.They found the positive effect of providing information about USDA certification stan-dards on consumer valuation of imported organic agricultural products. Illichmann andAbdulai [16] investigated the German consumers’ heterogeneous preferences of organicapples, milk, and beef by grouping them according to whether they trust the value of theorganic food. The results showed that consumers’ trust had a positive effect on organic foodconsumption. Jeong and Han [17] analyzed the characteristics of Korean consumers byusing the data on experiences in purchasing eco-friendly agricultural foods and examinedthe correlation between the experience and the policy for expanding the consumption.In addition, Kim and Lee [18] identified that the reputation of organic products has asignificant effect on consumers’ purchasing behavior of eco-friendly agricultural productsin Korea. Muhammada et al. [19] revealed that United Arab Emirates (UAE) consumers’WTP for organic food is increasing due to more awareness on healthy food. Furthermore,Ricci et al. [20] showed that consumer trust has a positive effect on purchase decision of eco-friendly convenience food in Italy. Janssen and Hamm [21] also claimed that the consumers’trust played an important role on purchase decision of organic food in Germany.

Sustainability 2022, 14, 211 3 of 16
In recent years, many studies have also investigated consumers’ preferences for eco-friendly agricultural products in China. Yu [22] analyzed the consumers’ awareness of threedifferent eco-friendly certifications in Guangzhou City and found that more awarenesscan increase the WTP for the non-pollution certificated food. Xing [23] used the choiceexperiment (CE) method to estimate the consumer’s WTP for food labels, including origin,organic certification, and nutritional ingredients. She found that consumers are willingto pay the highest premium for the organic label of milk. Zheng [24] used contingentvaluation method (CVM) to elicit the WTP for organic rice and organic pork of residentsin Beijing city and revealed a positive effect of consumers’ trust on purchase decision oforganic food.
One of the first investigations in the case of studying consumers’ preferences for teawas performed in 2007. Ye [25] compared the consumption of organic tea and ordinarytea in China and estimated that consumers are willing to pay 39.96% more for the organictea. Recently, Yang et al. [26] pointed out that China’s organic tea market is not activated.They used CVM to analyze the consumers’ WTP for organic tea in Fuzhou City. Theresults showed that those with a monthly income of more than 5000 yuan ($700) arewilling to pay 797.76 yuan/kg ($111.69/kg) more for organic tea. Additionally, Liu [27]and Su [28] investigated the consumers’ awareness of organic tea and discovered thatconsumers’ awareness has a positive effect on their WTP for organic tea. However, despitethe importance of tea consumption in China, few studies have analyzed the WTP forattributes of tea. In other words, there is a large gap in the literature concerning the demandon specific attribute of tea in China.
3. Eco-Friendly Certification System and Current Status of China’s Tea Market
According to Yu [29], China’s eco-friendly agriculture certification system is dividedinto organic certification, green food certification, and non-pollution certification due tocertification standards. Organic certification prohibits the addition of synthetic materi-als such as pesticides and fertilizers in the production process. In contrast, green foodcertification and non-pollution certification require limited synthetic materials, such aschemical pesticides (Figure 1). Non-pollution certification is the most basic certification inline with food safety legislation in China, and green food certification is the certificationsystem combining the global flow of agricultural development. Green food certificationand non-pollution certification are managed by China’s Ministry of Agriculture (MOA)and only implemented in China [29]. However, the relatively strict green food certification,which was introduced in China in 1989, has higher awareness and trust than those ofpollution-free certification [30]. In the case of tea, the eco-friendly certification system isapplied to the industry. Therefore, tea is classified into organic tea, green food tea, andnon-pollution tea [31].
Sustainability 2022, 14, x FOR PEER REVIEW 3 of 16
friendly convenience food in Italy. Janssen and Hamm [21] also claimed that the consum-ers’ trust played an important role on purchase decision of organic food in Germany.
In recent years, many studies have also investigated consumers’ preferences for eco-friendly agricultural products in China. Yu [22] analyzed the consumers’ awareness of three different eco-friendly certifications in Guangzhou City and found that more aware-ness can increase the WTP for the non-pollution certificated food. Xing [23] used the choice experiment (CE) method to estimate the consumer’s WTP for food labels, including origin, organic certification, and nutritional ingredients. She found that consumers are willing to pay the highest premium for the organic label of milk. Zheng [24] used contin-gent valuation method(CVM) to elicit the WTP for organic rice and organic pork of resi-dents in Beijing city and revealed a positive effect of consumers’ trust on purchase deci-sion of organic food.
One of the first investigations in the case of studying consumers’ preferences for tea was performed in 2007. Ye [25] compared the consumption of organic tea and ordinary tea in China and estimated that consumers are willing to pay 39.96% more for the organic tea. Recently, Yang et al. [26] pointed out that China’s organic tea market is not activated. They used CVM to analyze the consumers’ WTP for organic tea in Fuzhou City. The re-sults showed that those with a monthly income of more than 5000 yuan ($700) are willing to pay 797.76 yuan/kg ($111.69/kg) more for organic tea. Additionally, Liu [27] and Su [28] investigated the consumers’ awareness of organic tea and discovered that consumers’ awareness has a positive effect on their WTP for organic tea. However, despite the im-portance of tea consumption in China, few studies have analyzed the WTP for attributes of tea. In other words, there is a large gap in the literature concerning the demand on specific attribute of tea in China.
3. Eco-Friendly Certification System and Current Status of China’s Tea Market According to Yu [29], China’s eco-friendly agriculture certification system is divided
into organic certification, green food certification, and non-pollution certification due to certification standards. Organic certification prohibits the addition of synthetic materials such as pesticides and fertilizers in the production process. In contrast, green food certifi-cation and non-pollution certification require limited synthetic materials, such as chemical pesticides (Figure 1). Non-pollution certification is the most basic certification in line with food safety legislation in China, and green food certification is the certification system combining the global flow of agricultural development. Green food certification and non-pollution certification are managed by China’s Ministry of Agriculture (MOA) and only implemented in China [29]. However, the relatively strict green food certification, which was introduced in China in 1989, has higher awareness and trust than those of pollution-free certification [30]. In the case of tea, the eco-friendly certification system is applied to the industry. Therefore, tea is classified into organic tea, green food tea, and non-pollution tea [31].
Figure 1. Eco-friendly certification system in China. Adapted from: Yu [29], ‘Willingness to Pay for the “Green Food” in China’.
Figure 1. Eco-friendly certification system in China. Adapted from: Yu [29], ‘Willingness to Pay forthe “Green Food” in China’.
As of 2019, the total production area of tea exceeded 3.07 million hectares and the totalconsumption reached 202.6 million tons in China. Furthermore, green tea takes the largest

Sustainability 2022, 14, 211 4 of 16
share of production and consumption of tea in China, accounting for more than 60% ofproduction and consumption (Figure 2).
Figure 2. Percentage share of tea production and consumption in China during 2019. Source: ChinaTea Market Association, “2019 China Tea Production and Marketing Situation Report”.
In China, organic certification was implemented in the tea industry in 2000. Theplanted area of organic-certified tea increased from 20,000 ha in 2006 to 46,000 ha in 2014,and to 110,000 ha in 2018 (Figure 3). The share of area for organic tea within the total tea-planted area increased from 1.7% in 2014 and to 3.8% in 2018. In addition, the productionof organic tea continues to increase from 88,000 tons in 2014 to 193,000 tons in 2018, and theshare of organic tea in total tea production had reached 7.4% by 2018.
Sustainability 2022, 14, x FOR PEER REVIEW 4 of 16
As of 2019, the total production area of tea exceeded 3.07 million hectares and the total consumption reached 202.6 million tons in China. Furthermore, green tea takes the largest share of production and consumption of tea in China, accounting for more than 60% of production and consumption (Figure 2).
Figure 2. Percentage share of tea production and consumption in China during 2019. Source: China Tea Market Association, “2019 China Tea Production and Marketing Situation Report”.
In China, organic certification was implemented in the tea industry in 2000. The planted area of organic-certified tea increased from 20,000 ha in 2006 to 46,000 ha in 2014, and to 110,000 ha in 2018 (Figure 3). The share of area for organic tea within the total tea-planted area increased from 1.7% in 2014 and to 3.8% in 2018. In addition, the production of organic tea continues to increase from 88,000 tons in 2014 to 193,000 tons in 2018, and the share of organic tea in total tea production had reached 7.4% by 2018.
Figure 3. Total plantation area and production of tea with organic certification in China. Source: “Analysis of China’s Organic Tea Industry Development Situation and Investment Strategy Con-sulting Report 2020–2026”, “China Tea Production and Marketing Situation Report”.
The number of tea-producing firms with organic certification in China increased from 400 in 2010 to 1583 in 2017 (“Certification of Organic Products and Development of Organic Industry in China 2018”). In the case of tea with green food certification, the total planted area reached 200,000 ha by 2018. However, it is difficult to say that this proportion of the planted area (6.5%) is high (“Yunnan Tea Industry Green Development Bulletin”). Therefore, we can infer that the eco-friendly tea market has not been widely activated yet in China.
Figure 3. Total plantation area and production of tea with organic certification in China. Source:“Analysis of China’s Organic Tea Industry Development Situation and Investment Strategy ConsultingReport 2020–2026”, “China Tea Production and Marketing Situation Report”.
The number of tea-producing firms with organic certification in China increased from400 in 2010 to 1583 in 2017 (“Certification of Organic Products and Development of OrganicIndustry in China 2018”). In the case of tea with green food certification, the total plantedarea reached 200,000 ha by 2018. However, it is difficult to say that this proportion ofthe planted area (6.5%) is high (“Yunnan Tea Industry Green Development Bulletin”).Therefore, we can infer that the eco-friendly tea market has not been widely activated yetin China.
According to the FiBL survey on organic agriculture worldwide, the recorded or-ganic farmland in the world was more than 72.3 million hectares in 2019 (which is 1.5%of the world’s agricultural land). Globally, the country with the largest organic farm-land is Australia (35.7 million hectares), followed by Argentina (3.7 million hectares)and Spain (2.4 million hectares). China has the seventh-largest market of organic farm-land (2.2 million hectares). In 2019, the global organic food market reached more than113.2 billion dollars. The US is the largest organic food market in the world with a
Sustainability 2022, 14, 211 5 of 16
market size of 50.6 billion dollars, followed by Germany (13.6 billion dollars), France(12.8 billion dollars) and China (9.6 billion dollars). In terms of the organic tea market,China’s organic tea area reached 106 thousand hectares in 2019, 58% of the world’s organictea area. Although it accounts for a high proportion of the world’s organic tea area, itcurrently only accounts for less than 10% of China’s total tea planted area.
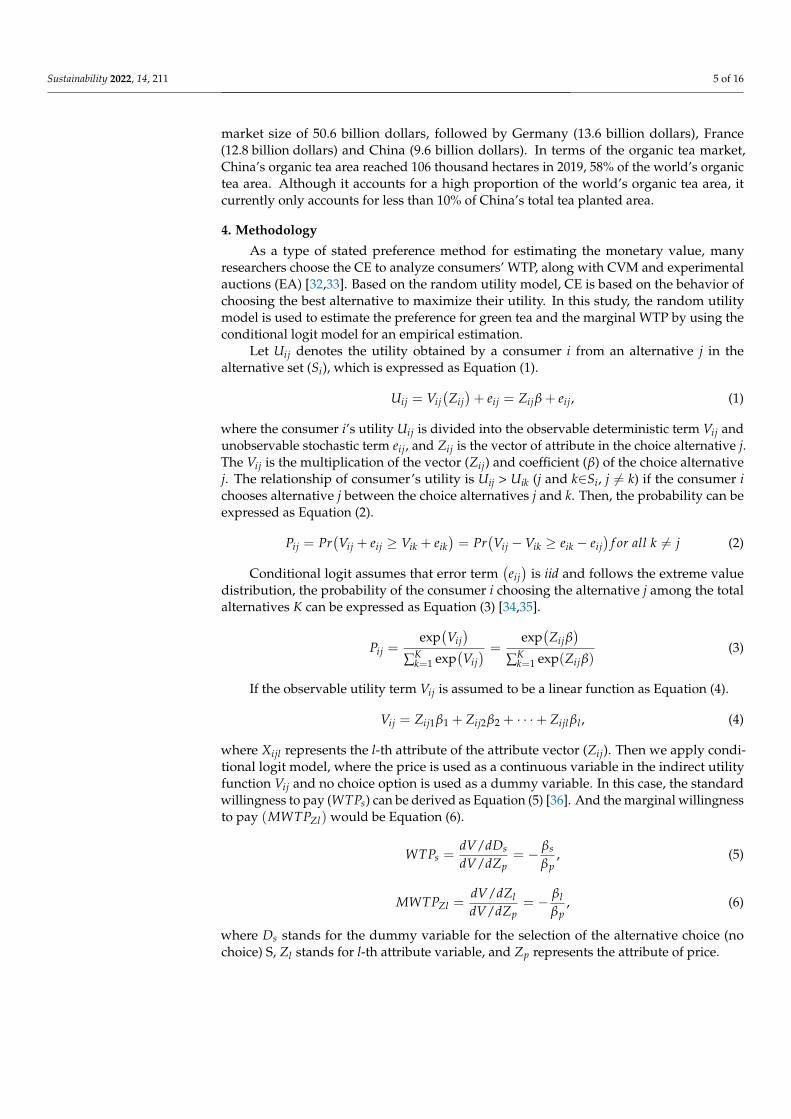
4. Methodology
As a type of stated preference method for estimating the monetary value, manyresearchers choose the CE to analyze consumers’ WTP, along with CVM and experimentalauctions (EA) [32,33]. Based on the random utility model, CE is based on the behavior ofchoosing the best alternative to maximize their utility. In this study, the random utilitymodel is used to estimate the preference for green tea and the marginal WTP by using theconditional logit model for an empirical estimation.
Let Uij denotes the utility obtained by a consumer i from an alternative j in thealternative set (Si), which is expressed as Equation (1).
Uij = Vij(Zij
)+ eij = Zijβ + eij, (1)
where the consumer i’s utility Uij is divided into the observable deterministic term Vij andunobservable stochastic term eij, and Zij is the vector of attribute in the choice alternative j.The Vij is the multiplication of the vector (Zij) and coefficient (β) of the choice alternativej. The relationship of consumer’s utility is Uij > Uik (j and k∈Si, j 6= k) if the consumer ichooses alternative j between the choice alternatives j and k. Then, the probability can beexpressed as Equation (2).
Pij = Pr(Vij + eij ≥ Vik + eik
)= Pr
(Vij −Vik ≥ eik − eij
)f or all k 6= j (2)
Conditional logit assumes that error term(eij)
is iid and follows the extreme valuedistribution, the probability of the consumer i choosing the alternative j among the totalalternatives K can be expressed as Equation (3) [34,35].
Pij =exp
(Vij
)∑K
k=1 exp(Vij
) =exp
(Zijβ
)∑K
k=1 exp(Zijβ)(3)
If the observable utility term Vij is assumed to be a linear function as Equation (4).
Vij = Zij1β1 + Zij2β2 + · · ·+ Zijl βl , (4)
where Xijl represents the l-th attribute of the attribute vector (Zij). Then we apply condi-tional logit model, where the price is used as a continuous variable in the indirect utilityfunction Vij and no choice option is used as a dummy variable. In this case, the standardwillingness to pay (WTPs) can be derived as Equation (5) [36]. And the marginal willingnessto pay (MWTPZl) would be Equation (6).
WTPs =dV/dDs
dV/dZp= − βs
βp, (5)
MWTPZl =dV/dZldV/dZp
= − βlβp
, (6)
where Ds stands for the dummy variable for the selection of the alternative choice (nochoice) S, Zl stands for l-th attribute variable, and Zp represents the attribute of price.

Sustainability 2022, 14, 211 6 of 16
5. Data5.1. Experiment Design
When a consumer makes a decision to purchase a particular item, the choice is notbased on only one specific attribute but on a variety of attributes at the same time. Therefore,there exists a limit on determining how much important each attribute is for a consumer [37].A choice experiment (CE) is able to estimate the monetary value of each attribute. However,it is essential to determine the attributes of a specific product and the attribute levels [38]. Inthis paper, the product to be estimated is green tea, which is produced, processed, and soldwidely in China. Attributes and their levels of green tea are shown in Table 1. Except for thecertification attribute, we selected other attributes and levels, referring to Yang et al. [26]and Liu [27]. In order to analyze consumers’ preferences, general attributes such as placeof production, size of producing firm, types of green tea and price are included in thisexperiment. In terms of the production place, there are 19 provinces producing tea in China,which can be divided into four major producing regions. Based on these four regions,the place of production attribute is divided into North of Yangtze River, Southern China,Jiangnan, and Southwest regions. In terms of the producing firm size, there are many teabrands in China, but consumers do not have high awareness of brands. Therefore, basedon the production scale of enterprises, which consumers more easily recognize, the size ofproducing firm attribute is classified into large firm, medium firm, and small firm. Basedon the current certification systems mentioned above, the eco-friendly certification attributeis classified into no cetification, no-pollution, green and organic certifications. In addition,since the quality of tea differs by harvesting time, the type of green tea is divided into“Mingqian Tea”, “Yuqian Tea” and others based on the tea-harvesting time (season). Interms of the price attribute, its level includes 200 yuan/250 g ($28/250 g), 300 yuan/250 g($42/250 g), 400 yuan/250 g ($56/250 g) and 500 yuan/250 g ($70/250 g), reflecting thecurrent market price.
Table 1. Attributes of green tea and levels.
Attributes Levels
Place of productionSize of production firm
CertificationType of green tea
Price (yuan/250 g)
North of Yangtze River *, Southern China, Jiangnan, SouthwestLarge, Medium *, Small
No certification *, No-pollution, Green, OrganicMingqian, Yuqian, Others *
200, 300, 400, 500Note: * denotes the criterion for dummy variables in the analysis.
Given all attributes and levels of green tea in Table 1, a full design of 576 (4 * 3 * 4 * 3 * 4)profiles are created. Realistically, since all of the constructed choice profiles cannot be in-vestigated, 16 choice profiles are derived through orthogonal design by using the SPSSStatistics program. Therefore, 8 choice sets, randomly drawn from 16 profiles, were pre-sented to each respondent. Each choice set includes two choice profiles and a “no choice”option. A sample of a choice set is shown in Table 2.
Table 2. A sample of a choice set used in a choice experiment.
A B C
North of Yangtze RiverSmall production firm
No-pollutionMingqian
300 yuan
JiangnanLarge production firm
OrganicYuqian
500 yuan
Neither A nor B

Sustainability 2022, 14, 211 7 of 16
5.2. Data Collection
A questionnaire survey was conducted on 362 Chinese consumers from December 13to 31, 2019 through a web survey platform (Wenjuanxing, http://www.wjx.cn, accessedon 2 November 2021). In addition to the attributes of Table 1, the questionnaire includesconsumers’ gender, age, education, monthly income, residence of city, and awarenessand trust of the eco-friendly certification system. The socioeconomic characteristics ofthe respondents are shown in Table 3. Specifically, in our sample, the ratio of women is57.5%, slightly higher than that of men. Regarding age, the ratio of respondents in the20~29 (37.9%) and 30~39 age groups (33.4%) are relatively higher. Most of the respondentshold a bachelor’s degree (64.9%). 37.0% of respondents are living in first-tier cities, 25.1%in second-tier cities, 24.3% in third-tier cities, and 13.5% in fourth-tier cities. Moreover,those respondents who are from the northeast economic zone account for 26.5% of thetotal sample, followed by east coast (18.8%), north coast (17.1%) and south coast (13.5%).Respondents with an average monthly income of 6000~8000 yuan ($840~$1120) accountfor the highest proportion (22.1%), followed by 4000–6000 yuan (($560~$840), 21.8%),2000–4000 yuan (($280~$560), 19.9%), 8000–10,000 yuan (($1120~$1400), 16.3%), more than10,000 yuan (($1400), 10.2%) and less than 2000 yuan (($280), 9.7%). In addition, thequestionnaire also included consumers’ awareness and trust of the certification system.Awareness results indicate that respondents who answered ‘heard of it’, ‘knows little’, ‘don’tknow’, and ‘knows well’ account for 46.4%, 31.5%, 16.0%, and 6.1% of the overall sample,respectively. “Trust” results show that consumers who responded ‘trust little’, ‘hardlytrust’, ‘trust well’ and ‘don’t trust’ account for 59.1%, 32.9%, 5.3% and 2.8%, respectively.
Table 3. Characteristics of the respondents.
Classification Frequency Ratio (%) Classification Frequency Ratio (%)
Gendermale 154 42.5
Residence ofcity
New First-tier city 134 37.0
female 208 57.5 Second-tier city 91 25.1
Age
~20 13 3.6 Third-tier city 88 24.3
20~29 137 37.9 others 49 13.5
30~39 121 33.4
Economiczone
Northeast 96 26.5
40~49 56 15.5 North coast 62 17.1
50~ 35 9.7 East coast 68 18.8
MonthlyIncome(yuan)
~2000 35 9.7 South coast 49 13.5
2000~4000 72 19.9 Others 87 24.0
4000~6000 79 21.8
Awareness
Don’t know 58 16.0
6000~8000 80 22.1 Heard of it 168 46.4
8000~10,000 59 16.3 knows little 114 31.5
10,000~ 37 10.2 Knows well 22 6.1
Education
High school and below 53 14.6
Trust
Don’t trust 10 2.8
Bachelor degree 235 64.9 Hardly trust 119 32.9
Graduate or above 74 20.4 Trust little 214 59.1
Total 362 100 Trust well 19 5.3
According to China’s 11th Five Year Plan, the Chinese government proposed a new method of dividing31 provinces in mainland China into eight economic zones based on the economic development situation of differ-ent regions. They are Northeast (Liaoning, Jilin and Heilongjiang provinces), North Coast (Beijing, Tianjin, Hebei,and Shandong provinces), East Coast (Shanghai, Jiangsu and Zhejiang provinces), Middle Reaches of YellowRiver (Shanxi, Henan, Shaanxi and Inner Mongolia provinces), South Coast (Fujian, Guangdong and Hainanprovinces), Middle Reaches of Yangtze River (Anhui, Jiangxi, Hubei and Hunan provinces), Southwest (Guangxi,Chongqing, Sichuan, Guizhou and Yunnan provinces), and Northwest (Xizang, Gansu, Qinghai, Ningxia andXinjiang provinces).

Sustainability 2022, 14, 211 8 of 16
6. Estimation Results
The estimation results of this study consist of logit model results, marginal WTP, andpreference share (Figure 4). Also, an implication is included at the end of the estimation result.
Sustainability 2022, 14, x FOR PEER REVIEW 8 of 16
6. Estimation Results The estimation results of this study consist of logit model results, marginal WTP, and
preference share (Figure 4). Also, an implication is included at the end of the estimation result.
Figure 4. Estimation result procedure.
6.1. The Conditional Logit Model Table 4 is the estimated result of the conditional logit model. The test result of the
goodness-of-fit Chi-square statistic (605.3) is greater than 26.22 (degree of freedom 12) which is the threshold of 1 percent significance level. It means that the null hypothesis that all estimated β ’s are zero would be rejected. All of the variables are estimated as dummy variables except for the price variable. In the case of “place of production”, North of Yangtze river is excluded as a reference; for “size of production firm”, “certification” and “type of green tea”, medium production firm, ordinary size firm, and other type are excluded.
According to the estimation results, the variables of “certification” and “type of green tea” are estimated to be statistically significant at the 1% level. Large and small for “size of production firm” and Jiangnan and Southwest for “place of production” are estimated to be statistically significant at the 5% level. In addition, Southern for “place of produc-tion” are estimated to be statistically significant at the 10% level. The estimated coefficient of “price” turns out to be –0.00084. In other words, as the price increases, the value of the commodity (ln(𝑃 1 − 𝑃⁄ )) decreases, which is suitable for the economic theory [39]. In the result, the choice probability of Southern China, Jiangnan, and Southwest for “place of production” are estimated as 0.162, 0.232 and 0.234, which are higher than the choice prob-ability of North of Yangtze river. The choice probability of large and small for “size of production firm” are 0.178 and 0.145 which are higher than that of the medium size firm. The choice probability of non-pollution, green, and organic for “certification” are 0.320, 0.397, and 0.692, respectively, which are higher than that of the tea with no certification. Finally, the choice probability of Mingqian and Yugian for “type of green tea” are esti-mated to be 0.240 and 0.471, which are higher than the choice probability of Others (fall season green tea).
Figure 4. Estimation result procedure.
6.1. The Conditional Logit Model
Table 4 is the estimated result of the conditional logit model. The test result of thegoodness-of-fit Chi-square statistic (605.3) is greater than 26.22 (degree of freedom 12)which is the threshold of 1 percent significance level. It means that the null hypothesisthat all estimated βi’s are zero would be rejected. All of the variables are estimated asdummy variables except for the price variable. In the case of “place of production”, Northof Yangtze river is excluded as a reference; for “size of production firm”, “certification”and “type of green tea”, medium production firm, ordinary size firm, and other typeare excluded.
Table 4. Estimation results for green tea attributes.
Variables Coefficients StandardDeviation t-Value
Place ofproduction
Southern China 0.162 * 0.097 1.67
Jiangnan 0.232 ** 0.102 2.27
Southwest 0.234 ** 0.113 2.06
Size ofproduction firm
Large 0.178 ** 0.085 2.09
Small 0.145 ** 0.072 2
Certification
Non-pollution 0.320 *** 0.110 2.92
Green 0.397 *** 0.099 4.02
Organic 0.692 *** 0.087 7.97Type of green tea
(Productionseason)
Mingqian 0.240 *** 0.091 2.64
Yuqian 0.471 *** 0.110 4.28
Price −0.00084 *** 0.000 −4.07
Choice Dummy 0.303 ** 0.135 2.25
Observations 362
Log Likelihood −2878.92 x2 (12) 605.33
Pseudo R 0.10 Prob > x2 0.00
Where the odds ratio is the ratio of the probability of being selected to the probability of not beingselected, the natural logarithm in this case is applied to the odds ratio ( Pi
1−Pi).
Note: ***, ** and * denote significant at 1, 5, and 10%, respectively.

Sustainability 2022, 14, 211 9 of 16
According to the estimation results, the variables of “certification” and “type of greentea” are estimated to be statistically significant at the 1% level. Large and small for “size ofproduction firm” and Jiangnan and Southwest for “place of production” are estimated tobe statistically significant at the 5% level. In addition, Southern for “place of production”are estimated to be statistically significant at the 10% level. The estimated coefficient of“price” turns out to be −0.00084. In other words, as the price increases, the value of thecommodity (ln(Pi/1− Pi)) decreases, which is suitable for the economic theory [39]. Inthe result, the choice probability of Southern China, Jiangnan, and Southwest for “placeof production” are estimated as 0.162, 0.232 and 0.234, which are higher than the choiceprobability of North of Yangtze river. The choice probability of large and small for “size ofproduction firm” are 0.178 and 0.145 which are higher than that of the medium size firm.The choice probability of non-pollution, green, and organic for “certification” are 0.320,0.397, and 0.692, respectively, which are higher than that of the tea with no certification.Finally, the choice probability of Mingqian and Yugian for “type of green tea” are estimatedto be 0.240 and 0.471, which are higher than the choice probability of Others (fall seasongreen tea).
6.2. Marginal Willingness to Pay for Each Attribute
Table 5 shows marginal WTPs. The marginal WTP for the green tea with the attributesof being produced in North of Yangtze river, by medium size firm, with no-certification(Ordinary) and in fall season (Others) is estimated to be 363 yuan ($50.82) per 250 g.According to the results of marginal WTP by attribute level, consumers are likely to pay277 yuan ($38.78) and 280 yuan ($39.20) more for Jiangnan and Southwest tea comparedto the one from North of Yangtze river. “Southern China” is not statistically significant atthe 10% level. In addition, consumers are more willing to pay 213 and 173 Yuan for theLarge and Small size firms and 287 yuan ($40.18) and 564 yuan ($78.96) for Mingqian teaand Yuqian tea. Lastly, consumers are willing to pay 383 yuan ($53.62), 475 yuan ($66.46),and 828 yuan ($115.92) more for non-pollution, green, and organic tea. In summary,consumers prefer green tea produced in Jiangnan and Southwest over that from North ofthe Yangtze, and consumers like green tea produced by large and small firms more than theone produced by medium firms. In addition, consumers show a higher WTP for certificatedgreen tea such as non-pollution, green, and organic. Moreover, Yuqian is revealed to bethe most preferred type of green tea. These results are very remarkable in a sense that themarginal WTP for organic certification is the highest, and the next is Yuqian attribute. Itmeans that consumers care more about safety and the quality in green tea.
Table 5. Marginal willingness to pay (WTP) for each attribute.
Variables MWTP(yuan/250 g)
StandardDeviation t-Value
Base 363.1 *** 132.15 2.75
Place ofproduction
Southern China 194.0 128.08 1.52
Jiangnan 277.1 * 146.70 1.89
Southwest 279.8 * 156.36 1.79
Size ofproduction firm
Large 212.9 * 114.81 1.85
Small 173.1 * 101.60 1.70
Certification
Non-pollution 382.8 ** 157.99 2.42
Green 474.7 *** 161.89 2.93
Organic 827.6 *** 228.64 3.62Type of green tea
(Productionseason)
Mingqian 287.2 ** 128.88 2.23
Yuqian 564.0 *** 195.74 2.88Note: ***, ** and * denote significant at 1, 5, and 10%, respectively.

Sustainability 2022, 14, 211 10 of 16
6.3. Marginal Willingness to Pay According to Awareness and Trust of Certification
Unlike other attributes, since the government implemented the certification system forgreen tea, the marginal WTP for certificated green tea depends on how much consumersare aware of the certification system and how much the green tea produced under thecertification system is reliable. Therefore, it is necessary to classify consumers accordingto their awareness and trust for the certification system. We divided all samples intofour groups: a high awareness group, a low awareness group, a high-trust group, and alow-trust group. After that, we estimated the marginal WTP for these differentiated groups.The results are shown in Table 6. According to the estimation results classified by awarenesslevel, the group with high awareness is 1051 yuan ($147.14) more willing to pay for greentea with organic certification than that with no certification. This is 332 yuan ($46.48) higherthan the one from the group with low awareness (719 yuan ($100.66)). The group with highawareness is more willing to pay by 834 yuan ($116.76) for green tea with green certificationthan that with no certification. This is 507 yuan ($70.98) higher than the one from the groupwith low awareness (327 yuan ($45.78)). This result suggests that the WTP for certificatedgreen tea increases as consumers’ awareness rises. According to the estimation results onthe trust level, the group with high trust is willing to pay by 1533 yuan ($214.62) morefor green tea with organic certification than that with no certification, which is 1232 yuan($172.48) higher than the group with low trust (301 yuan ($42.14)). On the other hand, thereis no significant difference in the marginal WTP for other attributes classified by awarenessand trust. In other words, the increase in marginal willingness due to increased trust ofconsumer is greater than the one due to increased awareness of consumer.
Table 6. Marginal willingness to pay for awareness and trust of green tea certification (yuan/250 g).
Classification AverageAwareness Trust
High AwarenessGroup
Low AwarenessGroup
High TrustGroup
Low TrustGroup
Place of production
Southern China 194.0 204.7 177.1 222.2 140.1
Jiangnan 277.1 * 275.6 252.2 669.6 84.6
Southwest 279.8 * 18.5 367.3 ** 630.4 116.1
Size of production firmLarge 212.9 * 191.0 219.5 * 472.6 53.6
small 173.1 * 93.6 208.7 * 262.7 133.3
Certification
Non-pollution 382.8 ** 615.1 291.4 * 519.3 126.5
Green 474.7 *** 834.3 * 326.8 ** 773.9 * 132.9
Organic 827.6 *** 1051.1 * 719.2 *** 1532.7 * 300.7 ***
Type of green tea(Production season)
Mingqian 287.2 ** 211.4 304.4 ** 599.2 104.2
Yuqian 564.0 *** 503.0 553.4 *** 1308.1 * 192.1 *
Note: ***, ** and * denote significant at 1, 5, and 10%, respectively.
These estimation result imply that it is imperative not only to promote the certificationsystem of green tea but also to increase consumers’ trust in the certification of green tea. Inother words, in order to invigorate the certification system, increasing the consumer’s trustthrough strict follow-up management is required.
6.4. The Results of Preference Share
Using the estimated results in Table 4, we calculated the consumers’ preference shareby the attribute level of green tea. The preference share is shown in Table 7. There are16 alternatives calculated by Equation (3). According to the results, the highest preferenceshare is option 6 (Jiangnan, Large, Organic, Yuqian, and 300 yuan), for which share iscalculated as 12.4%. The preference shares of option 15 (Southwest, large, organic, Mingqian,200 yuan) and option 7 (Southern China, small, organic, Mingqian, 400 yuan) are calculated

Sustainability 2022, 14, 211 11 of 16
to be 10.7% and 8.1%, respectively. On the other hand, the preference share of option 14(Southern China, large, ordinary, others, 300 yuan) is estimated to be the lowest (3.6%).
Table 7. Calculated preference share.
Option Place of ProductionSize of
ProductionFirm
CertificationType of Green Tea
(ProductionSeason)
Price(yuan/250 g)
PreferenceShare (%)
1 North of Yangtze River Small Non-pollution Mingqian 300 5.2
2 Southern China Large Green Mingqian 500 5.8
3 North of Yangtze River Large Ordinary Mingqian 200 4.2
4 North of Yangtze River Large Green Yuqian 400 6.7
5 Southwest Small Ordinary Yuqian 500 5.1
6 Jiangnan Large Organic Yuqian 300 12.4
7 Southern China Small Organic Mingqian 400 8.1
8 Southwest Medium Green Mingqian 300 6.1
9 Southern China Medium Non-pollution Yuqian 200 7.2
10 Southwest Large Non-pollution Others 400 4.9
11 North of Yangtze River Medium Organic Others 500 4.3
12 Jiangnan Small Green Others 200 6.0
13 Jiangnan Large Non-pollution Mingqian 500 5.7
14 Southern China Large Ordinary Others 300 3.6
15 Southwest Large Organic Mingqian 200 10.7
16 Jiangnan Medium Ordinary Mingqian 400 3.8
The choice options calculated to produce high preference share mainly include organiccertification of green tea and Mingqian or Yuqian, as indicated by the results in Table 7. Itmeans that the preference share depends on the certification and the quality. Therefore, itwould be useful to evaluate the change in preference share according to the quality and thecertification of green tea. By performing this analysis, we can then identify the attributewhich has the most significant effect on the consumer’s choice.
For the scenario analysis, first, we estimated changes in the preference share due tothe changes in the type of green tea (production season). We set four different scenariosand then estimated changes in preference share for each scenario. The results are shownin Table 8. The baseline (A) was set by assuming that the place of production (Southwest)and size of producing firm (Large) are the same, and the other attribute levels (certification,type of green tea, and price) for the baseline were selected and combined. Correspondingpreference shares are estimated to be around 20% (18.2~22.6 %). Scenarios 1 and 2 changethe attribute level from Mingqian to Yuqian, scenarios 3 and 4 change from Others toYuqian. As a result, when regular Mingqian is changed to Yuqian as scenarios 1-B and2-C, the preference share rises 3.7% and 3.9%, in other words, from 18.2% to 21.9% andfrom 19.7% to 23.6%. Converting from Others to Yuqian as in scenarios 3-D and 4-E, thepreference share rises 9.3% and 8.6% from 22.6% to 31.8% and from 19.9% to 28.4%.
Using the same process as above, we set 4 different scenarios according to the change ofthe certification and then estimated the change in the preference share (Table 9). Scenarios 5and 7 change the attribute level from ordinary to organic, scenarios 6 and 8 change theattribute level from green to organic. As a result, if we convert the attribute from Ordinaryto Organic as scenario 5-A and 7-C, the preference share rises 11.9% and 12.1% from 16.8%to 28.7% and from 17.1% to 29.2%. Changing from green to organic as in scenarios 6-B and8-D, the preference share rises 4.8% and 5.9% from 18.4% to 23.3% and from 25.0% to 30.9%.

Sustainability 2022, 14, 211 12 of 16
Table 8. Preference share changes according to changes in type of green tea (Scenarios 1 to 4).
Place ofProduction
Size ofProduction
FirmCertification
Type of Green Tea Price(yuan)
PreferenceShare (%)(Production
Season)
Baseline (A)
A
Southwest Large
Ordinary Yuqian 300 19.7
B Non-pollution Mingqian 500 18.2
C Green Mingqian 500 19.7
D Organic Others 400 22.6
E Green Others 200 19.9
Scenario1
A
Southwest Large
Ordinary Yuqian 300 18.8
B Non-pollution Yuqian 500 21.9 (3.7)
C Green Mingqian 500 18.8
D Organic Others 400 21.6
E Green Others 200 19
Scenario2
A
Southwest Large
Ordinary Yuqian 300 18.7
B Non-pollution Mingqian 500 17.3
C Green Yuqian 500 23.6 (3.9)
D Organic Others 400 21.5
E Green Others 200 18.9
Scenario3
A
Southwest Large
Ordinary Yuqian 300 17.3
B Non-pollution Mingqian 500 16
C Green Mingqian 500 17.3
D Organic Yuqian 400 31.8 (9.3)
E Green Others 200 17.5
Scenario4
A
Southwest Large
Ordinary Yuqian 300 17.6
B Non-pollution Mingqian 500 16.3
C Green Mingqian 500 17.6
D Organic Others 400 20.2
E Green Yuqian 200 28.4 (8.6)
Note: ( ) is changes in preference share compared to baseline (A).
Comparing the result from Table 8 and the one from Table 9, when we convert thequality(type) level of green tea, the preference share increases about 3.7%~9.3%. If wechange the certification level of green tea, the preference share increases about 4.8%~12.1%.These results provide an important insight that the increase in consumers’ preference isinduced more significant by the certification than the increase in the quality improvement.
6.5. Implication
The overall estimation results imply that the group with high awareness is morewilling to pay for the green tea with eco-friendly certification than for the one with nocertification, and the group with high trust is more willing to pay for green tea with eco-friendly certification. In addition, it is revealed that the difference in the WTP accordingto the awareness level is smaller than the difference in the WTP according to the trustlevel. Based on these results, we can suggest policies to promote the certification systemand enhance consumers’ trust in order to activate the certification system for eco-friendlyagricultural products. First, the government should come up with an effective promotionstrategy for the eco-friendly certification system. It is also necessary to block the sale of non-

Sustainability 2022, 14, 211 13 of 16
certified agricultural products which disguise as agricultural products having eco-friendlycertification. This policy will increase the consumers’ trust toward the certification system.
Table 9. Preference share changes according to changes in certification of green tea (Scenarios 5 to 8).
Place ofProduction
Size ofProduction
FirmCertification
Type of Green Tea Price(yuan)
PreferenceShare (%)(Production
Season)
Baseline (B)
A
Southwest Large
Ordinary Yuqian 500 16.8
B Green Others 300 18.4
C Ordinary Mingqian 200 17.1
D Green Yuqian 500 25.0
E Organic Others 400 22.7
Scenario5
A
Southwest Large
Organic Yuqian 500 28.7 (11.9)
B Green Others 200 15.8
C Ordinary Mingqian 400 14.7
D Green Yuqian 500 21.4
E Organic Others 400 19.5
Scenario6
A
Southwest Large
Ordinary Yuqian 500 15.8
B Organic Others 200 23.3 (4.8)
C Ordinary Mingqian 400 16.1
D Green Yuqian 500 23.5
E Organic Others 400 21.4
Scenario7
A
Southwest Large
Ordinary Yuqian 500 14.3
B Green Others 200 15.7
C Organic Mingqian 400 29.2 (12.1)
D Green Yuqian 500 21.3
E Organic Others 400 19.4
Scenario8
A
Southwest Large
Ordinary Yuqian 500 15.5
B Green Others 300 17.0
C Ordinary Mingqian 200 15.8
D Organic Yuqian 500 30.9 (5.9)
E Organic Others 400 20.9
Note: ( ) is changes in preference share compared to baseline (B).
In terms of production, the consulting is needed ins selecting organic, green food,or non-pollution food certification by considering the conditions and circumstances ofindividual farms. Since consumers are willing to pay for organic products more thangreen products, the price is likely to be high. However, if the cost and effort required toproduce organic products exceed the price increase, the production of green or pesticide-free products is more reasonable than the production of organic products. In other words,the government’s consulting policy is needed so that producers can select the optimaleco-friendly certification in consideration of production conditions. If the profitabilityof producers is guaranteed through product differentiation by adopting the eco-friendlycertification, the eco-friendly certification system would be activated.
7. Conclusions
This study examines the current status of the agricultural certification system in Chinaand analyzes consumers’ perceptions and preferences. We select green tea as the research

Sustainability 2022, 14, 211 14 of 16
object since it is one of representatives of a favorite food in China. We estimate consumers’WTP to analyze the preference for the certification and the quality (type) of green tea. Theattributes of green tea used for preference analysis are the place of production, size ofproduction firm, the type of the certification, type of green tea, and the price. The marginalWTP for each attribute is estimated. We also estimate the change in the marginal WTPaccording to consumers’ awareness and trust of the certification.
The analysis results indicate that the highest marginal WTP is identified to be theorganic certification, and consumers are willing to pay 828 yuan ($115.92) per 250 g morefor organic tea than for the tea with no certification. The marginal WTP for Yuqian isestimated to be 564 yuan ($78.96), which is higher than WTP for the green tea producedduring the fall season. It implies that consumers care about the safety and the quality ingreen tea production. In order to compare consumers’ marginal WTP with different foodsafety concerns in terms of awareness and trust, we divide consumers into four groups.The group with high awareness is willing to pay 1051 Yuan ($147.14) more for green teawith organic certification than for the tea with no certification. It is 332 yuan ($46.48) higherthan the one from the group with low awareness. Moreover, the group with high trust iswilling to pay 1533 yuan ($214.62) more for green tea with organic certification than forthe one with no certification. It is 1232 yuan ($172.48) higher than the one from the groupwith low trust. These results imply that it is essential to promote the certification system,and establish a strict follow-up management system to increase consumers’ trust in thecertification. Moreover, these improvements should be promoted towards consumers inorder to invigorate the certification system for green tea.
Using the estimated results, we calculate the share of consumer preference. The resultsshow that when changing the quality (type) level of green tea, the preference share increasesabout 3.7%~9.3%. When changing the certification level of green tea, the preference shareincreases about 4.8%~12.1%. These results provide important insight that the increasein consumers’ preference by the certification is greater than the increase in consumers’preference by the quality improvement.
Through the estimated WTP and changes in preference share, we can find solutionsfor the raised research questions. Under the assumption that the difference in productioncost is small, the estimation results in this paper strongly imply that producing eco-friendlycertified tea rather than high-quality tea will have a more positive impact on farm income.In addition, the simulation results indicate that the activation of eco-friendly certificationin China is a more effective way to secure consumers trust in the certification schemes thanto promote it.
Since this study uses the data from a web survey, there is a limitation that the sampledoes not completely represent the whole population. Moreover, conditional logit, theanalysis method selected in this study, has limitations. Since conditional logit estimates theaverage change in the respondent’s attributes, it has the advantage of being able to easilyestimate the change in preference share according to the changes in attributes such as thequality or the certification system. However, according to the independence of irrelevantalternatives (IIA) property assumption, there is a disadvantage that changes in individualattributes of respondents, and substitutions between attributes are not accurately reflectedin the estimation results. Therefore, in the future studies, it is recommendable to comparethe results in the present study with the results using methodologies such as mixed logit ornested logit that compensate for the disadvantages of conditional logit.
Author Contributions: K.N. conceived and designed the experiments, performed estimations andwrote the paper; Y.Q. performed experiments, collected data and wrote the draft of the paper; B.-i.A.:contributed analysis tools, reviewed and edited the paper. All authors have read and agreed to thepublished version of the manuscript.
Funding: This research received no external funding.
Institutional Review Board Statement: The study was conducted according to the guidelines of theDeclaration of Helsinki.
Sustainability 2022, 14, 211 15 of 16
Informed Consent Statement: Not applicable.
Conflicts of Interest: The authors declare no conflict of interest.
References1. Lee, K.I.; Kim, S.H.; Heo, S.Y. In-Depth Analysis of Food Consumption in Korea; Korea Rural Economic Institute: Naju, Korea, 2016.2. Lim, H.J.; Lee, Y.B.; Kim, Y.D. Impact of reason for purchasing environmentally-friendly agricultural products on intent to
re-purchase: Focus on regulation effect of indirect experience through their children. Korean Ind. Econ. Assoc. 2013, 26, 2633–2654.3. Sin, Y.K.; Kim, C.K.; Kim, T.Y. Prioritization of eco-friendly agricultural policy program using AHP. J. Rural Develop. 2005, 28,
39–56.4. Cho, W.H. Analyzing the producer’s behavior and characteristics of environmentally friendly agricultural products. Korean J.
Org. Agr. 2004, 12, 45–66.5. Gregory, N.G. Consumer concerns about food. Outlook Agr. 2000, 29, 251–257. [CrossRef]6. Lee, Y.J. A study of the effects of a mother’s LOHAS lifestyle attitude on children’s dietary habits, food behavior, and health-related
lifestyles. Korean J. Food Cook Sci. 2011, 27, 75–87. [CrossRef]7. Zhou, X.B.; Ouyang, X.H.; Hao, J.Q.; Xu, P.X. Analysis and counter measures on developing pollution-free agro-products, green
food and organic food in Beijing. Chin. J. Agr. Resour. Reg. Plan. 2010, 31, 17–22.8. Yiridoe, E.K. Comparison of consumer perceptions and preference toward organic versus conventionally produced foods: A
review and update of the literature. Renew. Agr. Food Syst. 2005, 20, 193–205. [CrossRef]9. Kim, K.D.; Lee, J.Y.; NamKung, S. Purchase behavior of Environment-friendly agricultural products by house-wives in Seoul area.
J. Korean Soc. Food Sci. Nutr. 2008, 37, 1667–1673. [CrossRef]10. Hughner, R.S.; McDonagh, P.; Prothero, A.; Shultz, C.J., II; Stanton, J. Who are organic food consumers? A compilation and review
of why people purchase organic food. J. Consum. Behav. 2007, 6, 94–110. [CrossRef]11. Batte, M.; Hooker, N.; Haab, T.; Beaverson, J. Putting. Their money where their mouths are: Consumer willingness to pay for
multi-ingredient, processed organic food products. Food Policy 2007, 32, 145–159. [CrossRef]12. Onken, K.A.; Bernard, J.C.; Pesek, J.D. Comparing willingness to pay for organic, natural, locally grown, and state marketing
program promoted foods in the mid-Atlantic region. Agr. Resour. Econ. Rev. 2011, 40, 33–47. [CrossRef]13. Jung, J.R.; Kim, T.H.; Bae, H.J. A study of perception and consumption behavior of consumers with regards to local food and
eco-friendly food. Culin. Sci. Hosp. Res. 2017, 23, 104–116.14. Bojnec, Š.; Petrescu, D.C.; Petrescu-Mag, R.M.; Rădulescu, C.V. Locally produced organic food: Consumer preferences. Amfiteatru
Econ. 2019, 21, 209–227. [CrossRef]15. Xie, J.; Gao, Z.; Swisherb, M.; Zhao, X. Consumers’ preferences for fresh broccolis: Interactive effects between country of origin
and organic labels. Agr. Econ. 2016, 47, 181–191. [CrossRef]16. Illichmann, R.; Abdulai, A. Analysis of Consumer Preferences and Willingness-to-Pay for Organic Food Products in Germany,
Agricultural and Applied Economics Association. 2013. Available online: https://ideas.repec.org/p/ags/aaea13/150980.html(accessed on 11 August 2021).
17. Jeong, H.K.; Han, J.H. An analysis of preference for policy to expand the consumption of environment-friendly agriculturalprocessed foods. J. Agr. Life Sci. 2019, 53, 145–152. [CrossRef]
18. Kim, K.H.; Lee, K.R. What are south korean consumers’ concerns when buying eco-friendly agricultural products? Sustainability2019, 11, 4740. [CrossRef]
19. Muhammada, S.; Fathelrahmanb, E.; Ullahc, R.U.T. Factors affecting consumers’ willingness to pay for certified organic foodproducts in united arab emirates. J. Food Distrib. Res. 2015, 46, 37–45.
20. Ricci, E.C.; Banterle, A.; Stranieri, S. Trust to go green: An exploration of consumer intentions for eco-friendly convenience food.Ecol. Econ. 2018, 148, 54–65. [CrossRef]
21. Janssen, M.; Hamm, U. Governmental and private certification labels for organic food: Consumer attitudes and preferences inGermany. Food Policy 2014, 49, 437–448. [CrossRef]
22. Yu, J.B. Empirical Analysis of consumers’ willingness to pay for different certified agricultural products and its influencingfactors—Based on the survey of consumers in Guangzhou. Consum. Econ. 2012, 28, 90–94.
23. Xing, Q.Q. Research on the Effect of Food Nutrition Labeling, Organic Labeling and Origin Labeling on Consumers’ Willings toPay: An Case Study. Master Degree Thesis, Nanjing Agricultural University, Nanjing, China, 2017.
24. Zheng, M.F. Variety Differences of consumers’ willingness to pay for organic food and influencing factors-taking rice and pork asan example. Oper. Strat. 2018, 452, 80–86.
25. Ye, Y. Research on consumer behavior and willingness to pay based on food safety—Taking contrast consumption of organic teaand common tea as an example. China Sci. Technol. Inf. 2007, 19, 160–162.
26. Yang, J.F.; Liu, B.Y.; Guan, X. Analysis of the willingness to pay for organic tea and its influencing factors of consumers infuzhou-an empirical study based on cvm. J. Fujian Agric. For. Univ. (Philos. Soc. Sci.) 2011, 14, 38–42.
27. Liu, B.Y. Study on WTP for Organic Tea of Consumers in Fujian and It’s Influence Factors. Master Degree Thesis, FujianAgriculture and Forestry University, Fuzhou, China, 2011.

Sustainability 2022, 14, 211 16 of 16
28. Su, B.F. The Analysis of Consumers’ Willingness to Pay for Tieguanyin Tea in Anxi and Its Influencing Factors. Master DegreeThesis, Fujian Agriculture and Forestry University, Fuzhou, China, 2017.
29. Yu, X.; Gao, Z.; Zeng, Y. Willingness to pay for the “green food” in China. Food Policy 2014, 45, 80–87. [CrossRef]30. Sanders, R. A market road to sustainable agriculture? ecological agriculture, green food and organic agriculture in China. Dev.
Change 2006, 37, 201–226. [CrossRef]31. Wu, C.J. Certified history and current status of organic products and organic tea. China Tea 2009, 31, 12–14.32. Alfnes, F.; Guttormsen, A.G.; Steine, G.; Kolstad, K. Consumers’ willingness to pay for the color of salmon: A choice experiment
with real economic incentives. Am. J. Agr. Econ. 2006, 88, 1050–1061. [CrossRef]33. Kim, D.H.; Ahn, B.I.; Kim, E.G. Metropolitan Residents’ Preferences and Willingness to Pay for a Life Zone Forest for Mitigating
Heat Island Effects during Summer Season in Korea. Sustainability 2016, 8, 1155. [CrossRef]34. Yang, S.B.; Yang, S.R. The Willingness-to-pay price for makgeolli made of domestic rice. Korean J. Food Mark. Econ. 2011, 28, 57–77.35. McFadden, D. Conditional logit analysis of qualitative choice behavior. In Frontiers in Econometrics; Zarembka, P., Ed.; Academic
Press: New York, NY, USA, 1974; pp. 105–142.36. Nam, K.; Lim, H.; Ahn, B.I. Analysis of consumer preference for milk produced through sustainable farming: The case of
mountainous dairy farming. Sustainability 2020, 12, 3039. [CrossRef]37. Ji, I.; Song, W.; Jeong, M. An analysis of consumer preferences for pork attributes. J. Rural Dev. 2012, 35, 41–57.38. Ahn, B.I.; Bae, M.S.; Nayga, R.M., Jr. Information effects on consumers’ preferences and willingness to pay for a functional food
product: The case of red ginseng concentrate. Asian. Econ. J. 2016, 30, 197–219. [CrossRef]39. Chung, D.H. A Study on the market share prediction on egg market by using discrete choice model. J. Korean Data Anal. Soc.
2009, 8, 3171–3180.
Related Documents