The United States Department of Agriculture (USDA) prohibits discrimination in all its programs and activities on the basis of race, color, national origin, gender, religion, age, disability, political beliefs, sexual orientation, and marital or familial status. (Not all prohibited bases apply to all programs.) Persons with disabilities who require alternative means for communication of program information (Braille, large print, audiotape, etc.) should contact USDA’s TARGET Center at (202) 720- 2600 (voice and TDD). To file a complaint of discrimination, write the USDA, Director, Office of Civil Rights, Room 326W, Jamie L. Whitten Building, 14 th and Independence Avenue, SW., Washington, D.C. 20250-9410, or call (202) 720-5964 (voice or TDD). USDA is an Equal Opportunity provider and employer. UNITED STATES DEPARTMENT OF AGRICULTURE 1930-220th St. SE, Ste. 102 Agricultural Marketing Service 10050 N 25th Ave., Ste. 302 Bothell, WA 98021-8471 Dairy Programs Phoenix, AZ 85021-1664 Phone: (425) 487-6009 Phone: (602) 547-2909 Fax: (425) 487-2775 FEDERAL MILK ORDERS 124, 131 & 135 Fax: (602) 547-2906 E-mail: [email protected] E-mail: [email protected] ANALYSIS OF COMPONENT LEVELS IN INDIVIDUAL HERD MILK AT THE FARM LEVEL PACIFIC NORTHWEST, ARIZONA-LAS VEGAS, AND WESTERN FEDERAL MILK MARKETING ORDERS 2002 Staff Paper 03-01 Chris Werner September 2003

Welcome message from author
This document is posted to help you gain knowledge. Please leave a comment to let me know what you think about it! Share it to your friends and learn new things together.
Transcript

The United States Department of Agriculture (USDA) prohibits discrimination in all its programs and activities on the basis of race, color, national origin, gender, religion, age, disability, political beliefs, sexual orientation, and marital or familial status. (Not all prohibited bases apply to all programs.) Persons with disabilities who require alternative means for communication of program information (Braille, large print, audiotape, etc.) should contact USDA’s TARGET Center at (202) 720-2600 (voice and TDD). To file a complaint of discrimination, write the USDA, Director, Office of Civil Rights, Room 326W, Jamie L. Whitten Building, 14th and Independence Avenue, SW., Washington, D.C. 20250-9410, or call (202) 720-5964 (voice or TDD). USDA is an Equal Opportunity provider and employer.
UNITED STATES DEPARTMENT OF AGRICULTURE 1930-220th St. SE, Ste. 102 Agricultural Marketing Service 10050 N 25th Ave., Ste. 302 Bothell, WA 98021-8471 Dairy Programs Phoenix, AZ 85021-1664 Phone: (425) 487-6009 Phone: (602) 547-2909 Fax: (425) 487-2775 FEDERAL MILK ORDERS 124, 131 & 135 Fax: (602) 547-2906 E-mail: [email protected] E-mail: [email protected]
ANALYSIS OF COMPONENT LEVELS IN INDIVIDUAL HERD MILK AT THE FARM LEVEL
PACIFIC NORTHWEST, ARIZONA-LAS VEGAS, AND WESTERN FEDERAL MILK MARKETING ORDERS
2002
Staff Paper 03-01
Chris Werner
September 2003
i
ANALYSIS OF COMPONENT LEVELS IN INDIVIDUAL HERD MILK AT THE FARM LEVEL
PACIFIC NORTHWEST, ARIZONA-LAS VEGAS, AND WESTERN FEDERAL MILK MARKETING ORDERS
2002
Chris Werner
Abstract
Component levels in producer milk pooled on the Pacific Northwest (FO 124), Arizona-Las Vegas (FO 131), and Western (FO 135) Federal Milk Marketing Orders were analyzed for 2002 to determine average levels, regional and seasonal variation, and, when possible, the statistical relationship between components. Handlers regulated under the Pacific Northwest and Western Orders report butterfat, protein, and other solids. Handlers regulated under the Arizona-Las Vegas Order report butterfat only. Producer milk pooled was also valued using Federal order minimum producer prices for the respective orders. For 2002, a monthly average total of 1,930 producers were pooled on the Pacific Northwest, Arizona-Las Vegas, and Western Orders. During 2002, these producers delivered 16.4 billion pounds to the three markets. The milk shed of the three Federal orders includes Arizona, California, Colorado, Idaho, Kansas, Montana, Nebraska, Nevada, Oklahoma, Oregon, Utah, and Washington.
Major findings of this study include:
1. The 2002 average component levels for the Pacific Northwest Order were 3.68% butterfat, 3.05% true protein, and 5.71% other solids. The 2002 average component levels for the Western Order were 3.63% butterfat, 3.06% true protein, and 5.72% other solids. The 2002 average butterfat level for the Arizona-Las Vegas Order was 3.63%.
2. In all three orders, butterfat and protein levels decrease during the summer months and increase in the late fall and winter.
3. Although the volume of producer milk, number of producers, and average milk production per producer varies greatly between regions, there are only small differences in aggregate component levels between geographic regions within the milk shed of the three orders.
4. The Pacific Northwest Order's linear regression in 2002 for protein is PRO% = 1.49 + 0.426 * BF%, with an R-squared of 0.65. The Western Order's linear regression in 2002 for protein is PRO% = 1.59 + 0.415 * BF%, with an R-squared of 0.49.
5. The Pacific Northwest and Western Orders' regressions for estimating other solids using butterfat have a very poor correlation (R-squared of less than 0.05). The monthly regression varies between a positive and negative relationship; other solids levels appear to be independent of butterfat levels.

ii
TABLE OF CONTENTS
Section Page Number I. INTRODUCTION ..................................................................................................... 1 II. DATA AND METHODOLOGY .............................................................................. 2 III. SEASONAL VARIATION IN MILK COMPONENT LEVELS............................... 3 Table 1: Monthly Component Levels, Pacific Northwest Order, 2002 ............... 4 Table 2: Monthly Component Levels, Western Order, 2002............................... 4 Table 3: Monthly Component Levels, Arizona-Las Vegas Order, 2002 ............. 5 Table 4: Component Levels: Weighted Average, Mean, Median, Standard Deviation, Minimum, and Maximum, Pacific Northwest Order, 2002 . 6 Table 5: Component Levels: Weighted Average, Mean, Median, Standard Deviation, Minimum, and Maximum, Western Order, 2002 ................ 6 Table 6: Component Levels: Weighted Average, Mean, Median, Standard Deviation, Minimum, and Maximum, Arizona-Las Vegas Order, 2002 ....................................................................................................... 6 IV. REGIONAL VARIATION IN MILK COMPONENT LEVELS................................ 7 Table 7: Various Statistics by Region For 2002 .................................................. 8 V. STATISTICAL RELATIONSHIP AMONG MILK COMPONENTS....................... 9 Table 8: Pacific Northwest and Western Orders, Comparison of Regression Results: Butterfat Levels as a Predictor of Protein Levels, 1997 through 2002 .................................... 10 VI. MINIMUM ORDER VALUE OF PRODUCER MILK ............................................. 10 VII. SUMMARY................................................................................................................ 11
iii
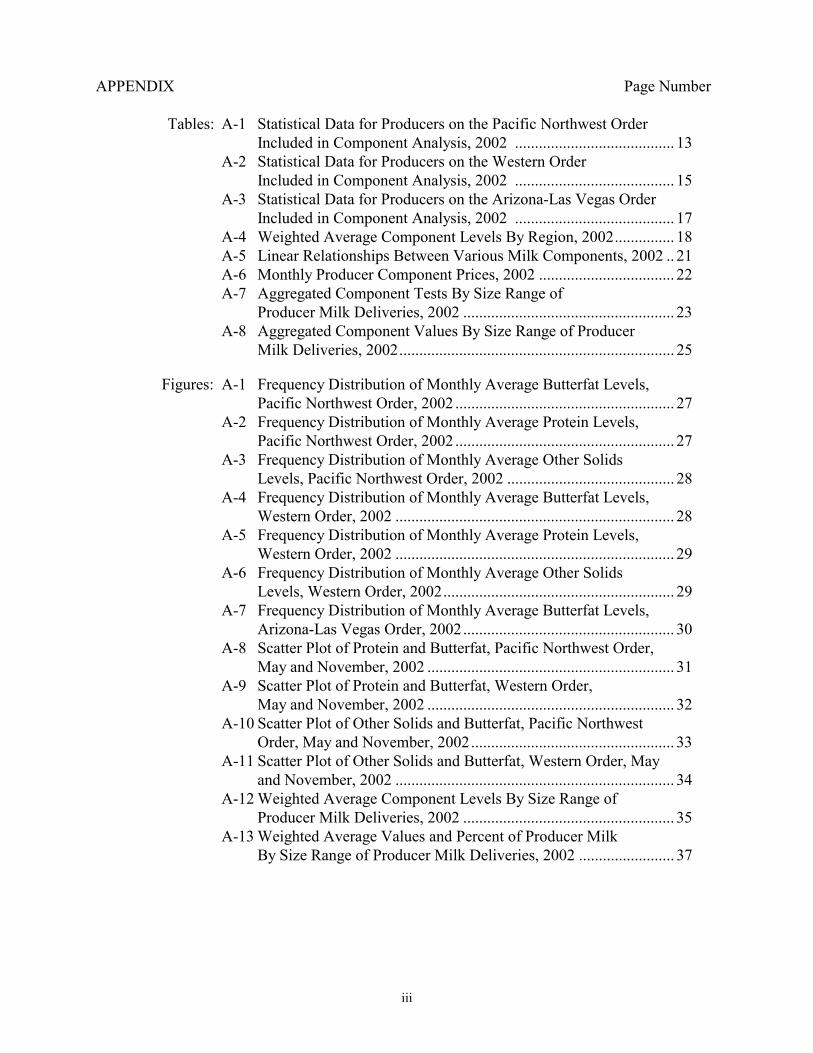
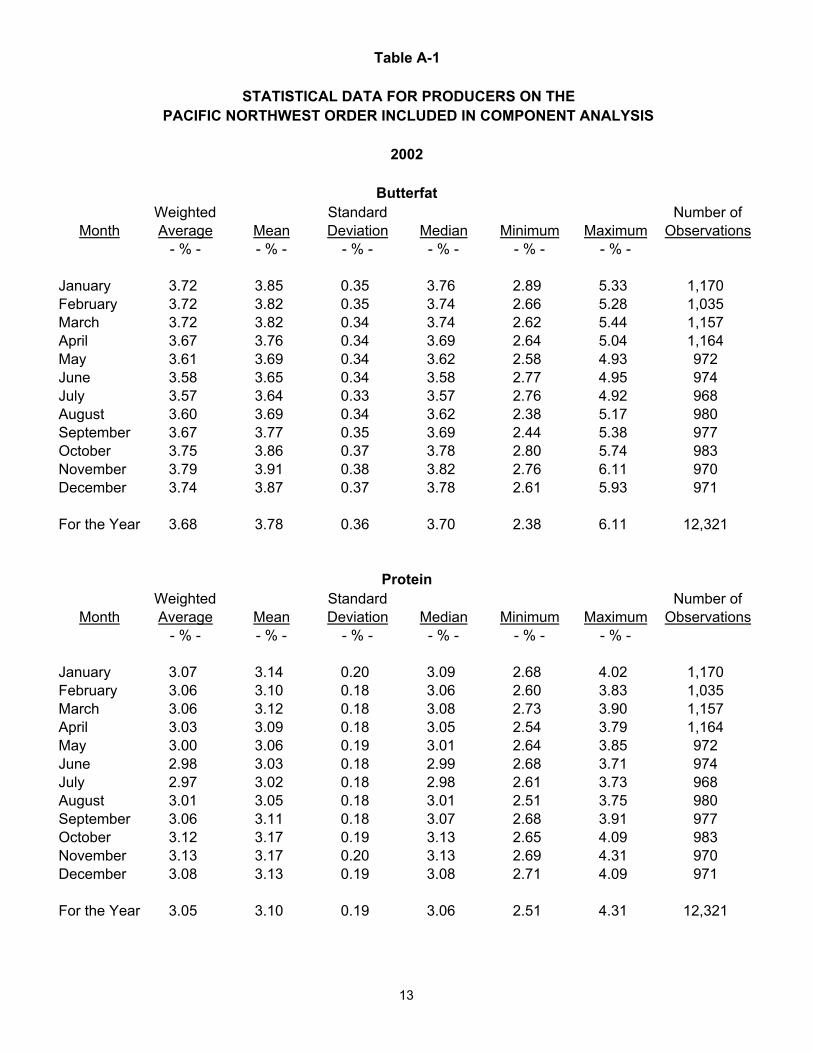
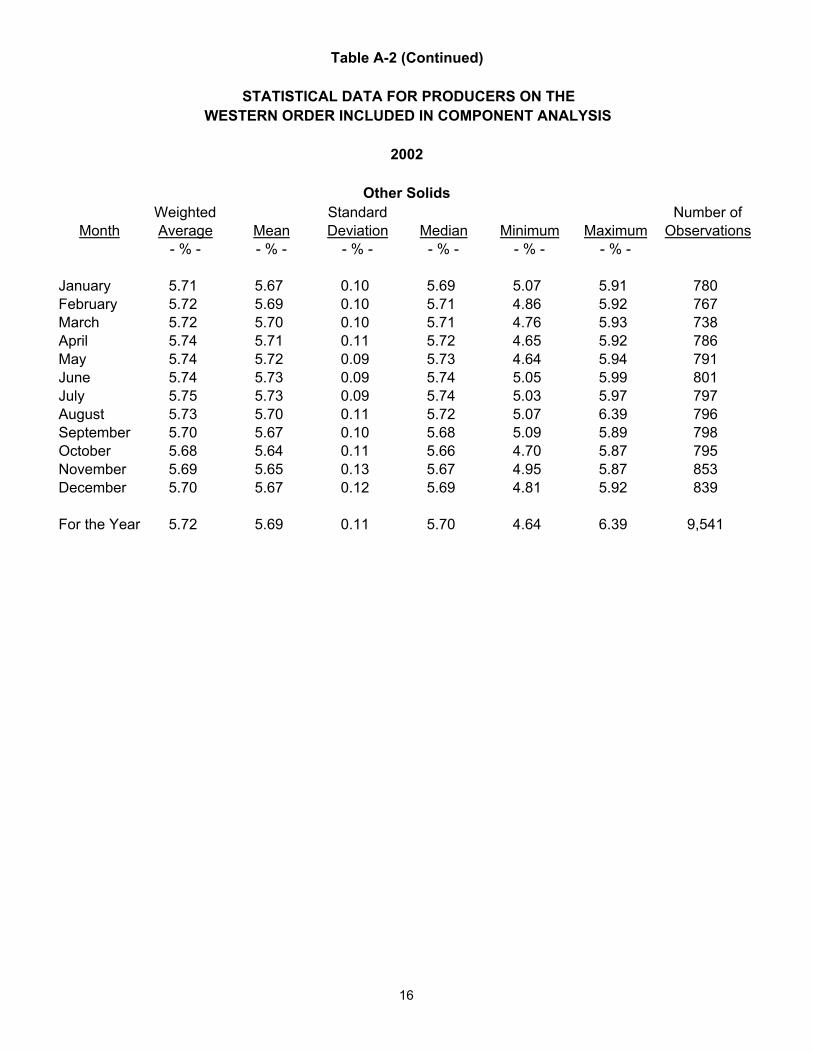
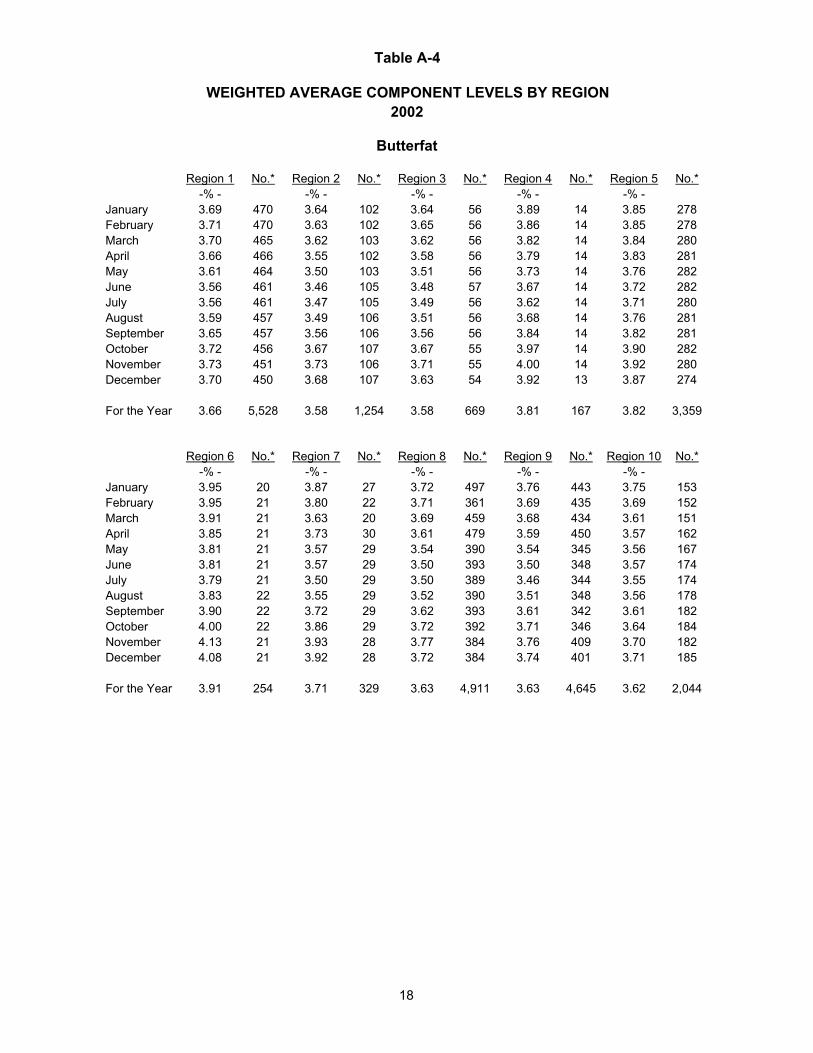
APPENDIX Page Number Tables: A-1 Statistical Data for Producers on the Pacific Northwest Order Included in Component Analysis, 2002 ........................................ 13 A-2 Statistical Data for Producers on the Western Order Included in Component Analysis, 2002 ........................................ 15 A-3 Statistical Data for Producers on the Arizona-Las Vegas Order Included in Component Analysis, 2002 ........................................ 17 A-4 Weighted Average Component Levels By Region, 2002............... 18 A-5 Linear Relationships Between Various Milk Components, 2002 .. 21 A-6 Monthly Producer Component Prices, 2002 .................................. 22 A-7 Aggregated Component Tests By Size Range of Producer Milk Deliveries, 2002 ..................................................... 23 A-8 Aggregated Component Values By Size Range of Producer Milk Deliveries, 2002..................................................................... 25 Figures: A-1 Frequency Distribution of Monthly Average Butterfat Levels, Pacific Northwest Order, 2002 ....................................................... 27 A-2 Frequency Distribution of Monthly Average Protein Levels, Pacific Northwest Order, 2002 ....................................................... 27 A-3 Frequency Distribution of Monthly Average Other Solids Levels, Pacific Northwest Order, 2002 .......................................... 28 A-4 Frequency Distribution of Monthly Average Butterfat Levels, Western Order, 2002 ...................................................................... 28 A-5 Frequency Distribution of Monthly Average Protein Levels, Western Order, 2002 ...................................................................... 29 A-6 Frequency Distribution of Monthly Average Other Solids Levels, Western Order, 2002.......................................................... 29 A-7 Frequency Distribution of Monthly Average Butterfat Levels, Arizona-Las Vegas Order, 2002..................................................... 30 A-8 Scatter Plot of Protein and Butterfat, Pacific Northwest Order, May and November, 2002 .............................................................. 31 A-9 Scatter Plot of Protein and Butterfat, Western Order, May and November, 2002 .............................................................. 32 A-10 Scatter Plot of Other Solids and Butterfat, Pacific Northwest Order, May and November, 2002................................................... 33 A-11 Scatter Plot of Other Solids and Butterfat, Western Order, May
and November, 2002 ...................................................................... 34 A-12 Weighted Average Component Levels By Size Range of
Producer Milk Deliveries, 2002 ..................................................... 35 A-13 Weighted Average Values and Percent of Producer Milk By Size Range of Producer Milk Deliveries, 2002 ........................ 37
iv
APPENDIX (continued) Page Number Maps: A-1 Marketing Areas of the Pacific Northwest, Arizona-Las Vegas, and Western Orders ........................................................................ 39 A-2 Geographic Regions Encompassing the Pacific Northwest, Arizona-Las Vegas, and Western Order Milksheds ....................... 40

1
ANALYSIS OF COMPONENT LEVELS IN INDIVIDUAL HERD MILK AT THE FARM LEVEL
PACIFIC NORTHWEST, ARIZONA-LAS VEGAS,
AND WESTERN FEDERAL MILK MARKETING ORDERS
2002
Chris Werner 1/ I. INTRODUCTION This study examines milk component levels in milk pooled on the Pacific Northwest (FO 124), Arizona-Las Vegas (FO 131), and Western (FO 135) Milk Marketing Orders during 2002. The milk components include butterfat, protein, and other solids. Protein and other solids were not included in any analyses concerning the Arizona-Las Vegas Order because they were not used as a basis for pricing milk in 2002, and handlers were not obligated under the order to report information on protein and other solids levels.
Component levels in producer milk pooled on the Pacific Northwest, Arizona-Las Vegas, and Western Orders were analyzed to determine average component levels, regional and seasonal variation, and the statistical relationship between components. Producer milk pooled on each order in 2002 was valued using Federal order minimum producer prices for the respective orders.
For 2002, a monthly average total of 1,930 producers were pooled on the Pacific Northwest, Arizona-Las Vegas, and Western Orders. During 2002, these producers delivered 16.4 billion pounds to the three markets. Beginning January 2000, true protein was used as a basis for pricing milk under the Pacific Northwest and Western Orders. Prior to January 2000, crude (Total Nitrogen) protein was used. True protein does not include non-protein nitrogen which is included in crude protein. Due to this change, references to protein levels prior to January 2000 are not directly comparable to protein levels after January 2000 without taking into account the effects of the change in testing for protein. In general, crude protein test levels are about 0.19 percentage points higher than true protein test levels. In a like manner, other solids levels associated with true protein levels are about 0.19 percentage points higher than those associated with crude protein test levels. During 2002, the Pacific Northwest Order milk shed was comprised of producers located in Washington, Oregon, California, Idaho, Colorado, Utah, Oklahoma, Nebraska, and Kansas. The Western Order milk shed was comprised of producers located in Southern Idaho, Utah, California, Eastern Oregon, Montana, Nevada, and Colorado. The Arizona-Las Vegas milk shed was comprised of producers located in Arizona and California. The milk shed of the three orders includes various geographic and climatic regions. These regions range from very dry climates 1/ Chris Werner is an Agricultural Economist with the Market Administrator Office, Bothell, Washington.

2
(Arizona, Central Washington, Southern Idaho, and Eastern Oregon) to very wet climates (western and coastal regions of Oregon and Washington). Geographically, the Cascade Mountain Range, Pacific Ocean, Rocky Mountain Range, and Columbia River provide general geographic and climate demarcations that may impact how dairy operations are managed.
II. DATA AND METHODOLOGY
The data included in this study comprises all producer milk pooled on the Pacific Northwest, Arizona-Las Vegas, and Western Orders. The data was collected from producer payrolls submitted by handlers to the market administrator's office. Components available for the Pacific Northwest and Western Orders were butterfat, protein, and other solids (other solids is nonfat solids less protein). Protein and other solids were not included for the Arizona-Las Vegas Order because they were not used as a basis for pricing milk in 2002, and handlers were not obligated under the order to report information on protein and other solids levels. Up until February 1997, the Pacific Northwest Order did not require handlers to report protein and other solids. Under the previous pricing system, butterfat and nonfat solids were the components used in determining minimum order values. Any reference to 1997 annual averages for protein and other solids for the Pacific Northwest Order does not include data for January 1997.
Eligible producer milk and producers which were not pooled were not included in this analysis. Eligible producer milk is Grade A milk production that qualifies to be but is not pooled on the respective order. The exclusion of milk not pooled was due to the unavailability of the information, and it often represented one handler and was, therefore, restricted. Partial pooling of a producer's monthly milk production to maintain producer qualification on the Western Order was treated as a full month's production. When inter-order pooling of producers occurred, each order was treated separately, and each producer was accounted for on that portion of milk that was pooled on that order. Examination of the data did not reveal that this treatment was a source of distortion or bias. The Pacific Northwest, Arizona-Las Vegas, and Western Orders were divided into ten regions. (See Map A-2.) The small number of producers in Northern California pooled on the Pacific Northwest Order made it necessary to combine them with another region (Western Oregon, Region 5). Region 5 has a similar climate and was geographically adjacent to the two California counties. Utah, Colorado, Kansas, Montana, Nebraska, and Nevada were combined for reasons of confidentiality. The Arizona, Oklahoma, and central/southern California producers were also combined for reasons of confidentiality. Other than the identified exceptions, order and/or state lines were considered as primary boundaries. The regions within states were defined based on climatic conditions and geography. The regions are as follows: Western Washington (Region 1), Central Washington (Region 2), Eastern Washington (Region 3), Northern Idaho (Region 4), Western Oregon/Northern California (Region 5), Central Oregon (Region 6), Eastern Oregon (Region 7), Southern Idaho and Wyoming (Region 8), Utah/Nevada/other states (Region 9), and Arizona/South-Central California/Oklahoma (Region 10).
3
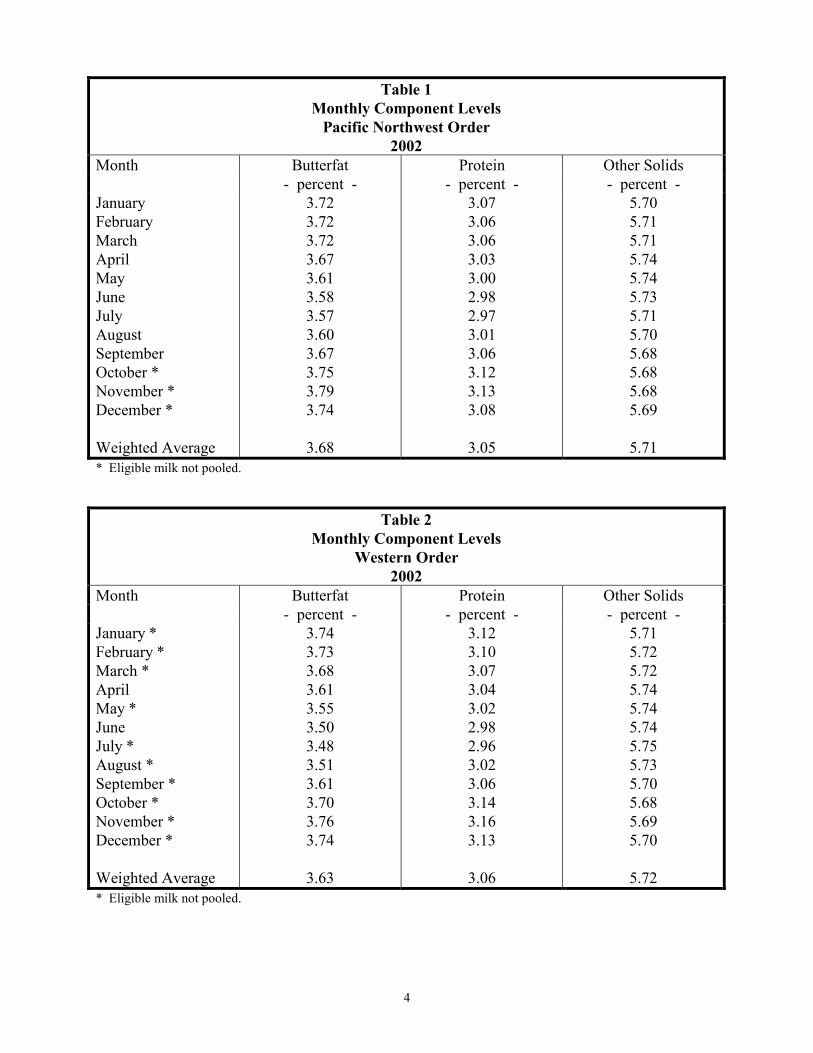
In Oregon and Washington, the west side of the Cascade Mountain Range has more precipitation and is characterized by a milder climate than the eastern side of the states1. The region east of the Cascade Mountain Range has a drier climate with warmer summers and colder winters. In Eastern Washington, the precipitation rate begins to increase slightly. Idaho has two distinct regions split by the orders: Northern Idaho is in the Pacific Northwest Order, while Southern Idaho is in the Western Order. Northern Idaho is wetter and more mountainous compared to Southern Idaho. Utah, in comparison to Southern Idaho, has regions of higher elevation and increased precipitation. Arizona is very dry year round with much less precipitation and many days with average temperatures much higher than the other regions studied. Ordinary Least Squares regression analysis was used to determine relationships between components. Monthly Federal order minimum producer prices specific to the Pacific Northwest, Arizona-Las Vegas, and Western Orders were used in the determination of the value of milk production. III. SEASONAL VARIATION IN MILK COMPONENT LEVELS In 2002, producers associated with the Pacific Northwest Order delivered 7,824.6 million pounds, but not all eligible milk was pooled. (See asterisked months in Table 1.) For 2002, producer milk tested, on average, 3.68% butterfat, 3.05% protein, and 5.71% other solids. In the Pacific Northwest Order, the butterfat percent decreases in the spring and increases again in the fall and winter. Table 1 shows the monthly and annual average component levels for the Pacific Northwest Order. Milk production per cow typically is less, and animals are fed more stored feed in the fall and winter. In the spring, during the flush of milk production, the feeding of more fresh grass increases the total pounds produced but decreases the percentage butterfat content of milk. The spring flush is additionally impacted by the biological cycle of cows and the increase in temperature in the spring. Butterfat levels in the Pacific Northwest Order in 2002 were the highest in November at 3.79% and lowest in July at 3.57%. The seasonal cycle of protein levels is similar to butterfat but with a lesser degree of variation. Protein levels in 2002 were highest in November at 3.13% and lowest in July at 2.97%. Other solids levels were much more consistent throughout the year when compared to the seasonal changes in butterfat and protein levels. Other solids levels reached a peak of 5.74% in April and May, and a low of 5.68% in September, October, and November, and showed very little seasonality. In 2002, producers associated with the Western Order delivered 5,541.2 million pounds, but not all eligible milk was pooled. (See asterisked months in Table 2.) For 2002, producer milk tested, on average, 3.63% butterfat, 3.06% protein, and 5.72% other solids.
1 Climate information based on Western Regional Climate Center precipitation maps.
4
Table 1 Monthly Component Levels
Pacific Northwest Order 2002
Month Butterfat Protein Other Solids - percent - - percent - - percent - January February March April May June July August September October * November * December * Weighted Average
3.72 3.72 3.72 3.67 3.61 3.58 3.57 3.60 3.67 3.75 3.79 3.74
3.68
3.07 3.06 3.06 3.03 3.00 2.98 2.97 3.01 3.06 3.12 3.13 3.08
3.05
5.70 5.71 5.71 5.74 5.74 5.73 5.71 5.70 5.68 5.68 5.68 5.69
5.71
* Eligible milk not pooled.
Table 2 Monthly Component Levels
Western Order 2002
Month Butterfat Protein Other Solids - percent - - percent - - percent - January * February * March * April May * June July * August * September * October * November * December * Weighted Average
3.74 3.73 3.68 3.61 3.55 3.50 3.48 3.51 3.61 3.70 3.76 3.74
3.63
3.12 3.10 3.07 3.04 3.02 2.98 2.96 3.02 3.06 3.14 3.16 3.13
3.06
5.71 5.72 5.72 5.74 5.74 5.74 5.75 5.73 5.70 5.68 5.69 5.70
5.72
* Eligible milk not pooled.

5
Table 3 Monthly Component Levels Arizona-Las Vegas Order
2002 Month Butterfat - percent - January February March April May June July August September October November December Weighted Average
3.73 3.66 3.59 3.56 3.56 3.59 3.59 3.59 3.64 3.66 3.70 3.70
3.63
Component levels in the Western Order follow a similar seasonal pattern as the Pacific Northwest Order. The butterfat and protein levels decrease in the spring and rise again in the fall. (See Table 2 on the previous page.) Butterfat levels in the Western Order in 2002 were highest in November at 3.76% and lowest in July at 3.48%. Protein levels in 2002 were also highest in November at 3.16% and lowest in July at 2.96%. Other solids levels were much more consistent throughout the year when compared to the seasonal changes in butterfat and protein levels. Other solids had a high of 5.75% in July, and a low of 5.68% in October and showed very little seasonality. In 2002, producers associated with the Arizona-Las Vegas Order delivered 3,026.6 million pounds. For 2002, producer milk tested, on average, 3.63% butterfat. Butterfat levels in the Arizona-Las Vegas Order follow a similar seasonal pattern as the Pacific Northwest and Western Orders. The butterfat levels decrease in the spring and rise again in the fall. (See Table 3 above.) Butterfat levels in the Arizona-Las Vegas Order in 2002 were highest in January at 3.73% and lowest in April and May at 3.56%. The highs and the lows of butterfat occurred roughly two months later in the Arizona-Las Vegas Order than the Pacific Northwest and Western Orders. For 2002, the monthly and annual weighted average butterfat and protein levels were less than the mean averages for both components. (See Table 4, 5, and 6 and Appendix Tables A-1, A-2, and A-3.) The relative levels of the weighted average and the mean would indicate that individual producers who deliver smaller amounts of milk (on a monthly basis) have higher levels of these components in their milk than their larger counterparts. Conversely, on the Pacific Northwest and Western

6
Table 4 Component Levels: Weighted Average, Mean, Median,
Standard Deviation, Minimum, and Maximum Pacific Northwest Order
2002 Butterfat Protein Other Solids
% % % Weighted Average 3.68 3.05 5.71 Mean 3.78 3.10 5.68 Median 3.70 3.06 5.69 Standard Deviation 0.36 0.19 0.09 Minimum 2.38 2.51 4.61 Maximum 6.11 4.31 6.04
Table 5 Component Levels: Weighted Average, Mean, Median,
Standard Deviation, Minimum, and Maximum Western Order
2002 Butterfat Protein Other Solids
% % % Weighted Average 3.63 3.06 5.72 Mean 3.69 3.12 5.69 Median 3.65 3.09 5.70 Standard Deviation 0.31 0.18 0.11 Minimum 2.69 2.58 4.64 Maximum 5.55 4.14 6.39
Table 6 Component Levels: Weighted Average, Mean, Median,
Standard Deviation, Minimum, and Maximum Arizona-Las Vegas Order
2002 Butterfat % Weighted Average 3.63 Mean 3.65 Median 3.62 Standard Deviation 0.27 Minimum 2.99 Maximum 4.92

7
Orders, the other solids weighted average is higher than the mean, indicating that producers who deliver larger amounts of milk have higher levels of other solids in their milk than their smaller counterparts. During 2002, for the Pacific Northwest Order, producers' individual monthly average butterfat tests ranged from 2.38% to 6.11%; protein tests ranged from 2.51% to 4.31%, and other solids levels ranged from 4.61% to 6.04%. (See Table 4.) Most monthly average component tests are within one standard deviation of the mean2. Based on the definition of a standard deviation, most producers had butterfat tests ranging from 3.42% to 4.14%. Similarly, most protein tests ranged from 2.91% to 3.29%, and most other solids tests ranged from 5.59% to 5.77%. (See Appendix Table A-1 for monthly component statistics.) In 2002, Western Order producer butterfat tests ranged from 2.69% to 5.55%, protein tests ranged from 2.58% to 4.14%, and other solids tests ranged from 4.64% to 6.39%. (See Table 5.) Based on the definition of a standard deviation, most producers had butterfat tests ranging from 3.38% to 4.00%. Similarly, most protein tests ranged from 2.94% to 3.30%, and most other solids tests ranged from 5.58% to 5.80%. (For monthly component statistics, see Appendix Table A-2.) In 2002, Arizona-Las Vegas Order producer butterfat tests ranged from 2.99% to 4.92%. (See Table 6.) Based on the definition of a standard deviation, most producers had butterfat tests ranging from 3.38% to 3.92%. (See Appendix Table A-3 for monthly component statistics.) IV. REGIONAL VARIATION IN MILK COMPONENT LEVELS Between geographic regions, differences in climate, breeds of cattle, common management practices, feeds, and other characteristics of dairy operations can reveal varying milk component levels on a geographic basis. The data was divided into ten regions based on the geographic location of the dairy farms. The ten regions are primarily based on a combination of relatively homogeneous climates and state and Federal order borders. Producer milk was aggregated based on the location it was produced, not by what order it was pooled on. Regions 1 through 6 are associated with the Pacific Northwest region and are defined in Appendix Map A-2. Table 7, on the following page, provides 2002 milk production, average number of producers, and component tests for each region. In 2002, the region with the most milk associated with the Pacific Northwest Order was Region 1 followed by Regions 2, 5, 6, 3, and 4. Component levels for each region appear to vary only slightly. The Western region is represented by Regions 7, 8, and 9. Region 8 represented the greatest portion of milk pooled on the Western Order, followed by Region 9. Region 10 represents the Arizona-Las Vegas Order and southern California producers pooled on the Pacific Northwest and Western Orders.
2 By definition, for a normal distribution, approximately 68% of observations are within one standard deviation of the mean.
8
Table 7 Various Statistics by Region For 2002
Region 1 (Western Washington) Region 2 (Central Washington) Milk Production Average Number of Producers Average Pounds Per Producer Butterfat Test Protein Test Other Solids Test
2,986,950,439461
6,483,9733.66%3.03%5.69%
Milk Production Average Number of Producers Average Pounds Per Producer Butterfat Test Protein Test Other Solids Test
1,983,898,171105
18,984,6713.58%2.99%5.70%
Region 3 (Eastern Washington) Region 4 (Northern Idaho) Milk Production Average Number of Producers Average Pounds Per Producer Butterfat Test Protein Test Other Solids Test
413,300,99656
7,413,4713.58%3.02%5.71%
Milk Production Average Number of Producers Average Pounds Per Producer Butterfat Test Protein Test Other Solids Test
19,641,96914
1,411,3993.81%3.07%5.67%
Region 5 (Western Oregon) Region 6 (Central Oregon) Milk Production Average Number of Producers Average Pounds Per Producer Butterfat Test Protein Test Other Solids Test
1,499,803,059280
5,358,0343.82%3.11%5.73%
Milk Production Average Number of Producers Average Pounds Per Producer Butterfat Test Protein Test Other Solids Test
471,397,95921
22,270,7703.91%3.18%5.78%
Region 7 (Eastern Oregon) Region 8 (Southern Idaho) Milk Production Average Number of Producers Average Pounds Per Producer Butterfat Test Protein Test Other Solids Test
44,907,97027
1,637,9813.71%3.09%5.66%
Milk Production Average Number of Producers Average Pounds Per Producer Butterfat Test Protein Test Other Solids Test
3,215,323,264409
7,856,6243.63%3.06%5.73%
Region 9 (Greater Utah) Region 10 (Arizona) Milk Production Average Number of Producers Average Pounds Per Producer Butterfat Test Protein Test Other Solids Test
1,563,049,586387
4,038,0183.63%3.05%5.73%
Milk Production Average Number of Producers Average Pounds Per Producer Butterfat Test Protein Test Other Solids Test
4,194,154,811170
24,623,2183.62%
n/an/a
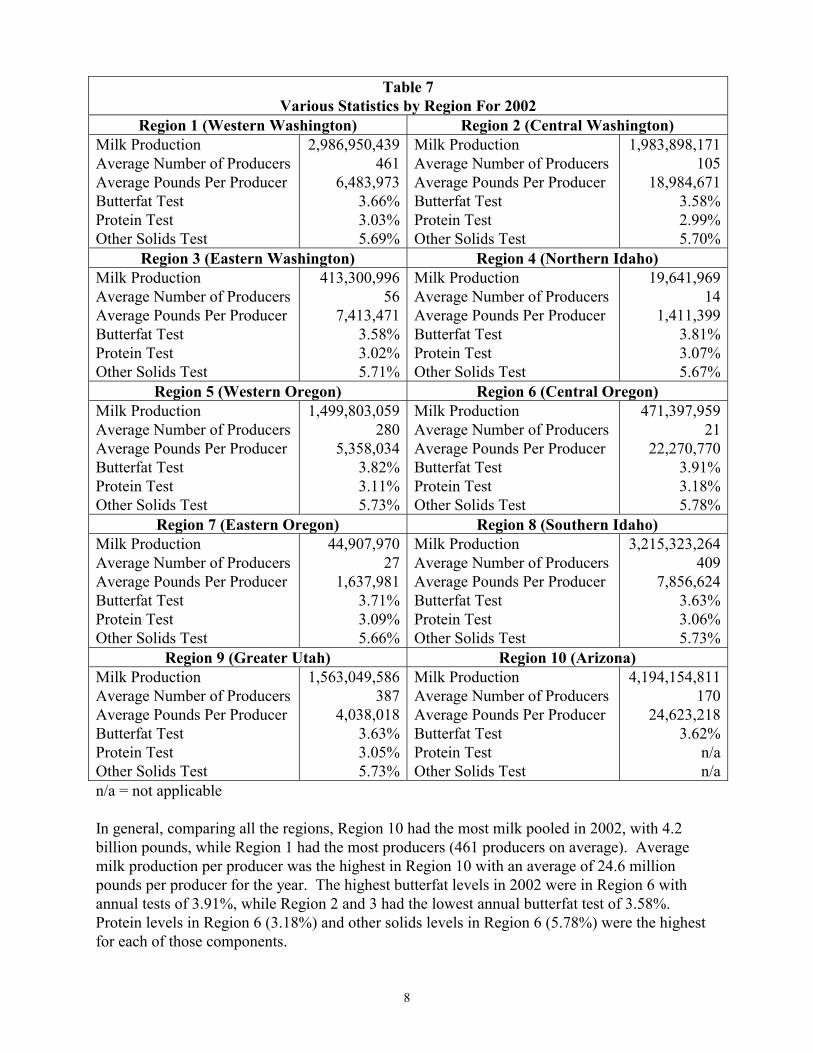
n/a = not applicable In general, comparing all the regions, Region 10 had the most milk pooled in 2002, with 4.2 billion pounds, while Region 1 had the most producers (461 producers on average). Average milk production per producer was the highest in Region 10 with an average of 24.6 million pounds per producer for the year. The highest butterfat levels in 2002 were in Region 6 with annual tests of 3.91%, while Region 2 and 3 had the lowest annual butterfat test of 3.58%. Protein levels in Region 6 (3.18%) and other solids levels in Region 6 (5.78%) were the highest for each of those components.

9
Producer milk, number of producers, and average milk production per producer varied greatly between regions. Small differences in component levels were also evident. In 2002, butterfat levels in Regions 4, 5, and 6 were noticeably higher than the other regions, while Regions 2 and 3 were much lower than the other regions. Protein levels in Region 6 were 0.19% higher than Region 2. Other solids levels by region varied only 0.12% between the high and low for the year 2002. V. STATISTICAL RELATIONSHIP AMONG MILK COMPONENTS Regression analysis was used to analyze the linear relationship between milk component levels. The analysis revealed that the only significant relationship between components was between butterfat (BF) and protein (PRO). Regressions of nonfat solids and protein and nonfat solids and butterfat were found to be insignificant and not included in this study. This latter finding was expected and is due to: (1) nonfat solids, by definition, is protein plus other solids; and (2) other solids levels appear random and show little seasonal variation. (See Appendix Figures A-10 and A-11.) The Pacific Northwest Order had 12,321 observations in 2002, compared to the Western Order's 9,541 observations. The linear regression for protein and butterfat for 2002 varied between the Pacific Northwest and Western Orders. The regression equation calculated for each order was:
Pacific Northwest: PRO% = 1.4879 + 0.4263 BF%
R2 = 0.6486
Western: PRO% = 1.5916+ 0.4147 BF% R2 = 0.4933
The correlation (R2) between protein and butterfat is slightly higher in the Pacific Northwest Order compared to the Western Order. The Pacific Northwest's slope is slightly steeper, but the intercept is slightly less. Adjusting for the difference in protein testing in years previous to 2000, both equations above are similar to previous Federal order publications3. Appendix Figures A-8 and A-9 show graphical representations of the linear regressions for May and November 2002. The butterfat and protein regression equations for the Pacific Northwest and Western Orders (Southwestern Idaho-Eastern Oregon prior to January 2000), on a combined basis, were done for 1997, 1998, 1999, 2000, 2001, and 2002. (See Table 8 on page 10.) The Pacific Northwest Order did not price milk based on protein in January 1997; no data was available for this month. Over the 1997 - 1999 periods, the general trend of the regression is toward a lower intercept but a steeper slope. This would suggest that, in general, a change in the butterfat level is associated with a larger change in the protein level in 1999 compared to 1997 or 1998. Beginning January 2000, the use of true protein, instead of crude protein, lowered the intercept and changed the slope only slightly. The changes in order marketing areas that occurred because of order 3 See Analysis of Component Levels and Somatic Cell Count in Individual Herd Milk at the Farm Level, 1998, Upper Midwest Marketing Area, Staff paper 99-01, July 1999.
10
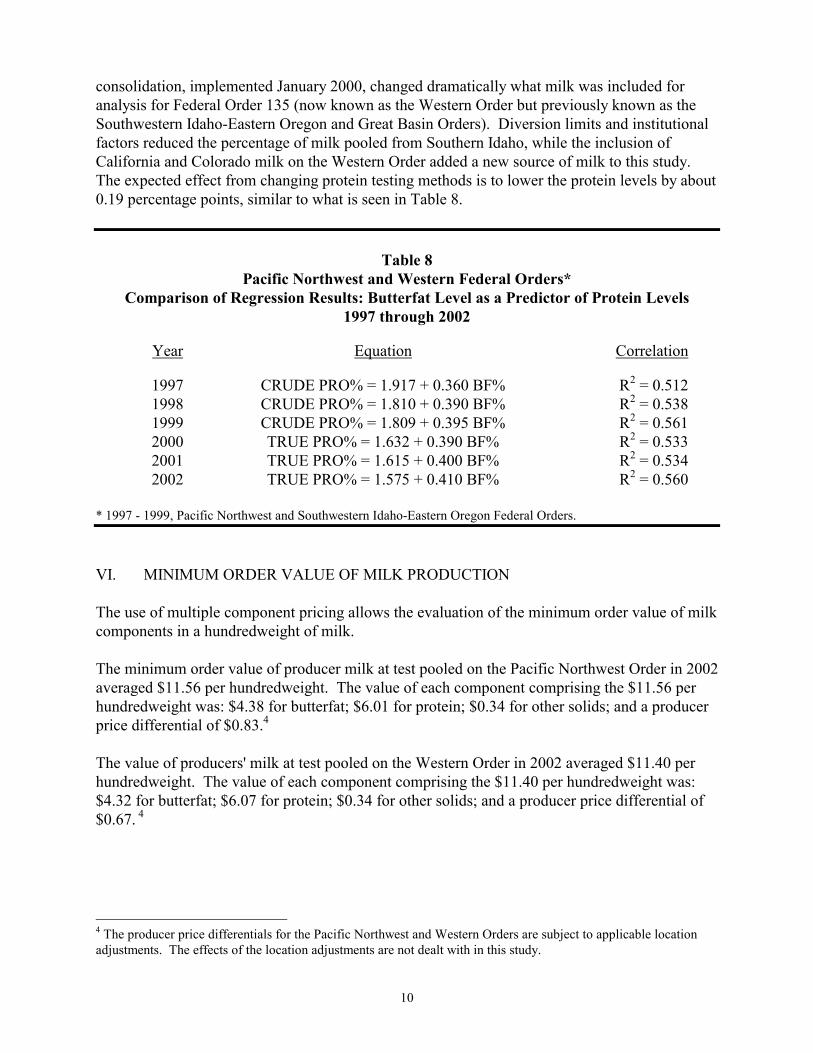
consolidation, implemented January 2000, changed dramatically what milk was included for analysis for Federal Order 135 (now known as the Western Order but previously known as the Southwestern Idaho-Eastern Oregon and Great Basin Orders). Diversion limits and institutional factors reduced the percentage of milk pooled from Southern Idaho, while the inclusion of California and Colorado milk on the Western Order added a new source of milk to this study. The expected effect from changing protein testing methods is to lower the protein levels by about 0.19 percentage points, similar to what is seen in Table 8.
Table 8
Pacific Northwest and Western Federal Orders* Comparison of Regression Results: Butterfat Level as a Predictor of Protein Levels
1997 through 2002
Year Equation Correlation 1997 CRUDE PRO% = 1.917 + 0.360 BF% R2 = 0.512 1998 CRUDE PRO% = 1.810 + 0.390 BF% R2 = 0.538 1999 CRUDE PRO% = 1.809 + 0.395 BF% R2 = 0.561 2000 TRUE PRO% = 1.632 + 0.390 BF% R2 = 0.533 2001 TRUE PRO% = 1.615 + 0.400 BF% R2 = 0.534 2002 TRUE PRO% = 1.575 + 0.410 BF% R2 = 0.560 * 1997 - 1999, Pacific Northwest and Southwestern Idaho-Eastern Oregon Federal Orders.
VI. MINIMUM ORDER VALUE OF MILK PRODUCTION
The use of multiple component pricing allows the evaluation of the minimum order value of milk components in a hundredweight of milk. The minimum order value of producer milk at test pooled on the Pacific Northwest Order in 2002 averaged $11.56 per hundredweight. The value of each component comprising the $11.56 per hundredweight was: $4.38 for butterfat; $6.01 for protein; $0.34 for other solids; and a producer price differential of $0.83.4 The value of producers' milk at test pooled on the Western Order in 2002 averaged $11.40 per hundredweight. The value of each component comprising the $11.40 per hundredweight was: $4.32 for butterfat; $6.07 for protein; $0.34 for other solids; and a producer price differential of $0.67. 4
4 The producer price differentials for the Pacific Northwest and Western Orders are subject to applicable location adjustments. The effects of the location adjustments are not dealt with in this study.
11
The value of producers' milk pooled on the Arizona-Las Vegas Order in 2002 averaged $11.69 per hundredweight. The value of skim and butterfat portions of the $11.69 per hundredweight was: $4.39 for butterfat; and $7.30 for skim.5 There is an apparent inverse relationship between the size-range of producers' production and the butterfat and protein levels in their milk. An inverse relationship between size-range and certain component levels may be due to the relative prevalence of high component testing breeds among smaller herd sizes (e.g. Jerseys) compared to lower component testing breeds (e.g. Holsteins). The weighted average component levels by size-range of milk production is summarized in Appendix Table A-7 and Figure A-12. On the Pacific Northwest and Western Orders the inverse relationship between size-range and producer butterfat and protein levels is more apparent than the levels of butterfat on the Arizona-Las Vegas Order. On the Pacific Northwest and Western Orders, there appears to be a positive relationship between the size-range of a producers’ production and the other solids levels in their milk. The difference in component levels, in turn, translates to an inverse relationship between size-range and minimum order value per hundredweight. The aggregated value of milk production by size-range of milk production is summarized in Appendix Table A-8 and Figure A-13. For the Pacific Northwest Order, on average, using 2002 Federal order prices, producers with less than 50,000 pounds of production received more per hundredweight, $12.49, than other producers. Producers with more than one million pounds of production averaged the lowest amount per hundredweight, at $11.43. Producers on the Western Order followed a similar pattern as producers on the Pacific Northwest Order. Producers with less than 50,000 pounds of production pooled on the Western Order received more per hundredweight, $11.92, than other producers. Producers with between 500,000 and 600,000 pounds of production averaged the lowest amount per hundredweight, at $11.30. This relationship is generally indicative of the fact that smaller herds typically have higher component levels than larger herds. On the Arizona-Las Vegas Order, using skim-butterfat values, a relationship between size-range and value per hundredweight was less evident. The Arizona-Las Vegas Order data was broken down further for producers over one million pounds into smaller increments (e.g. 1-2 million pounds, 2-3 million pounds, 3-4 million pounds, etc.) to determine whether the size-range categories used masked any relationships. Using smaller increments does indicate producers pooled on the Arizona-Las Vegas Order who have more milk deliveries have a lower value of milk; the relationship, however, is not as significant as the other two orders noted above.
VII. SUMMARY This paper analyzes milk components associated with the Pacific Northwest, Arizona-Las Vegas, and Western Orders. Handlers regulated under the Pacific Northwest and Western Orders report butterfat, protein, and other solids. Handlers regulated under the Arizona-Las Vegas Order report butterfat, only. For each order, producer information was collected from handler payrolls submitted to the market administrator's office. Component levels were examined using a variety 5 The producer prices for the Arizona-Las Vegas Order are subject to applicable location adjustments. The effects of the location adjustment are not dealt with in this study.

12
of measures including: annual averages, seasonal and regional averages, relationships between components, frequency distributions and scatter plots of regressions, and the value of milk components by size-range of production. Weighted average component levels for the Pacific Northwest Order in 2002 were: 3.68% butterfat, 3.05% protein, and 5.71% other solids. Butterfat and protein percentages peaked in November and reached a low in July, respectively. Other solids demonstrated very little seasonal change. Although the volume of producer milk, number of producers, and average milk production per producer varies greatly between regions, there are only small differences in aggregate component levels between geographic regions within the milk shed of the three orders. The linear relationship between butterfat and protein on the Pacific Northwest Order was:
Protein = 1.4879 + 0.4263 * Butterfat (R2 = 0.6486).
In 2002, the Federal order weighted average price received for milk was $11.56 per hundredweight, at test. Weighted average component levels for the Western Order in 2002 were: 3.63% butterfat, 3.06% protein, and 5.72% other solids. Butterfat and protein percentages peaked in November and reached a low in July. Other solids, as in the Pacific Northwest Order, had very little seasonal change. The linear relationship between butterfat and protein on the Western Order was:
Protein = 1.5916 + 0.4147 * Butterfat (R2 = 0.4933).
In 2002, the Federal order weighted average price received for milk was $11.40 per hundredweight, at test. The annual average butterfat level for the Arizona-Las Vegas Order in 2002 was 3.63%. Butterfat levels peaked in January and reached a low April and May. In 2002, the Federal order weighted average price received for milk was $11.69 per hundredweight, at test. In 2002, the minimum order value of producer milk at test pooled on the Pacific Northwest Order averaged $11.56, the Western Order averaged $11.40, and the Arizona-Las Vegas Order averaged $11.69. In general, as producers monthly deliveries increase, the weighted average value of the milk, at Federal order prices, decreases.

APPENDIX
Weighted Standard Number ofMonth Average Mean Deviation Median Minimum Maximum Observations
- % - - % - - % - - % - - % - - % -
January 3.72 3.85 0.35 3.76 2.89 5.33 1,170February 3.72 3.82 0.35 3.74 2.66 5.28 1,035March 3.72 3.82 0.34 3.74 2.62 5.44 1,157April 3.67 3.76 0.34 3.69 2.64 5.04 1,164May 3.61 3.69 0.34 3.62 2.58 4.93 972June 3.58 3.65 0.34 3.58 2.77 4.95 974July 3.57 3.64 0.33 3.57 2.76 4.92 968August 3.60 3.69 0.34 3.62 2.38 5.17 980September 3.67 3.77 0.35 3.69 2.44 5.38 977October 3.75 3.86 0.37 3.78 2.80 5.74 983November 3.79 3.91 0.38 3.82 2.76 6.11 970December 3.74 3.87 0.37 3.78 2.61 5.93 971
For the Year 3.68 3.78 0.36 3.70 2.38 6.11 12,321
Weighted Standard Number ofMonth Average Mean Deviation Median Minimum Maximum Observations
- % - - % - - % - - % - - % - - % -
January 3.07 3.14 0.20 3.09 2.68 4.02 1,170February 3.06 3.10 0.18 3.06 2.60 3.83 1,035March 3.06 3.12 0.18 3.08 2.73 3.90 1,157April 3.03 3.09 0.18 3.05 2.54 3.79 1,164May 3.00 3.06 0.19 3.01 2.64 3.85 972June 2.98 3.03 0.18 2.99 2.68 3.71 974July 2.97 3.02 0.18 2.98 2.61 3.73 968August 3.01 3.05 0.18 3.01 2.51 3.75 980September 3.06 3.11 0.18 3.07 2.68 3.91 977October 3.12 3.17 0.19 3.13 2.65 4.09 983November 3.13 3.17 0.20 3.13 2.69 4.31 970December 3.08 3.13 0.19 3.08 2.71 4.09 971
For the Year 3.05 3.10 0.19 3.06 2.51 4.31 12,321
Table A-1
STATISTICAL DATA FOR PRODUCERS ON THEPACIFIC NORTHWEST ORDER INCLUDED IN COMPONENT ANALYSIS
2002
Butterfat
Protein
13

Weighted Standard Number ofMonth Average Mean Deviation Median Minimum Maximum Observations
- % - - % - - % - - % - - % - - % -
January 5.70 5.67 0.09 5.69 4.61 5.96 1,170February 5.71 5.69 0.08 5.69 5.26 5.99 1,035March 5.71 5.70 0.07 5.70 5.21 5.95 1,157April 5.74 5.71 0.08 5.73 5.23 5.99 1,164May 5.74 5.72 0.08 5.73 5.16 6.04 972June 5.73 5.70 0.08 5.71 5.31 6.03 974July 5.71 5.68 0.09 5.69 5.09 6.00 968August 5.70 5.68 0.09 5.68 4.91 5.97 980September 5.68 5.65 0.09 5.65 5.06 5.91 977October 5.68 5.64 0.10 5.65 5.12 5.88 983November 5.68 5.65 0.10 5.66 5.12 5.87 970December 5.69 5.66 0.10 5.67 4.94 5.87 971
For the Year 5.71 5.68 0.09 5.69 4.61 6.04 12,321
2002
Other Solids
Table A-1 (Continued)
STATISTICAL DATA FOR PRODUCERS ON THEPACIFIC NORTHWEST ORDER INCLUDED IN COMPONENT ANALYSIS
14

Weighted Standard Number ofMonth Average Mean Deviation Median Minimum Maximum Observations
- % - - % - - % - - % - - % - - % -
January 3.74 3.81 0.30 3.76 3.20 5.49 780February 3.73 3.79 0.29 3.73 3.06 5.32 767March 3.68 3.74 0.31 3.69 2.99 5.55 738April 3.61 3.65 0.28 3.61 2.69 4.90 786May 3.55 3.58 0.26 3.56 2.94 4.72 791June 3.50 3.52 0.26 3.49 2.70 4.78 801July 3.48 3.49 0.25 3.47 2.84 4.76 797August 3.51 3.55 0.27 3.52 2.80 4.73 796September 3.61 3.67 0.28 3.64 2.91 5.17 798October 3.70 3.78 0.30 3.75 2.97 5.34 795November 3.76 3.83 0.31 3.78 2.87 5.15 853December 3.74 3.81 0.34 3.76 3.00 5.20 839
For the Year 3.63 3.69 0.31 3.65 2.69 5.55 9,541
Weighted Standard Number ofMonth Average Mean Deviation Median Minimum Maximum Observations
- % - - % - - % - - % - - % - - % -
January 3.12 3.19 0.18 3.15 2.81 4.02 780February 3.10 3.17 0.18 3.13 2.78 4.01 767March 3.07 3.13 0.17 3.10 2.78 3.93 738April 3.04 3.08 0.16 3.06 2.66 3.79 786May 3.02 3.05 0.15 3.04 2.64 3.77 791June 2.98 3.03 0.16 3.00 2.64 3.85 801July 2.96 3.00 0.16 2.98 2.58 3.85 797August 3.02 3.05 0.16 3.03 2.66 3.84 796September 3.06 3.12 0.16 3.08 2.79 3.87 798October 3.14 3.20 0.18 3.17 2.79 4.07 795November 3.16 3.22 0.18 3.19 2.75 4.14 853December 3.13 3.19 0.19 3.15 2.63 4.13 839
For the Year 3.06 3.12 0.18 3.09 2.58 4.14 9,541
Butterfat
Protein
Table A-2
STATISTICAL DATA FOR PRODUCERS ON THEWESTERN ORDER INCLUDED IN COMPONENT ANALYSIS
2002
15
Weighted Standard Number ofMonth Average Mean Deviation Median Minimum Maximum Observations
- % - - % - - % - - % - - % - - % -
January 5.71 5.67 0.10 5.69 5.07 5.91 780February 5.72 5.69 0.10 5.71 4.86 5.92 767March 5.72 5.70 0.10 5.71 4.76 5.93 738April 5.74 5.71 0.11 5.72 4.65 5.92 786May 5.74 5.72 0.09 5.73 4.64 5.94 791June 5.74 5.73 0.09 5.74 5.05 5.99 801July 5.75 5.73 0.09 5.74 5.03 5.97 797August 5.73 5.70 0.11 5.72 5.07 6.39 796September 5.70 5.67 0.10 5.68 5.09 5.89 798October 5.68 5.64 0.11 5.66 4.70 5.87 795November 5.69 5.65 0.13 5.67 4.95 5.87 853December 5.70 5.67 0.12 5.69 4.81 5.92 839
For the Year 5.72 5.69 0.11 5.70 4.64 6.39 9,541
Other Solids
Table A-2 (Continued)
STATISTICAL DATA FOR PRODUCERS ON THEWESTERN ORDER INCLUDED IN COMPONENT ANALYSIS
2002
16

Weighted Standard Number ofMonth Average Mean Deviation Median Minimum Maximum Observations
- % - - % - - % - - % - - % - - % -
January 3.73 3.77 0.27 3.73 3.29 4.91 110February 3.66 3.69 0.28 3.67 3.24 4.92 109March 3.59 3.61 0.27 3.58 3.16 4.78 108April 3.56 3.57 0.26 3.55 3.12 4.67 111May 3.56 3.58 0.26 3.55 3.09 4.69 108June 3.59 3.61 0.25 3.57 3.10 4.81 109July 3.59 3.61 0.26 3.56 3.05 4.70 108August 3.59 3.61 0.27 3.57 3.00 4.71 105September 3.64 3.67 0.26 3.64 2.99 4.76 107October 3.66 3.69 0.25 3.65 3.11 4.72 109November 3.70 3.73 0.28 3.68 3.12 4.87 107December 3.70 3.73 0.29 3.69 3.18 4.84 107
For the Year 3.63 3.65 0.27 3.62 2.99 4.92 1,298
Butterfat
Table A-3
STATISTICAL DATA FOR PRODUCERS ON THEARIZONA-LAS VEGAS ORDER INCLUDED IN COMPONENT ANALYSIS
2002
17
Region 1 No.* Region 2 No.* Region 3 No.* Region 4 No.* Region 5 No.*-% - -% - -% - -% - -% -
January 3.69 470 3.64 102 3.64 56 3.89 14 3.85 278February 3.71 470 3.63 102 3.65 56 3.86 14 3.85 278March 3.70 465 3.62 103 3.62 56 3.82 14 3.84 280April 3.66 466 3.55 102 3.58 56 3.79 14 3.83 281May 3.61 464 3.50 103 3.51 56 3.73 14 3.76 282June 3.56 461 3.46 105 3.48 57 3.67 14 3.72 282July 3.56 461 3.47 105 3.49 56 3.62 14 3.71 280August 3.59 457 3.49 106 3.51 56 3.68 14 3.76 281September 3.65 457 3.56 106 3.56 56 3.84 14 3.82 281October 3.72 456 3.67 107 3.67 55 3.97 14 3.90 282November 3.73 451 3.73 106 3.71 55 4.00 14 3.92 280December 3.70 450 3.68 107 3.63 54 3.92 13 3.87 274
For the Year 3.66 5,528 3.58 1,254 3.58 669 3.81 167 3.82 3,359
Region 6 No.* Region 7 No.* Region 8 No.* Region 9 No.* Region 10 No.*-% - -% - -% - -% - -% -
January 3.95 20 3.87 27 3.72 497 3.76 443 3.75 153February 3.95 21 3.80 22 3.71 361 3.69 435 3.69 152March 3.91 21 3.63 20 3.69 459 3.68 434 3.61 151April 3.85 21 3.73 30 3.61 479 3.59 450 3.57 162May 3.81 21 3.57 29 3.54 390 3.54 345 3.56 167June 3.81 21 3.57 29 3.50 393 3.50 348 3.57 174July 3.79 21 3.50 29 3.50 389 3.46 344 3.55 174August 3.83 22 3.55 29 3.52 390 3.51 348 3.56 178September 3.90 22 3.72 29 3.62 393 3.61 342 3.61 182October 4.00 22 3.86 29 3.72 392 3.71 346 3.64 184November 4.13 21 3.93 28 3.77 384 3.76 409 3.70 182December 4.08 21 3.92 28 3.72 384 3.74 401 3.71 185
For the Year 3.91 254 3.71 329 3.63 4,911 3.63 4,645 3.62 2,044
Butterfat
Table A-4
WEIGHTED AVERAGE COMPONENT LEVELS BY REGION2002
18
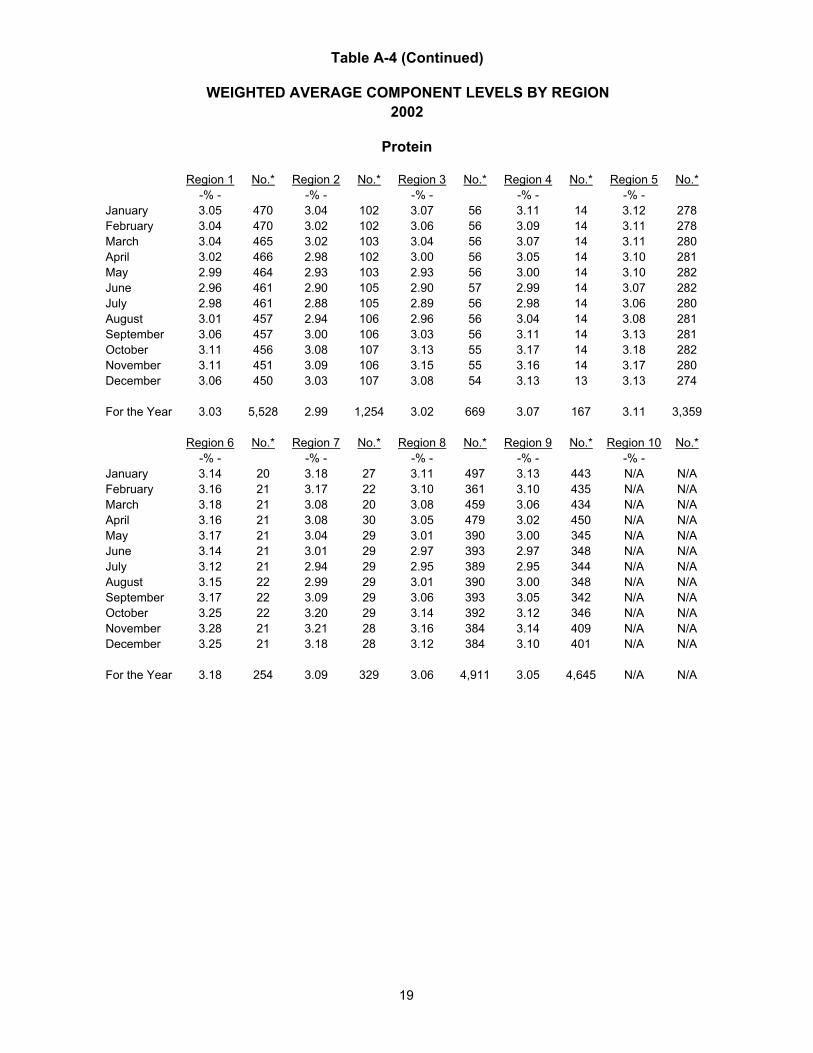
Region 1 No.* Region 2 No.* Region 3 No.* Region 4 No.* Region 5 No.*-% - -% - -% - -% - -% -
January 3.05 470 3.04 102 3.07 56 3.11 14 3.12 278February 3.04 470 3.02 102 3.06 56 3.09 14 3.11 278March 3.04 465 3.02 103 3.04 56 3.07 14 3.11 280April 3.02 466 2.98 102 3.00 56 3.05 14 3.10 281May 2.99 464 2.93 103 2.93 56 3.00 14 3.10 282June 2.96 461 2.90 105 2.90 57 2.99 14 3.07 282July 2.98 461 2.88 105 2.89 56 2.98 14 3.06 280August 3.01 457 2.94 106 2.96 56 3.04 14 3.08 281September 3.06 457 3.00 106 3.03 56 3.11 14 3.13 281October 3.11 456 3.08 107 3.13 55 3.17 14 3.18 282November 3.11 451 3.09 106 3.15 55 3.16 14 3.17 280December 3.06 450 3.03 107 3.08 54 3.13 13 3.13 274
For the Year 3.03 5,528 2.99 1,254 3.02 669 3.07 167 3.11 3,359
Region 6 No.* Region 7 No.* Region 8 No.* Region 9 No.* Region 10 No.*-% - -% - -% - -% - -% -
January 3.14 20 3.18 27 3.11 497 3.13 443 N/A N/AFebruary 3.16 21 3.17 22 3.10 361 3.10 435 N/A N/AMarch 3.18 21 3.08 20 3.08 459 3.06 434 N/A N/AApril 3.16 21 3.08 30 3.05 479 3.02 450 N/A N/AMay 3.17 21 3.04 29 3.01 390 3.00 345 N/A N/AJune 3.14 21 3.01 29 2.97 393 2.97 348 N/A N/AJuly 3.12 21 2.94 29 2.95 389 2.95 344 N/A N/AAugust 3.15 22 2.99 29 3.01 390 3.00 348 N/A N/ASeptember 3.17 22 3.09 29 3.06 393 3.05 342 N/A N/AOctober 3.25 22 3.20 29 3.14 392 3.12 346 N/A N/ANovember 3.28 21 3.21 28 3.16 384 3.14 409 N/A N/ADecember 3.25 21 3.18 28 3.12 384 3.10 401 N/A N/A
For the Year 3.18 254 3.09 329 3.06 4,911 3.05 4,645 N/A N/A
Table A-4 (Continued)
WEIGHTED AVERAGE COMPONENT LEVELS BY REGION2002
Protein
19

Region 1 No.* Region 2 No.* Region 3 No.* Region 4 No.* Region 5 No.*-% - -% - -% - -% - -% -
January 5.69 470 5.70 102 5.71 56 5.67 14 5.71 278February 5.69 470 5.70 102 5.71 56 5.68 14 5.72 278March 5.70 465 5.70 103 5.71 56 5.68 14 5.73 280April 5.72 466 5.74 102 5.75 56 5.70 14 5.76 281May 5.73 464 5.75 103 5.76 56 5.73 14 5.75 282June 5.70 461 5.73 105 5.74 57 5.70 14 5.75 282July 5.69 461 5.71 105 5.72 56 5.68 14 5.74 280August 5.68 457 5.71 106 5.72 56 5.66 14 5.72 281September 5.66 457 5.68 106 5.68 56 5.61 14 5.72 281October 5.65 456 5.67 107 5.68 55 5.61 14 5.71 282November 5.66 451 5.67 106 5.69 55 5.63 14 5.71 280December 5.67 450 5.67 107 5.69 54 5.64 13 5.72 274
For the Year 5.69 5,528 5.70 1,254 5.71 669 5.67 167 5.73 3,359
Region 6 No.* Region 7 No.* Region 8 No.* Region 9 No.* Region 10 No.*-% - -% - -% - -% - -% -
January 5.77 20 5.65 27 5.72 497 5.70 443 N/A N/AFebruary 5.80 21 5.67 22 5.73 361 5.73 435 N/A N/AMarch 5.76 21 5.70 20 5.74 459 5.73 434 N/A N/AApril 5.82 21 5.66 30 5.75 479 5.74 450 N/A N/AMay 5.81 21 5.72 29 5.76 390 5.73 345 N/A N/AJune 5.81 21 5.71 29 5.75 393 5.75 348 N/A N/AJuly 5.80 21 5.70 29 5.76 389 5.76 344 N/A N/AAugust 5.74 22 5.63 29 5.74 390 5.75 348 N/A N/ASeptember 5.75 22 5.60 29 5.71 393 5.71 342 N/A N/AOctober 5.74 22 5.58 29 5.70 392 5.69 346 N/A N/ANovember 5.80 21 5.60 28 5.71 384 5.70 409 N/A N/ADecember 5.80 21 5.63 28 5.71 384 5.72 401 N/A N/A
For the Year 5.78 254 5.66 329 5.73 4,911 5.73 4,645 N/A N/A
* Number of producers included in monthly average component level.N/A = not applicable, Arizona-Las Vegas Order, Area 10, did not use protein and other solids.
Other Solids
Table A-4 (Continued)
WEIGHTED AVERAGE COMPONENT LEVELS BY REGION2002
20

c bButterfat Standard R-Squared Standard Number of
Constant Coefficient Error of b (Adjusted) Error Comparisons
January 1.46570 0.43494 0.01013 0.61193 0.12173 1,170February 1.55038 0.40523 0.00990 0.61836 0.11157 1,035March 1.57373 0.40373 0.00996 0.58681 0.11606 1,157April 1.58468 0.39900 0.00978 0.58856 0.11474 1,164May 1.43225 0.44092 0.01100 0.62303 0.11787 972June 1.44585 0.43271 0.00994 0.66074 0.10494 974July 1.38598 0.44933 0.01002 0.67503 0.10326 968August 1.50600 0.42010 0.00996 0.64473 0.10585 980September 1.55223 0.41280 0.00983 0.64348 0.10874 977October 1.56543 0.41504 0.00935 0.66708 0.10971 983November 1.53730 0.41854 0.00986 0.64998 0.11800 970December 1.51319 0.41747 0.00987 0.64822 0.11464 971
For the Year 1.48792 0.42632 0.00283 0.64860 0.11373 12,321
c bButterfat Standard R-Squared Standard Number of
Constant Coefficient Error of b (Adjusted) Error Comparisons
January 1.46705 0.45102 0.01439 0.55739 0.11922 780February 1.49711 0.44103 0.01524 0.52215 0.12195 767March 1.69562 0.38399 0.01481 0.47661 0.12285 738April 1.72860 0.37057 0.01486 0.44174 0.11617 786May 1.68578 0.38189 0.01607 0.41629 0.11792 791June 1.71330 0.37287 0.01687 0.37871 0.12370 801July 1.77125 0.35244 0.01834 0.31636 0.13152 797August 1.82217 0.34687 0.01636 0.36063 0.12451 796September 1.76323 0.36859 0.01578 0.40582 0.12547 798October 1.67184 0.40504 0.01646 0.43230 0.13867 795November 1.72414 0.39145 0.01531 0.43387 0.13879 853December 1.89689 0.33884 0.01516 0.37304 0.14821 839
For the Year 1.59155 0.41466 0.00430 0.49333 0.13106 9,541
Western Order
2002
Table A-5
LINEAR RELATIONSHIPS BETWEEN VARIOUS MILK COMPONENTS
Butterfat Levels as a Predictor of Protein
Pacific Northwest Order
Protein = c + b (Butterfat)
21

Pacific Northwest Western Order Order
Butterfat Protein Other Solids Producer Price Producer PriceMonth Price Price Price Differential 1/ Differential 1/
$ / pound $ / pound $ / pound $ / hundredweight $ / hundredweight
January 1.4846 1.9660 0.1392 0.66 0.57February 1.3817 2.0884 0.0965 0.51 0.46March 1.3638 1.8342 0.0688 1.08 0.91April 1.2890 2.0109 0.0566 0.79 0.69May 1.1433 2.2097 0.0371 0.53 0.49June 1.1211 2.0148 0.0247 0.91 0.78July 1.0929 1.8095 0.0150 1.33 0.93August 1.0701 1.9021 0.0177 1.12 0.81September 1.0099 2.0646 0.0367 0.74 0.63October 1.0726 2.1839 0.0755 0.22 0.29November 1.0923 1.8469 0.0850 1.00 0.81December 1.1922 1.7506 0.0584 1.07 0.76
Simple Average 1.1928 1.9735 0.0593 0.83 0.68
Skim ButterfatMonth Price 2/ Price 2/
$ / hundredweight $ / pound
January 7.93 1.4742February 7.82 1.4030March 7.38 1.3683April 7.48 1.3071May 7.64 1.1807June 7.52 1.1326July 7.24 1.1085August 7.51 1.0828September 7.70 1.0296October 7.94 1.0626November 7.60 1.0884December 7.20 1.1767
Simple Average 7.58 1.20122/ The producer prices for the Arizona-Las Vegas Order are subject to applicable location adjustments. The effects of the location adjustments are not dealt with in this study.
MONTHLY PRODUCER COMPONENT PRICES
Table A-6
Pacific Northwest
Arizona-Las Vegas Order
and Western Order
2002
1/ The producer price differentials for the Pacific Northwest and Western Orders are subject to applicable location adjustments. The effects of the location adjustments are not dealt with in this study.
22
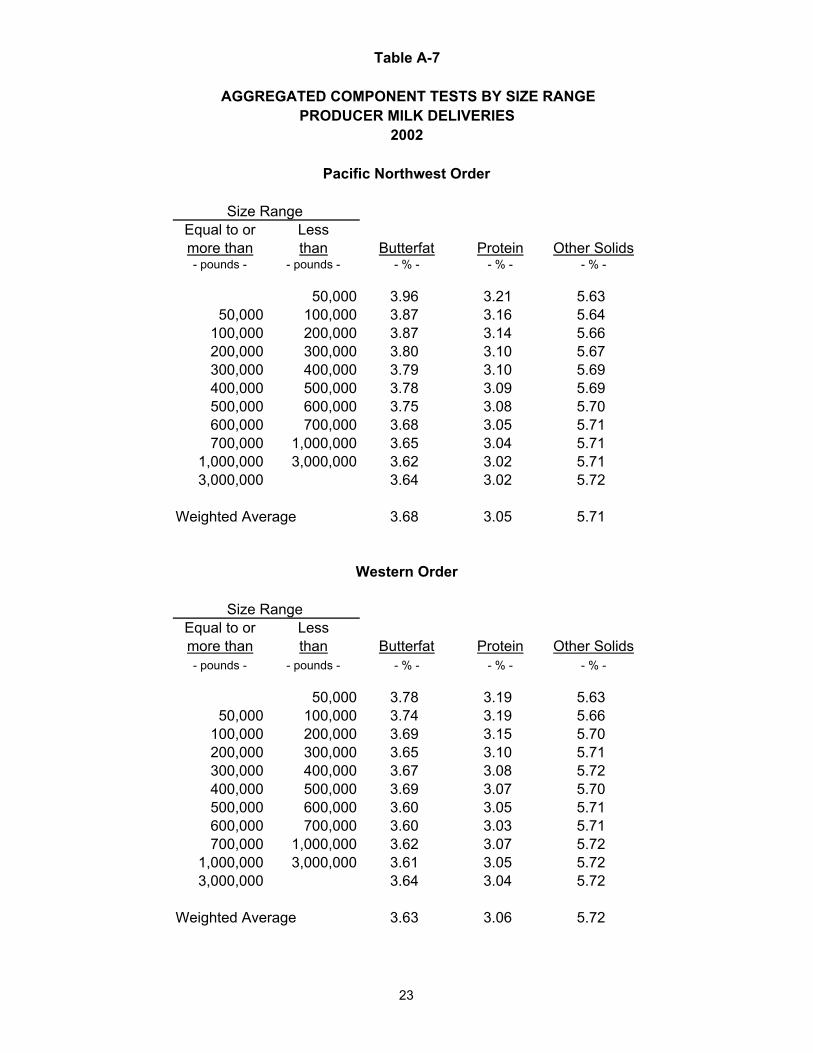
Equal to or Lessmore than than Butterfat Protein Other Solids- pounds - - pounds - - % - - % - - % -
50,000 3.96 3.21 5.6350,000 100,000 3.87 3.16 5.64
100,000 200,000 3.87 3.14 5.66200,000 300,000 3.80 3.10 5.67300,000 400,000 3.79 3.10 5.69400,000 500,000 3.78 3.09 5.69500,000 600,000 3.75 3.08 5.70600,000 700,000 3.68 3.05 5.71700,000 1,000,000 3.65 3.04 5.71
1,000,000 3,000,000 3.62 3.02 5.713,000,000 3.64 3.02 5.72
Weighted Average 3.68 3.05 5.71
Equal to or Lessmore than than Butterfat Protein Other Solids- pounds - - pounds - - % - - % - - % -
50,000 3.78 3.19 5.6350,000 100,000 3.74 3.19 5.66
100,000 200,000 3.69 3.15 5.70200,000 300,000 3.65 3.10 5.71300,000 400,000 3.67 3.08 5.72400,000 500,000 3.69 3.07 5.70500,000 600,000 3.60 3.05 5.71600,000 700,000 3.60 3.03 5.71700,000 1,000,000 3.62 3.07 5.72
1,000,000 3,000,000 3.61 3.05 5.723,000,000 3.64 3.04 5.72
Weighted Average 3.63 3.06 5.72
Western Order
Size Range
Pacific Northwest Order
Size Range
Table A-7
AGGREGATED COMPONENT TESTS BY SIZE RANGEPRODUCER MILK DELIVERIES
2002
23
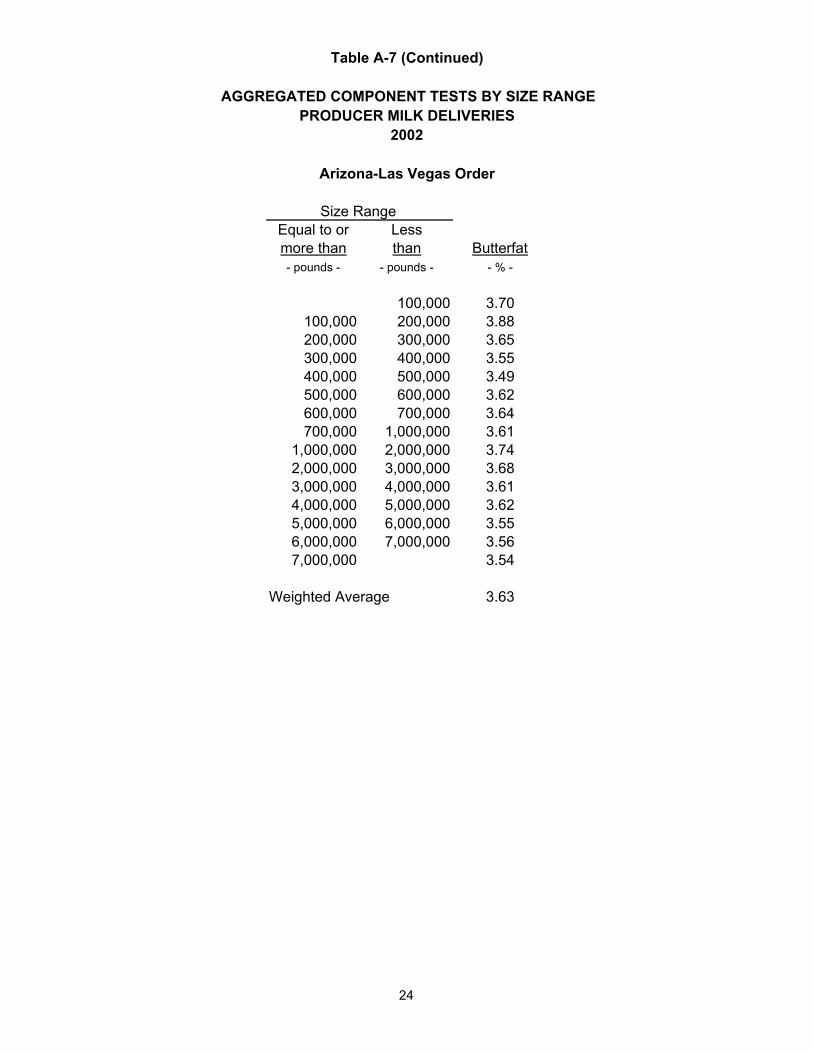
Equal to or Lessmore than than Butterfat- pounds - - pounds - - % -
100,000 3.70100,000 200,000 3.88200,000 300,000 3.65300,000 400,000 3.55400,000 500,000 3.49500,000 600,000 3.62600,000 700,000 3.64700,000 1,000,000 3.61
1,000,000 2,000,000 3.742,000,000 3,000,000 3.683,000,000 4,000,000 3.614,000,000 5,000,000 3.625,000,000 6,000,000 3.556,000,000 7,000,000 3.567,000,000 3.54
Weighted Average 3.63
Size Range
Arizona-Las Vegas Order
Table A-7 (Continued)
AGGREGATED COMPONENT TESTS BY SIZE RANGEPRODUCER MILK DELIVERIES
2002
24

Percent of WeightedEqual to or Less Producer Averagemore than than Milk Value- pounds - - pounds - - dollars - - pounds - - % - - dollars/cwt. -
50,000 3,360,018.78$ 26,901,343 0.34% 12.4950,000 100,000 10,145,748.43 83,585,624 1.07% 12.14
100,000 200,000 41,098,652.77 341,633,874 4.37% 12.03200,000 300,000 50,779,421.44 429,166,686 5.48% 11.83300,000 400,000 44,633,958.15 378,217,868 4.83% 11.80400,000 500,000 45,262,822.23 384,065,984 4.91% 11.79500,000 600,000 43,399,647.54 370,205,873 4.73% 11.72600,000 700,000 37,499,752.16 324,466,918 4.15% 11.56700,000 1,000,000 99,073,109.41 857,560,253 10.96% 11.55
1,000,000 3,000,000 345,537,457.35 3,023,276,511 38.64% 11.433,000,000 183,555,511.75 1,605,549,175 20.52% 11.43
Total/Weighted Average 904,346,100.02$ 7,824,630,109 100.00% 11.56
Percent of WeightedEqual to or Less Producer Averagemore than than Milk Value- pounds - - pounds - - dollars - - pounds - - % - - dollars/cwt. -
50,000 3,612,426.01$ 30,305,638 0.55% 11.9250,000 100,000 13,893,612.36 117,470,761 2.12% 11.83
100,000 200,000 35,713,945.54 308,336,067 5.56% 11.58200,000 300,000 25,598,299.40 223,509,539 4.03% 11.45300,000 400,000 19,966,655.31 174,678,672 3.15% 11.43400,000 500,000 21,483,410.08 188,234,011 3.40% 11.41500,000 600,000 19,368,600.29 171,468,213 3.09% 11.30600,000 700,000 17,528,551.62 154,201,389 2.78% 11.37700,000 1,000,000 69,375,772.78 610,460,817 11.02% 11.36
1,000,000 3,000,000 237,593,105.84 2,092,996,488 37.77% 11.353,000,000 167,412,220.22 1,469,580,743 26.52% 11.39
Total/Weighted Average 631,546,599.46$ 5,541,242,338 100.00% 11.40
Component Values* Milk
Western Order
Size Range Aggregated Producer
Size Range Aggregated
Component Values* MilkProducer
Table A-8
AGGREGATED COMPONENT VALUES BY SIZE RANGE
2002
Pacific Northwest Order
PRODUCER MILK DELIVERIES
25

Percent of WeightedEqual to or Less Producer Averagemore than than Milk Value- pounds - - pounds - - dollars - - pounds - - % - - dollars/cwt. -
100,000 117,331.73$ 976,417 0.03% 12.02100,000 200,000 291,265.06 2,459,630 0.08% 11.84200,000 300,000 632,695.28 5,539,959 0.18% 11.42300,000 400,000 928,060.39 8,137,385 0.27% 11.40400,000 500,000 1,735,874.56 14,937,931 0.49% 11.62500,000 600,000 3,970,523.39 34,582,165 1.14% 11.48600,000 700,000 2,955,168.64 25,286,662 0.84% 11.69700,000 1,000,000 15,512,190.42 132,505,544 4.38% 11.71
1,000,000 2,000,000 58,891,711.29 503,109,973 16.62% 11.712,000,000 3,000,000 83,712,113.19 710,328,074 23.47% 11.783,000,000 4,000,000 44,069,295.81 375,596,389 12.41% 11.734,000,000 5,000,000 34,550,016.51 296,467,284 9.80% 11.655,000,000 6,000,000 26,621,035.37 227,880,078 7.53% 11.686,000,000 7,000,000 15,437,211.92 134,406,211 4.44% 11.497,000,000 64,365,382.59 554,342,075 18.32% 11.61
Total/Weighted Average 353,789,876.16$ 3,026,555,777 100.00% 11.69
* Based on Federal order minimum prices. Producer prices for the three orders are subject to location adjustments.The effects of the location adjustments are not dealt with in this study.
Component Values* Milk
2002PRODUCER MILK DELIVERIES
ProducerAggregated Size Range
Arizona-Las Vegas Order
Table A-8 (Continued)
AGGREGATED COMPONENT VALUES BY SIZE RANGE
26
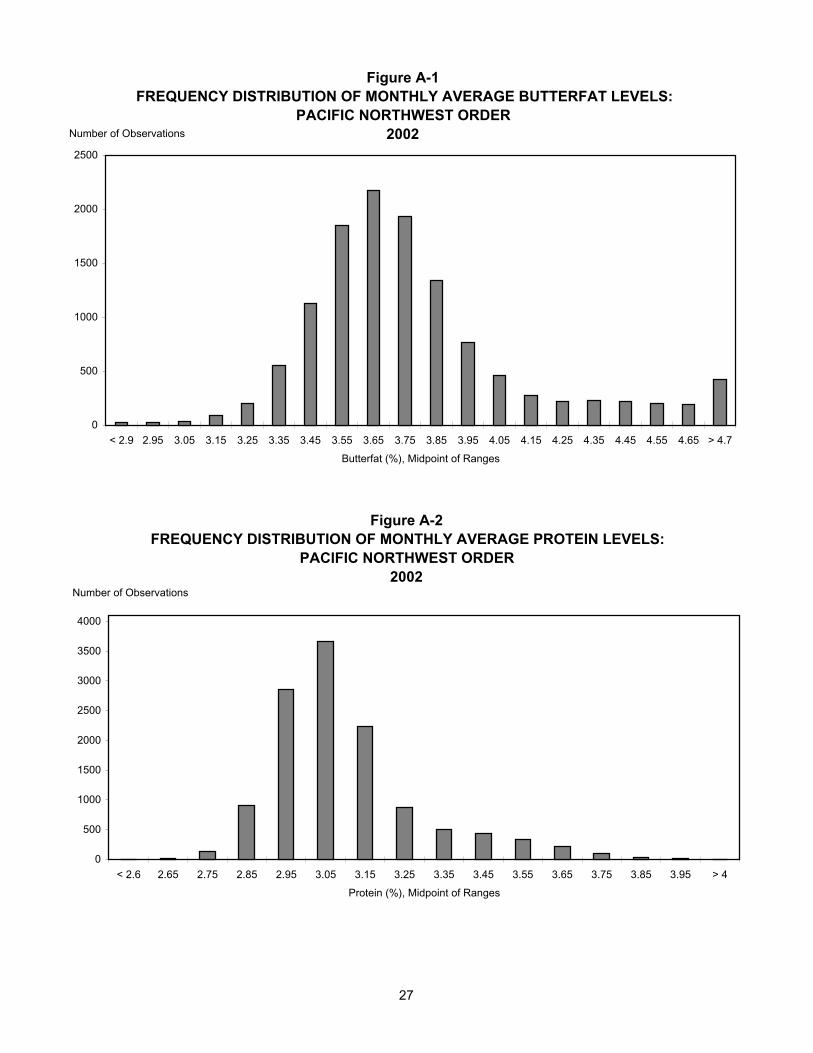
Figure A-1FREQUENCY DISTRIBUTION OF MONTHLY AVERAGE BUTTERFAT LEVELS:
PACIFIC NORTHWEST ORDER 2002
0
500
1000
1500
2000
2500
< 2.9 2.95 3.05 3.15 3.25 3.35 3.45 3.55 3.65 3.75 3.85 3.95 4.05 4.15 4.25 4.35 4.45 4.55 4.65 > 4.7
Butterfat (%), Midpoint of Ranges
Number of Observations
Figure A-2FREQUENCY DISTRIBUTION OF MONTHLY AVERAGE PROTEIN LEVELS:
PACIFIC NORTHWEST ORDER2002
0
500
1000
1500
2000
2500
3000
3500
4000
< 2.6 2.65 2.75 2.85 2.95 3.05 3.15 3.25 3.35 3.45 3.55 3.65 3.75 3.85 3.95 > 4
Protein (%), Midpoint of Ranges
Number of Observations
27
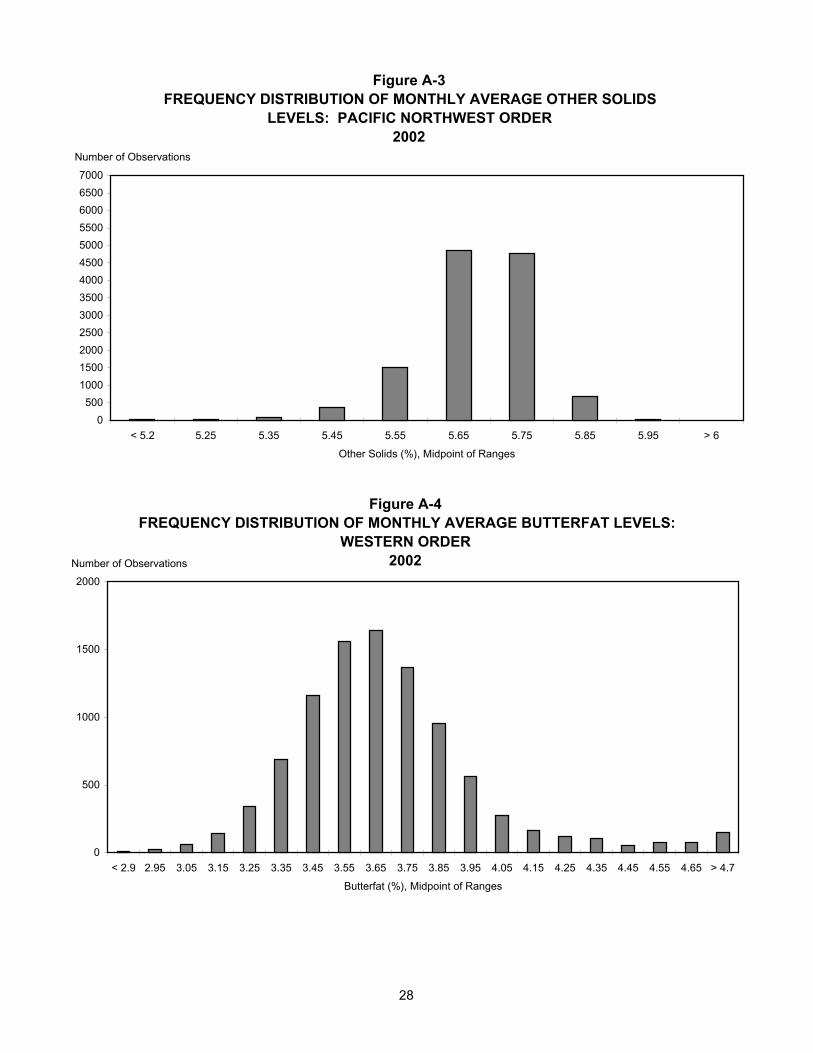
Figure A-3FREQUENCY DISTRIBUTION OF MONTHLY AVERAGE OTHER SOLIDS
LEVELS: PACIFIC NORTHWEST ORDER2002
0500
1000150020002500300035004000450050005500600065007000
< 5.2 5.25 5.35 5.45 5.55 5.65 5.75 5.85 5.95 > 6
Other Solids (%), Midpoint of Ranges
Number of Observations
Figure A-4FREQUENCY DISTRIBUTION OF MONTHLY AVERAGE BUTTERFAT LEVELS:
WESTERN ORDER2002
0
500
1000
1500
2000
< 2.9 2.95 3.05 3.15 3.25 3.35 3.45 3.55 3.65 3.75 3.85 3.95 4.05 4.15 4.25 4.35 4.45 4.55 4.65 > 4.7
Butterfat (%), Midpoint of Ranges
Number of Observations
28

Figure A-5FREQUENCY DISTRIBUTION OF MONTHLY AVERAGE PROTEIN LEVELS:
WESTERN ORDER2002
0
500
1000
1500
2000
2500
3000
< 2.6 2.65 2.75 2.85 2.95 3.05 3.15 3.25 3.35 3.45 3.55 3.65 3.75 3.85 3.95 > 4
Protein (%), Midpoint of Ranges
Number of Observations
Figure A-6FREQUENCY DISTRIBUTION OF MONTHLY AVERAGE OTHER SOLIDS
LEVELS: WESTERN ORDER2002
0
500
1000
1500
2000
2500
3000
3500
4000
4500
< 5.2 5.25 5.35 5.45 5.55 5.65 5.75 5.85 5.95 > 6
Other Solids (%), Midpoint of Ranges
Number of Observations
29
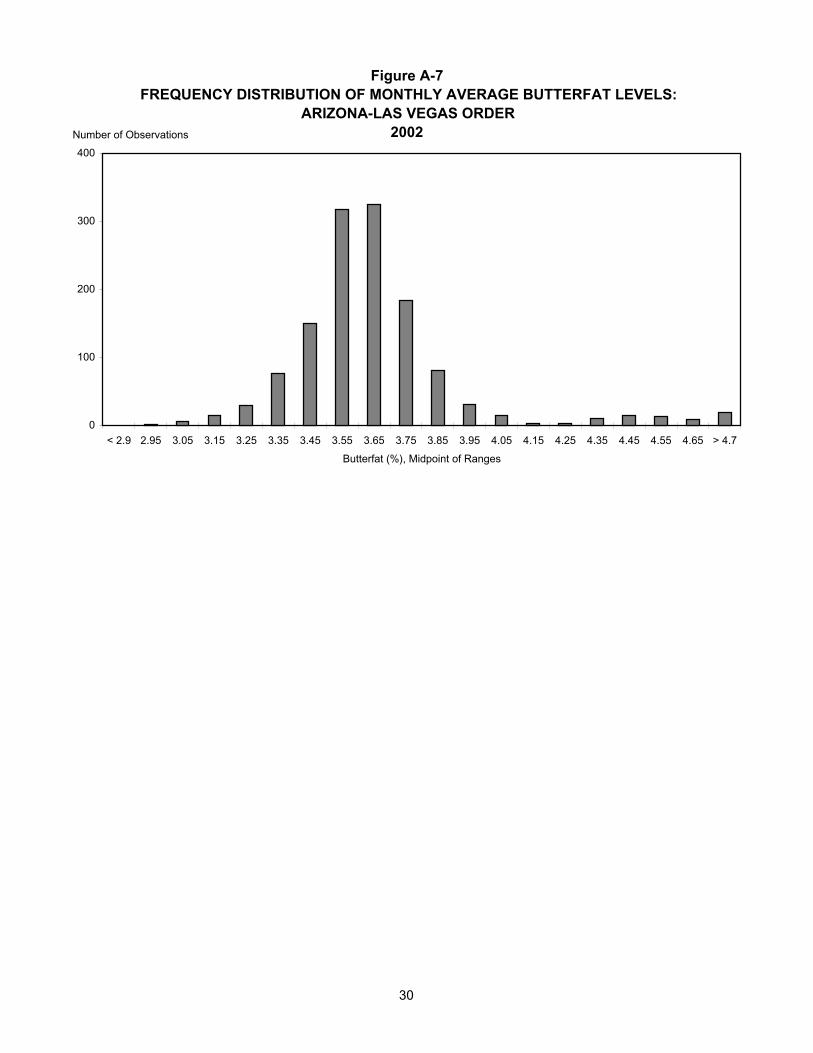
Figure A-7FREQUENCY DISTRIBUTION OF MONTHLY AVERAGE BUTTERFAT LEVELS:
ARIZONA-LAS VEGAS ORDER2002
0
100
200
300
400
< 2.9 2.95 3.05 3.15 3.25 3.35 3.45 3.55 3.65 3.75 3.85 3.95 4.05 4.15 4.25 4.35 4.45 4.55 4.65 > 4.7
Butterfat (%), Midpoint of Ranges
Number of Observations
30

Figure A-8SCATTER PLOT OF PROTEIN AND BUTTERFAT
MAY AND NOVEMBER 2002Pacific Northwest Order
May 2002 972 observations: %Protein = 1.43 + (0.441 * %Butterfat)
2.00
2.50
3.00
3.50
4.00
4.50
2.50 3.00 3.50 4.00 4.50 5.00 5.50 6.00
Butterfat (%)
Protein (%)
November 2002970 observations: %Protein = 1.54 + (0.419 * %Butterfat)
2.00
2.50
3.00
3.50
4.00
4.50
2.50 3.00 3.50 4.00 4.50 5.00 5.50 6.00Butterfat (%)
Protein (%)
31

Figure A-9SCATTER PLOT OF PROTEIN AND BUTTERFAT
MAY AND NOVEMBER 2002Western Order
May 2002791 observations: %Protein = 1.69 + (0.382 * %Butterfat)
2.00
2.50
3.00
3.50
4.00
4.50
2.50 3.00 3.50 4.00 4.50 5.00 5.50 6.00
Butterfat (%)
Protein (%)
November 2002853 observations: %Protein = 1.72 + (0.391 * %Butterfat)
2.00
2.50
3.00
3.50
4.00
4.50
2.50 3.00 3.50 4.00 4.50 5.00 5.50 6.00Butterfat (%)
Protein (%)
32

Figure A-10SCATTER PLOT OF OTHER SOLIDS AND BUTTERFAT
MAY AND NOVEMBER 2002Pacific Northwest Order
May 2002972 observations: %Other Solids = 5.85 + (-0.035 * %Butterfat)
5.00
5.50
6.00
6.50
2.50 3.00 3.50 4.00 4.50 5.00 5.50 6.00
Butterfat (%)
Other Solids (%)
November 2002970 observations: %Other Solids = 5.92 + (-0.070 * %Butterfat)
5.00
5.50
6.00
6.50
2.50 3.00 3.50 4.00 4.50 5.00 5.50 6.00Butterfat (%)
Other Solids (%)
33

Figure A-11SCATTER PLOT OF OTHER SOLIDS AND BUTTERFAT
MAY AND NOVEMBER 2002Western Order
May 2001791 observations: %Other Solids = 5.64 + (0.023 * %Butterfat)
5.00
5.50
6.00
6.50
2.50 3.00 3.50 4.00 4.50 5.00 5.50 6.00
Butterfat (%)
Other Solids (%)
November 2002853 observations: %Other Solids = 5.88 + (-0.059 * %Butterfat)
5.00
5.50
6.00
6.50
2.50 3.00 3.50 4.00 4.50 5.00 5.50 6.00Butterfat (%)
Other Solids (%)
34
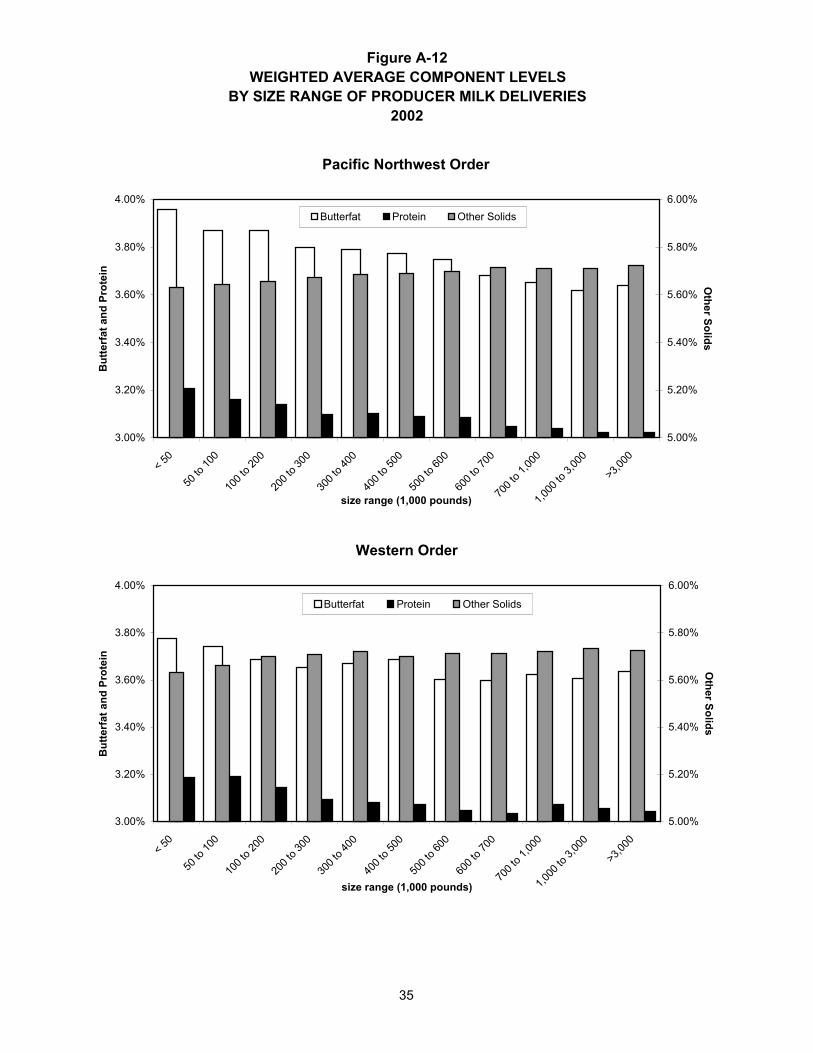
Figure A-12WEIGHTED AVERAGE COMPONENT LEVELS
BY SIZE RANGE OF PRODUCER MILK DELIVERIES2002
Pacific Northwest Order
3.00%
3.20%
3.40%
3.60%
3.80%
4.00%
< 50
50 to
100
100 t
o 200
200 t
o 300
300 t
o 400
400 t
o 500
500 t
o 600
600 t
o 700
700 t
o 1,00
0
1,000
to 3,
000
>3,000
size range (1,000 pounds)
But
terf
at a
nd P
rote
in
5.00%
5.20%
5.40%
5.60%
5.80%
6.00%
Other Solids
Butterfat Protein Other Solids
Western Order
3.00%
3.20%
3.40%
3.60%
3.80%
4.00%
< 50
50 to
100
100 t
o 200
200 t
o 300
300 t
o 400
400 t
o 500
500 t
o 600
600 t
o 700
700 t
o 1,00
0
1,000
to 3,
000
>3,000
size range (1,000 pounds)
But
terf
at a
nd P
rote
in
5.00%
5.20%
5.40%
5.60%
5.80%
6.00%
Other Solids
Butterfat Protein Other Solids
35
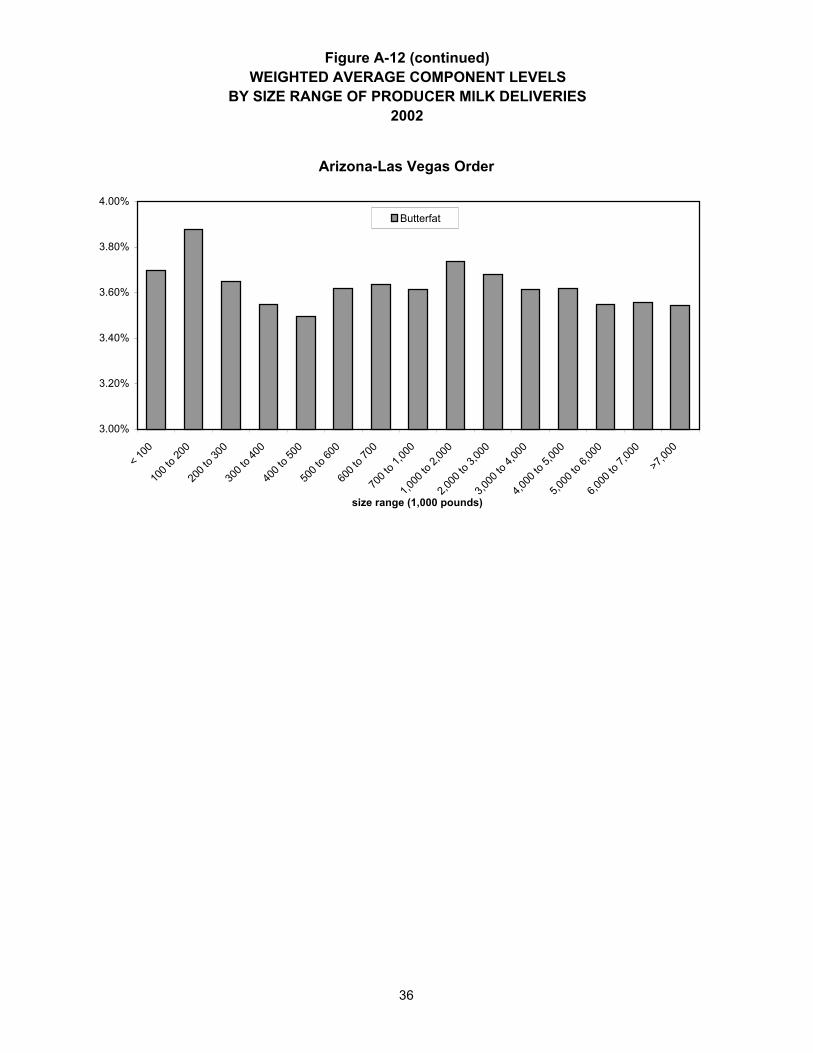
Figure A-12 (continued)WEIGHTED AVERAGE COMPONENT LEVELS
BY SIZE RANGE OF PRODUCER MILK DELIVERIES2002
Arizona-Las Vegas Order
3.00%
3.20%
3.40%
3.60%
3.80%
4.00%
< 100
100 t
o 200
200 t
o 300
300 t
o 400
400 t
o 500
500 t
o 600
600 t
o 700
700 t
o 1,00
0
1,000
to 2,
000
2,000
to 3,
000
3,000
to 4,
000
4,000
to 5,
000
5,000
to 6,
000
6,000
to 7,
000
>7,000
size range (1,000 pounds)
Butterfat
36

Figure A-13WEIGHTED AVERAGE VALUES AND PERCENT OF PRODUCER MILK
BY SIZE RANGE OF PRODUCER MILK DELIVERIES2002
Pacific Northwest Order
10.80
11.00
11.20
11.40
11.60
11.80
12.00
12.20
12.40
12.60
< 50
50 to
100
100 t
o 200
200 t
o 300
300 t
o 400
400 t
o 500
500 t
o 600
600 t
o 700
700 t
o 1,00
0
1,000
to 3,
000
>3,000
size range (1,000 pounds)
$/cwt.
0%
5%
10%
15%
20%
25%
30%
35%
40%
45%
% of producer m
ilk
Value Per Cwt Percent of Producer Milk
Western Order
10.90
11.00
11.10
11.20
11.30
11.40
11.50
11.60
11.70
11.80
11.90
12.00
< 50
50 to
100
100 t
o 200
200 t
o 300
300 t
o 400
400 t
o 500
500 t
o 600
600 t
o 700
700 t
o 1,00
0
1,000
to 3,
000
>3,000
size range (1,000 pounds)
$/cwt.
0%
5%
10%
15%
20%
25%
30%
35%
40%
% of producer m
ilk
Value Per Cwt Percent of Producer Milk
37

Figure A-13 (continued)WEIGHTED AVERAGE VALUES AND PERCENT OF PRODUCER MILK
BY SIZE RANGE OF PRODUCER MILK DELIVERIES2002
Arizona-Las Vegas Order
10.80
11.00
11.20
11.40
11.60
11.80
12.00
12.20
12.40
12.60
12.80
< 100
100 t
o 200
200 t
o 300
300 t
o 400
400 t
o 500
500 t
o 600
600 t
o 700
700 t
o 1,00
0
1,000
to 2,
000
2,000
to 3,
000
3,000
to 4,
000
4,000
to 5,
000
5,000
to 6,
000
6,000
to 7,
000
>7,000
size range (1,000 pounds)
$/cwt.
0%
5%
10%
15%
20%
25%
30%
% of producer m
ilk
Value Per Cwt Percent of Producer Milk
38

Pacific Northwest124
Arizona-Las Vegas131
Western135
MAP A-1Marketing Areas of the Pacific Northwest (FO 124), Arizona-Las Vegas (FO 131), and Western (FO 135) Federal Orders
39

1
10
5
9
6 78
24
3
Map A-2Geographic Regions Encompassing the Pacific Northwest,
Arizona-Las Vegas, and Western Order Milksheds
40
Related Documents