Analysis of Complex Survey Data Day 2: Univariate and Bivariate analysis

Analysis of Complex Survey Data Day 2: Univariate and Bivariate analysis.
Mar 31, 2015
Welcome message from author
This document is posted to help you gain knowledge. Please leave a comment to let me know what you think about it! Share it to your friends and learn new things together.
Transcript
Analysis of Complex Survey Data
Day 2: Univariate and Bivariate analysis
Today’s schedule
• Part I: Introduction to SUDAAN– Specifying the study design and design options
• PART II: Introduction to – PROC RECORDS– PROC CROSSTAB – PROC DESCRIPT
SUDAAN
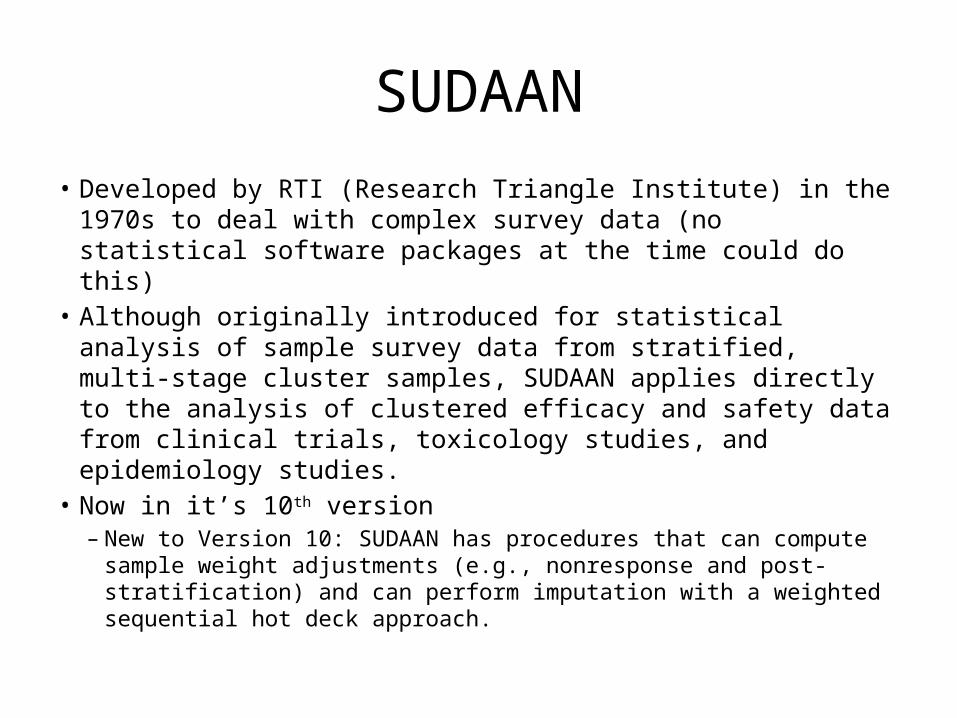
• Developed by RTI (Research Triangle Institute) in the 1970s to deal with complex survey data (no statistical software packages at the time could do this)
• Although originally introduced for statistical analysis of sample survey data from stratified, multi-stage cluster samples, SUDAAN applies directly to the analysis of clustered efficacy and safety data from clinical trials, toxicology studies, and epidemiology studies.
• Now in it’s 10th version– New to Version 10: SUDAAN has procedures that can compute sample
weight adjustments (e.g., nonresponse and post-stratification) and can perform imputation with a weighted sequential hot deck approach.
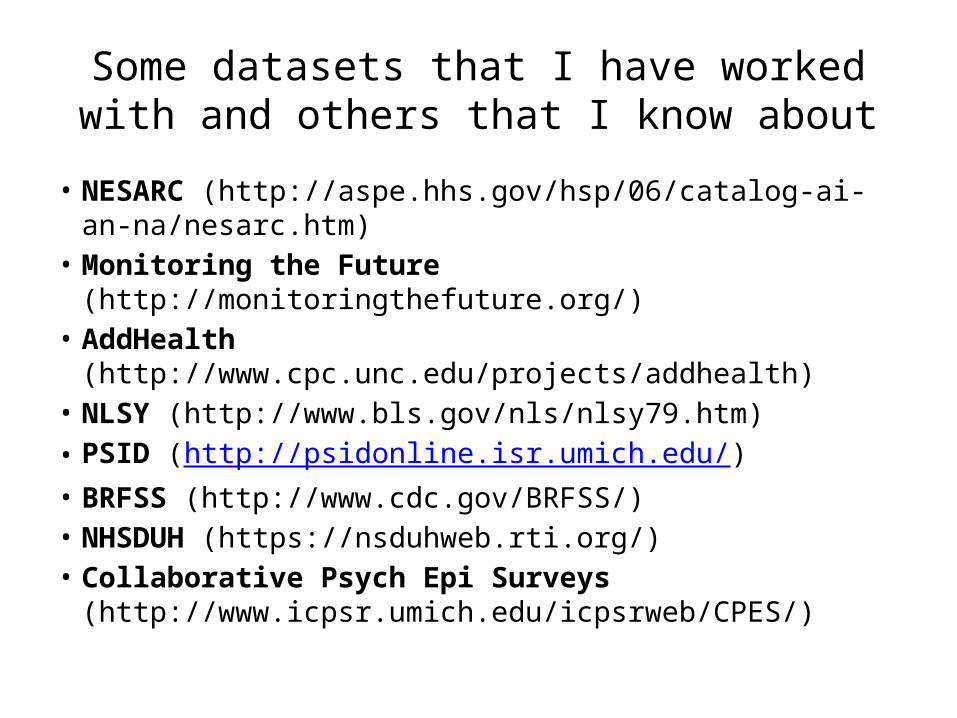
Some datasets that I have worked with and others that I know about
• NESARC (http://aspe.hhs.gov/hsp/06/catalog-ai-an-na/nesarc.htm)
• Monitoring the Future (http://monitoringthefuture.org/)• AddHealth (http://www.cpc.unc.edu/projects/addhealth)• NLSY (http://www.bls.gov/nls/nlsy79.htm)• PSID (http://psidonline.isr.umich.edu/)• BRFSS (http://www.cdc.gov/BRFSS/)• NHSDUH (https://nsduhweb.rti.org/)• Collaborative Psych Epi Surveys
(http://www.icpsr.umich.edu/icpsrweb/CPES/)
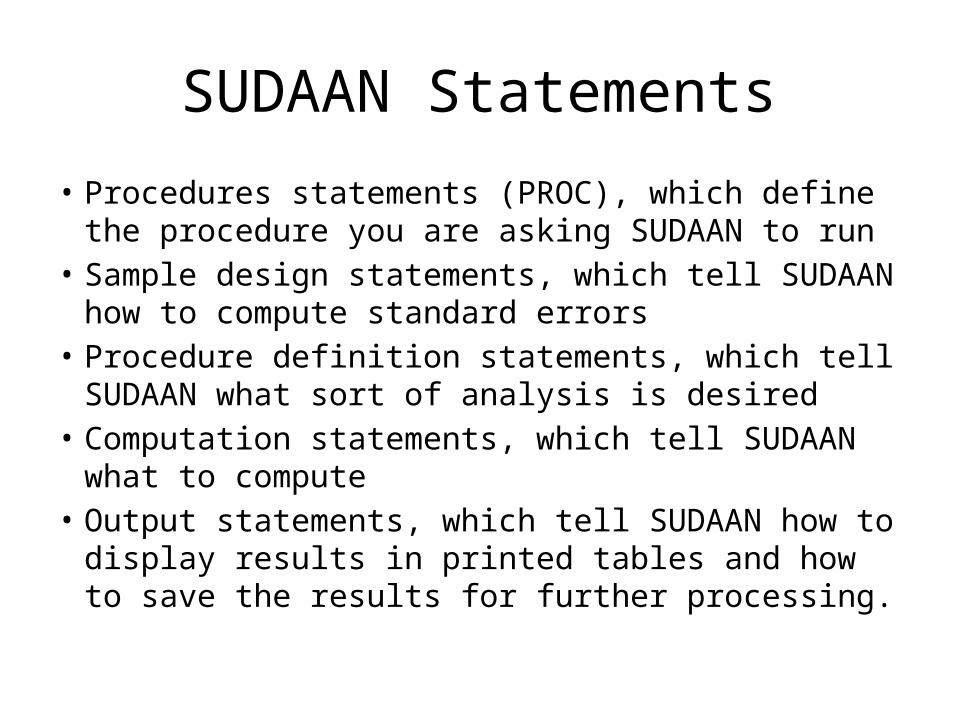
SUDAAN Statements
• Procedures statements (PROC), which define the procedure you are asking SUDAAN to run
• Sample design statements, which tell SUDAAN how to compute standard errors
• Procedure definition statements, which tell SUDAAN what sort of analysis is desired
• Computation statements, which tell SUDAAN what to compute
• Output statements, which tell SUDAAN how to display results in printed tables and how to save the results for further processing.

Specifying your study design
• The choice of study design in SUDAAN is very important when analyzing correlated data. It is only through the correct study design choice that you will compute correct standard errors.
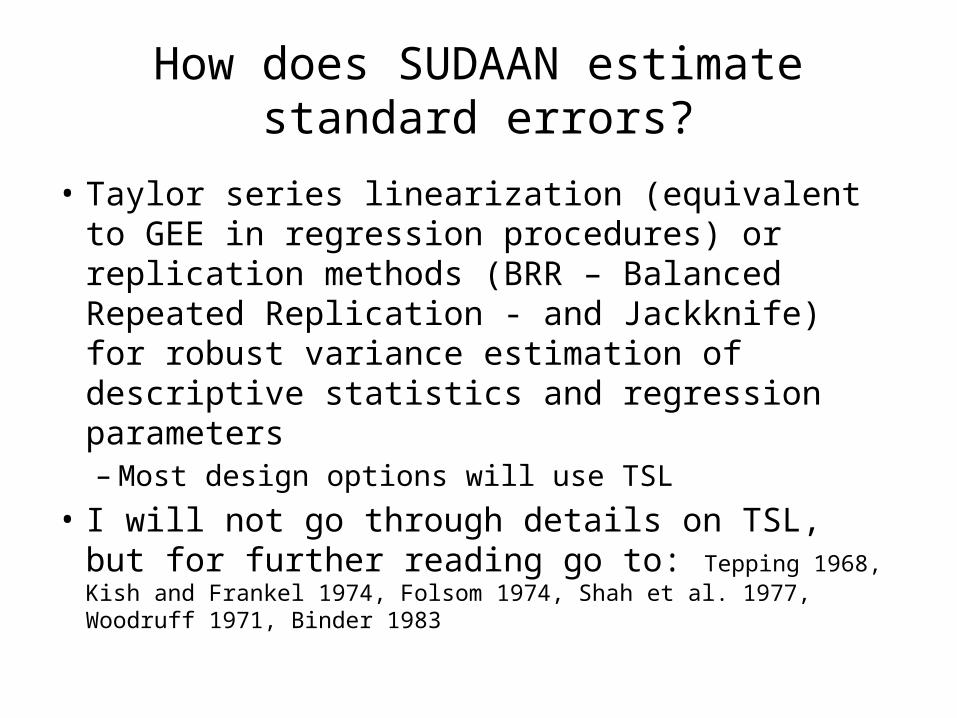
How does SUDAAN estimate standard errors?
• Taylor series linearization (equivalent to GEE in regression procedures) or replication methods (BRR – Balanced Repeated Replication - and Jackknife) for robust variance estimation of descriptive statistics and regression parameters– Most design options will use TSL
• I will not go through details on TSL, but for further reading go to: Tepping 1968, Kish and Frankel 1974, Folsom 1974, Shah et al. 1977, Woodruff 1971, Binder 1983
Specifying your study design
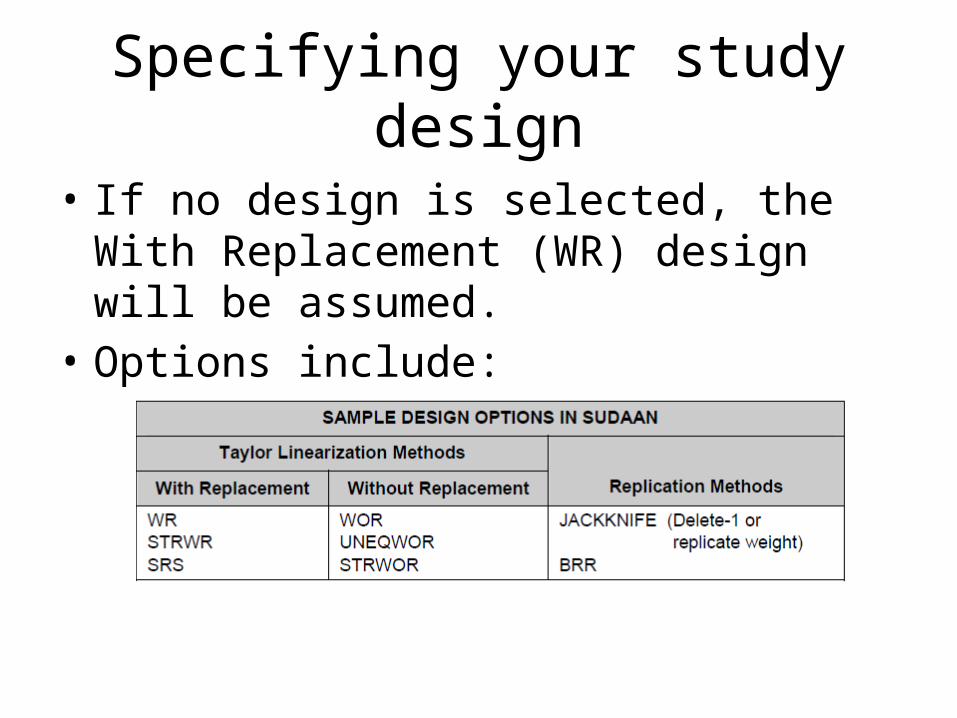
• If no design is selected, the With Replacement (WR) design will be assumed.
• Options include:
Specifying your study designWith Replacement options
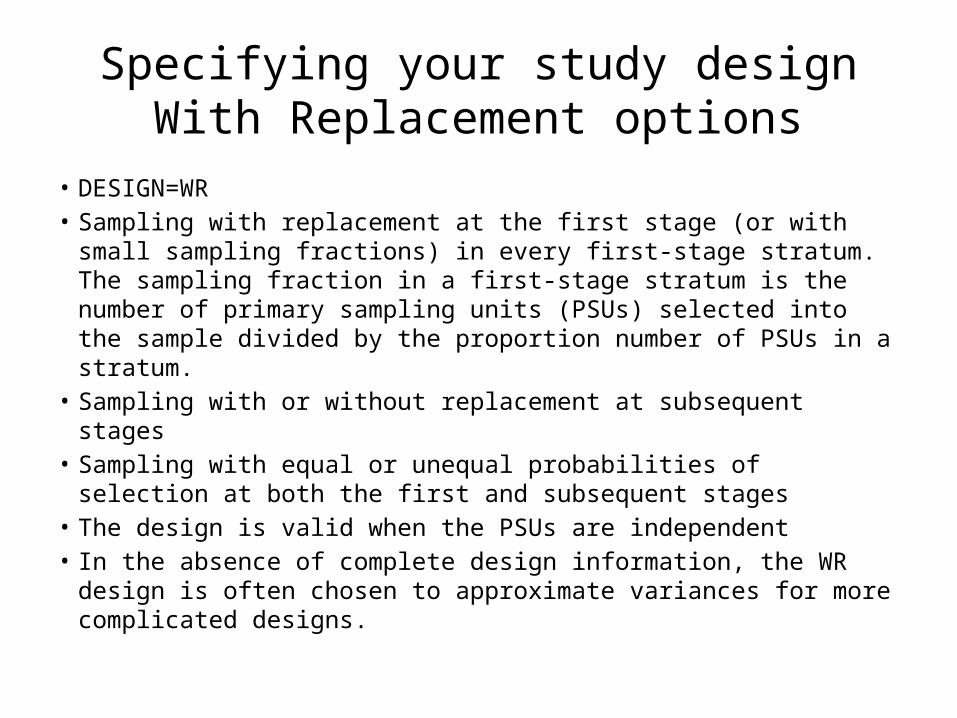
• DESIGN=WR• Sampling with replacement at the first stage (or with small sampling
fractions) in every first-stage stratum. The sampling fraction in a first-stage stratum is the number of primary sampling units (PSUs) selected into the sample divided by the proportion number of PSUs in a stratum.
• Sampling with or without replacement at subsequent stages• Sampling with equal or unequal probabilities of selection at both the
first and subsequent stages• The design is valid when the PSUs are independent• In the absence of complete design information, the WR design is
often chosen to approximate variances for more complicated designs.
Equal versus unequal selection probabilities?
• For most surveys, each PSU has an equal probability of selection within each stratum. However, there may be cases in which selection probabilities are unequal.
• For example, lower selection probabilities may be assigned to units with higher data collection costs and higher selection probabilities to PSUs from small subpopulations of particular interest.
• These design probabilities are a feature of the survey design and are assumed known before data analysis.
Specifying your study designWith Replacement options
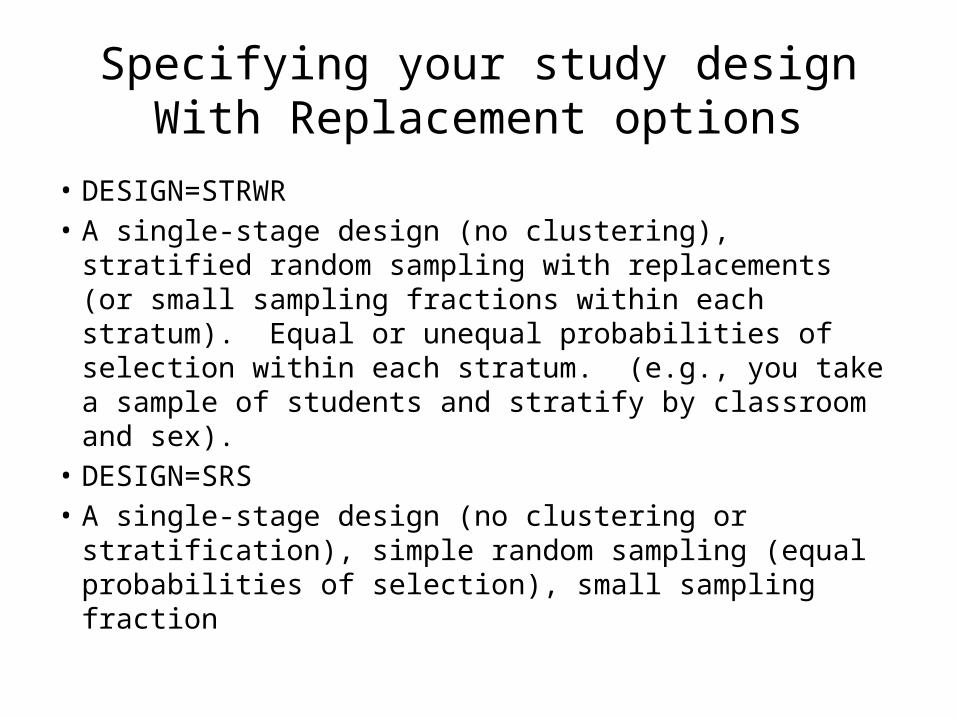
• DESIGN=STRWR• A single-stage design (no clustering), stratified random
sampling with replacements (or small sampling fractions within each stratum). Equal or unequal probabilities of selection within each stratum. (e.g., you take a sample of students and stratify by classroom and sex).
• DESIGN=SRS• A single-stage design (no clustering or stratification),
simple random sampling (equal probabilities of selection), small sampling fraction
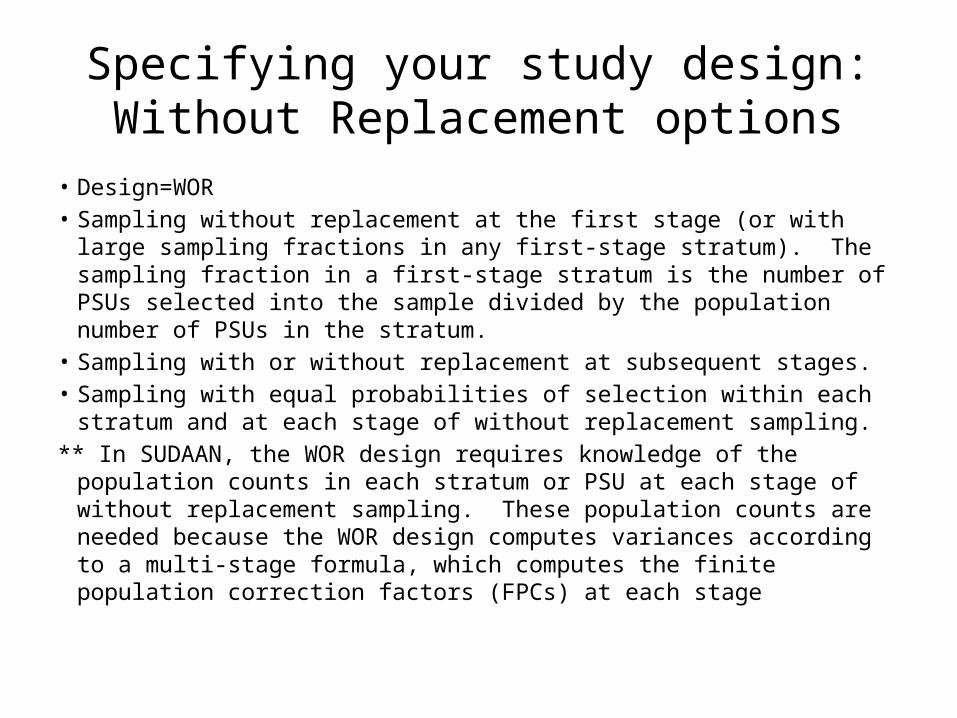
Specifying your study design:Without Replacement options
• Design=WOR• Sampling without replacement at the first stage (or with large
sampling fractions in any first-stage stratum). The sampling fraction in a first-stage stratum is the number of PSUs selected into the sample divided by the population number of PSUs in the stratum.
• Sampling with or without replacement at subsequent stages. • Sampling with equal probabilities of selection within each stratum and
at each stage of without replacement sampling.** In SUDAAN, the WOR design requires knowledge of the population
counts in each stratum or PSU at each stage of without replacement sampling. These population counts are needed because the WOR design computes variances according to a multi-stage formula, which computes the finite population correction factors (FPCs) at each stage
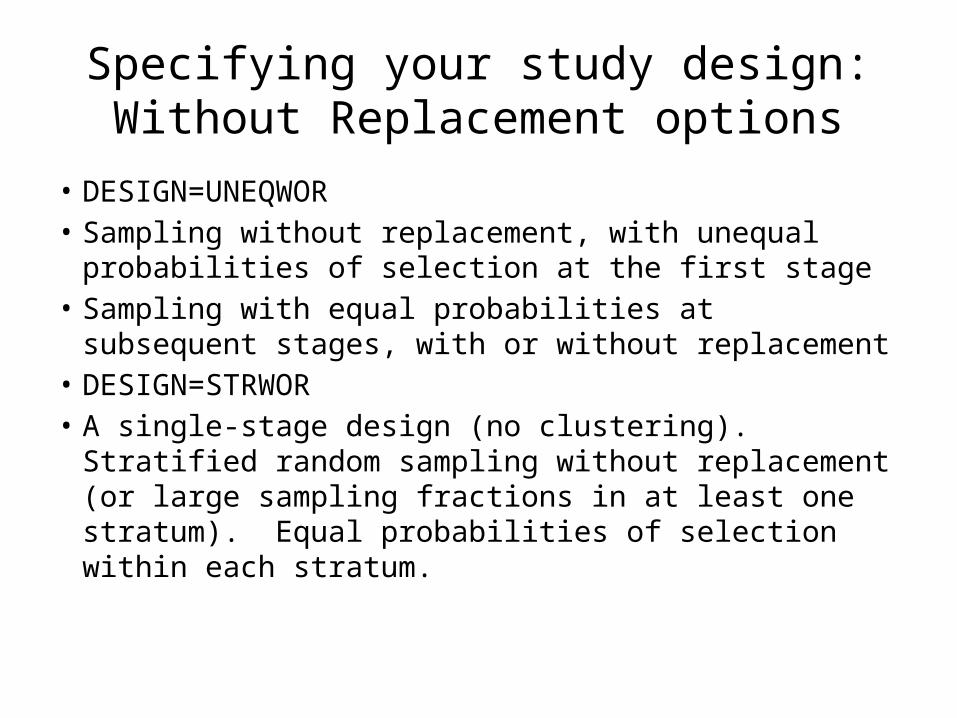
Specifying your study design:Without Replacement options
• DESIGN=UNEQWOR• Sampling without replacement, with unequal
probabilities of selection at the first stage• Sampling with equal probabilities at subsequent
stages, with or without replacement• DESIGN=STRWOR• A single-stage design (no clustering). Stratified random
sampling without replacement (or large sampling fractions in at least one stratum). Equal probabilities of selection within each stratum.
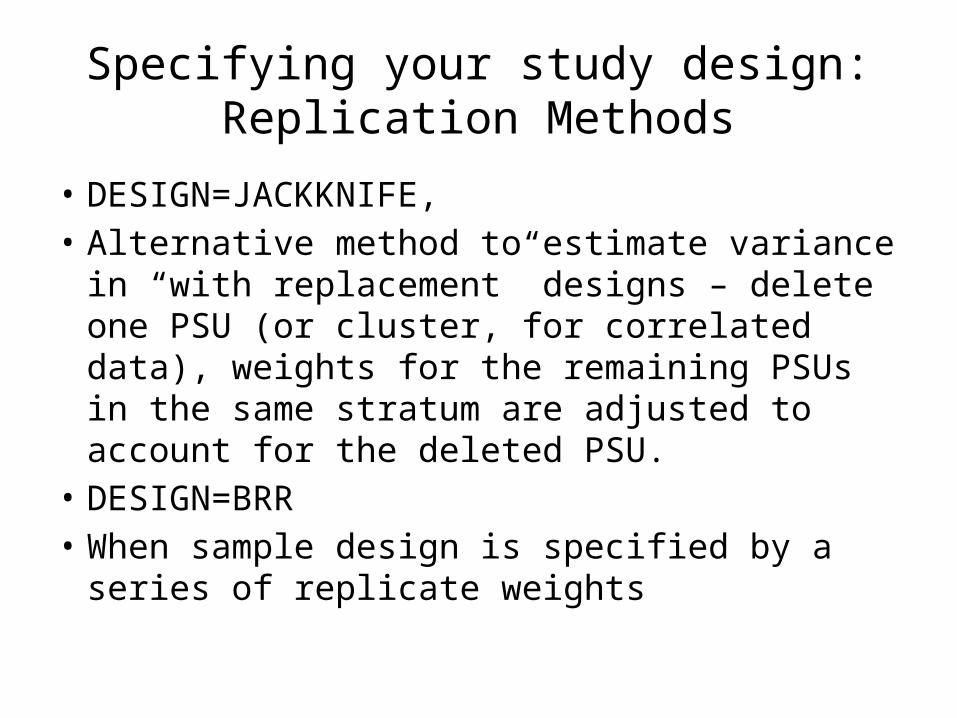
Specifying your study design:Replication Methods
• DESIGN=JACKKNIFE,• Alternative method to estimate variance in
“with replacement” designs – delete one PSU (or cluster, for correlated data), weights for the remaining PSUs in the same stratum are adjusted to account for the deleted PSU.
• DESIGN=BRR• When sample design is specified by a series of
replicate weights
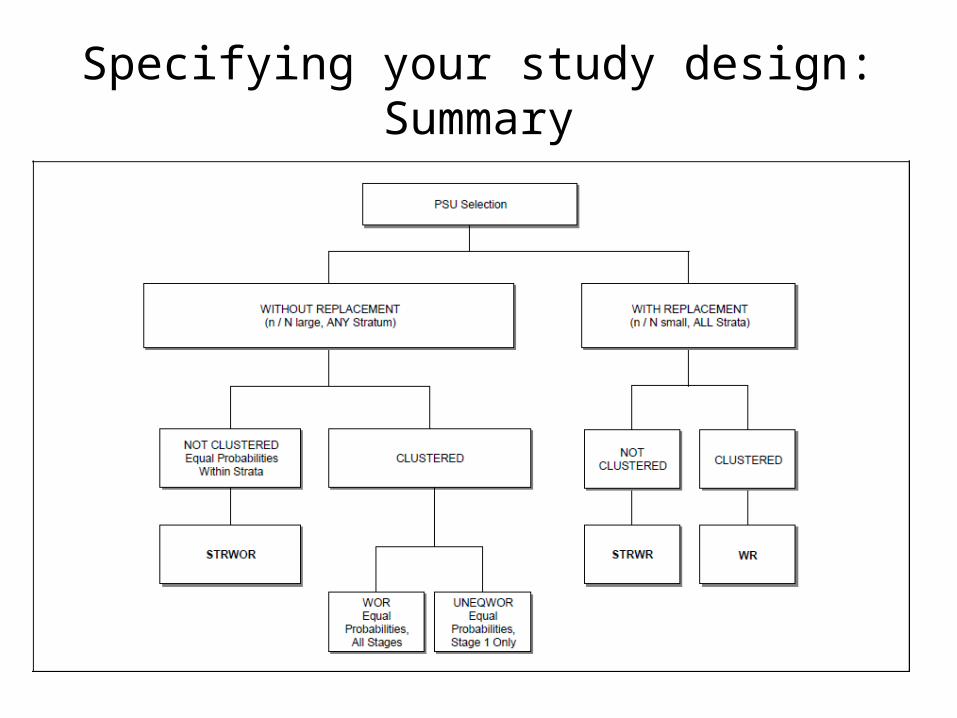
Specifying your study design: Summary
Specifying your study design
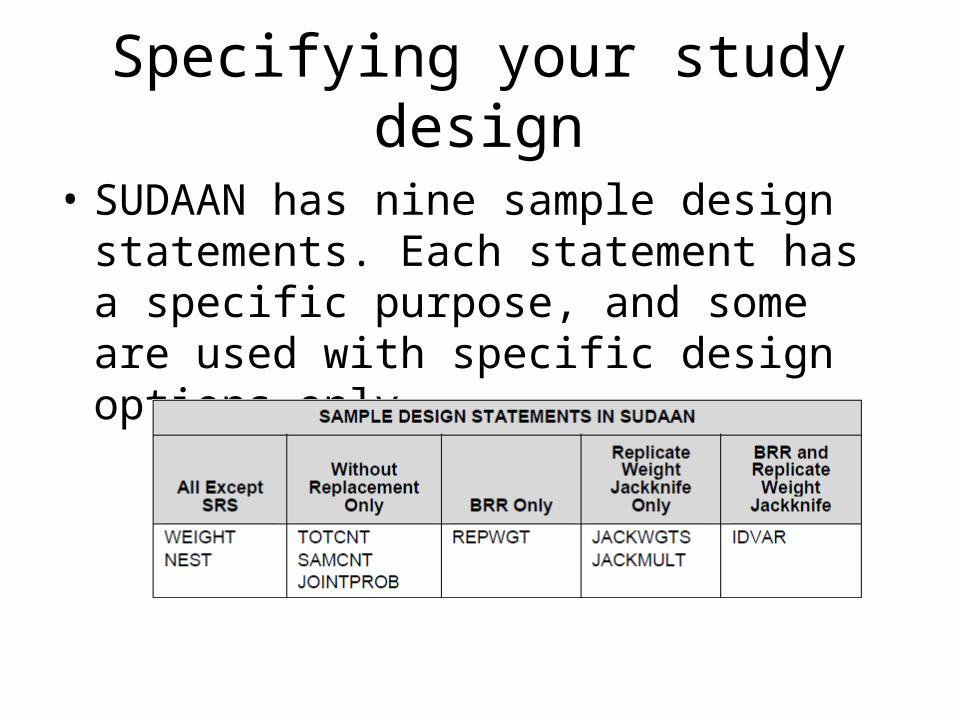
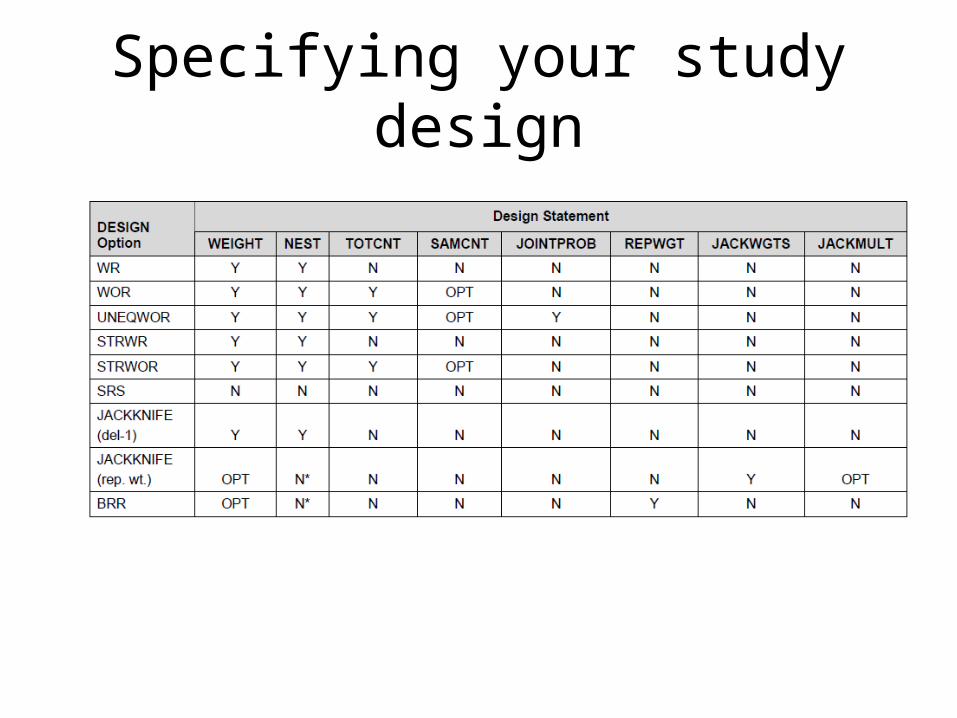
• SUDAAN has nine sample design statements. Each statement has a specific purpose, and some are used with specific design options only.
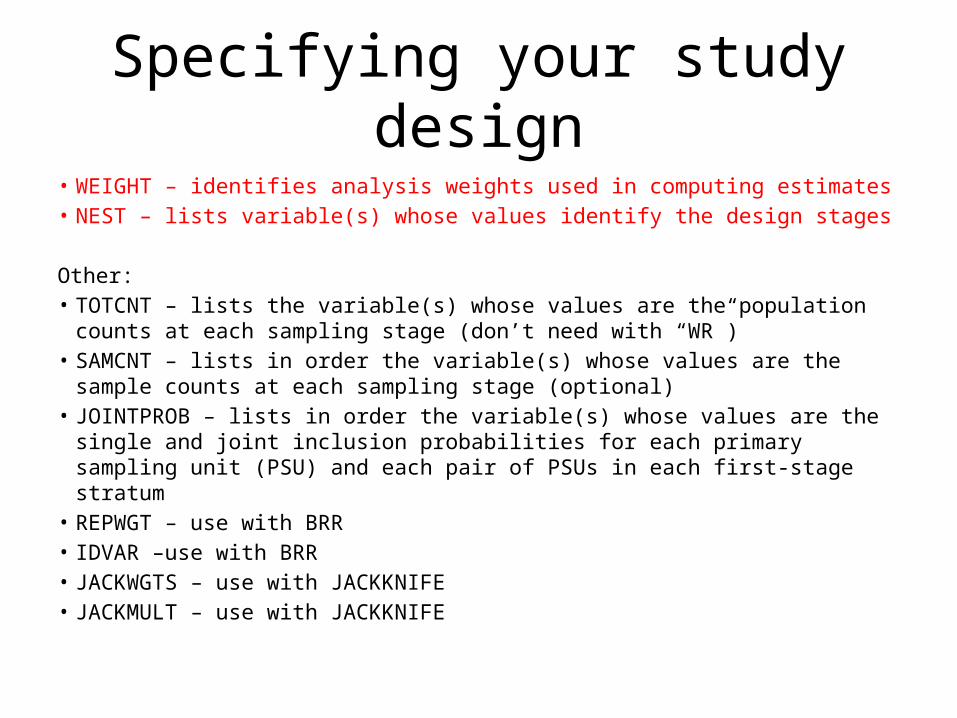
Specifying your study design• WEIGHT – identifies analysis weights used in computing estimates• NEST – lists variable(s) whose values identify the design stages
Other:• TOTCNT – lists the variable(s) whose values are the population counts at each
sampling stage (don’t need with “WR”)• SAMCNT – lists in order the variable(s) whose values are the sample counts at each
sampling stage (optional)• JOINTPROB – lists in order the variable(s) whose values are the single and joint
inclusion probabilities for each primary sampling unit (PSU) and each pair of PSUs in each first-stage stratum
• REPWGT – use with BRR• IDVAR –use with BRR• JACKWGTS – use with JACKKNIFE• JACKMULT – use with JACKKNIFE
Specifying your study design
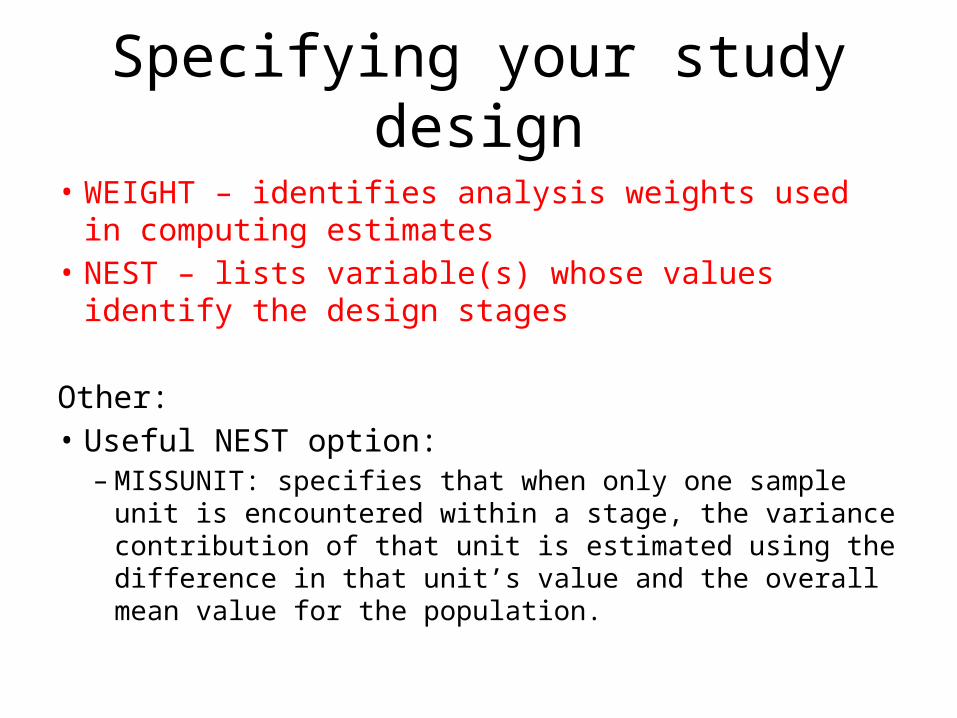
• WEIGHT – identifies analysis weights used in computing estimates
• NEST – lists variable(s) whose values identify the design stages
Other:• Useful NEST option:
– MISSUNIT: specifies that when only one sample unit is encountered within a stage, the variance contribution of that unit is estimated using the difference in that unit’s value and the overall mean value for the population.
Specifying your study design
Two examples
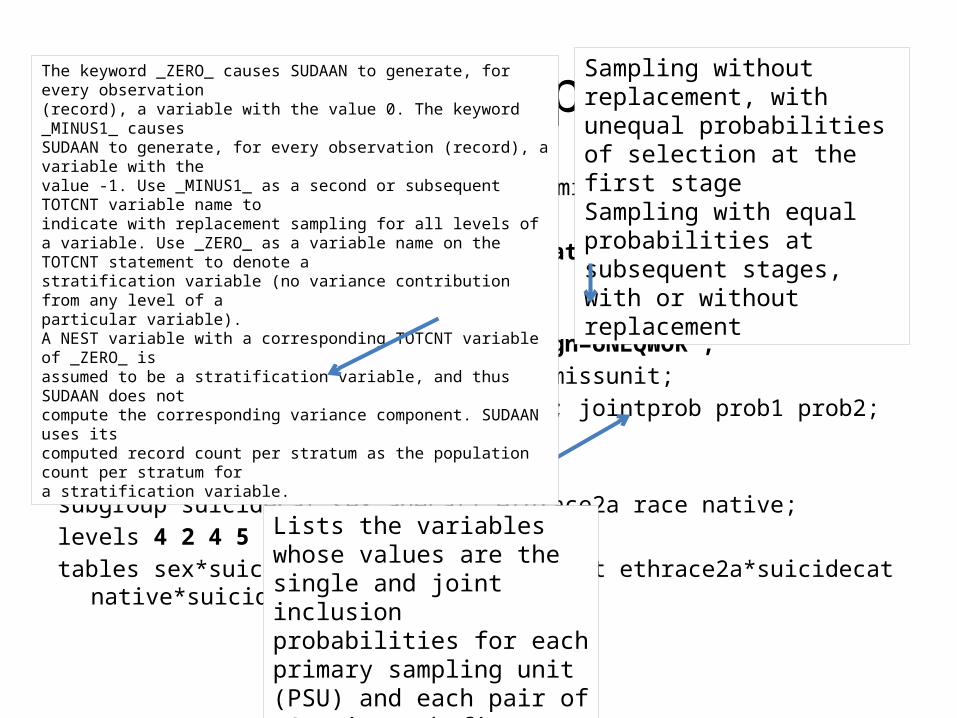
Two examples• National Longitudinal Alcohol Epidemiology Survey
proc sort data=suicidenlaes; by stratrec psuid substrec mseg; run;
proc crosstab data=suicidenlaes design=UNEQWOR ;nest stratrec psuid substrec mseg / missunit;totcnt _ZERO_ _ZERO_ _MINUS1_ _ZERO_; jointprob prob1 prob2;weight wssa;
subgroup suicidecat sex agecat1 ethrace2a race native; levels 4 2 4 5 4 2; tables sex*suicidecat agecat1*suicidecat ethrace2a*suicidecat
native*suicidecat ; run;
Sampling without replacement, with unequal probabilities of selection at the first stageSampling with equal probabilities at subsequent stages, with or without replacement
Lists the variables whose values are the single and joint inclusion probabilities for each primary sampling unit (PSU) and each pair of PSUs in each first-stage stratum
The keyword _ZERO_ causes SUDAAN to generate, for every observation(record), a variable with the value 0. The keyword _MINUS1_ causesSUDAAN to generate, for every observation (record), a variable with thevalue -1. Use _MINUS1_ as a second or subsequent TOTCNT variable name toindicate with replacement sampling for all levels of a variable. Use _ZERO_ as a variable name on the TOTCNT statement to denote astratification variable (no variance contribution from any level of aparticular variable).A NEST variable with a corresponding TOTCNT variable of _ZERO_ isassumed to be a stratification variable, and thus SUDAAN does notcompute the corresponding variance component. SUDAAN uses itscomputed record count per stratum as the population count per stratum fora stratification variable.
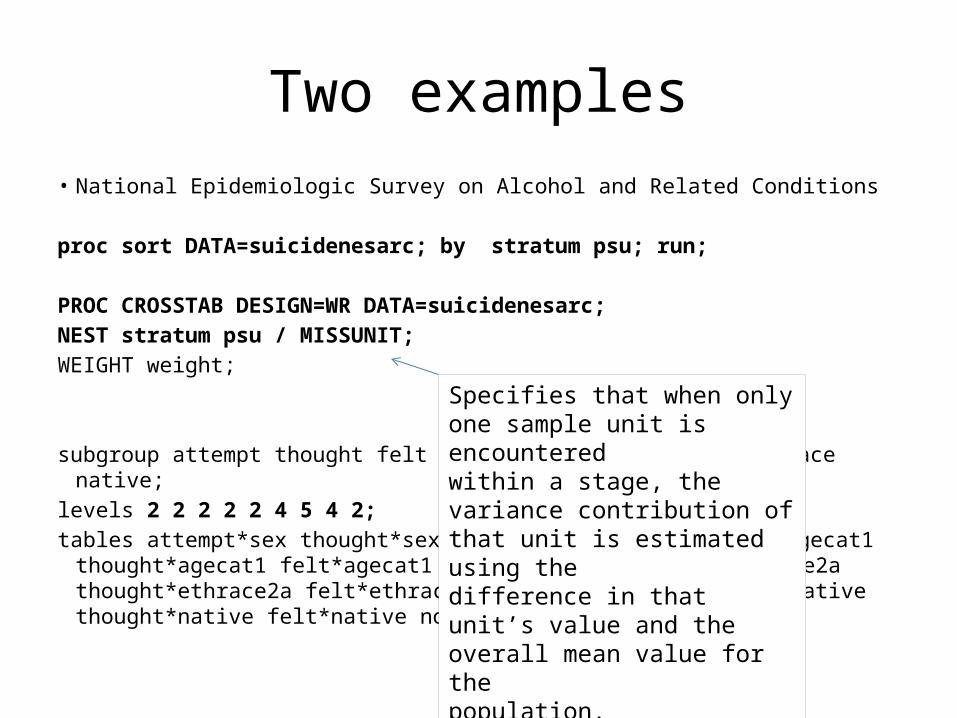
Two examples• National Epidemiologic Survey on Alcohol and Related Conditions
proc sort DATA=suicidenesarc; by stratum psu; run;
PROC CROSSTAB DESIGN=WR DATA=suicidenesarc; NEST stratum psu / MISSUNIT; WEIGHT weight;
subgroup attempt thought felt none sex agecat1 ethrace2a race native; levels 2 2 2 2 2 4 5 4 2; tables attempt*sex thought*sex felt*sex none*sex attempt*agecat1 thought*agecat1
felt*agecat1 none*agecat1 attempt*ethrace2a thought*ethrace2a felt*ethrace2a none*ethrace2a attempt*native thought*native felt*native none*native; run;
Specifies that when only one sample unit is encounteredwithin a stage, the variance contribution of that unit is estimated using thedifference in that unit’s value and the overall mean value for thepopulation.
Part II: PROC RECORDS and univariate statistics
General useful options on all procedure statements in SUDAAN
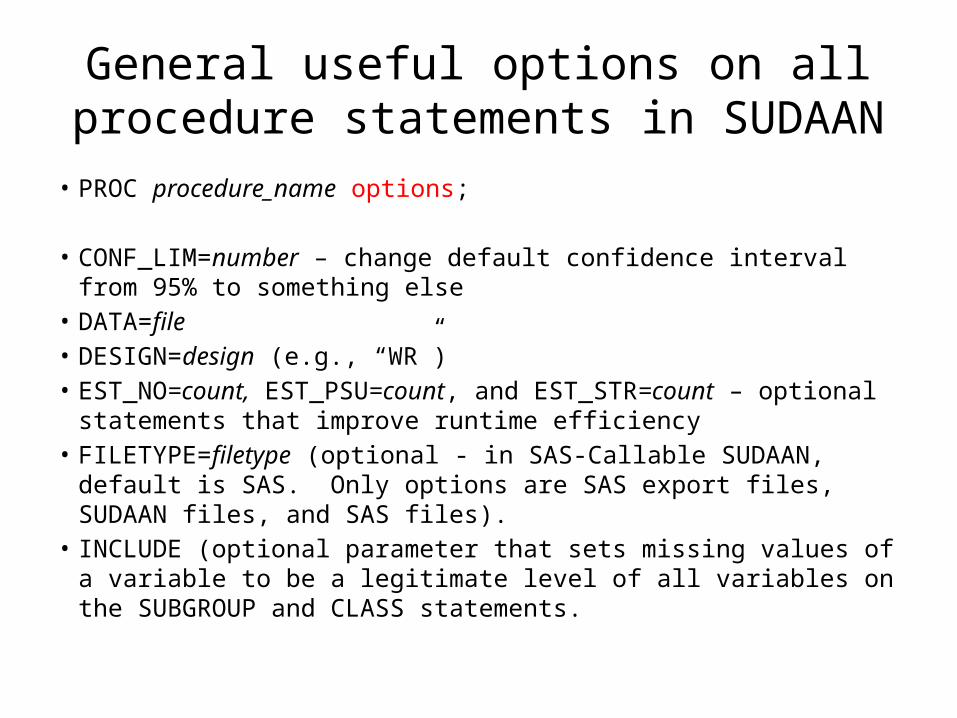
• PROC procedure_name options;
• CONF_LIM=number – change default confidence interval from 95% to something else
• DATA=file• DESIGN=design (e.g., “WR”)• EST_NO=count, EST_PSU=count, and EST_STR=count – optional
statements that improve runtime efficiency• FILETYPE=filetype (optional - in SAS-Callable SUDAAN, default is SAS.
Only options are SAS export files, SUDAAN files, and SAS files).• INCLUDE (optional parameter that sets missing values of a variable to
be a legitimate level of all variables on the SUBGROUP and CLASS statements.
General useful options on all procedure statements in SUDAAN
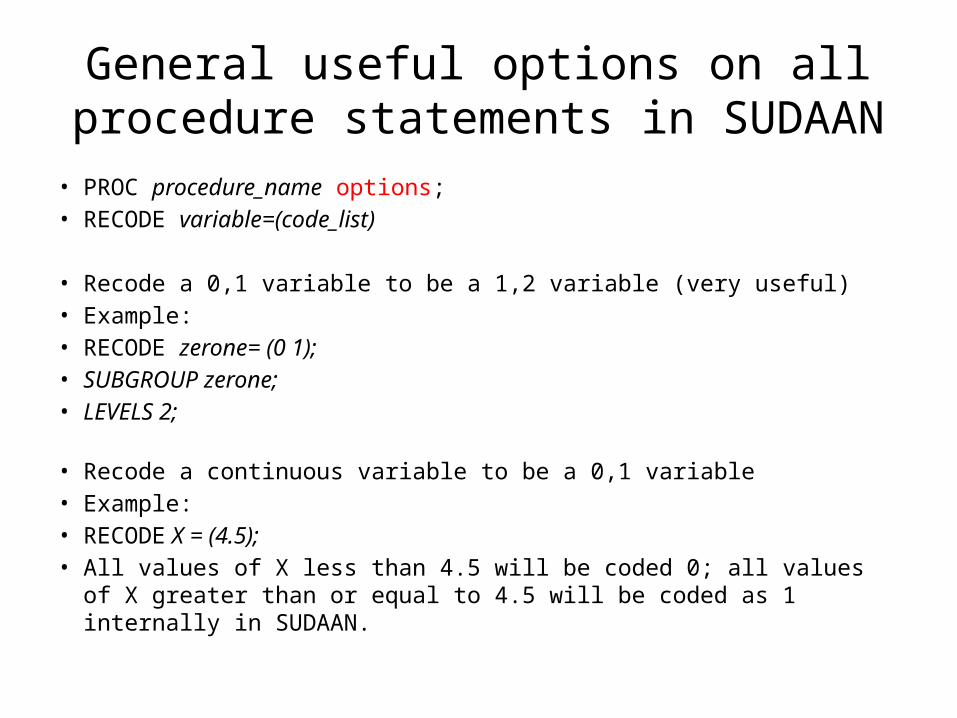
• PROC procedure_name options;• RECODE variable=(code_list)
• Recode a 0,1 variable to be a 1,2 variable (very useful)• Example:• RECODE zerone= (0 1);• SUBGROUP zerone;• LEVELS 2;
• Recode a continuous variable to be a 0,1 variable• Example:• RECODE X = (4.5);• All values of X less than 4.5 will be coded 0; all values of X greater than or equal
to 4.5 will be coded as 1 internally in SUDAAN.
General useful options on all procedure statements in SUDAAN
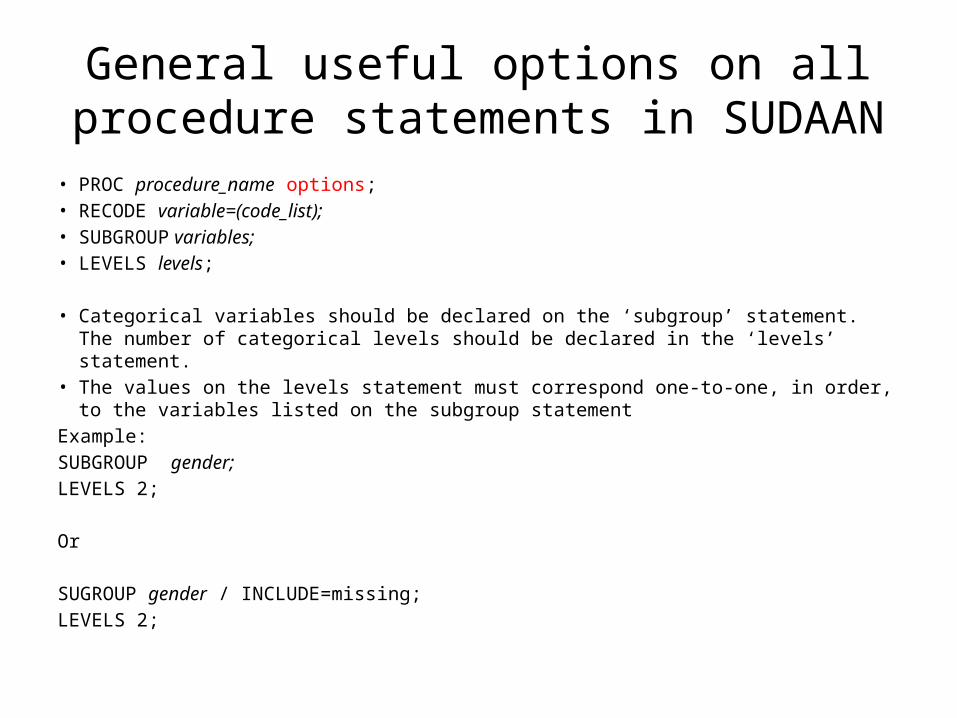
• PROC procedure_name options;• RECODE variable=(code_list);• SUBGROUP variables;• LEVELS levels;
• Categorical variables should be declared on the ‘subgroup’ statement. The number of categorical levels should be declared in the ‘levels’ statement.
• The values on the levels statement must correspond one-to-one, in order, to the variables listed on the subgroup statement
Example:SUBGROUP gender;LEVELS 2;
Or
SUGROUP gender / INCLUDE=missing;LEVELS 2;
General useful options on all procedure statements in SUDAAN
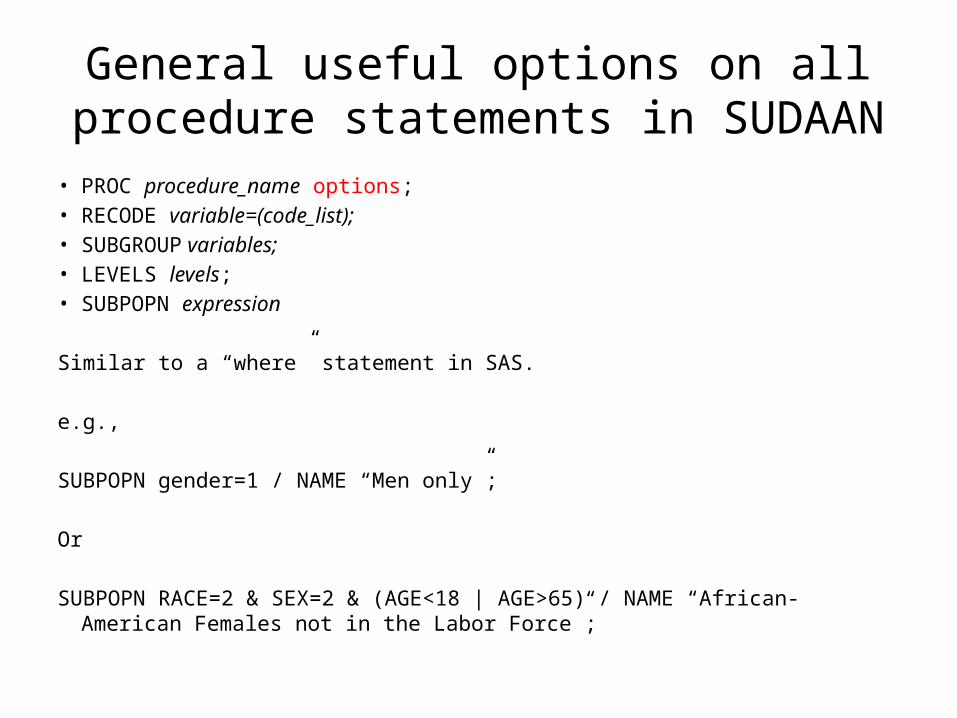
• PROC procedure_name options;• RECODE variable=(code_list);• SUBGROUP variables;• LEVELS levels;• SUBPOPN expression
Similar to a “where” statement in SAS.
e.g.,
SUBPOPN gender=1 / NAME “Men only”;
Or
SUBPOPN RACE=2 & SEX=2 & (AGE<18 | AGE>65) / NAME “African-American Females not in the Labor Force”;
General useful options on all procedure statements in SUDAAN
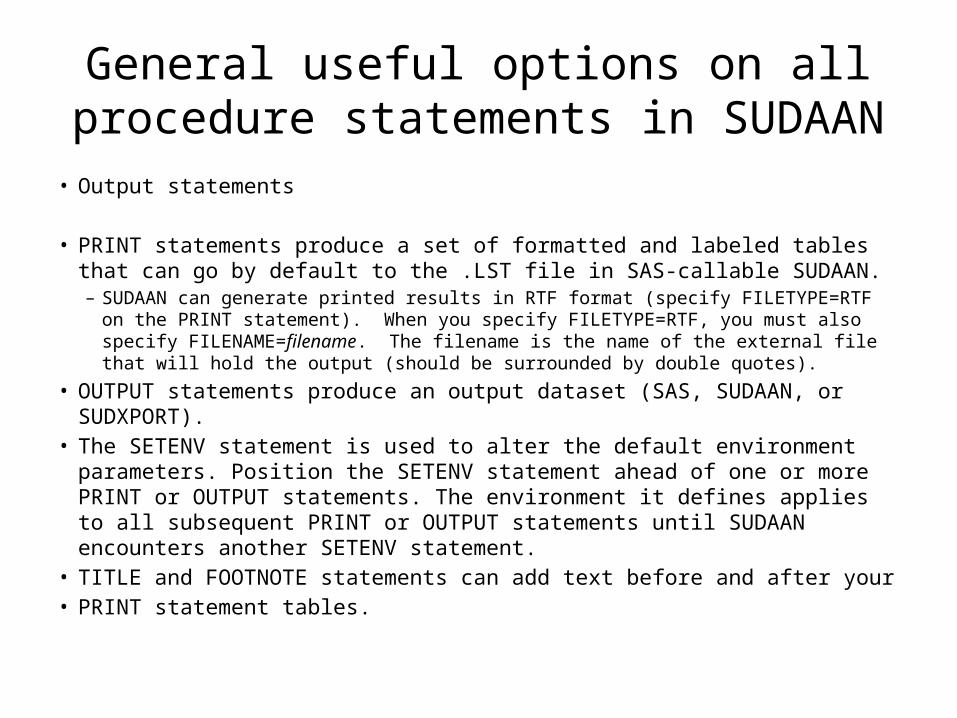
• Output statements
• PRINT statements produce a set of formatted and labeled tables that can go by default to the .LST file in SAS-callable SUDAAN.– SUDAAN can generate printed results in RTF format (specify FILETYPE=RTF on the
PRINT statement). When you specify FILETYPE=RTF, you must also specify FILENAME=filename. The filename is the name of the external file that will hold the output (should be surrounded by double quotes).
• OUTPUT statements produce an output dataset (SAS, SUDAAN, or SUDXPORT).• The SETENV statement is used to alter the default environment parameters.
Position the SETENV statement ahead of one or more PRINT or OUTPUT statements. The environment it defines applies to all subsequent PRINT or OUTPUT statements until SUDAAN encounters another SETENV statement.
• TITLE and FOOTNOTE statements can add text before and after your• PRINT statement tables.
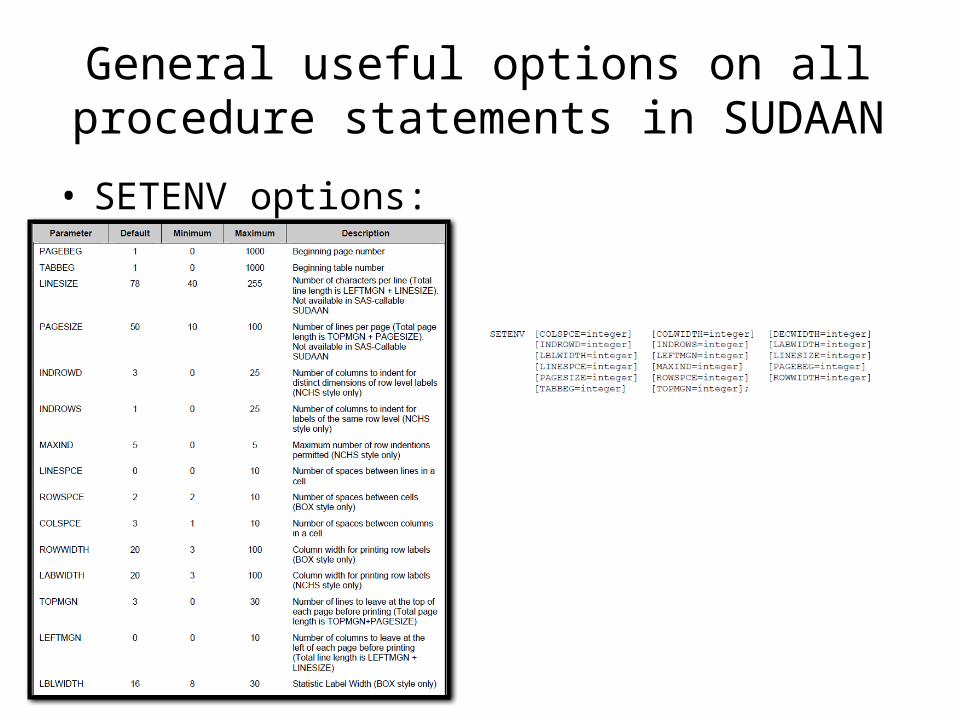
General useful options on all procedure statements in SUDAAN
• SETENV options:
PROC RECORDS
• RECORDS is a non-analytic procedure that prints observations from the input data set, obtains the contents of the input data set, and converts an input data set from one type to another. You can use the SUBPOPN statement to create a subset of a given data se, and you can use the SORTBY statement to sort your data.
• PROC RECORDS is particularly useful when you wish to verify that SUDAAN is reading your data properly.
• Similar to PROC PRINT in SAS
PROC CROSSTAB
• Computes frequencies, percentage distributions, odds ratios, relative risks, and their standard errors (or confidence intervals) for cross tabulations, as well as chi-square tests of independence and Cochran-Mantel-Haenszel chi-square test for stratified two-way tables.
• Similar to PROC FREQ in SAS
PROC CROSSTAB
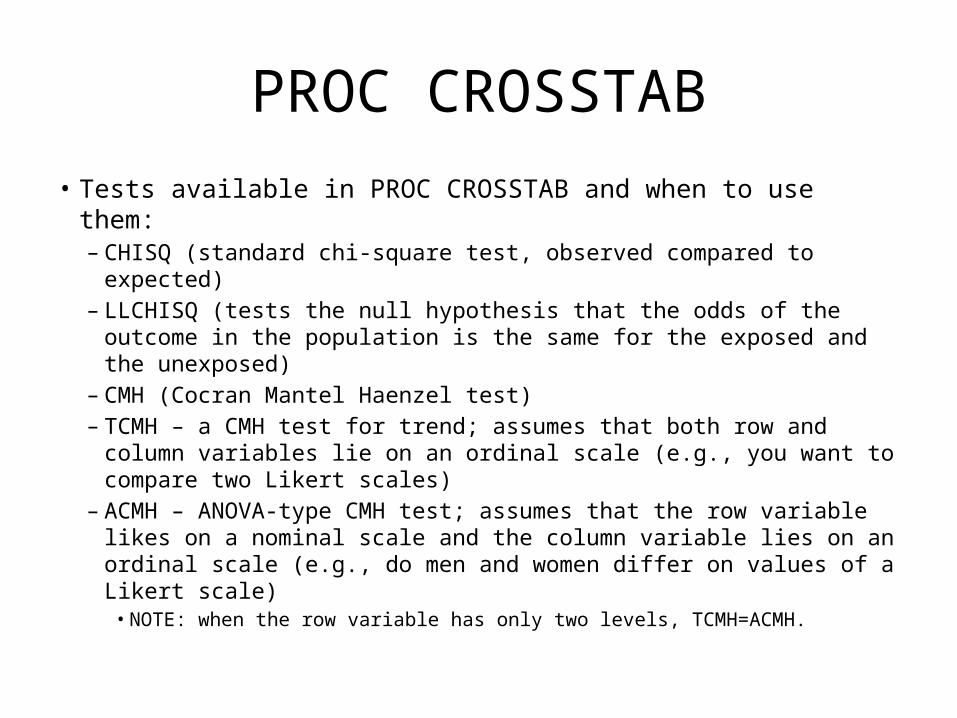
• Tests available in PROC CROSSTAB and when to use them:– CHISQ (standard chi-square test, observed compared to expected)– LLCHISQ (tests the null hypothesis that the odds of the outcome in
the population is the same for the exposed and the unexposed)– CMH (Cocran Mantel Haenzel test)– TCMH – a CMH test for trend; assumes that both row and column
variables lie on an ordinal scale (e.g., you want to compare two Likert scales)
– ACMH – ANOVA-type CMH test; assumes that the row variable likes on a nominal scale and the column variable lies on an ordinal scale (e.g., do men and women differ on values of a Likert scale)• NOTE: when the row variable has only two levels, TCMH=ACMH.
PROC RATIO
• Computes estimates, standard errors, and confidence limits of generalized ratios; also computes standardized estimates and tests single-degree-of-freedom contrasts among levels of a categorical variable.
PROC DESCRIPT
• Computes estimates of means, totals, proportions, percentages, geometric means, quantiles, and their standard errors and confidence limits; also computes standardized estimates and tests of single degree-of-freedom contrasts among levels of a categorical variable.
• Similar to PROC MEANS or PROC UNIVARIATE in SAS
LAB 2: Univariate and bivariate statistics in SUDAAN
Related Documents