i FINAL REPORT Contract 02-310 Project No. 008545 Analysis of Auto Industry and Consumer Response to Regulations and Technological Change, and Customization of Consumer Response Models in Support of AB 1493 Rulemaking – The Response of the Auto Industry and Consumers to Changes in the Exhaust Emission and Fuel Economy Standards (1975-2003): A Historical Review of Changes in Technology, Prices, and Sales of Various Classes of Vehicles Andrew Burke [email protected] Ethan Abeles Belinda Chen Principal Investigator Dr. Daniel Sperling [email protected] Prepared for the California Air Resources Board and the California Environmental Protection Agency Prepared by: Institute of Transportation Studies University of California, Davis One Shields Avenue Davis, CA 95616 October 18, 2004

Welcome message from author
This document is posted to help you gain knowledge. Please leave a comment to let me know what you think about it! Share it to your friends and learn new things together.
Transcript
i
FINAL REPORT
Contract 02-310 Project No. 008545
Analysis of Auto Industry and Consumer Response to Regulations and Technological Change, and Customization of Consumer
Response Models in Support of AB 1493 Rulemaking –
The Response of the Auto Industry and Consumers to Changes in the Exhaust Emission and Fuel Economy Standards (1975-2003): A Historical Review of Changes in Technology, Prices, and Sales
of Various Classes of Vehicles
Andrew Burke [email protected]
Ethan Abeles Belinda Chen
Principal Investigator Dr. Daniel Sperling
Prepared for the California Air Resources Board and the California Environmental Protection Agency
Prepared by: Institute of Transportation Studies
University of California, Davis One Shields Avenue Davis, CA 95616
October 18, 2004
ii
DISCLAIMER The statements and conclusions in this Report are those of the contractor and not necessarily those of the California Air Resources Board. The mention of commercial products, their source, or their use in connection with material reported herein is not to be construed as actual or implied endorsement of such products.
iii
ACKNOWLEDGMENTS This report was submitted in fulfillment of Contract 02-310, Analysis of Auto Industry and Consumer Response to Regulations and Technological Change, and Customization of Consumer Response Models in Support of AB 1493 Rulemaking, by the Institute of Transportation Studies at the University of California, Davis (ITS-Davis) under the sponsorship of the California Air Resources Board. Work was completed as of October 18, 2004.
iv
Table of Contents Abstract............................................................................................................................. vi Executive Summary........................................................................................................ vii 1. Introduction............................................................................................................... 1
1.1 Literature Review...................................................................................................... 1 2. Changes in Regulations .............................................................................................. 3
2.1 Vehicle Emissions..................................................................................................... 3 2.2 Fuel economy (CAFE).............................................................................................. 4
3. Industry/consumer data base....................................................................................... 7 4. Industry response........................................................................................................ 10
4.1 Historical review of technology changes................................................................ 10 4.2 Historical review of changes in vehicle characteristics .......................................... 14 4.3 Historical Review of vehicle price changes............................................................ 17 4.4 Vehicle prices in California .................................................................................... 21
5. Consumer response..................................................................................................... 23 5.1 Historical review of vehicle sales ........................................................................... 23 5.2 Historical review of the effect of fuel prices and macro-economic........................ 24 factors on vehicle sales ................................................................................................. 24 Year............................................................................................................................... 27 5.3 Historical review of innovative financing and marketing strategies ...................... 28
References........................................................................................................................ 32 References for the Literature Review Section (1.1)...................................................... 32 General References for the report (numbered) ............................................................. 34
Appendices....................................................................................................................... 37 Appendix I: Timeline of new technologies to reduce emissions and improve fuel economy........................................................................................................................ 37 Appendix II: Detailed history of the performance and price of selected vehicle models....................................................................................................................................... 38 Appendix III: Average Attribute Trends Generated from the ITS Davis Database – MSRP, Acceleration, Fuel Economy, Curb Weight, Horsepower................................ 83 Appendix IV: Vehicle Technology Trends with respect to Fuel Economy and Performance for Passenger Cars and Light Trucks (1975 to 2003).............................. 88
v
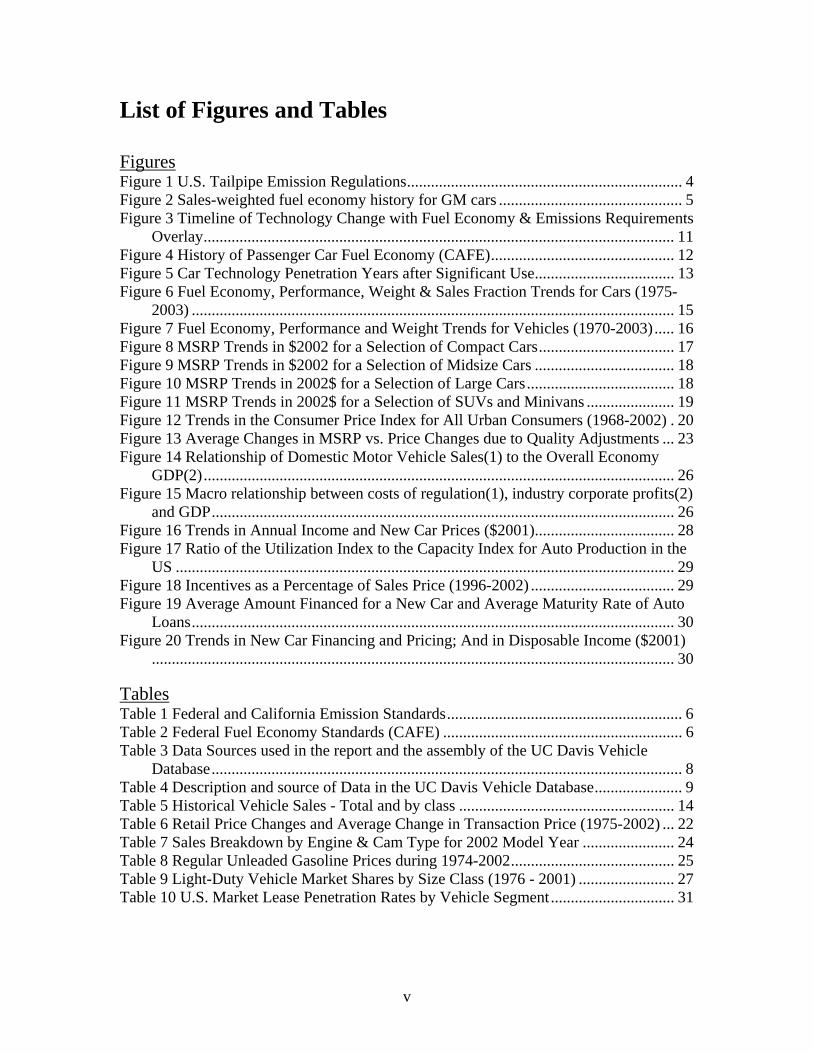
List of Figures and Tables Figures Figure 1 U.S. Tailpipe Emission Regulations..................................................................... 4 Figure 2 Sales-weighted fuel economy history for GM cars .............................................. 5 Figure 3 Timeline of Technology Change with Fuel Economy & Emissions Requirements
Overlay...................................................................................................................... 11 Figure 4 History of Passenger Car Fuel Economy (CAFE).............................................. 12 Figure 5 Car Technology Penetration Years after Significant Use................................... 13 Figure 6 Fuel Economy, Performance, Weight & Sales Fraction Trends for Cars (1975-
2003) ......................................................................................................................... 15 Figure 7 Fuel Economy, Performance and Weight Trends for Vehicles (1970-2003)..... 16 Figure 8 MSRP Trends in $2002 for a Selection of Compact Cars.................................. 17 Figure 9 MSRP Trends in $2002 for a Selection of Midsize Cars ................................... 18 Figure 10 MSRP Trends in 2002$ for a Selection of Large Cars..................................... 18 Figure 11 MSRP Trends in 2002$ for a Selection of SUVs and Minivans ...................... 19 Figure 12 Trends in the Consumer Price Index for All Urban Consumers (1968-2002) . 20 Figure 13 Average Changes in MSRP vs. Price Changes due to Quality Adjustments ... 23 Figure 14 Relationship of Domestic Motor Vehicle Sales(1) to the Overall Economy
GDP(2)...................................................................................................................... 26 Figure 15 Macro relationship between costs of regulation(1), industry corporate profits(2)
and GDP.................................................................................................................... 26 Figure 16 Trends in Annual Income and New Car Prices ($2001)................................... 28 Figure 17 Ratio of the Utilization Index to the Capacity Index for Auto Production in the
US ............................................................................................................................. 29 Figure 18 Incentives as a Percentage of Sales Price (1996-2002) .................................... 29 Figure 19 Average Amount Financed for a New Car and Average Maturity Rate of Auto
Loans......................................................................................................................... 30 Figure 20 Trends in New Car Financing and Pricing; And in Disposable Income ($2001)
................................................................................................................................... 30 Tables Table 1 Federal and California Emission Standards........................................................... 6 Table 2 Federal Fuel Economy Standards (CAFE) ............................................................ 6 Table 3 Data Sources used in the report and the assembly of the UC Davis Vehicle
Database...................................................................................................................... 8 Table 4 Description and source of Data in the UC Davis Vehicle Database...................... 9 Table 5 Historical Vehicle Sales - Total and by class ...................................................... 14 Table 6 Retail Price Changes and Average Change in Transaction Price (1975-2002) ... 22 Table 7 Sales Breakdown by Engine & Cam Type for 2002 Model Year ....................... 24 Table 8 Regular Unleaded Gasoline Prices during 1974-2002......................................... 25 Table 9 Light-Duty Vehicle Market Shares by Size Class (1976 - 2001) ........................ 27 Table 10 U.S. Market Lease Penetration Rates by Vehicle Segment............................... 31

vi
Abstract
The objectives of this study were to assess the responses of the auto industry and consumers to changes in exhaust emission and fuel economy standards, relate qualitatively these responses to technology developments and changing economic factors, and correlate vehicle sales with vehicle attributes and macro-economic factors. Data regarding the characteristics, prices, and sales of vehicle models from many manufacturers was assembled and analyzed for the years from 1975 to 2003. The analysis indicated that changes in emissions and fuel economy regulations forced the industry to develop an impressive sequence of new and improved technologies that were rapidly introduced in light duty vehicles. Retail prices increased substantially over this time period, with about 1/3 of the increase due to government regulations and 67% due to increased quality of the vehicles. The increase in vehicle prices has been accommodated by increases in disposal income and creative financing of sales through longer loan periods and leasing. Differences were not uniform across vehicle classes. For instance, fuel economy and fuel price appeared to influence sales of midsize and large cars more than small cars. For large cars, engine horsepower was not as significant as fuel economy during the entire time period.
vii
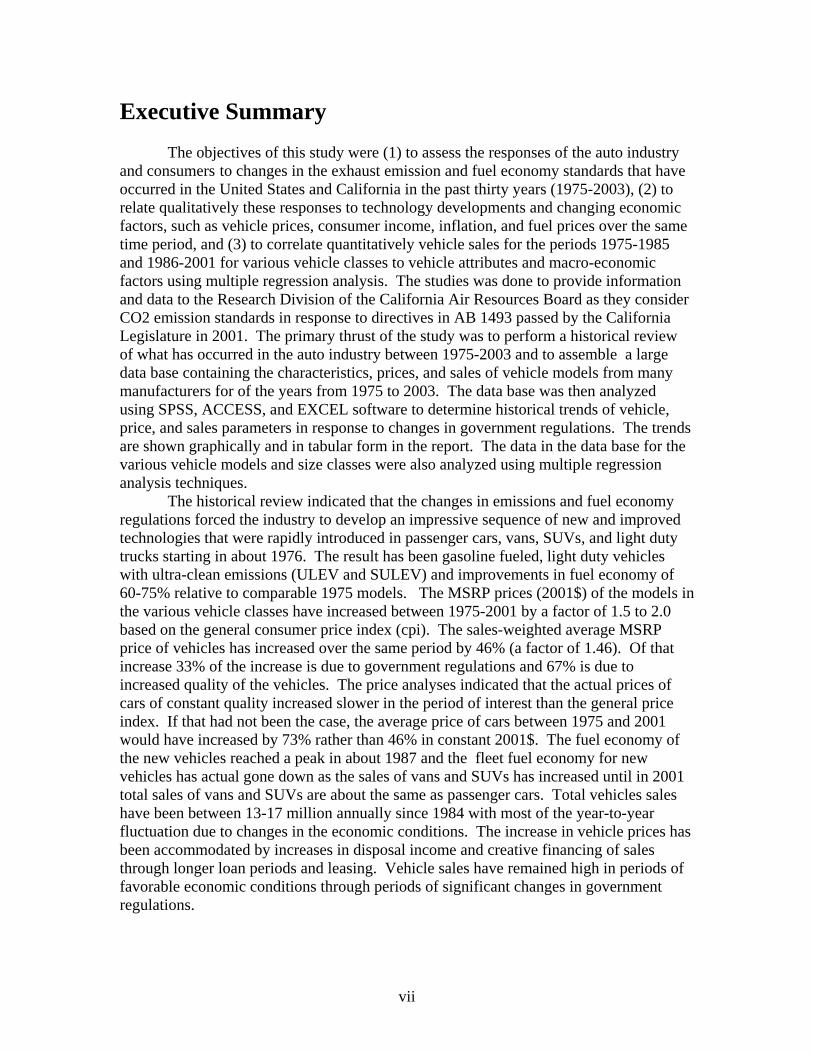
Executive Summary The objectives of this study were (1) to assess the responses of the auto industry
and consumers to changes in the exhaust emission and fuel economy standards that have occurred in the United States and California in the past thirty years (1975-2003), (2) to relate qualitatively these responses to technology developments and changing economic factors, such as vehicle prices, consumer income, inflation, and fuel prices over the same time period, and (3) to correlate quantitatively vehicle sales for the periods 1975-1985 and 1986-2001 for various vehicle classes to vehicle attributes and macro-economic factors using multiple regression analysis. The studies was done to provide information and data to the Research Division of the California Air Resources Board as they consider CO2 emission standards in response to directives in AB 1493 passed by the California Legislature in 2001. The primary thrust of the study was to perform a historical review of what has occurred in the auto industry between 1975-2003 and to assemble a large data base containing the characteristics, prices, and sales of vehicle models from many manufacturers for of the years from 1975 to 2003. The data base was then analyzed using SPSS, ACCESS, and EXCEL software to determine historical trends of vehicle, price, and sales parameters in response to changes in government regulations. The trends are shown graphically and in tabular form in the report. The data in the data base for the various vehicle models and size classes were also analyzed using multiple regression analysis techniques.
The historical review indicated that the changes in emissions and fuel economy regulations forced the industry to develop an impressive sequence of new and improved technologies that were rapidly introduced in passenger cars, vans, SUVs, and light duty trucks starting in about 1976. The result has been gasoline fueled, light duty vehicles with ultra-clean emissions (ULEV and SULEV) and improvements in fuel economy of 60-75% relative to comparable 1975 models. The MSRP prices (2001$) of the models in the various vehicle classes have increased between 1975-2001 by a factor of 1.5 to 2.0 based on the general consumer price index (cpi). The sales-weighted average MSRP price of vehicles has increased over the same period by 46% (a factor of 1.46). Of that increase 33% of the increase is due to government regulations and 67% is due to increased quality of the vehicles. The price analyses indicated that the actual prices of cars of constant quality increased slower in the period of interest than the general price index. If that had not been the case, the average price of cars between 1975 and 2001 would have increased by 73% rather than 46% in constant 2001$. The fuel economy of the new vehicles reached a peak in about 1987 and the fleet fuel economy for new vehicles has actual gone down as the sales of vans and SUVs has increased until in 2001 total sales of vans and SUVs are about the same as passenger cars. Total vehicles sales have been between 13-17 million annually since 1984 with most of the year-to-year fluctuation due to changes in the economic conditions. The increase in vehicle prices has been accommodated by increases in disposal income and creative financing of sales through longer loan periods and leasing. Vehicle sales have remained high in periods of favorable economic conditions through periods of significant changes in government regulations.
1
1. Introduction This report is concerned with assessing the response of the auto industry and
consumers to changes in exhaust emission and fuel economy standards since 1975. During the period 1975-2004, the emission standards, especially for passenger cars, have been tightened markedly in both the United States and California and the fuel economy (CAFE) standard was increased from 18 to 27.5 mpg from 1977-1985. These changes in the regulations have resulted in large changes in the technology incorporated into vehicles presently being marketed by the auto companies compared to vehicles marketed in 1975. The technology changes were introduced over the years as needed to meet the changing regulations. It is of interest to track historically the effect of these technology changes on the characteristics (size/weight, acceleration, and fuel economy), price, and sales of various classes of vehicles as a means of projecting how the auto industry and consumers would likely respond to possible future changes in regulations that would require significant reductions in CO2 emissions.
There are data available from many sources that are appropriate for this study and a relatively large fraction of the data is available over the internet making it relatively easy to transfer it into a single data base for analysis. Hence in the initial part of this study, a large data base was assembled that included technology, performance, emissions, fuel economy, price, and sales data for many of the vehicle models marketed by most of the auto companies in the world during the period 1975-2003. Much of the effort in the study was concerned with the analysis of this data using SPSS, ACCESS, and EXCEL software to determine the historical trends of the vehicle, price, and sales parameters in response to changes in the regulations and technology. These trends are shown graphically and in tabular form in the various sections of the report that follow.
1.1 Literature Review
A large body of literature is available that examines the many issues surrounding government regulation of the automobile industry. Gerard and Lave (May 2003), for example, argue that regulations stemming from the 1970 Clean Air Act led to significant technological changes and environmental improvements. There are many other studies that focus on the technology forcing nature of automotive industry regulation, particularly with respect to emissions control, and to a lesser extent, automobile safety (e.g. airbags). The CAFE standards are not, strictly speaking, a technology-forcing policy since automakers could meet the requirement through changes in the mix of vehicles offered. Three essays in a 1999 collection of essays (Gomez-Ibanez, 1999) on the topic of transportation economics and policy investigate three important aspects of government regulation and the auto industry. These include “The Politics of Controlling Auto Air Pollution” by Howitt and Altshuler, “Fuel Economy and Auto Safety Regulation: Is the Cure Worse than the Disease?” by Charles and Lester Lave, and “Technology-Forcing Public Policies and the Automobile” by Leone. Howitt and Altshuler discuss policy instruments intended to control auto emissions, and in the ‘future implications’ section of their paper, discuss the applicability of past regulations to future greenhouse gas emission policies. The Laves conclude that Federal legislation and regulation of automobiles focus almost exclusively on an immediate concern, and in the process, ignore possible system effects and behavioral changes. Due to the complex and interdependent nature of the transportation system, the authors believe that ‘solution-caused problems’ should be

2
better anticipated and handled. Leone offers another perspective with special attention paid to technology-forcing regulations. Leone argues that while technology-forcing mandates often achieve positive results, such policy measures should be approached with skepticism to ensure that the use of society’s resources is optimized.
A number of books and government reports have emerged over the last 25 years that examine the complex nature of automobile regulation. Some of the more prominent examples include Regulating the Automobile (Crandall, 1986), Corporate Strategies of the Automotive Manufacturers (Schnapp, 1978), Use of Advertising and Marketing Incentives to Promote Sales of Fuel Efficient Vehicles (Donnelly, 1981), Motor vehicle regulations (1992): Regulatory cost estimates could be improved , Assessing regulatory impacts (1981): The Federal experience with the auto industry, Cleaner Cars: The History and Technology of Emission Control Since the 1960s (Mondt, 2000), and numerous other recordings of Congressional proceedings, Ph.D. theses and books. These sources tend to be dated (i.e. from the late 1970s into the 1980s) because that is the era when these regulations were both contentious and actively being enacted. A number of the more update analyses are identified and discussed in the following sections.
Emissions Control Requirements
Many relevant papers concerning the economic impacts of automobile emissions regulations can be found in the business and economics journal literature. Some notable examples are Bresnahan and Yao (1985, Wang, Kling and Sperling (1993, and Anderson and Sherwood (2002. For a fuller treatment of relevant emissions control literature, see Chen et al.(2003). Safety and Occupant Protection Standards Papers that deal with the economic impacts of occupant crash protection include Graham (1984), Gomez-Ibanez (1997), Mannering and Winston (1995), Peltzman (1975), Arnould and Grabowski (1981), Dunham (1997), and others. These papers examine costs and benefits and compliance costs, as well as offsetting behavior and societal costs. For a complete literature review of the relevant airbag and passive restraint literature, see Abeles et al.(2003).
CAFE Standards
CAFE standards have been the object of intense scrutiny by economists and other policy analysts since they were first adopted. In 1981, Gsellman (1981) questioned whether the 1981-84 standards could be achieved (Reference 20a). McNutt (1983) discusses the consumption effects achieved through U.S. fuel economy policy prior to 1983. Many economists have argued that CAFE only became a binding constraint on auto manufacturers after gasoline prices fell in the 1980s from a peak of $2.81 (2001$) in 1982. They concluded that CAFE standards increased when the market alone would have produced greater fuel efficiency because of the high fuel prices. When the CAFE standards stopped increasing in 1985, the sales mix corresponding to what consumers wanted to purchase required manufacturers to produce more fuel-efficient vehicles. (Leone, 1990). Manufacturers were thus forced to make larger price markups for their larger, less fuel efficient (lower mpg) vehicles, and smaller price markups for their smaller, more fuel efficient vehicles (Porter, 1999). A study looking at CAFE standards
3
and their impact on automobile prices for 1978-80 concluded that U.S. automakers initially adopted a strategy of adjusting relative automobile prices to meet the standards, but by the end of the period, automakers were meeting the standards by improving the design of their automobiles to enhance fuel economy, and by a fuel-price driven shift in consumer demand (Falvey,1986). A 1997 study concludes that CAFE standards may have contributed to the decline in average fuel efficiency of the new vehicle fleet by shifting sales toward vans, trucks, and SUVs that met lower CAFÉ standards than passenger cars. (Thorpe, 1997). The less stringent CAFE standards for the larger light-duty vehicles facilitated the large increase in the sales of those vehicles (particularly SUV) from about 20% of total light-duty vehicle sales in 1981 to over 50% in 2001. In 1998, Goldberg used a series of discrete choice models to compare CAFE standards with alternative policies with respect to sales, prices, and fuel consumption (Goldberg, 1998). The results of this study call into question the true achievements of CAFE standards. In 1997, Espey concluded that under current tailpipe emissions standards, increases in fuel economy would increase emissions of the new vehicle fleet and that significantly higher fuel taxes would be required to achieve the same level of pollution reduction (Espey, 1997). A number of other studies have investigated the offsetting costs and benefits of CAFE standards (Crandall, 1989, Dowlatabadi, 1996, Ross, 1994. There is evidence from these studies that supports the claim of offsetting effects that impact vehicle safety and emissions.
This literature review has indicated that past studies of the relationships between
industry and consumer responses have been more narrowly focused than the study undertaken in the present project and for the most part were completed before the important developments of the 1990s. The previous studies have focused on a single type of regulation –fuel economy, emissions, or safety – and did not include consideration of the various classes of vehicles, including light trucks and SUVs. In addition, they did not span the complete period of 1975 to the present (2003). Also past studies did not have available for analysis an extensive data base of vehicle attributes and price characteristics like that compiled at UC Davis as part of the present study for the historical period of interest in which government regulations become a dominant consideration for the auto industry.
2. Changes in Regulations 2.1 Vehicle Emissions
Vehicle emissions have been regulated since the early 1960s starting with the control of crankcase emissions in 1961-63 and fuel evaporative and tailpipe emissions in 1970-71. The early emission standards were set primarily based on work done in California to reduce smog in the South Coast Air Basin. National vehicle emission standards resulted from the passage of the Clean Air Acts and amendments in 1963, 1965, 1967, and 1970. The emissions standards and how they have changed over the years are shown in Figure 1 (Reference 1). Up until 1975, it was possible to meet the standards by controlling engine spark timing and air-fuel ratio and using exhaust gas recirculation (EGR) and secondary air addition in the exhaust manifold. Unfortunately

4
these changes in the engine operation resulted in a significant fuel economy penalty at a time when the country was very concerned about the availability and price of oil.
Figure 1 U.S. Tailpipe Emission Regulations
Source: Mondt, Reference 1.
The more stringent emission standards mandated by the Clean Act of 1970 were implemented in 1975. These new standards (1.5 gm/mi HC, 15 gm/mi CO, and 3.0 gm/mi NOx) were met using an oxidation catalytic converter. This new technology was the beginning of a long series of technology improvements that resulted in both large decreases in emissions and significant increases in fuel economy. This is illustrated in Figure 2 (Reference 1) for the period 1975-1982. During this period, vehicle exhaust emissions were reduced to .4 gm/mi HC, 3.4 gm/mi CO, and 1.0 gm/mi NOx and the average fuel economy of the new car fleet doubled from 12 to 24 mpg. The large reduction in NOx emissions was made possible through the introduction of three-way oxidation/reduction catalytic converters, electronic ignition, fuel injection, and engine computer control. Improvements in these technologies in the period 1990-present have resulted in further reductions in vehicle emissions to the current California ULEV and SULEV standards. These California emission and the EPA Tier 2 standards are summarized in Table 1. Several auto companies are marketing mid-size passenger cars in 2003 that meet the SULEV standards and have near –zero evaporative emissions. In California, these vehicles are termed PZEVs (partial zero-emission vehicles). Hence the new technology introduced in automobiles in less than 30 years has resulted in the reduction of HC and NOx emissions by more than 99%.
2.2 Fuel economy (CAFE)
In 1975, the Congress passed the Energy Policy and Conservation Act which established Corporate Average Fuel Economy Standards (CAFE) for passenger cars. The

5
standards (Table 2) became effective in 1978 starting at 18 mpg increasing to 27.5 mpg in 1985. The rate of increase in mpg was highest in the period 1980-1984. Light truck CAFE standards were also established starting at 17.5 mpg in 1982 increasing to 20.7 mpg in 1996. These standards are currently applicable to light trucks, minivans, and sport utility vehicles. The light truck standard will increase by 1.5 mpg to 22.2 mpg in 2007.
Figure 2 Sales-weighted fuel economy history for GM cars
Introduction of Catalytic Converters
22
24.123.2
21.9
19.119.0
17.816.7
12.0
15.4
24
2019
18
1011121314151617181920212223242526
1974 1975 1976 1977 1978 1979 1980 1981 1982
Year
Regulated
Source: Mondt, Reference 1.
The auto industry was successful in increasing fuel economy in the early years
(1978-1985) when the standards were changing significantly from year to year. During that period, many vehicles (especially in the larger vehicle classes) were downsized with significant weight reductions. This redesign of the vehicles and the incorporation of engine improvements needed to meet the changes in the emission standards imposed in the same period resulted in large increases in fleet fuel economy. Since 1985, the fleet average fuel economy of passenger cars has changed very little remaining at about 28 mpg. Engines with variable valve actuation/timing and 4, 5, and 6 speed automatic transmissions with lockup in several of the gears have been introduced in more recent years. These technology improvements result in increased driveline efficiency and the potential for increased fuel economy, but the auto industry has utilized them to increase vehicle performance (decrease 0-60 mph acceleration times). Mid-size cars are now marketed (2003) with 4 cylinder (160 HP) engines and 4-speed automatic transmissions that have a composite fuel economy of 32 mpg (uncorrected), which is well above the CAFÉ standard of 27.5 mpg. These cars have a 0-60 mph acceleration time of 8.5 sec and meet the California SULEV emission standard (designated PZEVs).
6
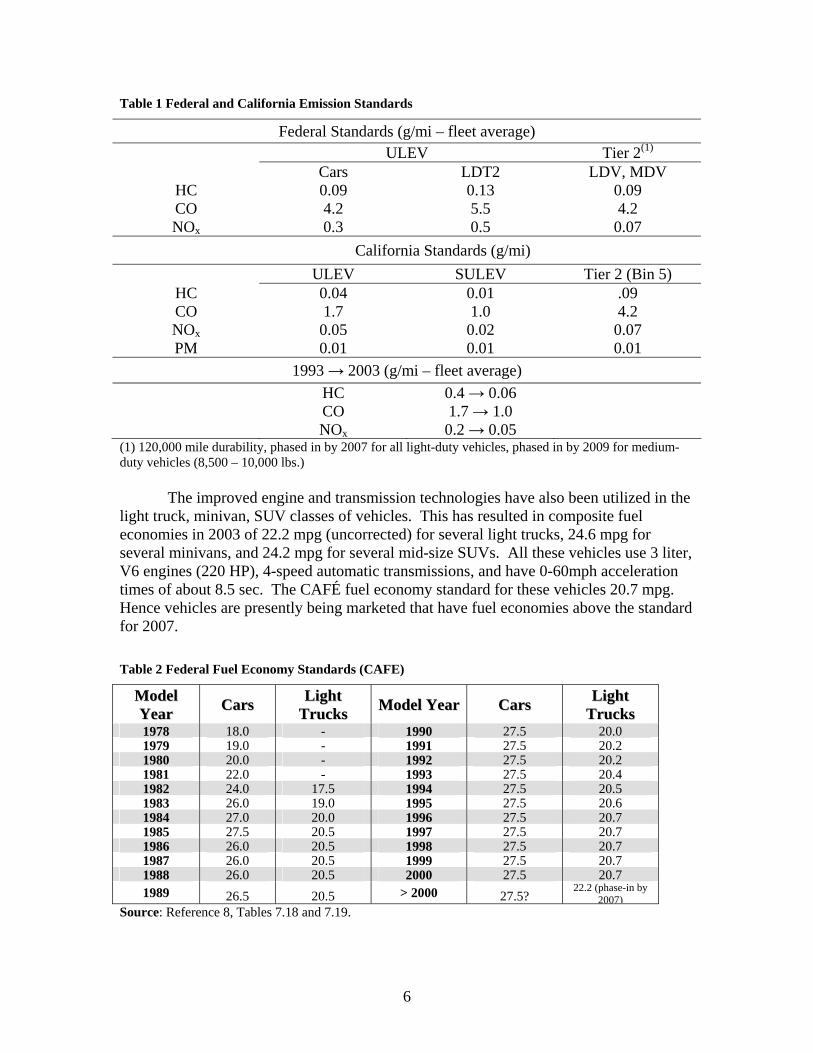
Table 1 Federal and California Emission Standards
Federal Standards (g/mi – fleet average) ULEV Tier 2(1)
Cars LDT2 LDV, MDV HC 0.09 0.13 0.09 CO 4.2 5.5 4.2 NOx 0.3 0.5 0.07
California Standards (g/mi) ULEV SULEV Tier 2 (Bin 5)
HC 0.04 0.01 .09 CO 1.7 1.0 4.2 NOx 0.05 0.02 0.07 PM 0.01 0.01 0.01
1993 → 2003 (g/mi – fleet average) HC 0.4 → 0.06 CO 1.7 → 1.0 NOx 0.2 → 0.05
(1) 120,000 mile durability, phased in by 2007 for all light-duty vehicles, phased in by 2009 for medium-duty vehicles (8,500 – 10,000 lbs.)
The improved engine and transmission technologies have also been utilized in the
light truck, minivan, SUV classes of vehicles. This has resulted in composite fuel economies in 2003 of 22.2 mpg (uncorrected) for several light trucks, 24.6 mpg for several minivans, and 24.2 mpg for several mid-size SUVs. All these vehicles use 3 liter, V6 engines (220 HP), 4-speed automatic transmissions, and have 0-60mph acceleration times of about 8.5 sec. The CAFÉ fuel economy standard for these vehicles 20.7 mpg. Hence vehicles are presently being marketed that have fuel economies above the standard for 2007.
Table 2 Federal Fuel Economy Standards (CAFE)
MMooddeell YYeeaarr CCaarrss LLiigghhtt
TTrruucckkss MMooddeell YYeeaarr CCaarrss LLiigghhtt TTrruucckkss
1978 18.0 - 1990 27.5 20.0 1979 19.0 - 1991 27.5 20.2 1980 20.0 - 1992 27.5 20.2 1981 22.0 - 1993 27.5 20.4 1982 24.0 17.5 1994 27.5 20.5 1983 26.0 19.0 1995 27.5 20.6 1984 27.0 20.0 1996 27.5 20.7 1985 27.5 20.5 1997 27.5 20.7 1986 26.0 20.5 1998 27.5 20.7 1987 26.0 20.5 1999 27.5 20.7 1988 26.0 20.5 2000 27.5 20.7 1989 26.5 20.5 > 2000 27.5?
22.2 (phase-in by 2007)
Source: Reference 8, Tables 7.18 and 7.19.
7
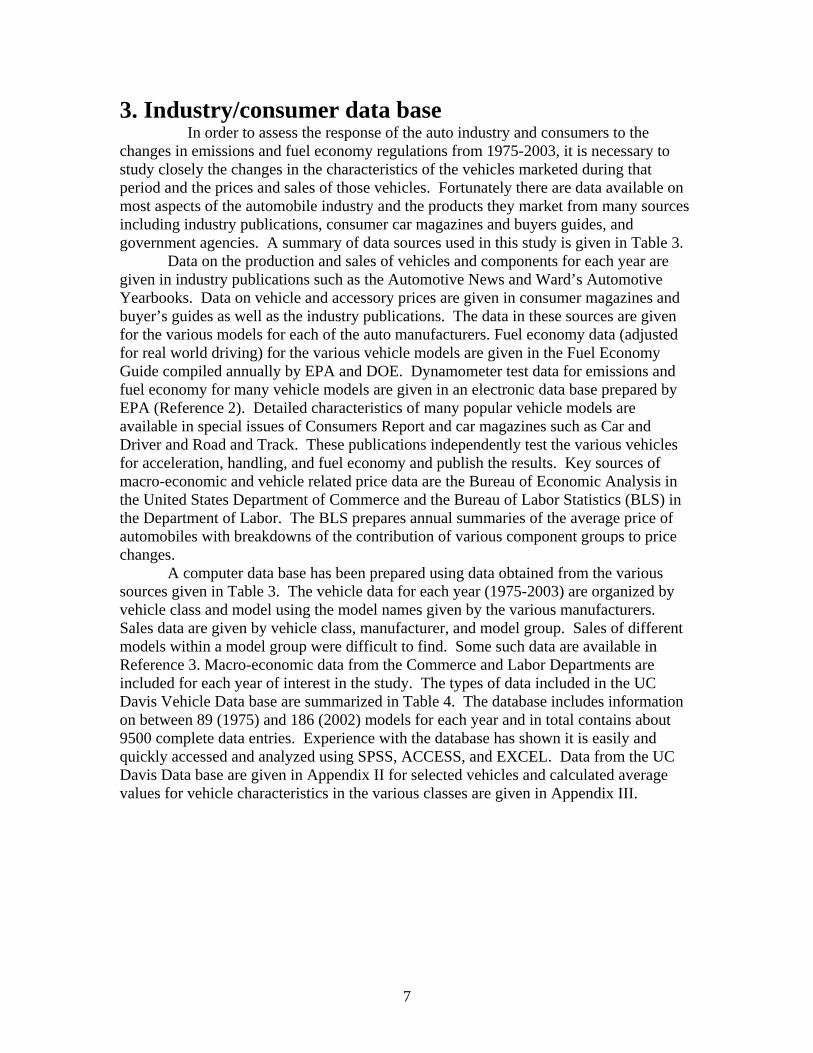
3. Industry/consumer data base In order to assess the response of the auto industry and consumers to the
changes in emissions and fuel economy regulations from 1975-2003, it is necessary to study closely the changes in the characteristics of the vehicles marketed during that period and the prices and sales of those vehicles. Fortunately there are data available on most aspects of the automobile industry and the products they market from many sources including industry publications, consumer car magazines and buyers guides, and government agencies. A summary of data sources used in this study is given in Table 3.
Data on the production and sales of vehicles and components for each year are given in industry publications such as the Automotive News and Ward’s Automotive Yearbooks. Data on vehicle and accessory prices are given in consumer magazines and buyer’s guides as well as the industry publications. The data in these sources are given for the various models for each of the auto manufacturers. Fuel economy data (adjusted for real world driving) for the various vehicle models are given in the Fuel Economy Guide compiled annually by EPA and DOE. Dynamometer test data for emissions and fuel economy for many vehicle models are given in an electronic data base prepared by EPA (Reference 2). Detailed characteristics of many popular vehicle models are available in special issues of Consumers Report and car magazines such as Car and Driver and Road and Track. These publications independently test the various vehicles for acceleration, handling, and fuel economy and publish the results. Key sources of macro-economic and vehicle related price data are the Bureau of Economic Analysis in the United States Department of Commerce and the Bureau of Labor Statistics (BLS) in the Department of Labor. The BLS prepares annual summaries of the average price of automobiles with breakdowns of the contribution of various component groups to price changes.
A computer data base has been prepared using data obtained from the various sources given in Table 3. The vehicle data for each year (1975-2003) are organized by vehicle class and model using the model names given by the various manufacturers. Sales data are given by vehicle class, manufacturer, and model group. Sales of different models within a model group were difficult to find. Some such data are available in Reference 3. Macro-economic data from the Commerce and Labor Departments are included for each year of interest in the study. The types of data included in the UC Davis Vehicle Data base are summarized in Table 4. The database includes information on between 89 (1975) and 186 (2002) models for each year and in total contains about 9500 complete data entries. Experience with the database has shown it is easily and quickly accessed and analyzed using SPSS, ACCESS, and EXCEL. Data from the UC Davis Data base are given in Appendix II for selected vehicles and calculated average values for vehicle characteristics in the various classes are given in Appendix III.

8
Table 3 Data Sources used in the report and the assembly of the UC Davis Vehicle Database
Source Data Description
U.S. Environmental Protection Agency, Fuel Economy Guide Database, 1978-2002, See: http://www.epa.gov/otaq/fedata.htm.
See Table 2.
U.S. Environmental Protection Agency, Test Car List Database, 1984-2002, See: http://www.epa.gov/otaq/tcldata.htm.
See Table 2.
Ward’s Communications (Various Years) Ward’s Automotive Yearbook. Annual. New York: Primedia, Inc., 1970-2002.
See Table 2.
Consumer Reports (Various Years) Annual Auto Issue. Mount Vernon, NY: Consumers Union. 1975-2003.
See Table 2.
Database
U.S. Department of Commerce, Bureau of Economic Analysis, Office of Automotive Affairs. See: http://www.ita.doc.gov/td/auto/qfact.html.
Average transaction price, motor vehicle output and sales, motor vehicle industry corporate profits, employment, and personal income.
U.S. Department of Labor, Bureau of Labor Statistics (2003) Consumer Price Index—All Urban Consumers, http://www.bls.gov/cpihome.htm.
Consumer Price Indices
U.S. Department of Labor, Bureau of Labor Statistics (2003) Producer Price Index, http://www.bls.gov/ppihome.htm.
Producer Price Indices
Automotive News (Various Years) Market Data Book. Detroit: Crain Communications, 1980-2003.
Confirmation and addition to Ward’s data
U.S. Census Bureau, Historical Income Tables - Households, See: http://www.census.gov/hhes/income/histinc/h05.html
Household Income
Davis, Stacy G. (2002) Transportation Energy Data Book: Edition 22. Oak Ridge National Laboratory, U.S. Department of Energy. See: http://www-cta.ornl.gov/cta/data/Index.html
Comprehensive collection of relevant transportation data.
Hellman, Karl H. and Heavenrich, Robert M. (2003) Light-Duty Automotive and Fuel Economy Trends: 1975 Through 2003. U.S. Environmental Protection Agency, Office of Mobile Sources, April 2003. (EPA420-R-03-006) See: http://www.epa.gov/otaq/cert/mpg/fetrends/r03006.pdf
Latest annual report tracking fuel economy and vehicle attribute trends.
Tables &
Figures
9
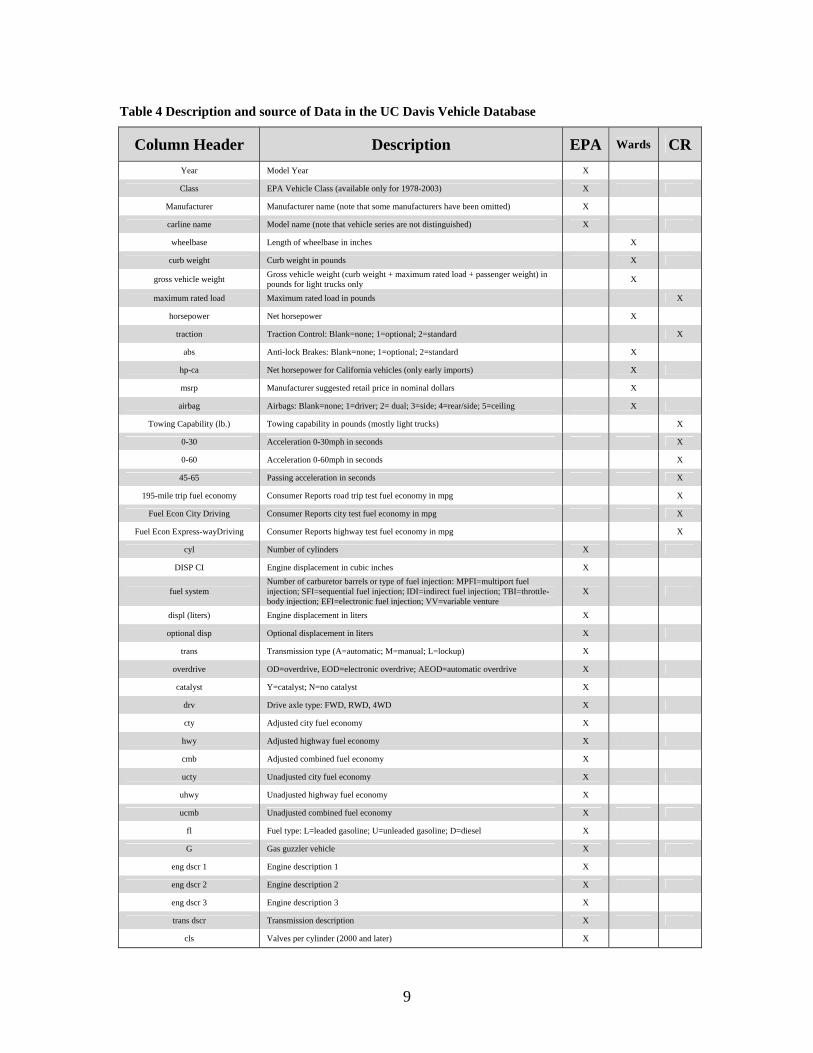
Table 4 Description and source of Data in the UC Davis Vehicle Database
Column Header Description EPA Wards CR Year Model Year X
Class EPA Vehicle Class (available only for 1978-2003) X
Manufacturer Manufacturer name (note that some manufacturers have been omitted) X
carline name Model name (note that vehicle series are not distinguished) X
wheelbase Length of wheelbase in inches X
curb weight Curb weight in pounds X
gross vehicle weight Gross vehicle weight (curb weight + maximum rated load + passenger weight) in pounds for light trucks only X
maximum rated load Maximum rated load in pounds X
horsepower Net horsepower X
traction Traction Control: Blank=none; 1=optional; 2=standard X
abs Anti-lock Brakes: Blank=none; 1=optional; 2=standard X
hp-ca Net horsepower for California vehicles (only early imports) X
msrp Manufacturer suggested retail price in nominal dollars X
airbag Airbags: Blank=none; 1=driver; 2= dual; 3=side; 4=rear/side; 5=ceiling X
Towing Capability (lb.) Towing capability in pounds (mostly light trucks) X
0-30 Acceleration 0-30mph in seconds X
0-60 Acceleration 0-60mph in seconds X
45-65 Passing acceleration in seconds X
195-mile trip fuel economy Consumer Reports road trip test fuel economy in mpg X
Fuel Econ City Driving Consumer Reports city test fuel economy in mpg X
Fuel Econ Express-wayDriving Consumer Reports highway test fuel economy in mpg X
cyl Number of cylinders X
DISP CI Engine displacement in cubic inches X
fuel system Number of carburetor barrels or type of fuel injection: MPFI=multiport fuel injection; SFI=sequential fuel injection; IDI=indirect fuel injection; TBI=throttle-body injection; EFI=electronic fuel injection; VV=variable venture
X
displ (liters) Engine displacement in liters X
optional disp Optional displacement in liters X
trans Transmission type (A=automatic; M=manual; L=lockup) X
overdrive OD=overdrive, EOD=electronic overdrive; AEOD=automatic overdrive X
catalyst Y=catalyst; N=no catalyst X
drv Drive axle type: FWD, RWD, 4WD X
cty Adjusted city fuel economy X
hwy Adjusted highway fuel economy X
cmb Adjusted combined fuel economy X
ucty Unadjusted city fuel economy X
uhwy Unadjusted highway fuel economy X
ucmb Unadjusted combined fuel economy X
fl Fuel type: L=leaded gasoline; U=unleaded gasoline; D=diesel X
G Gas guzzler vehicle X
eng dscr 1 Engine description 1 X
eng dscr 2 Engine description 2 X
eng dscr 3 Engine description 3 X
trans dscr Transmission description X
cls Valves per cylinder (2000 and later) X

10
4. Industry response In this section of the report, the industry response is described and analyzed in
terms of historical trends in changes in technology, weight/size and performance characteristics, and prices for vehicles marketed in the various vehicle classes. These changes can be overlayed with the emissions and fuel economy regulations and economic activity in the years of interest (1975-2003). When possible, special consideration will be given to changes directly related to California emission standards that are in some years significantly different than those of most other states.
4.1 Historical review of technology changes
This review of technology changes in autos and other light duty vehicles is concerned with the period 1975 to the present. Development of emission control technology started in the 1960s (Reference 1) with the advent of the early emission standards in California and the Clean Air Acts of 1963 and 1965, but the technology developments of interest in this study are those that have been the major contributors to the achievement of the present ultra-clean vehicles (ULEV and SULEV) and the large improvements in fuel economy that followed the imposition of the CAFE standards in 1978. It is those technology changes along with the battery and electric driveline developments from the ZEV Mandate (Reference 4), which will form the foundation for future vehicle designs that can result in significant reductions in CO2 emissions from those vehicles. It is of interest to note that many of the technologies developed to meet the stringent emission standards have played a large role in improving fuel economy and the performance of the vehicles presently being marketed. In this section, technologies are identified and the time periods in which they were introduced cited in relationship to the changing emissions and fuel economy regulations. For each of the technology changes, their consequences relative to improvements in vehicle emissions and fuel economy and the years of large scale introduction are presented in Appendix I. Time-lines for the introduction of the technologies are shown graphically in Figure 3 in a form that can be compared easily with a similar presentation of the time-lines for the changes in regulations. The technology time-lines will be used in later sections of the report to compare with time-based changes in vehicle price and sales.
As shown in Figure 3, the periods of most rapid technology change were the second half of the 1970s and the first half of the 1980s. The first changes in the 1970s were a downsizing of the cars both in terms of size (wheel base) and weight in order to increase fuel economy. This downsizing involved primarily the larger cars (mid- and full-size). Weight reductions of 1000-1200 lbs were achieved in the full-size cars. In addition, many of the car designs were changed to front-wheel drive as part of the downsizing. During this period, closer attention was given to aerodynamics with the resultant decrease of 10-20% in the drag coefficient of the vehicles. Further reductions in road load were achieved by the use of improved radial tires with lower rolling resistance. Accessory loads were reduced where possible. For example, electric radiator cooling fans replaced the fans driven off the engine. In general, maximum engine power was reduced with the utilization of 4 –cylinder engines and V-6s in place of V-8s. Vehicle acceleration times remained relatively unchanged during this period. Most of the larger
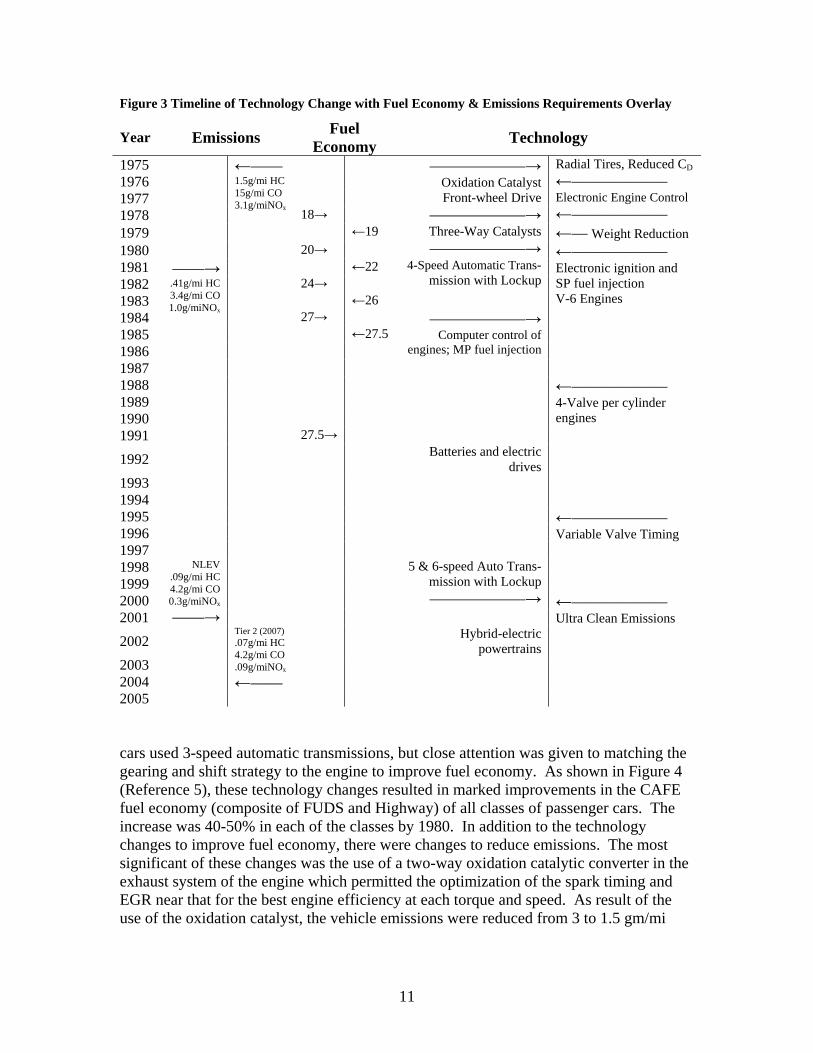
11
Figure 3 Timeline of Technology Change with Fuel Economy & Emissions Requirements Overlay
Year Emissions Fuel Economy Technology
1975 1976
——————→ Oxidation Catalyst
Radial Tires, Reduced CD ←——————
1977 1978
←——1.5g/mi HC 15g/mi CO 3.1g/miNOx
18→ Front-wheel Drive
——————→ Electronic Engine Control ←——————
1979 ←19 ←— Weight Reduction 1980 20→ 1981 ←22 1982 24→
Three-Way Catalysts ——————→
4-Speed Automatic Trans-mission with Lockup
1983 ←26 1984
——→ .41g/mi HC 3.4g/mi CO 1.0g/miNOx
27→
←—————— Electronic ignition and SP fuel injection V-6 Engines
1985 ←27.5 1986 1987
——————→Computer control of
engines; MP fuel injection
1988 1989 1990
←—————— 4-Valve per cylinder engines
1991 27.5→
1992 Batteries and electric drives
1993 1994 1995 1996 1997
←—————— Variable Valve Timing
1998 1999 2000
5 & 6-speed Auto Trans-mission with Lockup ——————→
2001
NLEV .09g/mi HC 4.2g/mi CO 0.3g/miNOx ——→
2002 Hybrid-electric powertrains
←—————— Ultra Clean Emissions
2003 2004 2005
Tier 2 (2007) .07g/mi HC 4.2g/mi CO .09g/miNOx
←——
cars used 3-speed automatic transmissions, but close attention was given to matching the gearing and shift strategy to the engine to improve fuel economy. As shown in Figure 4 (Reference 5), these technology changes resulted in marked improvements in the CAFE fuel economy (composite of FUDS and Highway) of all classes of passenger cars. The increase was 40-50% in each of the classes by 1980. In addition to the technology changes to improve fuel economy, there were changes to reduce emissions. The most significant of these changes was the use of a two-way oxidation catalytic converter in the exhaust system of the engine which permitted the optimization of the spark timing and EGR near that for the best engine efficiency at each torque and speed. As result of the use of the oxidation catalyst, the vehicle emissions were reduced from 3 to 1.5 gm/mi

12
HC, 28 to 15 gm/mi CO, and 3 to 2 gm/mi NOx and at the same time the fuel economy was improved as previously cited.
A second period of rapid technology change was initiated in early 1980s with the change in the emission standard to .4 gm/mi HC, 3.4 gm/mi CO, and 1 gm/mi NOx. These reductions in the emission standards lead to the use of a three-way, oxidation/reduction catalytic converter in place of the two-way, oxidation catalytic converter. For the three-way catalyst to function at high conversion efficiency for all three pollutants, the engine air-fuel ratio must be maintained very near (within about 1%) to stoichiometric. To operate the engine in this manner required several new engine technologies- namely, fuel injection, electronic ignition, an O2 sensor, and computer control of engine operation. By 1985, nearly all new passenger cars were equipped with these new technologies, which in addition to greatly reducing emissions, also resulted in continued improvements in fuel economy. Note from Figure 4 that the average CAFE fuel economy of small cars increased to 30 mpg, that of mid-size cars to 25 mpg, and that of large cars to 22 mpg. During this period, the 0-60 mph acceleration times decreased by about 1.5 seconds. This was the beginning of a trend in decreasing acceleration times that would continue up to the present time.
Figure 4 History of Passenger Car Fuel Economy (CAFE)
10
15
20
25
30
35
1976 1980 1985 1990 1995 2000 2001
mpg
Subcompact
Compact
Midsize
Large
Source: Reference 8, Table 7.7.
In the period 1985-1995, the emissions and fuel economy standards remained essentially unchanged except for the beginning of the tightening of emission standards in California as part of the LEVI program. During this period, the auto industry refined the advanced engine control technologies introduced in the first part of the 1980s. In addition, there was considerable engine development resulting in the introduction of 4-valve per cylinder engines and increases in the compression ratio from 8.5 to 9.5 or higher. This resulted in higher engine efficiency and large improvements in engine specific power (HP/liter displacement). In addition, 4-speed automatic transmissions with lockup in 4th gear were developed and utilized in the larger cars. The average CAFÉ fuel economy for small and mid-size cars remained essentially unchanged during this period, but the average fuel economy of the large cars increased to 25 mpg. The acceleration times decreased continuously reaching 10-11 seconds from 13 seconds ten years earlier. Hence the improvements in engine and transmission technologies developed from 1985-1995 were utilized primarily to improve vehicle performance rather than fuel economy. Nevertheless, these technology improvements were significant and

13
set the stage for even more impressive developments in the future. Note from Figure 5 that even for new technologies that have clear advantages, it takes 10-15 years before the old technology is almost completely replaced by the new technology.
Figure 5 Car Technology Penetration Years after Significant Use
Source: Reference 29, p.27, Figures 26 & 27.
Consider next the period from 1995 to the present (2003). During this period, the
refinement of the engine and transmission technologies continued. In the case of engines, the multi-point fuel injection systems were developed, compression ratio was further increased with some engines having a ratio of 10 or greater, and variable valve actuation/timing was introduced by several auto companies. These new technologies resulted in further improvements in engine efficiency and exhaust emissions. By 2003, Honda, Toyota, Ford, Volvo, and several other manufacturers were marketing cars that meet the California SULEV standard (see Table 1). Most of the auto companies are marketing some cars that meet the California ULEV standard. Transmission development continued with the introduction of 5 –speed automatic transmissions with lockup in several gears. The combination of engine and transmission improvements has lead to significant improvements in fuel economy. For example, the 2003 Honda Accord has a composite CAFÉ fuel economy of 32.3 mpg along with its SULEV emissions. This fuel economy is 17% greater than the 27.5 mpg CAFÉ standard. The Accord has a 4 cylinder, 160 HP engine and a 5-speed automatic transmission resulting in a 0-60 mph acceleration time of 9 seconds. Many mid- and full-size cars have V-6 engines. These cars have lower fuel economy and better acceleration times than the 4-cylinder versions and presently meet only the ULEV emission standard. It can be expected that the advanced engine technologies cited above will be further improved and be used in most of the cars of all classes in the near future (within five years).
14
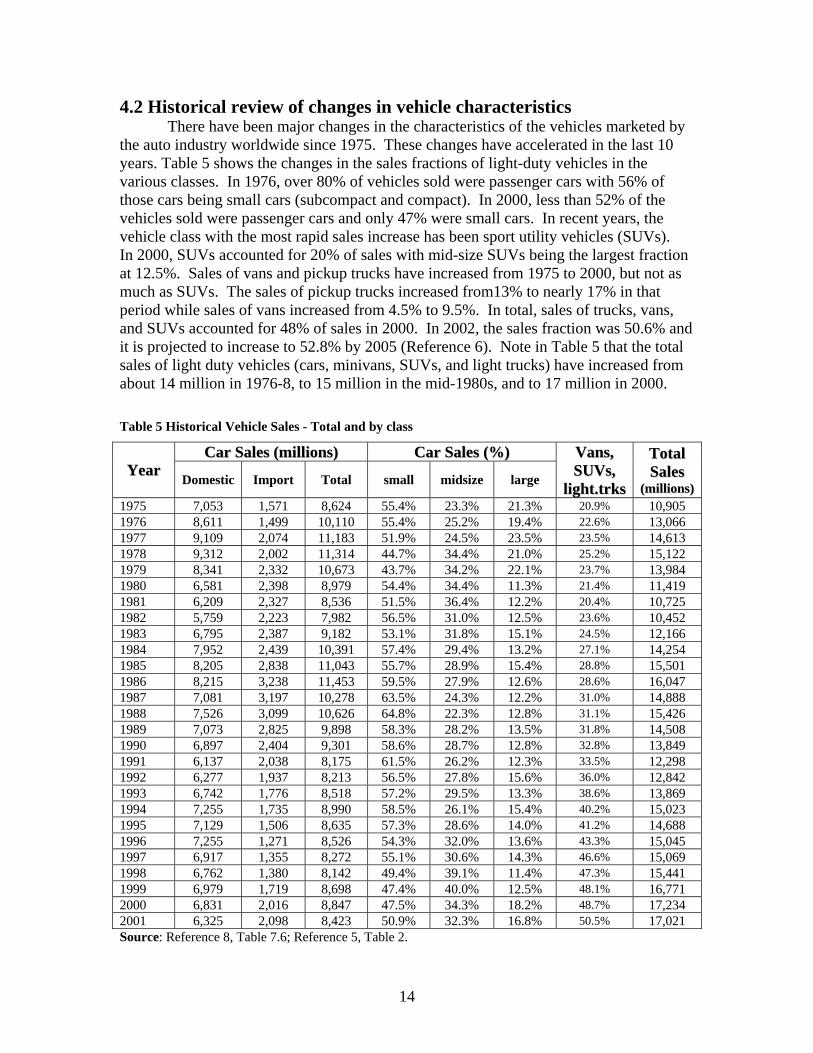
4.2 Historical review of changes in vehicle characteristics There have been major changes in the characteristics of the vehicles marketed by the auto industry worldwide since 1975. These changes have accelerated in the last 10 years. Table 5 shows the changes in the sales fractions of light-duty vehicles in the various classes. In 1976, over 80% of vehicles sold were passenger cars with 56% of those cars being small cars (subcompact and compact). In 2000, less than 52% of the vehicles sold were passenger cars and only 47% were small cars. In recent years, the vehicle class with the most rapid sales increase has been sport utility vehicles (SUVs). In 2000, SUVs accounted for 20% of sales with mid-size SUVs being the largest fraction at 12.5%. Sales of vans and pickup trucks have increased from 1975 to 2000, but not as much as SUVs. The sales of pickup trucks increased from13% to nearly 17% in that period while sales of vans increased from 4.5% to 9.5%. In total, sales of trucks, vans, and SUVs accounted for 48% of sales in 2000. In 2002, the sales fraction was 50.6% and it is projected to increase to 52.8% by 2005 (Reference 6). Note in Table 5 that the total sales of light duty vehicles (cars, minivans, SUVs, and light trucks) have increased from about 14 million in 1976-8, to 15 million in the mid-1980s, and to 17 million in 2000. Table 5 Historical Vehicle Sales - Total and by class
CCaarr SSaalleess ((mmiilllliioonnss)) CCaarr SSaalleess ((%%)) YYeeaarr Domestic Import Total small midsize large
VVaannss,, SSUUVVss,,
lliigghhtt..ttrrkkss
TToottaall SSaalleess
((mmiilllliioonnss)) 1975 7,053 1,571 8,624 55.4% 23.3% 21.3% 20.9% 10,905 1976 8,611 1,499 10,110 55.4% 25.2% 19.4% 22.6% 13,066 1977 9,109 2,074 11,183 51.9% 24.5% 23.5% 23.5% 14,613 1978 9,312 2,002 11,314 44.7% 34.4% 21.0% 25.2% 15,122 1979 8,341 2,332 10,673 43.7% 34.2% 22.1% 23.7% 13,984 1980 6,581 2,398 8,979 54.4% 34.4% 11.3% 21.4% 11,419 1981 6,209 2,327 8,536 51.5% 36.4% 12.2% 20.4% 10,725 1982 5,759 2,223 7,982 56.5% 31.0% 12.5% 23.6% 10,452 1983 6,795 2,387 9,182 53.1% 31.8% 15.1% 24.5% 12,166 1984 7,952 2,439 10,391 57.4% 29.4% 13.2% 27.1% 14,254 1985 8,205 2,838 11,043 55.7% 28.9% 15.4% 28.8% 15,501 1986 8,215 3,238 11,453 59.5% 27.9% 12.6% 28.6% 16,047 1987 7,081 3,197 10,278 63.5% 24.3% 12.2% 31.0% 14,888 1988 7,526 3,099 10,626 64.8% 22.3% 12.8% 31.1% 15,426 1989 7,073 2,825 9,898 58.3% 28.2% 13.5% 31.8% 14,508 1990 6,897 2,404 9,301 58.6% 28.7% 12.8% 32.8% 13,849 1991 6,137 2,038 8,175 61.5% 26.2% 12.3% 33.5% 12,298 1992 6,277 1,937 8,213 56.5% 27.8% 15.6% 36.0% 12,842 1993 6,742 1,776 8,518 57.2% 29.5% 13.3% 38.6% 13,869 1994 7,255 1,735 8,990 58.5% 26.1% 15.4% 40.2% 15,023 1995 7,129 1,506 8,635 57.3% 28.6% 14.0% 41.2% 14,688 1996 7,255 1,271 8,526 54.3% 32.0% 13.6% 43.3% 15,045 1997 6,917 1,355 8,272 55.1% 30.6% 14.3% 46.6% 15,069 1998 6,762 1,380 8,142 49.4% 39.1% 11.4% 47.3% 15,441 1999 6,979 1,719 8,698 47.4% 40.0% 12.5% 48.1% 16,771 2000 6,831 2,016 8,847 47.5% 34.3% 18.2% 48.7% 17,234 2001 6,325 2,098 8,423 50.9% 32.3% 16.8% 50.5% 17,021 Source: Reference 8, Table 7.6; Reference 5, Table 2.
15
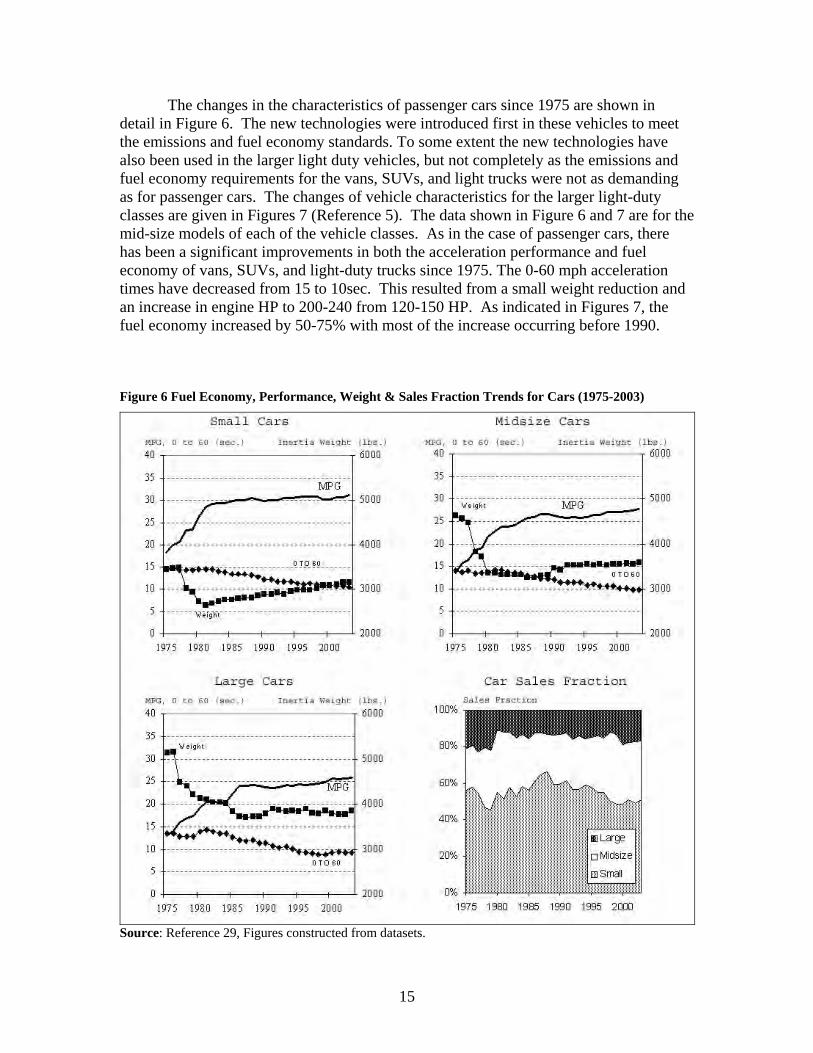
The changes in the characteristics of passenger cars since 1975 are shown in detail in Figure 6. The new technologies were introduced first in these vehicles to meet the emissions and fuel economy standards. To some extent the new technologies have also been used in the larger light duty vehicles, but not completely as the emissions and fuel economy requirements for the vans, SUVs, and light trucks were not as demanding as for passenger cars. The changes of vehicle characteristics for the larger light-duty classes are given in Figures 7 (Reference 5). The data shown in Figure 6 and 7 are for the mid-size models of each of the vehicle classes. As in the case of passenger cars, there has been a significant improvements in both the acceleration performance and fuel economy of vans, SUVs, and light-duty trucks since 1975. The 0-60 mph acceleration times have decreased from 15 to 10sec. This resulted from a small weight reduction and an increase in engine HP to 200-240 from 120-150 HP. As indicated in Figures 7, the fuel economy increased by 50-75% with most of the increase occurring before 1990.
Figure 6 Fuel Economy, Performance, Weight & Sales Fraction Trends for Cars (1975-2003)
Source: Reference 29, Figures constructed from datasets.

16
Figure 7 Fuel Economy, Performance and Weight Trends for Vehicles (1970-2003)
Source: Reference 29, p.36, Figures 33 – 36. After 1990, except for the vans, the fuel economy of the larger light duty vehicles either was flat or showed a slight decrease. As in the case of passenger cars, the emission standards for the vans, SUVs, and pickup trucks were greatly reduced for all three pollutants – HC, CO, and NOx.. The small and mid-size models fall into the LDT2 category with GVWR between 3751 and 5750 lbs. The emission standards for these vehicles are .13 gm/mi HC, 5.5 gm/mi CO, and .3 gm/mi NOx (100,000 miles durability). The emission standards in 1975 were 2, 20, and 3.1 gm/mi for HC, CO, and NOx,
17
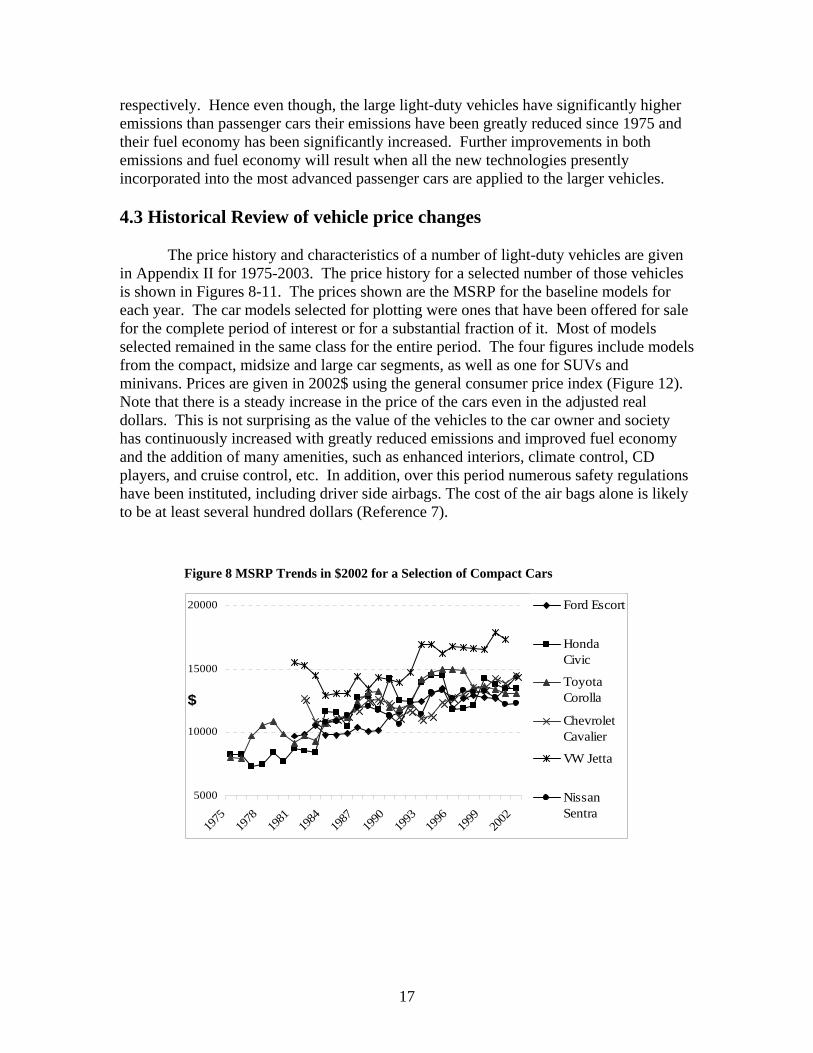
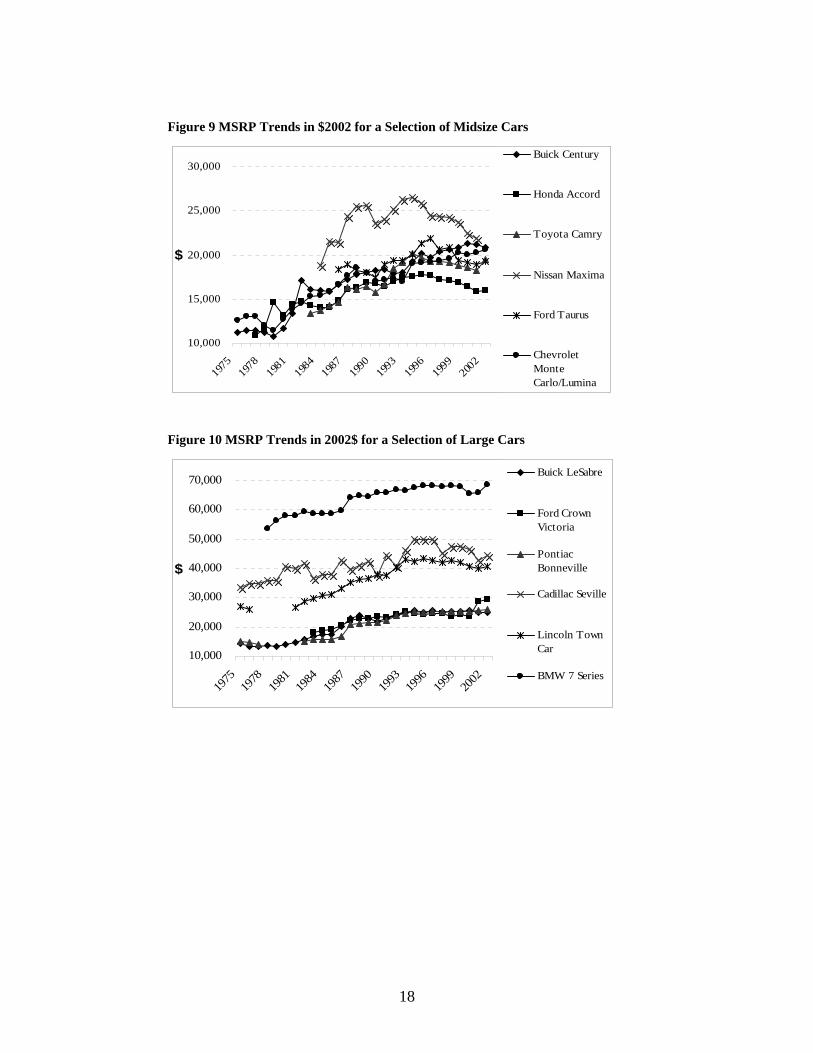
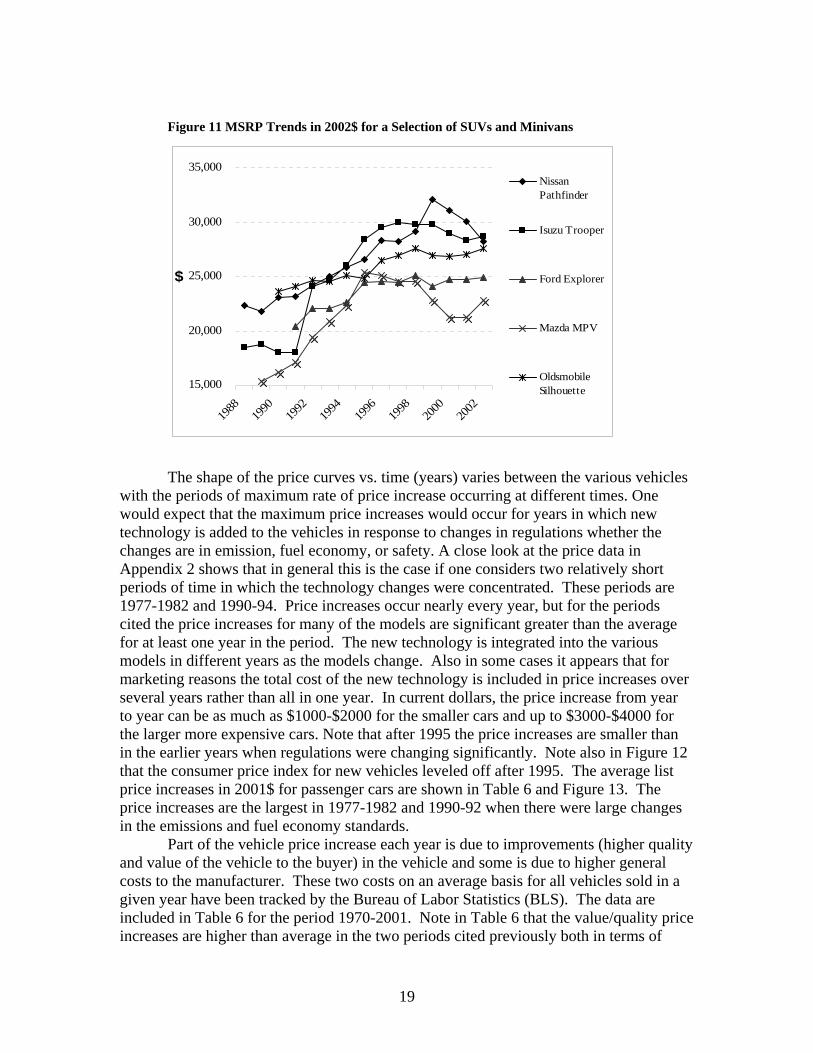
respectively. Hence even though, the large light-duty vehicles have significantly higher emissions than passenger cars their emissions have been greatly reduced since 1975 and their fuel economy has been significantly increased. Further improvements in both emissions and fuel economy will result when all the new technologies presently incorporated into the most advanced passenger cars are applied to the larger vehicles. 4.3 Historical Review of vehicle price changes The price history and characteristics of a number of light-duty vehicles are given in Appendix II for 1975-2003. The price history for a selected number of those vehicles is shown in Figures 8-11. The prices shown are the MSRP for the baseline models for each year. The car models selected for plotting were ones that have been offered for sale for the complete period of interest or for a substantial fraction of it. Most of models selected remained in the same class for the entire period. The four figures include models from the compact, midsize and large car segments, as well as one for SUVs and minivans. Prices are given in 2002$ using the general consumer price index (Figure 12). Note that there is a steady increase in the price of the cars even in the adjusted real dollars. This is not surprising as the value of the vehicles to the car owner and society has continuously increased with greatly reduced emissions and improved fuel economy and the addition of many amenities, such as enhanced interiors, climate control, CD players, and cruise control, etc. In addition, over this period numerous safety regulations have been instituted, including driver side airbags. The cost of the air bags alone is likely to be at least several hundred dollars (Reference 7).
Figure 8 MSRP Trends in $2002 for a Selection of Compact Cars
5000
10000
15000
20000
1975
1978
1981
1984
1987
1990
1993
1996
1999
2002
$
Ford Escort
HondaCivic
ToyotaCorolla
ChevroletCavalier
VW Jetta
NissanSentra
18
Figure 9 MSRP Trends in $2002 for a Selection of Midsize Cars
10,000
15,000
20,000
25,000
30,000
1975
1978
1981
1984
1987
1990
1993
1996
1999
2002
$
Buick Century
Honda Accord
Toyota Camry
Nissan Maxima
Ford Taurus
ChevroletMonteCarlo/Lumina
Figure 10 MSRP Trends in 2002$ for a Selection of Large Cars
10,000
20,000
30,000
40,000
50,000
60,000
70,000
1975
1978
1981
1984
1987
1990
1993
1996
1999
2002
$
Buick LeSabre
Ford CrownVictoria
PontiacBonneville
Cadillac Seville
Lincoln TownCar
BMW 7 Series
19
Figure 11 MSRP Trends in 2002$ for a Selection of SUVs and Minivans
15,000
20,000
25,000
30,000
35,000
1988
1990
1992
1994
1996
1998
2000
2002
$
NissanPathfinder
Isuzu Trooper
Ford Explorer
Mazda MPV
OldsmobileSilhouette
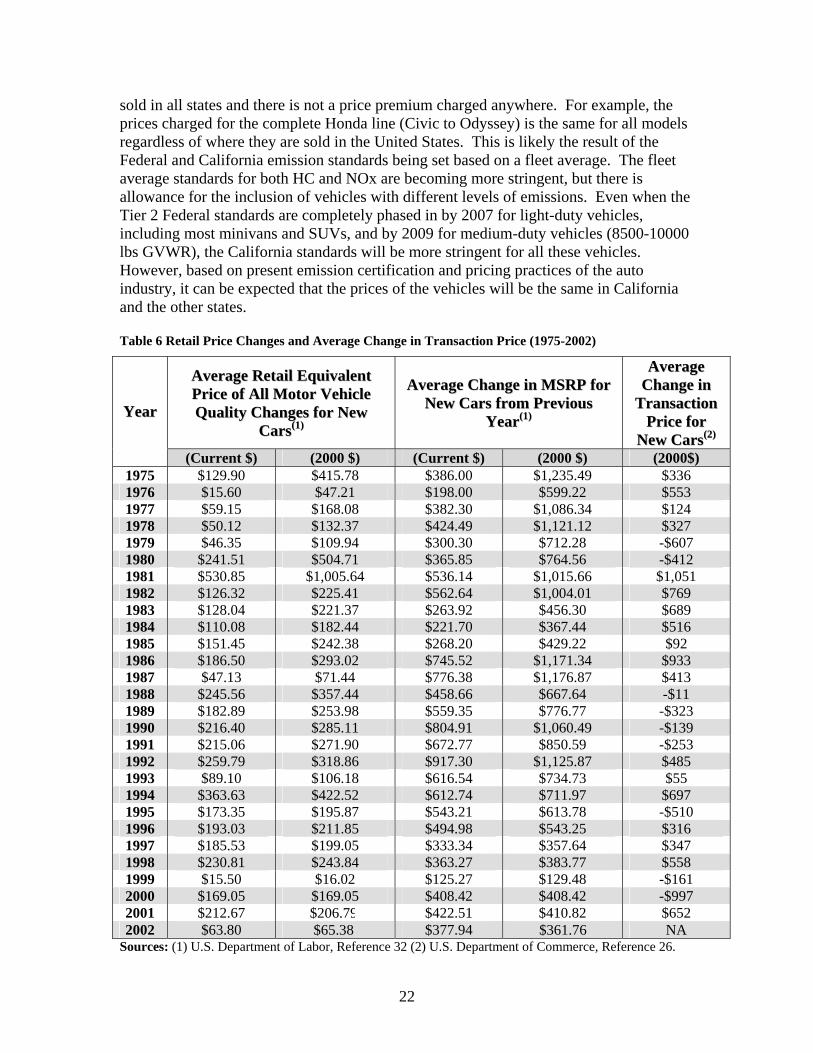
The shape of the price curves vs. time (years) varies between the various vehicles with the periods of maximum rate of price increase occurring at different times. One would expect that the maximum price increases would occur for years in which new technology is added to the vehicles in response to changes in regulations whether the changes are in emission, fuel economy, or safety. A close look at the price data in Appendix 2 shows that in general this is the case if one considers two relatively short periods of time in which the technology changes were concentrated. These periods are 1977-1982 and 1990-94. Price increases occur nearly every year, but for the periods cited the price increases for many of the models are significant greater than the average for at least one year in the period. The new technology is integrated into the various models in different years as the models change. Also in some cases it appears that for marketing reasons the total cost of the new technology is included in price increases over several years rather than all in one year. In current dollars, the price increase from year to year can be as much as $1000-$2000 for the smaller cars and up to $3000-$4000 for the larger more expensive cars. Note that after 1995 the price increases are smaller than in the earlier years when regulations were changing significantly. Note also in Figure 12 that the consumer price index for new vehicles leveled off after 1995. The average list price increases in 2001$ for passenger cars are shown in Table 6 and Figure 13. The price increases are the largest in 1977-1982 and 1990-92 when there were large changes in the emissions and fuel economy standards. Part of the vehicle price increase each year is due to improvements (higher quality and value of the vehicle to the buyer) in the vehicle and some is due to higher general costs to the manufacturer. These two costs on an average basis for all vehicles sold in a given year have been tracked by the Bureau of Labor Statistics (BLS). The data are included in Table 6 for the period 1970-2001. Note in Table 6 that the value/quality price increases are higher than average in the two periods cited previously both in terms of
20
current dollars and 2000$. Most of the quality/value price increase is likely due to the introduction of new technology in the vehicles- both in the powertrain and for safety. The average quality price increases during the peak change years are in excess of $1000 in 2000$.
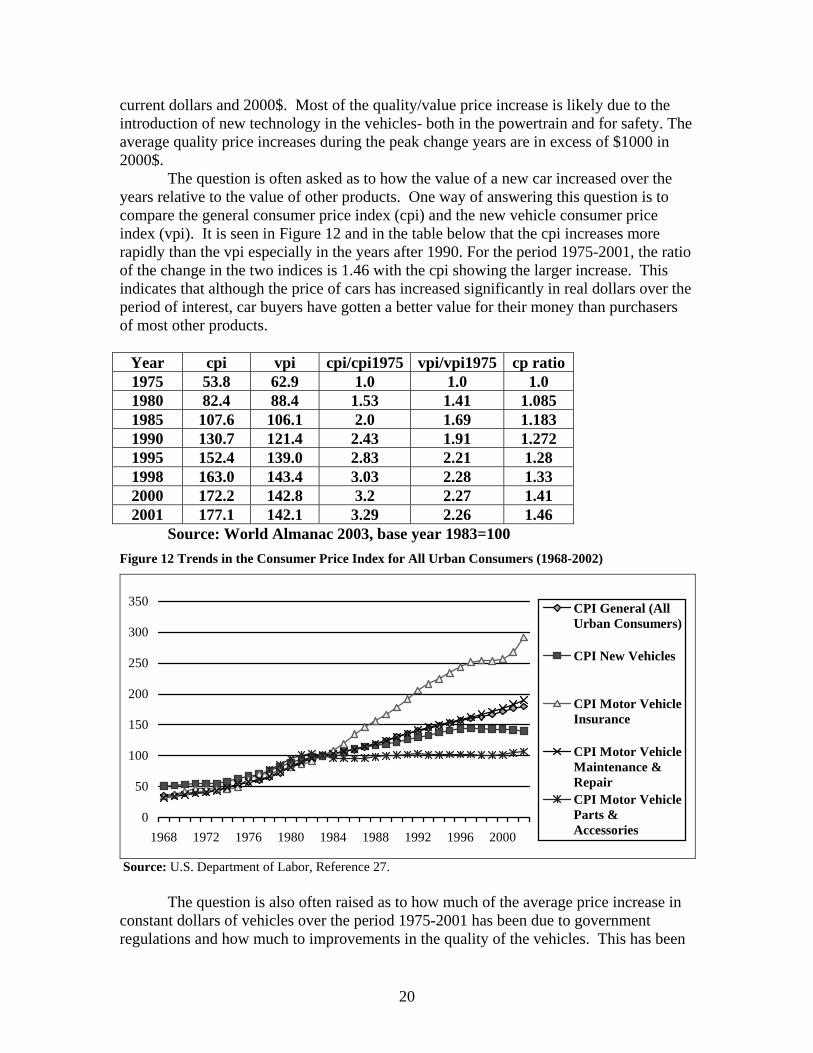
The question is often asked as to how the value of a new car increased over the years relative to the value of other products. One way of answering this question is to compare the general consumer price index (cpi) and the new vehicle consumer price index (vpi). It is seen in Figure 12 and in the table below that the cpi increases more rapidly than the vpi especially in the years after 1990. For the period 1975-2001, the ratio of the change in the two indices is 1.46 with the cpi showing the larger increase. This indicates that although the price of cars has increased significantly in real dollars over the period of interest, car buyers have gotten a better value for their money than purchasers of most other products.
Year cpi vpi cpi/cpi1975 vpi/vpi1975 cp ratio 1975 53.8 62.9 1.0 1.0 1.0 1980 82.4 88.4 1.53 1.41 1.085 1985 107.6 106.1 2.0 1.69 1.183 1990 130.7 121.4 2.43 1.91 1.272 1995 152.4 139.0 2.83 2.21 1.28 1998 163.0 143.4 3.03 2.28 1.33 2000 172.2 142.8 3.2 2.27 1.41 2001 177.1 142.1 3.29 2.26 1.46
Source: World Almanac 2003, base year 1983=100 Figure 12 Trends in the Consumer Price Index for All Urban Consumers (1968-2002)
0
50
100
150
200
250
300
350
1968 1972 1976 1980 1984 1988 1992 1996 2000
CPI General (AllUrban Consumers)
CPI New Vehicles
CPI Motor VehicleInsurance
CPI Motor VehicleMaintenance &RepairCPI Motor VehicleParts &Accessories
Source: U.S. Department of Labor, Reference 27. The question is also often raised as to how much of the average price increase in constant dollars of vehicles over the period 1975-2001 has been due to government regulations and how much to improvements in the quality of the vehicles. This has been
21
estimated in the following manner. In current dollars, the sales-weighted average price of vehicles sold in 1975 was $4345 and in 2001 it was $20896. Applying the vpi index to the 1975 price, the price of the car of the same quality as 1975 would be $9820 in 2001$. Hence the price difference between the 1975 and 2001 quality cars would be $11076. It has been estimated in Ward’s Automotive Yearbook (2002) that the price of regulations in 1975 was $586 resulting in a cost of $1324 in 2001$. Hence without government regulations the cost of the 1975 vehicle in 2001 would have been $8496 and the price difference with the 2001 models would have been $12400. The estimated total price of regulations in 2001 has been estimated by Ward’s to be $4018. Hence the price of the 1975 vehicle with 2001 regulations would have been $12514 resulting in a price difference of $8382 due to quality improvements between 1975 and 2001. Hence the fraction of the price increase in 2001 due to quality improvements is 67.6% and due to government regulation is 32.4%. Next consider what the price of the average vehicle sold would have been if the prices of vehicles had increased between 1975-2001 as fast as the general commodity index cpi. Without government regulations, the price of the 1975 vehicle in 2001 would have been $12368 (3.29 x 3759). Adding the same $12400 price differential determined previously, the price of a 2001 vehicle would be $24748. Hence the actual price in 2001 was 18.5% or $3872 less than it would have been had the auto industry price increases followed the general consumer price index. The average price of vehicles sold in constant dollars have increased by 46% between 1975-2001 rather than by 73% that would have been the case if the prices of the cars had increased the same as general sales items. 4.4 Vehicle prices in California Questions have been asked as to how the prices of vehicles in California might differ from those in most other states because of the more stringent emission standards in California. The Federal and California standards began to be significantly different in 1993 with the implementation of the LEVI standards in California, which reduce the fleet average HC standard from .4 to .04 gm/mi and the NOx standard from .4 to .05 gm/mi by 2004. The lower limits of the California standards are ULEV and SULEV (see Table 1). The Federal emission standards, termed NLEV (National Low Emission Vehicle) or sometimes referred to as the 50-state standard, are .09 gm/mi HC, 4.2 gm/mi CO, and .3 gm/mi NOx. It is not surprising that the auto companies are certifying various models of their passenger cars to different standards ranging from NLEV to SULEV. The certification data given in the EPA emissions data base (Reference 2) indicates that for 2002 (the most recent data available) nearly all the cars are certified to HC less than .09 gm/mi and in some cases less than .05 gm/mi; the NOx certification values are in most cases less than .1 gm/mi and often less than .05 gm/mi; the CO certification values are nearly always less than 1 gm/mi. Even some minivans are being certified at very low values. For example, the Honda Odyssey with the 240HP V6 engine was certified at .057 gm/mi HC, .56 gm/mi CO, and .03 gm/mi NOx. Discussions with technical contacts at Honda and Toyota indicated that those companies do not certify different models for California and the states with less stringent emission standards. In addition, when ULEV and SULEV models are available, they are
22
sold in all states and there is not a price premium charged anywhere. For example, the prices charged for the complete Honda line (Civic to Odyssey) is the same for all models regardless of where they are sold in the United States. This is likely the result of the Federal and California emission standards being set based on a fleet average. The fleet average standards for both HC and NOx are becoming more stringent, but there is allowance for the inclusion of vehicles with different levels of emissions. Even when the Tier 2 Federal standards are completely phased in by 2007 for light-duty vehicles, including most minivans and SUVs, and by 2009 for medium-duty vehicles (8500-10000 lbs GVWR), the California standards will be more stringent for all these vehicles. However, based on present emission certification and pricing practices of the auto industry, it can be expected that the prices of the vehicles will be the same in California and the other states.
Table 6 Retail Price Changes and Average Change in Transaction Price (1975-2002)
AAvveerraaggee RReettaaiill EEqquuiivvaalleenntt PPrriiccee ooff AAllll MMoottoorr VVeehhiiccllee QQuuaalliittyy CChhaannggeess ffoorr NNeeww
CCaarrss((11))
AAvveerraaggee CChhaannggee iinn MMSSRRPP ffoorr NNeeww CCaarrss ffrroomm PPrreevviioouuss
YYeeaarr((11))
AAvveerraaggee CChhaannggee iinn
TTrraannssaaccttiioonn PPrriiccee ffoorr
NNeeww CCaarrss((22))
YYeeaarr
(Current $) (2000 $) (Current $) (2000 $) (2000$) 1975 $129.90 $415.78 $386.00 $1,235.49 $336 1976 $15.60 $47.21 $198.00 $599.22 $553 1977 $59.15 $168.08 $382.30 $1,086.34 $124 1978 $50.12 $132.37 $424.49 $1,121.12 $327 1979 $46.35 $109.94 $300.30 $712.28 -$607 1980 $241.51 $504.71 $365.85 $764.56 -$412 1981 $530.85 $1,005.64 $536.14 $1,015.66 $1,051 1982 $126.32 $225.41 $562.64 $1,004.01 $769 1983 $128.04 $221.37 $263.92 $456.30 $689 1984 $110.08 $182.44 $221.70 $367.44 $516 1985 $151.45 $242.38 $268.20 $429.22 $92 1986 $186.50 $293.02 $745.52 $1,171.34 $933 1987 $47.13 $71.44 $776.38 $1,176.87 $413 1988 $245.56 $357.44 $458.66 $667.64 -$11 1989 $182.89 $253.98 $559.35 $776.77 -$323 1990 $216.40 $285.11 $804.91 $1,060.49 -$139 1991 $215.06 $271.90 $672.77 $850.59 -$253 1992 $259.79 $318.86 $917.30 $1,125.87 $485 1993 $89.10 $106.18 $616.54 $734.73 $55 1994 $363.63 $422.52 $612.74 $711.97 $697 1995 $173.35 $195.87 $543.21 $613.78 -$510 1996 $193.03 $211.85 $494.98 $543.25 $316 1997 $185.53 $199.05 $333.34 $357.64 $347 1998 $230.81 $243.84 $363.27 $383.77 $558 1999 $15.50 $16.02 $125.27 $129.48 -$161 2000 $169.05 $169.05 $408.42 $408.42 -$997 2001 $212.67 $206.79 $422.51 $410.82 $652 2002 $63.80 $65.38 $377.94 $361.76 NA
Sources: (1) U.S. Department of Labor, Reference 32 (2) U.S. Department of Commerce, Reference 26.

23
Figure 13 Average Changes in MSRP vs. Price Changes due to Quality Adjustments
$0$200$400$600$800
$1,000$1,200$1,400
1975 1978 1981 1984 1987 1990 1993 1996 1999 2002
Total Quality Adjustment Price Change MSRP Change
Sources: U.S. Department of Labor, Reference 32 & U.S. Department of Commerce, Reference 26. 5. Consumer response In this section of the report, the responses of consumers to changes in the characteristics and prices of the vehicles offered for sale by the auto industry are presented and analyzed based on historical trends in vehicle sales of various vehicle classes and macro-economic factors. 5.1 Historical review of vehicle sales There are a number of sources (References 5,6, and 8) of vehicle sales information, including sales by class and vehicle characteristics, for the period 1970 to the present (2003). Such information is also available in the UC Davis Vehicle Data Base discussed in Section 3. Total sales of all light-duty vehicles and percent of sales by class are given in Table 5. As noted previously, the sales fractions of the larger light duty vehicles (vans, SUVs, and light trucks) have increased rapidly over the last ten years and are expected to increase further in the years ahead. At the present time (2003), the sales fraction of all cars has decreased to about 50% of the total vehicle sales. The sales fraction of mid-size cars has increased and that of small (subcompact and compact) cars has decreased over the years such that in 2000 the sales fraction for mid-size cars was 37% and that of small cars was 47% of the total automobiles sold. The sales fraction of small cars (subcompact and compact) peaked at 64.8% in 1988. Large cars are a relatively small percentage (15%) of the car market. About 23% of the cars sold in the United States in 2000 were imported. Import sales are largest in California and the Northeast. Total vehicle sales have fluctuated over the years, but with a general increase from about 14 million in the late 1970s to slightly over 17 million by 2000-2001. All of the auto manufacturers offer multiple (two or three) versions of vehicles in each model group. The different vehicles in a model group can have different engines, transmissions, accessories, and/or interior/exterior trim. The key differences of interest in this study are those related to the powertrain – primarily the engine, which can significantly effect the emissions and fuel economy. In many instances, the model options are differentiated by the power rating of the engine and whether it is a 4-cylinder or V6 configuration. Information on sales of various models with different engines is given in Reference 3. Selected data from that database showing the sales breakdown for

24
a number of car, van, and SUV models using different size engines are given in Table 7. Note that unless performance is clearly the prime consideration to the buyer, the majority of the car buyers opt to purchase models with the lower power 4 cylinder engines when they have a choice. Buyers of vans and SUVs tend to purchase higher power V6 engines even when 4 cylinder engines are available. Within each model group, there is a significant price difference of at least $2000-$3000. Sales data seem to indicate that buyers tend to prefer the lower price options in the model group, but as indicated in Table 7, there are still significant sales of the higher priced vehicles in the group. Hence buyers are willing to pay several thousand dollars more if they feel they are receiving higher value in the vehicle, especially when they feel that high power is necessary. Table 7 Sales Breakdown by Engine & Cam Type for 2002 Model Year
Type Small Car Large Car Minivan Small
Truck Large Truck
L4 Gasoline 73.04% 25.33% 2.90% 20.48% L4 Diesel 0.97%
L6 Gasoline 4.92% 0.48% 15.41% 0.82% V6 Gasoline 16.43% 60.51% 97.10% 57.22% 16.02% V8 Gasoline 2.87% 13.59% 5.42% 83.16%
Eng
ine
V12 Gasoline 0.01% 0.08% OHV 13.30% 31.30% 68.00% 20.70% 59.20%
SOHC 32.30% 23.60% 3.20% 27.10% 32.80%
Cam
DOHC 54.40% 45.00% 28.80% 52.20% 8.00% Source: Reference 3, Martech Database. 5.2 Historical review of the effect of fuel prices and macro-economic factors on vehicle sales In the previous section, total vehicle sales and sales by vehicle class were reviewed for the period 1970-2002, but there was no consideration of why the sales varied as they did or how changes in model prices affected their sales. In this section, the influence of the various factors affecting sales are assessed qualitatively to evaluate consumer responses to them. First consider the effect of fuel prices on vehicle sales and fraction of sales in the various vehicle classes. The variation in the price of gasoline from 1975-2001 is shown in Table 8 in terms of current dollars, 1970$, and 2001$. The general consumer price index (cpi) was used to relate the various dollars. The table indicates that in real dollars the price of gasoline has varied significantly and was a maximum during the period 1977-1982 and was relatively flat and low during 1990-1994. Hence the level and large increase in gasoline prices would be expected to be market drivers in 1977-82 and changes in gasoline prices less of a factor in 1990-1994. Table 9 indicates that in 1977-1982 the high gasoline prices resulted in a large shift in the sales of passenger cars to smaller cars with higher fuel economy- compact to subcompact and large to mid-size cars. In addition, as shown in Table 6, the sales of US manufactured cars decreased and
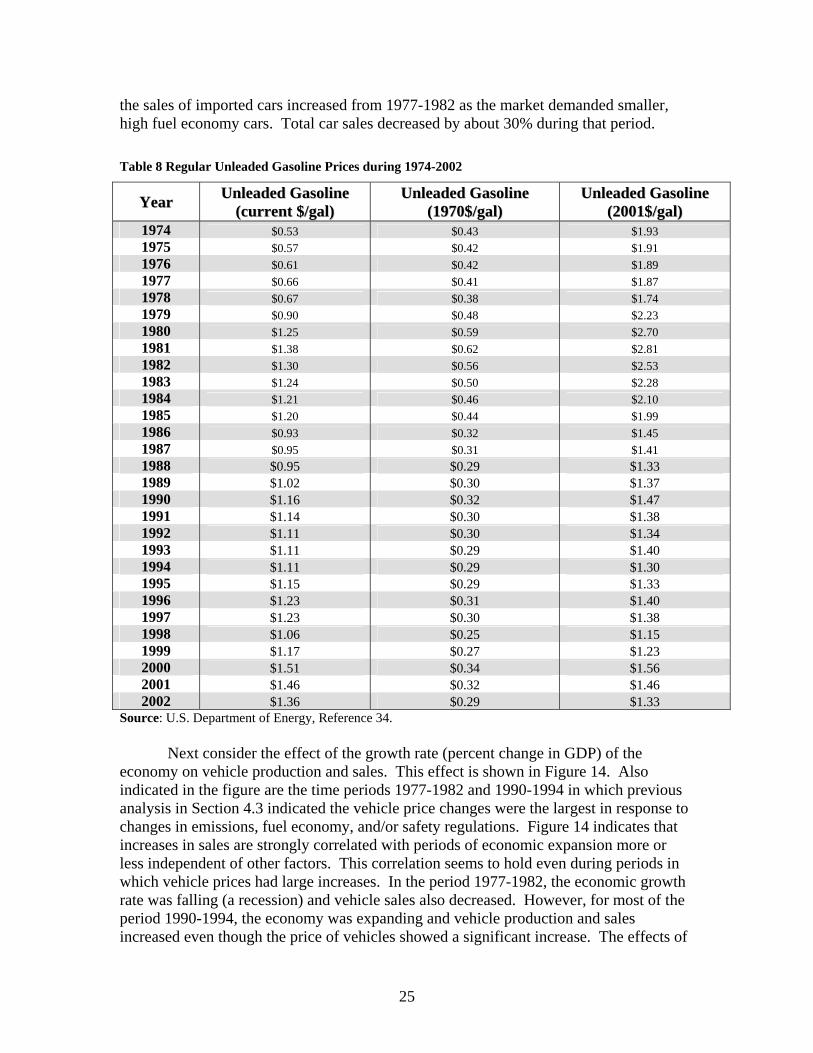
25
the sales of imported cars increased from 1977-1982 as the market demanded smaller, high fuel economy cars. Total car sales decreased by about 30% during that period.
Table 8 Regular Unleaded Gasoline Prices during 1974-2002
YYeeaarr UUnnlleeaaddeedd GGaassoolliinnee ((ccuurrrreenntt $$//ggaall))
UUnnlleeaaddeedd GGaassoolliinnee ((11997700$$//ggaall))
UUnnlleeaaddeedd GGaassoolliinnee ((22000011$$//ggaall))
1974 $0.53 $0.43 $1.93 1975 $0.57 $0.42 $1.91 1976 $0.61 $0.42 $1.89 1977 $0.66 $0.41 $1.87 1978 $0.67 $0.38 $1.74 1979 $0.90 $0.48 $2.23 1980 $1.25 $0.59 $2.70 1981 $1.38 $0.62 $2.81 1982 $1.30 $0.56 $2.53 1983 $1.24 $0.50 $2.28 1984 $1.21 $0.46 $2.10 1985 $1.20 $0.44 $1.99 1986 $0.93 $0.32 $1.45 1987 $0.95 $0.31 $1.41 1988 $0.95 $0.29 $1.33 1989 $1.02 $0.30 $1.37 1990 $1.16 $0.32 $1.47 1991 $1.14 $0.30 $1.38 1992 $1.11 $0.30 $1.34 1993 $1.11 $0.29 $1.40 1994 $1.11 $0.29 $1.30 1995 $1.15 $0.29 $1.33 1996 $1.23 $0.31 $1.40 1997 $1.23 $0.30 $1.38 1998 $1.06 $0.25 $1.15 1999 $1.17 $0.27 $1.23 2000 $1.51 $0.34 $1.56 2001 $1.46 $0.32 $1.46 2002 $1.36 $0.29 $1.33
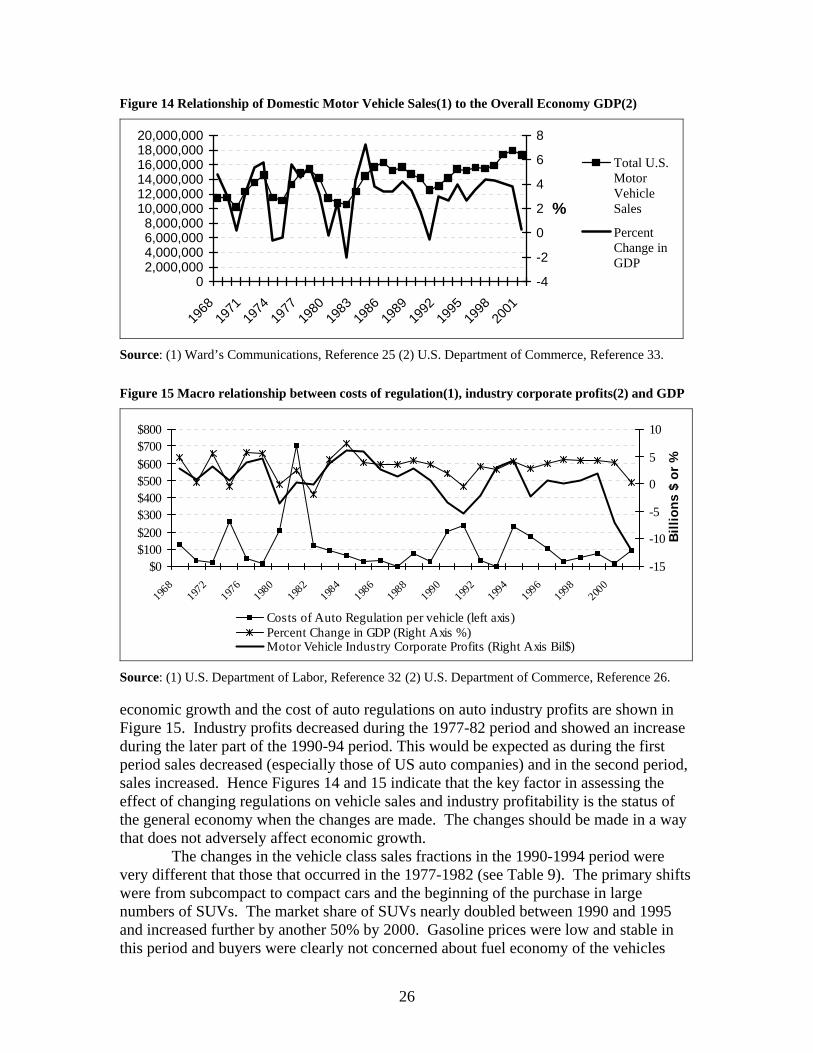
Source: U.S. Department of Energy, Reference 34. Next consider the effect of the growth rate (percent change in GDP) of the
economy on vehicle production and sales. This effect is shown in Figure 14. Also indicated in the figure are the time periods 1977-1982 and 1990-1994 in which previous analysis in Section 4.3 indicated the vehicle price changes were the largest in response to changes in emissions, fuel economy, and/or safety regulations. Figure 14 indicates that increases in sales are strongly correlated with periods of economic expansion more or less independent of other factors. This correlation seems to hold even during periods in which vehicle prices had large increases. In the period 1977-1982, the economic growth rate was falling (a recession) and vehicle sales also decreased. However, for most of the period 1990-1994, the economy was expanding and vehicle production and sales increased even though the price of vehicles showed a significant increase. The effects of
26
Figure 14 Relationship of Domestic Motor Vehicle Sales(1) to the Overall Economy GDP(2)
02,000,0004,000,0006,000,0008,000,000
10,000,00012,000,00014,000,00016,000,00018,000,00020,000,000
1968
1971
1974
1977
1980
1983
1986
1989
1992
1995
1998
2001
-4
-2
0
2
4
6
8
%
Total U.S.MotorVehicleSales
PercentChange inGDP
Source: (1) Ward’s Communications, Reference 25 (2) U.S. Department of Commerce, Reference 33.
Figure 15 Macro relationship between costs of regulation(1), industry corporate profits(2) and GDP
$0$100$200$300$400$500$600$700$800
1968
1972
1976
1980
1982
1984
1986
1988
1990
1992
1994
1996
1998
2000
-15
-10
-5
0
5
10
Billi
ons
$ or
%
Costs of Auto Regulation per vehicle (left axis)Percent Change in GDP (Right Axis %)Motor Vehicle Industry Corporate Profits (Right Axis Bil$)
Source: (1) U.S. Department of Labor, Reference 32 (2) U.S. Department of Commerce, Reference 26. economic growth and the cost of auto regulations on auto industry profits are shown in Figure 15. Industry profits decreased during the 1977-82 period and showed an increase during the later part of the 1990-94 period. This would be expected as during the first period sales decreased (especially those of US auto companies) and in the second period, sales increased. Hence Figures 14 and 15 indicate that the key factor in assessing the effect of changing regulations on vehicle sales and industry profitability is the status of the general economy when the changes are made. The changes should be made in a way that does not adversely affect economic growth. The changes in the vehicle class sales fractions in the 1990-1994 period were very different that those that occurred in the 1977-1982 (see Table 9). The primary shifts were from subcompact to compact cars and the beginning of the purchase in large numbers of SUVs. The market share of SUVs nearly doubled between 1990 and 1995 and increased further by another 50% by 2000. Gasoline prices were low and stable in this period and buyers were clearly not concerned about fuel economy of the vehicles

27
Table 9 Light-Duty Vehicle Market Shares by Size Class (1976 - 2001)
Year Minicompact Subcompact Compact Midsize Large Two Seater
Percent of Light Vehicles
Total 1976 0.0% 21.7% 23.5% 15.0% 18.3% 1.7% 80.2% 1977 6.5% 15.5% 21.8% 15.6% 20.0% 1.7% 81.0% 1978 6.7% 15.0% 12.0% 26.1% 17.6% 1.5% 79.0% 1979 4.3% 24.4% 6.7% 26.9% 15.4% 1.7% 79.4% 1980 3.8% 30.4% 5.3% 27.2% 11.8% 1.9% 80.4% 1981 3.9% 31.2% 5.4% 27.9% 12.1% 2.0% 82.5% 1982 2.7% 26.6% 10.8% 28.3% 10.1% 2.2% 80.6% 1983 2.1% 23.2% 12.6% 24.5% 9.6% 2.0% 74.0% 1984 0.3% 18.2% 20.0% 22.1% 10.9% 2.4% 73.9% 1985 0.3% 15.7% 23.2% 20.5% 10.0% 2.5% 72.1% 1986 1.2% 15.9% 23.6% 19.1% 9.4% 1.8% 71.0% 1987 1.0% 13.6% 27.1% 16.9% 9.3% 1.6% 69.5% 1988 0.6% 13.1% 27.8% 16.9% 9.1% 1.2% 68.6% 1989 0.1% 13.1% 24.7% 19.7% 9.4% 1.1% 68.1% 1990 0.6% 14.8% 23.0% 18.3% 9.3% 1.2% 67.1% 1991 0.6% 17.5% 19.8% 18.8% 9.4% 1.1% 67.1% 1992 0.9% 16.6% 19.6% 18.0% 9.1% 0.7% 64.9% 1993 0.6% 14.5% 19.8% 18.2% 8.8% 0.5% 62.4% 1994 0.4% 13.8% 21.0% 16.1% 9.2% 0.5% 60.9% 1995 0.3% 10.4% 22.4% 17.0% 9.0% 0.4% 59.5% 1996 0.2% 8.8% 23.5% 16.7% 8.5% 0.4% 58.1% 1997 0.3% 10.2% 19.9% 17.1% 7.9% 0.5% 55.9% 1998 0.1% 9.8% 15.2% 20.4% 6.9% 0.7% 53.1% 1999 0.1% 9.7% 14.2% 20.2% 7.1% 0.6% 51.9% 2000 0.1% 10.4% 13.9% 19.4% 7.5% 0.7% 51.9% 2001 0.2% 5.6% 18.7% 16.3% 9.2% 0.7% 50.9%
Source: TEDB 22, Reference 8. they were purchasing. In general, buyers also seemed not to be concerned with the relatively large price increases ($1000-$2000 per model year) that often occurred in 1990-1994. Another economic factor that could be expected to influence the response of consumers to vehicle price increases is the income of families. The change in the mean and median income of families in the period 1970-2002 is shown in Figure 16. Since the early 1980s, the mean income has increased more rapidly than the median income indicating the income of more affluent families has increased faster than the lower income families. The average prices of new domestic and imported cars are also shown in Figure 16. Percentage-wise the prices of cars have increased more rapidly than family incomes over most of the period of interest. Note that after about 1990 the average price of domestic cars has leveled off, but the average prices of imported cars have continued to increase at a relatively fast rate. These trends can also be seen in the cost data given in Appendix 2 for the various vehicle models. In the case of SUVs, the prices of the vehicles in real dollars have been nearly level or even decreasing. The more rapid increase of the mean income and the relatively level price of SUVs may explain why the more expensive car models and SUVs have sold so well and are gaining a greater share of
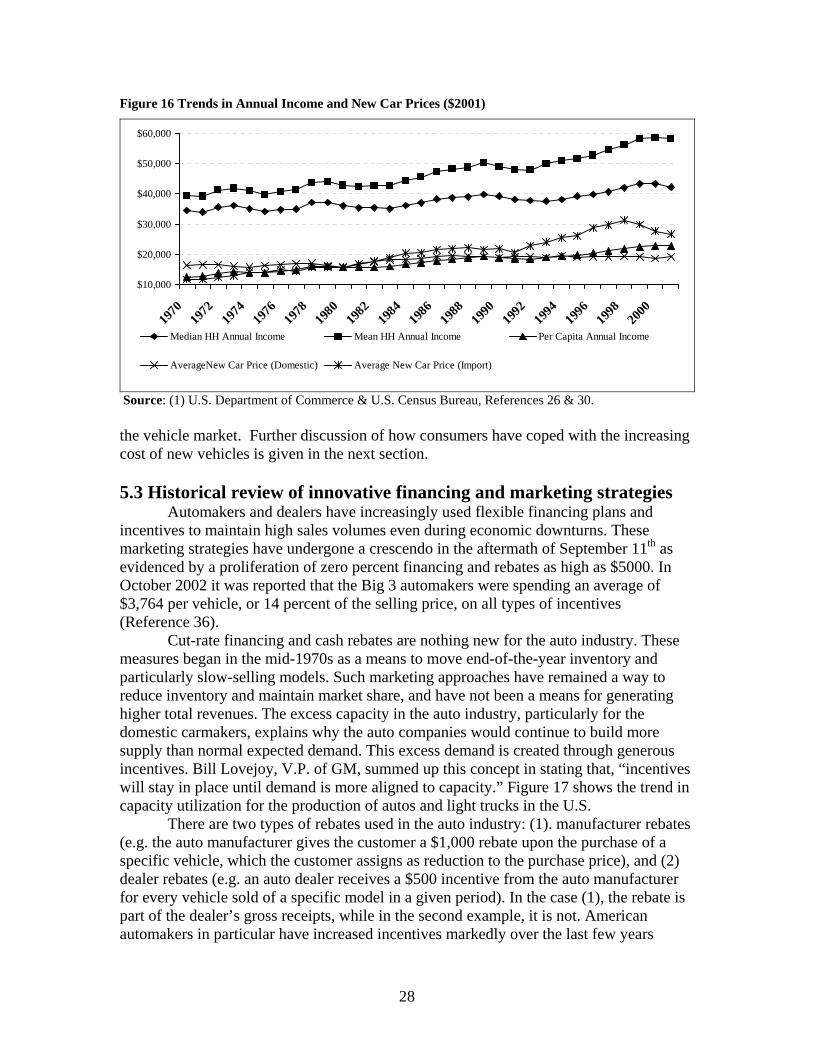
28
Figure 16 Trends in Annual Income and New Car Prices ($2001)
$10,000
$20,000
$30,000
$40,000
$50,000
$60,000
1970
1972
1974
1976
1978
1980
1982
1984
1986
1988
1990
1992
1994
1996
1998
2000
Median HH Annual Income Mean HH Annual Income Per Capita Annual Income
AverageNew Car Price (Domestic) Average New Car Price (Import)
Source: (1) U.S. Department of Commerce & U.S. Census Bureau, References 26 & 30. the vehicle market. Further discussion of how consumers have coped with the increasing cost of new vehicles is given in the next section. 5.3 Historical review of innovative financing and marketing strategies Automakers and dealers have increasingly used flexible financing plans and incentives to maintain high sales volumes even during economic downturns. These marketing strategies have undergone a crescendo in the aftermath of September 11th as evidenced by a proliferation of zero percent financing and rebates as high as $5000. In October 2002 it was reported that the Big 3 automakers were spending an average of $3,764 per vehicle, or 14 percent of the selling price, on all types of incentives (Reference 36).
Cut-rate financing and cash rebates are nothing new for the auto industry. These measures began in the mid-1970s as a means to move end-of-the-year inventory and particularly slow-selling models. Such marketing approaches have remained a way to reduce inventory and maintain market share, and have not been a means for generating higher total revenues. The excess capacity in the auto industry, particularly for the domestic carmakers, explains why the auto companies would continue to build more supply than normal expected demand. This excess demand is created through generous incentives. Bill Lovejoy, V.P. of GM, summed up this concept in stating that, “incentives will stay in place until demand is more aligned to capacity.” Figure 17 shows the trend in capacity utilization for the production of autos and light trucks in the U.S. There are two types of rebates used in the auto industry: (1). manufacturer rebates (e.g. the auto manufacturer gives the customer a $1,000 rebate upon the purchase of a specific vehicle, which the customer assigns as reduction to the purchase price), and (2) dealer rebates (e.g. an auto dealer receives a $500 incentive from the auto manufacturer for every vehicle sold of a specific model in a given period). In the case (1), the rebate is part of the dealer’s gross receipts, while in the second example, it is not. American automakers in particular have increased incentives markedly over the last few years

29
Figure 17 Ratio of the Utilization Index to the Capacity Index for Auto Production in the US
40%45%50%55%60%65%70%
1986
1987
1988
1989
1990
1991
1992
1993
1994
1995
1996
1997
1998
1999
2000
Source: (1) U.S. Department of Commerce, Reference 26.
Figure 18 Incentives as a Percentage of Sales Price (1996-2002)
0
5
10
15
%
'96 '97 '98 '99 '00 '01 '02
AmericanAutomakersAsian Automakers
Source: CNW Marketing/Research, Reference 31. (Figure 18). General Motors, the acknowledged bellwether with regard to incentives, has gone so far as to offer its 159,000 U.S. employees, and tens of thousands of employees at GM suppliers and dealers, a $1,000 discount on a new car or truck in an attempt to boost vehicle sales in September 2003 (Reference 37). Automakers use incentives other than cash to motivate consumers. For instance, GM offered a free Dell™ computer system with the purchase or leasing of a 2003 model year Saturn car or truck during September 2003 in addition to the incentives already in place (Reference 39). Changes in financing options have also made cars increasingly affordable to consumers whose incomes have been increasing slower than the price of new cars. Figure 19 shows that the average maturity rate for auto loans has nearly doubled over the last 32 years, while Figure 20 indicates that the car price, the amount financed, and disposable personal income all in constant dollars have tracked closely together. Monthly payments are thus smaller and more manageable for the consumer.

30
Figure 19 Average Amount Financed for a New Car and Average Maturity Rate of Auto Loans
0
10
20
30
40
50
60
70
1971
1973
1975
1977
1979
1981
1983
1985
1987
1989
1991
1993
1995
1997
1999
2001
2003
Mon
ths
$0
$5,000
$10,000
$15,000
$20,000
$25,000
$30,000
Average Maturity Average Amount Financed ($2001)
Source: (1) U.S. Department of Commerce, Reference 26. Figure 20 Trends in New Car Financing and Pricing; And in Disposable Income ($2001)
$5,000
$10,000
$15,000
$20,000
$25,000
$30,000
1971 1975 1979 1983 1987 1991 1993 1995 1997 1999 2001
Average New CarTransaction Price
DisposablePersonal Incomeper capita
Average AmountFinanced for aNew Car
Source: U.S. Department of Commerce & U.S. Census Bureau, References 26 & 30. Table Notes: Disposable income is the amount of Personal income an individual has after taxes and government fees, which can be spent on necessities, or non-essentials, or be saved. Figure data are every other year preceding 1991 and every year thereafter. Although most car loans are between 36 and 60 months, a number of independent finance companies in the western United States have recently offered loans as long as 96 months (Reference 38). The maturity rate for car loans has stabilized considerably since the mid to late 1980s, but recent record low interest rates provide the greater flexibility for potentially longer term car loans. In addition to amenable loan terms and interest rates, lease financing has flourished in the last 15 years. Table 10 highlights the dramatic increase in the lease penetration rate from 3.5 percent of new vehicle transactions in 1985 to 31.5 percent in 2002. Leasing allows the consumer to have lower affordable monthly payments and the opportunity to receive a new vehicle every 3 to 5 years.
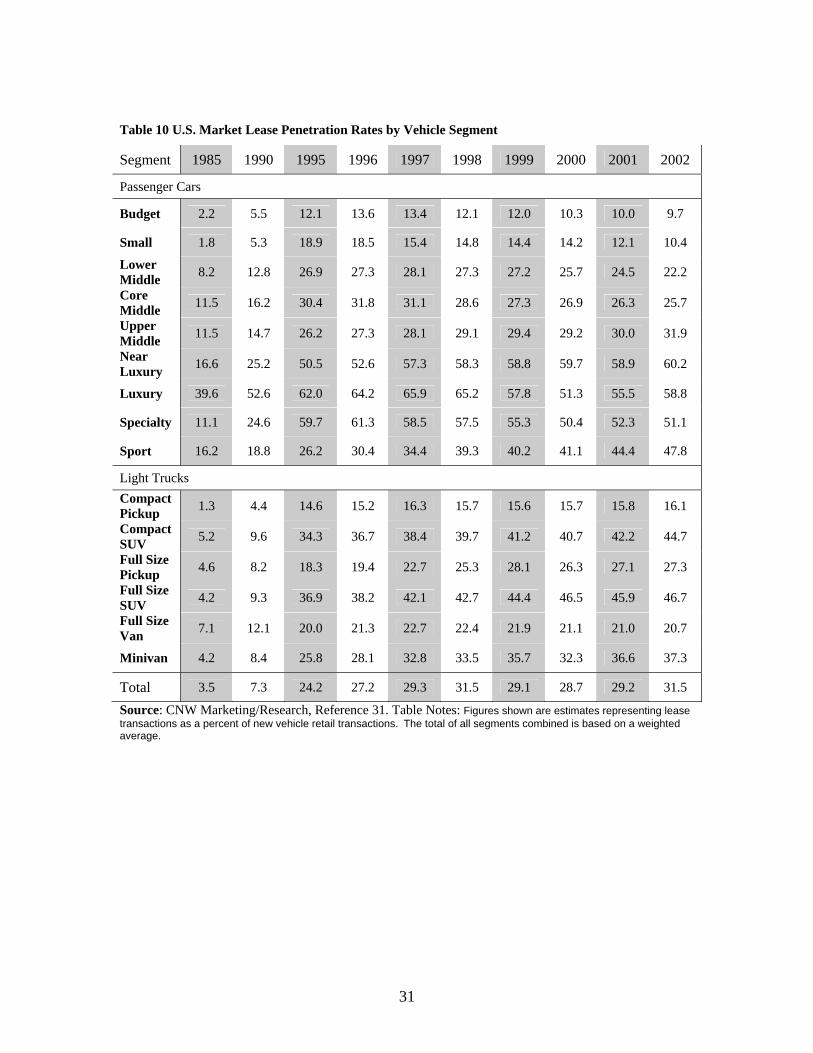
31
Table 10 U.S. Market Lease Penetration Rates by Vehicle Segment
Segment 1985 1990 1995 1996 1997 1998 1999 2000 2001 2002
Passenger Cars
Budget 2.2 5.5 12.1 13.6 13.4 12.1 12.0 10.3 10.0 9.7
Small 1.8 5.3 18.9 18.5 15.4 14.8 14.4 14.2 12.1 10.4
Lower Middle 8.2 12.8 26.9 27.3 28.1 27.3 27.2 25.7 24.5 22.2
Core Middle 11.5 16.2 30.4 31.8 31.1 28.6 27.3 26.9 26.3 25.7
Upper Middle 11.5 14.7 26.2 27.3 28.1 29.1 29.4 29.2 30.0 31.9
Near Luxury 16.6 25.2 50.5 52.6 57.3 58.3 58.8 59.7 58.9 60.2
Luxury 39.6 52.6 62.0 64.2 65.9 65.2 57.8 51.3 55.5 58.8
Specialty 11.1 24.6 59.7 61.3 58.5 57.5 55.3 50.4 52.3 51.1
Sport 16.2 18.8 26.2 30.4 34.4 39.3 40.2 41.1 44.4 47.8
Light Trucks Compact Pickup 1.3 4.4 14.6 15.2 16.3 15.7 15.6 15.7 15.8 16.1
Compact SUV 5.2 9.6 34.3 36.7 38.4 39.7 41.2 40.7 42.2 44.7
Full Size Pickup 4.6 8.2 18.3 19.4 22.7 25.3 28.1 26.3 27.1 27.3
Full Size SUV 4.2 9.3 36.9 38.2 42.1 42.7 44.4 46.5 45.9 46.7
Full Size Van 7.1 12.1 20.0 21.3 22.7 22.4 21.9 21.1 21.0 20.7
Minivan 4.2 8.4 25.8 28.1 32.8 33.5 35.7 32.3 36.6 37.3
Total 3.5 7.3 24.2 27.2 29.3 31.5 29.1 28.7 29.2 31.5
Source: CNW Marketing/Research, Reference 31. Table Notes: Figures shown are estimates representing lease transactions as a percent of new vehicle retail transactions. The total of all segments combined is based on a weighted average.

32
References References for the Literature Review Section (1.1) Gerard, David and Lester Lave, “Implementing Technology-Forcing Policies: The 1970 Clean Air Act Amendments and the Introduction of Advanced Automotive Emissions Controls,” Center for the Study and Improvement of Regulation, Department of Engineering and Public Policy, Carnegie Mellon University, May 2003 . Gómez-Ibáñez, José A., William B. Tye, editor, Clifford Winston, Eds., Essays in Transportation Economics and Policy: A Handbook in Honor of John R. Meyer, The Brookings Institution Press: Washington, DC, 1999. Crandall, Robert W. et al., Regulating the Automobile, The Brookings Institution Press: Washington, DC, 1986. Schnapp, John B., Corporate Strategies of the Automotive Manufacturers, Prepared for U.S. DOT, NHTSA. Contract No. DOT HS-7-01783, November 1978. Donnelly, Julie H., Use of Advertising and Marketing Incentives to Promote Sales of Fuel Efficient Vehicles, Prepared for the U.S. DOT. Contract No. DTNH22-80-C-07131, June 1981. Motor vehicle regulations: Regulatory cost estimates could be improved, Report to the Chairman, Subcommittee on Oversight and Investigations, Committee on Energy and Commerce, House of Representatives. United States General Accounting Office, 1992. Assessing regulatory impacts: The Federal experience with the auto industry, Submitted
to United States Regulatory Council, ICF Incorporated. Contract No. CORC 02, March 1981. Mondt, J. Robert, Cleaner Cars: The History and Technology of Emission Control Since the 1960s, SAE International, 2000. Bresnahan, Timothy F. and Dennis A. Yao. “The nonpecuniary costs of automobile emissions standards.” Rand Journal of Economics, Vol. 16, No. 4, 437-455, Winter 1985. Wang, Quanlu, Catherine Kling, and Daniel Sperling. 1993. “Light-Duty Vehicle Exhaust Emission Control Cost Estimates Using a Part-Pricing Approach.” J. A ir Waste Manage. Assoc. 43, 1461-1471, 1993.
33
Anderson, John F. and Todd Sherwood. “Comparison of EPA and Other Estimates of Mobile Source Rule Costs to Actual Price Changes,” SAE Publication 2002-01-1980, 2002. Chen, Belinda et al. “Effect of Emissions Regulation on Vehicle Attributes, Cost, and Price,” Institute of Transportation Studies, Report for the California Air Resources Board, December 2003. Graham, John. “Technology, Behavior and Safety: An Empirical Study of Automobile Occupant-Protection Regulation.” Policy Sciences 17, 141-51, October 1984. Gomez-Ibanez, Jose A. “Recission of the Passive Restraints Standard: Costs and Benefits.” C16-83-562. Harvard University, Kennedy School of Government Case Program, 1997. Mannering, Fred and Clifford Winston. “Automobile Air Bags in the 1990s: Market Failure or Market Efficiency,” Journal of Law and Economics, Vol. XXXVIII, pp. 265-279, October 1995. Peltzman, Sam. “The Effects of Automobile Safety Regulation.” Journal of Political Economy 83, 677-725, 1975. Arnould, R., and Grabowski, H. “Auto Safety Regulation: An Analysis of Market Failure,” The Bell Journal of Economics 12, No. 27, 1981. Dunham, W. R. “Are automobile safety regulations worth the price: Evidence from used car markets.” Economic Inquiry 35, No. 3, 579-589, 1997. Abeles, Ethan et al. “Automaker Response to Passive Restraint Regulation with respect to Actions, Economics, Technology and Marketing.” Institute of Transportation Studies, Report for the California Air Resources Board, December 2003. Gsellman, L. R. "The 1981-84 Automobile Fuel-Economy Standards - Can They Be Achieved." Applied Energy 8(3): 143-173, 1981. Mcnutt, B. D. "United-States Automobile Fuel-Economy Policies and Consumption Effects." Resources and Conservation 10(1-2): 9-24, 1983. Leone, R.A. and T.W. Parkinson Conserving Energy: Is There a Better Way? A Study of CAFE Regulation. Association of International Automobile Manufacturers. Washington DC, 1990. Porter, Richard C. Economics at the Wheel. Academic Press: San Diego, 1999. Falvey, R. E., J. Frank, et al. "Fuel-Economy Standards and Automobile Prices." Journal of Transport Economics and Policy 20(1): 31-45, 1986.

34
Thorpe, S. G. "Fuel economy standards, new vehicle sales and average fuel efficiency." Journal of Regulatory Economics 11(3): 311-326, 1997 Goldberg, P. K. "The effects of the Corporate Average Fuel Efficiency Standards in the US." Journal of Industrial Economics 46(1): 1-33, 1998. Espey, M. "Pollution control and energy conservation: Complements or antagonists? A study of gasoline taxes and automobile fuel economy standards." Energy Journal 18(2): 23-38, 1997 . Crandall, R. W. and J. D. Graham "The Effect of Fuel-Economy Standards on Automobile Safety." Journal of Law & Economics 32(1): 97-118, 1989 . Dowlatabadi, H., L. B. Lave, et al. "A free lunch at higher CAFE? A review of economic, environmental and social benefits." Energy Policy 24(3): 253-264, 1996. Ross, M. "Automobile Fuel Consumption and Emissions - Effects of Vehicle and Driving Characteristics." Annual Review of Energy and the Environment 19: 75-112, 1994. General References for the report (numbered) 1.Mondt, J.R., Cleaner Cars: The History and Technology of Emissions Control since the 1960s, book, SAE Publications, 2000 2. EPA emissions and fuel economy test data, emissions: epa.gov/otaq; fuel economy: fueleconomy.gov/feg/download.shtml 3. MarTech data base from ARB 4. Burke, A. F. and Kurani, K., Study of the Secondary Benefits of the ZEV Mandate, Report No. UCD-ITS-RR-00-7, August 2000 5. Light-duty Automotive Technology and Fuel Economy Trends 1975 through 2000, Report EPA 420-R00-008, December 2000 6. Market Data Book-2003, published by the Automotive News, 2003 7. Abeles, E., Air Bag Thesis, 2003 8. Davis, S.C., Transportation Energy DataBook, Editions 17, 20, 21, 22, published by the Center for Transportation Analysis, Oak Ridge National Laboratory. See: http://www-cta.ornl.gov/cta/data/Index.html 9. Buchholz, K., Why Diesel, Why Now?, SAE Automotive Engineering International, August 2003 10. Ashley, S., Diesel cars come clean, Mechanical Engineering, Vol.119, No.8, August 1997 11. Tomazic, D., integration of Emission Control Systems for CIDI Engines to Achieve PZEV, PZEV Emissions Technology: Regulations and Challenges, SAE TOPTEC, January 24-25, 2002, San Diego, California

35
12. Johnson, J. H., Diesel Nitrogen Oxide Emissions –Landmark Research 1995-2001, SAE Publication PT-89, 2002 13. Johnson, J. H., Diesel Particulate Emissions-Landmark Research 1994-2001, SAE Publication PT-86, 2002 14. “No diesel without Filter Campaign”, Diesel Fuel News, May 12, 2003, Page 1-5 15. Diesel Car magazine, published in the UK, June 2001 16. Cars Road Tests 2003-Winners and Losers, published by Consumers Report, Spring 2003 17. New Car Preview-2002: Ratings, Reviews, and Reliability, published by Consumers Reports, Winter 2002 18. Hermance, D., Toyota Hybrid System, 1999 SAE TOPTEC conference, Albany, N.Y., May 1999 19. Hirose, T., Takaoka, T.,Ueda, T., and Kobayashi, Y., the New High Expansion Ration Gasoline Engine for the Toyota Hybrid System, JSAE paper 9739552, October 1997 20. Ogawa, H., Masato, M., and Takahiro, E., Development of a Power Train for the Hybrid Automobile-The Civic Hybrid, SAE paper 2003-01-0083, March 2003 21. Burke, A. F., Saving Petroleum with Cost-effective Hybrids, SAE paper 2003-01-3279, November 2003 22. An, F. and Santini, D., Mass Impacts on Fuel Economies of Conventional vs. Hybrid Vehicles, paper to be presented at the 2004 SAE World Congress, March 2004 23. Description and Rationale for Staff’s Additional Proposed Modifications to the January 10, 2003 ZEV Regulatory Proposal, California Air Resources Board, March 5, 2003 24. Consumer Guide-Cars and Trucks, June 2003, published by Publications International, Lincolnwood, Illinois 25. Ward’s Communications, Ward’s Automotive Yearbook. Annual. New York: Primedia, Inc., 1970-2002. 26. U.S. Department of Commerce, Bureau of Economic Analysis, Office of Automotive Affairs. See: http://www.ita.doc.gov/td/auto/qfact.html. 27. U.S. Department of Labor, Bureau of Labor Statistics, Consumer Price Index—All Urban Consumers, http://www.bls.gov/cpihome.htm. 28. U.S. Census Bureau, Historical Income Tables - Households, See: http://www.census.gov/hhes/income/histinc/h05.html. 29. Hellman, Karl H. and Heavenrich, Robert M., Light-Duty Automotive and Fuel Economy Trends: 1975 through 2003. U.S. Environmental Protection Agency, Office of Mobile Sources, April 2003. (EPA420-R-03-006) See: http://www.epa.gov/otaq/cert/mpg/fetrends/r03006.pdf. 30. U.S. Department of Commerce, Bureau of Economic Analysis, Disposable Personal Income, Series: DSPI. A Guide to the National Income and Product Accounts of the United States (NIPA, See: http://www.bea.doc.gov/bea/an/nipaguid.pdf. 31. CNW Marketing/Research, See: http://www.nvo.com/cnwmr/door/. 32. U.S. Department of Labor, Bureau of Labor Statistics, “Quality Adjustment Releases for Motor Vehicles,” 1975-2002, See: http://www.bls.gov/ppi/ppicarqa.htm. 33. U.S. Department of Commerce, Bureau of Economic Analysis, National Economic Accounts. See: http://www.bea.doc.gov/bea/dn/home/gdp.htm.
36
34. U.S. Department of Energy, Energy Information Administration, Monthly Energy Review, 2002, Washington, D.C. 35. Ward's Automotive Reports, September 22, 2003. 36. “U.S. Carmakers Losing Ground to Imports, Despite Deals,” The New York Times, October 23, 2002, p. 1. 37. “GM Adds Employee Incentives to Boost Vehicle Sales,” Automotive News, September 25, 2003. See: http://www.autonews.com/news.cms?newsId=6478&bt=incentive. 38. “Car loans stretch to 8 years,” Automotive News, September 22, 2003. 39. “GM’s Saturn to Offer Dell Computers with Saturns,” Automotive News, September 5, 2003.
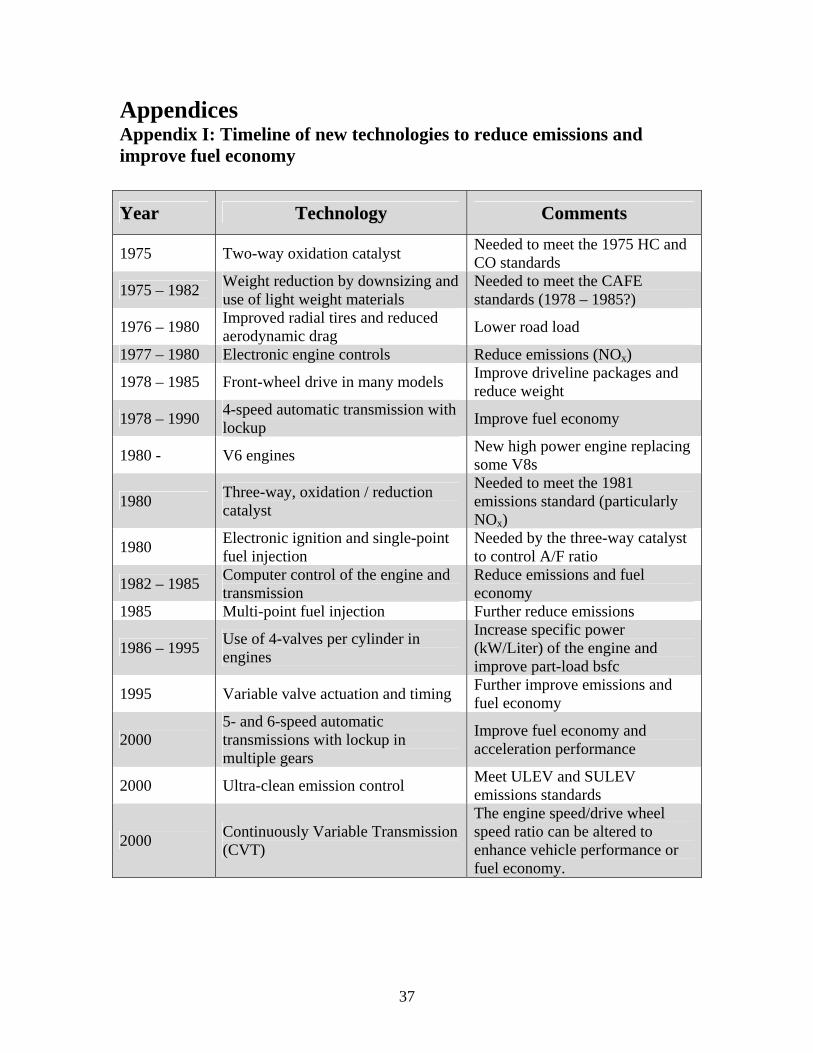
37
Appendices Appendix I: Timeline of new technologies to reduce emissions and improve fuel economy YYeeaarr TTeecchhnnoollooggyy CCoommmmeennttss
1975 Two-way oxidation catalyst Needed to meet the 1975 HC and CO standards
1975 – 1982 Weight reduction by downsizing and use of light weight materials
Needed to meet the CAFE standards (1978 – 1985?)
1976 – 1980 Improved radial tires and reduced aerodynamic drag Lower road load
1977 – 1980 Electronic engine controls Reduce emissions (NOx)
1978 – 1985 Front-wheel drive in many models Improve driveline packages and reduce weight
1978 – 1990 4-speed automatic transmission with lockup Improve fuel economy
1980 - V6 engines New high power engine replacing some V8s
1980 Three-way, oxidation / reduction catalyst
Needed to meet the 1981 emissions standard (particularly NOx)
1980 Electronic ignition and single-point fuel injection
Needed by the three-way catalyst to control A/F ratio
1982 – 1985 Computer control of the engine and transmission
Reduce emissions and fuel economy
1985 Multi-point fuel injection Further reduce emissions
1986 – 1995 Use of 4-valves per cylinder in engines
Increase specific power (kW/Liter) of the engine and improve part-load bsfc
1995 Variable valve actuation and timing Further improve emissions and fuel economy
2000 5- and 6-speed automatic transmissions with lockup in multiple gears
Improve fuel economy and acceleration performance
2000 Ultra-clean emission control Meet ULEV and SULEV emissions standards
2000 Continuously Variable Transmission (CVT)
The engine speed/drive wheel speed ratio can be altered to enhance vehicle performance or fuel economy.

38
Appendix II: Detailed history of the performance and price of selected vehicle models Buick Century – Midsize Car
050
100150200250300350400450
1975
1977
1979
1981
1983
1985
1987
1989
1991
1993
1995
1997
1999
2001
(in./l
b./h
p)
Wheelbase Weight / 10 Horsepow er
-
5
10
15
20
25
30
35
1975
1977
1979
1981
1983
1985
1987
1989
1991
1993
1995
1997
1999
2001
($/m
pg/s
ec.)
MSRP $2002 new vehicle cpi / 1000 mpg comb z60 accel
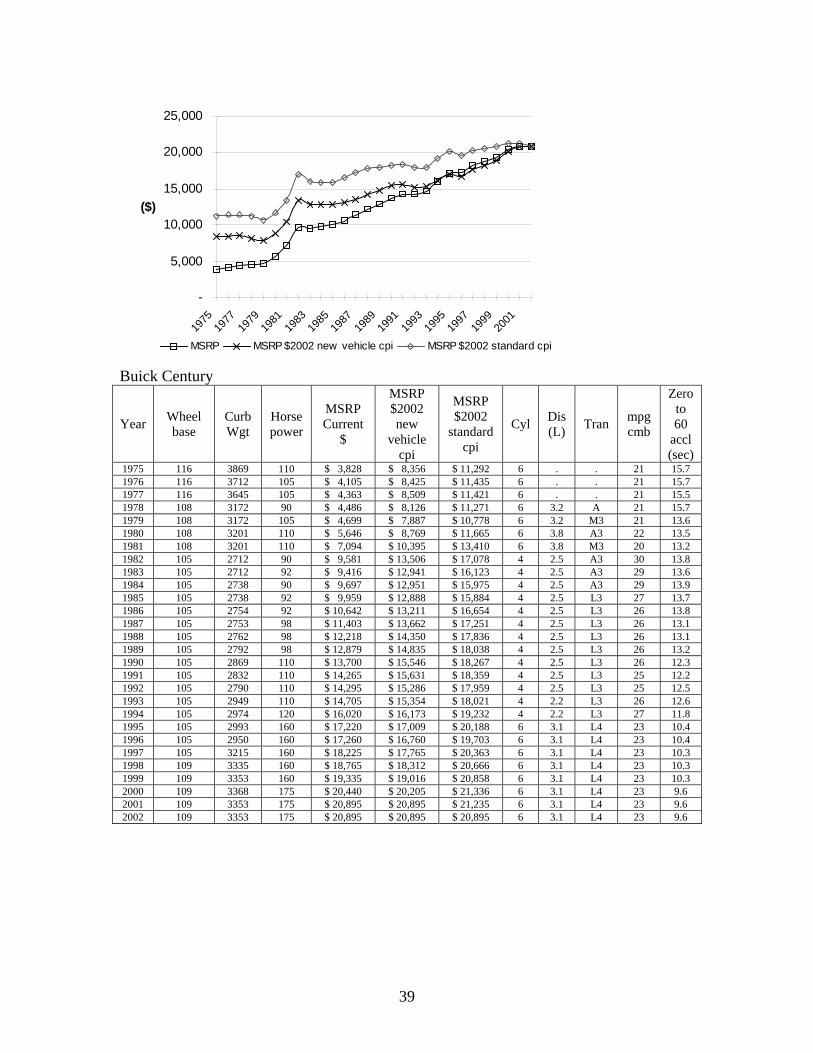
39
-
5,000
10,000
15,000
20,000
25,000
1975
1977
1979
1981
1983
1985
1987
1989
1991
1993
1995
1997
1999
2001
($)
MSRP MSRP $2002 new vehicle cpi MSRP $2002 standard cpi
Buick Century
Year Wheel base
Curb Wgt
Horse power
MSRP Current
$
MSRP $2002 new
vehicle cpi
MSRP $2002
standard cpi
Cyl Dis (L) Tran mpg
cmb
Zero to 60
accl (sec)
1975 116 3869 110 $ 3,828 $ 8,356 $ 11,292 6 . . 21 15.7 1976 116 3712 105 $ 4,105 $ 8,425 $ 11,435 6 . . 21 15.7 1977 116 3645 105 $ 4,363 $ 8,509 $ 11,421 6 . . 21 15.5 1978 108 3172 90 $ 4,486 $ 8,126 $ 11,271 6 3.2 A 21 15.7 1979 108 3172 105 $ 4,699 $ 7,887 $ 10,778 6 3.2 M3 21 13.6 1980 108 3201 110 $ 5,646 $ 8,769 $ 11,665 6 3.8 A3 22 13.5 1981 108 3201 110 $ 7,094 $ 10,395 $ 13,410 6 3.8 M3 20 13.2 1982 105 2712 90 $ 9,581 $ 13,506 $ 17,078 4 2.5 A3 30 13.8 1983 105 2712 92 $ 9,416 $ 12,941 $ 16,123 4 2.5 A3 29 13.6 1984 105 2738 90 $ 9,697 $ 12,951 $ 15,975 4 2.5 A3 29 13.9 1985 105 2738 92 $ 9,959 $ 12,888 $ 15,884 4 2.5 L3 27 13.7 1986 105 2754 92 $ 10,642 $ 13,211 $ 16,654 4 2.5 L3 26 13.8 1987 105 2753 98 $ 11,403 $ 13,662 $ 17,251 4 2.5 L3 26 13.1 1988 105 2762 98 $ 12,218 $ 14,350 $ 17,836 4 2.5 L3 26 13.1 1989 105 2792 98 $ 12,879 $ 14,835 $ 18,038 4 2.5 L3 26 13.2 1990 105 2869 110 $ 13,700 $ 15,546 $ 18,267 4 2.5 L3 26 12.3 1991 105 2832 110 $ 14,265 $ 15,631 $ 18,359 4 2.5 L3 25 12.2 1992 105 2790 110 $ 14,295 $ 15,286 $ 17,959 4 2.5 L3 25 12.5 1993 105 2949 110 $ 14,705 $ 15,354 $ 18,021 4 2.2 L3 26 12.6 1994 105 2974 120 $ 16,020 $ 16,173 $ 19,232 4 2.2 L3 27 11.8 1995 105 2993 160 $ 17,220 $ 17,009 $ 20,188 6 3.1 L4 23 10.4 1996 105 2950 160 $ 17,260 $ 16,760 $ 19,703 6 3.1 L4 23 10.4 1997 105 3215 160 $ 18,225 $ 17,765 $ 20,363 6 3.1 L4 23 10.3 1998 109 3335 160 $ 18,765 $ 18,312 $ 20,666 6 3.1 L4 23 10.3 1999 109 3353 160 $ 19,335 $ 19,016 $ 20,858 6 3.1 L4 23 10.3 2000 109 3368 175 $ 20,440 $ 20,205 $ 21,336 6 3.1 L4 23 9.6 2001 109 3353 175 $ 20,895 $ 20,895 $ 21,235 6 3.1 L4 23 9.6 2002 109 3353 175 $ 20,895 $ 20,895 $ 20,895 6 3.1 L4 23 9.6
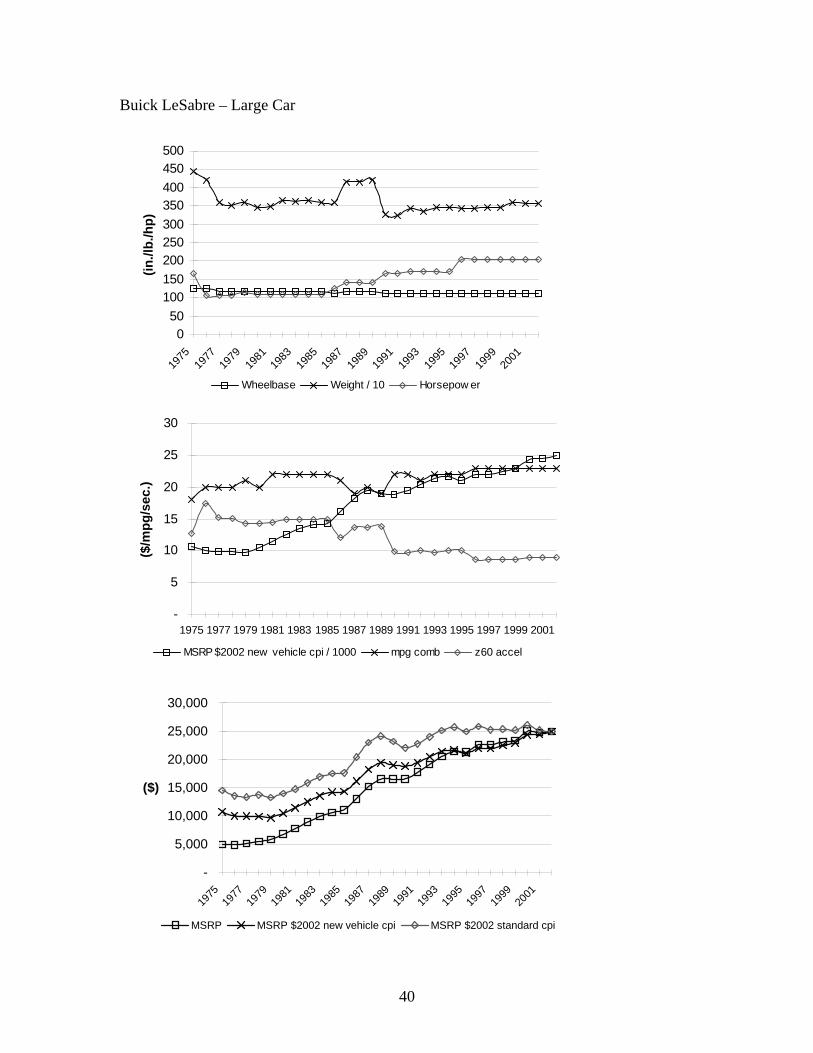
40
Buick LeSabre – Large Car
050
100150200250300350400450500
1975
1977
1979
1981
1983
1985
1987
1989
1991
1993
1995
1997
1999
2001
(in./l
b./h
p)
Wheelbase Weight / 10 Horsepow er
-
5
10
15
20
25
30
1975 1977 1979 1981 1983 1985 1987 1989 1991 1993 1995 1997 1999 2001
($/m
pg/s
ec.)
MSRP $2002 new vehicle cpi / 1000 mpg comb z60 accel
-
5,000
10,000
15,000
20,000
25,000
30,000
1975
1977
1979
1981
1983
1985
1987
1989
1991
1993
1995
1997
1999
2001
($)
MSRP MSRP $2002 new vehicle cpi MSRP $2002 standard cpi

41
Buick LeSabre
Year Wheel base
Curb Wgt
Horse power
MSRP Current
$
MSRP $2002 new
vehicle cpi
MSRP $2002
standard cpi
Cyl Dis (L) Tran mpg
cmb
Zero to 60
accl (sec)
1975 124 4449 165 $ 4,911 $ 10,720 $ 14,487 8 . . 18 12.7 1976 124 4210 105 $ 4,871 $ 9,997 $ 13,568 6 . . 20 17.4 1977 116 3577 105 $ 5,092 $ 9,931 $ 13,330 6 . . 20 15.3 1978 116 3510 105 $ 5,459 $ 9,888 $ 13,716 6 3.8 A 20 15.0 1979 116 3600 115 $ 5,780 $ 9,702 $ 13,257 6 3.8 A3 21 14.3 1980 116 3459 110 $ 6,769 $ 10,513 $ 13,986 6 3.8 A3 20 14.3 1981 116 3485 110 $ 7,805 $ 11,437 $ 14,754 6 3.8 A3 22 14.4 1982 116 3649 110 $ 8,886 $ 12,526 $ 15,840 6 3.8 A3 22 15.0 1983 116 3620 110 $ 9,869 $ 13,564 $ 16,899 6 3.8 A3 22 14.9 1984 116 3649 110 $ 10,615 $ 14,177 $ 17,488 6 3.8 A3 22 15.0 1985 116 3587 110 $ 11,078 $ 14,336 $ 17,668 6 3.8 L3 22 15.0 1986 111 3600 125 $ 13,026 $ 16,171 $ 20,385 6 3 L4 21 12.0 1987 116 4160 140 $ 15,199 $ 18,210 $ 22,994 8 5 L4 19 13.7 1988 116 4160 140 $ 16,520 $ 19,403 $ 24,117 8 5 L4 20 13.7 1989 116 4209 140 $ 16,530 $ 19,015 $ 23,151 8 5 L4 19 13.8 1990 111 3270 165 $ 16,555 $ 18,785 $ 22,073 6 3.8 L4 22 9.9 1991 111 3231 165 $ 17,715 $ 19,412 $ 22,799 6 3.8 L4 22 9.8 1992 111 3417 170 $ 19,125 $ 20,451 $ 24,026 6 3.8 L4 21 10.0 1993 111 3343 170 $ 20,490 $ 21,394 $ 25,110 6 3.8 L4 22 9.8 1994 111 3449 170 $ 21,435 $ 21,640 $ 25,732 6 3.8 L4 22 10.1 1995 111 3442 170 $ 21,309 $ 21,048 $ 24,981 6 3.8 L4 22 10.1 1996 111 3430 205 $ 22,620 $ 21,964 $ 25,822 6 3.8 L4 23 8.6 1997 111 3430 205 $ 22,620 $ 21,918 $ 25,274 6 3.8 L4 23 8.6 1998 111 3443 205 $ 23,070 $ 22,513 $ 25,407 6 3.8 L4 23 8.6 1999 111 3443 205 $ 23,340 $ 22,955 $ 25,178 6 3.8 L4 23 8.6 2000 112 3591 205 $ 25,000 $ 24,355 $ 26,096 6 3.8 L4 23 8.9 2001 112 3567 205 $ 24,762 $ 24,477 $ 25,165 6 3.8 L4 23 8.9 2002 112 3567 205 $ 24,975 $ 24,975 $ 24,975 6 3.8 L4 23 8.9

42
Cadillac El Dorado – Luxury Car
0
100
200
300
400
500
600
1975
1977
1979
1981
1983
1985
1987
1989
1991
1993
1995
1997
1999
2001
(in./l
b./h
p)
Wheelbase Weight / 10 Horsepow er
-5
1015202530354045
1975
1977
1979
1981
1983
1985
1987
1989
1991
1993
1995
1997
1999
2001
($/m
pg/s
ec.)
MSRP $2002 new vehicle cpi / 1000 mpg comb z60 accel
-5,000
10,00015,00020,00025,00030,00035,00040,00045,00050,000
1975
1977
1979
1981
1983
1985
1987
1989
1991
1993
1995
1997
1999
2001
($)
MSRP MSRP $2002 new vehicle cpi MSRP $2002 standard cpi

43
Cadillac El Dorado
Year Wheel base
Curb Wgt
Horse power
MSRP Current
$
MSRP $2002 new
vehicle cpi
MSRP $2002
standard cpi
Cyl Dis (L) Tran mpg
cmb
Zero to 60
accl (sec)
1975 126 5254 190 $ 9,948 $ 21,715 $ 29,345 8 . . 11 12.9 1976 126 5231 190 $ 10,586 $ 21,726 $ 29,487 8 . . 11 12.9 1977 126 5101 180 $ 11,187 $ 21,818 $ 29,285 8 . . 11 13.2 1978 126 5100 180 $ 11,921 $ 21,593 $ 29,952 8 7 A 11 13.2 1979 114 3900 125 $ 14,955 $ 25,102 $ 34,300 8 5.7 A3 24 14.2 1980 114 4080 105 $ 13,800 $ 19,984 $ 28,512 8 5.7 A3 24 17.0 1981 114 3930 140 $ 16,492 $ 24,166 $ 31,176 8 6 A3 18 13.1 1982 114 3625 125 $ 18,716 $ 26,383 $ 33,362 8 4.1 A4 20 13.4 1983 114 3748 135 $ 19,334 $ 26,572 $ 33,106 8 4.1 A4 20 13.0 1984 114 3734 135 $ 20,842 $ 27,837 $ 34,336 8 4.1 A4 21 12.9 1985 114 3734 135 $ 21,431 $ 27,733 $ 34,180 8 4.1 L4 18 12.9 1986 108 3365 130 $ 24,751 $ 30,726 $ 38,734 8 4.1 L4 20 12.2 1987 108 3360 130 $ 23,740 $ 28,442 $ 35,915 8 4.1 L4 20 12.2 1988 108 3398 155 $ 25,416 $ 29,851 $ 37,104 8 4.5 L4 19 10.7 1989 108 3421 155 $ 27,288 $ 31,432 $ 38,218 8 4.5 L4 20 10.8 1990 108 3426 180 $ 29,045 $ 32,958 $ 38,727 8 4.5 L4 19 9.6 1991 108 3469 200 $ 31,825 $ 34,873 $ 40,959 8 4.9 L4 20 8.9 1992 108 3604 200 $ 33,070 $ 35,362 $ 41,545 8 4.9 L4 19 9.2 1993 108 3840 270 $ 34,490 $ 36,011 $ 42,267 8 4.6 L4 19 7.5 1994 108 3774 270 $ 37,915 $ 38,277 $ 45,516 8 4.6 L4 19 7.5 1995 108 3774 275 $ 38,855 $ 38,380 $ 45,551 8 4.6 L4 19 7.4 1996 108 3765 275 $ 41,135 $ 39,942 $ 46,958 8 4.6 L4 20 7.3 1997 108 3821 275 $ 38,660 $ 37,460 $ 43,196 8 4.6 L4 20 7.4 1998 108 3843 275 $ 39,160 $ 38,214 $ 43,128 8 4.6 L4 20 7.5 1999 108 3843 275 $ 39,905 $ 39,248 $ 43,047 8 4.6 L4 20 7.5 2000 108 3843 275 $ 39,815 $ 39,159 $ 41,561 8 4.6 L4 21 7.5 2001 108 3814 275 $ 40,756 $ 40,287 $ 41,419 8 4.6 L4 20 7.4 2002 108 3814 275 $ 42,610 $ 42,610 $ 42,610 8 4.6 L4 21 7.4
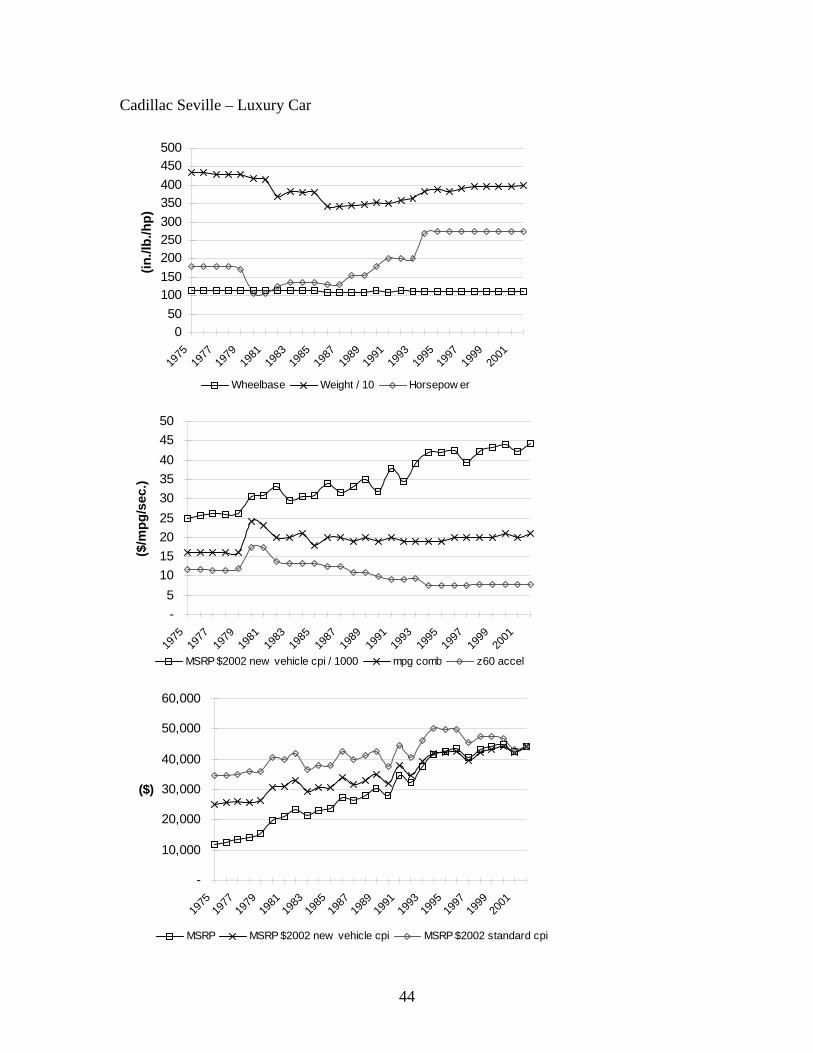
44
Cadillac Seville – Luxury Car
050
100150200250300350400450500
1975
1977
1979
1981
1983
1985
1987
1989
1991
1993
1995
1997
1999
2001
(in./l
b./h
p)
Wheelbase Weight / 10 Horsepow er
-5
101520253035404550
1975
1977
1979
1981
1983
1985
1987
1989
1991
1993
1995
1997
1999
2001
($/m
pg/s
ec.)
MSRP $2002 new vehicle cpi / 1000 mpg comb z60 accel
-
10,000
20,000
30,000
40,000
50,000
60,000
1975
1977
1979
1981
1983
1985
1987
1989
1991
1993
1995
1997
1999
2001
($)
MSRP MSRP $2002 new vehicle cpi MSRP $2002 standard cpi

45
Cadillac Seville
Year Wheel base
Curb Wgt
Horse power
MSRP Current
$
MSRP $2002 new
vehicle cpi
MSRP $2002
standard cpi
Cyl Dis (L) Tran mpg
cmb
Zero to 60
accl (sec)
1975 114 4341 180 $ 11,788 $ 24,898 $ 34,773 8 . . 16 11.6 1976 114 4340 180 $ 12,479 $ 25,611 $ 34,760 8 . . 16 11.6 1977 114 4300 180 $ 13,359 $ 26,054 $ 34,971 8 . . 16 11.5 1978 114 4300 180 $ 14,267 $ 25,842 $ 35,847 8 5.7 A 16 11.5 1979 114 4290 170 $ 15,646 $ 26,262 $ 35,885 8 5.7 A3 16 12.0 1980 114 4185 105 $ 19,662 $ 30,538 $ 40,624 8 5.7 A3 24 17.3 1981 114 4167 105 $ 21,088 $ 30,901 $ 39,864 8 5.7 A3 23 17.3 1982 114 3706 125 $ 23,433 $ 33,032 $ 41,770 8 4.1 A4 20 13.7 1983 114 3844 135 $ 21,440 $ 29,467 $ 36,712 8 4.1 A4 20 13.2 1984 114 3804 135 $ 22,962 $ 30,668 $ 37,829 8 4.1 A4 21 13.1 1985 114 3803 135 $ 23,759 $ 30,746 $ 37,893 8 4.1 L4 18 13.1 1986 108 3428 130 $ 27,256 $ 33,836 $ 42,654 8 4.1 L4 20 12.4 1987 108 3419 130 $ 26,326 $ 31,541 $ 39,828 8 4.1 L4 20 12.4 1988 108 3449 155 $ 28,152 $ 33,065 $ 41,098 8 4.5 L4 19 10.8 1989 108 3469 155 $ 30,300 $ 34,901 $ 42,437 8 4.5 L4 20 10.9 1990 114 3543 180 $ 28,090 $ 31,874 $ 37,453 8 4.5 L4 19 9.8 1991 114 3512 200 $ 34,545 $ 37,853 $ 44,459 8 4.9 L4 20 9.0 1992 114 3591 200 $ 32,340 $ 34,582 $ 40,628 8 4.9 L4 19 9.1 1993 111 3648 200 $ 37,590 $ 39,248 $ 46,066 8 4.6 L4 19 9.2 1994 111 3830 270 $ 41,615 $ 42,013 $ 49,958 8 4.6 L4 19 7.5 1995 111 3892 275 $ 42,570 $ 42,049 $ 49,906 8 4.6 L4 19 7.5 1996 111 3832 275 $ 43,635 $ 42,370 $ 49,812 8 4.6 L4 20 7.4 1997 111 3900 275 $ 40,660 $ 39,397 $ 45,430 8 4.6 L4 20 7.5 1998 112 3972 275 $ 43,160 $ 42,117 $ 47,533 8 4.6 L4 20 7.7 1999 112 3970 275 $ 44,025 $ 43,300 $ 47,492 8 4.6 L4 20 7.7 2000 112 3970 275 $ 44,775 $ 44,037 $ 46,738 8 4.6 L4 21 7.7 2001 112 3970 275 $ 42,655 $ 42,164 $ 43,349 8 4.6 L4 20 7.7 2002 112 3992 275 $ 44,269 $ 44,269 $ 44,269 8 4.6 L4 21 7.7
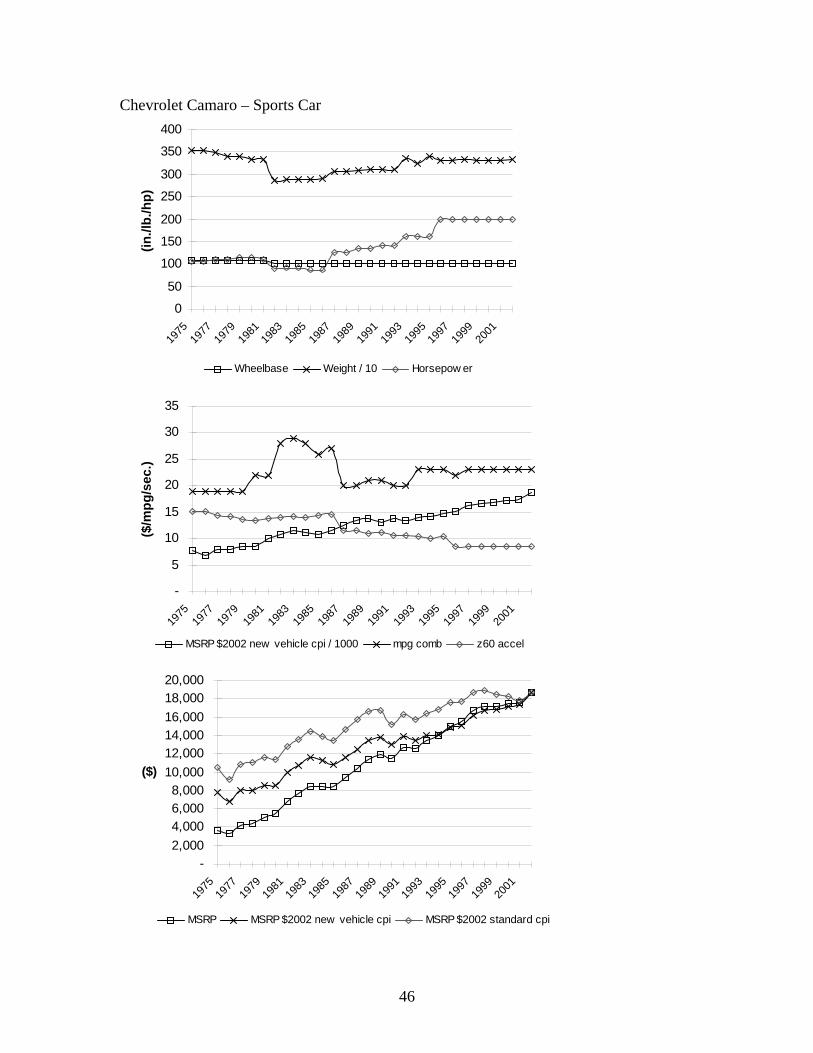
46
Chevrolet Camaro – Sports Car
0
50
100
150
200
250
300
350
400
1975
1977
1979
1981
1983
1985
1987
1989
1991
1993
1995
1997
1999
2001
(in./l
b./h
p)
Wheelbase Weight / 10 Horsepow er
-
5
10
15
20
25
30
35
1975
1977
1979
1981
1983
1985
1987
1989
1991
1993
1995
1997
1999
2001
($/m
pg/s
ec.)
MSRP $2002 new vehicle cpi / 1000 mpg comb z60 accel
-2,0004,0006,0008,000
10,00012,00014,00016,00018,00020,000
1975
1977
1979
1981
1983
1985
1987
1989
1991
1993
1995
1997
1999
2001
($)
MSRP MSRP $2002 new vehicle cpi MSRP $2002 standard cpi

47
Chevrolet Camaro
Year Wheel base
Curb Wgt
Horse power
MSRP Current
$
MSRP $2002 new
vehicle cpi
MSRP $2002
standard cpi
Cyl Dis (L) Tran mpg
cmb
Zero to 60
accl (sec)
1975 108 3531 105 $ 3,553 $ 7,756 $ 10,481 6 . . 19 15.1 1976 108 3531 105 $ 3,283 $ 6,738 $ 9,145 6 . . 19 15.1 1977 108 3479 110 $ 4,113 $ 8,022 $ 10,767 6 . . 19 14.4 1978 108 3403 110 $ 4,414 $ 7,995 $ 11,090 6 4.1 A 19 14.1 1979 108 3392 115 $ 5,073 $ 8,515 $ 11,635 6 4.1 A3 19 13.6 1980 108 3328 115 $ 5,499 $ 8,541 $ 11,362 6 3.8 A3 22 13.4 1981 108 3330 110 $ 6,780 $ 9,935 $ 12,817 6 3.8 A3 22 13.9 1982 101 2850 90 $ 7,630 $ 10,756 $ 13,601 4 2.5 M4 28 14.1 1983 101 2883 92 $ 8,450 $ 11,613 $ 14,469 4 2.5 A4 29 14.3 1984 101 2892 92 $ 8,409 $ 11,231 $ 13,853 4 2.5 M4 28 14.0 1985 101 2881 88 $ 8,399 $ 10,869 $ 13,396 4 2.5 M5 26 14.4 1986 101 2900 88 $ 9,349 $ 11,606 $ 14,631 4 2.5 M5 27 14.5 1987 101 3062 125 $ 10,409 $ 12,471 $ 15,747 6 2.8 M5 20 11.5 1988 101 3055 125 $ 11,409 $ 13,400 $ 16,655 6 2.8 M5 20 11.5 1989 101 3082 135 $ 11,934 $ 13,746 $ 16,714 6 2.8 M5 21 10.9 1990 101 3107 135 $ 11,434 $ 12,974 $ 15,245 6 3.1 L4 21 11.1 1991 101 3103 140 $ 12,649 $ 13,860 $ 16,279 6 3.1 M5 20 10.7 1992 101 3103 140 $ 12,565 $ 13,436 $ 15,785 6 3.1 M5 20 10.7 1993 101 3355 160 $ 13,399 $ 13,990 $ 16,420 6 3.3 L4 23 10.3 1994 101 3247 160 $ 13,989 $ 14,123 $ 16,794 6 3.3 L4 23 10.1 1995 101 3390 160 $ 14,995 $ 14,812 $ 17,579 6 3.3 L4 23 10.4 1996 101 3306 200 $ 15,495 $ 15,046 $ 17,688 6 3.8 L4 22 8.5 1997 101 3307 200 $ 16,740 $ 16,220 $ 18,704 6 3.8 M5 23 8.5 1998 101 3331 200 $ 17,150 $ 16,736 $ 18,888 6 3.8 M5 23 8.6 1999 101 3306 200 $ 17,160 $ 16,877 $ 18,511 6 3.8 M5 23 8.5 2000 101 3306 200 $ 17,490 $ 17,202 $ 18,257 6 3.8 M5 23 8.5 2001 101 3306 200 $ 17,560 $ 17,358 $ 17,846 6 3.8 L4 23 8.5 2002 101 3323 200 $ 18,655 $ 18,655 $ 18,655 6 3.8 M5 23 8.5

48
Chevrolet Cavalier – Compact Car
0
50
100
150
200
250
300
1982 1984 1986 1988 1990 1992 1994 1996 1998 2000 2002
(in./l
b./h
p)
Wheelbase Weight / 10 Horsepow er
-
5
10
15
20
25
30
35
1982 1984 1986 1988 1990 1992 1994 1996 1998 2000 2002
($/m
pg/s
ec.)
MSRP $2002 new vehicle cpi / 1000 mpg comb z60 accel
-
2,000
4,000
6,000
8,000
10,000
12,000
14,000
16,000
1982 1984 1986 1988 1990 1992 1994 1996 1998 2000 2002
($)
MSRP MSRP $2002 new vehicle cpi MSRP $2002 standard cpi

49
Chevrolet Cavalier
Year Wheel base
Curb Wgt
Horse power
MSRP Current
$
MSRP $2002 new
vehicle cpi
MSRP $2002
standard cpi
Cyl Dis (L) Tran mpg
cmb
Zero to 60
accl (sec)
1982 101 2413 88 $ 7,137 $ 10,061 $ 12,722 4 1.8 M4 31 12.6 1983 101 2403 88 $ 6,369 $ 8,753 $ 10,906 4 2 A3 30 12.8 1984 101 2389 88 $ 6,592 $ 8,804 $ 10,860 4 2 M4 32 12.5 1985 101 2339 85 $ 6,976 $ 9,027 $ 11,126 4 2 M4 30 12.6 1986 101 2342 85 $ 7,258 $ 9,010 $ 11,358 4 2 M4 28 12.6 1987 101 2345 85 $ 7,819 $ 9,368 $ 11,829 4 2 M4 28 12.7 1988 101 2363 90 $ 8,595 $ 10,095 $ 12,547 4 2 M5 29 12.2 1989 101 2423 90 $ 9,020 $ 10,390 $ 12,633 4 2 M5 29 12.4 1990 101 2471 95 $ 9,245 $ 10,490 $ 12,327 4 2.2 L3 28 12.3 1991 101 2444 95 $ 8,725 $ 9,561 $ 11,229 4 2.2 M5 28 12.0 1992 101 2509 110 $ 9,374 $ 10,024 $ 11,776 4 2.2 L3 26 11.1 1993 101 2520 110 $ 9,095 $ 9,496 $ 11,146 4 2.2 M5 29 11.0 1994 101 2520 120 $ 9,470 $ 9,561 $ 11,369 4 2.2 M5 29 10.2 1995 104 2617 120 $ 10,545 $ 10,416 $ 12,362 4 2.2 M5 29 10.5 1996 104 2676 120 $ 11,195 $ 10,870 $ 12,780 4 2.2 M5 29 10.7 1997 104 2676 115 $ 11,680 $ 11,317 $ 13,050 4 2.2 M5 27 11.1 1998 104 2630 115 $ 12,310 $ 12,013 $ 13,557 4 2.2 M5 28 10.9 1999 104 2676 115 $ 12,481 $ 12,275 $ 13,464 4 2.2 M5 28 11.1 2000 104 2676 115 $ 13,770 $ 13,543 $ 14,374 4 2.2 M5 28 11.1 2001 104 2676 115 $ 13,780 $ 13,621 $ 14,004 4 2.2 M5 27 11.1 2002 104 2676 115 $ 14,500 $ 14,500 $ 14,500 4 2.2 M5 28 11.1

50
Chevrolet Corvette – Sports/Luxury Car
0
50
100
150
200
250
300
350
400
1975
1977
1979
1981
1983
1985
1987
1989
1991
1993
1995
1997
1999
2001
(in./l
b./h
p)
Wheelbase Weight / 10 Horsepow er
-5
101520253035404550
1975
1977
1979
1981
1983
1985
1987
1989
1991
1993
1995
1997
1999
2001
($/m
pg/s
ec.)
MSRP $2002 new vehicle cpi / 1000 mpg comb z60 accel
-5,000
10,00015,00020,00025,00030,00035,00040,00045,00050,000
1975
1977
1979
1981
1983
1985
1987
1989
1991
1993
1995
1997
1999
2001
($)
MSRP MSRP $2002 new vehicle cpi MSRP $2002 standard cpi
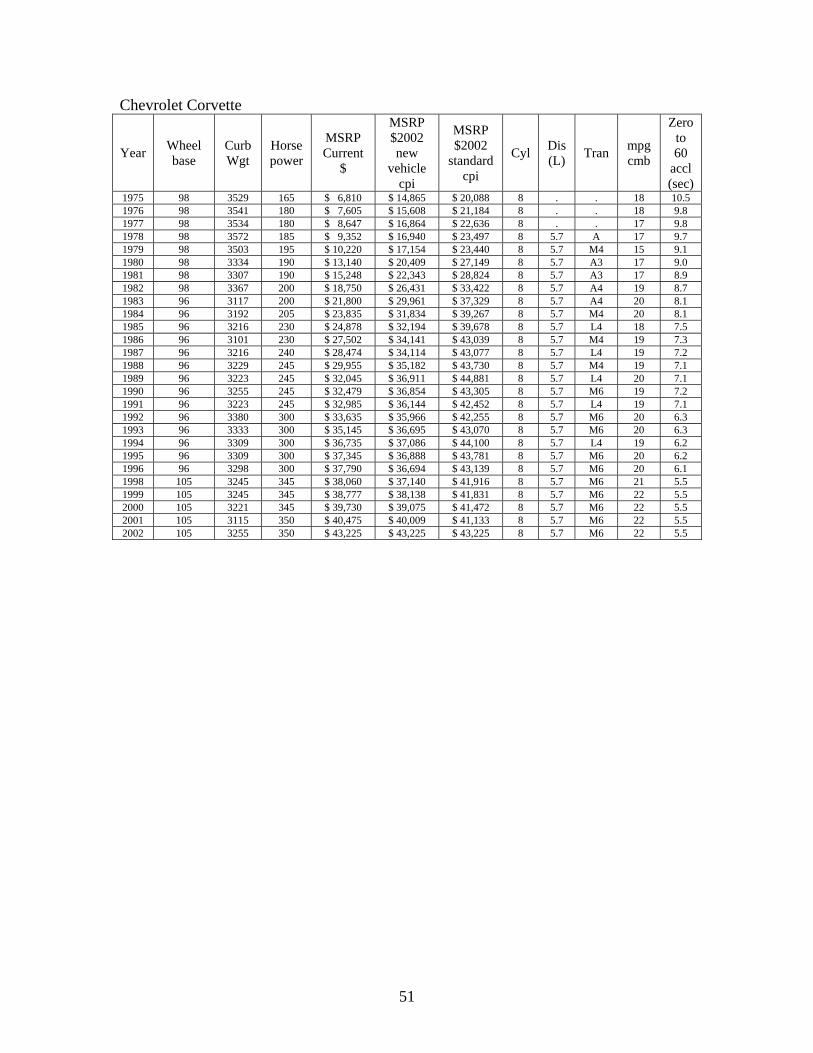
51
Chevrolet Corvette
Year Wheel base
Curb Wgt
Horse power
MSRP Current
$
MSRP $2002 new
vehicle cpi
MSRP $2002
standard cpi
Cyl Dis (L) Tran mpg
cmb
Zero to 60
accl (sec)
1975 98 3529 165 $ 6,810 $ 14,865 $ 20,088 8 . . 18 10.5 1976 98 3541 180 $ 7,605 $ 15,608 $ 21,184 8 . . 18 9.8 1977 98 3534 180 $ 8,647 $ 16,864 $ 22,636 8 . . 17 9.8 1978 98 3572 185 $ 9,352 $ 16,940 $ 23,497 8 5.7 A 17 9.7 1979 98 3503 195 $ 10,220 $ 17,154 $ 23,440 8 5.7 M4 15 9.1 1980 98 3334 190 $ 13,140 $ 20,409 $ 27,149 8 5.7 A3 17 9.0 1981 98 3307 190 $ 15,248 $ 22,343 $ 28,824 8 5.7 A3 17 8.9 1982 98 3367 200 $ 18,750 $ 26,431 $ 33,422 8 5.7 A4 19 8.7 1983 96 3117 200 $ 21,800 $ 29,961 $ 37,329 8 5.7 A4 20 8.1 1984 96 3192 205 $ 23,835 $ 31,834 $ 39,267 8 5.7 M4 20 8.1 1985 96 3216 230 $ 24,878 $ 32,194 $ 39,678 8 5.7 L4 18 7.5 1986 96 3101 230 $ 27,502 $ 34,141 $ 43,039 8 5.7 M4 19 7.3 1987 96 3216 240 $ 28,474 $ 34,114 $ 43,077 8 5.7 L4 19 7.2 1988 96 3229 245 $ 29,955 $ 35,182 $ 43,730 8 5.7 M4 19 7.1 1989 96 3223 245 $ 32,045 $ 36,911 $ 44,881 8 5.7 L4 20 7.1 1990 96 3255 245 $ 32,479 $ 36,854 $ 43,305 8 5.7 M6 19 7.2 1991 96 3223 245 $ 32,985 $ 36,144 $ 42,452 8 5.7 L4 19 7.1 1992 96 3380 300 $ 33,635 $ 35,966 $ 42,255 8 5.7 M6 20 6.3 1993 96 3333 300 $ 35,145 $ 36,695 $ 43,070 8 5.7 M6 20 6.3 1994 96 3309 300 $ 36,735 $ 37,086 $ 44,100 8 5.7 L4 19 6.2 1995 96 3309 300 $ 37,345 $ 36,888 $ 43,781 8 5.7 M6 20 6.2 1996 96 3298 300 $ 37,790 $ 36,694 $ 43,139 8 5.7 M6 20 6.1 1998 105 3245 345 $ 38,060 $ 37,140 $ 41,916 8 5.7 M6 21 5.5 1999 105 3245 345 $ 38,777 $ 38,138 $ 41,831 8 5.7 M6 22 5.5 2000 105 3221 345 $ 39,730 $ 39,075 $ 41,472 8 5.7 M6 22 5.5 2001 105 3115 350 $ 40,475 $ 40,009 $ 41,133 8 5.7 M6 22 5.5 2002 105 3255 350 $ 43,225 $ 43,225 $ 43,225 8 5.7 M6 22 5.5

52
Chevrolet Monte Carlo/Lumina – Midsize Car
050
100150200250300350400450
1975
1977
1979
1981
1983
1985
1987
1989
1991
1993
1995
1997
1999
2001
(in./l
b./h
p)
Wheelbase Weight / 10 Horsepow er
-
5
10
15
20
25
30
1975
1977
1979
1981
1983
1985
1987
1989
1991
1993
1995
1997
1999
2001
($/m
pg/s
ec.)
MSRP $2002 new vehicle cpi / 1000 mpg comb z60 accel
-
5,000
10,000
15,000
20,000
25,000
1975
1977
1979
1981
1983
1985
1987
1990
1992
1994
1996
1998
2000
2002
($)
MSRP MSRP $2002 new vehicle cpi MSRP $2002 standard cpi

53
Chevrolet Monte Carlo/Lumina
Year Wheel base
Curb Wgt
Horse power
MSRP Current
$
MSRP $2002 new
vehicle cpi
MSRP $2002
standard cpi
Cyl Dis (L) Tran mpg
cmb
Zero to 60
accl (sec)
1975 108 3531 105 $ 3,553 $ 7,756 $ 10,481 6 . . 19 15.1 1976 108 3531 105 $ 3,283 $ 6,738 $ 9,145 6 . . 19 15.1 1977 108 3479 110 $ 4,113 $ 8,022 $ 10,767 6 . . 19 14.4 1978 108 3403 110 $ 4,414 $ 7,995 $ 11,090 6 4.1 A 19 14.1 1979 108 3392 115 $ 5,073 $ 8,515 $ 11,635 6 4.1 A3 19 13.6 1980 108 3328 115 $ 5,499 $ 8,541 $ 11,362 6 3.8 A3 22 13.4 1981 108 3330 110 $ 6,780 $ 9,935 $ 12,817 6 3.8 A3 22 13.9 1982 101 2850 90 $ 7,630 $ 10,756 $ 13,601 4 2.5 M4 28 14.1 1983 101 2883 92 $ 8,450 $ 11,613 $ 14,469 4 2.5 A4 29 14.3 1984 101 2892 92 $ 8,409 $ 11,231 $ 13,853 4 2.5 M4 28 14.0 1985 101 2881 88 $ 8,399 $ 10,869 $ 13,396 4 2.5 M5 26 14.4 1986 101 2900 88 $ 9,349 $ 11,606 $ 14,631 4 2.5 M5 27 14.5 1987 101 3062 125 $ 10,409 $ 12,471 $ 15,747 6 2.8 M5 20 11.5 1988 101 3055 125 $ 11,409 $ 13,400 $ 16,655 6 2.8 M5 20 11.5 1989 101 3082 135 $ 11,934 $ 13,746 $ 16,714 6 2.8 M5 21 10.9 1990 101 3107 135 $ 11,434 $ 12,974 $ 15,245 6 3.1 L4 21 11.1 1991 101 3103 140 $ 12,649 $ 13,860 $ 16,279 6 3.1 M5 20 10.7 1992 101 3103 140 $ 12,565 $ 13,436 $ 15,785 6 3.1 M5 20 10.7 1993 101 3355 160 $ 13,399 $ 13,990 $ 16,420 6 3.3 L4 23 10.3 1994 101 3247 160 $ 13,989 $ 14,123 $ 16,794 6 3.3 L4 23 10.1 1995 101 3390 160 $ 14,995 $ 14,812 $ 17,579 6 3.3 L4 23 10.4 1996 101 3306 200 $ 15,495 $ 15,046 $ 17,688 6 3.8 L4 22 8.5 1997 101 3307 200 $ 16,740 $ 16,220 $ 18,704 6 3.8 M5 23 8.5 1998 101 3331 200 $ 17,150 $ 16,736 $ 18,888 6 3.8 M5 23 8.6 1999 101 3306 200 $ 17,160 $ 16,877 $ 18,511 6 3.8 M5 23 8.5 2000 101 3306 200 $ 17,490 $ 17,202 $ 18,257 6 3.8 M5 23 8.5 2001 101 3306 200 $ 17,560 $ 17,358 $ 17,846 6 3.8 L4 23 8.5 2002 101 3323 200 $ 18,655 $ 18,655 $ 18,655 6 3.8 M5 23 8.5
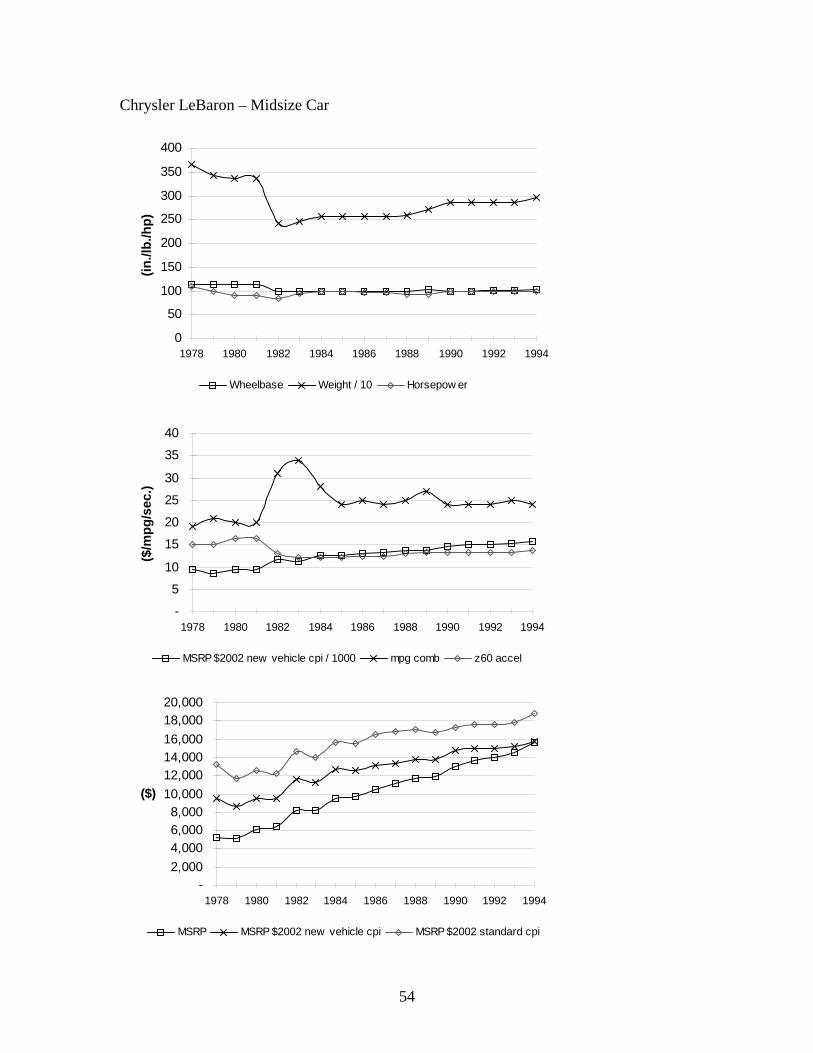
54
Chrysler LeBaron – Midsize Car
0
50
100
150
200
250
300
350
400
1978 1980 1982 1984 1986 1988 1990 1992 1994
(in./l
b./h
p)
Wheelbase Weight / 10 Horsepow er
-
5
10
15
20
25
30
35
40
1978 1980 1982 1984 1986 1988 1990 1992 1994
($/m
pg/s
ec.)
MSRP $2002 new vehicle cpi / 1000 mpg comb z60 accel
-2,0004,0006,0008,000
10,00012,00014,00016,00018,00020,000
1978 1980 1982 1984 1986 1988 1990 1992 1994
($)
MSRP MSRP $2002 new vehicle cpi MSRP $2002 standard cpi

55
Chrysler LeBaron
Year Wheel base
Curb Wgt
Horse power
MSRP Current
$
MSRP $2002 new
vehicle cpi
MSRP $2002
standard cpi
Cyl Dis (L) Tran mpg
cmb
Zero to 60
accl (sec)
1978 113 3654 110 $ 5,270 $ 9,546 $ 13,241 6 3.7 A 19 15.0 1979 113 3429 100 $ 5,122 $ 8,597 $ 11,748 6 3.7 M4 21 15.0 1980 113 3375 90 $ 6,103 $ 9,479 $ 12,610 6 3.7 A3 20 16.5 1981 113 3375 90 $ 6,495 $ 9,517 $ 12,278 6 3.7 A3 20 16.5 1982 100 2416 84 $ 8,237 $ 11,611 $ 14,683 4 2.2 M4 31 13.1 1983 100 2464 94 $ 8,154 $ 11,207 $ 13,962 4 2.2 M5 34 12.2 1984 100 2560 99 $ 9,465 $ 12,641 $ 15,593 4 2.2 A3 28 12.2 1985 100 2559 99 $ 9,707 $ 12,561 $ 15,482 4 2.2 A3 24 12.2 1986 100 2566 97 $ 10,525 $ 13,066 $ 16,471 4 2.2 A3 25 12.5 1987 100 2566 97 $ 11,105 $ 13,305 $ 16,800 4 2.2 A3 24 12.5 1988 100 2592 93 $ 11,715 $ 13,759 $ 17,102 4 2.2 L3 25 13.0 1989 103 2714 93 $ 11,945 $ 13,759 $ 16,730 4 2.5 M5 27 13.2 1990 100 2863 100 $ 12,960 $ 14,706 $ 17,280 4 2.5 L3 24 13.3 1991 100 2853 100 $ 13,650 $ 14,957 $ 17,568 4 2.5 L3 24 13.2 1992 101 2863 100 $ 13,998 $ 14,968 $ 17,585 4 2.5 L3 24 13.3 1993 101 2863 100 $ 14,554 $ 15,196 $ 17,836 4 2.5 L3 25 13.3 1994 104 2971 100 $ 15,626 $ 15,775 $ 18,759 4 2.5 L3 24 13.7
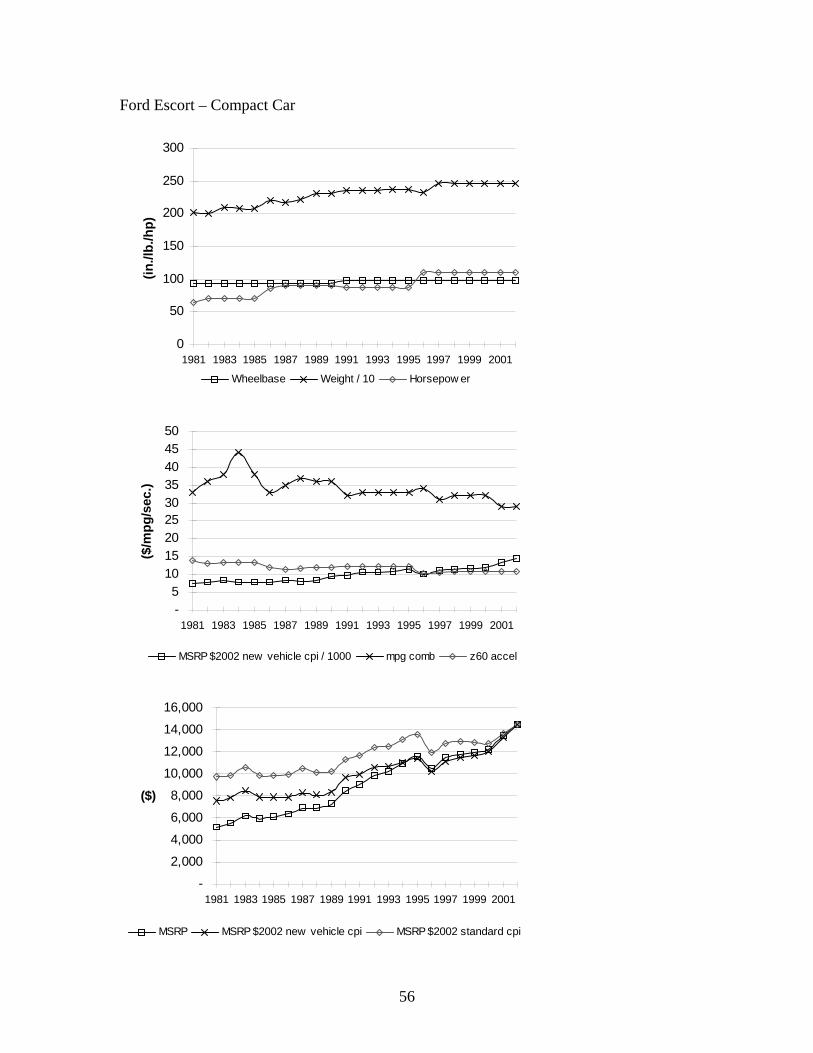
56
Ford Escort – Compact Car
0
50
100
150
200
250
300
1981 1983 1985 1987 1989 1991 1993 1995 1997 1999 2001
(in./l
b./h
p)
Wheelbase Weight / 10 Horsepow er
-5
101520253035404550
1981 1983 1985 1987 1989 1991 1993 1995 1997 1999 2001
($/m
pg/s
ec.)
MSRP $2002 new vehicle cpi / 1000 mpg comb z60 accel
-
2,000
4,000
6,000
8,000
10,000
12,000
14,000
16,000
1981 1983 1985 1987 1989 1991 1993 1995 1997 1999 2001
($)
MSRP MSRP $2002 new vehicle cpi MSRP $2002 standard cpi

57
Ford Escort
Year Wheel base
Curb Wgt
Horse power
MSRP Current
$
MSRP $2002 new
vehicle cpi
MSRP $2002
standard cpi
Cyl Dis (L) Tran mpg
cmb
Zero to 60
accl (sec)
1981 94 2021 65 $ 5,158 $ 7,558 $ 9,750 4 1.6 M4 33 13.9 1982 94 2007 70 $ 5,518 $ 7,778 $ 9,836 4 1.6 M4 36 13.0 1983 94 2094 70 $ 6,154 $ 8,458 $ 10,538 4 1.6 M4 38 13.5 1984 94 2080 70 $ 5,937 $ 7,929 $ 9,781 4 1.6 M4 44 13.4 1985 94 2074 70 $ 6,135 $ 7,939 $ 9,785 4 1.6 M4 38 13.4 1986 94 2201 86 $ 6,360 $ 7,895 $ 9,953 4 1.9 M4 33 11.9 1987 94 2180 90 $ 6,895 $ 8,261 $ 10,431 4 1.9 M4 35 11.4 1988 94 2222 90 $ 6,895 $ 8,098 $ 10,066 4 1.9 M4 37 11.6 1989 94 2313 90 $ 7,299 $ 8,407 $ 10,223 4 1.9 M4 36 12.0 1990 94 2310 90 $ 8,476 $ 9,618 $ 11,301 4 1.9 M4 36 12.0 1991 98 2355 88 $ 9,029 $ 9,894 $ 11,620 4 1.9 M5 32 12.4 1992 98 2355 88 $ 9,858 $ 10,541 $ 12,384 4 1.9 M5 33 12.4 1993 98 2360 88 $ 10,172 $ 10,621 $ 12,466 4 1.9 M5 33 12.4 1994 98 2371 88 $ 10,925 $ 11,029 $ 13,115 4 1.9 M5 33 12.4 1995 98 2371 88 $ 11,530 $ 11,389 $ 13,517 4 1.9 M5 33 12.4 1996 98 2323 110 $ 10,455 $ 10,152 $ 11,935 4 1.9 M5 34 10.3 1997 98 2457 110 $ 11,430 $ 11,075 $ 12,771 4 2 M5 31 10.7 1998 98 2468 110 $ 11,745 $ 11,461 $ 12,935 4 2 M5 32 10.8 1999 98 2468 110 $ 11,870 $ 11,674 $ 12,805 4 2 M5 32 10.8 2000 98 2468 110 $ 12,200 $ 11,999 $ 12,735 4 2 L4 32 10.8 2001 98 2468 110 $ 13,435 $ 13,280 $ 13,653 4 2 L4 29 10.9 2002 98 2468 110 $ 14,450 $ 14,450 $ 14,450 4 2 L4 29 10.9

58
Ford Mustang – Sports Car
0
50
100
150
200
250
300
350
1975
1977
1979
1981
1983
1985
1987
1989
1991
1993
1995
1997
1999
2001
(in./l
b./h
p)
Wheelbase Weight / 10 Horsepow er
-
5
10
15
20
25
30
35
1975
1977
1979
1981
1983
1985
1987
1989
1991
1993
1995
1997
1999
2001
($/m
pg/s
ec.)
MSRP $2002 new vehicle cpi / 1000 mpg comb z60 accel
-2,0004,0006,0008,000
10,00012,00014,00016,00018,00020,000
1975
1977
1979
1981
1983
1985
1987
1989
1991
1993
1995
1997
1999
2001
($)
MSRP MSRP $2002 new vehicle cpi MSRP $2002 standard cpi

59
Ford Mustang
Year Wheel base
Curb Wgt
Horse power
MSRP Current
$
MSRP $2002 new
vehicle cpi
MSRP $2002
standard cpi
Cyl Dis (L) Tran mpg
cmb
Zero to 60
accl (sec)
1975 96 2759 87 $ 3,529 $ 7,703 $ 10,410 4 . . 25 14.4 1976 96 2779 92 $ 3,525 $ 7,234 $ 9,819 4 . . 24 13.9 1977 96 2735 89 $ 3,702 $ 7,220 $ 9,691 4 . . 25 14.1 1978 96 2698 88 $ 3,555 $ 6,439 $ 8,932 4 2.3 A 25 14.0 1979 100 2532 88 $ 4,071 $ 6,833 $ 9,337 4 2.3 M4 24 13.1 1980 100 2588 88 $ 4,884 $ 7,586 $ 10,091 4 2.3 A3 25 13.6 1981 100 2588 88 $ 6,171 $ 9,042 $ 11,665 4 2.3 M4 27 13.3 1982 100 2683 86 $ 6,345 $ 8,944 $ 11,310 4 2.3 M4 26 13.9 1983 100 2679 90 $ 7,101 $ 9,759 $ 12,159 4 2.3 M4 31 13.4 1984 101 2664 88 $ 7,472 $ 9,980 $ 12,310 4 2.3 M4 29 13.6 1985 101 2782 88 $ 7,259 $ 9,394 $ 11,577 4 2.3 M4 26 14.1 1986 101 2733 88 $ 7,563 $ 9,389 $ 11,836 4 2.3 M4 25 13.9 1987 101 2724 90 $ 8,645 $ 10,357 $ 13,079 4 2.3 M5 27 13.6 1988 101 2751 90 $ 9,209 $ 10,816 $ 13,444 4 2.3 M5 27 13.7 1989 101 2754 88 $ 9,956 $ 11,468 $ 13,944 4 2.3 M5 25 14.0 1990 101 2960 88 $ 10,300 $ 11,520 $ 13,733 4 2.3 M5 26 14.8 1991 101 2759 105 $ 10,587 $ 11,601 $ 13,625 4 2.3 M5 25 12.2 1992 101 2775 105 $ 11,163 $ 11,937 $ 14,024 4 2.3 M5 25 12.2 1993 101 2775 105 $ 11,285 $ 11,783 $ 13,830 4 2.3 M5 25 12.2 1994 101 3077 145 $ 13,365 $ 13,493 $ 16,044 6 3.8 L4 23 11.0 1995 101 3077 145 $ 15,030 $ 14,846 $ 17,620 6 3.8 M5 24 10.3 1996 101 3065 145 $ 15,680 $ 15,225 $ 17,900 6 3.8 L4 23 10.4 1997 101 3065 150 $ 15,880 $ 15,387 $ 17,743 6 3.8 L4 23 10.1 1998 101 3065 150 $ 16,595 $ 16,194 $ 18,276 6 3.8 M5 24 10.0 1999 101 3069 190 $ 16,995 $ 16,715 $ 18,333 6 3.8 M5 23 8.4 2000 101 3069 190 $ 17,070 $ 16,789 $ 17,818 6 3.8 M5 23 8.4 2001 101 3114 190 $ 17,380 $ 17,180 $ 17,663 6 3.8 M5 23 8.5 2002 101 3066 190 $ 17,820 $ 17,820 $ 17,820 6 3.8 M5 23 8.4

60
Honda Accord – Compact/Midsize Car
0
50
100
150
200
250
300
350
1977
1979
1981
1983
1985
1987
1989
1991
1993
1995
1997
1999
2001
(in./l
b./h
p)
Wheelbase Weight / 10 Horsepow er
-5
101520
25303540
1977
1979
1981
1983
1985
1987
1989
1991
1993
1995
1997
1999
2001
($/m
pg/s
ec.)
MSRP $2002 new vehicle cpi / 1000 mpg comb z60 accel
-2,0004,0006,0008,000
10,00012,00014,00016,00018,00020,000
1977
1979
1981
1983
1985
1987
1989
1991
1993
1995
1997
1999
2001
($)
MSRP MSRP $2002 new vehicle cpi MSRP $2002 standard cpi
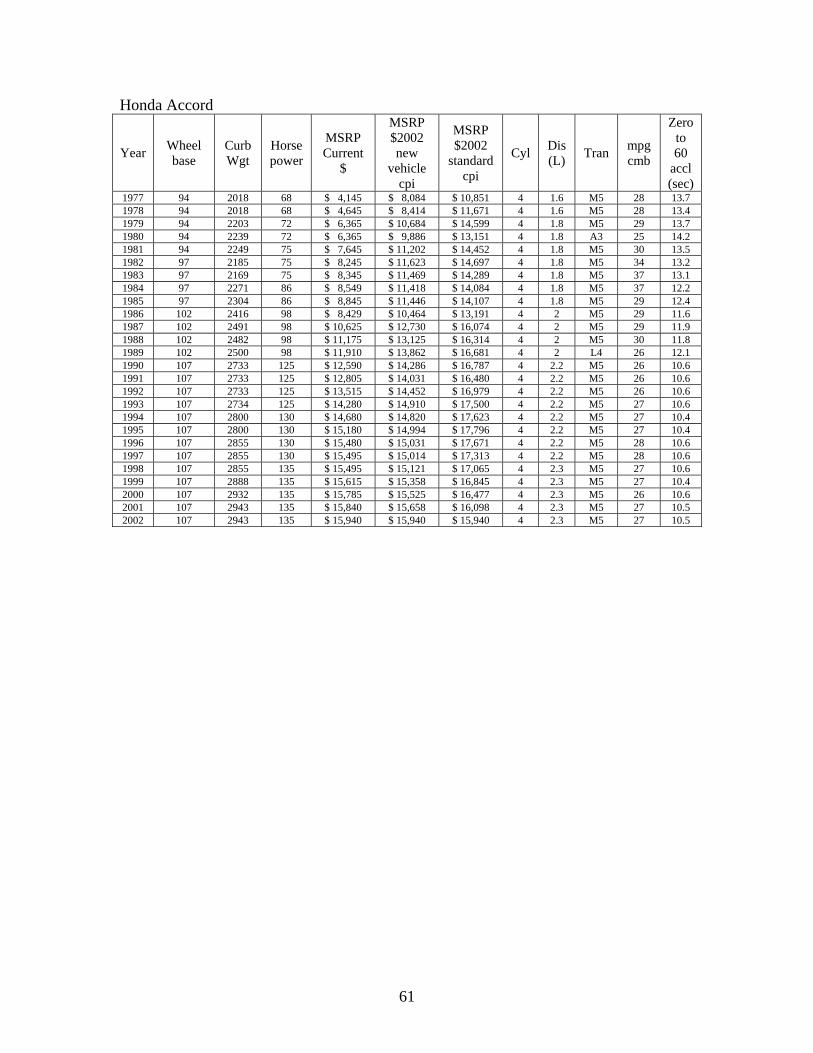
61
Honda Accord
Year Wheel base
Curb Wgt
Horse power
MSRP Current
$
MSRP $2002 new
vehicle cpi
MSRP $2002
standard cpi
Cyl Dis (L) Tran mpg
cmb
Zero to 60
accl (sec)
1977 94 2018 68 $ 4,145 $ 8,084 $ 10,851 4 1.6 M5 28 13.7 1978 94 2018 68 $ 4,645 $ 8,414 $ 11,671 4 1.6 M5 28 13.4 1979 94 2203 72 $ 6,365 $ 10,684 $ 14,599 4 1.8 M5 29 13.7 1980 94 2239 72 $ 6,365 $ 9,886 $ 13,151 4 1.8 A3 25 14.2 1981 94 2249 75 $ 7,645 $ 11,202 $ 14,452 4 1.8 M5 30 13.5 1982 97 2185 75 $ 8,245 $ 11,623 $ 14,697 4 1.8 M5 34 13.2 1983 97 2169 75 $ 8,345 $ 11,469 $ 14,289 4 1.8 M5 37 13.1 1984 97 2271 86 $ 8,549 $ 11,418 $ 14,084 4 1.8 M5 37 12.2 1985 97 2304 86 $ 8,845 $ 11,446 $ 14,107 4 1.8 M5 29 12.4 1986 102 2416 98 $ 8,429 $ 10,464 $ 13,191 4 2 M5 29 11.6 1987 102 2491 98 $ 10,625 $ 12,730 $ 16,074 4 2 M5 29 11.9 1988 102 2482 98 $ 11,175 $ 13,125 $ 16,314 4 2 M5 30 11.8 1989 102 2500 98 $ 11,910 $ 13,862 $ 16,681 4 2 L4 26 12.1 1990 107 2733 125 $ 12,590 $ 14,286 $ 16,787 4 2.2 M5 26 10.6 1991 107 2733 125 $ 12,805 $ 14,031 $ 16,480 4 2.2 M5 26 10.6 1992 107 2733 125 $ 13,515 $ 14,452 $ 16,979 4 2.2 M5 26 10.6 1993 107 2734 125 $ 14,280 $ 14,910 $ 17,500 4 2.2 M5 27 10.6 1994 107 2800 130 $ 14,680 $ 14,820 $ 17,623 4 2.2 M5 27 10.4 1995 107 2800 130 $ 15,180 $ 14,994 $ 17,796 4 2.2 M5 27 10.4 1996 107 2855 130 $ 15,480 $ 15,031 $ 17,671 4 2.2 M5 28 10.6 1997 107 2855 130 $ 15,495 $ 15,014 $ 17,313 4 2.2 M5 28 10.6 1998 107 2855 135 $ 15,495 $ 15,121 $ 17,065 4 2.3 M5 27 10.6 1999 107 2888 135 $ 15,615 $ 15,358 $ 16,845 4 2.3 M5 27 10.4 2000 107 2932 135 $ 15,785 $ 15,525 $ 16,477 4 2.3 M5 26 10.6 2001 107 2943 135 $ 15,840 $ 15,658 $ 16,098 4 2.3 M5 27 10.5 2002 107 2943 135 $ 15,940 $ 15,940 $ 15,940 4 2.3 M5 27 10.5

62
Honda Civic – Mini/Sub-Compact
0
50
100
150
200
250
300
1975
1977
1979
1981
1983
1985
1987
1989
1991
1993
1995
1997
1999
2001
(in./l
b./h
p)
Wheelbase Weight / 10 Horsepow er
-5
101520253035404550
1975
1977
1979
1981
1983
1985
1987
1989
1991
1993
1995
1997
1999
2001
($/m
pg/s
ec.)
MSRP $2002 new vehicle cpi / 1000 mpg comb z60 accel
-2,0004,0006,0008,000
10,00012,00014,00016,000
1975
1977
1979
1981
1983
1985
1987
1989
1991
1993
1995
1997
1999
2001
($)
MSRP MSRP $2002 new vehicle cpi MSRP $2002 standard cpi
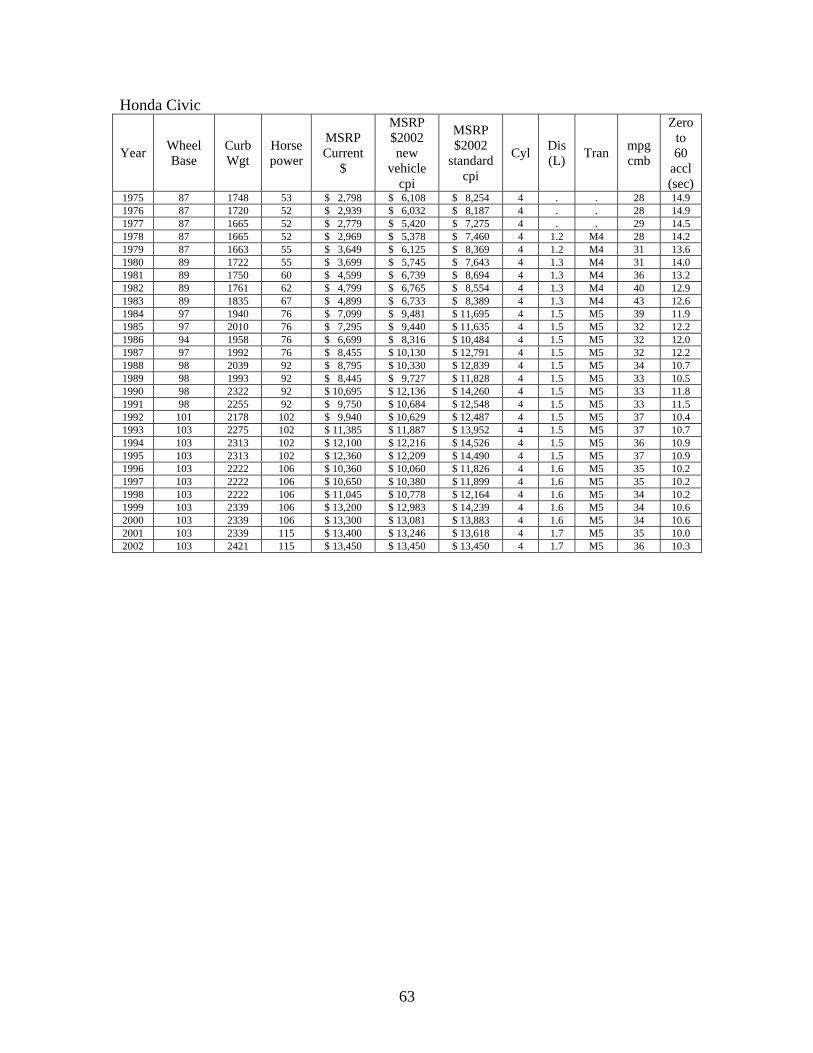
63
Honda Civic
Year Wheel Base
Curb Wgt
Horse power
MSRP Current
$
MSRP $2002 new
vehicle cpi
MSRP $2002
standard cpi
Cyl Dis (L) Tran mpg
cmb
Zero to 60
accl (sec)
1975 87 1748 53 $ 2,798 $ 6,108 $ 8,254 4 . . 28 14.9 1976 87 1720 52 $ 2,939 $ 6,032 $ 8,187 4 . . 28 14.9 1977 87 1665 52 $ 2,779 $ 5,420 $ 7,275 4 . . 29 14.5 1978 87 1665 52 $ 2,969 $ 5,378 $ 7,460 4 1.2 M4 28 14.2 1979 87 1663 55 $ 3,649 $ 6,125 $ 8,369 4 1.2 M4 31 13.6 1980 89 1722 55 $ 3,699 $ 5,745 $ 7,643 4 1.3 M4 31 14.0 1981 89 1750 60 $ 4,599 $ 6,739 $ 8,694 4 1.3 M4 36 13.2 1982 89 1761 62 $ 4,799 $ 6,765 $ 8,554 4 1.3 M4 40 12.9 1983 89 1835 67 $ 4,899 $ 6,733 $ 8,389 4 1.3 M4 43 12.6 1984 97 1940 76 $ 7,099 $ 9,481 $ 11,695 4 1.5 M5 39 11.9 1985 97 2010 76 $ 7,295 $ 9,440 $ 11,635 4 1.5 M5 32 12.2 1986 94 1958 76 $ 6,699 $ 8,316 $ 10,484 4 1.5 M5 32 12.0 1987 97 1992 76 $ 8,455 $ 10,130 $ 12,791 4 1.5 M5 32 12.2 1988 98 2039 92 $ 8,795 $ 10,330 $ 12,839 4 1.5 M5 34 10.7 1989 98 1993 92 $ 8,445 $ 9,727 $ 11,828 4 1.5 M5 33 10.5 1990 98 2322 92 $ 10,695 $ 12,136 $ 14,260 4 1.5 M5 33 11.8 1991 98 2255 92 $ 9,750 $ 10,684 $ 12,548 4 1.5 M5 33 11.5 1992 101 2178 102 $ 9,940 $ 10,629 $ 12,487 4 1.5 M5 37 10.4 1993 103 2275 102 $ 11,385 $ 11,887 $ 13,952 4 1.5 M5 37 10.7 1994 103 2313 102 $ 12,100 $ 12,216 $ 14,526 4 1.5 M5 36 10.9 1995 103 2313 102 $ 12,360 $ 12,209 $ 14,490 4 1.5 M5 37 10.9 1996 103 2222 106 $ 10,360 $ 10,060 $ 11,826 4 1.6 M5 35 10.2 1997 103 2222 106 $ 10,650 $ 10,380 $ 11,899 4 1.6 M5 35 10.2 1998 103 2222 106 $ 11,045 $ 10,778 $ 12,164 4 1.6 M5 34 10.2 1999 103 2339 106 $ 13,200 $ 12,983 $ 14,239 4 1.6 M5 34 10.6 2000 103 2339 106 $ 13,300 $ 13,081 $ 13,883 4 1.6 M5 34 10.6 2001 103 2339 115 $ 13,400 $ 13,246 $ 13,618 4 1.7 M5 35 10.0 2002 103 2421 115 $ 13,450 $ 13,450 $ 13,450 4 1.7 M5 36 10.3
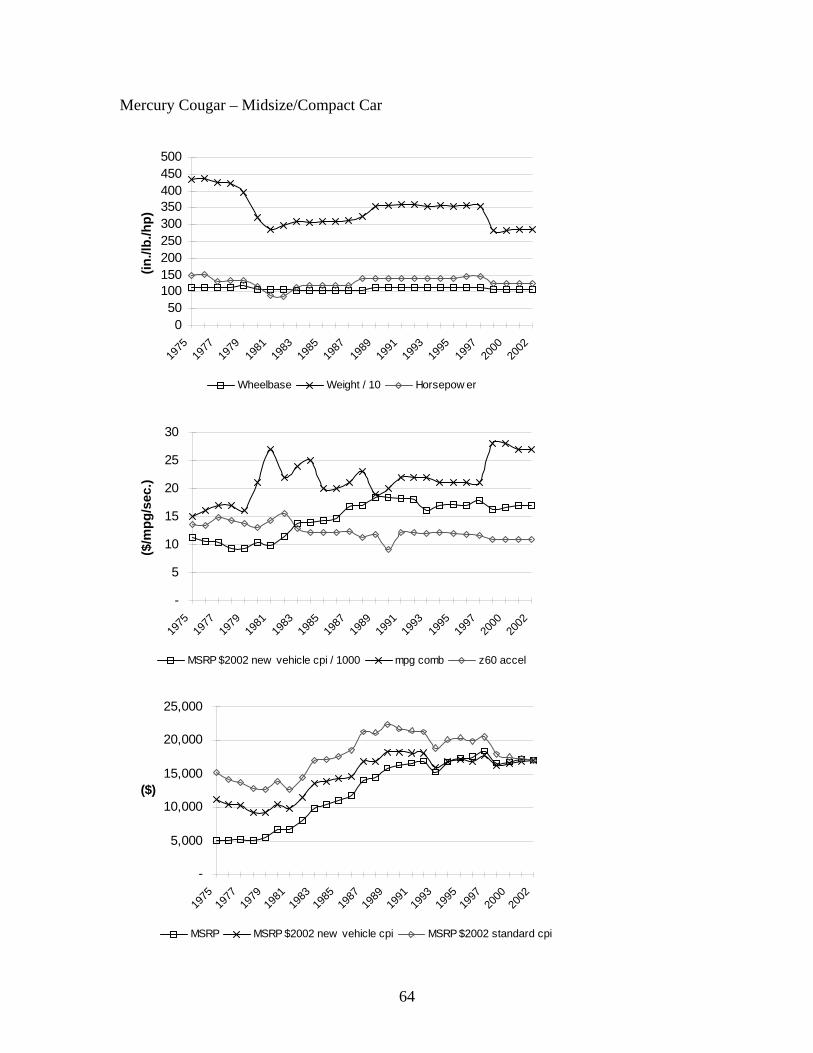
64
Mercury Cougar – Midsize/Compact Car
050
100150200250300350400450500
1975
1977
1979
1981
1983
1985
1987
1989
1991
1993
1995
1997
2000
2002
(in./l
b./h
p)
Wheelbase Weight / 10 Horsepow er
-
5
10
15
20
25
30
1975
1977
1979
1981
1983
1985
1987
1989
1991
1993
1995
1997
2000
2002
($/m
pg/s
ec.)
MSRP $2002 new vehicle cpi / 1000 mpg comb z60 accel
-
5,000
10,000
15,000
20,000
25,000
1975
1977
1979
1981
1983
1985
1987
1989
1991
1993
1995
1997
2000
2002
($)
MSRP MSRP $2002 new vehicle cpi MSRP $2002 standard cpi
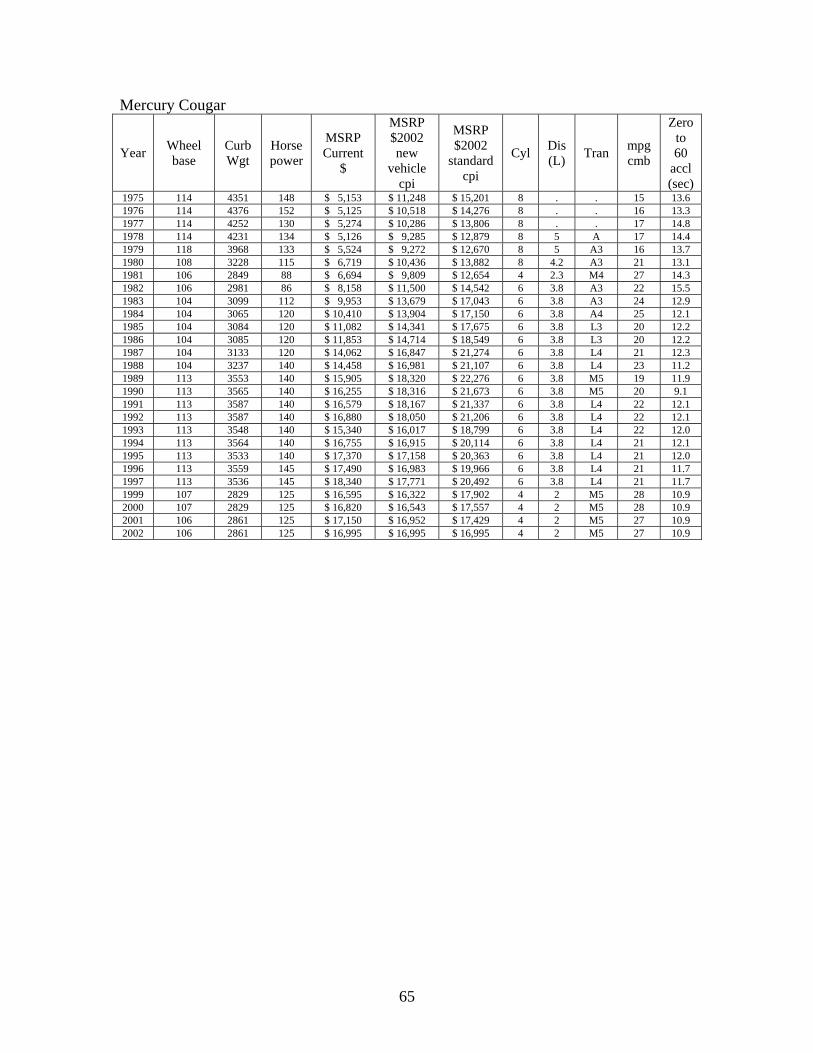
65
Mercury Cougar
Year Wheel base
Curb Wgt
Horse power
MSRP Current
$
MSRP $2002 new
vehicle cpi
MSRP $2002
standard cpi
Cyl Dis (L) Tran mpg
cmb
Zero to 60
accl (sec)
1975 114 4351 148 $ 5,153 $ 11,248 $ 15,201 8 . . 15 13.6 1976 114 4376 152 $ 5,125 $ 10,518 $ 14,276 8 . . 16 13.3 1977 114 4252 130 $ 5,274 $ 10,286 $ 13,806 8 . . 17 14.8 1978 114 4231 134 $ 5,126 $ 9,285 $ 12,879 8 5 A 17 14.4 1979 118 3968 133 $ 5,524 $ 9,272 $ 12,670 8 5 A3 16 13.7 1980 108 3228 115 $ 6,719 $ 10,436 $ 13,882 8 4.2 A3 21 13.1 1981 106 2849 88 $ 6,694 $ 9,809 $ 12,654 4 2.3 M4 27 14.3 1982 106 2981 86 $ 8,158 $ 11,500 $ 14,542 6 3.8 A3 22 15.5 1983 104 3099 112 $ 9,953 $ 13,679 $ 17,043 6 3.8 A3 24 12.9 1984 104 3065 120 $ 10,410 $ 13,904 $ 17,150 6 3.8 A4 25 12.1 1985 104 3084 120 $ 11,082 $ 14,341 $ 17,675 6 3.8 L3 20 12.2 1986 104 3085 120 $ 11,853 $ 14,714 $ 18,549 6 3.8 L3 20 12.2 1987 104 3133 120 $ 14,062 $ 16,847 $ 21,274 6 3.8 L4 21 12.3 1988 104 3237 140 $ 14,458 $ 16,981 $ 21,107 6 3.8 L4 23 11.2 1989 113 3553 140 $ 15,905 $ 18,320 $ 22,276 6 3.8 M5 19 11.9 1990 113 3565 140 $ 16,255 $ 18,316 $ 21,673 6 3.8 M5 20 9.1 1991 113 3587 140 $ 16,579 $ 18,167 $ 21,337 6 3.8 L4 22 12.1 1992 113 3587 140 $ 16,880 $ 18,050 $ 21,206 6 3.8 L4 22 12.1 1993 113 3548 140 $ 15,340 $ 16,017 $ 18,799 6 3.8 L4 22 12.0 1994 113 3564 140 $ 16,755 $ 16,915 $ 20,114 6 3.8 L4 21 12.1 1995 113 3533 140 $ 17,370 $ 17,158 $ 20,363 6 3.8 L4 21 12.0 1996 113 3559 145 $ 17,490 $ 16,983 $ 19,966 6 3.8 L4 21 11.7 1997 113 3536 145 $ 18,340 $ 17,771 $ 20,492 6 3.8 L4 21 11.7 1999 107 2829 125 $ 16,595 $ 16,322 $ 17,902 4 2 M5 28 10.9 2000 107 2829 125 $ 16,820 $ 16,543 $ 17,557 4 2 M5 28 10.9 2001 106 2861 125 $ 17,150 $ 16,952 $ 17,429 4 2 M5 27 10.9 2002 106 2861 125 $ 16,995 $ 16,995 $ 16,995 4 2 M5 27 10.9
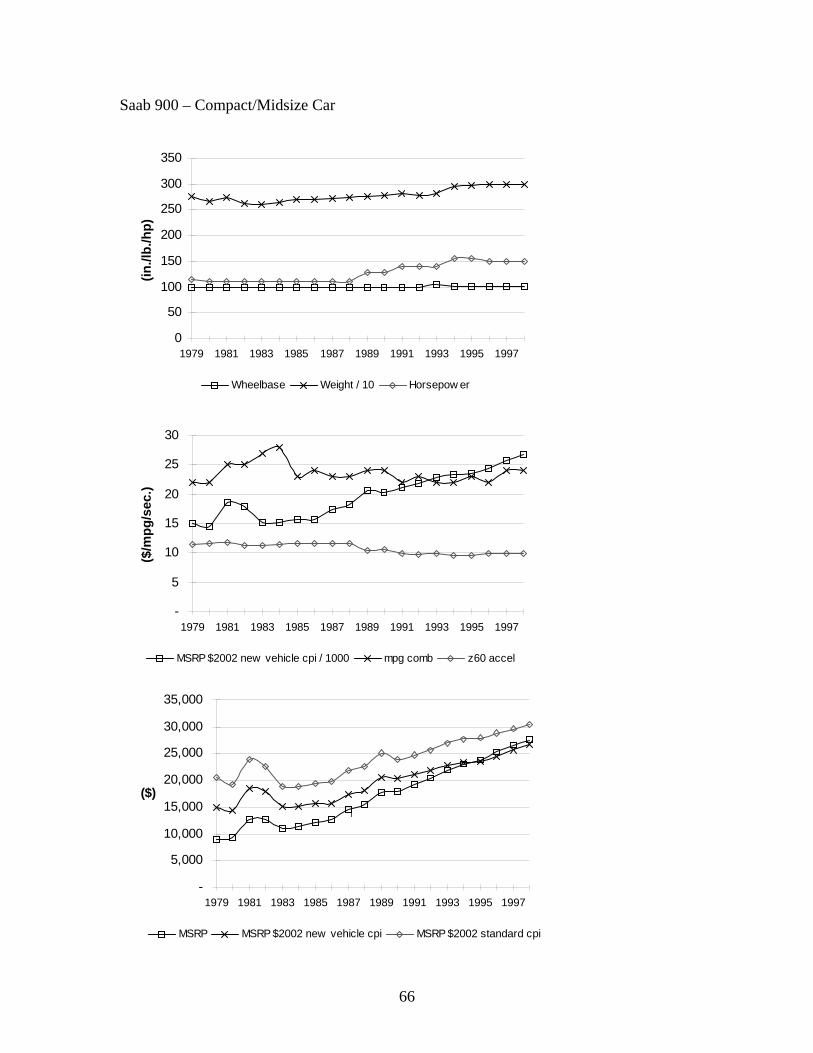
66
Saab 900 – Compact/Midsize Car
0
50
100
150
200
250
300
350
1979 1981 1983 1985 1987 1989 1991 1993 1995 1997
(in./l
b./h
p)
Wheelbase Weight / 10 Horsepow er
-
5
10
15
20
25
30
1979 1981 1983 1985 1987 1989 1991 1993 1995 1997
($/m
pg/s
ec.)
MSRP $2002 new vehicle cpi / 1000 mpg comb z60 accel
-
5,000
10,000
15,000
20,000
25,000
30,000
35,000
1979 1981 1983 1985 1987 1989 1991 1993 1995 1997
($)
MSRP MSRP $2002 new vehicle cpi MSRP $2002 standard cpi
h
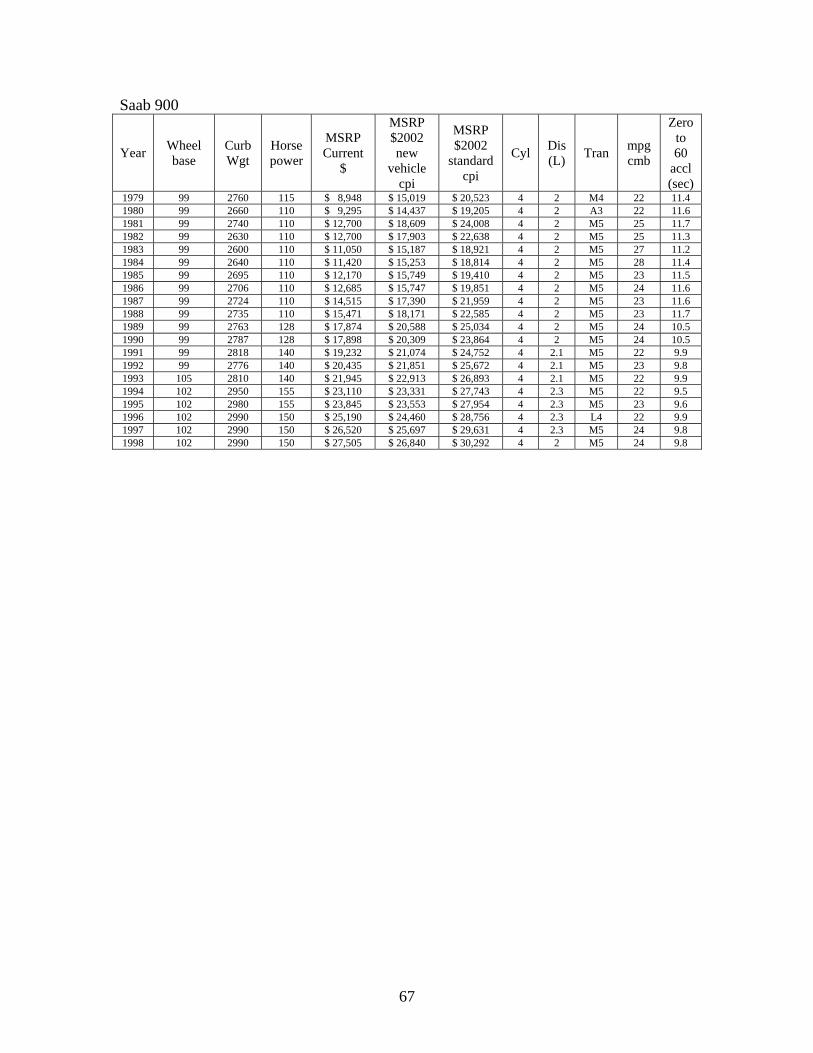
67
Saab 900
Year Wheel base
Curb Wgt
Horse power
MSRP Current
$
MSRP $2002 new
vehicle cpi
MSRP $2002
standard cpi
Cyl Dis (L) Tran mpg
cmb
Zero to 60
accl (sec)
1979 99 2760 115 $ 8,948 $ 15,019 $ 20,523 4 2 M4 22 11.4 1980 99 2660 110 $ 9,295 $ 14,437 $ 19,205 4 2 A3 22 11.6 1981 99 2740 110 $ 12,700 $ 18,609 $ 24,008 4 2 M5 25 11.7 1982 99 2630 110 $ 12,700 $ 17,903 $ 22,638 4 2 M5 25 11.3 1983 99 2600 110 $ 11,050 $ 15,187 $ 18,921 4 2 M5 27 11.2 1984 99 2640 110 $ 11,420 $ 15,253 $ 18,814 4 2 M5 28 11.4 1985 99 2695 110 $ 12,170 $ 15,749 $ 19,410 4 2 M5 23 11.5 1986 99 2706 110 $ 12,685 $ 15,747 $ 19,851 4 2 M5 24 11.6 1987 99 2724 110 $ 14,515 $ 17,390 $ 21,959 4 2 M5 23 11.6 1988 99 2735 110 $ 15,471 $ 18,171 $ 22,585 4 2 M5 23 11.7 1989 99 2763 128 $ 17,874 $ 20,588 $ 25,034 4 2 M5 24 10.5 1990 99 2787 128 $ 17,898 $ 20,309 $ 23,864 4 2 M5 24 10.5 1991 99 2818 140 $ 19,232 $ 21,074 $ 24,752 4 2.1 M5 22 9.9 1992 99 2776 140 $ 20,435 $ 21,851 $ 25,672 4 2.1 M5 23 9.8 1993 105 2810 140 $ 21,945 $ 22,913 $ 26,893 4 2.1 M5 22 9.9 1994 102 2950 155 $ 23,110 $ 23,331 $ 27,743 4 2.3 M5 22 9.5 1995 102 2980 155 $ 23,845 $ 23,553 $ 27,954 4 2.3 M5 23 9.6 1996 102 2990 150 $ 25,190 $ 24,460 $ 28,756 4 2.3 L4 22 9.9 1997 102 2990 150 $ 26,520 $ 25,697 $ 29,631 4 2.3 M5 24 9.8 1998 102 2990 150 $ 27,505 $ 26,840 $ 30,292 4 2 M5 24 9.8

68
Toyota Corolla – (Sub)Compact Car
0
50
100
150
200
250
300
1975
1977
1979
1981
1983
1985
1987
1989
1991
1993
1995
1997
1999
2001
2003
(in./l
b./h
p)
Wheelbase Weight / 10 Horsepow er
-5
1015202530354045
1975
1977
1979
1981
1983
1985
1987
1989
1991
1993
1995
1997
1999
2001
2003
($/m
pg/s
ec.)
MSRP $2002 new vehicle cpi / 1000 mpg comb z60 accel
-2,0004,0006,0008,000
10,00012,00014,00016,000
1975
1977
1979
1981
1983
1985
1987
1989
1991
1993
1995
1997
1999
2001
2003
($)
MSRP MSRP $2002 new vehicle cpi MSRP $2002 standard cpi

69
Toyota Corolla
Year Wheel base
Curb Wgt
Horse power
MSRP Current
$
MSRP $2002 new
vehicle cpi
MSRP $2002
standard cpi
Cyl Dis (L) Tran mpg
cmb
Zero to 60
accl (sec)
1975 93 2174 75 $ 2,711 $ 5,918 $ 7,997 4 . . 27 13.4 1976 93 2227 75 $ 2,849 $ 5,847 $ 7,936 4 . . 27 13.7 1977 93 2250 75 $ 3,708 $ 7,232 $ 9,707 4 1.6 A 27 13.8 1978 93 2240 75 $ 4,213 $ 7,631 $ 10,585 4 1.6 A 28 13.7 1979 93 2200 75 $ 4,758 $ 7,986 $ 10,913 4 1.6 M4 28 13.3 1980 93 2046 58 $ 4,758 $ 7,390 $ 9,831 4 1.8 A3 28 15.7 1981 95 2210 75 $ 4,828 $ 7,075 $ 9,127 4 1.8 M4 34 13.3 1982 95 2176 70 $ 5,448 $ 7,680 $ 9,711 4 1.8 M4 33 13.9 1983 95 2066 70 $ 5,448 $ 7,488 $ 9,329 4 1.6 A4 36 13.6 1984 96 2081 70 $ 6,498 $ 8,679 $ 10,705 4 1.6 M5 39 13.4 1985 96 2081 70 $ 6,938 $ 8,978 $ 11,065 4 1.6 M5 33 13.4 1986 96 2081 74 $ 7,148 $ 8,874 $ 11,186 4 1.6 M5 33 12.8 1987 96 2134 74 $ 8,178 $ 9,798 $ 12,372 4 1.6 M5 33 13.1 1988 96 2207 90 $ 8,998 $ 10,568 $ 13,136 4 1.6 M5 32 11.5 1989 96 2207 90 $ 9,453 $ 10,888 $ 13,239 4 1.6 M5 32 11.5 1990 96 2240 102 $ 9,013 $ 10,227 $ 12,017 4 1.6 M5 30 11.1 1991 96 2253 102 $ 9,273 $ 10,161 $ 11,934 4 1.6 M5 30 10.7 1992 96 2253 102 $ 9,713 $ 10,386 $ 12,202 4 1.6 M5 30 10.7 1993 97 2300 115 $ 11,803 $ 12,115 $ 14,464 4 1.8 L4 29 10.8 1994 96 2315 105 $ 12,303 $ 12,421 $ 14,770 4 1.6 M5 29 10.6 1995 97 2315 100 $ 12,775 $ 12,619 $ 14,977 4 1.8 L4 30 11.2 1996 97 2315 100 $ 13,148 $ 12,767 $ 15,009 4 1.8 L4 30 11.2 1997 97 2315 100 $ 13,418 $ 13,001 $ 14,992 4 1.6 M5 32 11.0 1998 97 2315 120 $ 12,328 $ 12,030 $ 13,577 4 1.8 M5 34 9.6 1999 97 2414 120 $ 12,638 $ 12,430 $ 13,633 4 1.8 M5 34 9.9 2000 97 2414 125 $ 12,873 $ 12,661 $ 13,437 4 1.8 M5 34 9.6 2001 97 2410 125 $ 13,048 $ 12,898 $ 13,260 4 1.8 M5 36 9.6 2002 97 2410 125 $ 13,053 $ 13,053 $ 13,053 4 1.8 M5 36 9.6

70
Volkswagen Jetta – (Sub)Compact Car
0
50
100
150
200
250
300
350
1981 1983 1985 1987 1989 1991 1993 1995 1997 1999 2001
(in./l
b./h
p)
Wheelbase Weight / 10 Horsepow er
-
5
10
15
20
25
30
35
40
1981 1983 1985 1987 1989 1991 1993 1995 1997 1999 2001
($/m
pg/s
ec.)
MSRP $2002 new vehicle cpi / 1000 mpg comb z60 accel
-2,0004,0006,0008,000
10,00012,00014,00016,00018,00020,000
1981 1983 1985 1987 1989 1991 1993 1995 1997 1999 2001
($)
MSRP MSRP $2002 new vehicle cpi MSRP $2002 standard cpi

71
Volkswagen Jetta
Year Wheel base
Curb Wgt
Horse power
MSRP Current
$
MSRP $2002 new
vehicle cpi
MSRP $2002
standard cpi
Cyl Dis (L) Tran mpg
cmb
Zero to 60
accl (sec)
1981 95 1892 74 $ 8,195 $ 12,008 $ 15,491 4 1.7 M5 30 11.9 1982 95 2026 74 $ 8,595 $ 12,116 $ 15,321 4 1.7 M5 32 12.6 1983 95 2026 74 $ 8,350 $ 11,645 $ 14,298 4 1.6 M5 34 13.4 1984 95 2204 74 $ 7,850 $ 10,484 $ 12,932 4 1.7 M5 35 13.4 1985 97 2212 85 $ 8,195 $ 10,605 $ 13,070 4 1.8 M5 30 12.1 1986 97 2212 85 $ 8,370 $ 10,391 $ 13,099 4 1.8 M5 30 12.1 1987 97 2275 85 $ 9,510 $ 11,394 $ 14,387 4 1.8 M5 29 12.4 1988 97 2305 100 $ 9,210 $ 10,817 $ 13,445 4 1.8 M5 28 11.0 1989 97 2367 100 $ 10,230 $ 11,783 $ 14,328 4 1.8 M5 29 11.2 1990 97 2367 100 $ 10,615 $ 12,045 $ 14,153 4 1.8 M5 28 11.2 1991 97 2330 100 $ 10,815 $ 11,851 $ 13,919 4 1.8 M5 27 11.1 1992 97 2369 100 $ 11,740 $ 12,554 $ 14,749 4 1.8 M5 28 11.2 1993 97 2647 115 $ 14,140 $ 14,400 $ 17,328 4 2 M5 26 11.0 1994 97 2647 115 $ 14,140 $ 14,275 $ 16,975 4 2 M5 26 11.0 1995 97 2647 115 $ 13,865 $ 13,695 $ 16,254 4 2 M5 27 11.0 1996 97 2657 115 $ 14,725 $ 14,298 $ 16,809 4 2 M5 26 11.0 1997 97 2657 115 $ 15,070 $ 14,602 $ 16,838 4 2 M5 26 11.0 1998 97 2590 115 $ 15,095 $ 14,730 $ 16,624 4 2 M5 26 10.8 1999 97 2590 115 $ 15,345 $ 15,092 $ 16,553 4 2 M5 27 10.8 2000 99 2884 115 $ 17,225 $ 16,941 $ 17,980 4 2 M5 27 11.8 2001 99 2946 115 $ 17,225 $ 17,027 $ 17,505 4 2 M5 27 11.9 2002 99 2893 115 $ 17,400 $ 17,400 $ 17,400 4 1.8 M5 27 11.8
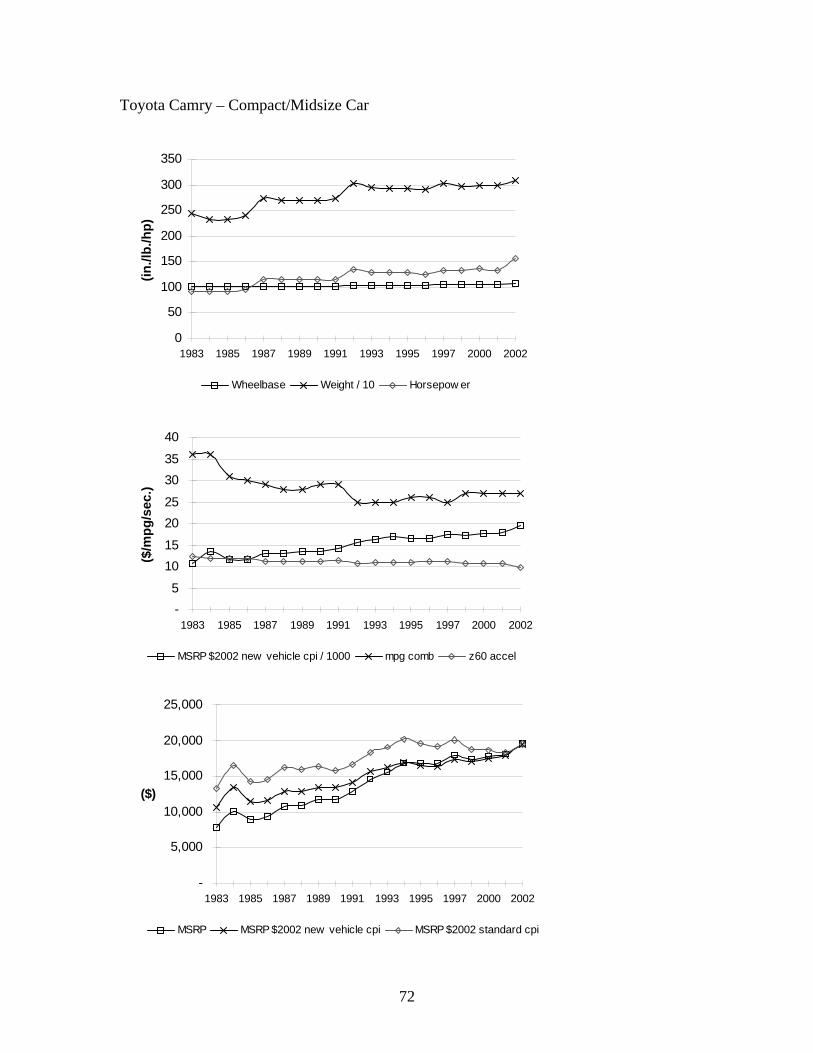
72
Toyota Camry – Compact/Midsize Car
0
50
100
150
200
250
300
350
1983 1985 1987 1989 1991 1993 1995 1997 2000 2002
(in./l
b./h
p)
Wheelbase Weight / 10 Horsepow er
-5
1015
2025
3035
40
1983 1985 1987 1989 1991 1993 1995 1997 2000 2002
($/m
pg/s
ec.)
MSRP $2002 new vehicle cpi / 1000 mpg comb z60 accel
-
5,000
10,000
15,000
20,000
25,000
1983 1985 1987 1989 1991 1993 1995 1997 2000 2002
($)
MSRP MSRP $2002 new vehicle cpi MSRP $2002 standard cpi
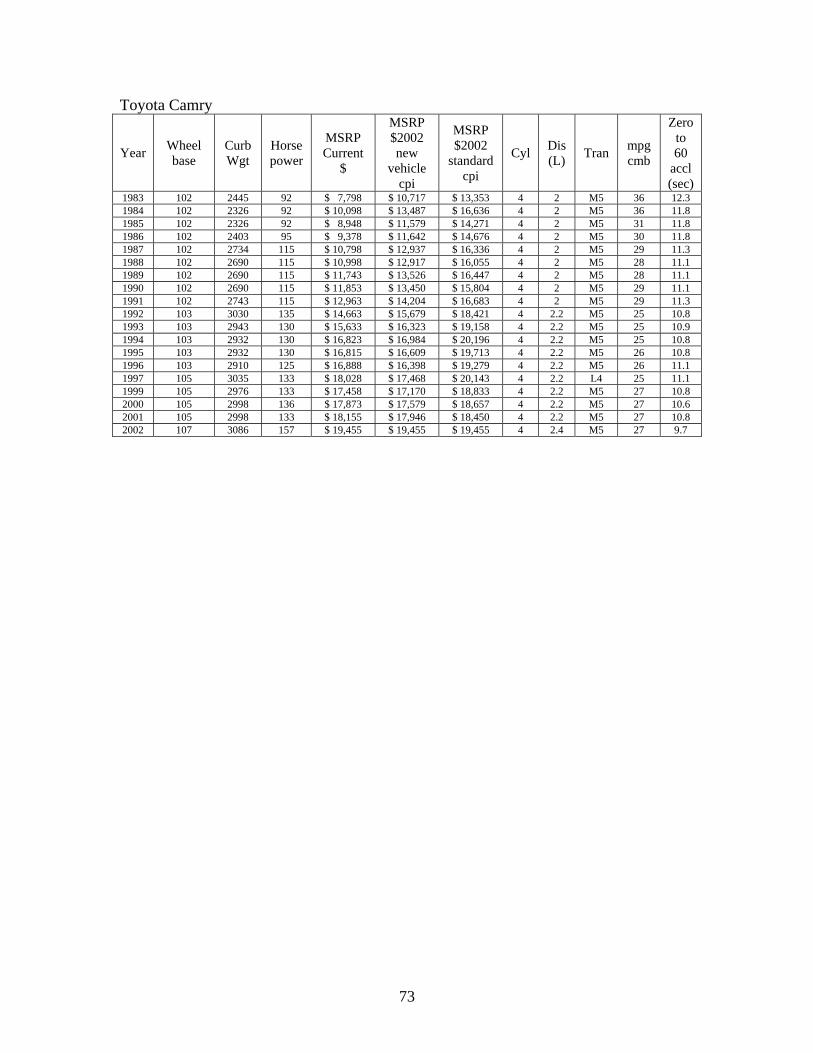
73
Toyota Camry
Year Wheel base
Curb Wgt
Horse power
MSRP Current
$
MSRP $2002 new
vehicle cpi
MSRP $2002
standard cpi
Cyl Dis (L) Tran mpg
cmb
Zero to 60
accl (sec)
1983 102 2445 92 $ 7,798 $ 10,717 $ 13,353 4 2 M5 36 12.3 1984 102 2326 92 $ 10,098 $ 13,487 $ 16,636 4 2 M5 36 11.8 1985 102 2326 92 $ 8,948 $ 11,579 $ 14,271 4 2 M5 31 11.8 1986 102 2403 95 $ 9,378 $ 11,642 $ 14,676 4 2 M5 30 11.8 1987 102 2734 115 $ 10,798 $ 12,937 $ 16,336 4 2 M5 29 11.3 1988 102 2690 115 $ 10,998 $ 12,917 $ 16,055 4 2 M5 28 11.1 1989 102 2690 115 $ 11,743 $ 13,526 $ 16,447 4 2 M5 28 11.1 1990 102 2690 115 $ 11,853 $ 13,450 $ 15,804 4 2 M5 29 11.1 1991 102 2743 115 $ 12,963 $ 14,204 $ 16,683 4 2 M5 29 11.3 1992 103 3030 135 $ 14,663 $ 15,679 $ 18,421 4 2.2 M5 25 10.8 1993 103 2943 130 $ 15,633 $ 16,323 $ 19,158 4 2.2 M5 25 10.9 1994 103 2932 130 $ 16,823 $ 16,984 $ 20,196 4 2.2 M5 25 10.8 1995 103 2932 130 $ 16,815 $ 16,609 $ 19,713 4 2.2 M5 26 10.8 1996 103 2910 125 $ 16,888 $ 16,398 $ 19,279 4 2.2 M5 26 11.1 1997 105 3035 133 $ 18,028 $ 17,468 $ 20,143 4 2.2 L4 25 11.1 1999 105 2976 133 $ 17,458 $ 17,170 $ 18,833 4 2.2 M5 27 10.8 2000 105 2998 136 $ 17,873 $ 17,579 $ 18,657 4 2.2 M5 27 10.6 2001 105 2998 133 $ 18,155 $ 17,946 $ 18,450 4 2.2 M5 27 10.8 2002 107 3086 157 $ 19,455 $ 19,455 $ 19,455 4 2.4 M5 27 9.7

74
Isuzu Trooper – Midsize SUV
050
100150200250300350400450500
1988
1989
1990
1991
1992
1993
1994
1995
1996
1997
1998
1999
2000
2001
2002
(in./l
b./h
p)
Wheelbase Weight / 10 Horsepow er
-
5
10
15
20
25
30
35
1988
1989
1990
1991
1992
1993
1994
1995
1996
1997
1998
1999
2000
2001
2002
($/m
pg/s
ec.)
MSRP 2002$ / 1000 mpg comb z60 accel
12,000
15,000
18,000
21,000
24,000
27,000
30,000
1988
1989
1990
1991
1992
1993
1994
1995
1996
1997
1998
1999
2000
2001
2002
($)
MSRP MSRP $2002 new vehicle CPI MSRP $2002 standard cpi

75
Isuzu Trooper
Year Wheel base
Curb Wgt
Horse power
MSRP Current
$
MSRP $2002 new
vehicle cpi
MSRP $2002
standard cpi
Cyl Dis (L) Tran mpg
cmb
Zero to 60
accl (sec)
1988 104 3745 120 $12,639 $14,845 $19,220 4 2.6 L4 17 15.1 1989 104 3650 120 $13,408 $15,444 $19,452 4 2.6 M5 17 14.9 1990 104 3650 120 $13,489 $15,306 $18,567 4 2.6 M5 17 14.9 1991 104 3650 120 $13,998 $15,339 $18,489 4 2.6 M5 17 14.9 1992 109 4155 175 $19,169 $20,498 $24,579 6 3.2 M5 17 12.1 1993 109 4210 175 $20,119 $21,006 $25,048 6 3.2 M5 17 12.2 1994 109 4210 175 $21,650 $21,857 $26,281 6 3.2 M5 17 12.2 1995 109 4275 175 $24,220 $23,924 $28,590 6 3.2 M5 17 12.3 1996 109 4275 190 $25,805 $25,057 $29,588 6 3.2 M5 17 11.6 1997 109 4275 190 $26,995 $26,157 $30,258 6 3.2 M5 17 11.6 1998 109 4530 215 $26,995 $26,343 $29,794 6 3.5 M5 17 10.9 1999 109 4455 215 $27,595 $27,140 $29,798 6 3.5 M5 17 10.8 2000 109 4455 215 $27,895 $27,435 $29,142 6 3.5 M5 17 10.8 2001 109 4455 215 $28,140 $27,816 $28,585 6 3.5 M5 17 10.8 2002 109 4238 230 $28,715 $28,715 $28,715 6 M5 17 9.8
Nissan Pathfinder
Year Wheel base
Curb Wgt
Horse power
MSRP Current
$
MSRP $2002 new
vehicle cpi
MSRP $2002
standard cpi
Cyl Dis (L) Tran mpg
cmb
Zero to 60
accl (sec)
1988 104 3735 145 $15,299 $17,969 $23,265 6 3 M5 16 13.0 1989 104 3735 145 $15,569 $17,933 $22,588 6 3 M5 16 13.0 1990 104 3798 145 $17,295 $19,625 $23,805 6 3 L4 17 13.1 1991 104 3795 153 $17,970 $19,691 $23,736 6 3 L4 16 12.6 1992 104 3795 153 $19,210 $20,542 $24,632 6 3 L4 16 12.6 1993 104 3795 153 $20,370 $21,268 $25,360 6 3 L4 16 12.6 1994 104 3795 153 $21,479 $21,684 $26,073 6 3 L4 16 12.6 1995 104 4090 153 $22,619 $22,342 $26,701 6 3 L4 16 13.3 1996 106 3920 168 $24,804 $24,085 $28,440 6 3.3 M5 17 11.9 1997 106 3920 168 $25,369 $24,581 $28,435 6 3.3 M5 17 11.9 1998 106 3920 168 $26,489 $25,849 $29,235 6 3.3 M5 17 11.9 1999 106 4050 168 $29,739 $29,249 $32,113 6 3.3 M5 17 12.2 2000 106 4050 170 $29,869 $29,377 $31,205 6 3.3 M5 17 12.1 2001 106 4250 240 $29,869 $29,525 $30,341 6 3.5 M5 17 9.5 2002 106 4190 250 $28,189 $28,189 $28,189 6 3.5 M5 17 9.1

76
Nissan Pathfinder – Midsize SUV
050
100150200250300350400450
1988
1989
1990
1991
1992
1993
1994
1995
1996
1997
1998
1999
2000
2001
2002
(in./l
b./h
p)
Wheelbase Weight / 10 Horsepow er
-
5
10
15
20
25
30
35
1988
1989
1990
1991
1992
1993
1994
1995
1996
1997
1998
1999
2000
2001
2002
($/m
pg/s
ec.)
MSRP 2002$ / 1000 mpg comb z60 accel
15,000
18,000
21,000
24,000
27,000
30,000
33,000
1988
1989
1990
1991
1992
1993
1994
1995
1996
1997
1998
1999
2000
2001
2002
($)
MSRP MSRP $2002 new vehicle CPI MSRP $2002 standard cpi
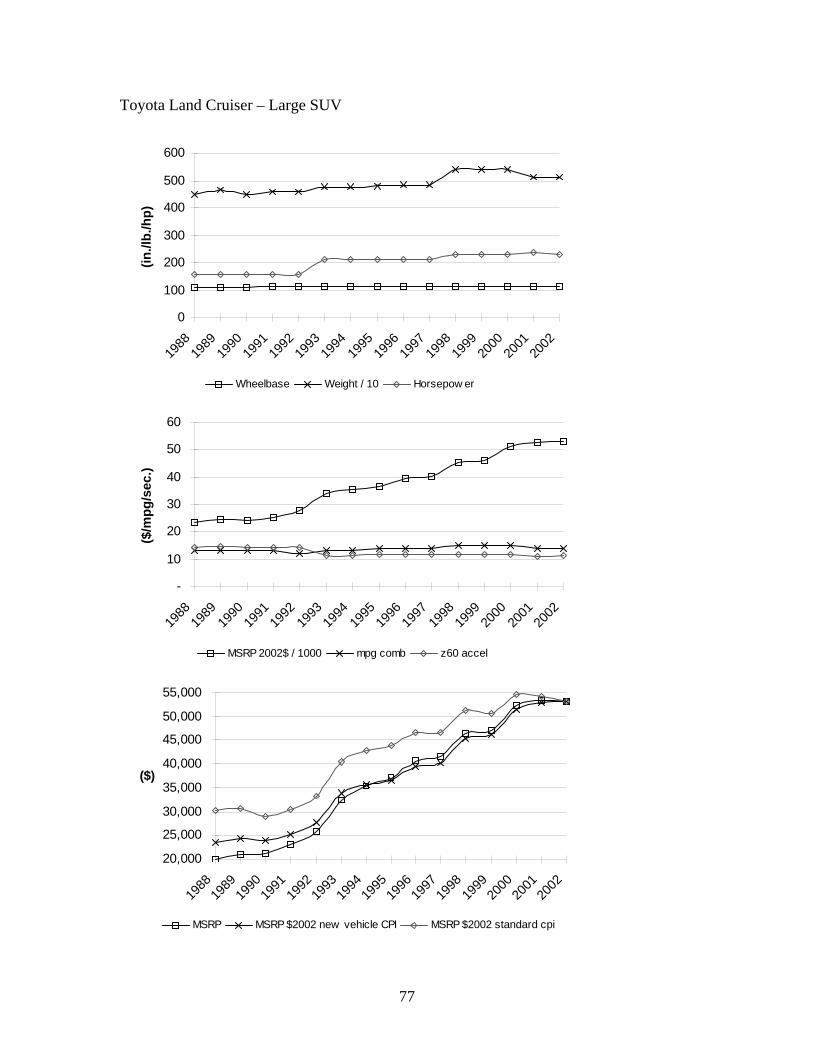
77
Toyota Land Cruiser – Large SUV
0
100
200
300
400
500
600
1988
1989
1990
1991
1992
1993
1994
1995
1996
1997
1998
1999
2000
2001
2002
(in./l
b./h
p)
Wheelbase Weight / 10 Horsepow er
-
10
20
30
40
50
60
1988
1989
1990
1991
1992
1993
1994
1995
1996
1997
1998
1999
2000
2001
2002
($/m
pg/s
ec.)
MSRP 2002$ / 1000 mpg comb z60 accel
20,000
25,000
30,000
35,000
40,000
45,000
50,000
55,000
1988
1989
1990
1991
1992
1993
1994
1995
1996
1997
1998
1999
2000
2001
2002
($)
MSRP MSRP $2002 new vehicle CPI MSRP $2002 standard cpi

78
Toyota Land Cruiser
Year Wheel base
Curb Wgt
Horse power
MSRP Current
$
MSRP $2002 new
vehicle cpi
MSRP $2002
standard cpi
Cyl Dis (L) Tran mpg
cmb
Zero to 60
accl (sec)
1988 108 4480 155 $19,998 $23,488 $30,411 6 4 L4 13 14.1 1989 108 4650 155 $21,153 $24,365 $30,689 6 4 L4 13 14.5 1990 108 4480 155 $21,163 $24,014 $29,129 6 4 L4 13 14.1 1991 112 4597 155 $23,063 $25,272 $30,463 6 4 L4 13 14.4 1992 112 4597 155 $25,923 $27,720 $33,240 6 4 L4 12 14.4 1993 112 4760 212 $32,453 $33,884 $40,403 6 4.5 L4 13 11.5 1994 112 4780 212 $35,298 $35,635 $42,848 6 4.5 L4 13 11.5 1995 112 4800 212 $37,105 $36,651 $43,800 6 4.5 L4 14 11.5 1996 112 4834 212 $40,678 $39,499 $46,641 6 4.5 L4 14 11.6 1997 112 4834 212 $41,488 $40,200 $46,503 6 4.5 L4 14 11.6 1998 112 5401 230 $46,370 $45,249 $51,178 8 4.7 L4 15 11.8 1999 112 5401 230 $46,898 $46,125 $50,642 8 4.7 L4 15 11.8 2000 112 5401 230 $52,208 $51,348 $54,543 6 4.7 L4 15 11.8 2001 112 5115 235 $53,405 $52,790 $54,249 8 4.7 L4 14 11.1 2002 112 5115 230 $53,105 $53,105 $53,105 8 4.7 L4 14 11.3
Chevrolet Suburban
Year Wheel base
Curb Wgt
Horse power
MSRP Current
$
MSRP $2002 new
vehicle cpi
MSRP $2002
standard cpi
Cyl Dis (L) Tran mpg
cmb
Zero to 60
accl (sec)
1988 130 5178 195 $15,107 $17,743 $22,973 8 5.7 L4 15 13.1 1989 130 5178 210 $15,215 $17,525 $22,074 8 5.7 L4 16 12.3 1990 130 5178 210 $16,225 $18,411 $22,333 8 5.7 L4 15 12.3 1991 130 5100 210 $17,340 $19,001 $22,904 8 5.7 L4 15 12.2 1992 132 5125 210 $19,003 $20,320 $24,367 8 5.7 L4 14 12.2 1993 132 5230 210 $19,720 $20,590 $24,551 8 5.7 L4 15 12.4 1994 132 5230 210 $21,046 $21,247 $25,548 8 5.7 L4 14 12.2 1995 132 5199 210 $22,000 $22,050 $25,970 8 5.7 L4 15 11.8 1996 132 5230 210 $23,200 $23,000 $26,601 8 5.7 L4 15 11.6 1997 132 4802 255 $25,323 $24,537 $28,384 8 5.7 L4 15 10.0 1998 132 4820 255 $25,740 $25,118 $28,409 8 5.7 L4 15 10.0 1999 132 4820 255 $26,230 $25,798 $28,324 8 5.7 L4 15 10.0 2000 130 4866 285 $26,400 $25,798 $27,613 8 5.3 L4 16 9.7 2001 130 4914 285 $26,656 $26,349 $27,077 8 5.3 L4 16 9.3

79
Chevrolet Suburban – Large SUV
0
100
200
300
400
500
600
1988
1989
1990
1991
1992
1993
1994
1995
1996
1997
1998
1999
2000
2001
2002
(in./l
b./h
p)
Wheelbase Weight / 10 Horsepow er
-
5
10
15
20
25
30
1988
1989
1990
1991
1992
1993
1994
1995
1996
1997
1998
1999
2000
2001
($/m
pg/s
ec.)
MSRP 2002$ / 1000 mpg comb z60 accel
15,000
18,000
21,000
24,000
27,000
30,000
33,000
36,000
1988
1989
1990
1991
1992
1993
1994
1995
1996
1997
1998
1999
2000
2001
($)
MSRP MSRP $2002 new vehicle CPI MSRP $2002 standard cpi
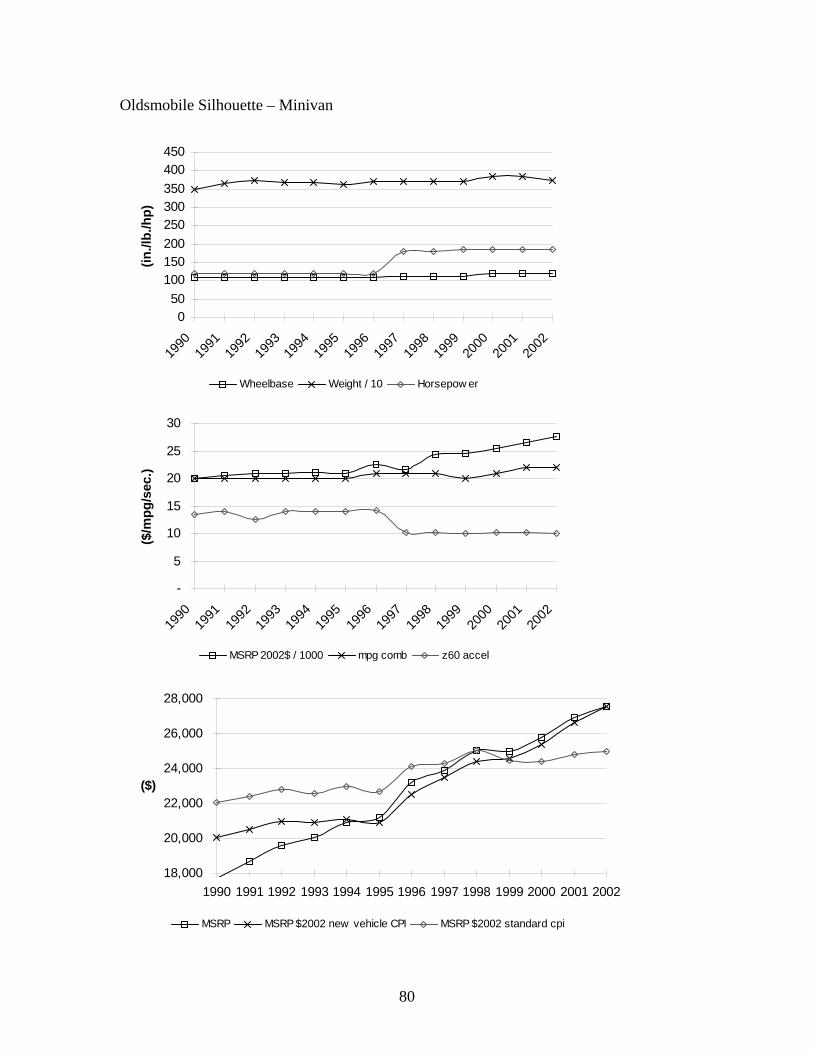
80
Oldsmobile Silhouette – Minivan
050
100150200250300350400450
1990
1991
1992
1993
1994
1995
1996
1997
1998
1999
2000
2001
2002
(in./l
b./h
p)
Wheelbase Weight / 10 Horsepow er
-
5
10
15
20
25
30
1990
1991
1992
1993
1994
1995
1996
1997
1998
1999
2000
2001
2002
($/m
pg/s
ec.)
MSRP 2002$ / 1000 mpg comb z60 accel
18,000
20,000
22,000
24,000
26,000
28,000
1990 1991 1992 1993 1994 1995 1996 1997 1998 1999 2000 2001 2002
($)
MSRP MSRP $2002 new vehicle CPI MSRP $2002 standard cpi
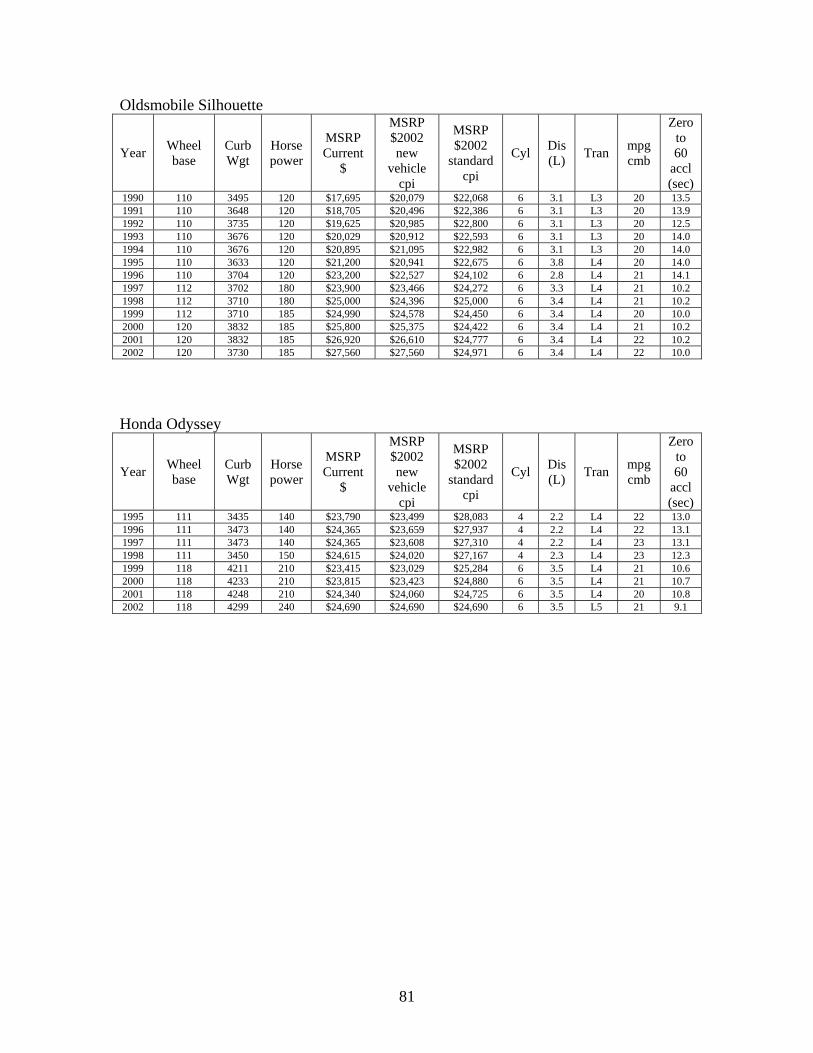
81
Oldsmobile Silhouette
Year Wheel base
Curb Wgt
Horse power
MSRP Current
$
MSRP $2002 new
vehicle cpi
MSRP $2002
standard cpi
Cyl Dis (L) Tran mpg
cmb
Zero to 60
accl (sec)
1990 110 3495 120 $17,695 $20,079 $22,068 6 3.1 L3 20 13.5 1991 110 3648 120 $18,705 $20,496 $22,386 6 3.1 L3 20 13.9 1992 110 3735 120 $19,625 $20,985 $22,800 6 3.1 L3 20 12.5 1993 110 3676 120 $20,029 $20,912 $22,593 6 3.1 L3 20 14.0 1994 110 3676 120 $20,895 $21,095 $22,982 6 3.1 L3 20 14.0 1995 110 3633 120 $21,200 $20,941 $22,675 6 3.8 L4 20 14.0 1996 110 3704 120 $23,200 $22,527 $24,102 6 2.8 L4 21 14.1 1997 112 3702 180 $23,900 $23,466 $24,272 6 3.3 L4 21 10.2 1998 112 3710 180 $25,000 $24,396 $25,000 6 3.4 L4 21 10.2 1999 112 3710 185 $24,990 $24,578 $24,450 6 3.4 L4 20 10.0 2000 120 3832 185 $25,800 $25,375 $24,422 6 3.4 L4 21 10.2 2001 120 3832 185 $26,920 $26,610 $24,777 6 3.4 L4 22 10.2 2002 120 3730 185 $27,560 $27,560 $24,971 6 3.4 L4 22 10.0
Honda Odyssey
Year Wheel base
Curb Wgt
Horse power
MSRP Current
$
MSRP $2002 new
vehicle cpi
MSRP $2002
standard cpi
Cyl Dis (L) Tran mpg
cmb
Zero to 60
accl (sec)
1995 111 3435 140 $23,790 $23,499 $28,083 4 2.2 L4 22 13.0 1996 111 3473 140 $24,365 $23,659 $27,937 4 2.2 L4 22 13.1 1997 111 3473 140 $24,365 $23,608 $27,310 4 2.2 L4 23 13.1 1998 111 3450 150 $24,615 $24,020 $27,167 4 2.3 L4 23 12.3 1999 118 4211 210 $23,415 $23,029 $25,284 6 3.5 L4 21 10.6 2000 118 4233 210 $23,815 $23,423 $24,880 6 3.5 L4 21 10.7 2001 118 4248 210 $24,340 $24,060 $24,725 6 3.5 L4 20 10.8 2002 118 4299 240 $24,690 $24,690 $24,690 6 3.5 L5 21 9.1
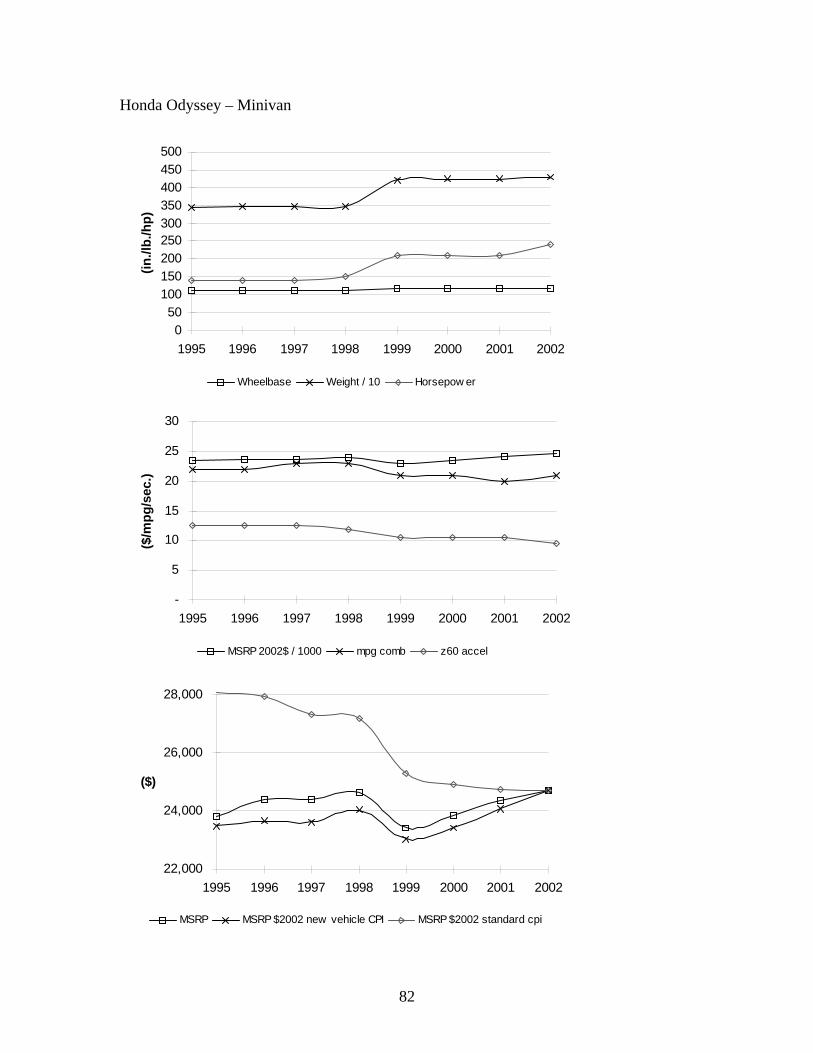
82
Honda Odyssey – Minivan
050
100150200250300350400450500
1995 1996 1997 1998 1999 2000 2001 2002
(in./l
b./h
p)
Wheelbase Weight / 10 Horsepow er
-
5
10
15
20
25
30
1995 1996 1997 1998 1999 2000 2001 2002
($/m
pg/s
ec.)
MSRP 2002$ / 1000 mpg comb z60 accel
22,000
24,000
26,000
28,000
1995 1996 1997 1998 1999 2000 2001 2002
($)
MSRP MSRP $2002 new vehicle CPI MSRP $2002 standard cpi
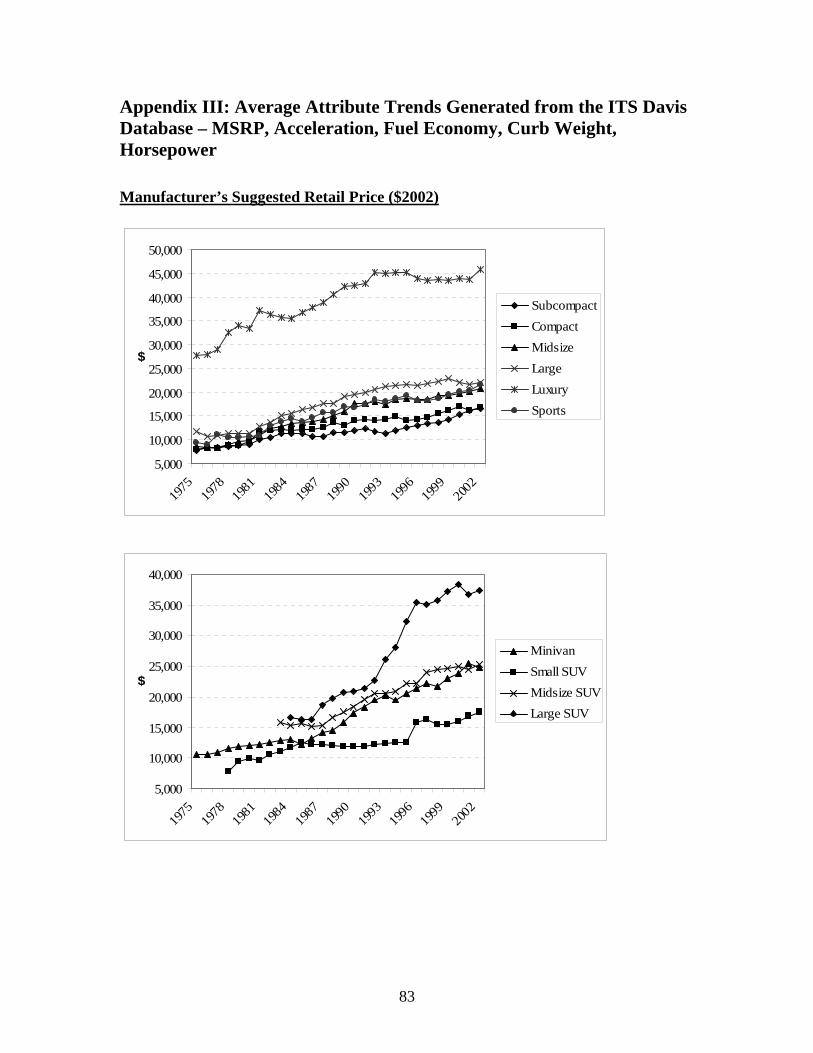
83
Appendix III: Average Attribute Trends Generated from the ITS Davis Database – MSRP, Acceleration, Fuel Economy, Curb Weight, Horsepower Manufacturer’s Suggested Retail Price ($2002)
5,000
10,000
15,000
20,000
25,000
30,000
35,000
40,000
45,000
50,000
1975
1978
1981
1984
1987
1990
1993
1996
1999
2002
$
SubcompactCompactMidsizeLargeLuxurySports
5,000
10,000
15,000
20,000
25,000
30,000
35,000
40,000
1975
1978
1981
1984
1987
1990
1993
1996
1999
2002
$
MinivanSmall SUVMidsize SUVLarge SUV

84
Horsepower
50
100
150
200
250
1975
1978
1981
1984
1987
1990
1993
1996
1999
2002
HP
SubcompactCompactMidsizeLargeLuxurySports
50
100
150
200
250
1975
1978
1981
1984
1987
1990
1993
1996
1999
2002
HP
MinivanSmall SUVMidsize SUVLarge SUV
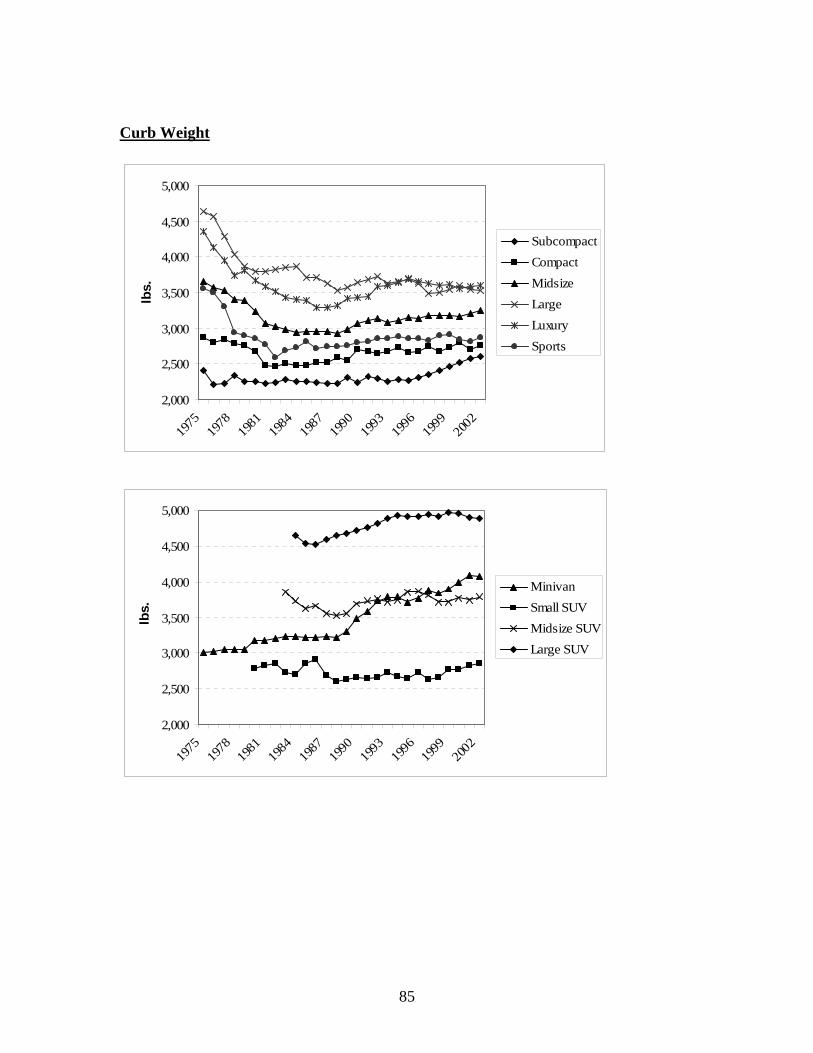
85
Curb Weight
2,000
2,500
3,000
3,500
4,000
4,500
5,000
1975
1978
1981
1984
1987
1990
1993
1996
1999
2002
lbs.
SubcompactCompactMidsizeLargeLuxurySports
2,000
2,500
3,000
3,500
4,000
4,500
5,000
1975
1978
1981
1984
1987
1990
1993
1996
1999
2002
lbs.
MinivanSmall SUVMidsize SUVLarge SUV

86
Combined Adjusted Fuel Economy from EPA
15
20
25
30
35
4019
78
1980
1982
1984
1986
1988
1990
1992
1994
1996
1998
2000
2002
mpg
SubcompactCompactMidsizeLargeLuxurySports
12
14
16
18
20
22
24
26
1984
1986
1988
1990
1992
1994
1996
1998
2000
2002
mpg
MinivanSmall SUVMidsize SUVLarge SUV

87
Zero to Sixty mph Acceleration Time
7
8
9
10
11
12
13
14
15
1975
1978
1981
1984
1987
1990
1993
1996
1999
2002
seco
nds
SubcompactCompactMidsizeLargeLuxurySports
9
10
11
12
13
14
15
1984
1986
1988
1990
1992
1994
1996
1998
2000
2002
seco
nds Minivan
Small SUVMidsize SUVLarge SUV

88
Appendix IV: Vehicle Technology Trends with respect to Fuel Economy and Performance for Passenger Cars and Light Trucks (1975 to 2003) Source: Reference 5, p. 6-9, Table 2 and p. 12-13, Table 3. Passenger Cars
< - - - - - - - Measured Characteristics - - - - - - - > < - -Percent By: - - > Vehicle Size Model
Year Sales (000) Frac
Adj 55/45 mpg
Vol Cu-Ft
Inertia Weight
(lb)
Eng HP HP/WT 0-60
Time Top Spd Small Mid Large
1975 8237 80.6% 13.5 4057 136 0.0331 14.2 111 55.4 23.3 21.3 1976 9722 78.8% 14.9 4058 134 0.0324 14.4 110 55.4 25.2 19.4 1977 11300 80.0% 15.6 110 3943 133 0.0335 14 111 51.9 24.5 23.5 1978 11175 77.3% 16.9 109 3587 124 0.0342 13.7 111 44.7 34.4 21 1979 10794 77.8% 17.2 108 3484 119 0.0338 13.8 110 43.7 34.2 22.1 1980 9443 83.5% 20 104 3101 100 0.0322 14.3 107 54.4 34.4 11.3 1981 8733 82.7% 21.4 106 3075 99 0.032 14.4 106 51.5 36.4 12.2 1982 7819 80.3% 22.2 106 3054 99 0.032 14.4 106 56.5 31 12.5 1983 8002 77.7% 22.1 108 3111 104 0.033 14 108 53.1 31.8 15.1 1984 10675 76.1% 22.4 107 3098 106 0.0339 13.8 109 57.4 29.4 13.2 1985 10791 74.6% 23 108 3092 111 0.0355 13.3 111 55.7 28.9 15.4 1986 11015 71.7% 23.8 107 3040 111 0.036 13.2 111 59.5 27.9 12.6 1987 10731 72.2% 24 106 3030 112 0.0365 13 112 63.5 24.3 12.2 1988 10736 70.2% 24.4 107 3046 116 0.0375 12.8 113 64.8 22.3 12.8 1989 10018 69.3% 24 107 3099 121 0.0387 12.5 115 58.3 28.2 13.5 1990 8810 69.8% 23.7 107 3175 129 0.0401 12.1 117 58.6 28.7 12.8 1991 8524 67.8% 23.9 106 3153 132 0.0413 11.8 118 61.5 26.2 12.3 1992 8108 66.6% 23.6 108 3239 141 0.0428 11.5 120 56.5 27.8 15.6 1993 8457 64.0% 24.1 108 3207 138 0.0425 11.6 120 57.2 29.5 13.3 1994 8414 60.2% 24 108 3249 143 0.0432 11.4 121 58.5 26.1 15.4 1995 9396 62.0% 24.2 108 3262 152 0.046 10.9 125 57.3 28.6 14 1996 7890 60.0% 24.2 108 3281 154 0.0464 10.8 125 54.3 32 13.6 1997 8335 57.7% 24.3 108 3274 156 0.0469 10.7 126 55.1 30.6 14.3 1998 7972 55.2% 24.4 108 3306 159 0.0475 10.6 127 49.4 39.1 11.4 1999 8446 55.3% 24.1 109 3365 164 0.0481 10.5 128 47.4 40 12.5 2000 9124 55.1% 24.1 109 3369 168 0.0492 10.4 129 47.5 34.3 18.2 2001 8405 53.9% 24.3 109 3379 168 0.0492 10.3 129 50.9 32.3 16.8 2002 8190 52.2% 24.3 109 3405 175 0.0507 10.1 131 48.7 34.8 16.4 2003 8388 52.4% 24.8 109 3410 175 0.0508 10.1 131 52 32.7 15.4
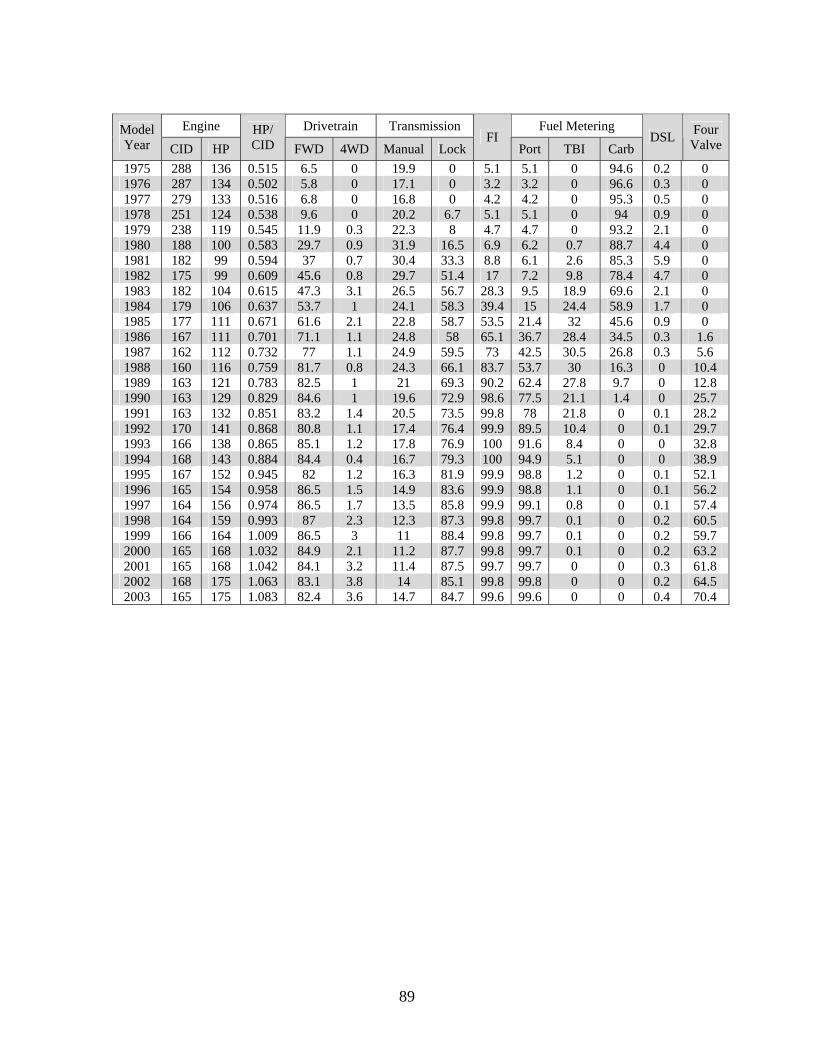
89
Engine Drivetrain Transmission Fuel Metering Model
Year CID HP HP/ CID FWD 4WD Manual Lock
FI Port TBI Carb
DSL Four Valve
1975 288 136 0.515 6.5 0 19.9 0 5.1 5.1 0 94.6 0.2 0 1976 287 134 0.502 5.8 0 17.1 0 3.2 3.2 0 96.6 0.3 0 1977 279 133 0.516 6.8 0 16.8 0 4.2 4.2 0 95.3 0.5 0 1978 251 124 0.538 9.6 0 20.2 6.7 5.1 5.1 0 94 0.9 0 1979 238 119 0.545 11.9 0.3 22.3 8 4.7 4.7 0 93.2 2.1 0 1980 188 100 0.583 29.7 0.9 31.9 16.5 6.9 6.2 0.7 88.7 4.4 0 1981 182 99 0.594 37 0.7 30.4 33.3 8.8 6.1 2.6 85.3 5.9 0 1982 175 99 0.609 45.6 0.8 29.7 51.4 17 7.2 9.8 78.4 4.7 0 1983 182 104 0.615 47.3 3.1 26.5 56.7 28.3 9.5 18.9 69.6 2.1 0 1984 179 106 0.637 53.7 1 24.1 58.3 39.4 15 24.4 58.9 1.7 0 1985 177 111 0.671 61.6 2.1 22.8 58.7 53.5 21.4 32 45.6 0.9 0 1986 167 111 0.701 71.1 1.1 24.8 58 65.1 36.7 28.4 34.5 0.3 1.6 1987 162 112 0.732 77 1.1 24.9 59.5 73 42.5 30.5 26.8 0.3 5.6 1988 160 116 0.759 81.7 0.8 24.3 66.1 83.7 53.7 30 16.3 0 10.4 1989 163 121 0.783 82.5 1 21 69.3 90.2 62.4 27.8 9.7 0 12.8 1990 163 129 0.829 84.6 1 19.6 72.9 98.6 77.5 21.1 1.4 0 25.7 1991 163 132 0.851 83.2 1.4 20.5 73.5 99.8 78 21.8 0 0.1 28.2 1992 170 141 0.868 80.8 1.1 17.4 76.4 99.9 89.5 10.4 0 0.1 29.7 1993 166 138 0.865 85.1 1.2 17.8 76.9 100 91.6 8.4 0 0 32.8 1994 168 143 0.884 84.4 0.4 16.7 79.3 100 94.9 5.1 0 0 38.9 1995 167 152 0.945 82 1.2 16.3 81.9 99.9 98.8 1.2 0 0.1 52.1 1996 165 154 0.958 86.5 1.5 14.9 83.6 99.9 98.8 1.1 0 0.1 56.2 1997 164 156 0.974 86.5 1.7 13.5 85.8 99.9 99.1 0.8 0 0.1 57.4 1998 164 159 0.993 87 2.3 12.3 87.3 99.8 99.7 0.1 0 0.2 60.5 1999 166 164 1.009 86.5 3 11 88.4 99.8 99.7 0.1 0 0.2 59.7 2000 165 168 1.032 84.9 2.1 11.2 87.7 99.8 99.7 0.1 0 0.2 63.2 2001 165 168 1.042 84.1 3.2 11.4 87.5 99.7 99.7 0 0 0.3 61.8 2002 168 175 1.063 83.1 3.8 14 85.1 99.8 99.8 0 0 0.2 64.5 2003 165 175 1.083 82.4 3.6 14.7 84.7 99.6 99.6 0 0 0.4 70.4
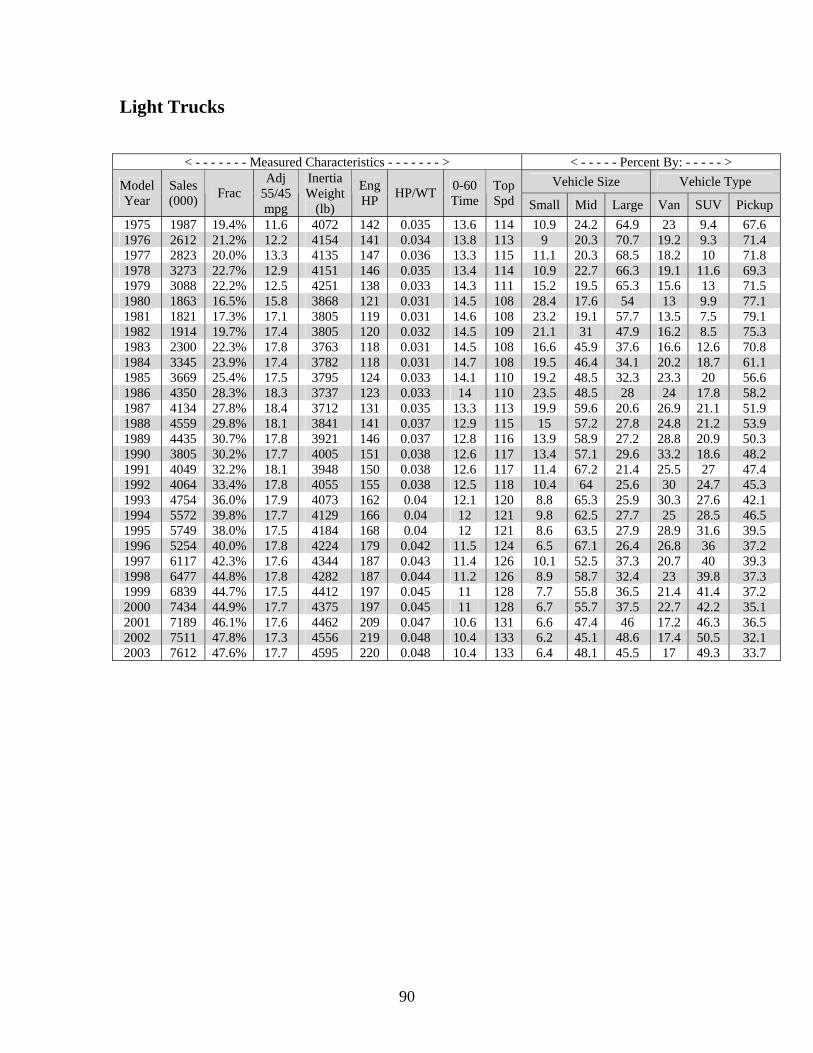
90
Light Trucks
< - - - - - - - Measured Characteristics - - - - - - - > < - - - - - Percent By: - - - - - > Vehicle Size Vehicle Type Model
Year Sales (000) Frac
Adj 55/45 mpg
Inertia Weight
(lb)
Eng HP HP/WT 0-60
Time Top Spd Small Mid Large Van SUV Pickup
1975 1987 19.4% 11.6 4072 142 0.035 13.6 114 10.9 24.2 64.9 23 9.4 67.6 1976 2612 21.2% 12.2 4154 141 0.034 13.8 113 9 20.3 70.7 19.2 9.3 71.4 1977 2823 20.0% 13.3 4135 147 0.036 13.3 115 11.1 20.3 68.5 18.2 10 71.8 1978 3273 22.7% 12.9 4151 146 0.035 13.4 114 10.9 22.7 66.3 19.1 11.6 69.3 1979 3088 22.2% 12.5 4251 138 0.033 14.3 111 15.2 19.5 65.3 15.6 13 71.5 1980 1863 16.5% 15.8 3868 121 0.031 14.5 108 28.4 17.6 54 13 9.9 77.1 1981 1821 17.3% 17.1 3805 119 0.031 14.6 108 23.2 19.1 57.7 13.5 7.5 79.1 1982 1914 19.7% 17.4 3805 120 0.032 14.5 109 21.1 31 47.9 16.2 8.5 75.3 1983 2300 22.3% 17.8 3763 118 0.031 14.5 108 16.6 45.9 37.6 16.6 12.6 70.8 1984 3345 23.9% 17.4 3782 118 0.031 14.7 108 19.5 46.4 34.1 20.2 18.7 61.1 1985 3669 25.4% 17.5 3795 124 0.033 14.1 110 19.2 48.5 32.3 23.3 20 56.6 1986 4350 28.3% 18.3 3737 123 0.033 14 110 23.5 48.5 28 24 17.8 58.2 1987 4134 27.8% 18.4 3712 131 0.035 13.3 113 19.9 59.6 20.6 26.9 21.1 51.9 1988 4559 29.8% 18.1 3841 141 0.037 12.9 115 15 57.2 27.8 24.8 21.2 53.9 1989 4435 30.7% 17.8 3921 146 0.037 12.8 116 13.9 58.9 27.2 28.8 20.9 50.3 1990 3805 30.2% 17.7 4005 151 0.038 12.6 117 13.4 57.1 29.6 33.2 18.6 48.2 1991 4049 32.2% 18.1 3948 150 0.038 12.6 117 11.4 67.2 21.4 25.5 27 47.4 1992 4064 33.4% 17.8 4055 155 0.038 12.5 118 10.4 64 25.6 30 24.7 45.3 1993 4754 36.0% 17.9 4073 162 0.04 12.1 120 8.8 65.3 25.9 30.3 27.6 42.1 1994 5572 39.8% 17.7 4129 166 0.04 12 121 9.8 62.5 27.7 25 28.5 46.5 1995 5749 38.0% 17.5 4184 168 0.04 12 121 8.6 63.5 27.9 28.9 31.6 39.5 1996 5254 40.0% 17.8 4224 179 0.042 11.5 124 6.5 67.1 26.4 26.8 36 37.2 1997 6117 42.3% 17.6 4344 187 0.043 11.4 126 10.1 52.5 37.3 20.7 40 39.3 1998 6477 44.8% 17.8 4282 187 0.044 11.2 126 8.9 58.7 32.4 23 39.8 37.3 1999 6839 44.7% 17.5 4412 197 0.045 11 128 7.7 55.8 36.5 21.4 41.4 37.2 2000 7434 44.9% 17.7 4375 197 0.045 11 128 6.7 55.7 37.5 22.7 42.2 35.1 2001 7189 46.1% 17.6 4462 209 0.047 10.6 131 6.6 47.4 46 17.2 46.3 36.5 2002 7511 47.8% 17.3 4556 219 0.048 10.4 133 6.2 45.1 48.6 17.4 50.5 32.1 2003 7612 47.6% 17.7 4595 220 0.048 10.4 133 6.4 48.1 45.5 17 49.3 33.7

91
Engine Drivetrain Transmission Fuel Metering Model
Year CID HP HP/ CID FWD 4WD Manual Lock
FI Port TBI Carb
DSL Four Valve
1975 311 142 0.476 0 17.1 37 0 0.1 0 0 99.9 0 0 1976 319 141 0.458 0 22.9 34.8 0 0.1 0 0 99.9 0 0 1977 318 147 0.482 0 23.6 32 0 0.1 0 0 99.9 0 0 1978 314 146 0.481 0 29 32.4 0 0.1 0 0 99.1 0.8 0 1979 298 138 0.486 0 18 35.2 2.1 0.3 0 0 97.9 1.8 0 1980 248 121 0.528 1.4 25 53 24.6 1.7 0 0 94.9 3.5 0 1981 247 119 0.508 1.9 20.1 51.6 31.1 1.1 0 0 93.3 5.6 0 1982 243 120 0.524 1.7 20 45.7 33.2 0.7 0 0 90 9.3 0 1983 231 118 0.543 1.4 25.8 45.9 36.1 0.6 0 0 94.7 4.7 0 1984 224 118 0.557 4.9 31 42.1 35.1 2.6 0 0 95.1 2.3 0 1985 224 124 0.586 7.1 30.6 37.1 42.2 12.3 0 0.2 86.7 1.1 0 1986 211 123 0.621 5.9 30.3 42.7 42 40.5 21.8 18.7 58.7 0.7 0 1987 210 131 0.654 7.4 31.5 39.9 44.8 66.9 33.3 33.6 32.9 0.3 0 1988 227 141 0.65 9 33.3 35.5 53.1 87.7 43.3 44.4 12.1 0.2 0 1989 234 146 0.653 9.9 32 32.7 56.8 93.5 45.9 47.6 6.3 0.2 0 1990 237 151 0.668 15.5 31.3 28.1 67.4 96 55.2 40.8 3.9 0.2 0 1991 228 150 0.681 9.7 35.3 31 67.4 98.2 55 43.2 1.6 0.1 0 1992 234 155 0.685 13.6 31.4 27.3 71.5 98.4 65.9 32.5 1.5 0.1 0 1993 235 162 0.71 15.1 29.5 23.3 75.7 99 73.4 25.7 1 0 0.2 1994 240 166 0.716 13.3 37.4 23.3 75.2 99.6 76.8 22.8 0.4 0 2.5 1995 244 168 0.715 17.7 40.7 20.5 78.6 100 79.8 20.2 0 0 8.1 1996 243 179 0.757 20.1 37.1 15.6 83.5 99.9 99.9 0 0 0.1 10.4 1997 248 187 0.775 13.9 43.3 14.6 84.9 100 100 0 0 0 11.3 1998 242 187 0.795 18.7 42 13.5 86 100 100 0 0 0 15.2 1999 249 197 0.814 17.4 44.6 9.1 90.5 100 100 0 0 0 16.2 2000 242 197 0.832 19.4 42.5 8 91.7 100 100 0 0 0 20.5 2001 243 209 0.882 18.5 43.8 6.3 93.4 100 100 0 0 0 27.1 2002 246 219 0.91 18.3 48 6.4 93.2 100 100 0 0 0 32.2 2003 245 220 0.919 18.1 49.1 5.9 93.3 100 100 0 0 0 33.7
Key for Appendix IV
Inertia weight – Curb weight + 300 lb. 0-60 time – Acceleration from zero to sixty miles per hour (Calculated from formulae, function of
weight, horsepower, and transmission type) Top Speed – Average top speed (Calculated from formulae) Adjusted 55/45 mpg – Combined fuel economy CID – Engine Displacement (Cubic Inches) Volume – Interior Volume (Cubic Feet) DSL – Diesel Engine Four valve – Four valves per cylinder FWD – Front wheel drive 4WD – Four wheel drive Manual – Manual transmission Lock – Automatic transmission with lockup FI – Fuel Injection Port – Port fuel injection TBI – Throttle Body Injection Carb – Carburetor
Related Documents