Integrating and Analysing Web GIS apps Muhammad Muneeb Ashraf

Welcome message from author
This document is posted to help you gain knowledge. Please leave a comment to let me know what you think about it! Share it to your friends and learn new things together.
Transcript

Integrating and Analysing Web GIS apps
Muhammad Muneeb Ashraf

Agenda
• Overview GIS Application
• Analyse Web GIS
• Integration with monitoring tool
• Monitor tools Architecture & Reporting Capabilities
• Live Demo
GIS Web Map Application

GIS Web Application DEMO

Monitoring of GIS Web App
– Show the availability of GIS services – Show the performance of the services – Show the usage of the services – Sends alarms about the services(down…etc.)

Monitoring Tools Architecture?
Data Collection
Reporting

General System Architecture
• Deployment • Collection • Reporting
• Monitoring
Monitoring tools Components
Data Sources…
• Data comes from several sources – ArcGIS for Server Application – Windows Performance Counters – ArcGIS for Server and IIS Log Files

Monitoring Tools Designed To…
• Answer questions like : -- How many visitors ? -- How is performance? --Most popular site?

Sample Reports From Monitor Tool
• Dashboard Reports – Summary – ArcGIS Server Map Service Availability
• Uptime Reports – Server Uptime – Optimizer Alarms
• Usage Reports – User Activity – Performance Counter – Map Tile Requests – Map Service Cost – Query Requests – Sessions and Unique Users

Sample Reports
Summary The summary table shows a rollup of some of the most important information for the last 7 days
Sample Reports
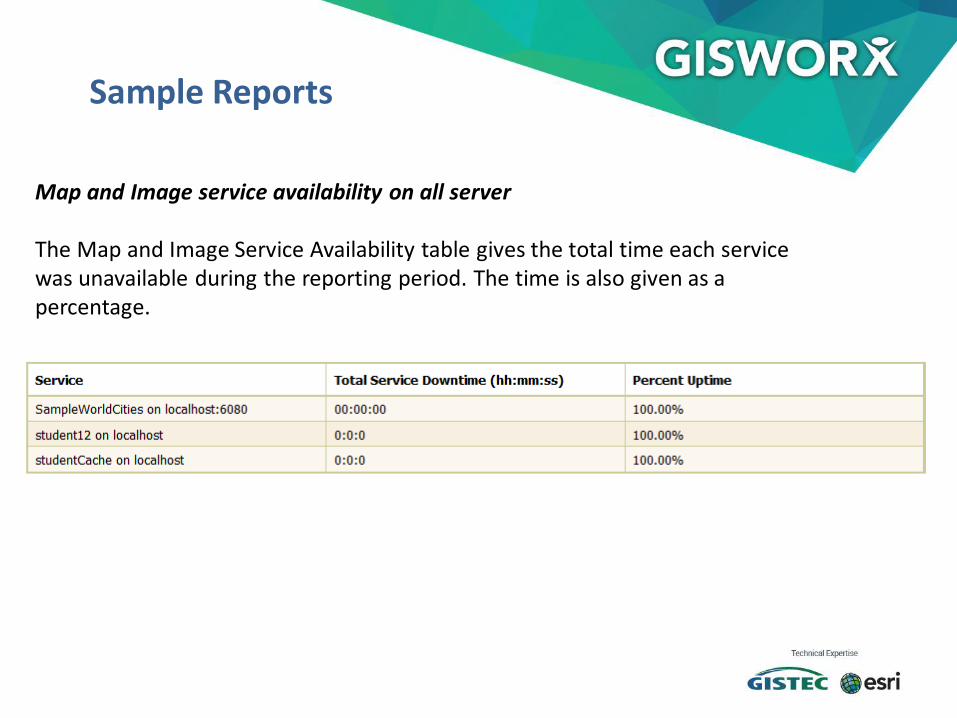
Map and Image service availability on all server The Map and Image Service Availability table gives the total time each service was unavailable during the reporting period. The time is also given as a percentage.
Sample Reports
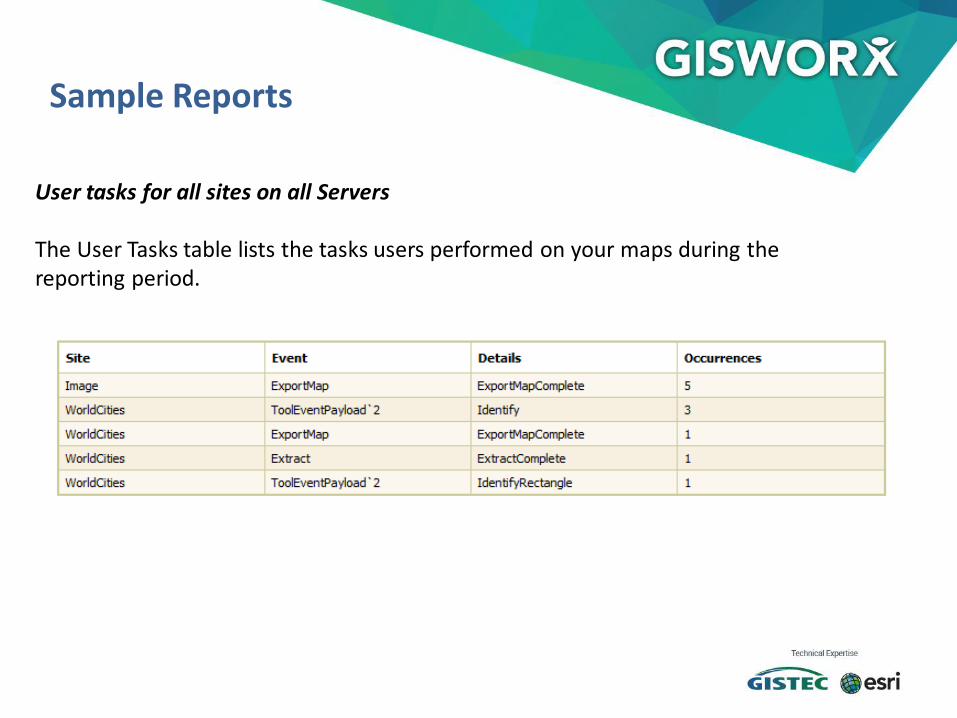
User tasks for all sites on all Servers The User Tasks table lists the tasks users performed on your maps during the reporting period.

Live Demo…

Thank You
Related Documents