Analysing Total Factor Productivity Growth for South Africa’s Manufacturing Sector Using a DEA-Based Malmquist Productivity Index Mpho Tsebe and Siyaduma Biniza July, 2015 Abstract This study uses a DEA-based Malmquist Productivity Index to measure total factor productivity (TFP) in South Africa’s manufacturing sector from 1994 to 2013. Using the index, the study provides a rich decomposition of the estimated productivity into technological change, pure efficiency and s cale efficiency. The study findings are that TFP for the entire manufacturing sector improved by 0.5 per cent per annum. Technological change accounts for most of the improvement in TFP in seven of the ten subsectors. And only four of the ten subsectors showed improvements in pure efficiency, whilst three subsectors experienced deterioration in scale efficiency. Overall, six subsectors had improvements in TFP. Capital-intensive subsectors like the transport equipment subsector had the largest improvements in TFP and output, but shed a number of jobs. Given the fact that the transport equipment subsector has been the biggest beneficiary of industrial policy incent ives; this raises the q uestion whet her industrial policy is failing to create jobs because it promotes capital- intensity and mechanisation. On the other hand, there has been a decline in TFP in labour-intensive subsectors such as: the non-metallic mineral products; text iles, clothing and leather; and fu rniture and other p roducts. These findings have implications given South Africa’s high unemployment rate. The decline in TFP in most of the labour-intensive subsectors limits the ability these sectors have to create jobs; and undermines the traditional role of manufacturing in creating jobs for the largely unskilled and semi-skilled labour force. This has broader implications for state interventions aimed at reducing poverty and inequality. JEL Codes: D24 - Production; Cost; Capital; Capital, Total Factor, and Multifactor Productivity; Capacity. L69 - Industry Studies: Manufacturing: Other Keywords: total factor productivity; manufacturing; industrial policy; Malmquist productivity index; data envelopment analysis; technological change; pure efficiency; scale efficiency.

Analysing Total Factor Productivity Growth for South Africa’s Manufacturing Sector
Jan 08, 2016
This study uses a DEA-based Malmquist Productivity Index to measure total factor productivity (TFP) in South Africa’s manufacturing sector from 1994 to 2013. Using the index, the study provides a rich decomposition of the estimated productivity into technological change, pure efficiency and scale efficiency.
The study findings are that TFP for the entire manufacturing sector improved by 0.5 per cent per annum. Technological change accounts for most of the improvement in TFP in seven of the ten subsectors. And only four of the ten subsectors showed improvements in pure efficiency, whilst three subsectors experienced deterioration in scale efficiency. Overall, six subsectors had improvements in TFP.
Capital-intensive subsectors like the transport equipment subsector had the largest improvements in TFP and output, but shed a number of jobs. Given the fact that the transport equipment subsector has been the biggest beneficiary of industrial policy incentives; this raises the question whether industrial policy is failing to create jobs because it promotes capitalintensity and mechanisation. On the other hand, there has been a decline in TFP in labour-intensive subsectors such as: the non-metallic mineral products; textiles, clothing and leather; and furniture and other products.
These findings have implications given South Africa’s high unemployment rate. The decline in TFP in most of the labour-intensive subsectors limits the ability these sectors have to create jobs; and undermines the traditional role of manufacturing in creating jobs for the largely unskilled and semi-skilled labour force. This has broader implications for state interventions aimed at reducing poverty and inequality.
Welcome message from author
This document is posted to help you gain knowledge. Please leave a comment to let me know what you think about it! Share it to your friends and learn new things together.
Transcript

7/17/2019 Analysing Total Factor Productivity Growth for South Africa’s Manufacturing Sector
http://slidepdf.com/reader/full/analysing-total-factor-productivity-growth-for-south-africas-manufacturing 1/18
Analysing Total Factor Productivity Growth for South Africa’s
Manufacturing Sector Using a DEA-Based Malmquist Productivity Index
Mpho Tsebe and Siyaduma Biniza
July, 2015
Abstract
This study uses a DEA-based Malmquist Productivity Index to measure
total factor productivity (TFP) in South Africa’s manufacturing sector
from 1994 to 2013. Using the index, the study provides a rich
decomposition of the estimated productivity into technological change,
pure efficiency and scale efficiency.
The study findings are that TFP for the entire manufacturing sector
improved by 0.5 per cent per annum. Technological change accounts for
most of the improvement in TFP in seven of the ten subsectors. And onlyfour of the ten subsectors showed improvements in pure efficiency, whilstthree subsectors experienced deterioration in scale efficiency. Overall, six
subsectors had improvements in TFP.
Capital-intensive subsectors like the transport equipment subsector had
the largest improvements in TFP and output, but shed a number of jobs.
Given the fact that the transport equipment subsector has been the biggest
beneficiary of industrial policy incentives; this raises the question whether
industrial policy is failing to create jobs because it promotes capital-
intensity and mechanisation. On the other hand, there has been a decline
in TFP in labour-intensive subsectors such as: the non-metallic mineral
products; textiles, clothing and leather; and furniture and other products.
These findings have implications given South Africa’s high
unemployment rate. The decline in TFP in most of the labour-intensive
subsectors limits the ability these sectors have to create jobs; and
undermines the traditional role of manufacturing in creating jobs for the
largely unskilled and semi-skilled labour force. This has broader
implications for state interventions aimed at reducing poverty and
inequality.
JEL Codes: D24 - Production; Cost; Capital; Capital, Total Factor, and
Multifactor Productivity; Capacity. L69 - Industry Studies:
Manufacturing: Other
Keywords: total factor productivity; manufacturing; industrial policy;
Malmquist productivity index; data envelopment analysis; technological
change; pure efficiency; scale efficiency.

7/17/2019 Analysing Total Factor Productivity Growth for South Africa’s Manufacturing Sector
http://slidepdf.com/reader/full/analysing-total-factor-productivity-growth-for-south-africas-manufacturing 2/18
1. INTRODUCTION
This paper analyses total factor productivity growth in South Africa’s manufacturing sector and subsectors from
1994 to 2013. The study is motivated by two main considerations. Firstly, there is a gap in the literature when it
comes to analysing total factor productivity in South Africa. Secondly, economic growth in the democratic South
Africa has been lurking and insufficient to meet the developmental needs of a large and growing population. In
addition, the National Development Plan outlines very ambitious growth rate target of 5.4 per cent per annum
(NPC, 2011), which can be achieved with a significant productivity increase, especially in the manufacturing
sector.
Studies covering the area of productivity growth in South Africa have more or less been conducted for the period
1970 to 2004. For instance, Arora and Bhundia (2003) use a Growth Accounting (GA) technique to study the
contributions of total factor productivity (TFP) to growth for the period 1980 to 2001; while Aghion, Braun and
Fedderke (2008) also use a GA technique to study the impact of product market competition on TFP growth over
the period 1980 to 2004. Fedderke and Bogetic (2009) employ a GA technique to assess the impact of
infrastructure on labour productivity and TFP growth in the period 1970 to 2000. As a result there is a gap in the
literature dealing with productivity analysis over the last decade. So it is important that we investigate the trends
in TFP over the last decade, i.e. 2004 to 2014.
The majority of the studies have employed GA to analyse productivity, where TFP growth is derived as a residual
of the Cobb Douglas production function. The main issue with the GA method is that the approach assumes that
the production process is efficient and all productivity change is attributed to technical change (Barro, 1999).
Furthermore, a number of neoclassical assumptions that dictate some of the important characteristics of the
production process need to be adopted, i.e. that production occurs with constant returns to scale and that capital
and labour are the only inputs considered (Barro, 1999).
In order to overcome the limits of the literature considering aggregate TFP, this study uses a non-parametric data
envelopment analysis (DEA) based Malmquist Productivity index to compute total factor productivity growth.
The main advantage of adopting the DEA-based Malmquist productivity index approach is that is requires
minimal assumptions with regard to the underlying technology. The first assumption is on the orientation of the
distance functions used to calculate the Malmquist index (which can be specified as either output-oriented orinput oriented). The second assumption pertains to whether the production technology exhibits constant returns to
scale (CRS) or variable returns to scale (VRS). Furthermore, the index provides a rich decomposition of the
estimated productivity change into technical change and efficiency change. Technical change refers to a shift in
the production technology, while efficiency change relates to how well a firm processes inputs into output(s). This
measure of efficiency can be further decomposed into “pure” efficiency and scale efficiency, where the later
refers to improvements in the scale or size of operations and the former relates to a more efficient use of inputs
and available technology (Kumar & Gulati, 2008).
We focus on manufacturing sector because it has always been regarded as an “engine” of growth due to its strong
backward and forward linkages with other sectors (Tregenna, 2011). For example the automotive industry, which
is part of the transport equipment subsector, also benefits a diversity of industries such as platinum group metals,
logistics, finance, retail and advertising etc. (AIEC, 2013,). Therefore, the subsector, and the broader
manufacturing sector, has strong economic and employment multipliers which is also acknowledged in South
Africa’s industrial development strategy. According to the Industrial Policy Action Plan (IPAP), the
manufacturing sector has been identified as having the highest economic and employment multipliers (DTI,
2014). This is why the South African government has tried to support the growth and development of
manufacturing sector through IPAP.

7/17/2019 Analysing Total Factor Productivity Growth for South Africa’s Manufacturing Sector
http://slidepdf.com/reader/full/analysing-total-factor-productivity-growth-for-south-africas-manufacturing 3/18
South Africa’s manufacturing output has increased from R180 billion in 1994 to R300 billion1 in 2013, but its
gross value added contribution to GDP has shrunk from 17 per cent to about 15 per cent over the same period (see
Figure 1a). In 2013 the manufacturing sector was the 4th largest contributor to GDP growth from being the 3
rd
largest contributor to growth in 1994. Furthermore, in 2013 the manufacturing sector employed 12 per cent of the
workforce compared with 14 per cent in 2008 (see Figure 1b).
Figure 1a: Sector contribution to GDP Figure 1b: Sector contribution to employment
Source: Statistics South Africa (2015)
It is undeniable that the manufacturing sector is a valuable industry and can contribute immensely to economic
growth and job creation.
As already mentioned, the purpose of this paper is to study TFP growth in the manufacturing sector from 1994 to
2014. To aid in the analysis we will use a non-parametric DEA-based Malmquist Productivity index to compute
TFP growth. The study seeks to answer the following questions:
• What has been the trend in TFP for the manufacturing sector?
• What are the contributions of technical change and efficiency change to TFP change?
• What has been the trend in TFP growth for the manufacturing subsectors over the study period?
The rest of the paper is structured as follows: Section 2 provides a literature review. Section 3 presents the
methodology and Section 4 discusses the data and empirical results. Section 5 concludes the paper.
2. LITERATURE REVIEWSimply defined, productivity is the ratio of output to input. More output per unit of input reflects higher
productivity. Optimum productivity is achieved when it is not possible to become more productive without
employing new technology or other changes in the production process.
The most common measures of productivity are index numbers and non-parametric approaches. The problem with
index numbers is that the approach assumes that the production process is efficient. Furthermore, this approach is
1 2005 constant prices
"#$%&'()'$*
+,
-%.%.#
/,
"#$%&#'(%)*$+
,-.
0$12*
34,
0$1.567$)8,
9%.1.&*
4/,
:7;;'.%)< 1.2 57&%1(
5*$=%&*5
3/,
>$%=1)* ?7'5*?7(25
@,
A)?*$
B,"#$%&'()'$*
3,-%.%.#
+,
"#$%&#'(%)*$+
,/.
C?7(*51(*D $*)1%( 1.2
)$12*
43,
0$1.567$)
B,
9%.1.&*
33,
E*.*$1( #7=*$.;*.)5
5*$=%&*5
4F,
6*$57.1( 5*$=%&*5
+,
7)?*$
48,

7/17/2019 Analysing Total Factor Productivity Growth for South Africa’s Manufacturing Sector
http://slidepdf.com/reader/full/analysing-total-factor-productivity-growth-for-south-africas-manufacturing 4/18
unable to provide a decomposition of productivity growth since it assumes that all productivity change is
attributed to technical change (Barro, 1999). The non-parametric approach on the other hand, is extremely flexible
and able to provide a decomposition of productivity differentials into different components of technical
efficiency, pure efficiency and scale efficiency (Coeli, Battesse, O'Donnell, & Rao, 2005).
Literature covering TFP is vast as it is considered one of the most important factors of growth, however the field
covering non-parametric analysis of TFP growth in manufacturing is still developing. Using a DEA-basedMalmquist index for the period 1981 to 2002, Mahadev (2002) studied TFP growth in Malaysia’s manufacturing
sector and found that the Malaysian manufacturing sector TFP grew by 0.8 per cent driven by small gains in
technical and efficiency change. Fare, Grosskopf and Pasurka (2001) made use of a Malmquist-Luenberger
productivity index to measure U.S. manufacturing productivity for the period 1974-1986. They found that, when
accounting for change in emissions, average annual TFP growth was 3.6 per cent, and 1.7 per cent when
emissions are ignored. Their study shows that productivity indexes that ignore reductions in bad outputs give an
incomplete picture.
Natarajan and Duraisamy (2008) analysed TFP growth of the unorganised manufacturing sector in India for 15
major states for the period 1978/79 to 2000/01, using a DEA-based Malmquist TFP growth index. Their results
show that TFP grew in all 15 states across the country. Most states experienced higher TFP growth post the 1990s
reforms than in the pre-reforms period. The reforms were initiated in the 1980’s and were intended to improve
efficiency, productivity, and international competitiveness of the manufacturing industry. Improvements in
efficiency change rather than technical progress contributed to the acceleration in TFP growth rate.
Using a non-parametric DEA-based Malmquist index Sehgal and Sharma (2011) analyse inter-temporal and intra-
industry comparisons of TFP for organised manufacturing in India and the Haryana state from 1981 to 2008. They
find that for both India and Haryana state, TFP growth shows a declining trend in the post-reform period from
1993 to 2008. They attribute the decline in TFP growth to inefficiencies in utilisation of resources. Their results
also suggest that technical change is the main driver of TFP growth in the pre-reform period from 1981 to 1992,
as a result of the liberalisation of technological advancements.
In South Africa, DEA has been extensively applied to study the efficiency of the public healthcare system. For
instance Ngoie and Koch (2005) applied DEA to a sample of Gauteng public hospitals to study the efficiency of
the public sector in delivering healthcare services and found that they were inefficient. On the same note
Mbonigaba and Oumar (2014) studied the efficiency of South African municipalities in providing healthcare and
found that they are generally inefficient. The first study to use DEA was conducted by Zere (2002) who analysed
the efficiency of the public healthcare system in South Africa He found that inefficient hospitals on average
consume 35-47 per cent more resources.
Other studies covering productivity growth in South Africa include: Arora and Bhundia (2003) who use a GA
technique to study the contributions of TFP to growth from 1980 to 2001; Aghion, Braun and Fedderke (2008)
who also use a GA technique to study the impact of product market competition on TFP growth from 1980 to
2004. Arora and Bhundia (2003) find that growth in GDP at the end of 1994 is attributed to higher TFP growth.
And Aghion, Braun and Fedderke (2008) conclude that higher past mark ups are associated with lower current productivity growth rates. Fedderke and Bogetic (2009) employ a GA technique to assess the impact of
infrastructure on South African labour productivity and TFP growth from 1970 to 2000. They find that
infrastructure capital has positive and economically meaningful impact on labour and TFP.
Closely related to the analysis in this paper is a study by Du Plessis and Smit (2007), who make use of a GA
technique to distinguish the relative contributions of capital, labour and TFP to South Africa’s growth revival
after 1994. They find that TFP growth accounts for 50 per cent or more of South Africa’s economic recovery
between 1995 and 2004.

7/17/2019 Analysing Total Factor Productivity Growth for South Africa’s Manufacturing Sector
http://slidepdf.com/reader/full/analysing-total-factor-productivity-growth-for-south-africas-manufacturing 5/18
3. METHODOLOGY
To answer the research questions, TFP growth is analysed using a Malmquist TFP index for the period 1994 to
2014. The Malmquist TFP index will be calculated and decomposed into efficiency change and technical change
using DEA.
3.1 Malmquist TFP index
The Malmquist productivity index measures TFP changes between ‘decision-making units’, or sectors as it is used
in this study, and one decision-making unit over time. The index distinguishes between sources of productivity
growth, namely: technical change, which refers to a shift in the production technology; and efficiency change,
which refers to how well a firm processes inputs into output using the same technology. Efficiency is further
decomposed into pure efficiency and scale efficiency, where the later refers to improvements in the scale or size
of operations and the former relates to a more efficient use of inputs and available technology (Kumar & Gulati,
2008).
The Malmquist productivity index is defined using either input or output distance functions, which can be
calculated using DEA-like linear programming techniques. The distance functions allow one to describe a multi-
input, multi-output production technology without specifying behavioural objectives such as cost minimisation or profit maximisation (Coelli T. J., 2003). The output distance function describes the production technology by
looking at a maximal proportional expansion of the output vector, given an input vector. While the input distance
function describes the production technology by looking at a minimal proportional decrease of the input vector,
given an output vector (Coeli, Battesse, O'Donnell, & Rao, 2005).
Fare et al’s (1994) output-oriented Malmquist productivity index is used to compute TFP change for the overall
manufacturing sector and its subsectors. We use an output orientated DEA-based Malmquist because we assume
that in manufacturing, the goal is to maximise output from a given set of inputs, rather than minimise inputs to
attain a constant level of output. The output-orientated Malmquist productivity index defined on a benchmark
technology satisfying constant returns to scale (CRS) is given by:
The first ratio measures efficiency change (i.e. whether the sector has moved closed to or father
away from the benchmark frontier) between period t and t+1 and the second ratio
measures technical change (i.e. technological movements relative to
the benchmark frontier). Such that: TFP change = efficiency change * technical change. A value of !!"
! !
!"# $ &'"#( ) *"#(+, - ."#(+,/'"#( ) *"#( - ."#( / * '"#(+, ) *"#(+, - ."#(+, /
'"#(+, ) *"#( - ."#( / 0,1
$ '"#(+, 2*"#(+, -."#(+, 3'"#( 2*"#( -."#( 3 * 4 '"#( 2*"#(+, -."#(+, 3
'"#(+, 2*"#(+, -."#(+, 3 * '"#( 2*"#( -."#( 3'"#(+, 2*"#( -."#( 35
,1 (1)
67 87 9:; #<=>?8 $ 8@@6#68>#A #<=>?8 * (8#<>6#=B #<=>?8!"#$%&' ("#$%& )*"#$%&+
!"#$ ' ("#
$ )*"#$ +
! "#$% & '($%)* + ,#$%)*-"($%)*& '#$%)* + ,($%)*- '
"#$% & '($% + ,($% -"#$%)*& '($% + ,($% -/
*0

7/17/2019 Analysing Total Factor Productivity Growth for South Africa’s Manufacturing Sector
http://slidepdf.com/reader/full/analysing-total-factor-productivity-growth-for-south-africas-manufacturing 6/18
indicates productivity growth, while a value of !!"
! ! denotes productivity decline, and !!"
! ! signals no
change in productivity from time t to t+1. Y is output vector and X is the amount of input vector.
We assume CRS technology because Grifell-Tatje and Lovell (1995) show that in the context of non-constant
returns to scale, the Malmquist index does not accurately measure productivity change.
The efficiency change component is decomposed into pure efficiency change (measured in relation to the best practice frontier) and scale efficiency between period t and t+1. Since the best practice frontier may exhibit VRS,
this means that the efficiency change component needs to be redefined to allow VRS. Following Ray and Desli
(1997), the efficiency change component is redefined as:
Combining equation 1 and 2, TFP change can be decomposed into technical change (defined on the benchmark
frontier), pure efficiency change (defined on the best practice frontier) and a scale effect component. The
subscript “oc” indicates that the distance function is defined on the benchmark frontier; “o” indicates that the
distance function is defined on the best practice frontier.
The components of TFP growth can be interpreted as follows: technical progress means that the technological
frontier has shifted; while an improvement in pure efficiency means that the sector’s position relative to the best
practice frontier has changed and improvements in scale efficiency means that the sector has moved to a position
with better input-output quantity ratio on the frontier (Balk, 2001). Improvements in any of the components of theMalmquist index are also associated with values greater than 1, and a deterioration is associated with values less
than 1.
For each subsector four-distance function are required to calculate TFP change between two time periods. The
main advantage of the Malmquist productivity index is that it does not require input or output prices. Furthermore
it provides insight into the sources of productivity change. The main disadvantage of the Malmquist index is the
necessity to compute the distance function. However, the distance functions can be calculated using DEA
(discussed below).
3.2 Data Envelopment Analysis (DEA)
DEA is a technique based on linear programming that was developed by Charnes, Cooper and Rhodes (1978) formeasuring relative efficiency of decision-making units (DMU) when the production process presents a structure
of multiple inputs and outputs. The efficiency scores of any DMU are obtained as the maximum ratio of weighted
outputs to weighted inputs subject to the condition that the similar ratios for every DMU be less than or equal to
one (Charnes, Cooper, & Rhodes, 1978), i.e.:
"#$%&' ( )#$%&' *+#$%&' ,"#$% ( )#$% *+#$% ,
- ".%&' ()#%&' *+#%&' ,"#% ()#% *+#% , ) /"#$% ()#$%&' *+#$%&' ,0"#% ()#%&' *+#%&' ,
".$% ()#$% *+#$% ,0"#% ()#% *+#% , ) "#$%&' ()#$%&' *+#$%&' ,0"#%&' ()#%&' *+#%&' ,"#$%&' ()#$% *+#$% ,0"#%&' ()#% *+#% , 1
'2 (2)
34 54 6773$358$9 $:;8<5 - =>?5 5773$358$9 $:;8<5 ) @$;A5 5773$358$9 $:;8<5

7/17/2019 Analysing Total Factor Productivity Growth for South Africa’s Manufacturing Sector
http://slidepdf.com/reader/full/analysing-total-factor-productivity-growth-for-south-africas-manufacturing 7/18
In words, DEA seeks to find values of U and V that maximize the efficiency of each DMU subject to the
constraint that the efficiency of all units must be ! 1. Equation 1 is a fractional linear form, which yields an
infinite number of solutions. To solve the model and apply methods of linear programming it is first necessary to
convert it into a linear form, by restricting the denominator to equal 1.
Equation 1 becomes:
To obtain distances functions for the Malmquist TFP index, four linear programming problems (LPPs) must be
solved for each DMU, or each for each manufacturing subsector in this study. The four LLPs are:
Maximise ! "$ %& '&(
)&" *
$ +, -,(.,"*
Subject to:
$ %& '&()&"*
$ +, -,(.,"*
/ *0 ( " *01 0 2 (1)
Where:
! = Efficiency rating of the DMU being evaluated by DEA
j = number of DMU being compared in DEA
Yro = amount of output produced by DMUo
Xio = amount of input used by DMUo
i = number of input used by the DMUs
r = number of outputs generated by the DMUs
Ur = weight assigned by DEA to output r
Vi = weight assigned by DEA to input i
3= U and V are constrained to be greater than or equal to some positive quantity in order to avoid any input
or output being totally ignored in determining the efficiency
Maximise ! " $ %& '&()&"*
Subject to
$ +, -,( " *.,"*
$ %& '&( /)&"* $ +, -,( 0 ( 1 ( " *1 2 1 3.
,"*
%&1+, 1 4 5 (2)
Where we assume we have n decision making units

7/17/2019 Analysing Total Factor Productivity Growth for South Africa’s Manufacturing Sector
http://slidepdf.com/reader/full/analysing-total-factor-productivity-growth-for-south-africas-manufacturing 8/18
In summary, DEA compares DMUs taking into account all inputs used and output produced, and identifies the
most efficient units or best practice units and the inefficient units in which real efficiency improvements are
possible. Units identified as efficient from DEA are relatively efficient and not strictly efficient, i.e. no other unit
is operating more efficiently than the efficiently identified ones, but it is possible that all units, including the
relatively efficient units, can be operated more efficient. Therefore the efficient units represent the best existing,
but not necessarily the best possible practice with respect to efficiency.
4. DATA AND EMPIRICAL RESULTS
For the purpose of the analysis two-digit standard industrial classification (SIC) code manufacturing data
spanning 1994 to 2014 is employed to conduct the analysis. Data is obtained from the Quantec database and the
variables included are production output, intermediate inputs, capital stock and labour. Production output,
intermediate inputs (i.e. energy consumption and material purchases) and capital stock are expressed in 2005
constant terms; while labour is taken as the number of formal and informal employees employed in each period.
!"#$%&' (#
$%& ) *#$%& +,
-&. /01 3
s.t -3(#$%& % ($%&45 6 #
*#$%& - *$%&45 6 #
45 6 #
7"#$' (#$ ) *#$ +8-& . /01 3
s.t -3(#$ % ($ 45 6 #
*#$ - *$ 45 6 #
45 6 #
!"#$%&' (#
$ ) *#$ +,
-&. /01 3
s.t -3(#$ % ($%& 45 6 #
*#$ - *$%&45 6 #
45 6 #
!"#$%&' (#
$ ) *#$ +,
-&. /01 3
s.t -3(#$ % ($%& 45 6 #
*#$ - *$%&45 6 #
45 6 #
LPP 1
LPP 2
LPP 3
LPP 4

7/17/2019 Analysing Total Factor Productivity Growth for South Africa’s Manufacturing Sector
http://slidepdf.com/reader/full/analysing-total-factor-productivity-growth-for-south-africas-manufacturing 9/18
In total, there are 10 two-digit manufacturing subsectors included in the study. The lists of sectors included in the
study are food, beverages and tobacco; textiles, clothing and leather; wood and paper, publishing and printing;
petroleum products, chemicals, rubber and plastic; other non-metallic mineral products; metals, metal products,
machinery and equipment; electrical machinery and apparatus; radio, TV, instruments, watches and clocks;
transport equipment; as well as furniture and other manufacturing.
The Malmquist TFP productivity indices are calculated using DEAP 2.1 program developed by (Coelli T. , 1996).This section looks into annual TFP changes of total manufacturing sector and an analysis of TFP growth of the 10
manufacturing subsectors.
Figure 2 below depicts the mean TFP growth for the manufacturing sector and subsectors, over the period 1994 to
2014. TFP in the manufacturing sector grew by 0.5 per cent on average. The transport equipment subsector
experienced the largest improvement in TFP growth, recording a 3.7 per cent average TFP growth rate; followed
by electrical machinery and apparatus, and the petroleum products, chemicals, rubber and plastic subsectors
which recorded TFP growth of 3.2 per cent and 2.2 per cent respectively. Other non-metallic mineral products
subsector experienced the largest deterioration in TFP growth, with TFP growth contracting by 1.4 per cent
between 1994 and 2014.
Figure 2: Mean TFP change for the manufacturing and subsectors, over the period 1994-2014
More generally, six of the ten manufacturing subsectors recorded improvements in TFP growth, while four
subsectors experienced a contraction in TFP growth. The poor performance in the four sectors with contracting
TFP is evident in gross domestic output growth recorded by StatsSA. For instance, gross domestic output in theother non-metallic mineral products subsector grew by a mere 0.3 per cent between 1994 and 2014, while gross
domestic growth in the transport equipment sector grew by 4.2 per cent in the same period (StatsSA, 2014).
!"#$
!&#'
!&#"
!&#"
&#$
&#(
&#(
&#)
*#*
+#*
+#,
!*#& !"#& &#& "#& *#& +#& $#&
-./01 232!40.56678 4720156 913:;8.<
=;127.;10 52: 3./01 452;>58.;172?
@0A.760<B 863./72? 52: 605./01
C33: 52: 95901D 9;E67</72? 52:F
G0.56<B 40.56 913:;8.<B 458/7201HF
G52;>58.;172?
I5:73B @JB 72<.1;402.<B K5.8/0< 52:F
=33: E0L015?0< M.3E5883
N0.1360;4 913:;8.<B 8/047856<BF
O608.17856 458/7201H 52: 599515.;<
@152<931. 0P;79402.
7/17/2019 Analysing Total Factor Productivity Growth for South Africa’s Manufacturing Sector
http://slidepdf.com/reader/full/analysing-total-factor-productivity-growth-for-south-africas-manufacturing 10/18
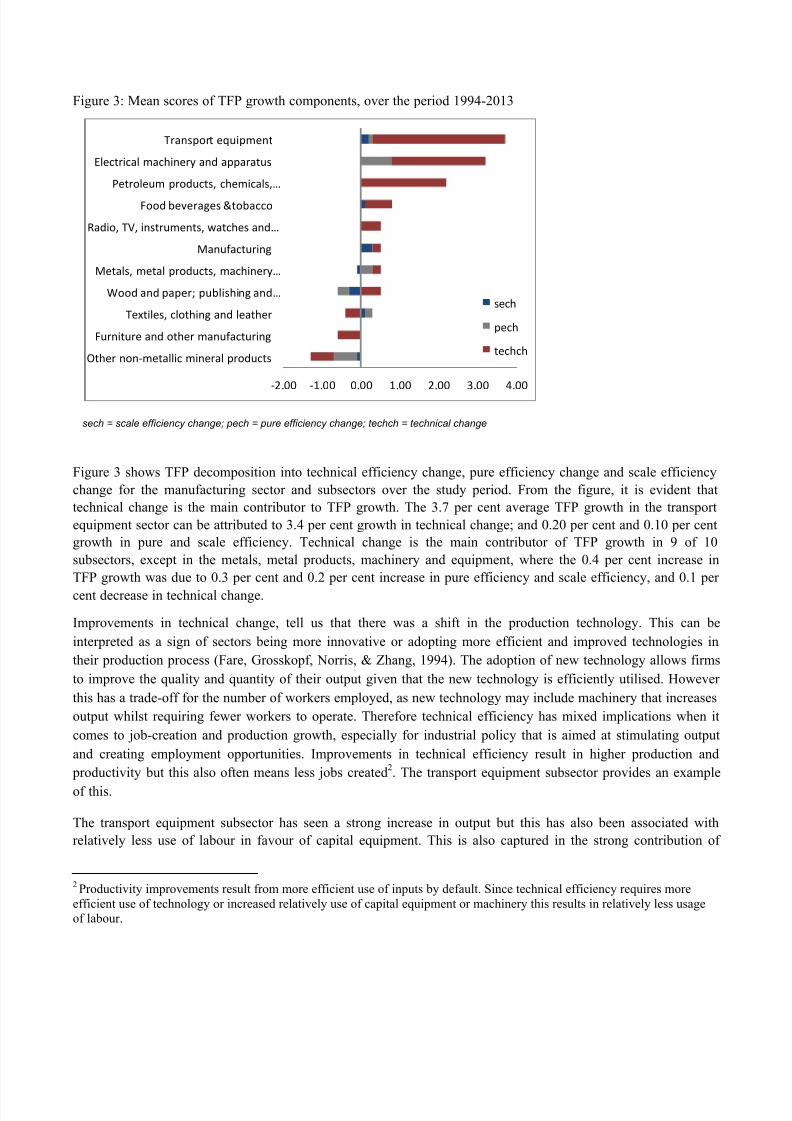
Figure 3: Mean scores of TFP growth components, over the period 1994-2013
Figure 3 shows TFP decomposition into technical efficiency change, pure efficiency change and scale efficiency
change for the manufacturing sector and subsectors over the study period. From the figure, it is evident that
technical change is the main contributor to TFP growth. The 3.7 per cent average TFP growth in the transport
equipment sector can be attributed to 3.4 per cent growth in technical change; and 0.20 per cent and 0.10 per cent
growth in pure and scale efficiency. Technical change is the main contributor of TFP growth in 9 of 10
subsectors, except in the metals, metal products, machinery and equipment, where the 0.4 per cent increase in
TFP growth was due to 0.3 per cent and 0.2 per cent increase in pure efficiency and scale efficiency, and 0.1 per
cent decrease in technical change.
Improvements in technical change, tell us that there was a shift in the production technology. This can be
interpreted as a sign of sectors being more innovative or adopting more efficient and improved technologies in
their production process (Fare, Grosskopf, Norris, & Zhang, 1994). The adoption of new technology allows firms
to improve the quality and quantity of their output given that the new technology is efficiently utilised. However
this has a trade-off for the number of workers employed, as new technology may include machinery that increases
output whilst requiring fewer workers to operate. Therefore technical efficiency has mixed implications when it
comes to job-creation and production growth, especially for industrial policy that is aimed at stimulating output
and creating employment opportunities. Improvements in technical efficiency result in higher production and
productivity but this also often means less jobs created2. The transport equipment subsector provides an example
of this.
The transport equipment subsector has seen a strong increase in output but this has also been associated with
relatively less use of labour in favour of capital equipment. This is also captured in the strong contribution of
2Productivity improvements result from more efficient use of inputs by default. Since technical efficiency requires more
efficient use of technology or increased relatively use of capital equipment or machinery this results in relatively less usage
of labour.
!"#$$ !%#$$ $#$$ %#$$ "#$$ &#$$ '#$$
()*+, ./.!0+)12234 03.+,12 5,/674)8
97,.3)7,+ 1.6 /)*+, 01.7:14)7,3.;
<+=)32+8> 42/)*3.; 1.6 2+1)*+,
?//6 1.6 515+,@ 57A238*3.; 1.6B
C+)128> 0+)12 5,/674)8> 014*3.+,DB
C1.7:14)7,3.;
E163/> <F> 3.8),70+.)8> G1)4*+8 1.6B
9//6 A+H+,1;+8 I)/A144/
J+),/2+70 5,/674)8> 4*+034128>B
K2+4),3412 014*3.+,D 1.6 1551,1)78
<,1.85/,) +L7350+.)
8+4*
5+4*
)+4*4*
sech = scale efficiency change; pech = pure efficiency change; techch = technical change

7/17/2019 Analysing Total Factor Productivity Growth for South Africa’s Manufacturing Sector
http://slidepdf.com/reader/full/analysing-total-factor-productivity-growth-for-south-africas-manufacturing 11/18
technical efficiency in the subsector’s TFP. Transport equipment output has grown by over 150% whilst
employment has declined by approximately 20% over the study period (see Figure 4 below). This poses a
challenge for industrial policy given that the stated objective of industrial policy is job-creation and stimulating
production (DTI, 2013b; DTI, 2014). The trade-off between gains in productivity and job-creation can be partly
attributed to industrial policy incentives, which encourage technical efficiency improvements - or more broadly -
capital intensity.
Figure 4: Transport Sector Trends 1994-2013
!"#$%&' )#*+,&%- ./01
South Africa’s industrial policy subsidises the cost of capital as a lot of incentives are aimed at capital
investments and subsidising the cost of machinery for firms. For instance, the Automotive Investment Scheme
(AIS) provides up to 30% cash grants for qualifying capital investments (DTI, 2013a). As a result, industrial
policy incentivises technical efficiency because it subsidises the cost of capital as opposed to labour. Most of the
national incentive programmes are aimed at the firm level and geared towards capital equipment subsidisation
with only a few incentives aim at labour subsidisation or skills development (see Figure 5 below).
Figure 5: Matrix of National Industrial Policy Incentives
0.00
5.00
10.00
15.00
20.00
25.00
30.00
35.00
0.00
20.00
40.00
60.00
80.00
100.00
120.00
140.00
160.00
180.00
1 9 9 4
1 9 9 5
1 9 9 6
1 9 9 7
1 9 9 8
1 9 9 9
2 0 0 0
2 0 0 1
2 0 0 2
2 0 0 3
2 0 0 4
2 0 0 5
2 0 0 6
2 0 0 7
2 0 0 8
2 0 0 9
2 0 1 0
2 0 1 1
2 0 1 2
2 0 1 3
Employ-ment: Formal ('000)
Real Output: TransportEquipment (Rb 2005-Prices)
Real Fixed Capital Stock (RHS)(Rb 2005-Prices)

7/17/2019 Analysing Total Factor Productivity Growth for South Africa’s Manufacturing Sector
http://slidepdf.com/reader/full/analysing-total-factor-productivity-growth-for-south-africas-manufacturing 12/18
The textiles, clothing and leather; metals, metal products, machinery and equipment; electrical machinery and
apparatus; and transport equipment subsectors recorded improvements in pure efficiency change. This tells us that
more efficient uses of inputs and available technology have been adopted in these sectors. In addition these
subsectors, except transport equipment, have had little growth in fixed capital stock – while the textiles, clothing
and leather subsector saw a strong decline in fixed capital stock (see Figures 6 & 7 below).
Figure 6: Electrical Machinery and Apparatus Trends Figure 7: Textiles, Clothing and Leather Trends
!"#$%&' )#*+,&%- ./01
Although it can be argued that pure efficiency growth are associated with less growth in fixed capital stock, and
by implication less job-shedding, the textiles, clothing and leather subsector has had other sectoral dynamics
which have led to very specific economic outcomes. For one, local production has been curtailed by strong import
substitution as a result of low tariffs (Black & Roberts, 2008, p. 219). Nevertheless, it suffices to say that
industrial policy has had a strong impact on TFP growth in the manufacturing sector – specifically with regard to
technical efficiency improvement. But this has had a trade-off with job-creation, which is the main objective ofindustrial policy.
Government incentives need to be rationalised and redesigned to favour outcomes that are aligned with the
objectives of industrial policy, i.e. subsidising the cost of labour relatively more than the cost of capital. However,
this will have an impact on TFP growth. Alternatively, policy-makers should pay special attention to labour
mobility which partly depends on workers’ skills and applicability of previous experience to arising job
opportunities as industrial policy unlocks new jobs which require more technical skills.
Three of the ten manufacturing subsectors, metals, metal products, machinery and equipment; wood and paper,
publishing and printing; and other non-metallic mineral products recorded deterioration in scale efficiency, which
shows that the size or scale of operations is inefficient. However, generally, the manufacturing sector hasimproved its scale efficiency with production increasing across most subsector. On an annual basis it is clear that
changes in TFP strongly fluctuate (see Table 1 below).
0.00
0.50
1.00
1.50
2.00
2.50
3.00
3.50
4.00
4.50
0.00
10.00
20.00
30.00
40.00
50.00
60.00
1 9 9 4
1 9 9 5
1 9 9 6
1 9 9 7
1 9 9 8
1 9 9 9
2 0 0 0
2 0 0 1
2 0 0 2
2 0 0 3
2 0 0 4
2 0 0 5
2 0 0 6
2 0 0 7
2 0 0 8
2 0 0 9
2 0 1 0
2 0 1 1
2 0 1 2
2 0 1 3
2 0 1 4
7.00
7.50
8.00
8.50
9.00
9.50
10.00
0.00
50.00
100.00
150.00
200.00
250.00
300.00
350.00
1 9 9 4
1 9 9 5
1 9 9 6
1 9 9 7
1 9 9 8
1 9 9 9
2 0 0 0
2 0 0 1
2 0 0 2
2 0 0 3
2 0 0 4
2 0 0 5
2 0 0 6
2 0 0 7
2 0 0 8
2 0 0 9
2 0 1 0
2 0 1 1
2 0 1 2
2 0 1 3
2 0 1 4
Employ-ment: Formal ('000) Real Output: Electrical Machinery and Apparatus (Rb 2005-Prices) Real Fixed Capital Stock (RHS) (Rb 2005-Prices)

7/17/2019 Analysing Total Factor Productivity Growth for South Africa’s Manufacturing Sector
http://slidepdf.com/reader/full/analysing-total-factor-productivity-growth-for-south-africas-manufacturing 13/18
Table 1: Annual percentage change in TFP growth
The manufacturing sector recorded four periods in which TFP deteriorated, in the year 1996, 2003, 2009 and 2013
(see Table 1 above). The highest decline in TFP growth occurred in 2009, where the manufacturing sector
recorded a 1.1 per cent contraction in TFP growth. This is not surprising considering South Africa was hit by the
global financial crisis, this saw real GDP growth contract by 1.4 per cent, while gross value added by the
manufacturing sector contracted by 10.6 per cent (StatsSA, 2014). The most significant improvements in TFP
growth in manufacturing sector occurred in 2000, where TFP growth increased by 1.9 per cent attributed to a 0.6
per cent increase in scale efficiency and 1.3 per cent increase in technical change.
As already discussed in the literature review, most studies analysing TFP growth in South Africa have done so by
making use of GA techniques where TFP is calculated as a residual of the Cobb-Douglas production function (see
Arora & Bhundia, 2003; Aghion, et al., 2008; Fedderke & Bogetic, 2009). The nature of these studies is such that,
no explicit magnitudes of the TFP growth are reported, but rather they measure or assess the contribution of TFP
to growth or the impact of certain variables to TFP growth. As a result there is little room to compare results
presented in this paper and those found in the abovementioned studies.
A study that is closely related to our analysis is that by Du Plessis and Smit (2007), who also make use of a GA
technique to distinguish the relative contributions of capital, labour and TFP to South Africa’s growth revival
post-1994. They report that TFP growth contributed positively to the overall performance in the manufacturing
sector and subsectors, except for the radio, TV, instruments, watches and clocks; transport equipment subsectors.
There are several differences that can be drawn between their findings and results presented in this paper. Results
presented in this paper show that the textiles, clothing and leather; wood and paper, publishing and printing; and
Year Manufacturing Food, beverages
and tobacco
Textiles, clothing
and leather
Wood and paper;
publishing and
printing
Petroleum produc ts,
chemicals, rubber and
plastic
Other non-metallic
mineral pr oducts
Metals, metal
products, machinery
and equipment
Electrical
machinery and
apparatus
Radio, TV,
instruments,
w atches and clocks
Transport
equipment
Furniture and
other
manufacturing
1995 0.6 1.5 0.2 1.1 3.8 0.6 1.2 4.7 6.3 9.3 0.7
1996 0.5 0.9 0.7 2.7 2.4 1.0 1.4 0.2 6.2 4.9 3.5
1997 0.8 4.3 0.2 2.7 3.0 0.3 1.3 10.9 10.9 2.9 2.6
1998 0.0 0.2 3.0 1.3 5.6 2.9 1.6 4.6 6.5 12.5 2.6
1999 0.2 1.2 2.3 1.2 8.6 4.3 0.6 8.6 1.6 7.8 0.4
2000 1.9 3.4 2.6 0.1 7.2 2.8 1.5 11.5 1.5 17.4 3.3
2001 0.5 1.3 0.3 0.9 5.2 2.5 0.2 2.4 1.8 9.9 1.4
2002 1.2 0.0 1.7 0.4 0.8 1.4 2.8 2.5 3.0 1.6 3.3
2003 0.6 1.5 0.1 2.2 3.7 4.2 0.3 0.6 0.4 2.0 7.7
2004 0.4 1.0 2.6 0.0 1.0 4.4 1.0 2.4 1.2 3.1 7.5
2005 0.7 0.1 0.8 0.6 0.2 1.2 1.4 1.4 1.7 4.1 2.3
2006 0.7 2.7 0.8 0.8 3.9 0.7 0.3 5.5 3.3 2.2 1.5
2007 1.3 1.3 2.7 1.3 0.1 0.2 1.7 0.8 2.0 4.2 1.1
2008 0.2 0.4 0.3 1.6 0.9 0.2 0.5 5.6 1.6 2.8 0.9
2009 1.1 0.3 1.1 0.5 1.1 5.9 4.8 3.0 1.4 0.4 0.9
2010 1.4 1.5 1.6 2.9 3.0 2.8 0.6 3.2 1.8 4.7 2.1
2011 1.0 0.4 0.7 1.2 0.4 2.2 0.7 0.1 3.8 1.9 1.0
2012 0.8 0.8 0.3 0.9 0.3 0.8 0.0 0.8 3.6 1.2 1.1
2013 0.2 0.5 0.1 0.1 0.4 0.7 0.1 2.2 0.4 1.7 1.0
Mean 0.5 0.8 0.1 0.1 2.2 1.4 0.4 3.2 0.5 3.7 0.6

7/17/2019 Analysing Total Factor Productivity Growth for South Africa’s Manufacturing Sector
http://slidepdf.com/reader/full/analysing-total-factor-productivity-growth-for-south-africas-manufacturing 14/18
other non-metallic mineral subsectors recorded a decline in TFP growth over the period 1994 to 2014. However,
Du Plessis and Smit (2007) report that TFP growth contributed positively to real output growth in these subsectors
in the period 1995 to 2004. Secondly they report that TFP growth contributed negatively to real output growth in
the radio, TV, instruments, watches and clocks subsector; while we found that TFP growth improved by 0.5 per
cent in this sector. A possible explanation for the differences in results is that the analysis in this paper covers a 20
year post-1994 period, which is much wider than the 10 year post 1994 period covered by Du Plessis and Smit
(2007).
However, some similarities can also be drawn from the two studies. For instance, Du Plessis and Smit (2007)
report that TFP contributed positively to real output in the manufacturing sector, which is line with our findings
that show that overall TFP growth improved by 0.5 per cent in the manufacturing sector. They also report that the
electrical, machinery and apparatus subsector experienced the highest TFP contribution to real output, which
closely resembles the second highest improvement in TFP growth according to our findings.
5. CONCLUSION
Using a DEA-based Malmquist Productivity index, the study set out to investigate TFP growth in South Africa’s
manufacturing sector and subsectors from 1994 to 2014. Data consisting of four productive factors (real output;
labour, capital stock and material inputs), spanning 20 years, and 10 manufacturing subsectors was used for the
analysis. The results show that on average, TFP growth improved 0.5 per cent in the manufacturing sector
between 1994 and 2014. The most significant improvements in TFP growth in the manufacturing sector occurred
in 2000, where TFP growth increased by 1.9 per cent attributed to a 0.6 per cent increase in scale efficiency and
1.3 per cent increase in technical change.
The transport equipment subsector experienced the largest improvement in TFP growth, recording a 3.7 per cent
average TFP growth rate, followed by the electrical machinery and apparatus; and petroleum products, chemicals,
rubber and plastic subsectors, who recorded TFP growth of 3.2 per cent and 2.2 per cent. Other non-metallic
mineral products subsector experienced the largest deterioration in TFP growth, with TFP growth contracting by
1.4 per cent between 1994 and 2014.
The study results also indicate that technical change is the main contributor to TFP growth. The 3.7 per cent
average TFP growth in the transport equipment sector was due to 3.4 per cent growth in technical change; and
0.20 per cent and 0.10 per cent growth in pure and scale efficiency. Technical change was the main contributor of
TFP growth in 9 of 10 subsectors, except in the metals, metal products, machinery and equipment, where the 0.4
per cent increase in TFP growth was due to 0.3 per cent and 0.2 per cent increase in pure efficiency and scale
efficiency 0.1 per cent decrease in technical change.
This shows the impact of industrial policy that has been aimed at capital equipment growth thereby favouring
gains in technical efficiency. Although this has had a positive impact for the transport equipment sector, there areclear trade-offs between technical efficiency improvements and job-creation. This is partly attributed to the fact
that industrial policy, by subsidising the cost of capital through various incentives, encourages capital-intensity.
This is an unintended consequence of industrial given that the main objective of industrial policy is job-creation.
Although the manufacturing sector experienced an improvement in TFP growth over the study period, the 0.5 per
cent average increase in TFP growth is evidently not sufficient as output growth is still lurking. The
manufacturing sector has been identified as a key sector of economic growth and employment creation. As such,

7/17/2019 Analysing Total Factor Productivity Growth for South Africa’s Manufacturing Sector
http://slidepdf.com/reader/full/analysing-total-factor-productivity-growth-for-south-africas-manufacturing 15/18
considerable efforts need to be taken by government to implement policies that foster improvements in
productivity. A considerable amount of work still need to be done in the area of productivity analysis, this should
include: (i) research on the level(s) of TFP required to attain the 5-6 per cent GDP growth target set in the NDP;
(ii) the analysis conducted in this paper can be extended to analyse TFP growth in other sectors deemed crucial
for growth and employment creation.

7/17/2019 Analysing Total Factor Productivity Growth for South Africa’s Manufacturing Sector
http://slidepdf.com/reader/full/analysing-total-factor-productivity-growth-for-south-africas-manufacturing 16/18
#$ %&'()*+,
"#$%&'( )*( +,-.'( /*( 0 12332,42( 5* 67889:* ;&<=2>%>%&' -'3 ),&3.?>%@%>A B,&C>$ %' D&.>$ "E,%?-* 2%"+"34%5 "6
7$*+54,4"+ - 1 6FG:( HIFJHG9*
"KL;* 678FM:* 8#,"3",49& 2:;"$, <*+#*=' !"#,> 86$4%* ./0?@ ),2>&,%-N ".>&<&>%@2 K'3.O>,A LP=&,> ;&.'?%Q 6"KL;:*
",&,-( R*( 0 +$.'3%-( "* 6788M:* )&>2'>%-Q S.>=.> -'3 T&>-Q 1-?>&, ),&3.?>%@%>A B,&C>$ %' )&O>J"=-,>$2%3 D&.>$
"E,%?-* A+,&$+*,4"+*= <"+&,*$B C#+D- E"$F4+G H*;&$/?I0JK *
+-Q4( +* /* 6788F:* D?-Q2 LEE%?%2'?A -'3 ),&3.?>%@%>A ;$-'#2* L"#$+*= "6 H$"D#%,494,B 8+*=B545 6FU:( FUVJF9M*
+-,,&( W* 5* 6FVVV:* X&>2O &' B,&C>$ "??&.'>%'#* L"#$+*= "6 2%"+"34% M$"N,> - 1 67:( FFVJFMH*
;$-,'2O( "*( ;&&=2,( Y*( 0 W$&32O( L* 6FVH9:* /2-O.,%'# >$2 LEE%?%2'?A &E Z2?%O%&' /-4%'# ['%>O* 2#$";&*+
L"#$+*= "6 O;&$*,4"+*= P&5&*$%> ( I7VJIII*
;&2Q%( T*( +->>2OO2( B*( S\Z&''2QQ( ;* 5*( 0 W-&( )* Z* 6788U:* 8+ 4+,$"D#%,4"+ ," &664%4&+%B *+D ;$"D#%,494,B *+*=B545
67'3 L3%>%&' 23*:* D=,%'#2, D?%2'?2*
;&2QQ%( T* 6FVVG:* " ;&<=.>2, ),&#,-< E&, D>&?$-O>%? 1,&'>%2, ),&3.?>%&' -'3 ;&O> 1.'?>%&' LO>%<->%&'* Q&+,&$
6"$ 2664%4&+%B *+D H$"D#%,494,B 8+*=B545@ E"$F4+G H*;&$ !&$4&5 R"@ /JI0SST *
;&2QQ%( T* 5* 6788M:* T&>-Q 1-?>&, ),&3.?>%@%>A %' "#,%?.Q>.,2N " /-Q<].%O> K'32P "'-QAO%O &E VM ;&.'>,%2O( FV98J
7888* E"$F4+G H*;&$ !&$4&5 687:*
ZTK* 678FM-:* ./0.I0? A+%&+,49& H&$6"$3*+%&' !&=&%,&D H$"U&%,5- ),2>&,%-N Z2=-,><2'> &E T,-32 -'3 K'3.O>,A*
ZTK* 678FM^:* A+D#5,$4*= H"=4%B 8%,4"+ H=*+' AH8H ./0?I01 V ./0WI0T@ ),2>&,%-N T$2 Z2=-,><2'> &E T,-32 -'3
K'3.O>,A*
ZTK* 678FI:* A+D#5,$4*= H"=4%B 8%,4"+ H=*+' AH8H ./01I0W V ./0TI0J@ ),2>&,%-( D&.>$ "E,%?-N T$2 Z2=-,><2'> &E
T,-32 -'3 K'3.O>,A*
Z. )Q2OO%O( D*( 0 D<%>( +* 6788H:* D&.>$ "E,%?-\O B,&C>$ W2@%@-Q "E>2, FVVI* L"#$+*= "6 86$4%*+ 2%"+"34%5 - 0T 6U:(
GG9JH8I*
1-,2( W*( B,&OO4&=E( /*( X&,,%O( /*( 0 _$-'#( _* 6FVVI:* ),&3.?>%@%>A B,&C>$( T2?$'%?-Q ),&#,2OO-'3 LEE%?%2'?A
;$-'#2O %' K'3.O>,%-Q%O23 ;&.'>,%2O* 83&$4%*+ 2%"+"34% P&94&N 69I:( GGJ9M*

7/17/2019 Analysing Total Factor Productivity Growth for South Africa’s Manufacturing Sector
http://slidepdf.com/reader/full/analysing-total-factor-productivity-growth-for-south-africas-manufacturing 17/18
1-,2( W*( B,&OO4&=E( D*( 0 )-O.,4-( ;* "* 6788F:* "??&.'>%'# E&, -%, =&QQ.>%&' 2<<%O%&'O %' <2-O.,2O &E O>->2
<-'.E-?>.,%'# =,&3.?>%@%>A #,&C>$* L"#$+*= "6 P&G4"+*= !%4&+%& - 10 6M:( M9FJI8V*
12332,42( 5* Y*( 0 +>%?( _* 6788V:* K'E,-O>,.?>.,2 -'3 B,&C>$ %' D&.>$ "E,%?-N Z%,2?> -'3 K'3%,2?> ),&3.?>%@%>A
K<=-?>O &E FV K'E,-O>,.?>.,2 /2-O.,2O* E"$=D X&9&=";3&+, - ?J 6V:( FU77JFUMV*
B,%E2QQJT->`2( L*( 0 a&@2QQ( ;* "* 6FVVU:* " X&>2 &' >$2 /-Q<].%O> ),&3.?>%@%>A K'32P* 2%"+"34% Y&,,&$5 6IH:( FGVJ
FHU*
b.<-,( D*( 0 B.Q->%( W* 67889:* "' L?-<%'->%&' &E T2?$'%?-Q( ).,2 T2?$'%?-Q( -'3 D?-Q2 LEE%?%2'?%2O %' K'3%-' ).^Q%?
D2?>&, +-'4O .O%'# Z->- L'@2Q&=<2'> "'-QAO%O* 2#$*54*+ L"#$+*= "6 Z#54+&55 *+D 2%"+"34%5 - A 67:( MMJGV*
/-$-32@( W* 67887:* " ZL" "==,&-?$ >& ['32,O>-'3%'# >$2 ),&3.?>%@%>A B,&C>$ &E /-Q-AO%-\O /-'.E-?>.,%'#
K'3.O>,%2O* 854* H*%464% L"#$+*= "6 <*+*G&3&+, ( U9HJG88*
/^&'%#-^-( 5*( 0 S.<-,( D* +* 678FI:* T$2 W2Q->%@2 6%':LEE%?%2'?A &E D&.>$ "E,%?-' /.'%?%=-Q%>%2O %' ),&@%3%'#
).^Q%? c2-Q>$ ;-,2* 2%"+"34% P&5&*$%> !"#,>&$+ 86$4%*- E"$F4+G H*;&$ 1J1 *
X->-,-`-'( W* W*( 0 Z.,-%O-<A( /* 67889( 5.'2 G:* LEE%?%2'?A -'3 =,&3.?>%@%>A %' >$2 K'3%-' .'&,#-'%d23
<-'.E-?>.,%'# O2?>&,N 3%3 ,2E&,<O <->>2,e W2>,%2@23 Z2?2<^2, FG( 78FI( E,&<
$>>=Nff3&C'Q&-3*O=,%'#2,*?&<fO>->%?f=3EfH8Hf-,>gM"F8*F88Hg71OF77M7J889J88IGJ
U*=3Ee-.>$GGhFIF9HGV7F9i833^7982GFHFHHE23U?88-UHFIIU?M7202P>h*=3E
X#&%2( b* 5*( 0 b&?$( D* b* 6788U:* ZL" "==Q%23 >& - B-.>2'# D-<=Q2 &E D&.>$ "E,%?-' ).^Q%? c&O=%>-QO*
X&;*$,3&+, "6 2%"+"34%5- [+49&$54,B "6 H$&,"$4* E"$F4+G H*;&$ R".K *
X);* 678FF:* R*,4"+*= X&9&=";3&+, H=*+' \454"+ 6"$ ./?/@ ),2>&,%-N X->%&'-Q )Q-''%'# ;&<<%OO%&'*
W-A( D* ;*( 0 Z2OQ%( L* 6FVVH:* ),&3.?>%@%>A B,&C>$( T2?$'%?-Q ),&#,2OO( -'3 LEE%?%2'?A ;$-'#2 %' K'3.O>,%-Q%d23
;&.'>,%2ON ;&<<2'>* 83&$4%*+ 2%"+"34% P&94&N - W 69H:( F8MMJF8MV*
D2$#-Q( D*( 0 D$-,<-( D* 678FF:* T&>-Q 1-?>&, =,&3.?>%@%>A &E <-'.E-?>.,%'# D2?>&, %' K'3%-N " W2#%&'-Q "'-QAO%O
E&, >$2 D>->2 &E c-,A-'-* 2%"+"34% L"#$+*= "6 X&9&=";3&+, A55#&5 - 0]. 6FM 0 FI:( VHJFF9*
D>->OD"* 678FI:* M$"55 X"3&5,4% H$"D#%,- !,*,45,4%*= P&=&*5&@ D>->%O>%?O D&.>$ "E,%?-*
T,2#2''-( 1* 678FF:* <*+#6*%,#$4+G H$"D#%,494,B- X&4+D#5,$4*=45*,4"+ *+D P&4+D#5,$4*=45*,4"+@ c2QO%'4%( 1%'Q-'3N
[X[JYKZLW*

7/17/2019 Analysing Total Factor Productivity Growth for South Africa’s Manufacturing Sector
http://slidepdf.com/reader/full/analysing-total-factor-productivity-growth-for-south-africas-manufacturing 18/18
_2,2( L* 67887:* c&O=%>-Q LEE%?%2'?A %' D.^JD-$-,-' "E,%?-N L@%32'?2 E,&< D&.>$ "E,%?-* 7>& [+4,&D R*,4"+5
[+49&$54,B- E"$=D A+5,4,#,& 6"$ X&9&=";3&+, 2%"+"34% P&5&*$%>- E"$F4+G H*;&$ R"@0K@
Related Documents