GMDD 7, 1413–1452, 2014 Analysing Amazonian forest productivity N. M. Fyllas et al. Title Page Abstract Introduction Conclusions References Tables Figures Back Close Full Screen / Esc Printer-friendly Version Interactive Discussion Discussion Paper | Discussion Paper | Discussion Paper | Discussion Paper | Geosci. Model Dev. Discuss., 7, 1413–1452, 2014 www.geosci-model-dev-discuss.net/7/1413/2014/ doi:10.5194/gmdd-7-1413-2014 © Author(s) 2014. CC Attribution 3.0 License. Open Access Geoscientific Model Development Discussions This discussion paper is/has been under review for the journal Geoscientific Model Development (GMD). Please refer to the corresponding final paper in GMD if available. Analysing Amazonian forest productivity using a new individual and trait-based model (TFS v.1) N. M. Fyllas 1,* , E. Gloor 1 , L. M. Mercado 2 , S. Sitch 2 , C. A. Quesada 3 , T. F. Domingues 4 , D. R. Galbraith 1 , A. Torre-Lezama 5 , E. Vilanova 5 , H. Ramírez-Angulo 5 , N. Higuchi 3 , D. A. Neill 6 , M. Silveira 7 , L. Ferreira 8 , G. A. Aymard C 9 , Y. Malhi 10 , O. L. Phillips 1 , and J. Lloyd 11,12 1 Ecology and Global Change, School of Geography, University of Leeds, Leeds, UK 2 School of Geography, University of Exeter, Exeter, UK 3 Instituto Nacional de Pesquisas da Amazônia, Manaus, Brazil 4 School of GeoSciences, University of Edinburgh, Edinburgh, Scotland, UK 5 Instituto de Investigaciones para el Desarrollo, Forestal Facultad de Ciencias Forestales y Ambientales, Universidad de Los Andes, Mérida, Venezuela 6 Department of Wildlife Conservation and Management, Universidad Estatal Amazónica, Puyo, Pastaza, Ecuador 7 Universidade Federal do Acre, Rio Branco, Brazil 8 Museu Paraense Emílio Goeldi, Belém, Brazil 1413

Welcome message from author
This document is posted to help you gain knowledge. Please leave a comment to let me know what you think about it! Share it to your friends and learn new things together.
Transcript
GMDD7, 1413–1452, 2014
AnalysingAmazonian forest
productivity
N. M. Fyllas et al.
Title Page
Abstract Introduction
Conclusions References
Tables Figures
J I
J I
Back Close
Full Screen / Esc
Printer-friendly Version
Interactive Discussion
Discussion
Paper
|D
iscussionP
aper|
Discussion
Paper
|D
iscussionP
aper|
Geosci. Model Dev. Discuss., 7, 1413–1452, 2014www.geosci-model-dev-discuss.net/7/1413/2014/doi:10.5194/gmdd-7-1413-2014© Author(s) 2014. CC Attribution 3.0 License.
Open A
ccess
GeoscientificModel Development
Discussions
This discussion paper is/has been under review for the journal Geoscientific ModelDevelopment (GMD). Please refer to the corresponding final paper in GMD if available.
Analysing Amazonian forest productivityusing a new individual and trait-basedmodel (TFS v.1)N. M. Fyllas1,*, E. Gloor1, L. M. Mercado2, S. Sitch2, C. A. Quesada3,T. F. Domingues4, D. R. Galbraith1, A. Torre-Lezama5, E. Vilanova5,H. Ramírez-Angulo5, N. Higuchi3, D. A. Neill6, M. Silveira7, L. Ferreira8,G. A. Aymard C9, Y. Malhi10, O. L. Phillips1, and J. Lloyd11,12
1Ecology and Global Change, School of Geography, University of Leeds, Leeds, UK2School of Geography, University of Exeter, Exeter, UK3Instituto Nacional de Pesquisas da Amazônia, Manaus, Brazil4School of GeoSciences, University of Edinburgh, Edinburgh, Scotland, UK5Instituto de Investigaciones para el Desarrollo, Forestal Facultad de Ciencias Forestales yAmbientales, Universidad de Los Andes, Mérida, Venezuela6Department of Wildlife Conservation and Management, Universidad Estatal Amazónica,Puyo, Pastaza, Ecuador7Universidade Federal do Acre, Rio Branco, Brazil8Museu Paraense Emílio Goeldi, Belém, Brazil
1413
GMDD7, 1413–1452, 2014
AnalysingAmazonian forest
productivity
N. M. Fyllas et al.
Title Page
Abstract Introduction
Conclusions References
Tables Figures
J I
J I
Back Close
Full Screen / Esc
Printer-friendly Version
Interactive Discussion
Discussion
Paper
|D
iscussionP
aper|
Discussion
Paper
|D
iscussionP
aper|
9UNELLEZ (Universidad Nacional Experimental de los Llanos Occidentales Ezekiel Zamora)– Guanare, Programa de Ciencias del Agro y el Mar, Herbario Universitario (PORT),estado Portugesa, Venezuela10Environmental Change Institute, School of Geography and the Environment,University of Oxford, Oxford, UK11Centre for Tropical Environmental and Sustainability Science (TESS) and School of Marineand Tropical Biology, James Cook University, Cairns, Australia12Department of Life Sciences, Imperial College London, Silwood Park Campus, Ascot, UK*now at: Department of Ecology and Systematics, Faculty of Biology,University of Athens, Athens, Greece
Received: 24 January 2014 – Accepted: 4 February 2014 – Published: 20 February 2014
Correspondence to: N. M. Fyllas ([email protected])
Published by Copernicus Publications on behalf of the European Geosciences Union.
1414
GMDD7, 1413–1452, 2014
AnalysingAmazonian forest
productivity
N. M. Fyllas et al.
Title Page
Abstract Introduction
Conclusions References
Tables Figures
J I
J I
Back Close
Full Screen / Esc
Printer-friendly Version
Interactive Discussion
Discussion
Paper
|D
iscussionP
aper|
Discussion
Paper
|D
iscussionP
aper|
Abstract
Repeated long-term censuses have revealed large-scale spatial patterns in AmazonBasin forest structure and dynamism, with some forests in the west of the Basin havingup to a twice as high rate of aboveground biomass production and tree recruitment asforests in the east. Possible causes for this variation could be the climatic and edaphic5
gradients across the Basin and/or the spatial distribution of tree species composition.To help understand causes of this variation a new individual-based model of tropicalforest growth designed to take full advantage of the forest census data available fromthe Amazonian Forest Inventory Network (RAINFOR) has been developed. The modelincorporates variations in tree size distribution, functional traits and soil physical prop-10
erties and runs at the stand level with four functional traits, leaf dry mass per area (Ma),leaf nitrogen (NL) and phosphorus (PL) content and wood density (DW) used to repre-sent a continuum of plant strategies found in tropical forests. We first applied the modelto validate canopy-level water fluxes at three Amazon eddy flux sites. For all three sitesthe canopy-level water fluxes were adequately simulated. We then applied the model at15
seven plots, where intensive measurements of carbon allocation are available. Tree-by-tree multi-annual growth rates generally agreed well with observations for small trees,but with deviations identified for large trees. At the stand-level, simulations at 40 plotswere used to explore the influence of climate and soil fertility on the gross (ΠG) andnet (ΠN) primary production rates as well as the carbon use efficiency (CU). Simulated20
ΠG, ΠN and CU were not associated with temperature. However all three measures ofstand level productivity were positively related to annual precipitation and soil fertility.
1 Introduction
The Amazon Basin encompasses one of the planet’s largest forest areas, hosting onequarter of the Earth’s biodiversity and constitutes a large reservoir of living biomass25
(Malhi and Phillips, 2005). Amazon forests also have a substantial influence on regional
1415
GMDD7, 1413–1452, 2014
AnalysingAmazonian forest
productivity
N. M. Fyllas et al.
Title Page
Abstract Introduction
Conclusions References
Tables Figures
J I
J I
Back Close
Full Screen / Esc
Printer-friendly Version
Interactive Discussion
Discussion
Paper
|D
iscussionP
aper|
Discussion
Paper
|D
iscussionP
aper|
and global climates (Shukla et al., 1990; Spracklen et al., 2012). These forests are,however, under strong human pressure through logging, forest to pasture conversion,and face at present a warming and more variable climate and changing atmosphericcomposition (Lewis et al., 2004; Gloor et al., 2013). Due to the enormous area of forestwithin the Amazon Basin, these factors have the potential to modify global atmospheric5
greenhouse concentrations, regional and global climate, and the overall biodiversity ofthe planet (Cramer et al., 2004).
Traditionally, two approaches have been followed to understand current and futurestate of the Amazon forests. First, Dynamic Global Vegetation Models (DGVM) havebeen used to simulate vegetation patterns and carbon fluxes across Amazonia (Moor-10
croft et al., 2001; Galbraith et al., 2010) with some predicting substantial carbon lossesunder scenarios of global change (White et al., 1999; Cox et al., 2004) but with othersless so (Cramer et al., 2004), or even gains (Huntingford et al., 2013). A second ap-proach to understand Amazonian forests dynamics is through the analysis of long-termfield observations of patterns of tree growth and mortality as they relate to climatic and15
edaphic variations across the Basin (e.g. Phillips et al., 2004; Quesada et al., 2012).Analyses of Amazon forest inventory data, and particularly those of the Amazon For-
est Inventory Network (RAINFOR) (Malhi et al., 2002), have revealed large-scale tem-poral trends in biomass and species composition as well as intriguing spatial patterns inmany stand properties (Phillips et al., 1998, 2009; Baker et al., 2004). Specifically, there20
is systematic spatial variation in species composition, biomass, growth and turnoverrates, with western forests exhibiting higher wood productivity, faster turnover time andlower stand wood density compared to eastern forests (Baker et al., 2004; Malhi et al.,2006). This macroecological variation may possibly be explained by the Basin-wide ob-served climate and soil fertility gradients (Ter Steege et al., 2006; Quesada et al., 2012).25
The climatic gradient comprises a southeast to northwest increase in annual precipi-tation and decrease in dry season length (Sombroek, 2001), with aboveground woodproductivity positively related to precipitation (Malhi et al., 2004). On the other hand,a soil age/fertility axis spans from the northeastern part of the basin to southwestern
1416
GMDD7, 1413–1452, 2014
AnalysingAmazonian forest
productivity
N. M. Fyllas et al.
Title Page
Abstract Introduction
Conclusions References
Tables Figures
J I
J I
Back Close
Full Screen / Esc
Printer-friendly Version
Interactive Discussion
Discussion
Paper
|D
iscussionP
aper|
Discussion
Paper
|D
iscussionP
aper|
Amazonia, with generally younger and richer soils in the west and highly weatherednutrient poor soils in the east (Sombroek, 2000; Quesada et al., 2011), although atregional and local scales the patterns are often more complicated than this macro-gradient might imply (Higgins et al., 2011). Soil physical properties (such as rootingdepth, drainage and water holding capacity and soil structure) are similarly related to5
soil age and parental material (Quesada et al., 2010). Poor physical (for example soildepth) conditions (less weathered soils) are associated with higher soil fertility (Walkerand Syers, 1976; Vitousek and Farrington, 1997) leading to increased nutrient con-centrations at the leaf level (Fyllas et al., 2009) and thus a potential for higher pho-tosynthetic rates (Reich et al., 1994; Raaimakers et al., 1995). In addition, increased10
disturbance-associated mortality rates in soils of poor physical properties appear tolead to more dynamic stands where faster growing species dominate (Chao et al.,2009; Quesada et al., 2012). This could explain the higher aboveground productivityobserved for western forests, through a positive feedback mechanism (Quesada et al.,2012).15
The simplistic ways by which plant functional diversity is currently reflected in DGVMsis an important shortcoming in predicting ecosystem response to environmental gradi-ents and their vulnerability to global change (Lavorel et al., 2007). Some of the widelyapplied DGVMs represent Amazonian plant diversity with only few plant functionaltypes (PFT), for example the LPJ model uses only two tropical-oriented PFTs (Sitch20
et al., 2003) and the JULES model only one (Clark et al., 2011). The mean valuesof key model parameters like photosynthetic capacity, wood density and leaf turnovertimes are selected to describe an a priori PFT definition (Fyllas et al., 2012). Thismeans that many processes are controlled by a set of fixed parameters that describeviable plant strategies within very limited boundaries. Such PFT implementation has25
important drawbacks. It is usually based on the average value of a plant trait recordedfrom different field studies and different species. But recent studies have shown thatkey traits present a wide variation, dependent upon species identity and site growingconditions (Sultan, 2000; Fyllas et al., 2009; Baraloto et al., 2010a). Thus any given
1417
GMDD7, 1413–1452, 2014
AnalysingAmazonian forest
productivity
N. M. Fyllas et al.
Title Page
Abstract Introduction
Conclusions References
Tables Figures
J I
J I
Back Close
Full Screen / Esc
Printer-friendly Version
Interactive Discussion
Discussion
Paper
|D
iscussionP
aper|
Discussion
Paper
|D
iscussionP
aper|
species has the potential to exhibit site-dependent shifts in its trait value, in additionto the interspecific trait variability found at any given site. Ignoring this plasticity couldpotentially bias modelling through an underestimation of the PFT’s resilience by pro-jecting dramatic but artificial switches in vegetation state caused by the limited anddiscrete (step-wise) nature of PFT descriptions.5
Such unaccounted variability could be particularly important when modelling Amazo-nian forest dynamics, where environmental heterogeneity and plant functional diversitycomprise key components of the ecosystem (Townsend et al., 2008). For example, thevariation in leaf mass per area (Ma) recorded within Amazon forests covers an ap-proximately similar range to the one identified in global datasets, ranging from 30 to10
300 gm−2 (Fyllas et al., 2009). Similarly, there is large variation in forest physical andchemical conditions (Quesada et al., 2010). These two important ecosystem compo-nents have now been better quantified with Amazon-wide climate (Malhi and Wright,2004), soil (Quesada et al., 2011) and functional trait datasets having been obtained(Baker et al., 2009; Fyllas et al., 2009; Patiño et al., 2009, 2012). This is in addition15
to continually expanding long-term forest inventory data in which tree growth, mortalityand species composition data are regularly being recorded (Keeling et al., 2008; Chaoet al., 2009).
We here introduce a vegetation dynamics model specifically designed to accountfor these environmental and the biotic variations as a tool to better analyse observed20
Amazonian large-scale patterns. Specifically we focus (a) on the architectural variabil-ity, expressed through the size-class distribution of a stand, and (b) on the functionalvariability, expressed through the distribution of four important functional traits, bothwithin and among forest plots. Following a continuum approach, we replace the use ofa discrete number of PFTs, with distributions of a functional traits “quartet”.25
Two functional dimensions are represented in the model: the leaf economic and thetree architecture spectra. The four functional traits include leaf mass per area (Ma), leafN and P dry mass concentration (NLm and PLm respectively) and wood density (DW).The first three traits express one component of the leaf economic spectrum (Reich
1418
GMDD7, 1413–1452, 2014
AnalysingAmazonian forest
productivity
N. M. Fyllas et al.
Title Page
Abstract Introduction
Conclusions References
Tables Figures
J I
J I
Back Close
Full Screen / Esc
Printer-friendly Version
Interactive Discussion
Discussion
Paper
|D
iscussionP
aper|
Discussion
Paper
|D
iscussionP
aper|
et al., 1997; Wright et al., 2004), i.e. a global photosynthetic tissue trade-off betweeninexpensive, short-lived and fast payback leaves vs. costly, long-lived and slow pay-back leaves; although we emphasise that other factors such as leaf cation concentra-tions may be important in this respect (Fyllas et al., 2012; Patiño et al., 2012). LowMa and high nutrient content leaves are associated with comparably short longevity.5
Co-varying with Ma are usually NLm and PLm, with low Ma leaves usually having highernutrient concentrations and thus supporting higher (mass-based) gas exchange rates(Reich et al., 1994; Raaimakers et al., 1995). Lately the role of PLm has been high-lighted as it expresses alternative limitations of the photosynthetic efficiency of tropicaltree species (Domingues et al., 2010). The fourth trait, DW, is used to represent a tree10
architectural dimension with denser wood species supporting an overall higher above-ground biomass and thus having a higher maintenance respiration (Chave et al., 2005;Mori et al., 2010, although see Larjavaara and Muller-Landau, 2012). These two di-mensions capture essentially a growth vs. survival trade-off. There is mixed evidencefor a coordination between leaf and stem traits, i.e. a correlation between slow return15
related leaf traits and denser wood (Chave et al., 2009), with Baraloto et al. (2010b)suggesting that these two axes are independent, but with Patiño et al. (2012) show-ing some important correlations with foliar traits such as PLm. For the purpose of thisstudy we consider leaf and stem dimensions as independent axes of tree functionalvariation, with no predefined interrelationship between the representative traits. How-20
ever, the observed among-stand variability of these four characters is used to expresshow growing conditions control plant processes while the within-stand trait variationrepresents a range of ecological strategies found under the same growing conditions.
The model is initialised with site-specific tree diameter and functional traits data,and forced with daily climate data. We first test the ability of the model to estimate25
stand-level water fluxes at three eddy-flux tower sites. For a subset of seven RAINFORplots where site-specific carbon allocation coefficients are known, a tree-level test ofstem growth rates is applied. We further validate the ability of the model to simulatethe spatial patterns of aboveground biomass productivity at 40 RAINFOR plots, and
1419
GMDD7, 1413–1452, 2014
AnalysingAmazonian forest
productivity
N. M. Fyllas et al.
Title Page
Abstract Introduction
Conclusions References
Tables Figures
J I
J I
Back Close
Full Screen / Esc
Printer-friendly Version
Interactive Discussion
Discussion
Paper
|D
iscussionP
aper|
Discussion
Paper
|D
iscussionP
aper|
subsequently explore the variation of Gross Primary Productivity (ΠG), Net PrimaryProductivity (ΠN) and Carbon Use Efficiency (CU) along established Amazonian cli-matic and edaphic gradients.
2 Materials and methods
2.1 Model description5
“Traits-based Forest Simulator” (TFS) is an individual-based forest model, i.e. it sim-ulates water and carbon fluxes for each tree in a stand. In the current version of themodel, stand structure is prescribed in terms of the number of trees and their diameterat breast height (d ). In this study a “snapshot” version of the model is used which doesnot take into account tree recruitment and mortality. An individual is fully described10
through d , with allometric equations used to estimate other attributes of interest liketree height (H), crown area (CA), total leaf area (LA) and tree-level leaf area index (L).Whole tree biomass is partitioned to leaf (BL), stem (BS), coarse root (BCR
) and fineroot (BFR) biomass, based on allometric equations. The general architecture of themodel is presented in Fig. 1.15
The functional diversity of the trees in a stand is expressed through four traits (Ma,NLm, PLm, DW) randomly assigned from local observations, using a data-driven randomvector generation algorithm. Leaf photosynthesis is calculated using the Farquhar bio-chemical model (Farquhar et al., 1980) with a modification of the total air-to-chloroplastconductance to be regulated by the soil moisture concentration. Hourly carbon and20
daily water fluxes are estimated for each tree, while light competition is based on theassumption of a perfect canopy tessellation and flat disc-shaped canopies. This sim-ple tree architecture simplifies the way light competition is approximated, by identify-ing canopy and sub-canopy trees based on the tessellation process and tree heightdistribution (Purves et al., 2007). Soil water balance is approximated through a sim-25
ple bucket model, with soil water content and vapour pressure deficit regulating leaf
1420
GMDD7, 1413–1452, 2014
AnalysingAmazonian forest
productivity
N. M. Fyllas et al.
Title Page
Abstract Introduction
Conclusions References
Tables Figures
J I
J I
Back Close
Full Screen / Esc
Printer-friendly Version
Interactive Discussion
Discussion
Paper
|D
iscussionP
aper|
Discussion
Paper
|D
iscussionP
aper|
conductance. Allocation of assimilated carbon to different plant components is static,i.e. it does not change with size or resource availability, but rather implements field-derived allocation coefficients (Aragão et al., 2009).
TFS is coded in Java and it is fully described in Sect. S1. Model components that areparticularly developed for this analysis are presented in the following paragraphs. All5
statistical analyses and graphs were made with R (R Development Core Team, 2013).
2.1.1 Initialisation and within stand functional diversity
As noted above, TFS employs neither species nor PFT descriptions, but rather continuaof the four key functional traits Ma, NLm, PLm and DW used to characterize an individualtree along with a d -based allometry. These functional characters are assigned to indi-10
vidual trees based on observed plot-level data and using a random vector generationalgorithm (Taylor and Thompson, 1986). This algorithm is appropriate for generatingnon-repeated pseudo-observations from a relatively small sample of observations. Inour case, coordinated trait suites for each tree in a stand are generated based ona smaller trait sample from trees in the same stand. This initialisation approach en-15
sures that within stand functional variation and trait covariances are preserved with-out any assumptions having to be made about their underlying statistical distributions.Thus no single functional trait “average stand” value is used. Further, between-standdifferences in the traits distributions and their covariances that may have arisen fromeither the successional status or the growing conditions of the stand are also taken20
into account. This is because each stand is characterised by its own multivariate traitsample and size distribution. More fertile plots have an overall lower Ma and higher NLmand PLm compared to infertile plots (Fyllas et al., 2009), with this being reflected in thephotosynthetic capacity of individual trees, as described in the next paragraph.
1421
GMDD7, 1413–1452, 2014
AnalysingAmazonian forest
productivity
N. M. Fyllas et al.
Title Page
Abstract Introduction
Conclusions References
Tables Figures
J I
J I
Back Close
Full Screen / Esc
Printer-friendly Version
Interactive Discussion
Discussion
Paper
|D
iscussionP
aper|
Discussion
Paper
|D
iscussionP
aper|
2.1.2 Light interception and carbon assimilation
The “flat top” version of the perfect plasticity model (Purves et al., 2007) is used to spec-ify if a tree is at the canopy or sub-canopy level. Radiation absorption is then estimatedby assuming that canopy trees intercept direct, diffuse and scattered radiation, whilesub-canopy trees intercept only diffuse and scattered radiation, in correspondence with5
the sun-shade implementation of the Farquhar model (de Pury and Farquhar, 1997;Wang and Leuning, 1998). A tree-level leaf area index (L), estimated as the ratio of LAto CA, is used to compute the energy, carbon and water fluxes for each tree in a stand.The net photosynthetic rate (µmolm−2 s−1) is given from:
An = gs(Cα −Cc) (1)10
with Cα the atmospheric CO2 mixing ratio (µmolmol−1), Cc the CO2 mixing ratio insidethe chloroplast and gs the CO2 stomatal conductance (molm−2 s−1) calculated fromMedlyn et al. (2011) and modulated by a soil moisture term (see also stomatal conduc-tance paragraph). The leaf-level photosynthetic rate An is scaled-up to the tree-level bymultiplying with the CA of the tree.15
2.1.3 Photosynthesis and respiration
Here we implement the co-limitation equation suggested by Domingues et al. (2010),where the leaf level photosynthetic capacity (area basis) is potentially limited by eithernitrogen or phosphorus concentrations according to:
Vmax =Ma(min{aNV + νNVNLm,aPV + νPVPLm}) (2)20
Jmax =Ma(min{aNJ + νNJNLm,aPJ + νPJPLm}) (3)
both in (µmolm−2 s−1), and aNV, aNJ, aPV, aPJ in (µmolg−1 s−1) and νNV, νNJ, νPV, νPJ in(µmolmg−1 s−1) empirical coefficients (see Sect. S1).
1422
GMDD7, 1413–1452, 2014
AnalysingAmazonian forest
productivity
N. M. Fyllas et al.
Title Page
Abstract Introduction
Conclusions References
Tables Figures
J I
J I
Back Close
Full Screen / Esc
Printer-friendly Version
Interactive Discussion
Discussion
Paper
|D
iscussionP
aper|
Discussion
Paper
|D
iscussionP
aper|
The canopy-level photosynthetic capacity VCmax (µmolm−2 s−1) is estimated usingthe tree-level leaf area index L, taking into account within canopy gradients in lightand photosynthetic capacity based on Lloyd et al. (2010). The modified Farquhar pho-tosynthesis model then computes hourly CO2 assimilation as described in Sect. S1.Nutrient optimisation is approximated using the equation of Lloyd et al. (2010) with Ma5
also dependent on the height of each tree.Tree respiration includes a growth and a maintenance component, both computed
daily. Growth respiration is considered as a constant fraction (0.25) of daily photosyn-thesis (Cannell and Thornley, 2000). Three different maintenance respiration formula-tions are allowed in TFS (Sect. S1), but in this study we use the formulation below. Leaf10
maintenance respiration RmL is estimated as a fraction of VCmax (Scheiter and Higgins,2009):
RmL = 0.015VCmax (4)
Stem maintenance respiration is estimated from the sapwood volume (VS) of a tree:
RmS = δVS (5)15
with δ = 39.6 (µmolm−3 s−1) as reported in Ryan et al. (1994) for tropical trees.Coarse root maintenance respiration RmCR is estimated as in Scheiter and Higgins
(2009):
RmCR = 0.218βRBCR
ΦCN(6)
where ΦCN is the root C : N ratio estimated on the basis of the simulated NR assuming20
a dry weight carbon fraction of 0.5.Fine root maintenance respiration RmFR is assumed to be equal to leaf respiration.All respiratory components are corrected with the temperature dependence function
of Tjoelker et al. (2001). The total maintenance respiration Rm is then:
Rm = RmL +RmS +RmCR +RmFR (7)25
1423
GMDD7, 1413–1452, 2014
AnalysingAmazonian forest
productivity
N. M. Fyllas et al.
Title Page
Abstract Introduction
Conclusions References
Tables Figures
J I
J I
Back Close
Full Screen / Esc
Printer-friendly Version
Interactive Discussion
Discussion
Paper
|D
iscussionP
aper|
Discussion
Paper
|D
iscussionP
aper|
2.1.4 Stomatal conductance
Initially, a maximum (no water stress) stomatal conductance, gs,max is calculated fol-lowing Medlyn et al. (2011, 2012):
gs,max = g0 +1.6 ·(
1+g1√DC
)×An
Ca(8)
with g0 (molm−2 s−1) the minimum stomatal conductance, g1 (–) an empirical co-5
efficient that represents the water use efficiency of the plant, and DC the leaf-to-atmosphere vapour pressure difference. Values of g0 and g1 that lead to the best modelperformance were different between sites, as indicated by the model calibration proce-dure. For the basin-wide simulations constant values of g0 = 0.020 (molm−2 s−1) andg1 = 5.0 (–) were used, close to the estimates of Domingues et al. (2013). In future10
versions of the model, we anticipate that g0 and g1 will be related to other functionaltraits. The maximum stomatal conductance is subsequently reduced to the actual gSby multiplying the second term of Eq. (8) with a water stress coefficient described inthe next paragraph.
2.1.5 Soil water balance and water availability effects on stomatal conductance15
A single-layer soil bucket model is used in the current version of the model to estimatesoil water content and the down-regulation of stomatal opening in case of limited soilwater. We are aware that this is a component that needs further improvement in thefuture but for the purpose of this study which is to explore to first order the basic func-tioning of forest stand carbon uptake and water loss a single-layer soil model should be20
sufficient. In contrast to most ecosystem fluxes model, where photosynthetic rates aredirectly regulated by water availability (Cox et al., 1998; Clark et al., 2011), we couplesoil water deficits to canopy conductances by estimating a daily fractional available soil
1424
GMDD7, 1413–1452, 2014
AnalysingAmazonian forest
productivity
N. M. Fyllas et al.
Title Page
Abstract Introduction
Conclusions References
Tables Figures
J I
J I
Back Close
Full Screen / Esc
Printer-friendly Version
Interactive Discussion
Discussion
Paper
|D
iscussionP
aper|
Discussion
Paper
|D
iscussionP
aper|
water content ϑi , for the i -th tree in the stand given from:
ϑi =Wi −WW
WFC −WW(9)
where Wi the available water for tree i , WFC is the soil water content at field capac-ity (matric potential of 0.033 MPa) and WW is the soil water content at wilting (matricpotential of 1.5 MPa), both estimated using the van Genuchten (1980) model with the5
soil-type specific parameters reported in Hodnett and Tomasella (2002).The estimation of Wi at time t is given from (see Sect. S1 for details):
Wi ,t =Wt−1 + (Pt −Etot,t −Qt)+ZR,i −ZD (10)
Here Wt−1 is the previous day’s (stand level) soil water column, Pt is the daily totalprecipitation, Etot,t the daily total (stand level) evaporation, Qt the run-off, ZR,i is the10
root depth of tree i , and ZD the soil depth all expressed in mm. The rooting depth ofeach tree is estimated in a similar way to Scheiter and Higgins (2009), as the biomassneeded to construct a root cylinder of radius Rr (Rr = 0.15 m) with a density Dr (Dr =100 kgm−3):
ZR =BFR
πDrR2r
(11)15
A tree specific water stress term γi that has a direct effect on stomatal conductance(as a multiplier) is subsequently estimated from:
γi = ϑni (12)
As discussed in Keenan et al. (2010) the exponent in Eq. (12), is a measure of thenon-linearity of the effects of soil water stress on stomatal conductance. The smaller20
the value of n, the less sensitive is canopy conductance to soil water stress. In our casewe found a value of n = 0.25 to give best agreement with observations in regards to theresponse of stomatal conductance to changes in water availability and the long-termsimulation of carbon fluxes.
1425
GMDD7, 1413–1452, 2014
AnalysingAmazonian forest
productivity
N. M. Fyllas et al.
Title Page
Abstract Introduction
Conclusions References
Tables Figures
J I
J I
Back Close
Full Screen / Esc
Printer-friendly Version
Interactive Discussion
Discussion
Paper
|D
iscussionP
aper|
Discussion
Paper
|D
iscussionP
aper|
2.2 Study sites and simulations set-up
Three sets of site data were used to explore the behaviour of the model. These in-clude a set of three eddy flux measurements (EFM) sites, seven plots with intensivecarbon balance and allocation measurements (IM), and 40 permanent measurementplots (PM).5
2.2.1 Eddy flux (EFM) sites
Daily climate and energy flux data from three EFM sites (Caxiuanã [1.72◦ S, 51.46◦ W],Manaus [2.61◦ S, 60.21◦ W] and Tapajós [2.86◦ S, 54.96◦ W]) were used to assess theability of the model to estimate canopy-level water fluxes. Data were obtained fromthe Large Scale Biosphere–Atmosphere Experiment in Amazonia (LBA) project (http:10
//daac.ornl.gov/LBA/lba.shtml). In particular mean daily climate parameters includingincoming radiation, temperature, precipitation, relative humidity and wind speed wereused to force the model. Latent heat flux (λE in Wm−2) was used to estimate a dailymean canopy conductance defined as GC = λE
DC. The EFM data cover a period from
2001 to 2008 for Caxiuanã, from 2000 to 2005 for Manaus and from 2002 to 200415
for Tapajós. GC was only estimated for days with a complete diurnal record of λE .At each one of the EFM sites the mean daily GC (molm−2 s−1) was compared betweenobservations and simulations. The model was initialized with size-class distribution andfunctional traits data from RAINFOR permanent plots located near the eddy flux towers.In particular CAX-06 inventory data were used for Caxiuanã, BNT-04 for Manaus, and20
TAP-55 for Tapajós. We note that the EFM sites are mainly found at the eastern part ofAmazonia (Fig. 2) growing on low fertility soils.
The model was initially calibrated to the site specific values for g0 and g1 of Eq. (8)that gave the best performance. A Standardised Major Axis (SMA) regression, forcedthrough zero was used to verify the ability of the model to simulate GC, with a regression25
slope close to one indicating a good model performance.
1426
GMDD7, 1413–1452, 2014
AnalysingAmazonian forest
productivity
N. M. Fyllas et al.
Title Page
Abstract Introduction
Conclusions References
Tables Figures
J I
J I
Back Close
Full Screen / Esc
Printer-friendly Version
Interactive Discussion
Discussion
Paper
|D
iscussionP
aper|
Discussion
Paper
|D
iscussionP
aper|
2.2.2 Intensive measurement (IM) sites
The ability of the model to realistically simulate carbon fluxes at the tree-level is eval-uated using data from the seven intensive measurement plots (Aragão et al., 2009;Malhi et al., 2009). These sites are amongst the intensively surveyed plots within theRAINFOR network (Fig. 2), where measurements of all major components of the C5
cycle are recorded (Malhi et al., 2009). At these plots, a detailed assessment of thecarbon stocks is applied, and ΠN allocation coefficients to different plant componentsare estimated (Aragão et al., 2009; Malhi et al., 2011; Doughty et al., 2013). These site-specific coefficients are used to calculate the amount of simulated ΠN that is allocatedto stems ΠN,s (kgCyr−1).10
The IM sites of interest include two plots at Agua Pudre in Colombia (AGP-01 andAGP-02), one (ALP-30) at Allpahuayo/Peru, one (BNT-04) at Manaus/Brazil, one inCaxiuanã/Brazil (CAX-06), one in Tambopata/Peru (TAM-05) and one in (TAP-55) Tapa-jós/Brazil. Based on data from Quesada et al. (2011), AGP-01, AGP-02, TAM-05 canbe considered to be located on fertile soils, with the other four plots on infertile ones.15
Available soil depth data (Quesada et al., 2011) and functional traits data (Fyllas et al.,2009) were used for site specific simulations. For all seven sites we estimated the ob-served average multi-annual growth rate (2000–2006) of each tree from forest censusdata, in order to compare it with the simulated ΠN,s.
The daily climate was extracted from the Princeton Global Meteorological Forcing20
Dataset (Sheffield et al., 2006). These simulations are used to validate the ability ofthe model to accurately estimate tree-level stem growth, under a given stand structure,a given climatic and soil profile and functional traits configuration of the establishedtrees. Average observed stem growth rate (per 10 cm d bins), expressed in carbonunits(i.e. kgCyr−1), is compared with simulated ΠN,s using the York method of best25
straight line, which holds when both x and y observations are subject to correlatederrors that vary from point to point (York et al., 2004).
1427
GMDD7, 1413–1452, 2014
AnalysingAmazonian forest
productivity
N. M. Fyllas et al.
Title Page
Abstract Introduction
Conclusions References
Tables Figures
J I
J I
Back Close
Full Screen / Esc
Printer-friendly Version
Interactive Discussion
Discussion
Paper
|D
iscussionP
aper|
Discussion
Paper
|D
iscussionP
aper|
2.2.3 Permanent measurement (PM) sites
Inventory data from 40 RAINFOR permanent measurement plots (Fig. 2), includingtree diameter and multiannual growth for all trees greater than 10 cm curated/managedin ForestPlots.net (Lopez-Gonzalez et al., 2009, 2011), are used to (a) validate theability of the model to accurately simulate stand-level carbon fluxes and (b) explore5
patterns of ΠG, ΠN and CU along the Amazonian climatic and soil fertility gradient. Thesize class distribution within each PM site is used to initialise the stand structure ofthe model and simulate patterns of productivity for the 2000–2006 period. Climate datafor the same period were used here with the first year again used as a spin-up period(Sheffield et al., 2006). For those 40 PM plots, sample distributions of the traits quartet10
are available (Fyllas et al., 2009) as well as a description of soil chemical and physicalproperties (Quesada et al., 2011).
At the PM sites the simulated stand-level aboveground ΠN was compared with ob-served rates of aboveground growth (∆BABG (kgCm−2 yr−1)) for trees that survived dur-ing the 2000–2006 time period using a SMA regression. A second step was to explore15
the way ΠG, ΠN and CU vary across an Amazon climatic and soil fertility gradient (Que-sada et al., 2010). The site scores of a principal components analysis (PCA) on thesoil properties of the 40 PM plots (see Fyllas et al., 2009) are used to categorise plotsalong a fertility gradient (Φ1), while the key climatic variables used were the annualmean temperature TA and annual total precipitation PA. A Kendall correlation coeffi-20
cient (τ) was used to identify potential relationships of ΠG, ΠN and CU with TA, PA andΦ1, as in most cases non-linear associations were observed.
1428
GMDD7, 1413–1452, 2014
AnalysingAmazonian forest
productivity
N. M. Fyllas et al.
Title Page
Abstract Introduction
Conclusions References
Tables Figures
J I
J I
Back Close
Full Screen / Esc
Printer-friendly Version
Interactive Discussion
Discussion
Paper
|D
iscussionP
aper|
Discussion
Paper
|D
iscussionP
aper|
3 Results
3.1 Canopy conductance simulations at the EFM sites
Values of best model performance for g0 and g1 were different between sites, with g0 =0.035 (molm−2 s−1) and g1 = 7.5 at Caxiuanã, g0 = 0.035 and g1 = 7.0 at Manaus withg0 = 0.01 and g1 = 2.5 these being somewhat lower than the estimates of Domingues5
et al. (2013) at Tapajós. Simulated GC was underestimated for Caxiuana (α = 0.85±0.05) and Manaus (α = 0.90±0.02), with the model overestimating GC in Tapajos (α =1.28±0.04), but exhibiting an overall adequate performance (Fig. 3). For simulationsat the IM and the PM sites, constant values of g0 = 0.02 (molm−2 s−1) and g1 = 5 (–)were used, which are found within the range of values in the EFM sites and reported10
estimates (Medlyn et al., 2012; Domingues et al., 2013).
3.2 Stem growth rate simulations at the IM sites
The mean simulated stem growth rate ΠN,s of each tree in the seven IM plots wascompared with the observed aboveground biomass gains (∆BABG) for the 2000–2006period. An accurate simulation of ΠN,s can be seen for small size classes, but with15
greater differences between the observed and the simulated multi-annual growth foundfor bigger trees (Fig. 4). At infertile ALP-30, the estimate slope of the York model in-dicated an overestimation of aboveground production (α = 1.18±0.06), driven mainlyby an overestimation of the mid-size classes. At BNT-04 the model underestimated theoverall growth (α = 0.82±0.03). Aboveground growth was overestimated in CAX-0620
(1.11±0.07). At TAP-55 (α = 1.44±0.15) the model underestimated aboveground pro-duction (0.90±0.06). At fertile AGP-01 (α = 1.36±0.08) and AGP-02 (α = 1.25±0.05)an overestimation of aboveground productivity was observed although with simulationsof most size classes falling within the observed ranges. At TAM-05 (α = 0.79±0.07)though, the simulated aboveground growth was underestimated with the overall slope25
1429
GMDD7, 1413–1452, 2014
AnalysingAmazonian forest
productivity
N. M. Fyllas et al.
Title Page
Abstract Introduction
Conclusions References
Tables Figures
J I
J I
Back Close
Full Screen / Esc
Printer-friendly Version
Interactive Discussion
Discussion
Paper
|D
iscussionP
aper|
Discussion
Paper
|D
iscussionP
aper|
driven by divergences in smaller size classes. The range and distribution of ΠN alloca-tion to stem growth is adequately captured by TFS as summarised in Fig. S2.1.
3.3 GPP, NPP and CUE simulations at the PM sites
Simulated stand-level aboveground net primary productivity ΠN,A was positively asso-ciated with observed changes in aboveground biomass of trees that survived in the PM5
plots over the 2000–2006 period ∆BABG, with an R2 = 0.42, suggesting an adequatemodel behaviour (Fig. 5). A summary of simulated stand-level ΠG, ΠN and CU relation-ships to key environmental drivers is given in Table 1 (see also Fig. S2.2). ΠG and ΠNand CU were not associated with temperature. However all three measures of standlevel productivity were positively related to annual precipitation and soil fertility.10
4 Discussion
We have reported here on the core components of an individual-based model, de-veloped in order to understand the patterns revealed by forest measurements acrossSouth America. In its current setup TFS does not explicitly simulate regeneration andmortality dynamics but rather uses the observed size distribution of trees at the study15
sites. The model is tailored to optimal exploitation of the RAINFOR type forest census,trait, and soil data. TFS is therefore able to take into account the structure of the standand the functional trait variability identified along the main climatic and edaphic axesof the Amazon Basin. With the current setup we were able to reproduce the tree- andstand-level ΠN patterns found across Amazonia and to explore for potential environ-20
mental controls over stand-level ΠG, ΠN and CU.
4.1 Scientific outcomes
Our simulations found no association of stand level gross primary productivity (ΠG)with temperature, probably due to the relatively small range of variation of temperature
1430
GMDD7, 1413–1452, 2014
AnalysingAmazonian forest
productivity
N. M. Fyllas et al.
Title Page
Abstract Introduction
Conclusions References
Tables Figures
J I
J I
Back Close
Full Screen / Esc
Printer-friendly Version
Interactive Discussion
Discussion
Paper
|D
iscussionP
aper|
Discussion
Paper
|D
iscussionP
aper|
across our plots. ΠG decreased until an annual temperature of approximately 26 ◦C butremained relative constant above this point (Table 1, Fig. S2.2). However our simula-tions suggest that a strong association of ΠG with the annual precipitation and soil fer-tility of the plots. ΠG was positively related to annual precipitation over the entire rangeobserved in the 40 PM plots. The association of ΠG with the fertility axis is in agreement5
with fertilisation experiments showing an increase with nutrient supply (Giardina et al.,2003). In our Basin-wide examination of ΠG the soil fertility and stand structure gradi-ents are not however independent (Quesada et al., 2012), as in the RAINFOR networkpermanent plots it has been observed that bigger/older trees are more abundant oneastern infertile forests, where soil physical conditions can support a bigger tree size10
(Baker et al., 2009) with a lower risk of trees being uprooted (Chao et al., 2009). Biggertrees generally support a greater foliage area and thus could significantly contributeto the overall carbon assimilation of the stand. However bigger trees on infertile plotsare generally characterised by lower leaf nutrient concentrations (Fyllas et al., 2009)and thus slower assimilation rates (Reich et al., 1994; Domingues et al., 2010). On15
the other hand a higher abundance of smaller trees with higher gas exchange rates isobserved on more dynamic, fertile plots. Ultimately this indicates that stand structureshould be specifically taken into account when simulating ΠG in tropical forests, andthus individual-based models could significantly contribute towards a deeper under-standing of the functioning and sensitivity of these ecosystems.20
In our simulations stand-level net primary productivity (ΠN) showed no significantassociation to annual temperature but increased with soil fertility and annual precipita-tion (Table 1, Fig. S2.2). Our ΠN simulations are in agreement with field observationsof increasing aboveground wood productivity with precipitation (Quesada et al., 2012).Based on TFS parameterisation, photosynthetic rates are expected to be higher at fer-25
tile soil conditions due to higher leaf N and P concentration there (Fyllas et al., 2009;Domingues et al., 2010). Using a similar parameterisation for a “sun and shade” big leafmodel, Mercado et al. (2011) found an increase in net canopy assimilation rate with leafP content in agreement with our positive association between ΠN and soil fertility. Their
1431
GMDD7, 1413–1452, 2014
AnalysingAmazonian forest
productivity
N. M. Fyllas et al.
Title Page
Abstract Introduction
Conclusions References
Tables Figures
J I
J I
Back Close
Full Screen / Esc
Printer-friendly Version
Interactive Discussion
Discussion
Paper
|D
iscussionP
aper|
Discussion
Paper
|D
iscussionP
aper|
simulated ΠG accounted for approximately 0.30 of the observed wood productivity in33 study plots, and thus the R2 = 0.42 between simulated ΠN and aboveground growthfound here suggest a marginally improved model behaviour. It should be noted thatour definition of soil fertility (Φ1), based on the PCA analysis in Quesada et al. (2010),directly relates to soil P content. As shown first in the analysis of Quesada et al. (2012),5
where data from almost 60 plots were considered, aboveground ΠN is positively relatedto soil P content in lowland tropical forest. The increased ΠN in fertile environments(apart from the higher ΠG) seems to be enhanced by the greater abundance of smalltrees there. As tree size increases maintenance respiration “consumes” an increas-ing proportion of assimilated carbon, and thus at large size classes the proportion of10
trees which have enough carbon to allocate to growth decreases (Givnish, 1988; Cav-aleri et al., 2008). This is in line with the negative relationship between coarse woodproduction and maximum height documented for some Amazonian trees (Baker et al.,2009).
In our simulations carbon use efficiency (CU) ranged from 0.43 to 0.54. Recent15
research suggests that the CU is not as constant as was previously assumed (DeLucia et al., 2007; Zhang et al., 2009). For example the meta-analysis of De Luciaet al. (2007) found that CU varies from 0.23 to 0.83 in different forest types. Our av-erage estimate of CU = 0.51 is, however, above the range of reported in Malhi (2012).Zhang and colleagues (2009) identified a negative trend of the ΠN/ΠG ratio with tem-20
perature at the range of 20 to 30 ◦C, as also simulated here especially above 26 ◦C(Fig. S2.2). Simulated CU increased with soil fertility, being marginally lower at infertile(0.48) compared to fertile (0.50) plots. This is attributable to smaller size class trees(with lower relative respiratory costs) constituting a greater proportion of the total standbiomass on the more fertile soils. One factor relating to soil fertility but not included25
in the current version is an implicit consideration of the costs of plant nutrient uptake(Lambers et al., 1983) either directly, or through other processes such as organic acidexudation (Jones et al., 2009) or the symbiotic associations (Duponnois et al., 2012).
1432
GMDD7, 1413–1452, 2014
AnalysingAmazonian forest
productivity
N. M. Fyllas et al.
Title Page
Abstract Introduction
Conclusions References
Tables Figures
J I
J I
Back Close
Full Screen / Esc
Printer-friendly Version
Interactive Discussion
Discussion
Paper
|D
iscussionP
aper|
Discussion
Paper
|D
iscussionP
aper|
One would expect these costs to be proportionally higher for stand of a low nutrientstatus, especially with regard to P (Quesada et al., 2012).
4.2 Practical implications
Modelling of tropical forests dynamics had traditionally aimed at a balance betweensimplicity, computational economy, and complexity. The enormous biological and bio-5
geochemical heterogeneity of tropical forests (Townsend et al., 2008) places specialimportance on how modellers prioritise both the amount and the detail of processesthat should be included to capture the main controls and feedbacks. On the other handthe finding that Amazonia is dominated by just 227 tree species (ter Steege et al., 2013)implies that most biogeochemical cycling in the world’s largest tropical forest is per-10
formed by a tiny sliver of its diversity. Various types of tropical forest models have beenpublished during the last decades. At the landscape level some approaches focus onrealistically representing the light environment (Chave, 1999), while others emphasiseon accurately grouping tree species and their response to environmental resourcesusing field observations (Huth and Ditzer, 2000; Gourlet-Fleury and Houllier, 2000).15
At the continental scale one of the greatest uncertainties in the application of DGVMsarises from the way population dynamics are modelled (Delbart et al., 2010; Poulteret al., 2010). To deal with demographic processes not explicitly taken into account inDGVMs, Fisher et al. (2010) applied the ecosystem demography model after definingseven plant functional types characterised by strategies along a growth vs. survival di-20
mension. Interestingly, by varying five parameters related to demographic processes,forest and biomass dynamics exhibited a wide range of responses to climate forcing.
Our study has aimed to balance the goal of model generality with that of model sim-plicity, and to draw on important recent lessons from field studies of the processescontrolling Amazonian forest dynamics. We thus focus on accounting for the diver-25
sity in key functional traits, stand-structure, and their association with soil physical andchemical properties (Fyllas et al., 2009). Two modelling studies that follow a partly sim-ilar philosophy have recently been published. Scheiter and Higgins (2009) developed
1433
GMDD7, 1413–1452, 2014
AnalysingAmazonian forest
productivity
N. M. Fyllas et al.
Title Page
Abstract Introduction
Conclusions References
Tables Figures
J I
J I
Back Close
Full Screen / Esc
Printer-friendly Version
Interactive Discussion
Discussion
Paper
|D
iscussionP
aper|
Discussion
Paper
|D
iscussionP
aper|
an individual-based DGVM where they also eschewed the functional group approach,but rather allowed for plants to allocate carbon as a function of the local environmentalconditions. Falster and colleagues (2011) presented a trait-based modelling frameworkwhere they used leaf economic strategy, height, wood density and seed size to scale-upfrom individual scale processes to landscape predictions. Our approach nevertheless5
differs from these in the quantity of observational constraints used as we have endeav-oured to constrain the simulations as much as possible with observational data in orderto be able to explore the large-scale forest patterns revealed by the permanent plotsmeasurement network.
Like all modelling efforts, TFS represents work in progress. We identify three partic-10
ularly promising avenues for future improvements. Firstly, discrepancies between theobserved and simulated stem level growth rates, particularly in larger size classes,could result from the allometric equations used to estimate aboveground biomass andgrowth not being species or size specific. The allometric equations used here expressa generic height (H) vs. d relationship for Amazonia, without taking into account habi-15
tat and species differences, so a more accurate representation of tree architecturewould probably result in better biomass growth estimation. Indeed, H–d relationshipsdo vary significantly among species (King, 1996; Poorter et al., 2006) and across re-gions (Nogueira et al., 2008; Feldpausch et al., 2011; Goodman et al., 2013). An ad-ditional source of bias when estimating stem-level growth rates could be related to the20
uniform (static) allocation coefficient used in this study. For example, Litton et al. (2007)showed that allocation to aboveground tree biomass components increases with ageand the availability of resources. Furthermore Castanho et al. (2013) improved thepredictions of a DGVM by adjusting allocation coefficients based on soil texture. Suchontogenetic and/or resource based shifts in patterns of carbon allocation could be po-25
tentially modelled through the use of dynamic allocation schemes (Friedlingstein et al.,1999; Franklin et al., 2012).
The importance of realistically representing autotrophic respiration processes inmodels of vegetation dynamics is also highlighted here. Modelling respiration has
1434
GMDD7, 1413–1452, 2014
AnalysingAmazonian forest
productivity
N. M. Fyllas et al.
Title Page
Abstract Introduction
Conclusions References
Tables Figures
J I
J I
Back Close
Full Screen / Esc
Printer-friendly Version
Interactive Discussion
Discussion
Paper
|D
iscussionP
aper|
Discussion
Paper
|D
iscussionP
aper|
proven to be a difficult task (Cannell and Thornley, 2000), and accurately represen-tations of this component is of great importance for understanding the global C cy-cle (Valentini et al., 2000). For example the way respiration is represented in DGVMscould have a substantial control over the way the dynamics of Amazonian forest underscenarios of climatic change are simulated (Huntingford et al., 2004; Galbraith et al.,5
2010). Nitrogen content of plant tissue has been proven a good predictor of respirationrates (Reich et al., 2008). However Mori et al. (2010) suggested a mixed-power equa-tion where the exponent varies from 1 to 3/4 as size increases. Both the Reich andMori models are implemented in TFS, but we found that a third method, combining thesize and nitrogen control, performed better. Thus we suggest that an amalgamation of10
those two approaches could provide a better way to estimate respiration fluxes in thenew generation of dynamic vegetation models. In addition leaf phosphorous contentseems to constrain respiration rates stronger than nitrogen content in some tropicalforests (Meir et al., 2001; Meir and Grace, 2002), and thus inclusion of this term infuture equations of leaf respiration could increase their realism.15
Finally, discrepancies in the observed vs. the simulated canopy conductance GCcould result from the parameterisation of the stomata conductance model of Medlynet al. (2011). The estimates for g0 and g1 used in the 40 PM plots simulations weretaken as constant. However Medlyn et al. (2011) suggested that g0 and g1 could varywith functional group. Thus the Amazon wide parameterisation used here should be20
replaced with local level estimates when appropriate gas exchange data are available,and ultimately with estimates based on linked functional traits as evidenced throughrecently documented associations between structural characteristics such as wooddensity and leaf area: sapwood ration with leaf physiological traits such as Ma andleaf 13C/13C ratio (Patino et al., 2012), although we also note that the extent of such25
structural/physiological linkages remains the subject of debate (Baraloto et al., 2010b).Alternative stomatal closure equations as a function of soil water availability (Harriset al., 2004) should also be tested along with the conductance model in future versionsof the model.
1435
GMDD7, 1413–1452, 2014
AnalysingAmazonian forest
productivity
N. M. Fyllas et al.
Title Page
Abstract Introduction
Conclusions References
Tables Figures
J I
J I
Back Close
Full Screen / Esc
Printer-friendly Version
Interactive Discussion
Discussion
Paper
|D
iscussionP
aper|
Discussion
Paper
|D
iscussionP
aper|
5 Conclusions
We set out to develop a modelling framework for tropical forests that is relatively simpleyet adequately complex to capture the main ecological gradients in the world’s mostextensive tropical forest. Our study places special emphasis on processes highlightedby recent field studies to strongly influence Amazonian forest dynamics, such as func-5
tional trait diversity and its association with multiple soil properties (Fyllas et al., 2009).In summary TFS is characterised by a relatively simple setup, which is capable to repro-duce water and carbon fluxes as observed at both daily and multi-annual time scales.TFS represents an important link between inventory data, and large scale models withthe incorporation of the continuum of plant strategies, through the inclusion of trait dis-10
tributions providing a step towards better representing diversity in vegetation modelling(Lavorel et al., 2009), representing important processes and trait variation that can-not be adequately accounted for by a DGVM approach to vegetation modelling. SinceTFS is based heavily on measured data, the model is well suited to testing hypothesesrelated to the present day Amazon biogeography and biogeochemical fluxes.15
Code availability.
The JAVA source code can be obtained upon request. Contact: [email protected].
Supplementary material related to this article is available online athttp://www.geosci-model-dev-discuss.net/7/1413/2014/gmdd-7-1413-2014-supplement.pdf.20
Acknowledgements. This research was supported by a Marie Curie Intra-European Fellowshipwithin the 7th European Community Framework Programme to NM Fyllas. Manuel Gloor andLina Mercado were funded by the AMAZONICA NERC consortium grant. OP is supported byan ERC Advanced Grant and a Royal Society Wolfson Research Merit Award. The work of
1436
GMDD7, 1413–1452, 2014
AnalysingAmazonian forest
productivity
N. M. Fyllas et al.
Title Page
Abstract Introduction
Conclusions References
Tables Figures
J I
J I
Back Close
Full Screen / Esc
Printer-friendly Version
Interactive Discussion
Discussion
Paper
|D
iscussionP
aper|
Discussion
Paper
|D
iscussionP
aper|
RAINFOR between 2000 and 2006 was supported primarily by the UK Natural EnvironmentResearch Council and the European Community Framework Programme through grants to OP,YM, and JL. Natalia Restrepo Coupe provided the gap filled Eddy Flux Tower data. GabrielaLopez-Gonzalez and Sophie Fauset helped with data preparation. The Missouri Botanical Gar-den, Rodolfo Vasquez, Abel Monteagudo, Nigel Pitman, Adriana Prieto, Agustin Rudas, Natal-5
ino Silva, Chiqui Arroyo and Alejandro Araujo Murakami contributed permanent plot data to theRAINFOR network.
References
Aragão, L. E. O. C., Malhi, Y., Metcalfe, D. B., Silva-Espejo, J. E., Jiménez, E., Navarrete, D.,Almeida, S., Costa, A. C. L., Salinas, N., Phillips, O. L., Anderson, L. O., Alvarez, E.,10
Baker, T. R., Goncalvez, P. H., Huamán-Ovalle, J., Mamani-Solórzano, M., Meir, P., Mon-teagudo, A., Patiño, S., Peñuela, M. C., Prieto, A., Quesada, C. A., Rozas-Dávila, A.,Rudas, A., Silva Jr., J. A., and Vásquez, R.: Above- and below-ground net primary pro-ductivity across ten Amazonian forests on contrasting soils, Biogeosciences, 6, 2759–2778,doi:10.5194/bg-6-2759-2009, 2009.15
Baker, T. R., Phillips, O. L., Malhi, Y., Almeida, S., Arroyo, L., Di Fiore, A., Erwin, T., Higuchi, N.,Killeen, T. J., and Laurance, S. G.: Increasing biomass in Amazonian forest plots, Philos. T.Roy. Soc. B, 359, 353–365, 2004.
Baker, T. R., Phillips, O. L., Laurance, W. F., Pitman, N. C. A., Almeida, S., Arroyo, L., DiFiore, A.,Erwin, T., Higuchi, N., Killeen, T. J., Laurance, S. G., Nascimento, H., Monteagudo, A.,20
Neill, D. A., Silva, J. N. M., Malhi, Y., López Gonzalez, G., Peacock, J., Quesada, C. A.,Lewis, S. L., and Lloyd, J.: Do species traits determine patterns of wood production in Ama-zonian forests?, Biogeosciences, 6, 297–307, doi:10.5194/bg-6-297-2009, 2009.
Baraloto, C., Timothy Paine, C. E., Patino, S., Bonal, D., Herault, B., and Chave, J.: Functionaltrait variation and sampling strategies in species-rich plant communities, Funct. Ecol. 24,25
208–216, 2010a.Baraloto, C., Timothy Paine, C. E., Poorter, L., Beauchene, J., Bonal, D., Domenach, A.-M.,
Hérault, B., Patiño, S., Roggy, J.-C., and Chave, J.: Decoupled leaf and stem economics inrain forest trees, Ecol. Lett., 13, 1338–1347, 2010b.
1437
GMDD7, 1413–1452, 2014
AnalysingAmazonian forest
productivity
N. M. Fyllas et al.
Title Page
Abstract Introduction
Conclusions References
Tables Figures
J I
J I
Back Close
Full Screen / Esc
Printer-friendly Version
Interactive Discussion
Discussion
Paper
|D
iscussionP
aper|
Discussion
Paper
|D
iscussionP
aper|
Cannell, M. G. R. and Thornley, J. H. M.: Modelling the components of plant respiration: someguiding principles, Ann. Bot.-London, 85, 45–54, 2000.
Cavaleri, M. A., Oberbauer, S. F., and Ryan, M. G.: Foliar and ecosystem respiration in anold-growth tropical rain forest, Plant Cell Environ., 31, 473–483, 2008.
Chao, K.-J., Phillips, O. L., Monteagudo, A., Torres-Lezama, A., and Vásquez Martínez, R.:5
How do trees die? Mode of death in northern Amazonia, J. Veg. Sci., 20, 260–268, 2009.Chave, J.: Study of structural, successional and spatial patterns in tropical rain forests using
TROLL, a spatially explicit forest model, Ecol. Model., 124, 233–254, 1999.Chave, J., Andalo, C., Brown, S., Cairns, M. A., Chambers, J. Q., Eamus, D., Fölster, H., Fro-
mard, F., Higuchi, N., and Kira, T.: Tree allometry and improved estimation of carbon stocks10
and balance in tropical forests, Oecologia, 145, 87–99, 2005.Chave, J., Coomes, D., Jansen, S., Lewis, S. L., Swenson, N. G., and Zanne, A. E.: Towards
a worldwide wood economics spectrum, Ecol. Lett., 12, 351–366, 2009.Clark, D. B., Mercado, L. M., Sitch, S., Jones, C. D., Gedney, N., Best, M. J., Pryor, M.,
Rooney, G. G., Essery, R. L. H., Blyth, E., Boucher, O., Harding, R. J., Huntingford, C., and15
Cox, P. M.: The Joint UK Land Environment Simulator (JULES), model description – Part 2:Carbon fluxes and vegetation dynamics, Geosci. Model Dev., 4, 701–722, doi:10.5194/gmd-4-701-2011, 2011.
Cox, P. M., Betts, R. A., Collins, M., Harris, P. P., Huntingford, C., and Jones, C. D.: Amazo-nian forest dieback under climate-carbon cycle projections for the 21st century, Theor. Appl.20
Climatol., 78, 137–156, 2004.Cramer, W., Bondeau, A., Schaphoff, S., Lucht, W., Smith, B., and Sitch, S.: Tropical forests and
the global carbon cycle: impacts of atmospheric carbon dioxide, climate change and rate ofdeforestation, Philos. T. R. Soc. B, 359, 331–343, 2004.
Delbart, N., Ciais, P., Chave, J., Viovy, N., Malhi, Y., and Le Toan, T.: Mortality as a key driver of25
the spatial distribution of aboveground biomass in Amazonian forest: results from a dynamicvegetation model, Biogeosciences, 7, 3027–3039, doi:10.5194/bg-7-3027-2010, 2010.
DeLucia, E., Drake, J. E., Thomas, R. B., and Gonzalez-Meller, M.: Forest carbon use efficiency:is respiration a constant fraction of gross primary production?, Glob. Change Biol., 13, 1157–1167, 2007.30
Domingues, T. F., Meir, P., Feldpausch, T. R., Saiz, G., Veenendaal, E. M., Schrodt, F., Bird, M.,Djagbletey, G., Hien, F., and Compaore, H.: Co-limitation of photosynthetic capacity by nitro-gen and phosphorus in West Africa woodlands, Plant Cell Environ., 33, 959–980, 2010.
1438
GMDD7, 1413–1452, 2014
AnalysingAmazonian forest
productivity
N. M. Fyllas et al.
Title Page
Abstract Introduction
Conclusions References
Tables Figures
J I
J I
Back Close
Full Screen / Esc
Printer-friendly Version
Interactive Discussion
Discussion
Paper
|D
iscussionP
aper|
Discussion
Paper
|D
iscussionP
aper|
Domingues, T. F., Martinelli, L. A., and Ehleringer, J. R.: Seasonal patterns of leaf-level photo-synthetic gas exchange in an eastern Amazonian rain forest, Plant Ecol. Div., 7, 189–203,2013.
Duponnois, R., Baudoin, E., Thioulouse, J., Hafidi, M., Galiana, A., Lebrun, M., and Prin, Y.:The impact of mycorrhizosphere bacterial communities on soil biofunctioning in tropical and5
mediterranean forest ecosystems, in: Bacteria in Agrobiology: Plant Probiotics, edited by:Maheshwari, D. K., Springer, Berlin Heidelberg, 79–95, 2012.
Falster, D. S., Brännström, Å., Dieckmann, U., and Westoby, M.: Influence of four major planttraits on average height, leaf-area cover, net primary productivity, and biomass density insingle-species forests: a theoretical investigation, J. Ecol., 99, 148–164, 2011.10
Farquhar, G. D., von Caemmerer, S., and Berry, J. A.: A biochemical model of photosyntheticCO2 assimilation in leaves of C3 species, Planta, 149, 78–90, 1980.
Feldpausch, T. R., Banin, L., Phillips, O. L., Baker, T. R., Lewis, S. L., Quesada, C. A., Affum-Baffoe, K., Arets, E. J. M. M., Berry, N. J., Bird, M., Brondizio, E. S., de Camargo, P.,Chave, J., Djagbletey, G., Domingues, T. F., Drescher, M., Fearnside, P. M., França, M. B.,15
Fyllas, N. M., Lopez-Gonzalez, G., Hladik, A., Higuchi, N., Hunter, M. O., Iida, Y., Salim, K. A.,Kassim, A. R., Keller, M., Kemp, J., King, D. A., Lovett, J. C., Marimon, B. S., Marimon-Junior, B. H., Lenza, E., Marshall, A. R., Metcalfe, D. J., Mitchard, E. T. A., Moran, E. F., Nel-son, B. W., Nilus, R., Nogueira, E. M., Palace, M., Patiño, S., Peh, K. S.-H., Raventos, M. T.,Reitsma, J. M., Saiz, G., Schrodt, F., Sonké, B., Taedoumg, H. E., Tan, S., White, L., Wöll, H.,20
and Lloyd, J.: Height-diameter allometry of tropical forest trees, Biogeosciences, 8, 1081–1106, doi:10.5194/bg-8-1081-2011, 2011.
Fisher, R., McDowell, N., Purves, D., Moorcroft, P., Sitch, S., Cox, P., Huntingford, C., Meir, P.,and Ian Woodward, F.: Assessing uncertainties in a second-generation dynamic vegetationmodel caused by ecological scale limitations, New Phytol., 187, 666–681, 2010.25
Franklin, O., Johansson, J., Dewar, R. C., Dieckmann, U., McMurtrie, R. E., Brännström, Å.,and Dybzinski, R.: Modeling carbon allocation in trees: a search for principles, Tree Physiol.,32, 648–666, 2012.
Fyllas, N. M., Patiño, S., Baker, T. R., Bielefeld Nardoto, G., Martinelli, L. A., Quesada, C. A.,Paiva, R., Schwarz, M., Horna, V., Mercado, L. M., Santos, A., Arroyo, L., Jiménez, E. M.,30
Luizão, F. J., Neill, D. A., Silva, N., Prieto, A., Rudas, A., Silviera, M., Vieira, I. C. G., Lopez-Gonzalez, G., Malhi, Y., Phillips, O. L., and Lloyd, J.: Basin-wide variations in foliar prop-
1439
GMDD7, 1413–1452, 2014
AnalysingAmazonian forest
productivity
N. M. Fyllas et al.
Title Page
Abstract Introduction
Conclusions References
Tables Figures
J I
J I
Back Close
Full Screen / Esc
Printer-friendly Version
Interactive Discussion
Discussion
Paper
|D
iscussionP
aper|
Discussion
Paper
|D
iscussionP
aper|
erties of Amazonian forest: phylogeny, soils and climate, Biogeosciences, 6, 2677–2708,doi:10.5194/bg-6-2677-2009, 2009.
Fyllas, N. M., Quesada, C. A., and Lloyd, J.: Deriving plant functional types for Amazonianforests for use in vegetation dynamics models, Perspect. Plant Ecol., 14, 97–110, 2012.
Galbraith, D., Levy, P. E., Sitch, S., Huntingford, C., Cox, P., Williams, M., and Meir, P.: Multiple5
mechanisms of Amazonian forest biomass losses in three dynamic global vegetation modelsunder climate change, New Phytol., 187, 647–665, 2010.
Giardina, C. P., Ryan, M. G., Binkley, D., and Fownes, J. H.: Primary production and carbonallocation in relation to nutrient supply in a tropical experimental forest, Glob. Change Biol.,9, 1438–1450, 2003.10
Gloor, M., Brienen, R. J. W., Galbraith, D., Feldpausch, T. R., Schöngart, J., Guyot, J.-L., Es-pinoza, J. C., Lloyd, J., and Phillips, O. L.: Intensification of the Amazon hydrological cycleover the last two decades, Geophys. Res. Lett., 40, 1729–1733, 2013.
Goodman, R. C., Phillips, O. L., and Baker, T. R.: The importance of crown dimensions to im-prove tropical tree biomass estimates, Ecol. Appl., online first, doi:10.1890/13-0070.1, 2013.15
Gourlet-Fleury, S. and Houllier, F.: Modelling diameter increment in a lowland evergreen rainforest in French Guiana, Forest Ecol. Manag., 131, 269–289, 2000.
Gower, S. T., McMurtrie, R. E., and Murty, D.: Aboveground net primary production decline withstand age: potential causes, Trends Ecol. Evol., 11, 378–382, 1996.
Harris, P. P., Huntingford, C., Cox, P. M., Gash, J. H., and Malhi, Y.: Effect of soil moisture on20
canopy conductance of Amazonian rainforest, Agr. Forest Meteorol., 122, 215–227, 2004.Higgins, M. A., Ruokolainen, K., Tuomisto, H., Llerena, N., Cardenas, G., Phillips, O. L.,
Vásquez, R., and Räsänen, M.: Geological control of floristic composition in Amazonianforests, J. Biogeogr., 38, 2136–2149, 2011.
Hodnett, M. G. and Tomasella, J.: Marked differences between van Genuchten soil water-25
retention parameters for temperate and tropical soils: a new water-retention pedo-transferfunctions developed for tropical soils, Geoderma, 108, 155–180, 2002.
Huntingford, C., Harris, P. P., Gedney, N., Cox, P. M., Betts, R. A., Marengo, J. A., andGash, J. H. C.: Using a GCM analogue model to investigate the potential for Amazonianforest dieback, Theor. Appl. Climatol., 78, 177–185, 2004.30
Huntingford, C., Zelazowski, P., Galbraith, D., Mercado, L. M., Sitch, S., Fisher, R., Lomas, M.,Walker, A. P., Jones, C. D., Booth, B. B. B., Malhi, Y., Hemming, D., Kay, G., Good, P.,Lewis, S. L., Phillips, O. L., Atkin, O. K., Lloyd, J., Gloor, E., Zaragoza-Castells, J., Meir, P.,
1440
GMDD7, 1413–1452, 2014
AnalysingAmazonian forest
productivity
N. M. Fyllas et al.
Title Page
Abstract Introduction
Conclusions References
Tables Figures
J I
J I
Back Close
Full Screen / Esc
Printer-friendly Version
Interactive Discussion
Discussion
Paper
|D
iscussionP
aper|
Discussion
Paper
|D
iscussionP
aper|
Betts, R., Harris, P. P., Nobre, C., Marengo, J., and Cox, P. M.: Simulated resilience of tropicalrainforests to CO2-induced climate change, Nat. Geosci., 6, 268–273, 2013.
Huth, A. and Ditzer, T.: Simulation of the growth of a lowland Dipterocarp rain forest withFORMIX3, Ecol. Model., 134, 1–25, 2000.
Jones, D. L., Nguyen, C., and Finlay, R. D.: Carbon flow in the rhizosphere: carbon trading at5
the soil–root interface, Plant Soil, 321, 5–33, 2009.Keeling, H. C., Baker, T. R., Martinez, R. V., Monteagudo, A., and Phillips, O. L.: Contrasting
patterns of diameter and biomass increment across tree functional groups in Amazonianforests, Oecologia, 158, 521–534, 2008.
King, D. A.: Allometry and life history of tropical trees, J. Trop. Ecol., 12, 25–44, 1996.10
Larjavaara, M. and Muller-Landau, H. C.: Still rethinking the value of high wood density, Am. J.Bot., 99, 165–168, 2012.
Lavorel, S., Díaz, S., Cornelissen, J. H. C., Garnier, E., Harrison, S. P., McIntyre, S.,Pausas, J. G., Pérez-Harguindeguy, N., Roumet, C., and Urcelay, C.: Plant functional types:are we getting any closer to the Holy Grail?, in: Terrestrial Ecosystems in a Changing World,15
Springer, 149–164, 2007.Lewis, S. L., Phillips, O. L., Baker, T. R., Lloyd, J., Malhi, Y., Almeida, S., Higuchi, N., Lau-
rance, W. F., Neill, D. A., and Silva, J. N. M.: Concerted changes in tropical forest structureand dynamics: evidence from 50 South American long-term plots, Philos. T. R. Soc. B, 359,421–436, 2004.20
Litton, C. M., Raich, J. W., and Ryan, M. G.: Carbon allocation in forest ecosystems, Glob.Change Biol., 13, 2089–2109, 2007.
Lloyd, J., Patiño, S., Paiva, R. Q., Nardoto, G. B., Quesada, C. A., Santos, A. J. B., Baker, T. R.,Brand, W. A., Hilke, I., Gielmann, H., Raessler, M., Luizão, F. J., Martinelli, L. A., and Mer-cado, L. M.: Optimisation of photosynthetic carbon gain and within-canopy gradients of asso-25
ciated foliar traits for Amazon forest trees, Biogeosciences, 7, 1833–1859, doi:10.5194/bg-7-1833-2010, 2010.
Lopez-Gonzalez, G., Lewis, S. L., Burkitt, M., and Phillips, O. L.: ForestPlots.net: a web appli-cation and research tool to manage and analyse tropical forest plot data, J. Veg. Sci., 22,610–613, 2011.30
Lopez-Gonzalez, G., Lewis, S. L., Burkitt, M., Baker, T. R., and Phillips, O. L.: ForestPlots.netDatabase, available at: www.forestplots.net (last access: 10 September 2013), 2013.
1441
GMDD7, 1413–1452, 2014
AnalysingAmazonian forest
productivity
N. M. Fyllas et al.
Title Page
Abstract Introduction
Conclusions References
Tables Figures
J I
J I
Back Close
Full Screen / Esc
Printer-friendly Version
Interactive Discussion
Discussion
Paper
|D
iscussionP
aper|
Discussion
Paper
|D
iscussionP
aper|
Malhi, Y.: The carbon balance of tropical forest regions, 1990–2005, Current Opinion in Envi-ronmental Sustainability, 2, 237–244, 2010.
Malhi, Y.: The productivity, metabolism and carbon cycle of tropical forest vegetation, J. Ecol.,100, 65–75, 2012.
Malhi, Y. and Wright, J.: Spatial patterns and recent trends in the climate of tropical rainforest5
regions, Philos. T. R. Soc. B, 359, 311–329, 2004.Malhi, Y., Phillips, O. L., Lloyd, J., Baker, T., Wright, J., Almeida, S., Arroyo, L., Frederiksen, T.,
Grace, J., and Higuchi, N.: An international network to monitor the structure, compositionand dynamics of Amazonian forests (RAINFOR), J. Veg. Sci., 13, 439–450, 2002.
Malhi, Y., Wood, D., Baker, T. R., Wright, J., Phillips, O. L., Cochrane, T., Meir, P., Chave, J.,10
Almeida, S., and Arroyo, L.: The regional variation of aboveground live biomass in old-growthAmazonian forests, Glob. Change Biol., 12, 1107–1138, 2006.
Malhi, Y., Doughty, C., and Galbraith, D.: The allocation of ecosystem net primary productivityin tropical forests, Philos. T. R. Soc. B, 366, 3225–3245, 2011.
Medlyn, B. E., Duursma, R. A., Eamus, D., Ellsworth, D. S., Prentice, I. C., Barton, C. V.,15
Crous, K. Y., de Angelis, P., Freeman, M., and Wingate, L.: Reconciling the optimal and em-pirical approaches to modelling stomatal conductance, Glob. Change Biol., 17, 2134–2144,2011.
Medlyn, B. E., Duursma, R. A., Eamus, D., Ellsworth, D. S., Colin Prentice, I., Barton, C. V.,Crous, K. Y., Angelis, P., Freeman, M., and Wingate, L.: Reconciling the optimal and empirical20
approaches to modelling stomatal conductance, Glob. Change Biol., 18, 3476–3476, 2012.Mercado, L. M., Patiño, S., Domingues, T. F., Fyllas, N. M., Weedon, G. P., Sitch, S., Que-
sada, C. A., Phillips, O. L., Aragão, L. E., and Malhi, Y.: Variations in Amazon forest pro-ductivity correlated with foliar nutrients and modelled rates of photosynthetic carbon supply,Philos. T. R. Soc. B, 366, 3316–3329, 2011.25
Moorcroft, P. R., Hurtt, G. C., and Pacala, S. W.: A method for scaling vegetation dynamics: theecosystem demography model (ED), Ecol. Monogr., 71, 557–586, 2001.
Mori, S., Yamaji, K., Ishida, A., Prokushkin, S. G., Masyagina, O. V., Hagihara, A., Hoque, A. R.,Suwa, R., Osawa, A., and Nishizono, T.: Mixed-power scaling of whole-plant respiration fromseedlings to giant trees, P. Natl. Acad. Sci. USA, 107, 1447–1451, 2010.30
Nogueira, E. M., Fearnside, P. M., Nelson, B. W., Barbosa, R. I., and Keizer, E. W. H.: Estimatesof forest biomass in the Brazilian Amazon: new allometric equations and adjustments tobiomass from wood-volume inventories, Forest Ecol. Manag., 256, 1853–1867, 2008.
1442
GMDD7, 1413–1452, 2014
AnalysingAmazonian forest
productivity
N. M. Fyllas et al.
Title Page
Abstract Introduction
Conclusions References
Tables Figures
J I
J I
Back Close
Full Screen / Esc
Printer-friendly Version
Interactive Discussion
Discussion
Paper
|D
iscussionP
aper|
Discussion
Paper
|D
iscussionP
aper|
Patiño, S., Lloyd, J., Paiva, R., Baker, T. R., Quesada, C. A., Mercado, L. M., Schmer-ler, J., Schwarz, M., Santos, A. J. B., Aguilar, A., Czimczik, C. I., Gallo, J., Horna, V.,Hoyos, E. J., Jimenez, E. M., Palomino, W., Peacock, J., Peña-Cruz, A., Sarmiento, C.,Sota, A., Turriago, J. D., Villanueva, B., Vitzthum, P., Alvarez, E., Arroyo, L., Baraloto, C.,Bonal, D., Chave, J., Costa, A. C. L., Herrera, R., Higuchi, N., Killeen, T., Leal, E., Luizão, F.,5
Meir, P., Monteagudo, A., Neil, D., Núñez-Vargas, P., Peñuela, M. C., Pitman, N., Pri-ante Filho, N., Prieto, A., Panfil, S. N., Rudas, A., Salomão, R., Silva, N., Silveira, M.,Soares deAlmeida, S., Torres-Lezama, A., Vásquez-Martínez, R., Vieira, I., Malhi, Y., andPhillips, O. L.: Branch xylem density variations across the Amazon Basin, Biogeosciences,6, 545–568, doi:10.5194/bg-6-545-2009, 2009.10
Patiño, S., Fyllas, N. M., Baker, T. R., Paiva, R., Quesada, C. A., Santos, A. J. B., Schwarz, M.,ter Steege, H., Phillips, O. L., and Lloyd, J.: Coordination of physiological and structural traitsin Amazon forest trees, Biogeosciences, 9, 775–801, doi:10.5194/bg-9-775-2012, 2012.
Phillips, O. L., Malhi, Y., Higuchi, N., Laurance, W. F., Núnez, P. V., Vásquez, R. M., Lau-rance, S. G., Ferreira, L. V., Stern, M., and Brown, S.: Changes in the carbon balance of15
tropical forests: evidence from long-term plots, Science, 282, 439–442, 1998.Phillips, O. L., Baker, T. R., Arroyo, L., Higuchi, N., Killeen, T. J., Laurance, W. F., Lewis, S. L.,
Lloyd, J., Malhi, Y., and Monteagudo, A.: Pattern and process in Amazon tree turnover, 1976–2001, Philos. T. R. Soc. B, 359, 381–407, 2004.
Phillips, O. L., Aragão, L. E., Lewis, S. L., Fisher, J. B., Lloyd, J., López-González, G., Malhi, Y.,20
Monteagudo, A., Peacock, J., and Quesada, C. A.: Drought sensitivity of the Amazon rain-forest, Science, 323, 1344–1347, 2009.
Poulter, B., Aragao, L., Heyder, U., Gumpenberger, M., Heinke, J., Langerwisch, F., Rammig, A.,Thonicke, K., and Cramer, W.: Net biome production of the Amazon Basin in the 21st century,Glob. Change Biol., 16, 2062–2075, 2010.25
Purves, D. W., Lichstein, J. W., and Pacala, S. W.: Crown plasticity and competition for canopyspace: a new spatially implicit model parameterized for 250 North American tree species,PLoS One, 2, e870, doi:10.1371/journal.pone.0000870, 2007.
Pury, D. de and Farquhar, G. D.: Simple scaling of photosynthesis from leaves to canopieswithout the errors of big-leaf models, Plant Cell Environ., 20, 537–557, 1997.30
Quesada, C. A., Lloyd, J., Schwarz, M., Patiño, S., Baker, T. R., Czimczik, C., Fyllas, N. M.,Martinelli, L., Nardoto, G. B., Schmerler, J., Santos, A. J. B., Hodnett, M. G., Herrera, R.,Luizão, F. J., Arneth, A., Lloyd, G., Dezzeo, N., Hilke, I., Kuhlmann, I., Raessler, M.,
1443
GMDD7, 1413–1452, 2014
AnalysingAmazonian forest
productivity
N. M. Fyllas et al.
Title Page
Abstract Introduction
Conclusions References
Tables Figures
J I
J I
Back Close
Full Screen / Esc
Printer-friendly Version
Interactive Discussion
Discussion
Paper
|D
iscussionP
aper|
Discussion
Paper
|D
iscussionP
aper|
Brand, W. A., Geilmann, H., Moraes Filho, J. O., Carvalho, F. P., Araujo Filho, R. N.,Chaves, J. E., Cruz Junior, O. F., Pimentel, T. P., and Paiva, R.: Variations in chemical andphysical properties of Amazon forest soils in relation to their genesis, Biogeosciences, 7,1515–1541, doi:10.5194/bg-7-1515-2010, 2010.
Quesada, C. A., Lloyd, J., Anderson, L. O., Fyllas, N. M., Schwarz, M., and Czimczik, C. I.: Soils5
of Amazonia with particular reference to the RAINFOR sites, Biogeosciences, 8, 1415–1440,doi:10.5194/bg-8-1415-2011, 2011.
Quesada, C. A., Phillips, O. L., Schwarz, M., Czimczik, C. I., Baker, T. R., Patiño, S., Fyl-las, N. M., Hodnett, M. G., Herrera, R., Almeida, S., Alvarez Dávila, E., Arneth, A., Ar-royo, L., Chao, K. J., Dezzeo, N., Erwin, T., di Fiore, A., Higuchi, N., Honorio Coro-10
nado, E., Jimenez, E. M., Killeen, T., Lezama, A. T., Lloyd, G., López-González, G.,Luizão, F. J., Malhi, Y., Monteagudo, A., Neill, D. A., Núñez Vargas, P., Paiva, R., Pea-cock, J., Peñuela, M. C., Peña Cruz, A., Pitman, N., Priante Filho, N., Prieto, A., Ramírez, H.,Rudas, A., Salomão, R., Santos, A. J. B., Schmerler, J., Silva, N., Silveira, M., Vásquez, R.,Vieira, I., Terborgh, J., and Lloyd, J.: Basin-wide variations in Amazon forest structure15
and function are mediated by both soils and climate, Biogeosciences, 9, 2203–2246,doi:10.5194/bg-9-2203-2012, 2012.
Raaimakers, D., Boot, R. G. A., Dijkstra, P., and Pot, S.: Photosynthetic rates in relation toleaf phosphorus content in pioneer versus climax tropical rainforest trees, Oecologia, 102,120–125, 1995.20
Reich, P. B., Walters, M. B., Ellsworth, D. S., and Uhl, C.: Photosynthesis–nitrogen relations inAmazonian tree species, Oecologia, 97, 62–72, 1994.
Reich, P. B., Walters, M. B., and Ellsworth, D. S.: From tropics to tundra: global convergence inplant functioning, P. Natl. Acad. Sci. USA, 94, 13730–13734, 1997.
Reich, P. B., Tjoelker, M. G., Pregitzer, K. S., Wright, I. J., Oleksyn, J., and Machado, J.-L.:25
Scaling of respiration to nitrogen in leaves, stems and roots of higher land plants, Ecol. Lett.,11, 793–801, 2008.
Reich, P. B., Oleksyn, J., and Wright, I. J.: Leaf phosphorus influences the photosynthesis–nitrogen relation: a cross-biome analysis of 314 species, Oecologia, 160, 207–212, 2009.
Scheiter, S. and Higgins, S. I.: Impacts of climate change on the vegetation of Africa: an adap-30
tive dynamic vegetation modelling approach, Glob. Change Biol., 15, 2224–2246, 2009.
1444
GMDD7, 1413–1452, 2014
AnalysingAmazonian forest
productivity
N. M. Fyllas et al.
Title Page
Abstract Introduction
Conclusions References
Tables Figures
J I
J I
Back Close
Full Screen / Esc
Printer-friendly Version
Interactive Discussion
Discussion
Paper
|D
iscussionP
aper|
Discussion
Paper
|D
iscussionP
aper|
Sheffield, J., Goteti, G., and Wood, E. F.: Development of a 50-year high-resolution globaldataset of meteorological forcings for land surface modeling, J. Climate, 19, 3088–3111,2006.
Shukla, J., Nobre, C., and Sellers, P.: Amazon deforestation and climate change, Science, 247,1322–1325, 1990.5
Sitch, S., Smith, B., Prentice, I. C., Arneth, A., Bondeau, A., Cramer, W., Kaplan, J. O., Levis, S.,Lucht, W., and Sykes, M. T.: Evaluation of ecosystem dynamics, plant geography and ter-restrial carbon cycling in the LPJ dynamic global vegetation model, Glob. Change Biol., 9,161–185, 2003.
Sombroek, W.: Amazon landforms and soils in relation to biological diversity, Acta Amazonica,10
30, 81–100, 2000.Sombroek, W.: Spatial and temporal patterns of Amazon rainfall: consequences for the planning
of agricultural occupation and the protection of primary forests, AMBIO: A Journal of theHuman Environment, 30, 388–396, 2001.
Spracklen, D. V., Arnold, S. R., and Taylor, C. M.: Observations of increased tropical rainfall15
preceded by air passage over forests, Nature, 489, 282–285, 2012.Sultan, S. E.: Phenotypic plasticity for plant development, function and life history, Trends Plant
Sci., 5, 537–542, 2000.Taylor, M. S. and Thompson, J. R.: A data based algorithm for the generation of random vectors,
Comput. Stat. Data An., 4, 93–101, 1986.20
Ter Steege, H., Pitman, N. C., Phillips, O. L., Chave, J., Sabatier, D., Duque, A., Molino, J.-F.,Prévost, M.-F., Spichiger, R., and Castellanos, H.: Continental-scale patterns of canopy treecomposition and function across Amazonia, Nature, 443, 444–447, 2006.
Ter Steege, H., Pitman, N. C., Sabatier, D., Baraloto, C., Salomão, R. P., Guevara, J. E.,Phillips, O. L., Castilho, C. V., Magnusson, W. E., and Molino, J.-F.: Hyperdominance in the25
Amazonian tree flora, Science, 342, 1243092, doi:10.1126/science.1243092, 2013.Tjoelker, M. G., Oleksyn, J., and Reich, P. B.: Modelling respiration of vegetation: evidence for
a general temperature-dependent Q10, Glob. Change Biol., 7, 223–230, 2001.Townsend, A. R., Asner, G. P., and Cleveland, C. C.: The biogeochemical heterogeneity of
tropical forests, Trends Ecol. Evol., 23, 424–431, 2008.30
Valentini, R., Matteucci, G., Dolman, A. J., Schulze, E.-D., Rebmann, C., Moors, E. J.,Granier, A., Gross, P., Jensen, N. O., and Pilegaard, K.: Respiration as the main determi-nant of carbon balance in European forests, Nature, 404, 861–865, 2000.
1445

GMDD7, 1413–1452, 2014
AnalysingAmazonian forest
productivity
N. M. Fyllas et al.
Title Page
Abstract Introduction
Conclusions References
Tables Figures
J I
J I
Back Close
Full Screen / Esc
Printer-friendly Version
Interactive Discussion
Discussion
Paper
|D
iscussionP
aper|
Discussion
Paper
|D
iscussionP
aper|
Van Genuchten, M. T.: A closed-form equation for predicting the hydraulic conductivity of un-saturated soils, Soil Sci. Soc. Am. J., 44, 892–898, 1980.
Vitousek, P. M. and Farrington, H.: Nutrient limitation and soil development: experimental testof a biogeochemical theory, Biogeochemistry, 37, 63–75, 1997.
Walker, T. W. and Syers, J. K.: The fate of phosphorus during pedogenesis, Geoderma, 15,5
1–19, 1976.Wang, Y.-P. and Leuning, R.: A two-leaf model for canopy conductance, photosynthesis and
partitioning of available energy I: Model description and comparison with a multi-layeredmodel, Agr. Forest Meteorol., 91, 89–111, 1998.
White, A., Cannell, M. G., and Friend, A. D.: Climate change impacts on ecosystems and the10
terrestrial carbon sink: a new assessment, Global Environ. Chang., 9, 21–30, 1999.Wright, I. J., Reich, P. B., Westoby, M., Ackerly, D. D., Baruch, Z., Bongers, F., Cavender-
Bares, J., Chapin, T., Cornelissen, J. H., and Diemer, M.: The worldwide leaf economicsspectrum, Nature, 428, 821–827, 2004.
York, D., Evensen, N. M., Martínez, M. L., and Delgado, J. D. B.: Unified equations for the slope,15
intercept, and standard errors of the best straight line, Am. J. Phys., 72, 367–375, 2004.Zhang, Y., Xu, M., Chen, H., and Adams, J.: Global pattern of NPP to GPP ratio derived from
MODIS data: effects of ecosystem type, geographical location and climate, Global. Ecol.Biogeogr., 18, 280–290, 2009.
1446
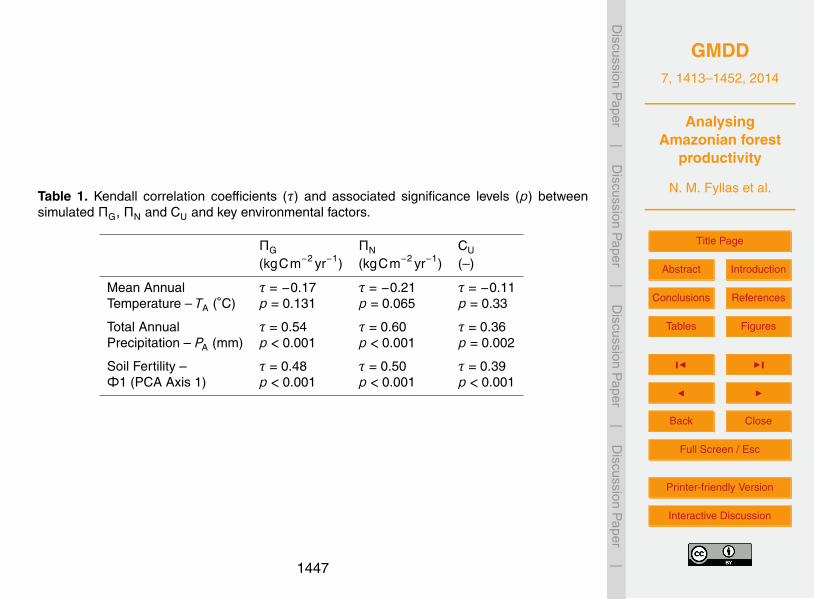
GMDD7, 1413–1452, 2014
AnalysingAmazonian forest
productivity
N. M. Fyllas et al.
Title Page
Abstract Introduction
Conclusions References
Tables Figures
J I
J I
Back Close
Full Screen / Esc
Printer-friendly Version
Interactive Discussion
Discussion
Paper
|D
iscussionP
aper|
Discussion
Paper
|D
iscussionP
aper|
Table 1. Kendall correlation coefficients (τ) and associated significance levels (p) betweensimulated ΠG, ΠN and CU and key environmental factors.
ΠG ΠN CU
(kgCm−2 yr−1) (kgCm−2 yr−1) (–)
Mean Annual τ = −0.17 τ = −0.21 τ = −0.11Temperature – TA (◦C) p = 0.131 p = 0.065 p = 0.33
Total Annual τ = 0.54 τ = 0.60 τ = 0.36Precipitation – PA (mm) p < 0.001 p < 0.001 p = 0.002
Soil Fertility – τ = 0.48 τ = 0.50 τ = 0.39Φ1 (PCA Axis 1) p < 0.001 p < 0.001 p < 0.001
1447
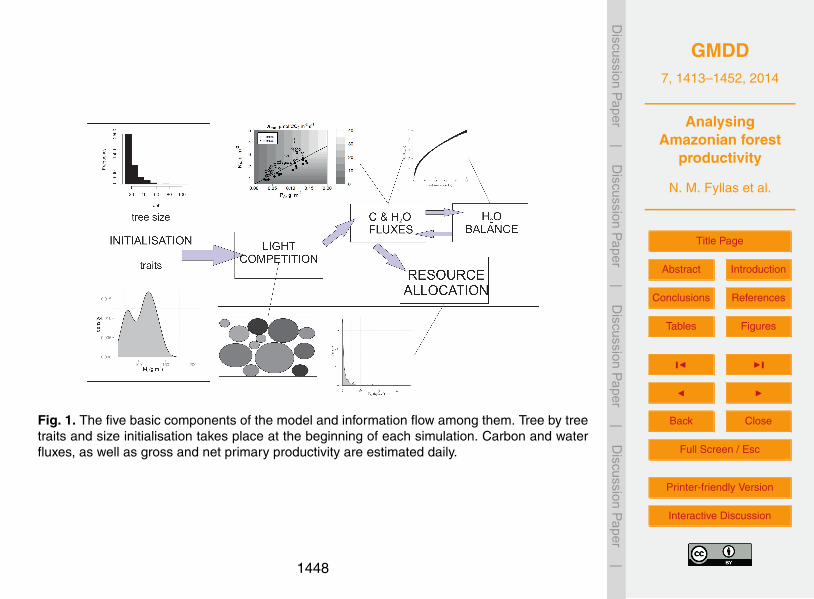
GMDD7, 1413–1452, 2014
AnalysingAmazonian forest
productivity
N. M. Fyllas et al.
Title Page
Abstract Introduction
Conclusions References
Tables Figures
J I
J I
Back Close
Full Screen / Esc
Printer-friendly Version
Interactive Discussion
Discussion
Paper
|D
iscussionP
aper|
Discussion
Paper
|D
iscussionP
aper|
Fig. 1. The five basic components of the model and information flow among them. Tree by treetraits and size initialisation takes place at the beginning of each simulation. Carbon and waterfluxes, as well as gross and net primary productivity are estimated daily.
1448
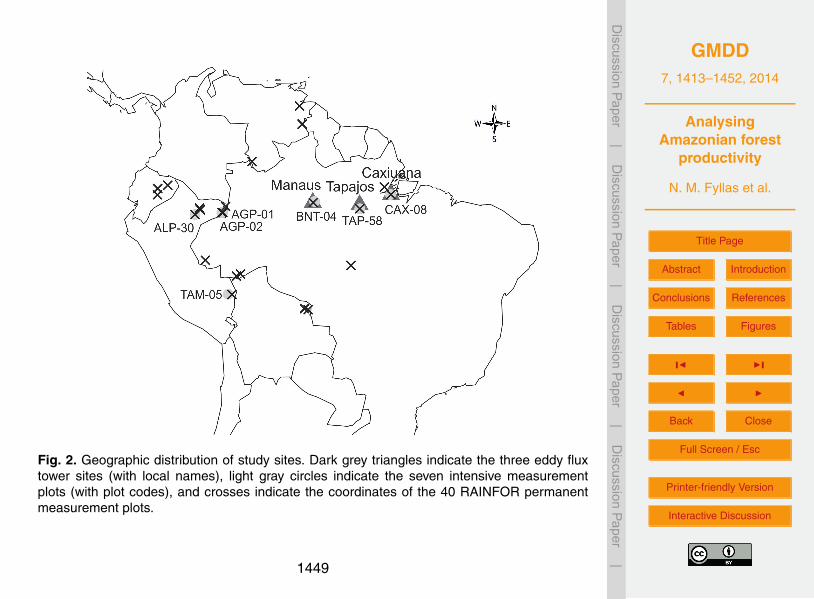
GMDD7, 1413–1452, 2014
AnalysingAmazonian forest
productivity
N. M. Fyllas et al.
Title Page
Abstract Introduction
Conclusions References
Tables Figures
J I
J I
Back Close
Full Screen / Esc
Printer-friendly Version
Interactive Discussion
Discussion
Paper
|D
iscussionP
aper|
Discussion
Paper
|D
iscussionP
aper|
Fig. 2. Geographic distribution of study sites. Dark grey triangles indicate the three eddy fluxtower sites (with local names), light gray circles indicate the seven intensive measurementplots (with plot codes), and crosses indicate the coordinates of the 40 RAINFOR permanentmeasurement plots.
1449
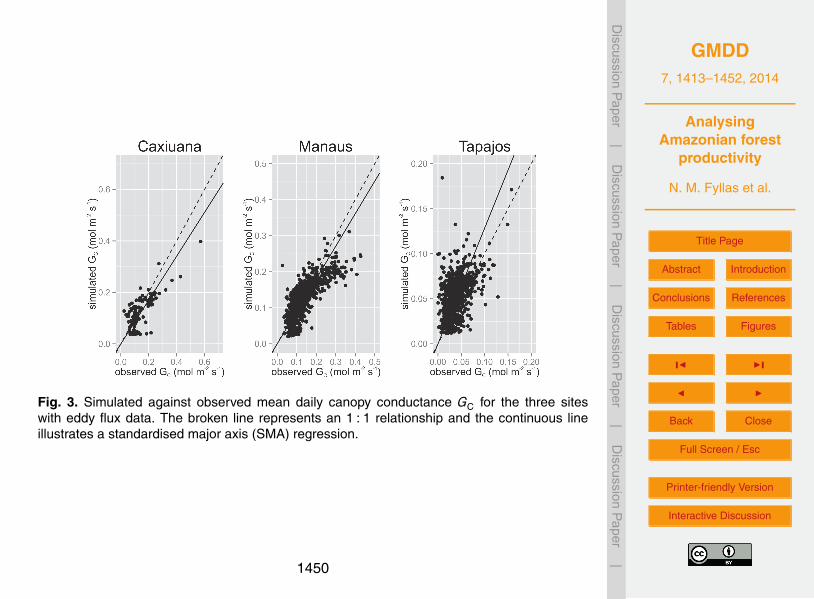
GMDD7, 1413–1452, 2014
AnalysingAmazonian forest
productivity
N. M. Fyllas et al.
Title Page
Abstract Introduction
Conclusions References
Tables Figures
J I
J I
Back Close
Full Screen / Esc
Printer-friendly Version
Interactive Discussion
Discussion
Paper
|D
iscussionP
aper|
Discussion
Paper
|D
iscussionP
aper|
Fig. 3. Simulated against observed mean daily canopy conductance GC for the three siteswith eddy flux data. The broken line represents an 1 : 1 relationship and the continuous lineillustrates a standardised major axis (SMA) regression.
1450
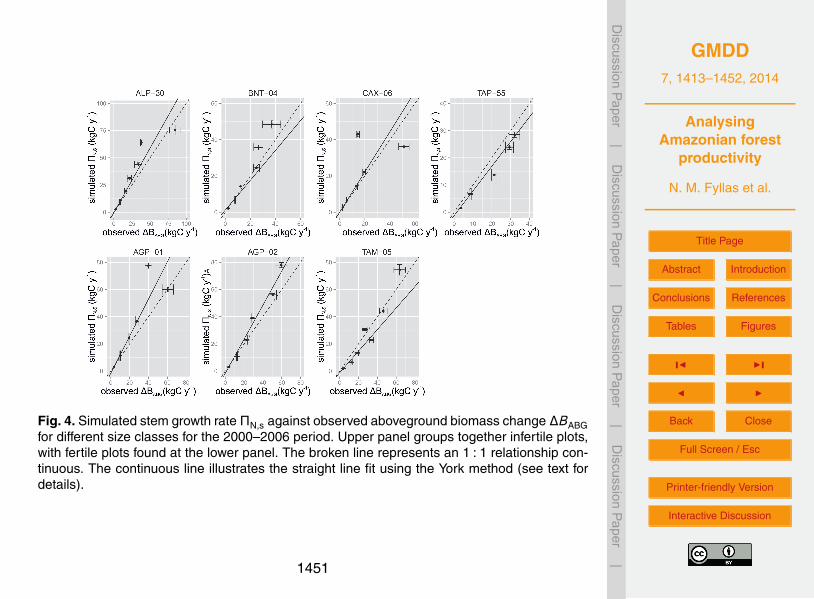
GMDD7, 1413–1452, 2014
AnalysingAmazonian forest
productivity
N. M. Fyllas et al.
Title Page
Abstract Introduction
Conclusions References
Tables Figures
J I
J I
Back Close
Full Screen / Esc
Printer-friendly Version
Interactive Discussion
Discussion
Paper
|D
iscussionP
aper|
Discussion
Paper
|D
iscussionP
aper|
Fig. 4. Simulated stem growth rate ΠN,s against observed aboveground biomass change ∆BABGfor different size classes for the 2000–2006 period. Upper panel groups together infertile plots,with fertile plots found at the lower panel. The broken line represents an 1 : 1 relationship con-tinuous. The continuous line illustrates the straight line fit using the York method (see text fordetails).
1451
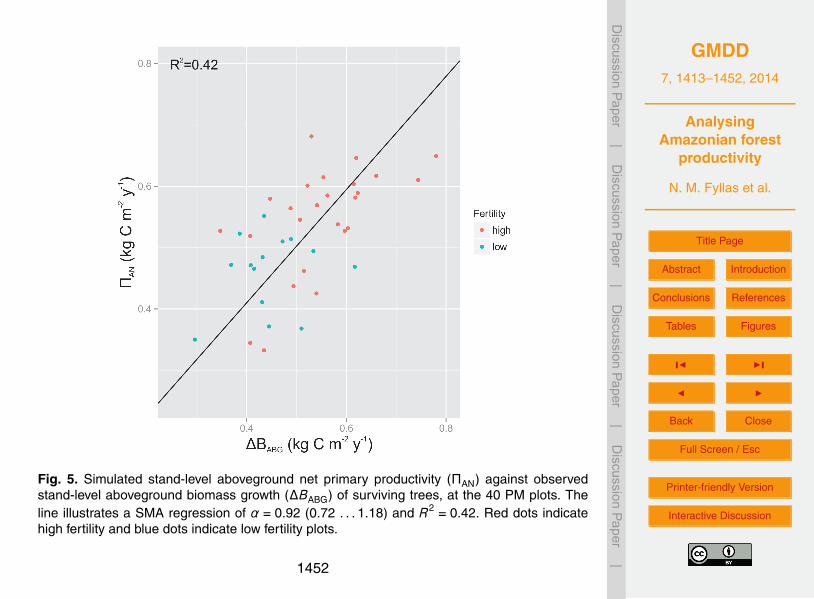
GMDD7, 1413–1452, 2014
AnalysingAmazonian forest
productivity
N. M. Fyllas et al.
Title Page
Abstract Introduction
Conclusions References
Tables Figures
J I
J I
Back Close
Full Screen / Esc
Printer-friendly Version
Interactive Discussion
Discussion
Paper
|D
iscussionP
aper|
Discussion
Paper
|D
iscussionP
aper|
Fig. 5. Simulated stand-level aboveground net primary productivity (ΠAN) against observedstand-level aboveground biomass growth (∆BABG) of surviving trees, at the 40 PM plots. Theline illustrates a SMA regression of α = 0.92 (0.72 . . . 1.18) and R2 = 0.42. Red dots indicatehigh fertility and blue dots indicate low fertility plots.
1452
Related Documents