AN OVERVIEW OF U.S. COMMUTER RAIL Timothy J. Brock, MA Reginald R. Souleyrette, PhD, PE KTC-13-18/UTCNURAIL1-12-1F

Welcome message from author
This document is posted to help you gain knowledge. Please leave a comment to let me know what you think about it! Share it to your friends and learn new things together.
Transcript
AN OVERVIEW OF U.S. COMMUTER RAIL
Timothy J. Brock, MA Reginald R. Souleyrette, PhD, PE KTC-13-18/UTCNURAIL1-12-1F
ii
This research was sponsored by:
The NuRail Center National University Transportation Center
and
The Kentucky Transportation Center
University of Kentucky
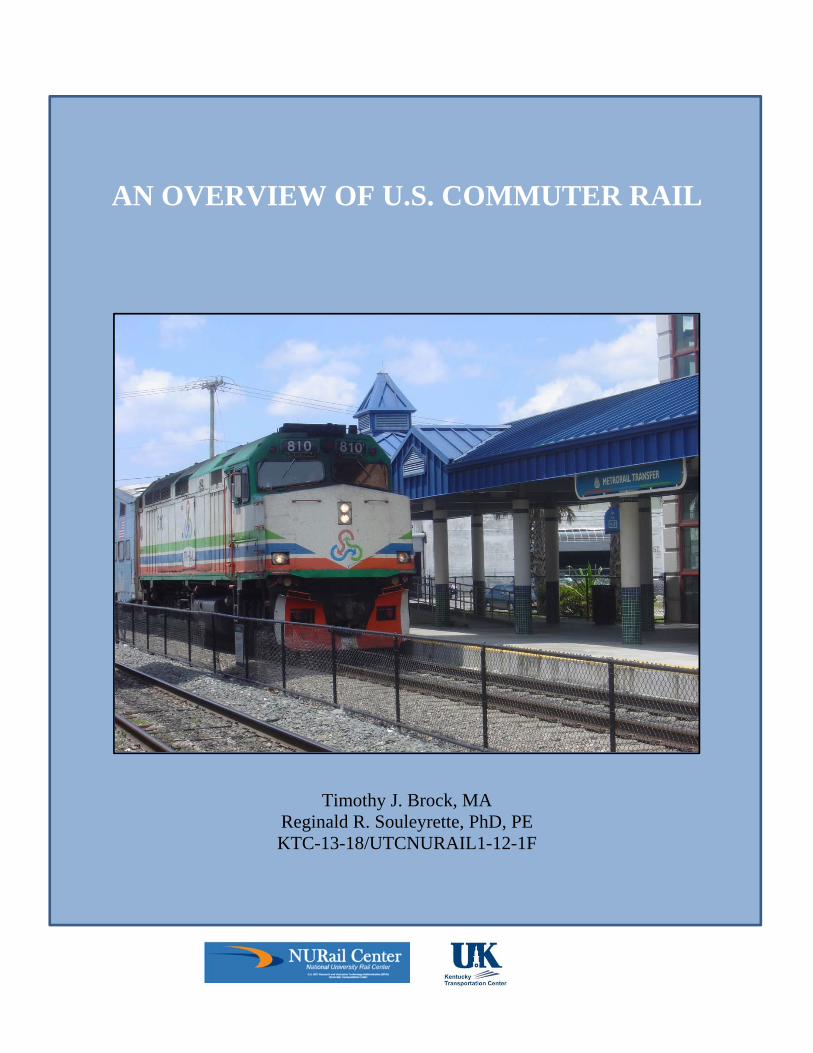
Cover Photo: Tri-Rail System in Miami, Florida By: Timothy J. Brock Date: April, 2011 Acknowledgements: The authors would like to thank Dr. Ted Grossardt and Dr. Len O’Connell for their comments on earlier drafts. They would also like to thank the participants in the Cities, Transportation and Sustainability session at the Association of American Geographers annual meeting for the thoughtful discussion and comments on this research. Disclaimer: The contents of this report reflect the views of the authors who are responsible for the facts and accuracy of the data presented herein. The contents do not necessarily reflect the official views or policies of the Kentucky Transportation Center or of the NuRail Center. This report does not constitute a standard, specification or regulation.
iii
AN OVERVIEW OF U.S. COMMUTER RAIL
Timothy J. Brock, M.A. Research Associate
Kentucky Transportation Center University of Kentucky
and
Reginald R. Souleyrette, Ph.D., P.E.
Professor of Transportation Engineering and Commonwealth Chair College of Engineering University of Kentucky
FINAL REPORT May 2nd, 2013
© 2013 University of Kentucky, Kentucky Transportation Center
Information may not be used, reproduced, or republished without our written consent.
iv
1. Report No. KTC-13-18/UTCNURAIL1-12-1F
2. Government Accession No.
3. Recipient’s Catalog No
4. Title and Subtitle AN OVERVIEW OF U.S. COMMUTER RAIL
5. Report Date May 2013
6. Performing Organization Code
7. Author(s): Timothy J. Brock and Reginald R. Souleyrette 8. Performing Organization Report No.
9. Performing Organization Name and Address Kentucky Transportation Center College of Engineering University of Kentucky Lexington, KY 40506-0281
10. Work Unit No. (TRAIS)
11. Contract or Grant No.
12. Sponsoring Agency Name and Address National University Rail Center (NURail), USDOT RITA through the University of Illinois at Urbana/Champaign
13. Type of Report and Period Covered Final Report
14. Sponsoring Agency Code
15. Supplementary Notes
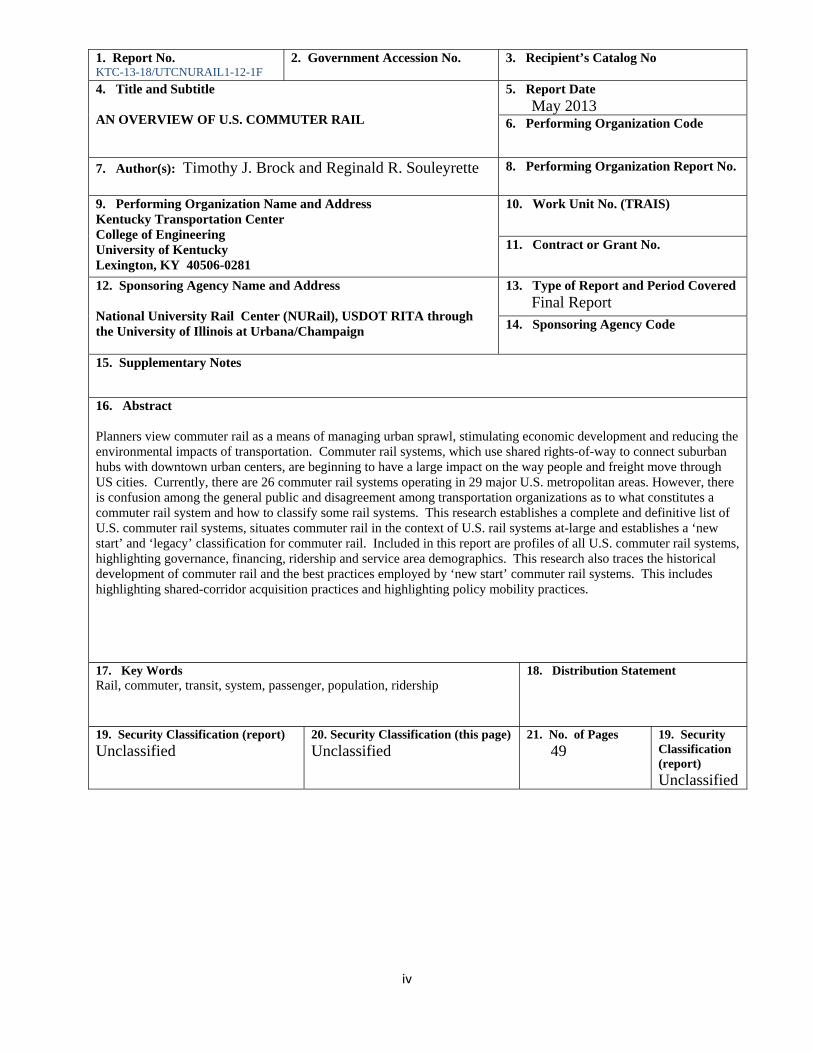
16. Abstract Planners view commuter rail as a means of managing urban sprawl, stimulating economic development and reducing the environmental impacts of transportation. Commuter rail systems, which use shared rights-of-way to connect suburban hubs with downtown urban centers, are beginning to have a large impact on the way people and freight move through US cities. Currently, there are 26 commuter rail systems operating in 29 major U.S. metropolitan areas. However, there is confusion among the general public and disagreement among transportation organizations as to what constitutes a commuter rail system and how to classify some rail systems. This research establishes a complete and definitive list of U.S. commuter rail systems, situates commuter rail in the context of U.S. rail systems at-large and establishes a ‘new start’ and ‘legacy’ classification for commuter rail. Included in this report are profiles of all U.S. commuter rail systems, highlighting governance, financing, ridership and service area demographics. This research also traces the historical development of commuter rail and the best practices employed by ‘new start’ commuter rail systems. This includes highlighting shared-corridor acquisition practices and highlighting policy mobility practices.
17. Key Words Rail, commuter, transit, system, passenger, population, ridership
18. Distribution Statement
19. Security Classification (report)
Unclassified 20. Security Classification (this page)
Unclassified 21. No. of Pages
49 19. Security Classification (report) Unclassified
v
Table of Contents Table of Contents ................................................................................................................................. v
Abstract ............................................................................................................................................. vii
INTRODUCTION ................................................................................................................................... 1
1.1 Project Goals ...................................................................................................................................... 1
1.2 Typology of American Rail .................................................................................................................. 1
1.3 Defining Commuter Rail ..................................................................................................................... 2
HISTORY OF PASSENGER RAIL AND COMMUTER RAIL .......................................................................... 6
2.1 The Decline of Private Passenger Rail Services .................................................................................. 6
2.2 Post-War Urban Rail Transit ............................................................................................................... 7
2.3 Establishing Quasi-Public Passenger Rail ........................................................................................... 7
2.4 Quasi-Public Commuter Rail ............................................................................................................... 8
ESTABLISHING A TYPOLOGY OF COMMUTER RAIL ................................................................................ 9
3.1 Legacy Commuter Rail Systems ......................................................................................................... 9
3.2 New Start Commuter Rail Systems .................................................................................................. 10
3.2.1 Establishing New Start Systems .................................................................................................... 11
3.2.2 New Start Shared Corridors .......................................................................................................... 11
3.2.3 New Generation Commuter Design .............................................................................................. 12
3.2.4 Policy Mobility ............................................................................................................................... 14
COMMUTER SYSTEM PROFILES .......................................................................................................... 15
4.1 Profile Overview ............................................................................................................................... 15
4.2 Commuter Rail System Profiles ........................................................................................................ 15
Rail Runner Express ............................................................................................................................. 16
Capital MetroRail ................................................................................................................................ 17
MARC .................................................................................................................................................. 18
MBTA ................................................................................................................................................... 19
Metra .................................................................................................................................................. 20
South Shore Line ................................................................................................................................. 21
Trinity Railway Express ........................................................................................................................ 22
A-Train ................................................................................................................................................. 23
MetroLink ............................................................................................................................................ 24
Tri-Rail ................................................................................................................................................. 25
Northstar ............................................................................................................................................. 26
Music City Star .................................................................................................................................... 27
vi
Shore Line East .................................................................................................................................... 28
MTA: Long Island ................................................................................................................................. 29
MTA: Metro North .............................................................................................................................. 30
New Jersey Transit .............................................................................................................................. 31
SEPTA .................................................................................................................................................. 32
Keystone Line ...................................................................................................................................... 33
Downeaster ......................................................................................................................................... 34
Westside Express Service .................................................................................................................... 35
FrontRunner ........................................................................................................................................ 36
Coaster ................................................................................................................................................ 37
Caltrain ................................................................................................................................................ 38
Altamont Commuter Express .............................................................................................................. 39
Sounder ............................................................................................................................................... 40
Virginia Railway Express ...................................................................................................................... 41
4.3 Systems Excluded from the Commuter Rail Survey ......................................................................... 42
CONCLUSIONS.................................................................................................................................... 44
REFERENCES ....................................................................................................................................... 45
Appendix A ........................................................................................................................................ 46
Appendix B ........................................................................................................................................ 47
Appendix C ........................................................................................................................................ 48
List of Tables
Table 1: Typology of U.S. Rail Systems ......................................................................................................... 2 Table 2: Commuter Rail Criteria .................................................................................................................... 3 Table 3: US Commuter Rail Systems ............................................................................................................ 5 Table 4: Legacy Commuter Rail System with Date ...................................................................................... 9 Table 5: New Start Commuter Rails System .............................................................................................. 10 Table 6: A Typology of Urban Form and Commuter Rail Design................................................................ 13

vii
Abstract Planners view commuter rail as a means of managing urban sprawl, stimulating economic development and reducing the environmental impacts of transportation. Commuter rail systems, which use shared rights-of-way to connect suburban hubs with downtown urban centers, are beginning to have a large impact on the way people and freight move through US cities. Currently, there are 26 commuter rail systems operating in 29 major U.S. metropolitan areas. However, there is confusion among the general public and disagreement among transportation organizations as to what constitutes a commuter rail system and how to classify some rail systems. This research establishes a complete and definitive list of U.S. commuter rail systems, situates commuter rail in the context of U.S. rail systems at-large and establishes a ‘new start’ and ‘legacy’ classification for commuter rail. Included in this report are profiles of all U.S. commuter rail systems, highlighting governance, financing, ridership and service area demographics. This research also traces the historical development of commuter rail and the best practices employed by ‘new start’ commuter rail systems. This includes highlighting shared-corridor acquisition practices and highlighting policy mobility practices.
Section 1
INTRODUCTION
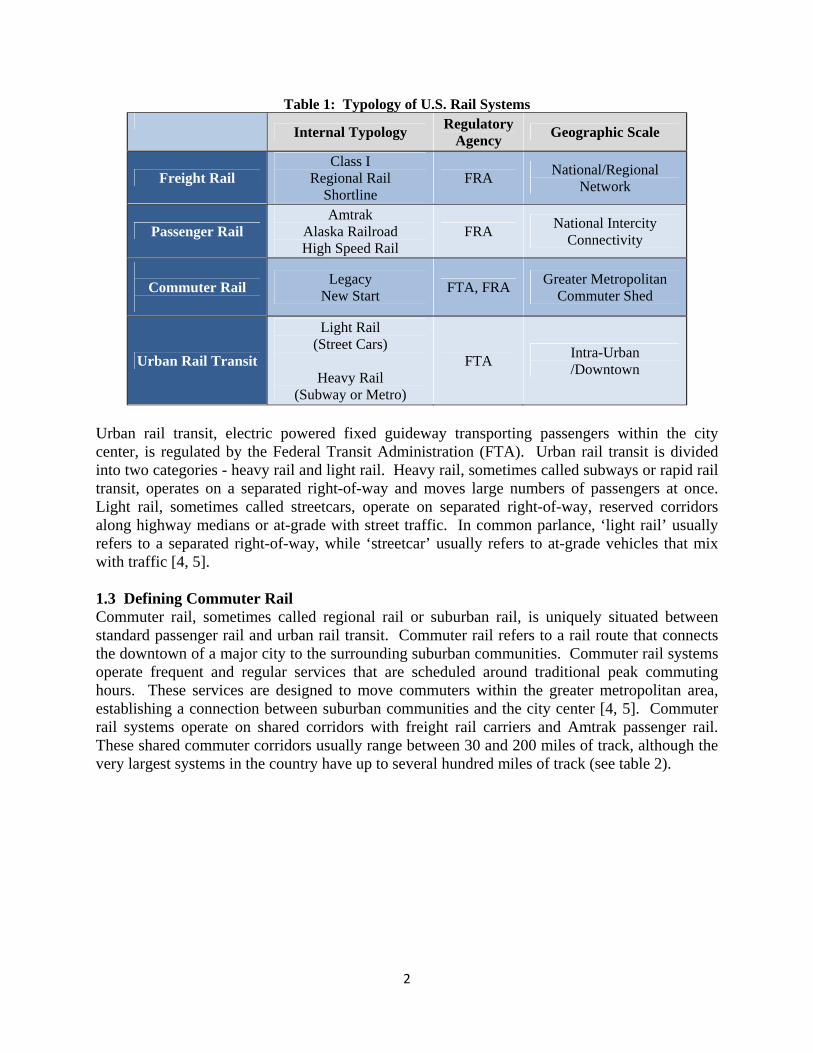
Alternative modes of transportation are becoming more important in sprawling urban areas with increasingly congested roadways. Many cities are turning to commuter rail as a viable mode of public transportation. City planners view commuter rail as a means of managing urban sprawl, stimulating economic development and reducing the environmental impacts of transportation. Commuter rail systems, which move passengers between the suburbs and the downtown on shared corridors, are having a larger impact on the way people and freight move through US cities. Commuter rail and its subsequent transit oriented development (TOD) provide opportunities for cities to re-shape their urban form and stimulate economic development. By creating dense, mixed use TOD zones along commuter rail stations, urban transportation planners hope to foster the establishment of livable, economically prosperous and environmentally sustainable communities. Urban planning literature suggests that metropolitan areas with successful public rail transit become more competitive in their attempts to attract globally mobile investment [1, 2]. Cities across the country have implemented commuter rail systems, with varying success, in an effort to reap these benefits. Currently, there at 26 operational commuter rail systems located in 29 major U.S. metropolitan areas. Long term trends indicate that commuter rail service will continue to grow nationally, as forecasted by the 28 percent increase in national ridership between 1997 and 2007. During this period, commuter rail added 100 million additional riders [3]. 1.1 Project Goals This research situates commuter rail systems in the context of rail systems at-large, compiles a complete and definitive list of U.S. commuter rail systems, profiles each system and establishes a ‘new start’ and ‘legacy’ classification system for commuter rail. Examining new start commuter rail, specifically the acquisition of right-of-way on shared-corridors and the relationship between system design and urban form, provides a means of tracing the policy mobility and system development of contemporary commuter rail. The authors highlight the current state of commuter rail, the historical acquisition of legacy commuter rail systems by public transit agencies and the establishment of contemporary new start commuter rail projects. This overview includes profiles of all 26 operational US commuter rail systems. These profiles will examine the vital statistics and demographics of each system. 1.2 Typology of American Rail American rail systems can be organized into four broad categories: freight rail, passenger rail, urban rail transit and commuter rail (see Table 1). The Federal Railroad Administration (FRA) is charged with assisting and regulating passenger rail and freight rail. These two industries often share track infrastructure and right-of-way corridors, making one of the FRA’s primary concerns the safe and efficient integration of both services on shared corridors [3]. In this context, the term ‘passenger rail’ refers to longer distance intercity rail transportation, such as Amtrak.
2
Table 1: Typology of U.S. Rail Systems
Internal Typology Regulatory
Agency Geographic Scale
Freight Rail Class I
Regional Rail Shortline
FRA National/Regional
Network
Passenger Rail Amtrak
Alaska Railroad High Speed Rail
FRA National Intercity
Connectivity
Commuter Rail
Legacy New Start
FTA, FRA Greater Metropolitan
Commuter Shed
Urban Rail Transit
Light Rail (Street Cars)
Heavy Rail
(Subway or Metro)
FTA Intra-Urban /Downtown
Urban rail transit, electric powered fixed guideway transporting passengers within the city center, is regulated by the Federal Transit Administration (FTA). Urban rail transit is divided into two categories - heavy rail and light rail. Heavy rail, sometimes called subways or rapid rail transit, operates on a separated right-of-way and moves large numbers of passengers at once. Light rail, sometimes called streetcars, operate on separated right-of-way, reserved corridors along highway medians or at-grade with street traffic. In common parlance, ‘light rail’ usually refers to a separated right-of-way, while ‘streetcar’ usually refers to at-grade vehicles that mix with traffic [4, 5]. 1.3 Defining Commuter Rail Commuter rail, sometimes called regional rail or suburban rail, is uniquely situated between standard passenger rail and urban rail transit. Commuter rail refers to a rail route that connects the downtown of a major city to the surrounding suburban communities. Commuter rail systems operate frequent and regular services that are scheduled around traditional peak commuting hours. These services are designed to move commuters within the greater metropolitan area, establishing a connection between suburban communities and the city center [4, 5]. Commuter rail systems operate on shared corridors with freight rail carriers and Amtrak passenger rail. These shared commuter corridors usually range between 30 and 200 miles of track, although the very largest systems in the country have up to several hundred miles of track (see table 2).

3
Table 2: Commuter Rail Criteria
Greater Metropolitan Commuter Shed
The system operates within the greater metropolitan commuter shed and connects downtown centers with suburban hubs*
Frequent Service Headways of 15 minute, 30 minute or 60 minute increments with
more frequent service in the peak of commuting hours
Regular Service Services are based on a regular weekday schedule
that focus on peak commuting hours.
Shared Corridor Rail infrastructure and corridor right-of-ways are shared
with freight and passenger rail carriers^
Track Miles Most systems have between 30 and 200 miles of track
Speed Commuter train speeds do not exceed 79 mph^
* Some commuter express services connect two metro areas in close proximity (see table 3) ^ The Keystone system is part of a new high speed passenger corridor as a result of recent Amtrak infrastructure modifications (sealed corridor with no freight carrier and increased speeds) Despite the recent increase in commuter rail systems, there is often confusion among the general public in differentiating commuter rail from light rail and heavy rail. Even professional transportation and planning organizations differ as to which systems are classified as commuter rails, due in part to the lack of definitive research on the variations of commuter rail systems in the United States. During the course of this research, criteria had to be constructed to definitively establish a complete and composite list of commuter rail systems. The selected criteria reflect the core elements of commuter rail as set forth by the Federal Transit Administration (FTA) and American Public Transportation Association (APTA) classification system. Even between these two organizations, there are discrepancies in the operational and design elements that constitute commuter rail. This research considered four systems that are associated with multiple classifications. Three of these systems failed to meet the criteria for commuter rail classification, as set forth by this study. While the Alaska Railroad system and the Capital Corridor in northern California are designated as commuter rail by the APTA, they are not designated as commuter rail systems by FTA. As a general guideline, this research considers a system’s standing with the FTA and its eligibility for federal transit funding to be a factor in its inclusion as a commuter rail. The Capital Corridor system and the Alaska Railroad function as interurban passenger rail systems and are entirely within the purview of the Federal Railroad Administration (FRA). The third system is the PATCO Line, a subsidiary of the Delaware River Port Authority of Pennsylvania and Camden, New Jersey. This line operates between Philadelphia and New Jersey and is often described as a commuter rail system by state and local transit agencies in the region, despite PATCO being classified as heavy rail by both the FTA and APTA. As these three systems failed to meet the researchers’ criteria, they have been excluded from the research. The Keystone Line, which connects Philadelphia to Harrisburg, PA, is considered a commuter rail system in this research. Despite having very similar characteristics to intercity passenger

4
rail, the system meets most of the criteria for commuter rail. The commuter rail operates at slightly higher speeds on a sealeded corridor that doesn’t share track infrastructure with freight rail, rather than the traditional shared corridor. These passenger rail characteristics stem from 2006 track improvements that allow the Keystone Line to reach speeds of 110 mph, well above the typical commuter rail top speed of 79 mph. This speed, which is second only to the Amtrak Acela passenger rail line in northeast corridor, qualifies the Keystone Line as an FRA high speed corridor. Many of these improvements, however, were funded by FTA transit funds. These improvements allowed a standard Amtrak line to begin operating frequent and regular commuter rail service. The Keystone Line has trains departing hourly during peak commuter hours, has 12 stations over the system’s104 mile corridor and is designated a commuter rail system by the FTA. Given these characteristics and the commuter rail function of the line, the researchers determined that the Keystone Line meets the key criteria for commuter rail as established by this study. This research has identified 26 systems as a comprehensive and definitive list of U.S. commuter rails systems (see Table 3).

5
Table 3: US Commuter Rail Systems System Name Location Track Miles Stations Daily Ridership
Rail Runner Express Albuquerque, NM
Santa Fe, NM 97 11 4,000
Capital MetroRail Austin, TX 32 9 1,600
MARC Baltimore, MD Washington DC
200 42 33,700
MBTA Boston, MA 368 123 130,700
Metra Chicago, IL 488 239 304,300
NICTD South Shore Line Chicago, IL
South Bend, IN 90 19 12,100
Trinity Railway Express Dallas, TX
Ft. Worth, TX 34 10 8,400
A-Train Denton/Dallas, TX 21 6 1,400
MetroLink Los Angeles, CA 512 55 43,100
Tri-Rail Miami, FL 72 18 14,000
NorthStar Minneapolis, MN
St. Paul, MN 40 6 2,100
Music City Star Nashville, TN 32 6 1,100
Shore Line East New Haven, CT 59 11 2,100
MTA - Long Island New York, NY 700 124 324,300
MTA - Metro North New York, NY 384 120 281,200
NJ Transit Newark, NJ 498 165 NA
SEPTA Philadelphia, PA 289 153 123,500
Keystone Line Philadelphia, PA Harrisburg, PA
104 12 1,800
Downeaster Portland, ME 116 12 1,400
Westside Express Service Portland, OR 15 5 1,600
FrontRunner Salt Lake City, UT 44 8 5,600
Coaster San Diego, CA 42 8 5,300
Caltrain San Francisco, CA 75 32 42,400
Altamont Commuter Express
San Jose, CA 86 10 3,100
Sounder Seattle, WA 82 10 9,900
Virginia Railway Express Washington, DC Alexandria, VA
90 18 19,200
Daily ridership data from the APTA Transit Ridership Report for the first quarter of 2012
6
Section 2
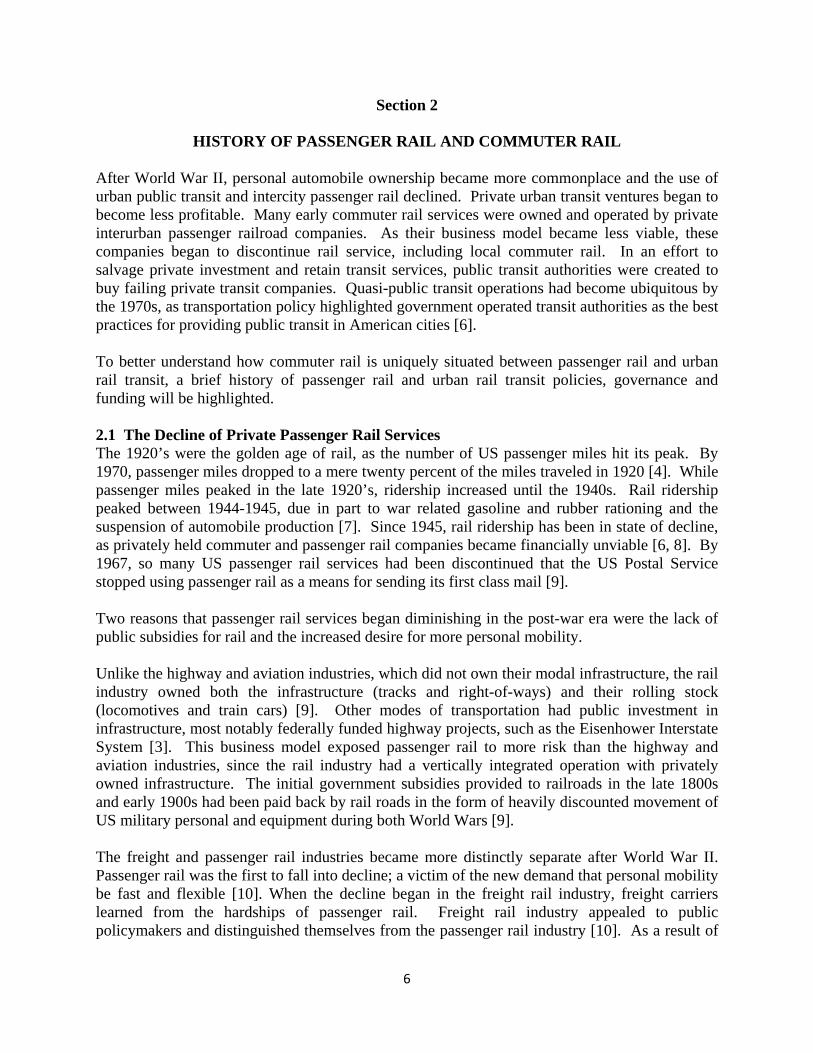
HISTORY OF PASSENGER RAIL AND COMMUTER RAIL After World War II, personal automobile ownership became more commonplace and the use of urban public transit and intercity passenger rail declined. Private urban transit ventures began to become less profitable. Many early commuter rail services were owned and operated by private interurban passenger railroad companies. As their business model became less viable, these companies began to discontinue rail service, including local commuter rail. In an effort to salvage private investment and retain transit services, public transit authorities were created to buy failing private transit companies. Quasi-public transit operations had become ubiquitous by the 1970s, as transportation policy highlighted government operated transit authorities as the best practices for providing public transit in American cities [6]. To better understand how commuter rail is uniquely situated between passenger rail and urban rail transit, a brief history of passenger rail and urban rail transit policies, governance and funding will be highlighted. 2.1 The Decline of Private Passenger Rail Services The 1920’s were the golden age of rail, as the number of US passenger miles hit its peak. By 1970, passenger miles dropped to a mere twenty percent of the miles traveled in 1920 [4]. While passenger miles peaked in the late 1920’s, ridership increased until the 1940s. Rail ridership peaked between 1944-1945, due in part to war related gasoline and rubber rationing and the suspension of automobile production [7]. Since 1945, rail ridership has been in state of decline, as privately held commuter and passenger rail companies became financially unviable [6, 8]. By 1967, so many US passenger rail services had been discontinued that the US Postal Service stopped using passenger rail as a means for sending its first class mail [9]. Two reasons that passenger rail services began diminishing in the post-war era were the lack of public subsidies for rail and the increased desire for more personal mobility. Unlike the highway and aviation industries, which did not own their modal infrastructure, the rail industry owned both the infrastructure (tracks and right-of-ways) and their rolling stock (locomotives and train cars) [9]. Other modes of transportation had public investment in infrastructure, most notably federally funded highway projects, such as the Eisenhower Interstate System [3]. This business model exposed passenger rail to more risk than the highway and aviation industries, since the rail industry had a vertically integrated operation with privately owned infrastructure. The initial government subsidies provided to railroads in the late 1800s and early 1900s had been paid back by rail roads in the form of heavily discounted movement of US military personal and equipment during both World Wars [9]. The freight and passenger rail industries became more distinctly separate after World War II. Passenger rail was the first to fall into decline; a victim of the new demand that personal mobility be fast and flexible [10]. When the decline began in the freight rail industry, freight carriers learned from the hardships of passenger rail. Freight rail industry appealed to public policymakers and distinguished themselves from the passenger rail industry [10]. As a result of
7
this separation, the two industries now have very different business models, employ different financial policies and advocate for distinct public policies. With little public investment in rail infrastructure and rapidly increasing post-war demand for personal transportation, operating private passenger rail services became less and less profitable. Many privately held regional rail companies began discontinuing passenger rail routes and stopping regional commuter rail services [10, 11]. The discontinuance of these failing rail services had traditionally been regulated by state government, allowing each state to set their own wide ranging and inconsistent conditions by which companies could withdraw passenger rail services. In an attempt to more uniformly regulate and manage rail service, the Interstate Commerce Commission (ICC) was charged with approving service discontinuances in 1958 [11]. While this federal intervention provided more consistent terms of discontinuation, it did not slow the rapid rate at which local and regional rail lines were closing. 2.2 Post-War Urban Rail Transit In 1962, President Kennedy delivered a special message to Congress in which he called for new planning efforts and capital assistance for US urban mass transit. This lead to the establishment of the Urban Mass Transit Administration (UMTA), precursor to the Federal Transit Administration, in 1964. UMTA began providing capital grants for metropolitan areas with a comprehensive transit plan. The first focus of the grants was to address the problem of deteriorating commuter rail services [6]. The timing of this federal transit funding coincided with urban environmental movements and anti-freeway movements, both of which called for better public transit systems. The availability of federal transit funds and the increasing public support for urban rail immediately made an impact on urban transit projects, specifically the establishment of urban rail projects to replace proposed highway projects. The two largest, most notable transportation projects that embraced this rail renaissance were San Francisco and Washington, DC. San Francisco was planning an elevated superhighway project which was rejected in favor of building what would become the BART heavy rail system. Washington DC opted for the construction of the DC Metro subway over a proposed 8 lane highway that would have cut across the city [6]. In an effort to improve funding for urban transit, the 1974 National Mass Transportation Assistance Act allowed some funds from the Highway Trust Fund, which is funded by fuel taxes, to be diverted to rapid transit projects [6]. 2.3 Establishing Quasi-Public Passenger Rail Wanting to establish a coherent national policy on public rail transit, the Kennedy Administration also asked Congress to conduct a comprehensive study of US intercity transit policy and passenger rail right-of-ways, as a means to facilitate the creation of a national multimodal transit system. This emphasis on multi-modal transport was a departure from the planning convention of the time, which sought to improve the US transportation network by updating and expanding the US interstate system [12]. The Kennedy administration’s emphasis on an increased network of passenger rail connectivity was not enough to curb the high rate of rail discontinuances across the country. In response to the rapid decline of passenger train routes, the US government consolidated the declining private network of intercity passenger rail carries into a federally subsidized national rail system. The Nixon administration passed the Rail Passenger Service Act of 1970,
8
establishing the National Railroad Passenger Corporation. Beginning service in 1971 under the title of Amtrak, the new national rail system was established as a for-profit enterprise formed by three incorporators picked by the Nixon administration. The board was to be composed of 15 directors: 8 presidential appointments that required Senate confirmation, 3 elected by the common stockholders, and four elected by preferred stockholders. Existing railroads were the only companies allowed to participate as common stockholders and invested in the new company by providing Amtrak with rolling stock. Existing rail lines were allowed to opt out of the Amtrak common share program, however the bill required all non-participating railroads to maintain their current service routes for at least four years [11]. While freight rail services still operated as private, for-profit entities, the Rail Passenger Service Act of 1970 allowed the federal government to relieve freight rail lines of their common carriage responsibilities to transport passengers [3, 11]. It quickly became apparent that Amtrak was losing money and would require fiscal support from the federal government. The years that followed were peppered with additional funding bills, policies to regulate fares and various other interventions, creating a strong partnership between the federal government and Amtrak. Despite the need for public funding, Amtrak was successful in increasing the number of passenger miles traveled. By 1991, the number of intercity passenger miles in the US had doubled the 1972 levels [7]. This success was due, in part, to increased destination side connectivity, which resulted from the resurgence of urban commuter rail systems and new light rail systems. 2.4 Quasi-Public Commuter Rail Many of the discontinued private regional passenger carriers had operated both intercity passenger rail and express commuter rail services. When these carriers relinquished their common carrier responsibilities to Amtrak, the commuter rail services they operated were often discontinued with no replacement service. In many traditional US cities, commuter rail was a vital part of the urban transit system. In an effort to capitalize on the need for local commuter rail, the Consolidated Rail Corporation (Conrail) acquired five legacy commuter rail systems in the Northeastern United States. They were MARC, MBTA, Metro North, NJ Transit and SEPTA. Recognizing the need for commuter rail services, the additional 4 legacy commuter rail were acquired by public transit authorities as a means of retaining the commuter train services that were being lost due to the decline of private rail carries. By 1980, Conrail was on the verge of bankruptcy and trying to terminate its commuter rail operations. As a response to the company’s congressional request to discontinue commuter service, the Northeast Rail Service Act of 1981 (NERSA) relieved Conrail from its commuter service obligations. In 1983 and 1984, Conrail sold its five commuter rail systems to regional and municipal transit agencies [14, 15]. This move established the benchmark practice of commuter rails systems being under the governance of municipal and regional transit authorities.
9
Section 3
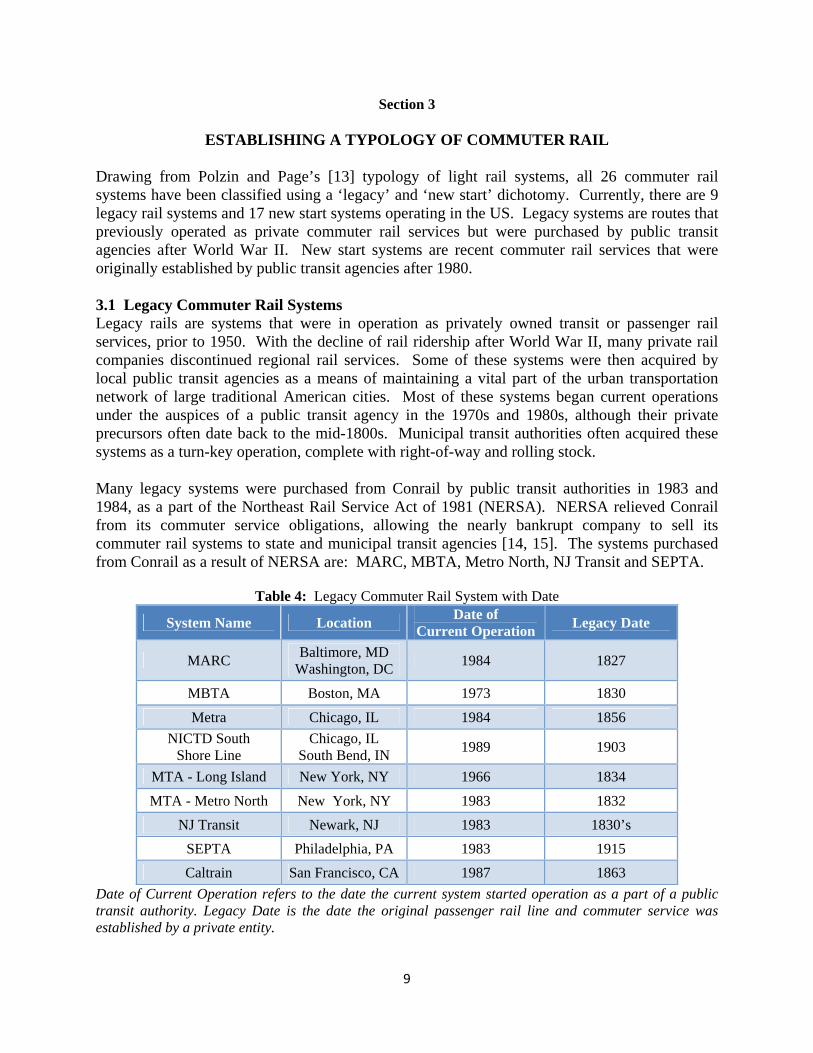
ESTABLISHING A TYPOLOGY OF COMMUTER RAIL Drawing from Polzin and Page’s [13] typology of light rail systems, all 26 commuter rail systems have been classified using a ‘legacy’ and ‘new start’ dichotomy. Currently, there are 9 legacy rail systems and 17 new start systems operating in the US. Legacy systems are routes that previously operated as private commuter rail services but were purchased by public transit agencies after World War II. New start systems are recent commuter rail services that were originally established by public transit agencies after 1980. 3.1 Legacy Commuter Rail Systems Legacy rails are systems that were in operation as privately owned transit or passenger rail services, prior to 1950. With the decline of rail ridership after World War II, many private rail companies discontinued regional rail services. Some of these systems were then acquired by local public transit agencies as a means of maintaining a vital part of the urban transportation network of large traditional American cities. Most of these systems began current operations under the auspices of a public transit agency in the 1970s and 1980s, although their private precursors often date back to the mid-1800s. Municipal transit authorities often acquired these systems as a turn-key operation, complete with right-of-way and rolling stock. Many legacy systems were purchased from Conrail by public transit authorities in 1983 and 1984, as a part of the Northeast Rail Service Act of 1981 (NERSA). NERSA relieved Conrail from its commuter service obligations, allowing the nearly bankrupt company to sell its commuter rail systems to state and municipal transit agencies [14, 15]. The systems purchased from Conrail as a result of NERSA are: MARC, MBTA, Metro North, NJ Transit and SEPTA.
Table 4: Legacy Commuter Rail System with Date
System Name Location Date of
Current Operation Legacy Date
MARC Baltimore, MD
Washington, DC 1984 1827
MBTA Boston, MA 1973 1830
Metra Chicago, IL 1984 1856
NICTD South Shore Line
Chicago, IL South Bend, IN
1989 1903
MTA - Long Island New York, NY 1966 1834
MTA - Metro North New York, NY 1983 1832
NJ Transit Newark, NJ 1983 1830’s
SEPTA Philadelphia, PA 1983 1915
Caltrain San Francisco, CA 1987 1863
Date of Current Operation refers to the date the current system started operation as a part of a public transit authority. Legacy Date is the date the original passenger rail line and commuter service was established by a private entity.
10
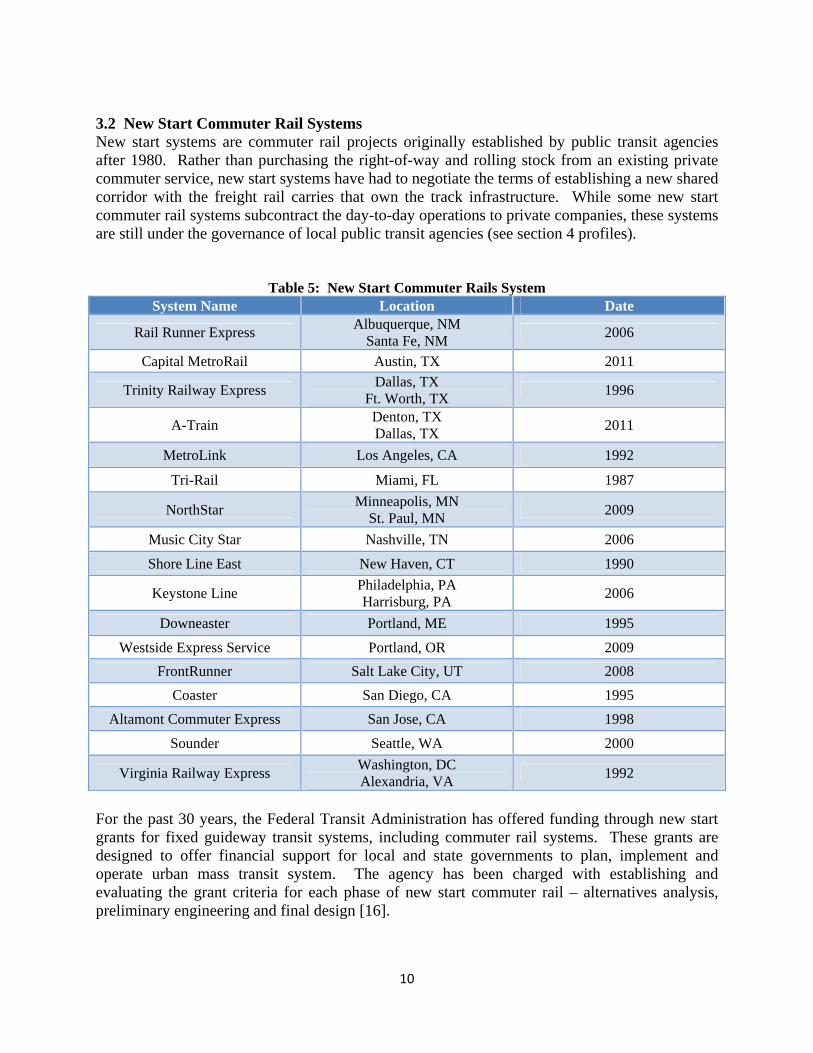
3.2 New Start Commuter Rail Systems New start systems are commuter rail projects originally established by public transit agencies after 1980. Rather than purchasing the right-of-way and rolling stock from an existing private commuter service, new start systems have had to negotiate the terms of establishing a new shared corridor with the freight rail carries that own the track infrastructure. While some new start commuter rail systems subcontract the day-to-day operations to private companies, these systems are still under the governance of local public transit agencies (see section 4 profiles).
Table 5: New Start Commuter Rails System System Name Location Date
Rail Runner Express Albuquerque, NM
Santa Fe, NM 2006
Capital MetroRail Austin, TX 2011
Trinity Railway Express Dallas, TX
Ft. Worth, TX 1996
A-Train Denton, TX Dallas, TX
2011
MetroLink Los Angeles, CA 1992
Tri-Rail Miami, FL 1987
NorthStar Minneapolis, MN
St. Paul, MN 2009
Music City Star Nashville, TN 2006
Shore Line East New Haven, CT 1990
Keystone Line Philadelphia, PA Harrisburg, PA
2006
Downeaster Portland, ME 1995
Westside Express Service Portland, OR 2009
FrontRunner Salt Lake City, UT 2008
Coaster San Diego, CA 1995
Altamont Commuter Express San Jose, CA 1998
Sounder Seattle, WA 2000
Virginia Railway Express Washington, DC Alexandria, VA
1992
For the past 30 years, the Federal Transit Administration has offered funding through new start grants for fixed guideway transit systems, including commuter rail systems. These grants are designed to offer financial support for local and state governments to plan, implement and operate urban mass transit system. The agency has been charged with establishing and evaluating the grant criteria for each phase of new start commuter rail – alternatives analysis, preliminary engineering and final design [16].
11
3.2.1 Establishing New Start Systems An examination of new start systems highlights three common scenarios employed by local transit agencies as they establish new commuter rail systems. The most common scenario is the establishment of new start commuter rail systems in areas that have recently begun to rapidly urbanize. These systems are designed and built from the ground up, often with no previous history of commuter rail service. For some systems, the initial justification for commuter rail is as a temporary solution to mitigate congestion from a major highway project. The Shore Line East in New Haven, Connecticut had its origins as a temporary congestion mitigation plan, but the success of the system has led to the permanent operation of the commuter service. The initial alternative analysis study for the forthcoming SunRail system in Orlando, Florida was implemented as a means of mitigating a major construction project on US Interstate 4. The second scenario is the reestablishment of long dormant commuter lines that existed in large urban centers but were not acquired by public transit agencies after their discontinuance. Some new start commuter rails had commuter services operating prior to 1950, but those services were abandoned for several decades prior to the implementation of new commuter rails. The primary example of this is the Virginia Railway Express, which services Washington, DC and Alexandria, Virginia. The contemporary commuter service began operations in 1992, nearly four decades after the last commuter rail system in Northern Virginia was discontinued. The third scenario is the modification of an existing passenger rail service to provide commuter rail services. These new start systems expand the capacity of existing Amtrak passenger rail services, allowing a set of commuter express trains to run hourly at peak hours. The Downeaster in Portland, Maine and the Keystone Line in Pennsylvania are excellent examples of this approach to establishing commuter rail. 3.2.2 New Start Shared Corridors One of the most important elements of establishing a new start commuter rail system is acquiring rail corridor access from the freight carriers that own the infrastructure. There are three arrangements for acquiring commuter right-of-way. The first is the outright purchasing of the corridor and track infrastructure. This usually requires the transit agency to allow the freight carrier to lease an exclusive right-of-way for freight movements on the tracks. The second arrangement is to purchase an easement from the freight carrier. The third is leasing time on the corridor. The Sounder in Seattle, Washington combined two scenarios: purchasing a section of track between Tacoma and Lakewood and agreeing to a long term lease to run 30 commuter trains a day from Seattle to Tacoma. The acquisition of right-of-way requires commuter rail systems to expand the capacity of the corridor to accommodate future commuter and freight needs. This includes actions such as double tracking and sidetracking shared corridor or funding infrastructural improvements for alternate lines to bypass the shared corridor. Purchasing the corridor requires the commuter rail system to maintain track infrastructure, including the dispatching services. By controlling dispatching services, a commuter system can

12
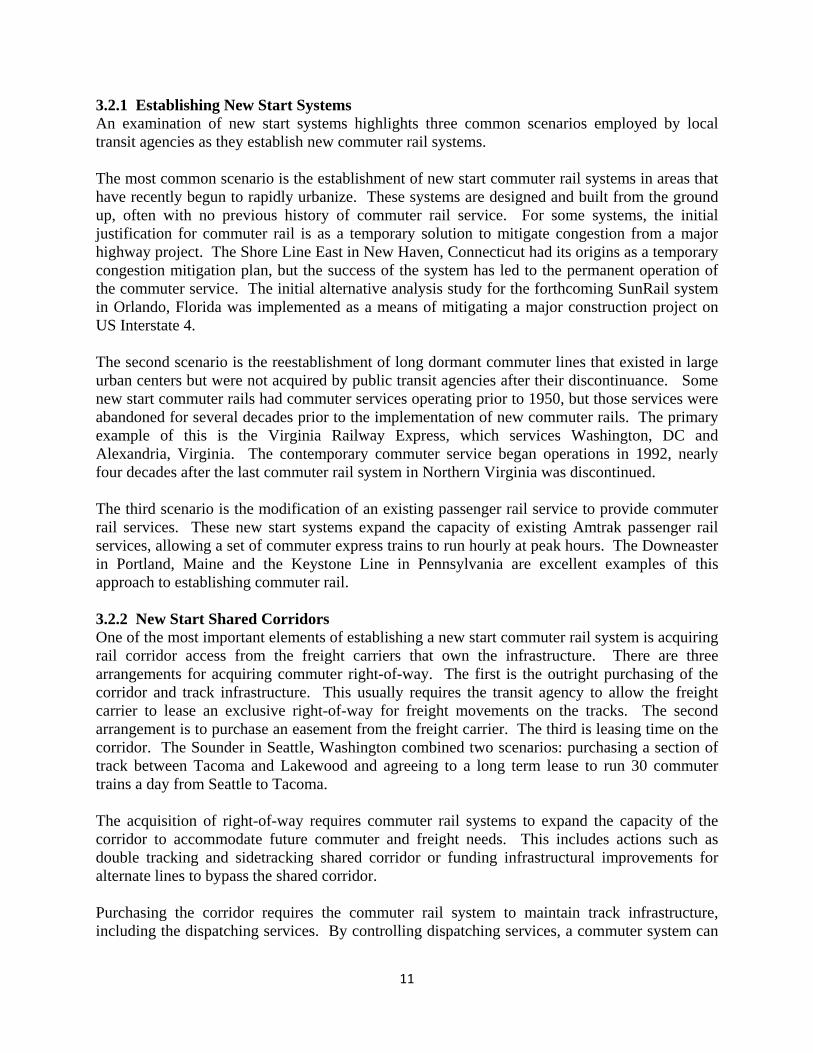
give priority to commuter trains. The RailRunner system in Albuquerque/Santa Fe, New Mexico purchased their corridor and operates the dispatch services for the line. Easement and leasing arrangements, such as the Tri-Rail system in Miami, Florida, allow the freight lines to maintain the signaling and dispatching operations on the line, thereby allowing the freight carrier to prioritize freight trains over commuter trains. The Tri-Rail system has historically had problems with their on-time performance record because of their lack of control over system dispatching services. To remedy this, the Tri-Rail system renegotiated track ownership and dispatch control, leading to the 2013 announcement that Tri-Rail was in the process of purchasing the track and assuming dispatching responsibilities for the track infrastructure in the system’s commuter corridor (see policy mobility section). 3.2.3 New Generation Commuter Design Unlike densely populated downtowns that exist in traditional American cities, such as New York and Chicago, the current generation of booming cities is characterized by low-density urban sprawl, stemming from automobile-centric city planning. These multinucleated suburban cities, whose vanguard include cities such as Dallas and Charlotte, are extending the metropolitan commuter sheds, which now serve as de facto urban units. Small suburban communities now function similar to urban neighborhoods in the pre-war American city. These new urban forms are giving rise to a new type of commuter rail line. The most recent new start commuter rail systems are beginning to function more as a hybrid between light rail and traditional regional rail. While legacy and early new start systems have only one or two stations in the downtown proper, more recent systems serve as both a suburban-to-downtown function as well as intra-urban transit system with several stations in the city center. This design element has been incorporated in the Rail Runner Express in Albuquerque/Santa Fe, New Mexico and Capital MetroRail in Austin, Texas. Commuter rail projects currently under construction, such as SunRail in central Florida. are also implementing a multiple-station design in the city center. Breaking with the traditional suburb to downtown model of commuter rail services, the Westside Express in Portland, Oregon has implemented the first suburb to suburb commuter rail system. This speaks to the growing importance of suburban connectivity in the contemporary urban form. This system connects Wilsonville to the Beaverton transit center, where commuter rail passengers can transfer to the Portland light rail system and travel downtown.
13
Table 6: A Typology of Urban Form and Commuter Rail Design
* System currently under construction

14
3.2.4 Policy Mobility The current iterations of new start commuter rail systems draw from successes and shortcomings of previous commuter rail systems. As commuter rail systems are established, project planners draw upon knowledge from existing rail systems by designating benchmark cities and employing the current set of best practices for project components, such as system design, transit oriented development, corridor acquisition and project financing. Benchmarking and policy transfer are crucial components of building a successful system, as more recent generations of commuter rail learn from the policy decisions of previously established rail. These policies are mobilized nationally and modified locally, in an effort to better establish successful commuter rail systems As an example of policy mobility, the Tri-Rail system recently restructured their lease agreement to purchase the track infrastructure used by the commuter system [17]. Tri-Rail was able to establish a new agreement similar to the SunRail contract to purchase track infrastructure in Orlando. While the first commuter rail system to establish dispatching rights for the system was RailRunner in New Mexico, the practice became a benchmark. SunRail mobilized this policy and bought the track infrastructure and dispatching rights for the Orlando system. With a policy structure in place for purchasing rail corridors and establishing dispatching centers, the Miami system was able to mobilize the shared corridor policy from Central Florida and renegotiate a similar contract on the South Florida system. Tri-Rail, the first new start commuter rail in the US, illustrates the means by which mobilized policies can come full circle. Project planners and local policymakers serve as transfer agents collecting and disseminating best practices through networking with colleagues, shared project consultants and information gathering trips. Many cities considering establishing a commuter rail system send a delegation of local planners and policymaker to visit benchmark cities with similar demographics. Systems in the planning phase conduct conferences, asking members of other commuter rail systems to share their institutional knowledge on establishing a commuter rail system. Perhaps the greatest means by which commuter rail practices are transferred is a shared set of consultants or experts. These include specialized private consultants, individual experts or large firms, and the new start commuter rail program managers at the FTA. The FTA highlights the current state of best practices for commuter rail and connects establishing systems with established commuter rail systems as part of the new start grant process.

15
Section 4
COMMUTER SYSTEM PROFILES 4.1 Profile Overview This section provides a system profile of all 26 commuter rail systems. These profiles include information on the organizational structure of the system, the ridership numbers, service area demographics, system classification and budget data. 4.2 Commuter Rail System Profiles Note: See Appendix B for definitions and data sources for each profile category. Much of the data comes from the FTA National Transit Database, APTA Transit Ridership Report and self-reported documentation from each of the commuter rail systems. Also see Appendix C for a complete bibliography of data sources used to create these profiles. The system profiles are listed in alphabetical by the city served by the commuter rail system.

16
Rail Runner Express
Albuquerque and Santa Fe, NM
Transit Agency: Rio Metro Regional Transit District FTA Number: 6111 Agency Purview: Exclusively Commuter Rail System Operator: Herzog Transit Services Freight Operator: BNSF Daily Ridership: 4,000 2011 Ridership: 1,242,100 MSA Population: 887,077 Service Population: 503,797 Established: 2006 Classification: New Start Track Miles: 97 Stations: 15 2009 Operational Expenditures: Total Expenditures $19,056,806 Per Passenger Mile $0.43 Per passenger Trip $17.60 2009 Fare Generated Revenue: $2,669,729 2012 Fare Rates: $2-$10 Notes: The system began operation in Albuquerque in 2006 and expanded services to Santa Fe in 2008. The first phase of the project connected Belen and Bernalillo on existing Burlington North Santa Fe railway (BNSF). The second phase required new tracks to extend the system from Bernalillo to Santa Fe, some of which is on a reserved right-of-way in the median of US Interstate-25. Utilizing existing right-of-way corridors was important to insure none of the surrounding Native American lands would have to be acquired. Since the commuter rail operates within the envelope of the BNSF and the I-25 corridor, no additional land acquisition was required.

17
Capital MetroRail
Austin, TX
Transit Agency: Capital Metropolitan Transportation Authority FTA Number: 6048 Agency Purview: Multimodal System Operator: Herzog Transit Services Freight Operator: Watco Companies Daily Ridership: 1,600 2011 Ridership: 469,300 MSA Population: 1,716,000 Service Population: 892,102 Established: 2011 Classification: New Start Track Miles: 32 Stations: 9 2009 Operational Expenditures: Total Expenditure Not Available Per Passenger Mile Not Available Per passenger Trip Not Available 2009 Fare Generated Revenue: Not Available 2012 Fare Rates: $2.25 Notes: The system was not operational during 2009, which is the most recent complete FTA dataset available.

18
MARC Maryland Area Regional Commuter
Baltimore, MD and Washington DC
Transit Agency: Maryland Transit Authority FTA Number: 3034 Agency Purview: Multimodal System Operator: Amtrak; CSX Transportation* Freight Operator: CSX Daily Ridership: 33,700 2011 Ridership: 8,286,000 MSA Population: 8,292,659 Service Population: 2,077,667 Established: 1984 Classification: Legacy Legacy Date: 1827 Track Miles: 200 Stations: 42 2009 Operational Expenditures: Total Expenditure $109,135,596 Per Passenger Mile $0.43 Per passenger Trip $13.50 2009 Fare Generated Revenue: $35,238,992 2012 Fare Rates: $4-$14 Notes: *While CSX Transportation is the current system operator for MARC, the class I freight rail company is phasing out its commuter rail operations. Beginning in 2010, MARC started taking bids for a new firm to operate the system. The bid process has since been delayed.

19
MBTA Massachusetts Bay Transportation Authority
Boston, MA
Transit Agency: Massachusetts Bay Transit Authority FTA Number: 1003 Agency Purview: Multimodal System Operator: Massachusetts Bay Commuter Rail Company (MBCR); Veolia Transportation Freight Operator: CSX Daily Ridership: 130,700 2011 Ridership: 36,429,400 MSA Population: 4,552,402 Service Population: 4,510,400 Established: 1973 Classification: Legacy Legacy Date: 1830’s Track Miles: 368 Stations: 123 2009 Operational Expenditures: Total Expenditure $277,168,433 Per Passenger Mile $0.34 Per passenger Trip $6.83 2009 Fare Generated Revenue: $137,526,396 2012 Fare Rates: $2-$11 Notes: Many rail lines were built in the 1830s that would ultimately become part of the MBTA commuter rail system. Some lines of note include: Boston and Worcester/Boston Albany (1831), Boston and Lowell (1835), Boston and Maine (1835), Boston and Portland (1839). These lines began to discontinue passenger services in the 1960s. The state slowly began to acquire and operate these lines. In 1974, the MBTA began operating the lines as a singular commuter rail system that was managed by a public transit agency.

20
Metra
Chicago, IL
Transit Agency: Northeast Illinois Regional Commuter Railroad Corp. (NIRCRC) FTA Number: 5118 Agency Purview: Exclusively Commuter Rail System Operator: NIRCRC Operations and PAS Operations* Freight Operator: BNSF; Union Pacific; Chicago South Shore and South Bend Railroad Daily Ridership: 304,300 2011 Ridership: 72,166,500 MSA Population: 9,461,105 Service Population: 7,261,176 Established: 1984 Classification: Legacy Legacy Date: 1856 Track Miles: 488 Stations: 239 2009 Operational Expenditures: Total Expenditure $548,648,030 Per Passenger Mile $0.33 Per passenger Trip $7.64 2009 Fare Generated Revenue: $236,067,676 2012 Fare Rates: $2.75-$9.25 Notes: * NIRCRC operates most Metra commuter services along tracks either owned by the transit authority or with trackage rights leasing agreements, however some sections of the system require operational services to be purchases from the freight carrier. Purchase Service Agreements (PSA) are required along four lines. Along these lines Metra commuter services to be operated by Union Pacific and BNSF.

21
South Shore Line
Chicago, IL and South Bend, IN
Transit Agency: Northern Indiana Commuter Transit District (NICTD) FTA Number: 5104 Agency Purview: Exclusively Commuter Rail System Operator: Northern Indiana Commuter Transit District (NICTD) Freight Operator: The Chicago Southshore and South Bend Railroad Daily Ridership: 12,100 2011 Ridership: 3,681,200 MSA Population: 9,780,329 Service Population: 958,644 Established: 1989 Classification: Legacy Legacy Date: 1903; Chicago, Lakeshore and South Bend Railway
1925; The South Shore Line Track Miles: 90 Stations: 19 2009 Operational Expenditures: Total Expenditure $39,250,585 Per Passenger Mile $0.36 Per passenger Trip $10.10 2009 Fare Generated Revenue: $17,718,766 2012 Fare Rates: $3.25-$11.75 Notes: Unlike the other US commuter rail systems that currently operate diesel engine locomotives, the South Shore line is an electric interurban commuter rail system. This system is one of the last two remaining electric commuter rail in the country (SEPTA is the other electric power system). This legacy interurban rail line and street car system operated under private ownership and several names from its founding in 1903 until the line applied for discountenance in 1976. Some of these names include: The Chicago & Indiana Air Line Railway (1903); The Chicago, Lake Shore and South Bend Railway (1904); and The Chicago South Shore and South Bend Railroad (1925).

22
Trinity Railway Express
Dallas and Ft. Worth, TX
Transit Agency: Dallas Area Rapid Transit (DART)
Fort Worth Transportation Authority (The T) FTA Number: 6056 (DART); 6007 (The T) Agency Purview: Multimodal System Operator: Herzog Transit Services Freight Operator: BNSF; Union Pacific; Dallas, Garland & Northeastern;
Fort Worth & Western Railroad Daily Ridership: 8,400 2011 Ridership: 2,364,900 MSA Population: 6,371,773 Service Population: 3,108,300* Established: 1996 Classification: New Start Track Miles: 34 Stations: 10 2009 Operational Expenditures: Total Expenditure $24,278,188* Per Passenger Mile $0.76 (DART); $.52 (The T) Per passenger Trip $8.99 (DART); $8.69 (The T) 2009 Fare Generated Revenue: $2,910,279* 2012 Fare Rates: $3.50-$5.00 Notes: *The Trinity Railway Expressway is a joint venture between the Dallas Area Rapid Transit (DART) and the Fort Worth Transportation Authority (The T). These profile sections reflect the total combined statistics of both transit agencies. Please refer to the 2009 FTA Annual Report for the totals separated by agency.
23
A-Train
Denton and Dallas, TX
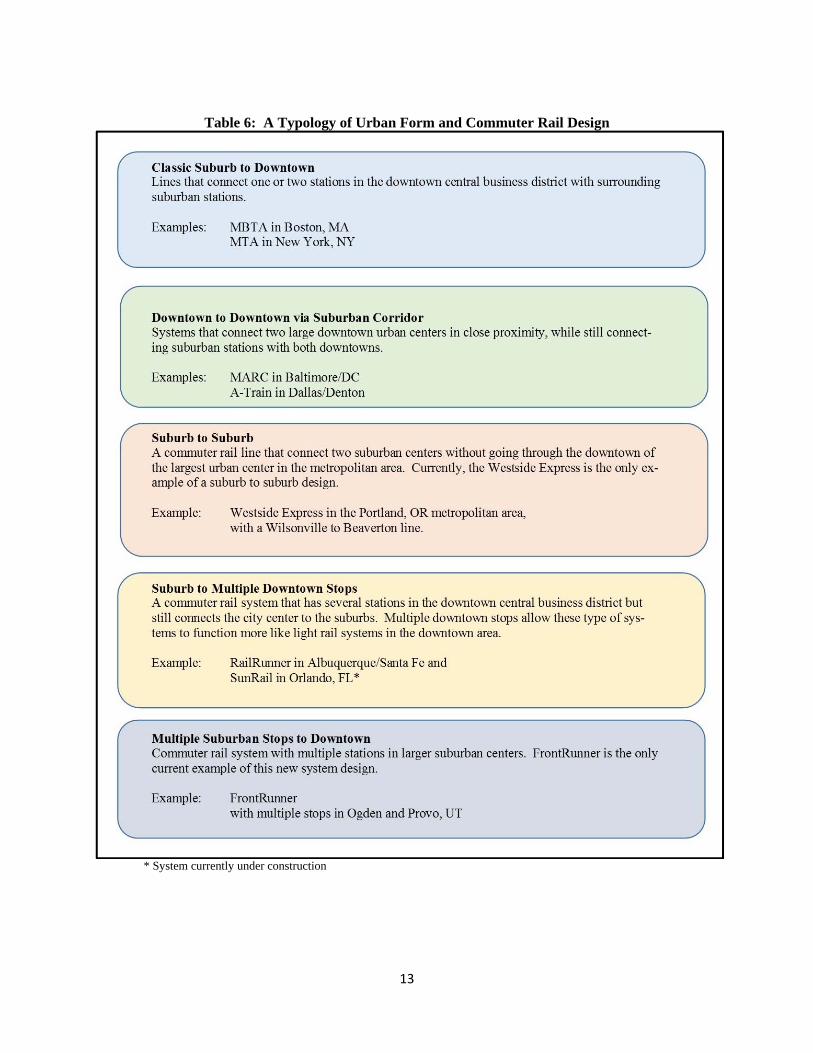
Transit Agency: Denton County Transportation Authority (DCTA) FTA Number: 6101 Agency Purview: Multimodal System Operator: North Texas Rail Group* Freight Operator: Union Pacific Daily Ridership: 1,400 2011 Ridership: 214,900 MSA Population: 6,371,773 Service Population: 234,552 Established: 2011 Classification: New Start Track Miles: 21 Stations: 6 2009 Operational Expenditures: Total Expenditure Not Available Per Passenger Mile Not Available Per passenger Trip Not Available 2009 Fare Generated Revenue: Not Available 2012 Fare Rates: $3-$5 Notes: *The North Texas Rail Group is a private consortium composed of the private rail construction and operations firms of Herzog and Archer West. The system was not operational during 2009, which is the most recent complete FTA dataset available.
24
MetroLink
Los Angeles, CA
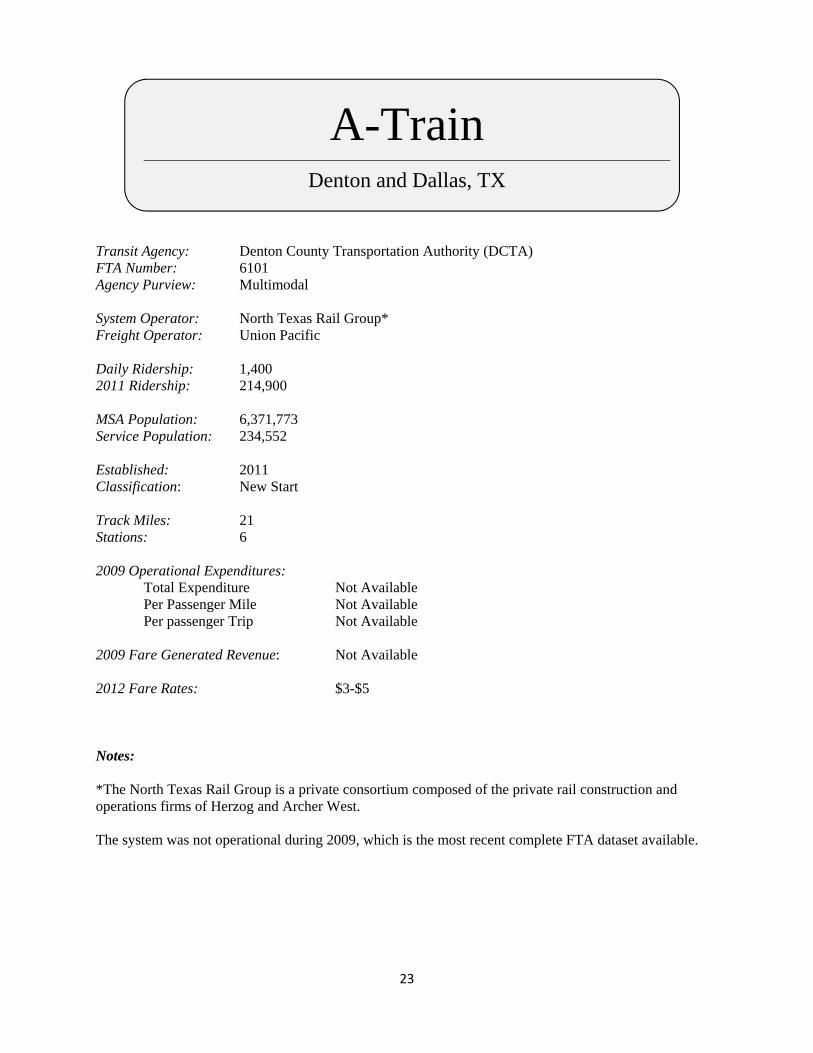
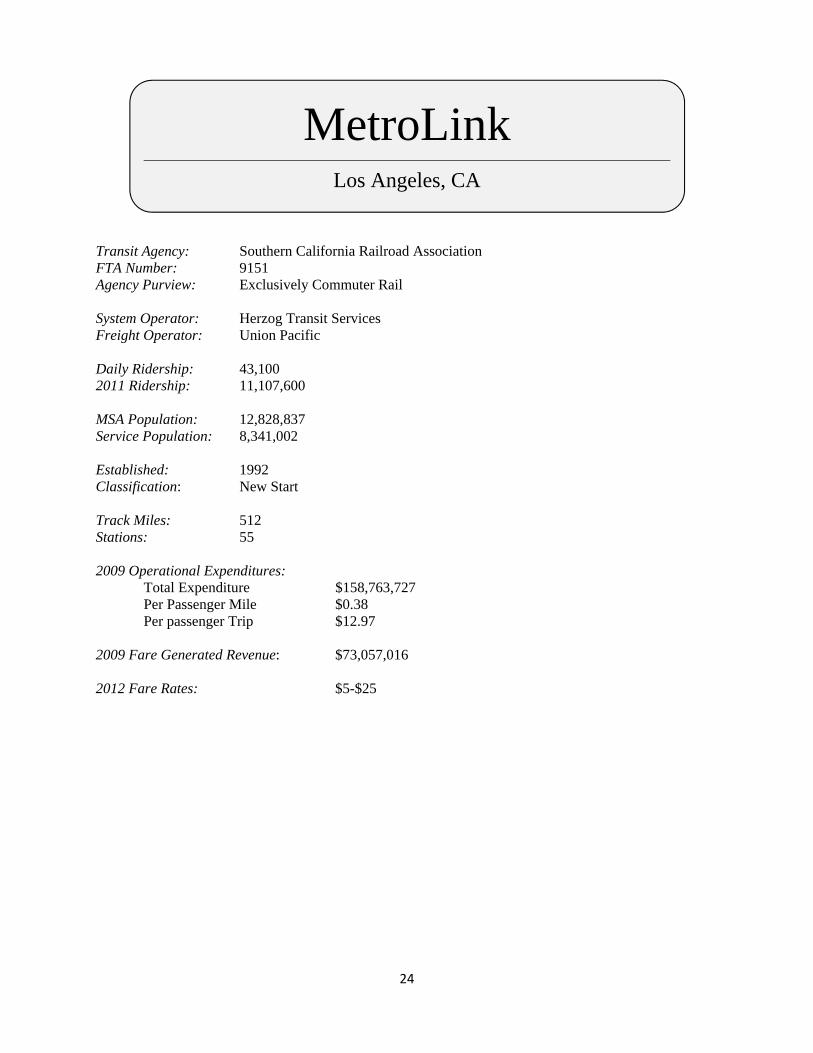
Transit Agency: Southern California Railroad Association FTA Number: 9151 Agency Purview: Exclusively Commuter Rail System Operator: Herzog Transit Services Freight Operator: Union Pacific Daily Ridership: 43,100 2011 Ridership: 11,107,600 MSA Population: 12,828,837 Service Population: 8,341,002 Established: 1992 Classification: New Start Track Miles: 512 Stations: 55 2009 Operational Expenditures: Total Expenditure $158,763,727 Per Passenger Mile $0.38 Per passenger Trip $12.97 2009 Fare Generated Revenue: $73,057,016 2012 Fare Rates: $5-$25
25
Tri-Rail
Miami and Ft. Lauderdale, FL
Transit Agency: South Florida Regional Transit Authority (SFRTA) FTA Number: 4077 Agency Purview: Multimodal System Operator: Veolia Transportation Freight Operator: CSX Daily Ridership: 14,000 2011 Ridership: 3,947,900 MSA Population: 5,564,635 Service Population: 5,448,962 Established: 1987 Classification: New Start Track Miles: 72 Stations: 18 2009 Operational Expenditures: Total Expenditure $52,871,662 Per Passenger Mile $0.43 Per passenger Trip $12.52 2009 Fare Generated Revenue: $9,744,718 2012 Fare Rates: $2.50-$7.00 Notes: The Tri-Rail system was the first new start commuter rail in the U.S.

26
Northstar
Minneapolis and St. Paul, MN
Transit Agency: Metro Transit FTA Number: 5027 Agency Purview: Multimodal System Operator: Metro Transit Freight Operator: BNSF Daily Ridership: 2,100 2011 Ridership: 703,400 MSA Population: 3,279,833 Service Population: 1,858,545 Established: 2009 Classification: New Start Track Miles: 40 Stations: 6 2009 Operational Expenditures: Total Expenditure $4,977,709 Per Passenger Mile $2.55 Per passenger Trip $63.18 2009 Fare Generated Revenue: $269,527 2012 Fare Rates: $3.25-$7.00 Notes: The NorthStar commuter rail system runs from Big Lake to downtown Minneapolis. This system connects with the light rail system, Hiawatha Line, at the downtown terminus at Target Field. Although currently operating on 40 miles of the corridor, the NorthStar Corridor Development Authority has secured the right-of-way for an 82 mile corridor. An expansion project to connect the Big Lake terminus with a line to St. Cloud is being proposed.
27
Music City Star
Nashville, TN
Transit Agency: Regional Transportation Authority FTA Number: 4159 Agency Purview: Multimodal System Operator: Transit Solutions Group Freight Operator: CSX Daily Ridership: 1,100 2011 Ridership: 279,300 MSA Population: 1,589,934 Service Population: 1,447,856 Established: 2006 Classification: New Start Track Miles: 32 Stations: 6 2009 Operational Expenditures: Total Expenditure $4,072,168 Per Passenger Mile $1.25 Per passenger Trip $22.45 2009 Fare Generated Revenue: $748,902 2012 Fare Rates: $2-$5

28
Shore Line East
New Haven, CT
Transit Agency: Connecticut Department of Transportation FTA Number: 1102 Agency Purview: Multimodal System Operator: Amtrak Freight Operator: CSX; Providence and Worchester Railroad Daily Ridership: 2,100 2011 Ridership: 614,100 MSA Population: 862,477 Service Population: 375,000 Established: 1990 Classification: New Start Track Miles: 59 Stations: 11 2009 Operational Expenditures: Total Expenditure $20,065,016 Per Passenger Mile $1.62 Per passenger Trip $33.80 2009 Fare Generated Revenue: $9,932,099 2012 Fare Rates: $2.75-$8.50 Notes: Like several recent commuter rail resurgences, the 1990 start of the Shore Line East was initially designed to be a congestion mitigation measure during interstate highway construction projects.

29
MTA: Long Island
New York, NY
Transit Agency: MTA Long Island Rail Road FTA Number: 2100 Agency Purview: Exclusively Commuter Rail System Operator: MTA Freight Operator: New York and Atlantic Railway Daily Ridership: 324,300 2011Ridership: 98,902,000 MSA Population: 18,897,109 Service Population: 11,720,000 Established: 1966 Classification: Legacy Legacy Date: 1834 Track Miles: 700 Stations: 124 2009 Operational Expenditures: Total Expenditure $1,104,479,277 Per Passenger Mile $0.57 Per passenger Trip $11.35 2009 Fare Generated Revenue: $509,332,964 2012 Fare Rates: $3.00-$25.00 Notes: The New York and Atlantic Railway, a subsidiary of Anacostia and Pacific, was given a 20 year contact as the freight carrier on the Long Island line. This was an attempt to streamline freight shipments, with the goal of increasing the efficiency of freight without interrupting commuter rail services.
30
MTA: Metro North
New York, NY
Transit Agency: Metro North Commuter Railroad Company FTA Number: 2078 Agency Purview: Multimodal System Operator: MTA Freight Operator: Canadian Pacific; CSX; Norfolk Southern; Providence and Worcester;
Housatonic Railroad Daily Ridership: 281,200 2011 Ridership: 81,803,100 MSA Population: 18,897,109 Service Population: 6,503,894 Established: 1983 Classification: Legacy Legacy Date: 1832 Track Miles: 384 Stations: 120 2009 Operational Expenditures: Total Expenditure $858,509,601 Per Passenger Mile $0.39 Per passenger Trip $10.80 2009 Fare Generated Revenue: $501,937,095 2012 Fare Rates: $2.25-$22.00 Notes: The original rail, that would become Metro North, was established in 1832 as the New York and Harlem Railroad. In 1983 Conrail was operating the commuter service but was nearly bankrupt. In an effort to keep the commuter rail service operating, the MTA purchased the line and began operating the system.

31
New Jersey Transit
Newark, NJ
Transit Agency: New Jersey Transit Corporation FTA Number: 2080 Agency Purview: Multimodal System Operator: Herzog Transit Services Freight Operator: Conrail; CSX; and Norfolk Southern Daily Ridership: NA (Not Reported)* 2011Ridership: 78,555,100 MSA Population: 18,897,109 Service Population: 17,799,861 Established: 1983 Classification: Legacy Legacy Date: 1830’s Track Miles: 498 Stations: 165 2009 Operational Expenditures: Total Expenditure $841,817,971 Per Passenger Mile $0.36 Per passenger Trip $10.07 2009 Fare Generated Revenue: $417,474,880 2012 Fare Rates: $2-$16 Notes: *No daily average ridership numbers are included in the APTA ridership report for 2012 or 2011. New Jersey Transit Rail Operations, a secondary subsidiary to New Jersey Transit, was established in 1983 and charged with managing the state’s commuter rail service. NJ Transit acquired the commuter rail system previously operated by Consolidated Rail Corporation (ConRail), after Congress ordered the discontinuation of Conrail passenger service in 1983. The first lines in the consolidated system were established in the mid-1830’s, including the early iterations of the the Erie-Lackawanna, Central Penn, Jersey Central and the Reading lines.

32
SEPTA Southeastern Pennsylvania Transportation Authority
Philadelphia, PA
Transit Agency: Southeastern Pennsylvania Transportation Authority (SEPTA) FTA Number: 3019 Agency Purview: Multimodal System Operator: SEPTA Freight Operator: CSX Daily Ridership: 123,500 2011 Ridership: 35,709,200 MSA Population: 5,965,343 Service Population: 3,337,770 Established: 1983 Classification: Legacy Legacy Date: 1915 Track Miles: 289 Stations: 153 2009 Operational Expenditures: Total Expenditure $219,782,314 Per Passenger Mile $0.44 Per passenger Trip $6.16 2009 Fare Generated Revenue: $123,337,758 2012 Fare Rates: $4 - $10 Notes: Unlike the other US commuter rail systems that currently operate diesel engine locomotives, the SEPTA is an electric interurban commuter rail system. This system is one of the last two remaining electric commuter rail in the country (South Shore Line is the other electric power system). Delaware Transit Corporation (TSA Number 3075) purchases commuter rail transit services from SEPTA. DTC subsidizes the SEPTA line that connects New Castle County, Delaware to downtown Philadelphia.
33
Keystone Line
Philadelphia, PA and Harrisburg, PA
Transit Agency: Pennsylvania Department of Transportation (PennDOT) FTA Number: 3057 Agency Purview: Exclusively Commuter Rail* System Operator: Amtrak Freight Operator: None - Sealed Corridor Daily Ridership: 1,800 2011 Ridership: 566,700 MSA Population: 6,514,818 Service Population: 3,100,000 Established: 2006 Classification: New Start Track Miles: 104 Stations: 12 2009 Operational Expenditures: Total Expenditure $16,271,442 Per Passenger Mile $0.41 Per passenger Trip $31.38 2009 Fare Generated Revenue: $7,988,939 2012 Fare Rates: $5-$30 Notes: *Despite the obvious involvement with various modes of transportation, the only transit service that PennDOT operates is the KeyStone Line commuter rail. While the Keystone Line functions as a commuter rail system, as well as being consider commuter rail by FTA, the 2006 infrastructure improvements allows the Keystone Line to reach speeds of 110 mph. This express service speed is second only to the Acela Line in northeast corridor and qualifies the Keystone Line for Federal Railroad Administration (FRA) high speed corridor funds. A Keystone Line West line is being considered to connect Harrisburg to Pittsburgh with the same type of commuter rail service.
34
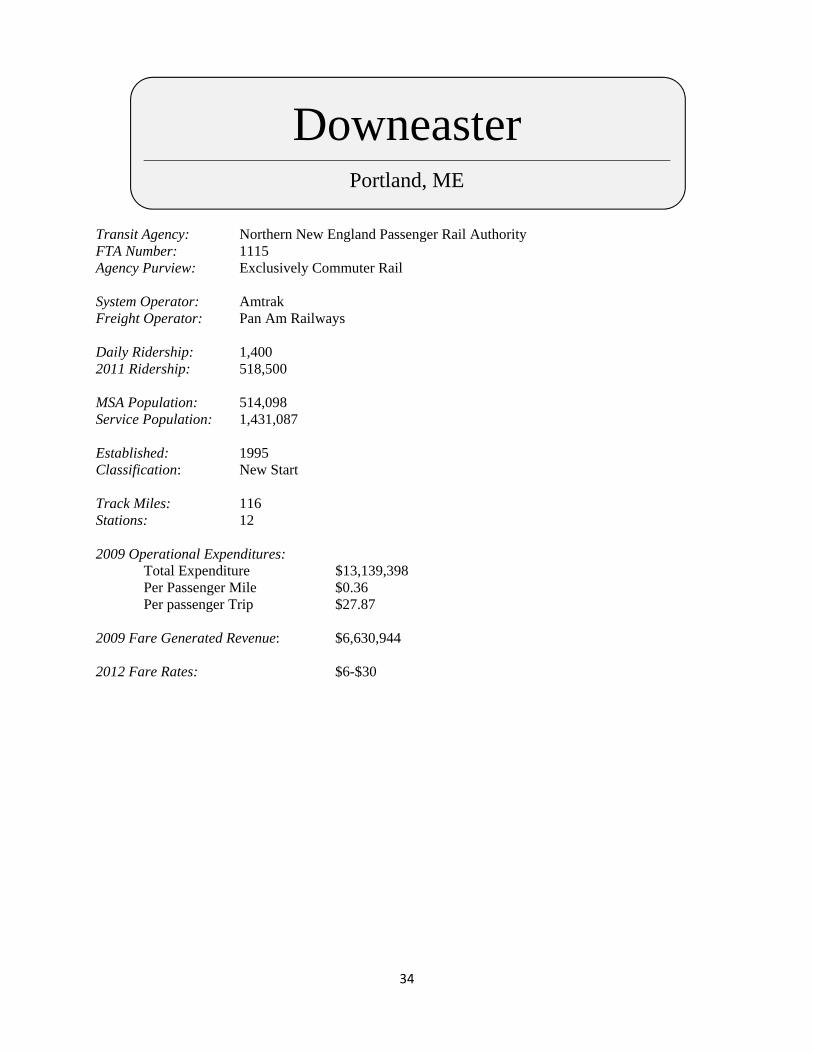
Downeaster
Portland, ME
Transit Agency: Northern New England Passenger Rail Authority FTA Number: 1115 Agency Purview: Exclusively Commuter Rail System Operator: Amtrak Freight Operator: Pan Am Railways Daily Ridership: 1,400 2011 Ridership: 518,500 MSA Population: 514,098 Service Population: 1,431,087 Established: 1995 Classification: New Start Track Miles: 116 Stations: 12 2009 Operational Expenditures: Total Expenditure $13,139,398 Per Passenger Mile $0.36 Per passenger Trip $27.87 2009 Fare Generated Revenue: $6,630,944 2012 Fare Rates: $6-$30

35
Westside Express Service
Portland, OR
Transit Agency: Tri-County Metroplitan Transportation District of Oregon FTA Number: 0008 Agency Purview: Multimodal System Operator: TriMet Freight Operator: Portland and Western Railroad Daily Ridership: 1,600 2011 Ridership: 400,800 MSA Population: 2,226,009 Service Population: 1,488,169 Established: 2009 Classification: New Start Track Miles: 15 Stations: 5 2009 Operational Expenditures: Total Expenditure $1,488,169 Per Passenger Mile $2.97 Per passenger Trip $25.60 2009 Fare Generated Revenue: $107,831 2012 Fare Rates: $2.50-$5 Notes: The Westside Express Service is the only suburban to suburban commuter rail that does not have a downtown station.
36
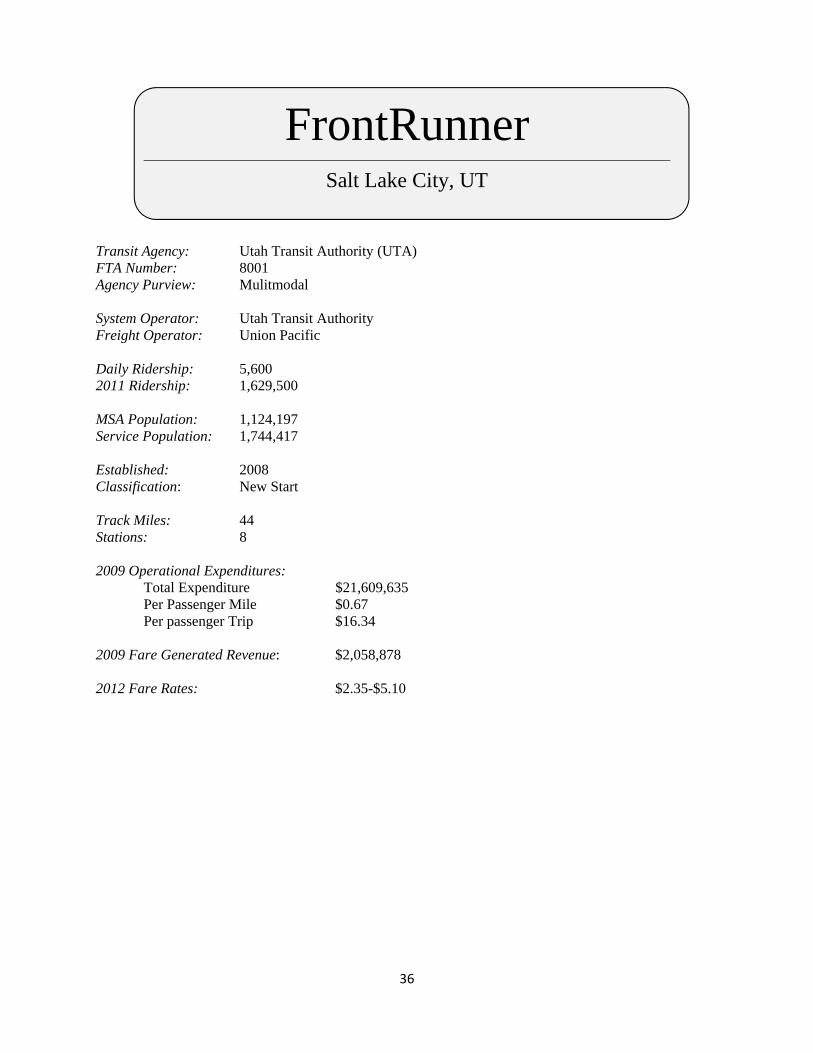
FrontRunner
Salt Lake City, UT
Transit Agency: Utah Transit Authority (UTA) FTA Number: 8001 Agency Purview: Mulitmodal System Operator: Utah Transit Authority Freight Operator: Union Pacific Daily Ridership: 5,600 2011 Ridership: 1,629,500 MSA Population: 1,124,197 Service Population: 1,744,417 Established: 2008 Classification: New Start Track Miles: 44 Stations: 8 2009 Operational Expenditures: Total Expenditure $21,609,635 Per Passenger Mile $0.67 Per passenger Trip $16.34 2009 Fare Generated Revenue: $2,058,878 2012 Fare Rates: $2.35-$5.10

37
Coaster
San Diego, CA
Transit Agency: North County Transit District (NCTD) FTA Number: 9030 Agency Purview: Multimodal System Operator: Transit America Services* Freight Operator: BNSF Daily Ridership: 5,300 2011 Ridership: 1,547,200 MSA Population: 3,095,313 Service Population: 850,000 Established: 1995 Classification: New Start Track Miles: 42 Stations: 8 2009 Operational Expenditures: Total Expenditure $16,439,884 Per Passenger Mile $0.39 Per passenger Trip $10.95 2009 Fare Generated Revenue: $6,975,640 2012 Fare Rates: $4.00-$5.50 Notes: *Transit America Services is a subsidiary of Herzog Transit Service.

38
Caltrain
San Francisco, CA
Transit Agency: Peninsula Corridor Joint Power Board (PCJBP) FTA Number: 9134 Agency Purview: Multimodal System Operator: Transit America Services* Freight Operator: Union Pacific Daily Ridership: 42,400 2011 Ridership: 13,243,200 MSA Population: 6,172,302 Service Population: 3,690,367 Established: 1987 Classification: Legacy Legacy Date: 1863 Track Miles: 75 Stations: 32 2009 Operational Expenditures: Total Expenditure $87,035,619 Per Passenger Mile $0.30 Per passenger Trip $7.66 2009 Fare Generated Revenue: $41,263,557 2012 Fare Rates: $3-$13 Notes: *Transit America Service is a subsidiary of Herzog Transit Services. Transit America took over Caltrain operations on May 25th, 2012. Prior to Transit America, the system was operated by Amtrak (1992-2012) and Southern Pacific (1980-1992).
39
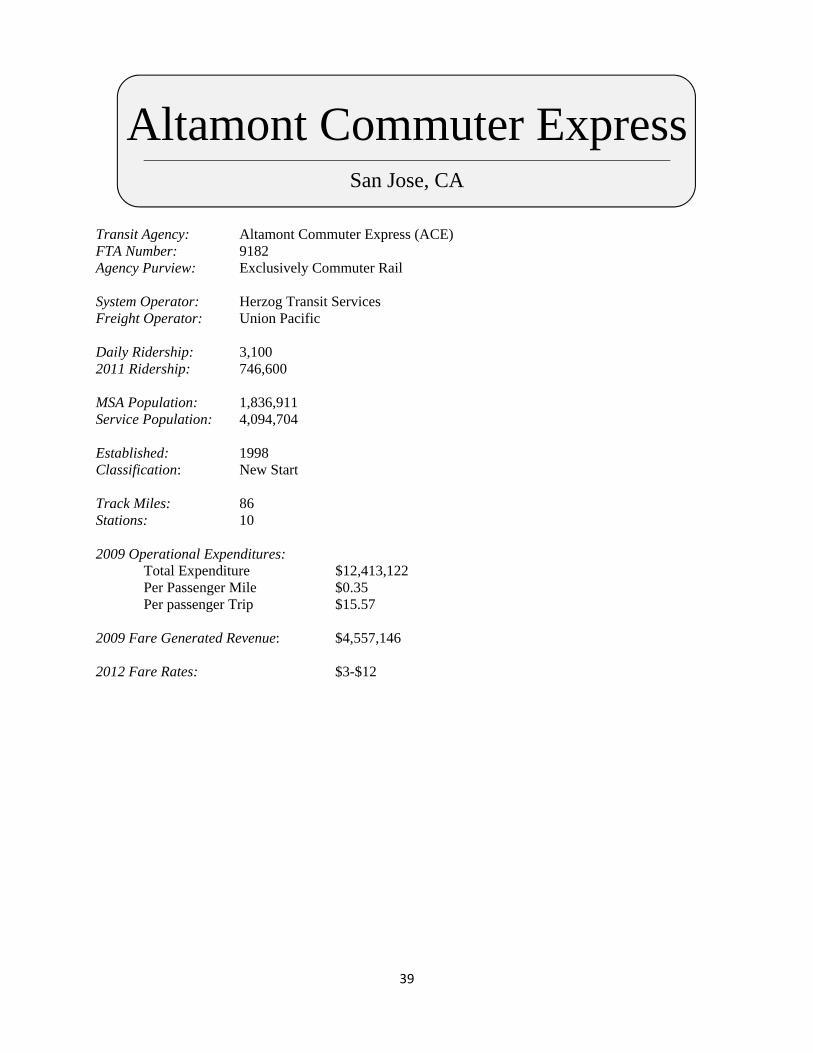
Altamont Commuter Express
San Jose, CA
Transit Agency: Altamont Commuter Express (ACE) FTA Number: 9182 Agency Purview: Exclusively Commuter Rail System Operator: Herzog Transit Services Freight Operator: Union Pacific Daily Ridership: 3,100 2011 Ridership: 746,600 MSA Population: 1,836,911 Service Population: 4,094,704 Established: 1998 Classification: New Start Track Miles: 86 Stations: 10 2009 Operational Expenditures: Total Expenditure $12,413,122 Per Passenger Mile $0.35 Per passenger Trip $15.57 2009 Fare Generated Revenue: $4,557,146 2012 Fare Rates: $3-$12
40
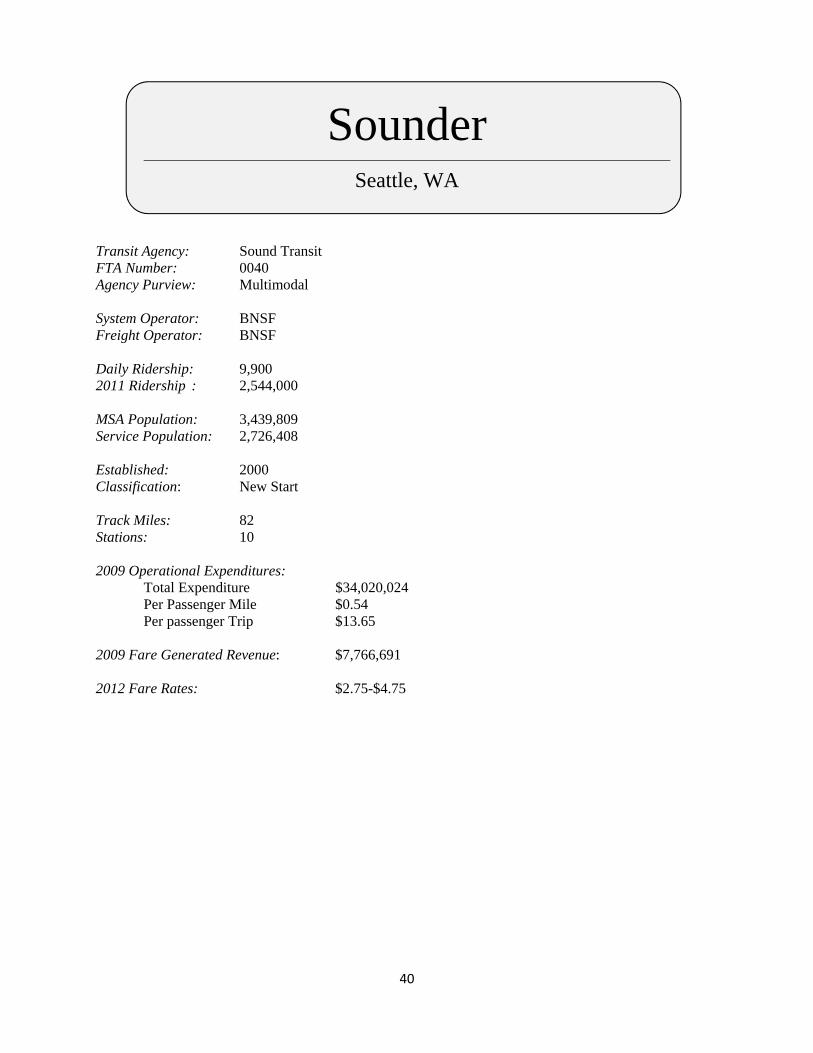
Sounder
Seattle, WA
Transit Agency: Sound Transit FTA Number: 0040 Agency Purview: Multimodal System Operator: BNSF Freight Operator: BNSF Daily Ridership: 9,900 2011 Ridership : 2,544,000 MSA Population: 3,439,809 Service Population: 2,726,408 Established: 2000 Classification: New Start Track Miles: 82 Stations: 10 2009 Operational Expenditures: Total Expenditure $34,020,024 Per Passenger Mile $0.54 Per passenger Trip $13.65 2009 Fare Generated Revenue: $7,766,691 2012 Fare Rates: $2.75-$4.75
41
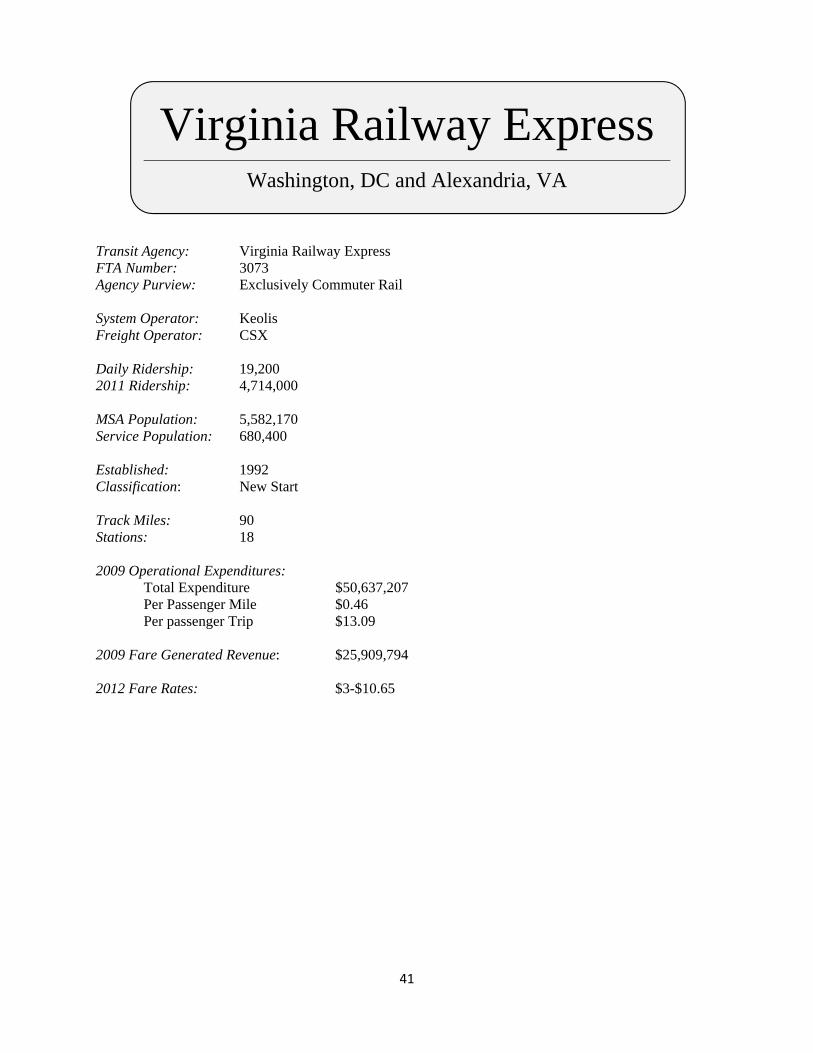
Virginia Railway Express
Washington, DC and Alexandria, VA
Transit Agency: Virginia Railway Express FTA Number: 3073 Agency Purview: Exclusively Commuter Rail System Operator: Keolis Freight Operator: CSX Daily Ridership: 19,200 2011 Ridership: 4,714,000 MSA Population: 5,582,170 Service Population: 680,400 Established: 1992 Classification: New Start Track Miles: 90 Stations: 18 2009 Operational Expenditures: Total Expenditure $50,637,207 Per Passenger Mile $0.46 Per passenger Trip $13.09 2009 Fare Generated Revenue: $25,909,794 2012 Fare Rates: $3-$10.65
42
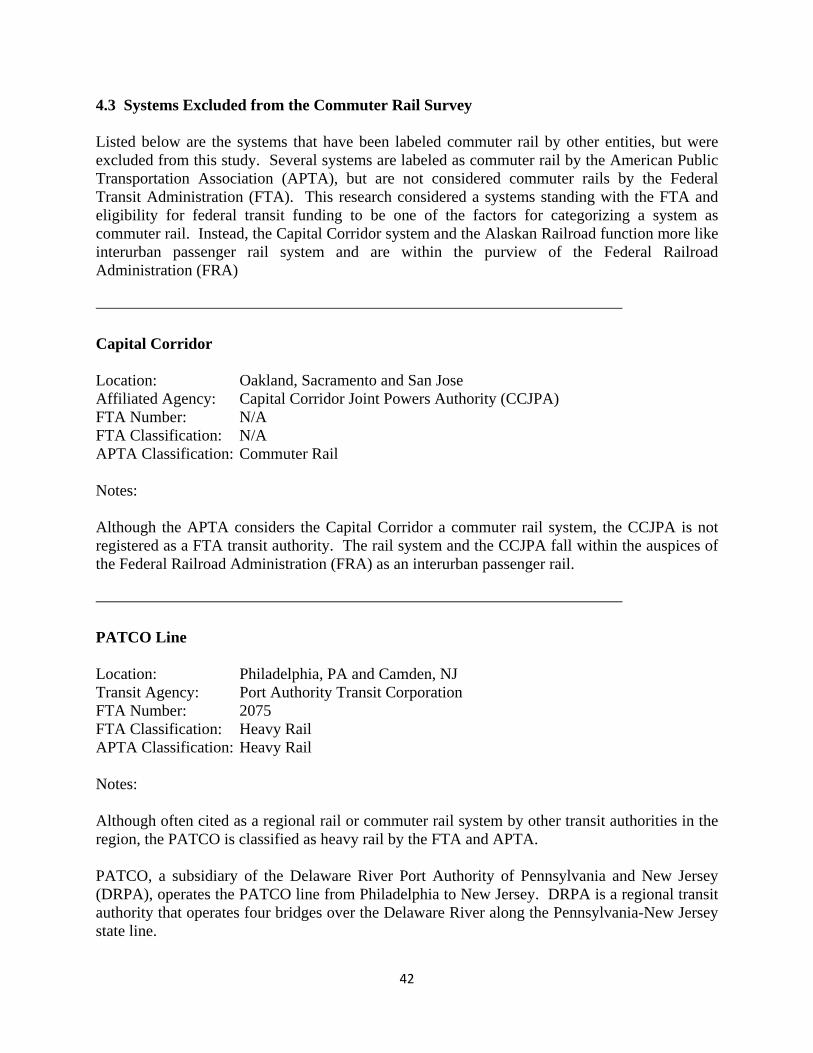
4.3 Systems Excluded from the Commuter Rail Survey Listed below are the systems that have been labeled commuter rail by other entities, but were excluded from this study. Several systems are labeled as commuter rail by the American Public Transportation Association (APTA), but are not considered commuter rails by the Federal Transit Administration (FTA). This research considered a systems standing with the FTA and eligibility for federal transit funding to be one of the factors for categorizing a system as commuter rail. Instead, the Capital Corridor system and the Alaskan Railroad function more like interurban passenger rail system and are within the purview of the Federal Railroad Administration (FRA) Capital Corridor Location: Oakland, Sacramento and San Jose Affiliated Agency: Capital Corridor Joint Powers Authority (CCJPA) FTA Number: N/A FTA Classification: N/A APTA Classification: Commuter Rail Notes: Although the APTA considers the Capital Corridor a commuter rail system, the CCJPA is not registered as a FTA transit authority. The rail system and the CCJPA fall within the auspices of the Federal Railroad Administration (FRA) as an interurban passenger rail. PATCO Line Location: Philadelphia, PA and Camden, NJ Transit Agency: Port Authority Transit Corporation FTA Number: 2075 FTA Classification: Heavy Rail APTA Classification: Heavy Rail Notes: Although often cited as a regional rail or commuter rail system by other transit authorities in the region, the PATCO is classified as heavy rail by the FTA and APTA. PATCO, a subsidiary of the Delaware River Port Authority of Pennsylvania and New Jersey (DRPA), operates the PATCO line from Philadelphia to New Jersey. DRPA is a regional transit authority that operates four bridges over the Delaware River along the Pennsylvania-New Jersey state line.
43
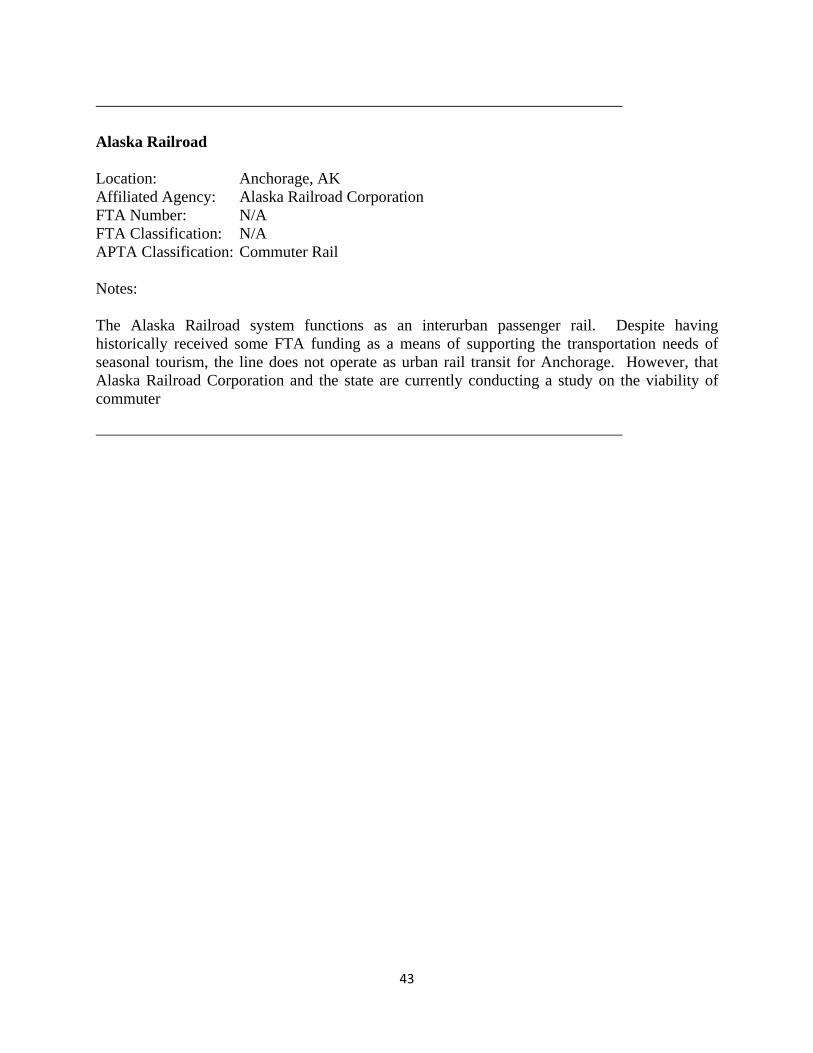
Alaska Railroad Location: Anchorage, AK Affiliated Agency: Alaska Railroad Corporation FTA Number: N/A FTA Classification: N/A APTA Classification: Commuter Rail Notes: The Alaska Railroad system functions as an interurban passenger rail. Despite having historically received some FTA funding as a means of supporting the transportation needs of seasonal tourism, the line does not operate as urban rail transit for Anchorage. However, that Alaska Railroad Corporation and the state are currently conducting a study on the viability of commuter

44
Section 5
CONCLUSIONS
Commuter rail systems are becoming more prevalent in the urban transportation landscape, a trend that is likely to continue for decades to come. As more new start commuter rail systems are established and locally modified to fit the unique urban forms found across US cities, the variation among commuter rails will increase. This research has established a definitive list of commuter rails systems and a base typology of commuter rail that will allow for more detailed analysis in future research. By situating commuter rail in relation to freight rail, passenger rail and urban rail transit, the unique issues surrounding commuter systems are better examined. The broad categorization of commuter rail into legacy systems and new start systems allows the historical differences in right-of-way acquisition to become apparent. This survey of U.S. commuter rail provides an initial step toward establishing a comparative analytic by which to examine best practices for future new start systems.
45
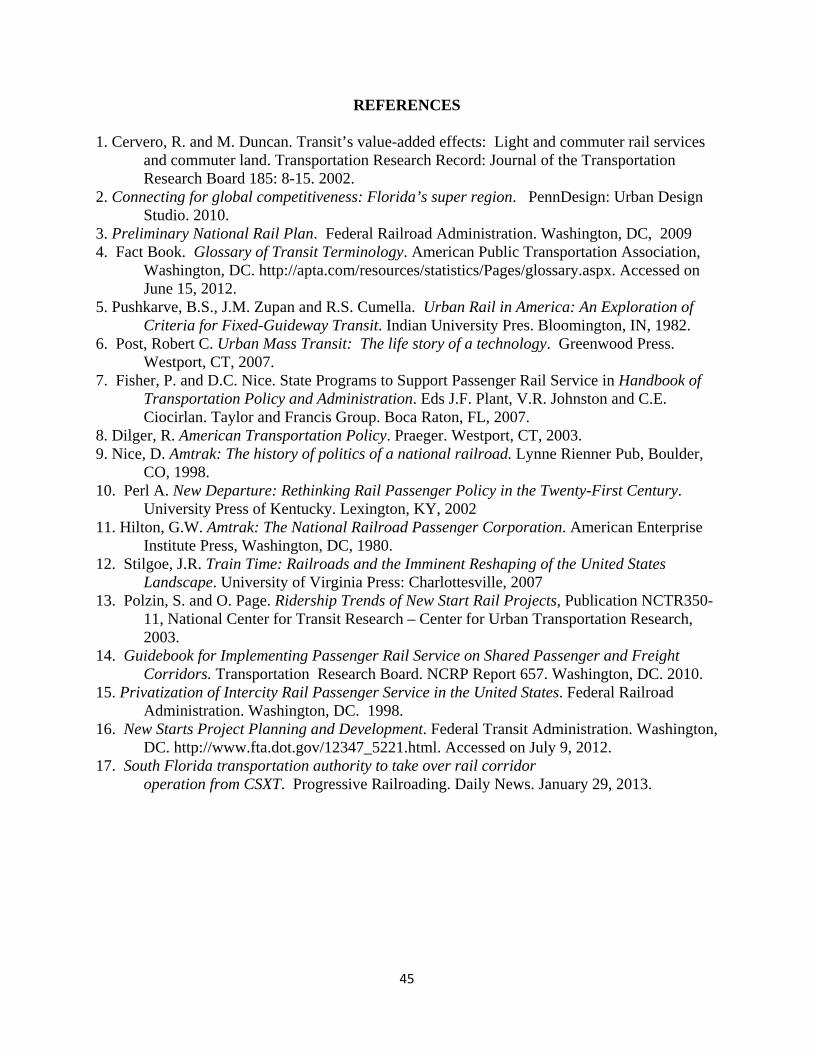
REFERENCES
1. Cervero, R. and M. Duncan. Transit’s value-added effects: Light and commuter rail services and commuter land. Transportation Research Record: Journal of the Transportation Research Board 185: 8-15. 2002.
2. Connecting for global competitiveness: Florida’s super region. PennDesign: Urban Design Studio. 2010.
3. Preliminary National Rail Plan. Federal Railroad Administration. Washington, DC, 2009 4. Fact Book. Glossary of Transit Terminology. American Public Transportation Association,
Washington, DC. http://apta.com/resources/statistics/Pages/glossary.aspx. Accessed on June 15, 2012.
5. Pushkarve, B.S., J.M. Zupan and R.S. Cumella. Urban Rail in America: An Exploration of Criteria for Fixed-Guideway Transit. Indian University Pres. Bloomington, IN, 1982.
6. Post, Robert C. Urban Mass Transit: The life story of a technology. Greenwood Press. Westport, CT, 2007.
7. Fisher, P. and D.C. Nice. State Programs to Support Passenger Rail Service in Handbook of Transportation Policy and Administration. Eds J.F. Plant, V.R. Johnston and C.E. Ciocirlan. Taylor and Francis Group. Boca Raton, FL, 2007.
8. Dilger, R. American Transportation Policy. Praeger. Westport, CT, 2003. 9. Nice, D. Amtrak: The history of politics of a national railroad. Lynne Rienner Pub, Boulder,
CO, 1998. 10. Perl A. New Departure: Rethinking Rail Passenger Policy in the Twenty-First Century.
University Press of Kentucky. Lexington, KY, 2002 11. Hilton, G.W. Amtrak: The National Railroad Passenger Corporation. American Enterprise
Institute Press, Washington, DC, 1980. 12. Stilgoe, J.R. Train Time: Railroads and the Imminent Reshaping of the United States
Landscape. University of Virginia Press: Charlottesville, 2007 13. Polzin, S. and O. Page. Ridership Trends of New Start Rail Projects, Publication NCTR350-
11, National Center for Transit Research – Center for Urban Transportation Research, 2003.
14. Guidebook for Implementing Passenger Rail Service on Shared Passenger and Freight Corridors. Transportation Research Board. NCRP Report 657. Washington, DC. 2010.
15. Privatization of Intercity Rail Passenger Service in the United States. Federal Railroad Administration. Washington, DC. 1998.
16. New Starts Project Planning and Development. Federal Transit Administration. Washington, DC. http://www.fta.dot.gov/12347_5221.html. Accessed on July 9, 2012.
17. South Florida transportation authority to take over rail corridor operation from CSXT. Progressive Railroading. Daily News. January 29, 2013.

Appendix A
Commuter Rail Systems
System Name Location Classification Date Legacy Date Miles Stations Daily Ridership MSA
Rail Runner Express Albuquerque/Santa Fe, NM New Start 2006 ---- 97 11 4,000 887,077 Capital MetroRail Austin, TX New Start 2011 ---- 32 9 1,600 1,716,000 MARC Baltimore/Washington DC Legacy 1984 1827 200 42 33,700 8,292,659 MBTA Boston, MA Legacy 1973 1830 368 123 130,700 4,552,402 Metra Chicago, IL Legacy 1984 1856 488 239 304,300 9,461,105 NICTD South Shore Line Chicago, IL/South Bend, IN Legacy 1989 1903 90 19 12,100 9,780,329 Trinity Railway Express Dallas/Ft. Worth, TX New Start 1996 ---- 34 10 8,400 6,371,773 A-Train Denton/Dallas, TX New Start 2011 ---- 21 6 1,400 6,371,773 MetroLink Los Angeles, CA New Start 1992 ---- 512 55 43,100 12,828,837 Tri-Rail Miami, FL New Start 1987 ---- 72 18 14,000 5,564,635 NorthStar Minneapolis/St. Paul New Start 2009 ---- 40 6 2,100 3,279,833 Music City Star Nashville, TN New Start 2006 ---- 32 6 1,100 1,589,934 Shore Line East New Haven, CT New Start 1990 ---- 59 11 2,100 862,477 MTA - Long Island New York, NY Legacy 1966 1834 700 124 324,300 18,897,109 MTA - Metro North New York, NY Legacy 1983 1832 384 120 281,200 18,897,109 NJ Transit Newark, NJ Legacy 1983 1830’s 498 165 NA 18,897,109 SEPTA Philadelphia, PA Legacy 1983 1915 289 153 123,500 5,965,343 Keystone Line Philadelphia/Harrisburg, PA New Start 2006 ---- 104 12 1,800 6,514,818 Downeaster Portland, ME New Start 1995 ---- 116 12 1,400 514,098 Westside Express Service Portland, OR New Start 2009 ---- 15 5 1,600 2,226,009 FrontRunner Salt Lake City, UT New Start 2008 ---- 44 8 5,600 1,124,197 Coaster San Diego, CA New Start 1995 ---- 42 8 5,300 3,095,313 Caltrain San Francisco, CA Legacy 1987 1863 75 32 42,400 6,172,302 Altamont Commuter Express San Jose, CA New Start 1998 ---- 86 10 3,100 1,836,911 Sounder Seattle, WA New Start 2000 ---- 82 10 9,900 3,439,809 Virginia Railway Express Washington, DC/Alexandria,
VA New Start 1992 ---- 90 18 19,200 5,582,170
Appendix B Data Sources and Definitions for Profile Entries
Transit Agency: Name of commuter rail transit agency; Self-reported data/ FTA reports/APTA reports FTA Number: Federal Transit Administration identification number from National Transit Database 2009 Agency Purview: Notes if agency operates multiple transit modes or solely commuter rail services. System Operator: The entity that operates the commuter rail service for the system; Self-reported data Freight Operator: The company conducting freight operations on the shared corridor Daily Ridership: APTA Transit Ridership Report for the first quarter of 2012; Average weekday ridership 2011 Ridership: APTA Transit Ridership Report for the fourth quarter of 2011 MSA Population: U.S. Census Bureau, Population for Large Metropolitan Statistical Area for 2010; Commuter systems that incorporate two major MSAs are given the total population of both MSAs (i.e. – MARC MSA includes the combined population of both Baltimore and Washington DC) Service Population: 2009 FTA profile; National Transit Database Established: Date new start commuter rail system began operations or date the legacy system were modernized or acquired by the current transit agency. Classification: New Start service are systems established after 1980; Legacy system existed prior to 1950, but were likely under private ownership prior to 1960. Track Miles: Number of infrastructure miles being operated by the sytem; Self-reported data/FTA reports/APTA reports Stations: Number of stations on the system 2009 Operational Expenditures: 2009 FTA profile; National Transit Database (Total Expenditure, Per Passenger Mile, Per passenger Trip) 2009 Fare Generated Revenue: 2009 FTA profile; National Transit Database 2012 Fare Rates: Range of fares for a ticket; often times determined by how many zones a commuter travels; self-reported Notes: Data collected from transit agency documents, third party research reports, rail system websites and published media sources.

48
Appendix C Bibliography for Commuter Rail Profiles
SYSTEM WEBSITES Altamont Commuter Express (ACE): http://www.acerail.com/Home.aspx A-train - DCTA.:
http://www.dcta.net/routes-schedules/a-train-routes-a-schedules/menu-id-134.html Caltrain: http://www.caltrain.com/ Capital Metro - Austin Public Transit: http://www.capmetro.org/MetroRail/ Coaster commuter train: http://www.gonctd.com/coaster Downeaster: http://www.amtrakdowneaster.com/ FrontRunner - Utah Transit Authority:
http://www.rideuta.com/mc/?page=UTA-Home-FrontRunner Keystone Service
Amtrak: http://www.amtrak.com/keystone-service-train PADOT: http://www.pacommutes.com/public-transit/rail/keystone-service/
MARC Train - Maryland Transit Administration: http://mta.maryland.gov/marc-train MBTA: http://mbta.com/index.asp Metra: http://metrarail.com/metra/en/home.html Metrolink: http://metrolinktrains.com/ MTA Long Island Rail Road: http://mta.info/lirr/ MTA Metro-North Railroad: http://mta.info/mnr/ Music City Star - RTA Home. http://www.musiccitystar.org/ NJ Transit http://www.njtransit.com/hp/hp_servlet.srv?hdnPageAction=HomePageTo New Mexico Rail Runner Express: http://www.nmrailrunner.com/ South Shore Line - Northern Indiana Commuter Transportation District: http://www.nictd.com/ Northstar Commuter Rail: http://northstartrain.org/ Virginia Rail Express – VRE: http://vre.org/ SEPTA - Southeastern Pennsylvania Transportation Authority. http://www.septa.org/ Shore Line East: http://www.shorelineeast.com/index.php Sounder Train – SoundTransit: http://www.soundtransit.org/Rider-Guide/Sounder-train.xml Trinity Railway Express (TRE): http://www.trinityrailwayexpress.org/index.html Tri-Rail - South Florida Regional Transportation Authority: http://www.tri-rail.com/ Westside Express Service (WES) - TriMet: http://www.trimet.org/wes/index.htm

49
Related Documents