AN INVESTIGATION OF CONSUMPTION PATTERNS AND CONSUMER SATISFACTION WITH THE PROVISION OF PHARMACEUTICAL PRODUCTS IN THE EGYPTIAN MARKET: n AN EMPIRICAL STUDY BY AISHA MOUSTAFA EL-MENIAWY B.con., N.A., (MARKETING) THE UNIVERSITY OF AIN-SMAMS, CAIRO A THESIS SUBMITTED TO THE UNIVERSITY OF SHEFFIELD IN FULFILMENT OF THE REQUIREMENT FOR THE DEGREE OF DOCTOR OF PHILOSOPHY January, 1991

Welcome message from author
This document is posted to help you gain knowledge. Please leave a comment to let me know what you think about it! Share it to your friends and learn new things together.
Transcript
AN INVESTIGATION OF CONSUMPTION PATTERNS
AND CONSUMER SATISFACTION WITH THE PROVISION
OF PHARMACEUTICAL PRODUCTS IN THE EGYPTIAN MARKET:n
AN EMPIRICAL STUDY
BY
AISHA MOUSTAFA EL-MENIAWY
B.con., N.A., (MARKETING)
THE UNIVERSITY OF AIN-SMAMS, CAIRO
A THESIS SUBMITTED TO THE UNIVERSITY OF SHEFFIELD
IN FULFILMENT OF THE REQUIREMENT FOR THE DEGREE OF
DOCTOR OF PHILOSOPHY
January, 1991

TO
My Mother and The Memory Of My Father; and
Brother In Law, Omer
My Husband, Mohammed and My children, Hebat-Allah and Hady

ACKNOWLEDGMENTS
I owe a special debt of gratitude to Dr. Anne Tomes for her
supervision and careful guidance throughout all the phases of this
research. Dr. Tomes's suggestions, which proved invaluable support,
are also greatly appreciated. This thesis would not have been
possible without her assistance and encouragement. Sincere
gratitude is also extended to Professor Arthur Meidan, for his
insightful comments and remarks on the theoretical aspects of this
research.
A special word of thanks goes to my colleague Dr. Thabt Edris
in Egypt for stimulating my interest in this topic and his primary
assistance.
I owe my gratitude to a number of people, in Cairo-Egypt, for
providing a great help in collecting the data required for this
study: Dr. Gomah Gamal, the production manager, Arab Medical
Packing Company; Dr. Aly El-Shikh, manager of the Scientific
Department, Hoechst Orient; and Dr. Abdel-Al Avad, sales manager,
El-Masryia For Medicine Trade And Distribution Company. I would
like also to thank Drug Organization For Chemical And Medical
Appliance (DOCMA), for allowing me access to the data required for
this research.
Many thanks are due to the staff of the Crookesmoor Library,
for their assistance. I wish, as well, to thank the secretarial
staff of the School Of Management, University Of Sheffield. I also
appreciate the special skills of Miss Elizabeth Fox, who served in
drawing tables and figures of this manuscript. The help I received
from Mrs Diane Brook in word processing is acknowledged.
My most bountiful gratitude goes to my mother, sisters, and
brothers, for their encouragement and endurance for being away from
then.
Last but certainly not the least, I owe a special debt of
gratitude to my husband, for being a true partner in this effort.
No words can adequately express my appreciation of his moral
support, understanding, patience, sacrifice, and co-operation
throughout the preparation of this project. I am deeply grateful to
my children for their tolerance during the time this work was
undertaken.A. El-Meniawy
School Of Management
•
AN INVESTIGATION OF CONSUMPTION PATTERNS
AND CONSUMER SATISFACTION WITH THE PROVISION
OF PHARMACEUTICAL PRODUCTS IN THE EGYPTIAN MARKET:
AN EMPIRICAL STUDY
ABSTRACT
This study is an empirical investigation of consumer satisfaction
with the provision of medicine in Egypt.
One way to look at consumer protection in the medicine market
is to explore consumer satisfaction with the provision of medicine.
A further way is to investigate the various consumption patterns of
medicines (in terms of expenditures). Both ways are combined
together in this investigation to gain an insight into the
protection provided to the Egyptian consumers in the medicine
market. The findings are then used to make recommendations in order
to improve medicine provision and protection in Egypt. In addition,
the study aims to contribute theoretically by presenting a
conceptual model of consumer satisfaction. Further, the work tries
to determine the components of consumer satisfaction with respect
to the underlying factors and the degree of satisfaction
experienced by the Egyptian consumers.
The rationale of the second objective of this study was to
investigate whether consumer segments exist in the Egyptian market
on the basis of consumer satisfaction with the provision of
medicine products with particular demographic and socio-economic
characteristics. Ho such clear segments emerged.
It was hypothesized that: (1) there are no significantdifferences among Egyptian consumers with different demographic and
socio-economic characteristics on the basis of their satisfaction
with the provision of medicine products and (2) there is no
significant relationship between the consumption patterns of
medicines (in terms of expenditure) and consumer demographic and
socio-economic (in terms of sex, age, income, education,
occupation, marital status, family size).
The primary data required was collected via personal
interviews using a structure questionnaire. ' Information was
collected on consumer attitudes, opinions and demography / socio-
economy. A random multi-stage area sample of 1300 consumers vas
chosen. Respondents were selected from two cities, Cairo and Giza.
From that sample, 938 usable cases of data were obtained and
analysed.
Two scales of measurement are employed in this study. First,
an interval scale to measure consumer satisfaction on a set of
variables and statements as well as to investigate consumption
patterns of medicines. Second, a nominal scale was used to record
information on consumers' demographics and socio-economics.
The reliability of the satisfaction scale employed in this
study was statistically tested using Cronbach's Alpha. In addition,
five different types of analysis are used to achieve the research
objectives (i.e., factor analysis, cluster analysis, discriminant
analysis, ANOVA, multiple regression analysis). Factor analysis is
used to analyse the set of satisfaction variables to determine the
underlying factors of consumer satisfaction. The degree of
satisfaction with those factors is also calculated to determine the
extent to which consumers are satisfied with each factor. It was
found that packaging and labelling contribute most to the variance
explained and are the factors with which consumers are most
satisfied. Consumers are least satisfied with medicine price and
availability of medicines.
Cluster analysis is utilized in this study to explore the
similarities and dissimilarities between the Egyptian consumers
segments on the basis of their satisfaction with respect to the
twelve factors identified and the statements. However, this
analysis did not bring out segments. This was confirmed by
discriminant analysis. ANOVA was therefore employed to investigate
the similarities and dissimilarities among consumers with different
demographic and socio-economic characteristics. Hultiple regression
analysis was used to determine the relationship between consumption
patterns (dependent variable) and consumer demographic and socio-
economic. The study found that sex, age, income, education, family
size and marital status do affect satisfaction with, and
consumption of, medicine products. In addition, the research
hypotheses are tested via ANOVA (F Ratio) and T tests.
The study makes a contribution to knowledge in three areas,
theoretical, empirical and practical. The main theoretical
contribution is the building of a conceptual model of consumer
satisfaction, while the empirical contribution is that this type of
study has not been carried out before into consumer satisfaction
with medicines in a developing country.
Finally, the practical contribution is the significant
implications arising from the work for all the players in the
medicine arena, especially the Egyptian government, since, the
study reveals that the Egyptian consumers feel that the provision
of medicine is less than satisfactory.
The thesis concludes with recommendations for further consumer
behaviour research, empirical studies of consumer satisfaction and
actions which need to be taken by the Egyptian government,
particularly to improve the medicine provision situation in Egypt
and provide the Egyptian consumer with adequate protection.
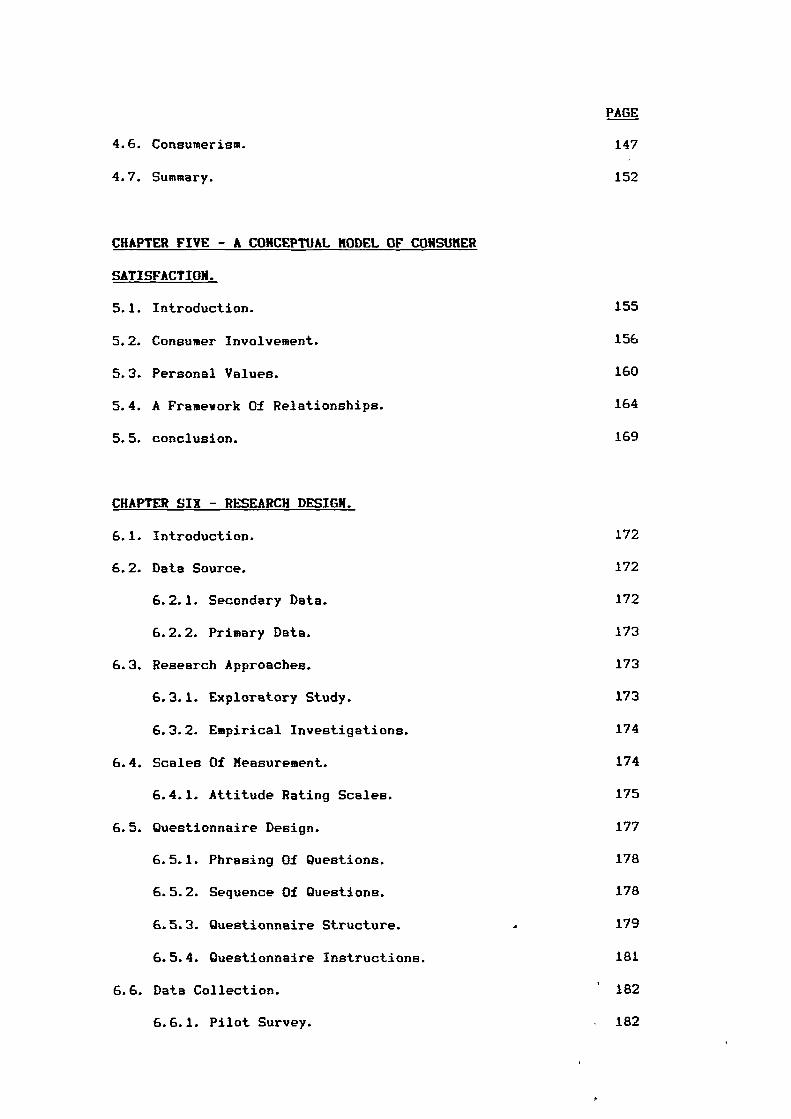
TABLE OF CONTENTS
PAGE
LIST OF TABLES. 1
LIST OF FIGURES. 3
CHAPTER ONE - INTRODUCTION.
1.1. Preface. 5
1.2. Problem Recognition And The Research
Questions. 7
1.3. Research Objectives. 9
1.4. Research Hypotheses. 10
1.5. Organization Of The Thesis. 11
CHAPTER TWO - REVIEW OF THE LITERATURE
PART ONE: THE GLOBAL PERSPECTIVES OF THE
PHARMACEUTICAL MARKETING.
2.1. Introduction.
2.2. Structure Of The Global Pharmaceutical Industry.
2.3. Characteristics Of The Pharmaceutical Marketing.
2.3.1. The Prescription Pharmaceutical Market.
2.3.2. Over-The-Counter Market.
2.4. Identification Of The Market.
2.4.1. The Patient / Consumer.
2.4.2. The Doctor As Distributor.
2.4.3. Patterns Of Relationships In The
Pharmaceutical Marketing.
2.5. The Global Strategies Of Pharmaceutical
Marketing.
2.5.1. Advertising And Promotion.
2.5.2. The Channel Of Disribution.
'
16
17
19
19
21
23
24
26
28
30
31
34
2.5.3. Pricing.
2.5.4. Patterns Of Competition.
2.6. The International Governments's Regulations
For The Marketing Of Pharmaceuticals.
2.6.1. Medicines' Safety.
2.6.2. Medicines' Advertising / Promotion,
Pricing And Disribution.
2.6.3. Post-Marketing Surveillance (PMS).
2.7. The World-Wide Health-Care.
2.7.1. The Consumption Of Medicines.
2.8. Summary Of Part One.
PART TWO: THE EGYPTIAN PHARMACEUTICAL PRODUCTS'MARKET.
'
PAGE
35
37
39
39
41
43
45
45
46
48
49
49
50
51
53
55
55
55
57
59
61
62
63
2.9. The Pharmaceutical Industry In Egypt.
2.10. An Overviev Of The Historical Development
Of The Pharmaceutical Sector In Egypt.
2.10.1. The First Phase (1939 - 1961).
2.10.2. The Second Phase (1962 - 1975).
2.10.3. The Third Phase (1976 - 1982).
2.10.4. The Fourth Phase (1983 - ).
2.11. The Major Elements Of The Pharmaceutical Policy.
2.11.1. The Selection Of Medicines.
2.11.2. The Increase Of Local Production Share.
2.11.3. Consumption Rationalization.
2.11.4. Distribution And Storage Policy.
2.11.5. Importation Policy.
2.11.6. Control Over Medicine Prices.
2.11.7. Medical Control.
PAGE
2.12. Recent Developments In The Pharmaceutical Sector. 64
2.12.1. The Development In The Field Of Technology. 64
2.12.2. The Development Of The Raw Materials
Industry. 65
2.12.3. The Development Of The Export Policy. 66
2.12.4. The Development Of The pharmaceutical
Packaging Industry. 67
2.13. Summary Of Part Two 70
CHAPTER THREE - CONSUMER SATISFACTION /
DISSATISFACTION
3.1. Introduction To Consumer Satisfaction /
Dissatisfaction. 73
3.2. Classification Of Consumer Satisfaction. 77
3.3. Conceptualization Of Consumer Satisfaction /
Dissatisfaction. 79
3.3.1. Satisfaction Defined. 79
3.3.2. Dissatisfaction Defined. 81
3.3.3. Consumer Satisfaction And Attitudes. 83
3.3.4. Approaches To Consumer Satisfaction. 90
3.3.4.1. Antecedents Of Satisfaction. 90
3.3.4.1.1. Expectation - The Primary Determinant
Of Satisfaction. 91
3.3.4.1.2. Performance. 95
3.3.4.1.3. The Concept Of Disconfirmation And
Inequity. 95
3.3.4.1.4. A Model Of Consumer Satisfaction. 97
3.3.4.2. Post Evaluation And Satisfaction. 100
1.
PAGE
3.3.5. Psychological Theory Of Consumer
Satisfaction. 105
3.3.6. Sociological Interpretation of
Consumer Satisfaction/Dissatisfaction. 110
3.3.6.1. Alienation. 110
3.3.6.2. Communication - Effect Theory. 112
3.3.7. Utility Theory Of Consumer Satisfaction /
Dissatisfaction. 113
3.4. The Relationship Between Satisfaction And
Dissatisfaction. 116
3.5. Measurement Of Consumer Satisfaction /
Dissatisfaction. 120
3.5.1. Measurement Problems. 123
3.6. Summary. 124
CHAPTER FOUR - CONSUMER CHARACTERISTICS RELATER
CONSUMPTION PATTERNS / SATISFACTION / COMPLAINT
BEHAVIOUR.
4.1. Introduction. 127
4.2. An Overview Of Consumer Characteristics. 128
4.2.1. Demographic Characteristics. 129
4.2.2. Socio-economic Characteristics. 130
4.3. Consumer Characteristics And Consumption
Patterns. 131
4.4. Consumer Characteristics And Satisfaction /
Dissatisfaction. 135
4.5. Consumer Characteristics And Propensity To
Complain. . 141
PAGE
4.6. Consumerism. 147
4.7. Summary. 152
CHAPTER FIVE - A CONCEPTUAL MODEL OF CONSUMER
SATISFACTION.
5.1. Introduction. 155
5.2. Consumer Involvement. 156
5.3. Personal Values. 160
5.4. A Framework Of Relationships. 164
5.5. conclusion. 169
CHAPTER SIX - RESEARCH DESIGN.
6.1. Introduction. 172
6.2. Data Source. 172
6.2.1. Secondary Data. 172
6.2.2. Primary Data. 173
6.3. Research Approaches. 173
6.3.1. Exploratory Study. 173
6.3.2. Empirical Investigations. 174
6.4. Scales Of Measurement. 174
6.4.1. Attitude Rating Scales. 175
6.5. Questionnaire Design. 177
6.5.1. Phrasing Of Questions. 178
6.5.2. Sequence Of Questions. 178
6.5.3. Questionnaire Structure. 179
6.5.4. Questionnaire Instructions. 181
6.6. Data Collection. 182
6.6.1. Pilot Survey. 182
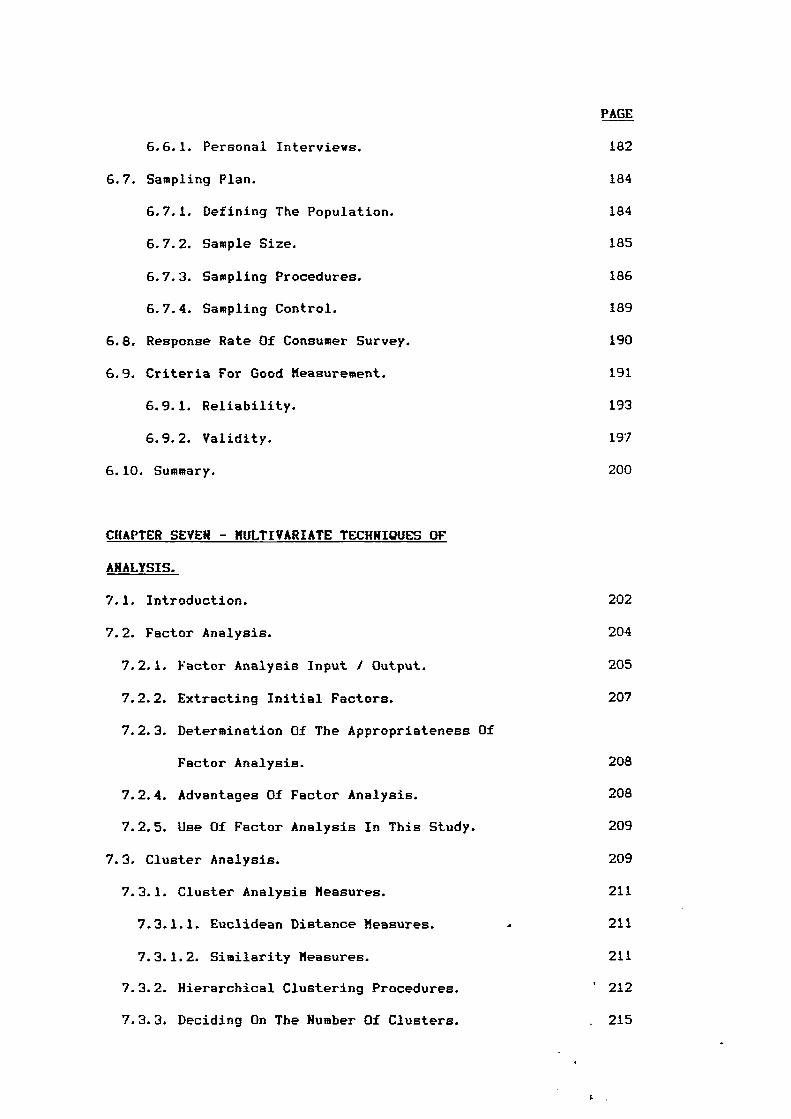
PAGE
6.6.1. Personal Interviews. 182
6.7. Sampling Plan. 184
6.7.1. Defining The Population. 184
6.7.2. Sample Size. 185
6.7.3. Sampling Procedures. 186
6.7.4. Sampling Control. 189
6.8. Response Rate Of Consumer Survey. 190
6.9. Criteria For Good Measurement. 191
6.9.1. Reliability. 193
6.9.2. Validity. 197
6.10. Summary. 200
CHAPTER SEVEN - MULTIVARIATE TECHNIQUES OF
ANALYSIS.
7.1. Introduction. 202
7.2. Factor Analysis. 204
7.2.1. Factor Analysis Input / Output. 205
7.2.2. Extracting Initial Factors. 207
7.2.3. Determination Of The Appropriateness Of
Factor Analysis. 208
7.2.4. Advantages Of Factor Analysis. 208
7.2.5. Use Of Factor Analysis In This Study. 209
7.3. Cluster Analysis. 209
7.3.1. Cluster Analysis Measures. 211
7.3.1.1. Euclidean Distance Measures. 211
7.3.1.2. Similarity Measures. 211
7.3.2. Hierarchical Clustering Procedures. ' 212
7.3.3. Deciding On The Number Of Clusters. . 215
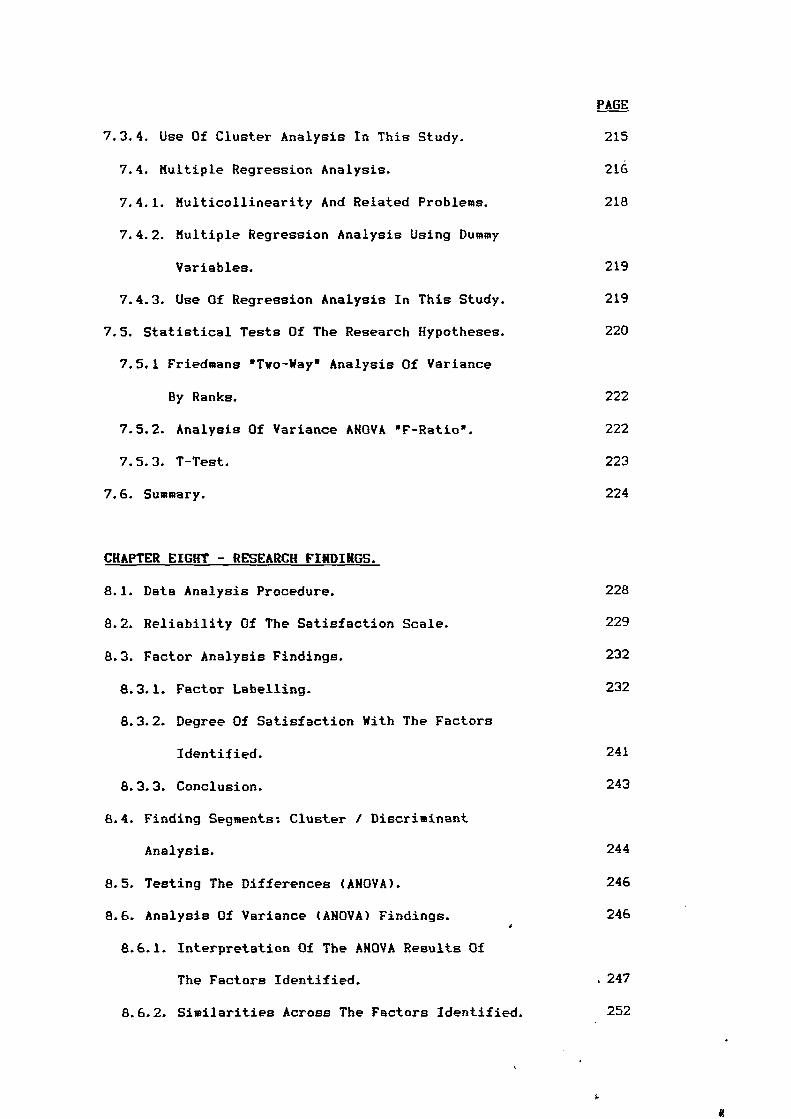
PAGE
7.3.4. Use Of Cluster Analysis In This Study. 215
7.4. Multiple Regression Analysis. 216
7.4.1. Multicollinearity And Related Problems. 218
7.4.2. Multiple Regression Analysis Using Dummy
Variables. 219
7.4.3. Use Of Regression Analysis In This Study. 219
7.5. Statistical Tests Of The Research Hypotheses. 220
7.5.1 Friedmans "Two-Way" Analysis Of Variance
By Ranks. 222
7.5.2. Analysis Of Variance ANOVA "F-Ratio". 222
7.5.3. T-Test. 223
7.6. Summary. 224
CHAPTER EIGHT - RESEARCH FINDINGS.
8.1. Data Analysis Procedure. 228
8.2. Reliability Of The Satisfaction Scale. 229
8.3. Factor Analysis Findings. 232
8.3.1. Factor Labelling. 232
8.3.2. Degree Of Satisfaction With The Factors
Identified. 241
8.3.3. Conclusion. 243
8.4. Finding Segments: Cluster / Discriminant
Analysis. 244
8.5. Testing The Differences (ANOVA). 246
8.6. Analysis Of Variance (ANOVA) Findings. 246
8.6.1. Interpretation Of The ANOVA Results Of
The Factors Identified. 247
8.6.2. Similarities Across The Factors Identified. 252
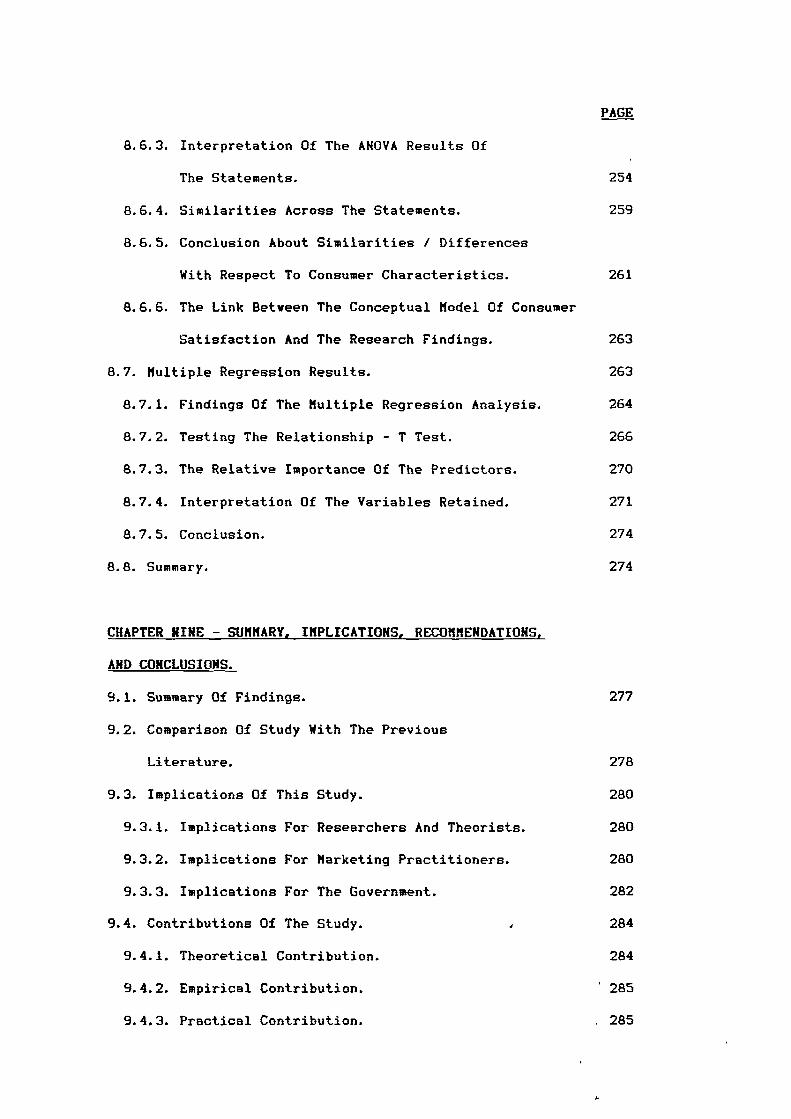
8.6.3. Interpretation Of The ANOVA Results Of
PAGE
The Statements. 254
8.6.4. Similarities Across The Statements. 259
8.6.5. Conclusion About Similarities / Differences
With Respect To Consumer Characteristics. 261
8.6.6. The Link Between The Conceptual Model Of Consumer
Satisfaction And The Research Findings. 263
8.7. Multiple Regression Results. 263
8.7.1. Findings Of The Multiple Regression Analysis. 264
8.7.2. Testing The Relationship - T Test. 266
8.7.3. The Relative Importance Of The Predictors. 270
8.7.4. Interpretation Of The Variables Retained. 271
8.7.5. Conclusion. 274
8.8. Summary. 274
CHAPTER NINE - SUMMARY, IMPLICATIONS, RECOMMENDATIONS,
AND CONCLUSIONS.
9.1. Summary Of Findings. 277
9.2. Comparison Of Study With The Previous
Literature. 278
9.3. Implications Of This Study. 280
9.3.1. Implications For Researchers And Theorists. 280
9.3.2. Implications For Marketing Practitioners. 280
9.3.3. Implications For The Government. 282
9.4. Contributions Of The Study. 284
9.4.1. Theoretical Contribution. 284
9.4.2. Empirical Contribution. ' 285
9.4.3. Practical Contribution. . 285
PAGE
9.5. Recommendations For Future Research. 287
9.6. Concluding Comments. 288
REFERENCES. 289
BIBLIOGRAPHY. 310
APPENDIX (1) QUESTIONNAIRE ENGLISH VERSION. 315
APPENDIX (2) QUESTIONNAIRE ARABIC VERSION. 324
APPENDIX (3) ROTATED FACTOR MATRIX
333
APPENDIX (4) CLUSTER / DISCRIMINANT ANALYSIS OUTPUT. 336
APPENDIX (5) ANOVA TABLES. 343
t
' - •
LIST OF TABLES
PAGE
Table 2.1: The World's Ethical Pharmaceutical
Companies Ranked By Estimated 1988
Revenues (US $ Million). 18
Table 2.2: National Production Share
(in million, L.E). 56
Table 2.3: The Study For The Increase In Consumption
(in million, L.E). 58
Table 2.4: Increase In Annual Medicine Consumption
Per Capita (Egyptian Pound L.E.). 59
Table 2.5: Direct And Indirect Subsidy
(in million, L.E). 60
Table 2.6: Increase In Annual Imported Raw Materials
(in million, L.E). 62
Table 2.7: The Development In The Field Of Rav Materials
(in million, L.E). 66
Table 2.8: The Development In The Field Of
Exportation (in million, L.E). 67
Table 2.9: The Value Of Medical Packaging production
(in million, L.E). 68
Table 6.1: The Percentages Of The Composition Of The
Sample Size. 188
Table 6.2: The Results Of Respose Rate. 191
Table 8.1: Attributes And Reliability Coefficients
Of Scale Of Satisfaction. 230
Table 8.2: Varimax Rotated Factor Matrix. 237
Table 8.3: Degree Of Satisfaction With
Each Factor. . 242

PAGE
Table 8.4: The Influence Of Sample Predictors On
The Full Regression Model. 266
Table 8.5: Regression_ Analysis: Demographic
/ Socio-economic Predictors For
Consumption Categories. 269
2
LIST OF FIGURES
PAGE
Figure 2.1: International Comparision Of
Expenditures Of Medicines. 18
Figure 2.2: DOCMA Organizational Structure. 58
Figure 3.1: Purchase And Its Outcomes. 87
Figure 3.2: The Hovard-Sheth Model
Of Buyer Behaviour. 89
Figure 3.3: Expectation And Level Of
Performance. 98
Figure 3.4: The Flov Diagram Of The Purchase
Decision Process. 104
Figure 3.5: The Relationship Betveen Expectations
Level And Performance Levels. 109
Figure 3.6: The Single Dimension Of Satisfaction
/Dissatisfaction Feelings. 116
Figure 3.7: The Independent Dimension Of Satisfaction
/ Dissatisfaction Feelings. 117
Figure 3.8: Effects Of A Change In Price Or
Quality On A Single Continuum. 118
Figure 3.9: Effects Of Increase In Quality And
Price On Dual-Factor Continua. 118
Figure 4.1: Consumer Reaction To Dissatisfied. 144
Figure 5.1: A Conceptual Model Of
Consumer Satisfaction. 170
3

CHAPTER ONE
INTRODUCTION
1.1. Preface.
1.2. Problem Recognition And The Research Questions.
1.3. Research Objectives.
1.4. Research Hypotheses.
1.5. Organisation Of The Thesis.
1.1. PREFACE:
This study arose out the concern of the Egyptian government to
protect consumers from marketing malpractices by all the players in
the pharmaceutical arena.
The concept of consumer protection is vide and complex in
scope in all societies even in an affluent society where the basic
needs and wants are met already. It has emerged as an issue area on
the public policy agenda of many advanced and developing societies
to eliminate hazardous products (Pestoff 1988) and the exploitation
of consumers for profit. Therefore, consumer protection is
considered to be a critical question in our lives. For that reason,
it is seen by the researcher as something beyond a marketing
problem.
This study is centred on a questionnaire relating to consumer
behaviour and attitudes that can be answered with confidence by the
Egyptian consumers, the results of which can be used to explore the
protection provided in the pharmaceutical market. Medicines are
vital consumer goods required by various categories of consumers to
satisfy urgent needs. Further, consumers are always unclear about
the medicine quality which should be offered, since medicines are
usually purchased without a word being said and the performance
characteristics therefore not spelt out. Many medicines are
dispensed by doctor's prescription. The consumer / patient
therefore relies primarily on the doctor's judegment. Yet, this
does not mean the doctor is not addressing himself to the needs of
the patient. The doctors' unique offering is that special
capability to identify and satisfy the patients' needs (Houston
1986). The problem of consumer protection in the medicine field
therefore has various facets that should be considered. These
include not only manufacturers' and distributors' responsibilities
but also doctors and finally pharmacists responsibilities. The
present study focuses on two major aspects. First, an exploration
of consumer satisfaction as an indicator of the extent of consumer
protection. Second, an investigation of the relationships between
consumers' consumption patterns (in terms of expenditure) and
consumers' demographic and socio-economic variables in the Egyptian
society that may influence these consumption patterns.
The study of consumer satisfaction creates particular
problems. A consumer clearly knows the ideal benefits he / she
seeks from a medicine but he / she does not necessarily expect
these benefits to accrue. The level of expectation will depend on
the degree of success or failure of his / her past treatments of a
variety of medical conditions and the benefits the doctor
prescribing the medicines tells the consumer he / she can expect.
Fortunately for the empirical researcher seeking to determine the
extent of perceived consumer satisfaction, a consumer having
experienced satisfaction or dissatisfaction with a medicine is
able, at an intuitive level, to express the extent of the
satisfaction / dissatisfaction with the various performance
characteristics of that medicine, without necessarily understanding
the criteria he / she used in making his / her judegment.
In order to explore the above criteria, the intention is to
identify the key elements that underlie the level of satisfaction
of the Egyptian consumers with medicine products. The researcher
has developed a number of variables which reflect the previously
mentioned elements of consumer satisfaction in the medicine market
namely, packaging, labelling, quality, pricing, quantity,
availability, medicines' negative I side effects and doctor's
6
experiences with medicines. Some of these variables were developed
by the researcher, since no research had been undertaken in Egypt
in the area of consumer satisfaction with the provision Of
medicine, while other variables were extracted from the literature,
and modified for the purpose of this study.
For the second aspect of this research, an exploratory study
demonstrated that the consumption rate of medicines is increasing
rapidly in Egypt in recent years (see chapter 2). It was felt that
more research effort into consumer behaviour to investigate this
phenomenon was required. Thus another set of variables of the
Egyptian demography and socio-economy have been generated (e.g.,
sex, age, income) to measure the relationships among these
variables and the consumption patterns of medicines (in terms of
expenditure). Bore precisely, several studies have indicated that
demographic and socio-economic variables are considered one of the
most important dimensions in understanding consumer satisfaction
(Cohen 1981). In addition, the problem of consumer dissatisfaction
has become identified and associated with specific problems such as
low income consumers who suffer from excessive prices and poor
quality in medicines and services. Poorly educated consumers are
often unaware of the characteristics of medicines which are able to
satisfy their needs.
1.2. PROBLEM RECOGNITION AND THE RESEARCH QUESTIONS:
There has been much progress in recent years in developing
standards of consumer goods which are responsive to the needs of
consumers. For instance, pharmaceutical companies in Egypt
penetrated significantly the markets of different types of
medicines (see chapter 2). In the exploratory study, it was .found
7
that there are obvious advances in the packaging of medicines which
can increase consumer satisfaction, but many consumer complaints
are still received about such products. In addition, there are
several medicines which are offered free through general hospitals,
but it seems that these medicines are unlabelled and thus generate
the subsequent problem of insufficient instruction. The researcher
felt that special attention should be given in the proper use of
medicines and informing consumers of the risks involved in their
use.
Account must be taken of the fact that the quality of
medicines has a bearing on performance and fitness for the purpose
as well. Consumers seek for safety in medicines however several
types have been found to have adverse effects. These effects are
the main criteria of consumer protection.
The shortage of raw materials for medicines is putting great
pressure on price. Further, price levels have risen during the
recent period of rapidly increasing inflation, despite the fact
that medicine prices are often bounded and subsidised by the
Egyptian government.
The problem of the price of medicines has an effect on the
availability of many kinds of medicine and several types cannot be
obtained at all. Distribution patterns also play an important role
and are responsible in part for the availability and scarcity of
medicines. In addition, the scarcity is being increased due to the
growth of the rate of consumption (see chapter 2).
Two critical questions stem from the above, discussion, they
are:
8
(1) To what extent are consumers satisfied (in terms of packaging,
labelling, quality, etc.) with the provision of medicines in
the Egyptian market?
(2) Are there any relationships among the various levels of
consumers' consumption patterns (in terms of their expenditure)
and the Egyptian demography and socio-economy (e.g., sex, age)?
1.3. RESEARCH OBJECTIVES:
This empirical investigation is mainly concerned with consumer
satisfaction with medicine products in Egypt. In other words,
consumer satisfaction is explored in this study to find out how
much Egyptian consumers are being protected in this vital sector of
consumer goods. The relationship between consumer's consumption
patterns of medicines and their demographic and socio-economic
characteristics is also of particular interest in this study.
Accordingly, the major objectives of this research are as
follows:
(1) To identify and quantify the key elements that underlie
consumer satisfaction (e.g., packaging, labelling, quality)
with medicine products in Egypt.
Such identification and quantification of consumer satisfaction
will enable us to answer the question of how much Egyptian
consumers are being protected in the market of medicines.
(2) To explore the similarity and dissimilarity among the various
categories of Egyptian consumers in their satisfaction with the
provision of medicines.
This exploration will help the government reconsider and evaluate
the current regulations with respect to its policy regarding the
manufacture and marketing of medicines. Distributors would also
9
benefit from such information if they wish to increase the
effectiveness of their marketing strategies.
(3) To investigate the relationship between consumption patterns of
medicines tin terms of expenditure) and the various
characteristics of the Egyptian consumers (i.e., demographic I
socio-economic).
Knowledge about consumption patterns in this vital market is
considered very important to find out how much consumer segments
spend on medicines.
Although principally an empirical study, the researcher aims
to make a theoretical contribution to consumer behaviour knowledge
by developing a conceptual model of consumer satisfaction.
1.4. RESEARCH HYPOTHESES:
The following are the key research hypotheses:
(1) There are no significant differences among Egyptian consumers
with different demographic and socio-economic
characteristics on the basis of their satisfaction with the
provision of medicine products.
(2) There is no significant relationship between consumption
patterns of medicines and consumer's demographic and socio-
economic characteristics in terms of:
2.1. Sex.
2.2. Age.
2.3. Income.
2.4. Education.
2.5. Occupation.
2.6. Harital Status.
2.7. Family Size.
10
1.5. ORGANISATION OF THE THESIS:
This thesis is organised into nine chapters, each chapter
comprises the stages in the process.
After beginning with a preface, explaining the rationale
behind the work, we continued this first chapter by presenting the
research problem and formulating the basic research questions and
the objectives of the study. This was followed by the hypotheses to
be tested.
Chapter two consists of two parts and deals with the review of
the literature on pharmaceutical marketing.
Part one describes the different issues of the global
marketing of pharmaceuticals. It starts with an introduction
followed by a short review of the structure of the pharmaceutical
industry. A discussion of the characteristics of pharmaceutical
marketing in the prescription market and the over-the-counter
market is presented. Also the discussion expands to the different
arguments regarding the role of the consumer / patient and the
doctor in the market. The global marketing strategies of
pharmaceutical companies are then discussed, particular attention
is concentrated on the national and international regulations
imposed on the marketing of pharmaceuticals. This part is concluded
by a very brief view of world health-care.
Part two provides an overview of the pharmaceutical market in
Egypt. The chapter highlights the historical development of the
pharmaceutical sector, followed by the key aspects of the
pharmaceutical policy. This is continued by tracing the recent
technological developments in the pharmaceutical industry.
Chapter three comprises a review of the literature on consumer
satisfaction. The chapter primarily focuses on the
11
conceptualisation of consumer satisfaction. It begins with an
introduction of consumer satisfaction / dissatisfaction and
different controversial issues are discussed. In this chapter
particular consideration is devoted to expectation, performance,
disconfirmation and inequity as a major bases of emerging
satisfaction / dissatisfaction. The chapter concludes with a
discussion of the measurement of consumer satisfaction and its
major problems.
Chapter four is concerned with a survey of the literature on
consumer characteristics regarding consumption patterns,
satisfaction and complaining behaviour. It is necessary to look at
similar studies to ours which prove helpful in determining the
role of consumer variables on satisfaction, consumption patterns
and complaining behaviour. We conclude this chapter by reviewing
the concept of consumerism.
Chapter five describes the researcher's attempt to develop a
model of consumer satisfaction with new dimensions.
Chapter six deals with the nature of the research design to
ensure that the research addresses the appropriate questions and
treats them in an efficient manner. The concern is with the process
of data collection which is gathered from a multi-stage random
sample of respondents by structured questionnaire using the
personal interviewing technique. A section is devoted to
investigating the reliability and validity of the research design.
Once the data have been collected, the emphasis turns
logically to the methodology of analysis. Therefore, chapter seven
reviews three different multivariate techniques of analysis to be
used to achieve the three research objectives (factor analysis,
12
cluster analysis and multiple regression analysis). The appropriate
statistical tests are also highlighted.
Chapter eight begins with testing the reliability of the
satisfaction scale, then it goes on to the research findings and
interpretation based on the computer output of factor analysis,
cluster analysis, discriminant analysis, ANOVA (F Ratio) and
multiple regression analysis. In this chapter we use ANOVA and T
tests to test the eight hypotheses of the study.
In chapter nine, we present a comparison between our study
and the literature reviewed, followed by the major implications for
researchers, theorists, marketing practioners and the Egyptian
government. The chapter highlights the theoretical, empirical and
practical contributions of the study. In addition, recommendations
for further research are reported.
13
CHAPTER TWO
REVIEW OF THE LITERATURE
PART ONE: THE GLOBAL PERSPECTIVES OF THE PHARMACEUTICAL MARKETINU.
2.1. Introduction.
2.2. Structure of The Global Pharmaceutical Industry.
2.3. Characteristics Of The Pharmaceutical Marketing.
2.3.1. The Prescription Pharmaceutical Market.
2.3.2. Over-The-Counter (OTC) Market.
2.4. Identification Of The Market.
2.4.1. The Patient / Consumer.
2.4.2. The Doctor As Distributor.
2.4.3. Patterns Of The Relationships In The Pharmaceutical
Marketing.
2.5. The Global Strategies Of Pharmaceutical Marketing.
2.5.1. Advertising And Promotion.
2.5.2. The Channel Of Distribution.
2.5.3. Pricing.
2.5.4. Patterns Of Competition.
2.6. The International Governments' Regulations For The Marketing
Of Pharmaceuticals.
2.6.1. Medicines' Safety.
2.6.2. Medicines' Advertising / Promotion, Pricing And
Distribution.
2.6.3. Post-Marketing Surveillance (PMS).
2.7. The World-Wide Health-Care.
2.7.1. The Consumption Of Medicines.
2.8. Summary Of Part One.
14
PART TWO: THE EGYPTIAM PHARMACEUTICAL PRODUCTS' MARKET.
2.9. The Pharmaceutical Industry In Egypt.
2.10. An Overview Of The Historical Development Of The
Pharmaceutical Sector In Egypt.
2.10.1. The First Phase (1939 - 1961) .
2.10.2. The Second Phase (1962 - 1975).
2.10.3. The Third Phase (1976 - 1982).
2.10.4. The Fourth Phase (1983 - ).
2.11. The Major Elements Of The Pharmaceutical Policy.
2.11.1. The Selection Of Medicines.
2.11.2. The Increase Of Local Production Share.
2.11.3. Consumption Rationalization.
2.11.4. Distribution And Storage Policy.
2.11.5. Importation Policy.
2.11.6. Control Over Medicine Prices.
2.11.7. Medical Control.
2.12. Recent Developments In The Pharmaceutical Sector.
2.12.1. The Development In The Field Of Technology.
2.12.2. The Development Of The Ray Materials Industry.
2.12.3. The Development Of The Export Policy.
2.12.4. The Development Of The Pharmaceutical Packaging
Industry.
2.13. Summary Of part Two.
15
PART ONE.
THE GLOBAL PERSPECTIVES OF THE PHARNACEUTICAL KARKETIMG.
2.1. INTRODUCTION:
The preservation of health is certainly one of the most vital
and ancient concerns of mankind. Yet, it is precisely in this area
that some of the greatest inequalities among nations, as well as
between demographic and socio-economic groups within nations, can
be shown to exist. The global strategy for health to all countries
first focused its attention on the issue of health as a fundamental
right of mankind and laid the foundations for world-wide action in
this field.
Although everyone, whether patient or pharmaceutical
professional recognizes the contribution of the pharmaceuticals'
industry to the health and welfare of the public, it is important
to realize that all the development in the pharmaceutical field and
the availability of pharmaceuticals to the general public have not
merely occurred by chance. Although most of the praise is accorded
to those in the pharmaceutical industry concerned with research and
development (R&D), few appreciate the contribution made by the
pharmaceutical marketing system in making these medicines available
at the right time, at the right place, in the right quantity, at a
reasonable price, and with the right information.
The pharmaceutical industry depends heavily on the role of the
marketing. The nature of the product requires that companies
interact with many heterogeneous publics, including educated
professionals faced with important tasks. Unlike any other sectors
of the world-wide economy, the pharmaceutical industry is not
involved with producing and distributing items of convenience, ease
or luxury. Medicines are used to cure and prevent disease,
16
alleviate suffering, and sometimes sustain life itself. Therefore,
the business of pharmaceutical marketing is human health.
Ultimately, patient benefits from medicines accrue from proper
diagnosis, prescribing, manufacture, distribution and consumption.
Pharmaceutical marketing is therefore a highly personal form of
business where accuracy in meeting a consumer's needs is of prime
consideration.
2.2. STRUCTURE OF THE GLOBAL PHARMACEUTICAL INDUSTRY:
A look at the structure of the pharmaceutical industry reveals
a high degree of concentration. Although, there are about 10,000
companies involved in pharmaceuticals around the world. Of these,
the top 100 account for roughly 80 percent of total sales,
according to the World Health Organization.
At the top of the pharmaceutical world, there are a group of
10 or so large companies with marketing and production operations
in all the main countries and annual sales in the £3 billion range
(before the mergers). These companies are often highly profitable,
with net profits running at 45-50 per cent of sales (Financial
times 1990). So far at least Japan is not a major world player in
medicines. Although the country has some big medicine companies
(the largest of which is Takeda), they operate mainly in Japan,
which is the world's second largest pharmaceutical market after the
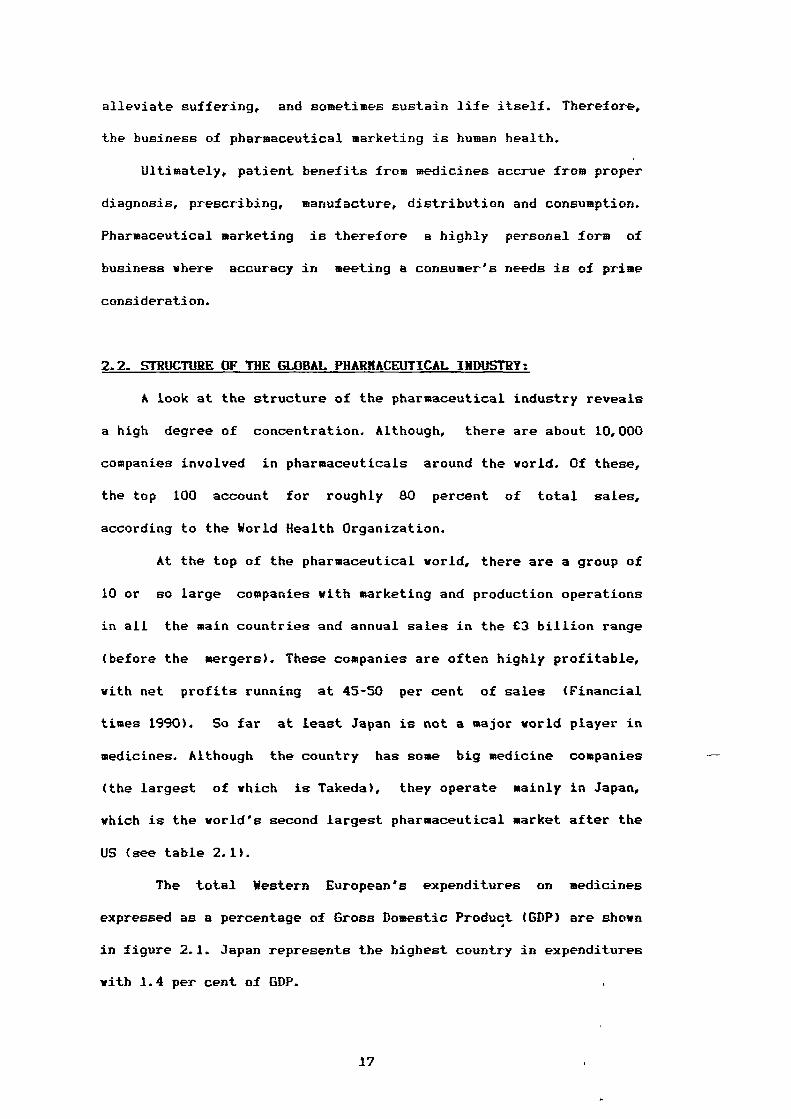
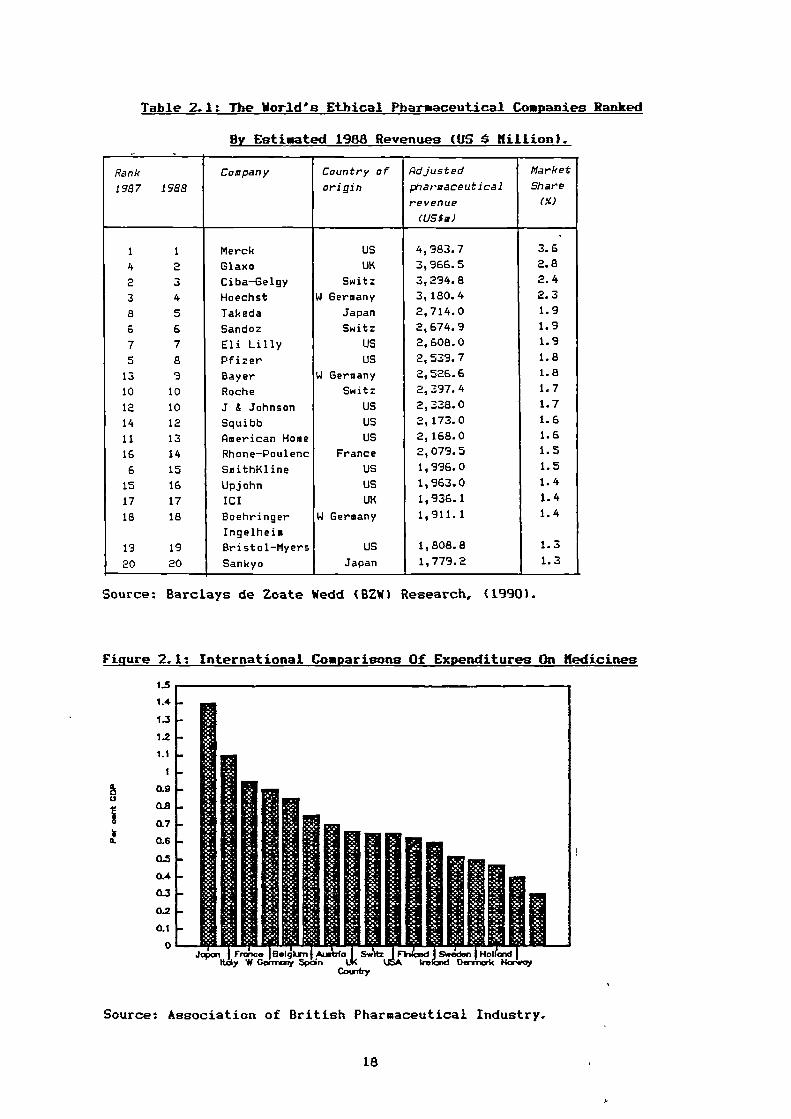
US (see table 2.1).
The total Western European's expenditures on medicines
expressed as a percentage of Gross Domestic Product (GDP) are shown
in figure 2.1. Japan represents the highest country in expenditures
with 1.4 per cent of GDP.
17
11 111119/111 ady w pane BelakT a --Ire Denrimdc Haw,
Couatry
LS
1.4.
1.3
1.2
Li
1
OM
0.7
0.6
0.4
0.3
0.2
OA
0
Table 2.1: The World's Ethical Pharmaceutical Companies Ranked
By Estimated 1988 Revenues (US Killion).
Rank
1987 1988
Company Country of
origin
Adjusted
pharmaceutical
revenue
(lS,m)
Market
Share
(X)
1 1 Merck US 4,983.7 3.6
4 ..›._ Glaxo UK 3,966.5 2.8
2 3 Ciba-Geigy Switz 3,294.8 2.4
3 4 Hoechst W Germany 3,180.4 2.3
8 5 Takeda Japan 2,714.0 1.9
6 6 Sandoz Switz 2,674.9 1.9
7 7 Eli Lilly US 2,608.0 1.9
5 a Pfizer US 2,539.7 1.8
13 9 Bayer W Germany 2,526.6 1.8
10 10 Roche Switz 2,397.4 1.7
12 10 J & Johnson US 2,338.0 1.7
14 12 Squibb US 2,173.0 1.6
11 13 American Home US 2,168.0 1.6
16 14 Rhone-Poulenc France 2,079.5 1.5
6 15 SmithKline US 1,996.0 1.5
15 16 Upjohn US 1,963.0 1.4
17 17 ICI UK 1,936.1 1.4
18 18 Boehringer W Germany 1,911.1 1.4
Ingelheim
19 19 Bristol-Myers US 1,808.8 1.3
20 20 Sankyo Japan 1,779.2 1.3
Source: Barclays de Zoate Wedd (BZW) Research, (1990).
Figure 2.1: International Comparisons Of Expenditures On Kedicines
Source: Association of British Pharmaceutical Industry.
18
2.3. CHARACTERISTICS OF THE PHARMACEUTICAL MARKETING:
Slatter (1977) categorised pharmaceutical marketing into four
classifications:
1. Prescription pharmaceutical market.
2. Over-The-Counter (OTC) market.
3. Animal health medicines market i.e. medicines designed for use
in treating animals, and preventing diseases in animals.
4. Intermediate pharmaceutical market i.e. products such as bulk
chemicals, capsules etc. are sold by one manufacturer to another
at an intermediate stage in the pharmaceutical manufacturing
process.
In this study, the discussion is confined to the first two
categories, since the pharmaceutical companies in a broad sense
around the world produce and market these two types. The
prescription pharmaceutical market is concerned with medicines
which are obtained by the consumer / patient only upon the doctor's
authorization. The other type is the over-the-counter (OTC)
medicines that may be purchased without a prescription.
There has been an expansion of the OTC pharmaceutical market
in recent years, but the most fundamental business of
pharmaceutical companies still remains the production and marketing
of the prescription medicines (Chappell 1983).
2.3.1. THE PRESCRIPTION PHARMACEUTICAL MARKET:
Darvall (1980) emphasises that prescription medicines are
complex chemical substances which, despite ,their undoubted
benefits, are capable of causing severe and in some cases
irreversible injuries, and the adverse effect can extend to an
unborn child.
19
Slatter (1977) pointed out that the aggregate demand for
prescription medicines at any time is primarily dependent on the
standard of living and the incidence of disease. The key feature
influencing the demand for any individual product is the extent to
which the product gains doctors' acceptance. This will depend on a
large number of factors including the medicine's therapeutic value
(i.e. medicine quality) and sales promotion undertaken by the
manufacturer to the doctor. Quite clearly, the marketing of
prescription medicines is unique in that the manufacturer does not
market his product to the ultimate consumer / patient, but instead
to an intermediary (doctor). Although it is the patient who
ultimately purchases and consumes a prescription medicine, it is
the doctor who makes the decision as to which the patient is to
have, how much he / she is to have, in what form he / she is to
take it, and for how long. Chappell (1983) adds that in the
prescription market the primary target is therefore the licensed
prescribers rather than the consumers of the product. Another
target of the marketing effort for prescription pharmaceuticals is
the licensed pharmacists. This group having assumed more importance
recently because of their .increased role as decision maker with
regard to the specific brand of medicine to be dispensed to the
patient.
Because of the risk of injury to consumers if a medicine is
unappropriately prescribed, it would be reasonable to suppose that
advertisements would inform doctors of the possible side effects
and adverse reactions associated with particular medicines. Stinson
(1975) stressed that in many instances, prescription medicine
advertisements do not provide adequate prescribing information, but
20

instead employ image appeals and extravagant and excessive claims
In order to persuade a doctor to prescribe the advertised medicine.
2.3.2. OVER-THE-COUNTER (OTC) MARKET:
OTC medicines are bought and taken on the consumer's own
initiative. The choice of medicine may be guided by some general
knowledge but, more often, is inspired by advice given to potential
consumers by publicity or, sometimes, by specific advice given by
pharmacists, neighbours, relatives or friends. The nonprescription
medicines (OTC) are lawfully sold without professional supervision
on the basis of labelling that provides adequate direction for the
proper use. In addition, the specific information on a medicine
purchased without medical prescription, is usually in package
inserts. The contents of such package inserts vary widely from
medicine to medicine, from one producer to another and from one
country to another (Peter 1981).
Self-medication (OTC) is most prevailent in the developed
countries in which consumers have a wide range of information
sources on nonprescription medicines and self-medication, such as
advertising, product labelling, advice of health professionals
including pharmacists, books and mass media. All these sources can
play an important part in the education of consumers for the proper
self-medication and self-care.
The World Health Organization (WHO) conducted an international
study which confirmed the findings of numerous investigations and
indicate that in the USA and UK, only quarter to one third of cases
of illness or injury are seen by doctors (Kohn and White 1976). In
general, the markets across the EC vary widely and are
characterised by the growing movement from prescribed medicines to
21
OTC, especially the UK market which is the most advanced in its
approach to self-medication. Herxheimer and Stimson (1981) found
that for the UK pharmaceutical industry nonprescription medicines
account for two-thirds of sales. In contrast, Southern European
countries such as Italy and Spain have a small nonprescription
market (Tacey 1990). Mercill (1983) adds that the nonprescription
market in the US is considered the consumer's first line of defence
in health care. Herxheimer and Stinson (1981) suggest several
different reasons for the increase in the self-medication market.
Firstly, when the illness experienced is not of the sort that is
usually taken to the doctor. Secondly, when the doctor is not
available because he / she is not easily accessible, or because of
financial or other barriers to consultations. Thirdly, self-
medication may be used as a stop-gap to relieve symptoms until
medical advice can be sought. Fourthly, when illness is seen to be
not of the sort that doctors can do much about. Fifthly, when
"official° medicine has proved to be ineffective, people may resort
to self-medication.
Because the OTC products differ substantially from the
prescription medicines, Slatter (1977) determined three key factors
that distinguish the OTC. First, no OTC product has patent
protection. Second, all the leading OTC products are heavily
promoted. The nature of the advertised products and the competition
in the market require companies to use both "push through" and
"pull through' marketing techniques. The former aims to sell
products to the retailer or wholesaler and therefore include
marketing variables such as incentive discounts. Whereas the latter
is designed to create consumer demand. Third, OTC products , are
characterised by multi-channel distribution such as grocery stores,
22
department stores and discount stores. These have become
increasingly important channels of distribution for OTC products in
addition to the traditional pharmacy outlets.
Briefly, the issue of whether medicines should be treated as
consumer products is, however, confused by the usual market
division between OTC and prescription markets. Government
regulations vary from country to country and particularly between
developed and less developed countries. A medicine which may be
only purchased on prescription in one country may often be obtained
over-the-counter in a neighbouring country, and a single brand of
medicine may be marked as a prescription medicine to doctors only
in one country and as a consumer product (OTC) in other country.
Obviously, this aspect of the market is related to the state of the
economy.
2.4. IDENTIFICATION OF THE MARKET:
The pharmaceutical products' market is, in comparison with
other consumer goods and services, characterised by some specific
features. These concern the characteristics of the medical product
as a good, as well as its supply and demand. The medical product as
a good is marked by its fundamental hazardousness. Medicines aid
and cure, they must, however, at the same time be regarded as
*life hazards" (Harts 1989).
The supply side of the market which is represented by the
manufacturer, is highly professionalised, well organized, and
scientifically sophisticated. The demand side of the market is
divided into three parts: the patient as the consumer of medical
product, the doctor as the distributor and the government as the
provider.
23
Because of the almost limitless possibilities in identifying
the various pharmaceutical markets, it is perhaps best for us to
limit our discussion to the consumer (patient) and the prescriber
(doctor), since the pharmaceutical market is unique in the
importance of the influence of nonpurchaser (doctor) on the
purchasing habits of the ultimate consumer. The different patterns
of relationships involved in pharmaceutical marketing also are
described belov.
2.4.1. THE PATIENT / CONSUMER:
Despite the importance of the doctor as a director in the
choice of prescription medication, consumer choice still demands
thorough consideration (Smith 1983a), since consumers make the
final decision to use or not use a medicine. He / she is the one
'who may personally suffer the adverse effects or adverse
interactions of medicines and as 'well as symptomatic or therapeutic
benefit.
According to Peter (1981) consumers should be entitled to the
fullest possible information on medicines which they are using on
their own initiative or because they have been advised to do so by
medical personnel. However, no other information in pharmaceutical
marketing, unfortunately, is as difficult as that for consumers,
mainly because they vary in their literacy, their general education
and their medical knowledge.
Although the patient is clearly important in the medicine
market either prescription or OTC, pharmaceutical companies tend to
see the market they operate in as one 'which the choice of the
individual plays a minor role. They often publicly portray such a
view, pulling the onus of decision making on the medical services.
24
The European Community (EC) listed six aspects of the marketing
environment for medicines which tend to distance the individual
consumer (patient) from the medicine supplier (manufacturer). That
list, presented by Tucker (1984), is as follows:
1) Demand on the health service originated only partly from the
patient, because the medicine industry comes from many sources
such as national public health institutions rather that from
individuals.
2) Normally the patient cannot himself / herself decide on the type
of treatment. The fact that the patient has made a decision to
visit his / her doctor with the expectation in most cases that
he / she will be prescribed a medicine.
3) The consumer cannot always decide when the demand for treatment
should end. Here it is important to distinguish clearly between
courses of treatments. The patient undergoing a course of
treatment for an infection is too often likely to stop taking
the tablets at the first sign of relief of symptoms. Whereas the
patient on a course of pain-killers, is more likely to continue
to demand further prescription renewals.
4) The patient can rarely evaluate the quality of services offered.
While this issue is acceptable in general terms, it is in many
cases irrelevant as far as the demand for medicine is concerned.
The point obviously ignores the fact that so many patients
become psychologically reliant on their regular medicines.
5) The patient is not interested in cost and prices, because he /
she does not have to pay directly, although the disinterest in
cost and prices on the individual in the EC cannot be applied
universally. In the USA and other developed countries' the
interest in prices is far higher.
25
6) Purchasing power should not play a role in the field of care.
However, whereas this can be applied as a real aspect of medical
treatment in most EC countries, it is merely an ideal which is
rarely attained if the broader view is taken.
2.4.2. THE DOCTOR AS DISTRIBUTOR:
The doctor is a distributor in pharmaceutical marketing,
since the use of ethical pharmaceuticals is generally dependent on
the prescribing doctor.
Although, there is an argument that the patient does behave as
a direct consumer of prescription medicines as well as OTC. There
is still another argument based on the view that the prescribing
doctor acts as the consumer in making his / her individual choice
of how many medicines, what types of medicines and which brands of
medicines to prescribe. Gagnon (1983) explains some interacting
variables that influence a doctor's ultimate selection of a
medicine such as the clinical and behavioural characteristics of
the patient, the patient's needs and expectation regarding
treatment in the use of medication, and the organizational
constraints placed upon the doctors.
A literature review of doctors' prescribing behaviour was
published by Hemminki (1975) who reported four factors which
influence the doctor in prescribing:
1) Education appears to influence the quality of prescribing
positively.
2) The contribution of advertising to prescribing is debatable in
that a positive attitude towards advertising can be expected to
influence prescribing.
26
3) The control and regulatory measures may have positive effects on
prescribing.
4) Patient and society demands on doctors for medicines may be
exaggerated in the case of ethical medicines.
The need of the medical profession for medicine information
has been discussed by Peter (1981). No doctor should ever prescribe
or administer a medicine on which he / she is not thoroughly
informed. The doctors' minimum information should comprise
knowledge of the following:
1) The pharmacological effect and, if relevant the mechanisms of
action of the medicine.
2) The usefulness of the medicine against the condition to be
treated or the symptom to be eliminated.
3) The established merit of medicines as compared to that of other
medicines used for the same purpose and that of other
therapeutic procedures.
4) Possible dangers of the medicine under particular physiological
conditions.
5) Adverse effects on organ systems.
Furthermore, the doctors must be informed on:
6) The range of useful and tolerated doses of his / her patient,
the usual dosing interval, the average duration of treatment.
7) The symptoms of poisoning by overdoses and the treatment of such
poisoning.
Gardner and Watson (1970) explained some reasons which may
lead to doctors being inadequately informed:
1) Adverse effects of a medicine or adverse interactions with other
medicine given to a patient may have been observed previously.
27
This danger exists, of course, to a particularly large extent
with new medicines.
2) Information on detrimental effects or interactions or the
absence of a therapeutic benefit of a medicine may be available
in principle but may not have been published.
3) Positive or negative information on medicines may be available
and even have been published in some journals, without reaching
a prescribers's attention.
4) Prescribing doctors when supplied with adequate information on
merits and demerits of medicines may be either unwilling to. or
incapable of, acting according to the information given to them.
Whatever one argues about the general merits of pushing more
power either to the patient or to the doctor, people are not
qualified to decide on medicines without the involvement of a
doctor.
2.4.3. PATTERNS OF RELATIONSHIPS IN THE PHARMACEUTICAL MARKETING:
Some literature suggests that, the only thing which creates
a good relationship between patient and doctor is the prescription
and the patients are described as prescription-oriented, as many
doctors believe. However, an empirical study by Wartman et al
(1981) found that the patient-doctor relationship may have a more
important role in producing a satisfied patient than the previously
thought. The findings show that when prescriptions are given, the
patient-doctor relationship, as reported by the patient is less
satisfying. Conversely, the relationship is more satisfying when
prescriptions tend not to be given. The findings also suggest that
a patient with anxiety may have a different set of expectations 'of
the visit than less anxious patients. Wartman et al go further and
28

state that the doctor who gives verbal attention to the patient's
problem by taking time to understand and answer questions, give
explanations and show a friendly interest in the patient has a
satisfying effect, and may have a psychologically therapeutic
effect on the patient.
Doctors also have a relationship with the pharmaceutical
industry (manufacturer) which as explained by Pike (1990), is a
complex relationship, since research on a new medicine is carried
out by the industry and relies on the medical profession to
evaluate its products in patients. Such a relationship is required
to be close in order to improve the treatment of patients and for
the development and assessment of new medicines.
Medawar (1984) explains the relationship among the medical
profession, the medicine producers and government as typically
close and exclusive. But such a relationship is very delicate
because:
1) The producers depends on favourable treatment from government,
and the doctors' approval of their products.
2) Doctors depend on the producers for new medicines and for
information about how to use them. Doctors depend on government,
if not as an employer, then as a major influence on their terms
and conditions of work.
3) Government depends on the other two for support for its health
policies.
Finally, Marsh (1990) emphasises the importance of a good
relationship between government and pharmaceutical companies.
Medicines companies spend a lot of time and trouble trying to get
on good terms with governments because on the one hand, health
agencies are the target purchasers of medicines and have a big part
29
in selling price. On the other hand, the medicine products are
subject to government regulations to ensure they work safely (see
section 2.6).
2.5. THE GLOBAL STRATEGIES OF PHARMACEURICAL MARKETING:
Marketing strategies can be defined as 'a set of principles
that adjust the company's marketing mix to react to the environment
changes over time' (natter 1977).
The significant issue in pharmaceutical marketing in many
developing and developed countries is whether medicines should be
sold by brand names or generic names. The recognition of both is
therefore worth mentioning in this context before discussing the
different marketing practices.
Schneller (1970) and Fere (1983) distinguish between the brand
and generic names. The brand names are owned by a company and used
to identify and differentiate the product from competitors. They
can be justified because their use reflects the doctor's confidence
in a certain product produced by a particular manufacturer.
Although the finite definition of 'generic' means a class of
substances having the same biologic properties, 'generic' has
customarily been used a synonym for established or nonproprietary
names. The generic names are used because scientific nomenclature
is unwieldy. Scientific names are meaningless to those who do not
have expertise in a specific field. Generally, the pharmaceutical
marketing of generics could increase the availability of, and
decrease the prices of, medicines in the future.
The differentiation between the brand and generic names along
with the two medicine categories (i.e. prescription, OTC medicines)
30
play an important role in guiding the marketing strategies world-
vide.
2.5.1. ADVERTISING AND PROMOTION:
Advertising and promotion in the pharmaceutical market have
two major functions. One is to make known the company's products
directly to the consumers and persuade them to buy the products (in
the case of OTC). The other is to inform the doctors about new
medicines and developments in therapeutics as well as reminding the
doctors of the established medicines (in the case of prescription).
The purpose of advertising of prescription pharmaceuticals is
no different from that of advertising any other products. However,
the major differences lie in the restrictions placed upon the
prescription medicines (i.e., ethical) by the availability of
suitable advertising media and government regulation.
The advertising strategy is controlled by law in most
countries to the extent that it is illegal to advertise
prescription medicines to the general public through the mass
media. Such advertising is limited to publications aimed at the
medical profession. This restriction is not contested by the
industry for two important reasons (Tucker 1984). First, doctors
are the "customers" for prescription medicines. Second, even the
most aggressive marketers of medicines would think twice about
advertising prescription medicines direct to the public.
The advertising of OTC medicines is aimed mainly at the
general public. Such advertising supports self-medication by
informing consumers about the nature and benefit of nonprescription
medicines and making marked products, their ingredients, and their
indication for use highly recognizable. Advertising. of
31
nonprescription medicines helps consumers to decide which medicine
will alleviate their particular symptom (hercill 1983). hercill
further emphasises that such a task is accomplished by: 1) making
consumers aware of their health and the symptoms of minor illnesses
that might affect them; 2) helping identify some causes of those
illnesses; and 3) helping consumers to decide whether or not to
utilize a nonprescription medicine and seek professional care.
The promotion of pharmaceuticals in most countries follows the
same pattern, that is, prescription medicines are promoted to the
health-care professionals only and nonprescription medicines to the
general public. The promotional mix consists of personal selling,
journal advertising, direct mail and samples. Pradhan (1983) shows
the differences in promotional efforts in some countries. In the
US, efforts are directed towards doctors, pharmacists working in
hospitals and the retail stores. In Japan, almost every major
pharmaceutical manufacturer publishes a magazine or external house
organ containing articles on a vide variety of technical subjects,
as well as advertisements for company products. While OTC medicines
are promoted to the general public through regular media.
In consonance with the above promotional methods, other
promotional strategies by a number of manufacturers are aimed at
retaining the product loyalty of generic medicines by adopting
visual differentiation in their packaging to distinguish their
products from other generics. These changes according to Ouraeshi
et al (1983) are of three basic types: 1) making the company name
more prominent on the package; 2) emphasizing, through the use of
colours or bold print, certain parts of generic name; and 3) using
symbols or other graphic illustrations to differentiate the prqduct
from other generic equivalents.
32
The market behaviour in the US ethical pharmaceutical industry
shows broad similarities with that of UK (Slatter 1977). In both
countries a fey products and a fey companies have important
positions in each therapeutic class, and the overall success of
individual companies depends on having a fe y important products. In
both countries high promotional expenditure is a prerequisite to
obtaining a high market share in the initial years after product
entry. The British-based medicine companies spend some £200 million
per annum on promoting their products to British doctors (Bancher
1987). Brand differentiation, always a crucial aspect of
pharmaceutical marketing, is increasingly vital as fewer genuinely
new products are being brought onto the market.
In general, the high promotion of advertising and promotion
spending on pharmaceuticals is probably related to some of the
reasons outlined below:
1) The unique market mechanism for prescription medicines. The
patient does not exercise consumer choice, and in many countries
pays little or nothing for the prescribed medicine; the doctor
selects the medicine and the brand but does not pay for it
while the health care authorities have to pay but cannot select
medicines for which they pay. Therefore, there is no direct
pressure on the effective decision maker.
2) The sharp distinction between products marked under generic
names and those sold under brand names makes the bulk of
advertising and promotion different. The patent protection for
the branded-medicine helps to advertise and promote a product
and secure it for a long periods even after protection has
expired.
33
3) The marketing practice of pharmaceuticals involves certainly an
amount of risk which does not exist in other consumer products'
markets. Therefore, most people generally assume that only the
doctor, rather than the consumer himself, has the expertise to
make judgments over the choice of medication for a specific
condition.
2.5.2. THE CHANNEL OF DISTRIBUTION:
An efficient distribution system is required to ensure that
medicines are promptly and easily available to those who need them.
Any breakdown in the distribution system will interfere with the
delivery of health care.
The organization of a pharmaceutical supply either in
developing or developed countries satisfying the needs of all
segments of the population is by no means an easy task. Each
organization must decide how it will operate within the supply
system. For the manufacturer of the prescription medicines, Smith
(1983a) stresses that the US la y requires that at least one
intermediary stands between the manufacturer and the consumer (i.e.
the doctor). It is illegal for the manufacturer to sell medicines
directly to the patients.
The medicine wholesaler acts as the middleman in the
distribution of medicines and represents the main channels of
distribution in most countries (Lidstone and Collier 1987). For
example, in the UK most manufacturers rely on pharmaceutical
wholesalers to distribute the bulk of their sales. This is in sharp
contrast to the situation in the US, where the selection of the
right distribution channel has a major impact on marketing
effectiveness (Slatter 1977). Nevertheless, the wholesalers are of
34
central importance in the chain of medicine distribution for almost
all pharmaceutical companies world-wide.
At the retail level, the most important class in the medicine
field is the one known to the public as the pharmacy or drugstore
for the sale of prescription and patent medicines. Pradhan (1983)
explains that the role of the retailer as a part of the
distribution chain differs from one country to another. In France
and Switzerland, medicines are distributed through pharmacies and
hospitals. Pharmacists must have . a licence to work in pharmacies.
In Japan, medicine products are distributed through retail
pharmacies, hospitals and clinics, with some OTC products marketed
through supermarket and door-to-door salesmen. Medicine
manufacturers distribute these products to such outlets by using
direct or indirect methods, since the pharmaceutical industry uses
wholesalers as exclusive outlets.
In brief, the choice of the distribution system is a matter of
government policy, but whatever that system, it should be efficient
so that medicines are available wherever they are needed. The
organization of the distribution system should include storage
facilities, proper inventory control and good transport facilities
and maintenance services.
2.5.3. PRICING:
Pricing is a most important and controversial issue in the
world-wide pharmaceutical market. The unique characteristics of the
pharmaceutical industry give rise to misunderstandings,
contradictions and conflicts in this area. The unique features are,
first, the huge amount spent on research and development (R&D) in
order to develop new products to alleviate pain and prevent, cure
35
or treat disease. Second, the industry has to depend on patent
protection to safeguard its "invention" for certain periods of
time. Another unique characteristic in the pharmaceutical market as
mentioned earlier is that the consumer / patient seldom exercises
any choice in product selection. A doctor acts as purchasing agent
for the patient, and it is he or she who selects the most effective
medicine for a particular course of treatment. (For OTC medicines,
the patient selects the product, but only after consultation with
members of the health profession). As a general rule, then, the
patient acquires medicines either without any charge or with some
minimal payment in some countries e.g. UK.
In spite of the unique characteristics of the pharmaceutical
market, market forces play some role in determining the price of
medical products Pradhan (1983):
1) The demand of medicines depends on the incidence of disease or a
need to prevent certain types of illness.
2) The effective use of medicines, to some extent, reduces the
incidence of disease which in turn reduces potential demand for
these types of medicines.
3) The degree of innovation which the medicine embodies over
existing products along with the degree of medicine
substitution.
General speaking, the prices of the global pharmaceuticals
differ from one country to another. The comparisions are extremely
difficult because the range of preparations on sale in different
countries varies considerably. Each country has j.ts own system of
taxes, import duty and other imposed control (see section 2.6). In
addition, currency fluctuations considerably influence individual
36
national prices and the value of money differs from country to
country (Chew 1985).
2.5.4. PATTERNS OF COMPETITION:
Competition is dynamic and one must therefore expect the
observed patterns and relationships to change overtime.
Since competitive forces in the market place are a function of
both a company's action and the activities of outside forces, a
• company can influence its competitive position by utilizing either
or both internal strategies (e.g., pricing, advertising and
promotion, physical differentiation) and external strategies which
are concerned with restructuring the external environment in such a
way that company can achieve its competitive objectives (James
1979).
flercill (1983) emphasises that there is much evidence to show
that the global pharmaceutical market is, in fact, highly
competitive. Many products are close substitutes for one another,
often containing identical or similar formulae. Medicines are
rejected when substantial numbers of consumers discover their
adverse qualities and characteristics and demonstrate
dissatisfaction by turning to competing products.
Due to the many companies in competition within the
pharmaceutical industry and the lack of overall dominance by any
single one, this would be suggestive of intense price competition
and fluctuating price at the manufacturer level. However, Slatter
(1977) argues that in the British market, price competition takes
places at the wholesale and retail level. Further, price
competition is also found in the hospital market, where bulk buying
of certain generic medicines on a competitive bidding basis assures
37
price competition. But most pharmaceutical manufacturers do not
engage in price competition because of the nature of the product
and the nature of the marketing process (i.e., the process by which
neither the prescriber nor the consumer pays for the product). In
addition, Pradhan (1983) reports that price competition in
Australia is observed in the pharmaceutical industry particularly
when such sales are by tenders or bids.
In contrast, the US pharmaceutical manufacturers are
relatively free of price control and this has an impact on pricing
strategies and on competition and sales. Cocks (1983) shows
therefore a much greater price flexibility and thus price
competition in the US pharmaceutical industry is greater than has
generally been assumed. Competition in prices within several sets
of competing medicines has produced a downward trend in prices in
relation to the prices of other consumer products.
Advertising also makes the consumer / patient aware of the
existence and attributes of more brands, and it is essential to
sellers of new brands to promote competition. Therefore, medicine
promotion is another issue that should be addressed in the context
of competition. Telser et al (1975) stated that promotion is
designed to inform doctors and persuade them to choose a particular
product among products that are roughly equivalent in the
therapeutic sense. They added that medicine promotion has been
expanding recently which may induce price competition in the
medicine market.
Finally, product competition is a prevailing strategy of a
large pharmaceutical companies. Through R&D efforts, companies have
been able to produce a continuous stream of new products thereby
engaging in innovatory competition. A product is considered 'new°
38
1.
• when a new medicine is launched on the market by the manufacturer
under a brand name. New medicines are highly important for the
prescriber and the competitive position of the manufacturer.
2.6. THE INTERNATIONAL GOVERNMENTS' REGULATIONS FOR THE MARKETING
OF PHARMACEUTICALS:
The international governments' regulations play a significant
role in guiding and monitoring the marketing practices in the field
of pharmaceuticals.
2.6.1. MEDICINES' SAFETY:
Medicine safety is an issue of considerable public interest,
for obvious reasons. The level of safety can only to a limited
extent be raised by means of legal regulation. It depends mainly
on the interpretation of the safety standards, doctors's behaviour
and attitudes concerning health policy, cultural and medical
traditions and the internal and external structures governing
administrative behaviour. Therefore, in this section and the
following one, we examine the ways in which governments' decisions
impinge on the freedom of pharmaceutical companies in selling
products. Our attention is on the interventions in medicine-selling
brought about by individual governments with particular reference
to the interventions such as they are, in developed countries.
In the US, the Food And Drug Administration ( FDA) embarked on
a major program to ensure the safety, effectiveness, and adequate
packaging and labelling for all nonprescription medicines (OTC).
The tamper-resistant packaging was brought in to assure safety. In
the US in 1983 approximately 10 to 30 per cent of OTC products were
estimated to be packaged in tamper-resistant packaging (Pradhan
39
1983). A label serves as a source of information about the medicine
product. OTC medicine products must bear a label giving complete
dose, and other necessary information. The label for these products
should be so clear that any person can read and follow the
instructions. According to the United States Federal Regulation, a
label should include seven points: 1) the name of the product; 2)
the name and address of the manufacturer or distributor; 3) the net
content of the package; 4) active ingredients and the quality of
certain ingredients; 5) the name of any habit-forming medicine
contained in it; 6) caution and warning needed for the protection
of the user; and 7) adequate direction for safe and effective use.
Darvall (1980) explains that the American and Canadian
controls over the prescription medicines are subject to the
provisions of (FDA). A new medicine may not be commercially
marketed in the US or in Canada unless it has been approved as safe
and effective by the FDA. The FDA refuses marketing approval for
any medicine not proven safe and effective for use under the
conditions prescribed recommended or suggested on its labelling.
Generally speaking, if the benefit associated with the use of a
particular medicine outweighs possible risk of injury or death, a
medicine will receive marketing approval. Braithwaite (1983)
concludes that the control of the American and Canadian governments
over prescriptive medicines has been viewed as the most stringent
In the western world. Given that context one would assume that the
probability of potentially harmful medicines reaching a patient
would be extremely low.
Harts (1989) states that the laws governing medical products
in the EC Hember States acknowledge substantive legal protectien in
the form of safety standards for the prescription medicines. That
40
law indicates the right of the consumer / patient to information
about hazardous medical products.
In Australia, because the majority of medicines available on
the Australian market are imported, they fall within the Common
Wealth's customs power. The customs regulations prohibit the
importation of any therapeutic substances into Australia unless the
importer is licensed or permission has been obtained from the
Director-General of Health.
The World Health Assembly (WHA) was set up to consider the
development of a code of marketing practices with special emphasis
on the essential pharmaceutical products for developing countries
(Schoepe and Molinda 1984). The purpose of the code for
pharmaceutical marketing which is still not in force in 1990 would
be the establishment of a standard of pharmaceutical marketing
practices to promote medicine quality, especially the quality of
medicines needed by developing countries. The code would apply to
the marketing of all medicine products and the availability of
information concerning the use of these products. Code provisions
would probably restrict the advertising and promotion of medicine
products, establish quality standards that the products must meet,
and control packaging and labelling so that all products'
ingredients appear on labels.
2.6.2. MEDICINES' ADVERTISING. PROMOTION, PRICING AND
DISTRIBUTION:
The issue of medicine abuse and advertising of nonprescription
medicines has been studied by the US Federal Trade Commission, the
government agency having jurisdiction over consumer advertising
(Mercill 1983). Leffler (1981) stresses that intensive advertising
41
of medicines results in excessive use of high-priced, heavily
promoted brand name products even though equivalent low priced
products are available. Those viewing pharmaceutical advertising
with disfavour insist that these ads are frequently uninformative
and seem simply to harp on the product's name in order to persuade
doctors to select that product out of habit rather than by
evaluative choice. For OTC products in Japan, regulations take care
of that market, check on advertising claims and truthfulness.
Doctors and other health-professional organization scrutinize the
quality and quantity of advertising material and detailing used by
the pharmaceutical companies (Pradhan 1983).
In many pharmaceutical markets, Pradhan (1983) emphasises that
pricing is no longer an area of marketing freedom. The government
agencies directly intervente in pricing in order to support local
manufacturers, control inflation, reduce balance of payments
deficits or improve the balance of payments position, maintain
price levels at the desired level, and not subsidize export market
prices. The governments have various means of achieving these
goals. Some impose direct price control, some have voluntary price
guide-lines, while some restrict the prices of active ingredients
or components of products. Pradhan adds that Germany and the US
have the least formal direct price control. Tucker (1984) concludes
that in countries which have a fairly strong domestic industry in
medicines, the government regulations find it far easier to control
medicine prices than in countries which are more heavily dependent
on imports.
Finally Tucker (1984) mentions the control over distribution
as a goal among those related directly to health cosiderations, The
regulations involved in attaining this goal are related to safety
42
TY
L IRY
1.
and efficient supply, with the aim being that access to dangerous
medicines is restricted to licensed medicine outlets, of which
there should be a sufficient number to serve the population.
2.6.3. POST-MARKETING SURVEILLANCE:
it is well known that the medicines which are available are
not always used in the correct way. Therefore, while it is
important to provide prescribers with continuing information on
medicines efficacy and safety, it also necessary to assess the
effects of giving them such information.
Many government officials have considered the need for a
better monitoring system which they felt would be an asset to the
public as well as to the pharmaceutical industry. This system is
popularly known as Post-Marketing Surveillance (PMS). PMS is
defined by Strom and Nelson (1979) as °a process that
systematically and comprehensively monitors the patterns of use and
benefits of prescription medicines as they are applied in medical
practices". In other words, it is the task of PM to supervise
medical products already on the market (Hart 1989). A new system
was developed by the US Joint Commission On Prescription Drug Use
in conjunction with the Health Protection Branch of Canada. The
commission also recommended that a permanent 'Centre For Drug
Surveillance" be established to speed up cooperation among existing
HIS programs and to develop new methods for carrying out PhS
(Hanson 1979).
A rationale for PHS is argued on the grounds that consumers do
not select the product but rather follow the advice of their
doctors. Also, consumers do not receive nor can they comprehend
information on medicines, thereby creating a classic case of
43
externally forced choice. The voluntary reporting system is
explained by Strom and Nelmon (1979) as one of the most important
techniques of VMS which is organized to collect, amplify and
distribute the information available from the collective
experiences of both doctors and patients. This technique has
advantages, some of them are: 1) it automatically assesses every
new medicine as it enters the market; 2) it is relatively
inexpensive to maintain; and 3) it cuts down on the amount of time
a doctor has to wait in order to receive feedback on a certain
medicine. However, the technique has some disadvantages such as the
difficulty for a patient to determine the role of utilization of
the medicine.
The subject of government regulation is not foreign to the
pharmaceutical industry. Therefore, it is not surprising that a
proposed VMS system faced strong reaction from many pharmaceutical
executives. Tucker (1984) demonstrates that the pharmaceutical
industry fears that governments might act unilaterally to legislate
their desired VMS, thereby clashing with the industry's own
medicine surveillance program, free from government interference.
Whatever the different views of the governments and the
reactions of pharmaceutical industries of VMS, Hart (1989)
concludes that at any rate, the effectiveness and workability of
VMS of medical products is extremely important because it alone can
guarantee a high level of safety.
44
2.7. THE WORLD-WIDE HEALTH CARE:
The increasing availability of health-care to a large section
of the world's population, particularly in the industrialized
nations, has greatly affected the demand for medicines.
2.7.1. THE CONSUMPTION OF MEDICINES:
Hany health-care systems around the world have introduced
measures to reduce overprescribing by the doctor and
overconsumption by the patient.
The overconsumption and wastage of medicines is rapidly
becoming a major issue in most countries, and there is strong
evidence that most governments of industrialized nations will
develop sophisticated data banks and undertake detailed
prescription analysis to control both prescribing and consumption.
Slatter (1977) demonstrated that the overconsumption of antibiotics
is a major problem in many countries particularly so in the UK
where antibiotics account for 14 per cent of ethical pharmaceutical
sales compared to only about 8 per cent in other countries in
western Europe. Medawar (1984) emphasises that one of the greatest
medicine-related world health problems is overconsumption, despite
the underconsumption in some countries. However, the WHO has yet to
emphasise the essential medicine policies which are fundamental to
the control of both under and over consumption of medicines. There
is a universal acceptance of the principle that essential medicines
should be available for use whenever needed.
Generally speaking, the consumption of medicines varies from
one country to another, James (1983) introduces two conditions
which lead to different demand levels of medicines. One is. the
climatic conditions, e.g., whether medicines are seasonal. Another
45
is the quality and quantity of medicines available in different
countries, this influences also consumption patterns. Tucker (1984)
adds another condition, that is the economic state of a country
affects the rate of medicine consumption. In developed countries
medicine consumption is clearly related to per capita income, thus
medicines are one of the consumer products for which the demand is
tied in with standard of living.
Although medicine consumption has increased faster in the poor
countries, it has nevertheless continued to rise in the developed
countries, despite the virtual eradication of many diseases and the
general improvement in health standards which has prevented most
people in developed countries from contracting these diseases. In
terms of overall consumption, medicine consumption is concentrated
with 25 per cent of the world's population living in the developed
countries responsible for about three-quarters of medicine
purchases.
2.8. SUMMARY OF PART ONE:
This part was mainly devoted to the different issues of
world-wide pharmaceutical marketing. We presented a short review of
the structure of the global pharmaceutical industry followed by the
characteristics of global pharmaceutical marketing which is
categorised into the prescription pharmaceutical market and the
over-the-counter market.
This part also presented the identification of the market of
pharmaceuticals which consists of consumer / patient and the
doctor. Different arguments are introduced to show the merits of
pushing more power either to the patient or the doctor in that
market.
46
I.
The next section focused on several aspects of the marketing
strategies (i.e., advertising and promotion, distribution, pricing,
patterns of consumption). A review of governments' regulations over
pharmaceutical marketing world-wide was presented in terms of
guidelines and monitoring systems covering various marketing
practices. Post-Marketing Surveillance was introduced to supervise
medicines already in the market.
This part was concluded by a brief presentation of world-wide
health-care through the patterns of consumption of medicines.
47
PART TWO.
THE EGYPTIAN PHARMACEUTICAL PRODUCTS' MARKET.
2.9. THE PHARMACEUTICAL INDUSTRY IN EGYPT:
Medicine has been given deep consideration as it is a
sensitive product evidently related to human life , in addition to
its importance in terms of technological and economic dimensions.
Most societies are handicapped in their attempts to define whether
medicine is a product or a service - is it available for purchase
only by consumers who are able to do so or is it considered as a
basic human right and should be available when the need arises.
The pharmaceutical industry in Egypt has made good progress,
so that it is now able to cover about 80 per cent of the
consumption by local production. The United Nations recorded such
success and therefore, selected the pharmaceutical industry in
Egypt as a good example to all the industries in the developing
countries.
Generally, the medical industry is one of the most
important industries in the world, it depends primarily on
continuous scientific research and development in order to attain
better treatment for human relief.
Briefly, the medical industry has several characteristics.
First, the importance of medicine as a product related to consumer
health. Second, the great variety of the combinations of raw
material in each finished medicine. Third, the high accuracy
required to get the right medical formulation. Fourth, the number
of different industrial operations each pharmaceutical product
needs.
48
1.
2.10. AN OVERVIEW OF THE HISTORICAL DEVELOPMENT OF THE
PHARMACEUTICAL SECTOR IR EGYPT:
A series of changes and developments have been taking place in
the pharmaceutical sector since 1939.
The pharmaceutical industry exerts a profound influence over
the effectiveness of policies to protect people's health. Thus it
may be useful to consider the four phases which the medicine sector
has gone through.
2.10.1. THE FIRST PHASE (1939 - 1961):
The first attempts to establish a modern pharmaceutical
industry were pioneered in 1939 when the bank of Egypt established
a small pharmaceutical company (Misr Company). Another two small
companies were formed (Memphis in 1940 and CID in 1947). Moreover,
there were sixteen other small companies owned by individuals as
well as twenty two small laboratories producing some simple
pharmaceutical products.
Before 1952, the local medicine industry was five million L.E
that covered about 107. of the medical needs at that period. Then
the medicine industry at that time achieved two important goals,
acquiring good experience on one hand, and establishing a degree
of confidence among consumers and medical personnel on the other
hand. The first revolutionary action was the establishment of the
Service and Production Committee in 1953. In that committee it was
found that the medicine problem was related to economic and
industrial problems as well as the social and health problems in
Egypt. The production committee was concerned with the medical
industry, while the service committee was concerned with health
services. In 1955 both committees were concerned with medicine
49
problems and an associate committee was established to study those
problems and to suggest possible ways of coordinating activities
between the industry and other services.
In 1956, the Development Committee Of The Medicine Industry
was established according to Decision Number 5. That act was
followed up by the establishment of a Superior Industry Of Medicine
and the decision to develop an exhaustive medicine policy with
regard to the economic and health plan. In July 1960, the Republic
Decision Number 212 restricted the import of medicine by the
Egyptian Trade And Distribution Organisation For Pharmaceuticals.
The major role of that organisation was the distribution of local
and imported medicine.
In 1961, the government achieved full control over 90% of
national production through mandatory state capital sharing in
sizable companies. That step implemented a reduction of all the
difficulties of finance and credit as well as operational and
structure constraints. In a short period, the success was
remarkable.
2.10.2. THE SECOND PHASE (1962 - 1975 ):
The substantial growth of the Egyptian medical industry
started at the beginning of 1962, by the nationalisation of the
medicine industry. That was implemented through the establishment
of the Egyptian General Organisation For Pharmaceutical Chemicals
And Appliances (00PCA) with full authority over planning,
production, importation and distribution under policy guidance of
Ministry Of Health. Similar action was taken in all the other
industrial and bulk trade sectors. The financial institution' were
nationalised as well. The Egyptian pharmaceutical industry
50
successfully implemented the Republic Decision Number 216 in the
period from 1962 to 1975. That decision had been complemented by
the establishment of several pharmaceutical companies (El Kahira,
El Arabia, Alexandria, El Nile) in 1962 and El Nasr in 1963.
Moreover, two trading companies had been established, El Gomhoria
for the importation and distribution of medical appliances in 1962,
and El Masryia for the importation and distribution of medicines.
The Medical Packaging Company was set up in 1965. Added to these,
another three Egyptian / foreign companies (i.e, )oint- ventures )
had been set up in the medicine market ( Phizer Egypt and Hoechst
Orient in 1962 and Swisspharma in 1965).
Finally in that stage, a centre for medical control and
research had been established in 1964 and staffed by experts in
the area of research and development (R&D). With accurate planning
and clear objectives therefore, the medical sector achieved good
progress during that period. The production covered about 72% of
the market needs while in 1950's it covered only 10%.
2.10.3. THE THIRD PHASE (1976 - 1982 ):
Because of the political / economic shift namely the open
door policy, a new turn in medicine policy took place during that
time. GOPCA was cancelled in order to give local manufacturers,
brokers, and private and public importers some self reliance, self
liberation as well as to allow for rationalised competition among
the companies and to face the difficulties created by the
circumstances of the open market economy. In order to face the open
door policy, a Superior Committee of the medical sector had been
established in which the open importation policy was considered as
a part of national production. However, the local market was
51
greatly shaken by the open door policy, probably that problem
along with others, were in a sense a natural consequence that
forced the health authority to establish the hinistariate Committee
For the Pharmaceutical Sector helped by the technical secretariat
to supervise private sector importers. Later on, the American
company (Squibb Egypt) was established in 1979 according to law 43
of 1974. In the beginning of 1980, the pharmaceutical public
sector shared other Arabic countries' financial, managerial and
technological experiences by the construction of ACDIHA companies
(Egyptian, Arabic investment). The principal goals of ACDIHA
groups are:
1) To complete the market needs of products that are not covered
completely by the local production of the public sector.
2) To produce new products that can replace the imported ones.
3) To increase availability of raw materials in order to overcome
the problem of hard currency.
4) To apply new technology in the pharmaceutical industry and
research by making licence agreements with some international
pharmaceutical companies for the acquisition of technology and
know-how.
In reality ACDIHA contributed heavily to the expansion of the
medicine sector in Egypt. It has three different groups of
companies. First, two companies for medicine production (Egyptian
International Pharmaceutical Industries Co. EIPCO, and Upper Egypt
Pharmaceutical Industries Co. UEPICO). Second, two companies for
medical packaging production (Arab Medical Co. FLE)CIPACK and Arab
Pharmaceutical Glass Co. APGCO). Third, three companies for raw
materials' production (Arab Hedical Plant Co. MIPACO, Arab Hedical
52
Gelatine production Co. ARABCAPS and Arab Medical Raw Material Co.
ACOPHARMA).
Finally, the investment policy encouraged some experts and
consultants in the field of medicine products to construct other
companies such as
1) Islamic Medical Industry Co. PHARCO (Egyptian / Italian
investment).
2) Advanced Biochemical Industries Co. ABI (Private Egyptian
investment).
2.10.4. THE FOURTH PHASE (1983- ):
The political targets of social justice for the administration
of safe and effective medicines and reasonable prices required a
major reorganisation of GOPCA and the establishment of Drug
Organisation For Chemical And Medical Appliance ( DOCKA ) which is
responsible for strategic planning, monitoring and evaluation of
most activities of the medicine sector. DOCMA owns eleven
pharmaceutical companies for production, trading and distribution
of medicines and medical appliances, while the others as we can
see in figure (2.2) are completely economically independent but
under the supervision of the DOCMA broad. The main function of
DOCKA is to act as the main authority on various national
pharmaceutical companies either public, joint-venture, or public
or private investment companies, to attain the coordination
objective of the health planning and policies of the country. The
major objectives of DOCMA are:
1) To set up the necessary legal framework and administrative
machinery as an attempt to evaluate and standardise all
activities of public sector companies, aiming at quick . sell
53
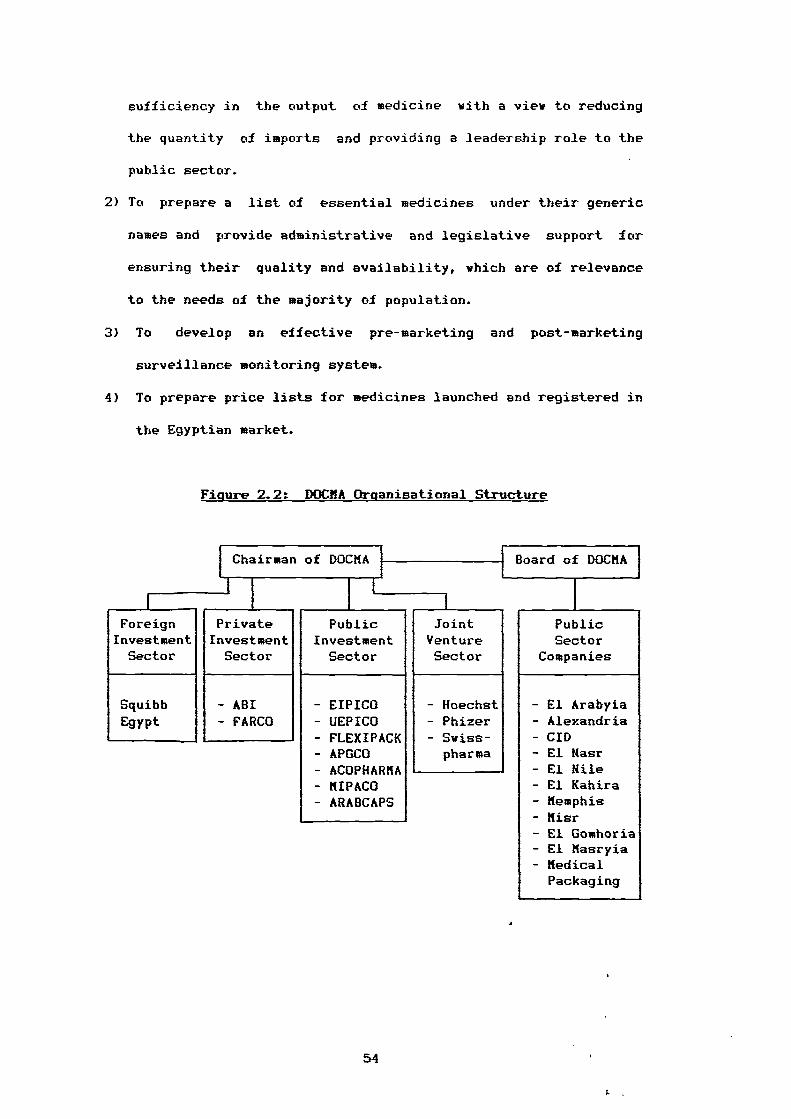
sufficiency in the output of medicine with a view to reducing
the quantity of imports and providing a leadership role to the
public sector.
2) To prepare a list of essential medicines under their generic
names and provide administrative and legislative support for
ensuring their quality and availability, which are of relevance
to the needs of the majority of population.
3) To develop an effective pre-marketing and post-marketing
surveillance monitoring system.
4) To prepare price lists for medicines launched and registered in
the Egyptian market.
Figure 2.2: DOCMA Organisational Structure
Chairman of DOGMA Board of cocmA
1
Foreign Private Public Joint PublicInvestment Investment Investment Venture SectorSector Sector Sector Sector Companies
Squibb - ABI - EIPICO - Hoechst - El ArabyiaEgypt - FARCO - UEPICO - Phizer - Alexandria
- FLEXIPACK- AMC°
- Swiss-pharma
- CID- El Hasr
- ACOPHARMA - El Mile- MIPACO - El Kahira- ARABCAPS - Memphis
- Misr- El Gomhoria- El Masryia- MedicalPackaging
54
2.11. THE MAJOR ELEMENTS OF THE PHARMACEUTICAL POLICY:
Undoubtedly, the pharmaceutical policy is integrated with the
national health policy, it is considered therefore as a part of an
exhaustive development plan. In the following sections we discuss
the major elements of that policy.
2.11.1. THE Cn-ECTION OF MEDICINES:
The policy of selection of any kind of medicine to be an
Item in the drug list occupies a great deal of time in the
pharmaceutical policy agenda. Selection depends on many aspects.
First is the economic cost of the item. However, the goal is to
cancel the kinds that are expensive in comparison with their
importance in achieving a remedy. Second, the pharmaceutical
policy gives deep consideration to the side / adverse effects of
medicines use in order to protect the consumer, especially the
disadvantaged patients who use medicine regularly (e.g., diabetics,
unbalanced blood pressure patients). Third, the policy aims also
to study the extent of the side / adverse effects which come with
some kinds of medicines .
2.11.2. THE INCREASE OF THE LOCAL PRODUCTION SHARE:
The productivity of the medicine public sector is the
biggest concern of the pharmaceutical policy, namely that the
public sector should be the basic source of medicines in the
market place. Local production showed up well in producing new and
important therapeutic groups (i.e, essential medicines) which
nearly satisfy the national consumption requirement. The essential
medicine list was prepared by DOCMA and issued officially in 198.8,
it is revised annually by a committee of experts. The choice of
55
I.
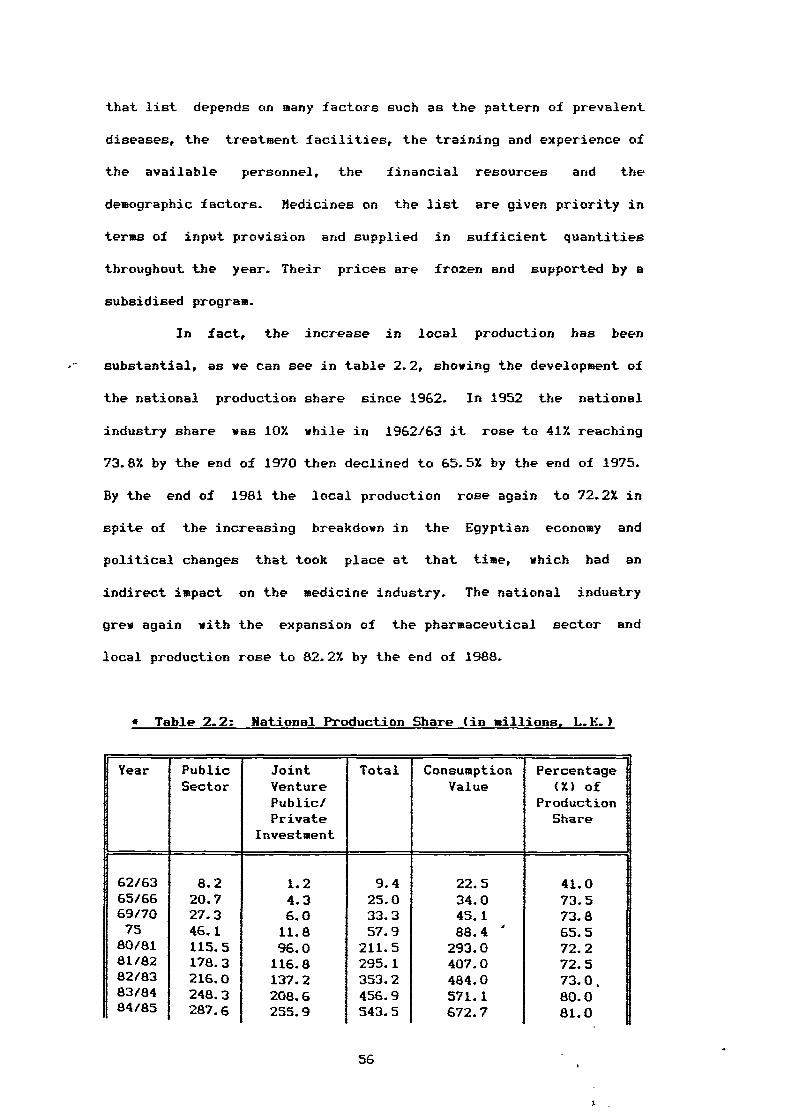
that list depends on many factors such as the pattern of prevalent
diseases, the treatment facilities, the training and experience of
the available personnel, the financial resources and the
demographic factors. hedicines on the list are given priority in
terms of input provision and supplied in sufficient quantities
throughout the year. Their prices are frozen and supported by a
subsidised program.
In fact, the increase in local production has been
substantial, as we can see in table 2.2, showing the development of
the national production share since 1962. In 1952 the national
industry share was 10% while in 1962/63 it rose to 41% reaching
73.8% by the end of 1970 then declined to 65.5% by the end of 1975.
By the end of 1981 the local production rose again to 72.2% in
spite of the increasing breakdown in the Egyptian economy and
political changes that took place at that time, which had an
indirect impact on the medicine industry. The national industry
grew again with the expansion of the pharmaceutical sector and
local production rose to 82.2% by the end of 1988.
• Table 2.2: National Production Share (in millions, L.E.)
Year Public Joint Total Consumption PercentageSector Venture Value (X) of
Public/ ProductionPrivate Share
Investment
62/63 8.2 1.2 9.4 22.5 41.065/66 20.7 4.3 25.0 34.0 73.569/70 27.3 6.0 33.3 45.1 73.875 46.1 11.8 57.9 88.4 ' 65.5
80/81 115.5 96.0 211.5 293.0 72.281/82 178.3 116.8 295.1 407.0 72.582/83 216.0 137.2 353.2 484.0 73.0,83/84 248.3 208.6 456.9 571.1 80.084/85 287.6 255.9 543.5 672.7 81.0
56
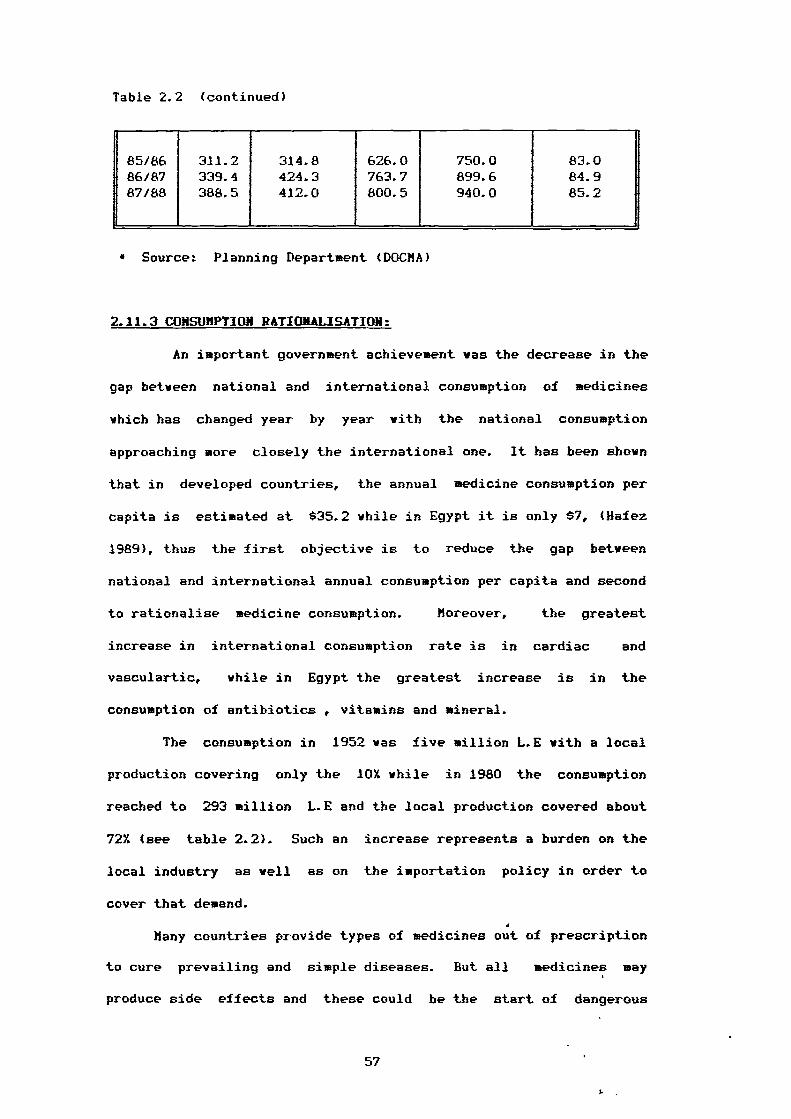
Table 2.2 (continued)
85/8686/8787/88
311.2339.4388.5
314.8424.3412.0
626.0763.7800.5
750.0899.6940.0
83.084.9
1
85.2 1i
I
• Source: Planning Department (DOCMA)
2.11.3 CONSUMPTION RATIONALISATION:
An important government achievement was the decrease in the
gap between national and international consumption of medicines
which has changed year by year with the national consumption
approaching more closely the international one. It has been shown
that in developed countries, the annual medicine consumption per
capita is estimated at $35.2 while in Egypt it is only $7, (Hafez
1989), thus the first objective is to reduce the gap between
national and international annual consumption per capita and second
to rationalise medicine consumption. Moreover, the greatest
increase in international consumption rate is in cardiac and
vasculartic, while in Egypt the greatest increase is in the
consumption of antibiotics , vitamins and mineral.
The consumption in 1952 was five million L.E with a local
production covering only the 10% while in 1980 the consumption
reached to 293 million L.E and the local production covered about
72% (see table 2.2). Such an increase represents a burden on the
local industry as well as on the importation policy in order to
cover that demand.
Many countries provide types of medicines out of prescription
to cure prevailing and simple diseases. But all medicines may
produce side effects and these could be the start of dangerous
57
I.
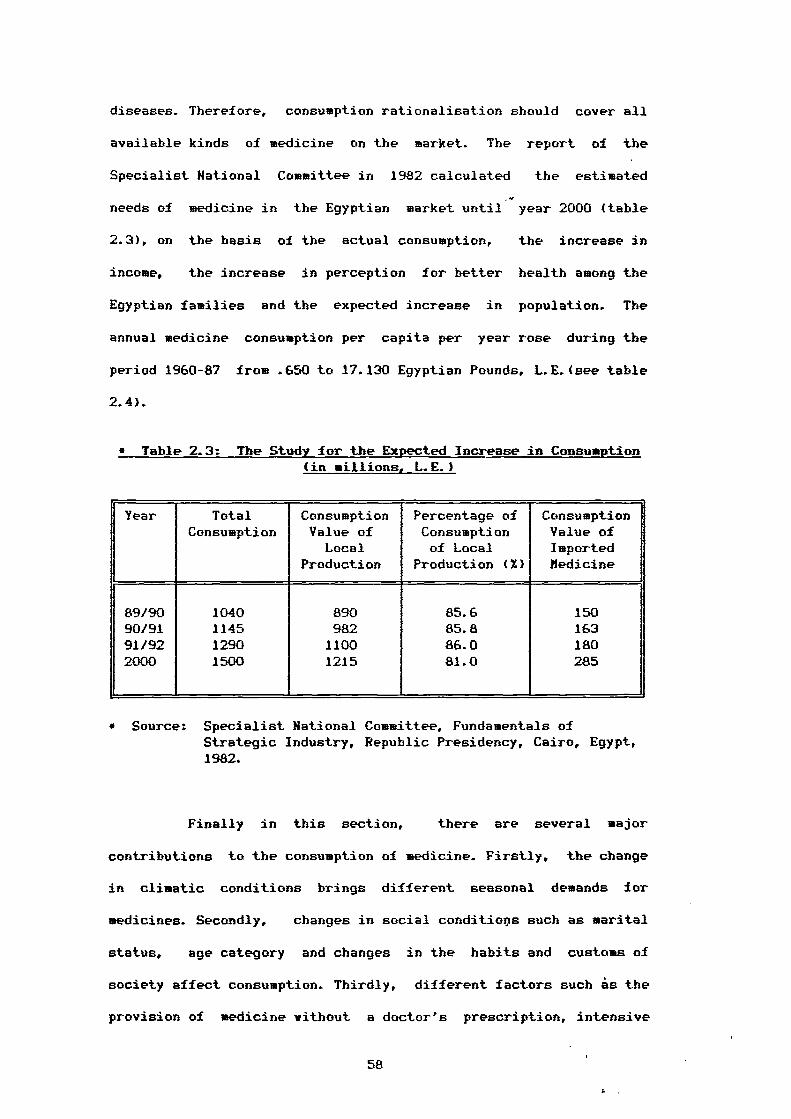
diseases. Therefore, consumption rationalisation should cover all
available kinds of medicine on the market. The report of the
Specialist National Committee in 1982 calculated the estimated
needs of medicine in the Egyptian market until year 2000 (table
2.3), on the basis of the actual consumption, the increase in
income, the increase in perception for better health among the
Egyptian families and the expected increase in population. The
annual medicine consumption per capita per year rose during the
period 1960-87 from .650 to 17.130 Egyptian Pounds, L.E.(see table
2.4).
• Table 2.3: The Study for the Expected Increase in Consumption (in millions, L.E.)
Year Total Consumption Percentage of ConsumptionConsumption Value of Consumption Value of
Local of Local ImportedProduction Production (Z) Bedicine
89/90 1040 890 85.6 15090/91 1145 982 85.8 16391/92 1290 1100 86.0 1802000 1500 1215 81.0 285
• Source: Specialist National Committee, Fundamentals ofStrategic Industry, Republic Presidency, Cairo, Egypt,1982.
Finally in this section, there are several major
contributions to the consumption of medicine. Firstly, the change
in climatic conditions brings different seasonal demands for
medicines. Secondly, changes in social conditiops such as marital
status, age category and changes in the habits and customs of
society affect consumption. Thirdly, different factors such is the
provision of medicine without a doctor's prescription, intensive
58
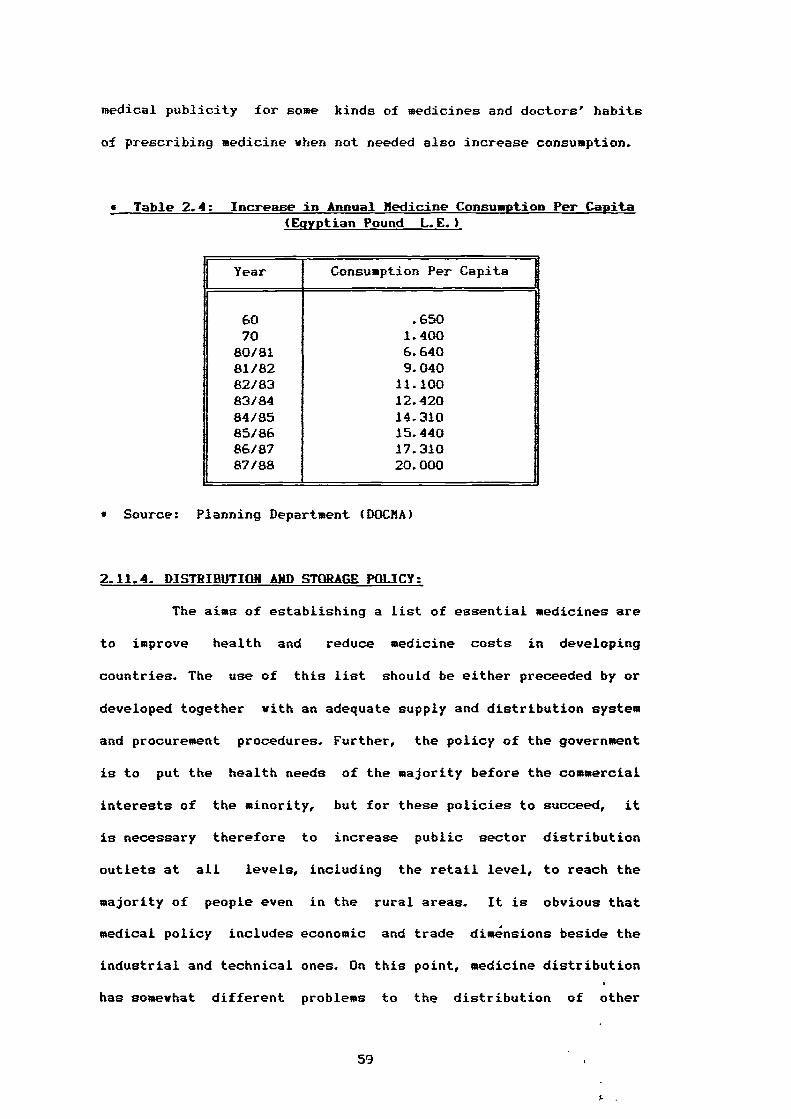
medical publicity for some kinds of medicines and doctors' habits
of prescribing medicine when not needed also increase consumption.
• Table 2.4: Increase in Annual Medicine Consumption Per Capita (Egyptian Pound L.E.)
1 Year Consumption Per Capita
60 .65070 1.400
80/81 6.64081/82 9.04082/83 11.10083/84 12.42084/85 14.31085/86 15.44086/87 17.31087/88 20.000
• Source: Planning Department (DOM)
2.11.4. DISTRIBUTION AND STORAGE POLICY:
The aims of establishing a list of essential medicines are
to improve health and reduce medicine costs in developing
countries. The use of this list should be either preceeded by or
developed together with an adequate supply and distribution system
and procurement procedures. Further, the policy of the government
is to put the health needs of the majority before the commercial
interests of the minority, but for these policies to succeed, it
is necessary therefore to increase public sector distribution
outlets at all levels, including the retail level, to reach the
majority of people even in the rural areas. It is obvious that
medical policy includes economic and trade dimensions beside the
industrial and technical ones. On this point, medicine distribution
has somewhat different problems to the distribution of other
59
I.
products. Medicine should be available at all times in adequate
amounts and in the appropriate dosage forms.
Storage of medicine needs technical experts in order to keep
control over the medicine production / expiry dates especially for
antibiotics. El hasryia For Medicine Trade And Distribution
Company is the body responsible for achieving sufficiency and
distribution in order to make medicine available to all citizens.
According to the pharmaceutical policy, El Masyria Co. distributes
about 40% of the public sector production through its forty eight
branches and thirty public chemists around all the country. While
the remaining 60% is distributed by the production companies
themselves. In contrast, El Hasryia Co. undertakes the
distribution of all imported medicines (i.e, 100%). Thus, this
company always has obtained a direct government subsidy to keep the
prices of essential medicines at the desired level. It also
receives another indirect subsidy supplied by the Egyptian Central
Bank (see table 2.5) in order to cover the differences between the
Egyptian and the foreign currency.
• Table 2.5: Direct and Indirect Subsidy (in millions, L.E.)
Year Direct Subsidy From Indirect Subsidy From TotalThe Ministry of The Egyptian Central
Health Rank1
77 12.0 - 12.078 - - -79 6.0 - 6.080 4.5 - 4.5
81/82 6.0 - 6.082/83 6.0 - 6.083/84 6.0 30 36.0
60
Table 2.5 (continued)
1
84/85 7.5 35 42.585/86 8.2 40 48.286/87 5.0 40 45.087/88 15.9 45 60.088/89 15.0 50 65.0
* Source: Planning Department (DOCHA)
2.11.5. IMPORTATION POLICY:
Pharmaceutical policy aims to restrict import activity and
considers its role as an integrated activity rather than a
competing role in order to complete the market needs of medicine
that are not available by the local production of the
pharmaceutical sector. The strategy ensures that dependence on
imports is reduced to the minimum. A high priority is given to new
international medicines which could complete the current medicines
groups. On the other hand, it attempts to exclude high price
imports that are similar to current local products in the market.
It is quite clear that the policy goal is to continue to
import a small percentage of all finished medicines, particularly
since the world-wide pharmaceutical industry can take advantages of
the rapid developments in the medicine field in providing new
products.
El Masryia For Trade And Distribution Company is the corner
stone for importation to satisfy the health care needs that cannot
be met by local production, by keeping private importation at a
minimum and directed towards the highly iherapeutic vital
products. Thus the scarcity of some kinds of medicine is due to the
decision to exclude some 126 items from the importation list.
61
Regarding the need for imported raw materials to avoid the
short fall in the domestic plan, the data shows an increase of
imported raw materials during the period 1983-1989. The importation
in 83/84 was 77.2 million L.E while in 88189 it was 291.3 million
L.E (see table 2.6). When considering these figures it must be
borne in mind that the Egyptian Pound (LE) has been steadily
losing value compared with the currency of those countries from
which Egypt imports raw materials.
• Table 2.6: Increase in Annual Imported Raw Materials (inmillions, I.E.)
1Year
t
Value of Imported Raw Materials
83/84 77.284/85 82.385/86 85.986187 181.387/88 207.188/89 291.3
• Source: Planning Department (DOCMA)
2.11.6. CONTROL OVER MEDICINE PRICES:
Medicine prices have risen with the recent increasing
inflation and the increased value of imported raw materials,
despite the fact that the Egyptian government sets constraints in
an attempt to control medicine costs, especially the medicines
offered at no charge from public hospitals. The pharmaceutical
policy is to study the prices regularly and allow price increases
only after considering the increase in raw materials' costs and the
increase in income level in Egyptian society.
62
The Minister of Health emphasised that great efforts are
usually necessary to keep medicine prices at a reasonable level (
Dwyddar, El Abram, 1989). Regarding the many complaints that have
been received about the increase of medicine prices, he also
stressed that the imported medicines are the source of complaints,
but these kinds represent only about 207. of all medicines. Further,
he added that the unique reason for the high prices of imported
medicines is the increase in cost in obtaining them. In fact, the
imported medicines are usually placed on the market at the real
prices (i.e, without subsidies) especially the ones not on the
essential drug list, whilst, the essential groups are often bounded
and subsidised to secure their availability at appropriate prices.
Additionally, the Minister of Health ensures that the pharmacists
and other experts in the medicine industry make efforts to produce
alternatives to imported medicines with the same mode of action as
well as of vital therapeutic potency.
Briefly, the control over prices comes in the form of a fixed
price list set by the Pricing Committee in the Ministry Of Health.
The prices usually have been set in the light of the prices of the
other alternatives in the market.
2.11.7. MEDICAL CONTROL:
All medicines either locally produced or imported are firmly
and comprehensively controlled to reduce associated health risks
before permission for sale is granted. The control authority within
the Ministry Of Health is the Central Administrption Of Pharmacy
Department (CAPD). Medicine control in Egypt concentrates on four
main areas. First, all medicine products are subject to
registration procedures to ensure: 1) safe, effective and
63
I.
inexpensive medicine of good quality reaches the consumer and 2)
the abuse and misuse of medicine is discouraged. Second, licensing
of the premises became a basic requirement owing to the vide
expansion of the pharmaceutical industry within both public and
private sectors. The need arose for more specific control. Through
the World Health Organisation (WHO) specification for good
manufacturing practices efforts were directed to establish basic
requirements and standards for licensing medicine companies in
Egypt. Third, an inspection of medicines has to be carried out
during and after the manufacturing cycle. CARD is responsible for
such inspections. Fourth, the control of importation and
exportation is a critical stage in the medical control program.
Samples of imported batches are tested by The National Control
Laboratories. Medicines for export require many control checks by
the manufacturer and official authorities at CARD before an export
certificate is issued.
2.12. RECENT DEVELOPMENTS IN THE PHARMACEUTICAL SECTOR:
The pharmaceutical industry has been successful in implementing
a substantial program with respect to different aspects of
technology over the last few years.
2.12.1. THE DEVELOPKEKT IN THE FIELD OF TECHKOLOGY:
The majority of the current medicine companies make extensive
use of new industrial automation. However, the Egyptian
pharmaceutical sector is considered a pioneer in using computer
facilities for its data processing activities such as evaluation
and updating the annual plan, consumption, forecasting and
information systems which have been developed since 1983 by the
64
Egyptian Drug Information Centre (EDIC). This centre has carried
out tasks such as collection, classification, processing,
storage, retrieval and dissemination of pharmaceutical information
in the Egyptian market.
Further, good progress has been made in the area of new and
important pharmaceutical groups and forms (e.g., tablets, syrups)
especially, by the investment sector. Production now covers about
23 dosage forms and includes new forms that have never been
produced in Egypt before. It also covers about 21 new
therapeutical groups. Additionally, the manufacturers not only
focused their attention on production development but also on
quality assurance procedures using the most recent technology in
this area such as the expansion of quality control activities to
fulfil the assurance programs on raw materials and finished
products.
Finally in this section, it is worthwhile mentioning that the
Egyptian experts contributed by transferring technology to a number
of Arabic countries such as Iraq, Syria, Lebanon, Jordan and
Kuwait.
2.12.2. THE DEVELOPMENT OF THE RAM MATERIALS INDUSTRY:
Undoubtedly, the raw materials industry is considered a
high technology industry. The public sector manufacturer (El Haar
Company) succeeded in manufacturing close to 12% of raw materials
used in medicine production in 1987, the remaining 88% was produced
by investment companies (ACOPHARMA, MIPACO, ARABCAPS). These
companies secured the availability of raw materials at low prices
and reduced the dependence on the imported raw materials. Table 2.7
65
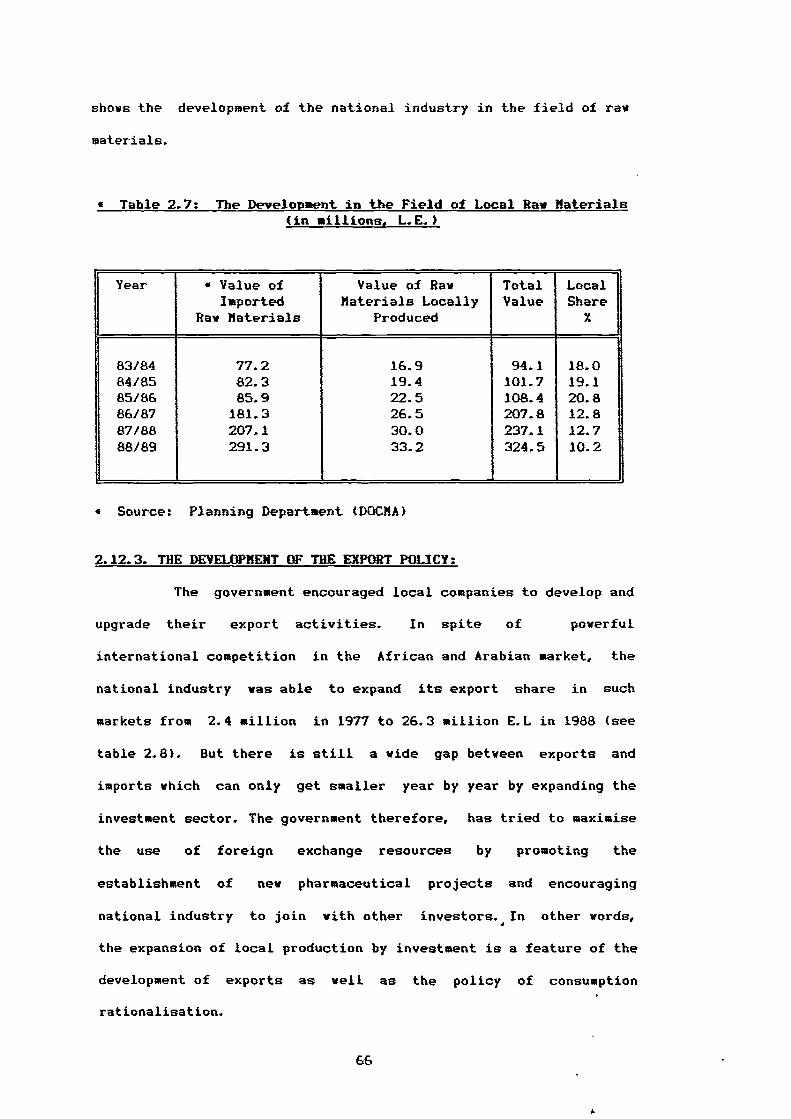
shows the development of the national industry in the field of raw
materials.
• Table 2.7: The Development in the Field of Local Raw Materials(in millions, I.E.)
Year • Value of Value of Raw Total LocalImported Materials Locally Value Share
REM Materials Produced X
83/84 77.2 16.9 94.1 18.084/85 82.3 19.4 101.7 19.185/86 85.9 22.5 108.4 20.886/87 181.3 26.5 207.8 12.887/88 207.1 30.0 237.1 12.788/89 291.3 33.2 324.5 10.2
• Source: Planning Department (DOCMA)
2.12.3. THE DEVELOPMENT OF THE EXPORT POLICY:
The government encouraged local companies to develop and
upgrade their export activities. In spite of powerful
international competition in the African and Arabian market, the
national industry was able to expand its export share in such
markets from 2.4 million in 1977 to 26.3 million E.L in 1988 (see
table 2.8). But there is still a wide gap between exports and
imports which can only get smaller year by year by expanding the
investment sector. The government therefore, has tried to maximise
the use of foreign exchange resources by promoting the
establishment of new pharmaceutical projects and encouraging
national industry to join with other investors. In other words,
the expansion of local production by investment is a feature of the
development of exports as well as the policy of consumption
rationalisation.
66
1.
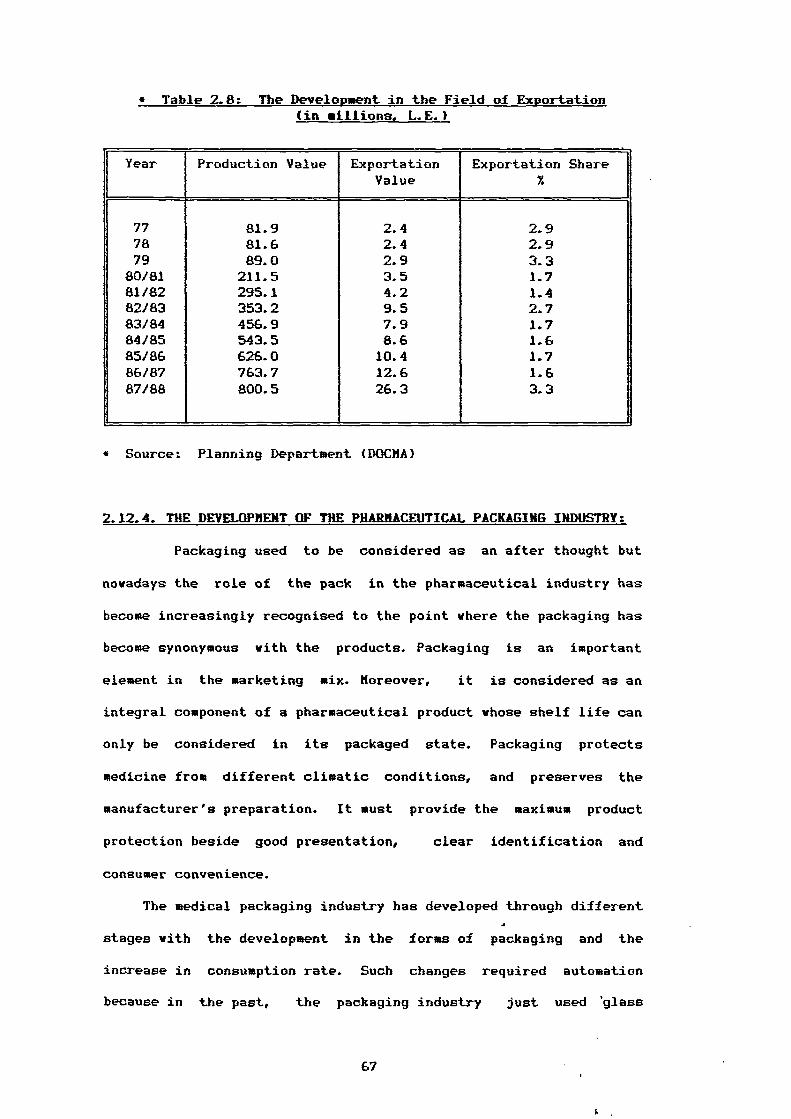
• Table 2.8: The Development in the Field of Exportation (in millions, L.E.)
Year Production Value ExportationValue
Exportation Share
77 81.9 2.4 2.978 81.6 2.4 2.979 89.0 2.9 3.3
80181 211.5 3.5 1.781/82 295.1 4.2 1.482/83 353.2 9.5 2.783/84 456.9 7.9 1.784/85 543.5 8.6 1.685/86 626.0 10.4 1.786/87 763.7 12.6 1.687/88 800.5 26.3 3.3
• Source: Planning Department (DOCMA)
2.12.4. THE DEVELOPMENT OF THE PHARMACEUTICAL PACKAGING INDUSTRY:
Packaging used to be considered as an after thought but
nowadays the role of the pack in the pharmaceutical industry has
become increasingly recognised to the point where the packaging has
become synonymous with the products. Packaging is an important
element in the marketing mix. Moreover, it is considered as an
integral component of a pharmaceutical product whose shelf life can
only be considered in its packaged state. Packaging protects
medicine from different climatic conditions, and preserves the
manufacturer's preparation. It must provide the maximum product
protection beside good presentation, clear identification and
consumer convenience.
The medical packaging industry has developed through different
stages with the development in the forms of packaging and the
increase in consumption rate. Such changes required automation
because in the past, the packaging industry just used 'glass
67
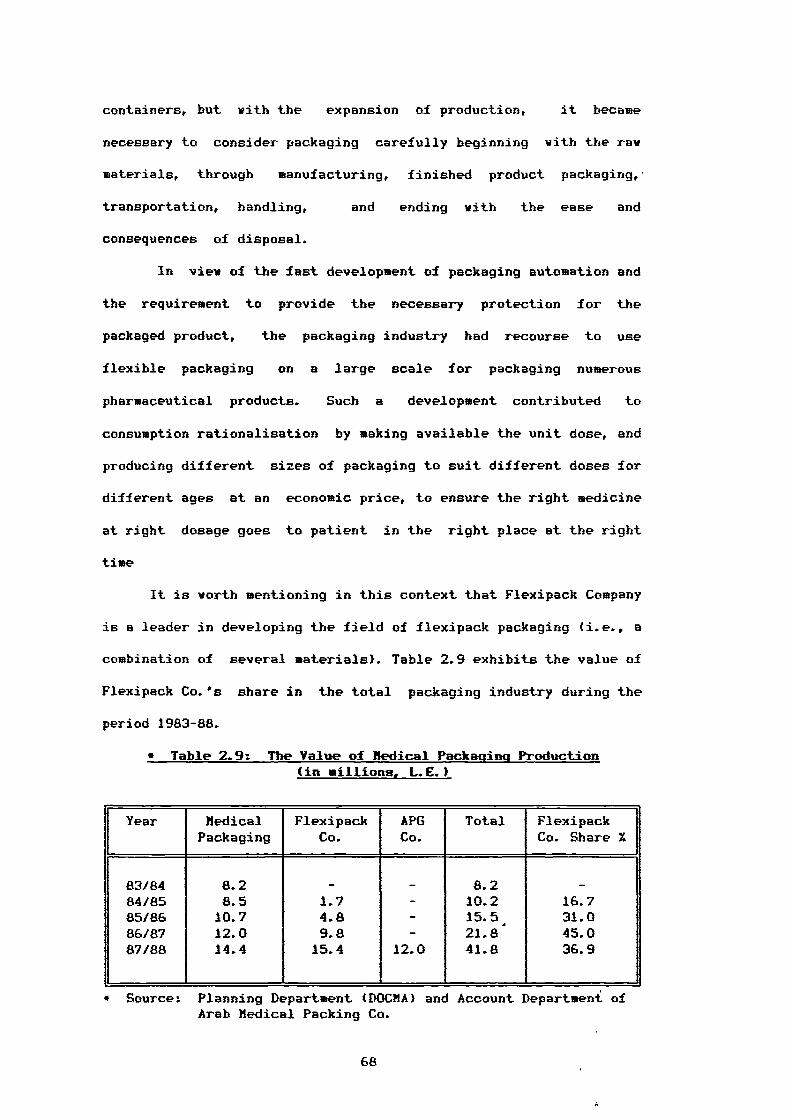
containers, but with the expansion of production, it became
necessary to consider packaging carefully beginning with the raw
materials, through manufacturing, finished product packaging,'
transportation, handling, and ending with the ease and
consequences of disposal.
In view of the fast development of packaging automation and
the requirement to provide the necessary protection for the
packaged product, the packaging industry had recourse to use
flexible packaging on a large scale for packaging numerous
pharmaceutical products. Such a development contributed to
consumption rationalisation by making available the unit dose, and
producing different sizes of packaging to suit different doses for
different ages at an economic price, to ensure the right medicine
at right dosage goes to patient in the right place at the right
time
It is worth mentioning in this context that Flexipack Company
is a leader in developing the field of flexipack packaging (i.e., a
combination of several materials). Table 2.9 exhibits the value of
Flexipack Co.'s share in the total packaging industry during the
period 1983-88.
• Table 2.9: The Value of Medical Packaqins Production(in millions, L.E.)
Year MedicalPackaging
FlexipackCo.
APGCo.
Total FlexipackCo. Share %
83/84 8.2 - - 8.2 -84/85 8.5 1.7 - 10.2 16.785/86 10.7 4.8 - 15.5, 31.086187 12.0 9.8 - 21.8 45.087/88 14.4 15.4 12.0 41.8 36.9
• Source: Planning Department (DOCMA) and Account Department ofArab Medical Packing Co.
68
To summarise, packaging is a means of economically providing
protection, presentation, identification / information, convenience
and containment of a product during storage, carriage, display and
use until it is used or administered. Good presentation enhances
patient confidence with positive visual impact. Further, medicines
are handled by professional people (i.e., doctors, pharmacists). It
is equally important therefore that their confidence in a product
is not downgraded by the pack. Flexible packing provides
convenience e.g., the use of Blister or Strip packs for unit
doses. The protective function of a pack is to guard against
various hazards. Additionally, it should be stressed that the pack
must contain maximum product information, especially the mode by
which a product may deteriorate or degrade.
Security of the medicine packaging should be mentioned in this
section as a feature of packaging development. However, the
guarantee of complete medicine safety from production to the site
of action in the body is an essential factor in the medicine
industry in Egypt. A patient wants to feel secure with regard to
his health and is particularly sensitive in this respect. The
doctor has to take this increased need into account in his
consultation, while the manufacturer must pay attention to other
aspects centred around active ingredients and packaging
information.
In summary, the manufacturers have made good progress in the
production of securely packaged medicines using different methods
for securing the various types of packaging and types of dosage
forms. Pharmacists have always had a responsibility to provide
medicines which are suitable for the purpose in appropriate and
secure packs, and consumers must know how to identify resistant
69
features of packages. The pharmaceutical industry has succeeded in
manufacturing several packaging types such as:
1) Plastic containers and Blister Packs for solids. These kinds,
are unit dose packs.
2) Glass containers with Pilfer Proof Caps for solids and liquids,
in order to assure product purity. Closures can be made easy to
open and close and accommodate the dispensing requirements.
3) Tamper-evident packaging technology. This is an additional
factor in protecting consumers.
4) Sleeves used as protection for packages.
2.13. Summary 01 Part Two:
In this chapter, we have presented an overall view of the
pharmaceutical market in Egypt. It is clear that the
pharmaceutical industry has made considerable progress in recent
years.
To fully understand the historical development of the
pharmaceutical sector, four stages of changes and expansion were
described.
The chapter focused also on several key aspects of the
pharmaceutical policy. One of these was the increase of consumption
of medicine and the need for a rationalisation policy. Also,
medical control procedures have become increasingly important with
the recent changes in export policy.
The last section of this chapter examined the technological
developments in the pharmaceutical sector. The most dramatic
development was shown in the new technology of the packaging
industry, especially in the field of flexible packaging which was
70

launched in the market several years in order to bring better
protection for the Egyptian consumers.
71
CHAPTER THREE
CONSUMER SATISFACTION / DISSATISFACTION
3.1. Introduction To Consumer Satisfaction / Dissatisfaction.
3.2. Classification Of Consumer Satisfaction.
3.3. Conceptualization Of Consumer Satisfaction / Dissatisfaction.
3.3.1. Satisfaction Defined.
3.3.2. Dissatisfaction Defined.
3.3.3. Consumer Satisfaction And Attitudes.
3.3.4. Approaches to Consumer Satisfaction .
3.3.4.1. Antecedents Of Satisfaction.
3.3.4.1.1. Expectation - The Primary
Determinant Of Satisfaction.
3.3.4.1.2. Performance.
3.3.4.1.3. The Concept of Disconfirmation
And Inequity.
3.3.4.1.4. A Model Of Consumer Satisfaction.
3.3.4.2. Post Evaluation And Satisfaction.
3.3.5. Psychological Theory Of Consumer Satisfaction.
3.3.6. Sociological Interpretation Of Consumer Satisfaction.
3.3.6.1. Alienation.
3.3.6.2. Communication - Effect Theory.
3.3.7. Utility Theory Of Consumer Satisfaction /
Dissatisfaction.
3.4. The Relationship Between Satisfaction / Dissatisfaction.
3.5. Measurement Of Consumer Satisfaction / Dissatisfaction.
3.5.1. Measurement Problems.
3.6. Summary.
72
3.1. INTRODUCTION TO CONSUMER SATISFACTION / DISSATISFACTION (CS/D):
Marketing academics have long been concerned about satisfaction
/ dissatisfaction and a considerable body of academic literature
has been formed around this topic.
For that reason, the concept of consumer satisfaction occupies
a central position in marketing thought and practice. Churchill and
Suprenant (1982) remind us that satisfaction is a major outcome of
marketing activity and serves to link the purchase and consumption
process with post purchase phenomena such as attitude change,
repeat purchase and brand loyalty. Kotler (1984) describes
satisfaction as the starting point for the discipline of marketing
activities. Further the marketing philosophy of business tells us
that it is the function of business to satisfy consumer needs at a
profit. Despite such assertions, Howard and Hulbert (1973) submit
that managers are disposed to accept sales dollars, market share or
profit as a substitute for the yardstick of true consumer
satisfaction. in addition, most corporations have assumed the vast
majority of their customers are satisfied. Stokes (1973) considered
the small minority which actually complains to be an atypical
segment.
Conversely Kotler (1976) suggested that consumer satisfaction
has long been a central concern of modern marketing practitioners
and more recently a major concern of various government agencies
engaged in consumer protection activities. The consumerist movement
had made consumer satisfaction an ever salient concern for both
business and government by calling attention to consumer
dissatisfaction with products, services and marketing practices.
Oliver (1979) suggests that if the most fundamental of
reinforcement theories is to believed, the subject of consumer
73
satisfaction / dissatisfaction (CS/fl) should occupy a prominent
position in the conversation of academics and practitioners alike.
The lack of adequate conceptualization and measurement of CS/D,
is definitely a major hindrance to public policy staff, to
legislators, to marketing managers, to consumerists and to consumer
behaviour theorists, although each group recognizes the need for
the development and implementation of that concept. For instance,
if consumers are dissatisfied, a business may face declining sales
(London 1977a). Business should therefore become interested in -
measures of consumer satisfaction. Consumer satisfaction measures,
may be helpful in determining the potential market of a product.
Moreover, marketing management should be interested in consumer
satisfaction because that has been held their ultimate goal as well
as their intermediate goals (e.g., profit, sales volumes, market
share, etc). Pratt (1972) suggested that, organizations' research
should be devoted therefore to the topic of satisfaction.
For this to come about Czepiel and Rosenberg, (1976) have
developed the following series of research questions which should
addressed:
(1) What is the relationship between satisfaction and sales, brand
loyalty, profit?.
(2) Can satisfaction be predicted or can it be used to predict
outcomes?.
(3) How sensitive is consumer satisfaction to changes in the
competitive environment?.
(4) What are the specific product and service variables that have
the greatest influence on consumer satisfaction for a given
product / service?.
74
(5) Can a measure of consumer satisfaction provide useful
diagnostic measures which explain states or marketing
problems?.
(6) How often and how should satisfaction be monitored or
measured?.
(7) Are there general principles with respect to consumer
satisfaction which can be used in the initial design of
products or marketing strategies or is its usefulness
restricted to exploring factors for diagnostic purposes?.
Czepiel and Rosenberg (1976) added three reasons which dictate
that research should be directed to these questions:
(1) Product proliferation in almost all categories gives consumers
a greater opportunity to choose those products which yield a
higher level of satisfaction
(2) The generally increasing level of consumer sophistication and
the awareness of sound buying practices and strategies subject
products to a closer pre-purchase scrutiny.
(3) The increasing interest of government and consumer spokes
persons demands that business be knowledgeable regarding its
own performance.
Those who favour government intervention in the market place
on the consumer's behalf believe that the economic system is not
completely capable of serving the public interest through the
profit motive. So the government seeks to identify and isolate
those products and industries where governmental action is
desirable to enhance consumer welfare.
Hughes (1976) explored four factors which are important to any
general program of consumer satisfaction, these are
75

(1) The monetary importance of the product to the consumer.
Generally, consumers carefully investigate the available
merchandise before making a purchase.
(2) The price point or level of quality which a consumer decides
upon for a particular purchase. Do those consumers who paid the
highest price generally express higher satisfaction than those
consumers who have paid lover prices?.
(3) The possibility that satisfaction levels are related to certain
demographic characteristics. If demography is a consideration,
then some products if purchased heavily by certain demographic
segments will of necessity have above or below average
satisfaction.
(4) The possibility that there are segments of the consumer
population which may be quite easily satisfied and will give
high ratings to many purchases.
In the light of the above factors, satisfaction is considered
an important phenomenon. It is a key concept in any theory of
consumer behaviour. Leavitt (1976) continued this notion and stated
that satisfaction represents an opportunity to other areas of
applied psychology. More specifically, the consumer decision making
process can be considered a key to post purchase evaluation and
hence influential upon further behaviour (Engel el al 1986).
Second, Czepiel et al (1974) presented the doctrine of consumer
sovereignty as one of the above mentioned factors which leads
economists to equate satisfaction with utility in order to enjoy
the use of goods and services. Hunt (1976) considered the
satisfaction of different groups and emphasized that a comparison
of those groups is very much culture bound. However, various social
76
groups, especially, broad cultural groups, have different learning
processes and experiences.
In concluding this introduction, it is important to
acknowledge several basic assumptions regarding consumer
satisfaction before moving on (Plummer 1974, Andreasen 1976, Day
1977). First, the actual experience with a product / service is
possibly the major factor influencing consumer satisfaction. That
experience often determines whether or not a subsequent purchase or
some form of redress will occur. Second, a distinction between a
generalized feeling of satisfaction and specific events or
experiences must be made. Third, there are variables external to
the actual experience (before, during, after) which play an
important role in determining consumer satisfaction.
3.2. CLASSIFICATION OF CONSUMER SATISFACTION:
For the purpose of marketing management, CS/D may be classified
in several ways. Czepiel et al (1974) identified three sorts of
consumer satisfaction: system satisfaction, enterprise satisfaction
and product / service satisfaction.
System Satisfaction may be defined as the consumer's
subjective evaluation of the total benefits they derive from the
operation of the marketing system. In developing an index of
consumer satisfaction Pfaff (1972) viewed system satisfaction as a
measure of the subjective welfare of consumers as influenced by the
attributes and circumstances under which goods and services are
offered in the market, such as prices, availability and image of
products. Renoux (1973) discriminated between two dimensions of
system satisfaction (Macro-Marketing System / )iicro-Marketing
System). Whereas in the Macro-Marketing System, the level of
77
satisfaction is not associated with specific producers, dealers or
products, the flicro-Harketing System is the level of satisfaction ./
dissatisfaction with specific aspects of the marketing system.
Furthermore, Renoux, advocated the following three sorts of
consumer satisfaction in the Micro-Marketing system:
(1) The Shopping- System involves the availability of products and
types of retail outlets.
(2) The Buying-System is concerned with the process of selecting
purchasing and receiving products from stores patronized.
(3) The Consuming-System results from problems in using and
consuming goods and services.
Enterprise Satisfaction refers to what is gained by consumers
in dealing with complex product / service organisations (e.g.,
health care facilities). Czepiel et al (1974) described the
enterprises system as a function of the consumption of a wide range
of products and service, and their surrounding factors such as
products assortment, atmosphere, location, etc.
Product I Service Satisfaction refers to the favorability of
the individual's subjective evaluation of the various outcomes and
experiences associated with using or consuming products or services
(Westbrook 1980a). This level of satisfaction is concerned with the
evaluation which occurs when a product / service offering interacts
with the internal processes of the consumer. More precisely, the
evaluation is based on a cognitive process in which consumers
compare their prior expectations with product outcomes (i.e,
product performance).
The three sorts of consumer satisfaction seem interchangeable,
since System-Satisfaction embraces all of the individual Product /
78
Service Satisfaction and the Enterprise Satisfaction components
accumulated by the consumer.
3.3. CONCEPTUALIZATION OF CONSUMER SATISFACTION / DISSATISFACTION (CS/fl):
As our economy, society and the market place become more
complex and interrelated, the need to put phenomena such as
consumer satisfaction into a broader framework becomes more
pronounced. In other words, before CS/D can play a positive role in
public issues, it must be based on adequate conceptualization and
suitable measurement methodologies, which most researchers,
policymakers, marketers and consumerists agree are presently
lacking.
Before discussing the conceptualization of CS/D, it is useful
to consider the definition of consumer satisfaction and how
satisfaction differs from attitudes.
3.3.1. SATISFACTION DEFINED:
Undoubtedly, any consumer satisfaction research is designed
to answer one question: are consumers pleased or displeased with
products in the market place?
Wilton (1985) states that, the notion of satisfaction became
more obvious and specific subsequent to the birth of modern social
science. Satisfaction is also important in the development of
modern marketing thought. In all basic marketing texts, consumer
satisfaction has always been defined as the means through which
marketers can achieve their organisational objectives ()Cotler
1972a).
79

Definitions and conceptualizations of consumer satisfaction
show substantial variety. The following literature is worth
mentioning here.
Plummer (1974) gives us a starting point for a definition
"business, government and other nonprofit organisations need
measures of how products and services are meeting client needs and
wants, so that they can enhance their own and / or society's well-
being". The extent to which these needs and wants are net has come
to be called consumer satisfaction.
Some 20 years ago Howard and Sheth (1969) defined
satisfaction as "the buyers' cognitive state of being adequately or
inadequately rewarded for the sacrifice he / she has undergone'.
They added, satisfaction is not necessarily the same objective
evaluation of reward, it can vary among people and for a given
person over time. Pfaff (1976) defined consumer satisfaction as the
inverse of the difference between the ideal and the actual
combination of attributes. Hiller (1976) saw consumer satisfaction
as perceived performance. While Hample (1977) stated that consumer
satisfaction is defined as the extent to which expected product
benefits are realized; it reflects a degree of congruence between
actual outcomes and expected consequences.
Other attempts have been made to define consumer satisfaction.
Several researchers (Day 1977, Oliver 1977, Swan and Travick 1981)
have used many techniques and models from studies of job
satisfaction. Locke (1976) adopted Howard and Sheth's definition
(1969) in which satisfaction is defined as "a ppsitive emotional
state resulting from the appraisal of one's job and as a function
of the perceived relationship between what one wants from one's job
80

and one perceives it as offering', and put it into a consumer
context.
More recently, Oliver (1981) defines satisfaction more broadly
as 'the summary psychological state resulting when emotion
surrounding disconfirmed expectation is coupled with the consumer's
prior feeling about consumption experience'. Engel et al (1986)
bring with their definition not only expectation but also the
concept of comparison with alternatives, defining satisfaction as a
" post consumption evaluation that the chosen alternatives is
consistent with prior beliefs and expectation with respect to that
alternatives'. Whilst Goodman (1989) defines satisfaction as 'the
state in which consumer needs, wants and expectations are met or
exceeded resulting in purchase and continuing loyalty'.
3.3.2. DISSATISFACTION DEFINED:
The recognition of dissatisfaction is as important as
satisfaction. Nevertheless, the literature is poor in defining
dissatisfaction and concentrates on satisfaction. Handy (1976)
defined consumer dissatisfaction as 'the gap or distance between
the consumer's (ideal) attribute combination for a product or
service and the attribute combination of the product or service
offered in the market place which should come closest to this
(ideal).
Cohen (1981) relates dissatisfaction and expectation, he
suggests that dissatisfaction stems in part from consumer's rising
expectations which may be due to the increase in consumer affluence
and sophistication. Moreover, Cohen used the Random House
Dictionary in developing a definition of dissatisfaction which was
quite similar to his definition. It stated "dissatisfaction results
81
from contemplating what falls short of one's wishes or
expectation TM . Engel et al (1986) give an exhaustive definition of
dissatisfaction, explaining dissatisfaction as the outcome when the
confirmation of product or service does not take place. Vinson and
Pearson (1978) tell us that, *while consumers have experienced,
unprecedented affluence, unlimited consumption opportunities and
improved products, they are nevertheless beginning to display
dissatisfactionTM.
Other writers offer further reasons for dissatisfaction. La
Tour and Peat (1979) cited an important and direct reason for
consumer dissatisfaction that is, that the quality of products are
inferior. While Miller, (1976) identified another two reasons for
dissatisfaction. One is the raising expectation which is an obvious
source of discontent. Expectations of product reliability and
performance are more sophisticated now more than ever before
(Diener 1975). The other reason lies in the decrease of consumer
options available. Consumers may have the resources for buying the
product or service that "fits their needs". It is conceivable that
the options available in the market place do not satisfy their
needs as they would like. Further, many alternatives of some
products categories may exist and an average consumer then is
frequently unqualified to judge or evaluate which product
alternative is best for his / her needs.
82
3.3.3. CONSUMER SATISFACTION AND ATTITUDES:
In order to understand the similarity and dissimilarity
between satisfaction and attitudes, it is necessary to give an
insight into the nature of attitudes with respect to the earlier
stages in the buying process. Engel et al (1986) developed a model
presented in figure (3.1) which shows the evaluation stages
starting with beliefs and attitudes and resulting in a possible
shift of intention. This is followed by the purchase stage which
leads to satisfaction / dissatisfaction. Earlier work by Lutz
(1975) portrays beliefs as the immediate causal antecedents of
attitude, while intentions are the immediate causal consequences
being one step removed from attitude.
The concept of attitudes has occupied a central place in the
explanatory system of the theories in human behaviour. Hence, there
are quite number of definitions of attitude, the most frequently
used definition is presented by Fishbein and Ajzen, (1975). They
defined attitudes as a "learned predisposition to respond in a
consistently favourable or unfavourable manner with respect to a
given object. Engel et al (1986) define attitudes as 'the mental
and neural state of readiness to respond that is organized through
experience and exerts a directive and / or dynamic influence on
behaviour". Assael (1987) proposes the model of complex decision
making where attitudes are a central component of a consumer's
psychological set and one of two thought variables. The other
thought is need. Attitudes are seen as the consumer's evaluation
of the ability of alternative brand or product categories to
satisfy these needs. Needs therefore, influende attitudes and
attitudes influence purchase. Attitudes are seen as being made up
of three underlying components (Lutz 1975, Roberston et 81'1984,
83
and Elbeck 1987). First is the cognitive component which refers to
the beliefs an individual holds about object. Second, is the
affective component i.e, a person has a positive affect (like) or
negative affect (dislike) toward an object. Finally, there is the
conative component which refers to the tendency to act, the
readiness of an individual to behave toward object. Fishbein and
Ajzen (1975) explained attitude under the unidimensionslist
approach, the cognitive and conative components are "pulled out" of
attitude; cognition is relablled beliefs and conation is relablled
intention and behaviour. Thus, under such an approach attitude
consists of affect only.
Cohen (1981) represents the functional conceptualization of
Daiel Katz (1960). Katz felt that attitudes can serve four basic
functions within the individual. First, the utilitarian function: a
recognition that attitudes can be instrumental in achieving
desirable goals and avoiding undesirable alternatives. Second, the
ego-defensive function which serves to help the individual deal
with his inner conflicts. Third, the expressive function by which
attitudes give positive expression to the individual's values and
to the type of person he conceives himself to be. Fourth, the
knowledge function which helps the individual cope with a complex
world that cannot grasped in its entirety.
Hustad and Pressemier (1971) defined attitudes as a 'learned
and enduring predisposition to act. It may be the product of such
components as perception, beliefs, values, motives and
preferences'. Beliefs then are components of attitudes. In order to
show the interaction between beliefs and attitudes Petrof (1971)
introduced two definitions of an attitude. First, he defined the
term as 'an enduring learned predisposition to behave a consistent
84
way towards a given class of objects' (similar to )4ustand and
Pressemier 1971). The second definition is m an enduring system of
positive or negative evaluation, emotional feeling and pro or con
action tendencies with respect to a social object". Both
definitions indicate that the nature of beliefs that an individual
holds toward object and his associated evaluation determine his
attitude toward that object.
Regarding intention, Howard and Sheth (1969) defined intention
as 'a cognitive state that reflects the buyer's plan to buy units
of a particular brand in some specified time period, this intention
reflects his attitude'. Frank et al (1972) support the Howard and
Sheth definition, they state that intention to buy may be viewed as
one of the three basic components of any attitude system (i.e,
cognitive, affective, conative). Obviously, the above discussion
presents beliefs and intention as components of attitudes.
The next point to be touched upon here is the similarity and
dissimilarity between attitudes and satisfaction. Hunt (1976)
suggested that consumer satisfaction is an attitude in the sense
that it is "an evaluative orientation which can be measured'. He
added 'consumer satisfaction is a special kind of attitude because
by definition it cannot exist prior to the purchase or consumption
of the attitude object". Czepiel and Rosenberg (1976) agreed with
Hunt's view that consumer satisfaction is an attitude in that it is
an evaluative orientation (affective) which can be measured. Many
researchers (Czepiel and Rosenberg 1976, Pfaff 1976, Miller 1977,
Oliver 1981) agreed that satisfaction to a great extent is
analogous to attitude. Pfaff 1976 suggested that satisfaction can
be denoted in part by all components of attitudes. The cognitive
component indicates the confirmation or disconfirmation of
85
expectation and performance of the product, the affective component
indicates whether the consumer is satisfied or dissatisfied with
the product, and the conative component whether to stop or arouse
future purchase in the post-purchase situation. Therefore,
satisfaction is not only an attitude, it is a richer concept than
attitude. Further, consumer satisfaction is more experience
specific than attitude, it gives additional insights into attitude.
Czepiel and Rosenberg (1976) regarded consumer satisfaction as an
indicator of product performance. A further distinction has been
raised by La Tour and Peat (1979) that the primary distinction
between satisfaction and attitude derives from temporal
positioning: attitude is positioned as a pre-decision construct,
while satisfaction is a post-decision construct.
86
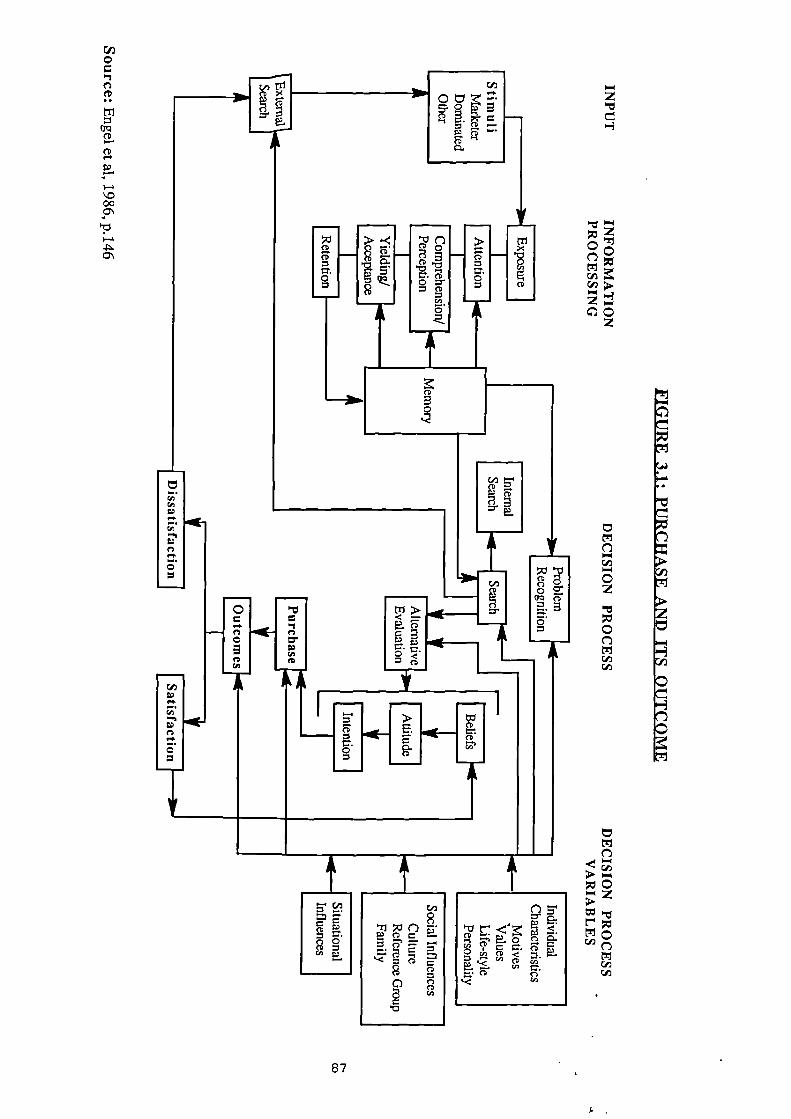
^0-3
CD
CD
0
> (-)o
8-(0
coC7 CD
co ^
A
A
00.
nnnn11
0
CD
,••••
o5
411(
.4E
triNat—
CD
OP
67
Howard And Sheth Model (1969):
The Howard and Sheth model (Hassarjian and Robertson, 1973) is
the first systematic effort to develop a comparison theory of
consumer behaviour (figure 3.2). By investigating the Howard and
Sheth model, it is clear that they distinguish between satisfaction
and attitude. Satisfaction and attitude appear as two of the six
distinct learning constructs (i.e, confidence, motives, intention,
attitude, choice criteria, brand comprehension and satisfaction)
suggesting that satisfaction and attitude play an equal role in the
circle of learning constructs. In other words, satisfaction "serves
as a controlling system linking through its impact on brand
comprehension, attitude and confidence". In addition, 'satisfaction
within the theory of consumer behaviour refers to the degree of
congruence between the actual consequences of purchase and
consumption of a brand, and what was expected from it by the buyer
at the time of purchase" (Kassarjian and Roberston, 1973). If the
actual outcomes are judged by the buyer to be better than or equal
to the expected, the buyer will feel satisfied. If on the other
hand, the actual outcomes are judged to be less than what he
expected, the buyer will feel dissatisfaction.
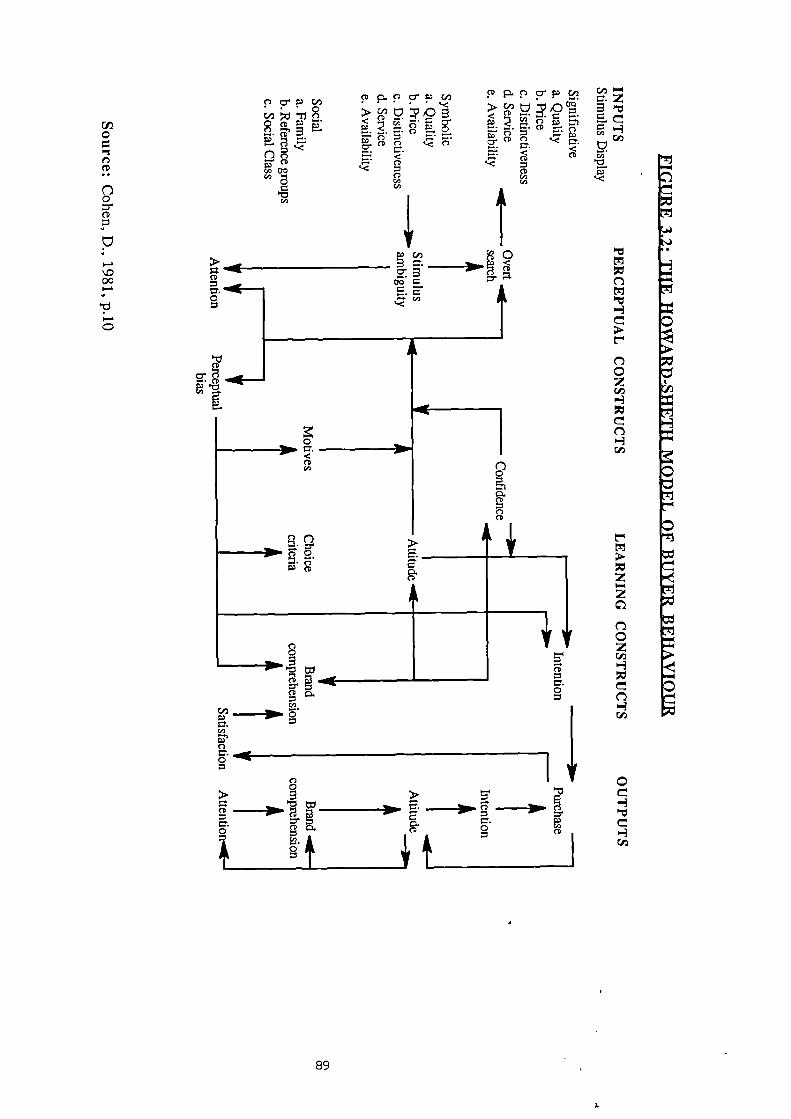
0• n•
0.•••
NIP
•S.
Ira
0-4
CD
=-•0
9 g0
n.AD cp
p cr p P P I. „T P P crpcon > 0
>< c-o
<E. 2 - P2.
• c-D =. CD E. r). — c.)1
$1) co c) cr CD CDIt%
E. 0 ."—% cr(;) CD
CD
C/3cq)
'153/
og▪ c c- A
E. 5—‘e
A
0
CD
•
n••n-31111. N R.
M". S''. --alin Ft" --311In ill
5-
cz..= =.
E11:1C
> 5 ?: 5' C
= o=".o co
i&
o4. t= C t 1
cr.)co i
89
3.3.4. APPROACHES TO CONSUMER SATISFACTION
There appear to be two distinct approaches to the study of
satisfaction / dissatisfaction. The first approach is primarily
concerned with the antecedents (causes) of the state of
satisfaction, where the critical variables of interest are a
consumer's level of expectation regarding product, performance and
the subsequent confirmation / disconfirmation and the feeling of
inequity (positive or negative). The second approach is post
evaluation.
3.3.4.1. ANTECEDENTS OF SATISFACTION:
Numerous theoretical structures have been proposed to
examine the antecedents of satisfaction and develop meaningful
measures of the construct. Churchill and Supprenant (1982) express
that the vast majority of these studies have used some variant of
the disconfirmation theory which holds that satisfaction is related
to the size and direction of the disconfirmation experience, where
disconfirmation is related to a person's initial expectation. More
specifically, an individual's expectation is: a) confirmed when a
product performs as expected, b) negatively disconfirmed when the
product performs more poorly than expected, c) positively
disconfirmed when the product performs better than expected.
Dissatisfaction results when a subject's expectations are
disconfirmed. The full disconfirmation encompasses five constructs:
expectation, performance, disconfirmation, inequity and
satisfaction.
90
3.3.4.1.1. EXPECTATION - THE PRIMARY DEMEMINANT OF SATISFACTION:
Day (1977) has explained expectation as' the consumer's
estimate at the time of purchase, or prior to usage, of how well or
poorly the product will supply the benefit of interest - to the
consumer'. Shiffman and Kanuf (1983) try to bring in reasons behind
expectations 'people usually see what they expect to see, and what
they expect to see is usually based on familiarity, on previous
experience, or on preconditioned (set)'. Ross et al (1987)
suggested that expectation reflects 'a generally optimistic or
pessimistic viewpoint about a specific situation'. Pitts and
Woodside (1984) present three major types of expectation according
to the literature on consumer satisfaction:
(1) Predictive expectation deals with beliefs on the likelihood of
the performance level. Barbeau(1985) brings with his definition
not only the performance level, but also the prior expectation
and other information about how the product will perform. He
adds that predictive expectation is seen as a cognitive
construct representing the levels of attributes that the
consumer thinks will be found in a particular product.
(2) Normative expectation is concerned with the ideal standards
about how a product should perform. Barbeau (1985) states that
the ideal standards may be independent of a particular brand or
product.
(3) Comparative expectation deals with the performance of the brand
compared to other similar brands.
The literature further shows that normative expectations are
the most appropriate determinants of satisfaction'. Olson and Dover
(1976) defined expectation as the consumer's belief about the level
of attributes possessed by a product. hiller's paper (1977)
91
discussed carefully the role of expectation in CS/D. However, most
of the expectation studies which utilize the confirmation of
expectation approach to consumer satisfaction have assumed either
implicitly or explicitly that an evaluative reaction will
automatically ensue after a consumption experience and will result
in either positive feeling about the experience (satisfaction) or
negative feeling (dissatisfaction). The results of these feelings
are irrelevant to the magnitude of the difference between the
perceived performance of product and the level of expectation with
which the consumer entered the consumption process.
There seems therefore a uniform acceptance of the importance
of expectation to CS/D studies. In thinking about expectations Day
(1977) proposed three categories in which expectation should be
broken down:
(1) Expectation About The Nature And Performance Of The Product
(attributes of the product):
In general, expectation about the nature and performance of the
product will be based on previous experience with that particular
item. The consumer who has a lot of experience with a product can
be expected to have a well-formed expectation about the item which
has been learned over time. But the inexperienced user will have a
relatively weak expectation of the attributes and performance of a
product. He will tend to rely on advertising, sales presentation
and advice of others more than the experienced consumer, and his
expectations are likely to be more incomplete as well as less
stable than those of experienced user. In the case of ambiguous
attributes, La Tour and Peat (1979) have stressed that the more
ambiguous the attribute, the more the consumer will be forced to
92
rely on the expectation -producing information rather than
judegment in forming a belief about the attribute level. The more
ambiguous the attribute, the smaller the discrepancy between the.
subjectively obtained level and the expected level, and thus the
more effective high expectation would be in producing greater
satisfaction.
(2) Expected Cost:
The price paid for an item . can have a rather complex effect on
the consumer's evaluative reaction. Price is often interpreted as
an index of the quality of an item. So that, a high price tends to
create high expectation of performance while low price leads to low
expectation of performance. Barksdale and Perreault (1980) carried
out an empirical study to explore whether consumers were satisfied
or dissatisfied with prices of consumer goods. Responses were
collected through mail questionnaires consisting of a series of
Likert-type statements. Those statements were arranged in several
groups, among them a group measuring attitude toward the price of
some consumer goods . Over one-half of the respondents disagreed
with the statement that the most important problem facing them is
the high price of consumer goods.
Day (1976,1977) considered the effect of price and the
importance'of the purchase to consumer. The expected cost of an
item can have an influence on the pre-purchase seeking and thus may
lead to better formed expectation.
93
(3) Social Benefit Of Purchase / Use:
For many products, there are benefits of purchase and consumption
quite independent of the attributes of the product, those products
which are jointly consumed with others, or are publicily consumed.
They may have sufficient social significance that the purchaser
will have formed an expectation about the reaction of others whose
approval is important to him.
(4) Expectation With Respect To Pharmaceutical Products:
In pharmaceutical marketing, mostly the target of the
salesmanship is the prescribing doctor and not the final purchaser.
Therefore, some writers consider doctors as consumers as did Knapp
and Oeltjen (1972) in an experimental study of risk-benefit
assessment by practitioners regarding medicine selection. They
posited that the probability of a practitioner prescribing a
medicine for a particular patient was a function of several kinds
of expectation: 1) doctor expectancy that a beneficial effect on a
patient's condition would occur if the medicines were prescribed;
2) expectation of the amount of beneficial effect to be gained; 3)
expectancy of medicine side-effects; and 4) expectation of the
magnitude of these side-effects. In addition, Smith (1983a)
mentions many considerations which are involved in determining what
medicine costs really mean to the patient. Some of them are
considered to be in the context of expectation such as the
perceived cost, the expected cost, and the post cost experiences.
94
3.3.4.1.2. PERFORKANCE
Churchill and Suprenant (1982) saw the primary importance
of performance in the satisfaction literature as a standard of
comparison by which to assess disconfirmation. Olshavsky and Miller
(1972) and Olson and Dover (1976) manipulated actual performance,
but their emphasis was on how performance rating was influenced by
expectation rather than on the impact of changes in performance
level on satisfaction (see figure 3.3), though it is reasonable to
assume that increasing performance should increase satisfaction.
Day (1982) has questioned "acceptable performance", demonstrating
that there is no obvious way to establish a consensus standard on
the acceptance level of satisfaction or dissatisfaction at any
point of time.
3.3.4.1.3. THE CONCEPT OF DISCONFIRNATION AND INEQUITY:
The disconfirmation concept has been viewed in many
studies as the net change in attribute rating or belief
probabilities before and after exposure to the product (Olson and
Dover 1976, and Swan 1977). Westbrook and Reilly (1983) add that
disconfirmation involves consumer comparison between pre-purchase
beliefs about a product with post-purchase beliefs formed during
consumption of the product. The extent to which post-purchase
beliefs disconfirm their pre-purchase counterparts is theorised to
be the principal determinant of satisfaction / dissatisfaction.
Oliver (1980) defines two dimensions of disconfirmation. One
is positive disconfirmation which results when low-probability
desirable attribute states are realized or when high-probability
undesirable states are avoided. Negative disconfirmation can be
95
1.
expected when high-probability desirable states do not occur or
when low-probability undesirable states do.
Recently equity theory has been considered as one of the
components of satisfaction. Swan and fiercer (1981) explain the
fundamental idea behind that theory, they define equity and
inequity as a 'feeling of well being or fairness or that
distributive justice has occurred or a feeling of distress if the
person is a victim or beneficiary or inequity". They add that
equity and inequity is a social exchange between two persons, each
one will compare his relative gains (outcomes minus inputs) to the
relative gains of the other person. In other words, equity theory
attempts to explain the process by which people compare and
evaluate outcomes (Tyagi 1982).
Whereas disconfirmation involves comparison between
performance and expectation of a product and service, equity
involves the comparison between the net gain of the marketer vs net
gain of the consumer in the purchase situation. The concept of
disconfirmation and inequity both therefore increase the
understanding of, and ability to, predict satisfaction. We
therefore conclude that both disconfirmation and inequity may be
antecedents of satisfaction, satisfaction results from confirmation
or positive disconfirmation as well as equity or positive inequity
(Swan 1985), (see figure 3.4).
96
3.3.4.1.4. A MODEL OF CONSUMER SATISFACTION:
The basic model of consumer satisfaction consists of two
major elements of determinant satisfaction: a) expected performance
and b) evaluation of perceived actual performance. In this
instance, satisfaction defined by hiller (1977) results from the
interaction of levels of expectation and perceived performance.
Hample, (1977), defined consumer satisfaction as the extent to
which expected product benefits are realized. It reflects a degree
of congruence between actual outcomes and expected consequences. As
mentioned earlier, Pfaff (1976) defined consumer satisfaction as
the inverse of the difference between the ideal and actual
combinations. Thus, both expectation and the ideal are thought to
be performance standards against which actual performance is
measured in arriving at satisfaction, and expectation is compared
to perceived performance in order to arrive at an evaluation. More
recently, Gronroos (1983) suggests that perceived performance is
composed of two qualities, technical and functional. Technical
quality has to do with what the consumer receives from the purchase
of the product. Functional quality has to do with how the consumer
receives or purchases the product.
Miller (1977) modified this model to recognize four
potentially different types of expectation an individual might have
regarding anticipated performance levels, i.e., ideal, expected,
minimum tolerable and deserved. A brief explanation of each
follows.
The ideal is the "wished for' level, it reflects what the
consumer feels the performance of the product 'can be', it is a
function of prior expectation, learning, information, advertising,
etc... The expected is thought of as having no effective
97
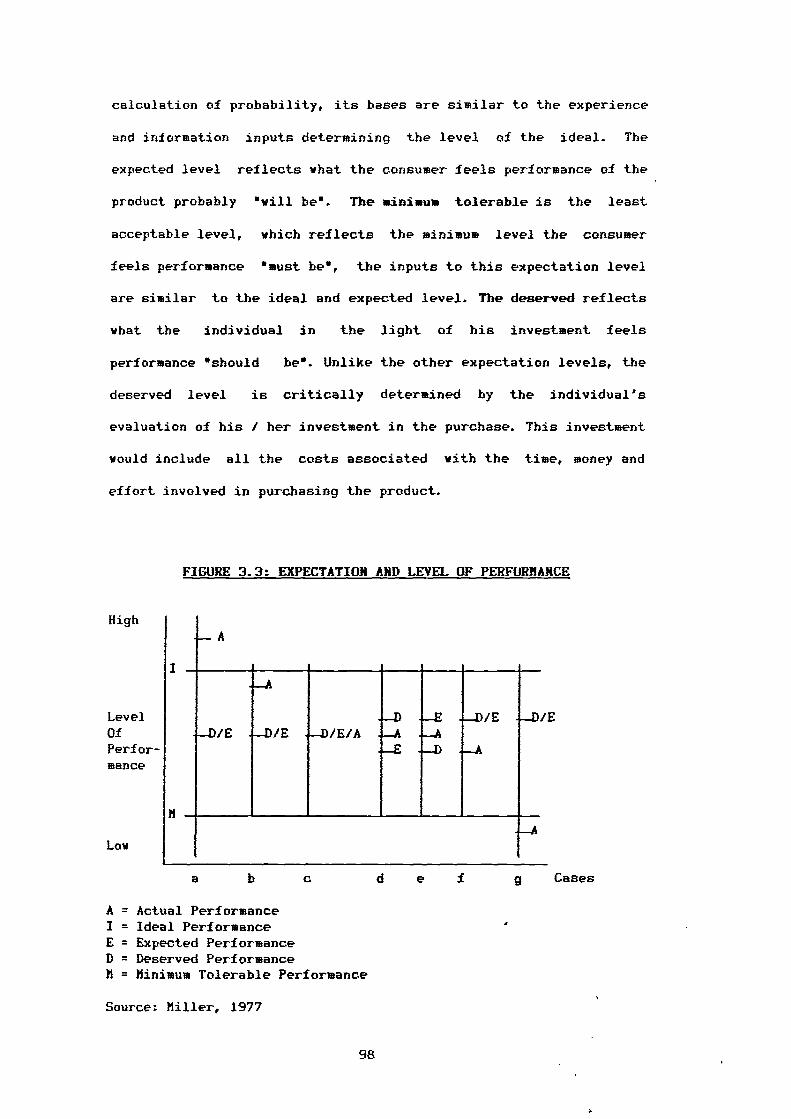
High
LevelOfPerfor-mance
Low
a
Cases
calculation of probability, its bases are similar to the experience
and information inputs determining the level of the ideal. The
expected level reflects what the consumer feels performance of the
product probably "will be". The minimum tolerable is the least
acceptable level, which reflects the minimum level the consumer
feels performance "must be", the inputs to this expectation level
are similar to the ideal and expected level. The deserved reflects
what the individual in the light of his investment feels
performance "should be". Unlike the other expectation levels, the
deserved level is critically determined by the individual's
evaluation of his / her investment in the purchase. This investment
would include all the costs associated with the time, money and
effort involved in purchasing the product.
FIGURE 3.3: EXPECTATION AND LEVEL OF PERFORMANCE
A = Actual PerformanceI = Ideal PerformanceE = Expected PerformanceD = Deserved PerformanceM = Minimum Tolerable Performance
Source: Miller, 1977
98
Conceptually, the ideal would always represent the highest
expectation level, and the minimum tolerable would always represent
the lowest level as can be seen in figure (3.3). On the other hand,
the deserved might be higher than the expected as in case "d* when
the individual pays a premium price or invests a great deal of time
and effort. Alternatively, the deserved may be lower than expected
as in case "e* when the product is 'a steal" requiring little time
or effort to obtain. When actual performance 6 A" appears to be
above the consumer ideal performance "I", he will be satisfied,
"case a*. If *A" is higher than deserved "D 6 or expected "E* but
less than "I", the consumer is still satisfied in "case b". Where
"A" is the same as "I)" or "E", the consumer feels neutral, "case
C', that means there would probably be no change in purchasing
behaviour. If "A" is above "D" and below "E", the consumer may feel
strongly dissatisfied, "case e". When "A" falls below "D" and "E"
but still above the minimum tolerable, *case f", the consumer will
still dissatisfied. Finally, where performance *A* does not even
meet the minimum tolerable level, "case g m , the consumer is greatly
dissatisfied.
While, Hiller (1977) was interested in the expectation of
consumer buying products, Barry et al(1982) were concerned with the
expectation of students about their performance in examinations. By
the same argument the ideal would represent the best grade a
student feels he / she could possibly get on a test. The expected
would reflect the student's objective of the grade. Hinimum
tolerable would be the worst possible grade the student thinks he /
she could have got. Finally, the deserved would reflect the grade
the student feels he / she should get. In this context, Barry et al
99
carried out an empirical investigation on groups of students. The
level of student satisfaction (five levels ranging from very
dissatisfied to very satisfied) was predicted from either the
actual examination score or the various differences. The results
showed that the expected score minus actual exam. score exhibited
the greatest amount of variation across the five levels of
satisfaction by applying one vay analysis of variance. Further,
inspection of the data found that the actual exam, score alone is
better predictor of satisfaction than the expected score minus
actual exam. score. It is clear therefore that expectation types
are useful for analysing satisfaction.
3.3.4.2. POST EVALUATION AND SATISFACTION:
The second approach of particular interest for this study
is post evaluation and its effects on satisfaction /
dissatisfaction. Czepiel et al (1974) are among several
researchers who have investigated this subject. They stated that,
satisfaction is the consumer's subjective evaluation of benefit,
objective and otherwise, obtained from the consumption of a
specific product or service. They added, it is his evaluation of
the extent to which the product or service fulfils the complete set
of wants and needs which the consumption act was expected to meet.
Several aspects of evaluation should be noted. The evaluation
process is important and implies a two level sort of an appraisal.
First, outcomes are compared to expectation. Second, the
seriousness of any discrepancy is noted or judged according to
some unspecified sort of a standard.
Other writers have dealt with evaluation as a basis of
satisfaction / dissatisfaction. Hunt (1976) emphasised that
100
satisfaction is not the pleasurableness of experience, it is the
evaluation rendered that the experience was at least as good as it
was supposed to be. One could have a pleasurable experience that
caused dissatisfaction because even though pleasurable, it was not
as pleasurable as it was supposed or expected to do. So,
satisfaction / dissatisfaction is not an emotion, it is the
evaluation of an emotion. According to Day (1977) there are some
circumstances which might trigger the evaluation process:
(1) The item and / or the purchase has some special significance
for the consumer.
(2) The consumer has had previous experience with the product.
(3) The consumer has been advised to be careful in making the
purchase by friends, consumer organisations or consumer
protection agencies.
Czepiel and Rosenberg (1976) with other researchers have found
that evaluation of outcomes may be affected by several aspects.
First, the perceived alternatives, satisfaction or dissatisfaction
with a product, would depend on what the alternatives were
perceived to be. The product may be evaluated as yielding
satisfaction compared to no alternatives. But if the alternatives
are quite readily available, the same product would yield
dissatisfaction. Second, evaluation may be affected by the amount
of effort spent in shopping to acquire the product. Engledov (1977)
added that the consumer who has expended considerable time and
energy seems to say to himself "If I worked that hard, I surely
must have picked out a pretty good product". This ties in with
Miller's concept (1977) of a deserved level of expectation
affecting satisfaction (case d and e in figure 3.3). Engledow
emphasises the role of effort. He argued that Knowledge about
101
consumer efforts is very important, since this effort includes
physical, mental and financial resources expended to obtain a
product. A further study on effort was carried out through a
laboratory experiment on consumer behaviour by Cardozo (1964). That
experiment showed that consumer satisfaction with a product was
affected not only by expectation but also by efforts. The principal
results of this experiment were: a) that a subject who expended
"high effort* and b) that a subject for whom the product came up to
expectation rated the product more favourably than did a subject
for whom the product did not come up to expectation.
It is important to consider the influence of the kind of
product (simple / complex) on consumer evaluation. Day (1977)
distinguished between the influence of a simple and complex product
on evaluation. Simple products are those which are purchased
routinely and consumed soon after purchase. A great variety of
consumer products fall into this category. In fact Day when
presenting an extended concept of CS/D reported that for many
simple products the consumer may not make an evaluation at all.
Complex products make the consumer's evaluation task more
difficult. Several aspects can contribute complexity to the
consumer's evaluation of products such as:
(1) The product is used over a considerable period of time so that
the evaluation process may vary over tine.
(2)The product involves many different features, some of which
may be highly satisfactory while other are unsatisfactory.
(3)Complementary products which are purchased separately and used
together in such a way that independent evaluation is
difficult.
102
With respect to the evaluation of pharmaceutical products,
Lidstone and Collier (1987) follow the footsteps of earlier writers
(i.e., Knapp and Oeltjen 1972) who considered doctors as consumers.
Lidstone and Collier define medicine adoption (awareness and
evaluation) as a process consisting of cognitive stages through
which a potential doctor must pass. The awareness of a new medicine
is generally thought of us a passive activity, while a new medicine
is evaluated according to a variety of sources of information.
Generally, the evaluation process is multidimensional in
nature even for the simplest products, because a product (simple or
complex) usually has more than one attribute or feature which can
influence the level of satisfaction of the user. Post purchase
evaluation gives an insight into the relationship between
consumer's attitudinal dimensions and market behaviour. Most
researchers have viewed consumer post evaluation as an 'outcome'
within an encompassing buying behaviour process (Anderson 1973,
Hunt 1976, Swan 1977) as well as an effort to determine the level
of rightness or wrongness of the purchase decision. Ortinau (1978)
identified four distinguishable stages in his post purchase
evaluation model, namely, new ownership, early consumption,
subsequent consumption and disposition. Pre-purchase expectation
has generally therefore been compared with purchase satisfaction
(Anderson 1973, Cardozo 1974, Andreasen 1977a)
The relationships involved in this approach are depicted in
figure (3.4). If benefits received from a purchase are equal to
expectations, confirmation and equity occur .
results. If benefits received are greater than
positive disconfirmation and positive inequity
disconfirmation and negative inequity occur when
and satisfaction
those expected,
occur. ,Negative
benefits received
103
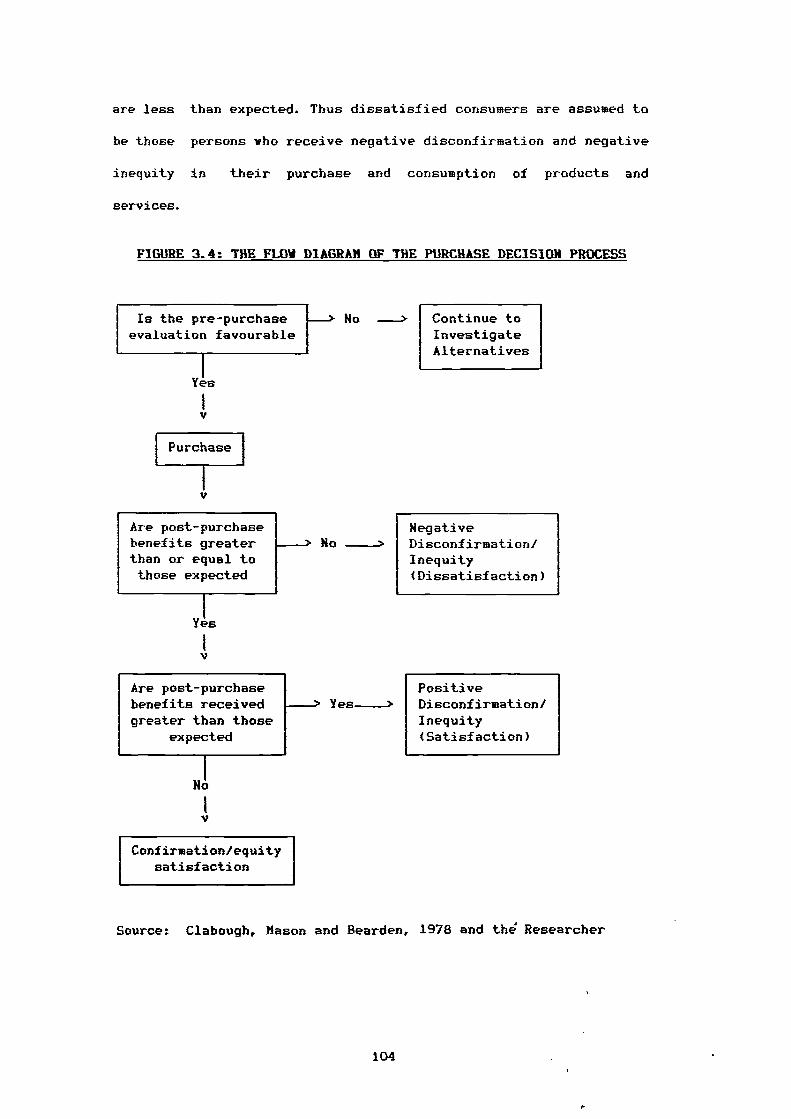
are less than expected. Thus dissatisfied consumers are assumed to
be those persons who receive negative disconfirmation and negative
inequity in their purchase and consumption of products and
services.
FIGURE 3.4: THE FLOW DIAGRAM OF THE PURCHASE DECISION PROCESS
Is the pre-purchaseevaluation favourable
No --> Continue toInvestigateAlternatives
Yes
Purchase
Are post-purchasebenefits greaterthan or equal tothose expected
Yes
NegativeNo -> Disconfirmation/
Inequity(Dissatisfaction)
PositiveYes -> Disconfirmation/
Inequity(Satisfaction)
Are post-purchasebenefits receivedgreater than those
expected
No
Confirmation/equitysatisfaction
Source: Clabough, Mason and Bearden, 1978 and the Researcher
104
3.3.5. PSYCHOLOGICAL THEORY OF COKSUKER SATISFACTIOK:
A considerable amount of theoretical research has been done
in recent years on the psychological process associated with the
assessment of consequences of decisions. Consumer psychologists and
marketing researchers have applied some of these theories to
product evaluation and the assessment of satisfaction in the
consumer decision making context. Engel et al (1986) consider the
traditionally accepted components of attitudes which were mentioned
earlier a) cognitive, "beliefs about the attitude object" b)
affective, "feeling of like or dislike" and c) behavioural
conative, 'action tendencies toward the attitude object'.
Pfaff (1976) pointed out in his paper that there are three
significant factors in any satisfaction measure: one cognitive and
two affective. The two affective factors are the positive and
negative aspects. Pfaff developed both cognitive and affective
models of psychological consumer satisfaction. Be focused not only
on price and quantities but also on a vide range of attributes with
a given product or service. The cognitive model is based on the
difference between an ideal set of attributes combination which a
particular individual considers to be relevant for himself and his
perception of the actual combination of attributes. Consumer
satisfaction can therefore be viewed as the inverse of the
difference between the ideal and actual combination of such
attributes. An index of consumer satisfaction interpreted in a
cognitive model would measure therefore discrepancy between what an
individual would like to see realized in the market and what the
market actually offers to them (Pfaff 1976).
The affective model is an alternative to the cognitive model.
In this model, the individual evaluates goods and services not
105
simply on the basis of some kind of rational calculus but also on
subjectively felt needs, aspiration and experience. An affective
model would therefore focus on aspiration levels and learning
behaviour in order to explain changes in the satisfaction level
over time even when the real world has not changed at all.
Horeover, an affective model is based on the observation that an
individual may be satisfied with products which are characterised
by real problems, at least in the eyes of experts. The affective
model has come to outweigh the cognitive model in psychological
theory. Thus it has been considered by researchers as an essential
aspect of attitude. Indeed it is sometimes treated as attitude
itself.
Hunt (1976) discussed the relationship between the cognitive
and affective model. He commented that there is a correlation
between the cognitive and affective. But the correlation is low
enough, so that we can consider them independent. In contrast, Swan
and Hercer, (1981), define cognition and affection as two concepts
that seem correlated with each other. However, the cognitive model
encompasses elements such as judegment that the product has
performed well or poorly or that decision to buy the product was
vise or unwise. While the affective dimension refers to a feeling
about the product such as pleased / displeased or a very wars to
very cold feeling about the purchase.
According to Cohen (1981) there are four psychological
theories which must be considered when trying to predict how the
disparity between expectation and actual performance influences
consumer satisfaction. Such theories provide alternative
predictions of how the consumer behaves when his perception of the
106
performance of the product is at variance with the prior
expectation of the product (Anderson 1973).
(1) Contrast Theory:
Contrast theory predicts that when a difference exists between
expectation and performance, the consumer will exaggerate the
disparity (Spector 1956). If the objective performance of the
product fails to meet expectation, the consumer will evaluate the
product less favourably than he would if he had no experience with
it. Anderson (1973) showed the sensitivity of that theory. Thus if
the product performs some what better than expected, the relation
will be highly favourable, but if performance falls short of
expectation the relation will be highly unfavourable. Anderson also
demonstrated what he labelled a "contrast effect'. When expectation
was extremely high, judegment of product quality was somewhat lover
than when expectation was moderately high. According to contrast
theory, the discrepancy, which remains subjective, and the expected
attribute level pill contribute to dissatisfaction (La Tour and
Peat 1979). Hence the gain in satisfaction obtained by increasing
perceived quality through the creation of high expectation might be
eliminated by dissatisfaction associated with the discrepancy.
(2) Dissonance (assimilation) Theory:
This theory has received the greatest attention in consumer
behaviour and marketing circles. Olshavsky and Miller (1972),
explained that this theory would predict the opposite effect from
contrast theory i.e., the consumer tends to minimize the difference
between expectation and performance. Dissonance theory leads to
the supposition that expectation before the purchase is made might
107
be quite different from expectation after purchase, especially if
the actual experience was substantially different from the expected
experience (Hunt 1976).
Robertson et al (1984) presented comments on this theory made
by Festinger (1957). Festinger tells us that "dissonance creates a
state of psychological tension which motivates the individual to
attempt to reduce that tension and return to a state of
psychological balance". Kassajin and Robertson (1973) concluded
that dissonance theory may sound similar to cognitive consistency
theory, since people according to this theory strive to achieve
consistency within their cognitive system and between their
cognitive system and overt behaviour.
(3) Generalized Negativity Theory:
Anderson (1973) summarized this theory. Any disparity in
expectation and performance will result in less satisfaction than
if expectation is met. )fore precisely, it indicates that any
discrepancy between expectation and performance results in a
generalized negative state. If a consumer expects a particular
performance from a product but a different performance occurs, he
will judge the product to be less pleasant than had he had no
previous expectancy (Carlsmith and Aronson 1963). In addition, "A
generally negative attitude will cause the product to be perceived
as less satisfying than its performance would indicate* (Cohen
1981).
(4) Assimilation - Contrast Theory:
Sirgy (1984) explains this theory which was originated by
Hovland et al (1957). They argued that messages when perceived may
fall within the individual's latitude of acceptance or rejection,
108
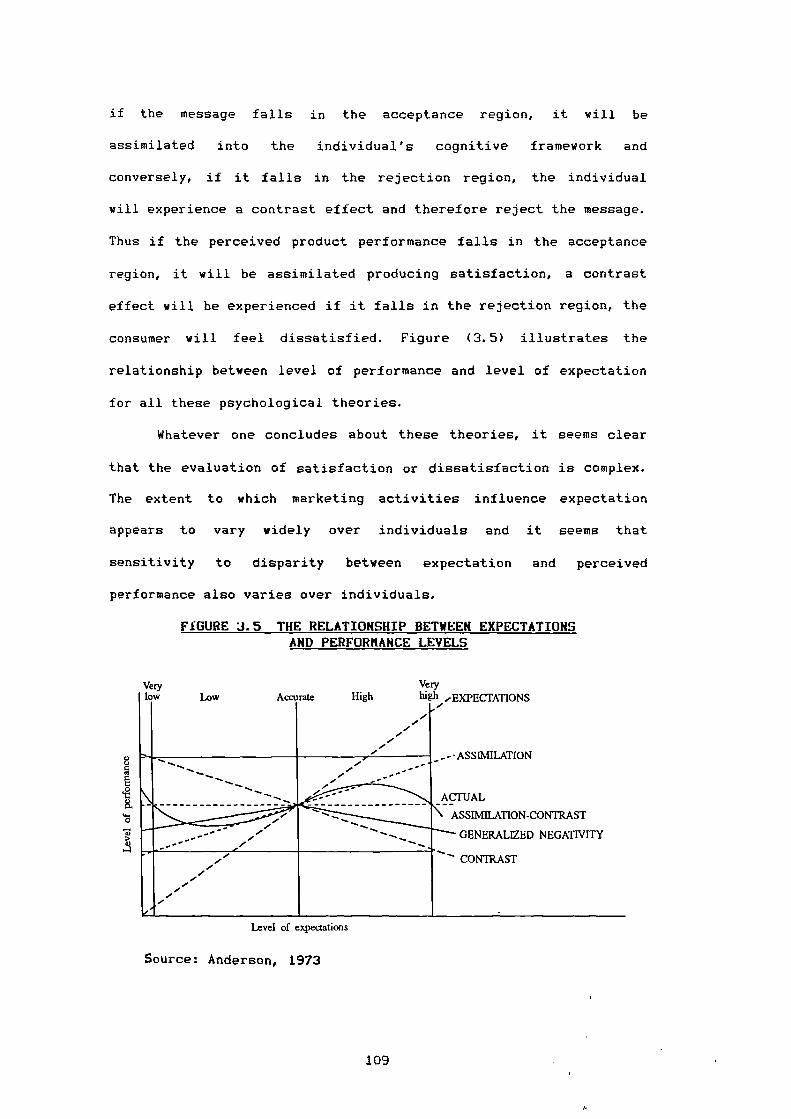
ASSIMILATION
ACTUAL
ASSIMILATION-CONTRAST
GENERALIZED NEGATIVITY
CONTRAST
Level of expectations
8
fi
K
0
A
Veryhigh 'EXPECTATIONSLow
Verylow HighAccurate
if the message falls in the acceptance region, it will be
assimilated into the individual's cognitive framework and
conversely, if it falls in the rejection region, the individual
will experience a contrast effect and therefore reject the message.
Thus if the perceived product performance falls in the acceptance
region, it will be assimilated producing satisfaction, a contrast
effect will be experienced if it falls in the rejection region, the
consumer will feel dissatisfied. Figure (3.5) illustrates the
relationship between level of performance and level of expectation
for all these psychological theories.
Whatever one concludes about these theories, it seems clear
that the evaluation of satisfaction or dissatisfaction is complex.
The extent to which marketing activities influence expectation
appears to vary widely over individuals and it seems that
sensitivity to disparity between expectation and perceived
performance also varies over individuals.
FIGURE 3.5 THE RELATIONSHIP BETWEEN EXPECTATIONS AND PERFORMANCE LEVELS
Source: Anderson, 1973
109
3.3.6. SOCIOLOWCAL INTERPRETATION OF CONSUMER SATISFACTION / DISSATISFACTION
Satisfaction / dissatisfaction is not only a term in
marketing literature. It also exists in the sociological literature
under the heading of alienation and communication - effect theory.
These two concepts have been extensively used in marketing
literature to interpret CS/D. Both of them are discussed below in
turn.
3.3.6.1. ALIENATION:
Clarke (1959) defined alienation as 'the psychological
state of an individual". He described an alienated person as one
who is estranged from his society and the culture it carries".
Seeman (1959) reported that alienation is typically viewed as a
generalized socialization phenomenon which results from a persons's
efforts to cope with perceived environmental inequalities and
imbalances. Alienation is defined by Hajda (1961) as "an
individual's feeling of discomfort which reflects his exclusion or
self-exclusion from social and cultural participation".
Although alienation has sometimes been conceptualized as an
objective condition of society or a collective experience, it can
be examined as a subjective state of mind consisting of certain
attitudes, beliefs and feeling. In attempts to clarify the concept
of alienation, Seeman (1971) has proposed five different variants
of the concept: powelessness, meaninglessness, normlessness,
isolation and self-estrangment. Each variant refers to a different
subjectively felt psychological state of the individual, caused by
different environmental conditions.
Seeman (1971) reported that the idea of alienation used
powerlessness frequently in broad terms as 'the expectancy or
110

probability held by the individual that his own behaviour cannot
determine the occurrence of the outcomes or reinforcements, he
seeks". In terms of marketing consumer powerlessness is a feeling
that one cannot exert influence on a seller's behaviour with regard
to prices, products, services, credit procedures, warranty
decisions and other actions that affect a buyer (Scott and Lamont
1973a).
Levin (1960) stated that meaninglessness is apt to vary with
the difference in the amount of information an individual considers
necessary to make an intelligent decision and the amount perceived
to be available. Lambert and Kniffin (1975) suggested that
meaninglessness occurs when consumers feel shackled and incapable
of judging and choosing intelligently from among alternative
products, brands or dealers because of inadequate information.
The third form of alienation according to Seeman (1971) is
normlessness. Kanungo (1979) stated that an individual may develop
a sense of normlessness when he finds that previously approved
social norms are no longer effective in guiding behaviour for the
attainment of personal goals. The individual finds that to achieve
given goals, it is necessary to use socially unapproved behaviour.
Consumer normlessness is characterized by Peterson (1974) in terms
of marketing as the danger feeling of being ripped off by a
business community that is motivated by self-interest and unwilling
to assume its responsibilities either to its customers or society
at large.
Kanungo (1979) felt that the terms of social isolation and
self-estrangment could used interchangeably. Lambert and Kniffin
(1975) clarified isolation and self-estrangement as a person who
perceives things, beliefs and goals that are very important to most
111
members of society as lacking value and validity, as providing
little or no meaningful satisfaction, as being purposeless.
The main stimulus in presenting the above recognition of
the concept of alienation is to provide an insight into the link
between alienation and the feeling of dissatisfaction. Since a
consumer with a strong feeling of alienation may have a greater
tendency to make external attribution of blame when dissatisfaction
occurs (Krishnan and Valerie 1979). So far, Lundstorm and Kerin
(1976) have demonstrated that consumer dissatisfaction is
positively correlated with the alienation dimensions of
powerlessness, normlessness and social isolation. In addition, a
study's findings by Lambert (1980) imply that consumer alienation
may be a common denominator in general feelings of dissatisfaction
with the market place and in numerous consumerism concerns that may
seem unrelated on the surface.
3.3.6.2. COMMUNICATION - EFFECT THEORY:
Communication is the second facet of the sociological
interpretation of consumer satisfaction. Pfaff (1976) tied this up
with psychological theory (cognitive - affective). Individuals
evaluate products cognitively or affectively or both and are likely
to respond to changes in persuasive communication. Accordingly,
observed changes in consumer satisfaction may be simply the result
of some communication (e.g., messages, which have been received in
either an interpersonal, intergroup, or mass communication
situation). Sirgy (1984) also used Hovland et al's theory (1957)
of message acceptance / rejection to illustrate the linkage between
communication and psychological theories, (as previously mentioned
in the section on assimilation-contrast theory). Consequently, any
112
I.
attempt at explaining the reasons for changes in satisfaction would
have to cope with a wide network of interaction and communication
within which any individual is placed. Pfaff added that, if there,
are observable changes in the actual attributes of the product, it
is therefore very difficult to disentangle the effect of any single
source of messages from the individual's preexisting attitudes.
This would suggest that the measurement of consumer satisfaction
should concentrate on formulating descriptive measures, without
necessarily entering into the more difficult question of why
consumer satisfaction or dissatisfaction has actually changed.
3.3.7. UTILITY THEORY OF CONSUMER SATISFACTION / DISSATISFACTION:
Consumer satisfaction / dissatisfaction can also be
conceptualised in terms of economic theory. There is but little
doubt that the examination of consumer satisfaction is considered
by most economists to be the ultimate goal of the market economy.
Indeed, the advantages of competition and decentralised
coordination of the economic system are generally stated in terms
of their effects on consumer welfare (Pfaff 1976).
The literature distinguishes between satisfaction and utility.
Whereas the confirmation of expectations approach to satisfaction
is related to cognitive psychology, the utility theory approach is
based more on ideas from economics. Economists equate satisfaction
with utility, the two terms are often used interchangeably, for
example Samuelson (1967) tells us a consumer buys a good because it
gives him satisfaction or utility. Day (1976) states that
economists visualiz a consumer as a rational decision-maker who
seeks to maximize his total or overall satisfaction. More
specifically, utility theory assumes that for any product there is
113
a combination of levels of the salient attributes of the product
which provide the individual consumer the highest possible level of
utility. In general, economists emphasise that an individual is
defined as acting rationally if his behaviour is directed towards
maximizing his satisfaction or utility.
Traditionally, economists have viewed utility as inherent in
the good involved. Consumer satisfaction can be viewed as the form,
time, place and possession of utility. The four types of utility
are not separated (Walters 1974). That concept was extended by
Lancaster (1969) who pointed out that the utility is the collection
of economic reasons for consuming a product (i.e., the various
product characteristics). Consumers possess preferences for a
collection of some characteristics, and preferences for products
are indirect or derived in the sense that products are required in
order to produce the characteristics. Lancaster (1971) proposed a
new approach which criticized the traditional theory. He stated
that utility or satisfaction is derived from the properties or
characteristics which the goods possess, rather than the good
themselves. Goods are viewed as vehicles for obtaining these
characteristics or benefits and thus analogous to inputs to a
production process. Obviously the consumer may have to combine
several sets of such inputs, including his own time and effort in
order to derive the desired bundle of utilities or satisfaction.
The issue of generic prescriptions can well be considered
under the economic theory as explained more recently by Blum and
Kreitman (1981). They assume that the consumer / patient is both
knowledgeable and rational, seeking the same medicine product at a
lover price, then the availability of a generic medicine may be a
factor in consumer decision. Similarly, it is assumed that doctors
114
are cost conscious, then the generic medicine ought to be selected
according to the economic model of rational decision-making based
on low cost as a 'utility".
Although economists have attempted to provide further
insight into the concept of utility, and these are described below,
they do not contribute measurably to the task of conceptualising
consumer satisfaction. Consumer surplus is considered an important
branch of economic theory, because the rational consumer will
allocate his / her scarce resources in such a way that the ratio of
marginal utilities to the prices of all products will be equal.
Hence, the total utility which he / she derives from all products
is at its maximum. If there any changes in the price of product,
his / her resources have to be reallocated in order to reach a new
equilibrium. Cavusgil and Kaynak (1982) suggest that the chief
concern of consumers in any society is to obtain desirable location
and time and reasonable prices. Pfaff (1976) clarified the
benefits of consumer surplus in the case of an undifferentiated
market (i.e., one-segment) where all consumers pay the same price.
Among them a group of consumers who might in fact be prepared to
pay higher prices, obtains a subjective benefit. This benefit is
termed consumer surplus. Consumer surplus therefore, measures the
difference between the prices individuals would have been willing
to pay and that which they actually paid on the basis of the going
market prices. It is clear that, the larger the surplus, the more
satisfied the consumer will be with the product.
Although the consumer surplus concept is the cornerstone of
economic theory, it is an incomplete picture of the concept.
Consumer surplus expresses a consumer's reaction with regard to the
price and quantity relationship only. It ignores other product
115
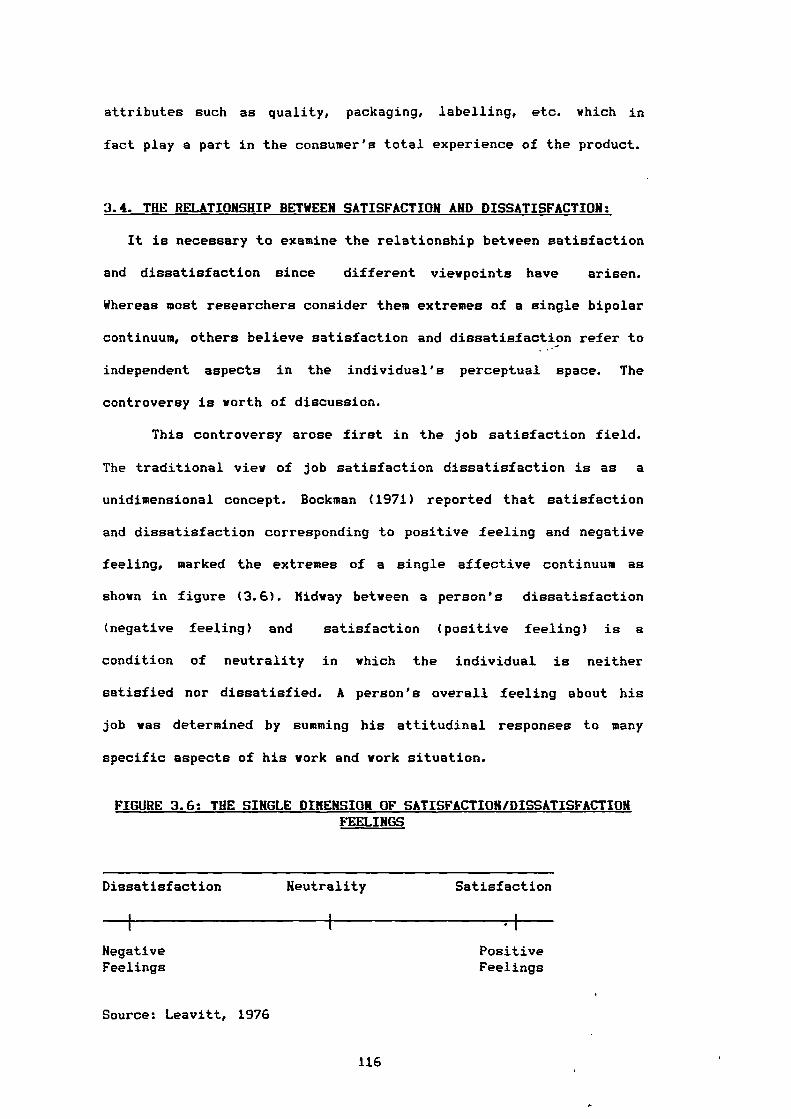
attributes such as quality, packaging, labelling, etc. which in
fact play a part in the consumer's total experience of the product.
3.4. THE RELATIONSHIP BETWEEN SATISFACTION AND DISSATISFACTION:
It is necessary to examine the relationship between satisfaction
and dissatisfaction since different viewpoints have arisen.
Whereas most researchers consider them extremes of a single bipolar
continuum, others believe satisfaction and dissatisfaction refer to
independent aspects in the individual's perceptual space. The
controversy is worth of discussion.
This controversy arose first in the job satisfaction field.
The traditional view of job satisfaction dissatisfaction is as a
unidimensional concept. Bockman (1971) reported that satisfaction
and dissatisfaction corresponding to positive feeling and negative
feeling, marked the extremes of a single affective continuum as
shown in figure (3.6). Midway between a person's dissatisfaction
(negative feeling) and satisfaction (positive feeling) is a
condition of neutrality in which the individual is neither
satisfied nor dissatisfied. A person's overall feeling about his
job was determined by summing his attitudinal responses to many
specific aspects of his work and work situation.
FIGURE 3.6: THE SINGLE DIMENSION OF SATISFACTION/DISSATISFACTION FEELINGS
Dissatisfaction
Neutrality Satisfaction
,
Negative PositiveFeelings Feelings
Source: Leavitt, 1976
116
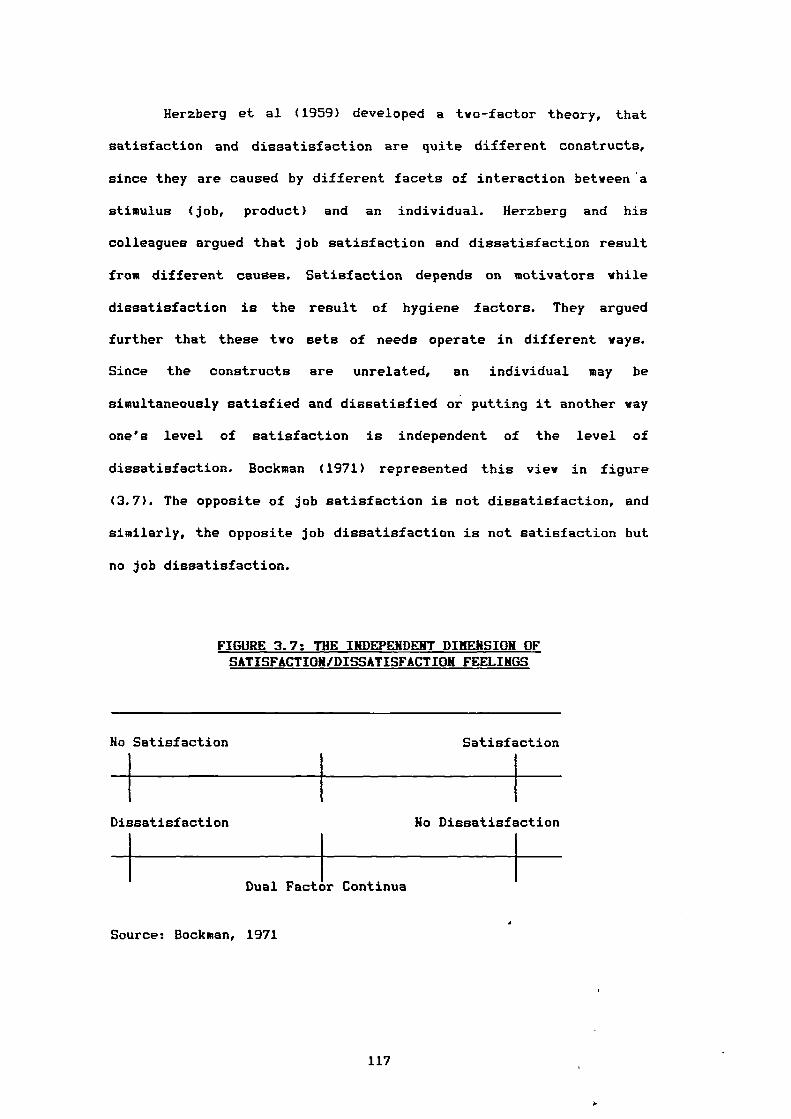
Herzberg et al (1959) developed a two-factor theory, that
satisfaction and dissatisfaction are quite different constructs,
since they are caused by different facets of interaction between 'a
stimulus (job, product) and an individual. Herzberg and his
colleagues argued that job satisfaction and dissatisfaction result
from different causes. Satisfaction depends on motivators while
dissatisfaction is the result of hygiene factors. They argued
further that these two sets of needs operate in different ways.
Since the constructs are unrelated, an individual may be
simultaneously satisfied and dissatisfied or putting it another way
one's level of satisfaction is independent of the level of
dissatisfaction. Bookman (1971) represented this view in figure
(3.7). The opposite of job satisfaction is not dissatisfaction, and
similarly, the opposite job dissatisfaction is not satisfaction but
no job dissatisfaction.
FIGURE 3.7: THE INDEPENDENT DIMENSION OF SATISFACTION/DISSATISFACTION FEELINGS
No Satisfaction Satisfaction
Dissatisfaction No Dissatisfaction
Dual Factor Continua
Source: Bookman, 1971
117
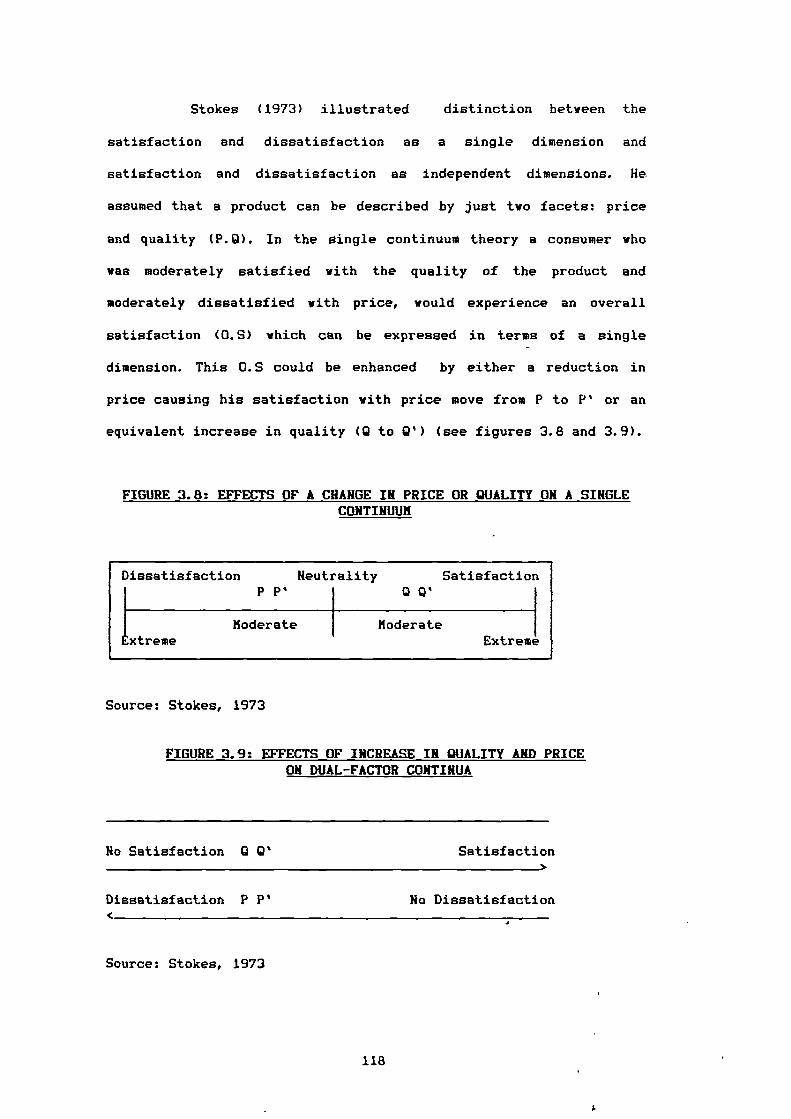
Dissatisfaction
1 xtreme
Neutrality SatisfactionPP' Q'
ExtremeModerate Moderate
Stokes (1973) illustrated distinction between the
satisfaction and dissatisfaction as a single dimension and
satisfaction and dissatisfaction as independent dimensions. He
assumed that a product can be described by just two facets: price
and quality (P.0). In the single continuum theory a consumer who
was moderately satisfied with the quality of the product and
moderately dissatisfied with price, would experience an overall
satisfaction (0.5) which can be expressed in terms of a single
dimension. This 0.5 could be enhanced by either a reduction in
price causing his satisfaction with price move from P to P' or an
equivalent increase in quality (12 to Q') (see figures 3.8 and 3.9).
FIGURE 3.8: EFFECTS OF A CHANGE IN PRICE OR QUALITY ON A SINGLE CONTINUUM
Source: Stokes, 1973
FIGURE 3.9: EFFECTS OF INCREASE IN QUALITY AND PRICE ON DUAL-FACTOR CONTINUA
No Satisfaction Q Satisfaction
Dissatisfaction P P' No Dissatisfaction
Source: Stokes, 1973
118

If satisfaction and dissatisfaction are independent, Stokes
(1974) stated that," No amount of improvement in quality, with
price held constant, would influence the individual's feelings of
dissatisfaction due to price". Increase in quality, no matter how
great, that results in any perceptible increase in price could
actually increase the consumer's level of dissatisfaction even if
he was being offered a much 'better buy'. Similarly, if a consumer
expresses a very low degree of satisfaction with quality, no price
reduction could raise his level of satisfaction. Stokes
illustrated the two concepts without reaching a conclusion.
Herzberg's two factors theory however encountered much criticisms
as reported by Locke (1976). Whitsett and Winslow (1967) found
that the two factors (i.e., motivator and hygiene) correlated with
both satisfaction and dissatisfaction. Waters and Waters (1969);
Hulin and Waters (1971); Waters and Roach (1971) employed
satisfaction and dissatisfaction scales, and also failed to show
consistent support of Herzberg's theory. Schneider and Locke (1971)
found out that, the effects of motivators and hygiene factors were
similar rather than opposite. However, one interprets these
results, one cannot support Herzberg's theory.
In summary, it seems that satisfaction and dissatisfaction
are not independent but they are causally interrelated. In other
words, the satisfaction and dissatisfaction scale is
unidimensional.
119
3.5. MEASUREMENT OF CONSUMER SATISFACTION / DISSATISFACTION:
The development of consumer satisfaction measures have not
received much attention in the marketing and consumer behaviour
literature. The most frequently used measures of consumer
satisfaction are simply the binary variable (satisfied - not
satisfied), or a threefold classification (completely satisfied,
partially satisfied and not satisfied). An excellent discussion of
the measurement methodology for an index of consumer satisfaction
is presented by Handy (1976) who states that satisfaction can be
measured by assigning a set of numbers to various points of the
satisfaction scale, and computing the average satisfaction response
by all respondents. A weight can be given to: a) always satisfied
b) almost always satisfied c) sometimes satisfied d) rarely
satisfied and e) never satisfied. From these weights a
dissatisfaction measure can be derived, since the higher the score
for a particular product or service, the higher level of
dissatisfaction. Swan and Longman (1972) evaluate consumer
satisfaction with automobile performance using a three point scale
whose end points are satisfied - dissatisfied. Andreasen (1976) in
his paper identified an important question in measuring consumer
satisfaction / dissatisfaction. He developed three questions:
(1) What is the goal? Do we wish to maximise satisfaction or just
minimise dissatisfaction?
In answering this question, he stressed that minimising
dissatisfaction may be involved for practical reasons, because
maximising satisfaction is an elusive goal. It is difficult to
conceive of ever making people fully satisfied and achieving a
performance free of defects.
120

(2) Are individuals to be allowed to define their own satisfaction
or dissatisfaction or is some objective measure preferred?
In the context of the social indicators' literature a distinction
is made between, on the one hand, measures which build upon reports
from individual citizens about their feeling of satisfaction
(subjective measurement). And on the other hand, such measures
which gauge welfare independently of the individuals's appraisal of
this own situation (objective measurement). Hunt (1976)
demonstrated that most empirical studies of consumer satisfaction
have focused on the consumer's subjective evaluation of the
benefits obtained from the consumption of a specific product or
service.
(3) At what point in the purchase process do we wish to measure
consumer satisfaction or dissatisfaction, soon after the
purchase or after the possible complaints have been resolved?
With respect to the alternative ways of measuring consumer
satisfaction and dissatisfaction, Hiller (1976) defined three ways.
First, satisfaction may measured simply as a self reported
categorical response on a single-dimensioned scale e.g., how
satisfied are you?, with responses ranging from extremely
dissatisfied through extremely satisfied. Hawes and Arndt (1979)
argued that single measures are usually used, because it has been
found these measures do produce useful findings. Westbrook and
Oliver (1981) agree with Howes and Arndt that simple single item
rating scales are most often employed. But there has been little
uniformity in the number of scale divisions or the.nature of verbal
anchoring, especially as consumer perception changes over time.
Scales range from 3-point fully-labelled rating scales to 10- and
11-point variants labelled only at the extremes and midpoint. Pfaff
121
I.
(1972) who developed perhaps the most advanced methodology in
satisfaction measurement to date, through the index of consumer
satisfaction, measured satisfaction on a seven point scale ranging
from very satisfied (A) to very dissatisfied (G). Respondents were
asked how important each of the attributes were for the purchasing
decision, i.e., the end points are very important and not
important. The second way to measure satisfaction according to
filler (1976) is a multidimensional scale, by which satisfaction
and dissatisfaction may be measured as the result of
multidimensioned-interaction among a number of variables comprising
the criteria against which a shopper evaluates a product(in this
case a store). Criteria are weighted by the consumer's report of
how important they are, these weights are multiplied by the
satisfaction scores for those specific criteria, and the sum of the
weighted criteria scores provide the measures of satisfaction
level. Westbrook and Oliver (1981) add that the multidimensional
rating scale measures of product / service, have found applications
only infrequently, despite their potential to reduce measurement
error because of uncertainty in combining attributes into an
overall satisfaction judegment. Finally satisfaction /
dissatisfaction also may be measured by the number of complaints
which could suggest the level of consumer dissatisfaction.
122
I.
3.5.1. MEASUREMENT PROBLEMS:
In attempting to implement measures of expectation as well
as the perceived actual performance of the object / concept being
studied, the satisfaction researcher encounters a number of
problems (Miller 1977) they are:
(1) Timing: when one measures the various types of expectation or
performance, there are several strong effects on the
measurement, such as the right time to measure expectation,
one should be careful to include all efforts, investment or
costs the subject might include in his cognitive computation.
perhaps it requires measurement of 'actual' performance.
(2) Interaction: it is very likely that the various types of
expectations (i.e., ideal, expected, minimum tolerable,
deserved) influence each other. Moreover, high expectation can
raise the evaluation of actual performance and low expectation
lover it at least for complex ambiguous stimuli.
(3)Consumption coincidence: the situation attendant on consumption
of the object (product / service). This potential problem
threatens measurement of the perceived 'actual' performance
more than it does the expectation.
Hample (1977) defined two basic problems in developing of
consumer satisfaction measure
(1) Aggregation of individual satisfaction measures into an
indicator of total family or household satisfaction.
(2)Separation of satisfaction measures concerning a particular
product / service system from the broader consumption and
market system which influence consumer's evaluations
Thus many problems exist for the researcher when measuring
satisfaction should he / she use the single dimension or
123
multidimensional approaches and what scale should he / she use;
should he / she look at causes of satisfaction or post-evaluation.
If the former should he / she try to measure expectation, if the
latter when should the satisfaction be measured. The approach
finally adopted in this work was a post-evaluation approach to
satisfaction using an equally weighted multidimensional scale of 41
attributes and 10 statements, using 7 point interval scales to
denote satisfaction. This approach is described in detail in
chapter 6.
3.6. SUKKARY:
This chapter provided a discussion of five issues relevant to
consumer satisfaction / dissatisfaction which emerged from the
literature review of marketing and consumer behaviour namely the
nature of consumer satisfaction / dissatisfaction CS/D, the
conceptualization of CS/D, classification of consumer satisfaction,
the relationship between satisfaction / dissatisfaction and the
measurement of CS/D.
The introduction was concerned with the nature of the
satisfaction phenomena raising the controversial issues of the
importance of satisfaction to marketing practitioners and various
government agencies.
The second section examined the major three levels of CS/D
(system satisfaction, enterprise satisfaction, product / service
satisfaction). It was concluded that those levels interact each
other.
The conceptualization of CS/D was then presented, citing
different definitions of consumer satisfaction and dissatisfaction.
The similarity / dissimilarity between satisfaction and attitudes
124
1.

were discussed. Two major approaches to consumer satisfaction were
proposed (causes of satisfaction, post-evaluation satisfaction). It
was determined that, the literature showed expectation as the
primary cause of satisfaction / dissatisfaction feeling, followed
by performance and disconfirmation and inequity. The influence of
the causes of satisfaction was supported by a model which built on
expected performance and evaluation of perceived actual
performance. The discussion of post-evaluation satisfaction
emphasised the factors which might trigger the evaluation process
and the section concluded by presenting a description of simple /
complex products which have an important influence on evaluation.
Four psychological theories were presented (contrast theory,
dissonance theory, generalized negatively theory and assimilation-
contrast theory) to show how each dealt with satisfaction. The
sociological concept of CS/D was also discussed under the heading
of alienation and communication-effect theory. The
conceptualization of CS/D was concluded by the distinction between
utility theory and the satisfaction concept.
The fourth section assessed the relationship between
satisfaction and dissatisfaction. It presented the single continua
-dual factor argument. The section concluded that there is a
relationship between satisfaction and dissatisfaction and the dual
factor model is inappropriate.
Section five dealt with measurement of CS/D using single
dimensioned scale / multidimensioned scale. This section was
concluded by the major problems of measurement and a very brief
description of the measurement method to be adopted in this work.
125
1.
CHAPTER FOUR
CONSUMER CHARACTERISTICS RELATED
CONSUMPTION PATTERNS / SATISFACTION /
COMPLAINT BEHAVIOUR
4.1. Introduction.
4.2. An Overview Of Consumer Characteristics.
4.2.1. Demographic Characteristics.
4.2.2. Socio-economic Characteristics.
4.3. Consumer Characteristics And Consumption Patterns.
4.4. Consumer Characteristics And Satisfaction / Dissatisfaction.
4.5. Consumer Characteristics And Propensity To Complain.
4.6. Consumerism.
4.7. Summary.
126
4.1. INTRODUCTION:
There is no doubt that the starting point in defining a market
is people. Over the past years, a number of studies have been
constructed for the better understanding of consumers, and the most
popular characteristics examined have been demographic and socio-
economic.
Demographic and socio-economic characteristics are routinely
used as identifiers of key target market segments. Buzzell et al
(1969) stated that the demographic and socio-economic
characteristics have been referred to as "states of being" because
they identify attributes or profiles of people. In addition Settle
et al (1978) related demographic and socio-economic to other types
of variables and demonstrated that, demographic and socio-economic
characteristics are often °enabling' variables that make possible
various forms of consumer buying behaviour. Earlier studies
attempted to show that a consumer's characteristics are related to
his buying behaviour (Kopenon 1960; Robert 1962; Ronald et al 1967
and Myers 1967). Most of those studies used linear regression
analysis in which demographic and socio-economic measures were used
as the independent variables and buying behaviour was used as the
dependent variable. Further Plummer (1974) reminds us that the
broad acceptance of consumer demographic and socio-economic
variables is because they lend themselves to quantification and
consumer classification. Demographics alone lack richness and often
need to be supplemented by other data. Hence socio-economic
variables are added to provide more depth. Traditionally, marketing
researchers have used demographic and socio-economic data to
develop market segments and predict the market behaviour of
individuals.
127
In the language of marketing, however, there is inconsistency
in nomenclature regarding demographic and socio-economic variables.
Some researchers use the terms of demographic and socio-economic
variables interchangeably (Churchill 1976; Schiffman and Kanuk 1983
and Kotler 1984). While other writers draw a clear differentiation
between the two sets (Frank et al 1972 and Settle et al 1978).
It is worth mentioning here that other characteristics are
widely applied e.g., psychographics which are used in the
measurement of life style. However, in this work we have
concentrated on demographic and socio-economic variables for two
reasons. First, in the Egyptian society, the respondents would have
much less difficulty in providing information on their demographics
/ socio-economic than on their life style or personality. Second,
the researcher felt that information on consumer demographic /
socio-economic was more useful in measuring consumer satisfaction
with, and consumption patterns of, the pharmaceutical products.
4.2. AN OVERVIEW ON COKSUKER CHARACTERISTICS:
In order to highlight the role of consumer profiles in
behaviours, an overview of these profiles (i.e., demographic and
socio-economic) are be presented separately.
128
4.2.1. DEMOGRAPHIC CHARACTERISTICS:
Dividing the market into segments based on demographic
variables (i.e., sex, age, family size, marital status) are the
most popular bases for distinguishing consumer groups. Kotler
(1984) puts forward two reasons. One is that consumer wants,
preferences and usage rates are highly associated with demographic
variables. Another is that demographic variables are easier to
measure than other types of variables. Earlier, Frank et al (1972)
identified more reasons such as, the accessibility to these
segments by various communication and distribution media as well as
the relatively large size segments based on any of these variables.
Few marketers any where can afford to ignore the study of
demographic characteristics, if their products are bought more by
some demography than by others.
The differences between the buying behaviour of males and
females have been reported in a number of studies. Many earlier
studies had attempted to interpret, understand male-female buying
behaviour and examine the role of men and women (Nuttall 1962
Kollat and Millet 1967). Green and Cunningham (1975) found the
differences between the roles of men and women in contemporary and
traditional role perceptions had an effect upon family decision-
making patterns. More recently an empirical study was conducted by
Qualls (1982) on 117 households. Six product decisions were
selected on the basis of their potential for being decisions
jointly determined by husbands and wives. The six products
included (family vacations, family automobile, children's
education, family housing, family insurance and family saving). The
analysis illustrated the mean ratings of perceived influenced by
husbands and wives. It was found that the husbands' rating of their
129
perceived influence are consistently higher than the wives reported
perceptions.
Because product needs often vary with age and life cycle,
researchers have found age to be a useful variable in
distinguishing segments. Frank et al (1972) raised the critical
question: whether or not different age groups really buy
differently. Life cycle is defined in terms of a composite of
demographic characteristics, especially marital status and age. In
this respect, Kollatt and Willett (1967), in a study of unplanned
purchasing, found that couples married less than ten years have the
lowest rate of unplanned purchasing. Furthermore, the percentage of
unplanned purchases increases irregularly as the length of marriage
increases.
4.2.2. SOCIO-ECONOMIC CHARACTERISTICS:
Wind (1969) reminds us that socio-economic variables in
general, and a combination of variables known as social class in
particular, have often been used to explain consumers' buying
behaviour. Frank et al (1972) go further in presenting various
bases for market segmentation and define two groups. The first,
those which focus on each of the variables (income, education, or
occupation). The second those which assume interaction among
various socio-economic variables and take them simultaneously in
the form of some complete index of social class. Engel et al (1986)
discuss the stability of social class against income, since the
controversy has been debated in the marketing literature for years..
They conclude that income is adequate for some products but social
class is superior for others. In addition, social classes are often
130
expressed either in terms of income, education and occupation or in
terms of lower / upper classes.
Carmen (1965) argued that even the empirical definition g of
social class typically involve education and income. Cohen (1981),
after he had reviewed many sociological studies, pointed out that
the sociologists have used a number of indicators as determinants
of social class such as occupation and income. Further Robertson et
al (1984) show the role of occupation, and stress that the one
variable with which social class is most highly correlated is
occupation, which is in turn highly correlated with education and
income.
General speaking therefore, demographics and socio-economics
play an important role in family decision making and buying
behaviour.
4.3. CONSUMER CHARACTERISTICS AND CONSUMPTION PATTERNS:
Consumption patterns are considered one of the major facets of
market behaviour. The effect of consumer characteristics on the
pattern of consumption has received appropriate attention ranging
from the practitioners in the market place through the academic
marketing literature. Gist (1974) identified consumption patterns
as 'any of several observable features or characteristics of
consumer behaviour'. He further defined consumption patterns as a
'symptom of attitudes, values, beliefs and motives of a consumer or
group of consumers'. It is a symptom as distinct from a cause of
consumer behaviour. Kinnear and Bernhardt (1986) support Gist's
views with respect to the importance of consumption patterns,
stating that demographic factors of sex, age, family size, marital
status often are not sufficient to explain variations in consumer
131
buying behaviour. However, there is much evidence in the literature
to refute this statement and show that consumer characteristics
have a significant role in consumption patterns. In a survey study,
Arndt (1978) grouped income under family life cycle and pointed out
that income varies over the life cycle. He then examined the size
and composition of consumption and expenditures by stage in family
life cycle by carrying out a study on a sample of 4707 households
selected by a stratified method. In general, the results of the
study tend to support the notion that size and composition of
household expenditure are systematically related to stage in family
life cycle.
In an earlier study by Crokett and Fried (1960) found that age
and family size to be the most highly correlated demographic
variables with consumption of consumer goods. Goldstein's study
(1968) focused on the aged population's share of aggregate
expenditures for various categories of goods and services. The
study relied on the availability of data in the mid - 1950's and
1960-1961 from the American Bureau Of Labour Statistics. The
results demonstrated that, expenditure of goods and services (food,
housing, medical care) became increasingly larger with rising age
of family head, especially after the age of 65. Goldstein concluded
that, there appears to be no such thing as an 'age' of acquisition,
that is an age group which dominates the consumer market with
intensive purchase of a wide variety of consumer goods.
The effect of life cycle on consumer behaviour was also
investigated and reported by Frank et al (1972). They presented the
results of some social researches, one in 1962, a furniture study
for Kroehler Manufacturing Company. It was found that, interest in
furniture buying is highest during the early years of marriage as
132
1.
well as when children have reached adolescence or have left home to
establish families of their own.
Coleman (1960) concluded in his study that, income is a good
predictor of consumption of some products. Gist (1974) also
considered income as a main component of consumption patterns. In
marketing and consumer behaviour, the concept of social class as a
major determinant of consumption patterns has been widely accepted
and used as a basis for segmenting consumer -product markets.
Income, education and occupation are considered by some writers as
components of social class (Coleman 1960, Martineau 1958). Masson
(1969) attempted to examine the differences in the allocation of
the family budget to food, shelter and education for families of
various social classes and incomes. He concluded that social class
was superior to income and contended that marketers should abandon
income and use social class as a segmentation base. However, the
relative superiority of income versus social class as a
segmentation base is still an unresolved controversy.
The contribution of twelve demographic and socio-economic
variables on consumption were discussed by Freedman (1968) in a
study designed to investigate consumer behaviour in Taiwan.
Interviews were obtained from a probability sample of 2713, and
information was collected on nine consumer durable goods. The
findings showed that socio-economic variables (e.g., husband's
education, husband's income, husband's occupation, wife's
education) have the strongest relationship with consumption of
durable goods. Those twelve variables (husband's education, wife's
education, household income, husband's occupation, use of family
planning, wife's traditional attitude scale, couple's' rural
background, length of marriage, number of children, family type,
133
I.
ethnic background, age of wife) used in the analysis explained 52
per cent of the variation in consumption. Education was the most
important determinant of consumption patterns followed closely by
occupation and income. Thus, Freedman concluded that income is not
an important determinant of consumption of durable goods in Taiwan.
Recently, Smith (1983a) discussed the manufacturer's
consideration regarding the role of some demographic and socio-
economic characteristics (sex, age, income) in the market of
prescription medicines. Sex seems an important demographic
characteristic, it has been shown that women have a higher
consumption of health care products and prescription medicines than
men. The consumer in 0-19 years and 60-79 years categories demand
proportionally more health-care than do the other age categories. A
further consideration is the importance of income level in
determining the type and level of health care purchases. For
example, the greater the affluence of a given family unit, the more
its members seek medical attention. In addition, in a study by the
US National Centre For Statistics, Smith found proportionally a
greater number of doctors' visits were made to those higher income
groups.
Graner (1983) also found that demographic and socio-economic
characteristics influence the amount of medicine purchased from
drugstores. The elderly and the extremely young are the greatest
users of medicines. Females do most of the purchasing from
pharmacies.
From the findings above, we conclude that demographic and
socio-economic variables have a significant role in determining
consumption patterns.
134
4.4. CONSUMER CHARACTERISTICS AND SATISFACTION / DISSATISFACTION:
In recent years, many consumers have expressed discontent with
many products and services. Consumer frustration and
dissatisfaction persists despite achievements made over the past
years. Barksdal and Perreault (1980) describe a series of studies
that have been conducted to monitor the public's attitude toward
marketing, consumerism and government regulation and found that
consumer discontent high and buyer dissatisfaction is widespread.
In the consumer behaviour literature, numerous studies have
focused on identifying demographic / socio-economic correlates of
consumer satisfaction / dissatisfaction and complaining behaviour
with mixed results. Two types of research have been found in the
literature. First, studies concerned with identifying the extent of
consumer satisfaction or dissatisfaction. Second, studies of
consumers who complain about their treatment in the market place.
In both types of studies the emphasis was to explore the extent of
the relationship between satisfaction / dissatisfaction,
complaining behaviour and consumer characteristics. The structure
of those studies was built on the basis of a dependent variable
that represented behaviour, either complaining action or inaction,
satisfaction / dissatisfaction or attitudes, and the independent
variables were consumer characteristics. This section is assigned
to review studies which show the extent of satisfaction /
dissatisfaction by different demography / socio-economy, while the
next section will touch upon the extent of consumer complaining by
consumer profiles.
Regarding the first group of studies. A study by Wall et al
(1978) investigated the degree of satisfaction with clothing
performance on the basis of demographic / socio-economic patterns.
135
A

The results indicated that product performance as well as consumer
variables are important in explaining consumer satisfaction. Cross
tabulations and correlations were computed to examine the
individual relationship between a consumer's level of clothing
performance satisfaction and selected demographic / socio-economic
variables (i.e., age social class, education, income). The
relationship between social class and clothing performance
satisfaction level showed that lover social class consumers were
more satisfied than consumers with higher class levels. This may
reflect a greater awareness and higher product performance
expectation on the part of higher social class consumers. Based
upon the cross tabulations of education levels and satisfaction
levels, no significant relationship was found between levels of
clothing performance satisfaction and level of education. In the
context of income variations, the visual analysis of cross
tabulation did not show a clear relationship between higher levels
of income and higher level of satisfaction, but the two lowest
income categories seem to have relatively high levels of
satisfaction. The relationship for low income groups may indicate
that persons with very low income accept the clothing products they
purchase and within the scope of their experience find their
clothing satisfactory. Finally in this study, the cross tabulations
between age and satisfaction levels yielded a significant chi-
square statistic. Younger consumers displayed less satisfaction
than did older consumers. This may be due to the lack of experience
and different sets of expectations.
Pfaff (1976) discussed the results of a study by the US
Department Of Agriculture in planning to rerun the index of
consumer satisfaction with food products within the years 1976/77.
136
The conclusion demonstrated that consumer satisfaction with food
does indeed relate significantly to different demographic / socio-
economic descriptors. As age increases so does satisfaction.
Participants from large households tend to be more dissatisfied
than those from smaller ones. As education and income increase,
satisfaction decreases.
Another earlier study by Mason and Himes (1973) provided
additional insight into the characteristics of consumers
experiencing dissatisfaction with some household appliances in the
preceding twelve-month period. The study hypothesized significant
differences between some variables (family size, income, age,
education level, marital status), and several patterns resulted.
The level of education and marital status did not reflect
statistically significant differences. In contrast, the number of
people in the household, income and age did reflect statistically
significant differences. The income levels of households which
experienced dissatisfaction with appliances were higher than the
households which did not experience dissatisfaction. The same
patterns were observed in terms of age, more than 50 per cent of
households who experienced dissatisfaction relative to their
appliances were 40-50 years of age.
Ash (1978) carried out a survey to examine the possibility
that certain consumer profiles reflected different levels of
satisfaction / dissatisfaction with various kinds of durable goods.
The actual data were acquired from self administered questionnaires
from a sample of 119 respondents. Correlation analysis was used to
examine the association between the satisfaction / dissatisfaction
scores and demographic data. The results of that study indirectly
support the results of Mason and Himes (1973). However, the results
137
showed that all demographic variables are significantly correlated
with at least three of the durable product categories. Examination
of the results also showed varying patterns of -relationships
between demographic variables and satisfaction. Although none of
the coefficients were large, most of the categories exhibited some
relationship between demographic variables and satisfaction scores.
The variables with the largest number of significant relationships
were marital status, employment status and income. Ash concluded
that, the relationship between demographic variables and
satisfaction were generally weak.
In addition to the above studies, more researchers have
explored the area of consumer goods. Pickle and Bruce (1972)
carried out a survey for the purpose of discovering the extent of
consumer dissatisfaction with major appliances, automobiles and
small appliances. Their findings were somewhat consistent with the
results of other studies described. Data was generated from a
random sample of 173 households. A significant difference in
product satisfaction / dissatisfaction between age groups existed
in the sample, the younger the age group the higher the degree of
dissatisfaction. Significant differences were found between various
education levels. With exception of the college graduates the
higher the level of education, the higher the degree of product
dissatisfaction experienced. With respect to income, the sample
exhibited no significant differences.
The study of consumer satisfaction / dissatisfaction vs
consumer profiles has recently been expanded beyond the scope of
consumer goods to such areas as satisfaction / dissatisfaction with
quality of life and business practices. Andrew and Withey (1976)
shoved variations in the life domain satisfaction associated with
138
1.
demographic / socio-economic variables. Domain satisfaction scores
are shown to vary with age, marital status, family composition and
race. Some of the variation is a result of constraints that prevent
achievement of satisfactory conditions.
Lundstrom et al (1978) measured the extent of consumer
satisfaction / dissatisfaction with business practices. The
research involved questionnaires for 600 people using a six-point
Likert scale with 41 items related to a variety of business
practices. Analysis of the difference between groups of consumer
satisfaction / dissatisfaction scores were examined for several
demographic variables. The greatest disparity came from married
versus single / divorced groups. Harried persons were considerably
more dissatisfied than their unmarried counterparts. Significant
differences were also found for age, income and education. Older
people were found to be more dissatisfied than younger people,
lower income respondents had a much higher level of dissatisfaction
as opposed to higher income families. In addition, the less
educated person was found to be less satisfied than the better
educated individual. On the other hand, the researchers found the
less educated are more likely to have a lover income and to feel
alienation from the economic system in terms of feeling a sense of
powerlessness which is considered a major contributor to
dissatisfaction.
There is a shortage of consumer behaviour studies, and in
particular consumer satisfaction studies, in the area of
pharmaceutical products. However, the researcher has found one
empirical study done by Rapoport (1979) to explore consumer
expectations of a remedy by doctor's prescription and his . / her
intention to self-medication regarding some demographic and socio-
139
economic characteristics (age, sex, social class). The results
demonstrated that there was little variation in expectation of a
doctor's prescription according to age, sex, and social class.
Whilst, demographic and socio-economic variables relating to
different intentions to self-medication shoved a higher intention
in the lover social class. Males were more likely to buy remedies
than females. Analysis of age shoved that elderly patients were
least likely to try self-medication but these differences according
to age were not statistically significant.
It is clear that more work is needed to look at consumer
satisfaction in this important field and this thesis addresses this
problem.
If we try to aggregate comments on the extent of the
relationship between consumer profiles and satisfaction. We find
some disagreement. Several of the studies described related to
consumer goods (Pickle and Bruce 1972 "appliances"; Pfaff 1976
'food products'; Wall et al 1978 "clothing performance' ) support
each other in finding that the younger consumers display more
dissatisfaction than others. However, the results of Lundstrom et
al (1978) showed the older respondents to be more dissatisfied than
younger, while Mason and Himes (1973) 'household appliances' study
reported that the middle aged express most dissatisfaction. With
respect to education, the findings of the some studies were
slightly similar, Pickle and Bruce (1972) and Pfaff (1976)
concluded that, the higher educated people are more dissatisfied.
But Lundstrom et al (1978) again reached contrasting results, they
reported that the less educated a person is the less satisfied he
/ she is. The finding that dissatisfaction increased with the
higher income categories received general support.
140
General speaking therefore, we cannot ignore the extent of the
relationship between consumer variables and satisfaction /
dissatisfaction and the influencing role of those profiles on
consumer attitudes. However, the role of some variables seem to be
product specific.
4.5. CONSUMER CHARACTERISTICS AND PROPENSITY TO COMPLAIN:
A further approach to consumer satisfaction / dissatisfaction
is to assess complaining behaviour, which may viewed as
manifestation-thought representative of consumer dissatisfaction.
London (1977b) presented a model of complaining behaviour. He
considered dissatisfaction as an important component of this model
and suggested that complaining behaviour may be related to personal
characteristics. In addition, the model predicts that the
dissatisfied consumer's tendency to complain will be affected by
his / her expectation concerning the benefit from complaining.
Gilly (1980) in his model of the post-purchase consumer process
recognises "complaint expectation" as influencing the vay in which
the dissatisfied consumer deals with his / her unhappiness. Gilly
goes further and points out that the evaluation of alternatives
forms certain expectations by which the consumer may decide to
voice the dissatisfaction to the seller in the form of a complaint.
In the marketing of products and services, there are many
consumers who are upset with the way they have been treated in the
market place. The most frequent action is to complain to someone in
the responsible organisation. Action is taken as a result of
dissatisfaction in order to achieve satisfaction. Consumer
complaints have occupied an important position in the ,market,
Richins and Verhage (1985) report for three reasons. First, if a
141
I.

dissatisfied consumer complains about defective products or an
inadequate level of service, that individual viii benefit if the
complaint is handled satisfactorily. Second, there is a benefit to
the seller or producer who receives the complaint, in a sense that
the organisation is granted a second chance to do its job yell - to
have a satisfied consumer. Third, there are societal benefits of
consumer complaint action. Complaints are a form of feedback to
business institutions. If consumers consistently complain about
unsatisfactory services, poor product design or inadequate quality,
firms will be better able to correct the cause of those problems.
For instance, Bearden (1983) demonstrates that failure to express
justified dissatisfaction is disappointing to both consumers and
marketers. For consumers, redress or restitution is only possible
if problems are expressed. For marketers, hidden discontent
prevents problems from being corrected and may cause the firm to
lose market share to competing products and services. In general,
consumers vith unresolved problems will undoubtedly develop more
negative attitudes toward business firms and support additional
governmental restrictions on their operations.
In evaluating the role of complaining behaviour it is
important to know the factors which influence the quantity of
complaining. Day and London (1976) reviewed four factors in this
respect. First, the value of the product, many products are so low
in value that dissatisfaction is overlooked. They might be
important to the user but are used by only a small segment of the
population. Second, the ease with which an individual can obtain
redress locally and conveniently in the event of extreme
dissatisfaction. In other words, if the source of the product or
service is physically distant or otherwise difficult to contact a
142
complaint is unlikely to be made. Third, Day (1980) also identifies
the prestige of a product as a factor which influences the quantity
of complaining; such as the economic importance of the product, its
social importance and its complexity. In general, the more
expensive the purchase, the more likely a consumer will act upon
dissatisfaction and complain. Fourth, the consumer's knowledge
contributes to the quantity of complaining, because the less
knowledgeable consumer will be less able to judge product
performance and evaluate the products and services he consumes. He
will also be unfamiliar with procedures for seeking redress and in
registering complaints.
The classification of responses to dissatisfaction has been of
particular concern to several researchers (Harland et al 1975; Day
1980; Bearden 1983). Day (1980) classifies the responses into three
categories: (a) redress seeking in which a specific remedy is
sought, (b) complaining for reasons other than redress seeking and
(c) boycotting or a personal decision to discontinue usage or
patronage. Bearden (1983) exhibits the range of possible consumer
reactions to dissatisfaction as shown in figure 4.1. The various
actions that consumers may take are either public or private
responses. Whereas private responses may impact on the source of
dissatisfaction, public action may lead to resolution of the
problems.
There are a variety of empirical studies that have sought to
expand the understanding of consumer complaining behaviour. Some
studies focus on the differences between complainers and non-
complainers on the basis of demographic / socio-economic variables.
Other studies have concentrated on the direct relationship between
143
1.
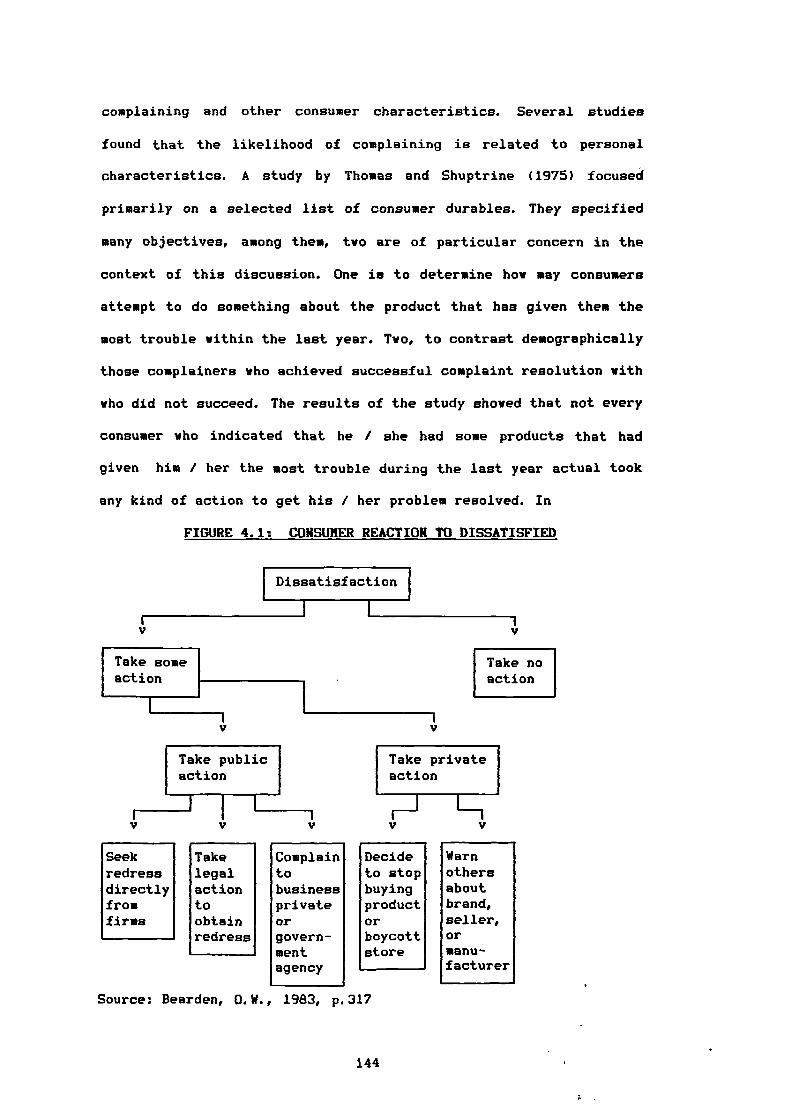
Take publicaction
Take someaction
Take noaction
Take privateaction
r_____J I
complaining and other consumer characteristics. Several studies
found that the likelihood of complaining is related to personal
characteristics. A study by Thomas and Shuptrine (1975) focused
primarily on a selected list of consumer durables. They specified
many objectives, among them, two are of particular concern in the
context of this discussion. One is to determine how may consumers
attempt to do something about the product that has given them the
most trouble within the last year. Two, to contrast demographically
those complainers who achieved successful complaint resolution with
who did not succeed. The results of the study showed that not every
consumer who indicated that he / she had some products that had
given him / her the most trouble during the last year actual took
any kind of action to get his / her problem resolved. In
FIGURE 4.1: CONSUMER REACTION TO DISSATISFIED
Dissatisfaction
Seek Take Complain Decide Warnredress legal to to stop othersdirectly action business buying aboutfromfirms
toobtainredress
privateorgovern-mentagency
productOrboycottstore
brand,seller,Ormanu-facturer
Source: Bearden, 0.W., 1983, p 317
144
determining whether there were any differences between complainers
and non-complainers on the grounds of their demographic / socio-
economic profiles, males were involved in making complaints more
than females. Consumers with a college education seemed to be more
prone to complain about durables giving them major problems than
were consumers with less education. Based on the different
categories of income, age, occupation there does not seem to be any
discernible difference in complaining behaviour. Thus, the
percentages of non-complainers are higher than complainers in
respect of two characteristics, sex and education.
It was suggested by Hunt (1976) that some people might
complain because they think it is expected of them or they may
complain too little because they think it is inappropriate to
complain. Robinson (1978) described in his paper a study by Warland
et al (1975). Warland et al researched the demographic and
attitudinal differences between non-complainers and complainers.
The results of that study suggested that non-complainers are often
unaware of available resources, feel powerless to act or do not
feel that complaining is worth the trouble. They also tend to be
different from complainers in income (lower), educational level
(lower) and social class (lower). Moreover, Warland et al reviewed
other data that were obtained in 1972 by telephone interviews of
1215 adults from a stratified random sample. The study first
differentiated among three groups of consumer dissatisfaction: (a)
upset-action group, (b) upset-no action group and (c) not upset
group. Second, their study presented a comparison of the three
groups with regard to demographic and socio-economic variables.
Those classified as "upset action' appear to be a distinct group,
they were better educated, earned higher incomes, and were more
145
frequently in the top social classes. They were also younger than
the other groups, while the profiles of 'upset-no action" and "not
upset groups' are quite similar.
Another survey study was carried out by Liefeld et al (1975)
on 17000 Canadian consumers. Respondents were asked to indicate
their age, education, family income, marital status, occupation of
family head, sex and the number of complaining letters they have
written to agencies. The results showed that middle aged consumers
complain more than younger and older. Consumers with a lower level
of education complain less than their counterparts. Further,
consumers with a family income over $8000 per annum complain more
than the lover income classes. Harried consumers complain more than
single. High education level and unemployed consumers complain more
than their counterparts. With respect to sex, no difference was
found between male and female. Cross tabulation was used to count
the frequency of complaining on aggregation of different profiles.
The results indicated that consumers with a university education,
family income over $10000 or under $400 and professional categories
were highly complaining and respondents who were 35-69 years of age
had a university education and married were also highly
complaining. Gaedeke (1972) also aimed to shed some light on
complainer's characteristics. The main results demonstrated that
complainers are for the most part, a heterogeneous group coming
from all socio-economic classes, geographic locations and age
groups.
Although, again little work seems to have been done on
consumer complaining behaviour in the pharmaceutical market,
however, a review study of complaints carried out by Hikeal and
Sharpe (1974) has shown a relationship between complaints and the
146
income and cost of medicines. They found that the patient who pays
a high price for a medicine item is more likely to complain, as is
the patient with a higher imcome.
Summarising the above findings it seems that most of those
studies demonstrated that complaining behaviour increases as
education level increases. Consumers who complain tend to be
younger or perhaps middle-aged and of higher socio-economic status
than those who do not. Furthermore, all the previous studies were
completely homogeneous with respect to income status, i.e., high
income is usually accompanied by high complaining behaviour.
In concluding this section, we can easily see that demographic
/ socio-economic characteristics affect consumer complaining.
4.6. CONSUMERISM:
Consumerism is a fitting conclusion to this chapter. Engel et
al (1986) explain the consumerism concept which has ancient roots.
However, increases in voiced complaint and redress-seeking have
been both causes and effects of the dramatic growth of consumerism
over the past two decades. The purpose of this section is to show a
different insightful explanation for consumerism. This is not
presented as the researches's unique alternative explanation but as
a supplement to the prior explanations of consumer dissatisfaction
and complaining behaviour.
In order to discuss the concept of consumerism, we must have
reference to a commonly accepted definition so as to ensure that
all marketers are discussing the same phenomenon. Despite this,
there is as yet no generally accepted definition of consumerism in
the marketing literature. For example, Buskirk and Rothe (1970)
147
defined consumerism as the organised efforts of consumers seeking
redress, restitution and remedy for dissatisfaction they have
accumulated in the acquisition of their standard of living". Kotler
(1972b) brings in to his definition rights, defining consumerism as
'a social movement seeking to augment the rights and powers of
buyers in relation to sellers'. Buskirk and Rothe (1970) present
Drucker's definition of consumerism. Drucker (1969) stated that
'consumerism means that the consumer looks upon the manufacturer as
somebody who is interested but really does not know what consumer's
realities are'. A consumer regards the manufacturer as somebody who
has not made the effort to find out, who does not understand the
world in which the consumer lives and expects the consumer to be
able to make distinctions which he is neither willing nor able to
make. More recently, Mayer (1981) presented a broader definition,
'consumerism is a social movement to inform consumers so that they
can make knowledgeable judegments regarding purchases of private
and public goods. It is a movement to further corrective action
against the misuse of both market and political power held by the
suppliers of these goods. It is also a movement to make consumers
aware of their responsibilities to deal openly and honourably with
those from whom they purchase goods and services'. Obviously, this
definition includes issues of concern such as: (a) public goods,
(b) the misuse of political in addition to economic power and (c)
consumer responsibilities. Generally, consumerism emphasis has been
on the quality of goods and servies rendered comercially or by the
government.
Of particular interest for this work, consumerism has begun to
examine the quality of professional services including what ,doctors
and pharmacists do. Further, consumers' unions have encouraged
148
patients to adopt a more active and questioning role, which of
course requires education of the patients as well as confidence in
the doctor (Woodcock 1981). Precise information is essential for
the correct use of medicines. Medawar (1984) determines several
basic democratic rights the patients should receive from the
experts. Apart from the right to health, these include the right to
information and education.
Brochert (1989) explains the situation in the developed
countries in which consumerism is highly developed with respect to
OTC medicines. How can one provide the patient with the correct
information, when the patient may not know whether or not a helpful
medicine exists, how to apply a given medicine, and how there is
always the hope that there is a medicine which can restore the
patient to perfect health?. The patient tends to trust almost every
promise and pays almost price in the hope that the trouble may
disappear. Despite the fact that a lot of information on OTC
medicines is available: advertising in newspaper and television,
newspaper, magazine articles and package leaflets and even oral
information from family members, neighbours, doctors and
pharmacists, consumer organizations still seek more information on
OTC products.
The definition of consumerism expands into consumer protection
when Day and Aaker (1970) linked different activities under the
heading of consumerism. They stated that, consumerism is the
'activities of government, business and independent organisations
that are designed to protect individuals from practices of both
business and government that infringe upon their rights as
consumers'. Assael (1987) supports Day and Aaker's definition and
summarises the vehicle of consumer protection in three types of
149
organisations: (a) consumer-oriented groups concerned primarily
with increasing consumer consciousness and providing consumer
•
information to improve their basis of choice, (b) government
through legislation and regulation and (c) business through
competition and self-regulation.
With respect to the pharmaceutical industry, Borgenhammer
(1989) stresses that in the area of public health, the fundamental
responsibility of government is to protect the interest of
consumers who are likely to become more critical towards the health
service system. The new situation calls for more information and
more concern for communication in order to create better
understanding between health services personnel and patients. To
provide more information some companies have introduced the
'patient package insert' 'PPI', which is considered an important
source of information (Herxheimer and Davies 1982). However, at the
same time PPI cannot be an effective for what the doctor tells the
patient, or for what the pharmacist says or puts on label, that
could be because the patient either does not yet have the insert or
will not have had the opportunity to read it.
Consumerism is a clearly complex force, it is interrelated
with other ecological, social, political, economic and
technological problems. Andreasen (1976) suggested that sources of
consumer satisfaction are important in exploring the consumerism
phenomenon. In the last chapter we showed that a great variation
exists among consumers in the extent of their dissatisfaction with
the provision of medicines and there is a ride variety of
underlying causes. Nevertheless, it is possible to determine
specific sources of dissatisfaction in the marketing as well as
economic environment. Several marketing researchers have tried to
150
isolate factors as the cause of consumerism (Buskirk and Rothe
1970; Day and Aaker 1970; Broffman 1971; Morin 1971; Kotler 1972b;
strayer 1977/78). For instance, the variety of products in the
market place as well as high expectation by consumers are two
aspects which influence consumerism. The demands for product
improvement have led to an increase in product complexity. Such
complexity has been stimulated by the emergence of new technology.
The problem is most severe for products which are purchased
infrequently, exhibit a rapid rate of technology change, and whose
performance characteristics are not readily apparent. In addition
to that, the new technology is not accompanied by enough
information. Imperfect information in the eyes of some authors is
considered the main reason for dissatisfaction. Even more, product
policies have come under attack to a large extent because of
problems such as the quality / price relationship. This leads the
writers previously mentioned (Buskirk and Rothe 1970; Day and
Aaker 1970; Broffman 1971; Morin 1971; Kotler 1972b; Strayer
1977/78) to state that more empirical evidence is needed on this
topic to facilitate the price / quality comparison.
Inflation has added to this problem. Rising prices have been
singled out for attack as well as leading consumers to increase
quality expectations which are not achieved, thus again
contributing to the frustration of consumers.
Alienation is another triggering factor (Engel et al 1986). A
feeling of powerlessness and isolation leads to essentially
defensive responses in the form of boycotts, pressures for
legislation, and so on.
Demography and socio-economy should be included in any study
of consumerism. As previously mentioned consumer profiles play a
151
significant role in consumer satisfaction / dissatisfaction. Thus
Cohen (1981) tells us to look to demographic and socio-economic
factors for a deeper understanding of consumerism, and Day and
Aaker (1970) demonstrated that consumerism has become identified
with problems associated with social fabric, particularly those of
low income consumers who are suffering excessive price and poor
quality in products and services.
Finally, Becker (1972) refutes the argument that consumerism
has been a result of the success of the marketing concept, the
core of which is the satisfaction of human needs and wants (Kotler
1984). He suggests that perhaps the growth of consumerism indicates
the failure of business to grasp the marketing concept.
4.7. SUMMARY:
The purpose of this chapter has been to propose consumer
characteristics as an important influence on consumer behaviour.
Demographic and socio-economic variables are two basic groups
which play an important role in family decision making and buying
behaviour.
The role of consumer variables was shown in different
behaviours such as consumption, satisfaction and complaining
through a detailed presentation of many empirical studies. The
effect on consumption of, and satisfaction with, different products
were assessed by several consumer characteristics. The results of
those empirical studies will be utilised in chapter 9 to compare
with our empirical results of this research.
The propensity to complain was cited as a subsequent action to
dissatisfaction. The degree of propensity to complain is also
152

influenced by consumer characteristics and was proven by some
empirical studies.
The chapter concluded by shifting the focus to consumerism as
an integrated concept with consumer dissatisfaction and complaining
behaviour. The literature exhibited a variety of definitions, all
of them in general defining consumerism in terms of rights and
powers of consumers or organised efforts by consumers to seek
redress.
153
CHAPTER FIVE
A CONCEPTUAL MODEL OF
CONSUMER SATISFACTION
5.1. Introduction.
5.2. Consumer Involvement.
5.3. Personal Values.
5.4. A Framework Of Relationships.
5.5. Conclusion.
154
5.1. INTRODUCTION:
It is clear to the researcher that there exists a need for a
significant amount of further research in the area of consumer
satisfaction. Such research needs to explore new dimensions such as
consumer involvement and personal values and build them into the
existing theoretical framework of other relationships. The recent
literature shows that consumer involvement and personal values
affect directly or indirectly the feeling of satisfaction /
dissatisfaction. The researcher suggests therefore that these two
dimensions are critical variables like expectation, experiences,
performance, disconfirmation and inequity in determining
satisfaction / dissatisfaction.
The purpose of this chapter is to critically review the most
important empirical evidence and theoretical arguments regarding
the role of consumer involvement and personal values in consumer
satisfaction. A conceptual framework is presented which describes
the interrelationships among a set of variables (i.e., consumer
involvement, personal values, expectations, experiences, personal
characteristics). Our emphasis is twofold, first the concepts of
consumer involvement and personal values as new dimensions of
consumer satisfaction are discussed individually and the background
literature is reviewed. Second, these concepts are built into a
model of consumer satisfaction.
155

5.2. CONSUMER INVOLVEMENT:
The concept of involvement has received much attention in
social psychology and more recently in consumer behaviour studies.
Basically, the concept of product involvement is "a recognition
that certain products may be more or less central to an
individual's life, his / her attitudes about himself / herself,
his / her sense of identity and his / her relationship to the rest
of the world" (Traylor 1981). Engel and Light (1968) characterised
involvement as 'the important values or motives". Day (1970)
provided a definition of involvement that derived from Freedman
(1964) and Ostrom and Brock (1968). Involvement according to Day is
defined as "the general level of interest in the object or the
centrality of the object to the person's ego-structure'. Hansen
(1981) defines involvement as 'variations in the extent to which
the individual is more or less motivated toward a specific piece of
information, product, or the like". Slams and Tashchian (1985)
define involvement as 'the degree to which consumers are
interested, concerned or involved in the consumer decision
process'. The concept of consumer involvement is considered
therefore by Sherrell and Shimp (1982) as one of the most important
scientific units in consumer behaviour.
Considerable progress has recently been made by consumer
researchers in understanding the nature of product involvement.
Mittal and Lee (1988) state that, 'product involvement is the
degree of interest of a consumer in a product category on an on-
going basis'.
Researchers and practitioners tend not to use the word
'involvement' alone, but rather imply a distinction between types
of involvement. Houston and Rothschild (1978) make a diRtinction
156

between enduring involvement and situational involvement. The
former stems from the individual and reflects a general and
permanent concern with the product class. While the latter reflects
concern with a specific situation such as the purchase occasion.
Further, involvement theory has considered a basic dichotomy: high
involvement and low involvement. Bloch (1982) and Schiffman and
Kanuf (1983) conclude that, when a purchase is considered by the
consumer to be important as in the case of a high risk product the
consumer is willing to exert effort to acquire information, then a
high involvement state exists leading to the processing and
evaluation of relevant marketing communications and relatively
complex decision making. On the other hand, when a consumer
believes a purchase is unimportant and sees little reason to secure
information, that leads to simple decision making. Such concern is
considered to be indicative of low involvement. Bloch (1982)
reminds us that researchers commonly warn that low involvement is
associated with most consumer purchase decisions.
High and low involvement are operationally distinguished by
Oliver and Bearden (1983). They present an empirical study by Boren
and Chaffee (1974) which brought evidence that a high involvement
consumer makes different pre-purchase judgements from a low
involvement consumer. Oliver and Bearden therefore conclude that
involvement is related to the absolute level of pre and post
evaluation for reasons which are not entirely clear. High
involvement decreases one's sensitivity to pre-usage phenomenon,
while low involvement causes the general tone of pre-usage affect
(attitude) to influence post-usage evaluations.
Despite such distinctions between high and low involvement,
Kapferer and Laurent (1985) found in an empirical analysis across
157

20 contrasted markets that high and low involvement represented
only 25 per cent of the purchase situations. 75 per cent are
described by other types of involvement.
Some recent evidence has shown that there are various
components of consumer involvement in a product. Traylor 1981
describes two components normative importance / product involvement
and commitment to a brand. 'Normative importance refers to how
connected or engaged a product class is to an individual's values'.
Commitment is defined as 'the pledging or binding of an individual
to his brand choice'. Traylor goes further and indicates that brand
commitment and product involvement / normative importance seem to
be completely unrelated phenomena for some individuals. Traylor
concludes that intuitively a consumer may be highly involved in a
product without having committed himself / herself to a particular
brand, or that he / she may be strongly committed to a brand for
what he / she considers an uninvolving product class.
Muncy and Hunt (1983) propose five types of involvement (ego
involvement, commitment to a brand, communication involvement,
purchase involvement, response involvement). Ego involvement is
defined as a concept related to one's value system. Ego involvement
precedes the commitment, but commitment can exist without ego
involvement. Communication involvement is based on the nature of
connections a person makes between a communication and something
existing in his life. Purchase involvement is defined in terms of
high and low response in obtaining information, in the first case,
individuals use information to arrive at the optimum choice, while
in the second case they minimize the physical and psychological
effort required to obtain a product.
158
Kapferer and Laurent (1985) describe Park and Young's (1984)
distinction between cognitive involvement and affective
involvement. The first one stems from utilitarian motives, the
second from emotional motives. Park and Young see consumer
involvement as a composite of cognitive and affective factors,
since the motivational state is potentially triggered by one or
more of the following antecedents: perceived importance of the
product, perceived risk and perceived pleasure value. These
antecedents may trigger by turn either enduring or situational
involvement. The pleasure value is mostly a factor of enduring
involvement. While perceived importance of the product and
perceived risk may apply to both.
Hittal (1986) present high and low involvement in terms of
high and low cognitive and affective types. High involvement occurs
'when a product's performance dimensions are important' i.e., high
cognitive and 'when a product's image dimensions are important'
i.e.,., high affective. Low involvement occurs 'when neither
performance nor image dimensions are much important' i.e., low
cognitive and low affective. Finally, Rothschild (1979) reported
that, generally in marketing, price is probably the most commonly
used indicator of involvement. Because the risks of a mispurchase
are high when price is high, consumers are likely to be involved.
In summary, it seems to the researcher from the above
literature review that consumer involvement would be an element
which affects directly or indirectly the feeling of consumer
satisfaction / dissatisfaction.
159
5.3. PERSONAL VALUES:
The field of consumer research has not given much attention to
personal values, despite the fact that many studies of consumer
behaviour have argued that values play an important role in social
and cultural activity.
Personal values are generally accepted as a major influence on
human behaviour (Rokeach 1968a). Personal value is viewed by
England (1967) as 'a relatively permanent perceptual framework
which shapes and influences the general nature of an individual's
behaviour". Rokeach (1968b) has defined a value as "the enduring
belief that a specific mode of conduct or end state of existence is
personally and socially preferable to alternative modes of conduct
or end states of existence'. Rokeach (1966a) developed the
definition of personal values that do not tie in to any situation
or object. He defined personal values as 'abstract ideals, positive
or negative, not tied to any specific object or situation,
representing a person's beliefs about modes of conduct and ideal
terminal modes'.
Vinson et al (1977) viewed the conceptualization of the term
'value' as reflecting the interests of three disciplines
(anthropology, sociology, psychology). Anthropologists are
interested in life styles and cultural patterns and psychologists
examine values from the standpoints of attitudes and personal
motives as defined by Rokeach's approach (1968a).
England (1967) defined two major classes of personal values
"operative" and "intended and adopted' values. While operative
values have the greatest influence on behaviour, intended and
adopted values may be professed but do not directly influence
behaviour to any great degree. Rokeach (1968c) differentiated
160
1. .

between "instrumental" and 'terminal' values. Instrumental values
relate to modes of conduct and represent single beliefs which are
personally and socially preferable in all situations with respect
to all objects (e.g., ambition, independence and self-control).
Terminal values are single beliefs that some end-state of existence
is personally and socially worth striving for (e.g., leading an
exciting life, family security and pleasure). Rokeach added that
terminal values are more stable, because they are acquired early in
life while instrumental values are more susceptible to change in
the socialization process.
In terms of marketing, Howard (1977) differentiated between
instrumental and terminal values. Whereas terminal values are
guiding choice among classes, instrumental values are guiding
choice among brands. In addition, he concluded that, if consumers
are to be grouped on the basis of values, the entire system of
values (both instrumental and terminal) of individuals must be
considered.
Values are viewed as existing at two distinct levels. The
first level referred to as "global values' or "generalized personal
values'. These values are of salience to individuals and provide a
basis for assessing dominant or overall need orientation. The
second level deals with values which refer to desired product
attributes and market place transactions and behaviours. That level
is termed 'domain specific values' or 'generalized economic values'
by which attitudes and behaviour cannot be understood or
efficiently predicted except in the context of a specific
environment (Scott and Lamont 1973b and Vinson et al 1977). Vinson
(1977) suggested that differential value orientations represent an
important underlying dimension of consumer discontent.
161

More recently, personal values have been conceptualized by
Bozinoff and Cohen (1982) as forming a belief system which serves
to guide behaviour across situations. Personal values include more
than the individual's own needs. They also capture the effects of
societal and institutional demands upon a person. Bozinoff and
Cohen go further and suggest that consumer behaviour is a function
of both the situation and what the individual brings to the
situation (i.e., personal values).
Consumer behaviour literature shows the relationship between
values and both attitudes and beliefs. Rokeach ((1968c)) was
concerned about the relationship between values and attitudes. He
stated three major considerations which show that the value concept
is broader than the attitude concept. First, value is clearly a
more dynamic concept than attitude, having a strong motivational
component as well as cognitive, affective and behavioural
components. Second, while attitude and value are both widely
assumed to be determinants of social behaviour, value is a
determinant of attitude as well as behaviour. Third, attitudes seem
to be a specialized concern mainly of psychology and sociology,
values have long been a centre of theoretical attention across many
disciplines in philosophy, education, political science, economics,
anthropology as well as in psychology and sociology.
Boote (1981a) presents a new approach to market segmentation
which relies on personal values. He describes values as °more
general than attitudes, in that they guide the choice of modes of
behaviour of the individual, while attitudes are object specific
(e.g., the degree to which a particular object is liked or
disliked). Moreover, values are more durable than attitudes,
because, as Becker and Connor (1981) state, attitudes result from
162

"the application of a general value to concrete objects or
situations". In addition, 'values are acquired over a longer period
of the individual's socialization and they are likely to be
thoroughly internalized by the time the individual reaches
adulthood".
Leasing (1976) deals with the relationship between values and
beliefs. He defined personal values as 'abstract beliefs centrally
located within the beliefs system. Values are not directed toward
any specific object, idea or situation; rather, they provide
standards relating to modes of conduct, goals and evaluation".
Leasing added that values therefore, lead to a certain amount of
stability across an individual's attitudes and behaviour .
In brief, personal values seem to be able to be placed within
the causes of the feeling of consumer satisfaction /
dissatisfaction. Vinson (1977) has suggested that personal values
represent an important dimension of consumer discontent. In
addition, the relationships between values and both attitudes and
beliefs could indicate to the extent of a relationship between
personal values and satisfaction. In the next section therefore, we
try to explore such relationships.
163
i.
5.4. A FRAMEWORK OF RELATIONSHIPS:
It is our hope in the following paragraphs to shift from the
individual concepts of consumer involvement and personal values and
to fit them into a broad framework of relationships involving
consumer satisfaction and dissatisfaction. Many relationships have
been found which enable the researcher to suggest that consumer
involvement and personal values are two dimensions among other
causes of satisfaction / dissatisfaction. The developed framework
shown in figure (5.1) is based on cause and effect relationships
between sets of variables. First, the relationships between values
and involvement. Pitts and Woodside (1984) demonstrate that 'the
activation of the involvement mechanism is accomplished by the
connections of the particular stimulus situation to the
individual's value hierarchy'. The decision to label a situation as
high or low involvement should come from the inspection of the
centrality or the number of values affected by the situation of the
stimulus. Pitts and Woodside question whether an individual's value
structure influences the cognitive processes entirely through the
mechanism of involvement. In this context, they present an
empirical study carried out by Rokeach (1973). Although the results
did not show a direct empirical relationship, the study hinted at
the nature of such a relationship. The results suggested that the
involvement mechanism is activated for those situations in which
the stimulus information is seen to be instrumental to some goal
the individual has or possess some intrinsic importance for the
person due to the particular value structure in force.
Second, with respect to the relationship between values and
expectation, Scott and Lamont (1973b) introduced the concept that
changes in personal values affect the expectations consumers hold
164
regarding the criteria used to evaluate the products and services
in the market place. Rokeach (1979) also raised the possibility of
a causal relationship between personal values and expectation. He
suggested personal values represent standards and beliefs
regarding product performance. Vinson and Muson (1976) in
introducing the concept of personal values as a new approach to
market segmentation, stated that marketers generally agree that the
process of marketing exchange is predicted largely upon the firms'
ability to recognize and satisfy consumer needs, which in turn are
largely based on personal values. Rokeach (1979) carried out a
study using 206 respondents (white and black) with different
personal values (instrumental and terminal) and different levels of
expectation. The respondents were asked to indicate normative
expectation on 5-point scales. Product moment correlation
coefficients between value dimensions and expectation from product
attributes were obtained. The hypotheses of this study were largely
supported, since a significant correlation was found between
expectation and personal values. The researcher concludes therefore
that value dimensions have an important impact on satisfaction
because of their significant association with product expectation.
Third, regarding the relationship between consumer involvement
and expectation, Swan and Combs (1976), proposed indirectly a
relationship between satisfaction and involvement by introducing
two dimensions of performance that became important in determining
the satisfaction with high and low involvement products. One is the
functional or instrumental performance of the product, the other is
the expressive or psychological performance of the product. Both
dimensions have been explained by Assael (1987) among factors with
which consumers are likely to be involved. Further, the functional
165
performance is important for high or low involvement products,
while the expressive performance is relevant for high involvement
products. Consumer involvement and expectation therefore seem to be
related.
Fourth, Houston and Rothschild (1978) discussed product
involvement as relative to consumer experience. They demonstrated
that situational involvement is dependent on the individual's prior
experiences in the strength of the values which are relevant to the
particular situation.
Fifthly, the work of Vinson et al (1977) suggests a
relationship between personal values and experience. They state
people acquire their values through experiences in specific
situations or domains of activity and that behaviour cannot be
understood or efficiently predicted except in the context of a
specific environment. We conclude from the above paragraphs that
consumer involvement, personal values, expectation and consumer
experience are all interlinked as shown in figure (5.1).
The next relationship to be touched upon here is the
relationship between consumer characteristics and consumer
involvement. Slams and Tashchian (1985) present the relationship
originated by Kassarjian (1981). They state that several
characteristics seem to merit discussion regarding involvement.
Those characteristics such as: family life cycle, education and
income were analysed for the purpose of exploring that
relationship. ANOVA was applied, and the results indicated that the
mean value of purchasing involvement for retirees is lover than
other groups in the life cycle. A positive and direct relationship
between education and purchasing involvement was hypothesized and
the results of ANOVA strongly support that hypothesis. The same
166

computation was done with income and the results shoved that
moderate levels of income lead to the highest level of involvement.-
The analysis exhibited also that, women have higher involvement
than men while the working status of wives was not associated with
purchasing involvement. Accordingly, we can conclude from that
study that consumer characteristics do indeed influence purchasing
involvement.
Finally, regarding the relationship between consumer
characteristics and personal values. Rokeach (1973) maintained that
while ethnic and cultural background is the predominant source of
personal values, income, education, age and sex should be taken in
consideration. Munson and McIntyre (1979) report Rokeach's work
(1973) in which he demonstrated that different value structures
(instrumental and terminal) have been found which significantly
differentiate men from women. Further, Vinson et al (977) argued
that personal values vary by age, education, income and other
consumer demographic and socio-economic variables. Boote (1981a) in
his attempt to describe market segmentation by personal values,
shows the impact of demographic variables (sex, age, income) on
personal values. He applied factor analysis for male and female
respondents on 45 value items. The value structure of the factors
identified for male and female were different. Then a statistical
clustering technique was used to find out if there were differences
in personal values and brand preferences on the basis of male and
female. The results suggested that brand preferences were not
significantly different on the basis of male and female, while
among personal value items, brand preferences exhibited differences
on the basis of male and female. In addition, Pitts (1981)
demonstrated that homogeneous groups of individuals with similar
167

value systems may effectively be developed and differentiated from
dissimilar groups on the basis of education and income. Moreover,
age and life cycle status have also been shown to have a unique
effect on individual values (Crosby et al 1983).
It is also important to know how our model contributes to the
satisfaction / dissatisfaction topic. The most appropriate model
found in the literature search was Miller's model (see chapter 3).
Miller (1977) describes the two most popular variables
(expectation, performance) which appear in all the literature
studies of consumer satisfaction. His model shows the interaction
of four types of expectation (ideal, expected, minimum tolerable,
deserved) with the level of performance that leads to a different
level of consumer satisfaction / dissatisfaction.
Our model widens the scope and brings a broader meaning to the
consumer satisfaction / dissatisfaction topic by introducing the
new variables of consumer involvement and personal values which
have not been used before in the previous studies of consumer
satisfaction. The main concern of this model is potentially to show
that consumers not only receive their feeling of satisfaction /
dissatisfaction by the interaction of expectation and performance,
but also that expectation is affected by involvement and personal
values both directly and indirectly through experiences. Hence, the
model offers the new idea that satisfaction / dissatisfaction is
dependent on consumer involvement and personal values.
In brief, if we accept the above relationships, we are
involved in a framework of interrelationships between different
components as shown in the conceptual model of consumer
satisfaction / dissatisfaction which is exhibited in figure (5.1).
168
5.5. CONCLUSION:
The theoretical arguments and empirical evidence which have
been reported in this chapter now embolden the researcher to place
personal values and consumer involvement within the discipline of
the topic of satisfaction.
Consumer satisfaction is indeed a complex phenomenon, as are
attempts to model it in a new framework. The value of this
conceptual model is that it helps to better define and understand
consumer satisfaction. Unfortunately, it was not possible to test
this model completely in this phD thesis, since as the reader will
recall the main thrust of this thesis was to investigate consumer
satisfaction with the provision of medicine in Egypt, with a view
to better protecting the Egyptian consumers. The literature survey
in chapter 3 nonetheless showed the subject of CS/D was ripe for
theoretical development and the proposed model grew out of the
researcher's desire to better understand the CS/D concept.
Complete testing would have required the development of
quantitative measures for all of the variables and the collection
of vast quantities of information from respondents, more than could
be collected in a large scale survey which had a rather different
primary purpose. Nonetheless, the researcher feels this conceptual
model is a valuable framework for further studies of consumer
satisfaction / dissatisfaction.
169
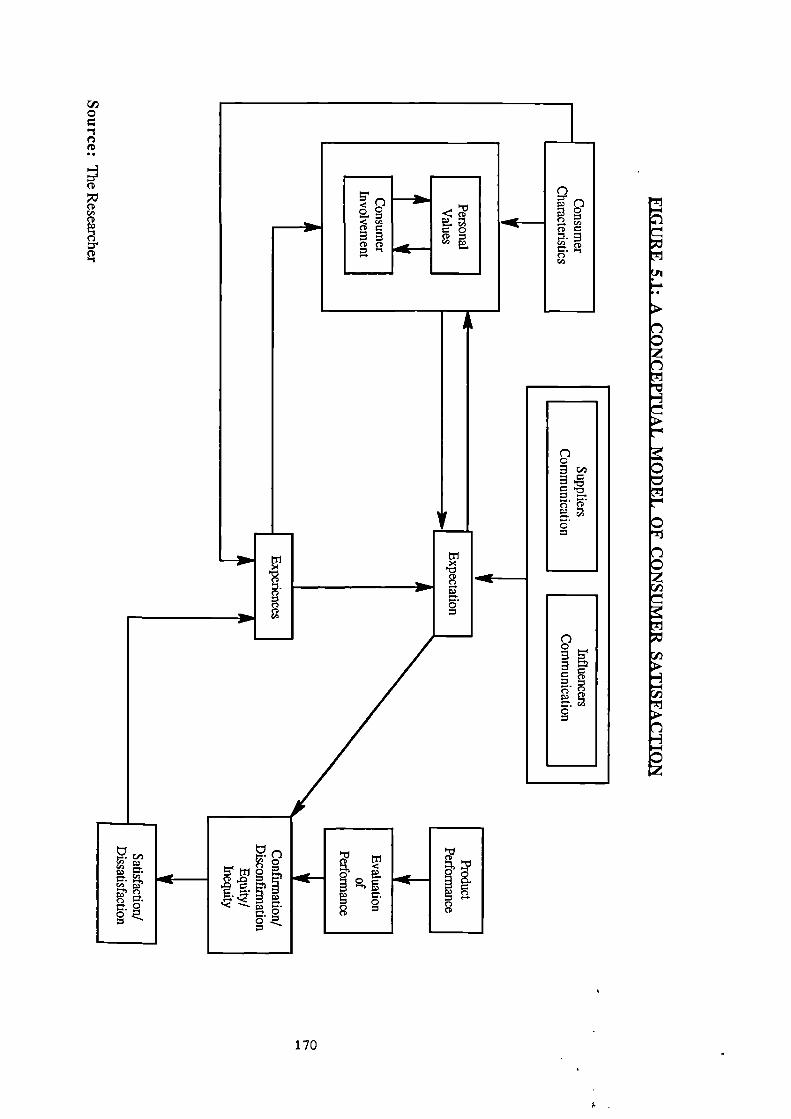
—31In
S.
S.
7CI
0
5<0 g<CD c
CD
G 'CVt';`,o
2
4111L--
710
CW1=.
P• e5 171 0tTl
0I=.
"0 Pr.
0
2 Jo.-e. F
000
PD
170

CHAPTER SIX
RESEARCH DESIGN
6.1. Introduction.
6.2. Data Sources.
6.2.1. Secondary Data.
6.2.2. Primary Data.
6.3. Research Approaches.
6.3.1. Exploratory Study.
6.3.2. Empirical Investigations.
6.4. Scales Of Measurement.
6.4.1. Attitude Rating Scales.
6.5. Questionnaire Design.
6.5.1. Phrasing Of Questions.
6.5.2. Sequence Of Questions.
6.5.3. Questionnaire Structure.
6.5.4. Questionnaire Instructions.
6.6. Data Collection.
6.6.1. Pilot Survey.
6.6.2. Personal Interviews.
6.7. Sampling Plan.
6.7.1. Defining The Population.
6.7.2. Sample Size.
6.7.3. Sampling Procedures.
6.7.4. Sampling Control.
6.8. Response Rate Of Consumer Survey.
6.9. Criteria For Good Measurement.
6.9.1. Reliability.
6.9.2. Validity.
6.10. Summary.
171
6.1. INTRODUCTION:
The research plan is the basic framework which guides the
analysis procedures of the research. It serves as a bridge between
the research objectives and the carrying out of the study by
specifying the source of data, research approaches, designing the
research instrument and data collection procedure. Moreover, a
successful research plan requires a good sample plan and suitable
scale of measurement.
6.2. DATA SOURCES:
When confronted by a new problem the researcher first attempts
to find existing data from secondary sources and then moves on to
collect primary data, should the secondary sources prove inadequate
in any way. Both secondary and primary data were required in this
study to satisfy the research objectives.
6.2.1. SECONDARY DATA:
Secondary data is readily available and is sometimes
sufficient to answer the research question. The fundamental rule in
using secondary data is to secure data directly from the original
source rather than using acquired sources (Kinnear and Taylor
1987). Oppenheim (1966) stated that, secondary sources may
facilitate the research process by:
(1) Expanding the understanding of the problem.
(2) Suggesting hypotheses and research objectives.
(3) Helping to plan the sample and to provide a basis for
validating the obtained sample.
172
In this context, the researcher relied on several kinds of
secondary data such as library sources (i.e, text books,
periodical), external data were collected from reports of the
Egyptian government, and internal data from pharmaceutical
companies records. These sources are documented in the references
and bibliography sections of this thesis.
6.2.2. PRIMARY DATA:
Primary data may be described as that data which has been
observed and recorded by the researchers for the first time, to
their knowledge. Researchers typically find that primary data must
be collected to supplement the secondary data. This study relies
strongly on primary data to explore consumer satisfaction in the
Egyptian market of pharmaceutical products. Since no previous
studies have been conducted on this topic in Egypt.
6.3. RESEARCH APPROACHES:
This research employed a two stage approach, first an
exploratory study followed by a large scale empirical
investigation. Each stage is discussed below.
6.3.1. EXPLORATORY STUDY:
This study began with an exploratory study into the
pharmaceutical market to seek insights into the general nature of
the problems in that market, the possible decision alternatives and
relevant variables that need to be considered. Oppenheim (1966)
concluded that the exploratory research is useful for establishing
the research question and for learning about the practical problems
of carrying out the research • In general, any exploratory research
173
1.
is conducted to understand and formulate the problem as well as to
state the research objectives and hypotheses.
6.3.2. EMPIRICAL INVESTIGATIONS:
Empirical investigations include the study of marketing
phenomenon such as consumer reaction, attitudes, opinions to
products and consumer behaviour in purchasing those products.
This empirical investigation was undertaken in Egypt to enable
us to identify the extent of consumer satisfaction as well as to
describe the relationship between consumers' consumption patterns
(in terms of their expenditure) and consumers' demographic / socio-
economic characteristics.
6.4. SCALES OF MEASUREMENT:
The objective of measurement is to transform the characteristics
of objects into a form that can be analysed by the researcher.
Several text books define a scale of measurement as 'the assignment
of numbers to characteristics of objects, persons, states or events
according to rules'. Numbers are used as symbols to represent
certain characteristics of objects or people (Tull and Hawkins 1987
and Kinnear and Taylor 1987). There are four levels of measurement,
nominal, ordinal, interval and ratio'. A nominal scale is the
level of measurement where numbers are used only as labels. It is
used for the lowest form of measurement, namely classification and
identification. An ordinal scale 'represents a number, letter or
other symbols used to rank items. Such items can be classified not
only as to whether they share some characteristic with another item
* The specific nature of this scale is out the scope of this study.
174
but also whether they have more or less of this characteristic than
some other object' (Tull and Hawkins 1987). An interval scale not
only separates individuals or items by ranks, but also measures
the distance between rank positions in equal units. Therefore,
numbers used to rank the objects also represent an equal increase
of the attributes being measured. This means that differences can
be compared.
Brown (1980) expresses the view that any attempt by a
researcher to assign numerical values to words is technically
justified, and arguments rage among marketing researchers regarding
the assumption that attitudinal, satisfaction and agreement scales
possess true interval properties. For our study, we follow in the
footsteps of such respected names as Green and Tull (1978), Aaker
and Day (1986) and Kinnear and Taylor (1987). We have made such an
assumption with respect to consumer satisfaction scales. Nominal
scales were used to measure the demographic and soico-economic
characteristics of respondents.
6.4.1. ATTITUDE RATING SCALES:
Attitude variables such as beliefs, preferences, intentions
and opinions are measured using rating scales. In a rating scale
the respondent is asked to rate himself / herself by choosing the
point at which he / she would fall on a scale running from one
extreme of the attitude in question to the other. Boote (1981b)
decides to restrict the scale to only five-points and seven-points
scales. On the one hand, he explains that, any fever than five
points would reduce the scale's ability to discriminate since
respondents would be unable to express refined gradations. , On the
other hand, more than seven points could be less than optimum,
175
1.
because the increase in information gathered becomes smaller with
longer scales.
The attitude rating scales used in this study are described
below.
(i) Itemized Rating Scale:
This kind of attitude scale is widely used in marketing
research as well as being the basic building block for complex
attitude scales (Tull and Harkins 1987). Further, all recent
sociological research suggests that the best method to employ to
study consumer satisfaction is an itemized rating scale (Westbrook
1980b). In this context, we used seven point rating scales ranging
from very dissatisfied to very satisfied (see appendix 1) to
indicate the degree of satisfaction / dissatisfaction with a group
of attributes.
(ii) Likert Scale:
Attitudes towards a complex objects (i.e, consumer's opinions
towards the use of medicine) can be measured using a Likert scale.
This scale requires a respondent to indicate a degree of agreement
or disagreement with a variety of statements related to the
attitude object. The original Likert format has lime rating
categories (Luck and Rubin 1987), but in this study, we drew a
seven category scale (strongly disagree which was assigned a score
of 1 to strongly agree which was assigned a score of 7) for the
purpose of increasing accuracy (see appendix 1).
176
6.5. QUESTIONNAIRE DESIGN:
As with most steps in the research process, the design of the
questionnaire is highly iterative, because, it is an integral part
of the research design. A questionnaire was used to collect the
primary data required. According to Parasuraman (1986) the logical
starting point for conducting a questionnaire is to translate the
data requirement of a project into a set of questions for eliciting
information. This is further explained by Boyd et al (1977). They
demonstrated that a questionnaire must serve two basic functions.
First, it must translate research objectives into questions which
respondents can answer. Second, it must motivate the respondent to
cooperate with the survey.
Regarding the questionnaire length, Haryana (1977) suggested
that a questionnaire should be long enough to include all the
information essential to the study, but not so long that the
respondent will reject it as being too time consuming. A short
questionnaire usually stands a better chance of being answered
honestly without the respondent feeling boredom. Generally,
questionnaires should be designed to maximise the willingness and
ability of people to respond.
In designing a questionnaire, consideration must be given to
many factors such as phrasing, sequence and simplicity of
questions. In developing the questionnaire all these points were
borne in mind.
177
1.
6.5.1. PHRASING OF QUESTIONS:
The phrasing of questions is a major problem. If the wording
is too simple it will insult respondents. On the other hand, if it
is too complicated, the question is likely to be misunderstood.
Thus, questions should be worded so that they are clear without
being over simplified. Belson (1985) warns against asking questions
that may be leading or suggestive. The researcher was aware of the
dangers of leading and suggestive questions i.e., that answers to
these questions are often of dubious value in the analysis process.
Such questions were therefore avoided.
In order to examine the phrasing of the questions, the
questionnaire was discussed in detail with fifteen respondents
through a pilot study described in detail in section (6.6.1).
6.5.2. SEQUENCE OF QUESTIONS:
The sequence of questions is an essential step in
questionnaire development. The sequence necessarily begins with a
statement which indicates that this particular survey has a
worthwhile purpose and that the person who is asked to respond
should feel secure in doing so. Most authors agree that questions
on threatening topics should not be placed at the beginning of
questionnaire. In contrast, questions placed at the beginning
should be simple and straight forward. Dijkstra and Zouwen (1982)
point out that the early items should be interesting to the
respondent and clearly related to the stated topics. These items
help to create respondent motivation. Therefore, they suggested
that demographic and socio-economic (e.g, age, income, sex) should
be asked at the end rather than the beginning of the questionnaire.
Thus, a refusal to answer a question such as income will nOt affect
178
responses to other questions if income is the last question in the
questionnaire.
There are two rules in question sequence according to Sudman
and Bradburn (1982). First, questions should flow smoothly and
logically from one to another and starting with simple questions
and moving progressively to the more complex ones. This helps to
establish rapport and build the confidence of a respondent in his /
her ability to answer. Second, questions should be arranged in such
a way that respondents can interpret later questions in the light
of the earlier ones. Luck et al (1982) suggest the best sequence
for questionnaire is as follows:
(1) Simple questions to start the flow of responses and gain
rapport.
(2) Specifics on feelings or information sought by the study.
(3) Demographic and socio-economic questions to describe the person
who responded.
Bearing this in mind, we started the questionnaire with fifty
one attitudinal questions (i.e, satisfaction variables and
statements), next a factual question (i.e, consumer expenditure on
medicine), and finally the classification information (i.e,
demographic / socio-economic).
6.5.3. QUESTIONNAIRE STRUCTURE:
Most questionnaires used in marketing research studies are
structured and are not disguised. That means, questions are
presented with exactly the same wording and in exactly the same
order to all respondents. Collection of data in a structured
interview has definite advantages in marketing research. It is
simple to administer, easy to tabulate, analyse, and is especially
179

appropriate for a large sample size empirical study (Green and Tull
1978).
In this research we used undisguised questions and all
questions were structured. The questionnaire was developed with
closed-ended questions (see appendix 1). These questions have
proven themselves to be more efficient and ultimately more reliable
than open-ended questions (Fink and Kosecoff 1985). Their
efficiency comes from being easy to use, score and code (for
analysis by computer). There are several types of closed-ended
questions such as dichotomous questions, checklists, scale
responses and multiple choice questions.
Our questionnaire falls into three sections. In the first
section, the questions were designed to explore consumer
satisfaction (e.g, packaging, labelling, quality) using itemized
rating and Likert scales (as described in section 6.4.1) in which
the respondents were given a range of categories to express their
attitudes and opinions. The questions were arranged on a seven
point scale ranging from very dissatisfied to very satisfied and
another ranging from strongly disagree to strongly agree. Such
questions endeavoured to provide a direct measure of respondents'
attitudes and opinions.
In the second section, a question was designed to investigate
the different consumption patterns of medicine (in terms of
expenditure). That question consists of five response categories
to provide the answers. Its advantages lay in enabling the
respondent to express herself / himself whilst the researcher
obtained all the replies in similar wording.
In the third section, the questions were designed to secure
the demographic and socio-economic information needed on the
180
P
Egyptian consumers. Several categories were developed for each
characteristic and the respondents selected that category into
which he / she fitted.
Respondents were finally encouraged to offer their own reasons
for either satisfaction or dissatisfaction with the provision of
medicine in the Egyptian market.
6.5.4 QUESTIONNAIRE INSTRUCTIONS:
Instructions regarding the answering of questions is considered
a significant section of any questionnaire. Platek et al (1985)
state that the instruction given to respondents is an important
issue. The instruction can motivate the respondent by indicating
the purpose of interview, clarifying his or her role and thereby
increasing the value of the information obtained. In this context,
each section of the questionnaire in this study included
instructions. These instructions appeared also on the Arabic
version (see appendix 2) which was actually administered. These
instructions explained the purpose of the research and include the
right way to complete the questionnaire. Respondents were assured
that any information provided would be treated confidentially and
used only in the respondents best interest. We emphasised
therefore, there was no need for a respondent to give his / her
name.
181
6.6. DATA COLLECTION:
A pilot study survey was carried out followed up by the large
scale personal interview survey.
6.6.1. PILOT SURVEY:
Good survey researchers carry out as a matter of course, a
pilot of their questionnaire. No questionnaire is ready to present
to the field without pilot work. Belson (1985) described the
procedure followed in this work. The researcher delivers the
questionnaire in the way planned to a small of people of the sort
that the questionnaire was designed for. Belson (1982) explains
that pilot work aims to (a) investigate the particular way in which
survey respondents understand / misunderstand a wide range of
questions put to them in a survey interview, (b) determine the
level of understanding of each respondents on a number of questions
to establish the relationship between understanding and various
characteristics of the respondents. A test of 15-50 is usually
sufficient to discover the major flows in a questionnaire before
the main study (Sudman 1976).
In this work, we conducted a small survey of 15 Egyptian
nationals living in Sheffield to ensure that the wording of the
questionnaire was simple to understand. But it was felt that those
respondents did not represent the different classes of the whole
population. Another further pilot survey of 20 respondents was
therefore carried out by the researcher in Egypt before conducting
the main survey in August (1989).
The researcher noted carefully things like, how long the
questionnaire took to answer, whether the respondents found any
difficulty in interpreting the meaning of any of the questions. The
182
pilot survey helped to discover ways to improve the response rate
and eliminate some poor wording. The final version is presented in
appendix (1). Rewording was necessary for some attributes and
statements (e.g., attributes 12, 34 to 36, 39 to 41 and statement
7) to eliminate misunderstanding and increase response rate.
6.6.2. PERSONAL INTERVIEWS:
The primary data was collected by face to face personal
interviews in 27 different areas in Cairo and Giza. Respondents
completed the questionnaires at home with exception of a few
respondents with whom the researcher could not communicate at home,
an advance arrangement was therefore made to fill in questionnaires
in their work location.
The telephone interview method was eliminated because such
interviews are limited to those respondents with a telephone, so
that this creates bias against lover income households without
telephones. A mail questionnaire method was also excluded because
of the limited time which was allowed to complete the survey (the
survey had to be completed during three months). Personal
interviews also have many advantages over other methods. They are
more flexible and allow the collection of greater variety of data
than other approaches for obtaining consumer reaction to
satisfaction variables (e.g, quantity, availability). Face to face
interviews often increase the rate of participation and establish
rapport because of the social relationship developed between the
respondents and the interviewer. Therefore, personal interviews are
recommended by Dijkstra and Zouwen (1982) as a relatively easy way
to obtain data on attitudes, opinions, motivation and other
characteristics that are not directly observable.
183
However, personal interviews can be subject to interview bias.
In order to avoid a bias problem in this study, the researcher
asked the respondents to fill in the questionnaires by themselves
(with the interviewer present). However, the researcher was forced
to record the non-educated respondents' answers.
6.7. SAMPLING PLAN:
Luck et al (1982) propose three useful steps in drawing up a
sampling plan, they are:
(1) Define the population from which the sample is to be drawn.
(2) Establish a frame of that population.
(3) Choose the method of selecting the sample units (i.e,
probability, nonprobability.
(4) Determine the size of sample that is needed.
6.7.1. DEFINING THE POPULATION:
When the research objectives are thought out, the target
population definition is a part of them (Aaker and Day 1983). Each
objective should contribute to refining the definition of the
population. Sudman (1976) suggested at least two basic steps in
defining the population under study. The first step, is to decide
whether the population is of individual households, or some other
categories. The second step, is to decide the unit to use. In order
to do that, he suggested the following criteria for consideration.
(i) Gemmel:thy:
The population of this study was defined as all households,
regardless of whether a single individual or family, and the survey
population was defined as those living in the capital Cairo and
184

Giza city. The reasons for limiting the study to those areas were
to save time and cost as well as to enhance the efficiency of the
administration of the survey.
(ii) Age Of Individual:
Sudman (1976) suggested the minimum age is usually 18 for
attitude research. The age categories of this study began at 18
years of age (see questionnaire design, appendix 1)
(iii) Other Demographic / Socio-economic variables:
Sex, marital status, family size and education, were defined
carefully by different categories (see appendix 1)
(IV) Household Variables:
If the unit of analysis chosen was the household. The sampling
frame included only the Egyptian households who had purchased or
used a medicine over the twelve months preceding the period of
field study (between August and October, 1989).
6.7.2. SAMPLE SIZE:
According to the latest population census in 1990, the whole
population of Egypt is 55 million people. Cairo includes about a
quarter of the whole population (i.e, close to 14 million), while
Giza includes about 3 million. Usually, there are two ways to
determine sample size as Tull and Hawkins (1987) state. First, is
to set an arbitrary size within the constraint of the research
budget, and to measure the precision of the sample at the analysis
stage, if probability sampling is used. Second, is to calculate the
optimum sample size given a desired level of precision and cost
according to the standard error formula. Sudman (1976) indicated
185
;.
that, the most common sample size used for attitudes research range
from 400 to 1000. It should be remembered that the size of
population has no direct effect on the size of sample (Churchill
1987).
We decided on a sample of 1300. This was as big as possible
within constraints of time and cost. since the researcher was
allowed by the Egyptian government only three months (from August
to October, 1989) to collect the data from Egypt.
6.7.3. SAMPLE PROCEDURES:
There are many different procedures by which researchers may
select their samples. We decided therefore, on using a probability
sample for two reasons as Brown (1980) demonstrates.
(1) Probability sampling is the only method that provides
essentially unbiased estimates and measurable precision.
(2) Probability sampling permits the researcher to evaluate in
quantitative terms.
In the absence of a readily available sample and their
distribution over different districts of Cairo and Giza, it was
decided to use a random multi-stage area sample. This type was
found appropriate to the nature and the purpose of research. In
this form of sampling the clusters were made up of individual units
which constituted mutually exclusive and exhaustive categories.
From these clusters, the researcher randomly selected those
categories to be included in the sample.
A multi-stage area sample is much less statistically efficient
than simple random sample. Kinnear and Taylor (1987) indicate that
in a simple random sample a single sampling error can be
calculated. A two-stage, area sample is subject to two sampling
186
x
errors. The authors therefore suggested two ways by which the
multi-stage area sample error will decrease, by an increase in (a)
sample size, (b) homogeneity of the elements being sampled. So, the
sample size of this research was already large enough (i.e, 1300),
and several stages were developed which achieved homogeneity (i.e,
small number of elements within each stage).
It should be noted that the sampling procedures were dependent
on the classification and geographical information about population
in Cairo and Giza. This information was obtained in advance by
contacting the Central Agency For Public Mobilisation And
Statistics in Cairo. Thereby, the researcher conducted the survey
as follows:
First step was developing a random sample of geographic areas in
Cairo and Giza.
Second step was selecting a random sample of suburbs within those
geographic areas.
Third step was to select streets randomly from each suburb.
Fourth step, each street was weighted by the number of house-
units, then the houses selected randomly.
Fifth step, a random sample of households in each house was
obtained.
The respondent was not necessarily the head of the household.
The member of the household who answered the door to the
interviewer was interviewed, providing he / she was 18 years old
and over. This was a deliberate move to ensure that different
categories of the population e.g. women and young people were
adequately represented in the sample.
Table 6.1 displays the percentages of the composition of the
sample size.
187
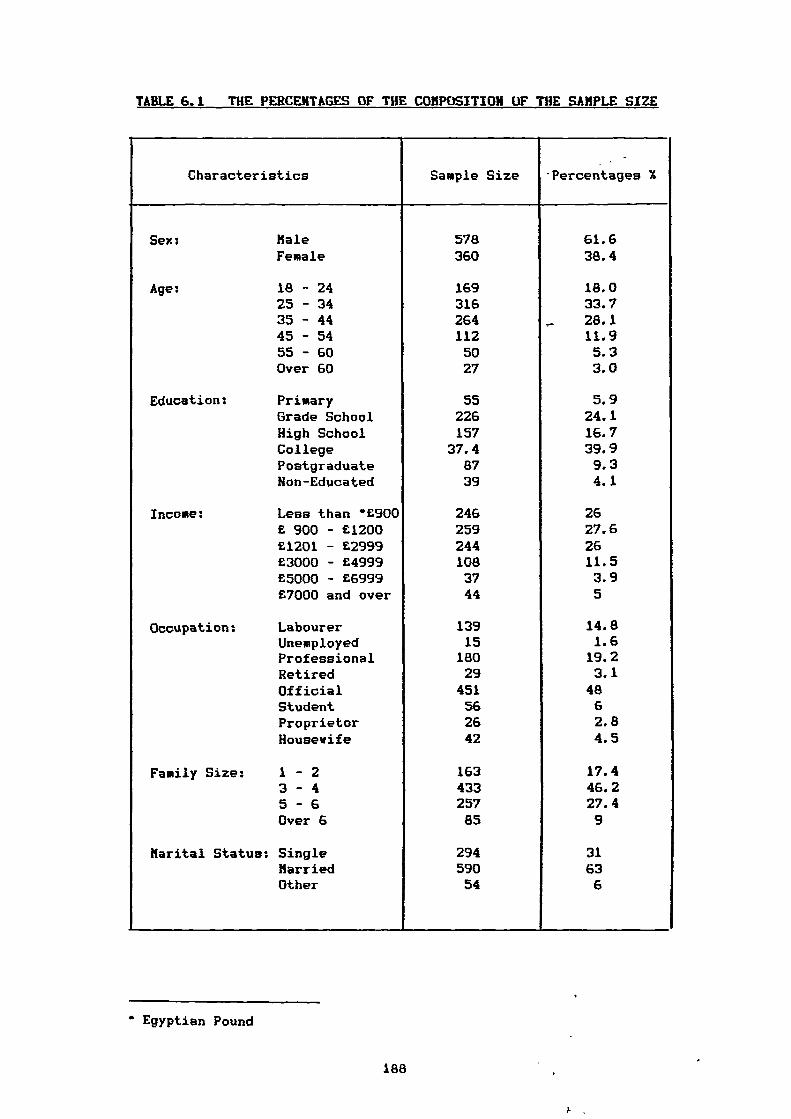
TABLE 6.1 THE PERCENTAGES OF THE COMPOSITION OF THE SAMPLE SIZE
Characteristics Sample Size. -
. Percentages X
Sex: Male 578 61.6Female 360 38.4
Age; 18 - 24 169 18.025 - 34 316 33.735 - 44 264 ,- 28.145 - 54 112 11.955 - 60 50 5.3Over 60 27 3.0
Education: Primary 55 5.9Grade School 226 24.1High School 157 16.7College 37.4 39.9Postgraduate 87 9.3Non-Educated 39 4.1
Income: Less than *£900 246 26£ 900 - £1200 259 27.6£1201 - £2999 244 26£3000 - £4999 108 11.5£5000 - £6999 37 3.9£7000 and over 44 5
Occupation: Labourer 139 14.8Unemployed 15 1.6Professional 180 19.2Retired 29 3.1Official 451 48Student 56 6Proprietor 26 2.8Housewife 42 4.5
Family Size: 1 - 2 163 17.43 - 4 433 46.25 - 6 257 27.4Over 6 85 9
Marital Status; Single 294 31Married 590 63Other 54 6
• Egyptian Pound
188
6.7.4. SAMPLING CONTROL:
Sampling control refers to the ability to collect information
from a sample that adequately represents relevant segments of
population of interest. Green and Tull (1978) pointed out that the
degree to which data can be obtained from a representative sample
in a questionnaire administration on two attributes:
(1) The ability to identify and reach appropriate sample
respondents.
(2) The ability to secure cooperation from each respondent
contacted.
Further, Kinnear and Taylor emphasise that personal interviews
allow a substantial level of control. Despite this, there is
evidence to suggest that the potential for sample control in
personal interviewing is seldom realised because such control may
be quite expensive (Tull and Hawkins 1987).
In this study care was taken to identify appropriate
respondents as explained in sampling procedures (section 6.7.3). To
try to reach the respondents selected, sometimes the researcher had
to go to the work location for interviews. Cooperation was secured
by putting respondents at their ease by discussing the purpose of
the research and stressing confidentially.
189
A
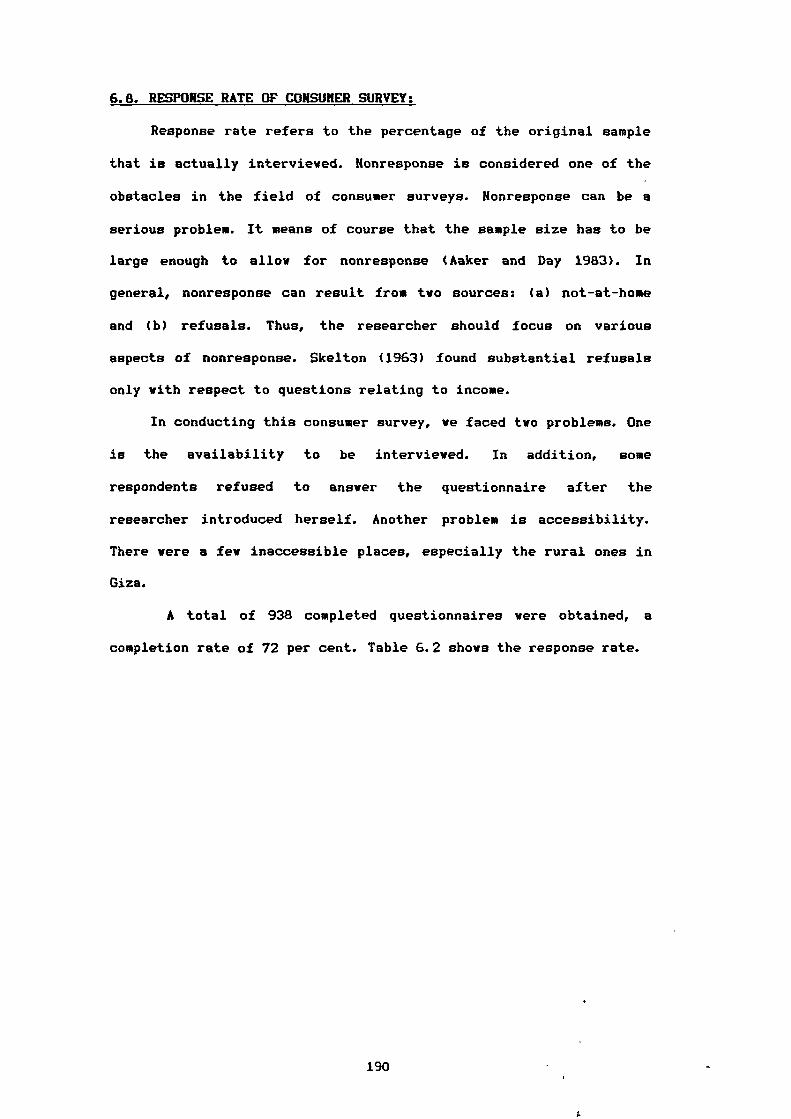
6.8. RESPONSE RATE OF CONSUMER SURVEY:
Response rate refers to the percentage of the original sample
that is actually interviewed. Nonresponse is considered one of the
obstacles in the field of consumer surveys. Nonresponse can be a
serious problem. It means of course that the sample size has to be
large enough to allow for nonresponse (Aaker and Day 1983). In
general, nonresponse can result from two sources: (a) not-at-home
and (b) refusals. Thus, the researcher should focus on various
aspects of nonresponse. Skelton (1963) found substantial refusals
only with respect to questions relating to income.
In conducting this consumer survey, we faced two problems. One
is the availability to be interviewed. In addition, some
respondents refused to answer the questionnaire after the
researcher introduced herself. Another problem is accessibility.
There were a few inaccessible places, especially the rural ones in
Giza.
A total of 938 completed questionnaires were obtained, a
completion rate of 72 per cent. Table 6.2 shows the response rate.
190
1.
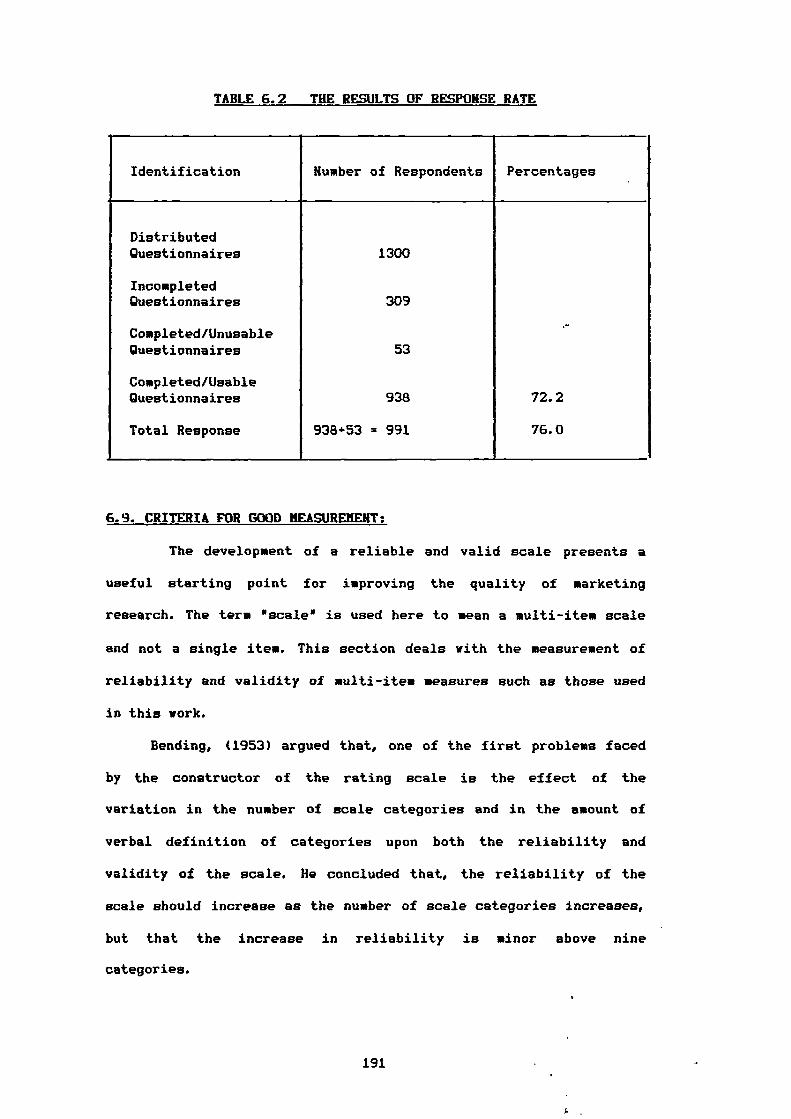
TABLE 6.2 THE RESULTS OF RESPONSE RATE
Identification Number of Respondents Percentages
DistributedQuestionnaires 1300
IncompletedQuestionnaires 309
,Completed/UnusableQuestionnaires 53
Completed/UsableQuestionnaires 938 72.2
Total Response 938+53 = 991 76.0
6.9. CRITERIA FOR GOOD MEASUREMENT:
The development of a reliable and valid scale presents a
useful starting point for improving the quality of marketing
research. The term "scale' is used here to mean a multi-item scale
and not a single item. This section deals with the measurement of
reliability and validity of multi-item measures such as those used
in this work.
Bending, (1953) argued that, one of the first problems faced
by the constructor of the rating scale is the effect of the
variation in the number of scale categories and in the amount of
verbal definition of categories upon both the reliability and
validity of the scale. He concluded that, the reliability of the
scale should increase as the number of scale categories increases,
but that the increase in reliability is minor above nine
categories.
191

Reliability and validity provide the essential language of
measurement (Carmines and Zeller 1979) and the distinction between
them is worthy of mention. Churchill (1987) distinguishes between
reliability and validity. Whereas validity is represented in the
agreement between two attempts to measure the same trait through
maximally different methods, reliability is the agreement between
two efforts to measure the same trait through maximally similar
methods. More simply reliability refers to consistency, the
ability to obtain the same results again, while validity tells us
whether the question or item really measures what it is supposed to
measure (Oppenheim 1966). Kinnear and Taylor (1987) distinguish
between validity and reliability in terms of errors of measurement.
Whilst the validity of a measure refers to the extent to which the
measurement process is free from both systematic and random errors,
the reliability of a measure refers to the extent to which the
measurement is free from random errors.
Obviously, measurement error can be in the form of either a
systematic bias or random errors. The error score is increased or
decreased from the true score resulting from measurement error.
Measurement error is the source of unreliability error (random
error) and its primary cause is that items in the scale are not
measuring the same phenomenon (Peter 1979). "Random error of
measurement are never completely eliminated, but to portray nature
in its ultimate lawfulness, efforts are made to reduce such errors
as much as possible, since the extent to which measurement error is
slight, a measure is said to be reliable' (Hunnally 1967). In other
words, the amount of random error is inversely- related to the
degree of reliability of the measurement instrument. Systematic
error has an effect on the measuring instrument. Such error lies at
.192

the very heart of validity, for such error prevents indicators from
representing what they are intended to: the theoretical concept
(Carmines and Zeller 1979).
High reliability does not necessarily mean high validity,
because validity can not rise above a certain point if the measure
is inconsistent to some degree (Oppenheim 1966). Hunnally (1967)
added that, the amount of measurement error places a limit on the
amount of validity that an instrument can have. Reliability is a
necessary but not sufficient condition for validity. In general, if
a measure were valid, there would be little need to worry about its
reliability, because a valid measurement is free from errors.
Conversely, a measure could be reliable and still not valid.
Carmines and Zeller (1979) emphasise that, reliability is basically
an empirical issue, focusing on the performance of empirical
measures. Validity in contrast, is usually more of a theoretical
issue because it inevitably raises the question 'valid for what
purpose'.
In this context, we explain below the different approaches to
the estimation of reliability and validity.
6.9.1. RELIABILITY:
The achievement of scale reliability is of course dependent
upon how consistent are the characteristics being measured, and how
stable the characteristics remain over time (Green and Tull 1978).
If a replication of the same technique on a similar population did
not yield the same measurement as the first data gathering, it
would mean that it is marked by random errors (Luck and Rubin
1987). To ascertain reliability, Oppenheim (1966) distinguished
between two kind of questions: (a) factual questions, and (b)
193

attitudinal questions. In the case of factual questions, he
suggested a number of internal ckecks, but so as not to annoy the
respondent, one must refrain from asking the same questions
repeatedly in the same way. Since attitudinal questions are more
sensitive than factual questions to changes in content, and so on,
it becomes almost impossible to assess reliability by asking the
same question in another form. For this reason, marketing
researchers should not rely on single-item measures when they come
to measure attitudes. They should gain the advantage of multi-item
scales that allow measurement errors to cancel out against each
other, and thus the reliability of the scale can be increased
(Peter 1979). There are three basic methods for assessing the
reliability of a measurement scale: test-retest, alternative forms
and internal consistency (i.e, spilt half and alpha correlation
coefficient).
Test-retest of reliability estimates (measure of stability)
are obtained when the same scale is measured under two or more
similar situations. The results of two separate administrations are
then compared by computing the correlation coefficient on an item-
by-item basis. The smaller the differences between corresponding
items, the higher the reliability. However, a number of practical
and computational difficulties are involved in measuring test-
retest reliability. First, different results may occur depending
upon the length of time between measurement and remeasurement. In
general, the longer the time interval, the lower the reliability
estimate (Bohrnstedt 1977). Second, some items can be measured only
once for example, initial reaction to an new advertisement (Tull
and Hawkins 1987). Third, factors extraneous to the measuring
process may cause shifts in the characteristic being measured. For
194

example, a favourable experience with a brand during the period
between the test and re-test might cause a shift in an individual's
rating of that brand (Tull and Hawkins 1987). Fourth, the problem
of reactivity which refers to the fact that sometimes the very
process of measuring a phenomenon can induce change in the
phenomenon itself (Carmines and Zeller 1979). In such situations,
there is no way to distinguish between change and unreliability
(Peter 1979).
These four problems may operate to increase or decrease the
measured reliability coefficient. In addition to the elapsed time
between the two tests.
The alternative forms method involves giving the respondents
two forms which are judged equivalent, but are not identical
(Kinnear and Taylor 1987). Hence, the basic logic of this approach
is similar to the test re-test. The alternative form method
requires two testing situations with the same people, but
alternative forms of the same test are administered. The
correlation between the alternative forms provides the estimate of
reliability (Carmines and Zeller 1979). Two basic limitations are
involved in this approach. First, is the extra time, expense and
trouble involved in obtaining two equivalent forms (Tull and
Hawkins 1987). Second, is the practical difficulty of developing
equivalent alternative forms that are parallel.
Internal consistency estimates of reliability based on the
average correlation among items within a test said to concern the
'internal consistency' (Hunnally 1967). Internal consistency is
estimated by the intercorrelation among the scores of the items on
a multiple-item index. All items must be designed to measure
precisely the same thing (Tull and Hawkins 1987). The earliest and
195

simplest type of internal consistency of a set of items is the
split-half reliability, the total set of items is divided into
equivalent groups (say, odd versus even numbers). The total scores
for the two halves are correlated and this is taken as the measure
of reliability of the instrument (Churchill 1987). Though spilt-
half is a basic form of internal consistency estimate, there is one
problem with using it; that is, correlation coefficients between
halves will vary depending on how the items are divided into
halves.
Thus, none of the above approaches of reliability estimates
were used in this study. It seemed more sensible to the researcher
to utilise the alpha correlation coefficient method. McKennell
(1978) reminds us that 'alpha is a label given by Cronbach (1951)
to a particular type of coefficient which measures the reliability
of a test or item battery, in the special sense of its internal
consistency'. "Coefficient alpha absolutely should be the first
measure one calculates to assess the quality of the instrument'.
"It is pregnant with meaning because the square root of coefficient
alpha is the estimated correlation of a K-item test with errorless
true scores" (Hunnally 1967).
Cronbach's Alpha is the most commonly accepted formula for
assessing the reliability of a measurement with multi-point items
(Peter 1979). Tull and Hawkins (1987) have also recommended the use
of Cronbach's Alpha Coefficient to measure internal consistency.
Therefore, it was decided to assess the reliability of the
satisfaction scale in this study by employing Cronbach Alpha
Coefficient. A low coefficient alpha indicates the sample of items
performs poorly in capturing the construct which motivated the
measure. A large alpha indicates that the K-item test correlates
196
x
well with true scores and the scale can be quite reliable
(Churchill 1979).
Regarding the acceptable level of the alpha coefficient, the
literature reveals some arguments. Levels of 0.5 to 0.6 were
recommended by Hunnally (1967) for early stages of basic research.
While Churchill and Peter (1984) stress that a value of 0.6 or less
is usually viewed as unsatisfactory. Carmines and Zeller (1979)
believe that the reliability should not be below 0.8 for a widely
used scale.
6.9.2. VALIDITY:
Validity is one of the important facets involved in
evaluating the worth of a scale. The validity of a scaling
procedure can be viewed in terms of its freedom from systematic
error. According to Green and Tull (1978) systematic error may
arise from the instrument itself, the user of the instrument, the
subject or the environment in which scaling procedure is being
administered. Although random error reduces the validity of any
measuring instrument, far more important in validity assessment is
systematic error (Carmines and Zeller (1979). Further, systematic
error does not yield easily to statistical solution.
Therefore, validity is a broader and more difficult problem
than reliability. Holbert (1974) emphasised this difficulty, noting
that validity is seldom reported in marketing research at least not
in ways useful to practitioners. Perhaps this is because there is
no simple and certain way to assure the validity of marketing
research.
197

Validity is classified into three forms: content validity
(face validity), construct validity and criterion-related validity
(concurrent/predictive validity).
Churchill (1987) explains the assessments of content validity
by examining the measure with an eye towards ascertaining the
domain of the characteristic that is captured by such a measure.
Churchill argues that the researcher can never guarantee the
content validity, but he can diminish the objection of the critics.
The key to content validity lies in the procedures that are used to
develop the instrument. However, Carmines and Zeller (1979) stress
the limitations of content validity in attitude measurement. One,
is the difficulty to deal with any abstract theoretical concept
including most topics in attitude studies since the theoretical'
concepts in the social sciences have simply not been described with
the required exactness. Another, is that in measuring most concepts
in social science, it is impossible to sample content.
Construct validity is directly concerned with the question of
what the instrument is, in fact, measuring. Construct validity is
evaluated by investigating what qualities a test measures, that is,
by determining the degree to which certain explanatory concepts or
constructs account for performance on the test (Bohrnstedt 1977).
Bohranstedt further indicates that, studies of construct validity
are done to validate the theory underlying the scale, score or test
constructed. Construct validity requires that the researcher should
have a sound theory of the nature of the concept (Tull and Harkins
1987). However, constructs vary widely in the extent to which the
domain of related observable variables is large or small. The
larger the domain of observables related to a construct, , the more
difficult it tends to be to define which variables belong or do not
198
in the domain (Hunnally 1967). Campbell and Fiske (1959) suggested
two types fall under the heading of construct validity they are:
convergent validity and discriminant validity. Tull and Hawkins
(1987) explain the role of those kinds of construct validity.
Whereas convergent validity is generally ensuring that the measure
correlates positively with other measure of the same construct,
discriminant validity ensures that the measure does not correlate
with theoretically unrelated constructs. Lehmann (1989) gives a
further explanation of convergent validity stating that a measure
has convergent validity if it follows the same patterns as other
measures of the same construct. For example, three different
measures of attitude would be said to have convergent validity if
they were highly correlated with each other. A construct should
also possess a discriminant validity, which means the construct
should be sufficiently distinct from other constructs to justify
its existence (Peter 1981). It is quite clear that, construct
validity is the most difficult to pursue for scale construction.
Criterion-related validity is ascertained by correlating one's
measure with a direct measure of the characteristic under
investigation. Criteria are generally divided into those which are
concurrent and those which are predictive on the basis of the
element time (Hohrnstedt 1977). Heller and Ray (1972) reported that
attitude-behaviour research shows some of the shortcomings of
predictive validity in determining the meaning of marketing
measures. Generally speaking, measure validation is practical, but
seldom used, especially when new measures of marketing phenomenon
are proposed.
The researcher attempted to achieve content validity in this
study through three different methods. First, the literature was
199
searched to determine how each variable is defined and used (e.g.,
packaging, labelling, pricing). In addition, some items were
formulated that represent each variable. For example the first
seven items in the questionnaire represent packaging (see
questionnaire design in appendix 1). Second, the pilot study which
was done to enable us to check the face validity of the attitudinal
variables, so that the variables used were appropriate to the
domain of medicine products. Third, in order to achieve content
validity for the factual questions, we compared the classification
categories of the designed questionnaire with the classification
census figures through the Central Agency For Public Mobilization
And Statistics.
6.10. SUMMARY:
The theme of this chapter is the research design. Secondary
and primary data were required. The researcher relied on libraries,
external data from the government and the pharmaceutical companies
for secondary data. The research is however built basically on
primary data.
Exploratory research was carried out to define the problem and
build the objectives and hypotheses of the study. A large empirical
study vas then used to find answers to the research questions.
Because the questionnaire is an integral part of the research
design, consideration was given to the choice of phrasing,
sequencing, structure and instruction.
Two scales of attitude measurement were used in this study
(itemized rating scale and Likert scale). There were explained in
this chapter.
200

In collecting the research data, the researcher adopting face
to face personal interviews via structured questionnaire. Good
results were obtained with response rate of 72.2 per cent.
Regarding the design of sample, a random multi-stage area
sample of 1300 consumers was chosen. Respondents were selected from
two cities (Cairo, Giza).
Finally, the chapter concluded with an explanation of
reliability and validity. The three basic methods of reliability
were mentioned and details were given of Cronbach's Alpha which
was used to test the scale of satisfaction in the context of the
research findings. Also, the three major approaches of validity
were presented, the methods used to attempt to achieve valid
findings were explained.
201
CHAPTER SEVEN
MULTIVARIATE TECHNIQUES
OF ANALYSIS
7.1. Introduction.
7.2. Factor Analysis.
7.2.1. Factor Analysis Input / Output.
7.2.2. Extracting Initial Factors.
7.2.3. Determination Of The Appropriateness Of Factor Analysis
7.2.4. Advantages Of Factor Analysis.
7.2.5. Use Of Factor Analysis In This Study.
7.3. Cluster Analysis.
7.3.1. Cluster Analysis Measures.
7.3.1.1. Euclidean Distance Measures.
7.3.1.2.. Similarity Measures.
7.3.2. Hierarchical Clustering Procedures.
7.3.3. Deciding On The Number Of Clusters.
7.3.4. Use Of Cluster Analysis In This Study.
7.4. Multiple Regression Analysis.
7.4.1. Multicollinearity And Related Problems.
7.4.2. Multiple Regression Analysis Using Dummy variables.
7.4.3. Use Of Regression Analysis In This Study.
7.5. Statistical Tests Of The Research Hypotheses.
7.5.1. Friedmans"Two-Way" Analysis Of Variance By Ranks.
7.5.2. Analysis Of Variance ANOVA "F-Ratio".
7.5.3. T-Test.
7.6. Summary.
202
7.1. INTRODUCTION:
Hultivariate methods are consistent with modern marketing
concepts, and the pressing need of marketing research is the
ability to analyse complex data.
It is useful to draw a distinction between the two approaches
of multivariate analysis namely "dependence / interdependence'. In
the latter we are interested in how a group of variables are
related among themselves, no one being marked by the condition of
the problems as of greater prior importance than the others.
Whereas, in the analysis of dependence we are interested in how a
certain special group 'the dependent variables' are designated as
being predicted or explained by a set of independent variables.
Now, there is a growing understanding in marketing research of
the need for, and usefulness of multivariate data analysis
procedures. Kinnear and Taylor (1987) stated two reasons for this
trend. First, marketing problems are usually not completely
described by one or two variables. Many variables combine to yield
marketing outcomes. Second, the advent of the high-speed computer
and associated analysis software has made the solution of
multivariate statistical procedures relatively easy.
The research objectives were first addressed by applying three
different multivariate analysis techniques: factor analysis,
cluster analysis and multiple regression analysis.
All techniques used are well documented by texts and articles.
It is the intention here to give only a brief overview of each
technique and how it was used in this work.
203
r.

7.2. FACTOR ANALYSIS:
Factor analysis is an interdependence multivariate technique
which was used to accomplish the first objective "to identify and
quantify the key elements that underlie consumer satisfaction with
medicine products in Egypt'. Factor analysis is concerned with the
identification of structure within a set of observed variables. It
addresses itself to the study of interrelationships among a set of
variables,.as an attempt to find factors that provide a dimensional
structure of data (Stewart 1981). One can look at each factor as
the dependent variable which is a function of observed variables.
In other words, factor analysis focuses on the whole set of
interrelationships displayed by the number of variables.
In applying factor analysis one is interested in examining the
strength of the overall association among variables in terms of
smaller set of linear composites of the original variables that
preserve most of the information in the full data (Aaker and Day
1983). In other words, (Massy et al 1968) the factor analysis
procedure involves finding a way of linearly transforming the
original variables into a new smaller set of independent factors,
which multiplied together in a special manner will produce the
original correlation matrix as closely as possible.
Factor analysis can be applied for two major functions. One
function, is to identify underlying constructs in the data (Aaker
and Day 1983), by deriving dimensions in the data which combine
each group of similar variables under specific termed factors. A
second function of factor analysis is simply to reduce a large
number of variables to a more mangeable set (Brown 1980). The
smaller set of variables express that which is common among the
original variables. Generally speaking, factor analysis can be
204
x
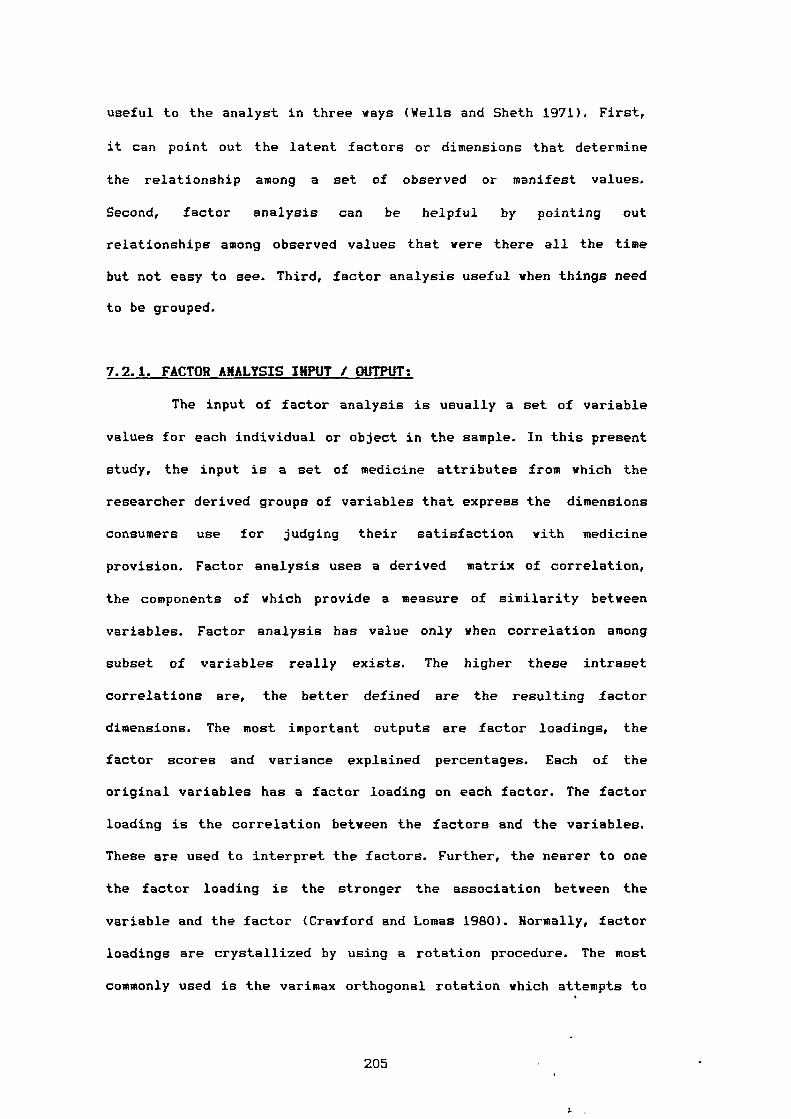
useful to the analyst in three ways (Wells and Sheth 1971). First,
it can point out the latent factors or dimensions that determine
the relationship among a set of observed or manifest values.
Second, factor analysis can be helpful by pointing out
relationships among observed values that were there all the time
but not easy to see. Third, factor analysis useful when things need
to be grouped.
7.2.1. FACTOR ANALYSIS INPUT / OUTPUT:
The input of factor analysis is usually a set of variable
values for each individual or object in the sample. In this present
study, the input is a set of medicine attributes from which the
researcher derived groups of variables that express the dimensions
consumers use for judging their satisfaction with medicine
provision. Factor analysis uses a derived matrix of correlation,
the components of which provide a measure of similarity between
variables. Factor analysis has value only when correlation among
subset of variables really exists. The higher these intraset
correlations are, the better defined are the resulting factor
dimensions. The most important outputs are factor loadings, the
factor scores and variance explained percentages. Each of the
original variables has a factor loading on each factor. The factor
loading is the correlation between the factors and the variables.
These are used to interpret the factors. Further, the nearer to one
the factor loading is the stronger the association between the
variable and the factor (Crawford and Lomas 1980). Normally, factor
loadings are crystallized by using a rotation procedure. The most
commonly used is the varimax orthogonal rotation which attempts to
205

produce some high loadings and some near zero loadings on each
factor.
Thus, the varimax orthogonal technique leads to a new set of
uncorrelated factors. The interpretability of factors is
facilitated when individual factor loadings are high or low
(Cattell 1978). Aaker (1971) also reminds us that while it attempts
to maximize the number of factor / variables correlations that are
either high or low, it also minimizes the number of factors with
which a variable is associated.
One output of most factor analysis programs is factor scores
which can be used as input to other multivariate techniques which
require the input variables to be uncorrelated (e.g, cluster
analysis, multiple regression analysis, multiple discriminant
analysis). This is not always satisfactory, because a factor score
contains elements of the variables which do not load heavily on
that factor. Frequently, a variable is chosen that has the highest
loading on the factor to represent the factor and respondents
scores on that variable are used as input to further techniques
(Hair et al 1987). Alternatively, a weighted average of the scores
of all the variables loading heavily on a factor can be used.
The percent of variance-explained by the factors helps to
determine the number of factors to include and the quality of their
representation of the original variables. Luck and Rubin (1987)
suggested that if a factor has an eigenvalue greater than one, it
is candidated for further interpretation.
206
7.2.2. EXTRACTING INITIAL FACTORS:
Principal components analysis is the most commonly used
technique in marketing for extracting initial factors. The main
reason for its popularity is that, unlike some of the less
structured factor analytical procedures, it leads to unique
reproducible results (Crawford and Lomas 1980).
The extracted factors should adequately explain the
correlation among the observed variables in best linear
combination. The best combination is in the sense that the
particular combination of original variables would account for more
of the variance in the data as a whole than any other linear
combination of variables (Hair et al 1987).
In using factor analysis the researcher must in one way or
another specify the number of factors to be considered, since, we
normally begin an analysis without knowing how many factors or
which factors underlie a set of manifest variables. Jackson (1983)
stresses the importance for the investigator not to leave out any
important factors. If this happens, the results will be basically
worthless. On the other hand, if the researcher instructs the
program for many factors more than the important ones, those
factors will appear on the program output but contribute little to
the explanatory power of the factor model.
In fact, carrying the analysis too far has penalties, it is
wasteful of computer time as well as obscures the meaning of the
findings. Corsuch (1973) and Luck and Rubin (1987) suggest that the
extraction process should stop when all factors with eigenvalue
greater than 1 have been removed. The rationale for the eigenvalue
to be not less than 1 is that any individual factor should account
207
for at least the variance of a single variable, if it is to be
retained for interpretation (Hair et al 1987).
7.2.3. DETERMINATION OF THE APPROPRIATENESS OF FACTOR ANALYSIS:
Stewart (1981) stated several useful methods for determining
whether a factor analysis should be applied to a set of data.
First, is the examination of the correlation matrix. If the
correlation coefficients are small throughout the matrix, factoring
may be inappropriate. Second, a plot of latent roots obtained from
a factoring procedure should ordinarily contain at least one sharp
break. This break may represent the point where residual factors
are separated from the true factors. Third, an examination of
communality estimates should reveal moderate to large
communalities. Consistently small values may be an indication that
factor analysis is inappropriate.
7.2.4. ADVANTAGES OF FACTOR ANALYSIS:
Factor analysis has two major advantages:
1) Summarization of correlated variables into a set of
explanatory factors to remove collinearity in subsequent
regression or discriminant analysis. In other words, this is
a way to minimize the correlated variables for further research
while the amount of information in the analysis is maximized.
2) Factor analysis might be used with other analytic techniques
such as cluster analysis to group people into market
segments. More precisely, in cluster analysis individuals
are often assigned to groups on the basis of their factor
scores.
208
Factor analysis is subject to limitations, since no
statistical tests are regularly employed to test the findings,. -
despite considerable efforts expended by mathematical statisticians
to develop such tests (Green and Tull 1978). As a result, it is
often difficult to know whether the results are merely an accident
or reflect something meaningful.
7.2.5. USE OF FACTOR ANALYSIS IN THIS STUDY:
Factor analysis was used in this study to identify the
elements which are grouped under major groups (e.g, pricing,
quality). The goal was to generate combinations of sets of
variables under specific termed factors. The emphasis was on in
interpreting the significant dimensions of consumer satisfaction.
The researcher used a principal components analysis followed by
varimax rotation. Further analysis was carried out to determine the
degree of satisfaction of respondents with the major factors and to
determine those with which they are most satisfied and those with
which they are least satisfied.
7.3. CLUSTER ANALYSIS:
Cluster analysis is a multivariate technique which was applied
to attempt to accomplish the second objective "to explore the
similarity among the various categories of Egyptian consumers in
their satisfaction with the provision of medicines'. Cluster
analysis has become a common tool for marketing researchers for
developing empirical grouping of persons or products (Punj and
Stewart 1983) on the basis of their similarity to each other.
Cluster analysis searches for natural groupings among objects
described by several variables. The emphasis is on placing'together
209

those objects that are similar with respect to the variables under
study.
Cluster analysis therefore is able to classify a population of
entities into a small number of mutually exclusive groups based on
the similarity of profiles among entities. Each set of objects is
defined by the value of a set of attributes associated with them,
such that members of a cluster 'look like' each other but do not
look much like objects outside the cluster. Cluster analysis is a
statistical method of classification. Unlike other statistical
methods for classification such as discriminant analysis and
automatic interaction detection, it makes no prior assumptions
about important differences within a population (Punj and Stewart
1983). Aaker (1971) proposed that the purpose of cluster analysis
is that it is able to identify objects. The resulting objects
should have internal (within cluster) homogeneity and high external
(between cluster) hetrogeneity.
It is worth emphasising that, the primary use of cluster
analysis is in market segmentation, since all segmentation
research, regardless of the method used, is designed to identify
groups of entities (people, markets, organisations). Leasing and
Tollefson (1971) demonstrated that one approach often used is to
define segments by socio-economic and demographic characteristics
based upon the individuals attitudes, opinions, purchase
propensities, etc....
210
7.3.1. CLUSTER ANALYSIS MEASURES:
In this section, our discussion reviews the most common
approaches of measurement in the application of cluster analysis,
euclidean distance measures and similarity measures.
7.3.1.1. EUCLIDEAN DISTANCE MEASURES:
Although many studies have been done using euclidean
distance as a measure of difference between individuals it is
theoretically only applicable under certain conditions. The
condition which most concerns us according to Inglis and Johnson
(1970) is that, it measures distance between items in a space with
uncorrelated axes. In marketing research studies attitudes, which
are frequently accepted as being correlated, represent the axes. In
addition, Aaker (1971) reminds us that distance measures are
usually restricted to instances in which the objects to be measured
are interval-scaled. Thus there are limitations in using euclidean
distance measures.
7.3.1.2. SIMILARITY MEASURES:
Similarity measures are often used in clustering when the
characteristics of each object are only nominally scaled. These
measures are flexible since they can handle nominal, ordinal and
interval scaled data. Moreover, similarity measures are generally
less sensitive to the impact of single characteristics on the
resultant dissimilarity of two objects than are the euclidean
distance measures. On the other hand, similarity measures have a
set of limitations (Aaker and Day 1983). First, if a large number
of characteristics are involved, objects which match may do so for
accidental reasons reflecting the noise in the data. Second, if
211

some variables are dichotomous and others are multichotomous the
two-state attributes will tend to be more heavily weighted in the
similarity measures. Third, if continuous data are separated in
order to similarity, valuable information can be lost.
7.3.2. HIERARCHICAL CLUSTERING PROCEDURES:
Once the cluster analysis measures have determined, the
clustering can begin. Several approaches are possible. Hierarchical
clustering procedures are widely used in marketing studies to place
similar objects into groups or clusters. There are basically two
types of hierarchical clustering procedures, agglomerative and
divisive methods. Agglomerative methods 'bottom-up' are the most
commonly used computer packages.
The divisive method "top-down' starts with all objects in
one cluster and divides and subdivides them until all objects are
in their own single-object clusters (Aaker and Day 1986).
Agglomerative methods in contrast, begin with the computation of a
similarity or distance matrix between the entities and end with a
dendrogram at the stage where all the individuals are in one group
(Everitt 1980). In other words, each object or observation starts
out as its own cluster, and the two that are most alike are then
combined to form a new composite cluster. In subsequent steps, the
two clusters are then compared to find the next most alike pair,
then they are combined. This sequence is repeated until all the
original clusters / respondents have been combined into one
(Saunders 1980). Five popular agglomerative procedures used to
develop clusters are: single linkage, complete linkage, average
linkage, Ward's method and the centroid method.
212

Regarding the first two methods (i.e, single and complete
linkage), single linkage first joins the two objects which are the
most similar. The distance similarity between objects is then
systematically scanned and objects are joined as the scanning level
(distance) is raised. The single linkage algorithm links an object
with any other object or cluster of objects if the distance between
the pair of objects or any member in the cluster is equal to the
scanning level. Similarly, two clusters join when any pair of
objects (from each cluster) have a distance equal to the scanning
level. Complete linkage on the other hand, requires that, an object
joining a cluster at certain scanning level must have relations at
that level with every member of the cluster (Churchill 1987).
Average linkage is an attempt to walk a middle ground between
the single and complete methods. The average of all similarities
between an object and a class of objects or between the members of
two classes has to be above the given level for linkage to occur
(Churchill 1987). This method defines distance between groups as
the average of distance between all pairs of individuals in two
groups (Everitt 1980). In addition, in the average linkage method
each member of a cluster has a smaller average of dissimilarity
with other members of the same cluster than with members of any
other cluster (Maurice 1983).
Ward's method is another hierarchical clustering method based
on within group variance rather than linkage (Anderberg 1973).
That method is designed to optimise the minimum variance within
clusters, which is known as error BUM of squares (Aldenderfer and
Blashfield 1984). Anderberg ( 1973) added that, Ward's method may
or may not give the minimum possible sets of clusters formed from
213

the data. However, the solution is usually very good even if it is
not optimum on this criterion.
In the centroid method, every time individuals are grouped, a
new centroid (mean) is computed. Cluster centroids migrate every
time a new individual or group of individuals is added to an
existing cluster (Hair et al 1987).
Regarding the mechanism of each of the above methods, the
complete linkage algorithm is particularly suited to finding very
tight compact and homogeneous clusters under the similarity-
within-clusters objective. Complete linkage is poorly suited for
finding naturally separated but nonhomogeneous clusters, while
single linkage methods which form straggling clusters, are poor at
finding homogeneous groups (Jackson 1983). Average linkage measures
all combinations of pairs between two clusters thus it tends to
form spherical clusters. The centroid method is popular but
exhibits chaining. The mean position of subjects in a cluster (the
centroid) is calculated and the distance between the centroids is
the measure of alikeness. Ward's method like the centroid method is
only suitable for use with distance measures and forms spherical
clusters (Saunders 1980).
Overall, every analyst should keep in mind that the objective
underlying each method is the same, to assign objects to groups so
there will be as much similarity within groups and as much
difference among groups as possible (Churchill 1987). The results
of a particular cluster analysis therefore, must be interpreted in
the context of a particular situation and the particular purpose of
the analysis (Jackson 1983).
214
x
7.3.3. DECIDING ON THE NUMBER OF CLUSTERS:
A crucial step in cluster analysis is to decide on the
number of clusters. Nair (1986) demonstrated that a trade-off has
to be made between an accurate identification of distinct subgroups'
among the population and a limitation to a manageable number of
clusters. Several authors have suggested (Friedman and Rubin 1967)
that the appropriate number of clusters should be taken from the
point where further combining of clusters gives a large increase in
the error sum of squares. Aaker and Day (1983) state several
possible approaches in the determination of the appropriate number
of clusters. First, the analyst can specify in advance the number
of clusters. Second, the analyst can specify the level of
clustering with respect to the average within cluster similarity by
establishing a certain level that 'would dictate the number of
clusters. Third, is to determine the number of clusters from the
pattern of clusters generated by the program.
7.3.4. USE CLUSTER ANALYSIS IN THIS STUDY:
In this study, hierarchical grouping methods of single,
complete, average and Ward's were utilized using factor scores of
individuals and statements as input to attempt to develop segments
of respondents whose profiles of satisfaction / dissatisfaction
with various attributes of medicine provision are similar within
each segment and different among these segments. The homogeneity of
groups should then enable us to gain insight into characteristics
(e.g, sex, age, income) groups with different attitudes. The
results should enable us to achieve a better understanding of
consumer attitudes and opinions.
215
7.4. MULTIPLE REGRESSION ANALYSIS:
Multiple regression analysis is a multivariate dependence
technique which was used to attempt to accomplish the third
objective 'to investigate the relationship between consumption
patterns of medicines and the various characteristics of the
Egyptian consumers (i.e, demographic and socio-economic)".
Multiple regression analysis attempts to determine the
functional relationship between a single metric dependence variable
(criterion) and a number of independent (explanatory variables)
(Jain et al 1986 ). Multiple regression is the appropriate method
analysis when the researcher has a single dependent variable which
is presumed to be a function of other independent variables.
Usually, the dependent variable (criterion) is predicted by or
explained by a group of independent variables. Aaker and Day (1983)
have proposed two different concepts of independent variables on
the basis of the study goal. First, The independent variables
(explanatory) sometimes are called the predictor variables when
prediction is the goal. They help to predict values of dependent
variable (criterion). Second, they are called the explanatory
variables because they explain variation in the dependent variable.
When constructing the model, the analyst must include all relevant
variables. If an important variable is omitted, the power of the
model is reduced.
In multiple regression analysis the relationship is assumed to
be linear and additive. However, these are important assumptions.
Linearity is the assumption that for each independent variable, the
amount of change in the mean value of the dependent variable
associated with a unit increase in the independent variable
"holding all other independent variables constant" is regardiess of
216
the level of the independent variable. While, additivity is the
assumption that for each independent variable, the amount of change
in the expected value of the dependent variable associated with a
unit increase in the independent variable "holding all other
independent variables constant' is the same regardless of values of
the other independent variables in the regression equation (Berry
and Feldman 1985).
When regression analysis is used to gain understanding of the
other relationship between variables, the primary question is
'which of the independent variables has the greatest influence upon
the dependent variable'. This can be answered by obtaining the
partial regression coefficient; the Beta coefficient; which
measures the degree of association between each independent and the
dependent variable. Since, the Beta coefficients can be compared
with each other in order to evaluate the independent variables, the
larger the Beta coefficient, the stronger the impact of that
variable upon the dependent variable. In addition, the Beta weight
enables the researcher to see how well the set of explanatory
variables explain the criterion variable and to determine the most
influential explanatory variables. The coefficient of multiple
determination R2 measures the proportion of the variation in the
dependent variable (criterion) which is associated with the
variation in the explanatory variables. In summary, multiple
regression is often used to gain an understanding of the
relationship between variables by:
(1) Finding a function or formula by which we can estimate the
value of criterion variable from the predictor variables (Green
1978).
217
(2) Determining which of the independent variables has the greatest
influence upon the dependent variable (Kinnear and Taylor-
1987).
7.4.1. MULTICOLLIMEARITY AND RELATED PROBLEMS:
Multicollinearity refers to the common problem in applied
regression studies in which the independent variables (explanatory)
are highly correlated. In other words, when independent variables
are related to each other and not truly independent of each other,
multicollinearity is said to exist. Such correlation between the
explanatory variables in the regression equation makes the
identification of structural relationships difficult or impossible.
Berry and Feldman (1985) distinguish between two forms of
muticollinearity. First, is perfect collinearity in which some
independent variables regressed against the other independent
variables in the model yield an R 2 of precisely 1.00. This arises
with very small data sets (i.e, small samples). The second is less
extreme multicollinearity in which the independent variables in a
regression equation are intercorrelated but not perfectly. The
study of multicollinearity in data analysis evolves around two
major problems (Green and Tull 1978): a) how it can be deleted and
b) what can be done about it. These problems are particularly
relevant to marketing research where one often faces the dilemma of
needing a number of variables to achieve accuracy of explanatory
variables.
Muticollinearity can be dealt with by different approaches.
Tull and Hawkins (1987) suggest several ways for dealing with such
situations. First, it can be ignored particularly when
multicollinearity may be prominent in only a subset of the
218
explanatory variables and when this subset does not account for
large proportion of the variance in the data. The second approach,
is to delete one of the correlated explanatory variables if they
have a high intercorrelation with the retained variables. Third,
the correlated variables can be combined or transformed to produce
uncorrelated variables. Finally, the correlated explanatory
variables can be summarized in a set of explanatory factors using
factor analysis. Further, Kinnear and Taylor (1987) add that
another way to avoid multicollinearity is by increasing the sample
size.
7.4.2. MULTIPLE REGRESSION ANALYSIS USING DUMMY VARIABLES:
The dummy variable is a simple and useful method of
introducing into a regression model information on variables which
are not conventionally measured on a numerical scale (e.g, sex,
occupation, marital status).
Briefly, the analyst who is interpreting the output from a
regression run must pay close attention to the coding of each
variable (i.e, 0 or 1).
7.4.3. USE OF REGRESSION ANALYSIS IN THIS STUDY:
This technique was applied to investigate the relationship
between consumers' consumption patterns and consumers'
characteristics "to investigate the relationship between
consumption patterns of medicines and various characteristics of
the Egyptian consumers (i.e, demographic and socio-economic)". By
using multiple regression, the thirty five categories of
explanatory variables (demographic and socio-economic) are
regressed against each category of the dependent variable: The
219
primary interest of this technique is to determine the extent to
which the independent variables (e.g, sex, age, family size) can
explain the variation in the dependent variable (i.e, consumption
patterns), and to conclude whether these explanatory variables are
strongly related to the various consumption levels. Finally,
multiple regression allows us to determine the most important
explanatory variables explaining the variation in the dependent
variable.
7.5. STATISTICAL TESTS OF THE RESEARCH HYFOTHFARS:
There are alternative statistical tests available for any
given research design and it is necessary to employ some rationale
for choosing among them. In hypothesis testing, we must state the
hypothesized value of a population parameter before we begin
sampling. The assumption we wish to test is the null hypothesis
"Ho". A statistical test is a good one if it has a small
probability of rejecting Ho when it is true, but a large
probability of rejecting Ho when it is false. If our sample results
fail to support the null hypothesis, we must conclude that
something else is true. In other words, whenever we reject the null
hypothesis, we accept the alternative hypothesis "H i ". Siegal
(1956) indicated that there are two major considerations in
selecting a statistical test. First, the researcher must consider
the manner in which the sample was drawn and the nature of its
population. Second, the kind of scale of measurement (i.e, nominal,
ordinal, interval, ratio) which was employed in the definition of
the variables involved in the study. Luck and Rubin (1987) add
another consideration which must be taken into account in deciding
on the appropriate statistical test such as: a) how many samples
220
are involved in the problem? "one, two, or many (k) samples" b) are
the samples independent or related to each other?
In this study, the following null hypotheses were tested:
Ho (1) There are no significant differences among Egyptian
consumers with different demographic and socio-economic
characteristics on basis of their satisfaction with the
provision of medicine products.
Ho (2) There is no significant relationship among the consumption
patterns of medicine and the consumer's sex.
Ho (3) There is no significant relationship among the consumption
patterns of medicine and the various categories of
consumers' age.
Ho (4) There is no significant relationship among the consumption
patterns of medicine and the various categories of
consumers' income.
Ho (5) There is no significant relationship among the consumption
patterns of medicine and the various categories of
consumers' education.
Ho (6) There is no significant relationship among the consumption
patterns of medicine and the various categories of
consumers' occupation.
Ho (7) There is no significant relationship among the consumption
patterns of medicine and consumers' marital status.
Ho (8) There is no significant relationship among the consumption
patterns of medicine and the various categories of family
size.
In order to determine the acceptability of the above
hypotheses which derived from a theoretical basis, (see chapters 3
221
and 4) three appropriate statistical tests were selected on the
basis of the previous considerations. These tests are:
7.5.1. FRIEDMAN wTWO-WAY° ANALYSIS OF VARIANCE BY RANKS:
This test is used for the purpose of testing the significant
differences for the first hypothesis. It is a non-parametric
statistical test, and can be applied when the K samples are related
(Siegal 1956). Thus, the researcher planned to use the Friedman
test to test the output for clustering procedures. The Friedman
test is useful when the measurement of variables is on at least an
ordinal scale, and the samples have been drawn from the same
population. Most of the non-parametric tests however, apply to
ordinal scales, and the Friedman test also applies to data on a
nominal scale. Therefore, the Friedman test is appropriate to
represent the groups of consumers' variables under the various
level of satisfaction, to determine whether or not these observed
groups are different (on the basis of satisfaction level), at the
.05 significance level.
7.5.2. ANALYSIS OF VARIANCE ANOVA 'F-RATIO'
As it will be mentioned in the next chapter, the results of
cluster analysis did not show distinct groups. Our attention turned
therefore, to ANOVA to replace the Friedman- two way analysis of
variance by ranks to test the significant differences for the first
hypothesis with a level of significance of .05.
ANOVA used in this study to test the null hypothesis that
there are no significant differences among Egyptian consumers with
different demographic and socio-economic characteristics on the
basis of their satisfaction with the provision of medicine
222
products. ANOVA can find whether or not there are differences among
the various categories of each of the demographic and socio-
economic characteristic at the .05 significance level.
ANOVA is applicable when there are more than two means being
compared. Actually, the objective of ANOVA is to test the
statistical significance of differences among average responses due
to controlled variables, after allowance is made for influences on
.response due to uncontrolled variables (Churchill 1987 and Green
and Tull 1978). The basic idea of ANOVA is to compare the variation
of among-samples sum of squares to the variation of within-samples
sum of squares in terms of an F ratio (Luck and Rubin 1987). The
variation of the response within groups is assumed to consist
_ solely of random error, while the variation between groups is
mixture of random and systematic errors due to the variation in the
different intragroups (Anderberg 1973).
7.5.3. T TEST:
This test is employed for testing the other hypotheses Ho 2
to Ho 8. The T test is provided as output from the multiple
regression computer program.
A T test is a parametric statistical test. Parametric
statistical tests are the most powerful when all its assumption are
valid (Siegal 1956). All the assumptions are satisfied in this work
i.e.,:
1) The several samples have come from an identical population.
2) The observations are independently drawn from a normally
distributed population (the sample had been drawn randomly).
3) The population must have the same variance as the sample or a
known ratio of variance.
223
4) The means of these normal distributions are linear combinations
and additive.
5) The scale of measurement should be at least interval".
A T test can determine whether or not the criterion variable
(consumption pattern) i.e associated with each explanatory variable
(e.g, sex, age, income). This data is measured with a level of
significance Alpha = .05.
Finally, it is important to emphasise that, the researcher did
not develop a hypothesis for factor analysis. For this reason the
researcher did not use a statistical test. The researcher's
interest in employing of factor analysis vas:
(a) To reduce the large number of variables into a smaller set of
uncorrelated variables.
(b) To extract the underlying dimensions in the data representing
the construct under study.
7.6. SUMMARY:
Three analysis techniques increasingly being advocated in the
marketing literature for the solution of marketing research
problems were reviewed in this chapter. The chapter began by
distinguishing between the two approaches of multivariate
techniques analysis (dependence, interdependence). With respect to
the interdependence multivariate techniques, factor analysis used
to identify underlying dimensions or constructs in the data to
reduce the number of variables by eliminating redundancy, was
explained. Principal components analysis was shown as a popular
method for extracting initial factors and the varimax rotation of
• The nominal variables had been converted to dummy variables whichshould be equivalent to intervally scaled variables.
224
these factors was discussed. Two advantages of factor analysis were
presented and the use of this technique to achieve the first
objective was also cited.
Cluster analysis was the second interdependence multivariate
technique described. Cluster analysis provides a direct approach to
grouping variables, objects, or people. The popular hierarchical
methods (single linkage, complete linkage, average linkage, Ward's
method, centroid method) were explained by which one can form
clusters of objects on the basis of their between-objects
similarity. Deciding on the number of clusters was explained as a
crucial step for the investigator. The use of cluster analysis to
accomplish the second objective of this study was reported.
We then turn our attention to multiple regression, a
dependence multivariate analysis technique. Because of the wide use
of multiple regression in marketing research, we illustrated it in
some detail as a technique for analysing the association between a
single dependent variable and a set of independent variables. The
regression model outputs coefficients and their associated Beta
coefficient and T-value, in addition to R 2 which provide a measure
of predictive ability of the model. Multicollinearity was proposed
as a significant problem, by which the interpretation of regression
model could be sometimes difficult. Dummy variables were also
introduced as an acceptable method allowing nominally scaled
variables in the regression equation. The utilisation of multiple
regression to achieve the third objective was cited.
The last section of this chapter stressed the statistical
hypotheses. The major considerations in selecting statistical tests
were also provided followed by the research hypotheses of the
study. The appropriate statistical tests for the fundamental
225
hypotheses were also examined. For the first hypothesis it was
planned to use Friedman's two-way analysis of variance by ranks to
test the significant difference among consumer segments according
to their demography and socio-economy, but it was necessary to
replace this with ANOVA. While for the other hypotheses (i.e, Ho 2
to Ho 8) a T test was employed to test the significant relationship
between each consumer characteristic and the various categories of
consumption patterns of medicine.
226
CHAPTER EIGHT
RESEARCH FINDINGS.
8.1. Data Analysis Procedure.
8.2. Reliability Of The Satisfaction Scale.
8.3. Factor Analysis Findings.
8.3.1. Factor Labelling.
8.3.2. Degree Of Satisfaction With The Factors Identified.
8,3.3. Conclusion.
8.4. Finding Segments: Cluster / Discriminant Analysis.
8.5. Testing The Differences (ANOVA).
8.6. Analysis Of Variance (ANOVA) Findings.
8.6.1. Interpretation Of The ANOVA Results Of The Factors
Identified.
8.6.2. Similarities Across The Factors Identified.
8.6.3. Interpretation Of The ANOVA Results Of The Statements.
8.6.4. Similarities Across The Statements.
8.6.5. Conclusion About Similarities/Differences With Respect To
Consumer Characteristics.
8.6.6. The Link Between The Conceptual Model Of Consumer
And The Research Findings.
8.7. Multiple Regression Results.
8.7.1. The Findings Of The Multiple Regression Analysis.
8.7.2. Testing The Relationship - T test.
8.7.3. The Relative Importance Of The Predictors.
8.7.4. Interpretation Of The Variables Retained.
8.7.5. Conclusion.
8.8. Summary.
227
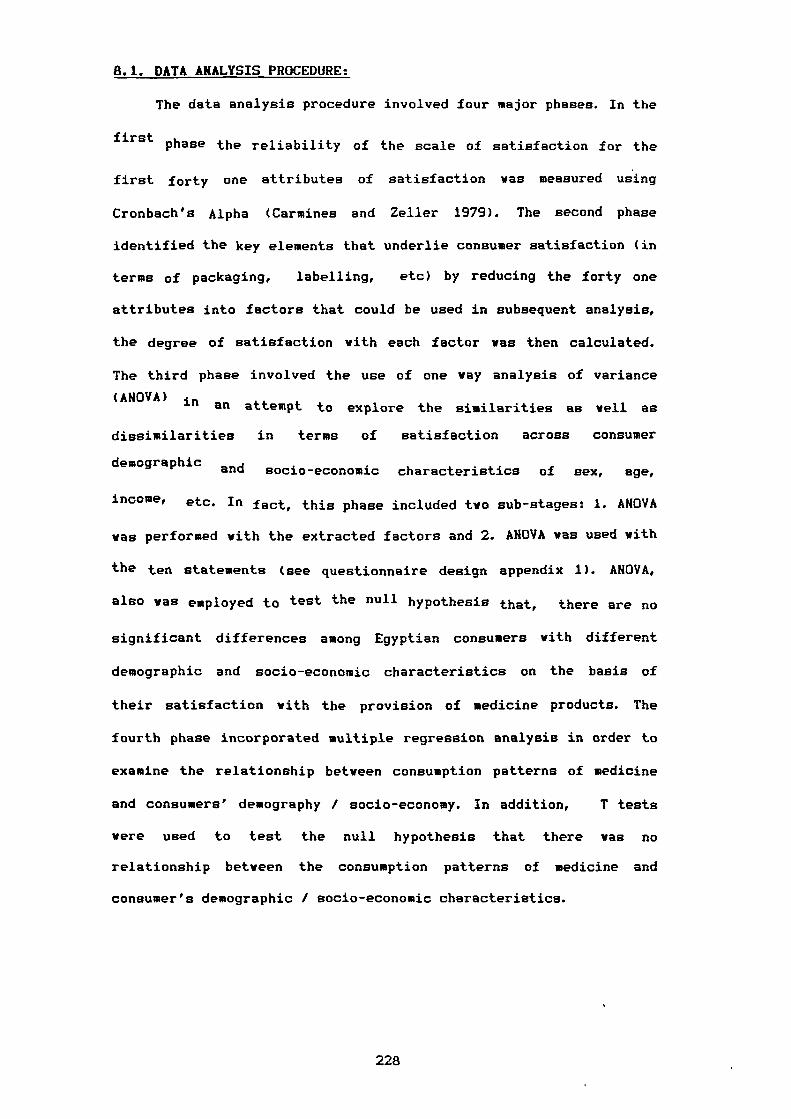
8.1. DATA ANALYSIS PROCEDURE:
The data analysis procedure involved four major phases. In the
first phase the reliability of the scale of satisfaction for the
first forty one attributes of satisfaction was measured using
Cronbach's Alpha (Carmines and Zeller 1979). The second phase
identified the key elements that underlie consumer satisfaction (in
terms of packaging, labelling, etc) by reducing the forty one
attributes into factors that could be used in subsequent analysis,
the degree of satisfaction with each factor was then calculated.
The third phase involved the use of one ray analysis of variance
(ANOVA) in an attempt to explore the similarities as well as
dissimilarities in terms of satisfaction across consumer
demographic and socio-economic characteristics of sex, age,
income, etc. In fact, this phase included two sub-stages: 1. ANOVA
was performed with the extracted factors and 2. ANOVA was used with
the ten statements (see questionnaire design appendix 1). ANOVA,
also was employed tohothesistest the null hypothesis that, there are no
significant differences among Egyptian consumers with different
demographic and socio-economic characteristics on the basis of
their satisfaction with the provision of medicine products. The
fourth phase incorporated multiple regression analysis in order to
examine the relationship between consumption patterns of medicine
and consumers' demography / socio-economy. In addition, T tests
were used to test the null hypothesis that there was no
relationship between the consumption patterns of medicine and
consumer's demographic / socio-economic characteristics.
228

8.2. RELIABILITY OF THE SATISFACTION SCALE:
In order to asses the internal consistency of the items
contained in the first forty one attributes Cronbach's coefficient
alpha was computed and is shown in table 8.1.
The scale exhibited a high degree of reliability indicated by
Cronbach's Alpha (Carmines and Zeller, 1979). Table 8.1 shows the
value of Cronbach's Alpha if all 41 items are retained as well as
the values if any item deleted systematically. The elimination of
any item reduced, although only marginally, the reliabili ty of the
scale and therefore all were retained and as good indicators of
satisfaction.
229
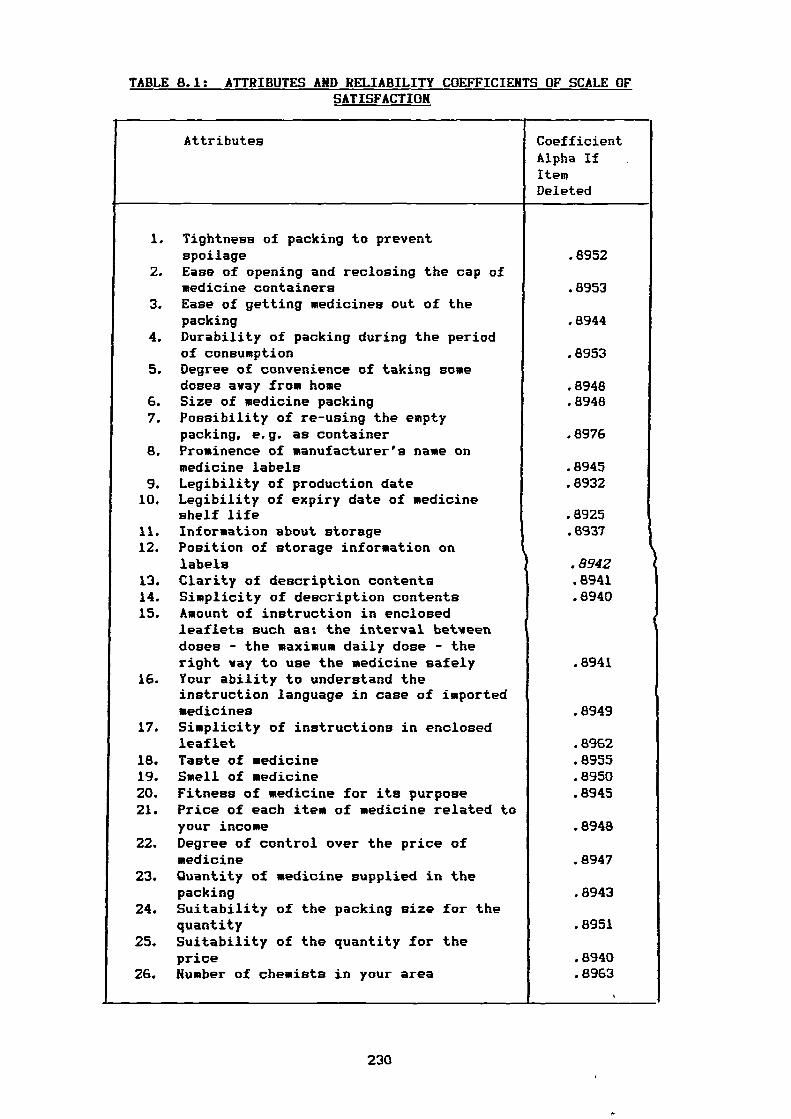
Attributes CoefficientAlpha IfItemDeleted
.8952
.8953
.8944
.8953
.8948
.8948
.8976
.8945
.8932
.8925
.6937
.8942.8941.8940
1
.8949
.8962
.8955
.8950
.8945
.8948
.8947
.8943
.8951
.8940
.8963
TABLE 8.1: ATTRIBUTES AND RELIABILITY COEFFICIENTS OF SCALE OFSATISFACTION
1. Tightness of packing to preventspoilage
2. Ease of opening and reclosing the cap ofmedicine containers
3. Ease of getting medicines out of thepacking
4. Durability of packing during the periodof consumption
5. Degree of convenience of taking somedoses away from home
6. Size of medicine packing7. Possibility of re-using the empty
packing, e. g. as container8. Prominence of manufacturer's name on
medicine labels9. Legibility of production date10. Legibility of expiry date of medicine
shelf life11. Information about storage12. Position of storage information on
labels13. Clarity of description contents14. Simplicity of description contents15. Amount of instruction in enclosed
leaflets such as: the interval betveendoses - the maximum daily dose - theright vay to use the medicine safely
16. Your ability to understand theinstruction language in case of importedmedicines
17. Simplicity of instructions in enclosedleaflet
18. Taste of medicine19. Smell of medicine20. Fitness of medicine for its purpose21. Price of each item of medicine related to
your income22. Degree of control over the price of
medicine23. Quantity of medicine supplied in the
packing24. Suitability of the packing size for the
quantity25. Suitability of the quantity for the
price26. Number of chemists in your area
.8941
230
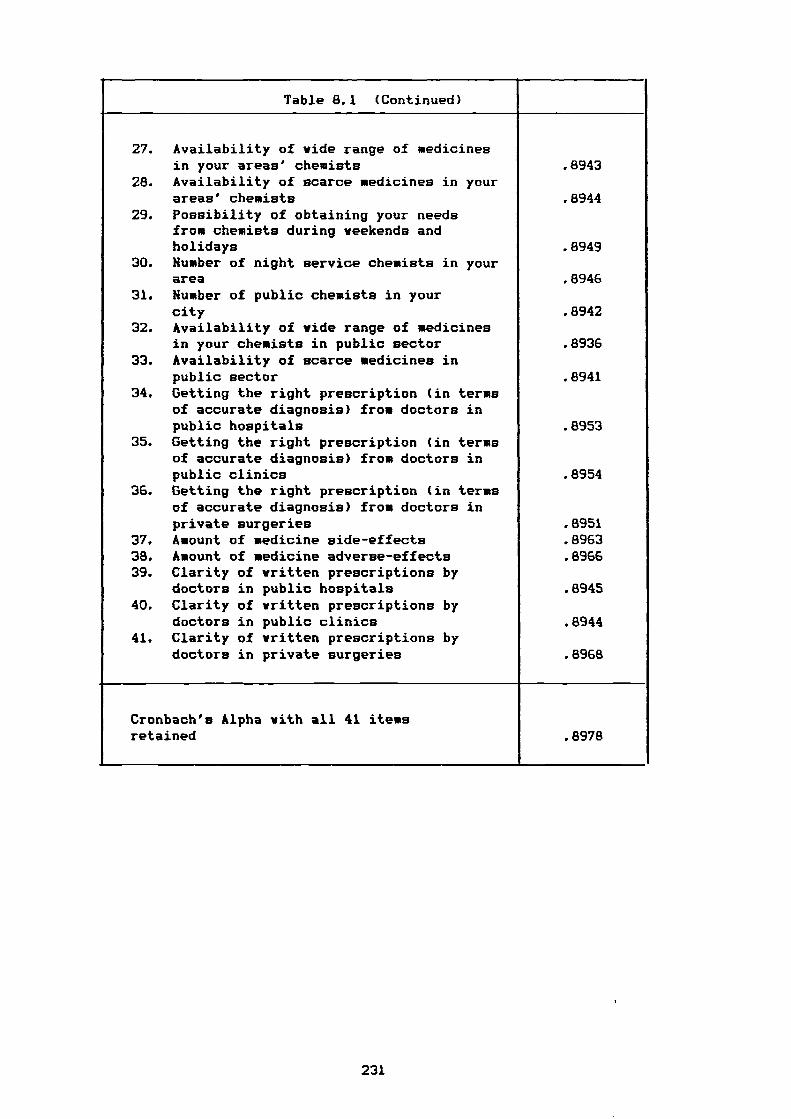
Table 8.1 (Continued)
27. Availability of wide range of medicinesin your areas' chemists .8943
28. Availability of scarce medicines in yourareas' chemists .8944
29. Possibility of obtaining your needsfrom chemists during weekends andholidays .8949
30. Number of night service chemists in yourarea .8946
31. Number of public chemists in yourcity .8942
32. Availability of ride range of medicinesin your chemists in public sector .8936
33. Availability of scarce medicines inpublic sector .8941
34. Getting the right prescription (in termsof accurate diagnosis) from doctors inpublic hospitals .8953
35. Getting the right prescription (in termsof accurate diagnosis) from doctors inpublic clinics .8954
36. Getting the right prescription (in termsof accurate diagnosis) from doctors inprivate surgeries .8951
37. Amount of medicine side-effects .896338. Amount of medicine adverse-effects .896639. Clarity of written prescriptions by
doctors in public hospitals .894540. Clarity of written prescriptions by
doctors in public clinics .894441. Clarity of written prescriptions by
doctors in private surgeries .8968
Cronbach's Alpha with all 41 itemsretained .8978
231

8.3. FACTOR ANALYSIS FINDINGS:
In order to gain an understanding of the factors underlying
the consumer satisfaction with medicine provision, factor analysis
is employed to reduce the large number of attributes. Each factor
extracted will be interpreted in turn.
8.3.1. FACTOR LABELLING:
Principal components analysis followed by a varimax rotation
was performed on the first forty one attributes to generate a
solution (see the complete factor tables in appendix 3) . Table 8.2
contains the results. The results suggest a twelve factor solution.
Thus, these factors can be candidated for further interpretation
(Luck and Rubin 1987).
Also, it is worth pointing out that the twelve factors
explained close to 63 per cent of the total variation in the data.
The remaining variance therefore, is the unique variance of the
attributes indicating that there may be unspecified attributes
influencing consumer satisfaction. Almost, all the attributes are
captured nicely by the twelve factor solution. Eleven out of twelve
of factors (excluding factor 9) seem to have a clear and
unambiguous meaning.
To make the interpretation easier, the attributes have been
grouped in terms of their factor loading on a specific factor i.e.,
the attributes are grouped with other attributes also loading on
the same factor. Bearing in mind that factors are interpreted
mainly on the basis of factor contents, the twelve factors that
emerged in the data may be characterized as follows:
1) Packing quality.
2) Description / instruction.
232

3) Availability of services of, and products in, public chemists.
4) Legibility of production / expiry date.
5) Price.
6) Clarity of written prescription.
7) Availability of services of, and products in, private chemists.
8) Quantity of medicine and packaging.
9) Taste / smell of medicine.
10) Adverse / side effects of medicine.
11) Doctors' experience.
12) Potential for re-use of the medicine containers.
Note in table 8.2 that the variation of a number of attributes
is yell explained by the twelve factors. In particular, attributes
9, 10, 18, 19, 37, and 38 have communalities over 80 per cent
and thus, their meaning is well reflected by the twelve factors. In
contrast, attribute 20 has a communality of only 33 per cent hence,
its meaning is not reflected yell by these factors. This attributes
(Fitness of medicine for purpose) cannot be ignored. However, the
low loading of the attribute does not mean it is worthless, it
might be an important dimension to consumers. The factor analysis
simply shove that none of the other attributes are highly
correlated with it, it is a unique feature.
The attributes highly correlated with the first factor suggests
that this factor is a (packing quality) dimension. That factor has
high attribute loadings a maximum .77 for the second attribute,
and a minimum .57 for the fifth attribute. At this point it is
necessary to examine the contribution of each original attribute.
The second one (ease of opening and reclosing the cap of medicine
packing) is the most important attribute in defining that factor.
Follow by the first, third, fourth, and fifth. This factor ' also
233
contributes most to the variance in the satisfaction (20 per cent).
Factor 1 combines all the packing attributes in the questionnaire
(see appendix 1) except two (i.e, attributes 6, 7 ) which load each
on different factors.
Factor 2 appears to reflect consumer satisfaction /
dissatisfaction with (description / instruction) involving the
clarity and simplicity of the description of the contents, the
amount of instruction enclosed, ability to understand and the
simplicity of those instructions as suggested by the loading of
these attributes. This factor explained 6.7 per cent of the
variance. Attributes 13 and 14 are the highest loading .72, .69
respectively. Moreover, they have higher communalities than the
others, 62 and 59 per cent respectively.
In factor 3, note that attribute 30 has a low loading and
should contribute little to the interpretation of that factor.
Hence, the third factor is termed availability of, and products
in, public chemists on the basis of the loading of attributes 31,
32, and 33. We can see from table 8.2 that the most important
attributes contributing to satisfaction / dissatisfaction with
this factor are the availability of a wide range of medicines in
the public chemists .80, and the availability of scarce medicines
in those chemists .77. Both of them have highly communalities (74 ,
and 71 per cent) respectively.
Factor 4 appears to deal with the degree of satisfaction /
dissatisfaction with the outer part of medicine labels. The highest
loading attributes are legibility of production date as well as
expiry date both .87, while the smallest are the prominence of the
manufacturer's name on medicine labels, information about storage
and position of storage information on labels. Further, the
234
strongest two attributes have the highest communality of all the 41
attributes (i.e., 86, 87 per cent respectively). The researcher
identified this factor as representing the highly loading
attributes(legibility of production / expiry date).
Factor 5 clearly is a price related factor the suited name
therefore is price. Factor 6 is an entirely homogeneous dimension,
three attributes i.e., 39, 40, 41, load highly on that factor.
Those attributes reflect the clarity of prescriptions from doctors
with different positions (i.e., in public hospitals, public clinic,
private surgery).
Factor 7 contains a group of homogeneous attributes with
somewhat high loadings. This factor is tentatively interpreted as
availability of services of, and products, in private chemists.
This factor seems to be related to factor 3. However, the
consumers distinguish between the role of public and private
chemists in their satisfaction with medicine availability /
scarcity.
Factor 8, as can be seen from table 8.2, characterizes the
attribute judegments on medicine quantity and size of packing.
Factor 9 clearly centres on the taste / smell of medicines.
Attributes 18 and 19, are highly correlated and combine to produce
that factor. Conversely, attribute 20 has a fairly low absolute
factor loading, .26. The low loading, indicates that it should not
be considered in the interpretation of factor 9.
Factor 10 appears to cover adverse / side effects. Although
few attributes load on that factor, they clearly define, as well as
strongly explain it. We see in table 8.2, the three attributes
loading on factor 11 are exploring the extent of satisfaction,with
obtaining the right prescription from different doctor sources.
235

Attributes 35 and 36 are highly correlated whilst attribute 34
relating to doctors in public hospitals has a low loading of only
.38 and therefore is less worthy of retention in the factor. The
factor has been named doctors' experience.
The final factor, factor 12 includes a unique attribute with
quite high loading .72 as shorn in table 8.2 and has been named
potential for re-use of the medicine containers.
236
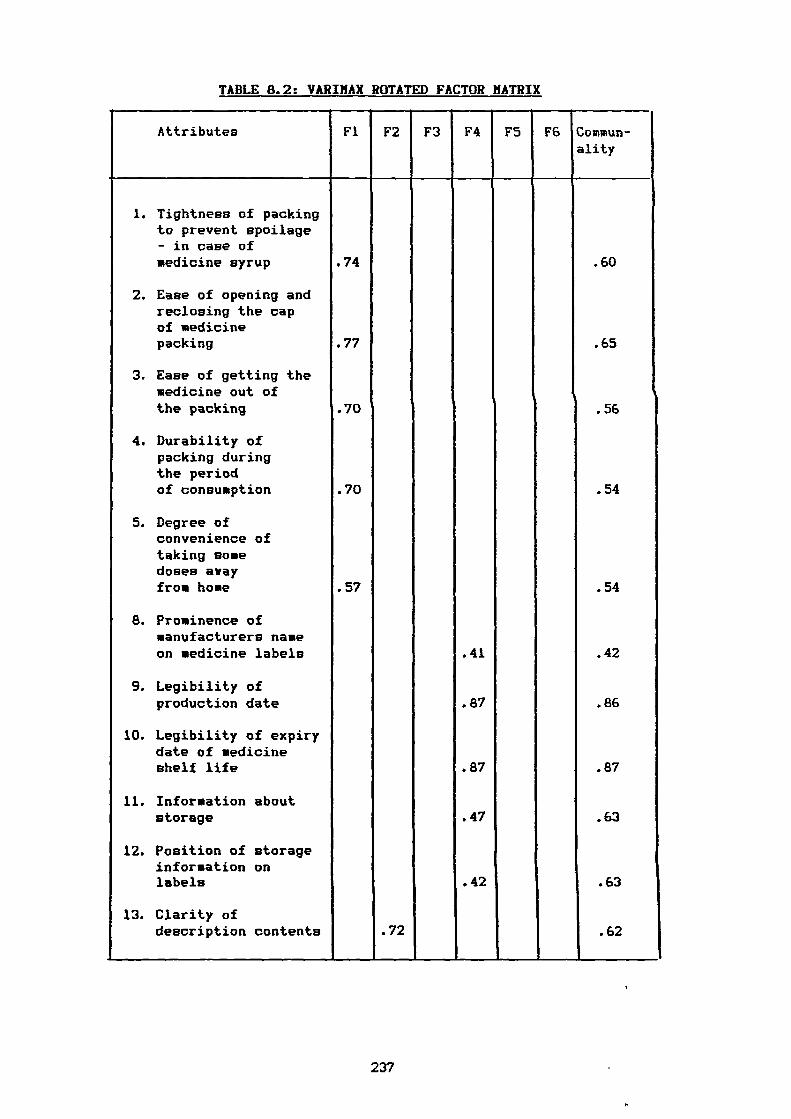
TABLE 8.2: VARIMAX ROTATED FACTOR MATRIX
Attributes Fl F2 F3 F4 F5 F6 Commun-ality
1. Tightness of packingto prevent spoilage- in case ofmedicine syrup
2. Ease of opening andreclosing the capof medicinepacking
3. Ease of getting themedicine out ofthe packing
4. Durability ofpacking duringthe periodof consumption
5. Degree ofconvenience oftaking somedoses awayfrom home
8. Prominence ofmanufacturers nameon medicine labels
9. Legibility ofproduction date
10. Legibility of expirydate of medicineshelf life
11. Information aboutstorage
12. Position of storageinformation onlabels
13. Clarity ofdescription contents
.74
.77
.70
.70
.57
.72
.41
.87
.87
.47
.42
.60
.65
n
.56
.54
.54
.42
.86
.87
.63
.63
.62
237
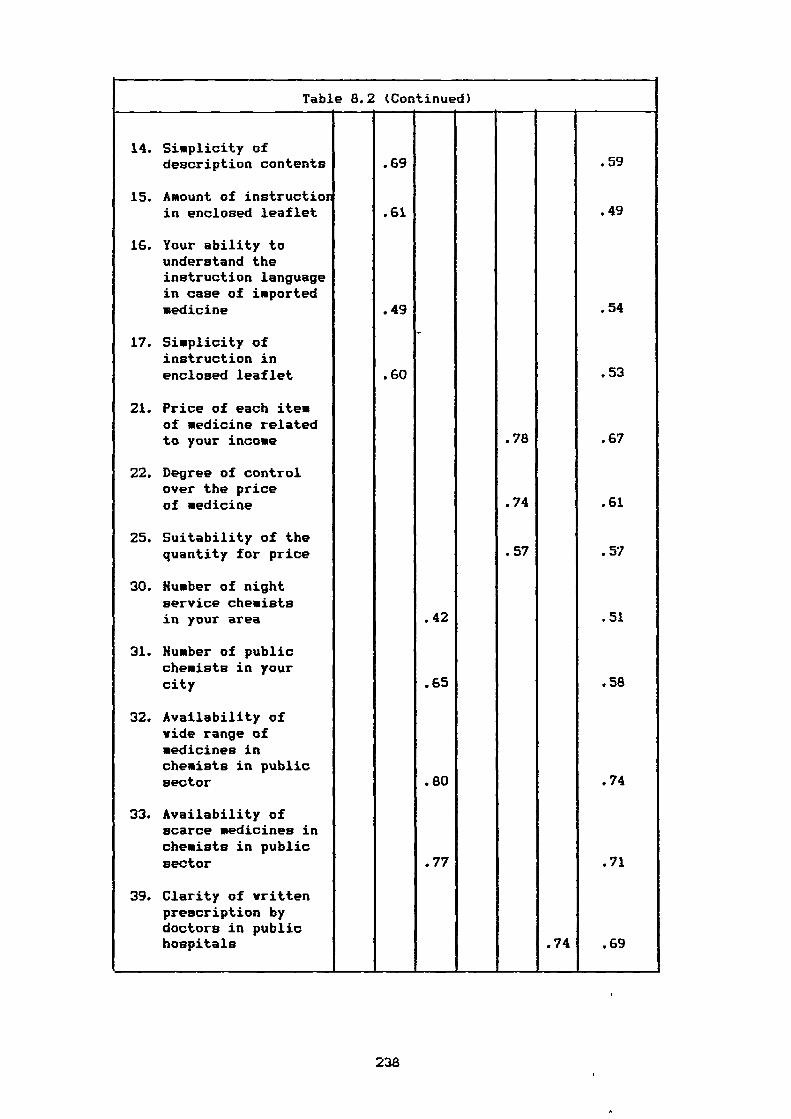
Table 8.2 (Continued)
14. Simplicity ofdescription contents
15. Amount of instructionin enclosed leaflet
16. Your ability tounderstand theinstruction languagein case of importedmedicine
17. Simplicity ofinstruction inenclosed leaflet
21. Price of each itemof medicine relatedto your income
22. Degree of controlover the priceof medicine
25. Suitability of thequantity for price
30. Humber of nightservice chemistsin your area
31. Humber of publicchemists in yourcity
32. Availability ofwide range ofmedicines inchemists in publicsector
33. Availability ofscarce medicines inchemists in publicsector
39. Clarity of writtenprescription bydoctors in publichospitals
.69
.61
.49
.60
.42
.65
.80
.77
.78
.74
.57
.74
.59
.49
.54
.53
.67
.61
.57
.51
.58
.74
.71
.69
238
Table 8.2 (Continued)
40.Clarity of writtenprescription bydoctors in publicclinics .83 .78
41. Clarity of writtenprescription bydoctors inprivate surgeries .77 .64
Eigenvalues 8.2 2.7 2.1 2.0 1.7 1.7
Percent of varianceexplained 20 6.7 5.0 4.E 4.2 4.0
Cumulative varianceexplained 20 26.6 31.6 36.E 40.7 44.7
Table 8.2 (Continued)
Attributes F7 F8 F9 FIO Fll F12 Commun-ality
6. Size of medicinepacking
7. Possibility ofre-using the emptypacking eg. ascontainer
18. Taste of medicine
19. Smell of medicine
20. Fitness of medicinefor its purpose
23. Quantity of medicinesupplied in thepacking
.52
.64
.89
.87
.26
.72
.54
.58
.83
.83
.33
.61
239
Table 8.2 (Continued)
24. Suitability ofpacking size forthe quantity
26. Humber of chemistsin your area
27. Availability ofwide range ofmedicine in yourareas' chemists
28. Availability ofscarce medicinesin your areas'chemists
29. Possibility ofobtaining yourneeds fromchemists duringveekends andholidays
34. Getting the rightprescription (interms ofaccurate diagnosis)from doctors inpublic hospitals
35. Getting the rightprescription (interms ofaccurate diagnosis)from doctors inpublic clinics
36. Getting the rightprescription (interms of accuratediagnosis) fromdoctors inprivate surgeries
37. Amount of medicineside-effects
.59
.68
.57
.70
-
.70
.88
.38
.78
.65
.59
.52
.61
.58
.58
.55
.72
.59
.82
240
Table 8.2 (Continued)
38. Amount of medicineadverse-effects .89 .82
Eigenvalues 1.4 1.3 1.2 1.1 1.1 1.0
Percent of varianceexplained 3.5 3.2 3.2 2.6 2.6 2.5
Cumulative varianceexplained 48.2 51.t 54.7 57.4 60.1 62.6
8.3.2. DEGREE OF SATISFACTION WITH THE FACTOR IDENTIFIED:
We continue to fulfil the first objective of the study to
determine the extent to which consumers are satisfied with each of
the twelve factors. The researcher calculated each average factor
score using weighted factor loadings. The results are shown in
table 8.3. Four factors, packing quality, description /
instruction, taste / smell of medicine and doctors' experience
achieved slightly better than neutral ratings. Three factors
achieved a neutral rating and on the remaining five factors
consumers showed dissatisfaction, the lowest rating going to price
of medicine.
However, the level of satisfaction with the best - rated
factor (packing quality) fell below the 'slightly satisfied" level.
It does not seem unreasonable to suggest that the consumers feel
that the provision of medicine in Egypt is less than satisfactory
in respect of the twelve factors identified.
241
TABLE 8.3: DEGREE OF SATISFACTION WITH EACH FACTOR
Factor Hanes AttributeLoading
AttributeMeans
,AverageFactorScore
1. Packing Quality .74 4.658.77 5.081.70 4.709 4.6.70 4.435.57 4.176
2. Description/ .72 4.850Instructions .62 4.351
.61 4.948 4.4
.49 3.163
.60 4.365
3. Taste/Smell of .89 4.300Medicines .87 4.145 4.2
.26 4.419
4. Doctors' .38 2.506Experience .78 4.009 4.2
.65 5.333
5. Availability of .59 5.260services of, and .68 3.473 4.0products in,private chemists
.57
.703.0963.989
6. Quantity of .52 4.135medicine and .64 3.567 4.0packing .70 4.335
7. Adverse/Side .88 3.916effects ofmedicines
.89 3.948 4.0
8. Legibility of .41 4.896Production/Expiry .87 3.786Date .87 3.681 3.7
.47 4.669
.42 4.360
9. Clarity of vritten .74 2.471prescription .83 2.904 3.2
.77 4.195
242
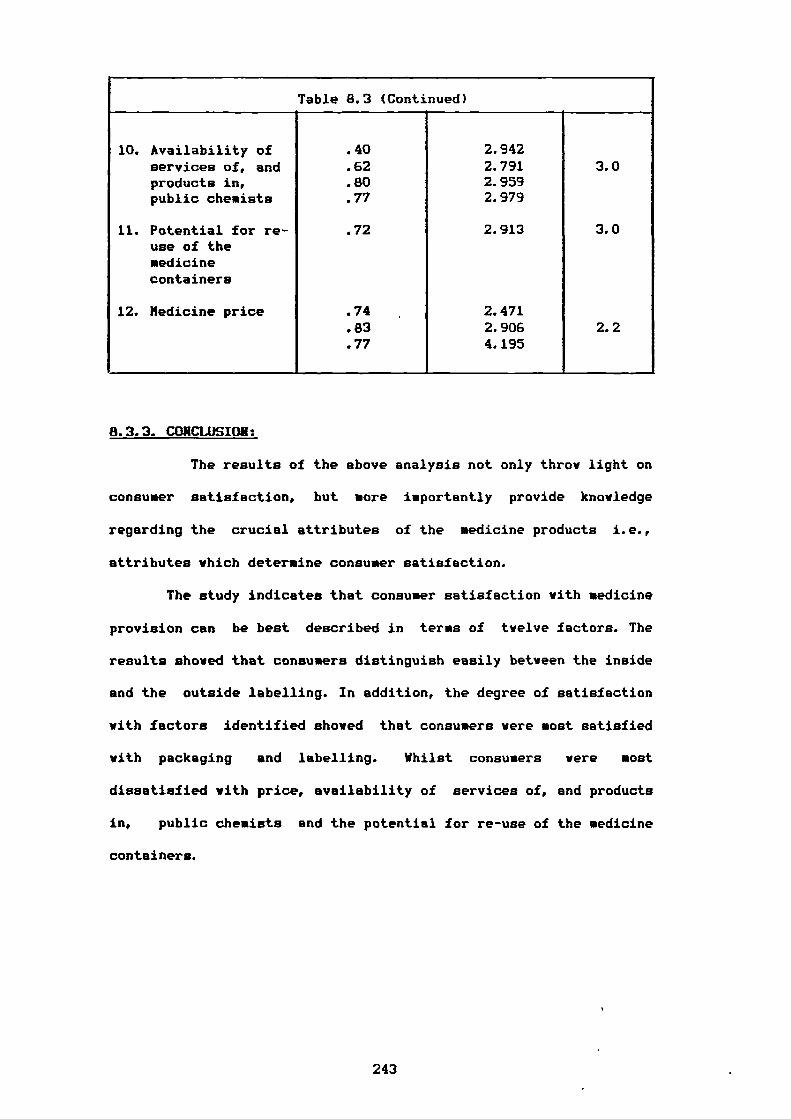
Table 8.3 (Continued)
10. Availability of .40 2.942
services of, and .62 2.791 3.0products in,public chemists
.80
.772.9592.979
11. Potential for re-use of themedicinecontainers
.72 2.913 3.0
12. Medicine price .74 2.471.83 2.906 2.2.77 4.195
8.3.3. CONCLUSION:
The results of the above analysis not only throw light on
consumer satisfaction, but more importantly provide knowledge
regarding the crucial attributes of the medicine products i.e.,
attributes which determine consumer satisfaction.
The study indicates that consumer satisfaction with medicine
provision can be best described in terms of twelve factors. The
results shored that consumers distinguish easily between the inside
and the outside labelling. In addition, the degree of satisfaction
with factors identified showed that consumers were most satisfied
with packaging and labelling. Whilst consumers were most
dissatisfied with price, availability of services of, and products
in, public chemists and the potential for re-use of the medicine
containers.
243

8.4. FINDING SEGMENTS: CLUSTER / DISCRIMINANT ANALYSIS:
It was planned to achieve the second objective of the study
utilizing cluster analysis for both the twelve factors identified
and the other statements (see questionnaire appendix 1). Different
clustering methods available on the SPSSX program (single,
complete, average linkage and Ward's method) were used. However,
none of the methods seems to convincingly identify groups of
consumers based on their level of satisfaction with factors and
statements. The researcher then foucsed on a linear discriminant
analysis to see if membership of the clusters obtained, although
unconvincing could be predicted on the basis of some linear
combinations of the consumers' demographic and socio-economic
variables. The results obtained from both cluster and discriminant
analysis are presented in appendix 4. From the last few steps in
the agglomeration schedules presented in tables 8.6 to 8.13,
appendix 4, we can see why we could not obtain meaningful clusters.
No clear breaks are obvious in the search. However, it was decided
to explore the most promising possibilities.
In table 8.6, clustering on the basis of the factors
identified using the complete linkage method, the increase in the
coefficient tells us that probably the two cluster solution is the
best. However, only 8 people were placed in cluster 2 and 930 in
cluster 1. The results therefore seem meaningless. We then
investigated the 5 cluster solution using discriminant analysis
with the demographic and socio-economic variables as predictors of
group membership. Table 8.14 shows that only one function was
significant and table 8.15 shows us that these results also are
meaningless.
244

In table 8.10, relating to the statements using the complete
linkage method, the increase in the coefficient in the
agglomeration schedule tells us again that the two cluster solution
is the most promising. The subsequent discriminant analysis (table
8.16) shows that the function is significant but the results in
table 8.17 shows us that the predictive ability of the function is
useless since only 2 respondents are placed in group 2.
Regarding the agglomeration schedule in table 8.13 (statements
using average linkage method), the increase in the coefficient
could suggest four groups. But the discriminant analysis in table
8.18 shows that only one function is significant. Moreover, table
8.19 shows that although the prediction of group membership is
better than by chance, at 34 per cent it cannot be regarded as
acceptable.
We conclude therefore that clusters which were initially
unconvincingly cannot be predicted on the basis of demographic and
socio-economic variables. Our attention therefore turned to look at
the demographic and socio-economic characteristics of consumers
individually with respect to each factor / statement using one way
analysis of variance (ANOVA). By ANOVA, we therefore explored some
similarities and differences among the Egyptian consumers with
different characteristics. This work is discribed in the following
section.
245
8.5. TESTING THE DIFFERENCES (ANOVA):
ANOVA was used to test the null hypothesis in this study that
there are no significant differences among Egyptian consumers with
different demographic and socio-economic characteristics on the
basis of their satisfaction with the provision of medicine
products. The findings shown in tables 8.20 to 8.32 in appendix 5
did show up fifty one significant differences at >95X confidence
level between various categories of consumer variables with respect
to the twelve factors identified and the statements. The null
hypothesis Ho is therefore rejected and the alternative one
accepted i.e., there are significant differences among Egyptian
consumers with different demographic and socio-economic
characteristics (sex, age, income, education, occupation, family
size, marital status) on the basis of their satisfaction with the
provision of medicine products. The details are presented in the
following sections.
8.6. ANALYSIS OF VARIANCE (ANOVA) FINDINGS:
Tables 8.33 to 8.45 in appendix 5 present the significant
differences that were detected using AHOHA. In the following
sections an attempt is made to explore the similarity /
dissimilarity among consumers with different demographic / socio-
economic characteristics on the basis of their satisfaction.
246
8.6.1. INTERPRETATION OF THE ANOVA RESULTS OF THE FACTORS IDENTIFIED
Considerable efforts needed to be made to gain a firm grasp
of these findings. The interpretation of consumer characteristics
can be followed through tables 8.33 to 8.39 in appendix 5.
We first look at sex which has significant differences with
respect to factors 2, 6, 12 as presented in table 8.33. In terms
of factors 2, 6 (i.e., description / instruction and clarity of
written prescription), the mean factor scores show that females
were more satisfied than males. This might be due to the
differences between men and women, often, men are more rational,
willing to concentrate harder. They seek clear instruction on
medicine labels, and perceive that it is their right to have a
clear prescription form. Women were also more satisfied than men
with the possibility of using empty packing e.g., containers. That
seems to be easy to interpret due to the experience of women in
Egypt they know how to use the empty containers for kitchen
purposes.
In terns of age, it is obvious from table 8.34 that older
people are more satisfied than youngers ones with factor 3 and
factor 7 which are named availability of services of, and products
in, public chemists - availability of services of, and products
in, private chemists. In the first case, consumers of 55-60 years
of age were more satisfied than those in the 25-34 age group. The
same pattern can be observed in the second case, consumers in the
35-44 age group were more satisfied than the slightly younger in
the previous category (i.e., 25-34). This is probably due to the
fact that, younger people are more critical and expect more of
life in general and products in particular. In addition, consumers
of middle age (i.e., 45-54) and 55-60 were more satisfied than the
247
youngest in the 18-24 years of age group with factor 4, legibility
of production / expiry date. The results seems reasonable, although
the older consumers are more mature as far as they know the
importance of the presence of production and expiry date on the
medicine labels, the youngest (i.e., 18-24) are less satisfied.
That could due to the fact that most of them are students at the
secondary schools and different universities, they are more
optimistic in their life and expect manufacturers to give careful
consideration to this important aspect. In contrast, the younger
consumers (25-35 years) were more satisfied than the older 45-54
years with respect to the second factor, description / instruction.
The researcher finds this results clear to interpret, simply
because younger people are better educated, they can read and
understand the description and instruction on medicine labels.
While older people in many cases are less educated and may also be
dissatisfied because of their inability to read well.
With respect to education level, as the results given in table
8.35 show the less educated reported more satisfaction than the
higher educated with factors 3, 4, 6, and 12, however,for factor
2, the more educated were the more satisfied. The interpretation
of these results seems somewhat easy. Factor 3, is the availability
of services of, and products in, public chemists, we conclude that
the higher educated were less satisfied because they are concerned
to receive better service from the public chemists as the
availability of medicines in those chemists is important to them.
While the less educated people almost all have a low income and
they get their treatment from the general hospitals. They are not
aware of the availability of medicines in such chemists. In factor
4 which is concerned with legibility of production and expiry date,
248
the output looks interesting. The more educated were less
satisfied. This is possibly due to: on the one hand, the
noneducated and very low educated (i.e., primary school) do not
mind about the legibility of production and expiry date on medicine
labels. They have no expectations about such aspects. On the other
hand, the more educated are less satisfied due to their deep
attention to such aspects as the presence of production and expiry
date on medicine labels. Carrying the analysis further to factor 6,
clarity of the written prescription, the possible interpretation
could be the greater awareness of the higher educated about the
necessity of a written prescription to be clear. They feel that a
clear prescription is an important form of patient protection and
therefore are less satisfied.
It came as no surprise that we found the less educated
consumers were more satisfied with factor 12 (potential for re-use
of medicine containers) because the higher educated are usually
careful about what to use. Factor 2, description / instruction
contrasts the above general pattern, because the more educated
consumers the more satisfied. That might due to the greater
experience, higher ability of those classes to read and understand
the description / instruction easily.
The next variable to be considered is family size which shows
only one difference throughout the factors. As displayed in table
8.36, the larger families (5-6 members) were more satisfied than
the smaller families (3-4 members) in terms of factor 3,
availability of services of, and products in, public chemists. The
interpretation seems slightly unclear, but it could be due to the
different social life of the smaller and larger families. The
249
smaller families are often looking for better service and expecting
a wide range of medicines in the public chemists.
In terms of family income, table 8.37 shows two significant
differences. First, the higher income classes (£5000-6999, over
£7000) per annum were more satisfied than the lowest classes (less
than £900, £1201-2999) and the middle classes (£3000-4999) with
regard to factor 5 and 7. Second, the highest income classes (over
£7000 and £5000-6999) per annum are less satisfied than the lowest
income classes (less than £900 and £900-1200) in respect of factor
6. The picture of the high income respondents who were more
satisfied with price as well as the availability of services of,
and products in, private chemists is very interesting to interpret.
Since, the higher income consumers are able to pay whatever the
price of medicine, they do not feel a wide gap between their income
and such prices. Additionally, the high classes often live in
modern areas, that are characterized by providing better services
(e.g., chemists, clinics, schools) in comparison with the poor
areas. On the other hand, the higher income classes were less
satisfied with the clarity of written prescriptions. That could due
to the high expectation of such classes, their attitudes are
influenced by the high cost paid to the private doctors.
The next analysis involves occupation as can be seen in table
8.38, the professionals express more satisfaction than labourers in
terms of factor 2, description / instruction. The difference in
satisfaction / dissatisfaction may be due to the different incomes
of each group. Professional are often of higher income classes than
labourers who have limited incomes. For that reason, labourers
have more experience with the medicine provided by the general
hospitals whereas professional classes frequently use private
250
sources. Added to this, the professionals reported more
satisfaction than officials with prices. This results deserves a
special remark, because professionals almost all have higher
incomes, while officials with their limited income sources are
suffering from an inability to get their satisfaction needs from
medicines. Generally professional classes were more satisfied than
other groups with the description / instruction and prices.
Furthermore, the output detected that labourers were more satisfied
than students in terms of factor 4, legibility of production /
expiry date. The results seem very reasonable to interpret because
the labourers are often poorly educated. It is hard for them to
understand the importance of production and expiry date on medicine
labels. In contrast, students have the ability to grasp and judge
that brings in turn higher expectations in this regard.
The last point to be discussed in this section is marital
status. As shown in table 8.39, single respondents were less
satisfied than the others (i.e., separated, divorced, widowed) in
terms of factor 4, legibility of production / expiry date. Such
results could be interpreted in relation to age. Single people are
usually younger, they are more aware, would have a higher
expectation of labelling. Again, the single consumers reported less
satisfaction than married consumers with respect to taste / smell
of medicine. There is no doubt that, the married consumers purchase
more medicine than single and other groups. Therefore their
attitude towards medicine taste / smell is influenced by their
greater experience.
251
8.6.2. SIMILARITIES ACROSS THE FACTORS IDENTIFIED:
Next, our attention turns to explore the similarities among
consumers in respect of their demographic and socio-economic
characteristics (i.e., sex, age, etc). Some similarities can be
noted among consumer characteristics as follows:
1) Females are similar to younger consumers as well as to the less
educated in terms of the greater satisfaction with description /
instruction. In open questioning- it was detected that the
consumers who expressed less satisfaction reported specific
reasons for this feeling, the instruction does not always
include an important statement, namely the interval dose of the
medicine. Further, the majority of consumers mentioned that they
do not understand the instructions on imported medicines. Some
of them suggested an Arabic translation should be enclosed. Some
were very dissatisfied with the description content, explaining
that it is, often too small to read.
2) The older households are similar to the less educated and larger
families in terms of their satisfaction with availability of
services of, and products in, public chemists. In open
questioning, they commented that, there was an adequate service
/ response for diabetics in public chemists. Conversely, the
dissatisfied counterparts are very unhappy because the public
chemists are located in the city centre only. Others were
dissatisfied with the scarcity of several kinds of medicine in
those chemists.
3) The older consumers, the less educated and the separated,
divorced, widowed group are similar to each other in terms of
The respondents were requested to state their own reasons foreither satisfaction or dissatisfaction.
252
their satisfaction with legibility of production / expiry date.
The less satisfied reported their unhappiness due to the absence
of information about storage and felt that manufacturers did not
seem concerned about supplying such information. Some consumers
who were slightly satisfied with the labels also felt a lack of
concern by manufacturers about supplying this information.
4) The higher income households and those in the higher occupation
groups have similar trends of satisfaction with medicine price.
Those dissatisfied with price emphasized the problem of the
rapid change in prices, more than once a year, with particular
reference to the increase in antibiotic prices. Other consumers
are unhappy with the degree of control over the price of
medicine especially with imported medicines which sell without
a fixed price.
5) Women, less educated households and the lover income classes
have a similar degree of satisfaction with the clarity of
written prescriptions. In contrast, the dissatisfied patients
mentioned that, written prescriptions were hard to read and
looked like symbols rather than whole words. In addition, some
doctors do not use a proper prescription form stamped by the
doctors' union.
6) The older people are similar to the higher income classes in
respect of their vier on the availability of service of, and
products in, private chemists. In open questioning, consumers
who are very dissatisfied reported reasons such as: a) the
scarcity of INSULIN for diabetics. b) sometimes domestic
products are not available in stock therefore pharmacists offer
alternative imported medicines which are more expensive than'the
domestic products and c) the medicines are only widely available
253
in the chemists in the modern areas for example, Heliopolis,
Zamalik, Garden-City.
7) Females as well as the less educated consumers are more
satisfied with potential for re-use of medicine containers.
8) Finally, married consumers are more satisfied than the single
consumers and other status consumers in terms of taste / smell
of medicine. On the other hand, all other groups expressed
dissatisfaction especially with children's medicines. Another
point deserves special attention. Some consumers reported that,
they do not like the taste and smell of medicine in plastic
containers. It could indicate that such containers may affect
medicine quality.
8.6.3. INTERPRETATION OF THE ANOVA RESULTS OF THE STATEMENTS:
In reviewing the differences between males and females in
this section, presented in table 8.40 in appendix 5, we note that
females are more satisfied in terms of three statements 2, 3, and
9 while males are more satisfied than females with statement 1. The
tendency to express dissatisfaction appears to be higher among men,
especially their opinion towards the presence of warning statements
as well as their concern that doctors should provide instruction
information in the prescription. Perhaps this is due to expectation
levels. Men expect adequate labels and are concerned with the
importance of instruction information in prescriptions and are less
satisfied with these features. On the other hand, the result with
respect to the statement (there is an obvious improvement in
medicine packaging over the last five years) shows the reverse,
males are more satisfied than females.
254
Table 8.41 shows that the 55-60 years of age group are
significantly different from the other age categories. In general,
they tend to be more satisfied than the younger. With regard to the
second statement, the difference between the 18-24 and 55-60 years
of age group could be due to the different expectation of the two
groups. The elderly simply are more apt to be satisfied than
younger consumers with similar conditions. In addition, the 55-60
group along with the oldest group (i.e, over 60 years) are more
satisfied than the younger, 25-34 and 35-44 years of age group in
terms of statements eight and nine. That issue might be due to the
greater concern of the younger patients. They are looking for more
information about a medicine's positive / negative effects.
Further, they prefer more doctor's instructions in the
prescriptions in order to use the medicine in the right way. Such
results must not be brushed aside, because the younger consumers
look on everything with a critical eye, want the best job from the
doctors towards their patients. The findings of statement 10 brings
a somewhat different interpretation since the older consumers are
more in agreement with the statement that the pharmacists do not
sell medicine out of prescription. It might be that: a) the older
patients are more careful and prefer a doctor's consultation, so
they do not ask the pharmacists for medicine without a doctor's
prescription , and b) they receive little opportunity to buy
medicine by themselves.
In terms of education level, we can see generally in table
8.42, the less educated consumers display more satisfaction than
do their higher educated counterparts, with the exception of
statement 1 with which the higher educated are more satisfied. That
finding looks easy to interpret. Although higher educated
255

consumers are able to distinguish between good and bad packing, it
is quite easy for those groups to follow such improvements. It is
worth reemphasising that, the improvement of packing in medicine
sector has been discussed as one of the most important issues from
the exploratory study of this research (see chapters one and two).
It is interesting also to turn the coin over and show the
results in which the higher educated classes (high school,
colleges, postgraduates) tend to be less satisfied than the lover
educated in critical aspects (i.e., statements 2,4,8,9,10).
With respect to the second and the fourth statements the
higher educated are agreed that the public hospitals offer free
medicine with insufficient instruction on labels. Furthermore, they
do not feel that adequate caution statements are issued. This
demonstrates the high awareness of the educated classes, their
concern with the presence of such instructions even on the
medicines which are offered free. Also they give much attention to
the enclosed leaflet. They realise the importance of the caution
statement in order to avoid problems during the period of medicine
use. Carrying the analysis further with respect to statement 8 and
9, educated patients expect more explanation from their doctors
about the effects of medicines as well as instruction information
in the doctor's prescription. Whilst the less educated (i.e,
noneducated, primary) do not understand the meaning of medicine
effects so clearly. So far as they are concerned the only effect of
medicine is curing then. Finally, as we can follow in table 8.42
the noneducated and the primary grade educated are more agreed that
the pharmacists do not sell medicines out of prescription. The
interpretation of this results seems unclear, but it may be That
the lack of experience of the less educated prevents them from
256
dealing with pharmacists without a doctor's prescription. Whereas
the higher educated with their previous experiences about the right
way to use medicines, matching the recommended dose to different
ages and the right medicine to cure a specific illness do buy
direct from pharmacists.
In respect of consumers' income, three statements show
significant differences. Table 8.43 shows that the rich consumers
(i.e, £7000 and over per annum) reported dissatisfaction more often
than the lower income classes in regard to statements 2 and 3. it
is surprising that we found the high income consumers are less
satisfied with the presence of instructions on medicine labels
offered free by public hospitals. However, we might assume that
such classes have never tried the public hospitals services, they
are almost always dealing with private surgeries. A similar trend
was observed on statement 3, the higher income groups are unhappy
with the existence of warning statements on medicine labels. It is
reasonable to say such groups often obtain imported medicines as
alternatives to domestic products by asking their doctors to
prescribe them. Thus their greater experience with imported
medicines affects their expectation towards better and sufficient
warning statement on medicine labels of the domestic products. That
brings in turn unsatisfactory feelings.
Statements 4 shows the reverse results, the higher income
groups express themselves to be more satisfied with the presence of
particular caution statements on medicine labels. This finding
seems in contradiction with the above interpretation, we suppose
that the higher income groups have not enough experience with
domestic medicines.
257

From the results of table 8.44 we can easily see that
statement 3 should be viewed with particular concern. it
demonstrates a significant difference between labourers and
officials, the former are more satisfied than the latter with the
presence of warning statements on medicines. The possible
interpretation for this results could due to the different
education level between the two groups. Labourers are often
noneducated or educated only to a very low level hence they cannot
recognise such warning statements, and that may sometimes lead to
misuse of medicines. In contrast, officials are usually educated
enough, to study the medicine labels as well as the enclosed
leaflet and follow the instructions carefully.
Ultimately, with respect to marital status in table 8.45 a
complicated significant difference is observed among single,
married and 'other' status(i.e, separated, divorced, widowed) in
respect to their tendency of agreement / disagreement with the
insufficient instruction on medicine labels offered free by the
public hospitals. The most satisfied group are divorced, separated
or widowed, followed by married, and single are the least satisfied
group. Further, the average satisfaction dropped between " others"
status and married / single consumers. We can say simply that this
might be due to the different circumstances of "other" status and
married / single which create a different set of experiences as
well as different expectation levels.
Carrying the analysis on, the divorced,....etc groups are more
satisfied than the married consumers in regard to whether the
pharmacists do or do not sell medicine out of prescription. We
think it is reasonable to interpret that this trend is due to the
"other" status habit of avoiding possible danger or trouble. They
258
follow the right way to buy medicine (i.e, by doctor's
prescription). Their experience therefore does not help them to
judge. In addition, the married consumers are more satisfied than
single in terms of the presence on medicine labels of a particular
caution statement. Such a finding looks slightly unclear, but a
reasonable interpretation would be due to the different feelings
and levels of responsibility of married and single consumers. The
married households who are therefore in a position of
responsibility are more aware and read such cautions in order to
keep them on the safe side.
8.6.4. SIMILARITIES ACROSS THE STATEMENTS:
The findings address some similarities among consumer groups
on the basis of their satisfaction with the ten statements, they
are summarised as follows:
1) Males as well as the higher educated are more satisfied with the
improvement in medicine packing. It is worth considering here
that males and the higher educated reported more comments on the
questionnaire about that matter. They did stress that such
improvements are quite clear in the case of Capsule and Tablet
packaging. Moreover, they expressed more satisfaction with the
improvement in packaging of local and foreign investment
companies (see chapter 2) rather than with the public sector
ones.
2) Females, older, lower income and 'other' status (i.e, separated,
divorced, widowed) show a similar trend of satisfaction in
respect of the instructions on medicine labels which is offered
by public hospitals. In addition, their counterparts reported
that medicine labels of these hospitals not only have
259
insufficient instructions but also have no identification, not
even the medicine name.
3) Females, lover income and higher occupation have similar trends
of satisfaction to the presence of yarning statements on
medicine labels. For instance, they reported their satisfaction
with such statements with one exception (keep the medicine out
of the reach of children).
4) The higher income, the married and the less educated are similar
to each other in terms of their satisfaction with the presence
on medicine labels of particular caution statements. While their
counterparts strongly disagreed and felt that the majority of
medicine companies were not concerned about such important
cautions.
5) The older and the less educated patients have a tendency to be
more satisfied with the adequacy of doctors to explain the
medicine positive / negative effects as well as with the
interest of most doctors in providing instruction information
in prescription.
6) The older, less educated and the 'other' status (i.e, divorced,
separated, widowed) have a tendency to believe that the majority
of pharmacists do not sell medicine out of prescription.
Whereas, the opinion of their counterparts (i.e, younger, higher
educated, single, married) emphasised that the majority of the
pharmacists sell different kinds of medicine out of prescription
even ANTIBIOTICS, which they sometimes prescribe to patients.
260
8.6.5. CONCLUSIONS ABOUT SIMILARITIES/ DIFFERENCES WITH RESPECT TO
CONSUMER CHARACTERISTICS:
Several major similarities and differences can be drawn with,
respect to all consumer characteristics. Firstly, the older, less
educated are the two most satisfied groups, regarding: a) factor 3
"availability of services of, and products in, public chemists', b)
factor 4, 'legibility of production / expiry date', c) statement 2,
'it seems that public hospitals offer free medicine with
insufficient instruction on labels', d) statement 8, "doctors
adequately explain to me the medicine positive / negative effects',
e) statement 9, "most doctors are concerned about instruction
information in prescription' and f) statement 10, "the majority of
pharmacists do not sell medicine out of prescription'. Secondly,
the picture of females, lower income groups is straightforward. It
obvious from the previous analysis that both groups do appear to be
satisfied regarding: a) factor 6, 'clarity of written
prescription', b) statement 2, 'it seems that public hospitals
offer free medicine with insufficient instruction on labels", c)
statement 3, 6 there are usually yarning statement statements on
medicine labels". Thirdly, of particular interest is the agreement
of males and the highly educated with the first statement 'there is
an obvious improvement in medicine packing over the last five
years".
In summary, four consumer variables (i.e, sex, age, income,
education) out of the seven under study contribute heavily to the
degree of satisfaction / dissatisfaction with the attributes and
statements.
The younger consumers are fairly dissatisfied with the
exception of their satisfaction with factor 2 'description /
261
instruction". On the whole, members of higher educated groups are
basically dissatisfied with the exception of statement 1, "the
improvement of medicine packing".
So far, the analysis procedure has detected that males are
less satisfied than females across several factors and statements.
Regarding the higher income classes, they did express satisfaction
with factor 5 "price", and statement 4, "medicine labels usually
contain particular caution statement'. "Other" status in terms of-
divorced, separated,....etc. groups are more satisfied than their
counterparts (i.e, single, married). In addition, the higher a
consumer's position in terms of occupation generally the more
satisfied the consumer is. Family size has little effect on the
degree of satisfaction / dissatisfaction with the attributes /
statements, except the larger families reported a greater
satisfaction with factor 3 "availability of services of, and
products in, public chemists".
There are still some intuitive remarks which should be
mentioned referring the most important consumer characteristics
(i.e, sex, age, income, education). On the basis of sex, females
seem to be more prone to be the ones to express positive attitudes.
In the comparison between younger and older status, in general, the
younger households express less satisfaction, whereas the consumers
in 55-60 years are the most satisfied age group. The higher
educated classes generally express feelings of dissatisfaction.
Lastly, different income classes have different degrees of
satisfaction / dissatisfaction, of particular interest is the high
dissatisfaction level of the highest income classes (i.e, £7000 and
over per annum).
262
8.6.6. THE LINK BETWEEN THE CONCEPTUAL MODEL OF CONSUMER
SATISFACTION AND THE RESEARCH FINDINGS:
Although the conceptual model of consumer satisfaction
(chapter 5) has not been tested, our research findings give some
support to the model. Since, the findings of this study showed that
four consumer characteristics (sex, age, income, education)
contribute heavily to the degree of satisfaction and
dissatisfaction with different aspects of medicine provision. The
influence of some consumer characteristics (sex, education, income)
on consumer involvement and personal values also has been shown
empirically by the work of other authors (i.e., Slama and Tashchian
1985, and Boote 1981a) through the context of the framework of the
presented relationships in chapter 5. Such issues along with the
other theoretical arguments support our view regarding the
suggestion that consumer involvement and personal values are
critical variables like expectation, performance, disconfirmation
and inequity in determining satisfaction and dissatisfaction
feelings.
8.7. MULTIPLE REGRESSION RESULTS:
Multiple regression attempts to investigate the relationship
between demographic and socio-economic variable (i.e, sex, age,
income, education, occupation, family size, marital status) and the
amount of medicine purchased by the respondents in the sample.
The purpose of the regression in this study is not to derive a
regression function capable of predicting the individual
consumption of medicine, but rather to gain insight into different
consumption level of segments of consumers. We use multiple
regression to attain two different objectives. First, to assess the
263
overall combined contribution of independent variables (consumer
characteristics) in explaining the dependent variable (consumption
of medicine). Thus, using the multiple correlation coefficient
squared (R2 ) to estimate how much of the overall consumption
variance is explained by the individual characteristic. In other
words, we measure the ability of all predictors (e.g, sex, age) to
account for the amount of medicine purchased. The significant
relationship is measured by the F-value with the probability set at
.05 level. Second, we use this analysis to test null hypotheses Ho
(2) to Ho (8). We evaluate the contribution of a given independent
variable when the effects of the other independent variables are
controlled. For that, we use the T-value statistic to measure the
ability of the predictor variable to explain variation in the
consumption level. For the purpose of this study, the latter
objective is more important, although the first is not ignored.
Three different statistics are used therefore to report the
interpretations which appear in the following sections. They are
the multiple correlation coefficient, T-value and the partial
correlation coefficient (B).
8.7.1. FINDINGS OF THE MULTIPLE REGRESSION ANALYSIS:
Table 8.4 presents the multiple regression statistics. This
analysis is based on questionnaire item 3 (see appendix 1).
Obviously, it is desirable to have a high R 2 for it implies a
high explanation of the phenomenon under study. For instance, the
regression analysis equation in table 8.4 shows a low R2 value (15
per cent) indicating that demographic and socio-economic variables
explain only a small proportion of the total variance of medicine
264
consumption. It is clear that, the b y R2 offers very useful
information for it implies that the criterion variable has other
predictors which account for 85 per cent of the variation in that
variable (consumption of medicine). More precisely, the results
suggest that the most variation in amount purchased medicine is not
explained by the set of demographic / socio-economic variables
used. However, the low R2 value may have arisen because the
variance within cells is great not because the relationship is weak
(Frank et al 1967). Since the F-statistic for the full model is
significant i.e, there is a relationship between the various
consumption levels and the consumer variables.
265
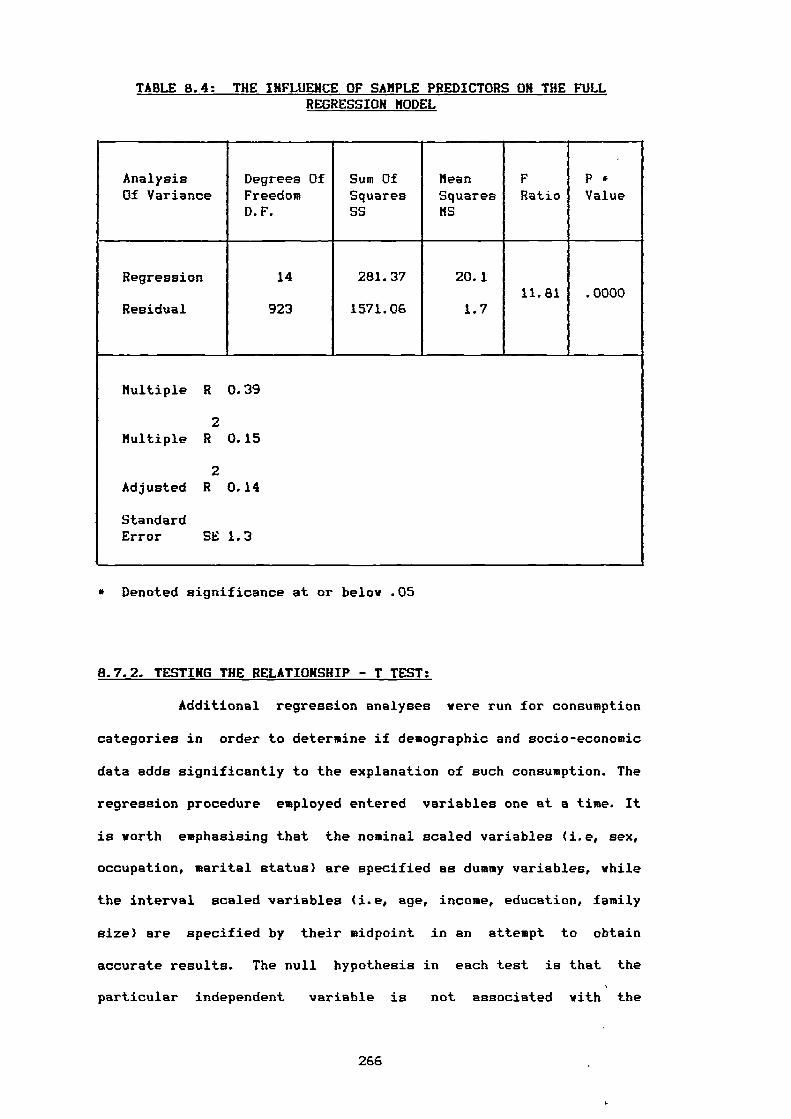
TABLE 8.4: THE INFLUENCE OF SAMPLE PREDICTORS ON THE FULL REGRESSION MODEL
AnalysisOf Variance
Degrees OfFreedomD.F.
Sum OfSquaresSS
MeanSquaresMS
FRatio
P *Value
Regression 14 281.37 20.111.81 .0000
Residual 923 1571.06 1.7
Multiple R 0.39
2Multiple R 0.15
2Adjusted R 0.14
StandardError SE 1.3
* Denoted significance at or below .05
8.7.2. TESTING THE RELATIONSHIP - T TEST:
Additional regression analyses were run for consumption
categories in order to determine if demographic and socio-economic
data adds significantly to the explanation of such consumption. The
regression procedure employed entered variables one at a time. It
is worth emphasising that the nominal scaled variables (i.e, sex,
occupation, marital status) are specified as dummy variables, while
the interval scaled variables (i.e, age, income, education, family
size) are specified by their midpoint in an attempt to obtain
accurate results. The null hypothesis in each test is that the
particular independent variable is not associated with the
266
dependent variable. If, the null hypothesis is rejected, the
variable should be included in the equation, but if the null
hypothesis is accepted the variable should be deleted from the
equation (Brown 1980).
By scanning the last column in table 8.5, we can assess the
acceptability of the null hypotheses as follow:
Ho(2) There is no significant relationship between the consumption
patterns of medicine and consumers' sex.
'We accept Ho, T-value (.740) is not significant.
Ho(3) There is no significant relationship between the consumption
patterns of medicine and consumers' age.
'We reject Ho, T-value (4.106) is significant.
Ho(4) There is no significant relationship between the consumption
patterns of medicine and consumers' income.
'We reject Ho, T-value (3.231) is significant.
Ho(5) There is no significant relationship between the consumption
patterns of medicine and consumers' occupation.
'We accept Ho, T-value (1.072, .294, -1.307, 1.580, -1.297,
-.259, .267) is not significant.
Ho(6) There is no significant relationship between the consumption
patterns of medicine and consumers' education.
'We accept Ho, T-value (-.251) is not significant.
Ho(7) There is no significant relationship between the consumption
patterns of medicine and marital status.
"We reject Ho, T-value (5.319) is significant.
Ho(8) There is no significant relationship between the consumption
patterns of medicine and family size.
"We reject Ho, T-value (2.046) is significant.
267

From the above hypotheses, ye can detect that four variables
out of seven are significant at the .05 level (age, income, marital
status, family size). The question of which variables are
candidated to retain according to Green and Tull ( 1978) is guided
by the number of predictors that are statistically significant.
268
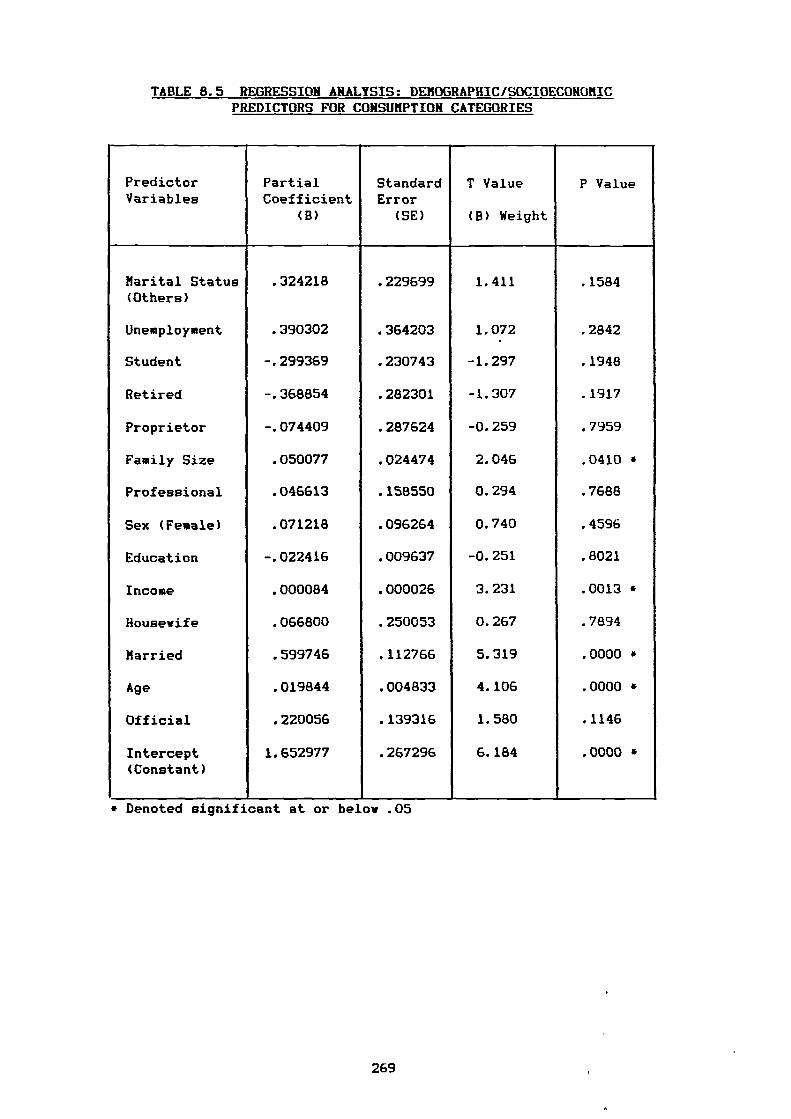
TABLE 8.5 REGRESSION ANALYSIS: DEMOGRAPHIC/SOCIOECONOMIC PREDICTORS FOR CONSUMPTION CATEGORIES
PredictorVariables
PartialCoefficient
(B)
StandardError
(SE)
T Value
(B) Weight
P Value
Marital Status .324218 .229699 1.411 .1584(Others)
Unemployment .390302 .364203 1.072 .2842
Student -.299369 .230743 -1.297 .1948
Retired -.368854 .282301 -1.307 .1917
Proprietor -.074409 .287624 -0.259 .7959
Family Size .050077 .024474 2.046 .0410 *
Professional .046613 .158550 0.294 .7688
Sex (Female) .071218 .096264 0.740 .4596
Education -.022416 .009637 -0.251 .8021
Income .000084 .000026 3.231 .0013 *
Housewife .066800 .250053 0.267 .7894
Married .599746 .112766 5.319 .0000 *
Age .019844 .004833 4.106 .0000 •
Official .220056 .139316 1.580 .1146
Intercept 1.652977 .267296 6.184 .0000 *(Constant)
* Denoted significant at or below .05
269
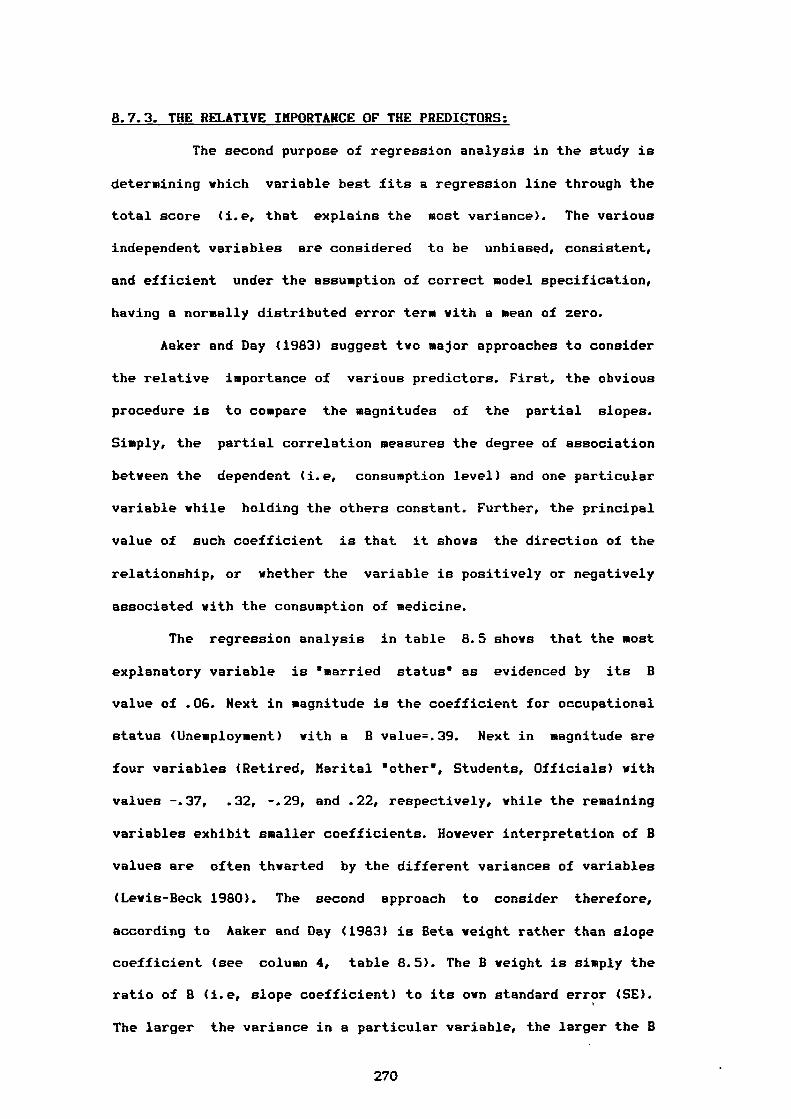
8.7.3. THE RELATIVE IMPORTANCE OF THE PREDICTORS:
The second purpose of regression analysis in the study is
determining which variable best fits a regression line through the
total score (i.e, that explains the most variance). The various
independent variables are considered to be unbiased, consistent,
and efficient under the assumption of correct model specification,
having a normally distributed error term with a mean of zero.
Aaker and Day (1983) suggest two major approaches to consider
the relative importance of various predictors. First, the obvious
procedure is to compare the magnitudes of the partial slopes.
Simply, the partial correlation measures the degree of association
between the dependent (i.e, consumption level) and one particular
variable while holding the others constant. Further, the principal
value of such coefficient is that it shows the direction of the
relationship, or whether the variable is positively or negatively
associated with the consumption of medicine.
The regression analysis in table 8.5 shows that the most
explanatory variable is 'married status' as evidenced by its B
value of .06. Next in magnitude is the coefficient for occupational
status (Unemployment) with a B value=.39. Next in magnitude are
four variables (Retired, Marital 'other', Students, Officials) with
values -.37, .32, -.29, and .22, respectively, while the remaining
variables exhibit smaller coefficients. However interpretation of B
values are often thwarted by the different variances of variables
(Levis-Beck 1980). The second approach to consider therefore,
according to Aaker and Day (1983) is Beta weight rather than slope
coefficient (see column 4, table 8.5). The B weight is simply the
ratio of B (i.e, slope coefficient) to its own standard error (SE).
The larger the variance in a particular variable, the larger the B
270

weight. In other words, the one with the largest 1-value can be
interpreted to be the one that is the least likely to have a zero
parameter.
Using the Beta weight, one would evaluate whether there is a
statistically significant relationship. The most influential
variables using this criterion therefore are: 1) married status
(B=5.319), 2) age (B=4.106), 3) income (B =3.231), and 4) family
size (B=2.046).
As we observed earlier from P-values (the last column)
married status, age, income, and family size are significant at
the .05 level. They provide a direct answer to the question: To
what extent are demographic and socio-economic associated with
different level of consumption categories ?
8.7.4. INTERPRETATION OF THE VARIABIFS RETAINED:
Four variables (i.e, married status, age, income, family
size) are worthy of note regarding the results of the previous
section which indicated that these variables do play a positively
significant role on medicine consumption. Married status appears to
play the greatest role while age comes in next in importance,
followed by income and family size. An attempt is made in this
section to rationalise these findings.
(i) Married Respondents:
Married respondents impact heavily on medicine consumption. The
married category dummy variable coefficient is significant and
positive indicating that in comparison with single and "other'
(i.e, divorced, separated, widowed), this category tends to spend
more on medicine. This result is not surprising because the married
271
group consume more medicine than their counterparts. On the one
hand, those married without children are almost always younger
starting their married life, they could worry about their health
and consume more medicine. On the other hand, married with children
tend to consume more medicine due to: a) the increase of family
members with the presence of children, and b) the majority of
families with children less than five years take their children
regularly to visit the doctors, so, the more visits to the doctor,
therefore the more the consumption of medicines.
The positive significance of the amount of medicine purchased
by married consumers confirms that this group of people can be
considered as one of the most important groups with respect to
consumption of medicine.
(ii) Respondents' Age:
The positive sign of the B-value indicates the older the
respondent the greater the consumption of medicine. This result
seems reasonable and can be interpreted as follows: a) generally,
it could be assumed that the older a person gets the more he/she
needs medicine and b) more specifically, the older consumers might
have incurable diseases such as diabetes or heart problems which
require regular consumption of medicine.
Generally speaking, the older consumers are an important group
which should be thought about, especially if we accept the above
assumed reasons.
272
(iii) Respondents' Income:
The positive sign shows that the consumption of medicine
increases as the income increases. There is no doubt that the
higher the income, the more the purchasing power. It is reasonable
to say that, on the one hand, the high income people are more
careful about their health, they can buy more VITAMINS or another
kinds of medicine out of prescription. On the other hand, as far as
the researcher knows, the higher income classes tend to visit their
physician or dentist regularly. The doctors might prescribe more
than one item to those patients. Furthermore, they could recommend
the imported items instead of the domestic ones. Therefore, the
switching from the domestic to the imported medicine (i.e, the more
expensive) increases the expenditure on medicine (our measure of
consumption). We can continue the interpretation further and say
that the higher income group consumes a greater quantity and
quality of food, this could be accompanied by some health problems
so the more health problems the more need of medicine.
It is interesting to turn the coin over and see the reverse
pattern(i.e, the poorer consumers have a lower consumption of
medicine). Such a result deserves a special remark. The lower
income people cannot overcome the scarcity of some kinds of
medicine by replacing the domestic products with imported
medicines. But medicine, unlike the other products it is a vital
consumer good, the high as well as the low income classes should
obtain their needs.
273
(IV) Family Size:
The results in table 8.5 shows how the increase of an extra
person in the family affects medicine consumption positively. This
finding comes as no surprise.
8.7.5. CONCLUSION:
There is a temptation to conclude that, the results of
multiple regression indicate four consumer characteristics impact
on medicine consumption. Generally, it appears that, marriage has
the greatest influence on consumption. In addition, the results
provide an answer to one of the two basic research questions in
this study: 'Are there any relationship among the various level of
consumer consumption patterns and the Egyptian demography and
Bocio-economy?. The answer seems to be yes. However, the findings
do suggest that, the consumption of medicine is a function of
broader influences than the consumer characteristics investigated.
It must be remmbered that consumer characteristics were adopted not
because they were initially presumed to be the major causes of
medicine consumption, but because the relationship among
consumption patterns and each of consumer variable might form a
basis of market segmentation.
8.8. SUMMARY:
In this chapter, we presented the findings and interpretation
of the data analysis in five major phases: a) reliability of
satisfaction scale, b) factor analysis findings, c) testing the
differences (ANOVA), d) ANOVA findings and e) multiple regression
analysis.
274
For testing the reliability of satisfaction scale, Cronbach's
Alpha was employed and shoved that the researcher had developed a
good reliable scale.
Twelve factors vere extracted and employed in the
interpretation of the underlying dimensions of satisfaction /
dissatisfaction. In addition, the degree of satisfaction with each
factor was calculated to determine how satisfied the Egyptian
consumers are with the provision of medicine.
ANOVA was utilized to test one of the fundamental hypotheses
of this study(i.e, there are no significant differences among
Egyptian consumers with different demographic and socio-economic
characteristics on the basis of their satisfaction with medicine
provision), the hypothesis was rejected. ANOVA was employed also to
explore the similarities / differences among Egyptian consumers
with different demographic and socio-economic characteristics on
the basis of their satisfaction with the twelve factors and the
statements.
Based upon the results of the multiple regression analysis, 1'-
tests were used to measure the other hypotheses of this research
(there is no significant relationship between consumer
characteristics and consumption patterns of medicine "in terms of
expenditure"), four of those hypotheses were rejected. In addition,
the relative importance of the predictors of regression model were
approached by calculating B weights and interpreted(see summary of
findings in chapter 9).
275
CHAPTER NINE
SUMMARY, IMPLICATIONS,
RECOMMENDATIONS AND CONCLUSIONS
9.1. Summary Of Findings.
9.2. Comparison Of This Study With The Previous Literature.
9.3. Implications Of The Study.
9.3.1. Implications For Researchers And Theorists.
9.3.2. Implications For Marketing Practitioners.
9.3.3. Implications For The Government.
9.4. Contributions Of The Study.
9.4.1. Theoretical Contribution.
9.4.2. Empirical Contribution.
9.4.3. Practical Contribution.
9.5. Recommendations For Future Research.
9.6. Concluding Comments.
276
9.1. SUMMARY OF THE FINDINGS:
Three types of analysis i.e, factor analysis, ANOVA, and
multiple regression analysis have been used to achieve the three
research objectives. In addition, the scale of satisfaction derived
from 41 attributes was tested using CRONBACH's ALPHA. The results
indicated that this scale provides a reliable measure of
satisfaction. Satisfaction attributes were factor analysed to
determine the underlying dimensions of consumer satisfaction with
the provision of medicines in the Egyptian market. The results
identified twelve factors (dimensions), packaging and labelling,
contributed most to the variance and were the factors with which
consumers were most satisfied. Consumers were least satisfied with
medicine price and availability of medicines.
ANOVA was used to test differences among Egyptian consumers
on the basis of their satisfaction with medicines. The findings
show there are differences in satisfaction among the consumers with
different demographic and socio-economic characteristics. ANOVA
was used to explore the nature of these differences and
similarities among the various categories of the Egyptian consumers
in their satisfaction with medicines. Sex and consumers from
different age groups, income levels and education levels did
exhibit different levels of satisfaction with some aspects of
medicine provision. But it is difficult to summarise the findings
as they were not clear cut and the results were explained in detail
in chapter 8.
Of the seven demographic / socio-economic variables employed
in the regression analysis, four were significant (i.e, married
status, age, income, family size ). In other words the results
indicate that these variables affect the consumption of medicines,
277
while the other variables (i.e, education, occupation, sex ) do not
influence on such consumption.
More importantly, two consumer variables (i.e, age, income)
affect the level of satisfaction / dissatisfaction and contribute
to the consumption of medicine. However, education levels and sex
which affect the level of satisfaction / dissatisfaction did not
explain the variation in consumption of medicine. Conversely,
family size which had the least effect on satisfaction /
dissatisfaction plays a significant role in the consumption of
medicine. Finally, concerning the variable marital status, married
people had the greatest influence on consumption while marital
status did not appear among the variables which affect the level of
satisfaction / dissatisfaction.
9.2. COMPARISON OF THIS STUDY WITH THE PREVIOUS LITERATURE:
The findings of the study are in line with the some of the
reviewed studies of the role of demographics and socio-economics in
consumer satisfaction which were presented in the fourth chapter.
However, as far as the researcher knows no studies have been
reported which measure consumer satisfaction in the area of
pharmaceuticals. The results of this work have therefore been
compared with those from other product fields.
Regarding the results of the extent of consumer satisfaction /
dissatisfaction, Wall et al (1978) investigated product performance
and consumer satisfaction. They found results which support our
findings such as: 1) the lower income categories exhibit a
relatively high level of satisfaction 2) younger consumers display
less satisfaction that do older consumers and 3) satisfaction
decreases as the level of education increases. Another earlier
278
studies in the field of consumer goods by Pickle and Bruce (1972)
and Pfaff (1976) concluded some results which confirm our findings
such as: 1) the younger the age group the higher the degree of
dissatisfaction, 2) the higher the level of education the higher
the level of dissatisfaction and (3) the higher the level of income
the higher the level of dissatisfaction (Pfaff 1976). The work of
Mason and Mimes (1973) found that the higher incomes classes
expressed themselves to be less satisfied than the lover income
groups with respect to some household appliances. Finally, the
findings of Lundstrom et al (1978) also support our work to some
degree they found that lover income people experience a much higher
level of dissatisfaction as opposed to higher income families.
Regarding the investigation of the relationship between
consumption patterns and consumer variables. Three earlier studies
are in agreement with our research finding. Firstly, family size
and age are demonstrated to be highly correlated with consumption
in the Crokett and Fried study in (1960). Secondly, the Goldstein
study (1968) focussed on consumer age and expenditure on various
categories of goods and services. The results demonstrated that
expenditure increased with increasing age of the head of the family
especially after 65. Thirdly, Coleman( 1960) concluded that income
is a good predictor of consumption patterns.
Other recent studies by Graner (1983) and Smith (1983a) in the
pharmaceutical field are also in line with our work. These studies
show that: 1) the elderly are the greatest users of medicines; 2)
the higher income the family, the more likely for its members to
seek medical attention (Smith 1983a).
279
9.3. IMPLICATIONS OF THE STUDY:
The findings of this study should be of concern to various
parties who have an interest in this field of study namely
marketing researchers, theorists, practitioners and the Egyptian
government.
9.3.1. IMPLICATIONS FOR RESEARCHERS AND THEORISTS:
To the marketing researcher, it should be of interest to
note the demographic and socio-economic variables found to be
important in discriminating between satisfied and dissatisfied
consumers as well as influencing the consumption of medicine. This
is useful for further research. The study also provides explicit
evidence that demographic and socio-economic variables are
associated with the consumption of medicine, supporting the
prevailing of marketing theory.
This work will also be of interest to marketing theorists
because, it provides considerable support for the conceptualization
of the satisfaction topic advanced throughout the literature review
and proposes a model of CS/D in chapter 5 which the researcher
feels is worthy of further verification.
9.3.2. IMPLICATIONS FOR MARKETING PRACTITIONERS:
The implication for marketing practice are more thought
provoking. It was been suggested (Howard and Hulbert 1973) that the
notion of consumer satisfaction as a part of the marketing concept
and good management in general is not widely accepted as a primary
company goal. This study tends to reinforce the importance of
consumer satisfaction. Four groups play an important role in the
market of medicines in Egypt, manufacturers, distributors, dOctors
280

and chemists and the results of this study have important
implications for each.
The findings may provide useful guide-lines for the
pharmaceutical companies (manufacturers). It is important for
manufacturers to give prime consideration to the price of medicines
and clarity of production and expiry dates on medicine labels with
which consumers exhibited a high degree of dissatisfaction. The
marketers may choose to adjust their programs to increase the
satisfaction of the already satisfied consumers while at the same
time increasing the satisfaction of the consumers who are at
present dissatisfied.
The findings have also implications for the distributors
because the results demonstrated the need for greater availability
of medicines without which levels of dissatisfaction will remain
high. The finding that consumers in the poor areas are less
satisfied with the availability of medicines has several
implications. One way to deal with this would be to determine the
range and the volume to be distributed in all areas on the basis of
the density of population in each area. Another way would be an
effective inventory of the flow of medicines through the
distribution cycle.
Generally, manufacturers and distributors have to strive to
increase medicine facilities in terms of products and outlets.
However, before taking specific action, further special studies
may be necessary.
Regarding doctors, the study found a high trend of
dissatisfaction in respect of doctors' failure to provide basic
information on the prescription form and to explain medicines'
positive / negative effects. Such findings have several
281
implications. On the one hand , doctors know that good prescribing
does not only mean choosing the right medicine, but also it
involves providing information which ensures that the medicine is
effectively used. On the other hand, there is no doubt that
medicines can be potentially harmful, many have side effects and
in some cases some patients become the victims of such medicines.
Many of these cases may have been avoided if the doctors had only
been a little bit more careful and more cautious about the side /
adverse effects of a medicine. It has been clearly shown that
patients who are told about the treatment are less anxious and take
medicines more sensibly and safely.
The ease with which medicine could be obtained without
prescription from chemists gives cause for concern. Pharmacists
should be more reluctant to sell medicine without doctors'
prescriptions. Many consumers feared inaccurate diagnoses and were
worried about the unnecessary and potentially harmful effects of
unsupervised long-term use of medicine. Pharmacists must be
dissuaded from such practices and government intervention seems to
be the only feasible approach to the problem.
9.3.3. IMPLICATIONS FOR THE GOVERNMENT:
The role of government in the market of medicines comes to
outweigh all the above roles. The government has a strong
humanitarian, political, and economic interest in maintaining and
restoring the health of its people. It must play a leading role in
protecting consumers and ensuring that consumers have access to
safe medicines. The findings of this thesis, summarised in the
first section have a number of important implications for the
government.
282
First, the problem of medicines' scarcity is not solely the
responsibility of the manufacturers and distributors. The
government must strive to ensure that consumers especially the
disadvantaged, have access to outlets with adequate stocks to
enable them to obtain at least the essential medicines.
Second, the problem of scarcity has been exacerbated by the
growth in the rate of consumption in recent years (see table 2.2).
Thus the government should encourage rational and economic use of
medicines. Efforts to solve this problem might include the
following:
A) Intensifying efforts to prevent doctors prescribing mainly to
please patients rather than to cure them.
B) Setting up education / guidance programs for consumers to help
ensure that medicines are used when needed.
Such programs would achieve the important benefits from medicines
and the consumer might understand his / her role as both patient
and consumer better.
Third, government could maintain its policy of making clear
the responsibility of the manufacturers and ensuring that medicines
suit the purpose for which they are intended. Consumers should
have the right to access to non-hazardous medicines. This is being
increasingly debated in the mass media.
Fourth, the price of medicine is clearly a problem. Over
ninety nine per cent of consumers stated their dissatisfaction with
the price of medicines. Undoubtedly, the shortage of raw material
in Egypt has an impact on the increase in medicine prices. This is
compounded by the fact that Egypt has had a serious foreign
exchange problem making imported raw materials expensive (see table
2.6). But accessible prices depends ultimately on how resources are
283
distributed and the degree of control over the prices throughout
the distribution cycle. Thus, the government cannot attribute the
whole price problem to the exchange rate.
Fifth, the findings detected that all the respondents in the
sample reported dissatisfaction with the plight of the elderly who
cannot get medicines at lover prices. A special study is needed to
determine the merit of this group, particularly the low income
elderly people.
Sixth, the results of the trend of dissatisfaction with the
services of the general hospitals deserve great consideration from
the government. More efforts to remedy this situation might include
a special study from the Ministry of Health.
In summary, this study has implications for all players in
the medicine arena. We have shown considerable consumer
dissatisfaction with medicines' provision in Egypt. The government
must work with manufacturers, distributors, doctors, and
pharmacists, decide which studies, strategies are the most
acceptable to ensure en adequate protection and better services for
the Egyptian consumers.
9.4. CONTRIBUTIONS OF THE STUDY:
The contributions of this study to consumer behaviour research
are theoretical, empirical and practical.
9.4.1. THEORETICAL CONTRIBUTION:
The bulk of the past studies have investigated the role of
consumer satisfaction with different products and consumer
characteristics. This study pointed out the need to investig'ate
consumer satisfaction as well as consumption patterns of a vital
284
product (medicine) . This research contributed to increase the
knowledge of consumer attitudes and behaviour in relation to
demographic and socio-economic variables in the critical area of
consumer health. In addition, the research contributed
theoretically by building a conceptual model of consumer
satisfaction.
9.4.2. EMPIRICAL CONTRIBUTION:
This study is an empirical study using analysis techniques
not used before in the market of medicines in Egypt. It is a small
part of the growing body of published work in marketing research
utilizing statistical analysis. Further, the derived satisfaction
scale with such a high reliability is itself a major contribution
of this study, that could used in further research. There have
been no published studies to the researcher's knowledge which deal
empirically with the question of the extent of consumer
satisfaction with medicine provision and whether or not there are
relationships between consumer characteristics and consumption of
these important consumer products.
9.4.3. PRACTICAL CONTRIBUTION:
The results of this study are of particular interest to the
Egyptian government giving the government grounds for increasing
control over the medicine sector in Egypt and supporting consumers'
health and public welfare by:
1) Reviewing and improving the current legislation on packaging and
labelling to increase consumer satisfaction in this sector. That
consists of the following actions:
285
a) The government's regulations could ensure that tamper-resistant
packaging is in force in all the pharmaceutical companies of the
public sector. So far, the tamper-resistant packaging has been
brought on a small scale into the investment sector of
pharmaceuticals (see part two in chapter 2).
b) To ensure adequate safety and effectiveness for all kinds of
medicines, the label on medicines' packaging should be improved
to provide the consumer / patient with complete and necessary
information.
2) Developing new legislation on manufacturing practices through
raising the requirements for licensing pharmaceutical companies.
Such action along with the current medical control (see part two
in chapter 2) will reduce the possibility of a harmful medicine
reaching a patient and thereby might improve the health of
society.
3) Guiding the pharmaceutical companies to avoid marketing
malpractice in the provision of medicine and offering the best
service possible. That could be acheived through:
a) Establishment of a market research department in DOCMA able to
identify the needs and wants of consumers. That department could
take demographic and socio-economic characteristics into
consideration and ensure that a wide range of medicines was
offered by the pharmaceutical companies to most important
segments of consumers who represent the heavy consumers of
medicines (i.e., married people, older consumer, higher income,
larger families).
b) Reorganization of the distribution system of the investment
sector of pharmaceuticals through the supervision of DOCMA,
286
since the distribution policy at present varies according to the
company's main objectives in the market place.
D) Providing a deeper insight into the role of doctors and
pharmacists in increasing society relief. The Ministry of Health
should have a special department directly responsible for
supervising and following the action of all doctors and
pharmacists. On the one hand to prevent doctors from the habit
of overprescribing; on the other hand to encourage pharmacists
not to dispense any kind of medicine unless on the doctors'
prescription.
9.5. RECOMMENDATIONS FOR FUTURE RESEARCH:
The results of this study should potentially encourage
scholars, especially as this study is the first empirical project
investigating consumer behaviour in the medicine market and
exploring the phenomenon of satisfaction and consumer attitudes and
opinion in Egypt in this product field.
The new model of consumer satisfaction needs further
verification through further consumer satisfaction studies which
concentrate on the role of consumer involvement and personal
values in satisfaction. The link between consumption patterns of
medicine and demographic socio-economic variables will hopefully
encourage a reexamination of the role of these variables for
further research.
A significant question that remains for future research in
respect of the strength of the relationship in the regression model
is: can the variation explained in the consumption increase if we
added other predictor variables to the regression equation”. Thus
there is still a need for more research to know whether the
287
analysis can be enriched by expanding the number of the explanatory
variables in the equation.
It is important that marketing researchers continue research
in this area so that the entire picture of consumer satisfaction of
the provision of medicine can be described. In general, the results
of this work offer many opportunities for further research.
9.6. CONCLUDING COMMENTS:
The main stimulus for this thesis was a research study which
purported to identify satisfaction / consumption segments. Although
no clear segments emerged, the study found that sex, age, income
and education affected the degree of satisfaction and
dissatisfaction with different aspects of medicine provision.
Whilst, marital status, age, income and family size influence the
consumption of medicine products. Also, the medicine attributes
examined in this study were shown to provide a highly reliable
scale of satisfaction.
The large size of the sample and the careful selection of the
sample elements give us confidence that our findings are
representative of the whole Egyptian population.
It is satisfing to report that the research directly answered
the two research questions:
1) To what extent are consumer satisfied with the provision of
medicines in the Egyptian market?
2) Are there any relationships among the various levels of
consumers' consumption patterns and the Egyptian demography and
socio- economy?
288
REFERENCES
Aaker,D.A., (1971), Multivariate Analysis In Marketing Theory And Application, Wadsworth, Inc., California.
Aaker,D.A., and Day,G.S., (1983), Marketing Research, 2nd. ed.,Johen Wiley and Sons, New York.
Aaker,D.A., and Day,G.S., (1986), Marketing Research, 3rd. ed.,Johen Wiley and Sons, New York.
Allport,G.W., (1935), Attitudes, In Handbook Of Social Psychology, Murchinson Worcester eds., Mass: Clark University Press.
Aldenderfer,M.S., and Blashfield,R.K., (1984), Cluster Analysis,Series, Quantitative Application In The Social Sciences,Sage Publications,Inc.,U.S.
Anderberg,M.R., (1973), Cluster Analysis For Application, AcademicPress, Hew York.
Anderson,R.E., 1973, Consumer Dissatisfaction: The Effect ofDisconfirmed Expectancy Of Perceived Product PerformanceJournal Of Marketing Research. 10, February, PP 38-44.
Andreasen,A.R., (1976), A Taxonomy Of Consumer Satisfaction /Dissatisfaction Measures, In Hunt,H.K. ed.. Conceptualization and Measurement Of CS/D, Proceeding Of Conference, Marketing Science Institution,
Andreasen,A.R., (1977a), Consumer Dissatisfaction And MarketPerformance, In Sheth, nevi and Leopardi, eds., Proceeding Of The Fourth International Research Seminar In Marketing,Foundation For Management Education.
Andreasen,A.R., (1977b), Consumer Dissatisfaction As A Measure OfMarket Performance, Journal Of Consumer Policy, 1, Fall,PP 309-21.
Andrev,F., and Withey,S.B., (1976), Social Indicators Of Well -Being, Plenum, New York.
Arndt,J., (1978), Family Life Cycle As Determinant Of Size AndComposition Of Household Expenditures, In William And Wilkie eds., Advances In Consumer Research, Proceeding Of The Association For Consumer Research, Florida.
Ash,S.B., (1978), A Comprehensive Study Of Consumer SatisfactionWith Durable Products, In Advances In Consumer Research,In Hunt.H.K., ed.. An Arbor: Michigan, Association For Consumer Research.
Assael,H., (1987), Consumer Behaviour, 3rd. ed., Wadsworth, Inc.,U.S.
289
Barbeau,J.B., (1985), Predictive and Normative Expectation inConsumer satisfaction: Autilization Of Adoption AndComparison In An Unified Framework, In Hunt and Day eds.,combined Proceeding Conference, Louis State University,Phoenix, Arizona.
Barksdale,H.C., and Perreault,W.D., (1980), Can Consumer BeSatisfied, MSU Business Topics, Spring, PP 19-30.
Barry,T.E.; Gilly,M.C., and William,R., (1982), Students AsConsumers Predicting Satisfaction , In Walker, Bearden, Murphy, Nevin And Olson eds., An Assessment Of Marketing Thought And Practice, American Marketing Association, Chicago, Illinois.
Bearden,O.W., (1983), Profiling Consumers Who Register ComplaintsAgainst Auto Repair Services, Journal Of consumer Affairs,17, 2, Winter, PP_313-35.
Becker,B.W., (1972), Consumerism: An Interpretation, Journal Of Marketing, 36, October, PP 61-5.
Becker,B.W., and Connor,P.E., (1981), Personal Values Of The HeavyUser Of Mass Media, Journal Of Advertising Research, 21, 5. October, PP 37-43.
Belson,W.A., (1982), The Design And Understanding Of Survey Questions, Golfer Publishing Co., Britain.
Belson,W.A., (1985), Validity In Survey Research, Gover PublishingCo., Britain.
Bending,A.v., (1953), The Reliability Of Self Rating As A FunctionOf The Amount Of Verbal Anchoring And Of The Number OfCategories One The Scale, Journal Of Applied Psychology,37, 1. PP 38-41.
Berry,W.D. and Feldman,S., (1985), Multiple Regression In Practice Series Quantitative Application In The SocialScience, Sage Publication, Inc, U.S.
Bloch,P.H., (1982), Involvement Beyond The Purchase Process:Conceptual Issues And Empirical Investigation, In Advances In Consumer Research, Mitchell,A.A., ed., An Arbor. Mich: Association For Consumer Research.
Blum,R. and Kreitman,K., (1981), Factors Affecting Individual UseOf Medicines, In Blum; Herxheimer; Stenzl; and Woodcock eds.,Pharmaceutical And Health Policy: International Perspectives On Provision And Control Of Medicines, Croon Helm, London.
Bockman,V.M., (1971), The Herzberg Controversy, Personnel Psychology, 24. Summer, PP 155-89.
Bohrnstedt,G.W., (1977), Reliability And Validity AssessmentAttitude Measurement, In Summer,G.F., ed., Kershaw Publishing co., London.
290
Boote,A.S., (1981a), Market Segmentation By Values And SalientProduct Attributes, Journal Of Advertising Research, 21, 1, February, PP 29-35.
Boote,A.S., (1981b), Reliability Testing Of Psychographic Scale,Journal Of Advertising Research, 21, 5, October, PP 53-60.
Borchert,G., (1989), Drug Information In TV Advertising, Journal Of Consumer Policy, 12, PP 371-380.
Borgenhammer,E., (1989), Patients' Right And Informed Consent:Swedish Experiences, Journal Of Consumer Policy, 12, PP 277- 294.
Boven,L., and Chaffee,S.H., (1974), Product Involvement AndPertinent Advertising Appeals, Journalism Quarterly, 51, PP 613-21.
Boyd,H.W.; Westfall,R. and Stach,S.F., (1977), Marketing Research: Text And Cases, Richard, D. Irvin, U.S.
Bozinoff,L., and Cohen,R., (1982), The Effects Of Personal ValuesAnd Situation On Product Attribute Importance, In Asseseement Of Marketing Thought And Practice, Edited By Waker,Bearden,Darden, Murphy, Nevin, Olson And Weitz, American Marketing Association, Chicago.
Braithraite,J., (1983), Corporate Crime In The Pharmaceutical Industry, Routledge And Kegan, London.
Broffman,M.H., (1971), Is Consumerism Merely Another MarketingConcept?, MUS Business Topics, Winter, PP 15-21.
Brown,F.E., (1980), Marketing Research: A Structure For Decision Making, Addision, Wesley Publishing Co., Inc., U.S.
Buskirk,R.H., and Rothe,J.T., (1970), Consumerism: AnInterpretation, Journal Of Marketing, 34, October, PP 61-5.
Buzzell,R.D.; Cox,D.F., and Brown,R.V., (1969), Marketing Research And Information System: Text And Cases, MC Gra y Hill, NewYork.
Campbell,D.T., and Fiske,D.W., (1959), Convergent And DiscriminantValidation By Mltitraite-Multi-Methods Matrix, Psychological Bulletin, March, PP 81-105.
Cardozo,R.H., (1964), Customer Satisfaction: Laboratory Study AndMarketing Action, In Kaplan,R.M., ed., Proceeding Of Conference, American Marketing Association, Chicago.
Carlsmith,J.M., and Aronson,E., (1963), Some Hedonice ConsequencesOf The Confirmation And Disconfirmation Of Expectation,Journal Of Abnormal And Social Psychology, 66, February,PP 151-6.
291
Carmen,J.A., (1965), The Application Of Social Class in Market Segmentation, Institute Of Business And Economic Research,University Of California, U.S.
Carmines,E.G., and Zeller,R.A., (1979), Reliability And Validity Assessment, Quantitative Application In The Social ScienceSage Publication, Inc.,U.S.
Cavusgil,S.T., and Kaynak.E., (1982), A Framework Of Cross-CulturalMeasurement Of Consumer Dissatif action, In Hunt And Day eds,New Finding On Consumer Satisfaction And Complaining Behaviour. Proceeding Of Conference, Bloomington, Indiana.
Cattell,R.B., (1978), The Scientific Use Of Factor Analysis In Behaviour And Life Science, Plenum Press, New York.
Chappell,S.C., (1983), Market Analysis, In Smith.M.C.ed., Principles Of Pharmaceutical Marketing, Lea And Febiger, US.
Chew,R., (1985), Pharmaceuticals In Seven Nations, Office Of HealthEconomics, London.
Churchill,G.A., (1976), Marketing Research, The Dryden Press,Illinois, U.S.
Churchill,G.A, (1979), A Paradigm For Developing Better Measures OfMarketing Constructs, Journal Of Marketing Research, 16 February, PP 64-73.
Churchill,G.A., and Suprenant,C., (1982), An Investigation Into TheDeterminant Of Customer Satisfaction, Journal Of Matketing Research, 19, November, PP 419-504.
Churchill,G.A., and Peter,J.P., (1984), Research Design Effects OnThe Reliability Of Rating: A Meta-Analysis, Journal Of Marketing Research, 16, November, PP 360-75.
Churchill,G.A., (1987), Marketing Research: Methodological Foundation, 4th ed., Holt, Rinehart And Wislon, NewYork.
Clarke,J., (1959), Measuring Alienation Within A Social System,American Sociological Review, 24, December, PP 53-62.
Cocks,D.L., (1983), Economic And Competitive Aspects Of ThePharmaceutical Industry, In Smith,M.C. ed., Principles Of Pharmaceutical Marketing, Lea And Febiger, US.
Cohen,D., (1981), Consumer Behaviour, 1st ed., Random House, Inc.,New York.
Coleman,R.P., (1960), The Significance Of Social Stratification InSelling: A Maturing Discipline, In Martin,L.B.. ed., American Marketing Association, Chicago.
Corsuch,A., (1973), Using Bartilett's Significance Test ToDetermine The Humber Of Factors To Extract, Educational And Psychological Measurement, 33, Summer, PP 361-64.
292
Crawford,I.M., and Lomas,R.A., (1980), Factor Analysis: A Tool ForData Reduction, European Journal Of Marketing, 14, PP 414
-21
Crokett,J., and Fried, I., (1960), A Complete Set Of Consumer DemandRelationships, In Fried And Jones eds., Consumption And Saving, Study Of Consumer Expenditure, University OfPhiladelphia
Crosby,L.A.; Gill,J.D., and Lee,R., (1983), Life Style And Age AsSurrogate Predictors Of Value Orientation, Paper Presented At The Personal Values And Consumer Behaviour Workshop,University Of Mississippi.
Czepiel,J.A.; Rosenberg,L.J., and Akerele,A., (1974), PerspectiveOn Consumer Satisfaction, In Curhanied,R.C. ed.,Proceeding Of Conference, American Marketing Association, Chicago.
Czepiel,J.A., and Rosenberg,L.J., (1976), The Study Of ConsumerSatisfaction: Addressing The 'So What Question", In Hunt, H. K. ed., Proceeding Of Conference, Marketing Science Institute
Darvall,L.W., (1980), The Pharmaceutical Industry: PrescriptionDrug Information Control In Australia And The United States,Nonash University Lay Review, 7, PP 39-51.
Day,G.S., and Aaker,D.A., (1970), A guide To Consumerism, Journal Of Marketing, 34, July, PP 12-19.
Day,G.S., (1970), Buyers Attitude And Brand Choice, Free Press, HewYork.
Day,R.L., (1976), Toward A Process Model Of Consumer Satisfaction,Conceptulization And Measurement Of CS/D, In Hunt,H.K. ed., Proceeding Of Conference, Marketing Science Institute.
Day,R.L., and London,E.L., (1976), Collecting ComprehensiveConsumer Complaint Data By Survey Research, In Beverlee And Anderson eds., Advances In Consumer Research, Association ForMarketing Research.
Day,R.L., (1977), Extending The Concept Of Consumer Satisfaction, inWilliam, P. ed., Advances In Consumer Research, Atlanta,Association For Consumer Research.
Day,R.L., (1980), Research Perspectives On Consumer ComplainingBehaviour, In Lam and Dunne eds., Theoretical Development, Marketing Association, Chicago.
Day,G.S., (1982), Are Consumers Satisfied, In Aaker and Day eds., Consumerism: Search For The Consumer Interest, 4th ed., FreePress, New York.
Dean,D.G., (1960), Alienation: Its Meaning And Measurement,American Sociological Review, 26, PP 753-58.
293
Diener,B.J., (1975), Information And Redrees: Consumer Heeds And Company Response, The Case Of The Personal Care Industry,Marketing Science Institute, Cambridge.
Dijkstra,W. and Zouven,J.V., (1982), Response Behaviour In The Survey-Interview, Academic Press, London.
Druker,P., (1969), Consumerism In Marketing, A Speach To Rational Association Of Manufacturers, Hev York.
Dvyddar,R., (1989), The Availability Of Medicine And Methods ForRemedy, Journal Of El-Ahram, January, 27.
Elbeck,M., (1987), An Approach To Client Satisfaction MeasurementAs An Attribute Of Health Services Quality, Health Care Management Review, 12,3, PP 47-52.
Engel,J.F., and Light,M.L., (1968), The Role Of PsychologicalCommitment In Consumer Behaviour: An Evaluation Of The RoleOf Cognitive Dissonance, In King And Pressimies eds., Application Of The Sciences In Marketing, Bass, In King andPressisier eds., New York.
Engel,J.F.; Blackvell,R.D., and Miniard,P.W., (1986), Consumer Behaviour. 5th ed., The Dryden Press, U.S.
England,G.W., (1967), Personal Values System Of The AmericanMangers, Academy Of Management Journal, 16, March, PP 53 -68.
Engledov,J.L., (1977), Was Consumer Satisfaction A Pig In A Poke?'Business Horizons, 20, April, PP 87-97.
Everitt,B., (1980), Cluster Analysis, 2nd ed., Halsted Press, JohnWiley And Sons, Hew York.
Ferm,M.A., (1983), Marketing Generic Drugs, In Smith,M.C. ed.,Principles Of Pharmaceutical Marketing, Lea And Febiger, US.
Festinger,L., (1957), A Theory Of Cognitive Dissonance, StanfordUniversity Press, U.S.
Fink,A., and Kosecoff,J., (1985), How To Conduct Surveys: A Step By Step Guide, Sage Publication, Inc., U.S.
Fishbein,M., and Ajzen,I., (1975), Attitude Intention And Behaviour: An Introduction To The Theory And Research,Reading, Mass: Addison-Wesley, U.S.
Frank,R.M.; Douglas,J.T. and Ronald,T.L., (1967), An Analysis OfSocio-economic - Related Market Segments For GroceryProducts, In Krannert,H.c. ed., School Of Industrial Administration Purdue University, Indiana.
Frank,R.E.; Massy,W.F., and Wind,Y., (1972), Market Segmentation,Prentice Hall, Inc, Cliffs, New York.
294
Freedman,J.L., (1964), Involvement, Discrepancy, And Chang, Journal Of Social Psychology, 69, September, PP 290-95.
Freedman,D.S., (1968), The Impact On The Consumption Of ModernDurables, In King,K.L. ed., Marketing And New Science Of Planning, Yerginia Polytechnic Institution, Proceeding OfConference.
Friedman,H.P., and Rubin,J., (1967), On Some Ivariant Criteria ForGrouping Data, Journal Of American Statistical Association,62, 1159-75.
Gagnon,J.P., (1983), Physician Prescribing Habits, In Smith,N.C. ed., Principles Of Pharmaceutical Marketing, Lea And Febiger, US.
Gaedeke,R.M., (1972), Filling And Disposition Of Complaints: SomeEmpirical Evidence, Journal Of Consumer Affairs, 6, Summer, PP 45-56.
Gardner.P., and Watson,L., (1970), Adverse Drug Reaction: APharmacist-Based Monitoring System, Clinical Pharmacology Therapeutics, 11, PP 802-808.
Gilly,M.C., (1980), Complaining Consumers And The Concept OfExpectation, In Refining Concepts And Measures Of Consumer Satisfaction Behaviour, Hunt And Day eds., Proceeding Of Conference, Bloomington, Indiana.
Gist,R.r., (1974), Marketing And Society: Text And Cases, 2nd, ed.,Dryden Press, U.S.
Goldstein,S., (1968), The Aged Segment Of The Market, 1950 And1960, Journal Of Marketing. 32, April, PP 62-8.
Goodman,J., (1989), The Nature Of Consumer Satisfaction, Quality Progress, Febraury, PP 37-40.
Graner,D.D., (1983), The Retailer, In Suith,M.C. ed., Principles Of Pharmaceutical Marketing, Lea And Febiger, US.
Green,R.T., and Cunningham,I.C., (1975), Feminine Role PerceptionAnd Family Purchasing Decision, Journal Of Marketing Research, 12, August, PP 325-32.
Green,P.E., (1978), Analyzing Multivariate Data, Dryden Press, NewYork.
Green,P.E., and Tull,D.S., (1978), Research For Marketing Decisions, 4th ed., Prentice Hall, Inc, Englewood, Cliffs,New Jersey.
Gronroos,C., (1983), Strategic Management In The Service Sector,Cambridge MA, Marketing Science Institute.
Hajda,J., (1961), Alienation And Integration Of StudentIntellectuals, American Sociological Review, 26, PP 758-78.
295
Hafez,A., (1989), The Historical Development Of The Pharmaceutical
Sector In Egypt, A Series Studies In The PharmaceuticalIndustry In Egypt.
Hair,J.F.; Anderson,R.E., and Tatham,R.L., (1987), MultivariateData Analysis, 2nd ed., Macmillan Publishing Co., U.S.
Handy,C.R., (1976), Monitoring Consumer Satisfaction,Conceptualization And Measurement Of CS/D, In Hunt,H.K. ed., Proceeding Of Conference, Marketing Science Institute.
Hample,D.J., (1977), Consumer Satisfaction With The Home BuyingProcess, Conceptualization Of CS/D, In Hunt,H.K. ed., Marketing Science Institute, Cambridge.
Hancher,L., (1987), Regulation Drug Promotion: The UK Experience,Journal Of Consumer Policy, 10, 4, December, PP 383-407.
Hansen,F., (1981), Hemispherical Lateralization: Implication ForUnderstanding Consumer Behaviour, Journal Of Consumer Research, 8, PP 23-36.
Hanson,R., (1979), The Pharmaceutical Development Process: EstimateOf Development Costs And Times And The Effects Of ProposedRegulatory Changes, In Issues In Pharmaceutical Economics, Chien,R./. ed., Lexington Mass: Lexington Books.
Hart,D., (1989)., Drug Safety As A Means Of Consumer Protection:The Approximation Of La ys In The EC Medical Products MarketAnd Its Limitation, Journal Of Consumer Policy, 12, PP 343 -355.
Haves,D.K., and Arndt,A., (1979), Determining ConsumerSatisfaction Thought And Benefit Profiling, European Journal Of Marketing, 13, 8, PP 285-98.
Heller,R.M., and Ray,M.L., (1972), Measure Validation In Marketing,Journal Of Marketing Research, 9, November, PP 361-70.
Hemminki,C., (1975), Review Of Literature On The Factors AffectingDrug Perscribing, Social Science And Medicine, PP 90-111.
Herxheimer,A., and Stimson,G., (1981), The Use Of Medicines ForIllness, In Blum; Herxheimer; Stenzl; And Woodcock eds., Pharmaceutical And Health Policy: International Perspectives On Provision And Control Of Medicines, Croon Helm, London.
Herxheimer,A., and Davies,C., (1982), Drug Information ForPatients: Bring Together The Messages From Prescriber,Pharmacist And Manufacturer, Journal Of The Royal College OfGeneral Practitioners, 32, Febraury, PP 93-97.
Herzberg,F; Mausner,B., and Snyderman,A., (1959), The Motivation To Work, Wiley, Inc., New York.
Holbert,H.B., (1974), Point Of View: On Validity In Research,Journal Of Advertising Research, 14, Febraury, PP 51-2:
296
Houston,M.J., and Rothschild,M.J., (1978), Conceptual AndMethodological Foundation Of Involvement, Research Frontiers In Marketing, In Jain,S.C., ed., American Marketing Association, Chicago.
Houston,F.S., (1986), Marketing Concept: What It Is And What It IsNot, Journal Of Marketing,50, April, PP 81-7.
Hovland,C.I.; Harvey,O.J., and Sherif,M., (1957), Assimilation AndContrast Effect In Reaction To Communication And AttitudeChange, Journal Of Abnormal Psychology, 55, PP 244-52.
Howard,J,A., and Sheth,J.H., (1969), The Theory Of Buyer Behaviour,John Wiley And Sons, Inc., New York.
Howard,J.A., and Hulbert,J., (1973), Advertising And PublicInterest, Staff Report To The Federal Trade Commission, Washington.
Howard,J.A., (1977), Consumer Behaviour: Application Of Theory, McGray Book Co., New York.
Hughes,D.A., (1976), An Investigation Of The Relation Of SelectedFactors To Consumer Socialization, Conceptulization And Measurement Of CS/D, In Hunt,H.K. ed., Proceeding Of Conference, Marketing Science Institute.
Hunt,H.K., (1976), Overview And Research Direction,Conceptualization Of CS/D, In Hunt,H.K. ed., Proceeding Of Conference, Marketing Science Institute.
Hulin,C.L., and Waters,L.K., (1971), Regression Analysis Of ThreeVariation Of The Two Factors Theory Of Job Satisfaction,Journal Of Applied Psychology, 55, PP 211-17.
Hustad,T.P., and Pessmier,E.A., (1971), Industry Use Of Life StyleAnalysis: Segmenting Consumer Market With Activity AndMeasures, Combined Conference Proceeding, In Willis., A. ed.,Aserican Marketing Association.
Inglis,J., and Johnson,D., (1970), Some Observation And DevelopmentIn The Analysis Of Multivariate Survey Data, Journal Of The Market Research Society, 12, April, PP 75-98.
Jackson,B.B., (1983), Multivariate Data Analysis, Richard D., IrwinInc., U.S.
Jain,A.K.; Pinson,C., and Ratchford,B.T., (1986), Marketing Research: Application And Problens, John Wiley And Sons, NewYork.
James,B.G., (1979), Pharmaceuticals: Re-thinking Our Besiness,Medical Marketing And Media, June, PP 19-24.
James,B.G., (1983), International Marketing, In Smith,M.C. ed., Principles Of Pharmaceutical Marketing, Lea And Febiber, US.
297
Kanungo,R.N., (1979), The Concept Of Alienation And InvolvementRevisited, Psychological Bulletin, 86, PP 119-38.
kapferer,J.N., and Laurent,G., (1985), Consumer InvolvementProfiles: A New Practical Approach To ConsumerInvolvement, Journal Of Advertising Research, 25, December, 6, PP 48-56.
Kassarjian,H.H., and Robertson,T.S., (1973), Perspective In Consumer Behaviour, Scott, Foeman And Co., U.S.
kassarjian,H.H., (1981), Low Involvement: A Second Look, InMonroe,K.B ed., Advances In Consumer Research, Ann Arbor, Mich., Association Of Consumer Research.
Katz,D., (1960), The Functional Approach To Study Of Attitudes,Public Opinion Quarterly, 24. Summer, PP 163-204.
Kinnear,T.C., and Bernhart,K.L., (1986), Principals Of Marketing,2nd ed., Scott, Forman And Co., U.S.
kinnear,T.C., and Taylor,J.R., (1987), Marketing Research: AppliedApproach, 3rd ed., McGraw Hill, New York.
Knapp,D.E., and Oeltjen,P.D., (1972), Benefits To Risks Ratio InPhysician Drug Selection, American Journal Of Public Health, 62, 10, PP 1346-1352.
Kohn,R., and White,K., (1976), Health Care: An International Study, Report Of The World Health Organization, InternationalCollaborative Study Of Medical Care Utilization, OxfordUniversity Press, London.
Kollat,D.T., and Willett,R.P., (1967), Customer Impulse PurchasingBehaviour, Journal Of Marketing Research, 4, February, PP 21 -31
Kopenen,A., (1960), Personality Characteristics Of Purchasers,Journal Of Advertising Research, 1, PP 6-12.
Kotler,P., (1972a), Marketing Management, 2nd ed., Prentice HallU.S.
Kotler,P., (1972b), What Consumerism Means For Marketers, Harvard Business Review, May-June, PP 48-57.
Kotler,P., (1976/84), Marketing Management: Analysis, Planning And Control, Englewood Cliffs, Prentice Hall, U.S.
Krishnan,S. and Valerie,A., (1979), Dissatisfaction Attribution AndConsumer Complaint Behaviour, In William.L.W. ed., Advances In Consumer Research, Ann Arbor: Association For Consumer Research.
Lambert,Z.V., and Kniffin,F.W., (1975), Consumer Discontent: ASocial Perspectives, California Management Review, Fall, PP 36-44.
298
Lambert,Z.V., (1980), Consumer Alienation, General DissatisfactionAnd Consumerism Issues: Conceptual And ManagerialPerspectives, Journal Of Retailing, 56, 2, Summer, PP 3- 24.
Lancaster,K., (1969), Introduction To Modern Micro-Economices, RandMcNally And Company, Chicago.
Lancaster,K., (1971), Consumer Demand: A New Approach, ColumbiaUniversity Press, New York.
La Tour,S.A., and Peat,H.C., (1979), Conceptual And MethodologicalIssues In Consumer Satisfaction Research, Advances Of Consumer Research, In William,L.W., ed., Proceeding Of Conference, Association Of Marketing Research.
Leavitt,C., (1976), Consumer Satisfaction As The Ultimate LifeForce, In Anderson,B.B., ed., Advances In Consumer Research,Association For Marketing Research.
Leffler,K.B., (1981), Persuasion Or Information? The Economics OfPrescription Drug Advertising, Journal Of Law And Economics, 24, PP 45-74.
Lehmann,D.R., (1989), Market Research And Analysis, 3 ed., RichardD Irwin, U. S.
Lessing,V.P., and Tollefson,J.0., (1971), Marketing SegmentationThrough Numerical Taxonomy, Journal Of Marketing Research,8, November, PP 480-87.
Lessing,V.P., (1976), Measurement Of Dependencies Between ValuesAnd Other Levels Of Consumer's Beliefs Space, Journal Of Business Research, 3. 3, PP 227-239.
Levin,M.B., (1960), The Alienation Voter, Holt, Rinehart AndWinston, New York.
Lewis-Beck, (1980), Applied Regression: An Introduction, Series OfQuantitative Application In The Social Sciences, SagePublication, Beverly Hills, London.
Lidstone,J., and Collier,T., (1987), Marketing Planning For ThePharmaceutical Industry, Gower Publishing, Great Britain.
Liefeld,J.P.; Edgecombe,F.H., and Wolfe,L., (1975), DemographicCharacteristics Of Canadian Consumer Complainers, Journal Of Consumer Affairs, 9, Summer, PP 73-80.
Locke,E.A., (1976), The Nature And Cases Of Job Satisfaction, inDunnette ed., Handbook Of Industrial And Organization Psychology, Rand Mc Nally College Publishing Co., U.S.
London,E.L., (1977a), Consumer Research Orientation DifferencesBetween Industry And Government, Conceptualization And
Measurement Of CS/D, In Hunt,H.K. ed., Proceeding Of Conference, Marketing Science Institute.
299
London,E.L., (1977b), A Model Of Consumer Complaint Behaviour, InCS/D And Complaining Behaviour, Day.L. ed., Proceeding Of Conference, School Of Business, University Of Indiana.
Luck,D.J.; Wales,H.G.; Taylor,D.A., and Rubin,R.S., (1982),Marketing Research, 6th ed., Prentice Hall, Inc., U.S.
Luck,D.J., and Rubin,R.S., (1987), Marketing Research, 7th ed.,Prentice Hall, Inc, U.S.
Lundstorm,W.J and Kerin,R., (1976), Psychological And DemographicCorrelates Of Consumer Discontent, Proceeding Of Conference Of The American Institute Of Decision Sciences.
Lundstrom,W.J.; Skelly,G.U., and Sciglimpaglia,D., (1978), How DeepThe Roots Of Consumer Discontent?: A Study Of RuralConsumers, In Day And Hunt eds., New Dimensions Of CS/D And Complianing Behaviour Bloomington, Indiana.
Lutz,R.J., (1975), Changing Brand Attitudes Through Modification OfCognitive Structure, Journal Of Consumer Research, 1, PP 49 -59.
Maier,J.R., (1986), Segmentation Allocation And Direction In ThePharmaceutical Industry, In Cowell And Collis eds., MarketingEducation Group, Proceeding Of Conference, July.
Marsh,P., (1990), On How The Minister Is Enjoying The Cut AndThrust Of Dealing With The Pharmaceuticals, Financial Times, July. 6.
Martineau,P., (1958), Social Class And Spending Behaviour, Journal Of Marketing, 23, PP 121-41.
Mason,J.B., and Himes,S.H., (1973), An Exploratory Behavioural AndSocio-economic Profile Of Consumer Action AboutDissatisfaction With Selected Household Appliances, Journal Of Consumer Affairs, Winter, 7, PP 121-27.
Massy,W.F.; Frank,R.E., and Tolodohi,A., (1968), Purchasing Behaviour And Personal Attitudes, Trustess Of The UniversityOf Pennsylvania, U.S.
Maurice,L., (1983), Cluster Analysis For Social Scientists, JosseyBass. Inc., California, U. S.
Mayer,R.H., (1981), Consumerism In The 70's: The Emergence Of NewIssues, Journal OF Consumer Affairs, 15. Winter. PP 375-91.
Mckennell,A.C., (1978), Attitude Scale Construction, in TheAnalysis Survey Data: Exploring Data Structure, 0'Muircheartaugh,C.A., ed., John Wiley Sons, Her York.
Medawar,C., (1984), Drugs And World Health: An International Consumer Perspectives, Consumer Association Social Audit,Holand.
300
Mercill,A.W., (1983), Nonprescription Drugs, In Smith,M.C. ed., Principles Of Pharmaceutical Marketing, Lea And Febiger, US.
Mikeal,R.I., and Sharpe,T., (1974), Patient Complaince, InWertheimer And Smith eds., Pharmacy Practice, University Park Press, PP 170-194.
Miller,J.A., (1976), Store Satisfaction And Aspiration Theory:A Conceptual Basis For Studying Consumer Discontent,Journal, Of Retailing, 52, 3, Fall, PP 65-84.
Miller,J.A., (1977), Studying Satisfaction: Modifying ModelsEliciting Expectation, Posing Problem And MarketingMeaningful Measurement, In Hunt,H.K. ed., Conceptualization Of CS/D, Marketing Science Institute,Cambridge.
Mittal,B., (1986), A Framework For Retailing ConsumerInvolvement To Lateral Brain Functioning, Advances In Consumer Research, American Marketing Association, Chicago.
Mittal,B. and Lee,M., (1988), Separating Brand-choice InvolvementVia Consumer Involvement Profiles, In Houston,M. ed., Advances In Consumer Research, Association For Marketing Research.
Morin,B.A., (1971), Consumerism Revisited, MSU, Business Topics, Summer, PP 47-51.
Muncy,A.A., and Hunt,S.D., (1983), Consumer InvolvementDefinitional Issues And Research Direction, In Kinnear,T. ed., Advances In Consumer Research, American Marketing Association.
Munson,J.M., and McIntyre,S.H., (1979), Developing PracticalProcedures For The Measurement Of Values In Cross-CulturalMarketing, Journal Of Marketing Research, 16, Febraury, PP 48-52.
Myers,J.G., (1967), Determinant Of Private Brand Attidude, Journal Of Marketing Research, 4, Febraury, PP 73-81.
Naryana,C.L., (1977), Graphic Positioning Scale: An EconomicalInstrument For Survey, Journal Of Marketing Research, 14, Febraury, PP 118-22.
Nunnally,J.C., (1967), Psychometric Theory, McGraw Hill Co. NewYork.
Nuttall,C.G., (1962), T.V. Commercial Audiences In The UnitedKingdom, Journal Of Advertising Research, 6, September, PP 19 -28.
Oliver,R.L., (1977), A Theoretical Reinterpretation Of ExpectationAnd Disconfirmation Effects Of Post Product Evaluation:Experiences In The Field, CS/D And Complaining Behaviour, In Day,R. ed., Bloomington, Indiana.
301
Oliver,R.L., (1979), Product Satisfaction As A Function Of PriorExpectation And Subsequent Disconfirmation: New Evidence,In Day,R. And Hunt,H. eds., Her Dimensions Of CS/D And Complaining Behaviour, Bloomington, Indiana.
Oliver,R.L., (1980), Conceptualizing And Measurement OfDisconfirmation Perceptions In The Prediction Of ConsumerSatisfaction And Complaining Behaviour, In Hunt And Day eds., Proceeding Of Conference On CS/D And Complaining Behaviour, Bloomington, Indiana.
Oliver,R.L., (1981), Measurement And Evaluation Of SatisfactionProcess In Retail Setting, Journal Of Retailing, 57, 3, Fall, PP 25-48.
Oliver,R.L., and Bearden,W.O., (1983), The Role Of Involvement InSatisfaction Process, In Bagozzi And Tybout eds., Advances In Consumer Research, Proceeding Of Association For Consumer Research.
Olshavsky,R.W., and Miller,J.C., (1972), Consumer Expectation,Product Performance And Perceived Product Quality,Journal Of Marketing Research, 9, Febraury, PP 19-21.
Olson,J.C., and Dover,P., (1976), Effects Of Expectation, ProductPerformance And Disconfirmation On Belief Elements OfCognitive Structure, In Beverlee And Anderson eds, Advances In Consumer Research, Association For Marketing Research.
Oppenheim,A.N., (1966), Questionnaire Design And Attitude Measurement, Heinemann Educational Books, Great Britain.
Ortinau,D.J., (1978), Conceptual Model Of Consumer's Post PurchaseSatisfaction / Dissatisfaction Decision Process, In Day AndHunt, Hew Dimensions Of CS/D And Compliaing Behaviuor.
Ostrom,T.M., and Brock,T.C., (1968), A Cognitive Model OfAttitudinal Involvement, In Theories Of Cognitive Consistency: Sourcebook Abelson, Aronson, McGuire, Newcomb And Rosenberg eds., Rand Muc Nally, Chicago.
Park,C.W., and Young,S.M., (1984), The Effects Of Involvement AndExecutional Factors Of A Television Commercial On BrandAttitude Formation, Working Paper, Marketing Science Institute, PP 84-100.
Parasuraman,A., (1986), Marketing Research, Addison WesleyPublishing Co. Inc., U.S.
Pestoff,A.V., (1988), Exit Voice And Collective Action In SwedishConsular Policy, Journal Of Consumer Policy, 12, March, PP 1-27.
Peter,J.P., (1979), Reliability: A Review Of Psychometric BasicsAnd Recent Marketing Practices, Journal Of Marketing Research, 16, Febraury, PP 6-17.
302
Peter,J.P., (1981), Construct Validity: A Review Of Basic IssuesAnd Marketing Practices, Journal Of Marketing Research, 19, May, PP 133-45.
Peter,G., (1981), Information And Education About Drugs, In Blum-Herxheimer; Stenzl; And Woodcock eds., Pharmaceutical And Health Policy: International Perspectives On Provision And Control Of Medicines, Croon Helm, London.
Petrof,J.V., (1971), Attitudes Of The Urban Poor Towards TheirNeighbourhood Supermarkets, Journal Of Retailing, 47, Spring, PP 3-17.
Peterson,E., (1974), Consumerism As A Retailer Asset, Harvard Business Review, 52, May-June, PP 91-101.
Pickle,H.B., and Bruce,R., (1972), Consumerism, ProductSatisfaction / Dissatisfaction: An Empirical Investigation,The Southern Journal Of Business, pp 87-100.
Pike,A., (1990), Smart Marketing, Financial Times, November, 21.
Pitts,R.E., (1981), Value Group Analysis Of Cultural Values InHeterogeneous Population, Journal Of Psychology. 117, PP 109 -124.
Pitts,R.E., and Woodside,A.G., (1984), Personal Values And Consumer Psychology, Health And Co., U.S.
Pfaff,A.B., (1972), An Index Of Consumer Satisfaction, InVenkatesan,M. ed., Proceeding Of Conference. Association Of Marketing Research, Chicago.
Pfaff,M., (1976), The Index Of Consumer Satisfaction: MeasurementProblems And Opportunities, In Hunt,H.K. ed., Conceptualization Of CS/D, Marketing Science Institute,Cambridge.
Platek,R.; Pierre,F.K., and Stevens,P., (1985), Development And Design Of Survey Questionnaires, Published Under TheAuthority Of Minister Of Supply And Services, Canada.
Plummer,J.T., (1974), The Concept And Application Of Life StyleSegmentation, Journal Of Marketing, 38, January, PP 33-37.
Pradhan,S.B., (1983), International Pharmaceutical Marketing,Quorum Books, US.
Pratt,R.W., (1972), The Index Of Consumer Satisfaction AndCorporate Policy, In Venkatean,M ed.. Proceeding Of Conference, Association For Consumer Research.
Prescribing All The Way To The Banks, (1990), Financial Times, August, 4.
Punj,G., and Stevart,D.W., (1983), Cluster Analysis In MarketingResearch: Review And Application, Journal Of Marketing Research, 20, May, PP 134-48.
303
Qualls,W.J., (1982), Changing Sex Roles: Its Impact Upon FamilyDecision Making, In Mitchell,A. ed., Advances In Consumer Research, American Marketing Association.
Ouraeshi,Z.; Lucimani,M.; and Malhotra,H., (1983), Brands OrGenerics: The Dilemma Of Pharmaceutical Marketing InDeveloping Countries, Journal Of Health Care Marketing, 3, 4, Fall, PP 27-37.
Rapoport,J., (1979), Patients' Expectation And Intention To Self-Medicate, Journal Of The Royal College Of General Practioners, 29, PP 468-472.
Renoux,Y., (1973), Consumer Dissatisfaction And Public Policy, InPublic Policy And Marketing Practices, In Allvine,F.C. ed., American Marketing Association, Chicago.
Richins,M.L., and Verhange,B.J., (1985), Seeking Redress ForConsumer Dissatisfaction: The Role Of Attitudes AndSituational Factors, Journal Of Consumer Policy, 8, PP 29-44.
Robert,F., (1962), Research On Household Behaviour, American Economic Review, 52, March, PP 19-63.
Robertson,T.S.; Zielinski,J., and Ward,S., (1984), Consumer Behaviour, Scott, Forman And Co., U.S.
Robinson,L.M., (1978), Consumer Complaint Behaviour: A Review WithImplication For Further Research, In Day And Hunt eds., New Dimensions Of CS/D And Complianing Behaviour.
Rokeach,M.J., (1968a), Beliefs, Attitudes And Values, SanFrancisco, Jossey-Bass, Inc., U.S.
Rokeach,M.J., (1968b), The Role Of Values In Public OpinionResearch, Public Opinion Quarterly, 32, PP 547-9.
Rokeach,M.J., (1968c), A Theory Of Organization And Change WithinValue / Attitude System, Journal Of Social Issues, 24, PP 13-33.
Rokeach,M.J., (1973), The Nature Of Hunan Values, New York, TheFree Press, U.S.
Rokeach,M.J., (1979), Understanding Human Values: Individual And Societal Free Press, U.S.
Ronald,F.E.; Massy,W.F., and Boyd,H., (1967), Correlates Of GroceryProduct Implication For Further Research, In Day,R. ed.,New Dimensions Of CS/D, American Marketing Association.
Ross,C.K.; Frommett,G.; Hazelwood,L., and Chang,R., (1987), TheRole Of Expectation In Patient Satisfaction With MedicalCare, Journal Of Health Care Marketing, 7, 4, December, PP 16- 26.
304
Rothschild,M.L., (1979), Advertising Strategies For High And LowInvolvement, In Maloney And Silvoman eds., Attitude Research Plays For High Stakes, American Marketing Association, PP 74-93.
Samuelson,P.A., (1967), Economics, 7th ed., McGraw Hill Book Co.,New York.
Saunders,J.A., (1980), Cluster Analysis For Market Segmentation,European Journal Of Marketing, 14, 7, PP 422-35.
Schiffman,L.G., and Kanuf.L.L., (1983), Consumer Behaviour, 2nd ed,Prentice Hall, Inc., Englewood, Cliffs, U.S.
Schneider,J., and Locke,E., (1971), A Critique Of Herzberg'sIncident Classification System And Suggested Revision,Organizational And Behaviour Human Performance, 16, PP 441-57.
Schneller,G.H., (1970), Status Report On Bio-Availability, AmericanJournal Of Hospital Pharmacy, 27, June, PP 30-36.
Schoepe,A., and Molinda,J., (1984), International Regulation OfPharmaceuticals: A WHO International Code Of Conduct For TheMarketing Of Pharmaceutical, Journal Of International Law And Commerce, 11, Summer, PP 121-141.
Scott,J.E., and Lamont,L.M., (1973a), Consumerism: A TheoreticalFramework For Analysis, In Boris.W. And Helmut.B. eds., Combined Of Proceeding, American Marketing Association,Chicago.
Scott,J.E., and Lamont,L.M., (1973b), Relating Consumer Values ToConsumer Behaviour: A Model And Methods For Investigation,In Greer,T.V. ed., Advances In Consumer Research, American Marketing Association.
Seeman,M., (1959), On The Meaning Of Alienation, AmericanSociological Review, 24, PP 783-91.
Seeman, M., (1971), Alienation: A Map, Psychological Today, August,PP 83-94.
Settle,R.B.; Alreck,P.L., and Blech,M.A., (1978), Social ClassDeterminant Of Leisure Activity, Advances In Consumer Research, In William,L.W. ed., Proceeding Of Conference,Association For Consumer Research, Florida.
Sherrell,D.L., and Shimp,T.A., (1982), Consumer Involvement In ALaboratory Setting, In Walker, Bearden, Murphy, Kevin, And Olson eds., Assessment Of Marketing Thought And Practice, Educators Conference Proceedings, Chicago.
Siegal,S., (1956), Hon-Parametric Statistical For The Behavioural Sciences McGraw Hill, Inc., New York.
Sirgy,M.J., (1984), Marketing And Social Behaviour: A General'System Theory, Praeger Publishers, U.S.
305
Skelton,V.C., (1963), Patterns Behind Income Refusals, Journal Of Marketing, 27, PP 38-41.
Slama,M.E., and Tashchian,A., (1985), Selected Socio-economic AndDemographic Characteristics Associated With PurchasingInvolvement, Journal Of Marketing, 49, Winter, PP 72-82.
Slatter,S., (1977), Competitive And Marketing Strategies In The Pharmaceutical Industry,Redvood Burn Limited, Croon Helm,London.
Smith,M.C., (1983a), Identification Of The Market, In Smith,M.C. ed., Principles Of Pharmaceutical Marketing, Lea And Febiger, US.
Smith,M.C., (1983b), The Manufacturer, In Smith,M.C. ed., Principles Of Pharmaceutical Matketing, Lea And Febiger, US.
Spector,A.J., (1959), Expectation, Fulfilment And Moral, Journal Of Abnormal And Social Psychology, 52, January, PP 51-6.
Stevart,D.W., (1981), The Application And Misapplication Of FactorAnalysis In Marketing Research, Journal Of Marketing Research„ 18, Febraury, PP 51-62.
Stimson,G.V., (1977), Do Drug Advertisments Provide TherapeuticInformation, Journal Of Medical Ethics, 3, PP 7-11.
Stokes,R.C., (1973), Consumerism And The Measurement Of ConsumerSatisfaction, Paper Presented At The American Marketing Association, Attitude Research Conference, Madrid, Spain.
Stokes,R.C., (1974), Consumer Complaint And ConsumerDissatisfaction, Presentation To The Food And Drug Law Institute, Phoenix, Arizona.
Straver,W.C., (1977), The International Consumerist Movement,European Journal Of Marketing, 11, PP 93-117.
Straver,W.C., (1978), The Consumerist Movement In Europe:Challenges And Opportunities For Marketing Strategy,European Journal Of Marketing, 12, 4, pp 316-25.
Strom,B., and Melmon,K., (1979), Can Post Marketing SurveillanceHelp To Effect Optimal Drug Therapy, Journal Of The American Medical Association, 30, November, PP 242-246.
Sudman,S., (1976), Applied Sampling, Academic Press, Inc., NewYork.
Sudman,S., and Bradburn,N.M., (1982), Asking Questions, Jossey-BassPublishers, U.S.
Svan,J.E., and Longman,A., (1972), Consumer Satisfaction WithAutomobile Repair Performance, Attitude Towards The IndustryAnd Governmental Control, Paper Presented To The American Marketing Association.
306
Swan,J.E., and Combs,L.J., (1976), Product Performance And ConsumerSatisfaction: A New Concept, Journal Of Marketing, 40, April, PP 25-33.
Svan,J.E., (1977), Consumer Satisfaction With Retail Store RelatedTo The Fulfilment Of Expectation On An Initial Shopping Trip,Consumer Satisfaction And Complaining Behaviour, In Day,R.L., ed., Bloomington, Indiana.
Svan,J.E., and Mercer, (1981), Consumer Satisfaction As A FunctionOf Equity And Disconfermation, Conceptual And Empirical Contribution To Consumer Satisfaction And Complaining Behaviour, In Hunt And Day eds., Proceeding Of Conference, Bloomington, Indiana.
Svan,J.E., and Travick,F., (1981), Disconfermation Of ExpectationAnd Satisfaction With A Retail Service, Journal Of Retailing,57, 3, Fall, PP 49-67.
Svan,J.E., (1985), Automobile Buyers Satisfaction With SalespersonRelated To Equity And Disconfirmation, Consumer Satisfaction / Dissatisfaction And Complaining Behaviour, Hunt And Day eds., Proceeding Of Conference, Phoenix, Arizona.
Tacey,E., (1990), Over-The-Counter, Financial Times, November,21.
Tayagi,P.K., (1982), Combining The Equity / Inequity Model And TheExpectancy-Value Model For predicting SatisfactionMotivation And Performance, In Walker, Bearden, Murphy, Nevin And Alson eds., Assessment Of Marketing Thought And Practice, Educators Conference Proceedings, Chicago.
Telser,L.; Best,W.; Egan,J.; and Higinbotham,H., (1975), The TheoryOf Supply With Application To The Ethical PharmaceuticalIndustry, Journal Of Lay And Economics, 18, PP 449-455.
The World Drug Situation, World Health Organization (WHO), 1989.
Thomas,W.R., and Shuptrine,F.K., (1975), The Consumer ComplaintProcess: Communication And Resolution, Business And Economic Reviev, 21, June, PP 13-22.
Traylor,M.B., (1981), Product Involvement And Brand Commitment,Journal Of Advertising Research, 21, 6, December PP 51-56.
Tucker,D., (1984), The World Health Market: The Future Of ThePharmaceutical Industry, Euromonitor Publication, US.
Tull,D.S., and Havkins,D.I., (1987), Marketing Research: Measurement And Methods, 4th ed., Macimillan, New York.
Vinson,D.E. and Munson,J., (1976), Personal Values: An Approach ToMarket Segmentation, In Bernhardt,K. ed., Marketing: 1776- 1976 And Beyond, Proceedings Of Conference, American Marketing-Association, Chicago.
307
Vinson,D.E.; Scott,J.E., and Lamont,L.M., (1977), The Role OfPersonal In Marketing And Consumer Behaviour, Journal Of Marketing, 14, April, PP 44-50.
Vinson,D.E., (1977), Personal Values As A Dimension Of ConsumerDiscontent, In Greenberg And Bellenger eds., Contemporary Marketing Thought, American Marketing Association, Chicago.
Vinson,D.E., and Pearson,J.B., (1978), The Anxiety Effect OfOverstimulation On The Consumption Decision Process,Business And Society, Spring, PP 28-35.
Wall,M.; Dickey.L.E., and Talarzyk,W.W., (1978), Correlates OfSatisfaction And Dissatisfaction With Clothing Performance,Journal Of Consumer Affairs, 12, 1, Summer, PP 104-115.
Walters,G., (1974), Consumer Behaviour: Theory And Practice,Homewood Illinois, Richard,D., Irvin, U.S.
Warland,R.H.; Herrman,R.O., and Willits,J., (1975), DissatisfiedConsumers: Who Gets Upset And Who Takes Action, Journal Of Consumer Affairs, 9, PP 148-63.
Wartman,S.A.; Morlock,L.L.; and Malitz,F.E., (1981), DoPrescription Adversely Affect Doctor-Patient Interaction,American Journal Of Health Policy, 71, 12, PP 1358-1361.
Wasson,C.R., (1969), Is It Time To Quit Thinking Of IncomeClasses?, Journal Of Marketing Reseach, 33, PP 54-57.
Waters,L.K., and Waters,C.W., (1969), Correlates Of JobSatisfaction Among Female Clerical Workers, Journal Of Applied Pyschology, 53, PP 388-91.
Waters,L.K., and Roach,D., (1971), The Two Factors Theories Of JobSatisfaction: Empirical Tests For Four Samples Of insuranceCompany Employees, Personnel PyschologY, 24, PP 697-705.
Waters,L.K., and Waters,C.W., (1972), An Empirical Test Of FiveVersions Of Job Satisfaction, Organizational Behaviour And Human Performance, 7, PP 18-24.
Wells,W.D., and Sheth,J.H., (1971), Factor Analysis In Marketing Research McGraw Hill, U.S.
Westbrook,R.A., (1980a), Interpersonal Effective Influences OnConsumer Satisfaction With Products, Journal Of Consumer Research, 7, June, PP 49-54.
Westbrook,R.A., (1980b), A Rating Scale For Measuring Product /Service Satisfaction, Journal Of Marketing, 44, Fall, PP 68 -72.
Westbrook,R.A., and Oliver,R.L., (1981), Developing Better MeasuresOf Consumer Satisfaction: Some Preliminary Results, In MonroeK.B ed. ,Advances In Consumer Research, American Marketing Association.
308
Westbrook,R.A., and Reilly,M.D., (1983), Value-Percept Disparity:An Alternative Of The Disconfirmation Expectation TheoryOf Consumer Satisfaction, Advances In Consumer Research,In Hagozzi And Tybout eds., Proceeding Of Conference,Association Of Consumer Research.
Whitsett,D.A., and Winslow,E.K., (1967), An Analysis Of Studies:Critical Of The Motivation / Hygiene Theory, Personnel Psychology, 20, PP 391-415.
Wilton,P.C., (1985), History And Future Of Consumer SatisfactionResearch, In Tan,C And Sheth,J eds.,Historical Perspectives In Consumer Research, National And International Perspectives, Proceeding Of Conference, Association For Consumer Research, Singapore.
Wind,Y., (1969), Incongruency Of Socio-economic Variables AndBuying Behaviour, In Philp,R., And McDoland eds., Proceeding Of Conference, American Marketing Association.
Woodcock,J., (1981), Medicines: The Interested Parties, in Blum.Herxheimerl. Stenzl; And Woodcock eds., Pharmaceutical And Health Policy: International Perspectives On Provision And Control Of Medicines, Croon Helm, London.
309
I.
BIBLIOGRAPHY
Aaker,D.A, and Day,G.S, (1982), Consumerism: Search For The Consumer Interest, 4th ed., Free Press, New York.
Assael,H., (1975), Evaluating New Product And Developing Early Prediction Of Trial, New York University.
Backer,M.J., (1985), Marketing: An Introductory Text, 4th ed.,Macmillan Co., Great Britain.
Beranrd,K., (1988), Consumer Demand Or Customer Satisfaction?European Journal Of Marketing, 22, 3, PP 61-72.
Bonner,R.E., (1964), Some Clustering Techniques, Journal Of Marketing Research, 8, January, PP 22-32.
Broedling,L.A., (1974), On More Reliability Employing The ConceptOf Reliability, Public Opinion Quarterly, Fall, PP 372-78.
Cardoz,R.H., (1965), An Experimental Study Of Customer Efforts,Expectation And Satisfaction, Journal Of Marketing Research, 2, August, PP 244-49.
Chappell,S.C., (1980), The Prescription Decline Sense Or Nonsense?Medical Marketing And Media, 15, PP 15-21.
Chetely,A., (1986), Not Good Enough For Us But Fit For Them: AnExamination Of The Chemical And Pharmaceutical Export Trades,Journal Of Consumer Policy, 9, PP 155-180.
Clabaugh,M; Mason,J. and Bearden,W., (1978), Consumer AlienationAnd Causal Attributes As Moderator, In Hunt And Day eds., New Dimensions Of CS/D And Complaining Behaviour, Proceeding Of Conference, Bloomington, Indiana.
Daniel,W.W., (1978), Applied Non-Parametric Statistics, Boston,Mass, Hougton Mifflin Co., U.S.
Diener,B.J., (1976), The Fulfilment Of Consumer Promotions AsA Source Of Consumer Dissatisfaction, Conceptualization And Measurement Of CS/D, In Hunt,H.K. ed., Proceeding Of Conference, Marketing Science Institute.
Dhalla,N.K., and Mahatto,W.H., (1976), Expanding The Scope OfSegmentation Research, Journal Of Matketing, 40, April,PP 34-41.
Darvall,L.W., (1986), Consumer Praticipation In GovernmentDecision Making: New Drug Evaluation In Australia AndUnited States, Journal Of Consumer Policy, 6, PP 41-55.
Edgar,M., (1982), Infectious Diseases And Health In Costa Rica:The Development Of A New Paradigm, Pediatric Infectious Disease, 1, 3, Kay, 212-216.
EL-Asffury,A.M., (1989), Journal Of The Egyptian Packaging Development Association, 47,5.
310
EL-Kattan,M., (1985), Medicine In Egypt, The Committee Of Medical Publicity, DOCMA.
EL-Kattan,M., (1986), Journal Of Medicine, 1, June.
JEL-Kattan,M., (1987), Journal Of Medicine, 2, October.
EL-Sharkawy,A., (1989), Journal Of Medicine, 3, March.
Fenwick,J. and Quelch,J.A., (1984), Consumer Behaviour For Marketing Managers; Newton, Allyn And Bacon, U.S.
Fiedler,F.E., (1978), The Culture Assimilator: An Approach To CrossCultural Training, Journal Of Applied Psychology, 55, PP 95
-102.
Fink,J.L., (1979), Marketing In A Generic Environment: APharmacist's View, Medical Marketing And Media, 14, PP 40-46.
Fundamentals Of The Strategy Of Industry, (1982), The Specialist National Committee, Republic Presidency, Cairo, Egypt.
Gioia,D.A., and Stearns,J.M., (1980), An Unified ExpectancyApproach To Consumer Satisfaction / Dissatisfaction AndComplaining Behaviour, In Refining Concepts And Measures Of Consumer Satisfaction And Complaining Behaviour, Hunt And Day eds., Proceeding Of Conference, Bloomington, Indiana.
Glassman,M., and Smith,T., (1980), On The Process Of ConsumerSatisfaction, In Refining Concepts And Measures Of Consumer Satisfaction And Complaining Behaviour, Hunt And Day eds.,Proceeding Of Conference, Bloomington, Indiana.
Green,M.J., (1974), Appropriateness And Responsiveness: Can TheGovernment Protect The Consumer?, Journal Of Economic Issues,8, 2, June, PP 309-28.
Green,M.J., (1977), New Approach To Market Segmentation, Business Horizons, February, PP 61-73.
Greenberg,B.A.; Goldstrucker,J.L., and Bellenger,D.H., (1977),What Techniques Are used By Marketing Researchers InBusiness, Journal Of Marketing, 41, April, PP 62-8.
Guertin,W., (1966), The Research For Recurring Among IndividualProfiles, Educational And Psychology Measurement, 26, PP 151 -65.
Hamburg,M., (1987), Statistical Analysis For Decision Making, 4thed., Harcourt Brace Jovanavich, Inc., New York.
Harmer,R., and Cunnigham,J., ( 1981), Cluster Analysis Profile DataConfounded With Interrater Differences: A Comparison OfProfiles Association Measures, Applied Psychological Measurement, 5, PP 63-72.
311
Hook,J., and Ward,J.R., (1963), Hierarchical Grouping To OptimizeAn Objective Function, Journal Of The American Statistical Association, 58, PP 236-43.
Kim,J.0., and Muller,C.W., (1978), Introduction To Factor Analysis, What It is And How To DO it, Series Quantitative ApplicationIn Social Sciences, Sage Publication, Inc., U.S.
Klasatorin,T.D., (1983), Assessing Cluster Analysis Results,Journal Of Marketing Research, 20, February, PP 92-8.
Krugaman,A., (1965), The Impact Of Television Advertising: LearningWith Involvement, Public Opinion Quarterly, 29, PP 349-56.
Leach,C., (1979), Introduction To Statistics: A Non Parametric Approach For Social Sciences, John Wiley And Sons, New York.
Leavitt,C., (1977), Consumer Satisfaction And Dissatisfaction: Bi-Polor Or Independent, In Hunt,H.K. ed., ConceptualizationAnd Measurement Of CS/D, Proceeding Of Conference, Marketing Science institute.
Maddox,N., (1980), Two Factors Theory And Consumer Satisfaction: AReplication And Measures Of CS/D And Complaining Behaviour,In Hunt And Day eds., Proceeding Of Conference, Bloomington, Indiana.
Marjorie,F, and Victor,J., (1984), Demographic And The PropensityTo Consume, In Kinnear,T. ed., Advances In Consumer Research, Association For Marketing Research.
McMurry,R.N., (1963), Conflicts In Human Values, Harvard Business Review, May-June PP 130-45.
Medawar,C., (1984), The Wrong Kind Of Medicine?, ConsumerAssociation And Social Audit, US.
Morganosky,M.A., and Buckely,H.M., (1986), Complaint Behaviour:Analysis By Demographic, Life Style And Consumer Values,Advances In Consumer Research, Association For MarketingResearch.
Myers,J.H., and Alpert,M.I., (1968), Determinant Attributes:Meaning And Measurement, Journal Of Marketing, 32, October, PP 13-20.
Peltzman,S., (1975), The Diffusion Of Pharmaceutical Innovotion,In Helms And Washington eds., American Enterprise Insitutue.
Pitts,R.E., and Woodside,A.G., (1983), Personal Value Influences OnConsumer Product Class And Brand Performance, Journal Of Psychology, 119, PP 37-53.
Prakash,V. and Lounsbury,J., (1983), A Reliability Problem in TheMeasurement Of Disconfirmation Of Expectation, in Bagozzi And Tybout eds., Advances In Consumer Research, Proceeding Of Conference, Association For Marketing Research.
312
Raju,P.S., (1980), Optimum Stimulation Level: Its RelationshipTo Personality, Demographic And Exploratory Behaviour,Journal Of Consumer Research, 7, December, PP 272-82.
Reekie,W.D., (1981), Price And Quality Competition In Drug Markets:Evidence From The United States And Netherlands, In Helps And Washington eds., American Enterprise Institute.
Sallah,G., (1988), The Modern Trends Of, And The Role Of, FlexiblePackaging In Medicine Wrapping, The Twenty Sixth International Conference, Keredian Hotel, Cairo, 2-5 December.
Schuman,H., and Presser,S., (1981), Questions And Answers In Attitude Survey Experiments On Question Form, Wording And Context, Academic Press, Inc., New York.
Schvartz,D.J., Marketing Today: A Basic Approach, Harcourt BraceJovanovich, Inc., New York.
Sethna,B.N., (1980), Some Important Determinants Of ConsumerSatisfaction / Dissatisfaction, In Refining Concepts And Measures Of Consumer Satisfaction And Complaining Behaviour, Hunt And Day eds., Proceeding Of Conference, Bloomington, Indiana.
Sheth,J.N., (1971), Multivariate Revolution In Marketing Research,Journal Of Marketing, 35, January, PP 13-19.
Siecker,B.R., (1981), The Wholesaler Effect In Pharmacy Management,American Pharmacy, 21, 11. November, PP 34-36.
Smith,M.C., (1973), General Practice Pharmacy In The United KingdomAnd United States Of America: Some Comparisons And Contrasts,The Pharmaceutical Journal, 6, January, PP 9-12.
Stafford,J.E; Cox,K.L., and Higginbothm,J.M., (1968), SomeConsumption Pattern Differences Between Urban White AndNegroes, Social Science Quarterly, December, PP 619-30.
Stewart,D.W., (1981), The Application And Misapplication Of FactorAnalysis In Marketing Research, Journal Of Marketing Research, 18, February, PP 51-62.
Taviss,I., (1969), Changes In The Form Of Alienation, American Sociological Review, 34, PP 46-59.
The Strategy Of Medical Policy, (1981), Series Studies Of The Specialists National Committee, Republic Presidency, Cairo.
The Use Of Essential Drugs, (1988), Third Report Of The World Health Organization (WHO), Geneva.
Trucker,W.T., (1959), Marketing And Society, Paper Delivered To The Southern Economic Association.
313
Vermeer,R.S, (1980), Consumerism: A Rich Man's Movement?, InConsumer Action In Developing Countries, International Organization Of Consumer Unions, Panang, Malaysia.
Wall,M; Dickey,L.E., and Talarzyk,W.W., (1977), Predicting AndProfiling Consumer Satisfaction And Propensity To Complain,Paper From A Marketing Research Symposium, In Day,R. ed., School Of Business, Bloomington, Indiana.
Walters,H.A., (1976), Cultural Values Do Correlate With ConsumerBehaviour, Journal Of Marketing Research, 13, May, PP 121-27.
Weller,T., (1983), Too Few And Too Little: Barricades To ThePursuit Of Health, Review Of Infectious Disease, 5, 6. November-December, PP 994-1002.
Williams,L., and Kelly,E.J., (1973), Social Marketing: Perspectives And Vier Points, Richard,D. Irvin, Inc, U.S.
Wood,D.A., and William,K.L., (1970), The Multivariate Nature Of JobSatisfaction, Personnel Psychology, 23, Summer, PP 173-89.
314
i.

APPENDIX 1
QUESTIONNAIRE - ENGLISH VERSION
315

Dear Egyptian citizen:
I am looking for your co-operation with the research work which is
currently being undertaken on the pharmaceutical market in Egypt.
The rationale behind this study is to recognize the problems which the
consumers encounter in the provision of medicine in Egypt.
The particular concern of this study is to know your degree of
satisfaction with respect to some aspects of medicine provision. In
addition, I would like to obtain your judgments about some statements
relating to the same aspects.
I shall be grateful for your co-operation by completing this
questionnaire which will take just a few minutes. The data collected will
be treated in the strictest confidence and analysed in aggregate for the
purpose of the study. No need therefore to address the questionnaire by
your name after you have filled it in.
Aisha Moustafa El-Meniawey Lecturer Assistant
At The Faculty Of Commerce, Ain-Shams University
And Currently A Doctoral Student At The University
Of Sheffield, England.
316
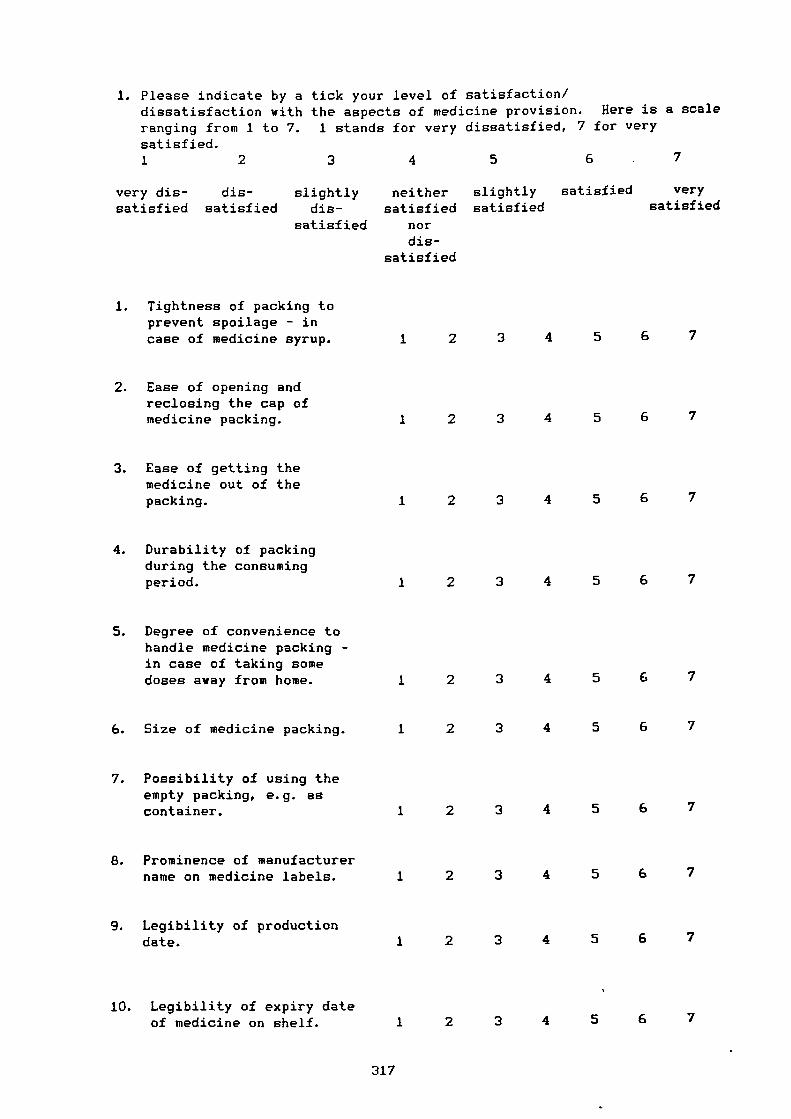
1. Please indicate by a tick your level of satisfaction/dissatisfaction with the aspects of medicine provision. Here is a scaleranging from 1 to 7. 1 stands for very dissatisfied, 7 for verysatisfied.1 2 3 4 5 6 7
very die- die- slightly neither slightly satisfied verysatisfied satisfied die- satisfied satisfied satisfied
satisfied nordis-
satisfied
1. Tightness of packing toprevent spoilage - incase of medicine syrup.
2. Ease of opening andreclosing the cap ofmedicine packing.
3. Ease of getting themedicine out of thepacking.
4. Durability of packingduring the consumingperiod.
5. Degree of convenience tohandle medicine packing -in case of taking somedoses away from home.
6. Size of medicine packing.
7. Possibility of using theempty packing, e.g. ascontainer.
8. Prominence of manufacturername on medicine labels.
9. Legibility of productiondate.
10. Legibility of expiry dateof medicine on shelf.
1 2 3 4 5 6 7
1 2 3 4 5 6 7
1 2 3 4 5 6 7
1 2 3 4 5 6 7
1 2 3 4 5 6 7
1 2 3 4 5 6 7
1 2 3 4 5 6 7
1 2 3 4 5 6 7
1 2 3 4 5 6 7
1 2 3 4 5 6 7
317
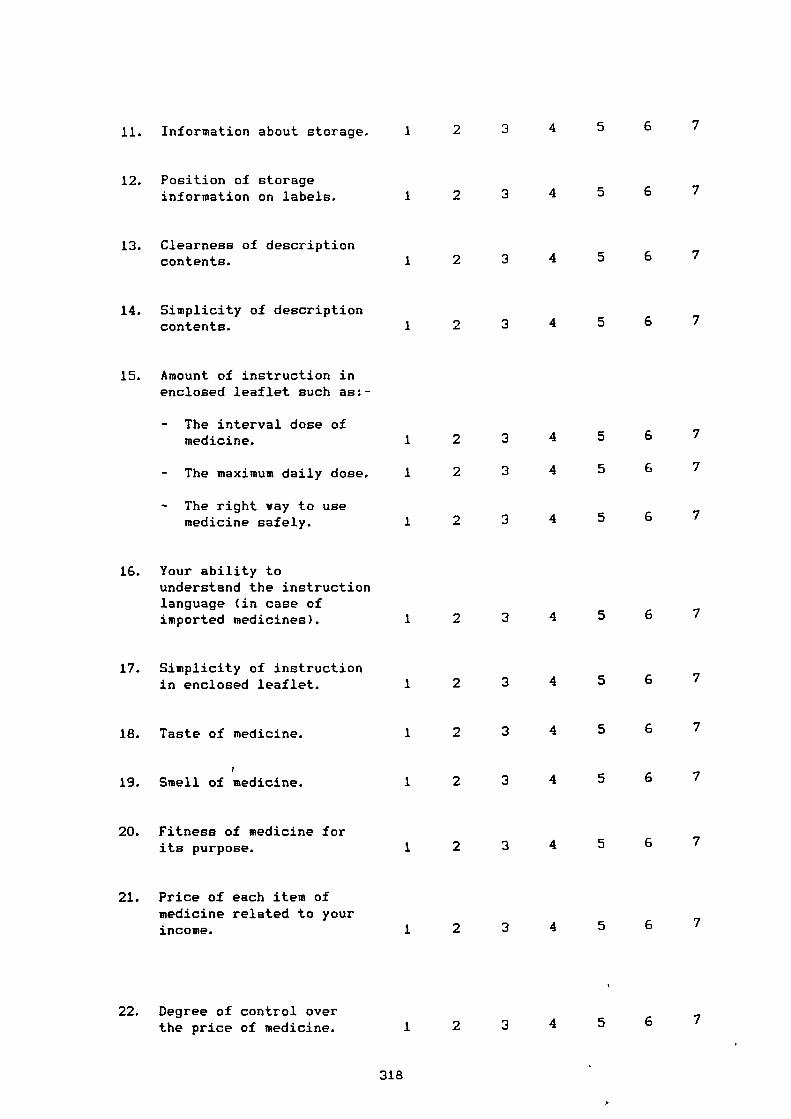
15. Amount of instruction inenclosed leaflet such as:-
- The interval dose ofmedicine.
- The maximum daily dose.
- The right way to usemedicine safely.
18. Taste of medicine.
r
19. Smell of medicine.
11. Information about storage.
12. Position of storageinformation on labels.
13. Clearness of descriptioncontents.
14. Simplicity of descriptioncontents.
16. Your ability tounderstand the instructionlanguage (in case ofimported medicines).
17. Simplicity of instructionin enclosed leaflet.
20. Fitness of medicine forits purpose.
21. Price of each item ofmedicine related to yourincome.
22. Degree of control overthe price of medicine.
1 2 3 4 5 6 7
1 2 3 4 5 6 7
1 2 3 4 5 6 7
1 2 3 4 5 6 7
1 2 3 4 5 6 7
1 2 3 4 5 6 7
1 2 3 4 5 6 7
1 2 3 4 5 6 7
1 2 3 4 5 6 7
1 2 3 4 5 6 7
1 2 3 4 5 6 7
1 2 3 4 5 6 7
1 2 3 4 5 6 7
1 2 3 4 5 6 7
318
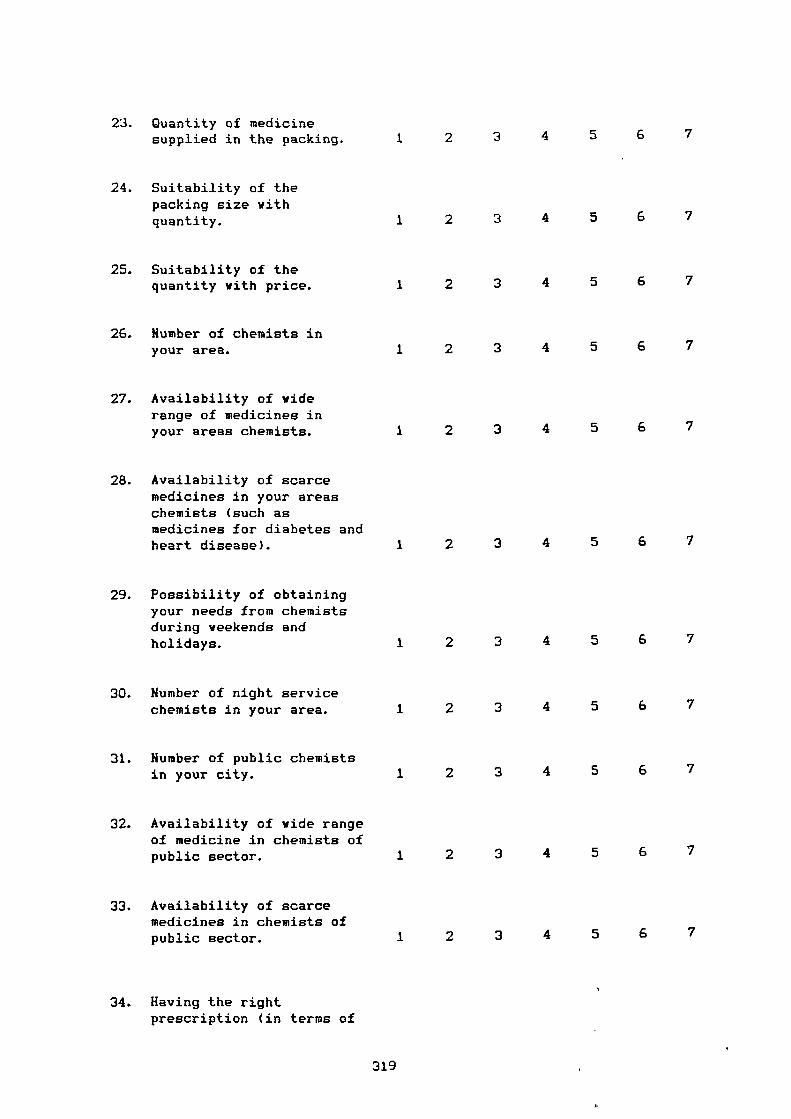
23. Quantity of medicinesupplied in the packing.
24. Suitability of thepacking size withquantity.
25. Suitability of thequantity with price.
26. Humber of chemists inyour area.
27. Availability of viderange of medicines inyour areas chemists.
28. Availability of scarcemedicines in your areaschemists (such asmedicines for diabetes andheart disease).
29. Possibility of obtainingyour needs from chemistsduring weekends andholidays.
30. Humber of night servicechemists in your area.
31. Humber of public chemistsin your city.
32. Availability of wide rangeof medicine in chemists ofpublic sector.
33. Availability of scarcemedicines in chemists ofpublic sector.
34. Having the rightprescription (in terms of
1 2 3 4 5 6 7
1 2 3 4 5 6 7
1 2 3 4 5 6 7
1 2 3 4 5 6 7
1 2 3 4 5 6 7
1 2 3 4 5 6 7
1 2 3 4 5 6 7
1 2 3 4 5 6 7
1 2 3 4 5 6 7
1 2 3 4 5 6 7
1 2 3 4 5 6 7
319
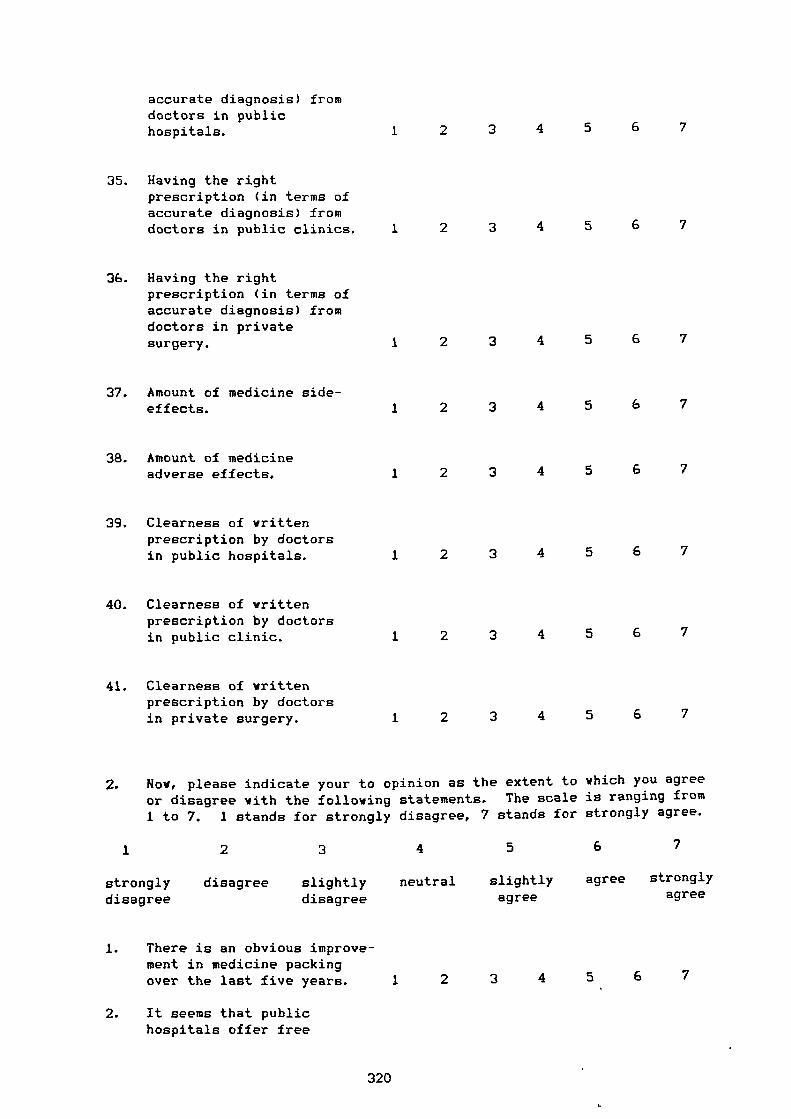
accurate diagnosis) fromdoctors in publichospitals.
35. Having the rightprescription (in terms ofaccurate diagnosis) fromdoctors in public clinics.
36. Having the rightprescription (in terms ofaccurate diagnosis) fromdoctors in privatesurgery.
37. Amount of medicine side-effects.
38. Amount of medicineadverse effects.
39. Clearness of writtenprescription by doctorsin public hospitals.
40. Clearness of writtenprescription by doctorsin public clinic.
41. Clearness of writtenprescription by doctorsin private surgery.
1 2 3 4 5 6 7
1 2 3 4 5 6 7
1 2 3 4 5 6 7
1 2 3 4 5 6 7
1 2 3 4 5 6 7
1 2 3 4 5 6 7
1 2 3 4 5 6 7
1 2 3 4 5 6 7
2. Now, please indicate your to opinion as the extent to which you agreeor disagree with the following statements. The scale is ranging from1 to 7. 1 stands for strongly disagree, 7 stands for strongly agree.
I
2 3 4 5 6 7
strongly disagree slightly neutral slightly agree strongly
disagree disagree agree agree
1. There is an obvious improve-ment in medicine packingover the last five years. 1 2 3 4 5 6 7
2. It seems that publichospitals offer free
320
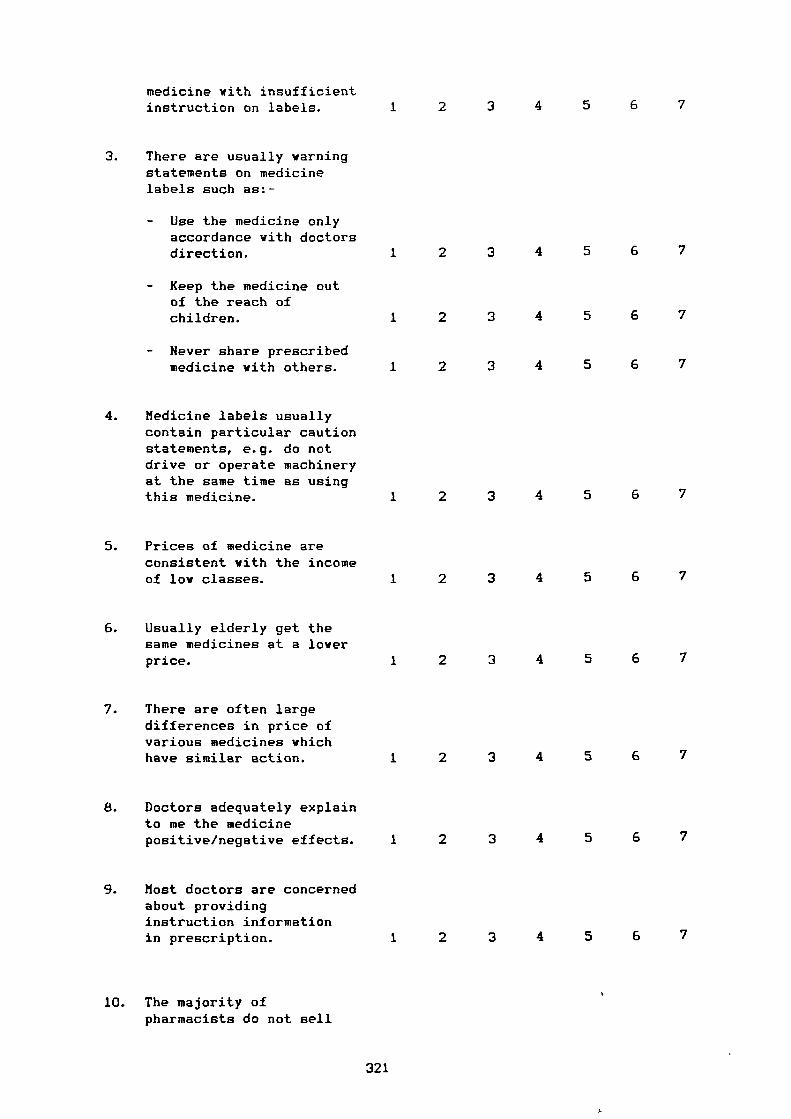
medicine with insufficientinstruction on labels. 1 2 3 4 5 6 7
3. There are usually warningstatements on medicinelabels such as:-
- Use the medicine onlyaccordance with doctorsdirection.
- Keep the medicine outof the reach ofchildren.
- Never share prescribedmedicine with others.
4. Medicine labels usuallycontain particular cautionstatements, e.g. do notdrive or operate machineryat the same time as usingthis medicine.
5. Prices of medicine areconsistent with the incomeof low classes.
6. Usually elderly get thesame medicines at a loverprice.
7. There are often largedifferences in price ofvarious medicines whichhave similar action.
8. Doctors adequately explainto me the medicinepositive/negative effects.
9. Most doctors are concernedabout providinginstruction informationin prescription.
10. The majority ofpharmacists do not sell
1 2 3 4 5 6 7
1 2 3 4 5 6 7
1 2 3 4 5 6 7
1 2 3 4 5 6 7
1 2 3 4 5 6 7
1 2 3 4 5 6 7
1 2 3 4 5 6 7
1 2 3 4 5 6 7
1 2 3 4 5 6 7
321
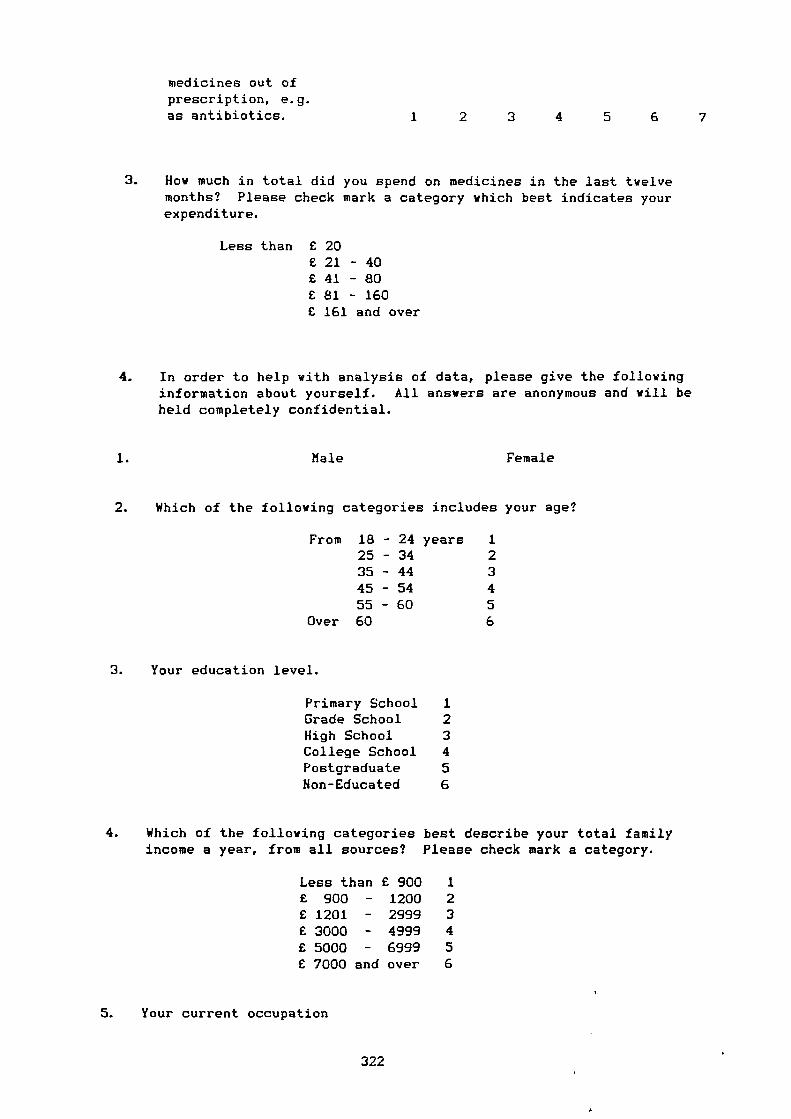
medicines out ofprescription, e.g.as antibiotics. 1 2 3 4 5 6 7
3. How much in total did you spend on medicines in the last twelvemonths? Please check mark a category which best indicates yourexpenditure.
Less than E 20E 21 - 40E 41 - 80E 81 - 160E 161 and over
4. In order to help with analysis of data, please give the followinginformation about yourself. All answers are anonymous and will beheld completely confidential.
1. Male Female
2. Which of the following categories includes your age?
From 18 - 24 years 1
25 - 34 2
35 - 44 3
45 - 54 455 - 60 5
Over 60 6
3. Your education level.
Primary School 1Grade School 2High School 3College School 4Postgraduate 5Non-Educated 6
4. Which of the following categories best describe your total family
income a year, from all sources? Please check mark a category.
Less than C 900 1E 900 - 1200 2E 1201 - 2999 3E 3000 - 4999 4E 5000 - 6999 5E 7000 and over 6
5. Your current occupation
322
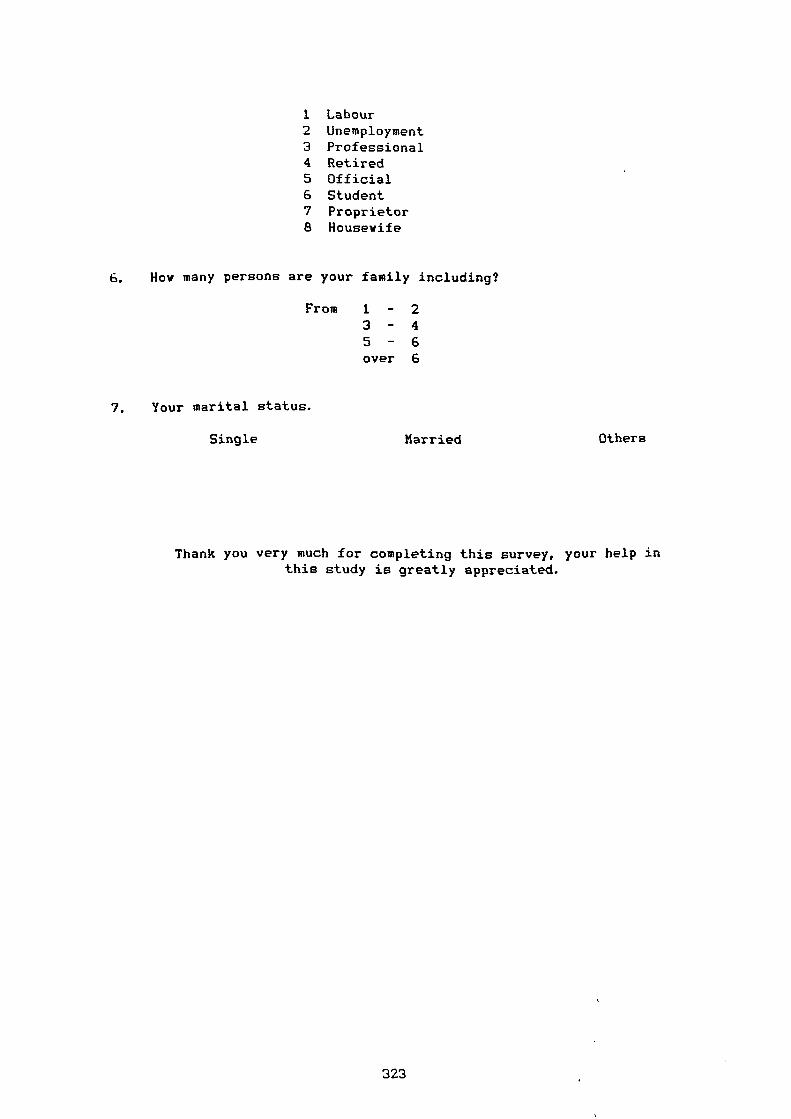
1 Labour2 Unemployment3 Professional4 Retired5 Official6 Student7 Proprietor8 Housewife
6. How many persons are your family including?
From 1 - 23 - 45 - 6over 6
7. Your marital status.
Single
Harried Others
Thank you very much for completing this survey, your help inthis study is greatly appreciated.
323

APPENDIX 2
QUESTIONNAIRE - ARABIC VERSION
324

k1 ii.I
ji I '
4.60.-4I64..1 1 0/0 I _94J 1
uJ < f p - d•-• jzI iI uA a i_ljzSJJ I
j1....• 0.a IJi 4.1---01_1 1.4 I g j--ga.r..11 • I j ..1"..1 IJ I 71—ajJ
• Lii„, I 61 I sksJ I I 3s cz. I j 1.&41-1 I vas,. u•1 j OILL.. I Lai 2.--"1 I -PIM
I z_Jiz—z u.1.1 I _i aV a_____A t u I.1 uJ e_,ao 1 4..1 (Jr.,1nnn•n• n•0 tr-' I j I -AZ-4 1 j I I u_i) :3.:14 I e.0 • I -1-1 I ab,L-qz... I
• ' I -5..9::"" I t5:3-1 I 4.10----;:-1 L7J I Ji-LLD I
. I-A? I • t _
4.9 1 0.0.L Ls
las I.. — 3 j i..21 1„41,..as I ,mple.11
/ LIRA J.S.2.-1 I 76t-m,„J •
325
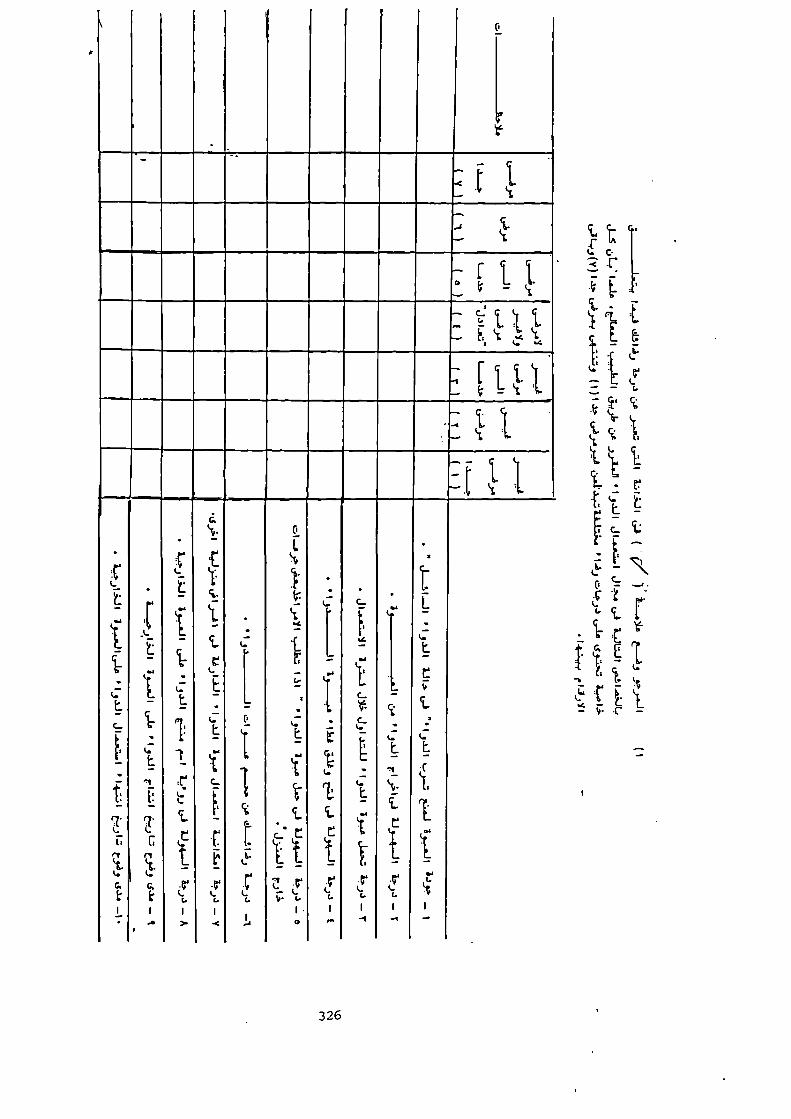
-
'e.
=
r
i.— kL
:1 t 1—
— cc: I ki. t— g k‘ .. 't
•
t 1" 1
t.,..... 1_
1 1
_....,..„.._„,„
0
. 1.-
. .I. •
: • •
‘L r 4".
C..
_6t.
i [,.-
: 1 .__
c
I
P -E i .I 1 ... q.
tC-r
,:L 1
1
I. .
t.. t..r. c;
.-r r c; e e
3. k,6 6G G,
t t1
. .tt. ki.
I I
Li
1"
kt.1...
i: t
Z.! .44
%-; ti.l.0
•
t
.e.L,
1,..
1-
r`--
i
.;'`i-1
;....
1
-
326
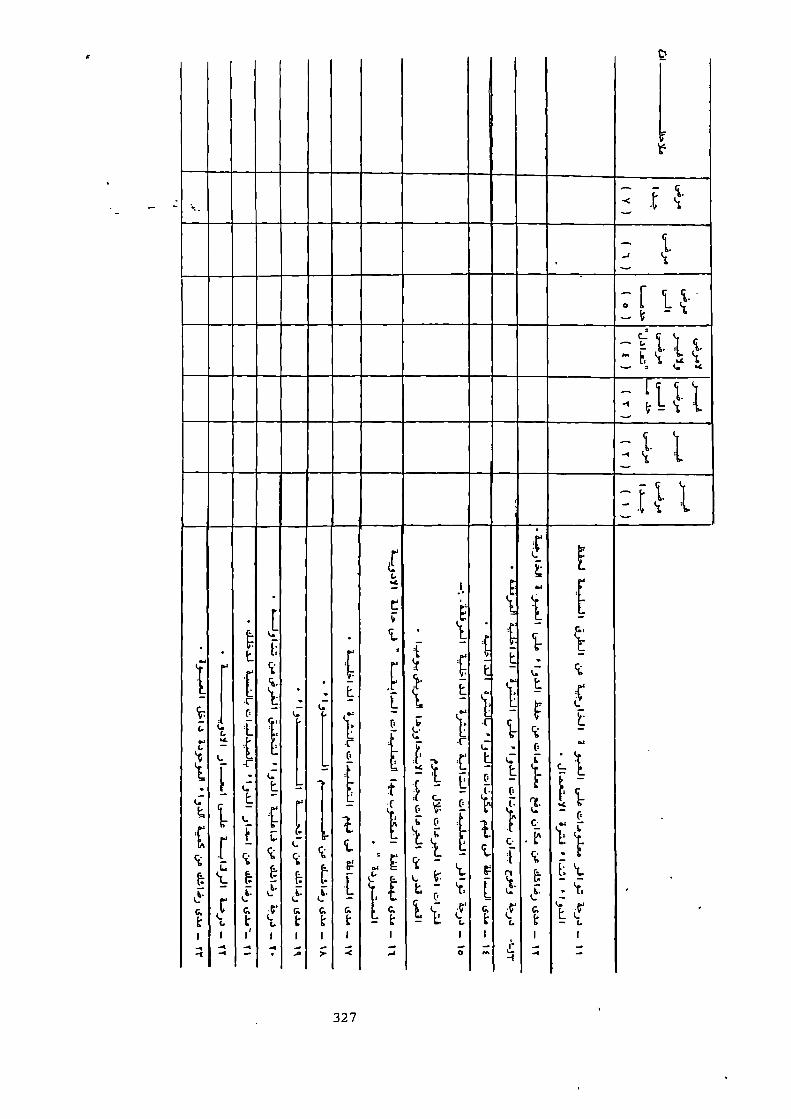
,-.
c
V
---._.<
•t kL—
— I
•
.., (T.
•-•
:1 t•— t,
— (c-i' 1 1 i.- E Ll."., 't— . l.. .4
^ [ t 1 tl
1.(t • tt.E•
I._...,
rL,.. .
.
i",..._t
•
.
[
64
ei•
rC
ty
•.
E
:
.....
I.
rf
1-::
. t 1;• i.. L
• t
1 t ,c1 . • .,— ; 'crt- :,— . i i 1.0
—
k.
— k: .., • —i.
F.:....
kr. .1:
64 .t. .I [ i
r
(2.
t
tt--k, •C-
•
-t..
1.
.
i;
e...
i. L I.r -- t
P L 1' , :c
6-± t 7
E
c7
k-.t
c
ki-c„• t
_-c - k-E t- - E f . - !---
V CI6
r. (1F
E
L t Li: f 11
t. —C.
. C
b.
• - _ lL , C. •
ci.. 1 C. CI; i•I. f % gr"
F..
t..
‘,... &
r t..
E-:..
S.F. (....
i,-. i-.(... L
-
1..—
t:
..t.
v 'T..
L ,.. `r.v
v
Lr,
,:•F
c..
t-A.
— ,
•
t,
, tI I'
‘1.I
G.
t tI I
G.
tI
G- t
I
i l, .V- t:. LL.
I
G.
tI
r
ki.G.
tI
kE 4.- '1.
I
.
-.4-i
-4 -4-4 -• .4• ... ......• )0. -..4 •-•.-I 0' 7••• .:1...'" .4-- --
327
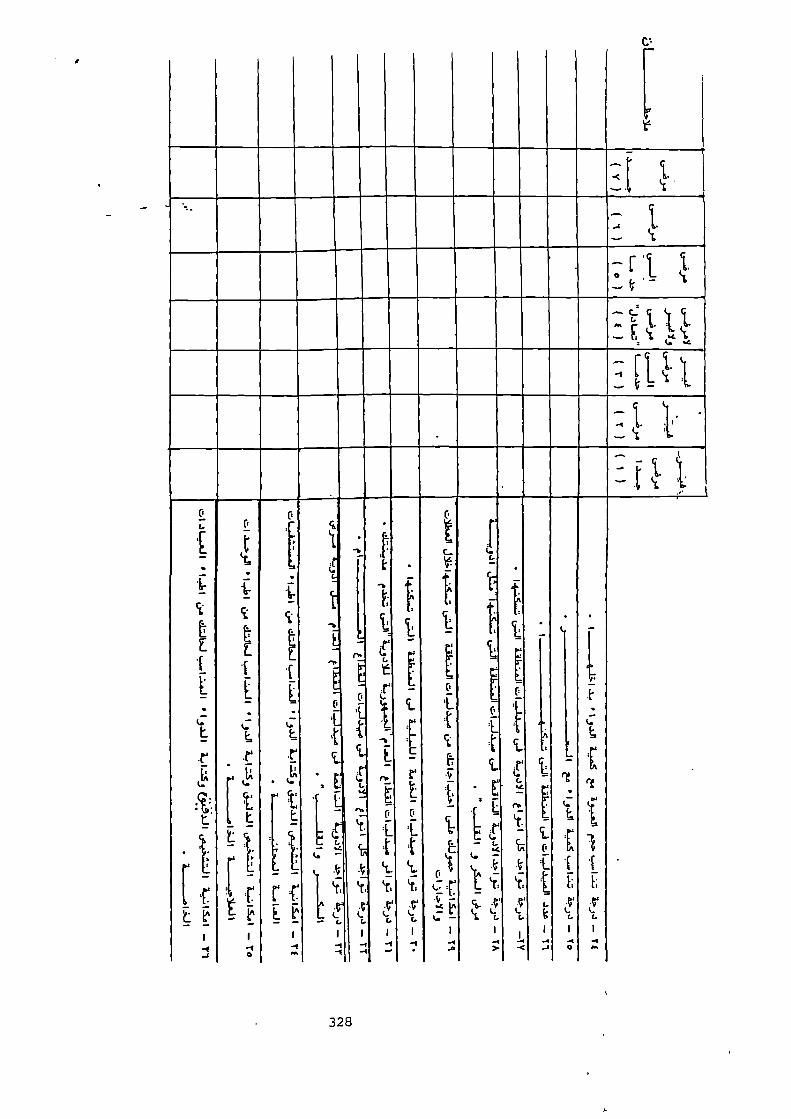
t-
_
1.ki.
:11._.
2C-
'[.
I
1t
•
t
I-11..I
•
E
tt
.
I.:
ks
I-10
=
r
E
r
I
r
L
.:
i
-
:r.
L^_
-1,ft
g
1.
1,
_
,'i--
I
5...
3
-
Lt:
c -_
t
_
I
-1-1
•
L
t—
:t
5...
• L.
'
i
cG
: q:
I
--I
-.
IT
.,r
1
—_
E.
.
ii .ti.
t
,,v
I
-I!
...
t
_
(
t
I
P
.
t
s.
- .
1- I
E —
tIn
,
E
4-.. fl`t:
'..
( -7
t-CE:
I I
5..
1...,
(7
-<
'L
•
F
...I
'6,
-r
i
L.
I
0
-
•
1
i
L.
I
.
328
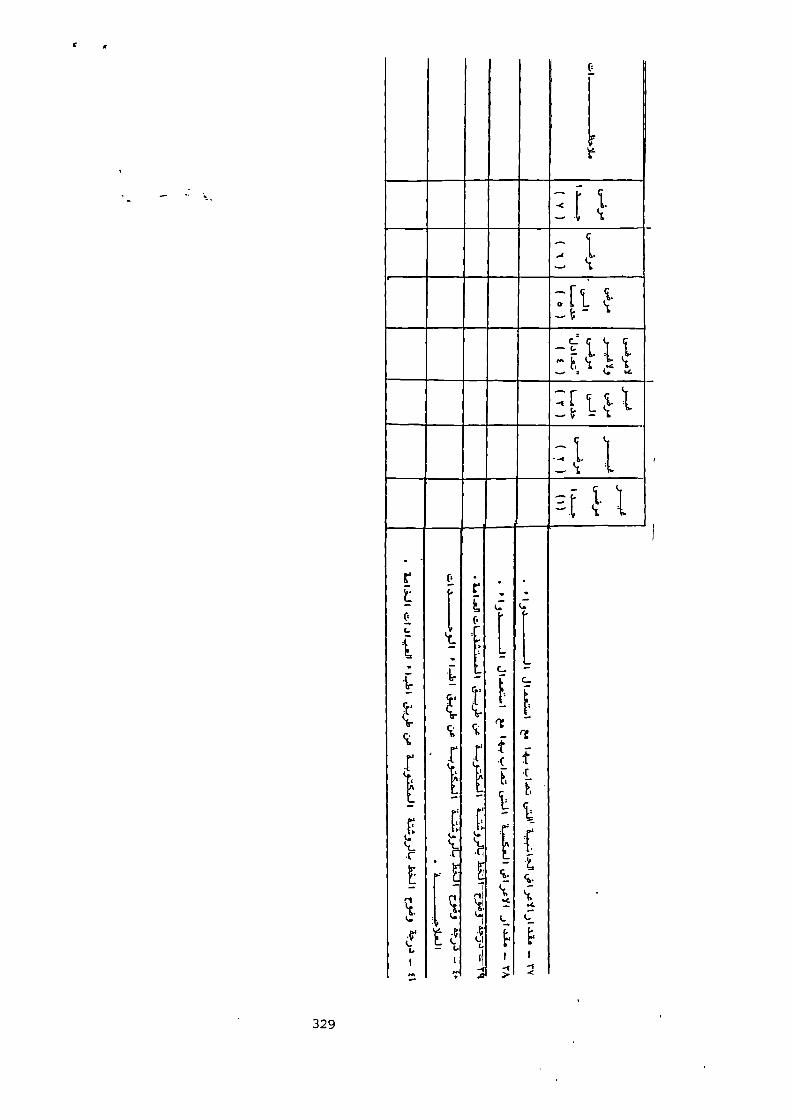
_
,
v-
.... -
< [ I
.-: 1
- C,.= 1 1I, k,
_, r t i. 1- 1,- %. 1..
- t 1 1. .
r
E r
0,t tt.kt
cf.r',1rt•k-
L
16 : [
'tI
,
r
Cr
cc;
•r1rk,7._
-C1
ql61
if
I
.
i't
Crrt;- r1c,t7:
-C1
q l6.S
II
't.i
vl
1
—ftEIL
-c
--it
I
•1t
'r;
-tt
F`
t.1..ci-
kG.-.4
il
I
.
••••
329
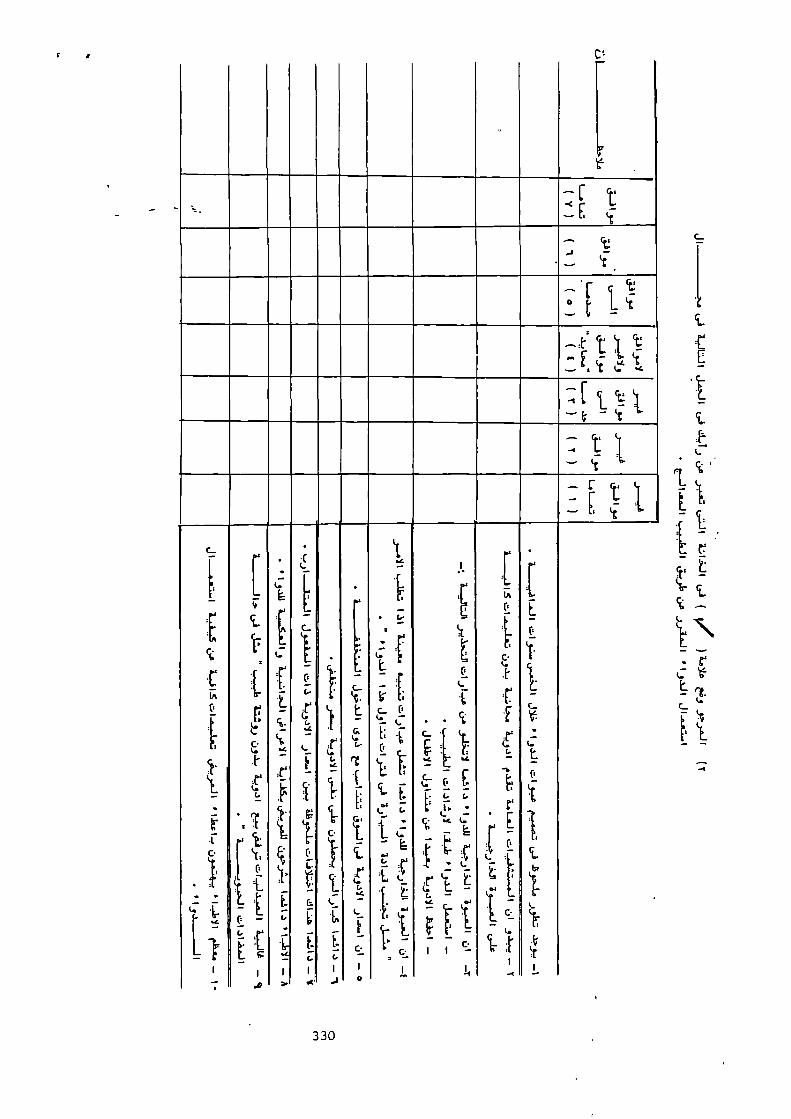
Ct_.
p.
ie
C t.........< E tt_
cr...
......•C
.._,
1
L kt
F. i
t cv--: 1.– tt
— r t
.
.
0
i
6
.
.
7
5.-
rt...kc,
0
—
1
-
tt
g
t.
`:i .
I
•6
...,
c4
6re_
I
.
.L
•
C
I..1
kC .
..
:
..::
t._.
ii
.
I
. .
c_
E .0
11
I
.
t..
...G....
—
—
_.
0
C
.-c,
.. ,
t t
-
t. E
• .4. ,...
--..
r `E _
_ c.. kr
I o
.
o
6
:
0
t
r
E
rc.
1
,
v:
g
330
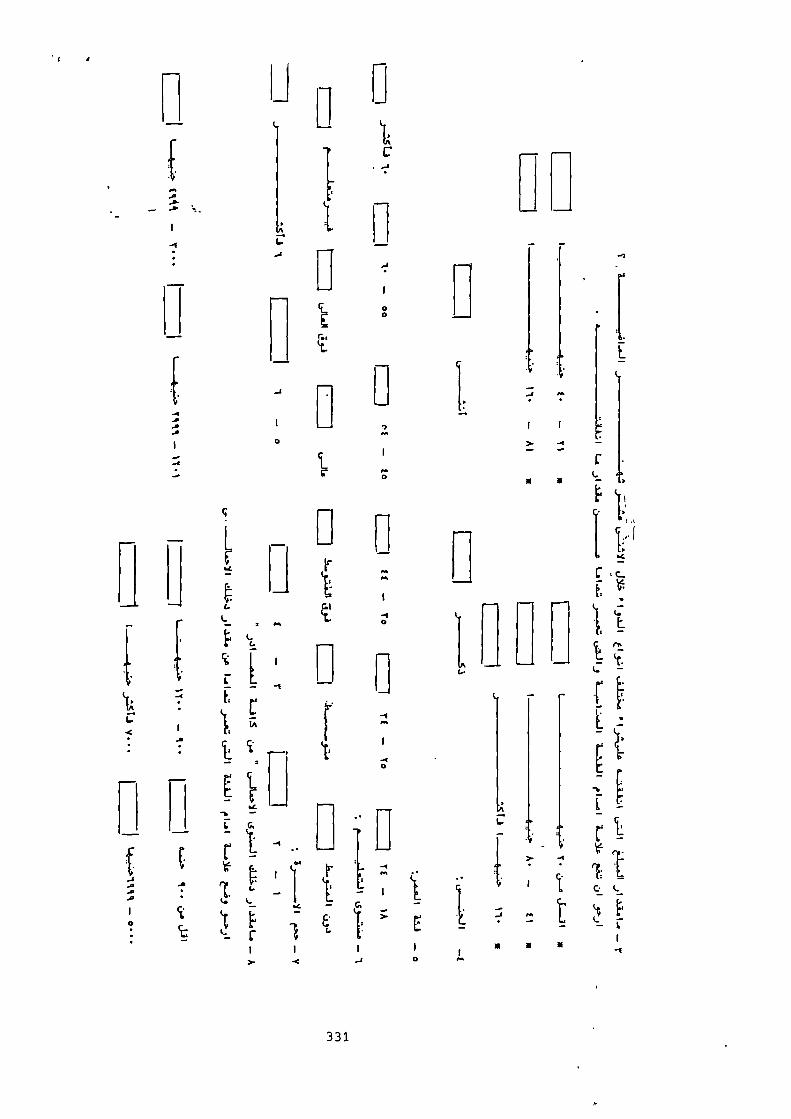
^
E
331
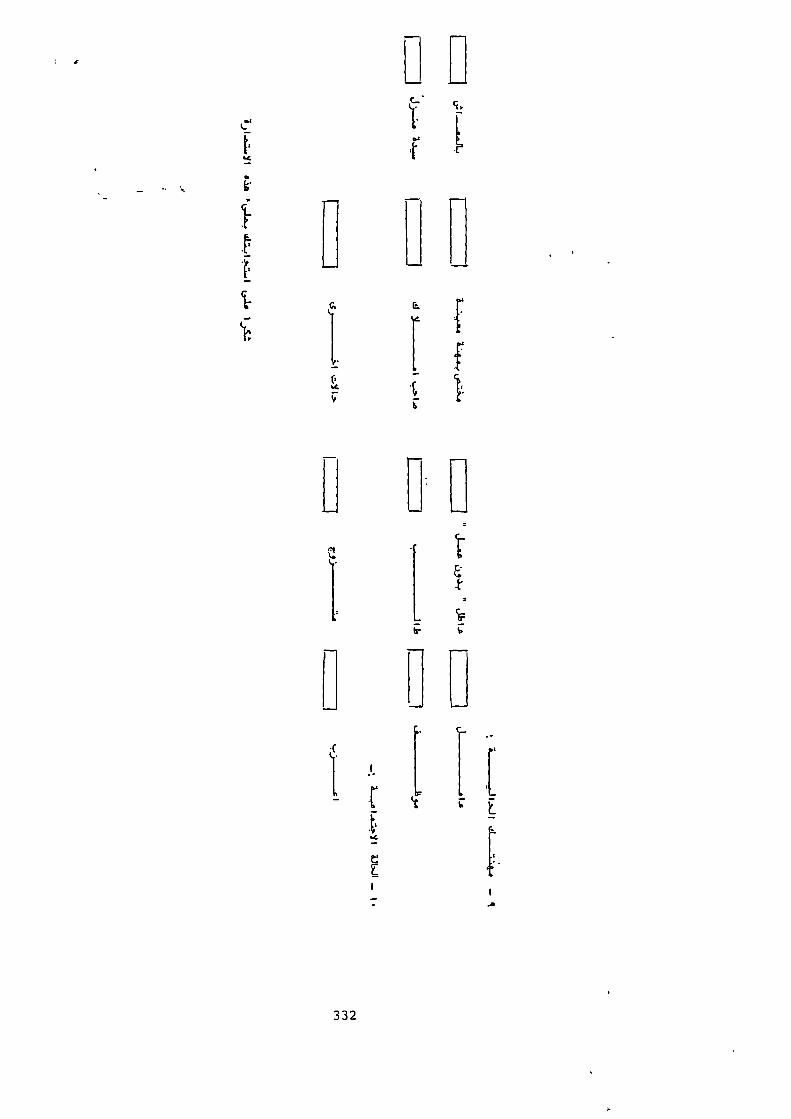
..,nn•nn
c. e.
0*
332

APPENDIX (3)
ROTATED FACTOR MATRIX
333

000mxoyons.n>>>»000m-oLpoorrrnrnrrrroll-ovm-or,mmmnmimmm«<<«<<cccmyJccca.nnn>›,..mm»)..›xxxmmxxxx.x.nny.s.n>zzz.-..,mcoLownnnonnn<<«<<««««««««««<<««<<xxxxxxmAAWAX737)7WW13AXW73Axiv.72323A.0731.1,p1.1.1.1,-P.PwWwWWwwwwwwwvvvvvvvv.-rrrrracoXAA213,3AA,ri3OW-4CT.11-PWN,-,D43M-4MU14-wW,--DaC0-4M,X14-wr41-,D
..................... 0000000000000000S Cl71DDD77.70DDrnD.-3,-.,--.7.'N,-._),--..(,),JA-4-44-4rvm-J-44. W4-Wrivcou1ui ,J04.0mAPOMMw_nw074-0'3D-4w 04) -4 1\1,0 -.1•0W -J.--. 04.4.0 -PW -3 -7w-o v ,nwOW pm-4 7W(1,0M-4, 11-4 J1 -4 -4 -4 nT 0 MwMx .-. j1 m -44- 4- nil nP w v 00w 7 7 047P04'.-•W-P0D,-.P.owN-4.3M,-.w.0-0.34104o7J00'v7-04,m_oor-w n-•
x.
)Jr.--14,MT-14-4-3),D7.).-. Cl
0'0'%0-4-0.-(N .PNUI4J10'JMWP3W0P41. 7,-. 0,0D01Jrvw-J-4-14-431 0.-, n.(10-4, .1.0W.-. WFDMWP-(Dr4-.7700WmMD„0,37,--. NrJwmwNw p _o-Jm MW043DT-P.OWWO31DLII00-0(1)Wp.v4.W-1,03',-.0.0kxwr.0004.u3.0--Jrvi--0'N0)0'0'miv4iw.,1.0.0N0.43-43.--w4DD n-•W0-4
NJ
II•••••••••••••••• 00000000 •• OOOOOOOO ••••••• ClDr-(r.4700rW-400,4WN0r0r(--371--.30--00.--DJ0D,--. NN4..--. 0'wr-J -3411,-. ,00--40k00wMcxNv0'OD 0ocowvisow.prN4, 0vw0'1)-44.0'J1(04'-144.00WD.34.w4-0m M
n-n cowwvIrvol-04-0CTNNW1-0.3.0-4D4,w0m4-kA-4-4.--,Zr-40,wrm-J4M0-.4%11-4M(Trs40-1-17,0-01.4.0.(1wN4(.41.-4W4,WAMJ.PD0
••••••• OOOOOOOOOOOOOOOOO • OOOOOOOO •••••••• ClD000Dr_30,-..-000r1-.000DrDNI70.-,D7t-..-.4.4.MCD4-0D0---3D0mw p .-. 0w0.-. 4.00'-1W-4wCT0WNJ0J-J.- . .nrnr.J-4-4-1-00-4-W 0-00'NJMJ0.0,-..-.4,000W0r4.-01.0.00ulWp31rwW-PW4.rs44.MA3'W-Imm0'w.ow0'-)wrvoo3wNmm.o•-i-r31N4-4-4.0.01.-1./Iw•-0'0--4
I I ii•••••••• OOOOOOO ••••••••••••••• OOOOO •••••• Cl
...-.NIDDD.-.WD0-0.-.N.--Jo--.I-DO3DO_),..r,D.-.0_)D3DOw .DMWO-40-4uivimD,J1-4-00s wm p r4,p 4, N.00-4Dw4-orti. 04.wolvIn4-4J)koviND0W-04--JulOWvi-JulWrsJ.-0rn ., ,JI0M4-r0'.04- M4.CT4M-OMWON4.-05_0(vvio)-4-0-4rvwWML.43u)CoM.P0,--mwor-400cow1-.11-04--0WZ3-04.NJW,CMI-Jww,3
A
-11I n
••••• OOOOOOOOOOO ••••••••••••• OOOOOOOOOOOO-4co-400.-NoW000.-.00000D00000(-4000.-.I.J00,-4.-40.--0000CT IV n-n 0 4- 4- -443 co rv 1- ,n-• NJ 4- •-• -4 n..n -4 iv 4, 0 "0 0 coN-4 Cr. 4, -4 n--w0CT-00.-s WCTMNJWUIrviva4, N n04, rul,-4 W00-.1-0w0)MMuIM-4-41/404, -4wwvt-om m0',-.W nJIM,-.0430M-4INJ-44- n-•0WWv).0.-.-4(,)-40“0.--wN4,-400,-.4.ww.nN010)00),-.NINJWM(.4Coul0P4m(v0M0',--.4-w0'C00'.-.0-,413143rmim.--.(v01/4111.x.-.4.-4Nm
II• • • • • • • • OOOOOOOOOOOOO • • OOOOOO • OOOOOO • • • • • ClC) D CD 0 0 C3 0 .4 N 4.. -4 %.0 M %.11 ... C3 C) D 1-4 1-4 C3 C) 0 0 r. NJ C) C3 0 ,--. 0 0 -.I
4, w Cf. CP 4) 4, 4, ro -4 r- M 03 W .0 w Po Ln m w W n-• NJ (D .0 NJ 4- 4, ,A CDOmm$4. Nu10-4-44-a—OwMOM4, ww0-44, -.4Mas -4,--thNOm4-w4, 00r.w0, 4).-. 20WW4.01NW-4.0CovIZN-41v0'-4,-..---4mr0'43WM.04-003.04.0'0W.-.Nru100.--colvw4.(.0%)1.4.4-rt.0.40(‘).0°-4w.00.m.-.NJOwrvivWW-ONCoMq3-4Nm-OUI,OON
OO OOOO OOOOO 22••••••••••2•2OOOO I OOOOO •••WNF1-0.-. klikoNM-4-00--. MNC0-10W4, .0.--. -4Mrc0-404, 4',--00Wmr.J-J,0-0m.-. 0n-•.,-(Los0 cow(-. -.I Cr. n.s4)00rvul w -0 .Orsirvw.0 . n-• Lrlt.t.)VIN-4 OD 4, UJ
4.CDU)1(O -4 VI N.) -401.40-• n-• (T04- ,J1W-4 -JONI •-n• os co Os .04, 05 uJ
CD
334
I.
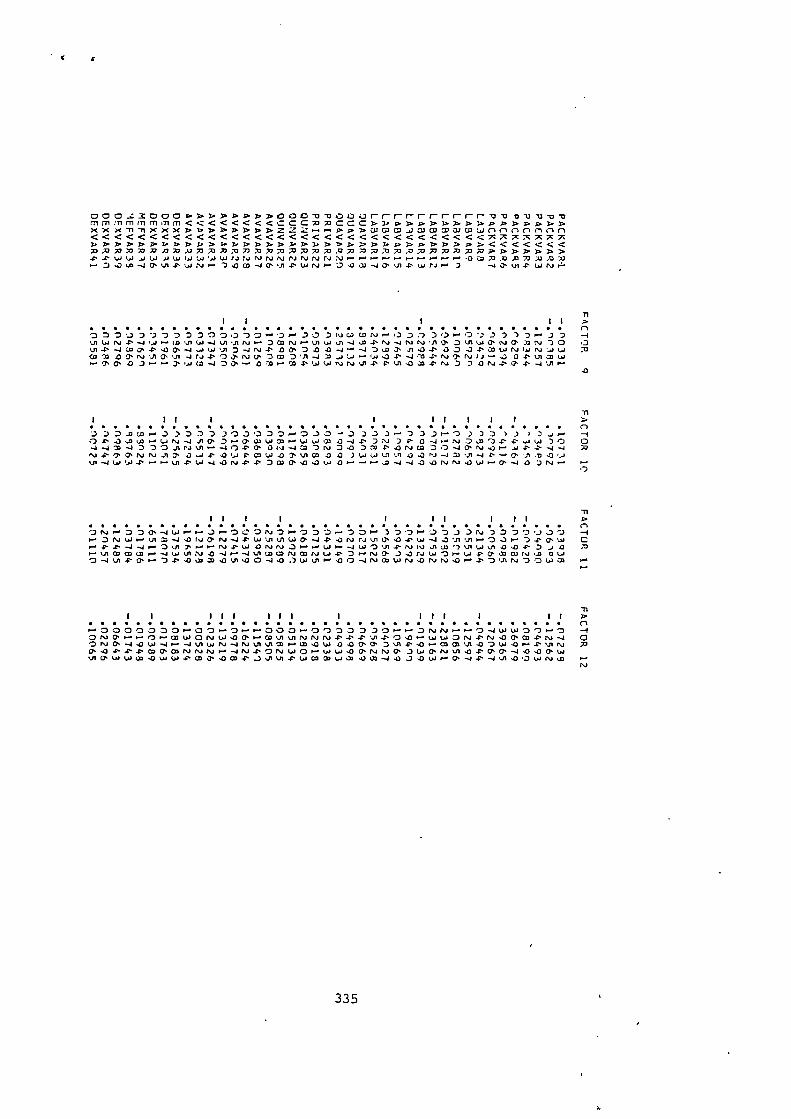
000,:3000r. >>>>>»DOOmmr- ...... r-r-r—ommviammmmmnnnmn<<<<<<<<CCCMMCCCLI.r.»>>>.D.I.J.rnrnxxxmmxxx>u>>>>>>zzz,..-.D.n>wcam,,wwmalcowncInnnnn«<<«««<<««<<««««««««x7rxxx73.7370mmxm7ximx73737373:07373x,0 x07J7Jx,oxxm733.3.n>>»4, 4, La LO .4 LJ .1 LU (41 L4 La rJr,j NJ NJ NI Is, PJ rsJ ra :NJ 4070.00303030 ".*
-.4aut-pwrvr
1 1 1 11 p.
••••••••••••••••• ...... •••••••••••••••••• nO 00070003300,730,-.030DwcaC0ra,-.-003313.....)0thLar.J.C..1.,J.J.-•Dmrarulwvi-JJa-Pr.DLow0.0Ln4'Ja00'4'.00'-.J10--JNJ4'00'044-.1 .-04'00.74wra talvww MCoaa.0TnrJ4-00.n,0,DmD.A-Lw...04.-1ro-prvo,NJIJ-.a04,Lomw
M1 11 1 1 11 1 1 1 >
• ....... •••••••••••• 00000 •••••••••••••••• n3D3-oca.M3:23_300000.- . 0_30-. 323) .--0331-. 022713/2.J.- -104'JuoLo.-ur.,-.4J10'7.-0'wwmo-wwcaZ-J4'D:JDP0-4.-raww -20 0..1-.1m-.1D0004-0'0(a-a=0n,0.03mP.0NJm30-40, 4 MNJ4'TOsnJNJI.OLJpOW.03'L/10002ww n1vi-0'Lri-4WLakn-PLa-a.OMDm0 . .0.0w.0.--,---1-4-40.0w.-0. -103NJ .- .-
II 1 I 1 II I 11•••••••••••••••••••••••••••••••••••••••••....4,...000.-41.0.-........),-.003N-3rOD'J.-.00.-.17..7.33rap7'3,J3'D3 DNW.-. LAM-44:0WPN-4PWL/IV1WCP-44,..ONI,JVIIT44, W-4.0 ..11 ..A.--. 0Jr -)4, 0, W C
-1 ul ...A o•-•4.41 .0 is4rs4 •-• LJ -4 L4 "D (N.1 INJ J1 (.0 LJ .0 <13., .0 70• vi 03 0303,-. '1 U' :s4 0 -4 (-0 -4 5.11 LaW1,402 14LJ4"0•-• NO La 'D 1:1‘ 03 CO NJ 03 0 Lo0 -4 vi 41' Cr .- .0 co ao .0 co Q 0 -4 4,1) .) L.+ Ln .0 0 -4 NJ co La rJ P4 NJ 4r. %PI Po 0 LA 03
III III I III I II>••••••••••• 00000 • 00000 • 00000000000000000 • n.-.3oc0o3o.-0o.--D.-..-30o,-.0,i0„D330,-.0.ONJP..,...01-.07WONW,00,WVIvINNNMV14,043,-.wW0N.C.N.0PM-PN-4 0Or.J0. -4.0w-4......4.nmrm.0W0.00, 0, 35)1 .N.0,-Mmv14:101st42 A0' rn4'co0.mNINJNIONwOrw5.4430.N.IN0'3 1,4'0,00'Wvi0'WW,2342wW4'ul4'1stWW,44:1-4,11430wINJW
335

APPENDIX4
CLUSTER/DISCRIMINANT ANALYSIS OUTPUT
336
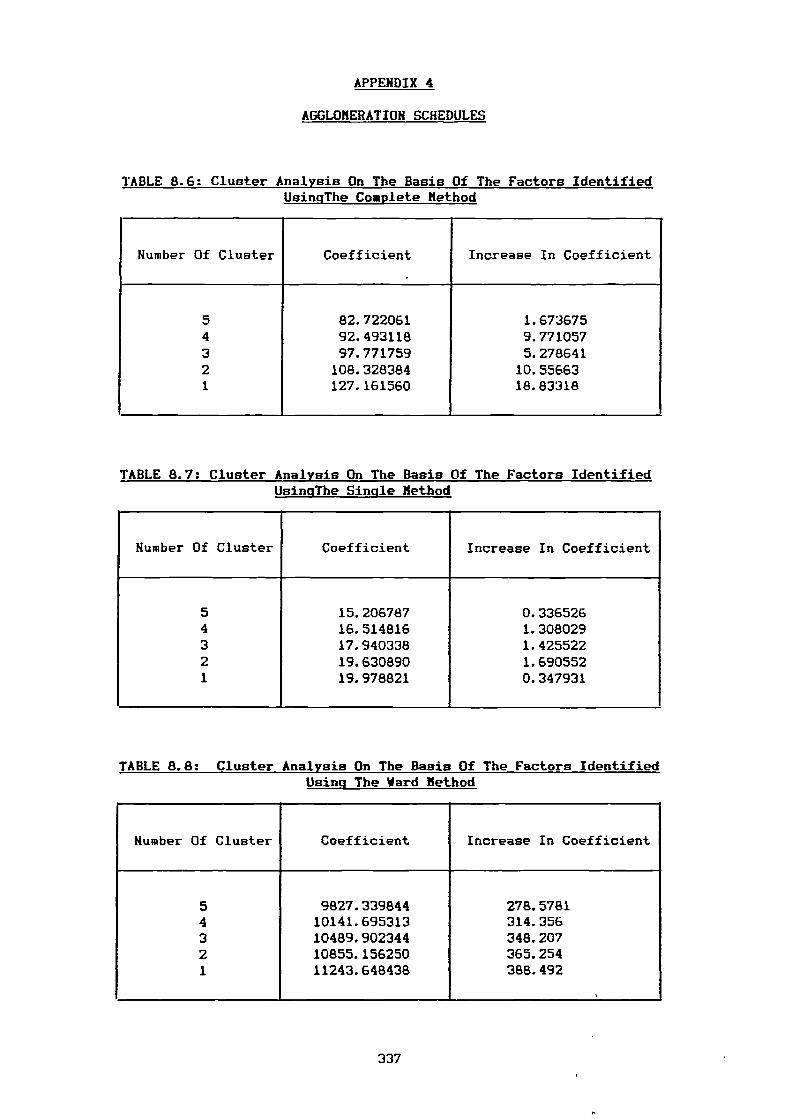
APPENDIX 4
AGGLOMERATION SCHEDULES
TABLE 8.6: Cluster Analysis On The Basis Of The Factors Identified UsingThe Complete Method
Number Of Cluster Coefficient Increase In Coefficient
5 82.722061 1.6736754 92.493118 9.7710573 97.771759 5.2786412 108.328384 10.556631 127.161560 18.83318
TABLE 8.7: Cluster Analysis On The Basis Of The Factors Identified UsingThe Single Method
Number Of Cluster Coefficient Increase In Coefficient
5 15.206787 0.3365264 16.514816 1.3080293 17.940338 1.4255222 19.630890 1.6905521 19.978821 0.347931
TABLE 8.8: Cluster Analysis On The Basis Of The Factors Identified Using The Ward Method
Number Of Cluster Coefficient Increase In Coefficient
5 9827.339844 278.57814 10141.695313 314.3563 10489.902344 348.2072 10855.156250 365.2541 11243.648438 388.492
,
337
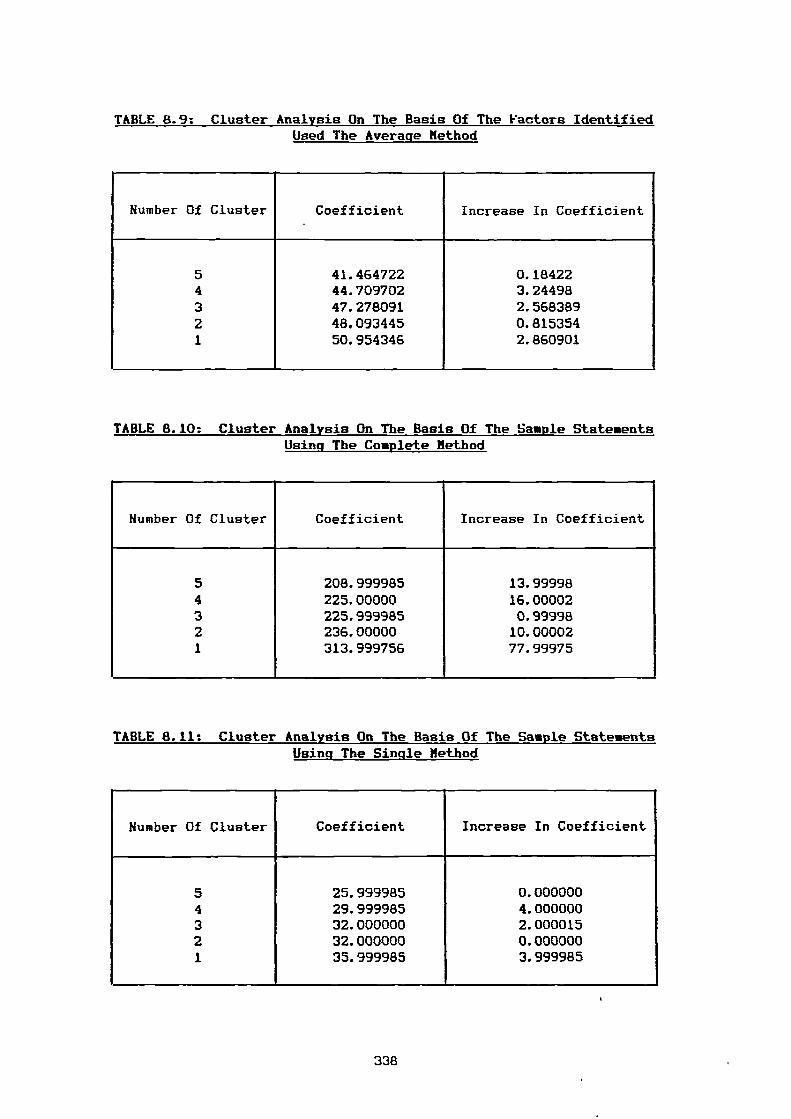
TABLE 8.9: Cluster Analysis On The Basis Of The Factors Identified Used The Average Method
Number Of Cluster Coefficient Increase In Coefficient
5 41.464722 0.184224 44.709702 3.244983 47.278091 2.5683892 48.093445 0.8153541 50.954346 2.860901
TABLE 8.10: Cluster Analysis On The Basis Of The Sample StatementsUsing The Complete Method
Number Of Cluster Coefficient Increase In Coefficient
5 208.999985 13.999984 225.00000 16.000023 225.999985 0.999982 236.00000 10.000021 313.999756 77.99975
TABLE 8.11: Cluster Analysis On The Basis Of The Sample Statements Using The Single Method
Number Of Cluster Coefficient Increase In Coefficient
5 25.999985 0.0000004 29.999985 4.0000003 32.000000 2.0000152 32.000000 0.0000001 35.999985 3.999985
338
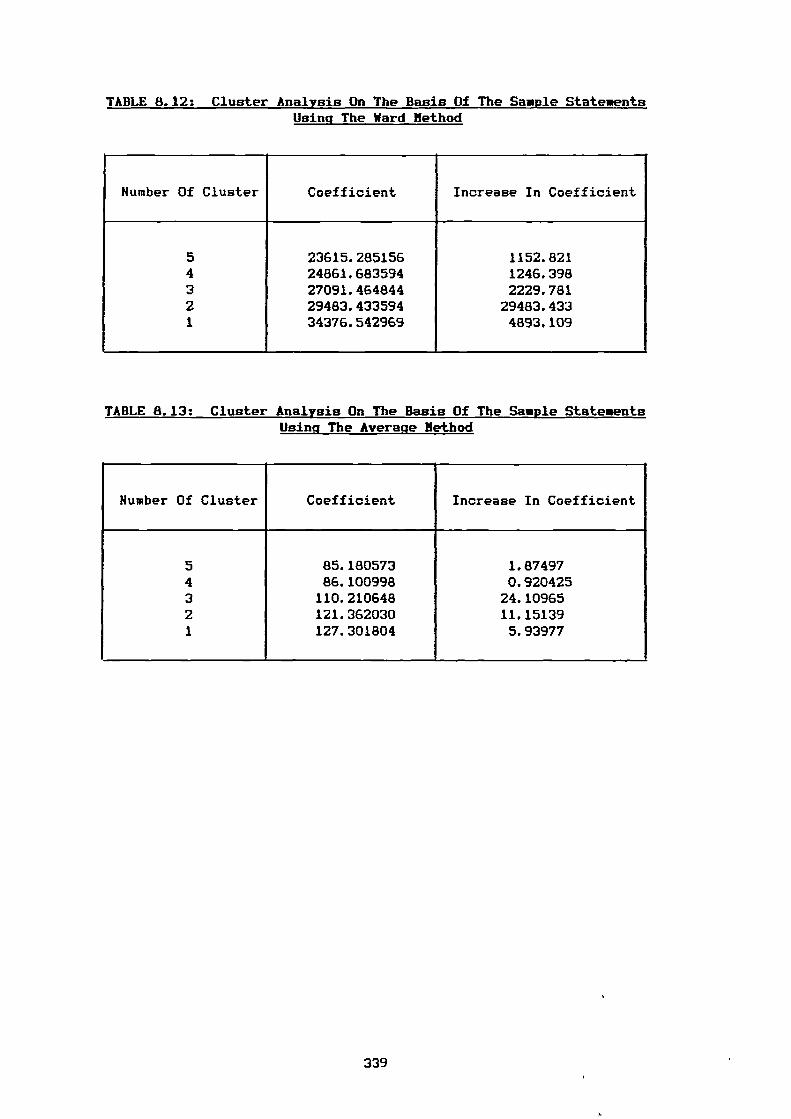
TABLE 8.12: Cluster Analysis On The Basis Of The Sample Statements Using The Ward Method
Humber Of Cluster Coefficient Increase In Coefficient
5 23615.285156 1152.8214 24861.683594 1246.3983 27091.464844 2229.7812 29483.433594 29483.4331 34376.542969 4893.109
TABLE 8.13: Cluster Analysis On The Basis Of The Sample StatementsUsing The Average Method
Number Of Cluster Coefficient Increase In Coefficient
5 85.180573 1.874974 86.100998 0.9204253 110.210648 24.109652 121.362030 11.151391 127.301804 5.93977
339
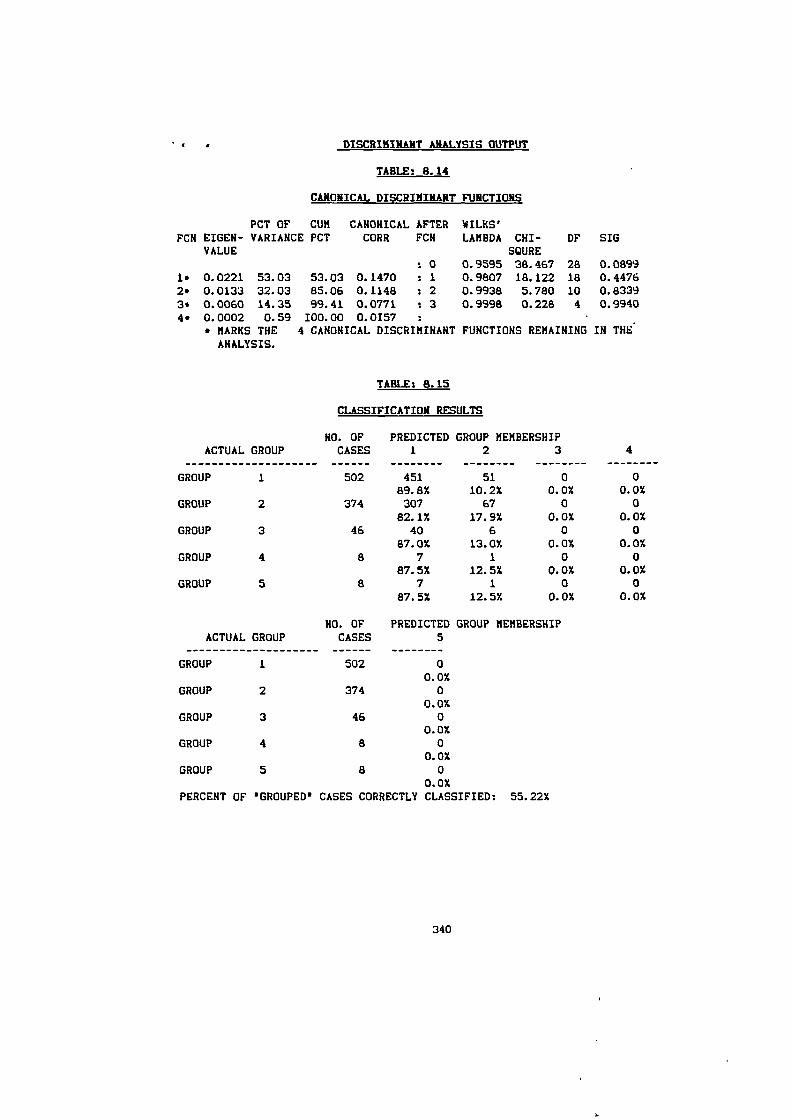
DISCRIMINANT ANALYSIS OUTPUT
TABLE: 8.14
CANONICAL DISCRIMINANT FUNCTIONS
PCT OF CUMFCN EIGER- VARIANCE PCT
VALUE
CANONICAL AFTERCORR FCH
WILKS'LAMBDA CHI-
SOREDF SIG
: 0 0.9595 38.467 28 0.08991. 0.0221 53.03 53.03 0.1470 : 1 0.9807 18.122 18 0.44762. 0.0133 32.03 85.06 0.1148 : 2 0.9938 5.780 10 0.83393. 0.0060 14.35 99.41 0.0771 : 3 0.9998 0.228 4 0.99404. 0.0002 0.59 100.00 0.0157
• MARKS THE 4 CANONICAL DISCRIMINANT FUNCTIONS REMAINING IN THEANALYSIS.
TABLE: 8.15
CLASSIFICATION RESULTS
NO. OF PREDICTED GROUP MEMBERSHIPACTUAL GROUP CASES 1 2 3
4
GROUP 1 502 451 51 0 089.8% 10.2% 0.0% 0.0%
GROUP 2 374 307 67 0 082.1% 17.9% 0.0% 0.0%
GROUP 3 46 40 6 0 087.0% 13.0% 0.0% 0.0%
GROUP 4 a 7 1 0 087.5% 12.5% 0.0% 0.0%
GROUP 5 a 7 1 0 087.5% 12.5% 0.0% 0.0%
HO. OF PREDICTED GROUP MEMBERSHIPACTUAL GROUP CASES 5
GROUP 1 502 00.0%
GROUP 2 374 00.0%
GROUP 3 46 00.0%
GROUP 4 8 00.0%
GROUP 5 8 00.0%
PERCENT OF 'GROUPED' CASES CORRECTLY CLASSIFIED: 55.22%
340
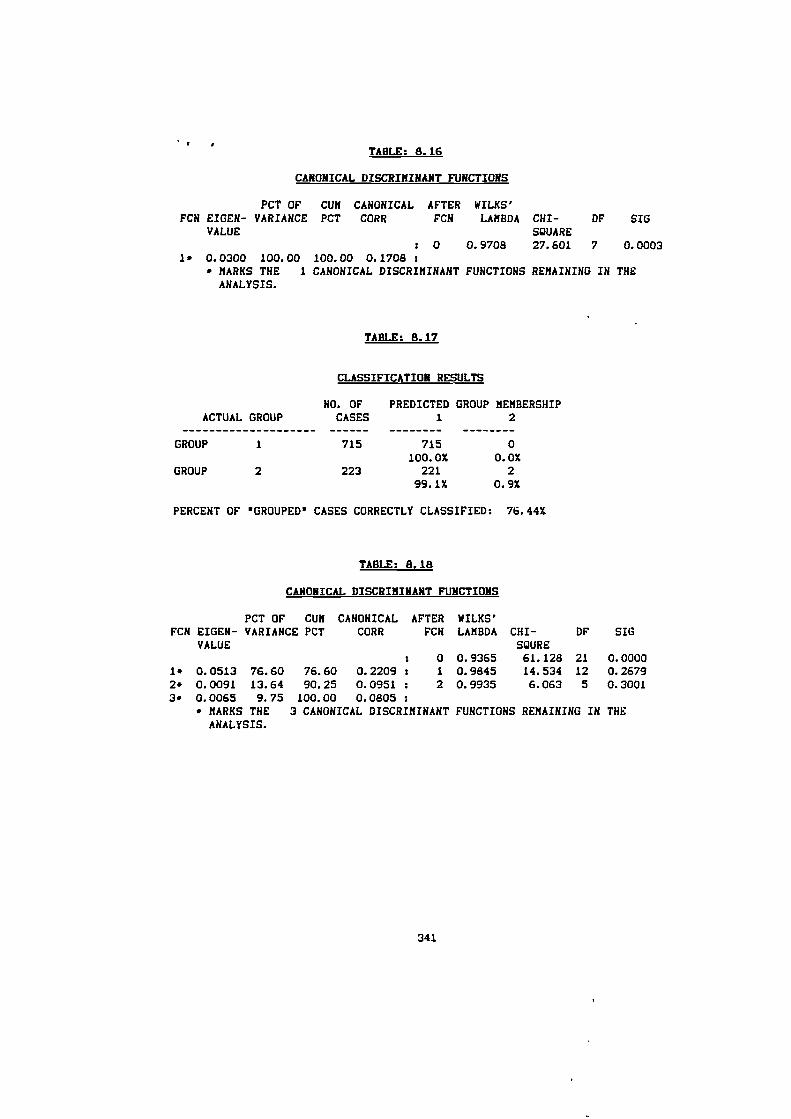
TABLE: 8.16
CANONICAL DISCRIMINANT FUNCTIONS
PCT OF CUM CANONICAL AFTER WILKS'FCN EIGEN- VARIANCE PCT CORR FCN LAMBDA CH/- DF SIG
VALUE SQUARE
: 0 0.9708 27.601 7 0.00031* 0.0300 100.00 100.00 0.1708
• MARKS THE 1 CANONICAL DISCRIMINANT FUNCTIONS REMAINING IN THEANALYSIS.
TABLE: 8.17
CLASSIFICATION RESULTS
NO. OF PREDICTED GROUP MEMBERSHIPACTUAL GROUP CASES 1 2
GROUP 1 715 715 0
100.0% 0.07.GROUP 2 223 221 2
99.1% 0.97.
PERCENT OF 'GROUPED' CASES CORRECTLY CLASSIFIED: 76.44%
TABLE: 8.18
CANONICAL DISCRIMINANT FUNCTIONS
PCT OF CUM CANONICAL AFTER WILKS'FCH EIGEH- VARIANCE PCT CORR FCN LAMBDA CHI- OF SIG
VALUE MIRE: 0 0.9365 61.128 21 0.0000
1* 0.0513 76.60 76.60 0.2209 : 1 0.9845 14.534 12 0.26792* 0.0091 13.64 90.25 0.0951 : 2 0.9935 6.063 5 0.30013* 0.0065 9.75 100.00 0.0805
* MARKS THE 3 CANONICAL DISCRIMINANT FUNCTIONS REMAINING IN THEANALYSIS.
341
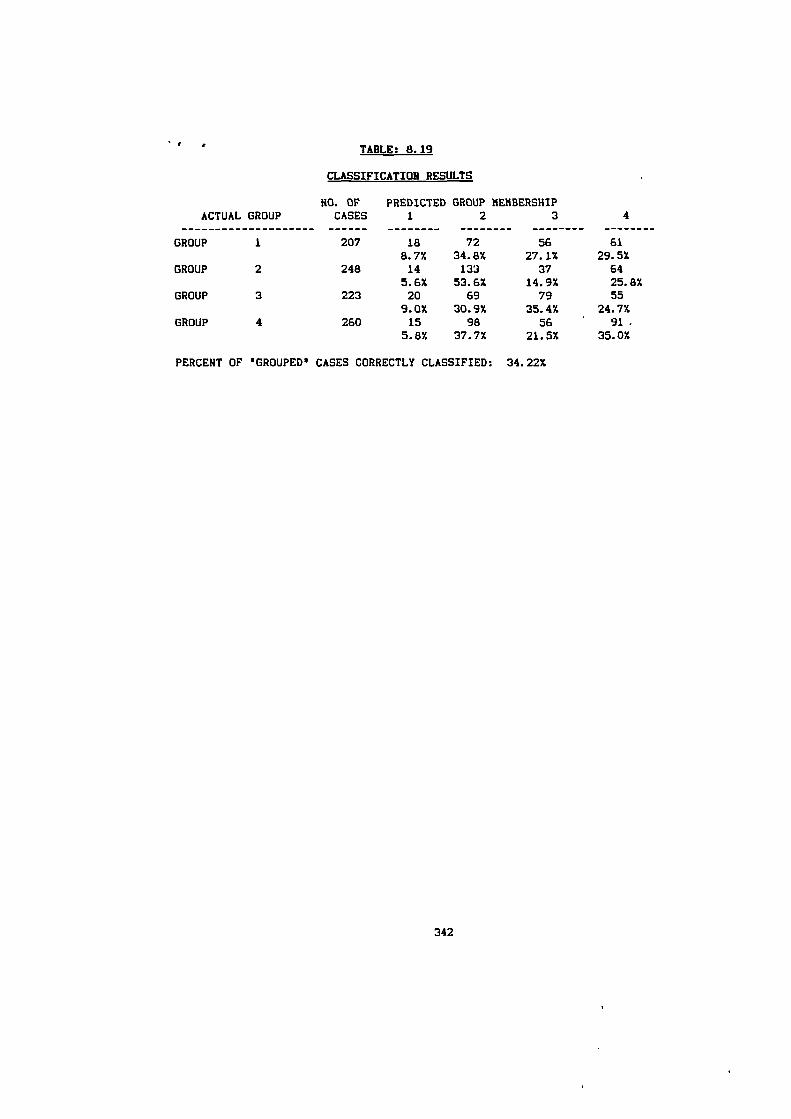
TABLE: 8.19
CLASSIFICATION RESULTS
HO. OF PREDICTED GROUP MEMBERSHIPACTUAL GROUP
CASES 1 2 3
4
GROUP 1 207 18 72 56 61
8.7% 34.8% 27.1% 29.5%GROUP 2 248 14 133 37 64
5.6% 53.6% 14.9% 25.8%GROUP 3 223 20 69 79 55
9.0% 30.9% 35.4% 24.7%GROUP 4 260 15 98 56 ' 91 -
5.8% 37.7% 21.5% 35.0%
PERCENT OF 'GROUPED' CASES CORRECTLY CLASSIFIED: 34.22%
342

APPENDIX 5
ANOVA TABLES
343
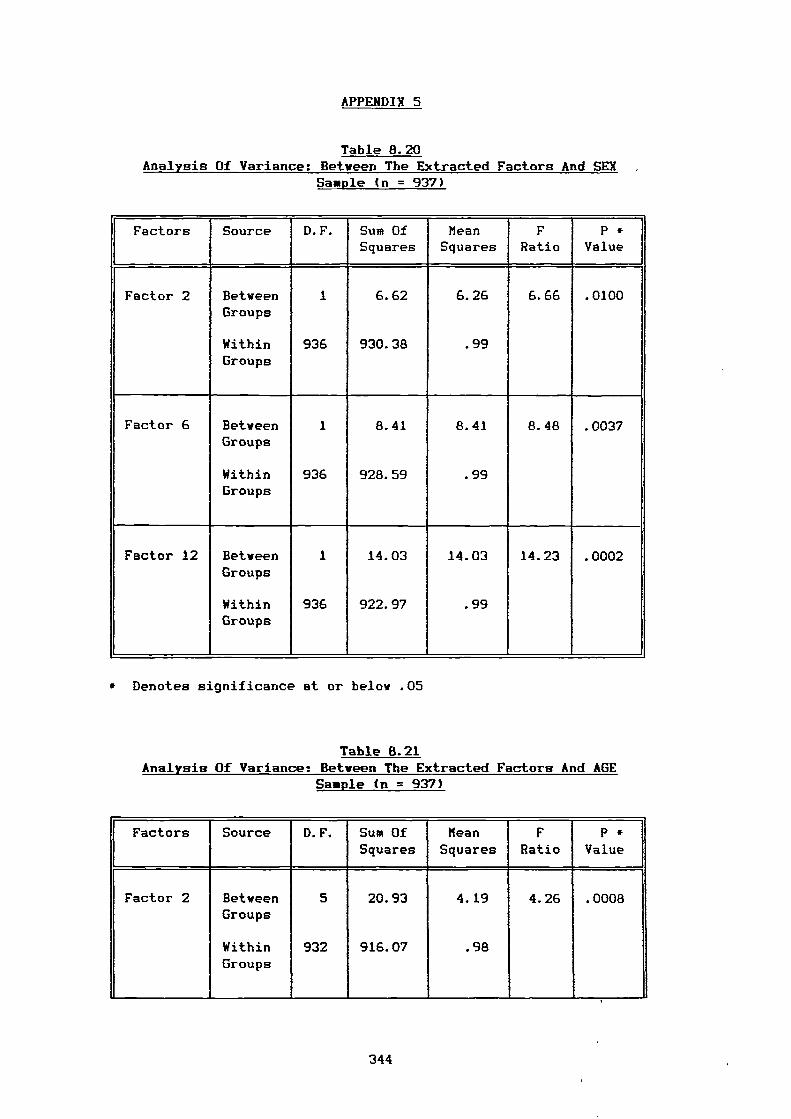
APPENDIX 5
Table 8.20 Analysis Of Variance: Between The Extracted Factors And SEX
Sample in = 937)
Factors Source D.F. Sum OfSquares
MeanSquares
FRatio
P *Value
Factor 2 Between 1 6.62 6.26 6.66 .0100Groups
Within 936 930.38 .99Groups
Factor 6 Between 1 8.41 8.41 8.48 .0037Groups
Within 936 928.59 .99Groups
Factor 12 Between 1 14.03 14.03 14.23 .0002Groups
Within 936 922.97 .99Groups
* Denotes significance at or below .05
Table 8.21 Analysis Of Variance: Between The Extracted Factors And AGE
Sample (n = 937)
Factors Source D.F. Sum OfSquares
MeanSquares
FRatio
P *Value
Factor 2 BetweenGroups
WithinGroups
5
932
20.93
916.07
4.19
.98
4.26 .0008
344
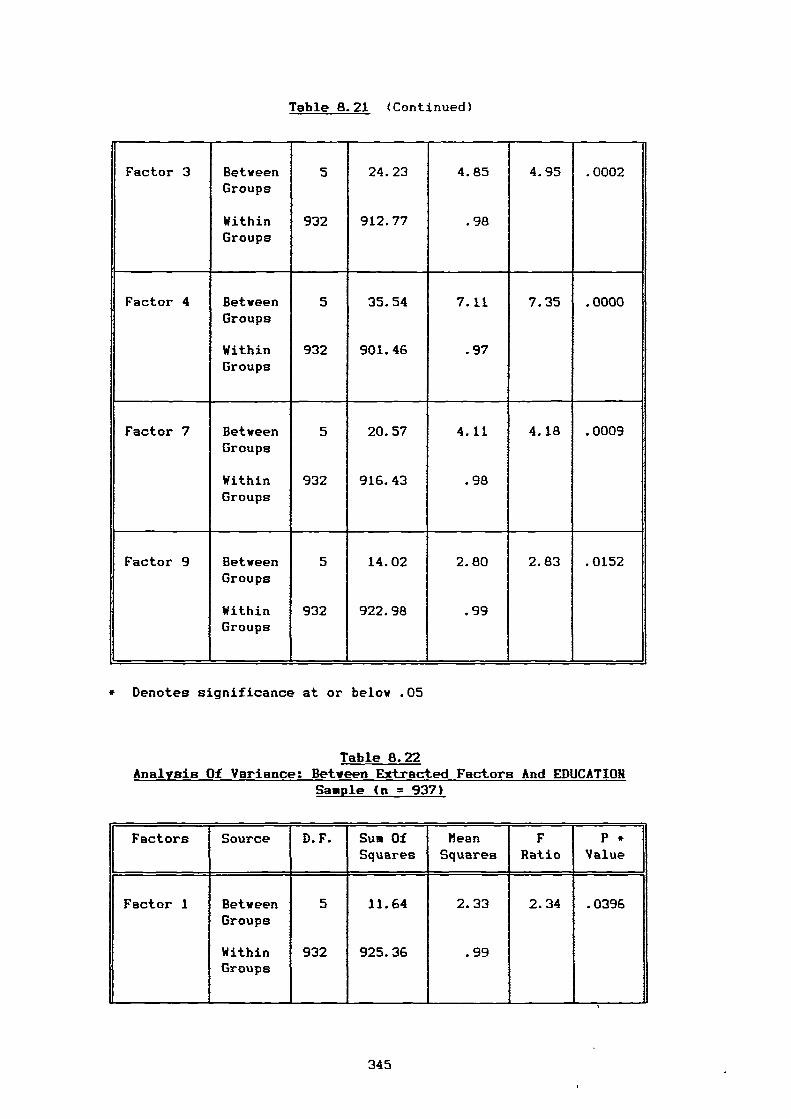
Table 8.21 (Continued)
Factor 3 Between 5 24.23 4.85 4.95 .0002Groups
Within 932 912.77 .98Groups
Factor 4 Between 5 35.54 7.11 7.35 .0000Groups
Within 932 901.46 .97Groups
Factor 7 Between 5 20.57 4.11 4.18 .0009Groups
Within 932 916.43 .98Groups
Factor 9 Between 5 14.02 2.80 2.83 .0152Groups
Within 932 922.98 .99Groups
* Denotes significance at or below .05
Table 8.22 Analysis Of Variance: Between Extracted Factors And EDUCATION
Sample (n = 937)
Factors Source D.F. Sum OfSquares
beanSquares
FRatio
P *Value
Factor 1 BetweenGroups
WithinGroups
5
932
11.64
925.36
2.33
.99
2.34 .0396
345
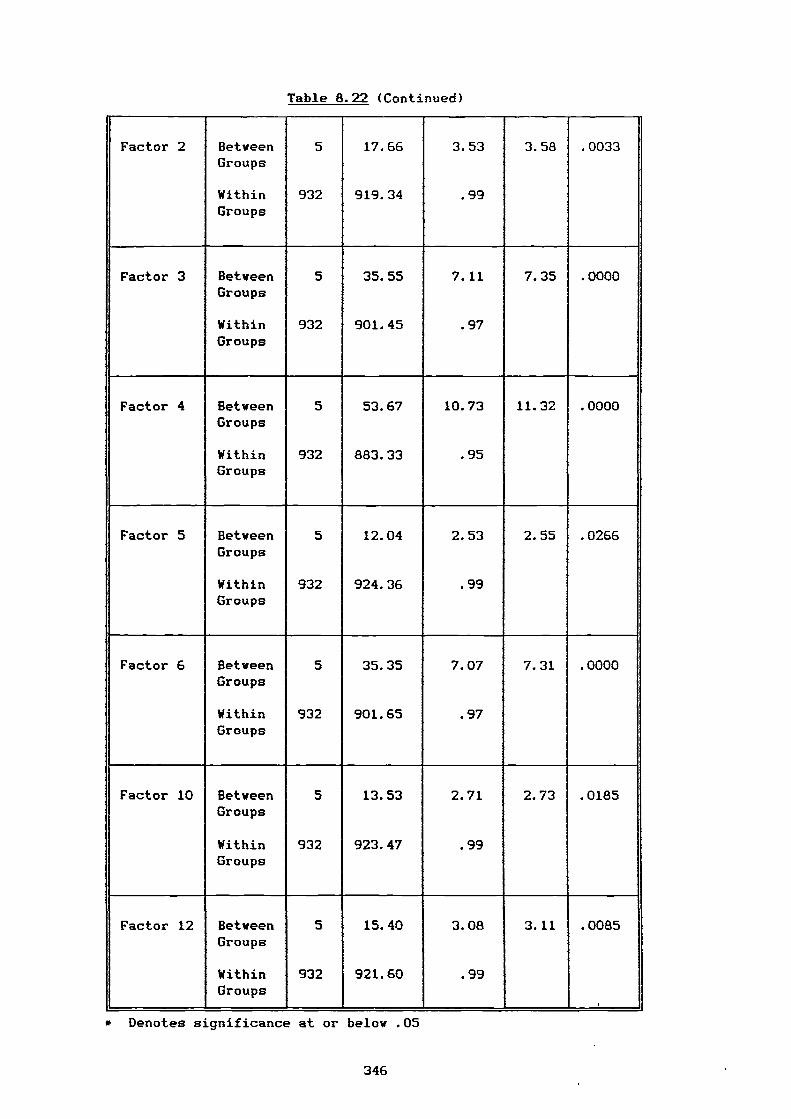
Table 8.22 (Continued)
Factor 2 Between 5 17.66 3.53 3.58 .0033Groups
Within 932 919.34 .99Groups
Factor 3 Between 5 35.55 7.11 7.35 .0000Groups
Within 932 901.45 .97Groups
Factor 4 Between 5 53.67 10.73 11.32 .0000Groups
Within 932 883.33 .95Groups
Factor 5 Between 5 12.04 2.53 2.55 .0266Groups
Within 932 924.36 .99Groups
Factor 6 Between 5 35.35 7.07 7.31 .0000Groups
Within 932 901.65 .97Groups
Factor 10 Between 5 13.53 2.71 2.73 .0185Groups
Within 932 923.47 .99Groups
Factor 12 Between 5 15.40 3.08 3.11 .0085Groups
Within 932 921.60 .99Groups
,
* Denotes significance at or below .05
346
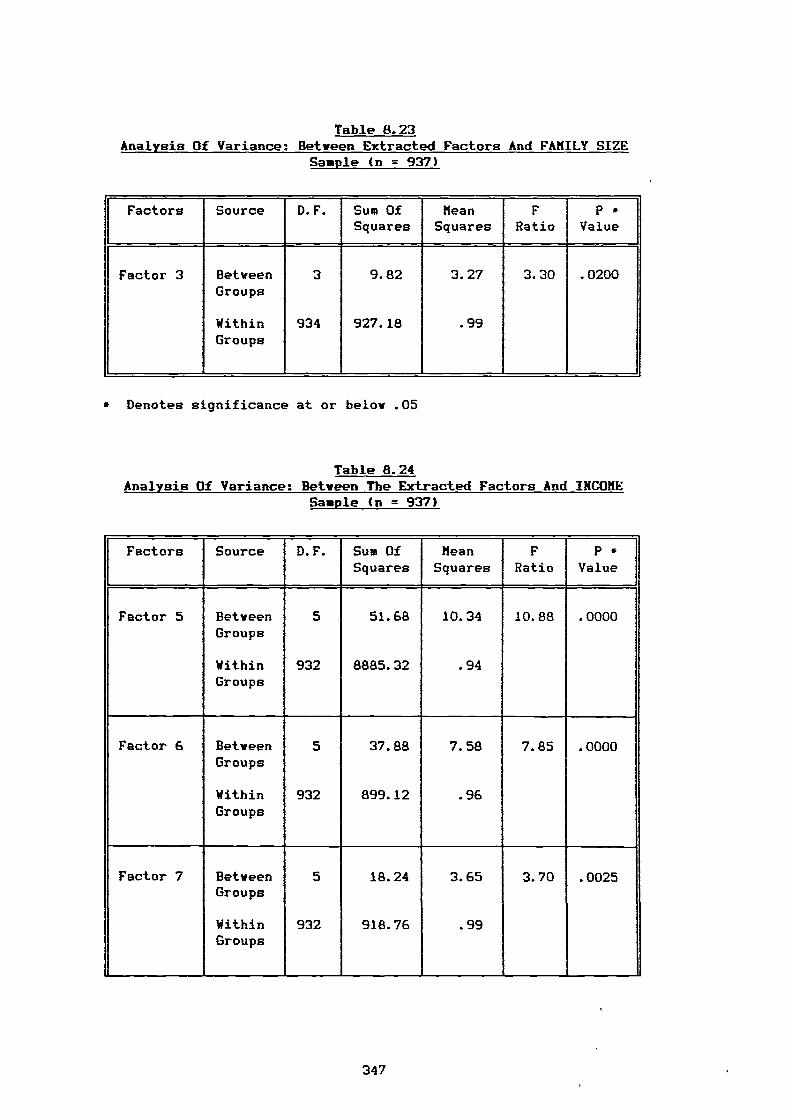
Table 8.23 Analysis Of Variance: Between Extracted Factors And FAMILY SIZE
Sample (n = 937)
Factors Source D.F. Sum OfSquares
MeanSquares
FRatio
P *Value
Factor 3 BetweenGroups
WithinGroups
3
934
9.82
927.18
3.27
.99
3.30 .0200
* Denotes significance at or below .05
Table 8.24 Analysis Of Variance: Between The Extracted Factors And INCOME
Sample (n = 937)
Factors Source D.F. Sum OfSquares
MeanSquares
FRatio
P *Value
Factor 5 Between 5 51.68 10.34 10.88 .0000Groups
Within 932 8885.32 .94Groups
Factor 6 Between 5 37.88 7.58 7.85 .0000Groups
Within 932 899.12 .96Groups
Factor 7 Between 5 18.24 3.65 3.70 .0025Groups
Within 932 918.76 .99Groups
347
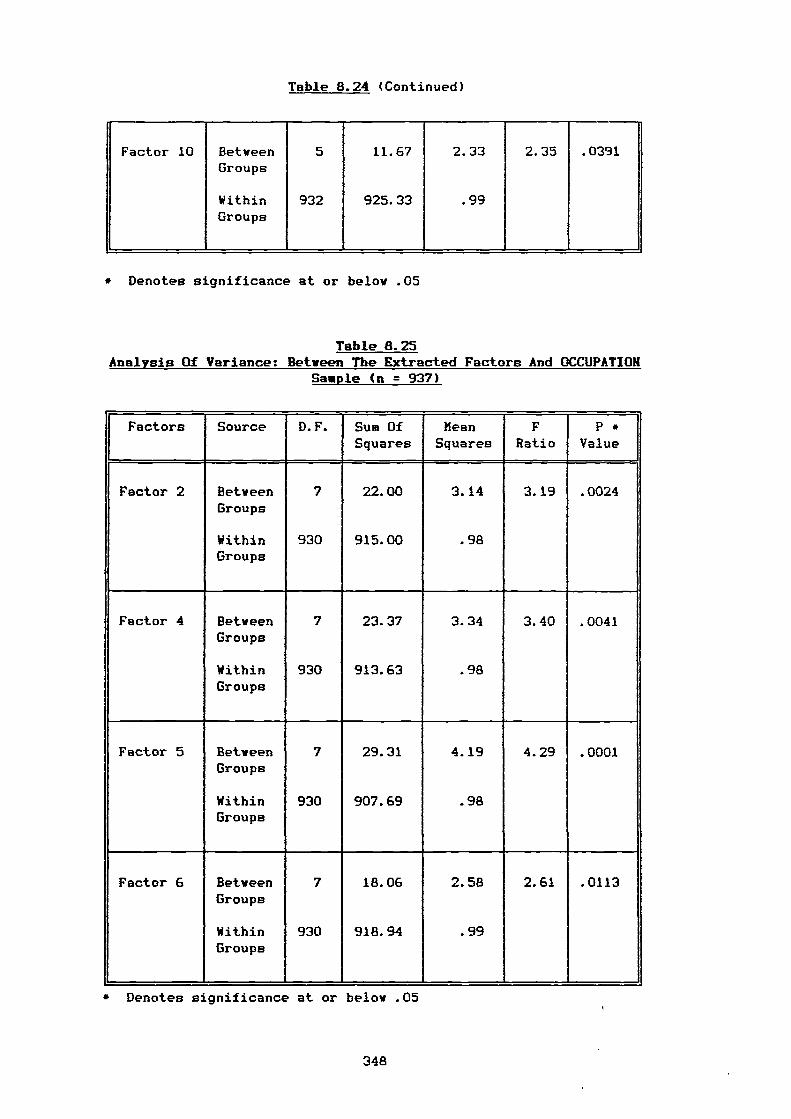
Table 8.24 (Continued)
Factor 10 BetweenGroups
WithinGroups
5
932
11.67
925.33
2.33
.99
2.35 .0391
* Denotes significance at or below .05
Table 8.25 Analysis Of Variance: Between The Extracted Factors And OCCUPATION
Sample (n = 937)
Factors Source D.F. Sum OfSquares
MeanSquares
FRatio
P *Value
Factor 2 Between 7 22.00 3.14 3.19 .0024Groups
Within 930 915.00 .98Groups
Factor 4 Between 7 23.37 3.34 3.40 .0041Groups
Within 930 913.63 .98Groups
Factor 5 Between 7 29.31 4.19 4.29 .0001Groups
Within 930 907.69 .98Groups
Factor 6 Between 7 18.06 2.58 2.61 .0113Groups
Within 930 918.94 .99Groups
• Denotes significance at or below .05
348
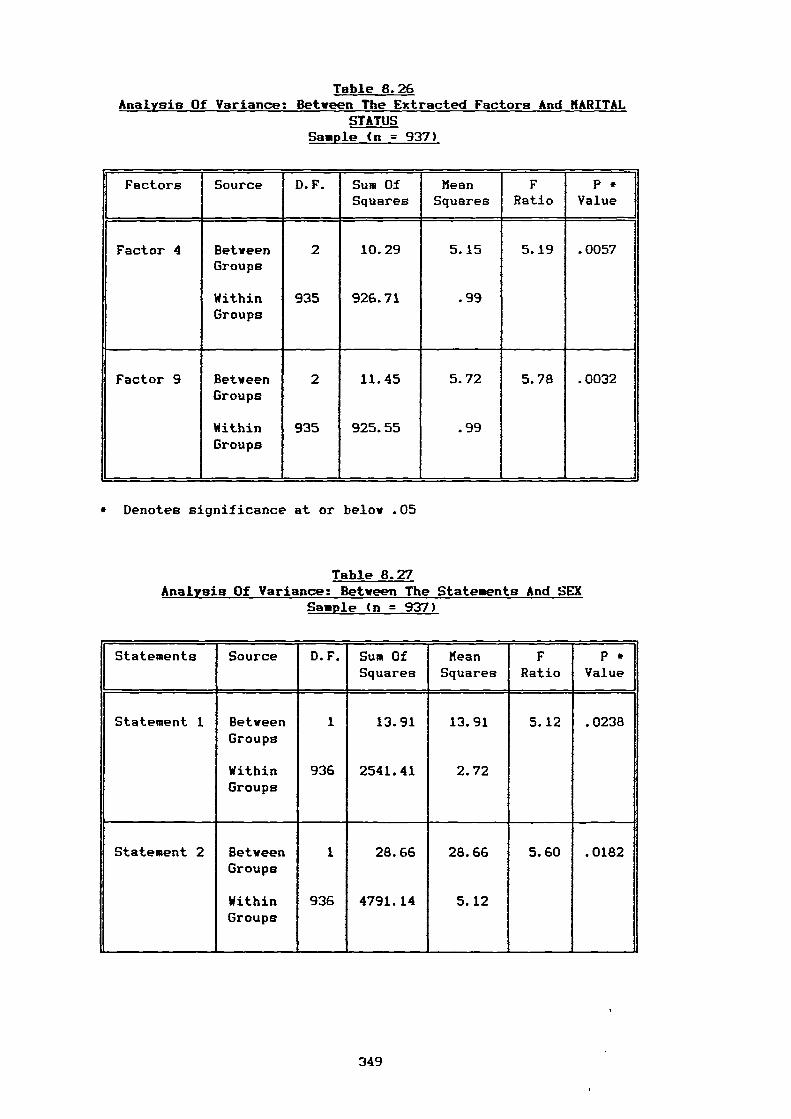
Table 8.26 Analysis Of Variance: Between The Extracted Factors And MARITAL
STATUS Sample (n = 937)
Factors Source D.F. Sum OfSquares
MeanSquares
FRatio
P *Value
Factor 4 Between 2 10.29 5.15 5.19 .0057Groups
Within 935 926.71 .99Groups
Factor 9 Between 2 11.45 5.72 5.78 .0032Groups
Within 935 925.55 .99Groups
* Denotes significance at or below .05
Table 8.27 Analysis Of Variance: Between The Statements And SEX
Sample (n = 937)
Statements Source D.F. Sum OfSquares
MeanSquares
FRatio
P *Value
Statement 1 Between 1 13.91 13.91 5.12 .0238Groups
Within 936 2541.41 2.72Groups
Statement 2 Between 1 28.66 28.66 5.60 .0182Groups
Within 936 4791.14 5.12Groups
349
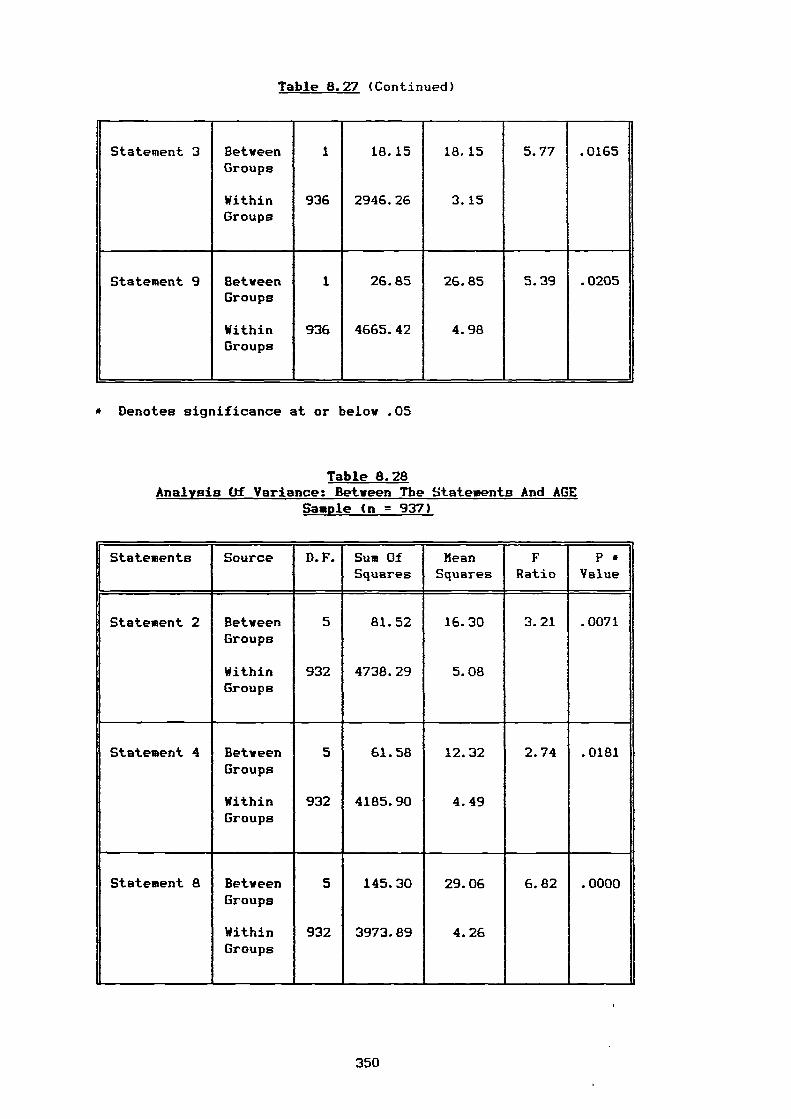
Table 8.27 (Continued)
Statement 3 Between 1 18.15 18.15 5.77 .0165Groups
Within 936 2946.26 3.15Groups
Statement 9 Between 1 26.85 26.85 5.39 .0205Groups
Within 936 4665.42 4.98Groups
• Denotes significance at or below .05
Table 8.28 Analysis Of Variance: Between The Statements And AGE
Sample (n = 937)
Statements Source D.F. Sum OfSquares
MeanSquares
FRatio
P *Value
Statement 2 Between 5 81.52 16.30 3.21 .0071Groups
Within 932 4738.29 5.08Groups
Statement 4 Between 5 61.58 12.32 2.74 .0181Groups
Within 932 4185.90 4.49Groups
Statement 8 Between 5 145.30 29.06 6.82 .0000Groups
Within 932 3973.89 4.26
1
Groups
350
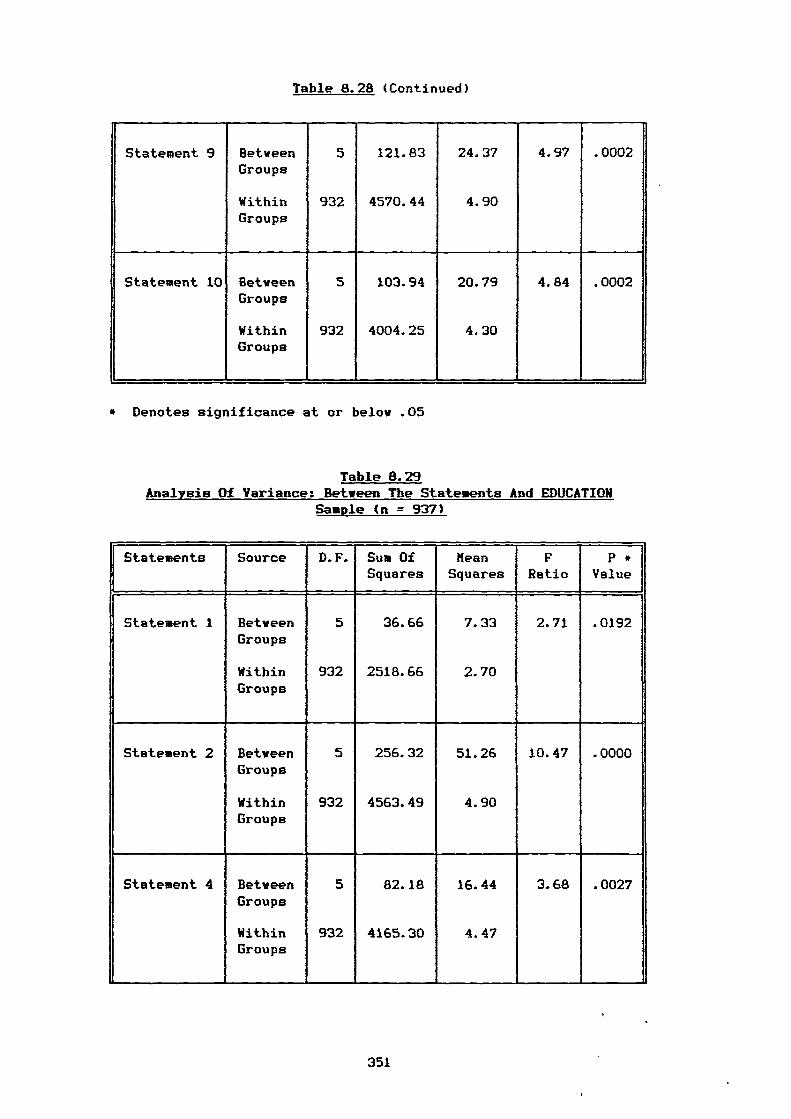
Table 8.28 (Continued)
Statement 9 Between 5 121.83 24.37 4.97 .0002Groups
Within 932 4570.44 4.90Groups
Statement 10 Between 5 103.94 20.79 4.84 .0002Groups
Within 932 4004.25 4.30Groups
* Denotes significance at or below .05
Table 8.29 Analysis Of Variance: Between The Statements And EDUCATION
Sample (n = 937)
Statements Source D.F. Sum OfSquares
MeanSquares
FRatio
P *Value
,
Statement 1 Between 5 36.66 7.33 2.71 .0192Groups
Within 932 2518.66 2.70Groups
Statement 2 Between 5 256.32 51.26 10.47 .0000Groups
Within 932 4563.49 4.90Groups
Statement 4 Between 5 82.18 16.44 3.68 .0027Groups
Within 932 4165.30 4.47Groups
351
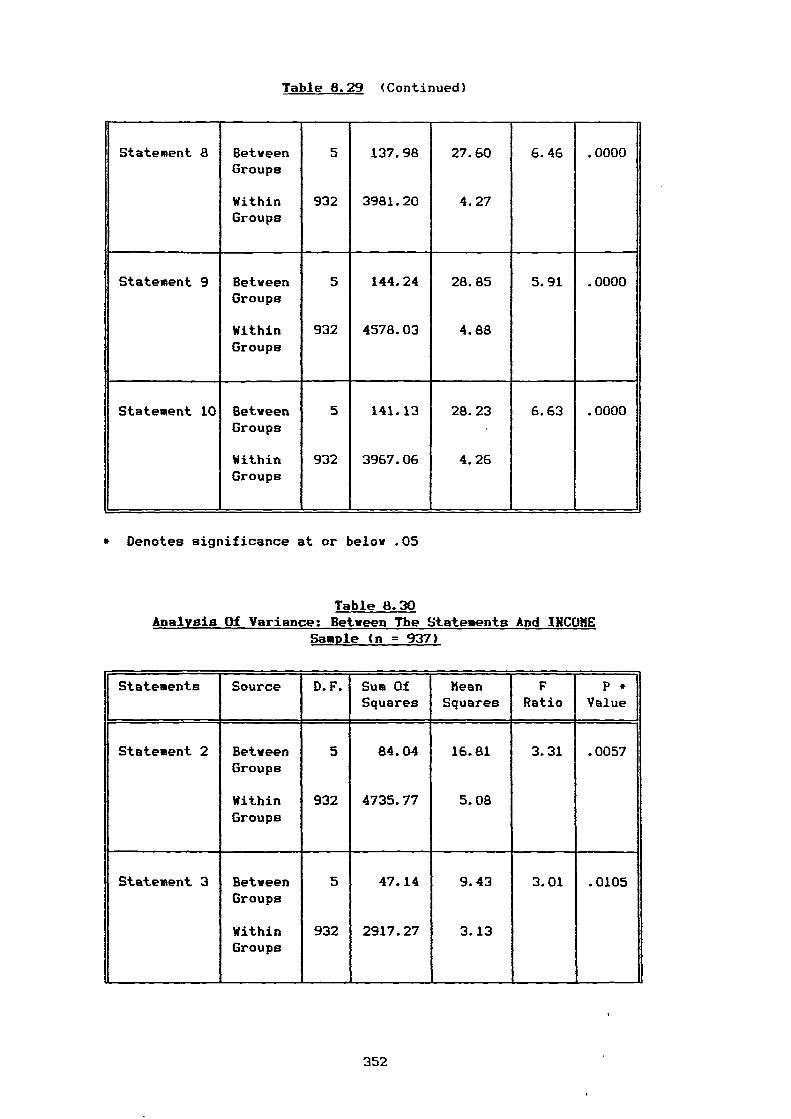
Table 8.29 (Continued)
Statement 8 Between 5 137.98 27.60 6.46 .0000Groups
Within 932 3981.20 4.27Groups
Statement 9 Between 5 144.24 28.85 5.91 .0000Groups
Within 932 4578.03 4.88Groups
Statement 10 Between 5 141.13 28.23 6.63 .0000Groups
Within 932 3967.06 4.26Groups
* Denotes significance at or below .05
Table 8.30 Analysis Of Variance: Between The Statements And INCOME
Sample (n = 937)
Statements Source D.F. Sum OfSquares
MeanSquares
FRatio
P *Value
Statement 2 Between 5 84.04 16.81 3.31 .0057Groups
Within 932 4735.77 5.08Groups
Statement 3 Between 5 47.14 9.43 3.01 .0105Groups
Within 932 2917.27 3.13Groups
L
352
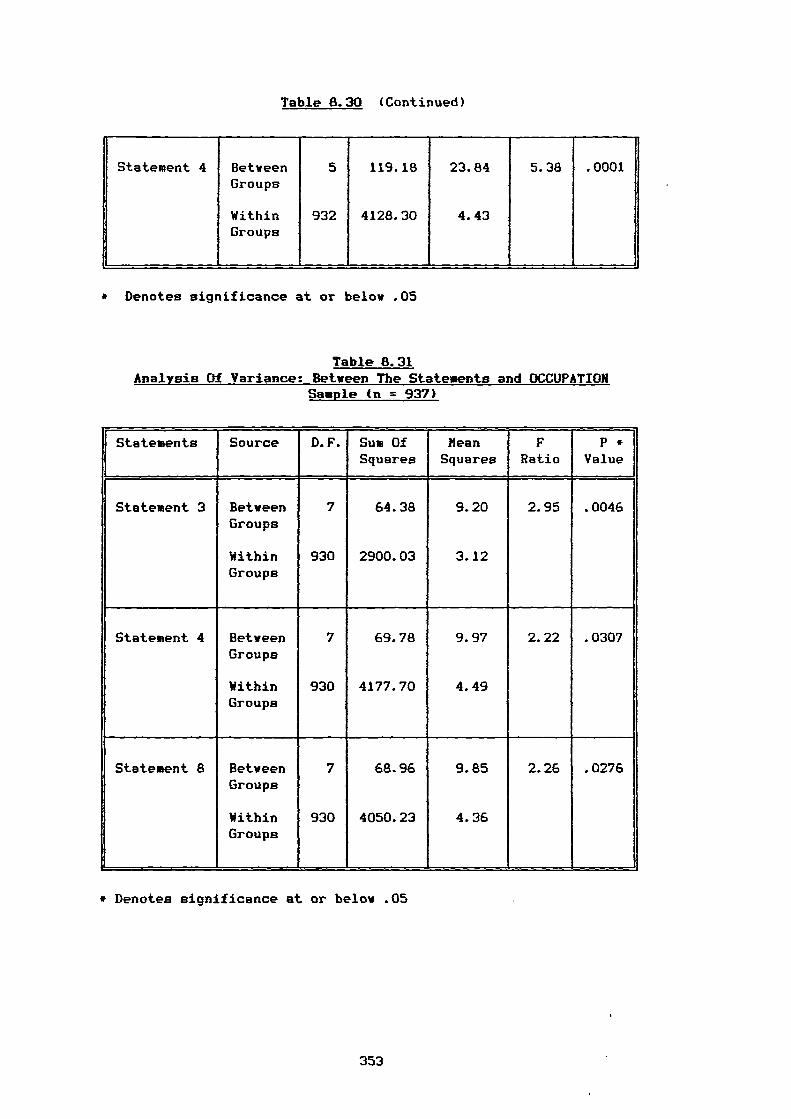
Table 8.30 (Continued)
Statement 4 BetweenGroups
WithinGroups
5
932
119.18
4128.30
23.84
4.43
5.38 .0001
* Denotes significance at or below .05
Table 8.31 Analysis Of Variance: Between The Statements and OCCUPATION
Sample (n = 937)
Statements Source D.F. Sum OfSquares
?leanSquares
FRatio
P *Value
Statement 3 Between 7 64.38 9.20 2.95 .0046Groups
Within 930 2900.03 3.12Groups
Statement 4 Between 7 69.78 9.97 2.22 .0307Groups
Within 930 4177.70 4.49Groups
Statement 8 Between 7 68.96 9.85 2.26 .0276Groups
Within 930 4050.23 4.36Groups
* Denotes significance at or below .05
353
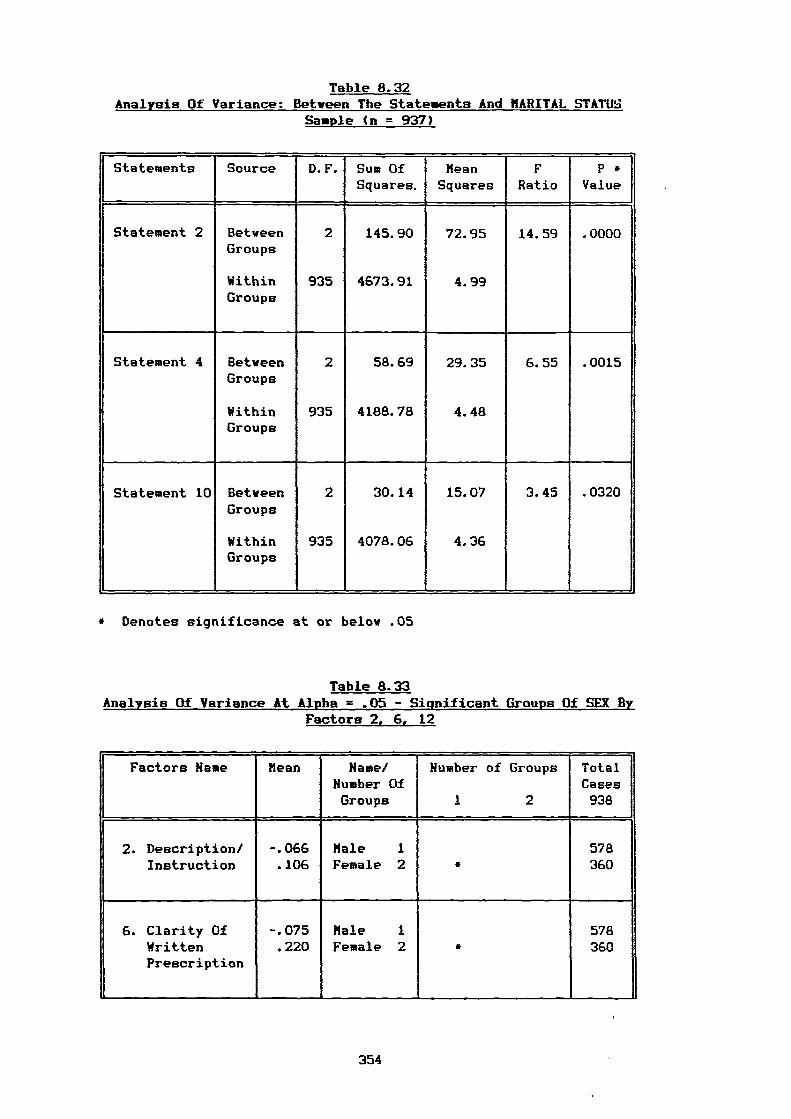
Table 8.32Analysis Of Variance: Between The Statements And MARITAL STATUS
Sample (n = 937)
Statements Source D.F. Sum OfSquares.
MeanSquares
FRatio
P *Value
Statement 2 Between 2 145.90 72.95 14.59 .0000Groups
Within 935 4673.91 4.99Groups
Statement 4 Between 2 58.69 29.35 6.55 .0015Groups
Within 935 4188.78 4.48Groups
Statement 10 Between 2 30.14 15.07 3.45 .0320Groups
Within 935 4078.06 4.36Groups
* Denotes significance at or below .05
Table 8.33 Analysis Of Variance At Alpha = .05 - Significant Groups Of SEX By
Factors 2, 6, 12
Factors Name Mean,
Name/Number Of
Number of Groups TotalCases
Groups 1 2 938
2. Description/ -.066 Male 1 578Instruction .106 Female 2 * 360
6. Clarity Of -.075 Male 1 578Written .220 Female 2 * 360Prescription
354
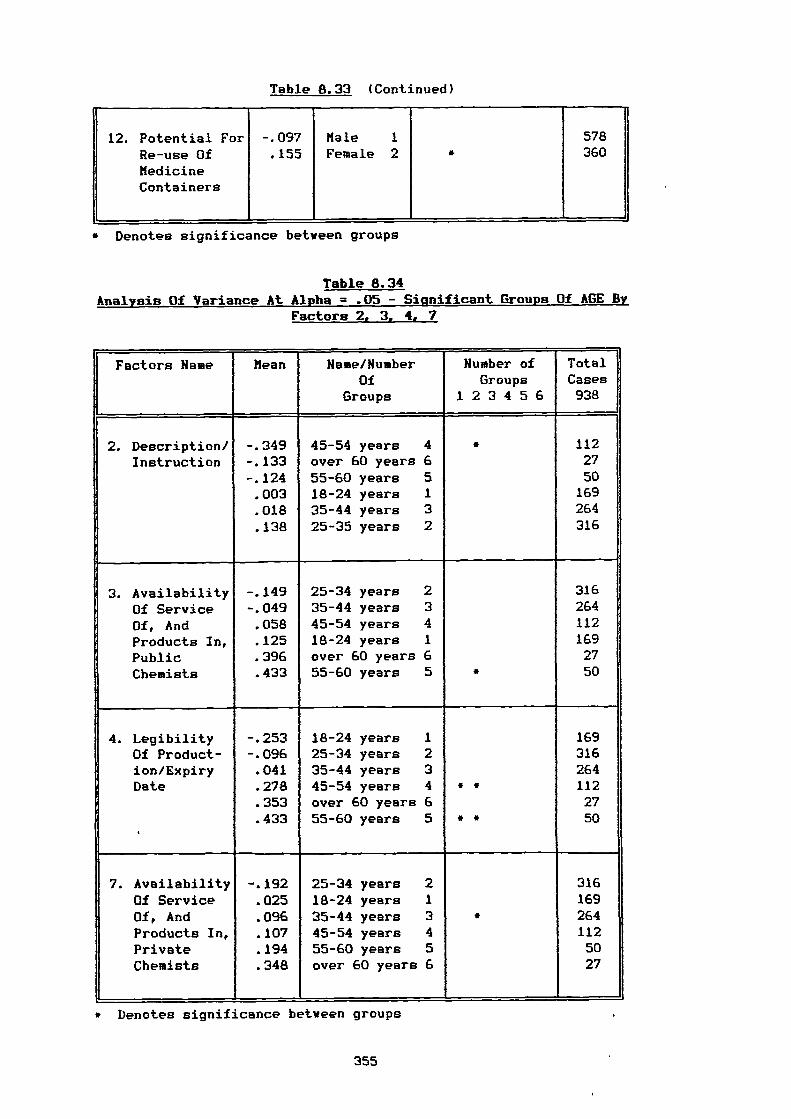
Table 8.33 (Continued)
12.
-
PotentialRe-use OfMedicineContainers
For -.097.155
MaleFemale
12 •
578360
* Denotes significance between groups
Table 8.34 Analysis Of Variance At Alpha = .05 - Sipnificant Groups Of AGE By
Factors 2, 3, 4, 7
Factors Name Mean Name/NumberOf
Groups 1
Number ofGroups
2 3 4 5 6
TotalCases938
2. Description/Instruction
-.349-.133-.124.003.018.138
45-54 years 4over 60 years 655-60 years 518-24 years 135-44 years 325-35 years 2
* 1122750169264316
3. AvailabilityOf ServiceOf, AndProducts In,PublicChemists
-.149-.049.058.125.396.433
25-34 years 235-44 years 345-54 years 418-24 years 1over 60 years 655-60 years 5 *
3162641121692750
4. LegibilityOf Product-ion/ExpiryDate
'
-.253-.096.041.278.353.433
18-24 years 125-34 years 235-44 years 345-54 years 4over 60 years 655-60 years 5
*
*
*
•
1693162641122750
7.
,
AvailabilityOf ServiceOf, AndProducts In,PrivateChemists
-.192.025.096.107.194.348
25-34 years 218-24 years 135-44 years 345-54 years 455-60 years 5over 60 years 6
*
3161692641125027
• Denotes significance between groups
355
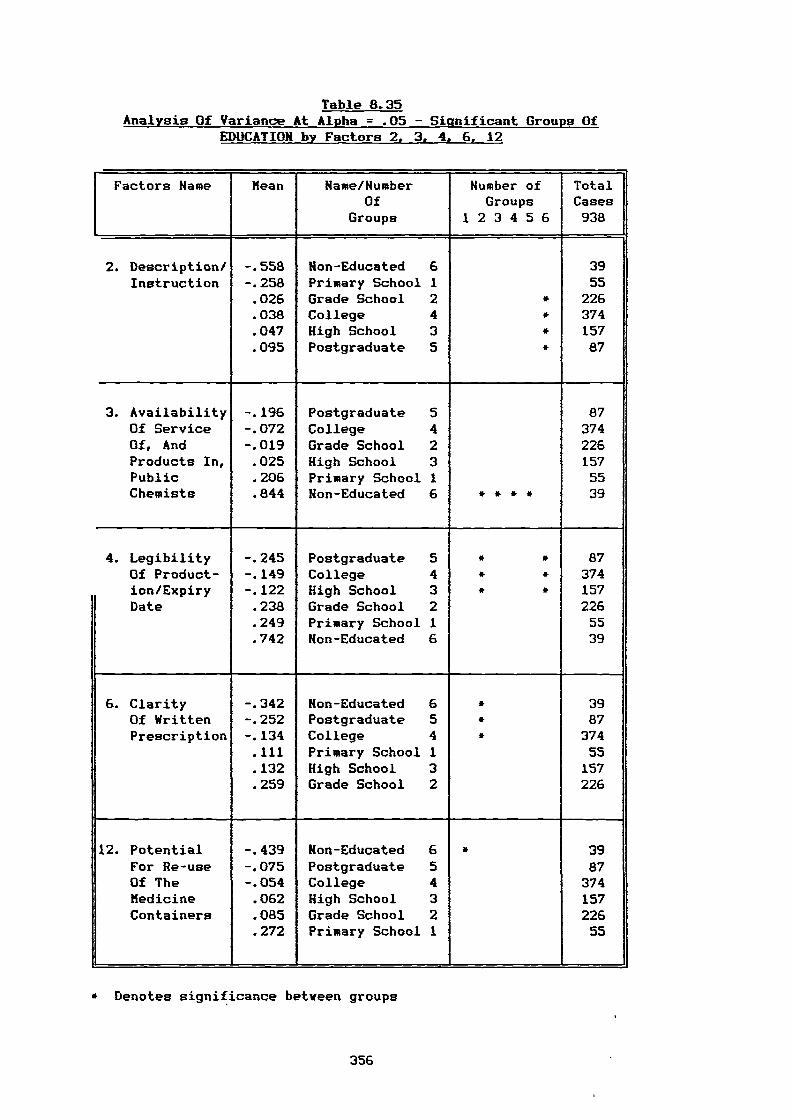
Table 8.35 Analysis Of Variance At Alpha = .05 - Significant Groups Of
EDUCATION by Factors 2, 3, 4, 6, 12
Factors Name Mean Name/NumberOf
Number ofGroups
TotalCases
Groups 1 2 3 4 5 6 938
2. Description/ -.558 Hon-Educated 6 39Instruction -.258 Primary School 1 55
.026 Grade School 2 * 226
.038 College 4 * 374
.047 High School 3 • 157
.095 Postgraduate 5 • 87
3. Availability -.196 Postgraduate 5 87Of Service -.072 College 4 374Of, And -.019 Grade School 2 226Products In,Public
.025
.206High SchoolPrimary School
31
15755
Chemists .844 Hon-Educated 6 • • • • 39
4. Legibility -.245 Postgraduate 5 • * 87Of Product- -.149 College 4 * * 374ion/Expiry -.122 High School 3 * • 157Date .238 Grade School 2 226
.249 Primary School 1 55
.742 Hon-Educated 6 39
6. Clarity -.342 Non-Educated 6 * 39Of Written -.252 Postgraduate 5 • 87Prescription -.134 College 4 * 374
.111 Primary School 1 55. .132 High School 3 157
.259 Grade School 2 226
12. Potential -.439 Non-Educated 6 • 39For Re-use -.075 Postgraduate 5 87Of The -.054 College 4 374Medicine .062 High School 3 157Containers .085 Grade School 2 226
.272 Primary School 1 55
* Denotes significance between groups
356
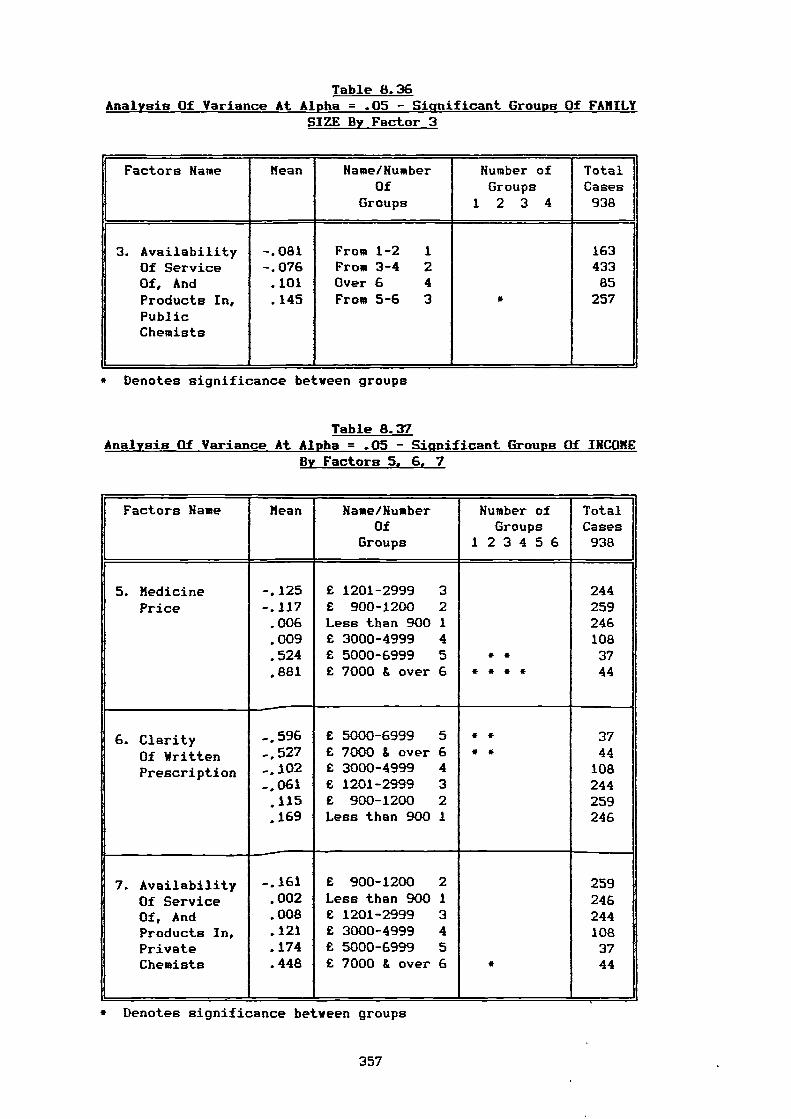
Table 8.36 Analysis Of Variance At Alpha = .05 - Significant Groups Of FAMILY
SIZE By Factor 3
Factors Name Mean Name/NumberOf
Groups
Humber ofGroups
1 2 3 4
TotalCases938
3. Availability -.081 From 1-2 1 163Of Service -.076 From 3-4 2 433Of, And .101 Over 6 4 85Products In, .145 From 5-6 3 * 257PublicChemists
* Denotes significance between groups
Table 8.37 Analysis Of Variance At Alpha = .05 - Significant Groups Of INCOME
By Factors 5, 6, 7
Factors Name Mean Name/NumberOf
Groups 1
Number ofGroups2 3 4 5 6
TotalCases938
5. MedicinePrice
-.125-.117.006.009.524.881
£ 1201-2999 3£ 900-1200 2Less than 900 1£ 3000-4999 4£ 5000-6999 5£ 7000 & over 6 *
**
*• *
2442592461083744
6. ClarityOf WrittenPrescription
-.596-,527-.102-.061
• 115.169
£ 5000-6999 5£ 7000 S. over 6£ 3000-4999 4£ 1201-2999 3£ 900-1200 2Less than 900 1
••
**
3744
108244259246
7.
—
AvailabilityOf ServiceOf, AndProducts In,PrivateChemists
-.161.002.008.121.174.448
£ 900-1200 2Less than 900 1£ 1201-2999 3£ 3000-4999 4£ 5000-6999 5£ 7000 & over 6 *
2592462441083744
* Denotes significance between groups
357
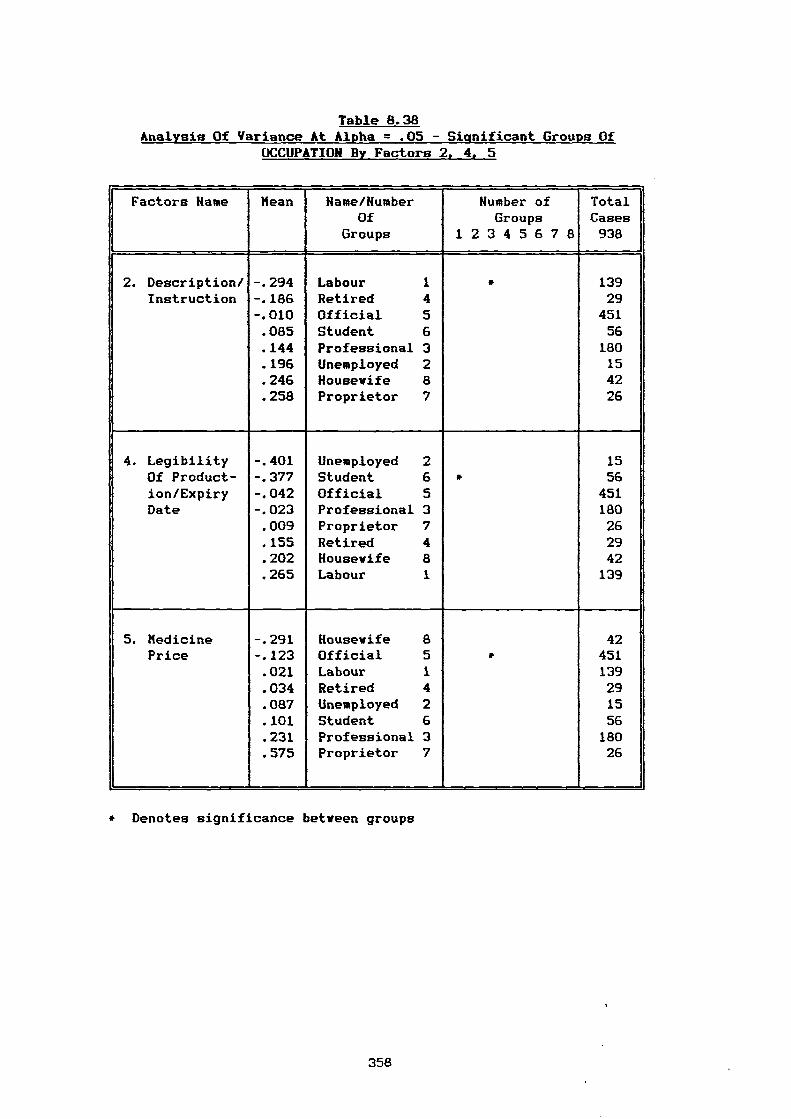
Table 8.38 Analysis Of Variance At Alpha = .05 - Significant Groups Of
OCCUPATION By Factors 2, 4, 5
Factors Name Mean Name/NumberOf
Humber ofGroups
TotalCases
Groups 1 2 3 4 5 6 7 8 938
2. Description/ -.294 Labour 1 • 139Instruction -.186 Retired 4 29
-.010 Official 5 451.085 Student 6 56.144 Professional 3 180.196 Unemployed 2 15.246 Housewife 8 42.258 Proprietor 7 26
4. Legibility -.401 Unemployed 2 15Of Product- -.377 Student 6 • 56ion/Expiry -.042 Official 5 451Date -.023 Professional 3 180
.009 Proprietor 7 26
.155 Retired 4 29
.202 Housewife 8 42
.265 Labour 1 139
5. Medicine -.291 Housewife 8 42Price -.123 Official 5 * 451
.021 Labour 1 139
.034 Retired 4 29
.087 Unemployed 2 15
.101 Student 6 56
.231 Professional 3 180
.575 Proprietor 7 26
Denotes significance between groups
358
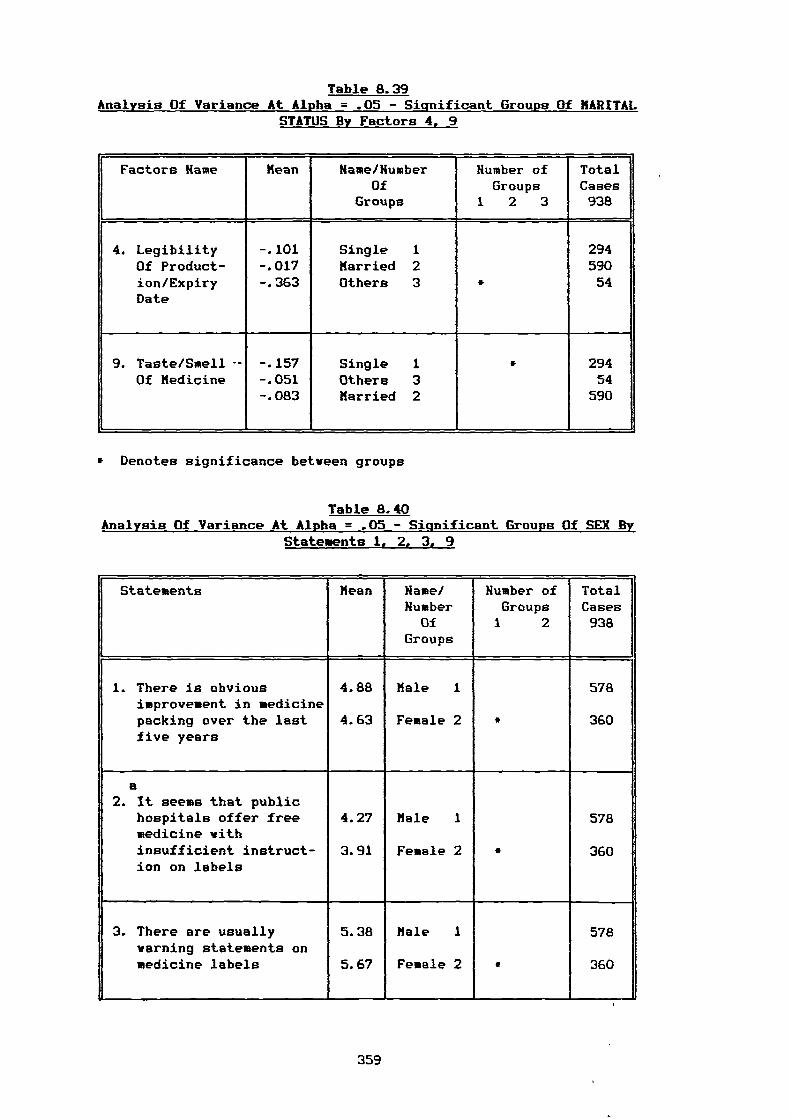
Table 8.39 Analysis Of Variance At Alpha = .05 - Significant Groups Of MARITAL
STATUS By Factors 4, 9
Factors Name Mean Name/NumberOf
Number ofGroups
TotalCases
Groups 1 2 3 938
4. Legibility -.101 Single 1 294Of Product- -.017 Married 2 590ion/Expiry -.363 Others 3 • 54Date
9. Taste/Smell — -.157 Single 1 • 294Of Medicine -.051 Others 3 54
-.083 Married 2 590
* Denotes significance between groups
Table 8.40 Analysis Of Variance At Alpha = .05 - Significant Groups Of SEX By
Statements 1, 2, 3, 9
i Statements Mean Name/Number
Number ofGroups
TotalCases
Of 1 2 938Groups
r
1. There is obviousimprovement in medicinepacking over the lastfive years
4.88
4.63
Male 1
Female 2 *
578
360
a2. It seems that public
hospitals offer freemedicine withinsufficient instruct-ion on labels
4.27
3.91
Male 1
Female 2 *
578
360
. There are usuallywarning statements onmedicine labels
5.38
5.67
Male 1
Female 2 •
578
360
359
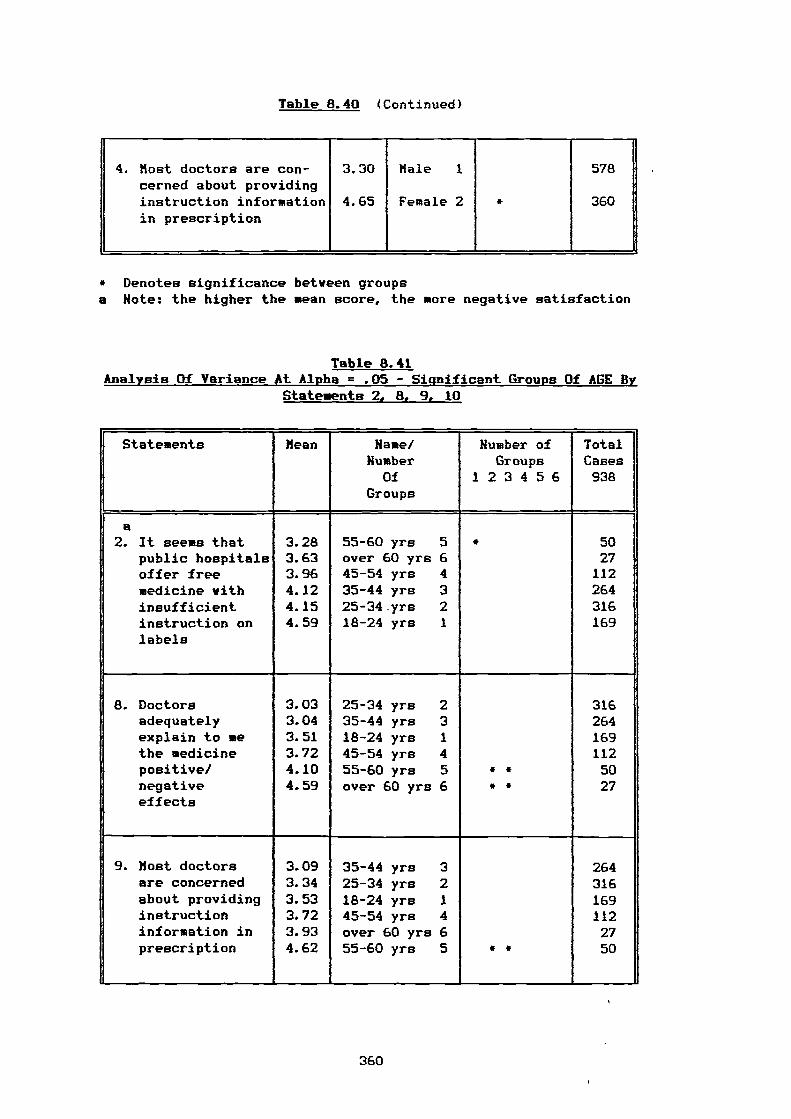
Table 8.40 (Continued)
4. Most doctors are con-cerned about providinginstruction informationin prescription
3.30
4.65
Male 1
Female 2 *
578
360
* Denotes significance between groupsa Note: the higher the mean score, the more negative satisfaction
Table 8.41 Analysis Of Variance At Alpha = .05 - Significant Groups Of AGE By
Statements 2, 8, 9, 10
Statements Mean Name/Humber
Humber ofGroups
TotalCases
Of 1 2 3 4 5 6 938Groups
B2. It seems that 3.28 55-60 yrs 5 * 50
public hospitals 3.63 over 60 yrs 6 27offer free 3.96 45-54 yrs 4 112medicine with 4.12 35-44 yrs 3 264insufficient 4.15 25-34.yrs 2 316instruction onlabels
4.59 18-24 yrs 1 169
8. Doctors 3.03 25-34 yrs 2 316adequately 3.04 35-44 yrs 3 264explain to me 3.51 18-24 yrs 1 169the medicine 3.72 45-54 yrs 4 112positive/ 4.10 55-60 yrs 5 • * 50
. negativeeffects
4.59 over 60 yrs 6 * • 27
9. Most doctors 3.09 35-44 yrs 3 264are concerned 3.34 25-34 yrs 2 316about providing 3.53 18-24 yrs 1 169instruction 3.72 45-54 yrs 4 112information in 3.93 over 60 yrs 6 27prescription 4.62 55-60 yrs 5 • • 50
360
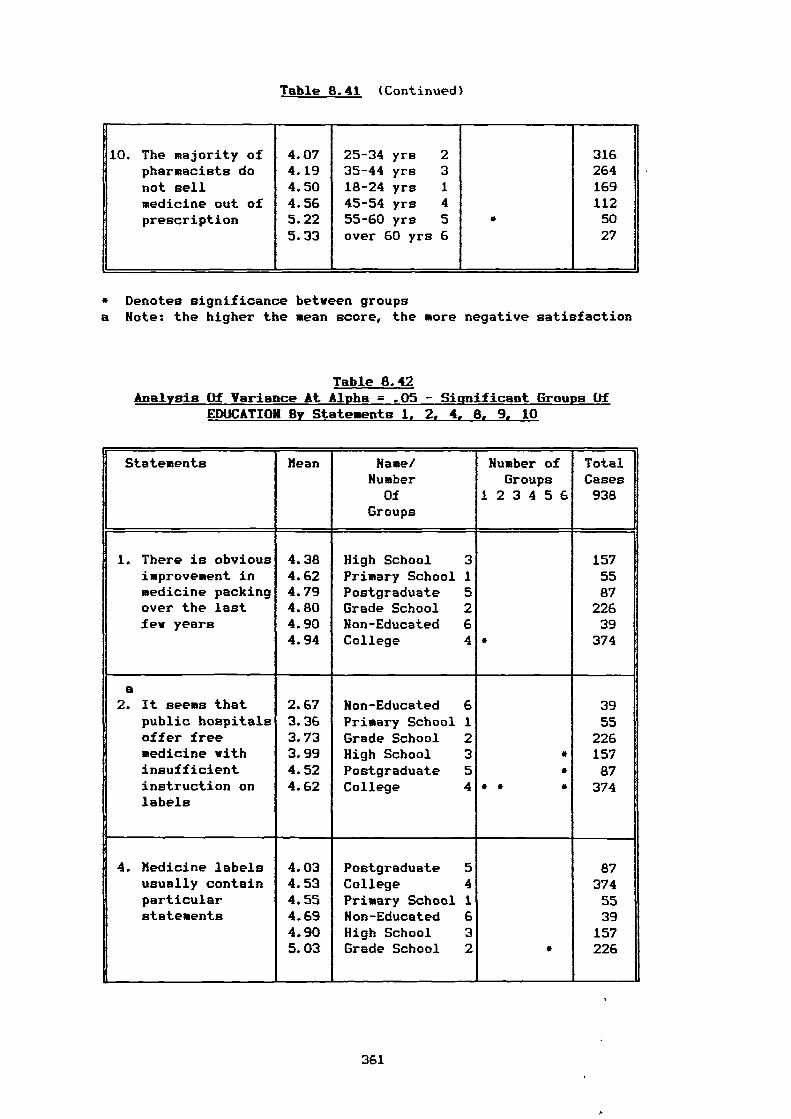
Table 8.41 (Continued)
10. The majority ofpharmacists donot sellmedicine out ofprescription
4.074.194.504.565.225.33
25-34 yrs 235-44 yrs 318-24 yrs 145-54 yrs 455-60 yrs 5over 60 yrs 6
*
3162641691125027
* Denotes significance between groupsa Note: the higher the mean score, the more negative satisfaction
Table 8.42 Analysis Of Variance At Alpha = .05 - Significant Groups Of
EDUCATION By Statements 1, 2, 4, 8, 9, 10
Statements Mean Name/Number
Number ofGroups
TotalCases
Of 1 2 3 4 5 6 938Groups
1. There is obvious 4.38 High School 3 157improvement in 4.62 Primary School 1 55medicine packing 4.79 Postgraduate 5 87over the last 4.80 Grade School 2 226few years 4.90 Non-Educated 6 39
4.94 College 4 * 374
a2. It seems that 2.67 Non-Educated 6 39
public hospitals 3.36 Primary School 1 55offer free 3.73 Grade School 2 226medicine with 3.99 High School 3 * 157insufficient 4.52 Postgraduate 5 * 87instruction onlabels
4.62 College 4 * * * 374
4. Medicine labels 4.03 Postgraduate 5 87usually contain 4.53 College 4 374particular 4.55 Primary School 1 55statements 4.69 Non-Educated 6 39
4.90 High School 3 1575.03 Grade School 2 * 226
361
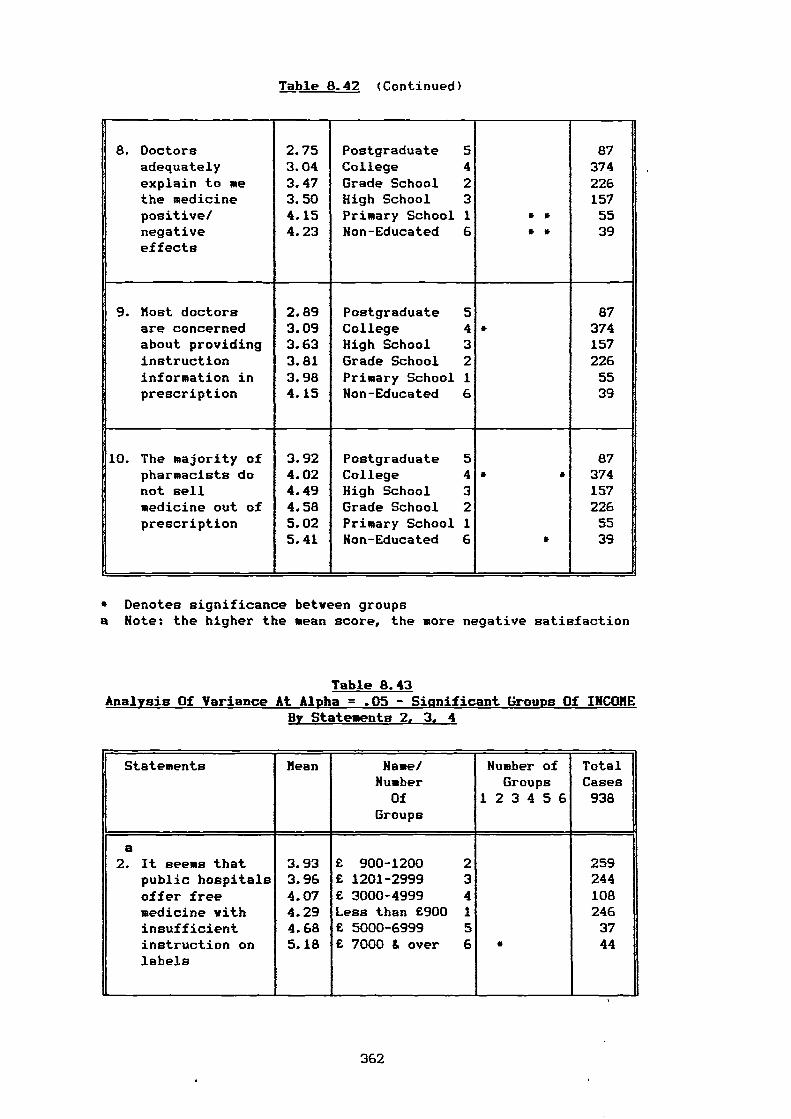
Table 8.42 (Continued)
8. Doctorsadequatelyexplain to methe medicinepositive/
2.753.043.473.504.15
PostgraduateCollegeGrade SchoolHigh SchoolPrimary School
54231 * •
8737422615755
negativeeffects
4.23 Non-Educated 6 * • 39
9. Most doctors 2.89 Postgraduate 5 87are concerned 3.09 College 4 • 374about providing 3.63 High School 3 157instruction 3.81 Grade School 2 226information in 3.98 Primary School 1 55prescription 4.15 Non-Educated 6 39
10. The majority of 3.92 Postgraduate 5 87pharmacists do 4.02 College 4 * • 374not sell 4.49 High School 3 157medicine out of 4.58 Grade School 2 226prescription 5.02 Primary School 1 55
5.41 Non-Educated 6 * 39
* Denotes significance between groupsa Note: the higher the mean score, the more negative satisfaction
Table 8.43 Analysis Of Variance At Alpha = .05 - Siunificant Groups Of INCOME
By Statements 2, 3, 4
Statements
IGroups
Mean Name/Number
Of
Number ofGroups
1 2 3 4 5 6
TotalCases938
a2. It seems that
public hospitalsoffer freemedicine withinsufficientinstruction onlabels
3.933.964.074.294.685.18
£ 900-1200 2£ 1201-2999 3£ 3000-4999 4Less than £900 1£ 5000-6999 5£ 7000 & over 6 *
-
2592441082463744
362
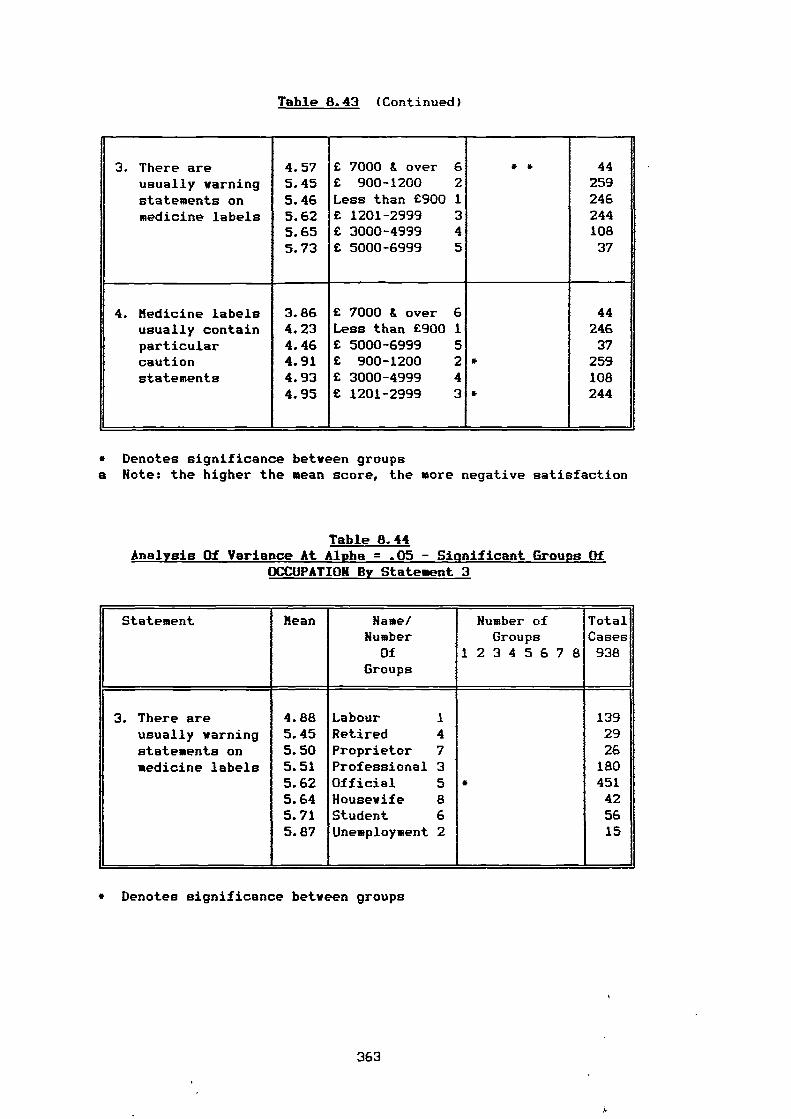
Table 8.43 (Continued)
3. There areusually warningstatements on
4.575.455.46
E 7000 & over 6E 900-1200 2Less than E900 1
• • 44259246
medicine labels 5.62 E 1201-2999 3 2445.65 E 3000-4999 4 1085.73 E 5000-6999 5 37
4. Medicine labels 3.86 £ 7000 & over 6 44
usually contain 4.23 Less than £900 1 246particular 4.46 £ 5000-6999 5 37caution 4.91 E 900-1200 2 * 259statements 4.93 E 3000-4999 4 108
4.95 £ 1201-2999 3 * 244
* Denotes significance between groupsa Note: the higher the mean score, the more negative satisfaction
Table 8.44 Analysis Of Variance At Alpha = .05 - Significant Groups Of
OCCUPATION By Statement 3
Statement Mean Name/Number
OfGroups
Number ofGroups
1 2 3 4 5 6 7 8
TotalCases938
3. There are 4.88 Labour 1 139usually yarning 5.45 Retired 4 29statements on 5.50 Proprietor 7 26medicine labels 5.51 Professional 3 180
5.62 Official 5 • 4515.64 Housewife 8 425.71 Student 6 565.87 Unemployment 2 15
* Denotes significance between groups
363
I.
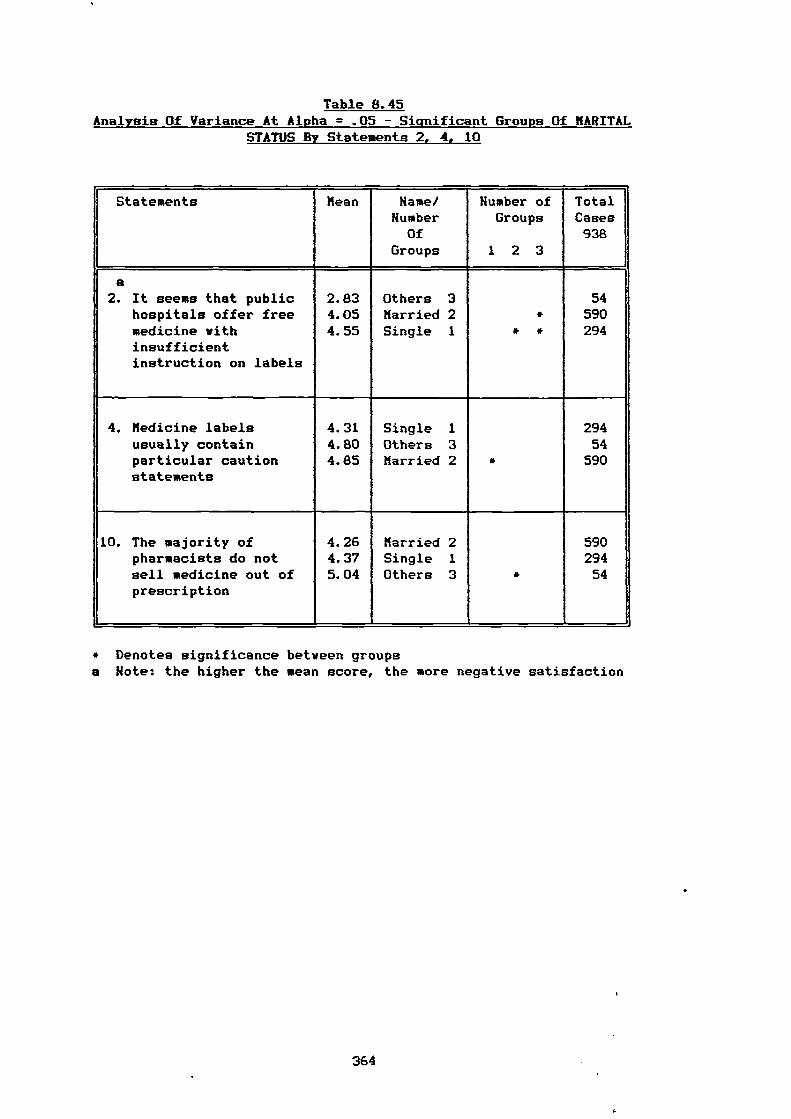
Table 8.45 Analysis Of Variance At Alpha = .05 - Significant Groups Of MARITAL
STATUS By Statements 2, 4, 10
Statements Mean Name/Humber
Humber ofGroups
TotalCases
Of 938Groups 1 2 3
a2. It seems that public 2.83 Others 3 54
hospitals offer free 4.05 Married 2 • 590medicine withinsufficientinstruction on labels
4.55 Single 1 • • 294
4. Medicine labels 4.31 Single 1 294usually contain 4.80 Others 3 54particular cautionstatements
4.85 Married 2 * 590
10. The majority of 4.26 Married 2 590pharmacists do not 4.37 Single 1 294sell medicine out ofprescription
5.04 Others 3 • 54
* Denotes significance between groupsa Note: the higher the mean score, the more negative satisfaction
364
Related Documents