An introduction to Transnet 13 October 2004

An introduction to Transnet 13 October 2004. Agenda Strategy Overview of key businesses –Spoornet –SAPO –NPA –Petronet –SAA.
Dec 27, 2015
Welcome message from author
This document is posted to help you gain knowledge. Please leave a comment to let me know what you think about it! Share it to your friends and learn new things together.
Transcript

An introduction toTransnet
13 October 2004

Agenda
• Strategy
• Overview of key businesses–Spoornet
–SAPO
–NPA
–Petronet
–SAA

Strategy

Delivering on our commitments
“The public sector discharges its responsibilities to our people as a critical player in the process of the growth,
reconstruction and development of our country by reducing the cost of doing business in our country.”
President Mbeki : State of the Nation Address 21 May 2004

Why Port and Rail

Total throughput for 2003 in the South African economy that required logistics intervention = 745mt (1998 = 590mt)
Mining49%
Agriculture6%
Manufacturing
45%330mt
370mt
45mt
2003Manufacturing = 20% of GDP @ constant 1995
prices
2003Mining = 6% of GDP @ constant 1995 prices
2003Agriculture = 4%
of GDP @ constant 1995
prices
Key Sector Sub-Groups
Agriculture Grain, Vegetables, Fruit, etc
Mining Coal, Ferrous Metal, Nonferrous Metal, Non-metallic Minerals, Crude Petroleum
Manufacturing
•Heavy
•Light
Chemicals, Fuel & Petroleum Products, Fertilizer, Iron, Steel & Metal, Machinery & Equipment, Motor Vehicles, Parts & Accessories, Scrap
FMCG; Beverages, Textiles & Clothing, Wood & -Products, Furniture, Paper & -Products, Rubber, Plastic, Ceramics & Glass,
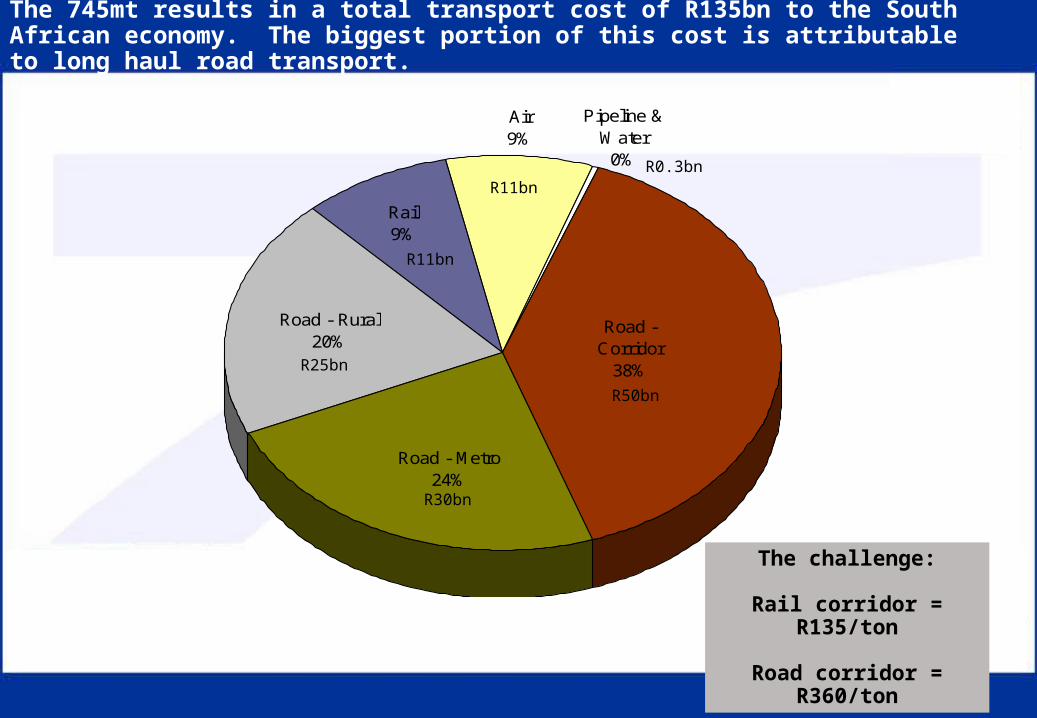
The 745mt results in a total transport cost of R135bn to the South African economy. The biggest portion of this cost is attributable to long haul road transport.
Pipeline & Water
0%
Air9%
Rail9%
Road - Corridor
38%
Road - Metro24%
Road - Rural20%
R11bn
R50bn
R30bn
R11bnR0.3bn
The challenge:
Rail corridor = R135/ton
Road corridor = R360/ton
R25bn

The R135bn transport cost has an associated logistics cost of R45bn, amounting to a total logistics cost of R178bn (14.7% of GDP).
Inventory opportunity
cost1%
Transport75%
Storage8%
Mngt & admin16%

Understanding the Road / Rail trend over the past decade
60
70
80
90
100
110
120
130
140
150
160
19
91
19
93
19
97
20
03
Index 1
991=
100
Total GDP Transportable GDPRoad ton Rail tonRail ton excl export coal & ore
Data depicted on an index basis
The last decade has seen growth in road traffic, while rail traffic (excl. the export lines) has declined

The structure of the surface freight transport market (2003 million tons):The “normal” macro economic model is to transport corridor freight on rail and rural freight on road. Structural myopia caused an unhealthy situation in South Africa.
Tonnage1105mt (270)
Road920mt (200)
Rail185mt (600)
Corridor140mt (750)
13%
Metropolitan570mt (70)
52%
Rural210mt (190)
19%
Corridor45mt (670)
4%
Metropolitan10mt (100)
1%
Rural30mt (500)
3%
Export lines100mt (650)
9%
Figure in brackets denotes average transport distance
Tonkm296bn
Road185bn
Rail111bn
Corridor105bn35%
Metropolitan40bn14%
Rural40bn14%
Corridor30bn10%
Metropolitan1bn0%
Rural15bn5%
Export lines65bn22%
IncomeR123bn
RoadR111bn
RailR12bn
CorridorR55bn45%
MetropolitanR29bn24%
RuralR27bn22%
CorridorR5.6bn
5%
MetropolitanR0.5bn
<1%
RuralR1.5bn
1%
Export linesR4.5bn
4%

Cape Town Port Elizabeth
Durban
Saldanha
Richards Bay
East London
Maputo
Sishen
Beitbridge
Gauteng
There are significant shifts in the SA economy that warrant a closer examination of the
supply chains necessary to support the economy. SA needs to reduce logistics costs by one third to sustain our
competitiveness.
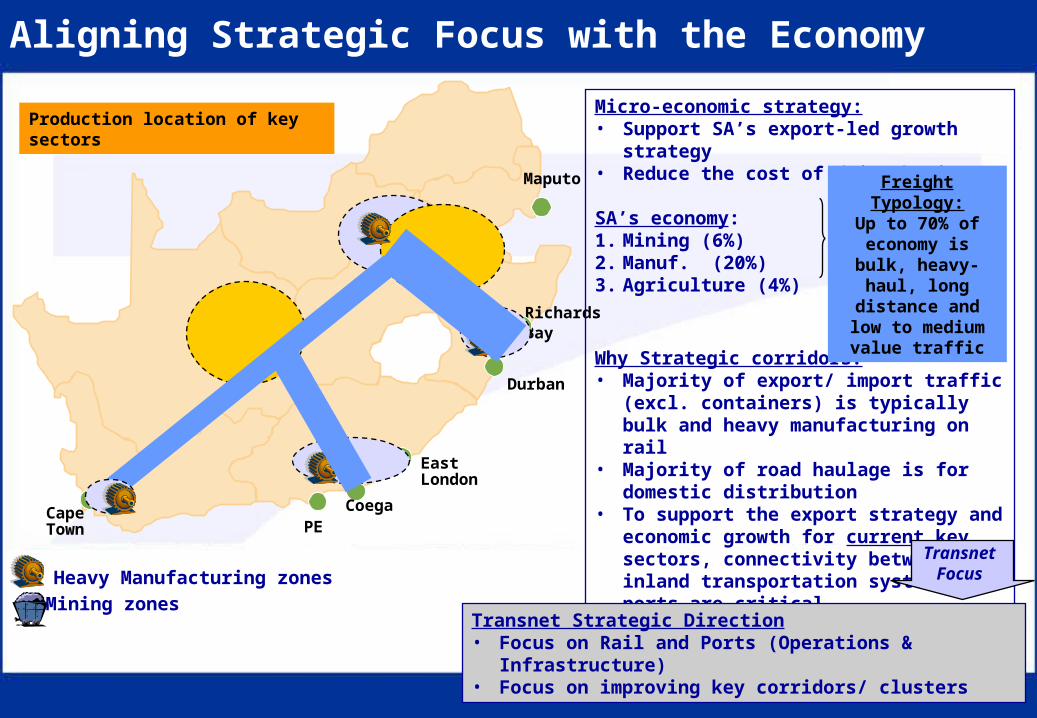
Aligning Strategic Focus with the Economy
PE
East London
Maputo
RichardsBay
Durban
Cape Town
Coega
Heavy Manufacturing zones
Mining zones
Micro-economic strategy:• Support SA’s export-led growth strategy• Reduce the cost of doing business
SA’s economy:1. Mining (6%) 49%2. Manuf. (20%) 45%3. Agriculture (4%) 6%
Why Strategic corridors?• Majority of export/ import traffic (excl.
containers) is typically bulk and heavy manufacturing on rail
• Majority of road haulage is for domestic distribution
• To support the export strategy and economic growth for current key sectors, connectivity between inland transportation systems and ports are critical
• Create efficient export systems for growing sectors
Freight Typology:Up to 70% of
economy is bulk, heavy-haul, long
distance and low to medium value
traffic
Production location of key sectors
Transnet Strategic Direction• Focus on Rail and Ports (Operations & Infrastructure)• Focus on improving key corridors/ clusters
TransnetFocus

Direction ofthe Business
1
RestructuredBalance Sheet
2
CorporateGovernance
3
RiskManagement
4
Direction ofthe Business
1
RestructuredBalance Sheet
2
CorporateGovernance
3
RiskManagement
4
Strategic direction

The Role of Transnet
Contribute to the sustainable economic development of
South Africa by providing the best connected and
efficient transport network run by world-class rail,
pipeline and port operators

An Integrated Transport Strategy
Transnet provides efficient, integrated transport services to the
bulk and manufacturing sectors
• Ensure that Transnet provides an efficient transport platform that
facilitates trade growth in SA
• Transnet is the custodian of Port, Rail and Pipeline Infrastructure
• Transnet serves specific industries to leverage its strength in assets
• Transnet collaborates with Customers to jointly design services and
invest in areas that improves the performance of all parties

Transport Portfolio
PipelineNetworkPipelineNetwork
PipelineOperations
PipelineOperations
Transnet Business Portfolio
RailInfrastructure
RailInfrastructure
RailOperations
RailOperations
Port Infrastructure
Port Infrastructure
Port Operations
Port Operations
HoldingCo
Investment Portfolio
Aviation
Other
Independent Regulators

Transnet into the future
Transport
Portfolio
TransnetInfrastructure
TransnetOperations
HoldingCo
RailInfrastructure
NPA RailOperations
SAPO
PipelineInfrastructure
PipelineOperations

Implementation plan

• Operational integration
with private sector (port
and rail)
• Partnerships (local and
global) established for
growth
Deliver the Mandate
2004/05 2006/072005/06
Implement New Business Model
• Operational synergy
between SAPO, NPA
& Spoornet
• Restructured portfolio
• Operational efficiency
• Vertical separation
• Corporate office
Restructuring
• Divestment
Building a SolidFoundation
Migration Path for Transnet Integrated, Inter-modal Transport Solution

Transnet Strategy
Effective & EfficientNational Logistics System
Effective & EfficientNational Logistics System
Economic GrowthEconomic Growth
Str
ateg
icC
orr
ido
rsS
trat
egic
Co
rrid
ors
Strateg
icC
lusters
Strateg
icC
lusters
Change ManagementChange Management
Financial StrategyFinancial Strategy
Frei
ght R
ailw
ays
Ports
Pipelines
• Vertical Separation• Infrastructure Planning• Head Office Restructuring• Divestment• Operational Synergies
• Vertical Separation• Infrastructure Planning• Head Office Restructuring• Divestment• Operational Synergies

Critical element of implementation
At the heart of the turn around plan is the operational efficiency of the core
businesses. Without efficiency in the core operations, reducing supply chain costs and changing the road rail mix in
transport will not occur.

Operational Themes
Operational Efficiency
Operational Efficiency
Customer & ThirdParty CollaborationCustomer & Third
Party Collaboration
Integration& Interface Integration& Interface
Infra-structureDevelopment
Infra-structureDevelopment
• Nodal efficiency • Increasing key Productivity indicators within the nodal points• Safety and Risk compliance • Efficient and streamlined operational processes
• Nodal efficiency • Increasing key Productivity indicators within the nodal points• Safety and Risk compliance • Efficient and streamlined operational processes
• Integration and optimisation of rail and port interfaces• Reduction of total logistics costs• Enhancing predictability and reliability
• Integration and optimisation of rail and port interfaces• Reduction of total logistics costs• Enhancing predictability and reliability
• Create capacity before demand arises• Implementation of CAPEX plans – rolling 5 / 15 year plans• Create capacity before demand arises• Implementation of CAPEX plans – rolling 5 / 15 year plans
• Strategic operational forums• Supply chain competitiveness (time and cost) • De-bottlenecking
• Strategic operational forums• Supply chain competitiveness (time and cost) • De-bottlenecking
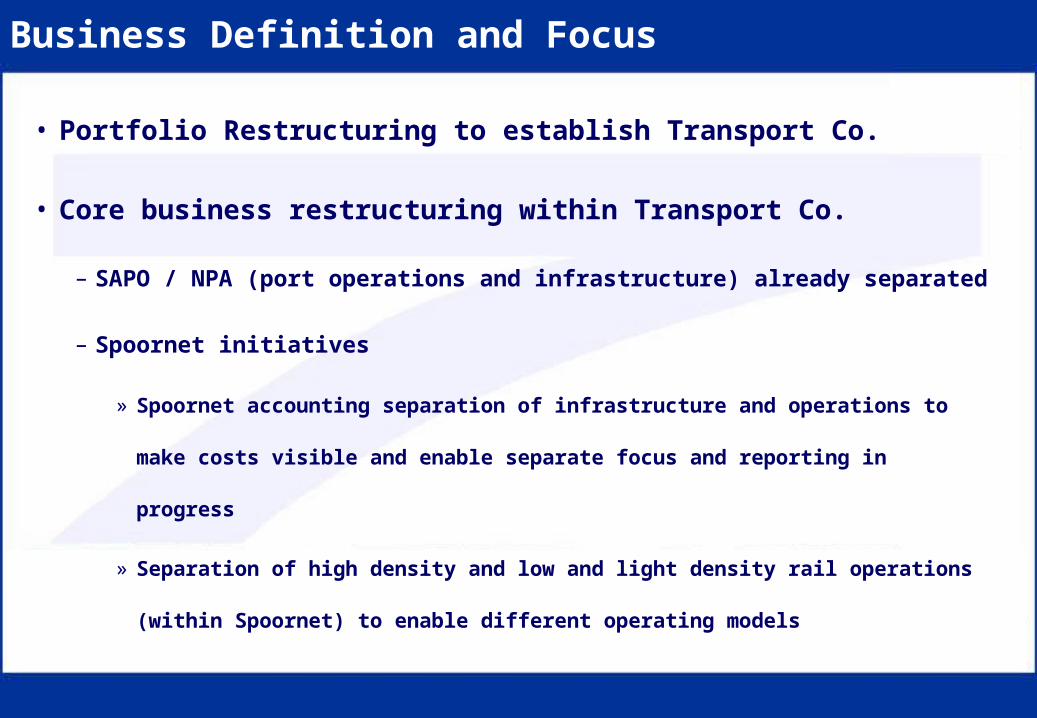
• Portfolio Restructuring to establish Transport Co.
• Core business restructuring within Transport Co.
– SAPO / NPA (port operations and infrastructure) already separated
– Spoornet initiatives
» Spoornet accounting separation of infrastructure and operations to make
costs visible and enable separate focus and reporting in progress
» Separation of high density and low and light density rail operations
(within Spoornet) to enable different operating models
Business Definition and Focus
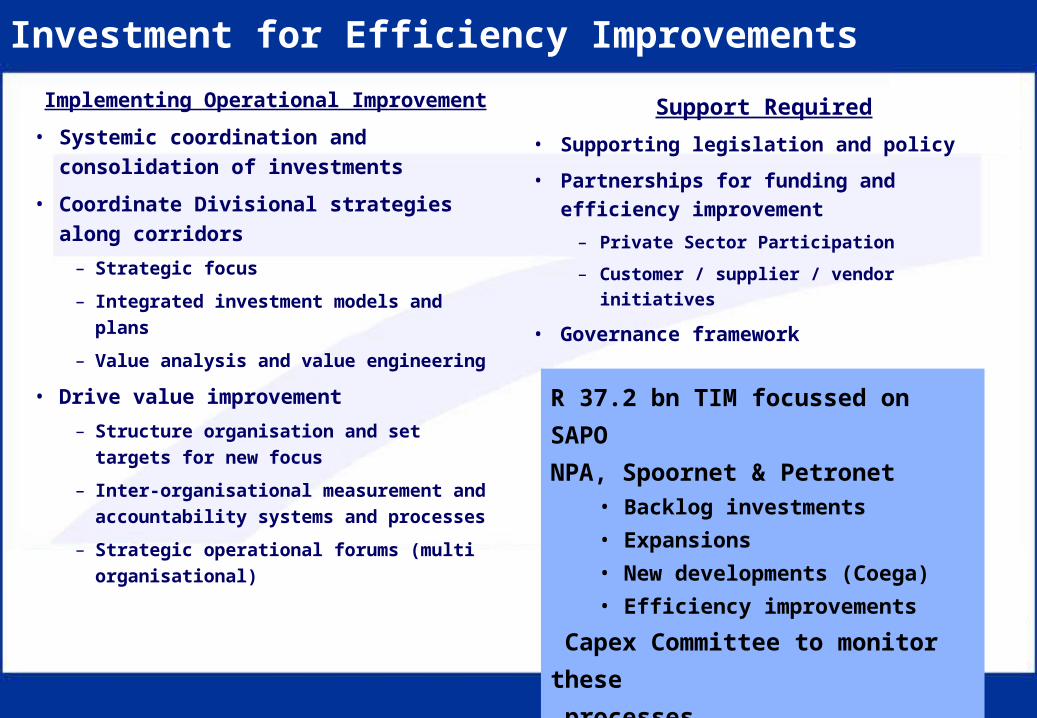
Investment for Efficiency Improvements
Implementing Operational Improvement
• Systemic coordination and
consolidation of investments
• Coordinate Divisional strategies
along corridors
– Strategic focus
– Integrated investment models and
plans
– Value analysis and value engineering
• Drive value improvement
– Structure organisation and set targets
for new focus
– Inter-organisational measurement and
accountability systems and processes
– Strategic operational forums (multi
organisational)
Support Required
• Supporting legislation and policy
• Partnerships for funding and efficiency
improvement
– Private Sector Participation
– Customer / supplier / vendor initiatives
• Governance framework
R 37.2 bn TIM focussed on SAPO
NPA, Spoornet & Petronet• Backlog investments
• Expansions
• New developments (Coega)
• Efficiency improvements
Capex Committee to monitor these
processes

Collaboration, Partnering and Integration
• Collaboration initiatives and projects
– Interim Advisory Board to improve container supply chain efficiencies
– Analysis and prioritisation of key industries and customers to determine areas of
biggest impact taking place in Spoornet (will result in similar projects to Thuth’ihlathi –
timber, and Masibambane - domestic coal)
– Petronet managing depots and terminals for customers
• Inter-divisional integration
– City Deep / corridor container performance improvement (SAPO / Spoornet)
– Various NPA / SAPO / Spoornet commodity / corridor based initiatives (e.g granite and
ferros – Richards Bay)
• Private sector participation
– SAPO business model incorporates PPP’s to attract investments and
improve efficiencies
– Selective introduction of PPP’s in “branch lines”
– Commercial cold storage (SAPO)

Process Efficiencies, Systems and Technology
• New cranes in SAPO (twin lift capability) – improved container handling
efficiencies and throughput
• New locomotives with increased traction efficiency will
– Increase utilisation and reduce costs (e.g. fuel efficiency) and
– Enable implementation of additional technologies that will futher enhance efficiencies
• On-board signalling on new locomotives has major benefits in terms of
– Traffic density (number of trains on a line)
– Safety
• Changing of signal spacing on Sishen-Saldanha corridor will allow increased
traffic density
• NPA modelling and simulation of ports and terminals (ITE / G2)
improves investment decisions
• NPA strategic sourcing initiative
• Operational systems integration
Key businesses

FinancialsSpoornet

Positioning Statement
Spoornet is "mission critical" to the economy of the country.
Its service places it at the heart of it all.

Country Description Activity United States 194,731 km mainline routes
Russia 87,157 km
China 71,600 km
India 63,518 km (15,009 km electrified)
Canada 49,422 km
Germany 45,514 km (21,000 km electrified)
Australia 41,588 km (4,612 km electrified)
Argentina 34,463 km (168 km electrified)
France 32,682 km
Brazil 31,543 km (1,981 km electrified)
Poland 23,420 km
Japan 23,168 km (15,995 km electrified)
Ukraine 22,473 km
South Africa 22,298 km (9,570 km electrified)
Mexico 19,510 km
Italy 19,493 km
United Kingdom 16,893 km
Spoornet’s Position within the World
Source: www.nationmaster.com
In world terms, Spoornet is a smaller freight based
railway, seeking to leverage heavy haul
technology

Spoornet’s Position within Africa
Country Description Activity South Africa 22,298 km
Sudan 5,978 km
Egypt 5,105 km
Congo, Democratic Republic 4,772 km
Algeria 3,973 km
Tanzania 3,690 km
Nigeria 3,557 km
Mozambique 3,123 km
Zimbabwe 3,077 km
Kenya 2,778 km
Angola 2,761 km
Namibia 2,382 km
Zambia 2,173 km
Tunisia 2,152 km
Morocco 1,907 km
Uganda 1,241 km
Guinea 1,115 km
Source: www.nationmaster.com
However, Spoornet is a large railway business
and is the most significant player in
Africa

19901986 1992 1994 1996 1998 2003
FreightLogisticsSolutions
Vision
Deregulation of Road
Transport
Predictable Service
MUP retrenchment
Closing of regions
Management Interventions• Labour• GFB sustainability• COALlink & Orex
privatisation
SpoornetIntegrated
Freight Railway
Incremental improvements in operations
Loss of critical skillsLoss of Market Share
DecliningCustomerService
Financial difficulties surface
Declining Operational Efficiency & Safety
Poor morale and work ethic
Historical Background

Key Statistics
Key Statistics 1990/91 2002/03 2003/04
Traffic:
Total freight tons (millions) 173.6 179.5 180.6 Total net tonkm (billions) 94.3 105.7 106.8 Shosholoza Meyl passengers (millions)
3.52 3.06 3.08
Blue Train passengers 8 306 5 740
Resources:
Locomotives 3 897 3 253 3 256 Freight wagons 155 831 114 135 113 584 Passenger coaches Shosholoza Meyl 1 929 2 052 2 061 Blue Train 32 36 36 Rail network: Route km 20 604 20 041 20 041 Track km 32 155 30 400 30 400 Employees (March) ± 82 000 34 662 34 771
Finance: Turnover (R million) R 6.60 R11 165 R12 401 Shosholoza Meyl R262 R288 Luxrail R62 R32

Immediate Medium Term Long Term
04/05 05/06 06/07 07/08 08/09
Phase 1Phase 1
• Customer Service• Operational Efficiency• Safety• Profitability• Attracting and Retaining a skilled
Workforce
Mobilisation
Phase 2:
New Service OfferingsYield Management CapabilityIncreasing Capacity
Phase 2
Development
Phase 3:Phase 3 • Logistics and Supply Value Chain Management•Business Development Overborder
Value Extraction
Fixing the Basics
Growth
Value Add
Spoornet Strategic Direction

Customer Service1
Operational Efficiency2
Safety3
Profitability4
Skills5
Org
anis
atio
nal
Red
esig
n
Customer Orientation
Strategic Programme of Action


Overview of South African Port Operations
• SAPO operates 13 terminals in 6 ports of SA
• Revenue - R3.2 billion in 2004/05 financial year and expected to grow by 9% p.a
• Staff complement 5570
• Total Assets Employed R3.3 billion

Services Offered
• Cargo handling
• Storage
• Logistics Management Solutions
• Warehousing and Distribution Management
• Steverdoring
• Rail/Port Interface
• Value Added Services

Market Profile
• Operates in 4 Sectors viz. Containers, Bulk, B/bulk and Cars
• Volumes handled for 2003/04 were
Sector Performance Market share
a) 3 Container terminals handled 2.5 million Teu’s 100% market share
b) 6 Break bulk terminals handled 13.3 million tons 82 % market share
c) 2 Dry bulk terminals handled 44 million tons 32 % market share
d) 2 Car terminals handled 220,000 units 100% market share
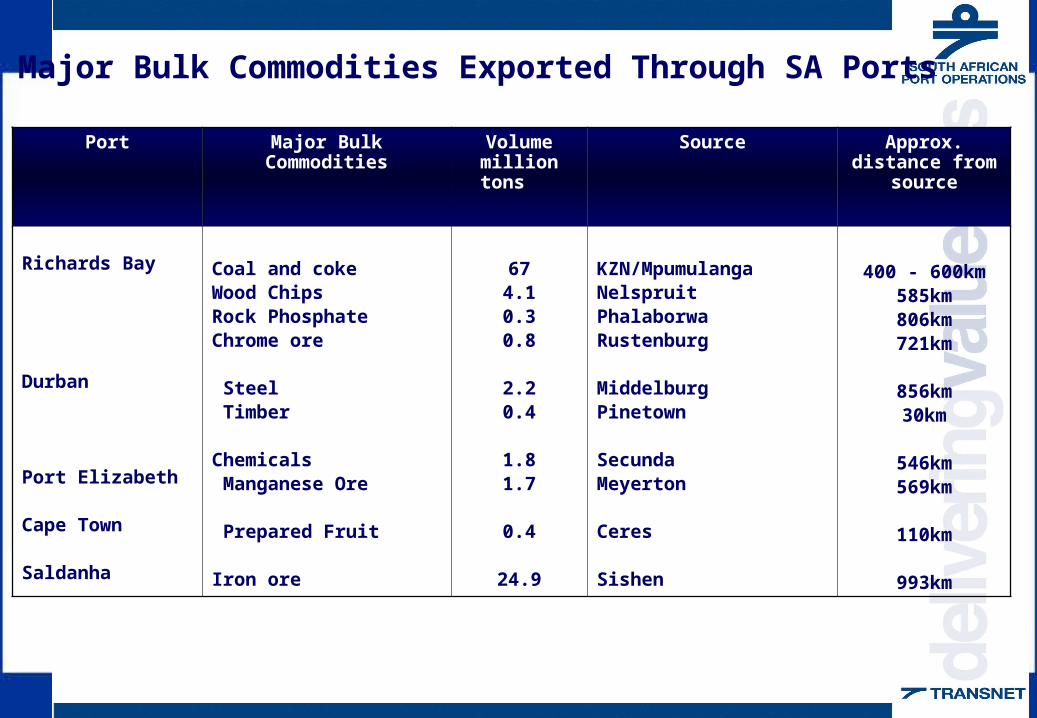
Major Bulk Commodities Exported Through SA Ports
Port Major Bulk Commodities
Volume million tons
Source Approx. distance from
source
Richards Bay
Durban
Port Elizabeth
Cape Town
Saldanha
Coal and cokeWood ChipsRock PhosphateChrome ore
Steel Timber Chemicals Manganese Ore
Prepared Fruit Iron ore
674.10.30.8
2.20.4
1.81.7
0.4
24.9
KZN/MpumulangaNelspruitPhalaborwaRustenburg
MiddelburgPinetown
SecundaMeyerton
Ceres
Sishen
400 - 600km585km806km721km
856km30km
546km569km
110km
993km
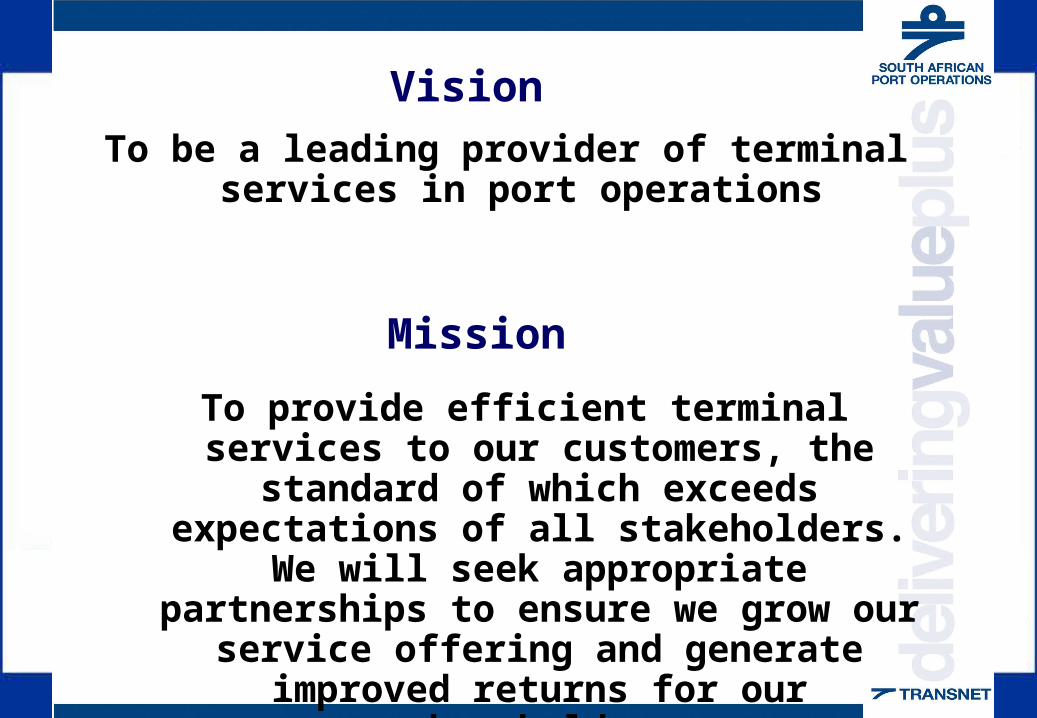
Vision
To be a leading provider of terminal services in port operations
Mission
To provide efficient terminal services to our customers, the standard of which exceeds expectations of all stakeholders. We will
seek appropriate partnerships to ensure we grow our service offering and generate improved returns for our shareholder.
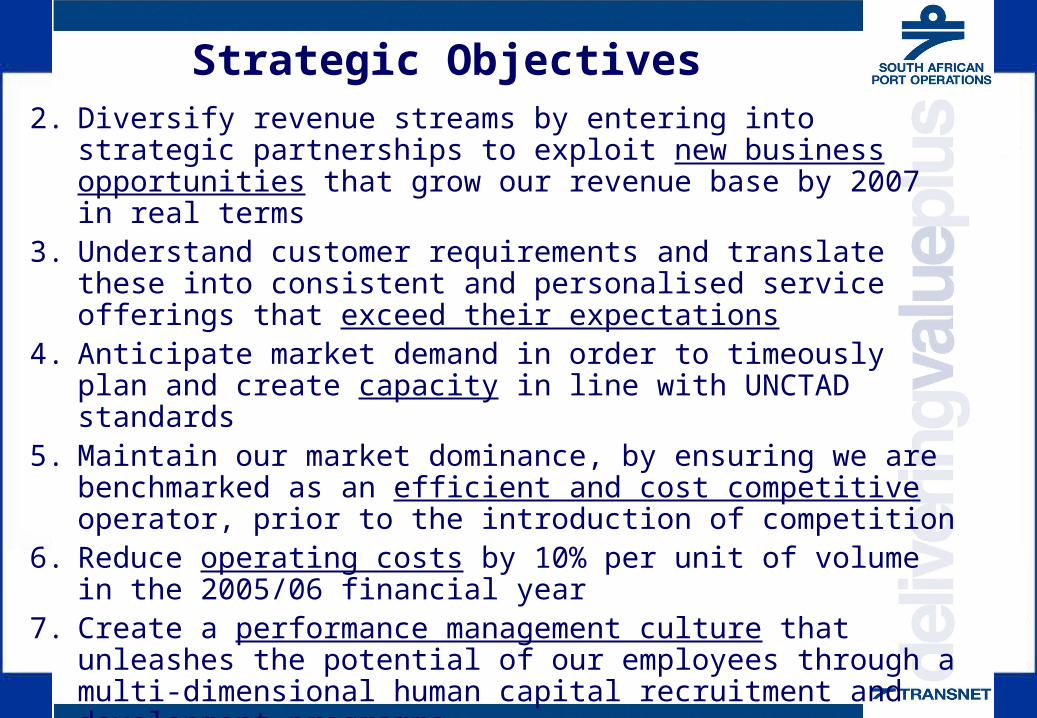
Strategic Objectives2. Diversify revenue streams by entering into strategic partnerships to
exploit new business opportunities that grow our revenue base by 2007 in real terms
3. Understand customer requirements and translate these into consistent and personalised service offerings that exceed their expectations
4. Anticipate market demand in order to timeously plan and create capacity in line with UNCTAD standards
5. Maintain our market dominance, by ensuring we are benchmarked as an efficient and cost competitive operator, prior to the introduction of competition
6. Reduce operating costs by 10% per unit of volume in the 2005/06 financial year
7. Create a performance management culture that unleashes the potential of our employees through a multi-dimensional human capital recruitment and development programme

What has been the focus?
•Splitting the company into two, namely, NPASA and SAPO
•Setting up systems, corporate office (infrastructure)
•Creating an independent & sustainable SAPO culture

Focus Areas
• Upgrading terminal superstructure
• Business Ring Fencing
• Creating an e-business forum with clients
• Continuous Improvement
• SAPO Capacity Building Initiatives
• Shop Floor Development Program
• Women in Operations
• Freight Handling Learnership
• Tariff Reform

Way Forward through Strategic Alliances
• Lowering the cost and improving the service
• Reducing the burden on overstretched infrastructure
• Increasing total efficiencies by shifting to modes that have higher capacity
• Reduce cost and time and inconvenience
• Increased productivity and efficiency
• Improved energy consumption, air, and environmental quality

National Ports Authority

NPA Vision & Mission
• Vision:
– To be a transformed, collaborative port authority that leads economic growth in a world class port system.
• Mission:
– To create and sustain world class freight and logistics solutions.

Strategic Objectives
• Value and wealth creation
• Optimising infrastructure and business processes to enhance logistics chains timeously
• Create winning customers and stakeholders through service excellence
• Inculcate behaviour embracing NPA core values; and
• Develop people’s business skills and embed innovation as a core competence

NPA Business Overview
• Custodian of SA’s 7 commercial ports.
• The NPA provides the following functions:– Landlord (infrastructure provider, management of port industrial
complex)
– Maritime (marine, dredging, lighthouse )
– Control function (environment, IMO, ISPS, harbour master)
• Focus on functional efficiencies, systems & structures
• Trade facilitation & competitiveness.

Future Position Of SA Ports
Playing a leading role in the SA economy
• Occupy a central role in integrated logistics chains;
• Set, monitor & sustain efficiency standards to meet/exceed customer expectations
• Play a key developmental role in furtherance of national & regional objectives:
– economic growth & sustainability
– country competitiveness
– Broadening the economic base

Centrality of NPA in the Logistics Chain
NPA
Terminal operators Shipping agentsConcessionaires
Stevedores
Rail operators
Road operators
Cargo owners
Freight forwarders
Inbound Logistics
Outbound Logistics
Cargo owners
Ship owners
Consumers

Challenges
• Reduced tariff income vs. Increased Capital Investment – R16.3b for the next 5 years
• Lowering Cost of doing business– Whether the reduced cost trickles down to SA Inc.

Key Enablers
• Ring fencing of assets
• Corporatisation
• Funding plans
• Private sector participation
• Port Regulator

Petronet

OUR CORE BUSINESS
Bulk transportation of energy (energy carrier) : Range of petroleum products and gas
HOW ?
Through 3000km of high-pressure underground steel pipelines which we own, operate and maintain
•Of the 3000km – •2500km for conveying petroleum products and•500km for transmission of gas to KwaZulu Natal
PETRONET
3PPT-0998
Petronet

Pipeline network
6PPT-1001

Total products transported (2003/04):
All liquid fuel products : ± 17,2 billion liters
•Petrols and diesel: 10,5 billion liters
•Avtur (jet fuel): 0,9 billion liters
•Crude oil: 5,8 billion liters
• For perspective : This equates to 285 000 road tankers per annum (refined products only) = 5500 road tanker per week @ 40m per
tanker = 210km long “train” of tankers weekly or ± 30km long “train” daily
Activities
PETRONET
10PPT-1005

Petronet transports approximately 40% of the SA refined product fuel requirements and 100 % of the Natref refinery’s crude oil requirements (which is 21% of the total SA crude requirement)
Approximately 80% of Johannesburg international airport’s requirements are supplied by Petronet’s Avtur pipeline from the Natref refinery and Durban
Petronet in perspective
PETRONET
11PPT-1006

Major international and local oil companies and government:
BP, CALTEX, SASOL OIL, SASOL GAS, SHELL, TOTAL and CEF
Clients
PETRONET
14PPT-1009

Fuel tax 111.000 c/l24.449%
Basic Price 214.732 c/l47.298%
Wholesale Margin 37.268 c/l 8.209%
Transport Cost 13.000 c/l 2.863%(Based on Petronet’s Tariffs)
Road Accident Fund 26.5 c/l5.837%
Slate Levy 1.000 c/l 0.220% Customs & Excise 4.0 c/l 0.881%
Retail Margin 39.800 c/l 8.767%
Service Cost recoveries 6.700 c/l 1.476%
BASED ON PETROL PRICE : 93 - OCTANE (ULP)GAUTENG : 454.00c/l (SEPTEMBER 2004)
COMPONENTS OF THE PUMP PRICE OF PETROL
What costs do we add to price of fuel
PETRONET
17PPT-1012
FinancialsSouth African Airways

• Financial overview

Revenue by Route (FY2005F)
Domestic 23%
Regional (Africa) 16%
Intercontinental 61%
Revenue by Route
R14,818M
0
5,000
10,000
R15,000M
SAA Passenger & Cargo Revenue (FY2005F)
Intercontinental routes accounted for ~60% of passenger revenue.
Note: Revenue is a forecast for FY2005, and includes passenger and cargo revenue onlySource: SAA Finance

Revenue by Sales Region
Asia6.9%
Africa10.8%
Americas13.4%
Europe16.8%
South Africa52.1%
Passenger Revenue
100%
0
20
40
60
80
100%
SAA Passenger Revenue
Roughly 50% of SAA’s sales are generated outside of South Africa.
Note: Data is for FY2005YTD; 48% of sales (i.e. originating from outside RSA) are denominated in foreign currencySource: SAA Finance

Cost Overview
2,950675
794
928
1,205
1,666
2,409
2,931
3,102
Operating Expenditure
R16,660M
0
5,000
10,000
15,000
R20,000M
SAA Expenditure (FY2005F)
FuelLabourAircraft DistributionMaintenanceNav, Landing
Purchaseof capacity
Accom &refresh.
Other
Fuel, labour and aircraft capital costs are the three largest cost components, accounting for 51% of operating expenses.
Note: Data is for FY2005F; Roughly 50% of SAA’s costs are incurred in foreign currenciesSource: SAA Finance

• Route structure

• Serves 600 intercontinental destinations
• Serves 30 African destinations
• Serves 21 domestic destinations
• Offers 358 daily frequencies
• SAA has 9 route specific alliances
SAA Network Reach

Johannesburg/Cape town
Atlanta
NewYork
London
Dubai
Perth Sydney
São Paulo
Hong Kong
Frankfurt
SAA network structure
Utilising alliances and code shares, SAA serves over 600 destinations.

SAA Route Network - Intercontinental (1Q2006)
Asia/Australia
• Mumbai – 7
• Hong Kong – 7
• Perth – 4
Europe
• Paris - 7
• Frankfurt (JNB) - 7
• Frankfurt (CPT) - 3
• Milan* - 3
• Zurich - 7
• London (JNB) - 14
• London (CPT) - 9
Americas
• Sao Paulo – 7
• Atlanta – 7
• New York - 7
Note: Figures represent flights per week and excludes code shares; *To be cancelled after Southern summer due to poor profitability
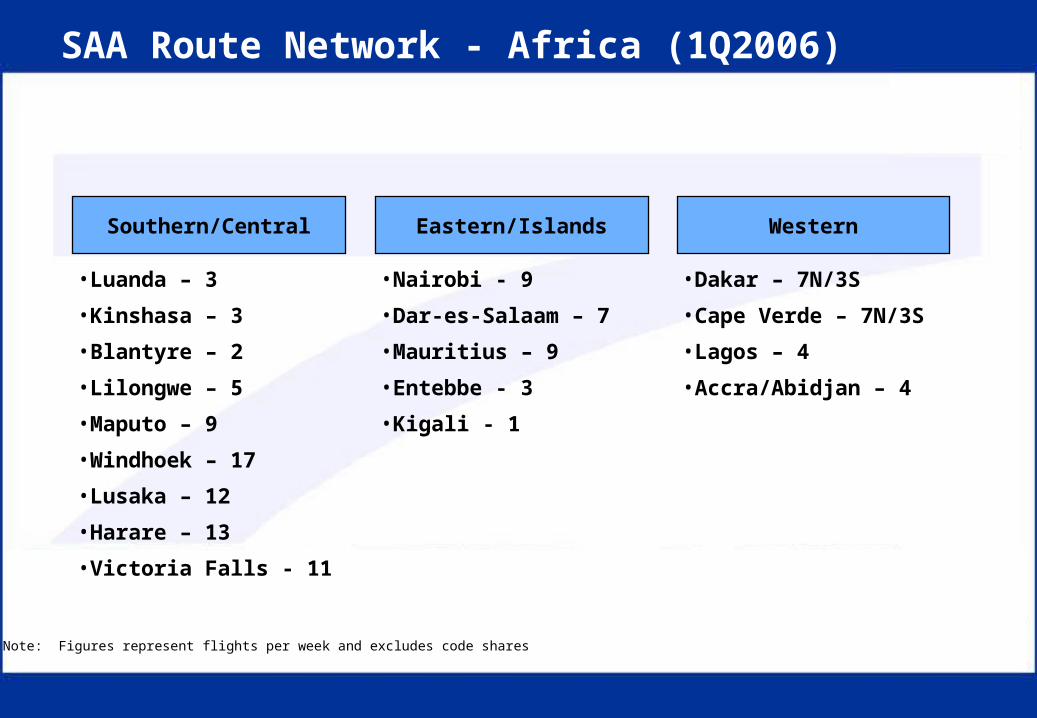
SAA Route Network - Africa (1Q2006)
Eastern/Islands
• Nairobi - 9
• Dar-es-Salaam – 7
• Mauritius – 9
• Entebbe - 3
• Kigali - 1
Southern/Central
• Luanda – 3
• Kinshasa – 3
• Blantyre – 2
• Lilongwe – 5
• Maputo – 9
• Windhoek – 17
• Lusaka – 12
• Harare – 13
• Victoria Falls - 11
Western
• Dakar – 7N/3S
• Cape Verde – 7N/3S
• Lagos – 4
• Accra/Abidjan – 4
Note: Figures represent flights per week and excludes code shares
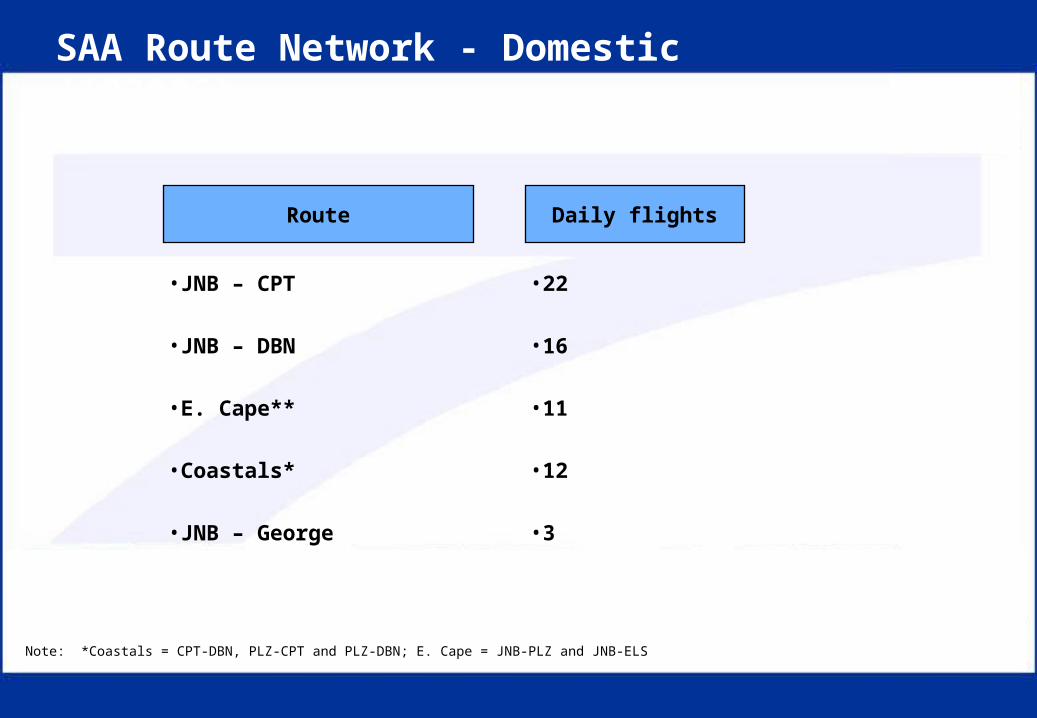
SAA Route Network - Domestic (1Q2006)
• JNB – George
Note: *Coastals = CPT-DBN, PLZ-CPT and PLZ-DBN; E. Cape = JNB-PLZ and JNB-ELS
• 3
• JNB – CPT
Daily flightsRoute
• 22
• Coastals* • 12
• E. Cape** • 11
• JNB – DBN • 16

• Fleet structure
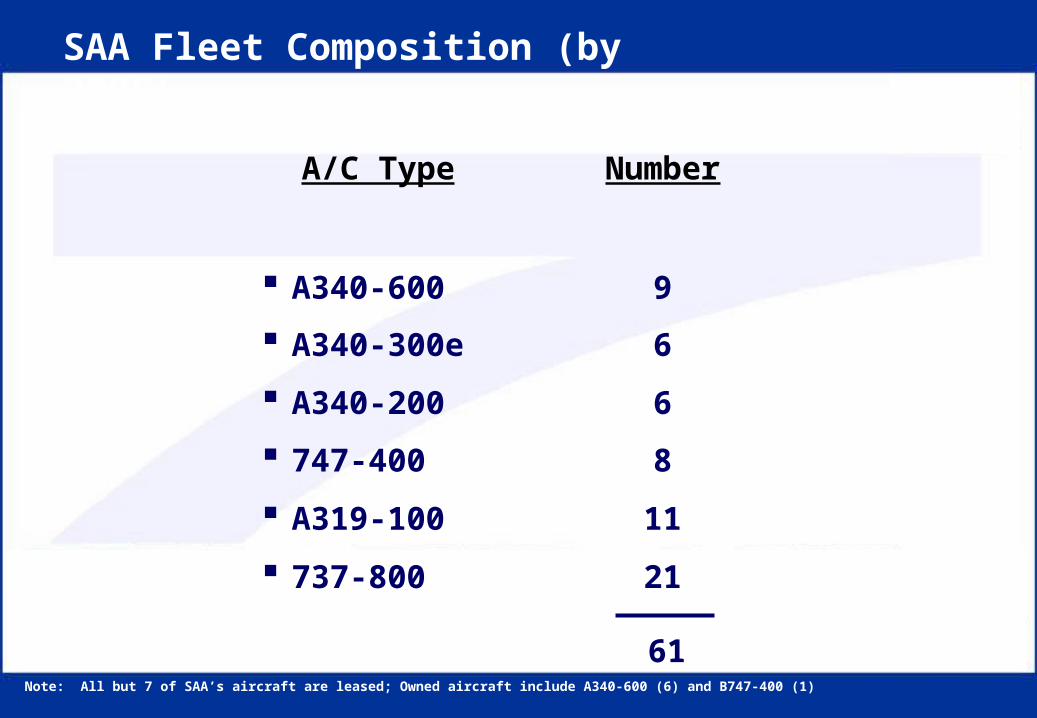
A/C Type Number
A340-300e 6
A340-200 6
747-400 8
A319-100 11
737-800 21
A340-600 9
61
SAA Fleet Composition (by 2005)
Note: All but 7 of SAA’s aircraft are leased; Owned aircraft include A340-600 (6) and B747-400 (1)

A/C Type Number Delivery
A340-600 2 2005
A340-300e 3 Done
A340-300e 3 1Q2005
A319-100 11 From 1 Sep 2004
A340-600 7 Done
26
Deliveries to date
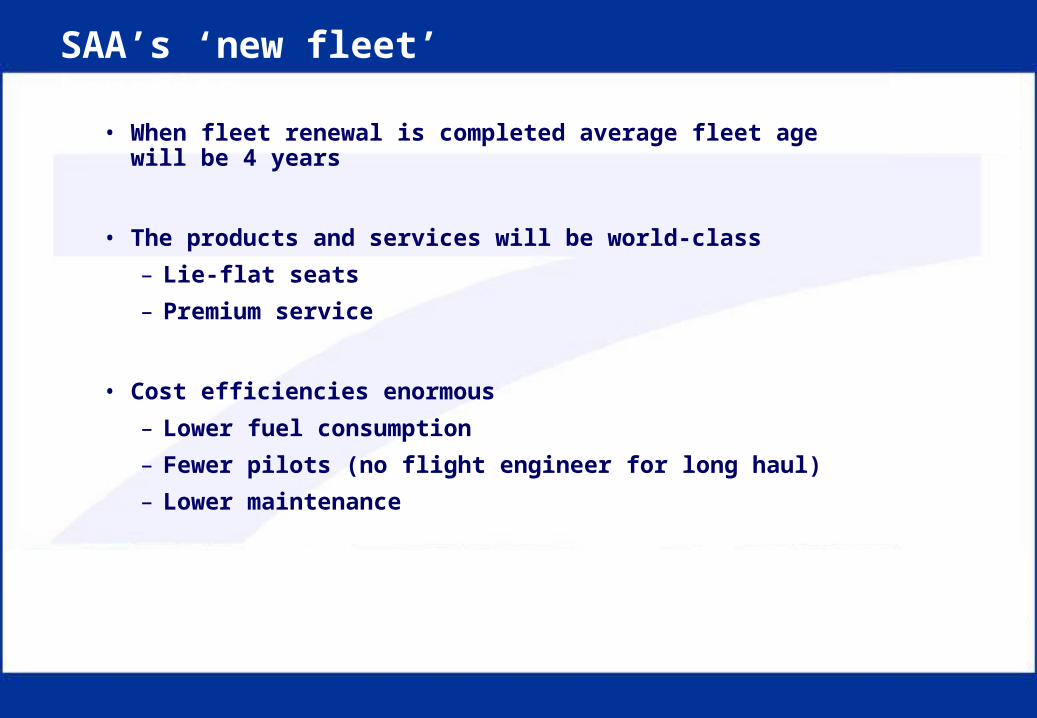
• When fleet renewal is completed average fleet age will be 4 years
• The products and services will be world-class
– Lie-flat seats
– Premium service
• Cost efficiencies enormous
– Lower fuel consumption
– Fewer pilots (no flight engineer for long haul)
– Lower maintenance
SAA’s ‘new fleet’ benefits
• Personnel
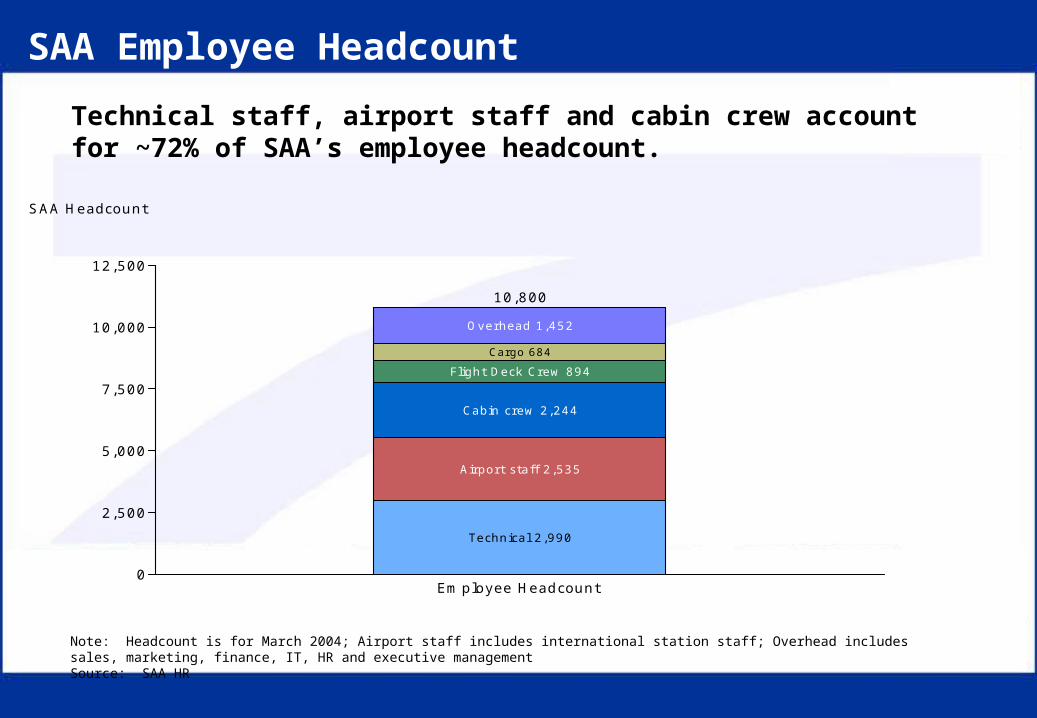
SAA Employee Headcount
Overhead 1,452
Cargo 684
Flight Deck Crew 894
Cabin crew 2,244
Airport staff 2,535
Technical 2,990
Employee Headcount
10,800
0
2,500
5,000
7,500
10,000
12,500
SAA Headcount
Technical staff, airport staff and cabin crew account for ~72% of SAA’s employee headcount.
Note: Headcount is for March 2004; Airport staff includes international station staff; Overhead includes sales, marketing, finance, IT, HR and executive managementSource: SAA HR

• Technical issues

Financial Lease
• Substantially all the risks and rewards associated with ownership of the asset are transferred from the lessor to the lessee
• Obligations under the finance lease agreement are capitalised onto the balance sheet
• Asset is depreciated over the remaining useful life
• Periodic lease payments applied to reducing capital portion of the lease liability and expensed as finance cost
• Finance lease is in substance a loan (with simultaneous purchase of asset)

Operating Lease
• Substantially all the risks and rewards are not transferred to the lessee (e.g. SAA)
• Lease payments are expensed as operating costs
• Asset is not on the balance sheet of the lessee
• An operating lease is in substance similar to a rental agreement

Hedging
• Financial term used to describe the process of covering financial exposures faced by a company
• Much the same as buying insurance to cover personal risk
• Financial exposures arise as a result of the ongoing activities of a company
• Nature of such risks: foreign currency, interest rate, inflation, commodities (e.g. oil) – any financial instrument whose price fluctuates and therefore whose value in the future cannot be known with certainty
• A market exists for “insurance” products to cover these risks – e.g. forward exchange contracts (FECs), swaps, options, futures contracts, etc.
• An example would be where a South African company buys an asset whose price is in Euro, for delivery at a future date. The South African company can either carry the exposure, and at the future date sell Rand to buy enough Euro to pay for the asset. Alternatively, the South African company can choose to fix or cap the Rand price at which it needs to buy Euro in the future to pay for the asset.

SAA Hedges
• Hedging should in most instances be used by companies to cover their exposures and to create certainty. This is desirable as it makes robust and value creating decision making possible. It also makes long term decision making possible. So called derivatives, which is the term used to describe many of these hedging instruments used to achieve certainty in financial risk, are actually powerful tools used appropriately and responsibly
• Hedging should be in respect of all exposures in one particular financial risk area. For example, one should first offset foreign currency outflows against foreign currency inflows, with only the residual (net exposure) amount being considered for hedging unless there is market failure
• Deliberately hedging one side (inflow or outflow only) in the absence of market failure is not really hedging, but speculation, or taking a bet
• In the case of the hedging issue at SAA, the failure to assess the net exposures by looking at both inflows and outflows was at the heart of the problems they then faced in the future. Rather than hedging, they turned out to have taken a bet, which they subsequently lost
• As is normally the case in situations where companies lose a lot of money because of financial decisions, it is usually not the fault of the derivatives, but that of management

Transnet
Investment Portfolio
Metro rail Autopax
SAA/SAX Others

Financials
Thank you
Related Documents
![Transnet Port Terminal, a division of · Transnet Port Terminal, a division of TRANSNET SOC LTD Registration Number 1990/000900/30 [Hereinafter referred to as Transnet] REQUEST FOR](https://static.cupdf.com/doc/110x72/5f5e4faa6b0e6821912b906b/transnet-port-terminal-a-division-of-transnet-port-terminal-a-division-of-transnet.jpg)


![Transnet]...TRANSNET FRAIGHT RAIL, a division of TRANSNET SOC LTD Registration Number 1990/000900/30 [thereinafter referred to as Transnet] REQUEST FOR QUOTATION …](https://static.cupdf.com/doc/110x72/6050751b455b0f3d741c0d14/transnet-transnet-fraight-rail-a-division-of-transnet-soc-ltd-registration.jpg)


![Petronet MNB Ltd [Compatibility Mode]](https://static.cupdf.com/doc/110x72/55cf99f7550346d0339feadc/petronet-mnb-ltd-compatibility-mode.jpg)