Overview What are functional data? Some functional data . . . The goals of functional . . . The first steps in a . . . Using derivatives in . . . Summary: What . . . Home Page Title Page Page 1 of 33 Go Back Full Screen Close Quit An Introduction to Functional Data Analysis

Welcome message from author
This document is posted to help you gain knowledge. Please leave a comment to let me know what you think about it! Share it to your friends and learn new things together.
Transcript
Overview
What are functional data?
Some functional data . . .
The goals of functional . . .
The first steps in a . . .
Using derivatives in . . .
Summary: What . . .
Home Page
Title Page
JJ II
J I
Page 1 of 33
Go Back
Full Screen
Close
Quit
An Introduction toFunctional Data
Analysis
Overview
What are functional data?
Some functional data . . .
The goals of functional . . .
The first steps in a . . .
Using derivatives in . . .
Summary: What . . .
Home Page
Title Page
JJ II
J I
Page 2 of 33
Go Back
Full Screen
Close
Quit
1. Overview• What are functional data?
• Some functional data analyses
• The goals of functional data analysis
• First steps in a functional data analysis
• Using derivatives in functional data analysis
This talk follows closely the first chapter of J. O. Ramsayand B. W. Silverman, (2005) Functional Data Analysis, Sec-ond Edition. New York: Springer.

Overview
What are functional data?
Some functional data . . .
The goals of functional . . .
The first steps in a . . .
Using derivatives in . . .
Summary: What . . .
Home Page
Title Page
JJ II
J I
Page 3 of 33
Go Back
Full Screen
Close
Quit
2. What are functional data?

Overview
What are functional data?
Some functional data . . .
The goals of functional . . .
The first steps in a . . .
Using derivatives in . . .
Summary: What . . .
Home Page
Title Page
JJ II
J I
Page 4 of 33
Go Back
Full Screen
Close
Quit
Heights of ten girls

Overview
What are functional data?
Some functional data . . .
The goals of functional . . .
The first steps in a . . .
Using derivatives in . . .
Summary: What . . .
Home Page
Title Page
JJ II
J I
Page 5 of 33
Go Back
Full Screen
Close
Quit
Data challenges
• We need repeated and regular access to each child forup to 20 years.
• Height changes over the day, and must be measured ata fixed time.
• Height is measured in supine position in infancy, fol-lowed by standing height. The change involves an ad-justment of about 1 cm.
• Measurement error is about 0.5 cm in later years, but israther larger in infancy. This is a signal–to–noise ratioof about 150.
• Measurements are not taken at equally spaced pointsin time.
Overview
What are functional data?
Some functional data . . .
The goals of functional . . .
The first steps in a . . .
Using derivatives in . . .
Summary: What . . .
Home Page
Title Page
JJ II
J I
Page 6 of 33
Go Back
Full Screen
Close
Quit
Modelling challenges
• We want smooth curves that fit the data as well as isreasonable. That is, with a typical error level that startsat about 0.7 cm but decreases to around 0.5 cm.
• In principle the curves should be monotone; i. e., havea positive derivative.
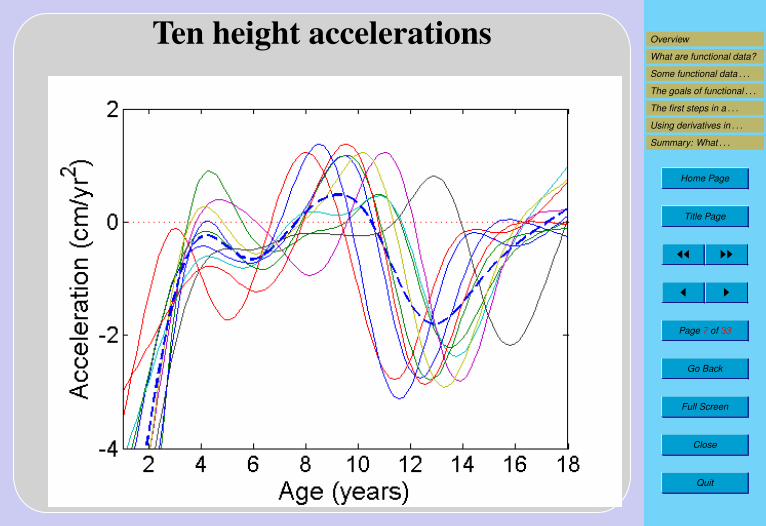
• We will want to look at velocity and acceleration, so thatwe want to differentiate twice and have a smooth curve.
Overview
What are functional data?
Some functional data . . .
The goals of functional . . .
The first steps in a . . .
Using derivatives in . . .
Summary: What . . .
Home Page
Title Page
JJ II
J I
Page 7 of 33
Go Back
Full Screen
Close
Quit
Ten height accelerations

Overview
What are functional data?
Some functional data . . .
The goals of functional . . .
The first steps in a . . .
Using derivatives in . . .
Summary: What . . .
Home Page
Title Page
JJ II
J I
Page 8 of 33
Go Back
Full Screen
Close
Quit
Plotting acceleration against velocity

Overview
What are functional data?
Some functional data . . .
The goals of functional . . .
The first steps in a . . .
Using derivatives in . . .
Summary: What . . .
Home Page
Title Page
JJ II
J I
Page 9 of 33
Go Back
Full Screen
Close
Quit
One boy’s height curve

Overview
What are functional data?
Some functional data . . .
The goals of functional . . .
The first steps in a . . .
Using derivatives in . . .
Summary: What . . .
Home Page
Title Page
JJ II
J I
Page 10 of 33
Go Back
Full Screen
Close
Quit
One boy’s height velocity curve
Overview
What are functional data?
Some functional data . . .
The goals of functional . . .
The first steps in a . . .
Using derivatives in . . .
Summary: What . . .
Home Page
Title Page
JJ II
J I
Page 11 of 33
Go Back
Full Screen
Close
Quit
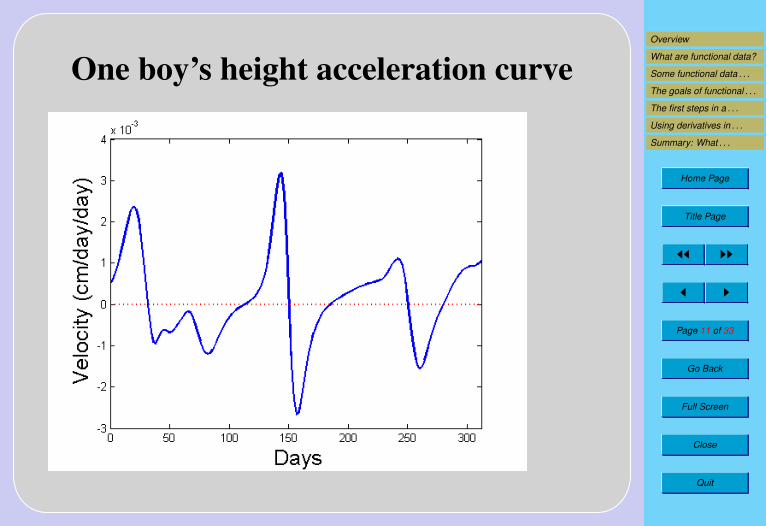
One boy’s height acceleration curve
Overview
What are functional data?
Some functional data . . .
The goals of functional . . .
The first steps in a . . .
Using derivatives in . . .
Summary: What . . .
Home Page
Title Page
JJ II
J I
Page 12 of 33
Go Back
Full Screen
Close
Quit
Data from one newborn baby
• Prof. Michael Hermanussen developed an instrumentcapable of measuring the length of the tibia of a baby(the lower leg bone) with an accuracy of about 0.1 mil-limeters.
• He measured newborn infant’s tibias daily and hourly.

Overview
What are functional data?
Some functional data . . .
The goals of functional . . .
The first steps in a . . .
Using derivatives in . . .
Summary: What . . .
Home Page
Title Page
JJ II
J I
Page 13 of 33
Go Back
Full Screen
Close
Quit
One baby’s height curve

Overview
What are functional data?
Some functional data . . .
The goals of functional . . .
The first steps in a . . .
Using derivatives in . . .
Summary: What . . .
Home Page
Title Page
JJ II
J I
Page 14 of 33
Go Back
Full Screen
Close
Quit
One baby’s height velocity curve

Overview
What are functional data?
Some functional data . . .
The goals of functional . . .
The first steps in a . . .
Using derivatives in . . .
Summary: What . . .
Home Page
Title Page
JJ II
J I
Page 15 of 33
Go Back
Full Screen
Close
Quit
One baby’s height acceleration curve

Overview
What are functional data?
Some functional data . . .
The goals of functional . . .
The first steps in a . . .
Using derivatives in . . .
Summary: What . . .
Home Page
Title Page
JJ II
J I
Page 16 of 33
Go Back
Full Screen
Close
Quit
Some conclusions about growth
• Over 20 years, there is one major growth spurt, butclear evidence for at least one minor spurt.
• The timing of these spurts varies from child to child.
• Zooming in on a daily scale, at ten years of age there isa growth spurt every 100 days or so, and the amount ofenergy in the spurts seems to be decreasing.
• A newborn’s tibia can grow at an astonishing 2 millime-ters per day!
• A critical aspect of growth is what shuts it off.
Overview
What are functional data?
Some functional data . . .
The goals of functional . . .
The first steps in a . . .
Using derivatives in . . .
Summary: What . . .
Home Page
Title Page
JJ II
J I
Page 17 of 33
Go Back
Full Screen
Close
Quit
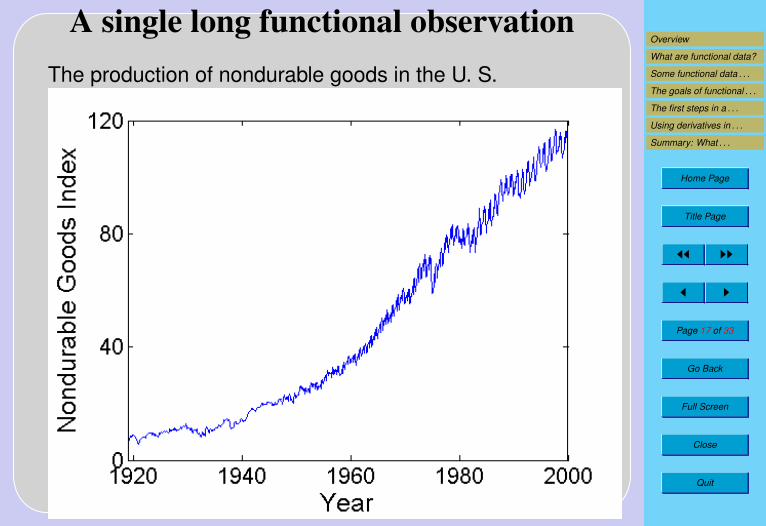
A single long functional observationThe production of nondurable goods in the U. S.

Overview
What are functional data?
Some functional data . . .
The goals of functional . . .
The first steps in a . . .
Using derivatives in . . .
Summary: What . . .
Home Page
Title Page
JJ II
J I
Page 18 of 33
Go Back
Full Screen
Close
Quit

Overview
What are functional data?
Some functional data . . .
The goals of functional . . .
The first steps in a . . .
Using derivatives in . . .
Summary: What . . .
Home Page
Title Page
JJ II
J I
Page 19 of 33
Go Back
Full Screen
Close
Quit
Multiscale variationThese data, after transformation, have interesting variationon four different time scales:
• Long term: A remarkably linear trend with a slope of1.6.
• Medium Term: Multi–year changes due to the depres-sion, World War II, the Vietnam War, and over the lastdecade.
• Short Term: Shocks like the stock market crash of1928, the 1938 reduction of money supply and the endof the Vietnam War in 1976.
• Seasonal Effects: Within-year effects that we will con-sider later, and that evolve smoothly from one year tothe next.

Overview
What are functional data?
Some functional data . . .
The goals of functional . . .
The first steps in a . . .
Using derivatives in . . .
Summary: What . . .
Home Page
Title Page
JJ II
J I
Page 20 of 33
Go Back
Full Screen
Close
Quit
3. Some functional data analyses

Overview
What are functional data?
Some functional data . . .
The goals of functional . . .
The first steps in a . . .
Using derivatives in . . .
Summary: What . . .
Home Page
Title Page
JJ II
J I
Page 21 of 33
Go Back
Full Screen
Close
Quit
An input/output systemTray 47 level in an oil refinery responds to a step change ininput.
Can we develop a functional linear model to describe thisrelation?

Overview
What are functional data?
Some functional data . . .
The goals of functional . . .
The first steps in a . . .
Using derivatives in . . .
Summary: What . . .
Home Page
Title Page
JJ II
J I
Page 22 of 33
Go Back
Full Screen
Close
Quit
Mean annual temperatures at fourweather stations
We will use principal components analysis on data from 35weather stations.
Overview
What are functional data?
Some functional data . . .
The goals of functional . . .
The first steps in a . . .
Using derivatives in . . .
Summary: What . . .
Home Page
Title Page
JJ II
J I
Page 23 of 33
Go Back
Full Screen
Close
Quit
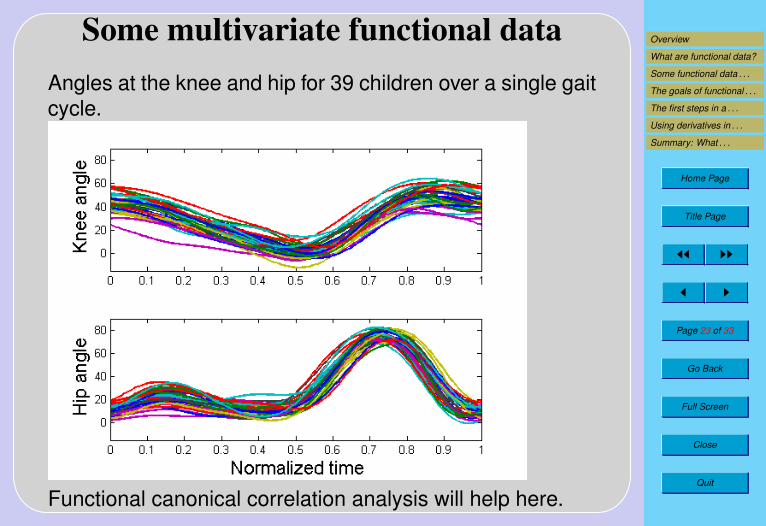
Some multivariate functional dataAngles at the knee and hip for 39 children over a single gaitcycle.
Functional canonical correlation analysis will help here.
Overview
What are functional data?
Some functional data . . .
The goals of functional . . .
The first steps in a . . .
Using derivatives in . . .
Summary: What . . .
Home Page
Title Page
JJ II
J I
Page 24 of 33
Go Back
Full Screen
Close
Quit
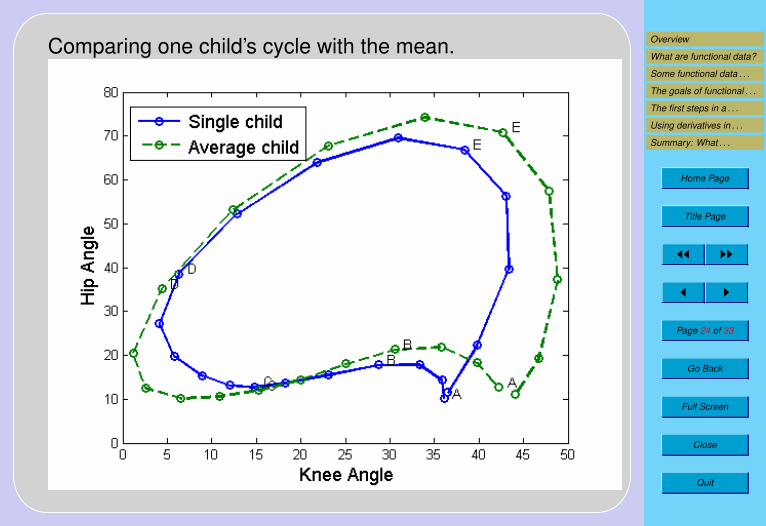
Comparing one child’s cycle with the mean.

Overview
What are functional data?
Some functional data . . .
The goals of functional . . .
The first steps in a . . .
Using derivatives in . . .
Summary: What . . .
Home Page
Title Page
JJ II
J I
Page 25 of 33
Go Back
Full Screen
Close
Quit
4. The goals of functional data analy-sis

Overview
What are functional data?
Some functional data . . .
The goals of functional . . .
The first steps in a . . .
Using derivatives in . . .
Summary: What . . .
Home Page
Title Page
JJ II
J I
Page 26 of 33
Go Back
Full Screen
Close
Quit
The goals of functional data analysis are essentially thesame as those of any other branch of statistics. They in-clude:
• to represent the data in ways that aid further analysis
• to display the data so as to highlight various character-istics
• to study important sources of pattern and variationamong the data
• to explain variation in an outcome or dependent variableby using input or independent variable information
• to compare two or more sets of data with respect to cer-tain types of variation, where two sets of data can con-tain different sets of replicates of the same functions, ordifferent functions for a common set of replicates.
Overview
What are functional data?
Some functional data . . .
The goals of functional . . .
The first steps in a . . .
Using derivatives in . . .
Summary: What . . .
Home Page
Title Page
JJ II
J I
Page 27 of 33
Go Back
Full Screen
Close
Quit
5. The first steps in a functional dataanalysis

Overview
What are functional data?
Some functional data . . .
The goals of functional . . .
The first steps in a . . .
Using derivatives in . . .
Summary: What . . .
Home Page
Title Page
JJ II
J I
Page 28 of 33
Go Back
Full Screen
Close
Quit
Smoothing the rainfall data for PrinceRupert
The smooth line is constrained to be positive.

Overview
What are functional data?
Some functional data . . .
The goals of functional . . .
The first steps in a . . .
Using derivatives in . . .
Summary: What . . .
Home Page
Title Page
JJ II
J I
Page 29 of 33
Go Back
Full Screen
Close
Quit
Data registration or feature alignment

Overview
What are functional data?
Some functional data . . .
The goals of functional . . .
The first steps in a . . .
Using derivatives in . . .
Summary: What . . .
Home Page
Title Page
JJ II
J I
Page 30 of 33
Go Back
Full Screen
Close
Quit
The problem of phase variation
• Often important features in replicated curves do not oc-cur at the same time. Like the pubertal growth spurt.
• Phase variation disrupts most obvious functional dataanalyses, which are designed for only amplitude varia-tion.
• The mean curve here is a worthless summary of thesegrowth acceleration curves.
• We must first align features, a process called curve reg-istration.
• Registration separates phase and amplitude variation,which can then be studied independently, and alsojointly.

Overview
What are functional data?
Some functional data . . .
The goals of functional . . .
The first steps in a . . .
Using derivatives in . . .
Summary: What . . .
Home Page
Title Page
JJ II
J I
Page 31 of 33
Go Back
Full Screen
Close
Quit
6. Using derivatives in functionaldata analysis

Overview
What are functional data?
Some functional data . . .
The goals of functional . . .
The first steps in a . . .
Using derivatives in . . .
Summary: What . . .
Home Page
Title Page
JJ II
J I
Page 32 of 33
Go Back
Full Screen
Close
Quit
The sinusoidal component of weather
• One expects temperature to be primarily sinusoidal incharacter, and certainly periodic over the annual cycle.
• There is much variation in level and some variation inphase.
• A model of the form
Tempi(t) ≈ ci1 + ci2 sin(πt/6) + ci3 cos(πt/6)
should do rather nicely for these data.

Overview
What are functional data?
Some functional data . . .
The goals of functional . . .
The first steps in a . . .
Using derivatives in . . .
Summary: What . . .
Home Page
Title Page
JJ II
J I
Page 33 of 33
Go Back
Full Screen
Close
Quit
• There are clear departures from sinusoidal or simpleharmonic behavior.
• We could remove sinusoidal trend by regression, butlet’s use differentiation instead.
• We use Dmx to refer to the mth derivative.
• We compute
LTemp = (π/6)2DTemp + D3Temp,
which will annihilate shifted sinusoids.
• L is a linear differential operator.
• We can define temperature as the solution to the differ-ential equation
Ltemp = u
where u is called a forcing function, and accounts forthe non–sinusoidal effects.

Overview
What are functional data?
Some functional data . . .
The goals of functional . . .
The first steps in a . . .
Using derivatives in . . .
Summary: What . . .
Home Page
Title Page
JJ II
J I
Page 34 of 33
Go Back
Full Screen
Close
Quit
De–sined temperature

Overview
What are functional data?
Some functional data . . .
The goals of functional . . .
The first steps in a . . .
Using derivatives in . . .
Summary: What . . .
Home Page
Title Page
JJ II
J I
Page 35 of 33
Go Back
Full Screen
Close
Quit
The seasonal trend for a typical year in the goods index

Overview
What are functional data?
Some functional data . . .
The goals of functional . . .
The first steps in a . . .
Using derivatives in . . .
Summary: What . . .
Home Page
Title Page
JJ II
J I
Page 36 of 33
Go Back
Full Screen
Close
Quit
Displaying seasonal dynamics: the phase-plane plot

Overview
What are functional data?
Some functional data . . .
The goals of functional . . .
The first steps in a . . .
Using derivatives in . . .
Summary: What . . .
Home Page
Title Page
JJ II
J I
Page 37 of 33
Go Back
Full Screen
Close
Quit
• Many types of functional data show strong harmonicvariation.
• The acceleration or second derivative reflects poten-tial energy in a mechanical system, like a pendulum orspring.
• The first derivative reflects its kinetic energy.
• A sinusoid is the prototype for such variation. Plottingits second derivative against first derivative produces acircle.
• The radius of the cycle is the total energy in the system,conserved as energy changes state.
• These ideas apply most periodic phenomena.
• The phase-plane plot is a graphic version of a differen-tial equation.

Overview
What are functional data?
Some functional data . . .
The goals of functional . . .
The first steps in a . . .
Using derivatives in . . .
Summary: What . . .
Home Page
Title Page
JJ II
J I
Page 38 of 33
Go Back
Full Screen
Close
Quit
7. Summary: What makes FDA dif-ferent?

Overview
What are functional data?
Some functional data . . .
The goals of functional . . .
The first steps in a . . .
Using derivatives in . . .
Summary: What . . .
Home Page
Title Page
JJ II
J I
Page 39 of 33
Go Back
Full Screen
Close
Quit
• Unlike time series analyses, no assumptions of station-arity are made, and data are not sampled at equallyspaced time points.
• Unlike most longitudinal data, a large number of timepoints are available, and the signal-to-noise ratio ismedium to high.
• The data can support the accurate estimate of one ormore derivatives, and these play several critical roles.
• Phase variation is recognized and separated from am-plitude variation.
• Familiar multivariate methods have functional counter-parts, and the smoothness of functional parameter es-timates is explicitly controlled.
• Differential equations are new modelling tools.

Overview
What are functional data?
Some functional data . . .
The goals of functional . . .
The first steps in a . . .
Using derivatives in . . .
Summary: What . . .
Home Page
Title Page
JJ II
J I
Page 40 of 33
Go Back
Full Screen
Close
Quit
8. Where do we go for more informa-tion?

Overview
What are functional data?
Some functional data . . .
The goals of functional . . .
The first steps in a . . .
Using derivatives in . . .
Summary: What . . .
Home Page
Title Page
JJ II
J I
Page 41 of 33
Go Back
Full Screen
Close
Quit
• A web site containing more information, data, sampleanalyses, software, news, and etc.:
• www.functionaldata.org• Two books to consider:
• J. O. Ramsay and B. W. Silverman, (2005) FunctionalData Analysis, Second Edition. New York: Springer.
• J. O. Ramsay and B. W. Silverman, (2002) AppliedFunctional Data Analysis, Second Edition. New York:Springer.
Related Documents