An Introduction to Agriculture Statistics Background Material for Training Session Held in Maputo Mozambique, March 2-11, 2009 Draft Ernie Boyko And Christopher Hill World Bank, GDDS Project

Welcome message from author
This document is posted to help you gain knowledge. Please leave a comment to let me know what you think about it! Share it to your friends and learn new things together.
Transcript
An Introduction
to Agriculture
Statistics
Background Material for Training Session Held in
Maputo Mozambique, March 2-11, 2009
Draft
Ernie Boyko And
Christopher Hill World Bank, GDDS Project
General Data Dissemination System, II World Bank
An Introduction to Agriculture Statistics, April 2009, Boyko and Hill Page 2
Table of Contents
Preface…………………………………………………………………………………………………………..3
Chapter 1: Introduction: Setting the Stage……………………………………………………..4
Chapter 2: Major Users of Agriculture Statistics in Mozambique…………………12
Chapter 3: The use of Definitions, Concepts, Classifications and Quality………16
Chapter 4: The Survey Process………………………………………………………………………21
Chapter 5: Questionnaire Design………………………………………………………………….29
Chapter 6: What Should be Measured in an Agriculture Statistics System?......36
Chapter 7: Sample Design……………………………………………………………………………...44
Chapter 8: Case Study: Survey Design Considerations for Mozambique Cattle Statistics…………………………………………………………………………………………………...…..52
Chapter 9: Planning an Agricultural Survey…………………………………………………..57
Chapter 10: Project Management Basics……………………………………………………….61
Chapter 11: Data Collection…………………………………………………………………………..64
Chapter 12: Data Capture and Processing……………………………………………………..70
Chapter 13: Estimation………………………………………………………………………………….76
Chapter 14: Verifying Survey Estimates………………………………………………………..84
Chapter 15: Metadata and Data Management………………………………………………..87
Chapter 16: Data Analysis, Product Creation and Dissemination……….………….89
Chapter 17 Conclusions and Addendum ……………………………………………………….96
General Data Dissemination System, II World Bank
An Introduction to Agriculture Statistics, April 2009, Boyko and Hill Page 3
Preface This document was prepared as part of a mission to Mozambique which aimed at providing an introduction to agriculture statistics. The overall objective of this mission was to provide training and orientation for up to 25 members of the Agriculture Statistics Department in the Ministry of Agriculture. The subject of the training was an overview of the role, purpose, production, dissemination and management of agriculture statistics in Mozambique.
The Mozambique Ministry of Agriculture (MINAG) is responsible for producing annual and special statistics for the agriculture sector. Based in large part on the strength of their provincial offices, MINAG has a strong survey program. The annual agriculture survey known as the TIA (Trabalho de Inquerito Agricola) has been in existence since 2002. The survey is planned centrally with assistance from USAID and Michigan State University. The data are collected and captured in the field by teams of people working in the provincial offices. There has long been a concern that the provincial statisticians have only a limited exposure to the statistical process. For example, they are not involved in questionnaire and sample design nor are they involved in the post-data capture activities. This training program was designed to give them an overview of the entire statistical process.
While the provincial employees were the main targets for the training, this same training was used to augment the knowledge of junior staff and to expose new staff working in the central office in Maputo to the statistical process.
This mission was organized by the World Bank with financial support from the Department for International Development (DFID) of the United Kingdom as part of a project to assist 21 Anglophone African countries to participate in the General Data Dissemination System (GDDS). Participating countries were assisted to participate in the GDDS through two separate, but linked projects both financed by DFID. The IMF provided project management and technical support in the area of economic and financial statistics. The World Bank provided technical support in the area of socio-demographic statistics. Both projects ran concurrently until mid- 2009.
The training session covered all aspects of agriculture statistics starting with the nature of statistics and data and how they can be used to form information which can be used for decision-making. After exploring the nature of statistics, the material followed the main topics pertaining to the survey cycle.
This mission was carried out by Ernie Boyko from Ottawa, Canada and Christopher Hill from Maputo, Mozambique on March 2-11, 2009. The slides that were used for this training session are (or will be) available from the GDDS web site at worldbank.org/data/gdds
General Data Dissemination System, II World Bank
An Introduction to Agriculture Statistics, April 2009, Boyko and Hill Page 4
Chapter 1: Introduction: Setting the Stage
What do we mean by agriculture statistics? The terms data, statistics and information are often used interchangeably but there are important distinctions.
Data are the basic part of a broader information system. When statisticians produce data, they are trying to measure or count phenomena (things or activities) that are part of the real world. Data may be viewed as a lowest level of abstraction from which information and knowledge are derived.
Examples of data: Number of cows on a farm
Number of people in a household
Number of children in a family
In these cases, the data are derived (yes, the word data is considered to be plural. The singular for data is datum) by counting.
If the question were: “How many dollars did you spend last year on improved seed?” the answer must be provided by a respondent who would look at records, or simply cite the number from memory. This is another example of measurement.
Data, statistics and information
• What are they?
• Why are they important?
• Where do they come from?
• What is the scope of agriculture stats and information?
General Data Dissemination System, II World Bank
An Introduction to Agriculture Statistics, April 2009, Boyko and Hill Page 5
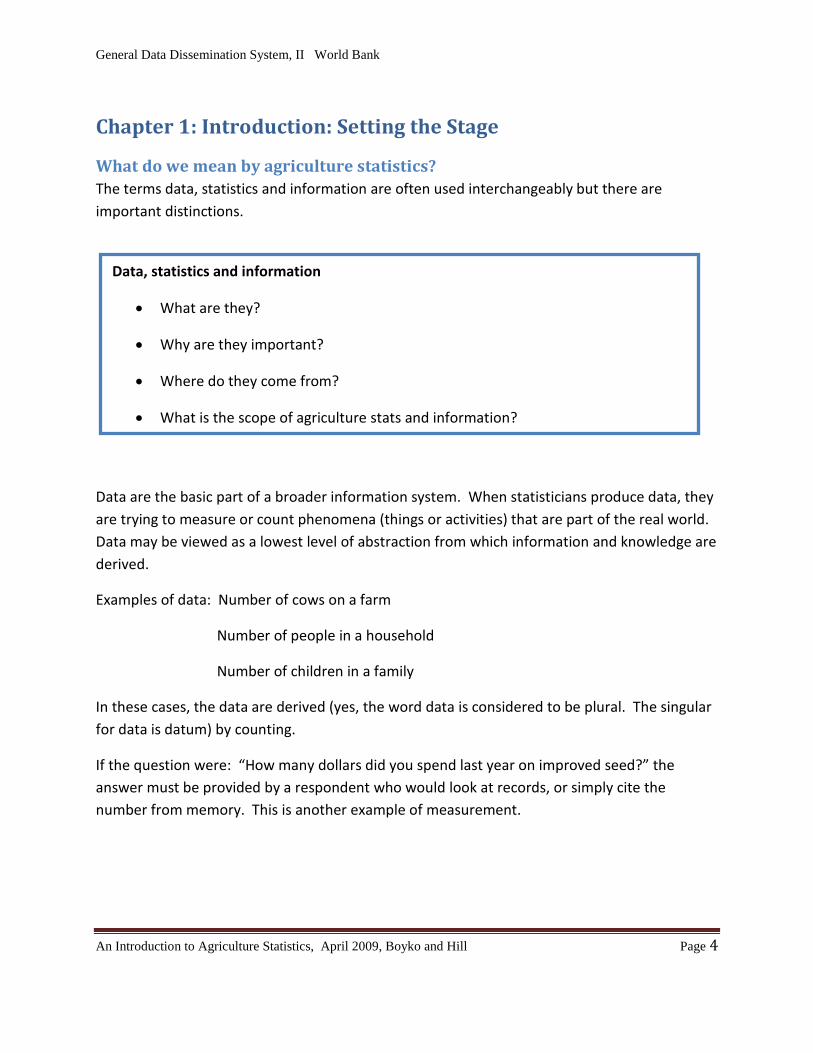
Figure 1 Data in machine readable form
Data by themselves are not very useful. They must be organized into statistics in order to become understandable and consumable by the user.
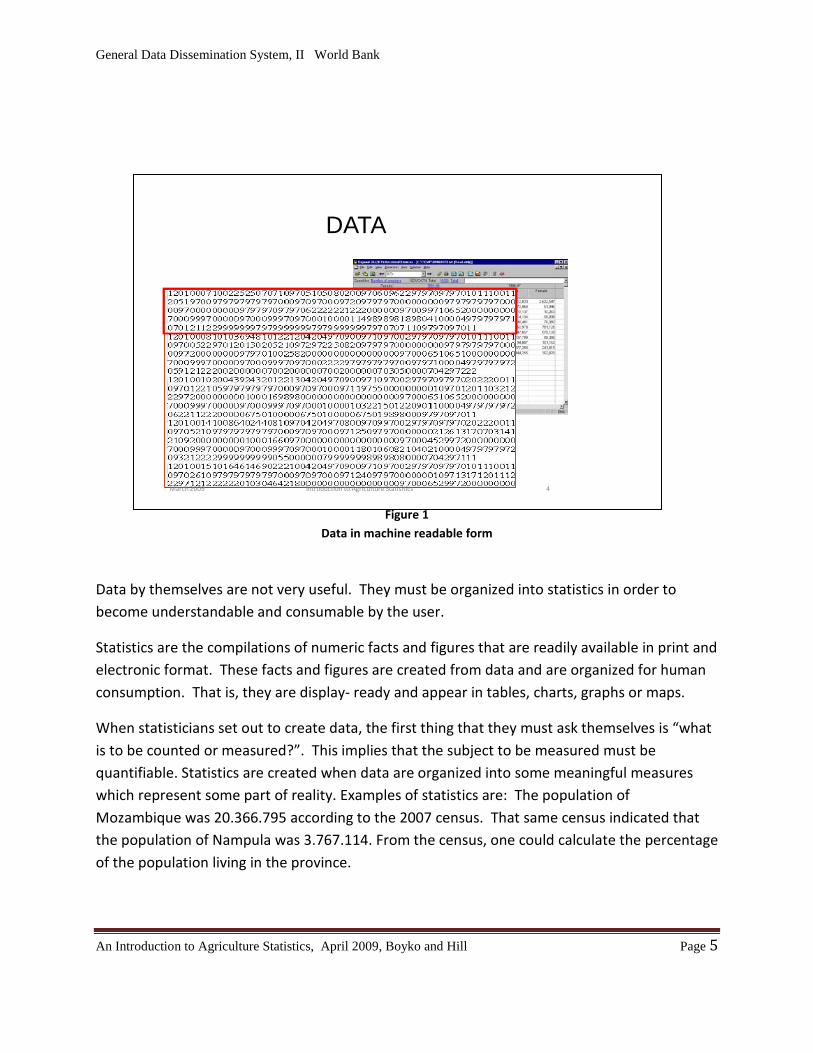
Statistics are the compilations of numeric facts and figures that are readily available in print and electronic format. These facts and figures are created from data and are organized for human consumption. That is, they are display- ready and appear in tables, charts, graphs or maps.
When statisticians set out to create data, the first thing that they must ask themselves is “what is to be counted or measured?”. This implies that the subject to be measured must be quantifiable. Statistics are created when data are organized into some meaningful measures which represent some part of reality. Examples of statistics are: The population of Mozambique was 20.366.795 according to the 2007 census. That same census indicated that the population of Nampula was 3.767.114. From the census, one could calculate the percentage of the population living in the province.
DATA
March 2009 4Introduction to Agriculture Statisitics
General Data Dissemination System, II World Bank
An Introduction to Agriculture Statistics, April 2009, Boyko and Hill Page 6
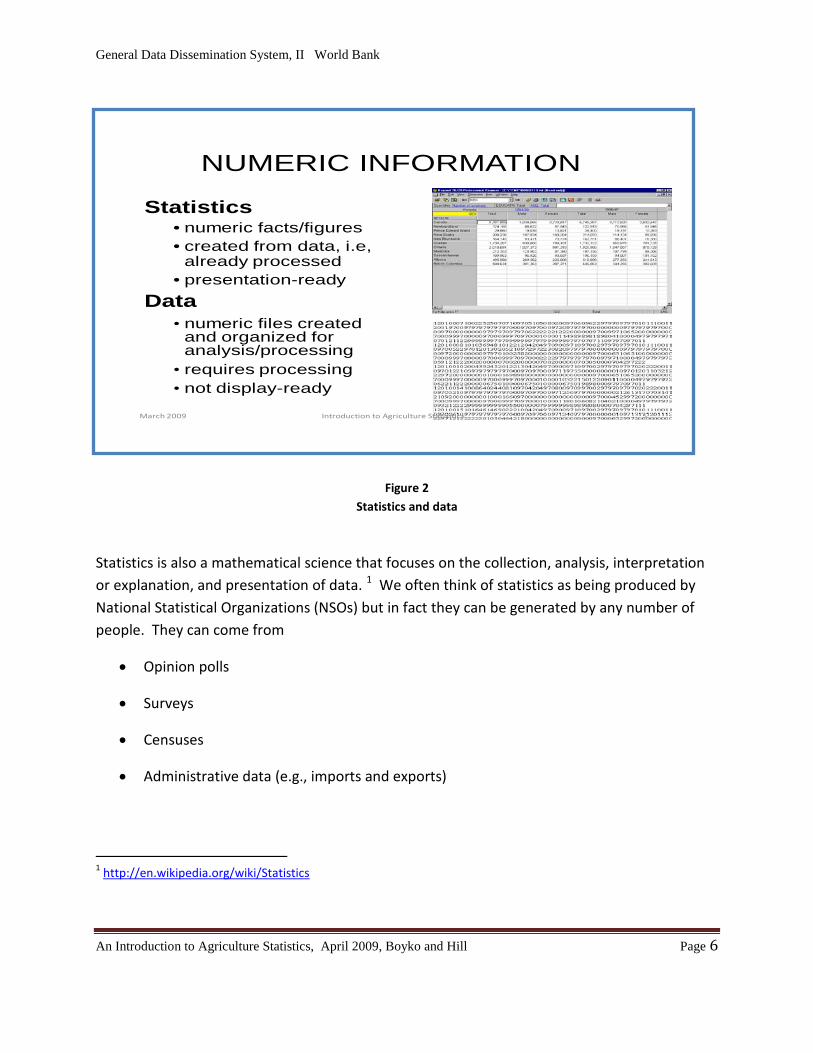
Figure 2 Statistics and data
Statistics is also a mathematical science that focuses on the collection, analysis, interpretation or explanation, and presentation of data. 1
• Opinion polls
We often think of statistics as being produced by National Statistical Organizations (NSOs) but in fact they can be generated by any number of people. They can come from
• Surveys
• Censuses
• Administrative data (e.g., imports and exports)
1 http://en.wikipedia.org/wiki/Statistics
NUMERIC INFORMATION
Statistics• numeric facts/figures • created from data, i.e,
already processed• presentation-ready
Data• numeric files created
and organized for analysis/processing
• requires processing• not display-ready
March 2009 5Introduction to Agriculture Statisitics
General Data Dissemination System, II World Bank
An Introduction to Agriculture Statistics, April 2009, Boyko and Hill Page 7
This leads us to distinguish between official and non-official statistics.
What are “official statistics”?
“Official statistics are collected by government to inform debate, decision-making and research both within government and by the wider community
They provide an objective perspective of the changes taking place in national life and allow comparisons between periods of time and geographical areas.
Reliable social and economic statistics are fundamental to open government (and) it is the responsibility of government to provide them and to maintain public confidence in them.
Open access to official statistics provides the citizen with more than a picture of society. It offers a window on the work and performance of government itself, showing the scale of government activity in every area of public policy and allowing the impact of public policies and actions to be assessed.”2
Official statistics are created by trusted public institutions in order to support government and other operations and decision processes.
“Official statistics result from the collection and processing of data into statistical information by the government institution responsible for that subject-matter domain. They are then disseminated to stakeholders and the general public. Statistical information allows users to draw a relevant, reliable and accurate picture of the development of the country, compare differences between countries and changes over time. They enable stakeholders and decision makers to be well informed and develop policies for addressing actual development challenges.”3
Official statistics are created by NSOs. Just to clarify, in Mozambique, INE (Mozambique Instituto Nacional de Estatística) is the NSO. They have delegated the task of producing
2 United Kingdom White Paper on Open Government ,July 1993
3 http://en.wikipedia.org/wiki/Official_statistics
General Data Dissemination System, II World Bank
An Introduction to Agriculture Statistics, April 2009, Boyko and Hill Page 8
agriculture statistics to the Mozambique Ministry of Agriculture (MINAG). Thus, MINAG is the producer of official statistics for agriculture.
Statistics are desired by decision-makers because they are the basis for creating information about things. Information is created through the issue-oriented manipulation of statistics and other information.
“Information (in information processing) refers to knowledge concerning objects, such as facts, events, things, processes, or ideas, including concepts that within a certain context, has a particular meaning.”4
The bottom line is the fact that countries such as Mozambique as well as international partners have a number of groups/organizations/individuals who wish to make decisions to do with their work. This is the reason that statistics are important. And as will be seen, agriculture statistics are of particular importance because they have to do with food production and a source of income for a large percentage of the population.
4 ISO/IEC 2382-1; 1992 - Economic Commission for Europe of the United Nations (UNECE), "Terminology on Statistical Metadata", Conference of European Statisticians Statistical Standards and Studies, No. 53, Geneva, 2000. See page 22 in http://www.unece.org/stats/publications/53metadaterminology.pdf
General Data Dissemination System, II World Bank
An Introduction to Agriculture Statistics, April 2009, Boyko and Hill Page 9
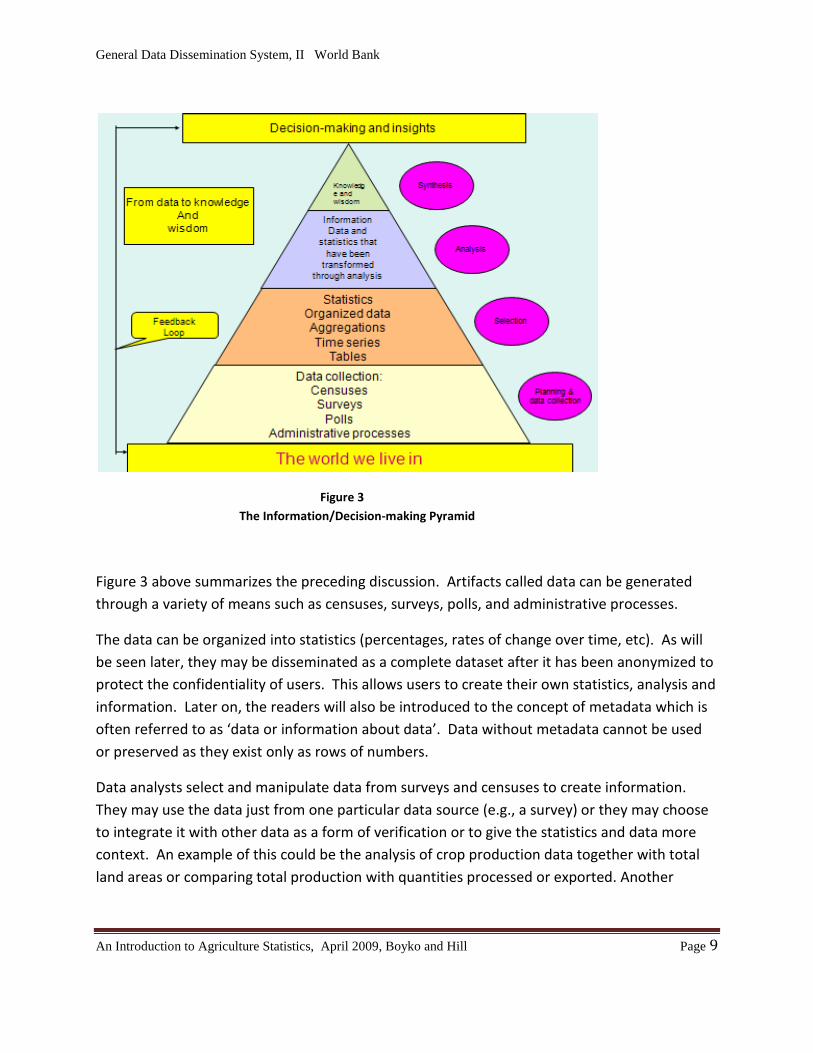
Figure 3 The Information/Decision-making Pyramid
Figure 3 above summarizes the preceding discussion. Artifacts called data can be generated through a variety of means such as censuses, surveys, polls, and administrative processes.
The data can be organized into statistics (percentages, rates of change over time, etc). As will be seen later, they may be disseminated as a complete dataset after it has been anonymized to protect the confidentiality of users. This allows users to create their own statistics, analysis and information. Later on, the readers will also be introduced to the concept of metadata which is often referred to as ‘data or information about data’. Data without metadata cannot be used or preserved as they exist only as rows of numbers.
Data analysts select and manipulate data from surveys and censuses to create information. They may use the data just from one particular data source (e.g., a survey) or they may choose to integrate it with other data as a form of verification or to give the statistics and data more context. An example of this could be the analysis of crop production data together with total land areas or comparing total production with quantities processed or exported. Another
General Data Dissemination System, II World Bank
An Introduction to Agriculture Statistics, April 2009, Boyko and Hill Page 10
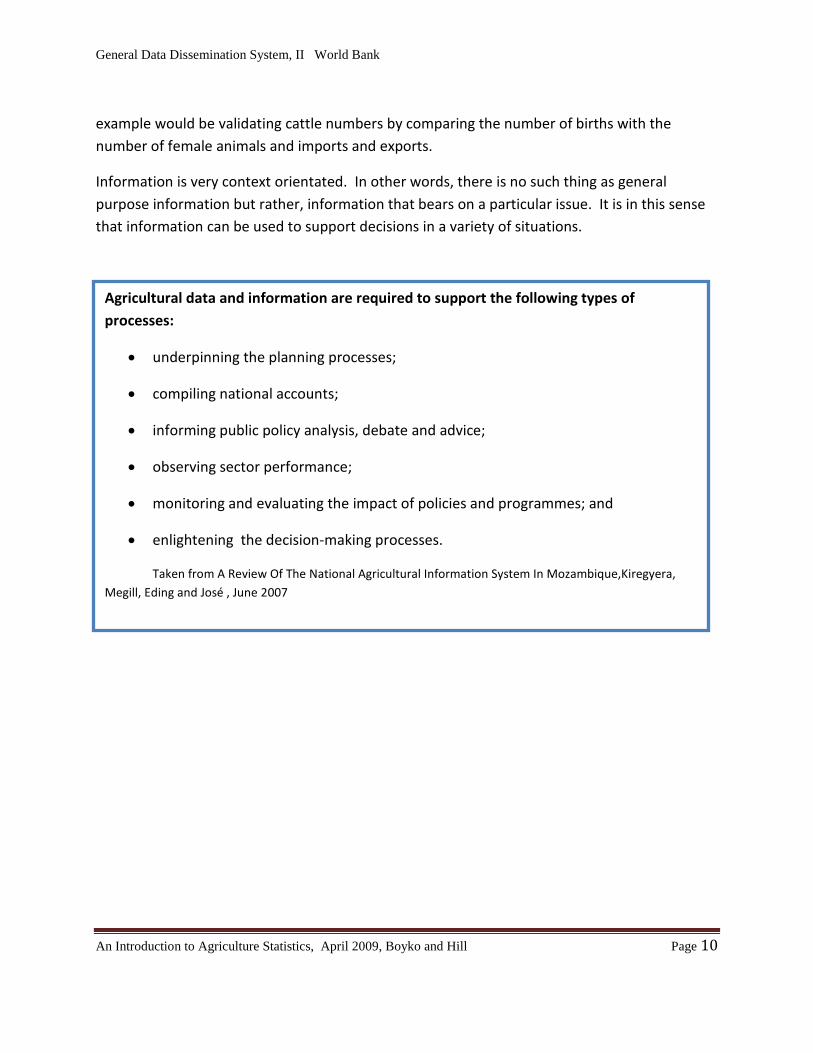
example would be validating cattle numbers by comparing the number of births with the number of female animals and imports and exports.
Information is very context orientated. In other words, there is no such thing as general purpose information but rather, information that bears on a particular issue. It is in this sense that information can be used to support decisions in a variety of situations.
Agricultural data and information are required to support the following types of processes:
• underpinning the planning processes;
• compiling national accounts;
• informing public policy analysis, debate and advice;
• observing sector performance;
• monitoring and evaluating the impact of policies and programmes; and
• enlightening the decision-making processes.
Taken from A Review Of The National Agricultural Information System In Mozambique,Kiregyera, Megill, Eding and José , June 2007
General Data Dissemination System, II World Bank
An Introduction to Agriculture Statistics, April 2009, Boyko and Hill Page 11
Examples of agriculture development objectives
• Improving food supply (cereals, cashew nut, sugar, cotton)
• Improving seeds
• Providing access to fertilizer
• Monitoring and controlling pests of basic crops and reducing animal mortality
Adapted from a presentation by Destina Uinge, Mozambique, Minimal Statistical Plan, INE 2002
General Data Dissemination System, II World Bank
An Introduction to Agriculture Statistics, April 2009, Boyko and Hill Page 12
Chapter 2: Major Users of Agriculture Statistics in Mozambique
Introduction As has already been mentioned, statistics are produced and valued because they help decision makers and program managers make decisions and evaluate progress. It is these needs that must be kept in mind when planning and designing agriculture surveys. Accordingly, it would be useful to spend some time identifying the key users of agriculture statistics. For interested readers of this text, these notes should be viewed along with the presentations that were made by Dr. Rafael Uaiene, Monica Maqaua and Dr. Domingos Diogo. Following are brief descriptions of various programs that are major users of statistics from agriculture as well as other areas.
PROAGRI Phase II
This is a multi donor program which is continuing to provide support to the Ministry of Agriculture for the implementation of Mozambique's national program for agricultural development (known as PROAGRI). The objective of PROAGRI is to contribute to poverty reduction and improved food security by: supporting farmers in accessing seeds, fertilizers, tools, and markets to sell their products; stimulating the development of agro-industries for domestic and export markets; and promoting sustainable natural resources management and conservation.
The ability of the Mozambique government and its partners to be able to make statements such as “In 2006, agricultural production was increased by 10.4 percent over 2005.” depends on having good quality statistics.
PARPA II
”1.The Government of Mozambique’s Action Plan for the Reduction of Absolute Poverty for 2006-09 (PARPA II) is intended to reduce the incidence of poverty from 54 percent in 2003 to 45 percent in 2009. 2. This document is a successor to PARPA I (Government of Mozambique, 2001). It shares the same priorities in the areas of human capital development through education and health, improved governance, development of basic infrastructures and agriculture, rural development, and better macroeconomic and financial management. 3. This PARPA differs from the previous one in that its priorities include greater integration of the national economy and an increase in productivity. In particular, it focuses attention on district-based development, creation of an environment favorable
General Data Dissemination System, II World Bank
An Introduction to Agriculture Statistics, April 2009, Boyko and Hill Page 13
to growth of the nation’s productive sector, improvement of the financial system, measures to help small and medium-size companies to flourish in the formal sector, and the development of both the internal revenue collection system and the methods of allocating budgeted funds.”5
The objectives of PARPA II extend well beyond agriculture but once again, one can observe specific objectives for which statistics are required.
MDG: The Millennium Development Goals
The MDG is a United Nations initiative.
“The MDGs represent a global partnership that has grown from the commitments and targets established at the world summits of the 1990s. Responding to the world's main development challenges and to the calls of civil society, the MDGs promote poverty reduction, education, maternal health, gender equality, and aim at combating child mortality, AIDS and other diseases.”6
For Mozambique, this program is integrated with PARPA II
“The second national poverty reduction strategy developed by the Government of Mozambique, known by its Portuguese acronym as PARPA II (2006-2009), (Mozambique’s PRSP), sets time-bound targets in line with the Millennium Development Goals (MDGs). Mozambique is also grappling with the rapidly evolving aid environment, with increased alignment of donor activity centred on the PARPA and a move towards direct budget support and sector-wide approaches, with all significant funding for a given sector supporting one policy and expenditure programme across the sector.”7
The issues of poverty and agriculture are closely related as such a high proportion of the population lives in rural areas and have some attachment to the production of food.
5 IMF, International Monetary Fund, see www.imf.org/external/pubs/ft/scr/2007/cr0737.pdf
6 United Nations, United Nations Development Program, see http://www.undp.org/mdg/
7 MDG monitor, United Nations, see http://www.mdgmonitor.org/factsheets_00.cfm?c=MOZ
General Data Dissemination System, II World Bank
An Introduction to Agriculture Statistics, April 2009, Boyko and Hill Page 14
The National Accounts
One of the major and immediate users of virtually all of the statistics produced by agriculture is what is referred to as the National Accounts which are put together by INE. One often sees reference to such measures such as the Gross Domestic Product and the percentage of it that comes from agriculture. For example, consider the following quote:
“Agriculture is important for all the countries of Africa and especially for the countries represented here. It accounts for up to 50 per cent of Gross Domestic Product, provides a livelihood for as much as 80 per cent of the population, produces most of the food we eat and also generates foreign exchange. And yet, in many countries agriculture is in something of a crisis. If Africa is to meet the challenge of the Millennium Development Goals, reduce poverty and improve the welfare of our population, then it is essential that there is sustained growth in agricultural output and productivity. Simply because of the numbers of people involved, we will not be able to reduce poverty unless we can increase agricultural incomes and this is true of Mozambique and all the other countries represented here.”8
Gross Domestic Product (GDP) is one of the measures that are part of the System of National Accounts (SNA). In general terms, it is a measure of the gross income of a country. According to data from 2005, agriculture accounts for 23% of the Mozambique economy.
“The System of National Accounts consists of an integrated set of macroeconomic accounts, balance sheets and tables based on internationally agreed concepts, definitions, classifications and accounting rules. Together, these principles provide a comprehensive accounting framework within which economic data can be compiled and presented in a format that is designed for purposes of economic analysis, decision-taking and policy-making.”9
The SNA10
8 Dr. João Loureiro, President, INE, Opening address to the GDDS II launch seminar, Maptuo, March, 2007
is a conceptual international classification coordinated by the United Nations that sets out the standard for the measurement of the market economy in countries. Each country decides how much of the 1993 SNA standard they can implement. This decision hinges on how
9 The United Nations Statistics Division, UNSD, see http://unstats.un.org/unsd/sna1993/introduction.asp
10 Ibid, NSD http://unstats.un.org/unsd/sna1993/toctop.asp
General Data Dissemination System, II World Bank
An Introduction to Agriculture Statistics, April 2009, Boyko and Hill Page 15
many of the statistical indicators they can consistently produce for the various sectors of the economy. It is important for the Economics Directorate understand the specific requirements of INE for calculating the GDP.
International Agencies
Mozambique and its development partners are major stakeholders in rural and agriculture statistics. There is broad agreement among countries and development organizations to follow what is called Managing for development results (MfDR). This is a management strategy that focuses on using performance information to improve decision-making.
Conclusion As can be seen, the process of producing statistics is very much oriented towards the use of information. The manner in which the needs of these and other users are met is through consultation and discussion and by formulating questionnaires and surveys which produce the desired results.
General Data Dissemination System, II World Bank
An Introduction to Agriculture Statistics, April 2009, Boyko and Hill Page 16
Chapter 3: The use of Definitions, Concepts, Classifications and Quality As was mentioned above, Statistics is a mathematical discipline that focuses on the collection, analysis, interpretation or explanation, and presentation of data. As such, there are certain “rules” to be followed. Since Statistics attempt to portray states and activities from the real world, there has to be a process or a method to define an abstraction that can successfully measured. Statisticians develop concepts and definitions to be followed in order to produce consistent measures.
Examples of Concepts
cultivated land (total land under crops)
An agricultural holding
Examples of Definitions
Large farms (e.g. farms with more than 100 head of cattle)
Since all countries usually end up measuring the same types of commodities, it makes sense to use a common list so that everyone is measuring the same thing. These common lists are known as classification systems.
Classifications - Examples
International standard industrial classification
International commodity classifications
International trade classifications
E.g., Harmonized commodity description and coding system (HS)
The use of standards and definitions assures a systematic coverage of the economy and permit international aggregations and comparisons. This is particularly important for analyzing food supplies on a regional basis.
General Data Dissemination System, II World Bank
An Introduction to Agriculture Statistics, April 2009, Boyko and Hill Page 17
For agriculture, many of the concepts and definitions used in the measurement of agriculture activities and production have been developed or vetted by the Food and Agriculture Organization (FAO) in Rome. See http://www.fao.org/ . This work has been adapted to the agriculture of different continents. An example of this is the work done by the FAO African Commission on Agricultural Statistics. See http://www.fao.org/es/ESS/meetings/afcas2007.asp
One of the areas that receives a lot of attention from the international agencies is the census of agriculture. The Roundtable Meeting on Programme for the 2010 Round of Censuses of Agriculture was held in Apia, Samoa, 9-13 March 2009. See http://www.fao.org/es/ESS/meetings/census_samoa_03_2009.asp
Statistical Coordination
In most countries, statistics are produced by more than one agency. As we have seen, the case of Mozambique, INE has been designated at the National Statistics Organization (NSO) but the responsibility for agriculture statistics has been delegated to the Ministry of Agriculture (to the Economics Directorate). Legislation which mandates this activity and protects the interests of respondents is a key part of the national statistical system. Censuses must serve a wide variety of stakeholders. The content of the census of population has an impact on the agriculture statistics program as it is the sampling frame that will be used for the census of agriculture and the annual agriculture surveys.
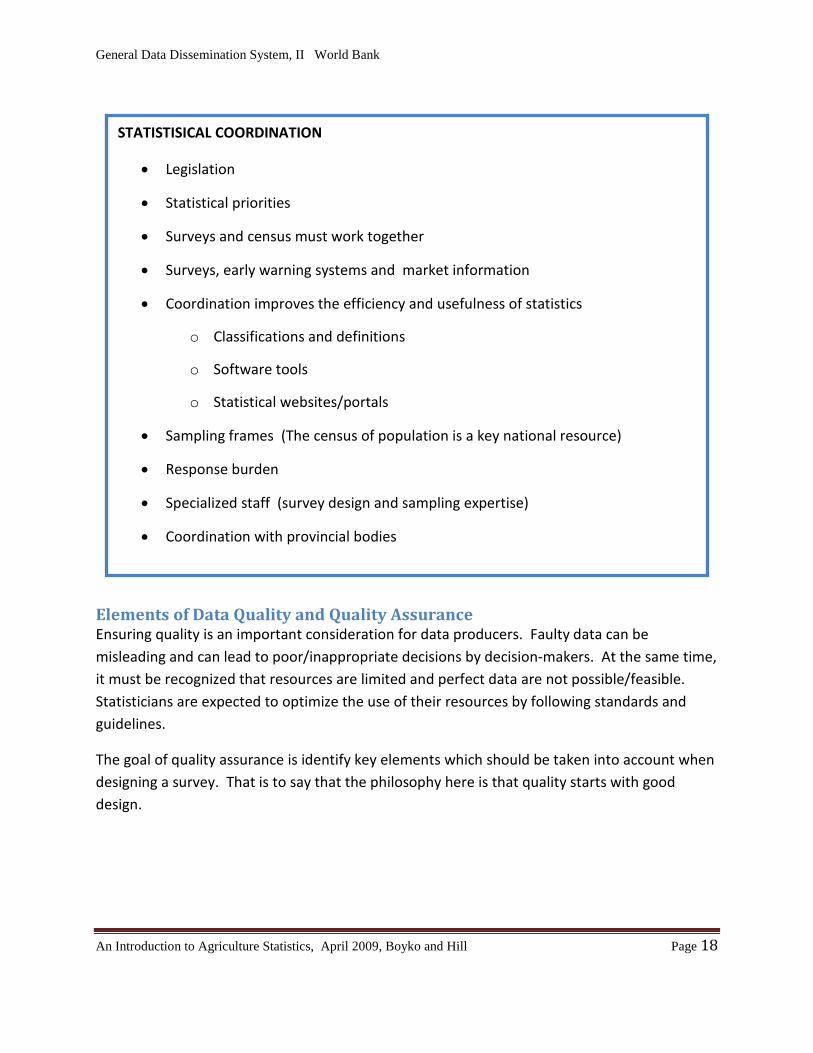
Since INE is responsible for producing the national accounts, it is essential that the task of providing production data for each of the sectors is coordinated to ensure that sectors are neither missed nor double counted. Some of the specific areas requiring coordination are shown below.
General Data Dissemination System, II World Bank
An Introduction to Agriculture Statistics, April 2009, Boyko and Hill Page 18
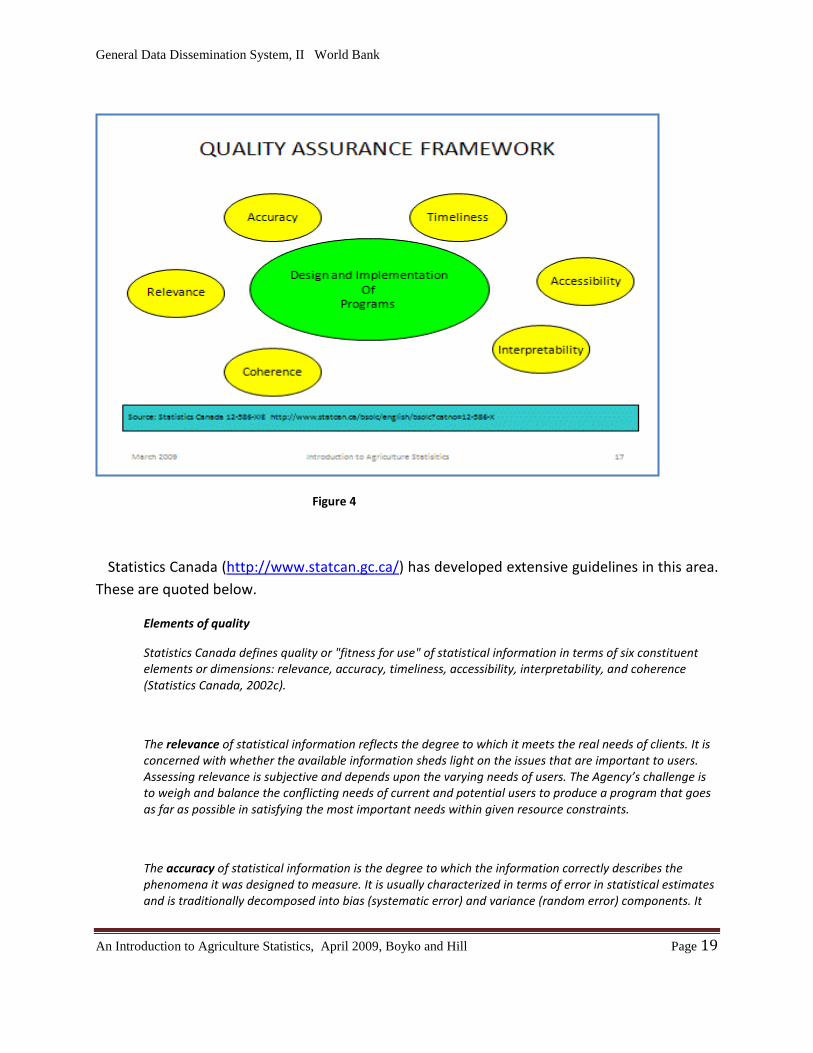
Elements of Data Quality and Quality Assurance Ensuring quality is an important consideration for data producers. Faulty data can be misleading and can lead to poor/inappropriate decisions by decision-makers. At the same time, it must be recognized that resources are limited and perfect data are not possible/feasible. Statisticians are expected to optimize the use of their resources by following standards and guidelines.
The goal of quality assurance is identify key elements which should be taken into account when designing a survey. That is to say that the philosophy here is that quality starts with good design.
STATISTISICAL COORDINATION
• Legislation
• Statistical priorities
• Surveys and census must work together
• Surveys, early warning systems and market information
• Coordination improves the efficiency and usefulness of statistics
o Classifications and definitions
o Software tools
o Statistical websites/portals
• Sampling frames (The census of population is a key national resource)
• Response burden
• Specialized staff (survey design and sampling expertise)
• Coordination with provincial bodies
General Data Dissemination System, II World Bank
An Introduction to Agriculture Statistics, April 2009, Boyko and Hill Page 19
Figure 4
Statistics Canada (http://www.statcan.gc.ca/) has developed extensive guidelines in this area. These are quoted below.
Elements of quality
Statistics Canada defines quality or "fitness for use" of statistical information in terms of six constituent elements or dimensions: relevance, accuracy, timeliness, accessibility, interpretability, and coherence (Statistics Canada, 2002c).
The relevance of statistical information reflects the degree to which it meets the real needs of clients. It is concerned with whether the available information sheds light on the issues that are important to users. Assessing relevance is subjective and depends upon the varying needs of users. The Agency’s challenge is to weigh and balance the conflicting needs of current and potential users to produce a program that goes as far as possible in satisfying the most important needs within given resource constraints.
The accuracy of statistical information is the degree to which the information correctly describes the phenomena it was designed to measure. It is usually characterized in terms of error in statistical estimates and is traditionally decomposed into bias (systematic error) and variance (random error) components. It
General Data Dissemination System, II World Bank
An Introduction to Agriculture Statistics, April 2009, Boyko and Hill Page 20
may also be described in terms of the major sources of error that potentially cause inaccuracy (e.g., coverage, sampling, nonresponse, response).
The timeliness of statistical information refers to the delay between the reference point (or the end of the reference period) to which the information pertains, and the date on which the information becomes available. It is typically involved in a trade-off against accuracy. The timeliness of information will influence its relevance.
The accessibility of statistical information refers to the ease with which it can be obtained from the Agency. This includes the ease with which the existence of information can be ascertained, as well as the suitability of the form or medium through which the information can be accessed. The cost of the information may also be an aspect of accessibility for some users.
The interpretability of statistical information reflects the availability of the supplementary information and metadata necessary to interpret and utilize it appropriately. This information normally includes the underlying concepts, variables and classifications used, the methodology of data collection and processing, and indications or measures of the accuracy of the statistical information.
The coherence of statistical information reflects the degree to which it can be successfully brought together with other statistical information within a broad analytic framework and over time. The use of standard concepts, classifications and target populations promotes coherence, as does the use of common methodology across surveys. Coherence does not necessarily imply full numerical consistency.
These dimensions of quality are overlapping and interrelated. There is no general model that brings them together to optimize or to prescribe a level of quality. Achieving an acceptable level of quality is the result of addressing, managing and balancing these elements of quality over time with careful attention to program objectives, costs, respondent burden and other factors that may affect information quality or user expectations. This balance is a critical aspect of the design of the Agency's surveys.11
Quality control (QC) is used to measure actual performance, compare it to standards and act on the differences.12
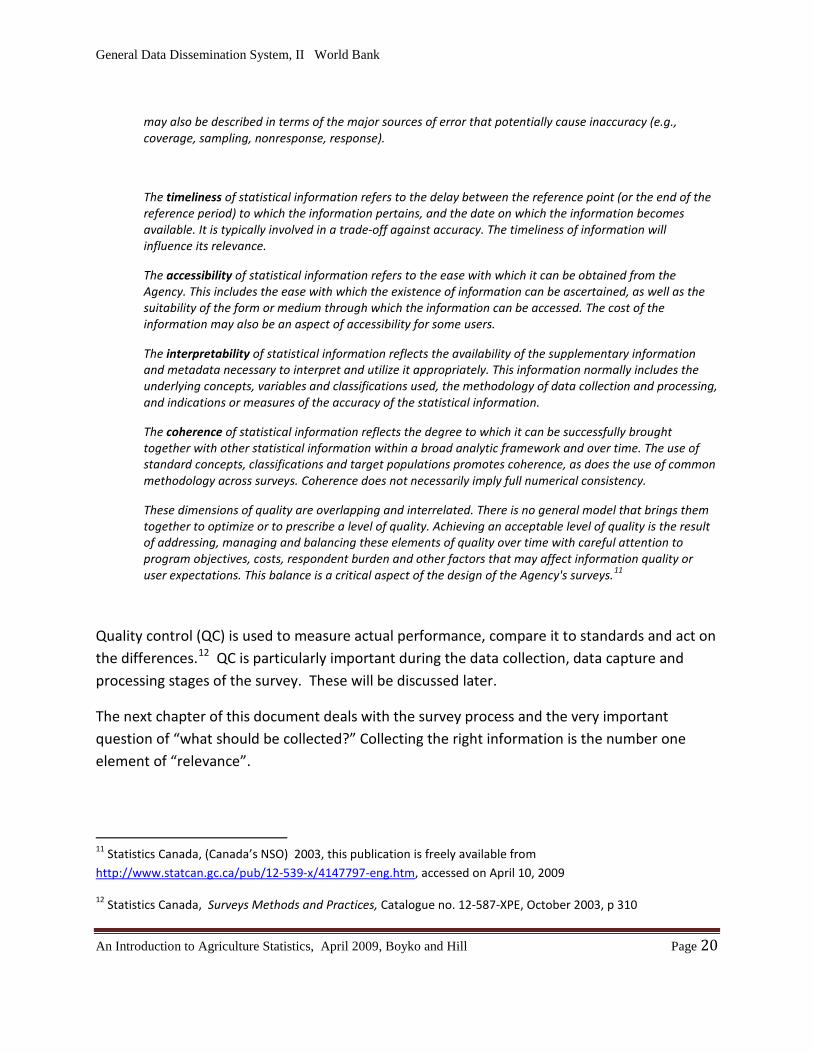
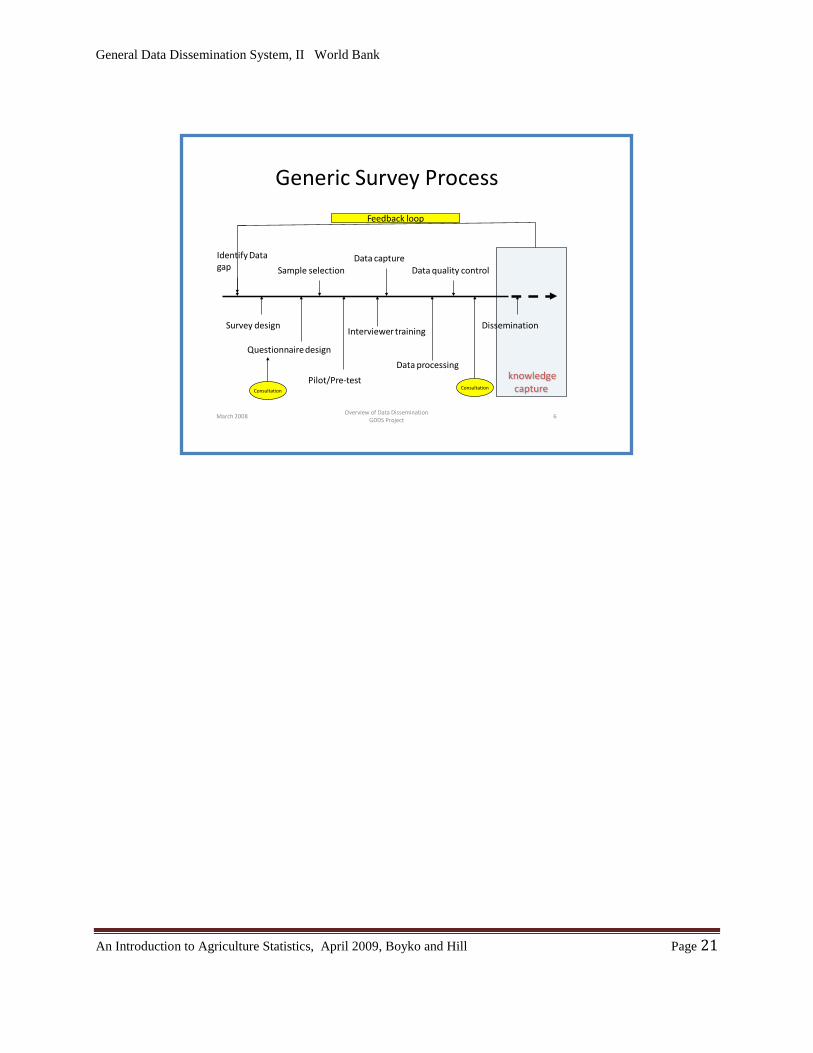
The next chapter of this document deals with the survey process and the very important question of “what should be collected?” Collecting the right information is the number one element of “relevance”.
QC is particularly important during the data collection, data capture and processing stages of the survey. These will be discussed later.
11 Statistics Canada, (Canada’s NSO) 2003, this publication is freely available from http://www.statcan.gc.ca/pub/12-539-x/4147797-eng.htm, accessed on April 10, 2009
12 Statistics Canada, Surveys Methods and Practices, Catalogue no. 12-587-XPE, October 2003, p 310
General Data Dissemination System, II World Bank
An Introduction to Agriculture Statistics, April 2009, Boyko and Hill Page 21
March 2008Overview of Data Dissemination
GDDS Project6
knowledgecapture
Generic Survey Process
Survey design
Identify Data gap Sample selection
Questionnaire design
Pilot/Pre-test
Interviewer training
Data processing
Data quality control
Dissemination
Data capture
Feedback loop
Consultation Consultation
General Data Dissemination System, II World Bank
An Introduction to Agriculture Statistics, April 2009, Boyko and Hill Page 22
Chapter 4: The Survey Process
Introduction This section provides a general overview of the components of the survey system
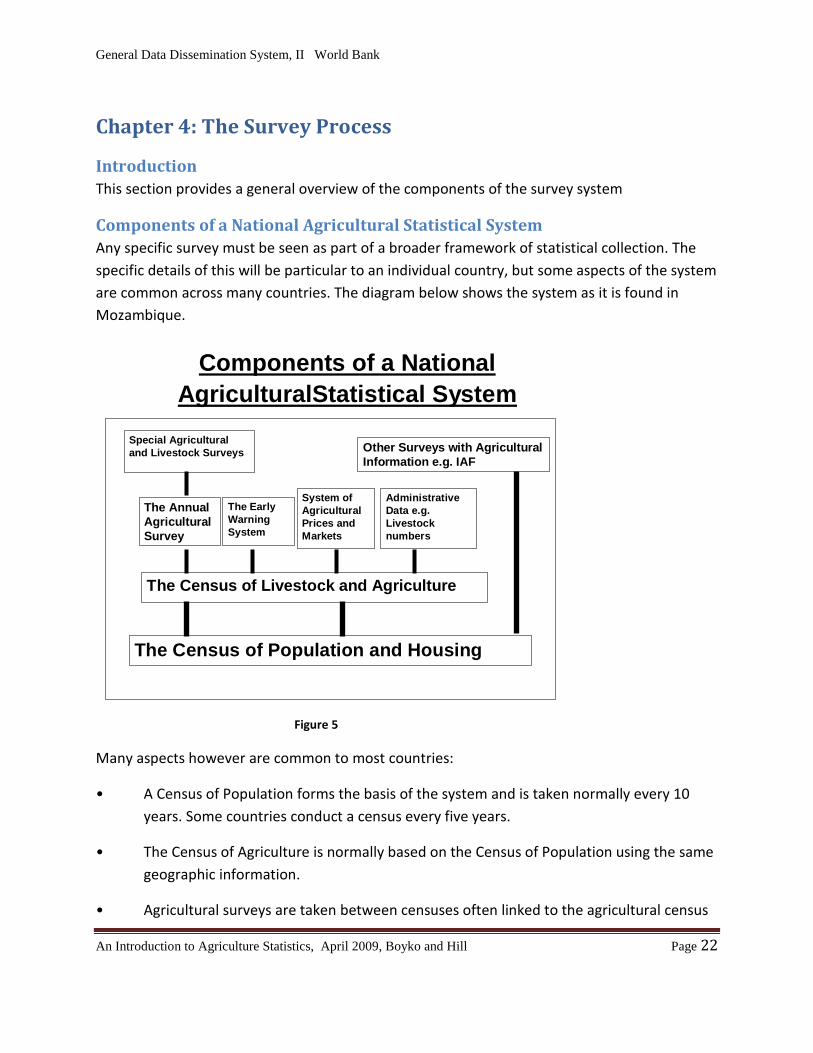
Components of a National Agricultural Statistical System Any specific survey must be seen as part of a broader framework of statistical collection. The specific details of this will be particular to an individual country, but some aspects of the system are common across many countries. The diagram below shows the system as it is found in Mozambique.
Components of a National AgriculturalStatistical System
The Census of Population and Housing
The Census of Livestock and Agriculture
The Annual Agricultural Survey
The Early Warning System
System of Agricultural Prices and Markets
Special Agricultural and Livestock Surveys
Administrative Data e.g. Livestock numbers
Other Surveys with Agricultural Information e.g. IAF
Figure 5
Many aspects however are common to most countries:
• A Census of Population forms the basis of the system and is taken normally every 10 years. Some countries conduct a census every five years.
• The Census of Agriculture is normally based on the Census of Population using the same geographic information.
• Agricultural surveys are taken between censuses often linked to the agricultural census
General Data Dissemination System, II World Bank
An Introduction to Agriculture Statistics, April 2009, Boyko and Hill Page 23
• There are regular collections of administrative data, such as livestock numbers and trade data
• There is price information that may be specifically related to agricultural products
• Early warning systems are normally only found in countries with food security risks, but other countries may also undertake crop forecasting exercises
• Special agricultural surveys may be undertaken.
• Other surveys such as Household Budget Surveys will also provide agricultural information
The Stages of the Survey Process The statistical survey can be considered to fall into three parts all of which will be discussed in this paper
• Planning and Design Phase
• Implementation and Analysis
• Dissemination and Archiving and Evaluation
Planning and Design Phase The planning and design phase of a survey is critical to its success. Often this phase is not given sufficient attention. Four elements will be covered:
• Formulation of the statement of objectives;
• Selection of a survey frame;
• Determination of the sample design;
• Questionnaire design
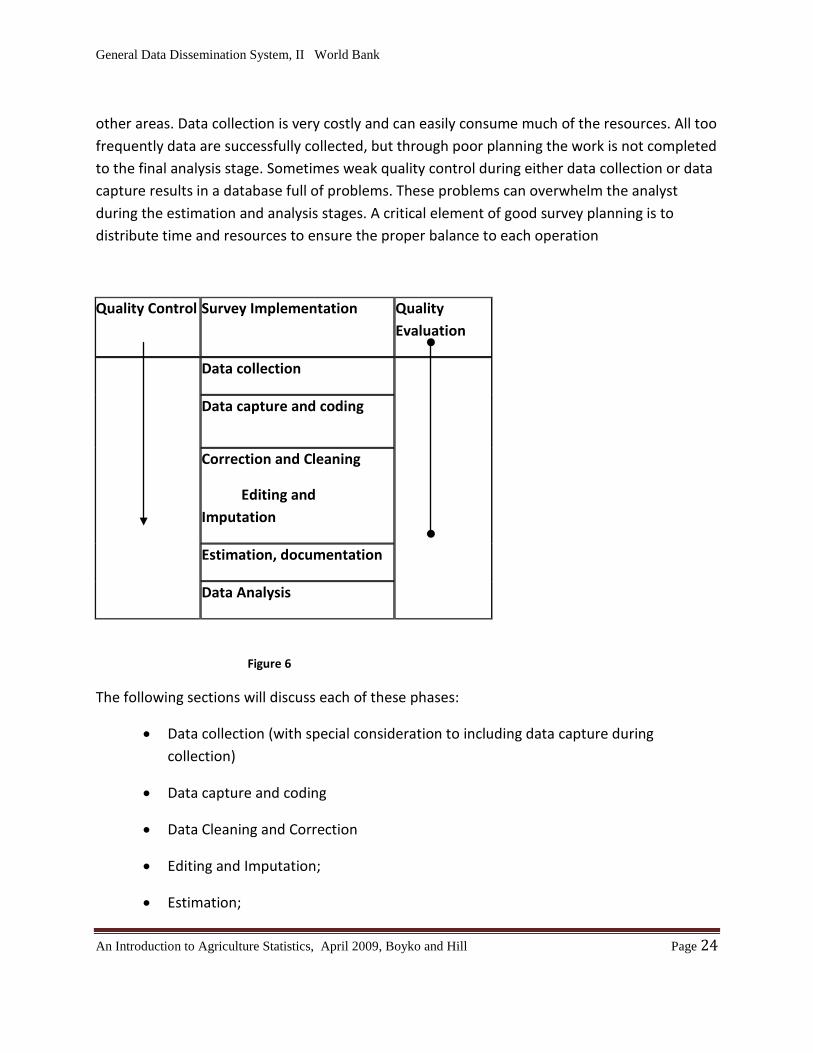
Implementation and Analysis The implementation and analysis phase is the core of the survey process. The stages of this phase are shown in the diagram below. Quality control needs to take place at all stages during every operation. All too often some stages in this phase receive attention to the neglect of
General Data Dissemination System, II World Bank
An Introduction to Agriculture Statistics, April 2009, Boyko and Hill Page 24
other areas. Data collection is very costly and can easily consume much of the resources. All too frequently data are successfully collected, but through poor planning the work is not completed to the final analysis stage. Sometimes weak quality control during either data collection or data capture results in a database full of problems. These problems can overwhelm the analyst during the estimation and analysis stages. A critical element of good survey planning is to distribute time and resources to ensure the proper balance to each operation
Quality Control Survey Implementation Quality Evaluation
Data collection
Data capture and coding
Correction and Cleaning
Editing and Imputation
Estimation, documentation
Data Analysis
Figure 6
The following sections will discuss each of these phases:
• Data collection (with special consideration to including data capture during collection)
• Data capture and coding
• Data Cleaning and Correction
• Editing and Imputation;
• Estimation;
General Data Dissemination System, II World Bank
An Introduction to Agriculture Statistics, April 2009, Boyko and Hill Page 25
• Data documentation
• Data analysis and presentation of survey results
The topics of Quality Assurance and Quality Control are important elements in any well designed survey programme. As this is a basic overview of surveys this topics will only be cover slightly in the discussion.
Dissemination and Archiving Four activities are identified as representing the third phase of the survey programme
• Data dissemination;
• Evaluation;
• Archiving
Once a survey has been completed the results of the survey need to the disseminated and archived. This phase is often seriously neglected. If the data collected are not analysed and disseminated, then all the resources expended on the collection will have been wasted.
Documentation and archiving of the survey are equally important. The value of statistical information can be greatly enhanced by ongoing use and further analysis. This additional use is very difficult without proper documentation. The database needs to be properly documented and archived not only for further use, but also to allow future survey takers to learn from the results of previous surveys and improve on them.
Evaluation is an extremely variable activity. National Censuses in developed countries have been subjected to a multitude of different techniques of evaluation into all their aspects. On the other hand even a small scale survey should be subject to some degree of critical assessment.
What is the Survey Frame? The survey frame is all units that are covered by a census or survey. Three factors need to be considered in defining the frame.
• What is the unit of observation?
• What is the coverage?
• What is the scope?
General Data Dissemination System, II World Bank
An Introduction to Agriculture Statistics, April 2009, Boyko and Hill Page 26
The unit of observation A number of different types of units are typically used in surveys. These include entities such as persons, households, business establishments, agricultural holdings, and institutions. Surveys typically include more than one type of unit. Where there is more than one type of unit the different types of units are linked. In some surveys more than one type of unit may be included as a unit of observation. Normally one type of unit is the key unit that defines the frame.
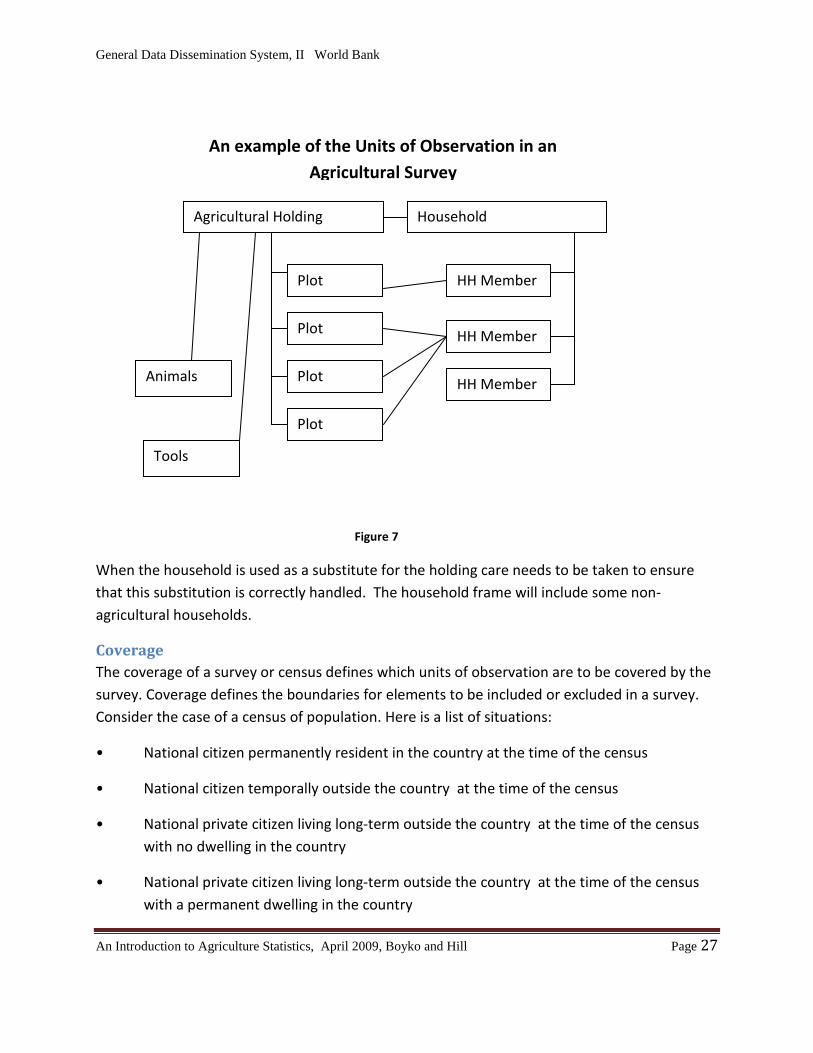
In the case of agricultural surveys the standard key unit of observation is the agricultural holding. All the other units of observation are linked to holding and all the information collected can be direction or indirectly linked to the holding. In practice in many agricultural surveys in African countries, the household is used as a proxy for the holding, particularly in the case of small holdings. In this situation, the household defines the frame. Often there are two separate frames:
• A frame of large holdings defined using a list of these holdings and
• A household frame to cover all small or medium holdings
Diagram 7 below provides an illustration of the link between the holding and other units of observation
General Data Dissemination System, II World Bank
An Introduction to Agriculture Statistics, April 2009, Boyko and Hill Page 27
Figure 7
When the household is used as a substitute for the holding care needs to be taken to ensure that this substitution is correctly handled. The household frame will include some non-agricultural households.
Coverage The coverage of a survey or census defines which units of observation are to be covered by the survey. Coverage defines the boundaries for elements to be included or excluded in a survey. Consider the case of a census of population. Here is a list of situations:
• National citizen permanently resident in the country at the time of the census
• National citizen temporally outside the country at the time of the census
• National private citizen living long-term outside the country at the time of the census with no dwelling in the country
• National private citizen living long-term outside the country at the time of the census with a permanent dwelling in the country
Plot HH Member
HH Member
HH Member
Plot
Plot
Plot
Animals
Household Agricultural Holding
An example of the Units of Observation in an Agricultural Survey
Tools
General Data Dissemination System, II World Bank
An Introduction to Agriculture Statistics, April 2009, Boyko and Hill Page 28
• National citizen employed at an embassy living long-term outside the country at the time of the census
• Foreign citizen who is a permanent resident and in the country at the time of the census
• Foreign citizen who is a temporary visitor
Who should be covered in the census of population?
Similar issues occur in the case of agriculture.
• What is the minimum level of activity needed to define a holding?
• Should this be the same in urban and rural areas?
• Should some city areas be excluded?
• How do you cover situations where the household and holding are physically separated?
The Scope of the Survey The final element to be considered related to the frame of a survey is a determination of the scope of the topic to be surveyed. This is very important in the case of agriculture. There are international definitions of economic activities that can assist in defining a survey’s scope. On the other hand the definition of a surveys scope must also depend upon the objectives of the survey that may arise from national interests quite independent of any international usage.
Some of the elements that need to be considered in defining the scope of an agricultural survey are:
•What is a farm? Should this term include:
Fish farming?
Commercial flower growing?
Forestry?
•What activities should be included in farming
Food processing by the farmer?
Sales to consumers by the farmer?
General Data Dissemination System, II World Bank
An Introduction to Agriculture Statistics, April 2009, Boyko and Hill Page 29
Hunting and gathering by farmers?
Collecting wood?
Collecting of construction materials such as cane, thatch, and coconut fronds?
All productive activities by farming households?
General Data Dissemination System, II World Bank
An Introduction to Agriculture Statistics, April 2009, Boyko and Hill Page 30
Chapter 5: Questionnaire Design
Introduction A well designed questionnaire is essential to the success of a survey. A poorly designed questionnaire results in many survey errors that could have been avoided. Sometimes questions and even complete questionnaires have proved to be unusable. Attention to the issues addressed below will help reduce these problems. There are excellent questionnaires. The questionnaire designer should never by hesitant to copy the good work of others. There are many examples of excellent questionnaires from which countries can draw.
There are however situations when even expert questionnaire designers find themselves constrained by circumstances. Sometimes the survey specialist wished to collect information that is very difficult or costly to collect. Due to limited time and resources shortcuts may have to be taken. One or a few questions may be asked when many are needed to fully elucidate a topic. There may be only one or a limited number of visits when many are needed. Designing a questionnaire or set of linked questionnaires is an art. Length is also an issue. Some of the best designed questionnaires have suffered from being overly long.
The Process of Questionnaire Development
Consultation Before undertaking a survey, the survey taker should carefully define the survey objectives and consult with users concerning the information needs. Many surveys are part of some broader system of statistics. A Census of Agriculture for example has it place in the overall scheme of National Statistics. There are also international models for the content of Agricultural Censuses. The consultation process needs to balance these aspects while taking appropriate account of specific national needs.
The survey producer is, however, in the final analysis responsible for the survey. Sometime data users may have specific interests that need to be placed in the broader context of the survey. And the survey specialist is responsible for limiting the total size of the questionnaire.
Questions should have an explicit rationale. No questions should be included in the questionnaire without an explicit rationale. One of the basic methods to rationalize the content of the questionnaire is to produce a tabulation plan. The tabulation plan should be developed together with the questionnaire. If a question is not included in a basic tabulation it should not be asked.
General Data Dissemination System, II World Bank
An Introduction to Agriculture Statistics, April 2009, Boyko and Hill Page 31
The other element in planning the questionnaire content is planning the main areas of analysis. Obviously a well-designed survey with a diversity of objectives can be used for various analytical studies. However it is important to avoid the inclusion of questions of the form “this information might be interesting to know”.
“Do not re-invent the wheel”
When designing a questionnaire consult existing questionnaires covering the same area. A question or set of questions that have been proven to work in another survey are likely to work in the current survey.
Using the same question in different survey facilitate comparisons. This is especially important if the survey is repeated survey. There needs to be a very strong justification for changing the wording of questions from one year to the next within the same programme. It can also be very useful to use the same questions in different survey to facilitate analysis across surveys. .
Considerations in Drafting the Questionnaires Many factors need to be taken into account when designing a questionnaire. These are briefly outlined here:
• Comparability of results with other surveys: One survey is part of a broader system of statistical information. Using the same questions as other surveys strengthens the overall information system.
• Data Reliability: Questions must be designed to facilitate responses. Cross checks between different questions can improve the quality of responses
• Non response: Non response is a major problem in many surveys particularly if many questions are not relevant to respondents. Skips can be included to allow non-relevant questions to be by-passed. Care however needs to be taken to design skips in a way that avoid introducing additional complications
• Interviewers: Questions must be formulated so that they are clearly understood by the interviewer. The questions need to include sufficient wording so that the interviewer can ask a complete question of the respondent. Often interviewers will have to translate the questions
General Data Dissemination System, II World Bank
An Introduction to Agriculture Statistics, April 2009, Boyko and Hill Page 32
into local languages. Too many words should also be avoided. Lots of examples or explanatory notes in a question can also create confusion.
• Data processing: Questionnaires often fail to include elements to assist the data entry process. The codes that will be entered should be organised so that the data entry can proceed easily. Numbers are easier to enter than words. Data entry staff should not have to simultaneously code questions and enter the data
• Administrative requirements; A questionnaire should include elements to facilitate the logistics and administration of the questionnaire. Standard geographic codes, interviewer references and other reference numbers will assist later management of the questionnaire. There is always a risk that questionnaires could fall apart. A code number recorded on every page will help correct this situation.
Review of Questionnaires Questionnaires need to be thoroughly reviewed by persons other than the survey team. Those doing the review should include both those likely to use the data and other independent experts. These independent experts should include both subject matter specialist who can assess the relevance of the content and experts of survey design. Many simple design errors could be avoided if a questionnaire is reviewed by the appropriate experts.
Testing the Questionnaire Questionnaires frequently go into the field without sufficient testing. Essentially two types of testing need to be considered: pre-testing and pilot testing. The objective of pre-testing is to fine tune the questionnaire; the objective of the pilot test are to test the operational procedures. Ideally the questionnaire should have been finalised before the pilot takes place. Here we are only considering the pre-testing of the questionnaire.
Before doing a pre-test it is desirable to undertake some informal testing with experts or possibly some knowledgeable persons from the community of interest. This is a fundamental step in procedures and is easy and inexpensive to do. It is useful for identifying problems with:
• The wording of the question and possibly how these will be worded in the local languages
• The ordering of questions and sections of the questionnaire
• The best form of layout for the questionnaire (Often there is a problem as to whether it is best to use portrait or landscape format)
General Data Dissemination System, II World Bank
An Introduction to Agriculture Statistics, April 2009, Boyko and Hill Page 33
• Which instructions and code list should be included in the questionnaire?
• Is the length of the questionnaire acceptable?
• How are non-response, skips and other structural aspects of the questionnaire to be designed?
The Pre-test The questionnaire testing should be completed with one or more pre-tests. Following are some considerations in designing a pre-test:
• The respondents should cover a cross-section of the survey population
• The size of the samples can be as small as 20 or 30 units
• The respondents should not be members of project team
• There should be feedback through field observation of the test
• The interviewers should be trained experts and should be debriefed after the test to get their perceptions
Types of Questions Statistical surveys serve various different purposes and the questions used can take different forms. Three forms can be identified
• open questions
• open questions with closed responses
• closed questions
Open-ended questions allow respondents to answer in their own words and the complete responses are recorded. Open-ended questions with closed responses allow the respondents to respond in their own words, but the interviewers have a set of responses into which to classify these responses. Closed Questions have a fully pre-coded set of responses.
The advantages and disadvantages of these different question formats will now be considered with some examples from agricultural surveys
General Data Dissemination System, II World Bank
An Introduction to Agriculture Statistics, April 2009, Boyko and Hill Page 34
Difficulties with Fully Open Questions Open-ended questions are very suitable for small scale investigations. Some social surveys include community focus group discussions with open ended questions to supplement more formal household surveys. They can provide information in depth that may no emerge from highly structured interviews. They do however depend a great deal on the interpretive skills of the interviewers.
Open ended questions may also be useful in the development phase of a survey programme allowing the investigator to explore different issue to assist in the design of closed questions.
The difficulty for respondents is that open ended questions are more difficult to answer and can be very time consuming. The difficulties for investigator are that open-ended questions can yield irrelevant answers, they can be time consuming to process, are difficult to interpret with a high risk of bias. Finally they can be difficult to analyze. Open-ended questions should not be used in large scale surveys with a large number of respondents.
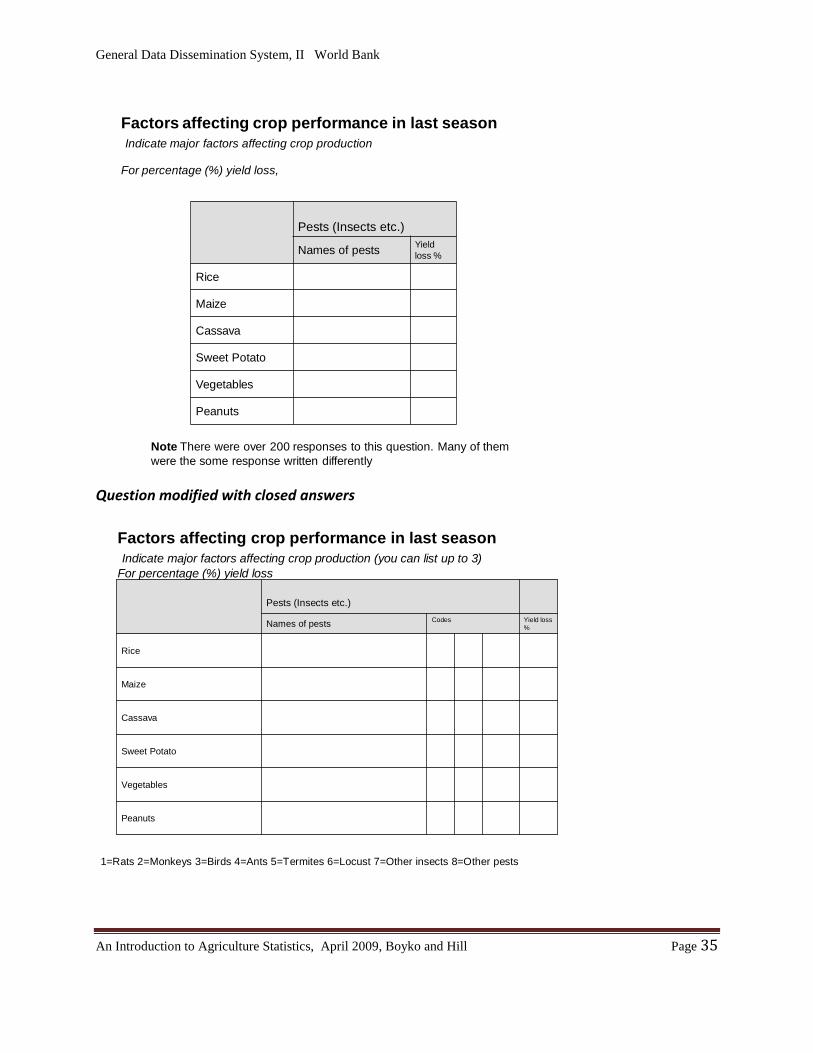
The example below indicates an open-ended question on animal pest used in an agricultural survey in an Africa country. All the open-ended responses were recorded in the survey database. Over 200 hundred different responses were recorded. In many cases essentially the same response was reported in a number of different ways for example; Rats, rats, rat, rodents, rats and mice. Also in some cases the response covered multiple answers for example; birds and rats, rats and monkeys, insects and rats. In fact there were only 8 different pest lists. In some cases two and very rarely three types of pests were listed. This question could have been designed much more efficiently for easy data capture and processing. One possible form of this is given below; an open question with three columns of pre-coded boxes.
Original Open Question
General Data Dissemination System, II World Bank
An Introduction to Agriculture Statistics, April 2009, Boyko and Hill Page 35
Factors affecting crop performance in last season Indicate major factors affecting crop production
For percentage (%) yield loss,
Pests (Insects etc.)
Names of pests Yield loss %
Rice
Maize
Cassava
Sweet Potato
Vegetables
Peanuts
Note There were over 200 responses to this question. Many of them were the some response written differently
Question modified with closed answers
Factors affecting crop performance in last season Indicate major factors affecting crop production (you can list up to 3)
For percentage (%) yield loss
1=Rats 2=Monkeys 3=Birds 4=Ants 5=Termites 6=Locust 7=Other insects 8=Other pests
Peanuts
Vegetables
Sweet Potato
Cassava
Maize
Rice
Yield loss %
CodesNames of pests
Pests (Insects etc.)
General Data Dissemination System, II World Bank
An Introduction to Agriculture Statistics, April 2009, Boyko and Hill Page 36
Advantages and Limitations of Closed Questions In general large scale surveys are typically made up of a set of closed questions. Closed question are fast and easy for the respondent to answer. For the investigator they are cheap and easy to analyse. They provide a clear frame of reference and provide consistent categories. On the other hand closed questions have some limitations. A list of responses can elicit an answer from a respondent when he or she has no opinion or knowledge. It can oversimplify an issue. Answers can be forced into a preset mould presenting an incomplete picture. Closed questions can become boring to answer.
Designing closed questions needs to be undertaken with care. They must be exhaustive including all possible responses. This may be achieved by including an open ended category “other, please specify”. Clearly if too many respondents use this option the designer looses much of the value of using a closed question. The responses must also be mutually exclusive avoiding the possibility that two or more responses could have been given. Attention must also be given to the risk that the order of response may influence the results.
Types of Closed Questions There are a number of different types of closed question:
• Two-choice
• Multiple-choice
• Multiple-response questions
• Checklist
• Ranking
• Rating
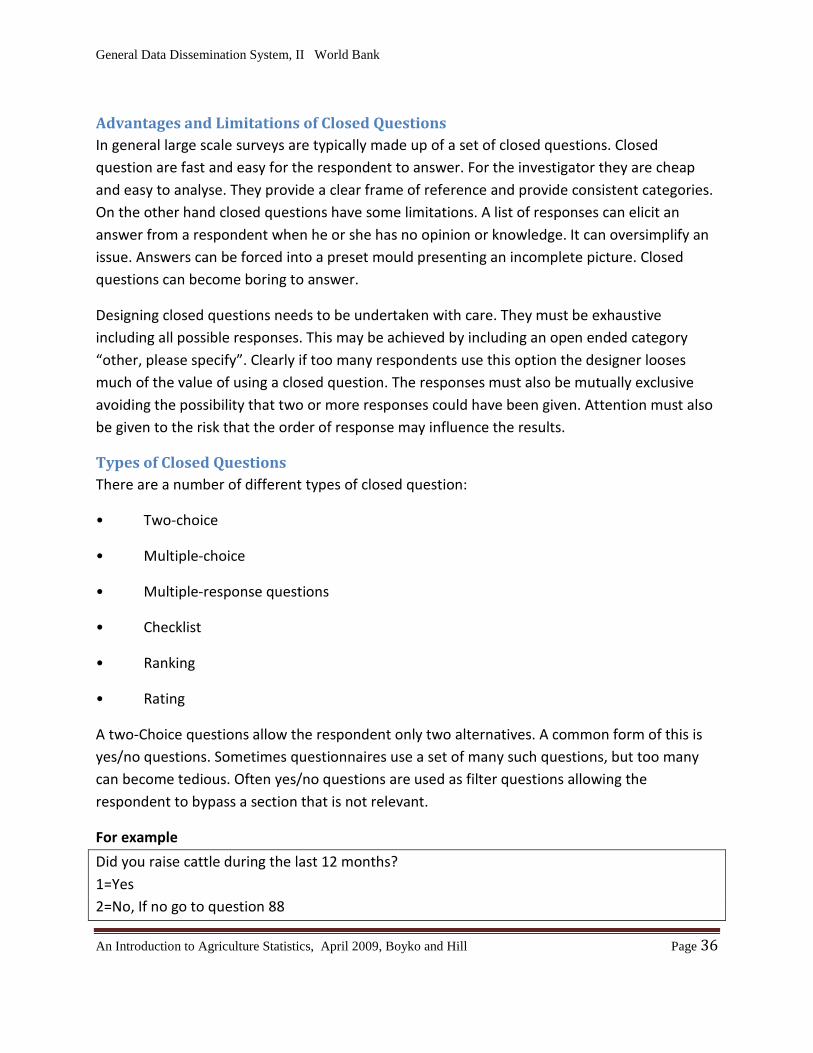
A two-Choice questions allow the respondent only two alternatives. A common form of this is yes/no questions. Sometimes questionnaires use a set of many such questions, but too many can become tedious. Often yes/no questions are used as filter questions allowing the respondent to bypass a section that is not relevant.
For example
Did you raise cattle during the last 12 months? 1=Yes 2=No, If no go to question 88
General Data Dissemination System, II World Bank
An Introduction to Agriculture Statistics, April 2009, Boyko and Hill Page 37
In a multiple choice question the respondents are give several alternatives from which they must make only one response. In this situation the answer categories must be mutually exclusive.
For example
What is your relationship to the head of Household? 1=Head 2=Spouse 3=Son/daughter 4=Brother/sister 5=Parent or parent in law 6=Other relation 7=Not related
Sometimes a multiple response list such as this example allows for many variants. The designer has to make a decision as to how detailed this list should be.
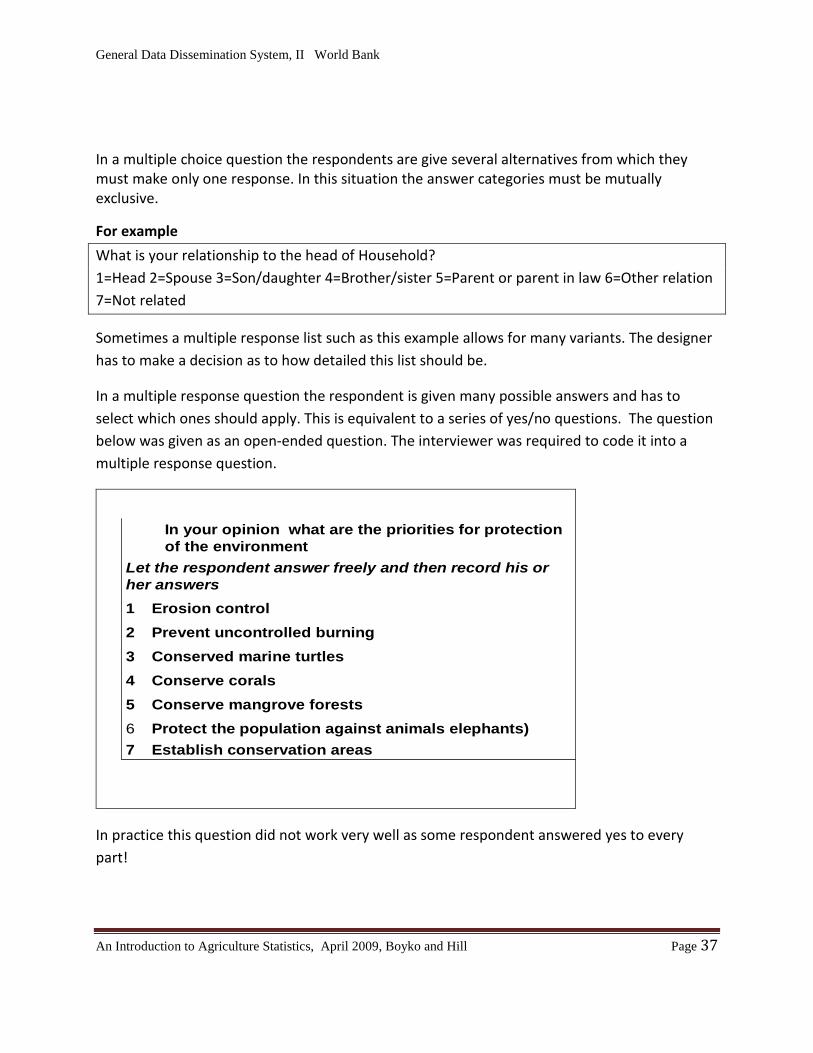
In a multiple response question the respondent is given many possible answers and has to select which ones should apply. This is equivalent to a series of yes/no questions. The question below was given as an open-ended question. The interviewer was required to code it into a multiple response question.
Establish conservation areas7Protect the population against animals elephants)6
Conserve mangrove forests5Conserve corals4Conserved marine turtles3Prevent uncontrolled burning2Erosion control1
Let the respondent answer freely and then record his or her answers
In your opinion what are the priorities for protection of the environment
In practice this question did not work very well as some respondent answered yes to every part!
General Data Dissemination System, II World Bank
An Introduction to Agriculture Statistics, April 2009, Boyko and Hill Page 38
Chapter 6: What Should be Measured in an Agriculture Statistics System?
For statistics to be relevant, they must measure the right things. To determine which statistics should be collected, it is important to look at its objectives of the user community which is being supported and to consider which types of decisions that may need to be made at various levels in the system. It is clear that the reasons we need agriculture is because we need to eat, be clothed and to be able to earn money while doing this things. Thus we end up measuring the stocks and flows under the following headings:
• Crops
• Horticulture and floriculture
• Livestock, poultry and other animals
• Aquaculture (where this is defined as part of the agriculture sector)
• Purchased inputs and investments
• Paid labour
• Equipment and capital stock
• Prices paid and received by farmers
• Other
This information can be gathered by various means (censuses, surveys, marketing information, administrative systems and various household surveys).
The discussion below identifies different levels of need and varying measurement goals. It must be pointed out that it takes time to build a good system of agriculture statistics; one must start slowly and gradually build the system. It is for this reason that different levels of measurement are identified for each of the subject areas.
General Data Dissemination System, II World Bank
An Introduction to Agriculture Statistics, April 2009, Boyko and Hill Page 39
Crop Statistics Objective: To determine the quantity of crop production.
Measurement options:
1. At a minimum, the NSO should determine the quantity of crop produced on an annual basis after the harvest has been completed.
2. In order to be able to get an advance indicator (in advance of the end of harvest), NSO’s can determine the land area devoted to the crop, and carry out a yield survey. Other refinements to this measurement would include the amount of own consumption and area irrigated if applicable
3. For commercial products (those sold commercially and traded internationally) measurements of product in storage positions enables an assessment of total supplies and carryover stocks.
Horticulture Objective: To determine the value of production
Measurement options:
1. To determine the area in trees or vines, annual production
Floriculture Objective: To determine the value of production
Measurement options:
The information below is intended to be generic and in no way should be interpreted as recommendations for the Mozambique TIA. The content of TIA should reflect the expressed needs of major users and the available resources.
Crops statistics can pose some special measurement issues. These are dealt with below in a separate section.
General Data Dissemination System, II World Bank
An Introduction to Agriculture Statistics, April 2009, Boyko and Hill Page 40
1. The area under production, value of production
Livestock, poultry and other animals Objective: To determine the inventories of animals by species and the annual production of products such as meat, milk, eggs, wool, hides
Measurement options:
1. Inventories by type of animal
2. Inventories by type of animal, gender, age and purpose
Aquaculture Objective: To determine the quantity of production
Measurement options:
1. To determine the weight of fish harvested.
2. To determine the area covered in water
Paid labour Objective: The quantity of paid labour
Measurement options:
1. The number of days and value of labour acquired for farm production
Purchased inputs and investments Objective: To determine the quantity and value of purchased inputs and the quantity of expenditures on capital items.
Measurement options:
1. The total costs of inputs such as seed, feed, fertilizer, chemicals and capital items such as tillage and irrigation equipment, tools, breeding stock.
2. Total and unit costs of seed, feed, fertilizer and chemicals.
General Data Dissemination System, II World Bank
An Introduction to Agriculture Statistics, April 2009, Boyko and Hill Page 41
Prices paid and received by farmers Objective: To determine the prices received by farmers for the sale of products and the prices paid for the purchase of inputs
Other Other measurements will depend on user objectives and which other household surveys are carried out. Some examples are:
1. Days of off-farm work and income earned
2. Custom services
3. Community storage and processing
4. Farm operator household characteristics
5. Access to markets and market information
Some Measurement Issues in Estimating Crop Production All aspects of measuring agriculture production have challenges but estimating crop production has some unique challenges. Crop estimation can involve measurements other than those obtained by asking the operator questions. Some of these methods can involve direct measurement of the areas under crop and the yields obtained. The methods for estimating crop production break down into pre-harvest and post-harvest methods.
Pre-Harvest Pre-harvest forecasting of crop production is primarily concerned with advance estimation of production of crops, which have been planted and are already on the
The quantity of crop production can be estimated either by asking farm operators what quantity of crop they harvested or by trying to come up with independent estimates of the area devoted to the crops and the yield of the crops. Yield X area = total gross production. Alternatively, one can survey famers after the harvest and ask them how much they produced.
General Data Dissemination System, II World Bank
An Introduction to Agriculture Statistics, April 2009, Boyko and Hill Page 42
ground. If information on the likely magnitude of production of such crop(s) becomes available 4-6 weeks before harvest, it provides suitable lead-time to all the stakeholders to plan their respective operations accordingly. In the context of preharvest crop production forecast, it is important to mark the words, “likely magnitude of production to be harvested” in contrast to which final estimates relate to estimate of production actually harvested.13
One of the leading indicators of crop production is the area seeded or available for harvesting. This can be measured through the use of surveys which can be carried out early in the growing season. Another approach that can be used in some situations is the use of remote sensing image analysis from satellites. If sample surveys are used to estimate cropped area, there are two different ways of obtaining the information. One choice is to ask the farm operator and the second is to engage in direct measurement of the crop plots using GPS technology. Yield estimation is often more difficult. Of course one can ask the operator what yield was obtained.
“Various techniques were used in order to determine the yield per unit area of each crop. These include household interviews, crop samples (cuts), visual observations of growing crops, closer evaluation of yields of harvested crops and grain storage tanks, counting of plant population densities and discussions with agricultural extension workers and individual farmers. Available historical data including the national average yields were also used in the determination of the yields.”14
Crop cutting involves choosing farms and crop plots at random and then selecting small areas where the crop is cut and the seeds harvested. The following abstract from a journal article by Derek Poatea, outlines some of the research that has been done in the area of objective measurement. 13
AFRICAN COMMISSION ON AGRICULTURAL STATISTICS, CROP PRODUCTION FORECASTING: STATISTICAL CONSIDERATIONS, Seventeenth Session, Pretoria, South Africa, 27 – 30 NOVEMBER 2001
14 Food and Agriculture Organization and the World Food Program, Fao/Wfp Crop And Food Supply Assessment Mission To Lesotho12 June 2007, see ftp://ftp.fao.org/docrep/fao/010/ah865e/ah865e00.pdf
General Data Dissemination System, II World Bank
An Introduction to Agriculture Statistics, April 2009, Boyko and Hill Page 43
“Four methods of measuring crop production are reviewed in the context of different survey objectives. A popular technique, crop cutting, tends to overestimate yields and does not produce good estimates of individual plots. For high accuracy, harvest of the whole plot is the best method. If statistics of regional production are required output can be sampled after harvest, or, if the farmer harvests in consistent units, his own estimate can be taken. Limited evidence shows that farmers' estimates may be no more biased than crop cutting, but require fewer resources and supervision. There is no best method. The method used must be chosen for the purpose of the study. Whichever method is chosen a distinction should be made between biological and economic yield and correction must be made for threshing and moisture content.”15
Early Warning Systems (EWS) EWS are intended to provide advance warning of potential food shortages in advance harvest. If food shortages are possible then the government and other agencies can take action. If the only information about crop production is available after the harvest is over, there may not be sufficient time to take action. In countries where shortages are not an issue, EWS are important sources of advance market information. The approaches used include measurement of fields, crop cutting and plant counting, agro-meteorological (rainfall and weather conditions) information and may involve modelling. In general, these methods tend to focus more on the estimation of yields rather than the area planted as the sample sizes are generally too small to estimate the areas reliably. In an ideal situation, the sample design of the EWS should be tied to the design of annual surveys such as the TIA.
Going from Gross Production to Net Production The methods described above are mainly used to provide an estimate for the total amount of output produced. What is important from a food perspective however, is the net amount available for consumption. The difference between what is harvested and what can be consumed are the losses due to such things as physical loss (due to a variety of reasons) and reduced milling quality. Both of these factors have economic implications.
Censuses of population are key elements on which agriculture censuses and surveys are based. To facilitate drawing samples for agriculture censuses and surveys, the censuses of population
15 Derek Poatea, A Review of Methods for Measuring Crop Production from Smallholder Producers, Experimental Agriculture (1988), 24:1-14 Cambridge University Press, Copyright © Cambridge University Press 1988
General Data Dissemination System, II World Bank
An Introduction to Agriculture Statistics, April 2009, Boyko and Hill Page 44
carry questions referred to as “core modules” on as many as 8 areas (based on FAO recommendations) including the following:
• Land
• Crops
• Livestock
• Irrigation and water management
• Agricultural practices
• Agricultural services
• Household food security and
• Aquaculture
Countries should only choose modules are important for their agriculture and which can be used as part of the sample design for subsequent (sample) censuses and surveys.
General Data Dissemination System, II World Bank
An Introduction to Agriculture Statistics, April 2009, Boyko and Hill Page 45
Chapter 7: Sample Design
What is sampling? Sampling is a means of selecting a subset of units from a population for the purpose of collecting information for those units, usually to draw inferences about the population as a whole. Samples are drawn from sampling frames which are a list of all the units in the population.
Types of Sampling There are two different types of sampling
• Non-probability sampling
• Probability sampling
Non-probability sampling Non-probability sampling is a subjective method of selecting units for study. There is no information about how representative the units selected are of the entire population. Examples of such samples are:
• First person you met
• Friends of the village leader
• A group of students in class
This method of selection is useful as:
• A tool for the generation of ideas
• A preliminary step for example pre-testing a questionnaire
• Initial studies
The Advantages and Disadvantages of Non-probability sampling The advantage of this type of sampling is that it is
• Inexpensive,
General Data Dissemination System, II World Bank
An Introduction to Agriculture Statistics, April 2009, Boyko and Hill Page 46
• Requires no sampling frame.
• Useful for exploratory studies
Its disadvantages are that;
• Dangerous to make assumptions from the sample
• Impossible to determine probability of selection and use any standard statistical measures
Sometimes there is a real risk that a badly implemented probability sample is in fact a non-probability sample For example; depending upon a village leader to select persons for interview is not a substitute for a proper process of listing and randomly selecting persons
Types of Non Probability Sampling There are a number of methods of non-probability some of which may be acceptable in appropriate situations
• Haphazard Sampling: Simply selecting the first persons available
• Volunteer Sampling: Using a group of volunteers such as a class of students
• Judgment Sampling: Selecting units to represent different elements in the population. This practice may be useful during testing of survey
• Quota Sampling: Selecting units on a haphazard basis to conform to a population distribution eg men and women, married and single, old and young in the same proportions as they exist in the total population. This method is often used for public opinion surveys. The sample is pseudo-representative.
Probability sampling In probability sampling all member of the population of interest must chance of being selected and their probability of selection must be known or be able to be calculated. The sample is:
• Representative and
• The sampled units must have a probability of selection that is equal, known or can be calculated
General Data Dissemination System, II World Bank
An Introduction to Agriculture Statistics, April 2009, Boyko and Hill Page 47
Methods of Probability sampling There are a number of methods and techniques of probability sampling that may be used separately or in conjunction. Many practical samples used for National survey use a combination of methods. The methods are:
• Simple Random Sampling (SRS) • Systematic Sampling (SYS) • Probability Proportional to Size (PPS) Sampling • Cluster Sampling • Stratified Sampling (STR) • Multi-Stage Sampling
Simple Random Sampling (SRS)
Method
• All units in the population are selected randomly • All units have equal probability of selection • The units are drawn from single population Advantages • The method is simple to implement • It requires no additional information. All that is needed is
list of population contact information .
• It does not needs any technical development The statistical theory for the method is very well established, standard formulas exist for all parameters, means variance and so on The formulae are easy to use
It is the standard used to compare with other designs Disadvantages
• It makes no use of auxiliary information • It is not efficient • Very expensive for using with geographically dispersed populations • It cannot be use if list does not exist
General Data Dissemination System, II World Bank
An Introduction to Agriculture Statistics, April 2009, Boyko and Hill Page 48
Systematic Sampling (SYS) Method
• Units are selected systematically from random start • All units have equal probability of selection • The units are drawn from single population Advantages
• The method is a proxy for SRS It does not require frame or list of information
• It is generally more efficient than SRS • Well-established theory,
standard formulas exist for all parameters. • Simpler than SRS
It only requires one random number as the start point • The method of selection ensures the dispersion of sample Disadvantages
• It is possible to select a ‘Bad’ sample if the sampling interval matches periodicity in the population.
• Like SRS it makes no use of auxiliary information • The final sample size is not known in advance when a conceptual frame is used. • It can give variable sample size • It does not give an unbiased estimator of the sampling variance
Probability Proportional to Size (PPS) Sampling Method
• This method is often used as the primary stage in multi-stage sampling for example selecting households from villages or students from schools
• Each record is selected with probability proportional size where size is the number of secondary units in the primary units
General Data Dissemination System, II World Bank
An Introduction to Agriculture Statistics, April 2009, Boyko and Hill Page 49
Advantages The main advantage of PPS is that it makes uses auxiliary information such s village size to improve the statistical efficiency. It can result in a dramatic reduction in sampling variance compared with SRS Disadvantages PPS requires a sampling frame with good quality auxiliary information for example the number of households per village must be known with reasonable accuracy. The creation of the sampling frame creation is more costly and complex. The number of secondary units in the population needs to be known. There are situations where it is not applicable. The calculation of the sampling variance is more complex. It should not be used if the size measures are not reasonably accurate or stable. In such circumstances, better is to create size groupings and perform stratified sampling A systematic method for applying PPS • First it is necessary to know the number of secondary units in the primary units, that is
for example the number of households per village • Then you calculate the cumulative size measure for each unit in the population, the
villages • For each unit, (village) there is a range corresponding to one more than the cumulative
value of previous unit in the population to the cumulative value of this unit. • The sampling interval is determine by taking k/n where k is the total number of units
and n is the number of primary units to be selected • Select a random start, r a number between, between 1 and k. • Select those units whose range contains the random numbers r, r+k, r+2k, ... r+(n-1)k..
Cluster Sampling Method • Units e.g. persons are organised into clusters for example a school, Village, or Factory • A sample of clusters are selected • Then all units in the cluster are interviewed • This method is related to multi stage sampling. The difference is that in multi-stage
sampling only a sub-ample of units are interviewed Advantages
General Data Dissemination System, II World Bank
An Introduction to Agriculture Statistics, April 2009, Boyko and Hill Page 50
• Cluster sampling greatly reduces costs in time and organization. This is sspecially true for dispersed rural populations
• It is easier to apply than SRS or SYS as populations are naturally clustered • It is only necessary to make a list of clusters and units within the cluster. • It is often more efficient Disadvantages • It is less efficient if the members of the clusters are homogeneous. However this may be
overcome by increasing the number of clusters • In general the sample size is not known in advance, • It requires organization working with the clusters • Its variance estimation is more complex
Stratified Sampling (STR) Method • The Population is divided into mutually exclusive groups called strata • Independent samples are elected from each stratum. Advantages • It increases precision. The improvement in precision depends upon the extent of
differentiation among strata and homogeneity within strata. Even moderate differentiation can gain precision
• It guarantees that all subgroups of interest are covered and makes it possible to control the level of coverage e.g. coverage of provinces
• It is operationally convenience. • It can protect against selecting a ‘bad’ sample. • It allows different sampling frames and procedures to be applied to different strata (e.g.
SRS in one stratum, PPS in another). Disadvantages (STR) • The quality of stratification depends upon the quality the auxiliary information • It increase the complexity of the survey • Estimation of parameters from the stratified sample is more complex
General Data Dissemination System, II World Bank
An Introduction to Agriculture Statistics, April 2009, Boyko and Hill Page 51
Multi-stage Samples The most practical samples used in National Statistical Systems are multistage samples. • This means the sample is selected in two or more successive stages. • Usual the number of stages is two or three stages • Multi-stage combined with stratification ensures the level of Geographic coverage
required in Government Statistics
Example of Structure of Agricultural Information for Sampling Most Government agricultural surveys are multi-stage stratified samples. Normally geographic levels, provinces and districts are used for stratification to ensure proper national coverage. Information may also be used related to agro-ecological zone or cropping zone to improve the quality of the sample. Generally the primary will be a smaller geographic unit, a village or other rural communal unit or possibly an enumeration area from the census of population. A recommended strategy is to selects these units with probability proportional to size. The final level will be the household. These will be selected with the community either randomly or systematically.
Sample Design used for TIA Essentially all the different techniques are used in the Annual Agricultural Survey (TIA). It is • Multi-stage, • Stratified geographical • Selects Communities with Probability Proportion to Size • Uses a Systematic Sample at the household level The stages are • Stratification
Provinces and Groups of Districts classified by Agro-ecological zones within each Province
• First level within strata Districts selected within Strata with Probability Proportional to Size (Number of Households)
• Second level Villages selected within selected Districts with Probability Proportional to Size (Number of Households)
• Third level-Household selected systematically
General Data Dissemination System, II World Bank
An Introduction to Agriculture Statistics, April 2009, Boyko and Hill Page 52
Chapter 8: Case Study: Survey Design Considerations for Mozambique Cattle Statistics
The TIA survey collects information on a variety of subjects including cattle and other livestock statistics. These statistics are important for the Directorate of Veterinary Services (DVS) which is responsible for promoting the animal production and the health of the animal populations. The Census of Agriculture is a key source of information for them as it produces estimates at the district (sub-provincial) level. The annual agriculture survey uses a smaller sample size and provides reasonable estimates for smaller animals (goats, chickens etc.) but the DVS finds that the cattle estimates are not sufficiently accurate for their purposes.
The DVS uses livestock statistics for planning policies and programs (ensuring the health of the animal population) and for operational purposes. They depend on the Census of Agriculture for district level data for different classes of animals. Some district offices have a list of livestock producers (arrolamento) which contains cattle numbers but is not a good estimate of the total livestock population. The DVS finds TIA estimates reasonable for smaller animals (goats, chickens etc) but not for cattle numbers
The trainers used this situation as a case study to elaborate the elements of sample design. While the TIA is not designed to provide district level estimates, it can be optimized to provide better quality provincial level estimates. This question has already been studied by a number of experts and the purpose of this part of the training is to explain the sample design considerations.
It is useful to review the differences among the sources of cattle statistics. The Census of Population and Housing (CPH) includes a livestock module and visits each household. The Census of Agriculture (CAP) is based on a sample of the CPH and the TIA is also a sample. The differences in sample size have an impact on the accuracy of the data from each of the surveys.
The TIA is a smaller sample than the CAP and is the source of annual data. The CAP covered all the 128 rural districts of Mozambique, and included a sample of about 23,000 farm households. The TIA covers 94 districts, and approximately 6000 households are interviewed
The DVS is concerned about the discrepancy between the CAP and the TIA . They feel that the data are not accurate enough for their work.
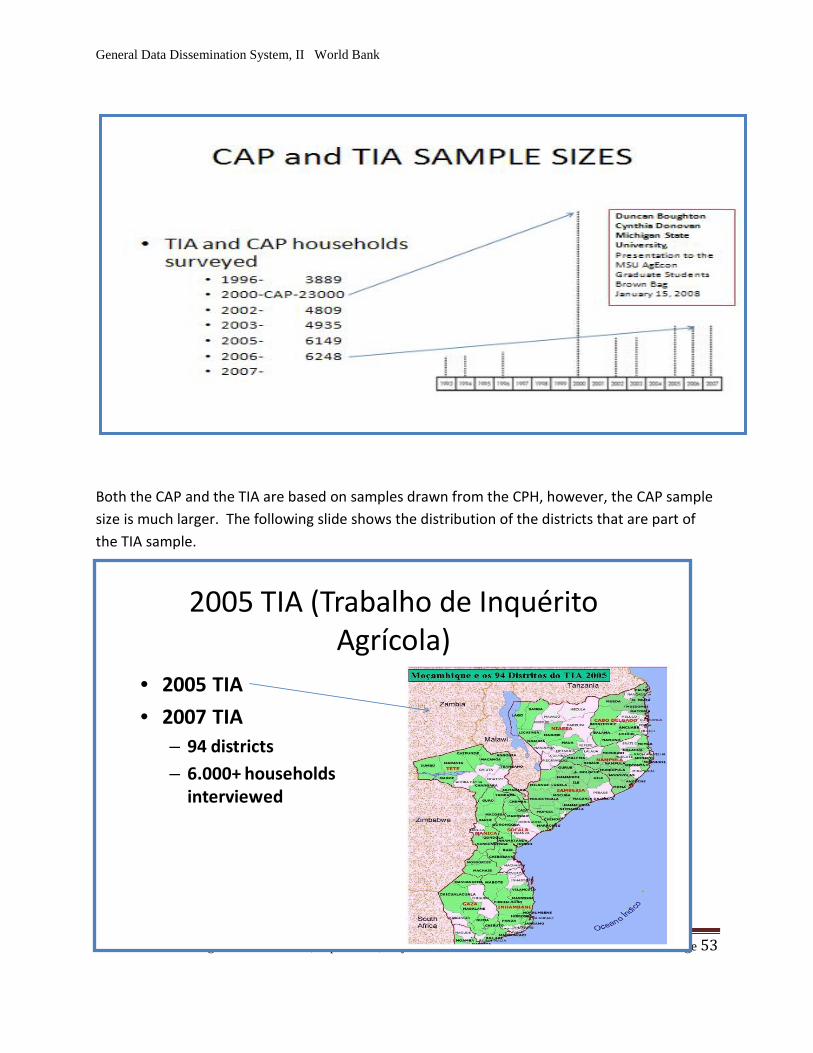
General Data Dissemination System, II World Bank
An Introduction to Agriculture Statistics, April 2009, Boyko and Hill Page 53
Both the CAP and the TIA are based on samples drawn from the CPH, however, the CAP sample size is much larger. The following slide shows the distribution of the districts that are part of the TIA sample.
2005 TIA (Trabalho de InquéritoAgrícola)
• 2005 TIA
• 2007 TIA– 94 districts– 6.000+ households
interviewed
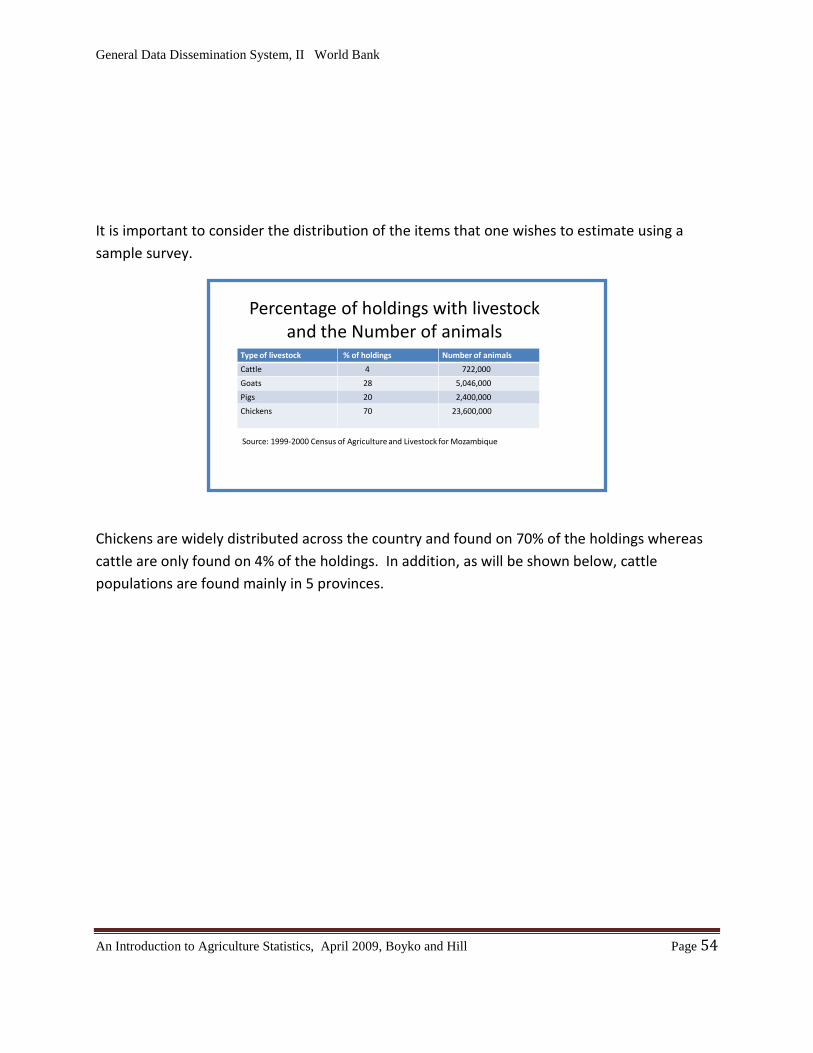
General Data Dissemination System, II World Bank
An Introduction to Agriculture Statistics, April 2009, Boyko and Hill Page 54
It is important to consider the distribution of the items that one wishes to estimate using a sample survey.
Chickens are widely distributed across the country and found on 70% of the holdings whereas cattle are only found on 4% of the holdings. In addition, as will be shown below, cattle populations are found mainly in 5 provinces.
Percentage of holdings with livestock and the Number of animals
Type of livestock % of holdings Number of animals
Cattle 4 722,000
Goats 28 5,046,000
Pigs 20 2,400,000
Chickens 70 23,600,000
Source: 1999-2000 Census of Agriculture and Livestock for Mozambique
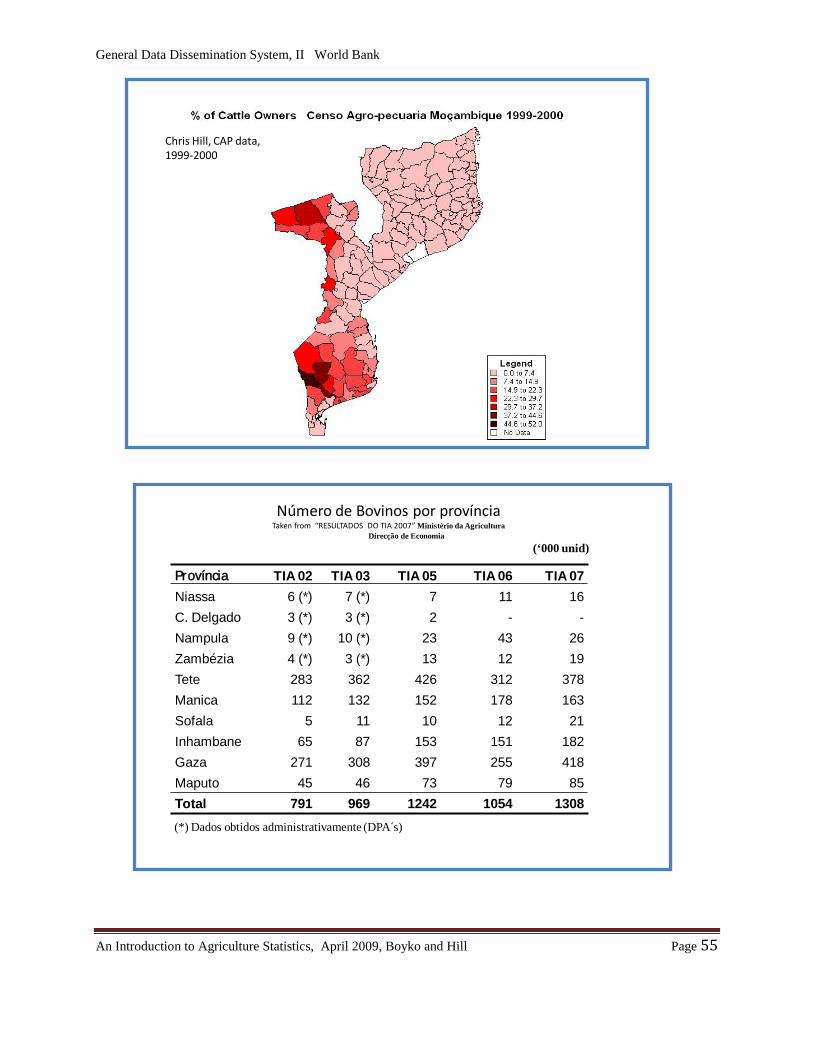
General Data Dissemination System, II World Bank
An Introduction to Agriculture Statistics, April 2009, Boyko and Hill Page 55
Chris Hill, CAP data, 1999-2000
Número de Bovinos por provínciaTaken from “RESULTADOS DO TIA 2007” Ministério da Agricultura
Direcção de Economia
(‘000 unid)
(*) Dados obtidos administrativamente (DPA´s)
Província TIA 02 TIA 03 TIA 05 TIA 06 TIA 07Niassa 6 (*) 7 (*) 7 11 16C. Delgado 3 (*) 3 (*) 2 - -Nampula 9 (*) 10 (*) 23 43 26Zambézia 4 (*) 3 (*) 13 12 19Tete 283 362 426 312 378Manica 112 132 152 178 163Sofala 5 11 10 12 21Inhambane 65 87 153 151 182Gaza 271 308 397 255 418Maputo 45 46 73 79 85Total 791 969 1242 1054 1308
General Data Dissemination System, II World Bank
An Introduction to Agriculture Statistics, April 2009, Boyko and Hill Page 56
The question of the best approach to use in designing a TIA sample which can provide good quality estimates for cattle at the provincial level was considered by Chris Hill and Domingos Diogo in a paper that was presented at The 17th Session of African Commission On Agricultural Statistics (ACAS) held in Pretoria, South Africa. 27 – 30 November 2001.16
The normal approach used in designing a survey such as the one for the TIA is to use a two-stage sample. Within the primary sample units (PSU), villages or sections of larger communities are selected with probability proportional to size. Within these PSUs, all households are listed and classified as small or medium size holdings. A household will be classified as medium based on area of land cultivate and the number of livestock owned. Within the PSU all medium holdings should be selected together with a fixed size sample of small holdings.
Since cattle are concentrated in only certain parts of the country, this must be taken into account in the sample design by including an additional step. This involves classifying the province into what can be referred to as agro-ecological zones. These are useful strata as agricultural production occurs in particular climatic and ecological zones. In the case of Mozambique agriculture, the provinces could be subdivided into two to four zones and the districts can then be selected with a probability proportional to size defined by the number of households in a district. Since the dry zones (one of the agro-ecological zones) have smaller populations, households in these areas will need a higher sampling ratio.
The basis of the classification used to draw the sample will need to be modified by over sampling areas with larger cattle numbers and lower populations. This will ensure a higher coverage of households with livestock. (The census data will be used in determining these limits.) The combination of these two methods should provide reliable estimates of all the principle types of livestock at the provincial level.
The review group headed by Prof. Kiregyera 2007 also considered this issue and came to a similar conclusion with respect to the appropriate design for the cattle portion of the survey.
“For livestock data, the coming Population and Housing Census can provide a good count of livestock that should be used as a base figure for livestock. TIA should continue to provide national and provincial data for small animals and for vaccination rates for large animals.
16 The African Commission on Agricultural Statistics, Pretoria, South Africa. 27 – 30 November 2001, see http://www.fao.org/es/ESS/meetings/AFCAS17/ECountryPapers.htm
General Data Dissemination System, II World Bank
An Introduction to Agriculture Statistics, April 2009, Boyko and Hill Page 57
The survey sample should be redesigned after the Population and Housing Census in such a way that areas with concentrations of large livestock are over-sampled for purposes of getting more reliable livestock data. For large animals, the arrolamento should be revived, perfected and used as a source of animal counts for local programmes.”17
The 2008 TIA sample has been redrawn based on the 2007 CHP. The extent to which the cattle issue was taken into account could not be determined. The main point to remember is that agriculture products (e.g., cattle and special crops) that are concentrated in a few areas require specialized sampling and possibly specialized surveys. Products that are wide spread (e.g., chickens, major crops) can be sampled using the census of population and housing area frame without major adjustments to the sample design.
17 Prof. Ben Kiregyera, David Megill, David Eding, Bonifácio José, (2007) A Review Of The National Agricultural Information System In Mozambique, unpublished report available from the Mozambique Ministry of Agriculture or from the Instituto Nacional de Estatística
General Data Dissemination System, II World Bank
An Introduction to Agriculture Statistics, April 2009, Boyko and Hill Page 58
Chapter 9: Planning an Agricultural Survey
Agriculture surveys such as the TIA are big and expensive projects. The results that are produced from it are important for MINAG and its major users. Project planning and management is an important process for ensuring timely results of good quality. The TIA includes many players in the central office (Maputo) and in each of the provinces. Time management is crucial. It is important to keep important dates and timing as the reference date for the survey is (or should be) a fixed date.
Part of the success of the TIA project depends establishing the right structure to manage and control the project. The structure used for the TIA is shown below. Establishing committees for methodology, training, data, operations and logistics are essential in brining the right expertise to bear on the planning and management of the survey. The availability of international experts from Michigan State University has played an important role for the TIA. However, the work that is done in the field during collection depends on the local groups.
A key to organizing a survey is to have the right project structure in place. The TIA structure works quite well. It consists of a president for the project who has the overall responsibility for the survey and a survey manager who is the overall coordinator of the survey. The coordinator relies on committees for advice in the areas of methodology and training, data, operations and logistics. There are also technical advisors, one international expert from Michigan State University and one national advisor.
There is an operational structure to support the survey while it is in the field. There are typically 1-3 supervisors from the MINAG head office in each of the provinces and 2 supervisors from the Provincial Directorate of Agriculture. There are generally about 50 survey teams each of which consists of a supervisor, 3 enumerators, a data entry clerk and a vehicle with a driver.
Gantt Chart A Gantt chart is a type of bar chart which identifies major activities and the time frame during which they musts be accomplished. It is a very useful planning tool. Below is a draft of such a table (referred to as a cronagrama in Portuguese) is an example of such a plan. 18
18 Many thanks for Ellen Payongayong from the MSU team at the Ministry of Agriculture for sharing this example with the class.
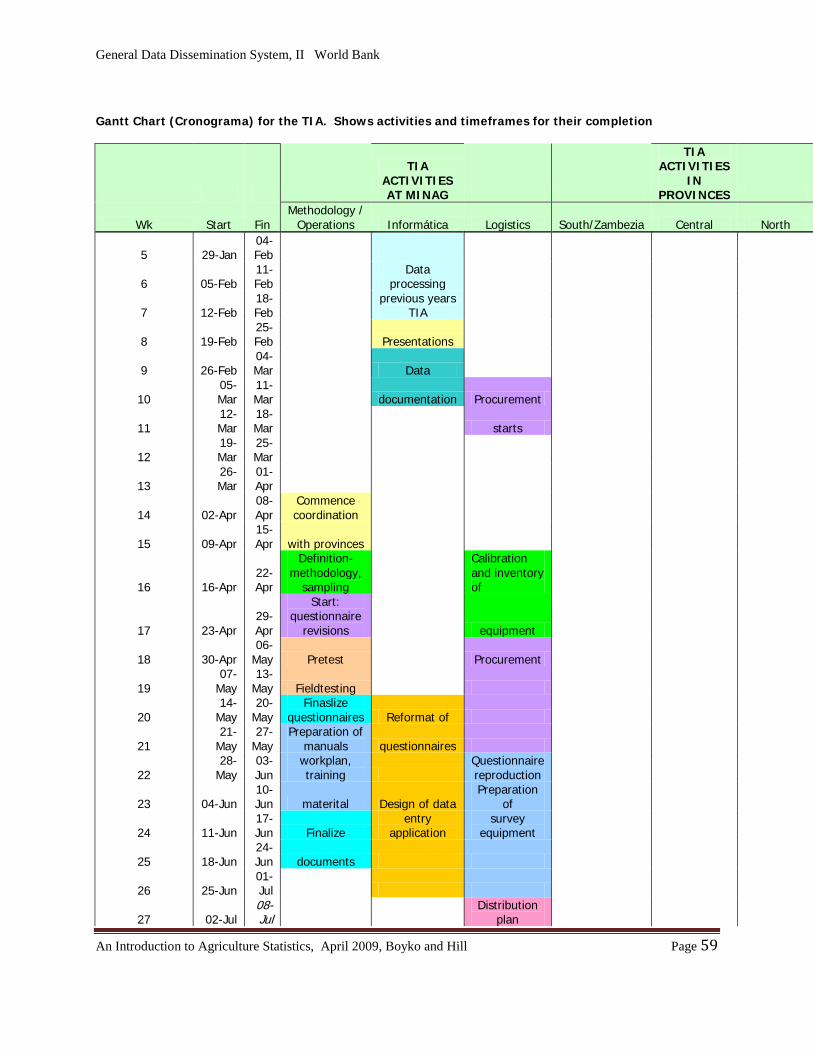
General Data Dissemination System, II World Bank
An Introduction to Agriculture Statistics, April 2009, Boyko and Hill Page 59
Gantt Chart (Cronograma) for the TIA. Shows activities and timeframes for their completion
TIA ACTIVITIES AT MINAG
TIA ACTIVITIES
IN PROVINCES
Wk Start Fin Methodology /
Operations Informática Logistics South/Zambezia Central North
5 29-Jan 04-Feb
6 05-Feb 11-Feb
Data processing
7 12-Feb 18-Feb
previous years TIA
8 19-Feb 25-Feb Presentations
9 26-Feb 04-Mar Data
10 05-Mar
11-Mar documentation Procurement
11 12-Mar
18-Mar starts
12 19-Mar
25-Mar
13 26-Mar
01-Apr
14 02-Apr 08-Apr
Commence coordination
15 09-Apr 15-Apr with provinces
16 16-Apr 22-Apr
Definition-methodology,
sampling
Calibration and inventory of
17 23-Apr 29-Apr
Start: questionnaire
revisions equipment
18 30-Apr 06-
May Pretest Procurement
19 07-
May 13-
May Fieldtesting
20 14-
May 20-
May Finaslize
questionnaires Reformat of
21 21-
May 27-
May Preparation of
manuals questionnaires
22 28-
May 03-Jun
workplan, training
Questionnaire reproduction
23 04-Jun 10-Jun materital Design of data
Preparation of
24 11-Jun 17-Jun Finalize
entry application
survey equipment
25 18-Jun 24-Jun documents
26 25-Jun 01-Jul
27 02-Jul 08- Jul
Distribution plan
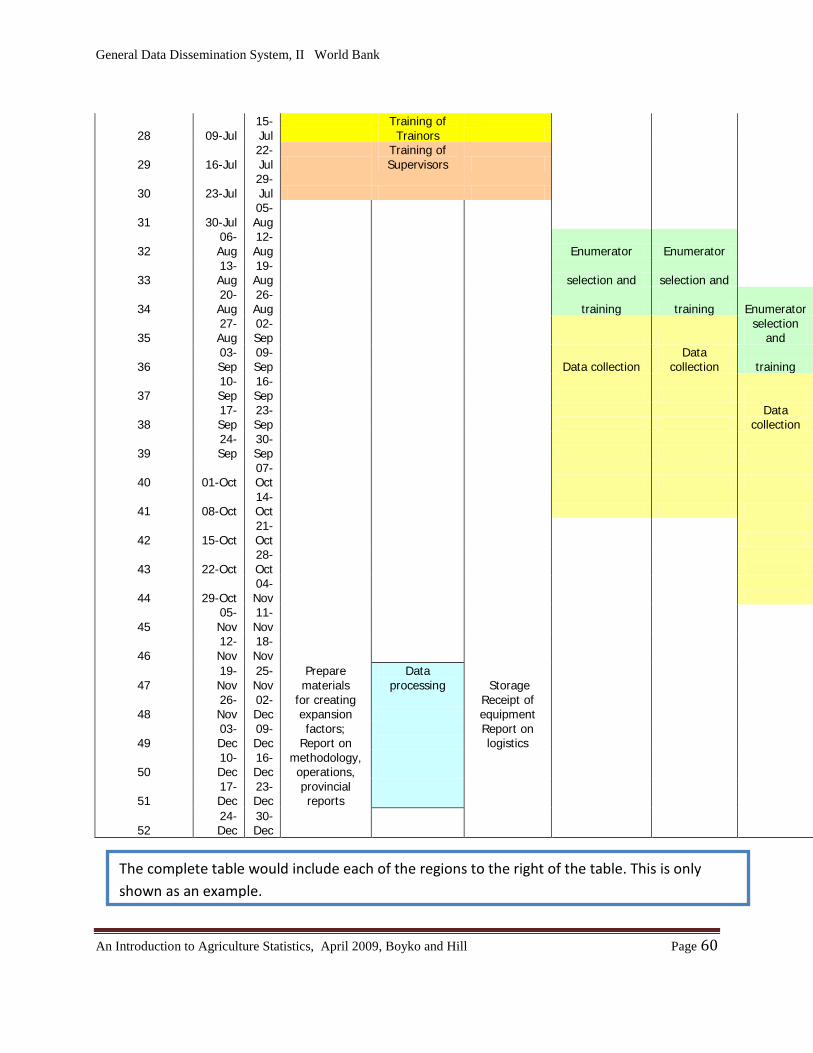
General Data Dissemination System, II World Bank
An Introduction to Agriculture Statistics, April 2009, Boyko and Hill Page 60
28 09-Jul 15-Jul
Training of Trainors
29 16-Jul 22-Jul
Training of Supervisors
30 23-Jul 29-Jul
31 30-Jul 05-Aug
32 06-Aug
12-Aug Enumerator Enumerator
33 13-Aug
19-Aug selection and selection and
34 20-Aug
26-Aug training training Enumerator
35 27-Aug
02-Sep
selection and
36 03-Sep
09-Sep Data collection
Data collection training
37 10-Sep
16-Sep
38 17-Sep
23-Sep
Data collection
39 24-Sep
30-Sep
40 01-Oct 07-Oct
41 08-Oct 14-Oct
42 15-Oct 21-Oct
43 22-Oct 28-Oct
44 29-Oct 04-Nov
45 05-Nov
11-Nov
46 12-Nov
18-Nov
47 19-Nov
25-Nov
Prepare materials
Data processing Storage
48 26-Nov
02-Dec
for creating expansion
Receipt of equipment
49 03-Dec
09-Dec
factors; Report on
Report on logistics
50 10-Dec
16-Dec
methodology, operations,
51 17-Dec
23-Dec
provincial reports
52 24-Dec
30-Dec
The complete table would include each of the regions to the right of the table. This is only shown as an example.
General Data Dissemination System, II World Bank
An Introduction to Agriculture Statistics, April 2009, Boyko and Hill Page 61
One of the issues that came to light during the training session was the fact that certain activities will now take longer than in previous years. These are:
• the flow of funds to the provincial offices to pay for enumerators • the process for acquiring equipment and • the process for hiring enumerators
There is no easy way to overcome such challenges other than to build in extra lead times into the planning process.

General Data Dissemination System, II World Bank
An Introduction to Agriculture Statistics, April 2009, Boyko and Hill Page 62
Chapter 10: Project Management Basics “A project is a series of connected events that are conducted over a defined and limited period of time and are targeted towards generating a unique but well defined outcome”. Managing a survey can be viewed as a project in the classic sense. In preparation for this mission, reference was made to basic handbook on project management.19
As was mentioned above, surveys take time and money and thus have to be carefully managed. They are big undertakings which must succeed. Time, cost and performance are the key variables to be managed. There are risks and uncertainties to be managed. Surveys require leaders, structures and people.
The main elements involved in successful project management are:
• Planning (Deciding which actions? with what? when, how long? who?)
• Managing (Leading, Communicating, Motivating, Negotiating)
• Monitoring (Data are an important part of monitoring. The data measure, record, collate, and must be analyzed. The data must be relevant, credible, timely, and understandable) and
• Controlling (Actions based on analysis of the data must be appropriate, quick, cost effective, and balanced )
19 Phil Baguley, Teach Yourself Project Management, McGraw Hill, Whitby Ontario, Canada, 2008,
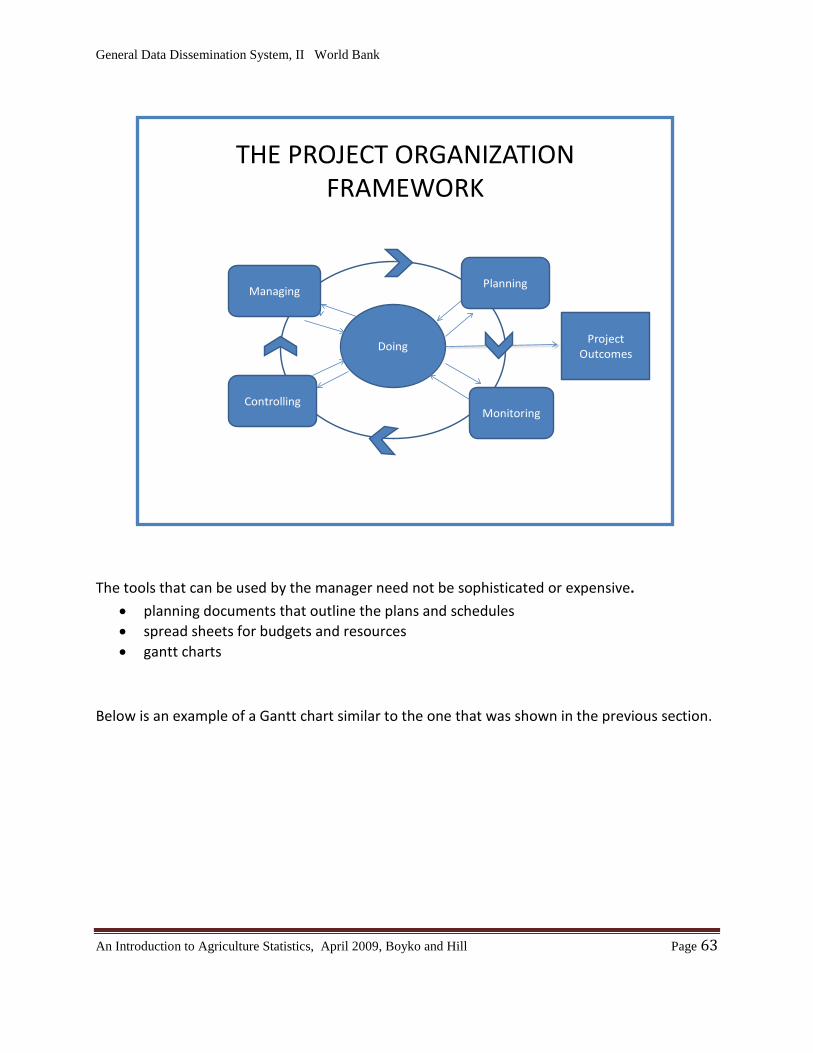
General Data Dissemination System, II World Bank
An Introduction to Agriculture Statistics, April 2009, Boyko and Hill Page 63
The tools that can be used by the manager need not be sophisticated or expensive.
• planning documents that outline the plans and schedules • spread sheets for budgets and resources • gantt charts
Below is an example of a Gantt chart similar to the one that was shown in the previous section.
THE PROJECT ORGANIZATION FRAMEWORK
Doing
Planning
MonitoringControlling
Managing
ProjectOutcomes
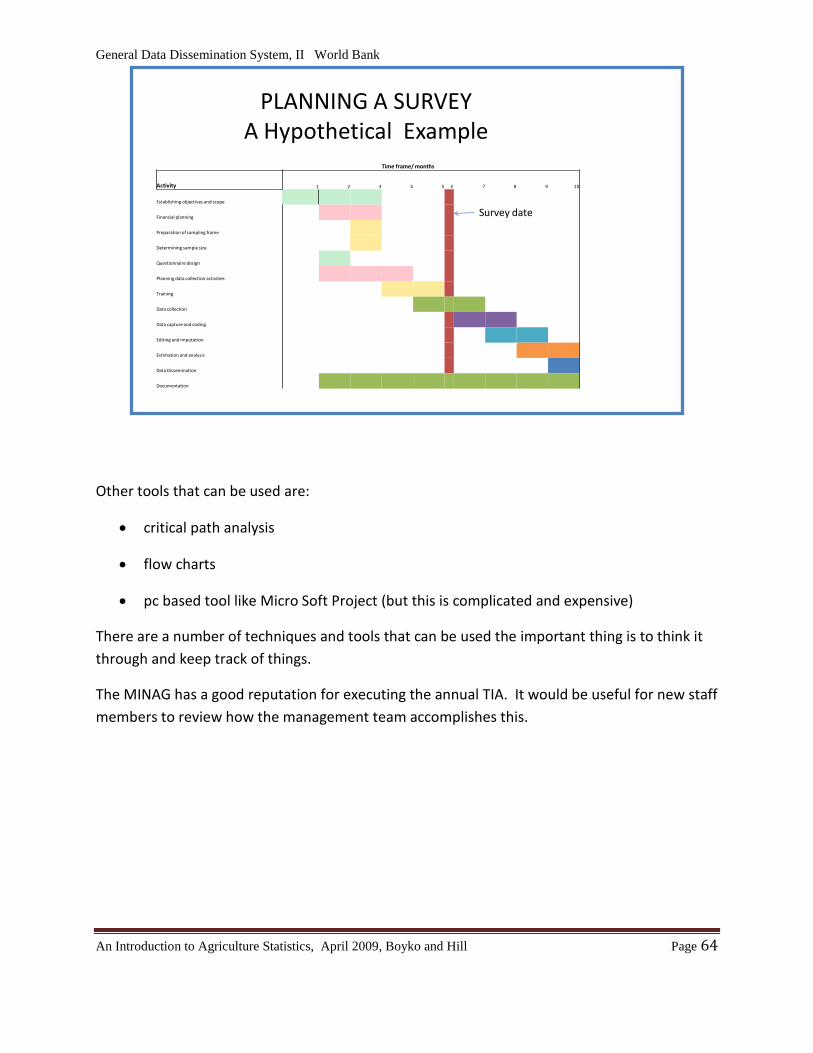
General Data Dissemination System, II World Bank
An Introduction to Agriculture Statistics, April 2009, Boyko and Hill Page 64
Other tools that can be used are:
• critical path analysis
• flow charts
• pc based tool like Micro Soft Project (but this is complicated and expensive)
There are a number of techniques and tools that can be used the important thing is to think it through and keep track of things.
The MINAG has a good reputation for executing the annual TIA. It would be useful for new staff members to review how the management team accomplishes this.
Time frame/ months
Activity 1 2 3 4 5 6 7 8 9 10
Establishing objectives and scope
Financial planning
Preparation of sampling frame
Determining sample size
Questionnaire design
Planning data collection activities
Training
Data collection
Data capture and coding
Editing and imputation
Estimation and analysis
Data Dissemination
Documentation
PLANNING A SURVEYA Hypothetical Example
Survey date
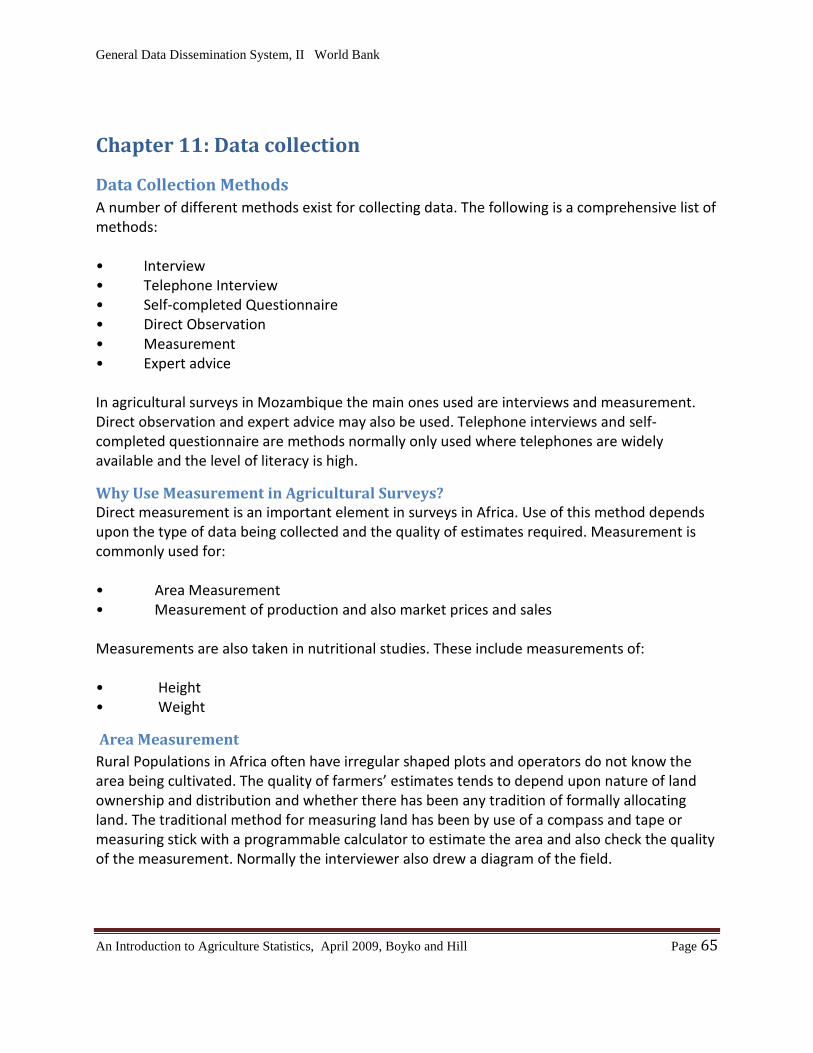
General Data Dissemination System, II World Bank
An Introduction to Agriculture Statistics, April 2009, Boyko and Hill Page 65
Chapter 11: Data collection
Data Collection Methods A number of different methods exist for collecting data. The following is a comprehensive list of methods: • Interview • Telephone Interview • Self-completed Questionnaire • Direct Observation • Measurement • Expert advice In agricultural surveys in Mozambique the main ones used are interviews and measurement. Direct observation and expert advice may also be used. Telephone interviews and self-completed questionnaire are methods normally only used where telephones are widely available and the level of literacy is high.
Why Use Measurement in Agricultural Surveys? Direct measurement is an important element in surveys in Africa. Use of this method depends upon the type of data being collected and the quality of estimates required. Measurement is commonly used for: • Area Measurement • Measurement of production and also market prices and sales Measurements are also taken in nutritional studies. These include measurements of: • Height • Weight
Area Measurement Rural Populations in Africa often have irregular shaped plots and operators do not know the area being cultivated. The quality of farmers’ estimates tends to depend upon nature of land ownership and distribution and whether there has been any tradition of formally allocating land. The traditional method for measuring land has been by use of a compass and tape or measuring stick with a programmable calculator to estimate the area and also check the quality of the measurement. Normally the interviewer also drew a diagram of the field.
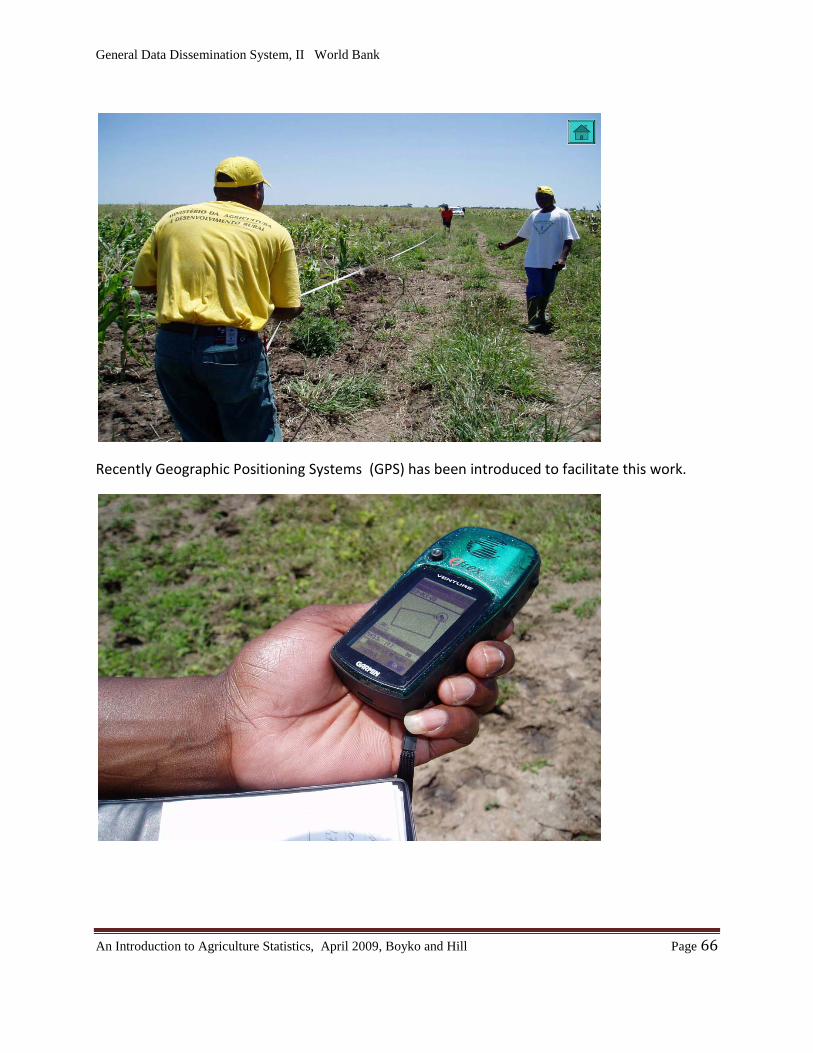
General Data Dissemination System, II World Bank
An Introduction to Agriculture Statistics, April 2009, Boyko and Hill Page 66
Recently Geographic Positioning Systems (GPS) has been introduced to facilitate this work.
General Data Dissemination System, II World Bank
An Introduction to Agriculture Statistics, April 2009, Boyko and Hill Page 67
Production Measurement of Crops Harvested at one time The quality of estimates of crop production obtained from objective measurement compared to farmer’s estimates has been much debated. Limited studies have been made on this topic.
Farmers do have a need to know the volume of production. They often have a clear idea whether the production in the current year will be sufficient to meet the family’s food requirements. It may be important for making decisions about whether or not to sell possible surpluses. The farmer’s knowledge however may not be in official standard units such as kilograms. It may be in a traditional measure that needs to be converted.
Estimates of crop production by measuring a sample of the crop has proved to be less accurate than expected. A number of factors have contributed to this:
• measuring crop samples is very time consuming and may not be done well if not very thoroughly supervised
• irregular shaped fields, partial tree cover and intercropping can influence the proper selection of the sample. There is a tendency to avoid areas of poor production
These situations lead to an over-estimate of actual production. More work needs to be done on evaluating these methods, but there is some reason to believe that physical measurement of field area is generally better than farmers reported estimates. Farmer’s estimates of production properly converted from traditional measures may be as reliable as objective measures.
Production Measurement of Crops that are Continually Harvested Estimates of production of crops that are continually harvested are especially difficult to obtain. In Mozambique the two main crops in this category are cassava and sweet potato. Sweet potato is an important secondary crop providing food during the low season. Cassava on the other hand is in some areas, the main crop and in many areas is a joint principal crop together with maize. Estimating crop production using physical measurements is complicated by the fact that the crop is harvested over an extended period and continues to grow over the period in which it is being harvested. If other food supplies are good, cassava may be left in the ground and not harvested or is used to feed animal. Most of the cassava production is for own-consumption, so sales estimates are very low in relation to total production. As the producers rarely harvest a large quantity at one time they do not have a clear idea of actual production. The ideal method for estimating cassava production would be to take repeated measurement of crop harvested or consumed over the production period. Repeated measurements would be
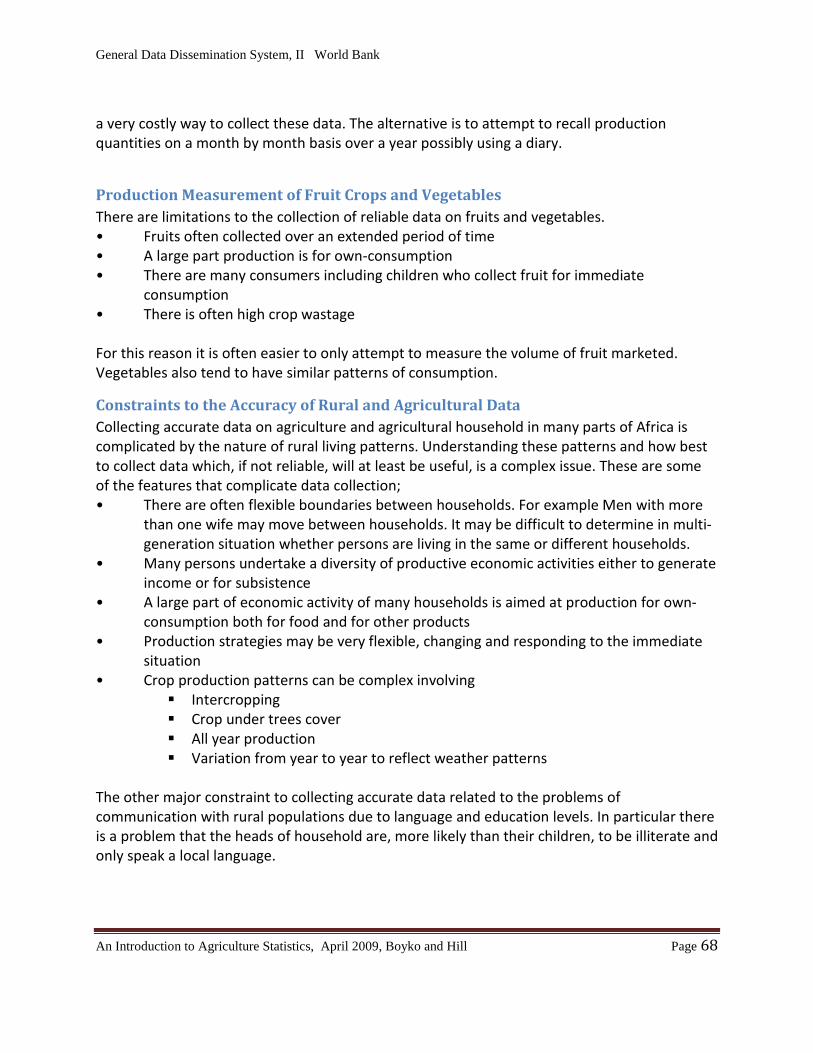
General Data Dissemination System, II World Bank
An Introduction to Agriculture Statistics, April 2009, Boyko and Hill Page 68
a very costly way to collect these data. The alternative is to attempt to recall production quantities on a month by month basis over a year possibly using a diary.
Production Measurement of Fruit Crops and Vegetables There are limitations to the collection of reliable data on fruits and vegetables. • Fruits often collected over an extended period of time • A large part production is for own-consumption • There are many consumers including children who collect fruit for immediate
consumption • There is often high crop wastage For this reason it is often easier to only attempt to measure the volume of fruit marketed. Vegetables also tend to have similar patterns of consumption.
Constraints to the Accuracy of Rural and Agricultural Data Collecting accurate data on agriculture and agricultural household in many parts of Africa is complicated by the nature of rural living patterns. Understanding these patterns and how best to collect data which, if not reliable, will at least be useful, is a complex issue. These are some of the features that complicate data collection; • There are often flexible boundaries between households. For example Men with more
than one wife may move between households. It may be difficult to determine in multi-generation situation whether persons are living in the same or different households.
• Many persons undertake a diversity of productive economic activities either to generate income or for subsistence
• A large part of economic activity of many households is aimed at production for own- consumption both for food and for other products
• Production strategies may be very flexible, changing and responding to the immediate situation
• Crop production patterns can be complex involving Intercropping Crop under trees cover All year production Variation from year to year to reflect weather patterns
The other major constraint to collecting accurate data related to the problems of communication with rural populations due to language and education levels. In particular there is a problem that the heads of household are, more likely than their children, to be illiterate and only speak a local language.
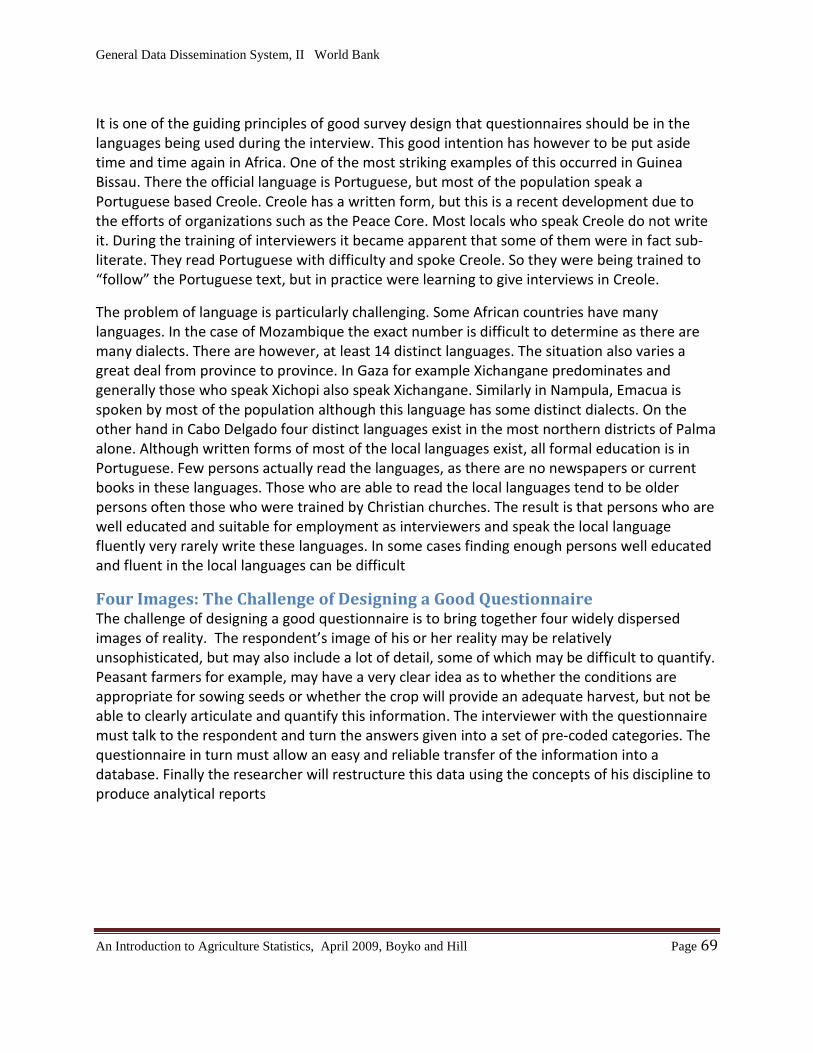
General Data Dissemination System, II World Bank
An Introduction to Agriculture Statistics, April 2009, Boyko and Hill Page 69
It is one of the guiding principles of good survey design that questionnaires should be in the languages being used during the interview. This good intention has however to be put aside time and time again in Africa. One of the most striking examples of this occurred in Guinea Bissau. There the official language is Portuguese, but most of the population speak a Portuguese based Creole. Creole has a written form, but this is a recent development due to the efforts of organizations such as the Peace Core. Most locals who speak Creole do not write it. During the training of interviewers it became apparent that some of them were in fact sub-literate. They read Portuguese with difficulty and spoke Creole. So they were being trained to “follow” the Portuguese text, but in practice were learning to give interviews in Creole.
The problem of language is particularly challenging. Some African countries have many languages. In the case of Mozambique the exact number is difficult to determine as there are many dialects. There are however, at least 14 distinct languages. The situation also varies a great deal from province to province. In Gaza for example Xichangane predominates and generally those who speak Xichopi also speak Xichangane. Similarly in Nampula, Emacua is spoken by most of the population although this language has some distinct dialects. On the other hand in Cabo Delgado four distinct languages exist in the most northern districts of Palma alone. Although written forms of most of the local languages exist, all formal education is in Portuguese. Few persons actually read the languages, as there are no newspapers or current books in these languages. Those who are able to read the local languages tend to be older persons often those who were trained by Christian churches. The result is that persons who are well educated and suitable for employment as interviewers and speak the local language fluently very rarely write these languages. In some cases finding enough persons well educated and fluent in the local languages can be difficult
Four Images: The Challenge of Designing a Good Questionnaire The challenge of designing a good questionnaire is to bring together four widely dispersed images of reality. The respondent’s image of his or her reality may be relatively unsophisticated, but may also include a lot of detail, some of which may be difficult to quantify. Peasant farmers for example, may have a very clear idea as to whether the conditions are appropriate for sowing seeds or whether the crop will provide an adequate harvest, but not be able to clearly articulate and quantify this information. The interviewer with the questionnaire must talk to the respondent and turn the answers given into a set of pre-coded categories. The questionnaire in turn must allow an easy and reliable transfer of the information into a database. Finally the researcher will restructure this data using the concepts of his discipline to produce analytical reports
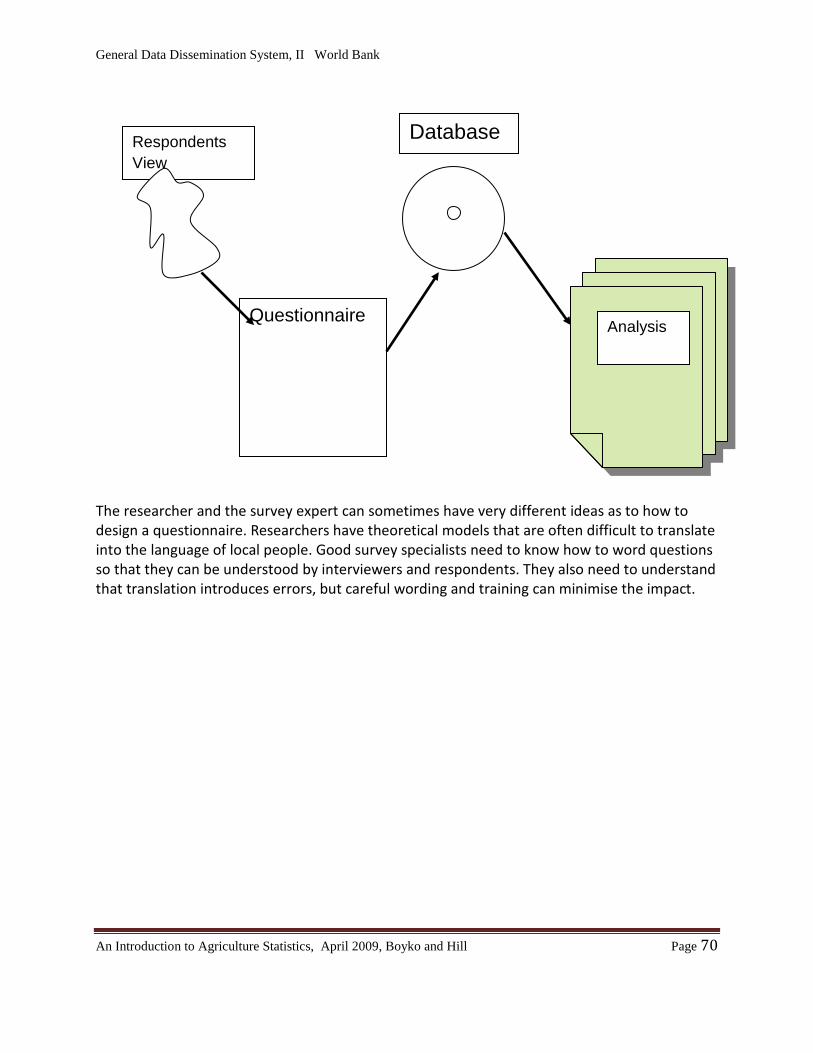
General Data Dissemination System, II World Bank
An Introduction to Agriculture Statistics, April 2009, Boyko and Hill Page 70
The researcher and the survey expert can sometimes have very different ideas as to how to design a questionnaire. Researchers have theoretical models that are often difficult to translate into the language of local people. Good survey specialists need to know how to word questions so that they can be understood by interviewers and respondents. They also need to understand that translation introduces errors, but careful wording and training can minimise the impact.
Questionnaire Analysis
Respondents View
Database
General Data Dissemination System, II World Bank
An Introduction to Agriculture Statistics, April 2009, Boyko and Hill Page 71
Chapter 12: Data Capture and Processing
Introduction
These processes are undergoing changes due to improved computer technology. New techniques from developed countries are being transferred to less developed countries. The main problem with this process is that these techniques require rigorous testing and many countries have limited numbers of skilled experts.
Operations The operations involved during these phases are: • coding • data capture • editing • imputation • outlier detection and treatment • creating a database
Coding Coding is the process of assigning a numerical value to responses to facilitate data capture and processing in general. The different approaches possible are: • questionnaire can be pre-coded; • coding can be done manually after collection; • coding can be done automatically, One of the key choices is whether to use pre-coding or manual coding after collection. The factors to consider are: • pre-coding the questionnaire saves considerable time and moneybut respondent’s
answers are not recorded. • to have both a write-in response and a code box. This makes it possible to check the
work of the interviewer • to ensure that code lists are mutually exclusive and exhaustive • the handling of “other” category may need to be coded later if there are many such
answers • new codes may have to be added if there are large numbers of similar answers that are
not included in the original code list
General Data Dissemination System, II World Bank
An Introduction to Agriculture Statistics, April 2009, Boyko and Hill Page 72
The weaknesses of manually coding after collection are that: • open questions can result in very long list of values
same concept may be written in many different ways manual coding after collection is often of poor quality coder detached from reality in field
There is a need for tight quality control
Data Capture There are some alternatives as to where and when data capture takes place: • computer-assisted interviewing (cai) • data capture in the field • decentralised data capture • centralised data capture
Staging of Data Capture: Mozambique Experience and Plans The experience with data capture in Mozambique is as follows: Data capture in the field is being used for the Annual Agriculture Surveys (TIA) and the Poverty and Social Impact Analysis -Follow up Study (World Bank). Computer-Assisted Interviewing (CAI) is being proposed for the 2009 Census of Agriculture. Centralised Data Capture has been the practice with most other surveys
Computer-Assisted Interviewing (CAI) The advantages of CAI are:
• higher response rates • early error detection and correction • reduce time • reduce manual administration • quality control of interviewing
Constraints
• cost and availability of hardware • management of hardware. the risks of • breakdowns • viruses • security • power supply • availability of interviewers capable of using computer • limited internet systems in many areas
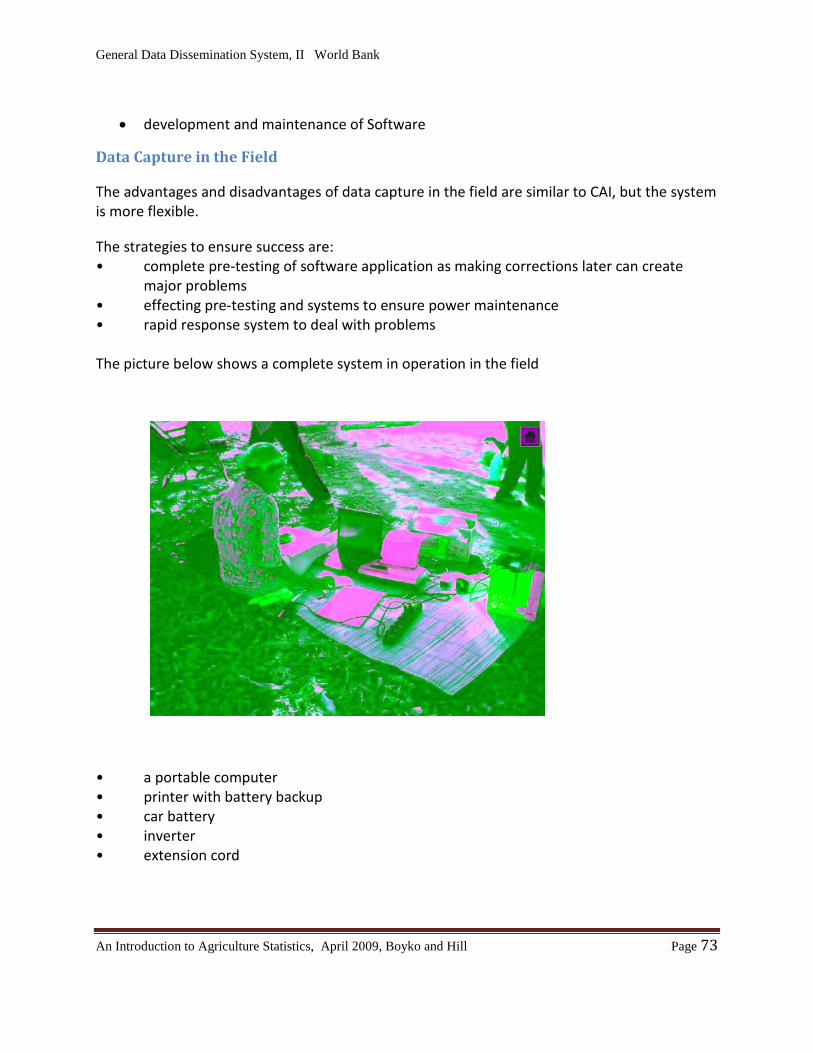
General Data Dissemination System, II World Bank
An Introduction to Agriculture Statistics, April 2009, Boyko and Hill Page 73
• development and maintenance of Software
Data Capture in the Field
The advantages and disadvantages of data capture in the field are similar to CAI, but the system is more flexible.
The strategies to ensure success are: • complete pre-testing of software application as making corrections later can create
major problems • effecting pre-testing and systems to ensure power maintenance • rapid response system to deal with problems The picture below shows a complete system in operation in the field
• a portable computer • printer with battery backup • car battery • inverter • extension cord
General Data Dissemination System, II World Bank
An Introduction to Agriculture Statistics, April 2009, Boyko and Hill Page 74
Quality Control of Data Capture Various procedures can be used to provide quality control during data capture. Normally the system includes on line edits to cover issues such as:
• completeness • the correct implementation of skips • the relationship between variables
Formal quality control procedures are implemented using systems of Multiple Data Entry. Comparison is made between the two entries. Examples are:
• the same person enters data twice • data entry twice different persons • data enter on a 100% or sample basis
The quality control procedure may also be used to select, correct and reject data entry personnel
Editing Editing is used for the identification of missing, incomplete, inconsistent and extreme values in the data
Types of edits Editing systems can be simple or very sophisticated depending upon the scale of the survey. Examples of edits are: • question must have one and only one response, • response must be consistent with skips • the coded values must be valid
Example The valid responses for Marital Status are 1 to 6
1=Single, 2=Legally Married, 3=Traditionally Married, 4=Separated, 5=Divorced and 6=Widowed,
• multiple variable consistency/validity Examples
The maximum number of coconut palms is 100 per hectare
Total Production > or = to Sales + Own Consumption + plus seeds + Other destinations
When does editing occur? Editing can occur are various stages during the survey process: • by the interviewer during the interview;
General Data Dissemination System, II World Bank
An Introduction to Agriculture Statistics, April 2009, Boyko and Hill Page 75
• by the interviewer immediately after the interview; • by the interviewer’s supervisor; • during data processing.
Constraints to Editing Editing can be very costly and time consuming. The level of editing very much depends upon the scale of the operation involved. It does however greatly facilitate subsequent processes of estimation and analysis. . • available resources (time, budget and people); • available hardware and software; • respondent/interviewer burden; • intended use of the data; • co-ordination with corrections adjustments and imputation.
End Use of the Data Not all parts of the data need to be edited with the same level of detail. The amount of editing that is performed should depend, to a large extent, on the uses of the resulting data. Questions can be ranked in importance. This ranking can determine the extent to which editing is undertaken. The order is: • key questionnaire identifiers (these must be clean) • major classification variables • important indicators and measures • secondary information
Manual versus Automated Edits Edits may be done manually or be automated. Here are some considerations for choosing automated editing. Automated editing is: • an increasing possible with technological advances • more rigorous than manual editing • can apply tests too complicated for manual editing Its limitation is that to work effectively it requires rigorous development and testing
Basis of Edits The basis of designing edits is: • structure of the questionnaire • expert knowledge • other related surveys experience
Identification and Treatment of Outliers Outliers can introduce very serious problems in quantitative data. A few extreme outliers can totally distort this data and must under all circumstances be identified and corrected or eliminated.
General Data Dissemination System, II World Bank
An Introduction to Agriculture Statistics, April 2009, Boyko and Hill Page 76
Examples of outliers
One dimensional
Total Production
Number of livestock
Multi-dimensional Two or more dimensions
Maize production per hectare (yield)
Number of trees per Hectare
Identification and Treatment of Outliers A common cause of outliers is errors in the unit of measurement. This can occur when the respondent is allowed, for example, to select the unit of measurement for production. Another type of error occurs when there are there are two alternatives for example financial units which may be measured in the basic financial unit or in thousands or area measurement in square meter or hectares. An example in the Census of Agriculture was a few respondents were erroneously coded as reporting metric tonnes. Both kilograms and 100 kilogram bags had very similar codes. Not all outliers are dues to these types of systematic errors and in some cases no obvious explanation is apparent. The methods of correction include: • verify original data • where there are clear “unit errors” because values are out by a factor 10, 100, 1000 etc.
then correct by that factor • in other situations possible solutions include adjusting to the ratio with another variable
or setting to a reasonable maximum value and finally, • simply eliminate the extreme record There are sophisticated solutions that are possible, but these are only appropriate with sufficient technical resources.
General Data Dissemination System, II World Bank
An Introduction to Agriculture Statistics, April 2009, Boyko and Hill Page 77
Chapter 13: Estimation Definition of the Concept “Population” In Statistics the term population is used to refer to the entity of interest. It is not the same as concept as population used in demography. The term population may refer to people, but could equally refer to other entities such as holdings, households, fields, businesses.
Basic Statistical Parameters The following is a list of basic parameters that will be defined and discussed
• Total • Number • Probability (Percentage) • Mean or Average • Variance • Standard Deviation • Standard Error Total The total is the number of elements of interest in the sample or the population, or the sum of the elements for continuous elements.
• Total number of persons living in agricultural households • Total Number of Cattle in Mozambique • Total number of coconut palms • Total area cultivated • Total income from selling maize
Number The term “number” refers to the number of units of observation in the sample or the entire population. For household surveys this will normally be number of households nationally or in the sample. It could equally refer to other units of observation such as persons, businesses or holdings
General Data Dissemination System, II World Bank
An Introduction to Agriculture Statistics, April 2009, Boyko and Hill Page 78
Probability (Percentage) Probability refers to the proportion of units in a population or sample with a given characteristic usually measured as a percentage. Percentage = Number with characteristic/ Total number *100.
Examples
• Percentage of female headed households • Percentage of households owning chickens
Arithmetic Mean or Average The arithmetic mean is the total number of units of interest divided by the number of units of observation in the population. There are other types of means, but the arithmetic is the one normally used.
Examples
• Average number of chickens per household • Average household size that is average number of person in the household • Average maize production per household
Standard Deviation The Standard Deviation is a measure of dispersion of the data about the mean or average value. It is the standard parameter used for dispersion or spread of data. This is the simple Formula unweighted
S.D = √((∑(Mean – Xi)2 / n)
Distribution of Household Sizes Sierra Leone Below are two graphs showing the distribution of the size of households from a survey in Sierra Leone. One shows the result for all household, the other for polygamous households.
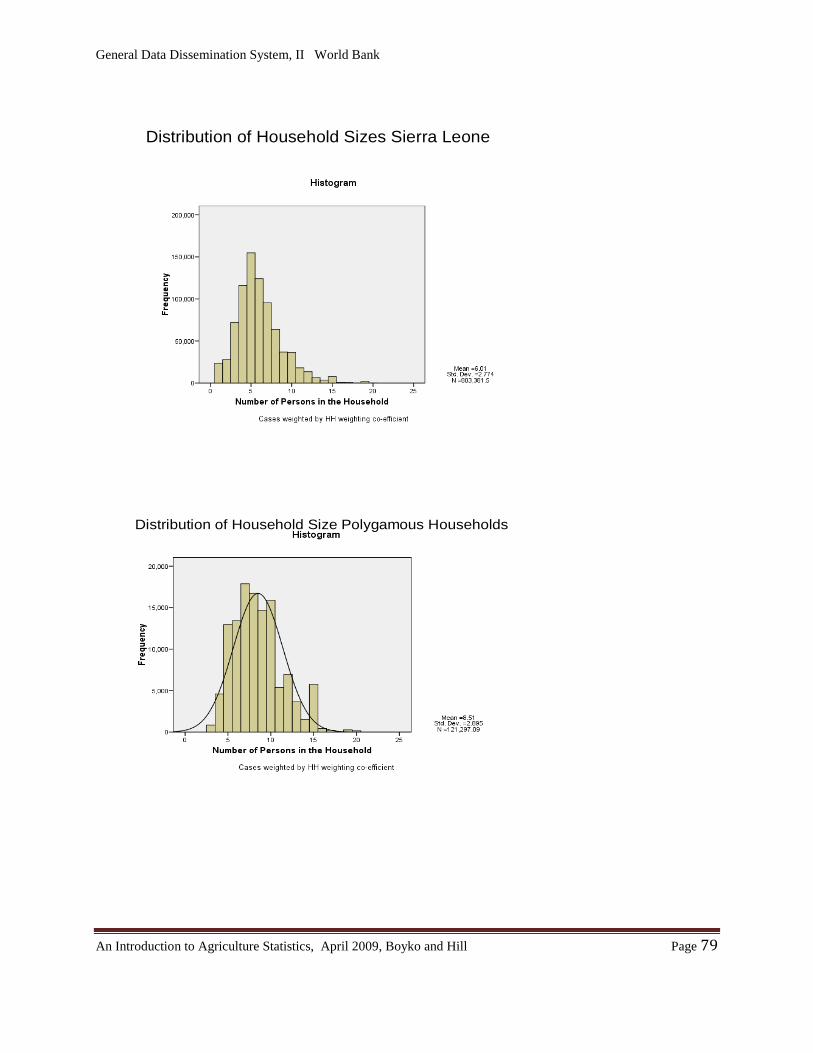
General Data Dissemination System, II World Bank
An Introduction to Agriculture Statistics, April 2009, Boyko and Hill Page 79
Distribution of Household Sizes Sierra Leone
Distribution of Household Size Polygamous Households
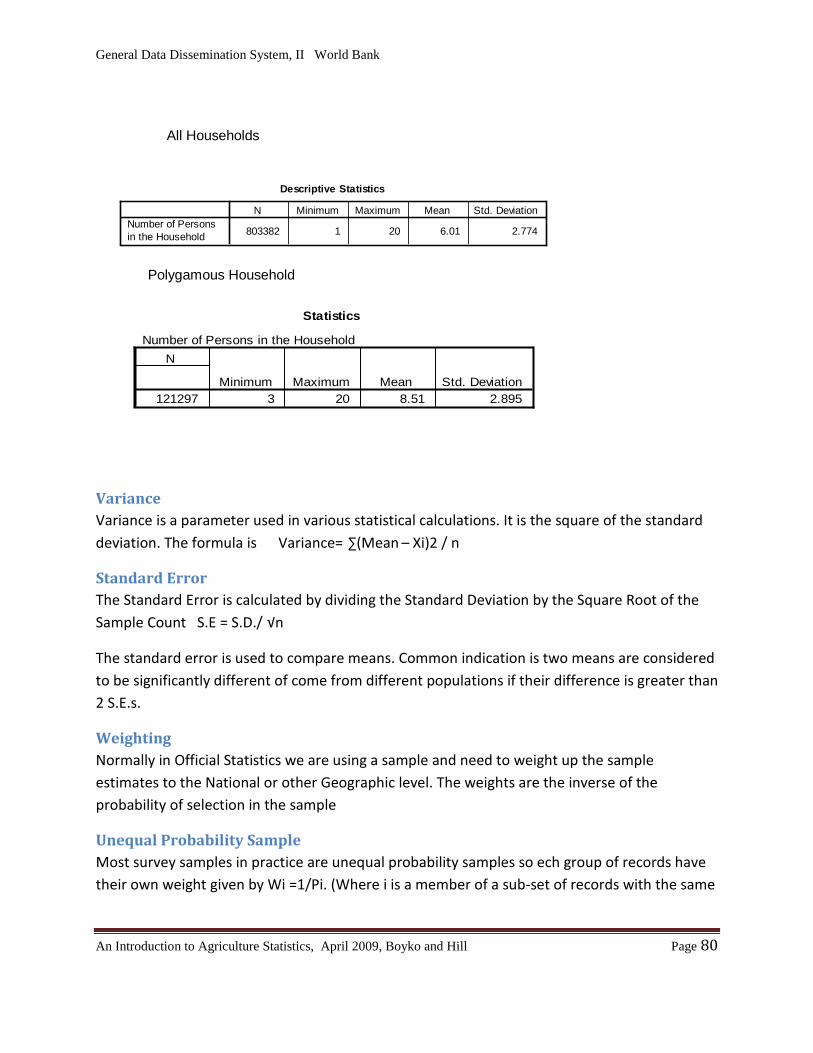
General Data Dissemination System, II World Bank
An Introduction to Agriculture Statistics, April 2009, Boyko and Hill Page 80
Descriptive Statistics
803382 1 20 6.01 2.774Number of Personsin the Household
N Minimum Maximum Mean Std. Deviation
Statistics
Number of Persons in the Household
121297 3 20 8.51 2.895
N
Minimum Maximum Mean Std. Deviation
All Households
Polygamous Household
Variance Variance is a parameter used in various statistical calculations. It is the square of the standard deviation. The formula is Variance= ∑(Mean – Xi)2 / n
Standard Error The Standard Error is calculated by dividing the Standard Deviation by the Square Root of the Sample Count S.E = S.D./ √n
The standard error is used to compare means. Common indication is two means are considered to be significantly different of come from different populations if their difference is greater than 2 S.E.s.
Weighting Normally in Official Statistics we are using a sample and need to weight up the sample estimates to the National or other Geographic level. The weights are the inverse of the probability of selection in the sample
Unequal Probability Sample Most survey samples in practice are unequal probability samples so ech group of records have their own weight given by Wi =1/Pi. (Where i is a member of a sub-set of records with the same
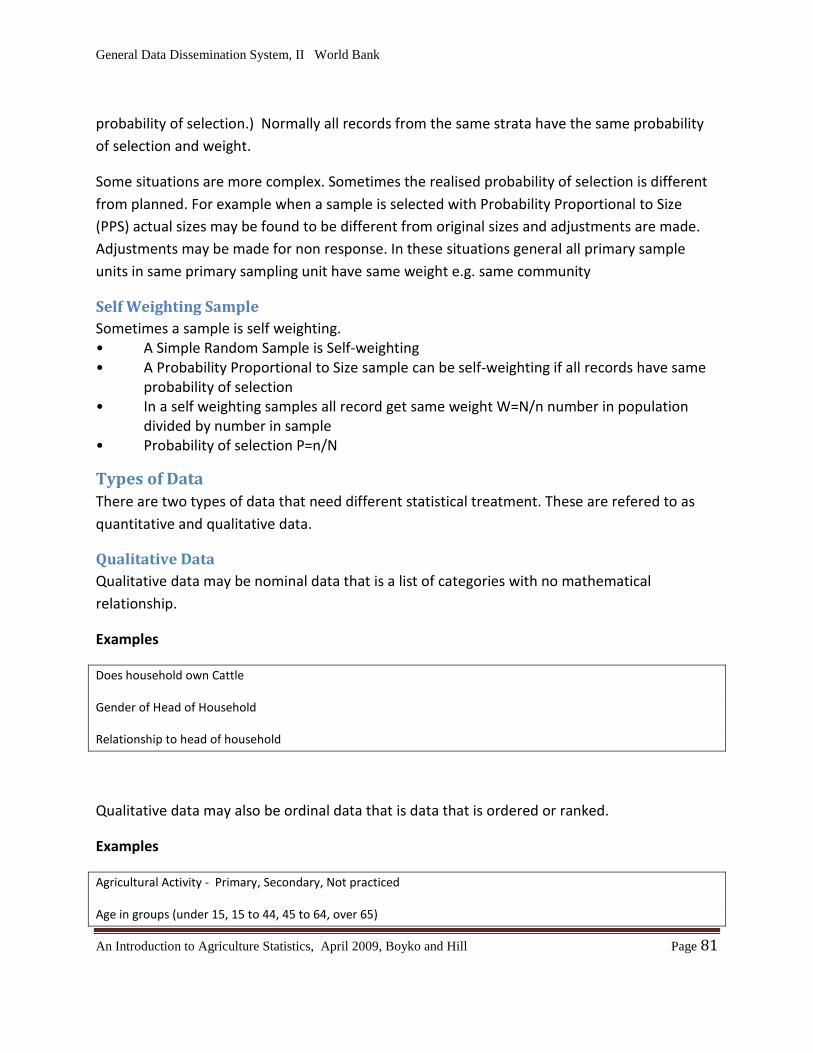
General Data Dissemination System, II World Bank
An Introduction to Agriculture Statistics, April 2009, Boyko and Hill Page 81
probability of selection.) Normally all records from the same strata have the same probability of selection and weight.
Some situations are more complex. Sometimes the realised probability of selection is different from planned. For example when a sample is selected with Probability Proportional to Size (PPS) actual sizes may be found to be different from original sizes and adjustments are made. Adjustments may be made for non response. In these situations general all primary sample units in same primary sampling unit have same weight e.g. same community
Self Weighting Sample Sometimes a sample is self weighting. • A Simple Random Sample is Self-weighting • A Probability Proportional to Size sample can be self-weighting if all records have same
probability of selection • In a self weighting samples all record get same weight W=N/n number in population
divided by number in sample • Probability of selection P=n/N
Types of Data There are two types of data that need different statistical treatment. These are refered to as quantitative and qualitative data.
Qualitative Data Qualitative data may be nominal data that is a list of categories with no mathematical relationship.
Examples
Does household own Cattle
Gender of Head of Household
Relationship to head of household
Qualitative data may also be ordinal data that is data that is ordered or ranked.
Examples
Agricultural Activity - Primary, Secondary, Not practiced
Age in groups (under 15, 15 to 44, 45 to 64, over 65)
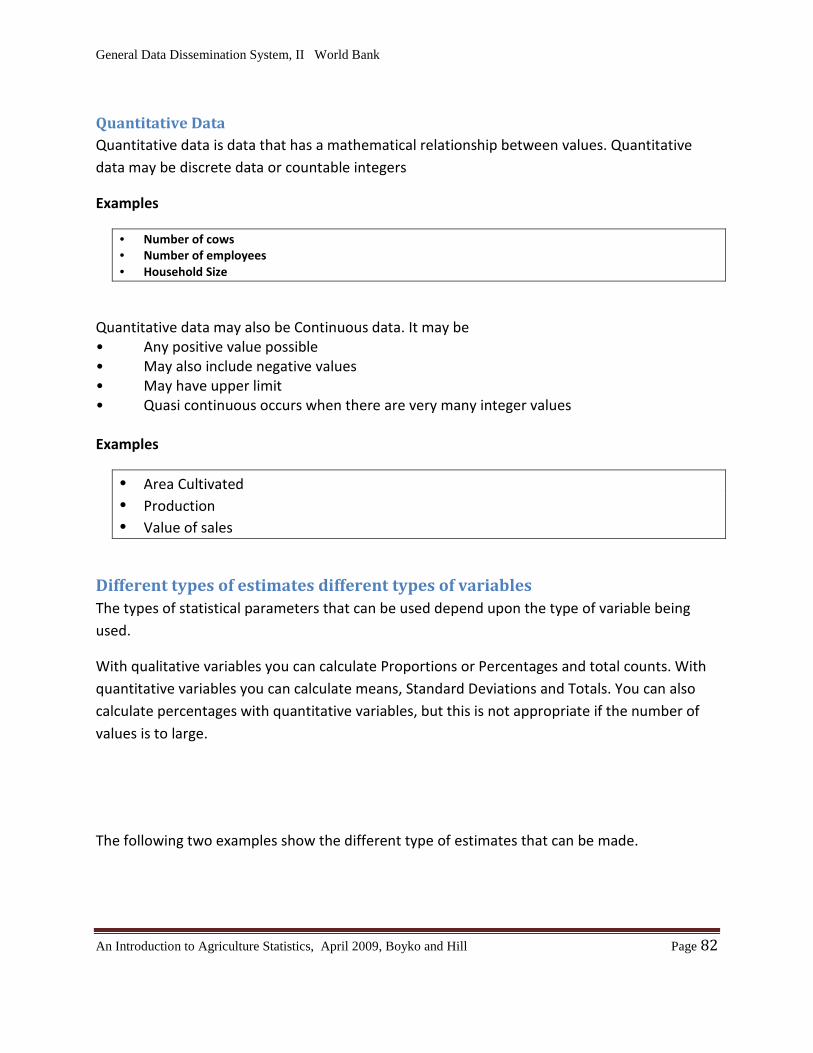
General Data Dissemination System, II World Bank
An Introduction to Agriculture Statistics, April 2009, Boyko and Hill Page 82
Quantitative Data Quantitative data is data that has a mathematical relationship between values. Quantitative data may be discrete data or countable integers
Examples
• Number of cows • Number of employees • Household Size
Quantitative data may also be Continuous data. It may be • Any positive value possible • May also include negative values • May have upper limit • Quasi continuous occurs when there are very many integer values Examples
• Area Cultivated • Production • Value of sales
Different types of estimates different types of variables The types of statistical parameters that can be used depend upon the type of variable being used.
With qualitative variables you can calculate Proportions or Percentages and total counts. With quantitative variables you can calculate means, Standard Deviations and Totals. You can also calculate percentages with quantitative variables, but this is not appropriate if the number of values is to large.
The following two examples show the different type of estimates that can be made.
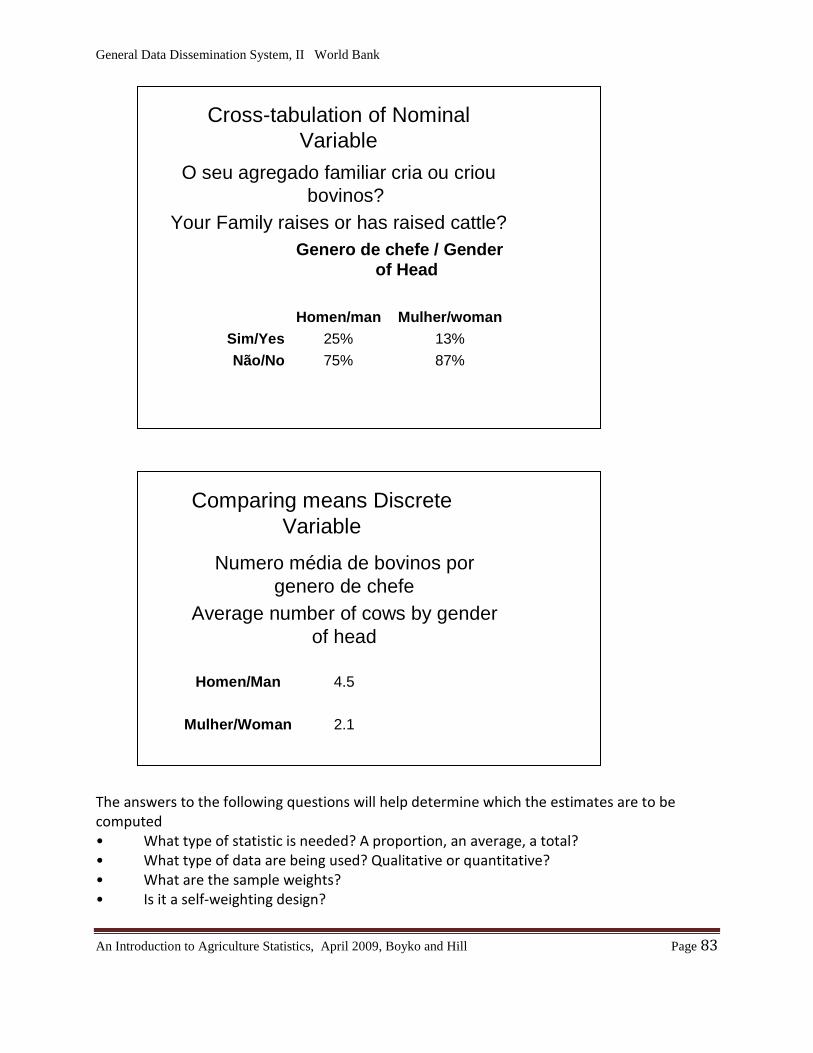
General Data Dissemination System, II World Bank
An Introduction to Agriculture Statistics, April 2009, Boyko and Hill Page 83
The answers to the following questions will help determine which the estimates are to be computed • What type of statistic is needed? A proportion, an average, a total? • What type of data are being used? Qualitative or quantitative? • What are the sample weights? • Is it a self-weighting design?
Cross-tabulation of Nominal Variable
87%75%Não/No13%25%Sim/Yes
Mulher/womanHomen/man
Genero de chefe / Gender of Head
Your Family raises or has raised cattle?
O seu agregado familiar cria ou criou bovinos?
Comparing means Discrete Variable
2.1Mulher/Woman
4.5Homen/Man
Average number of cows by gender of head
Numero média de bovinos por genero de chefe
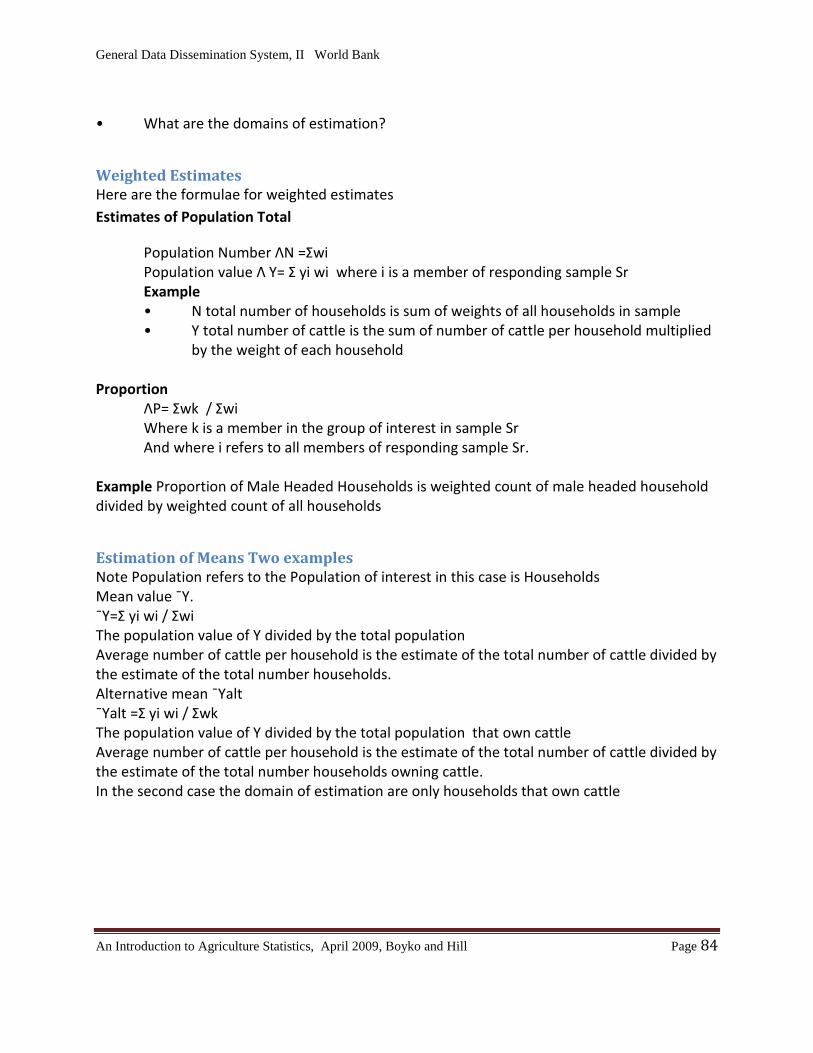
General Data Dissemination System, II World Bank
An Introduction to Agriculture Statistics, April 2009, Boyko and Hill Page 84
• What are the domains of estimation?
Weighted Estimates Here are the formulae for weighted estimates Estimates of Population Total
Population Number ΛN =Σwi Population value Λ Y= Σ yi wi where i is a member of responding sample Sr Example • N total number of households is sum of weights of all households in sample • Y total number of cattle is the sum of number of cattle per household multiplied
by the weight of each household Proportion
ΛP= Σwk / Σwi Where k is a member in the group of interest in sample Sr And where i refers to all members of responding sample Sr.
Example Proportion of Male Headed Households is weighted count of male headed household divided by weighted count of all households
Estimation of Means Two examples Note Population refers to the Population of interest in this case is Households Mean value ¯Y. ¯Y=Σ yi wi / Σwi The population value of Y divided by the total population Average number of cattle per household is the estimate of the total number of cattle divided by the estimate of the total number households. Alternative mean ¯Yalt ¯Yalt =Σ yi wi / Σwk The population value of Y divided by the total population that own cattle Average number of cattle per household is the estimate of the total number of cattle divided by the estimate of the total number households owning cattle. In the second case the domain of estimation are only households that own cattle
General Data Dissemination System, II World Bank
An Introduction to Agriculture Statistics, April 2009, Boyko and Hill Page 85
Chapter 14: Verifying Survey Estimates
Introduction It is useful at this stage of the survey process to review where we are. Data have been collected, captured and processed, a clean data file has been produced, the data have been aggregated and various estimates have been produced, the outputs have been created in SPSS and can used for analysis in SPSS or exported to a spreadsheet. But are the estimates fit to be published? Usually, some sort of verification needs to be applied. The estimates need to be verified.
Verifying Data: Coherence Because there are many possible sources errors in a survey, a number of checks must be performed. Once all of the statistical, processing and estimation checks have been performed, the data must be assessed for coherence. As has already been mentioned “the coherence of statistical information reflects the degree to which it can be successfully brought together with other statistical information within a broad analytic framework and over time. The use of standard concepts, classifications and target populations promotes coherence, as does the use of common methodology across surveys.20
The survey estimates need to be verified and examined in the context of time and supplementary information. Are the levels and changes reasonable? Are there any processing errors that have caused estimates that cannot be explained? Are the estimates consistent with other estimates over time? (time series analysis). Can large changes be explained? Are the changes possible from a scientific point of view? E.g., biology and weather.
For agricultural data it is useful to construct time series and supply-utilization balance sheets.
20 Statistics Canada, op cit.
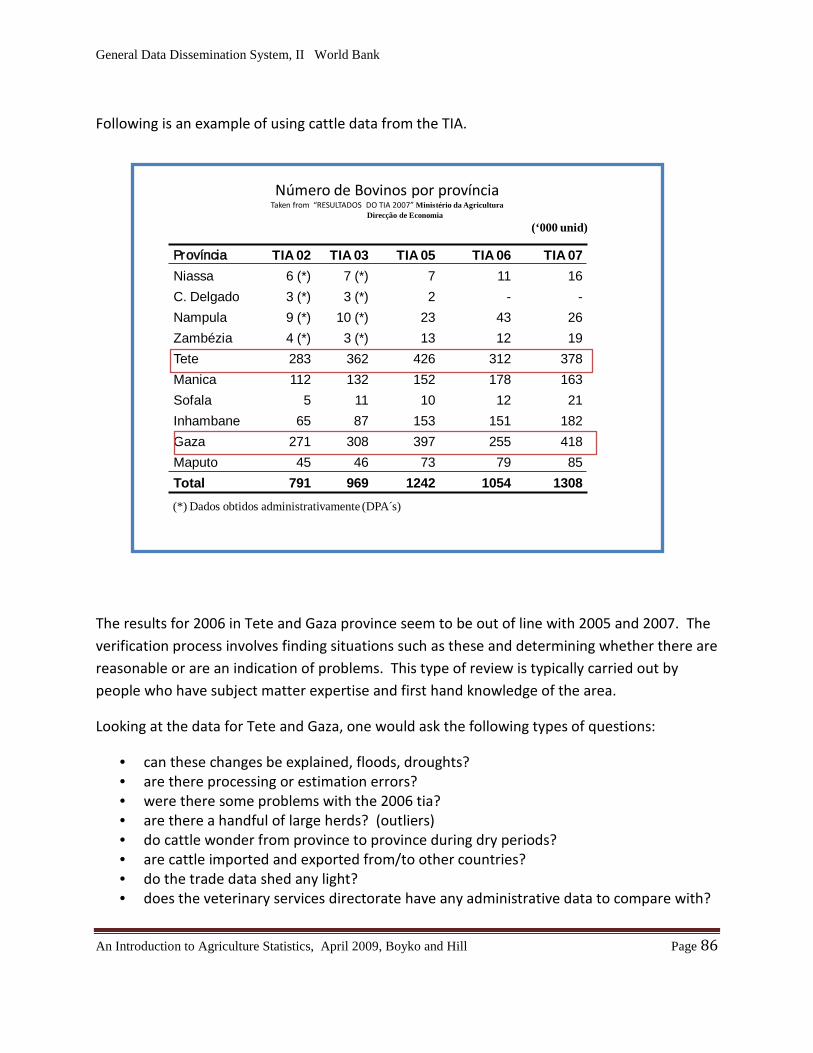
General Data Dissemination System, II World Bank
An Introduction to Agriculture Statistics, April 2009, Boyko and Hill Page 86
Following is an example of using cattle data from the TIA.
The results for 2006 in Tete and Gaza province seem to be out of line with 2005 and 2007. The verification process involves finding situations such as these and determining whether there are reasonable or are an indication of problems. This type of review is typically carried out by people who have subject matter expertise and first hand knowledge of the area.
Looking at the data for Tete and Gaza, one would ask the following types of questions:
• can these changes be explained, floods, droughts? • are there processing or estimation errors? • were there some problems with the 2006 tia? • are there a handful of large herds? (outliers) • do cattle wonder from province to province during dry periods? • are cattle imported and exported from/to other countries? • do the trade data shed any light? • does the veterinary services directorate have any administrative data to compare with?
Número de Bovinos por provínciaTaken from “RESULTADOS DO TIA 2007” Ministério da Agricultura
Direcção de Economia
(‘000 unid)
(*) Dados obtidos administrativamente (DPA´s)
Província TIA 02 TIA 03 TIA 05 TIA 06 TIA 07Niassa 6 (*) 7 (*) 7 11 16C. Delgado 3 (*) 3 (*) 2 - -Nampula 9 (*) 10 (*) 23 43 26Zambézia 4 (*) 3 (*) 13 12 19Tete 283 362 426 312 378Manica 112 132 152 178 163Sofala 5 11 10 12 21Inhambane 65 87 153 151 182Gaza 271 308 397 255 418Maputo 45 46 73 79 85Total 791 969 1242 1054 1308
General Data Dissemination System, II World Bank
An Introduction to Agriculture Statistics, April 2009, Boyko and Hill Page 87
Similar checks can be performed for other variables. For example, for crop data there may be three variables to review:
• Area seeded • Total production • Average yield is derived from production/area
The analyst should look at trends and sample indicators (the same questions as cattle). Since there is a fixed amount of land, one can look at the land balance. Once can track the percentage of land cropped from year to year. If it varies a great deal, can it be explained by such things as weather or market conditions? Can local intelligence offer any insights?
If the survey indicators show that yields and production are higher than average but local weather data show (for example) would indicate that the area has suffered an extreme drought, then the analyst must look for reasons that may cause this discrepancy. Once again some possibilities are:
• processing or data capture errors • estimation errors • extreme responses
For sales and expenditure data, it may be possible to cross reference the survey data with information from various manufacturing and trade sources. Once again, marketing information may give an indication of trends in the industry. If the question has a demographic link (e.g., labour) then the analyst should look at household composition.
It is difficult to give a precise answer as to how to verify survey data. Verification is best done by people with experience and a good knowledge of the subject. Sample surveys can have many different types of errors. The analysts must look for the discrepancies and verify the numbers. If changes need to be made, the decision should be documented and published with the survey results. A review of the survey process may lead to making changes for the next survey cycle.
Later in this document, reference will be made to the benefit of constructing supply-utilization balance sheets which can also be used to spot inconsistencies in data.
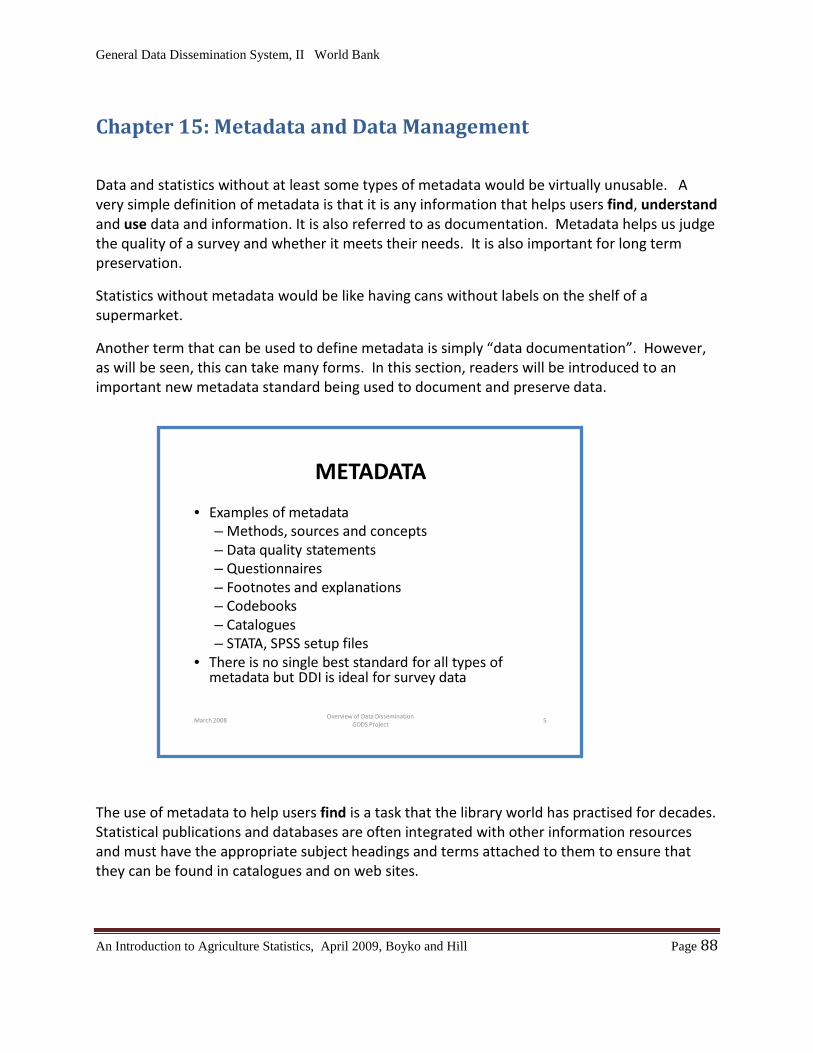
General Data Dissemination System, II World Bank
An Introduction to Agriculture Statistics, April 2009, Boyko and Hill Page 88
Chapter 15: Metadata and Data Management
Data and statistics without at least some types of metadata would be virtually unusable. A very simple definition of metadata is that it is any information that helps users find, understand and use data and information. It is also referred to as documentation. Metadata helps us judge the quality of a survey and whether it meets their needs. It is also important for long term preservation.
Statistics without metadata would be like having cans without labels on the shelf of a supermarket.
Another term that can be used to define metadata is simply “data documentation”. However, as will be seen, this can take many forms. In this section, readers will be introduced to an important new metadata standard being used to document and preserve data.
The use of metadata to help users find is a task that the library world has practised for decades. Statistical publications and databases are often integrated with other information resources and must have the appropriate subject headings and terms attached to them to ensure that they can be found in catalogues and on web sites.
March 2008Overview of Data Dissemination
GDDS Project5
METADATA
• Examples of metadata– Methods, sources and concepts – Data quality statements– Questionnaires– Footnotes and explanations– Codebooks– Catalogues– STATA, SPSS setup files
• There is no single best standard for all types of metadata but DDI is ideal for survey data
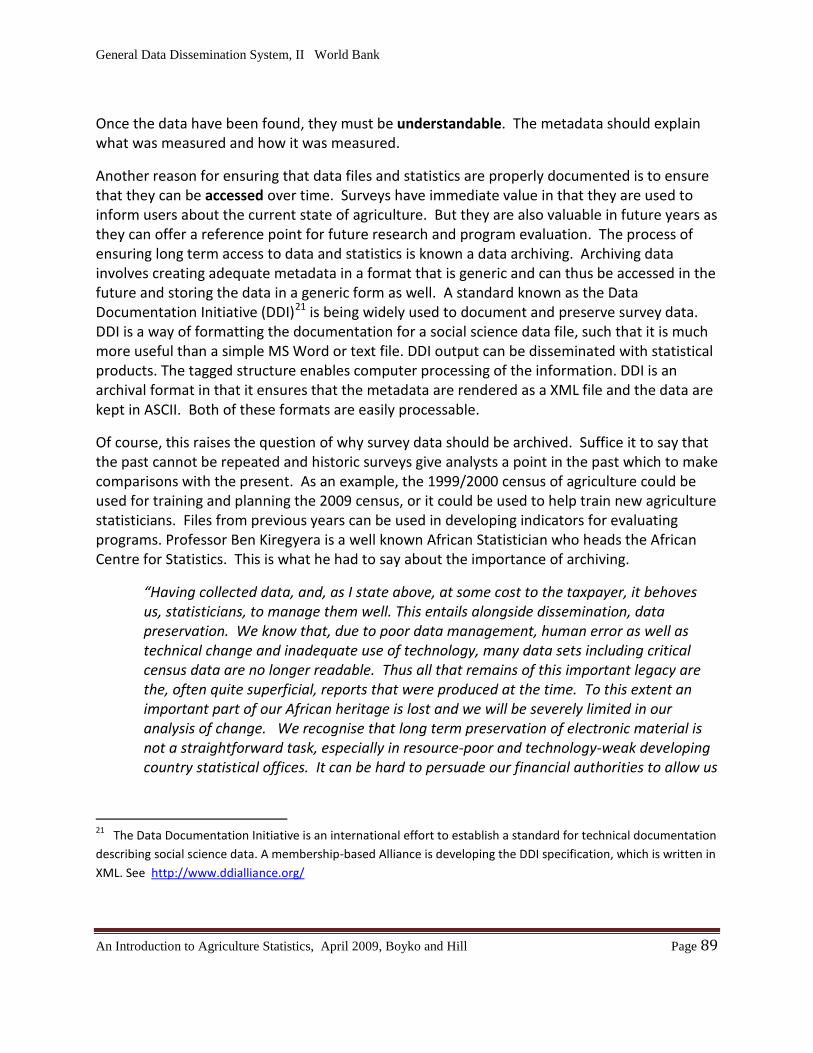
General Data Dissemination System, II World Bank
An Introduction to Agriculture Statistics, April 2009, Boyko and Hill Page 89
Once the data have been found, they must be understandable. The metadata should explain what was measured and how it was measured.
Another reason for ensuring that data files and statistics are properly documented is to ensure that they can be accessed over time. Surveys have immediate value in that they are used to inform users about the current state of agriculture. But they are also valuable in future years as they can offer a reference point for future research and program evaluation. The process of ensuring long term access to data and statistics is known a data archiving. Archiving data involves creating adequate metadata in a format that is generic and can thus be accessed in the future and storing the data in a generic form as well. A standard known as the Data Documentation Initiative (DDI)21
Of course, this raises the question of why survey data should be archived. Suffice it to say that the past cannot be repeated and historic surveys give analysts a point in the past which to make comparisons with the present. As an example, the 1999/2000 census of agriculture could be used for training and planning the 2009 census, or it could be used to help train new agriculture statisticians. Files from previous years can be used in developing indicators for evaluating programs. Professor Ben Kiregyera is a well known African Statistician who heads the African Centre for Statistics. This is what he had to say about the importance of archiving.
is being widely used to document and preserve survey data. DDI is a way of formatting the documentation for a social science data file, such that it is much more useful than a simple MS Word or text file. DDI output can be disseminated with statistical products. The tagged structure enables computer processing of the information. DDI is an archival format in that it ensures that the metadata are rendered as a XML file and the data are kept in ASCII. Both of these formats are easily processable.
“Having collected data, and, as I state above, at some cost to the taxpayer, it behoves us, statisticians, to manage them well. This entails alongside dissemination, data preservation. We know that, due to poor data management, human error as well as technical change and inadequate use of technology, many data sets including critical census data are no longer readable. Thus all that remains of this important legacy are the, often quite superficial, reports that were produced at the time. To this extent an important part of our African heritage is lost and we will be severely limited in our analysis of change. We recognise that long term preservation of electronic material is not a straightforward task, especially in resource-poor and technology-weak developing country statistical offices. It can be hard to persuade our financial authorities to allow us
21 The Data Documentation Initiative is an international effort to establish a standard for technical documentation describing social science data. A membership-based Alliance is developing the DDI specification, which is written in XML. See http://www.ddialliance.org/
General Data Dissemination System, II World Bank
An Introduction to Agriculture Statistics, April 2009, Boyko and Hill Page 90
to spend money on the preservation of data for historians and statisticians of the future, when there are so many pressing problems today. To this end partnership - for both technical work and advocacy – across the data archiving, data librarian, statistical and research communities is to be encouraged.”22
To conclude, metadata are important for dissemination and long term preservation (data archiving) and archiving is important to support analysis and research. As will be shown later, data archiving tools and programs are available to countries.
22 Prof. Ben Kiregyera, Presentation sent to the Inaugural meeting of the African Association of Statistical Data Archivists, Cape Town, April, 2008.
General Data Dissemination System, II World Bank
An Introduction to Agriculture Statistics, April 2009, Boyko and Hill Page 91
Chapter 16: Data Analysis, Product Creation and Dissemination
Introduction The importance of analysing surveys and creating products for users to use cannot be over emphasized in terms of its importance. To quote Prof. Kiregyera:
“I think that we statisticians have focussed to too large an extent on the problems of collecting data and have given insufficient attention to our roles in generating information and knowledge. This is understandable since collecting information is costly and difficult and it is important that we ensure we have the best quality data for the resources expended. So perhaps this explains why many National Statistical Agencies in developing countries have built up impressive mountains of data which are insufficiently processed and analyzed. But given that most people are not adept at understanding data one can argue it is even more important for statisticians to get involved in the interpretation and use of information. Thus one of the challenges facing many National Statistical Agencies in Africa, and I believe other developing countries, is to graduate from being collectors of data to being generators of information and knowledge.” 23
Analysis is the process of summarizing and interpreting the data collected in such a way that users can glean the insights economic and social issues. The products from analysis can take on many forms. Analysis may be as simple as the interpretation of tables and trends or it may involve building models and conducting inferential analysis. For the purpose of the training session in Maputo, Chris Hill led the class through an analysis gender in Mozambique agriculture.
24
The main purpose of introducing analysis is to make the reader aware of the importance of this activity. The rest of this chapter will focus on the creation of products, for the purposes of dissemination. The dissemination of such products will typically be accompanied with descriptive analysis.
Due to the length of this document, it will not be reproduced here.
Dissemination Dissemination is the process of creating and distributing relevant data and information products to target audiences. Data products should be of a defined quality, delivered in a timely fashion in a format suitable for the intended use. Access to data and information is available now and in the future. Dissemination is the ultimate objective of any statistical system as it is a way to meet the objectives of the organization. Statistics only become official when they are
23 Prof. Ben Kiregyera, ibid
24 Christopher Hill, Gender Based Analysis of the Smallholder Agriculture Sector in Mozambique using data from the 2002 Annual Agricultural Survey, unpublished research available by contacting the author at
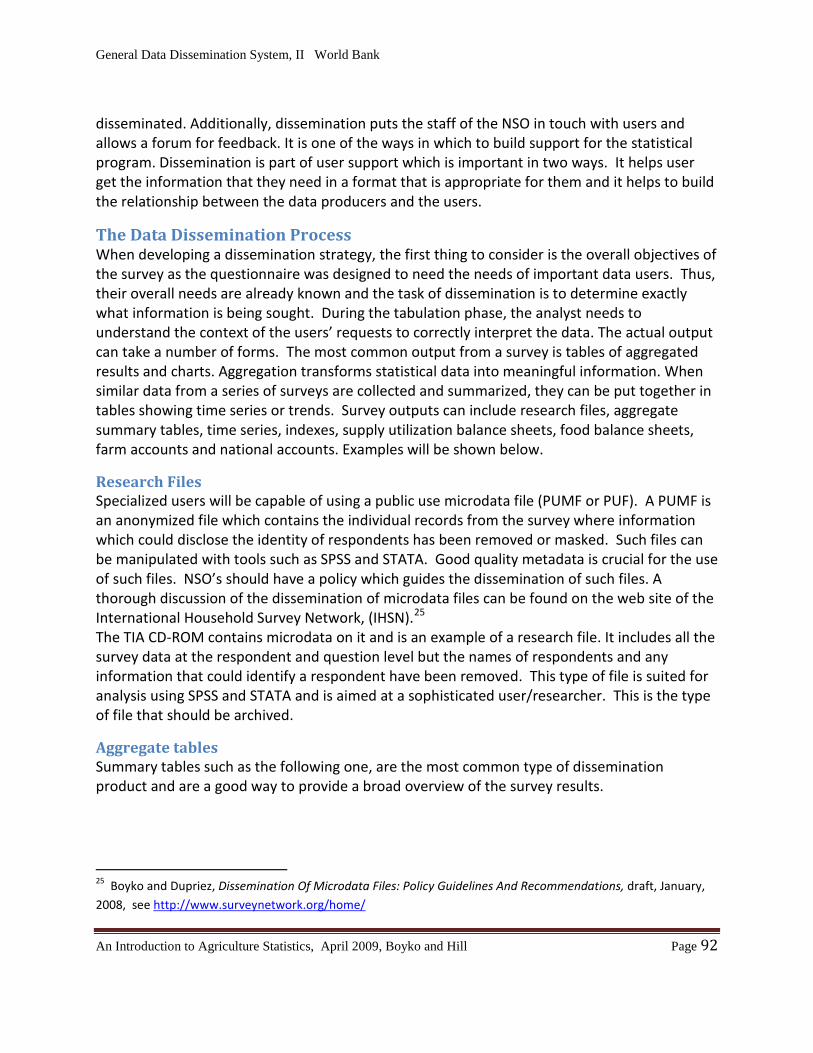
General Data Dissemination System, II World Bank
An Introduction to Agriculture Statistics, April 2009, Boyko and Hill Page 92
disseminated. Additionally, dissemination puts the staff of the NSO in touch with users and allows a forum for feedback. It is one of the ways in which to build support for the statistical program. Dissemination is part of user support which is important in two ways. It helps user get the information that they need in a format that is appropriate for them and it helps to build the relationship between the data producers and the users.
The Data Dissemination Process When developing a dissemination strategy, the first thing to consider is the overall objectives of the survey as the questionnaire was designed to need the needs of important data users. Thus, their overall needs are already known and the task of dissemination is to determine exactly what information is being sought. During the tabulation phase, the analyst needs to understand the context of the users’ requests to correctly interpret the data. The actual output can take a number of forms. The most common output from a survey is tables of aggregated results and charts. Aggregation transforms statistical data into meaningful information. When similar data from a series of surveys are collected and summarized, they can be put together in tables showing time series or trends. Survey outputs can include research files, aggregate summary tables, time series, indexes, supply utilization balance sheets, food balance sheets, farm accounts and national accounts. Examples will be shown below.
Research Files Specialized users will be capable of using a public use microdata file (PUMF or PUF). A PUMF is an anonymized file which contains the individual records from the survey where information which could disclose the identity of respondents has been removed or masked. Such files can be manipulated with tools such as SPSS and STATA. Good quality metadata is crucial for the use of such files. NSO’s should have a policy which guides the dissemination of such files. A thorough discussion of the dissemination of microdata files can be found on the web site of the International Household Survey Network, (IHSN).25
The TIA CD-ROM contains microdata on it and is an example of a research file. It includes all the survey data at the respondent and question level but the names of respondents and any information that could identify a respondent have been removed. This type of file is suited for analysis using SPSS and STATA and is aimed at a sophisticated user/researcher. This is the type of file that should be archived.
Aggregate tables Summary tables such as the following one, are the most common type of dissemination product and are a good way to provide a broad overview of the survey results.
25 Boyko and Dupriez, Dissemination Of Microdata Files: Policy Guidelines And Recommendations, draft, January, 2008, see http://www.surveynetwork.org/home/
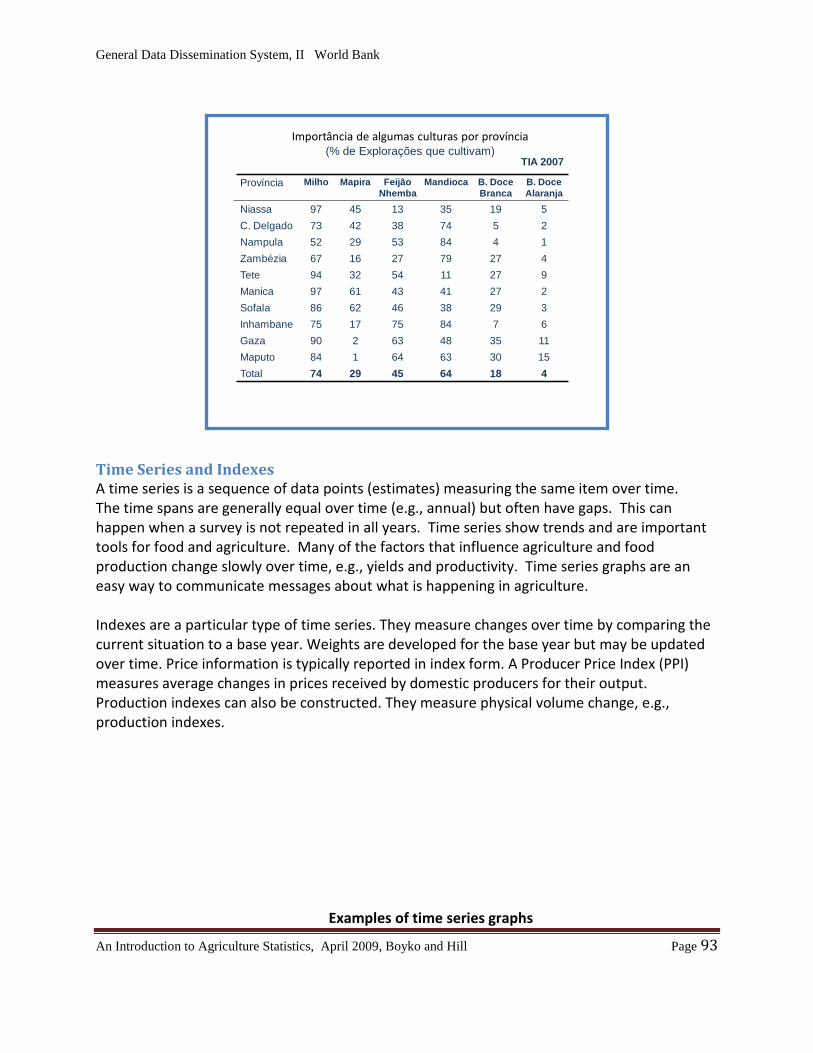
General Data Dissemination System, II World Bank
An Introduction to Agriculture Statistics, April 2009, Boyko and Hill Page 93
Time Series and Indexes A time series is a sequence of data points (estimates) measuring the same item over time. The time spans are generally equal over time (e.g., annual) but often have gaps. This can happen when a survey is not repeated in all years. Time series show trends and are important tools for food and agriculture. Many of the factors that influence agriculture and food production change slowly over time, e.g., yields and productivity. Time series graphs are an easy way to communicate messages about what is happening in agriculture. Indexes are a particular type of time series. They measure changes over time by comparing the current situation to a base year. Weights are developed for the base year but may be updated over time. Price information is typically reported in index form. A Producer Price Index (PPI) measures average changes in prices received by domestic producers for their output. Production indexes can also be constructed. They measure physical volume change, e.g., production indexes.
Examples of time series graphs
Importância de algumas culturas por província(% de Explorações que cultivam)
TIA 2007
Província Milho Mapira Feijão Nhemba
Mandioca B. Doce Branca
B. Doce Alaranja
Niassa 97 45 13 35 19 5C. Delgado 73 42 38 74 5 2Nampula 52 29 53 84 4 1Zambézia 67 16 27 79 27 4Tete 94 32 54 11 27 9Manica 97 61 43 41 27 2Sofala 86 62 46 38 29 3Inhambane 75 17 75 84 7 6Gaza 90 2 63 48 35 11Maputo 84 1 64 63 30 15Total 74 29 45 64 18 4
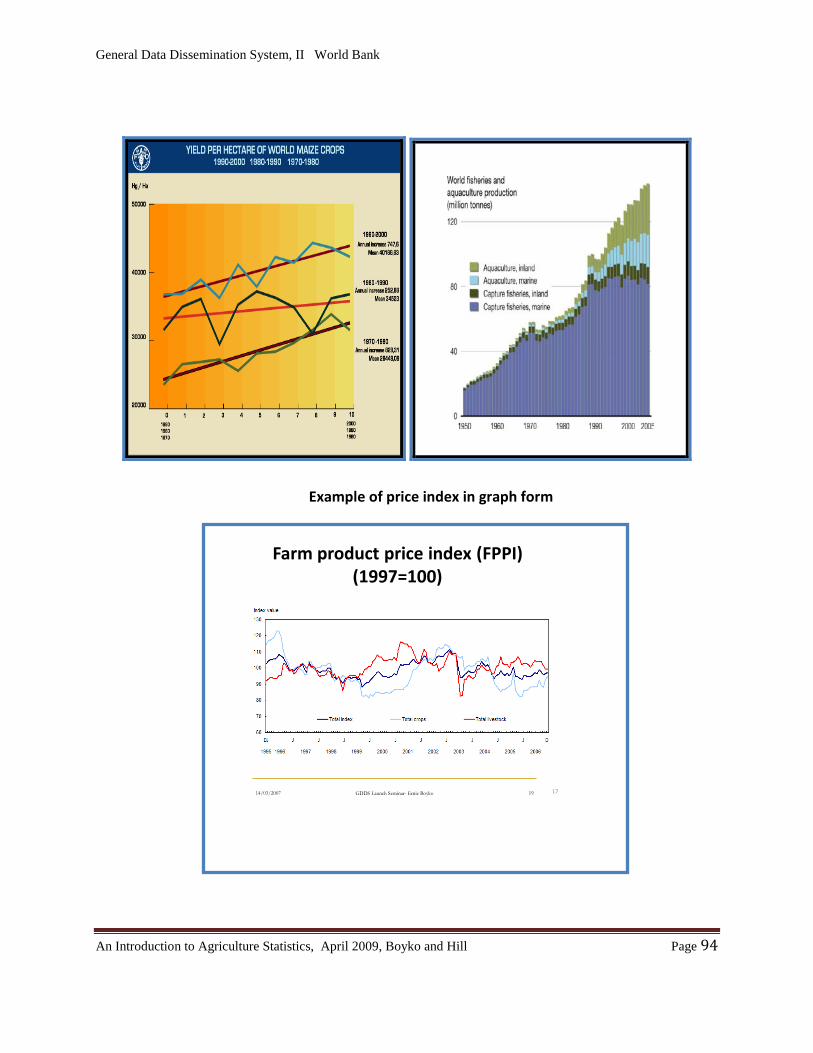
General Data Dissemination System, II World Bank
An Introduction to Agriculture Statistics, April 2009, Boyko and Hill Page 94
13/04/2009 GDDS Launch Seminar- Ernie Boyko 14
Example of price index in graph form
12/04/2009 GDDS Launch Seminar- Ernie Boyko 1714/03/2007 GDDS Launch Seminar- Ernie Boyko 19
Farm product price index (FPPI) (1997=100)
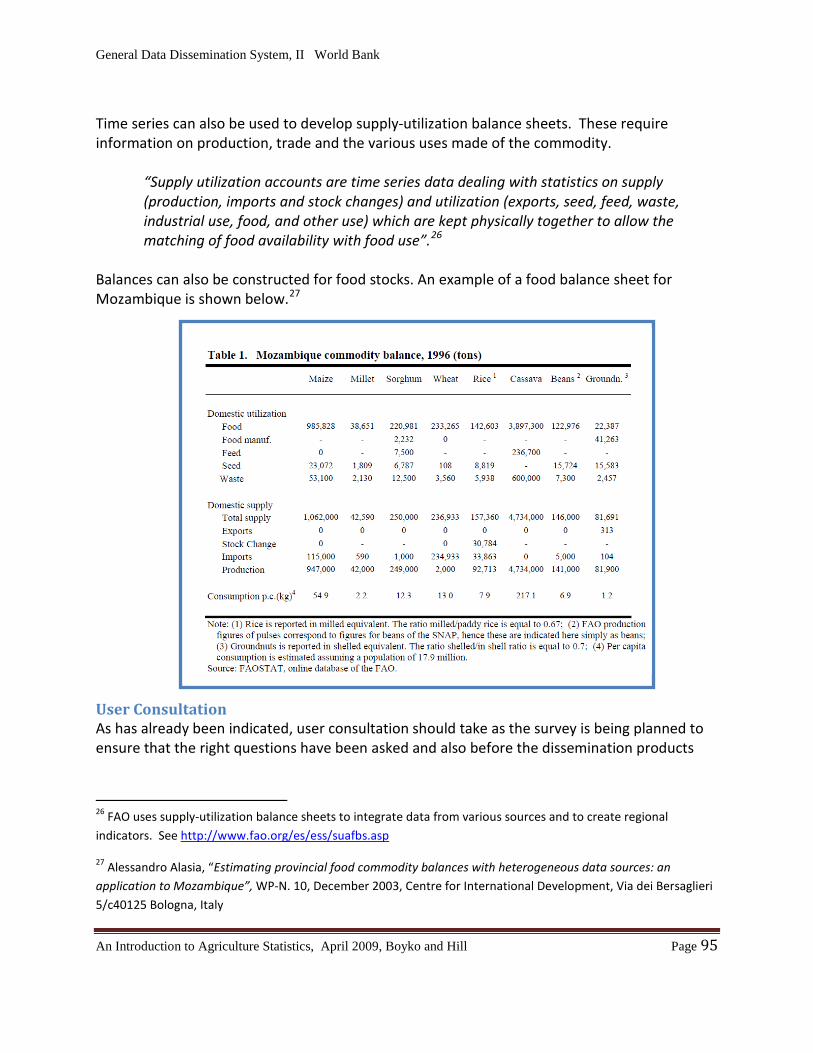
General Data Dissemination System, II World Bank
An Introduction to Agriculture Statistics, April 2009, Boyko and Hill Page 95
Time series can also be used to develop supply-utilization balance sheets. These require information on production, trade and the various uses made of the commodity.
“Supply utilization accounts are time series data dealing with statistics on supply (production, imports and stock changes) and utilization (exports, seed, feed, waste, industrial use, food, and other use) which are kept physically together to allow the matching of food availability with food use”.26
Balances can also be constructed for food stocks. An example of a food balance sheet for Mozambique is shown below.27
User Consultation As has already been indicated, user consultation should take as the survey is being planned to ensure that the right questions have been asked and also before the dissemination products
26 FAO uses supply-utilization balance sheets to integrate data from various sources and to create regional indicators. See http://www.fao.org/es/ess/suafbs.asp
27 Alessandro Alasia, “Estimating provincial food commodity balances with heterogeneous data sources: an application to Mozambique”, WP-N. 10, December 2003, Centre for International Development, Via dei Bersaglieri 5/c40125 Bologna, Italy
General Data Dissemination System, II World Bank
An Introduction to Agriculture Statistics, April 2009, Boyko and Hill Page 96
are produced. This consultation would help determine the nature of the product and also the delivery mechanism.
The purpose of the consultations (which can take various forms) is to find out what are the users are using now (if anything) and how are they using it. More importantly, what would they like to have should be determined. Are there unmet needs? In some cases, the users may want to receive custom tabulations to support their work as it evolves. These can often be done on a cost recovery basis.
The delivery mechanism is also an important consideration when organizing a dissemination service. Traditionally, most statistics were disseminated on paper but in today’s world, web sites and databases can be used as dissemination vehicles and as repositories from which tables can be drawn at will. The choices made will depend on the needs of the users and the resources of the data producing agency.
Conclusions Analysis and dissemination are crucial steps in the survey process. They are in fact, the way that one can ensure that the survey’s objectives are fulfilled. They require close cooperation with the users. There are many different products and ways of delivering them to users.
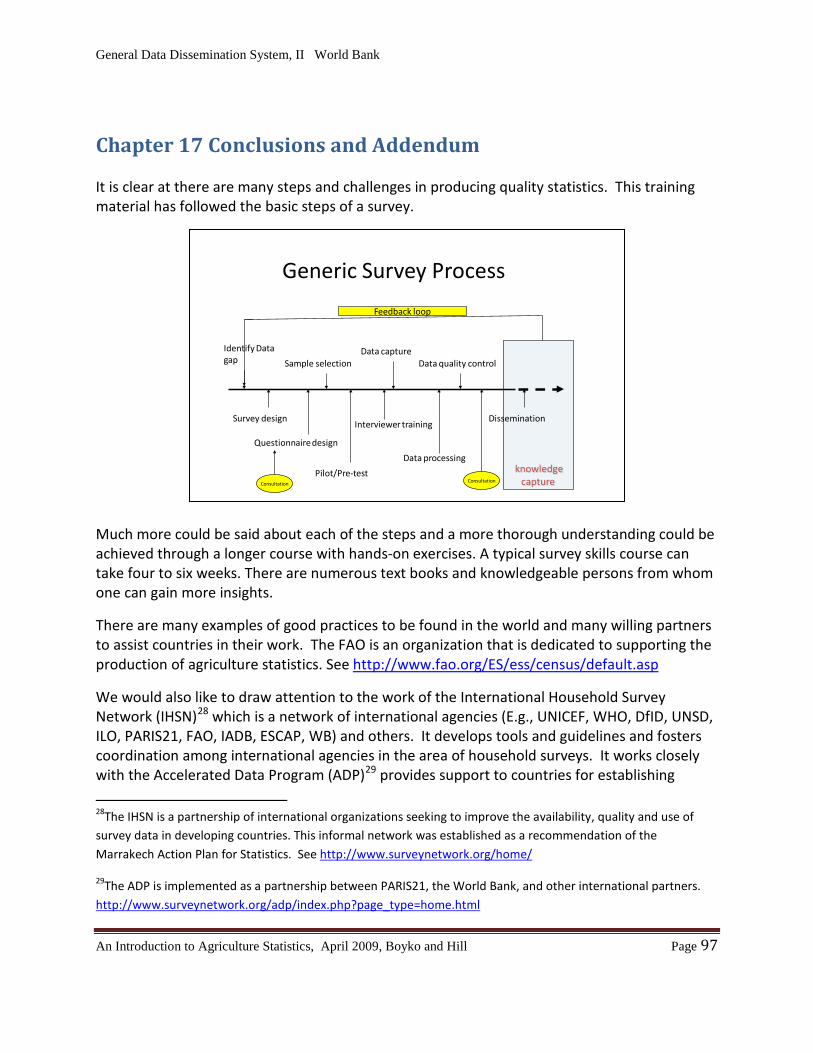
General Data Dissemination System, II World Bank
An Introduction to Agriculture Statistics, April 2009, Boyko and Hill Page 97
Chapter 17 Conclusions and Addendum
It is clear at there are many steps and challenges in producing quality statistics. This training material has followed the basic steps of a survey.
Much more could be said about each of the steps and a more thorough understanding could be achieved through a longer course with hands-on exercises. A typical survey skills course can take four to six weeks. There are numerous text books and knowledgeable persons from whom one can gain more insights.
There are many examples of good practices to be found in the world and many willing partners to assist countries in their work. The FAO is an organization that is dedicated to supporting the production of agriculture statistics. See http://www.fao.org/ES/ess/census/default.asp
We would also like to draw attention to the work of the International Household Survey Network (IHSN)28 which is a network of international agencies (E.g., UNICEF, WHO, DfID, UNSD, ILO, PARIS21, FAO, IADB, ESCAP, WB) and others. It develops tools and guidelines and fosters coordination among international agencies in the area of household surveys. It works closely with the Accelerated Data Program (ADP)29
28The IHSN is a partnership of international organizations seeking to improve the availability, quality and use of survey data in developing countries. This informal network was established as a recommendation of the Marrakech Action Plan for Statistics. See
provides support to countries for establishing
http://www.surveynetwork.org/home/
29The ADP is implemented as a partnership between PARIS21, the World Bank, and other international partners. http://www.surveynetwork.org/adp/index.php?page_type=home.html
knowledgecapture
Generic Survey Process
Survey design
Identify Data gap Sample selection
Questionnaire design
Pilot/Pre-test
Interviewer training
Data processing
Data quality control
Dissemination
Data capture
Feedback loop
Consultation Consultation
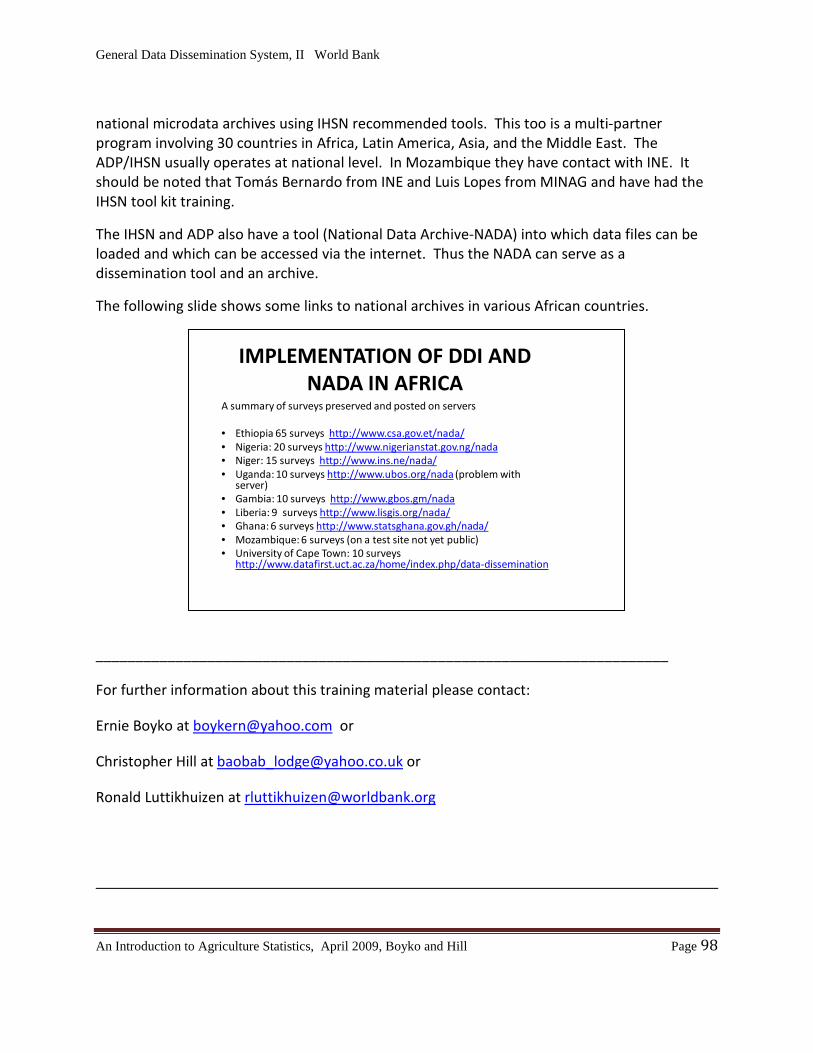
General Data Dissemination System, II World Bank
An Introduction to Agriculture Statistics, April 2009, Boyko and Hill Page 98
national microdata archives using IHSN recommended tools. This too is a multi-partner program involving 30 countries in Africa, Latin America, Asia, and the Middle East. The ADP/IHSN usually operates at national level. In Mozambique they have contact with INE. It should be noted that Tomás Bernardo from INE and Luis Lopes from MINAG and have had the IHSN tool kit training.
The IHSN and ADP also have a tool (National Data Archive-NADA) into which data files can be loaded and which can be accessed via the internet. Thus the NADA can serve as a dissemination tool and an archive.
The following slide shows some links to national archives in various African countries.
________________________________________________________________________
For further information about this training material please contact:
Ernie Boyko at [email protected] or
Christopher Hill at [email protected] or
Ronald Luttikhuizen at [email protected]
IMPLEMENTATION OF DDI AND NADA IN AFRICA
A summary of surveys preserved and posted on servers
• Ethiopia 65 surveys http://www.csa.gov.et/nada/• Nigeria: 20 surveys http://www.nigerianstat.gov.ng/nada• Niger: 15 surveys http://www.ins.ne/nada/• Uganda: 10 surveys http://www.ubos.org/nada (problem with
server)• Gambia: 10 surveys http://www.gbos.gm/nada• Liberia: 9 surveys http://www.lisgis.org/nada/• Ghana: 6 surveys http://www.statsghana.gov.gh/nada/• Mozambique: 6 surveys (on a test site not yet public)• University of Cape Town: 10 surveys
http://www.datafirst.uct.ac.za/home/index.php/data-dissemination
Related Documents