1077-2626/13/$31.00 © 2013 IEEE Published by the IEEE Computer Society Accepted for publication by IEEE. ©2013 IEEE. Personal use of this material is permitted. Permission from IEEE must be obtained for all other uses, in any current or future media, including reprinting/ republishing this material for advertising or promotional purposes, creating new collective works, for resale or redistribution to servers or lists, or reuse of any copyrighted component of this work in other works. An Interaction Model for Visualizations Beyond The Desktop Yvonne Jansen and Pierre Dragicevic Fig. 1. Examples of beyond-desktop interactive visualizations: a) tangible range sliders for wall-sized displays [32], b) a rearrangeable physical 3D chart [33], c) an interactive data sculpture of time series [54], d) an interactive shape-changing display [40]. Abstract—We present an interaction model for beyond-desktop visualizations that combines the visualization reference model with the instrumental interaction paradigm. Beyond-desktop visualizations involve a wide range of emerging technologies such as wall- sized displays, 3D and shape-changing displays, touch and tangible input, and physical information visualizations. While these technologies allow for new forms of interaction, they are often studied in isolation. New conceptual models are needed to build a coherent picture of what has been done and what is possible. We describe a modified pipeline model where raw data is processed into a visualization and then rendered into the physical world. Users can explore or change data by directly manipulating visualizations or through the use of instruments. Interactions can also take place in the physical world outside the visualization system, such as when using locomotion to inspect a large scale visualization. Through case studies we illustrate how this model can be used to describe both conventional and unconventional interactive visualization systems, and compare different design alternatives. Index Terms—Information visualization, interaction model, notational system, physical visualization 1 I NTRODUCTION External, physical representations of information are older than the invention of writing [50, p.94]. External representations promote ex- ternal cognition and visual thinking [11], and humans developed a rich set of skills for crafting and exploring them. In addition to mere vi- sual exploration, the manipulation of external representations has been shown to be a key component of external cognition [35, 18, 36, 46]. Computers immensely increased the amount of data we can collect, process and visualize, and diversified the ways we can represent it vi- sually. Visualization systems became powerful and complex, and so- phisticated interaction techniques are now necessary to control them. With the widening of technological possibilities beyond classic desktop settings, new opportunities have emerged (see Figure 1 for a small sample). Not only display surfaces of arbitrary shapes and sizes can be used to show richer visualizations, but also new input technologies can be used to manipulate them. These include multi- touch surfaces and tangible controllers, which promise to take better advantage of our natural abilities to manipulate physical objects [31]. New opportunities also arose in the area of physical information visualization [33], where visualizations themselves are made physi- cal, either to enrich their perception or to facilitate their manipula- tion. With digital fabrication technologies and fab labs, the production of physical visualizations became easier and accessible to all. With recent advances in actuated physical displays [47], computationally- augmented physical visualizations are now starting to be considered. • Yvonne Jansen is with Inria and Universit´ e Paris Sud. E-mail: [email protected]. • Pierre Dragicevic is with Inria. E-mail: [email protected]. Manuscript received 31 March 2013; accepted 1 August 2013; posted online 13 October 2013; mailed on 4 October 2013. For information on obtaining reprints of this article, please send e-mail to: [email protected]. However, new opportunities also bring new challenges. Some of these are technological and are actively being researched. Another se- rious challenge lies in the informed design of beyond-desktop visual- ization systems, i.e, building systems that harness both human capaci- ties and the power of new technologies. Although theories and models have been proposed that help design desktop visualizations, interac- tion with visualization systems now needs to be seen as situated in the midst of heterogeneous displays and interaction instruments [39]. Due to the lack of new conceptual models, it is hard to build a coherent picture of beyond-desktop systems that have been proposed so far, and to reflect on this work in a way that can inform future design. We present a conceptual interaction model and visual notation sys- tem that aims to facilitate the description, comparison and criticism of beyond-desktop visualization systems. This model refines and unifies the information visualization reference model [11, 13] and the instru- mental interaction model [7]. We first introduce our model and illus- trate it with simple examples. Many of these examples are taken from desktop visualization systems, as these have reached maturity, they are familiar to most readers, and they support a number of complex in- teractions. We believe that better understanding desktop visualization systems can help understand beyond-desktop systems and vice versa. We then illustrate how to use our model and visual notation through case studies of less conventional visualization systems. We conclude with a discussion of the strengths and the limits of our model. 2 AN ADAPTED I NFOVIS PIPELINE The process of information visualization can be described as a se- quence of data transformations that go through several stages until a final image is produced. This process is referred to as the visualization reference model or the “infovis pipeline” and has been described by Card et al. [11] and Chi and Riedl [13], and refined by others [12, 56]. While the infovis pipeline is extremely useful for understanding information visualization systems, previous models have been essen- tially focusing on desktop systems. In this section we describe an in- fovis pipeline that shares many similarities with previous models but has been extended to better capture non-conventional setups.

Welcome message from author
This document is posted to help you gain knowledge. Please leave a comment to let me know what you think about it! Share it to your friends and learn new things together.
Transcript
1077-2626/13/$31.00 © 2013 IEEE Published by the IEEE Computer Society
Accepted for publication by IEEE. ©2013 IEEE. Personal use of this material is permitted. Permission from IEEE must be obtained for all other uses, in any current or future media, including reprinting/republishing this material for advertising or promotional purposes, creating new collective works, for resale or redistribution to servers or lists, or reuse of any copyrighted component of this work in other works.
An Interaction Model for Visualizations Beyond The Desktop
Yvonne Jansen and Pierre Dragicevic
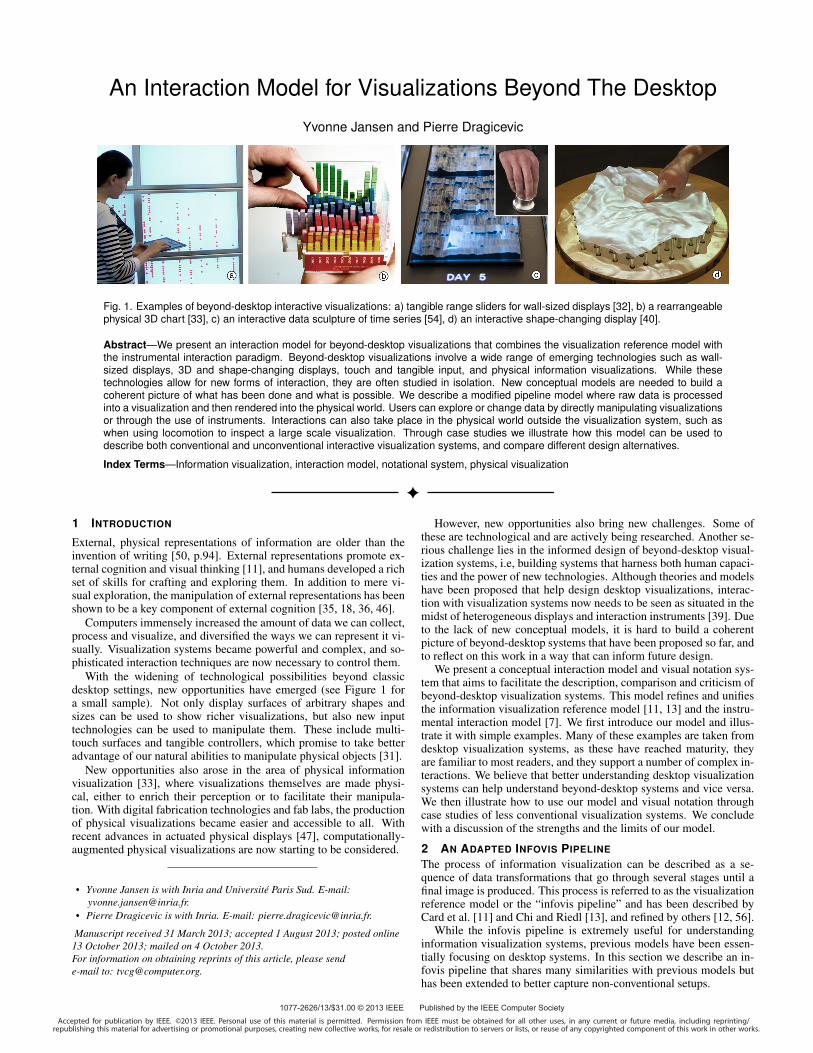
Fig. 1. Examples of beyond-desktop interactive visualizations: a) tangible range sliders for wall-sized displays [32], b) a rearrangeablephysical 3D chart [33], c) an interactive data sculpture of time series [54], d) an interactive shape-changing display [40].
Abstract—We present an interaction model for beyond-desktop visualizations that combines the visualization reference model withthe instrumental interaction paradigm. Beyond-desktop visualizations involve a wide range of emerging technologies such as wall-sized displays, 3D and shape-changing displays, touch and tangible input, and physical information visualizations. While thesetechnologies allow for new forms of interaction, they are often studied in isolation. New conceptual models are needed to build acoherent picture of what has been done and what is possible. We describe a modified pipeline model where raw data is processedinto a visualization and then rendered into the physical world. Users can explore or change data by directly manipulating visualizationsor through the use of instruments. Interactions can also take place in the physical world outside the visualization system, such aswhen using locomotion to inspect a large scale visualization. Through case studies we illustrate how this model can be used todescribe both conventional and unconventional interactive visualization systems, and compare different design alternatives.
Index Terms—Information visualization, interaction model, notational system, physical visualization
1 INTRODUCTION
External, physical representations of information are older than theinvention of writing [50, p.94]. External representations promote ex-ternal cognition and visual thinking [11], and humans developed a richset of skills for crafting and exploring them. In addition to mere vi-sual exploration, the manipulation of external representations has beenshown to be a key component of external cognition [35, 18, 36, 46].
Computers immensely increased the amount of data we can collect,process and visualize, and diversified the ways we can represent it vi-sually. Visualization systems became powerful and complex, and so-phisticated interaction techniques are now necessary to control them.
With the widening of technological possibilities beyond classicdesktop settings, new opportunities have emerged (see Figure 1 fora small sample). Not only display surfaces of arbitrary shapes andsizes can be used to show richer visualizations, but also new inputtechnologies can be used to manipulate them. These include multi-touch surfaces and tangible controllers, which promise to take betteradvantage of our natural abilities to manipulate physical objects [31].
New opportunities also arose in the area of physical informationvisualization [33], where visualizations themselves are made physi-cal, either to enrich their perception or to facilitate their manipula-tion. With digital fabrication technologies and fab labs, the productionof physical visualizations became easier and accessible to all. Withrecent advances in actuated physical displays [47], computationally-augmented physical visualizations are now starting to be considered.
• Yvonne Jansen is with Inria and Universite Paris Sud. E-mail:[email protected].
• Pierre Dragicevic is with Inria. E-mail: [email protected].
Manuscript received 31 March 2013; accepted 1 August 2013; posted online13 October 2013; mailed on 4 October 2013.For information on obtaining reprints of this article, please sende-mail to: [email protected].
However, new opportunities also bring new challenges. Some ofthese are technological and are actively being researched. Another se-rious challenge lies in the informed design of beyond-desktop visual-ization systems, i.e, building systems that harness both human capaci-ties and the power of new technologies. Although theories and modelshave been proposed that help design desktop visualizations, interac-tion with visualization systems now needs to be seen as situated in themidst of heterogeneous displays and interaction instruments [39]. Dueto the lack of new conceptual models, it is hard to build a coherentpicture of beyond-desktop systems that have been proposed so far, andto reflect on this work in a way that can inform future design.
We present a conceptual interaction model and visual notation sys-tem that aims to facilitate the description, comparison and criticism ofbeyond-desktop visualization systems. This model refines and unifiesthe information visualization reference model [11, 13] and the instru-mental interaction model [7]. We first introduce our model and illus-trate it with simple examples. Many of these examples are taken fromdesktop visualization systems, as these have reached maturity, theyare familiar to most readers, and they support a number of complex in-teractions. We believe that better understanding desktop visualizationsystems can help understand beyond-desktop systems and vice versa.We then illustrate how to use our model and visual notation throughcase studies of less conventional visualization systems. We concludewith a discussion of the strengths and the limits of our model.
2 AN ADAPTED INFOVIS PIPELINE
The process of information visualization can be described as a se-quence of data transformations that go through several stages until afinal image is produced. This process is referred to as the visualizationreference model or the “infovis pipeline” and has been described byCard et al. [11] and Chi and Riedl [13], and refined by others [12, 56].
While the infovis pipeline is extremely useful for understandinginformation visualization systems, previous models have been essen-tially focusing on desktop systems. In this section we describe an in-fovis pipeline that shares many similarities with previous models buthas been extended to better capture non-conventional setups.
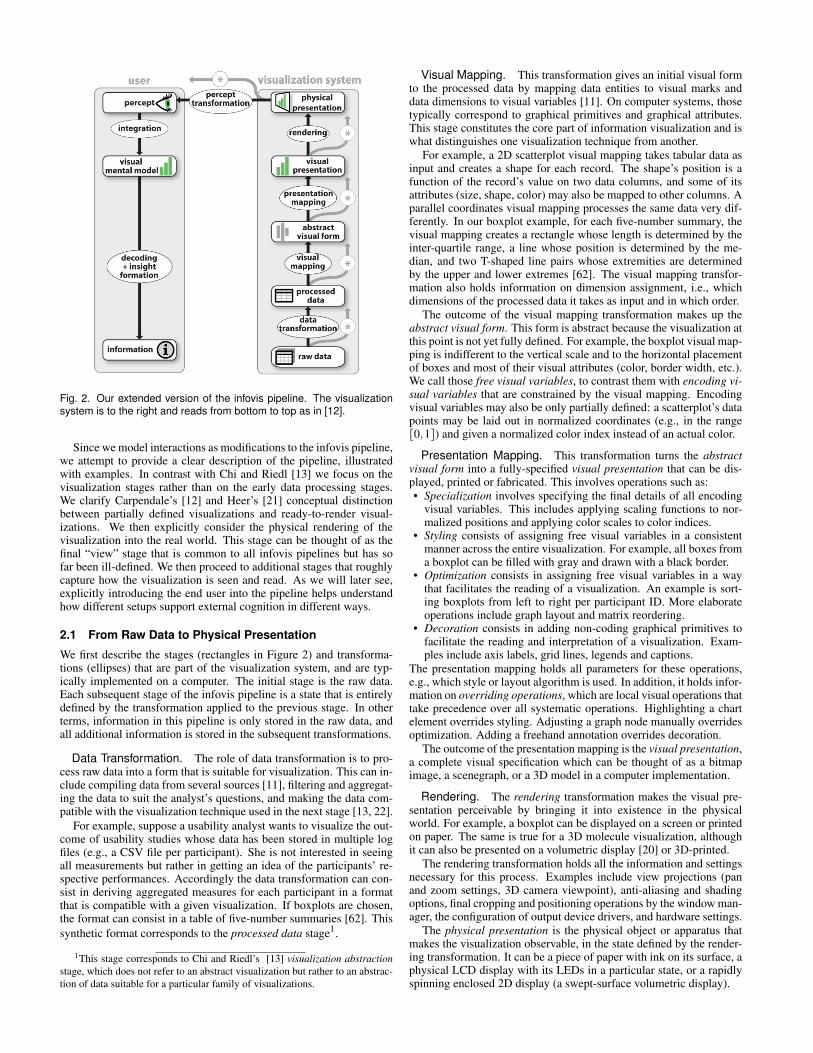
Fig. 2. Our extended version of the infovis pipeline. The visualizationsystem is to the right and reads from bottom to top as in [12].
Since we model interactions as modifications to the infovis pipeline,we attempt to provide a clear description of the pipeline, illustratedwith examples. In contrast with Chi and Riedl [13] we focus on thevisualization stages rather than on the early data processing stages.We clarify Carpendale’s [12] and Heer’s [21] conceptual distinctionbetween partially defined visualizations and ready-to-render visual-izations. We then explicitly consider the physical rendering of thevisualization into the real world. This stage can be thought of as thefinal “view” stage that is common to all infovis pipelines but has sofar been ill-defined. We then proceed to additional stages that roughlycapture how the visualization is seen and read. As we will later see,explicitly introducing the end user into the pipeline helps understandhow different setups support external cognition in different ways.
2.1 From Raw Data to Physical Presentation
We first describe the stages (rectangles in Figure 2) and transforma-tions (ellipses) that are part of the visualization system, and are typ-ically implemented on a computer. The initial stage is the raw data.Each subsequent stage of the infovis pipeline is a state that is entirelydefined by the transformation applied to the previous stage. In otherterms, information in this pipeline is only stored in the raw data, andall additional information is stored in the subsequent transformations.
Data Transformation. The role of data transformation is to pro-cess raw data into a form that is suitable for visualization. This can in-clude compiling data from several sources [11], filtering and aggregat-ing the data to suit the analyst’s questions, and making the data com-patible with the visualization technique used in the next stage [13, 22].
For example, suppose a usability analyst wants to visualize the out-come of usability studies whose data has been stored in multiple logfiles (e.g., a CSV file per participant). She is not interested in seeingall measurements but rather in getting an idea of the participants’ re-spective performances. Accordingly the data transformation can con-sist in deriving aggregated measures for each participant in a formatthat is compatible with a given visualization. If boxplots are chosen,the format can consist in a table of five-number summaries [62]. Thissynthetic format corresponds to the processed data stage1.
1This stage corresponds to Chi and Riedl’s [13] visualization abstractionstage, which does not refer to an abstract visualization but rather to an abstrac-tion of data suitable for a particular family of visualizations.
Visual Mapping. This transformation gives an initial visual formto the processed data by mapping data entities to visual marks anddata dimensions to visual variables [11]. On computer systems, thosetypically correspond to graphical primitives and graphical attributes.This stage constitutes the core part of information visualization and iswhat distinguishes one visualization technique from another.
For example, a 2D scatterplot visual mapping takes tabular data asinput and creates a shape for each record. The shape’s position is afunction of the record’s value on two data columns, and some of itsattributes (size, shape, color) may also be mapped to other columns. Aparallel coordinates visual mapping processes the same data very dif-ferently. In our boxplot example, for each five-number summary, thevisual mapping creates a rectangle whose length is determined by theinter-quartile range, a line whose position is determined by the me-dian, and two T-shaped line pairs whose extremities are determinedby the upper and lower extremes [62]. The visual mapping transfor-mation also holds information on dimension assignment, i.e., whichdimensions of the processed data it takes as input and in which order.
The outcome of the visual mapping transformation makes up theabstract visual form. This form is abstract because the visualization atthis point is not yet fully defined. For example, the boxplot visual map-ping is indifferent to the vertical scale and to the horizontal placementof boxes and most of their visual attributes (color, border width, etc.).We call those free visual variables, to contrast them with encoding vi-sual variables that are constrained by the visual mapping. Encodingvisual variables may also be only partially defined: a scatterplot’s datapoints may be laid out in normalized coordinates (e.g., in the range[0,1]) and given a normalized color index instead of an actual color.
Presentation Mapping. This transformation turns the abstractvisual form into a fully-specified visual presentation that can be dis-played, printed or fabricated. This involves operations such as:• Specialization involves specifying the final details of all encoding
visual variables. This includes applying scaling functions to nor-malized positions and applying color scales to color indices.
• Styling consists of assigning free visual variables in a consistentmanner across the entire visualization. For example, all boxes froma boxplot can be filled with gray and drawn with a black border.
• Optimization consists in assigning free visual variables in a waythat facilitates the reading of a visualization. An example is sort-ing boxplots from left to right per participant ID. More elaborateoperations include graph layout and matrix reordering.
• Decoration consists in adding non-coding graphical primitives tofacilitate the reading and interpretation of a visualization. Exam-ples include axis labels, grid lines, legends and captions.
The presentation mapping holds all parameters for these operations,e.g., which style or layout algorithm is used. In addition, it holds infor-mation on overriding operations, which are local visual operations thattake precedence over all systematic operations. Highlighting a chartelement overrides styling. Adjusting a graph node manually overridesoptimization. Adding a freehand annotation overrides decoration.
The outcome of the presentation mapping is the visual presentation,a complete visual specification which can be thought of as a bitmapimage, a scenegraph, or a 3D model in a computer implementation.
Rendering. The rendering transformation makes the visual pre-sentation perceivable by bringing it into existence in the physicalworld. For example, a boxplot can be displayed on a screen or printedon paper. The same is true for a 3D molecule visualization, althoughit can also be presented on a volumetric display [20] or 3D-printed.
The rendering transformation holds all the information and settingsnecessary for this process. Examples include view projections (panand zoom settings, 3D camera viewpoint), anti-aliasing and shadingoptions, final cropping and positioning operations by the window man-ager, the configuration of output device drivers, and hardware settings.
The physical presentation is the physical object or apparatus thatmakes the visualization observable, in the state defined by the render-ing transformation. It can be a piece of paper with ink on its surface, aphysical LCD display with its LEDs in a particular state, or a rapidlyspinning enclosed 2D display (a swept-surface volumetric display).
2.2 From Physical Presentation to Insights
So far we captured how raw data is made visual and brought into ex-istence in the objective world independently from any observer. Herewe consider how the physical presentation is read and used. Cognitiveprocesses are complex, poorly understood and differ across users [41],therefore our model does not try to capture those in detail.
Percept Transformation. This transformation defines how thephysical presentation becomes a percept. Roughly defined, a perceptis what an observer sees at a given point in time. For example, a userfacing a volumetric display will see not a spinning disc, but a glowingobject resembling a 3D molecule. A user facing a computer screenwill see not an array of LEDs but a spatially continuous boxplot chart.
While a visualization designer can use her knowledge on percepttransformations to design visual or physical presentations, this trans-formation is outside the visualization system pipeline and thereforeoutside the system’s control. Part of it is under the user’s control. Forexample, a user can move around to get a different perspective [9].Other examples include switching on a desk light to examine boxplotprintouts or dimming the light before using a volumetric display.
Environmental factors determine how distal stimuli (physical pre-sentations) are turned into proximal stimuli (retinal images). In ad-dition, the percept transformation includes all psychophysical mecha-nisms that turn proximal stimuli into percepts, and that are largely out-side the user’s control. These include general mechanisms like lightadaptation and individual factors like color blindness. Those also in-clude the mechanisms that make the time- and space-discretized stim-uli from electronic displays appear as coherent shapes.
Integration. This transformation defines how a new percept iscombined with previous percepts to update a mental visual model ofthe visual presentation. For example, inspecting a molecular modelfrom different angles or panning and zooming a dense 2D visualiza-tion help to construct a visual mental model that aligns with the orig-inal visual presentation. However, both percepts and mental visualmodels are ephemeral in nature and extremely incomplete [41]. Mostof the visual information gathered from the external world is forgottenand re-accessed when it is needed [49]. Mental visual models are onlyrough sketches that help users maintain an overview of what is whereand remain oriented during the visual information gathering activity.
Decoding + Insight Formation. This transformation defineshow information is extracted from the visual mental model. Decod-ing refers to the extraction of data values, such as retrieving the medianperformance of a specific participant. Decoding initially requires iden-tifying which visual mapping function has been applied and subse-quently being able to “invert” it. The ease of this process is determinedby the recognizability and readability of a visualization, which in turndepend on the user’s visual literacy and degree of training [37, 41].
Once the visual mapping is understood, not all information retrievaltasks require explicit decoding, as tasks in the data domain can trans-late into tasks in the visual domain [24]. For example, medians be-tween participants can be compared by looking at relative positions oflines. Other information can be gathered directly from the boxplot’svisual presentation, such as the degree of variation between medians,the existence of possible outliers, or performance trends per age.
Similarly to the visual mental model, the information gained froma visualization is ephemeral due to limits of short term memory, butcan serve to guide later visual information retrieval such as obtainingrelevant detailed information [51]. Also, once combined and put intocontext, multiple pieces of information can lead to insights that canbe remembered and guide decision making [11]. For example, ourusability analyst might realize that elder users have issues with the newuser interface and decide to have her team explore alternative designs.
2.3 BranchesAt each stage of the pipeline, a separate visualization pipeline canbranch out (see star icons in Figure 2 and legend in Figure 3). Forexample, the usability analyst may use the boxplot together with a
scatterplot that shows mean performance against age for each partici-pant. In that case another branch starts from raw data and goes throughan alternative data transformation and visual mapping.
Branches can exist higher up in the pipeline. For example, the pro-cessed data used by the boxplot can also feed a bar chart showing onlymedian performances. Or the boxplot’s abstract visual form can be fedto a secondary visual presentation with a different participant ordering.
Branches can merge, a common example being multiple visual pre-sentations shown on a single screen – or multiple “views”. Multipleviews can be merged by the rendering transformation at the windowmanager level. Integrated views such as magic lenses [10] can bemerged further below in the pipeline. Branched pipelines can alsolead to separate physical presentations, i.e., a boxplot and a scatterplotcan be shown on two separate screens or printed on separate sheetsof paper. When seen by a single user, those two physical presenta-tions lead to two visual mental models that can be later merged bythe decoding+insight formation transformation. When the same vi-sual presentation is shown twice (e.g., at different scales), the mergingcan be done by the integration transformation.
Finally, in colocated collaborative settings multiple users can be ob-serving the same physical presentation. In that case, each user has aunique viewpoint onto the shared physical presentation and a uniquepercept transformation. In a distributed pipeline system such as aWeb app, multiple users can be observing the same visual presenta-tion through separate and possibly remote physical presentations.
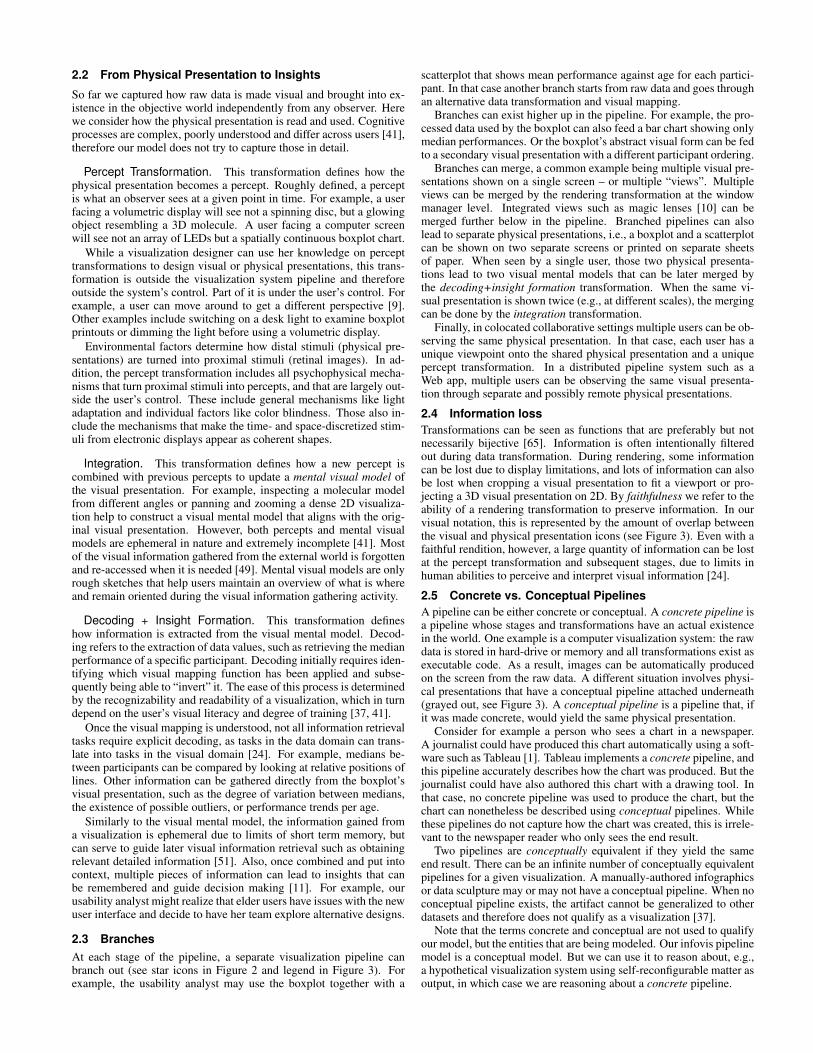
2.4 Information lossTransformations can be seen as functions that are preferably but notnecessarily bijective [65]. Information is often intentionally filteredout during data transformation. During rendering, some informationcan be lost due to display limitations, and lots of information can alsobe lost when cropping a visual presentation to fit a viewport or pro-jecting a 3D visual presentation on 2D. By faithfulness we refer to theability of a rendering transformation to preserve information. In ourvisual notation, this is represented by the amount of overlap betweenthe visual and physical presentation icons (see Figure 3). Even with afaithful rendition, however, a large quantity of information can be lostat the percept transformation and subsequent stages, due to limits inhuman abilities to perceive and interpret visual information [24].
2.5 Concrete vs. Conceptual PipelinesA pipeline can be either concrete or conceptual. A concrete pipeline isa pipeline whose stages and transformations have an actual existencein the world. One example is a computer visualization system: the rawdata is stored in hard-drive or memory and all transformations exist asexecutable code. As a result, images can be automatically producedon the screen from the raw data. A different situation involves physi-cal presentations that have a conceptual pipeline attached underneath(grayed out, see Figure 3). A conceptual pipeline is a pipeline that, ifit was made concrete, would yield the same physical presentation.
Consider for example a person who sees a chart in a newspaper.A journalist could have produced this chart automatically using a soft-ware such as Tableau [1]. Tableau implements a concrete pipeline, andthis pipeline accurately describes how the chart was produced. But thejournalist could have also authored this chart with a drawing tool. Inthat case, no concrete pipeline was used to produce the chart, but thechart can nonetheless be described using conceptual pipelines. Whilethese pipelines do not capture how the chart was created, this is irrele-vant to the newspaper reader who only sees the end result.
Two pipelines are conceptually equivalent if they yield the sameend result. There can be an infinite number of conceptually equivalentpipelines for a given visualization. A manually-authored infographicsor data sculpture may or may not have a conceptual pipeline. When noconceptual pipeline exists, the artifact cannot be generalized to otherdatasets and therefore does not qualify as a visualization [37].
Note that the terms concrete and conceptual are not used to qualifyour model, but the entities that are being modeled. Our infovis pipelinemodel is a conceptual model. But we can use it to reason about, e.g.,a hypothetical visualization system using self-reconfigurable matter asoutput, in which case we are reasoning about a concrete pipeline.
Fig. 3. Elements of our visual notation for interactive information visualization pipelines. For the meaning of pipeline icons see Figure 2. Theseelements and all other illustrations from this article are available for download as vector graphics at www.aviz.fr/beyond.
3 INTERACTIVITY
By interactivity we refer to users’ ability to alter the infovis pipeline.While several interaction taxonomies for visualization have been pro-posed they all try to answer one or several of these questions:
1. What is the user doing?That is, what is the effect of the interaction?
2. Why is she doing it?That is, what is the goal behind producing this effect?
3. How does she do it?That is, what are the means by which this effect is achieved?
Immediate goals have been previously addressed in tasks tax-onomies [3, 23, 41, 51, 64] while general goals have been discussedin textbooks and essays [11, 58]. Effects and means have receivedcomparatively less attention and can vary widely across systems.
Effects and means can be understood from two perspectives. Fromthe pipeline’s perspective (i.e., in a real or conceptual system), theyrefer to what is affected in the pipeline (e.g., which level is modified)and how (e.g., what hardware and software mechanisms are involved).From the user’s perspective, effects and means refer to the user’s sub-jective perception of what is being modified (e.g, what happens to thevisualization) and how this modification is achieved (e.g, by directmanipulation or done automatically by the system).
We first briefly discuss goals, then address effects and means fromthe pipeline’s perspective, and finally address the effects and meansfrom the users’ perspective.
3.1 GoalsAs mentioned in the previous section, information can be intention-ally filtered out in the pipeline in order to accommodate very largedatasets, or can be lost because of technological or human (perceptualand cognitive) limitations. The primary function of interactivity in vi-sualization systems is to allow users to dynamically alter the pipelineto reveal other aspects of the data. Users can then integrate the variouspercepts and pieces of information over time in order to build a richerpicture of the data and accumulate insights. This dynamic process isoften referred to as data exploration [11]. Data exploration can bethought of as being goal-directed and decomposable into elementaryanalytical tasks [3, 41, 51, 61, 64].
Interactivity can be used not only to explore, but also to correct,update or collect data. Data collection is often considered a problemoutside the realm of infovis: raw data is considered as “given”. Al-though data from the physical world (e.g., temperature measurements)can be automatically collected, lots of information initially only existin human minds (e.g., opinion polls) and need to be explicitly exter-nalized. When the person using a visualization system is the same asthe person who provides (or is able to correct or update) the data, datainput becomes an infovis problem. This problem has started to be dis-cussed in research [6], although it has long been addressed by PIMsoftware such as calendar tools, which provide both visualizations ofpersonal data and the means for entering and updating this data.
Finally, interactivity can also have social functions, such as helpingusers coordinate and communicate in collaborative settings or helpinganalysts present data to an audience [29, 23]. An interesting exam-ple of storytelling involving interaction with an improvised physicalvisualization is “Hans Rosling’s shortest Ted Talk” [48].
3.2 Effects – The Pipeline’s PerspectiveFrom the pipeline’s perspective, the effect refers to the part of thepipeline that is modified during interaction and the nature of thechange. Any part of a visualization system’s pipeline that stores in-formation can potentially be modified, namely the raw data level andall subsequent transformations. An example for a data transformationmodification is changing the range of a filter. An example for a visualmapping modification is swapping two axes on a scatterplot. An ex-ample for a presentation mapping modification is reordering a matrixvisualization. An example for a rendering modification is zooming.
Percept transformations can also be modified. Examples includerepositioning a laptop computer, moving around in a large display en-vironment, manipulating a physical visualization, and virtually any ac-tion that changes the percept of a physical presentation: turning off theroom’s lights, placing one’s finger on a screen, etc.
Conceptual pipelines can be modified too. A conceptual pipelineis modified when the concrete entity it is connected to changes. Forexample, consider a card player who keeps scores using tally marks ona paper sheet. A simple conceptual pipeline is one that takes the scoresas raw data, creates a visual form using a “tally mark” visual mapping,then produces a physical presentation consisting in ink on paper. But ifthe card player adds a mark, the original pipeline becomes inconsistentwith the changed physical presentation. A correct conceptual pipelinehas to be substituted, and a parsimonious one would use the new scoresas raw data and leave the rest unchanged. Therefore, drawing a tallymark conceptually modifies the pipeline at the raw data level.
As will be discussed in the next section, the effect of an interactioncan also consist in a higher-level modification, such as creating a newbranch on the pipeline or removing an existing branch.
3.3 Means – The Pipeline’s PerspectiveFrom the pipeline’s perspective, the means consist in interaction tech-niques, i.e., all the hardware and software elements that provide a wayfor users to produce the effect of interest on the pipeline [57]. Manyinteraction techniques can produce the same effect. For example, ascatterplot can be filtered through SQL queries, dynamics queries [11],using tangible props [32], or even by speech recognition.
Interaction techniques can be complex and require elaborate formsof communication between different levels of the pipeline. We callthese mechanisms propagation. We first describe the different types ofpropagation (see legend in Figure 3), and then discuss how interactiontechniques can be modeled in our pipeline in the form of instruments.
Forward and Back Propagation. As a general principle, effectspropagate forward, e.g., if a user changes the data transformation, thenthe new transformation is applied to the raw data, after which all thesubsequent transformations are applied all the way to the physical pre-sentation. This type of propagation is common to all infovis pipelines(arrows in Figure 2) and will be referred to as forward propagation.
In addition to forward propagation, some interaction techniquesalso require back propagation. For example, consider brushing & link-ing on two scatterplots [8]: every time the mouse moves, its positionneeds to be translated from screen coordinates into visual presentationcoordinates, then the glyph below this point needs to be matched to thecorresponding data record [15]. In other terms, all geometrical trans-formations from the data transformation to the physical presentationare inverted. Then the “highlighted” attribute of the data point is set totrue and the change is propagated forward to the second scatterplot.
Branching. Branching consists in creating a new branch in apipeline (see section 2.3 on branches). This involves instantiating allpipeline entities from the branching point upwards, then performinga forward propagation. Branching also serves to generate an initialpipeline from a raw dataset.
In a desktop setting, a common example of branching interaction iscreating a new “view” (e.g., window) of the same data, or activating amagic lens. In both cases, the two branches usually merge before thephysical presentation level, whereas printing a visualization on papercreates a branch with a separate physical presentation.
Branches can also be suppressed (e.g., closing a window). In ad-dition, some visualization systems support branch substitution [1, 60].Branch substitution consists in suppressing a branch starting from acertain level (e.g., processed data), then creating a new branch thatends up being displayed at the same physical location. One exampleis switching from parallel coordinates to a matrix visualization.
Automatic vs. Manual Propagation. Propagation in a concretepipeline can be either automatic, manual, or in-between. Propagationsin integrated visualization systems are typically fully automatic: everychange to one level is immediately reflected to the levels above – i.e.,all transformations are applied – without any user intervention.
An example of user intervention at the data transformation levelis exporting part of a dataset as a graphml file to be visualized as anode-link diagram. Another example at the rendering level would beexporting a molecule visualization as a 3D model to be displayed bya separate viewer. In both examples, every time the raw data changes,updating the physical presentation requires user intervention.
There is a continuum between automatic and manual propagation.For example, opening a raw dataset with a spreadsheet and copyingvalues one by one into another spreadsheet would be a rather manualway of doing data transformation. Invoking a parsing script insteadwould be a more automatic – yet not fully automatic – way of doing thesame job. Crafting data sculptures such as Mount Fear [4] can involvevarying degrees of automaticity at different levels of the pipeline.
Repeated vs. One-shot Propagation. At any level of apipeline, forward propagation can be either repeated or one-shot. Re-peated forward propagation means that information is propagated for-ward more than once. A computer visualization system typically sup-ports repeated forward propagation at all levels, meaning that changesto the raw data can be reflected on the same physical presentation. Ifpropagations are also fully automatic, the physical presentation can becontinuously updated and display streaming data [45].
Propagation can also be one-shot, meaning that forward propaga-tion is only performed when the branch is initially created, but not af-terwards. Examples of one-shot propagation at the rendering level in-clude paper printouts and 3D fabrication. Any change affecting layersbelow the physical presentation stop being propagated to these phys-ical presentations. Seeing the changes would require branching, i.e.,producing a new printout or physical model. Each physical presenta-tion can however possess a conceptual pipeline that is a snapshot of thepipeline initially used to create it, and that can be modified separately.
Instruments. Following the instrumental interaction frame-work [7], we model interaction techniques as instruments. Instrumentsare inspired by tools: a screwdriver acts as a mediator between humansand screws. In interactive systems, an instrument acts as a mediatorbetween the user and the object being modified – in our case, the visu-alization pipeline. The role of an instrument is to interpret user inputinto modifications of the pipeline and to provide user feedback.
Instruments have a physical part and a logical part [7]. In our model,an instrument can have two physical parts: i) a physical handle, i.e., anobject that the user can physically operate; and ii) a physical presenta-tion that gives user feedback. An instrument’s physical handle can becolocated with its physical presentation (e.g., touchscreen), physicallyremote (e.g., mouse), or non-existing (e.g., mid-air pointing) [44].
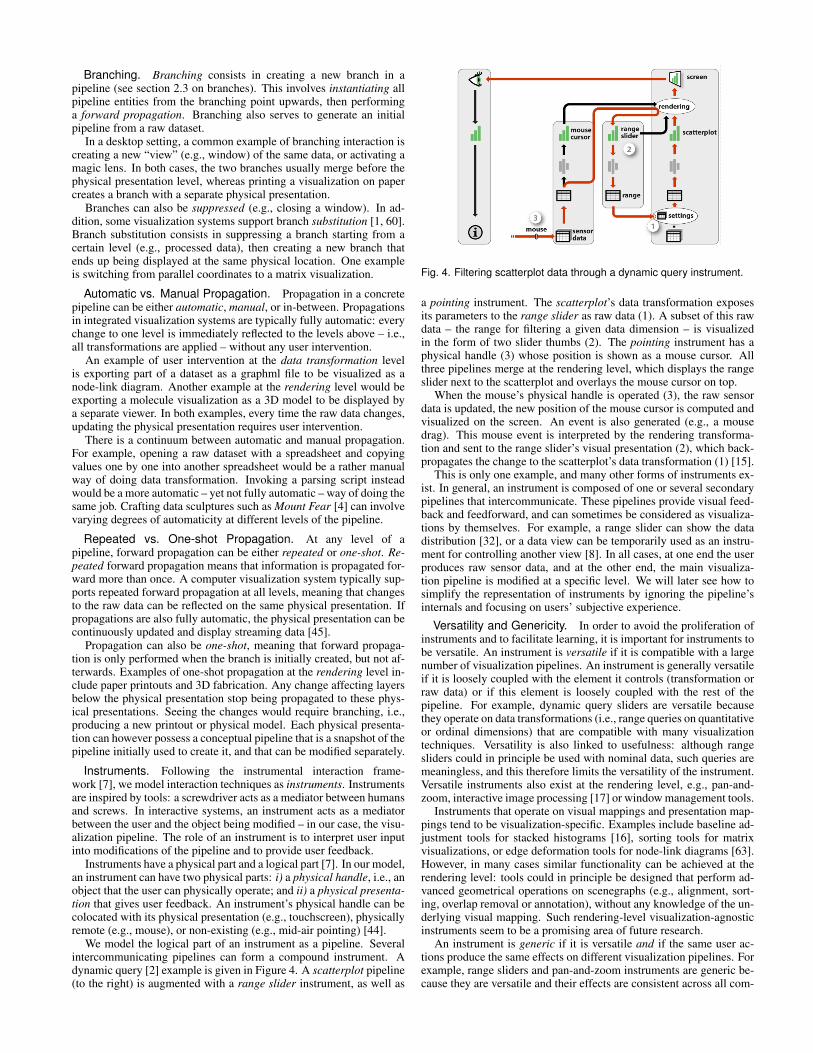
We model the logical part of an instrument as a pipeline. Severalintercommunicating pipelines can form a compound instrument. Adynamic query [2] example is given in Figure 4. A scatterplot pipeline(to the right) is augmented with a range slider instrument, as well as
Fig. 4. Filtering scatterplot data through a dynamic query instrument.
a pointing instrument. The scatterplot’s data transformation exposesits parameters to the range slider as raw data (1). A subset of this rawdata – the range for filtering a given data dimension – is visualizedin the form of two slider thumbs (2). The pointing instrument has aphysical handle (3) whose position is shown as a mouse cursor. Allthree pipelines merge at the rendering level, which displays the rangeslider next to the scatterplot and overlays the mouse cursor on top.
When the mouse’s physical handle is operated (3), the raw sensordata is updated, the new position of the mouse cursor is computed andvisualized on the screen. An event is also generated (e.g., a mousedrag). This mouse event is interpreted by the rendering transforma-tion and sent to the range slider’s visual presentation (2), which back-propagates the change to the scatterplot’s data transformation (1) [15].
This is only one example, and many other forms of instruments ex-ist. In general, an instrument is composed of one or several secondarypipelines that intercommunicate. These pipelines provide visual feed-back and feedforward, and can sometimes be considered as visualiza-tions by themselves. For example, a range slider can show the datadistribution [32], or a data view can be temporarily used as an instru-ment for controlling another view [8]. In all cases, at one end the userproduces raw sensor data, and at the other end, the main visualiza-tion pipeline is modified at a specific level. We will later see how tosimplify the representation of instruments by ignoring the pipeline’sinternals and focusing on users’ subjective experience.
Versatility and Genericity. In order to avoid the proliferation ofinstruments and to facilitate learning, it is important for instruments tobe versatile. An instrument is versatile if it is compatible with a largenumber of visualization pipelines. An instrument is generally versatileif it is loosely coupled with the element it controls (transformation orraw data) or if this element is loosely coupled with the rest of thepipeline. For example, dynamic query sliders are versatile becausethey operate on data transformations (i.e., range queries on quantitativeor ordinal dimensions) that are compatible with many visualizationtechniques. Versatility is also linked to usefulness: although rangesliders could in principle be used with nominal data, such queries aremeaningless, and this therefore limits the versatility of the instrument.Versatile instruments also exist at the rendering level, e.g., pan-and-zoom, interactive image processing [17] or window management tools.
Instruments that operate on visual mappings and presentation map-pings tend to be visualization-specific. Examples include baseline ad-justment tools for stacked histograms [16], sorting tools for matrixvisualizations, or edge deformation tools for node-link diagrams [63].However, in many cases similar functionality can be achieved at therendering level: tools could in principle be designed that perform ad-vanced geometrical operations on scenegraphs (e.g., alignment, sort-ing, overlap removal or annotation), without any knowledge of the un-derlying visual mapping. Such rendering-level visualization-agnosticinstruments seem to be a promising area of future research.
An instrument is generic if it is versatile and if the same user ac-tions produce the same effects on different visualization pipelines. Forexample, range sliders and pan-and-zoom instruments are generic be-cause they are versatile and their effects are consistent across all com-
patible visualizations. An instrument that is rather versatile but notgeneric is the rectangular selection tool: this tools lets users select 2Ddata ranges on scatterplots and line graphs [26], but has different se-mantics on node-link diagrams. Similarly, an instrument for draggingvisual marks can be versatile but can have very different effects ondifferent visualizations (e.g., reordering rows and columns on matri-ces vs. changing the raw data on scatterplots). More generally, directmanipulation instruments that require back-propagation may be ver-satile but are rarely generic because spatial manipulations need to beinterpreted according to the visual mapping used.
3.4 Effects – The User’s Perspective
In Section 3.2 we considered the effects of interactions on the visual-ization pipeline. We now discuss the user’s perception of these effects.
Instruments produce multiple observable effects. A user who op-erates the range slider of Figure 4 can attend to the changes on thescatterplot but also to the slider’s thumb, the cursor on the screen, orthe physical mouse. However, instruments are not the object of thetask and unless they need to be fixed or reconfigured [55, Chap.2][7],users normally focus on the data being explored. In the instrumentalinteraction framework this data would be referred to as the domain ob-ject [7]. However, this framework does not consider the visualizationprocess and equates the domain object with its visual presentation. Wetherefore discuss where in the pipeline effects are perceived to occur.
Although effects are made observable by the physical presentation,they are usually not perceived at this level. A person using a computerdoes not see pixels changing on a screen but instead perceives actionhappening “behind” [55, Chap.2]. In our pipeline model, the entitythat best aligns with what the user perceives is the visual presentation.
The perception of changes in a pipeline’s transformations tends toshift towards the visual presentation level. For example, when pan-ning and zooming a tree visualization or rotating a 3D molecule, onemay perceive not a “camera” motion, but a change to the position andorientation of the tree or of the molecule2. If the presentation map-ping changes (e.g., a tree branch is collapsed), the change will also beperceived as happening to the tree or to the molecule.
The interpretation of changes occurring lower in the pipeline likelyvaries across users, especially since not all users think of visualizationsin terms of pipelines. For example, when comparing a boxplot with anewer version where a participant has been removed, an informationvisualization expert may “correctly” interpret the new version as hav-ing a different data transformation. But other users may prefer to thinkof an alteration of the raw dataset, or may simply consider that a boxhas been removed from the visual presentation. Regardless, a changein the visual presentation is likely to be the initial perception for allusers, while further interpretations may require additional cognition.
To summarize, the subjective perception of interaction effects mayvary across time and across users but in most typical situations, thedominant and immediate perception is that of changes happening tothe visual presentation of the data being explored.
3.5 Means – The User’s Perspective
From the user’s perspective, the means refer to how a user perceives heproduces the effects he observes. This subjective experience dependson the instrument used. A category of instruments that have generatedconsiderable interest in HCI are “direct manipulation” techniques [28,52, 19, 7], which we discuss here in the context of infovis.
While the instrumental interaction framework [7] helpfully clari-fies the different levels of directness an instrument can elicit, it doesnot capture the subjective experience of manipulation. We thereforeintroduce the concept of instrumental manipulation.
Instrumental Manipulation vs. Operation. Instrumental ma-nipulation is the experience of self-agency for the perceived effect.Anything else is instrumental operation.
2Similarly, changes to the percept transformation can be shifted towardsthe physical presentation. Examples are rotating a computer screen or placinga post-it note on a screen, which can be seen as happening to the screen.
The sense of self-agency, i.e., being the cause of something [53],is a key component in how interactions are experienced. Consider anode-link diagram visualization where the user has two alternatives: i)the user presses a button and the diagram is automatically laid out bythe computer; or ii) the user manually drags the nodes to the same finalpositions. The perceived outcome of both actions – i.e., the effect – isthe same change to the visual presentation, but in i), the user is doinginstrumental operation while in ii), it is instrumental manipulation.
Self-agency is always experienced with the physical handle and canbe transferred to the next instruments in the chain [55, Chap.7], some-times with the feeling that these instruments have been incorporatedto the body [42, 5]. In the scenario i) above, the user feels he is theone who is depressing not only the physical mouse button, but alsothe widget on the screen, after which the computer takes over. In therange slider of Figure 4, the user experiences self-agency for movingthe physical mouse, as well as the mouse pointer and the range slider’sthumb. Then, self-agency may or may not be experienced for the ef-fects on the scatterplot’s visual presentation.
Self-agency is transferred when observed effects can be easily pre-dicted from physical actions. This is the case when effects and actionshave a high degree of compatibility [7], but also when they are linkedby a simple relationship [42, 34]. If the range slider operates on ascatterplot axis, actions and effects are directly correlated and the usermay perceive he is “stretching” the scatterplot. If the scatterplot mo-tions are reverted or rotated by 90 degrees, agency is still transferred.But if another dimension is filtered, points will appear and disappearin an unpredictable manner, and self-agency will stop at the slider’sthumb. The visual presentation will not be experienced as being ma-nipulated and the user will be performing instrumental operation.
Instruments have a simplified visual notation where the means fromthe pipeline’s perspective are not shown (see Figure 3). If the instru-ment supports instrumental manipulation the icon is placed in front ofthe visual presentation. Otherwise it faces the effect on the pipeline.
Direct vs. Indirect Instrumental Manipulation. In addition toproviding the illusion that the visual presentation is being manipulated,some instruments give the illusion that it is being directly manipulated.Factors that contribute to this illusion include [7]:• A high degree of compatibility between actions and effects. For
example, filtering a scatterplot by dragging an axis is more com-patible than using a range slider, since motions are not reverted.
• A low degree of indirection, which refers to a low spatial and tem-poral offset between the user’s actions and the observed effect.Here we interpret this as being the degree of indirection betweenthe physical handle and the visual presentation.
• A degree of integration of 1, which refers to physical actions andthe observed effect having the same dimensionality. A counter-example is using a computer mouse to operate the range slider:although the range slider has two degrees of freedom, only onedegree of freedom of the mouse is used to operate it.There is a continuum between indirect and direct instrumental ma-
nipulation. For example, dragging objects on a touchscreen feels verydirect, yet the illusion is imperfect due to possible parallax and lag,inconsistent tactile cues, and impoverished hand gestures [59]. In ourcompacted visual notation, the position and shape of the icon encodesinformation about how direct the instrument feels (Figure 3).
To summarize, the user’s subjective experience of interacting with avisualization can be either instrumental manipulation or instrumentaloperation. For an instrument to elicit a sense of manipulation, changesshown at the visual presentation level have to be predictable, e.g., bearsimilarities with the user’s gestures on the physical handle. Additionalfactors can contribute to an experience of directness. But given thecurrent state of technology, the ultimate experience of directness, or“true” direct manipulation, can only be achieved by the manipulationof physical objects without any mediating instrument.
While supporting directness can be extremely valuable [28, 52, 2],indirections such as in light switches can also be useful [7]. Further-more, instrumental operation is useful when the user wishes to partlyrelinquish control to the computer because manipulation would be toocomplex or too repetitive [19] (e.g., when reordering a matrix).
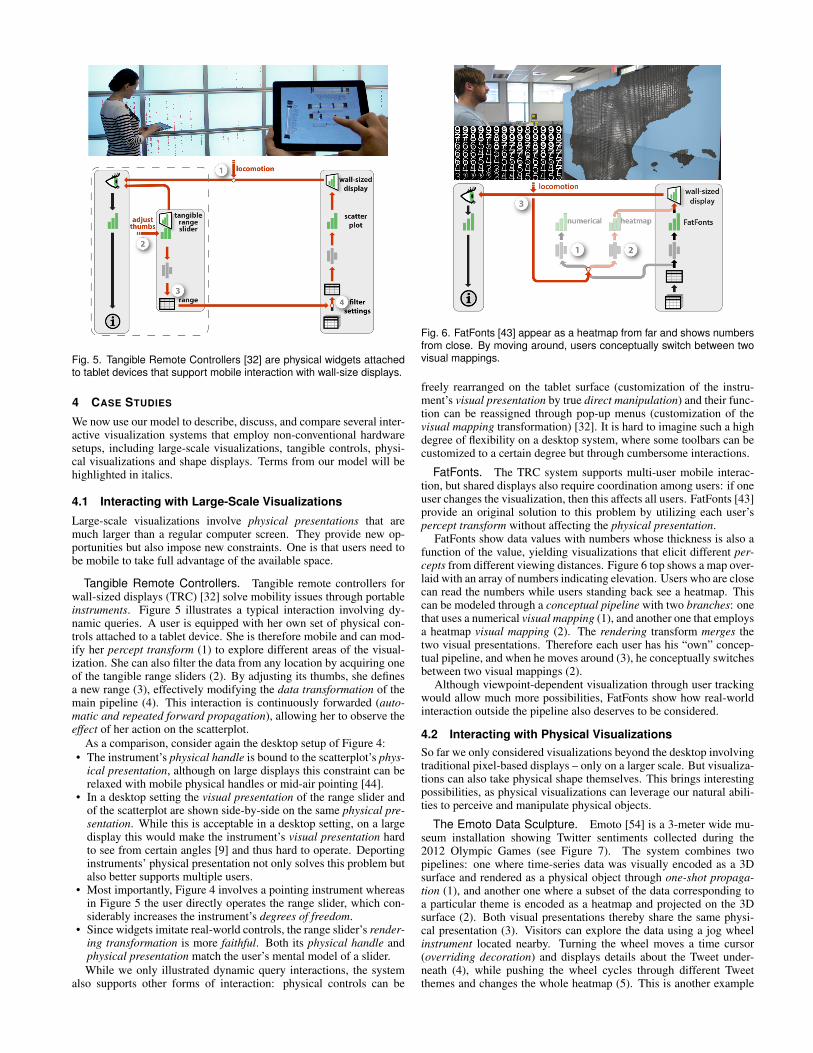
Fig. 5. Tangible Remote Controllers [32] are physical widgets attachedto tablet devices that support mobile interaction with wall-size displays.
4 CASE STUDIES
We now use our model to describe, discuss, and compare several inter-active visualization systems that employ non-conventional hardwaresetups, including large-scale visualizations, tangible controls, physi-cal visualizations and shape displays. Terms from our model will behighlighted in italics.
4.1 Interacting with Large-Scale Visualizations
Large-scale visualizations involve physical presentations that aremuch larger than a regular computer screen. They provide new op-portunities but also impose new constraints. One is that users need tobe mobile to take full advantage of the available space.
Tangible Remote Controllers. Tangible remote controllers forwall-sized displays (TRC) [32] solve mobility issues through portableinstruments. Figure 5 illustrates a typical interaction involving dy-namic queries. A user is equipped with her own set of physical con-trols attached to a tablet device. She is therefore mobile and can mod-ify her percept transform (1) to explore different areas of the visual-ization. She can also filter the data from any location by acquiring oneof the tangible range sliders (2). By adjusting its thumbs, she definesa new range (3), effectively modifying the data transformation of themain pipeline (4). This interaction is continuously forwarded (auto-matic and repeated forward propagation), allowing her to observe theeffect of her action on the scatterplot.
As a comparison, consider again the desktop setup of Figure 4:• The instrument’s physical handle is bound to the scatterplot’s phys-
ical presentation, although on large displays this constraint can berelaxed with mobile physical handles or mid-air pointing [44].
• In a desktop setting the visual presentation of the range slider andof the scatterplot are shown side-by-side on the same physical pre-sentation. While this is acceptable in a desktop setting, on a largedisplay this would make the instrument’s visual presentation hardto see from certain angles [9] and thus hard to operate. Deportinginstruments’ physical presentation not only solves this problem butalso better supports multiple users.
• Most importantly, Figure 4 involves a pointing instrument whereasin Figure 5 the user directly operates the range slider, which con-siderably increases the instrument’s degrees of freedom.
• Since widgets imitate real-world controls, the range slider’s render-ing transformation is more faithful. Both its physical handle andphysical presentation match the user’s mental model of a slider.While we only illustrated dynamic query interactions, the system
also supports other forms of interaction: physical controls can be
Fig. 6. FatFonts [43] appear as a heatmap from far and shows numbersfrom close. By moving around, users conceptually switch between twovisual mappings.
freely rearranged on the tablet surface (customization of the instru-ment’s visual presentation by true direct manipulation) and their func-tion can be reassigned through pop-up menus (customization of thevisual mapping transformation) [32]. It is hard to imagine such a highdegree of flexibility on a desktop system, where some toolbars can becustomized to a certain degree but through cumbersome interactions.
FatFonts. The TRC system supports multi-user mobile interac-tion, but shared displays also require coordination among users: if oneuser changes the visualization, then this affects all users. FatFonts [43]provide an original solution to this problem by utilizing each user’spercept transform without affecting the physical presentation.
FatFonts show data values with numbers whose thickness is also afunction of the value, yielding visualizations that elicit different per-cepts from different viewing distances. Figure 6 top shows a map over-laid with an array of numbers indicating elevation. Users who are closecan read the numbers while users standing back see a heatmap. Thiscan be modeled through a conceptual pipeline with two branches: onethat uses a numerical visual mapping (1), and another one that employsa heatmap visual mapping (2). The rendering transform merges thetwo visual presentations. Therefore each user has his “own” concep-tual pipeline, and when he moves around (3), he conceptually switchesbetween two visual mappings (2).
Although viewpoint-dependent visualization through user trackingwould allow much more possibilities, FatFonts show how real-worldinteraction outside the pipeline also deserves to be considered.
4.2 Interacting with Physical VisualizationsSo far we only considered visualizations beyond the desktop involvingtraditional pixel-based displays – only on a larger scale. But visualiza-tions can also take physical shape themselves. This brings interestingpossibilities, as physical visualizations can leverage our natural abili-ties to perceive and manipulate physical objects.
The Emoto Data Sculpture. Emoto [54] is a 3-meter wide mu-seum installation showing Twitter sentiments collected during the2012 Olympic Games (see Figure 7). The system combines twopipelines: one where time-series data was visually encoded as a 3Dsurface and rendered as a physical object through one-shot propaga-tion (1), and another one where a subset of the data corresponding toa particular theme is encoded as a heatmap and projected on the 3Dsurface (2). Both visual presentations thereby share the same physi-cal presentation (3). Visitors can explore the data using a jog wheelinstrument located nearby. Turning the wheel moves a time cursor(overriding decoration) and displays details about the Tweet under-neath (4), while pushing the wheel cycles through different Tweetthemes and changes the whole heatmap (5). This is another example
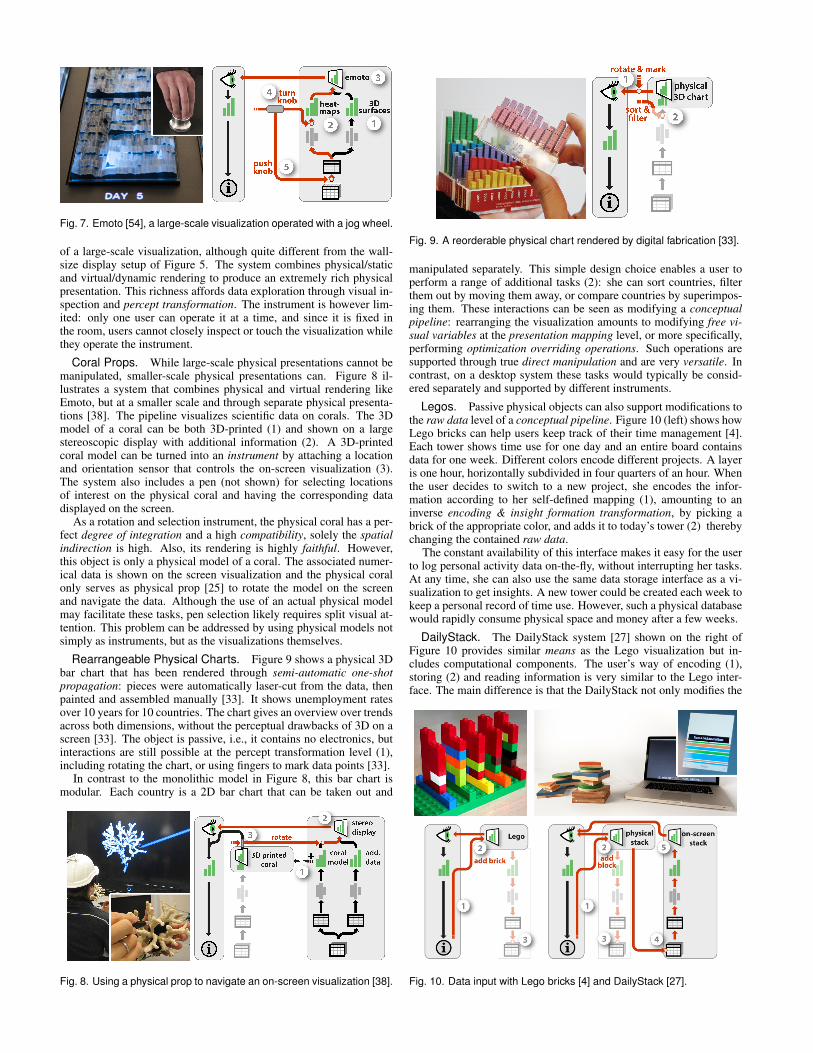
Fig. 7. Emoto [54], a large-scale visualization operated with a jog wheel.
of a large-scale visualization, although quite different from the wall-size display setup of Figure 5. The system combines physical/staticand virtual/dynamic rendering to produce an extremely rich physicalpresentation. This richness affords data exploration through visual in-spection and percept transformation. The instrument is however lim-ited: only one user can operate it at a time, and since it is fixed inthe room, users cannot closely inspect or touch the visualization whilethey operate the instrument.
Coral Props. While large-scale physical presentations cannot bemanipulated, smaller-scale physical presentations can. Figure 8 il-lustrates a system that combines physical and virtual rendering likeEmoto, but at a smaller scale and through separate physical presenta-tions [38]. The pipeline visualizes scientific data on corals. The 3Dmodel of a coral can be both 3D-printed (1) and shown on a largestereoscopic display with additional information (2). A 3D-printedcoral model can be turned into an instrument by attaching a locationand orientation sensor that controls the on-screen visualization (3).The system also includes a pen (not shown) for selecting locationsof interest on the physical coral and having the corresponding datadisplayed on the screen.
As a rotation and selection instrument, the physical coral has a per-fect degree of integration and a high compatibility, solely the spatialindirection is high. Also, its rendering is highly faithful. However,this object is only a physical model of a coral. The associated numer-ical data is shown on the screen visualization and the physical coralonly serves as physical prop [25] to rotate the model on the screenand navigate the data. Although the use of an actual physical modelmay facilitate these tasks, pen selection likely requires split visual at-tention. This problem can be addressed by using physical models notsimply as instruments, but as the visualizations themselves.
Rearrangeable Physical Charts. Figure 9 shows a physical 3Dbar chart that has been rendered through semi-automatic one-shotpropagation: pieces were automatically laser-cut from the data, thenpainted and assembled manually [33]. It shows unemployment ratesover 10 years for 10 countries. The chart gives an overview over trendsacross both dimensions, without the perceptual drawbacks of 3D on ascreen [33]. The object is passive, i.e., it contains no electronics, butinteractions are still possible at the percept transformation level (1),including rotating the chart, or using fingers to mark data points [33].
In contrast to the monolithic model in Figure 8, this bar chart ismodular. Each country is a 2D bar chart that can be taken out and
Fig. 8. Using a physical prop to navigate an on-screen visualization [38].
Fig. 9. A reorderable physical chart rendered by digital fabrication [33].
manipulated separately. This simple design choice enables a user toperform a range of additional tasks (2): she can sort countries, filterthem out by moving them away, or compare countries by superimpos-ing them. These interactions can be seen as modifying a conceptualpipeline: rearranging the visualization amounts to modifying free vi-sual variables at the presentation mapping level, or more specifically,performing optimization overriding operations. Such operations aresupported through true direct manipulation and are very versatile. Incontrast, on a desktop system these tasks would typically be consid-ered separately and supported by different instruments.
Legos. Passive physical objects can also support modifications tothe raw data level of a conceptual pipeline. Figure 10 (left) shows howLego bricks can help users keep track of their time management [4].Each tower shows time use for one day and an entire board containsdata for one week. Different colors encode different projects. A layeris one hour, horizontally subdivided in four quarters of an hour. Whenthe user decides to switch to a new project, she encodes the infor-mation according to her self-defined mapping (1), amounting to aninverse encoding & insight formation transformation, by picking abrick of the appropriate color, and adds it to today’s tower (2) therebychanging the contained raw data.
The constant availability of this interface makes it easy for the userto log personal activity data on-the-fly, without interrupting her tasks.At any time, she can also use the same data storage interface as a vi-sualization to get insights. A new tower could be created each week tokeep a personal record of time use. However, such a physical databasewould rapidly consume physical space and money after a few weeks.
DailyStack. The DailyStack system [27] shown on the right ofFigure 10 provides similar means as the Lego visualization but in-cludes computational components. The user’s way of encoding (1),storing (2) and reading information is very similar to the Lego inter-face. The main difference is that the DailyStack not only modifies the
Fig. 10. Data input with Lego bricks [4] and DailyStack [27].
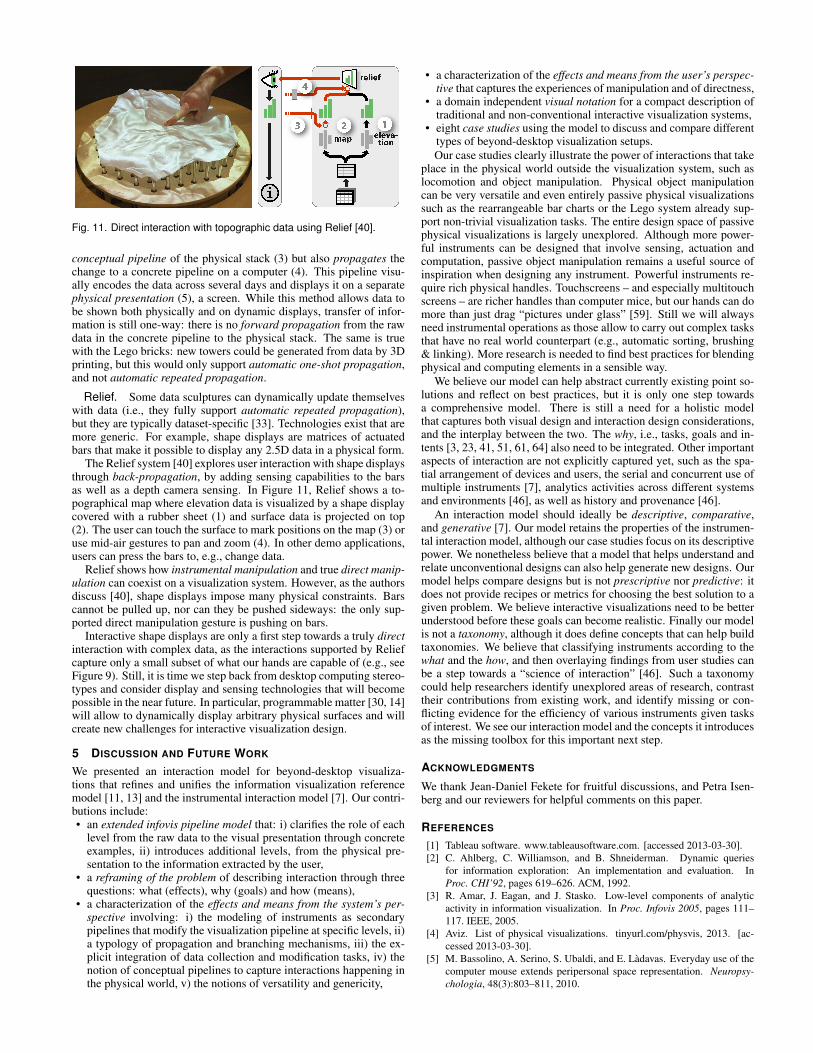
Fig. 11. Direct interaction with topographic data using Relief [40].
conceptual pipeline of the physical stack (3) but also propagates thechange to a concrete pipeline on a computer (4). This pipeline visu-ally encodes the data across several days and displays it on a separatephysical presentation (5), a screen. While this method allows data tobe shown both physically and on dynamic displays, transfer of infor-mation is still one-way: there is no forward propagation from the rawdata in the concrete pipeline to the physical stack. The same is truewith the Lego bricks: new towers could be generated from data by 3Dprinting, but this would only support automatic one-shot propagation,and not automatic repeated propagation.
Relief. Some data sculptures can dynamically update themselveswith data (i.e., they fully support automatic repeated propagation),but they are typically dataset-specific [33]. Technologies exist that aremore generic. For example, shape displays are matrices of actuatedbars that make it possible to display any 2.5D data in a physical form.
The Relief system [40] explores user interaction with shape displaysthrough back-propagation, by adding sensing capabilities to the barsas well as a depth camera sensing. In Figure 11, Relief shows a to-pographical map where elevation data is visualized by a shape displaycovered with a rubber sheet (1) and surface data is projected on top(2). The user can touch the surface to mark positions on the map (3) oruse mid-air gestures to pan and zoom (4). In other demo applications,users can press the bars to, e.g., change data.
Relief shows how instrumental manipulation and true direct manip-ulation can coexist on a visualization system. However, as the authorsdiscuss [40], shape displays impose many physical constraints. Barscannot be pulled up, nor can they be pushed sideways: the only sup-ported direct manipulation gesture is pushing on bars.
Interactive shape displays are only a first step towards a truly directinteraction with complex data, as the interactions supported by Reliefcapture only a small subset of what our hands are capable of (e.g., seeFigure 9). Still, it is time we step back from desktop computing stereo-types and consider display and sensing technologies that will becomepossible in the near future. In particular, programmable matter [30, 14]will allow to dynamically display arbitrary physical surfaces and willcreate new challenges for interactive visualization design.
5 DISCUSSION AND FUTURE WORK
We presented an interaction model for beyond-desktop visualiza-tions that refines and unifies the information visualization referencemodel [11, 13] and the instrumental interaction model [7]. Our contri-butions include:• an extended infovis pipeline model that: i) clarifies the role of each
level from the raw data to the visual presentation through concreteexamples, ii) introduces additional levels, from the physical pre-sentation to the information extracted by the user,
• a reframing of the problem of describing interaction through threequestions: what (effects), why (goals) and how (means),
• a characterization of the effects and means from the system’s per-spective involving: i) the modeling of instruments as secondarypipelines that modify the visualization pipeline at specific levels, ii)a typology of propagation and branching mechanisms, iii) the ex-plicit integration of data collection and modification tasks, iv) thenotion of conceptual pipelines to capture interactions happening inthe physical world, v) the notions of versatility and genericity,
• a characterization of the effects and means from the user’s perspec-tive that captures the experiences of manipulation and of directness,
• a domain independent visual notation for a compact description oftraditional and non-conventional interactive visualization systems,
• eight case studies using the model to discuss and compare differenttypes of beyond-desktop visualization setups.Our case studies clearly illustrate the power of interactions that take
place in the physical world outside the visualization system, such aslocomotion and object manipulation. Physical object manipulationcan be very versatile and even entirely passive physical visualizationssuch as the rearrangeable bar charts or the Lego system already sup-port non-trivial visualization tasks. The entire design space of passivephysical visualizations is largely unexplored. Although more power-ful instruments can be designed that involve sensing, actuation andcomputation, passive object manipulation remains a useful source ofinspiration when designing any instrument. Powerful instruments re-quire rich physical handles. Touchscreens – and especially multitouchscreens – are richer handles than computer mice, but our hands can domore than just drag “pictures under glass” [59]. Still we will alwaysneed instrumental operations as those allow to carry out complex tasksthat have no real world counterpart (e.g., automatic sorting, brushing& linking). More research is needed to find best practices for blendingphysical and computing elements in a sensible way.
We believe our model can help abstract currently existing point so-lutions and reflect on best practices, but it is only one step towardsa comprehensive model. There is still a need for a holistic modelthat captures both visual design and interaction design considerations,and the interplay between the two. The why, i.e., tasks, goals and in-tents [3, 23, 41, 51, 61, 64] also need to be integrated. Other importantaspects of interaction are not explicitly captured yet, such as the spa-tial arrangement of devices and users, the serial and concurrent use ofmultiple instruments [7], analytics activities across different systemsand environments [46], as well as history and provenance [46].
An interaction model should ideally be descriptive, comparative,and generative [7]. Our model retains the properties of the instrumen-tal interaction model, although our case studies focus on its descriptivepower. We nonetheless believe that a model that helps understand andrelate unconventional designs can also help generate new designs. Ourmodel helps compare designs but is not prescriptive nor predictive: itdoes not provide recipes or metrics for choosing the best solution to agiven problem. We believe interactive visualizations need to be betterunderstood before these goals can become realistic. Finally our modelis not a taxonomy, although it does define concepts that can help buildtaxonomies. We believe that classifying instruments according to thewhat and the how, and then overlaying findings from user studies canbe a step towards a “science of interaction” [46]. Such a taxonomycould help researchers identify unexplored areas of research, contrasttheir contributions from existing work, and identify missing or con-flicting evidence for the efficiency of various instruments given tasksof interest. We see our interaction model and the concepts it introducesas the missing toolbox for this important next step.
ACKNOWLEDGMENTS
We thank Jean-Daniel Fekete for fruitful discussions, and Petra Isen-berg and our reviewers for helpful comments on this paper.
REFERENCES
[1] Tableau software. www.tableausoftware.com. [accessed 2013-03-30].[2] C. Ahlberg, C. Williamson, and B. Shneiderman. Dynamic queries
for information exploration: An implementation and evaluation. InProc. CHI’92, pages 619–626. ACM, 1992.
[3] R. Amar, J. Eagan, and J. Stasko. Low-level components of analyticactivity in information visualization. In Proc. Infovis 2005, pages 111–117. IEEE, 2005.
[4] Aviz. List of physical visualizations. tinyurl.com/physvis, 2013. [ac-cessed 2013-03-30].
[5] M. Bassolino, A. Serino, S. Ubaldi, and E. Ladavas. Everyday use of thecomputer mouse extends peripersonal space representation. Neuropsy-chologia, 48(3):803–811, 2010.
[6] T. Baudel. From information visualization to direct manipulation: ex-tending a generic visualization framework for the interactive editing oflarge datasets. In Proc. UIST’06, pages 67–76. ACM, 2006.
[7] M. Beaudouin-Lafon. Instrumental interaction: an interaction model fordesigning post-wimp user interfaces. In Proc. CHI 2000, pages 446–453.ACM, 2000.
[8] R. A. Becker and W. S. Cleveland. Brushing scatterplots. Technometrics,29(2):127–142, 1987.
[9] A. Bezerianos, P. Isenberg, et al. Perception of visual variables on tiledwall-sized displays for information visualization applications. TVCG,18(12), 2012.
[10] E. A. Bier, M. C. Stone, K. Pier, W. Buxton, and T. D. DeRose. Toolglassand magic lenses: the see-through interface. In Proc. SIGGRAPH’93,pages 73–80. ACM, 1993.
[11] S. Card, J. Mackinlay, and B. Shneiderman. Readings in information vi-sualization: using vision to think, pages 1–34. Morgan Kaufmann, 1999.
[12] M. S. T. Carpendale. A framework for elastic presentation space. PhDthesis, Simon Fraser University, 1999.
[13] E. Chi and J. Riedl. An operator interaction framework for visualizationsystems. In Proc. InfoVis’98, pages 63–70. IEEE, 1998.
[14] CMU & Intel Research. Claytronics video. tinyurl.com/claytronics, 2006.[accessed 2013-03-30].
[15] S. Conversy. Improving usability of interactive graphics specification andimplementation with picking views and inverse transformation. In Proc.VL/HCC’11, pages 153–160. IEEE, 2011.
[16] A. Dix and G. Ellis. Starting simple: adding value to static visualisationthrough simple interaction. In Proc. AVI’98, AVI ’98, pages 124–134,New York, NY, USA, 1998. ACM.
[17] N. Elmqvist, A. Moere, H. Jetter, D. Cernea, H. Reiterer, and T. Jankun-Kelly. Fluid interaction for information visualization. Information Visu-alization, 10(4):327–340, 2011.
[18] M. Fjeld and W. Barendregt. Epistemic action: A measure for cogni-tive support in tangible user interfaces? Behavior research methods,41(3):876–881, 2009.
[19] D. Gentner and J. Nielsen. The Anti-Mac interface. Commun. ACM,39(8):70–82, Aug. 1996.
[20] T. Grossman and R. Balakrishnan. The design and evaluation of selectiontechniques for 3d volumetric displays. In Proc. UIST’06, pages 3–12.ACM, 2006.
[21] J. Heer and M. Agrawala. Software design patterns for information visu-alization. TVCG, 12(5):853–860, 2006.
[22] J. Heer, S. K. Card, and J. A. Landay. Prefuse: a toolkit for interactiveinformation visualization. In Proc. CHI’05, pages 421–430. ACM, 2005.
[23] J. Heer and B. Shneiderman. Interactive dynamics for visual analysis.Queue, 10(2):30, 2012.
[24] M. Hegarty. The cognitive science of visual-spatial displays: Implicationsfor design. Topics in Cognitive Science, 3(3):446–474, 2011.
[25] K. Hinckley, R. Pausch, J. C. Goble, and N. F. Kassell. Passive real-worldinterface props for neurosurgical visualization. In CHI’94, 1994.
[26] H. Hochheiser and B. Shneiderman. Dynamic query tools for time se-ries data sets: timebox widgets for interactive exploration. InformationVisualization, 3(1):1–18, Mar. 2004.
[27] A. Højmose and R. Thielke. Dailystack. tinyurl.com/dailystack, 2010.[accessed 2013-03-30].
[28] E. L. Hutchins, J. D. Hollan, and D. A. Norman. Direct manipulationinterfaces. Human–Computer Interaction, 1(4):311–338, 1985.
[29] P. Isenberg, N. Elmqvist, J. Scholtz, D. Cernea, K.-L. Ma, and H. Hagen.Collaborative visualization: definition, challenges, and research agenda.Information Visualization, 10(4):310–326, 2011.
[30] H. Ishii, D. Lakatos, L. Bonanni, and J. Labrune. Radical atoms: beyondtangible bits, toward transformable materials. interactions, 19(1):38–51,2012.
[31] H. Ishii and B. Ullmer. Tangible bits: towards seamless interfaces be-tween people, bits and atoms. In Proc. CHI’97, pages 234–241. ACM,1997.
[32] Y. Jansen, P. Dragicevic, and J.-D. Fekete. Tangible remote controllersfor wall-size displays. In Proc. CHI’12, pages 2865–2874, New York,NY, USA, 2012. ACM.
[33] Y. Jansen, P. Dragicevic, and J.-D. Fekete. Evaluating the efficiency ofphysical visualizations. In Proc. CHI’13, pages 2593–2602. ACM, 2013.
[34] S. H. Johnson-Frey. What’s so special about human tool use? Neuron,39(2):201–4, 2003.
[35] D. Kirsh. Interaction, external representation and sense making. In Pro-
ceedings of the Thirty First Annual Conference of the Cognitive ScienceSociety, pages 1103–1108, 2009.
[36] S. Klemmer, B. Hartmann, and L. Takayama. How bodies matter: fivethemes for interaction design. In Proc. DIS’06, pages 140–149. ACM,2006.
[37] R. Kosara. Visualization criticism-the missing link between informationvisualization and art. In Information Visualization, IV’07, pages 631–636.IEEE, 2007.
[38] K. J. Kruszynski and R. van Liere. Tangible props for scientific visualiza-tion: concept, requirements, application. Virtual reality, 13(4):235–244,2009.
[39] B. Lee, P. Isenberg, N. Riche, S. Carpendale, et al. Beyond mouse andkeyboard: Expanding design considerations for information visualizationinteractions. TVCG, 18(12), 2012.
[40] D. Leithinger, D. Lakatos, A. DeVincenzi, M. Blackshaw, and H. Ishii.Direct and gestural interaction with relief: A 2.5 d shape display. InProc. UIST’11, 2011.
[41] Z. Liu and J. T. Stasko. Mental models, visual reasoning and interactionin information visualization: A top-down perspective. TVCG, 16(6):999–1008, 2010.
[42] A. Maravita and A. Iriki. Tools for the body (schema). Trends in cognitivesciences, 8(2):79–86, 2004.
[43] M. Nacenta, U. Hinrichs, and S. Carpendale. FatFonts: combining thesymbolic and visual aspects of numbers. In Proc. AVI’12, pages 407–414. ACM, 2012.
[44] M. Nancel, J. Wagner, E. Pietriga, O. Chapuis, and W. Mackay. Mid-airpan-and-zoom on wall-sized displays. Proc. CHI’11, 2011.
[45] A. Norton, M. Rubin, and L. Wilkinson. Streaming graphics. StatisticalComputing and Graphics Newsletter, 12(1):11–14, 2001.
[46] W. A. Pike, J. Stasko, R. Chang, and T. A. O’Connell. The science ofinteraction. Information Visualization, 8(4):263–274, 2009.
[47] M. K. Rasmussen, E. W. Pedersen, M. G. Petersen, and K. Hornbæk.Shape-changing interfaces: a review of the design space and open re-search questions. In CHI’12, 2012.
[48] H. Reininger. Hans Rosling’s Shortest TED talk. http://youtu.be/UNs-ziziPyo, 2012. [accessed 2013-03-30].
[49] R. A. Rensink. Internal vs. external information in visual perception.In Proceedings of the 2nd international symposium on Smart graphics,pages 63–70. ACM, 2002.
[50] D. Schmandt-Besserat. How writing came about. University of TexasPress, 1996.
[51] B. Shneiderman. The eyes have it: A task by data type taxonomy forinformation visualizations. In VL/HCC’96, pages 336–343. IEEE, 1996.
[52] B. Shneiderman. Designing the user interface. Pearson Education, 1998.[53] H. A. Skinner. A Guide to Constructs of Control. J Pers Soc Psychol.,
71(3):549–570, Sept. 1996.[54] M. Stefaner and D. Hemment. Emoto. tinyurl.com/emotovis, 2012. [ac-
cessed 2013-03-30].[55] D. Svanaes. Understanding Interactivity: Steps to a Phenomenology of
Human-Computer Interaction. PhD thesis, NTNU, 2000.[56] M. Tobiasz, P. Isenberg, and S. Carpendale. Lark: Coordinating co-
located collaboration with information visualization. TVCG, 15(6):1065–1072, 2009.
[57] A. B. Tucker. Computer science handbook. Chapman & Hall/CRC, 2004.[58] J. J. Van Wijk. The value of visualization. In Proc. VIS’05, pages 79–86.
IEEE, 2005.[59] B. Victor. A brief rant on the future of interaction design.
http://tinyurl.com/picsunderglass, 2011. [accessed 2013-03-30].[60] F. B. Viegas, M. Wattenberg, F. Van Ham, J. Kriss, and M. McKeon.
Manyeyes: a site for visualization at internet scale. TVCG, 13(6):1121–1128, 2007.
[61] S. Wehrend and C. Lewis. A problem-oriented classification of visualiza-tion techniques. In Proc. VIS’90, pages 139–143. IEEE, 1990.
[62] H. Wickham and L. Stryjewski. 40 years of boxplots. Am. Stat., 2011.[63] N. Wong, S. Carpendale, and S. Greenberg. Edgelens: an interactive
method for managing edge congestion in graphs. In Proc. InfoVis’03,pages 51–58. IEEE, 2003.
[64] J. S. Yi, Y. ah Kang, J. T. Stasko, and J. A. Jacko. Toward a deeper un-derstanding of the role of interaction in information visualization. TVCG,13(6):1224–1231, 2007.
[65] C. Ziemkiewicz and R. Kosara. Embedding information visualizationwithin visual representation. In Advances in Information and IntelligentSystems, pages 307–326. Springer, 2009.
Related Documents


