1 23 Hydrogeology Journal Official Journal of the International Association of Hydrogeologists ISSN 1431-2174 Hydrogeol J DOI 10.1007/s10040-014-1147-8 An integrated approach for aquifer vulnerability mapping using GIS and rough sets: study from an alluvial aquifer in North India Arina Khan, Haris Hasan Khan, Rashid Umar & Muneeb Hasan Khan

Welcome message from author
This document is posted to help you gain knowledge. Please leave a comment to let me know what you think about it! Share it to your friends and learn new things together.
Transcript
1 23
Hydrogeology JournalOfficial Journal of the InternationalAssociation of Hydrogeologists ISSN 1431-2174 Hydrogeol JDOI 10.1007/s10040-014-1147-8
An integrated approach for aquifervulnerability mapping using GIS and roughsets: study from an alluvial aquifer inNorth India
Arina Khan, Haris Hasan Khan, RashidUmar & Muneeb Hasan Khan
1 23
Your article is protected by copyright and
all rights are held exclusively by Springer-
Verlag Berlin Heidelberg. This e-offprint is
for personal use only and shall not be self-
archived in electronic repositories. If you wish
to self-archive your article, please use the
accepted manuscript version for posting on
your own website. You may further deposit
the accepted manuscript version in any
repository, provided it is only made publicly
available 12 months after official publication
or later and provided acknowledgement is
given to the original source of publication
and a link is inserted to the published article
on Springer's website. The link must be
accompanied by the following text: "The final
publication is available at link.springer.com”.
An integrated approach for aquifer vulnerability mapping using GISand rough sets: study from an alluvial aquifer in North India
Arina Khan & Haris Hasan Khan & Rashid Umar &
Muneeb Hasan Khan
Abstract A modified DRASTIC model in a geographicinformation system (GIS) environment coupled with aninformation-analytic technique called ‘rough sets’ is usedto understand the aquifer vulnerability characteristics of asegment of the lower Kali watershed in western UttarPradesh, India. Since the region is a flat plain, topography(T) is removed as a potential control. Other parameters arethe same as in DRASTIC, hence the new model is termedas DRASIC. The rough set technique is employed toprovide insight into the relative vulnerabilities of differentadministrative units (blocks) within the study area. Usingrough sets, three important factors are computed: strength,certainty and coverage. Strength indicates how thevulnerability characteristics vary in the entire area,certainty gives the relative fractions of low, medium andhigh vulnerability regions within a particular block, andcoverage computes the percentage of a particular vulner-ability state in each block. The purpose of the work is todemonstrate the utility of this integrated approach inclassifying different administrative blocks in the studyarea according to their aquifer vulnerability characteris-tics. This approach is particularly useful for block-levelplanning and decision making for sustainable managementof groundwater resources.
Keywords India . Groundwater vulnerability .Geographic information system . Fuzzy logic . Rough sets
Introduction
Groundwater pollution is the artificially induced degradationof natural groundwater quality. Sustainable groundwater-resource management involves understanding thehydrogeologic nature and mechanics of the resource. Forthis purpose, assessment of the natural vulnerability of theaquifers to contaminants is important. Regional-scale as-sessments such as vulnerability maps, have proven toprovide an effective means of assembling key informationassets, identifying environmental trends, and prioritizing theneed for detailed site-specific investigations within ground-water environments (Bekesi and McConchie 2002; Aller etal. 1987). Establishing a strategic framework for managingthe groundwater environment employs overlay/index tech-niques such as DRASTIC (Aller et al. 1987). In this model,spatial datasets on Depth to groundwater, Recharge byrainfall, Aquifer type, Soil properties, Topography, Impact ofthe vadose zone and the hydraulic Conductivity of theaquifer are combined (Navulur and Engel 1998; Al-Adamatet al. 2003; Voudouris et al. 2010). The DRASTIC modelcan be a valuable tool for identifying groundwater suppliesthat are vulnerable to contamination using basichydrogeologic variables believed to influence contaminanttransport from surface sources to groundwater (Kalinski etal. 1994). Some other researchers have also tried to correlatethe vulnerability index with contaminant parameters (Neshatet al. 2013; Javadi et al. 2011; Awawdeh and Jaradat 2010).Many workers have attempted to modify the DRASTICgroundwater vulnerability index, producing models such asvector-DRASTIC (Pacheco and Fernandes 2013),DRARCH (Guo et al. 2007), DRASTIC-Fm (Denny et al.2006), DRAMIC (Wang et al. 2007), and DRASIC-LU(Umar et al. 2009), to better suit the local conditions of therespective study areas. Also, Composite DRASTIC (CDindex) was used by Martínez-Bastida et al. 2010 to assessgroundwater vulnerability in central Spain. Sener andDavraz (2013) modified DRASTIC by adding two param-eters: lineament and land-use for assessing groundwatervulnerability, and an analytic hierarchy process (AHP)determined the rating coefficients of each parameter.Optimization using statistical and geostatistical methodswas done by Panagopoulos et al. (2006) to modify theDRASTIC model to predict the intrinsic vulnerability topollution in a part of Trifilia province, Greece.
Received: 13 November 2013 /Accepted: 21 April 2014
* Springer-Verlag Berlin Heidelberg 2014
A. Khan :R. Umar ())Department of Geology,Aligarh Muslim University, Aligarh, Indiae-mail: [email protected]
H. H. KhanDepartment of Earth Sciences,Pondicherry University, Pondicherry, India
M. H. KhanDepartment of Computer Engineering,Motilal Nehru National Institute of Technology, Allahabad, India
Hydrogeology JournalDOI 10.1007/s10040-014-1147-8
Author's personal copy
In general, overlay-index methods are quite effective indetermining groundwater vulnerability and are suitable foruse in GIS since they involve aggregation and overlaying ofmultiple maps (Tilahun and Merkel 2010). Integration ofvulnerability indices with a GIS that allows interactivemapping will improve management of water resources andlanduse (Connell and Daele 2003). Integrating information-analytic techniques with DRASTIC enhances its utility. Thecombined use of GIS and fuzzy rule based techniques isparticularly useful for modeling fuzzy inputs common tohydrogeologic parameters due to their tolerance of theinherent imprecision and uncertainty and it also shows amarked reduction in information loss when used with simpleGIS techniques (Burrough and McDonnell 1998; Burroughet al. 1992; Sui 1992). A GIS and fuzzy rule-based modelwas coupled to generate groundwater sensitivity maps andthe results were compared with the modified DRASTICindex and field-water-quality data by Dixon (2005). GIShelps categorise vulnerability maps based on a set of valuesinto zones of high, medium and low vulnerability. The entireset of administrative units cannot be reclassified into a singlezone as they usually consist of different vulnerability zones.For regional planning and decision-making purposes, therelative vulnerabilities of different administrative blocks areof importance. Uddameri and Honnungar (2007) combinedrough sets and GIS techniques to assess aquifer vulnerabilitycharacteristics in South Texas (USA) and ranked 18 differentcounties according to their vulnerabilities.
The present work attempts to demonstrate the usefulnessof a modified version of DRASTIC in combination withRST (rough set theory) to generalize aquifer vulnerabilitywithin a block. The new model, where topography has beenremoved, is based on low variance in terrain slope, and iscalled DRASIC. The evaluation method of aquifer media(A) and impact of vadose zone (I) factors is based on theactual aquifer disposition considering the cumulative thick-ness of sand in the aquifer and clay in the vadose zone, whichis unique and more realistic. GIS-based DRASIC vulnera-bility mapping is coupled with an information-analyticrough sets technique to classify different administrative units(blocks) within the study area according to their aquifervulnerability.
Study area
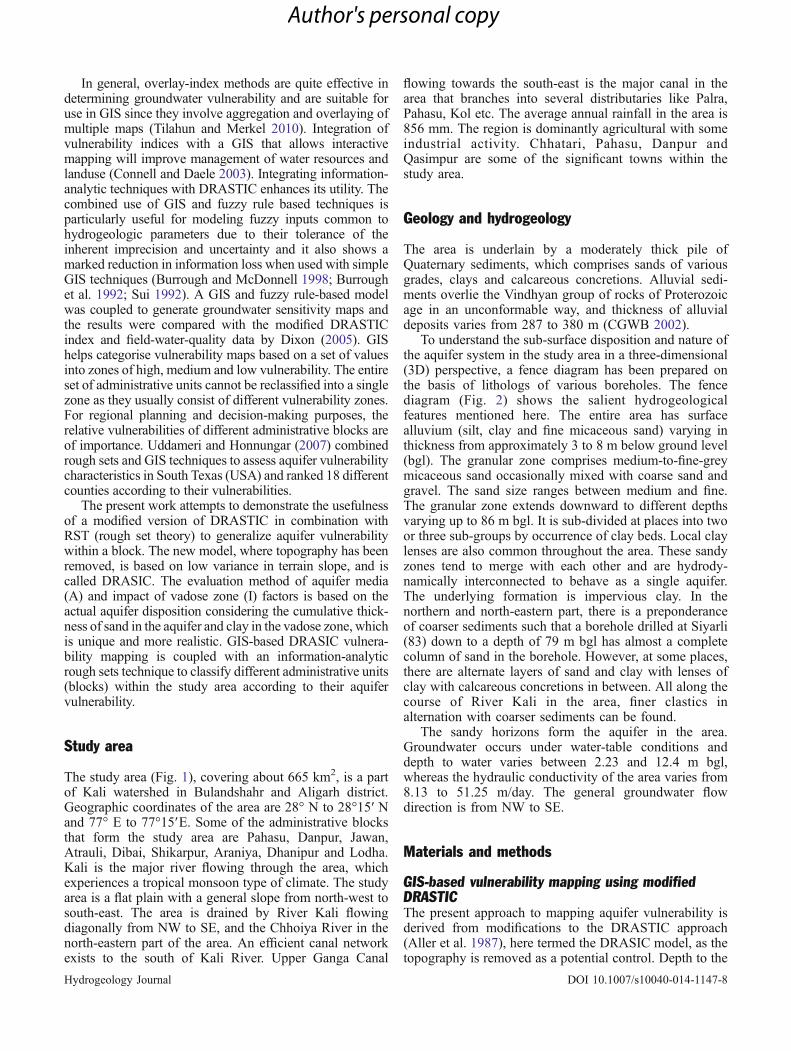
The study area (Fig. 1), covering about 665 km2, is a partof Kali watershed in Bulandshahr and Aligarh district.Geographic coordinates of the area are 28° N to 28°15′ Nand 77° E to 77°15′E. Some of the administrative blocksthat form the study area are Pahasu, Danpur, Jawan,Atrauli, Dibai, Shikarpur, Araniya, Dhanipur and Lodha.Kali is the major river flowing through the area, whichexperiences a tropical monsoon type of climate. The studyarea is a flat plain with a general slope from north-west tosouth-east. The area is drained by River Kali flowingdiagonally from NW to SE, and the Chhoiya River in thenorth-eastern part of the area. An efficient canal networkexists to the south of Kali River. Upper Ganga Canal
flowing towards the south-east is the major canal in thearea that branches into several distributaries like Palra,Pahasu, Kol etc. The average annual rainfall in the area is856 mm. The region is dominantly agricultural with someindustrial activity. Chhatari, Pahasu, Danpur andQasimpur are some of the significant towns within thestudy area.
Geology and hydrogeology
The area is underlain by a moderately thick pile ofQuaternary sediments, which comprises sands of variousgrades, clays and calcareous concretions. Alluvial sedi-ments overlie the Vindhyan group of rocks of Proterozoicage in an unconformable way, and thickness of alluvialdeposits varies from 287 to 380 m (CGWB 2002).
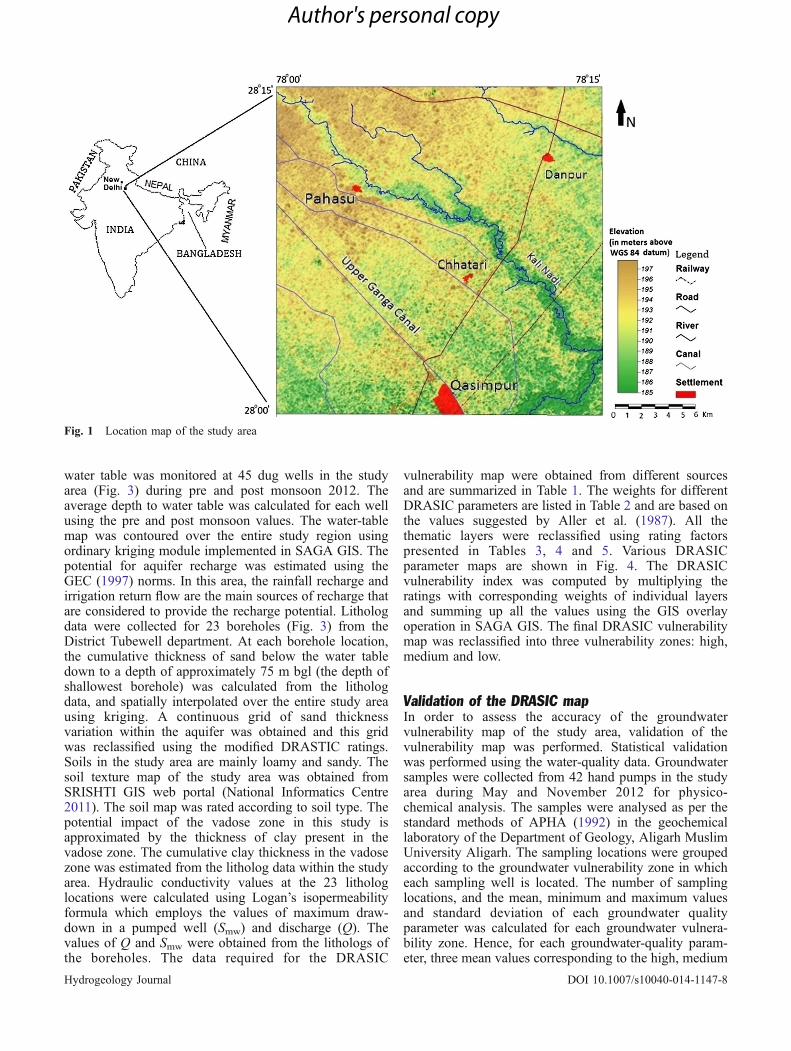
To understand the sub-surface disposition and nature ofthe aquifer system in the study area in a three-dimensional(3D) perspective, a fence diagram has been prepared onthe basis of lithologs of various boreholes. The fencediagram (Fig. 2) shows the salient hydrogeologicalfeatures mentioned here. The entire area has surfacealluvium (silt, clay and fine micaceous sand) varying inthickness from approximately 3 to 8 m below ground level(bgl). The granular zone comprises medium-to-fine-greymicaceous sand occasionally mixed with coarse sand andgravel. The sand size ranges between medium and fine.The granular zone extends downward to different depthsvarying up to 86 m bgl. It is sub-divided at places into twoor three sub-groups by occurrence of clay beds. Local claylenses are also common throughout the area. These sandyzones tend to merge with each other and are hydrody-namically interconnected to behave as a single aquifer.The underlying formation is impervious clay. In thenorthern and north-eastern part, there is a preponderanceof coarser sediments such that a borehole drilled at Siyarli(83) down to a depth of 79 m bgl has almost a completecolumn of sand in the borehole. However, at some places,there are alternate layers of sand and clay with lenses ofclay with calcareous concretions in between. All along thecourse of River Kali in the area, finer clastics inalternation with coarser sediments can be found.
The sandy horizons form the aquifer in the area.Groundwater occurs under water-table conditions anddepth to water varies between 2.23 and 12.4 m bgl,whereas the hydraulic conductivity of the area varies from8.13 to 51.25 m/day. The general groundwater flowdirection is from NW to SE.
Materials and methods
GIS-based vulnerability mapping using modifiedDRASTICThe present approach to mapping aquifer vulnerability isderived from modifications to the DRASTIC approach(Aller et al. 1987), here termed the DRASIC model, as thetopography is removed as a potential control. Depth to the
Hydrogeology Journal DOI 10.1007/s10040-014-1147-8
Author's personal copy
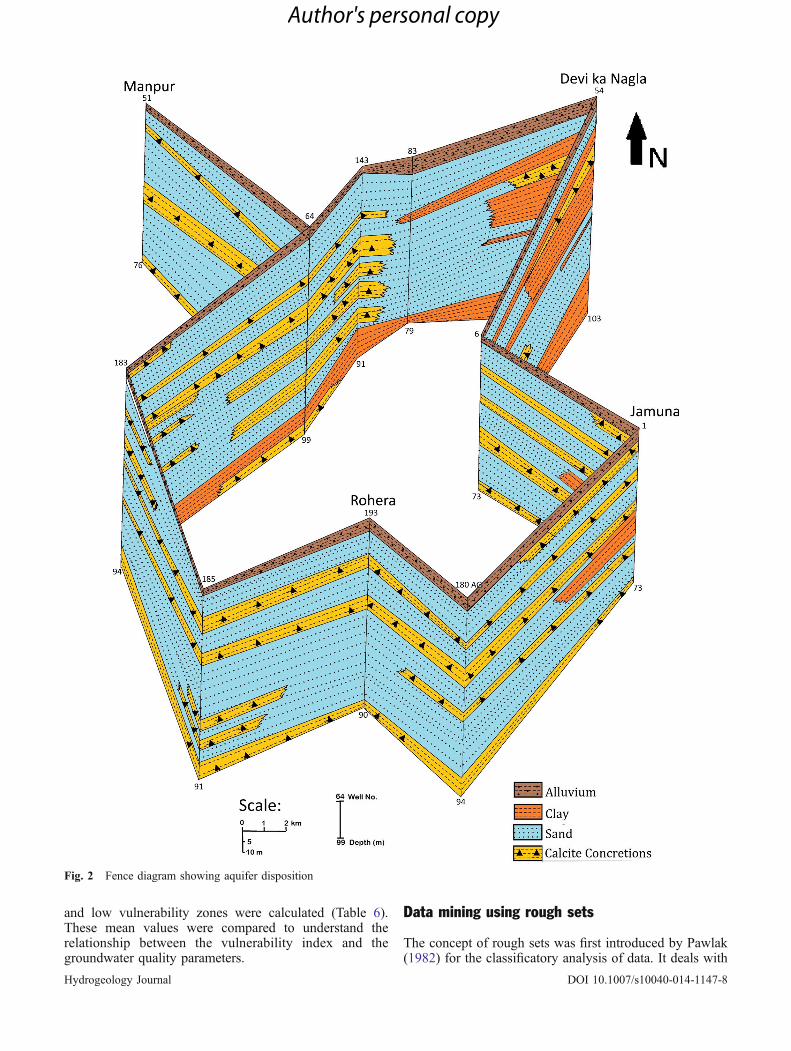
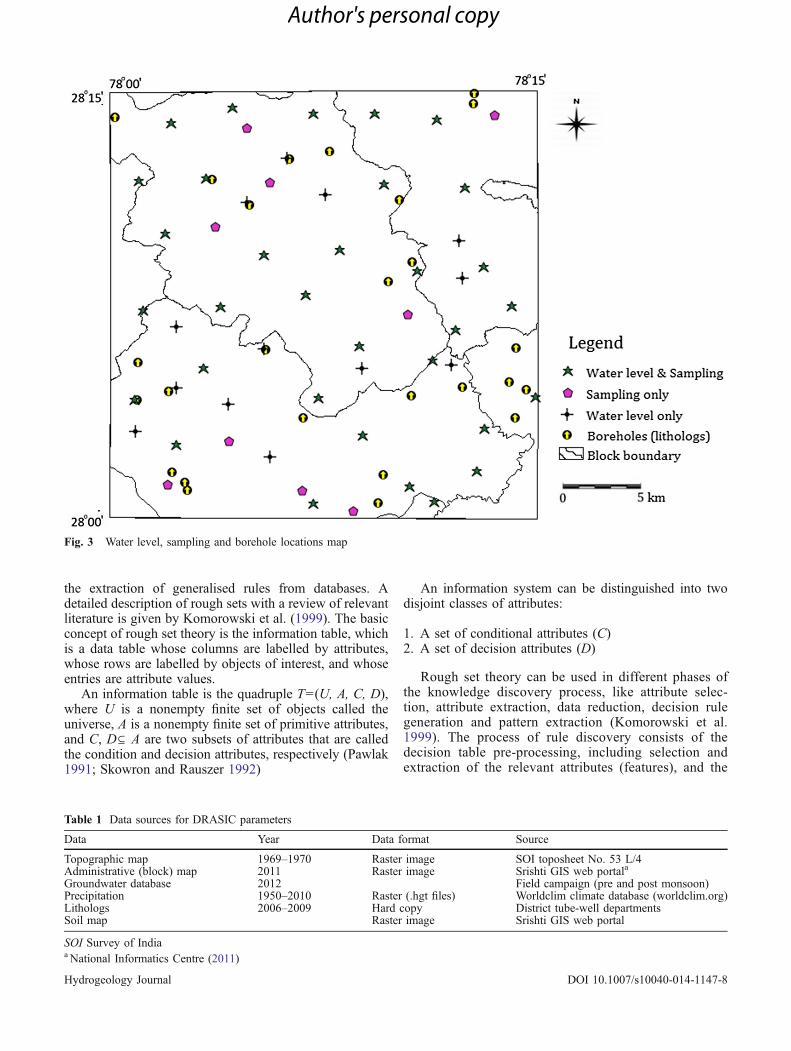
water table was monitored at 45 dug wells in the studyarea (Fig. 3) during pre and post monsoon 2012. Theaverage depth to water table was calculated for each wellusing the pre and post monsoon values. The water-tablemap was contoured over the entire study region usingordinary kriging module implemented in SAGA GIS. Thepotential for aquifer recharge was estimated using theGEC (1997) norms. In this area, the rainfall recharge andirrigation return flow are the main sources of recharge thatare considered to provide the recharge potential. Lithologdata were collected for 23 boreholes (Fig. 3) from theDistrict Tubewell department. At each borehole location,the cumulative thickness of sand below the water tabledown to a depth of approximately 75 m bgl (the depth ofshallowest borehole) was calculated from the lithologdata, and spatially interpolated over the entire study areausing kriging. A continuous grid of sand thicknessvariation within the aquifer was obtained and this gridwas reclassified using the modified DRASTIC ratings.Soils in the study area are mainly loamy and sandy. Thesoil texture map of the study area was obtained fromSRISHTI GIS web portal (National Informatics Centre2011). The soil map was rated according to soil type. Thepotential impact of the vadose zone in this study isapproximated by the thickness of clay present in thevadose zone. The cumulative clay thickness in the vadosezone was estimated from the litholog data within the studyarea. Hydraulic conductivity values at the 23 lithologlocations were calculated using Logan’s isopermeabilityformula which employs the values of maximum draw-down in a pumped well (Smw) and discharge (Q). Thevalues of Q and Smw were obtained from the lithologs ofthe boreholes. The data required for the DRASIC
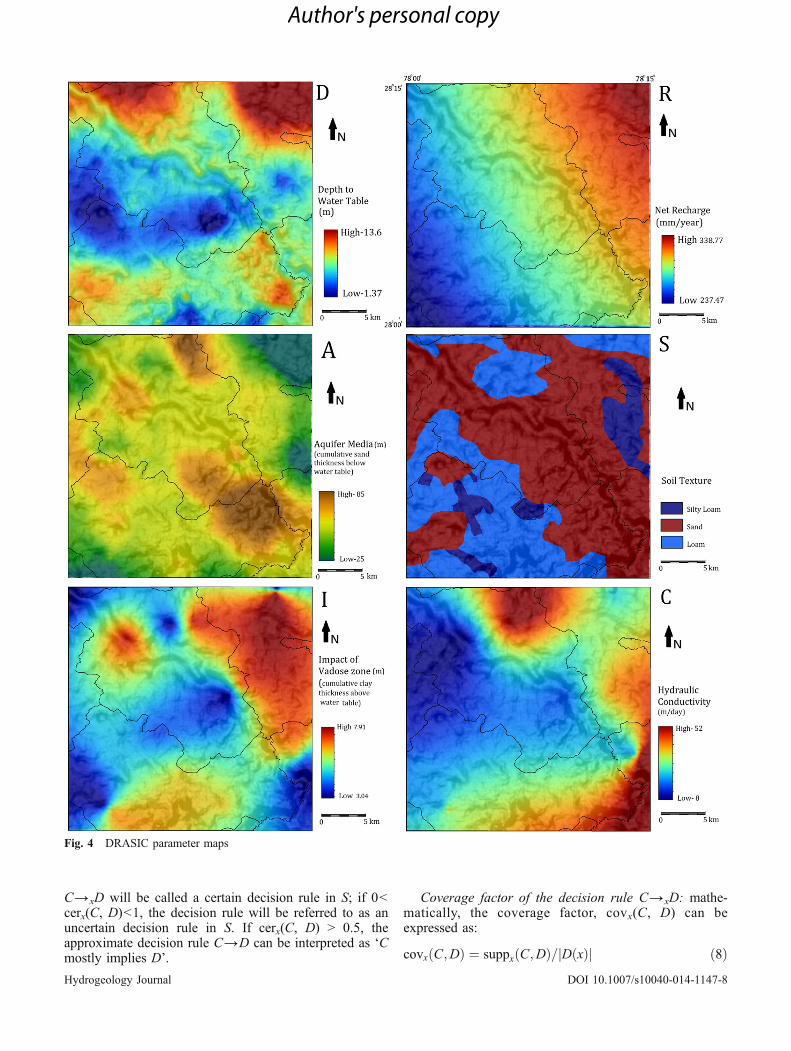
vulnerability map were obtained from different sourcesand are summarized in Table 1. The weights for differentDRASIC parameters are listed in Table 2 and are based onthe values suggested by Aller et al. (1987). All thethematic layers were reclassified using rating factorspresented in Tables 3, 4 and 5. Various DRASICparameter maps are shown in Fig. 4. The DRASICvulnerability index was computed by multiplying theratings with corresponding weights of individual layersand summing up all the values using the GIS overlayoperation in SAGA GIS. The final DRASIC vulnerabilitymap was reclassified into three vulnerability zones: high,medium and low.
Validation of the DRASIC mapIn order to assess the accuracy of the groundwatervulnerability map of the study area, validation of thevulnerability map was performed. Statistical validationwas performed using the water-quality data. Groundwatersamples were collected from 42 hand pumps in the studyarea during May and November 2012 for physico-chemical analysis. The samples were analysed as per thestandard methods of APHA (1992) in the geochemicallaboratory of the Department of Geology, Aligarh MuslimUniversity Aligarh. The sampling locations were groupedaccording to the groundwater vulnerability zone in whicheach sampling well is located. The number of samplinglocations, and the mean, minimum and maximum valuesand standard deviation of each groundwater qualityparameter was calculated for each groundwater vulnera-bility zone. Hence, for each groundwater-quality param-eter, three mean values corresponding to the high, medium
Fig. 1 Location map of the study area
Hydrogeology Journal DOI 10.1007/s10040-014-1147-8
Author's personal copy
and low vulnerability zones were calculated (Table 6).These mean values were compared to understand therelationship between the vulnerability index and thegroundwater quality parameters.
Data mining using rough sets
The concept of rough sets was first introduced by Pawlak(1982) for the classificatory analysis of data. It deals with
Fig. 2 Fence diagram showing aquifer disposition
Hydrogeology Journal DOI 10.1007/s10040-014-1147-8
Author's personal copy
the extraction of generalised rules from databases. Adetailed description of rough sets with a review of relevantliterature is given by Komorowski et al. (1999). The basicconcept of rough set theory is the information table, whichis a data table whose columns are labelled by attributes,whose rows are labelled by objects of interest, and whoseentries are attribute values.
An information table is the quadruple T=(U, A, C, D),where U is a nonempty finite set of objects called theuniverse, A is a nonempty finite set of primitive attributes,and C, D⊆ A are two subsets of attributes that are calledthe condition and decision attributes, respectively (Pawlak1991; Skowron and Rauszer 1992)
An information system can be distinguished into twodisjoint classes of attributes:
1. A set of conditional attributes (C)2. A set of decision attributes (D)
Rough set theory can be used in different phases ofthe knowledge discovery process, like attribute selec-tion, attribute extraction, data reduction, decision rulegeneration and pattern extraction (Komorowski et al.1999). The process of rule discovery consists of thedecision table pre-processing, including selection andextraction of the relevant attributes (features), and the
Fig. 3 Water level, sampling and borehole locations map
Table 1 Data sources for DRASIC parameters
Data Year Data format Source
Topographic map 1969–1970 Raster image SOI toposheet No. 53 L/4Administrative (block) map 2011 Raster image Srishti GIS web portala
Groundwater database 2012 Field campaign (pre and post monsoon)Precipitation 1950–2010 Raster (.hgt files) Worldclim climate database (worldclim.org)Lithologs 2006–2009 Hard copy District tube-well departmentsSoil map Raster image Srishti GIS web portal
SOI Survey of Indiaa National Informatics Centre (2011)
Hydrogeology Journal DOI 10.1007/s10040-014-1147-8
Author's personal copy
appropriate decision rule generation (Skowron andZhong 2001). Rough set methodologies are useful inresolving inconsistencies arising when two objectshave the same set of conditional attributes butdifferent decision attributes (Komorowski et al.1999). Pawlak (2005) has outlined a new approachto conflict analysis using rough sets, illustrated by asimple tutorial example of voting analysis in conflictsituation. The mathematical approach by Pawlak(2005) has been employed here to group together theadministrative blocks of similar groundwater vulnera-bility characteristics.
According to Pawlak (2005), a decision table describesdecisions determined, when some conditions are satisfied.Let us consider a decision table S=(U, C, D) where U is aset of objects, C is a set of conditions and D is a set ofdecisions. Every object, x, in the U set determines asequence c1(x) ,… ,cn(x) , d1(x) ,… ,dm(x) where(c1,…,cn)=C and (d1,…,dm)=D. The sequence will becalled a decision rule induced by x (in S) and isrepresented as:
c1 xð Þ;…; cn xð Þ→d1 xð Þ;…; dm xð Þ; ð1Þ
or simply as:
C→xD or C→D when x is known ð2Þ
Support of the decision rule C→xD: the intersection ofthe set of conditions and the set of the decision and isrepresented as:
suppx C;Dð Þ ¼ C xð Þ∩D xð Þ½ � ð3Þ
where C(x) and D(x) denote C and D granules induced byx respectively. │X│ denotes cardinality of X (Pawlak2005).
Strength of the decision rule C→xD: the strength of thedecision rule C→xD is given by
σx C;Dð Þ ¼ suppx C;Dð Þ= Uj j ð4Þ
Certainty factor of the decision rule C→xD: there is acertainty factor, cerx(C, D), associated with every decisionrule C→xD and it is defined as:
cerx C;Dð Þ ¼ suppx C;Dð Þ= C xð Þj j ð5Þ
¼ σx C;Dð Þ=Π C xð Þ½ � ð6Þ
where,
Π C xð Þ½ � ¼ C xð Þj j= Uj j ð7Þ
The certainty factor can be interpreted as the condi-tional probability of obtaining a decision D, or thecertainty with which C implies D. If cerx(C, D)=1, then
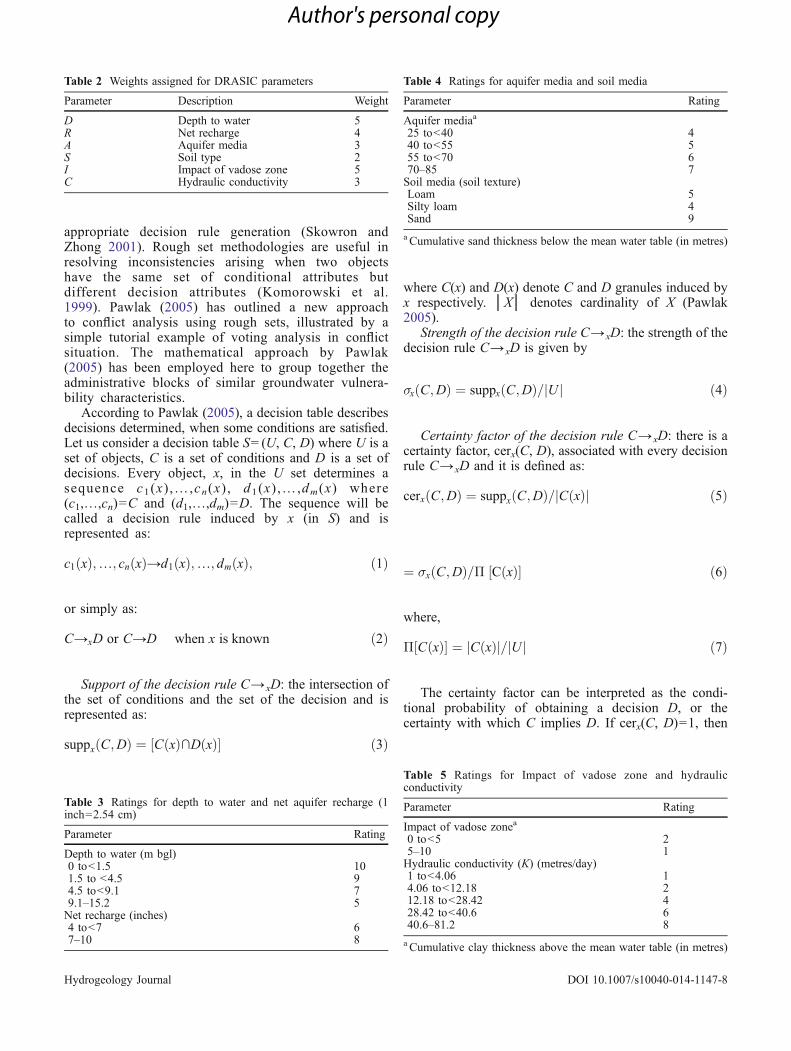
Table 2 Weights assigned for DRASIC parameters
Parameter Description Weight
D Depth to water 5R Net recharge 4A Aquifer media 3S Soil type 2I Impact of vadose zone 5C Hydraulic conductivity 3
Table 3 Ratings for depth to water and net aquifer recharge (1inch=2.54 cm)
Parameter Rating
Depth to water (m bgl)0 to<1.5 101.5 to <4.5 94.5 to<9.1 79.1–15.2 5Net recharge (inches)4 to<7 67–10 8
Table 4 Ratings for aquifer media and soil media
Parameter Rating
Aquifer mediaa
25 to<40 440 to<55 555 to<70 670–85 7Soil media (soil texture)Loam 5Silty loam 4Sand 9
a Cumulative sand thickness below the mean water table (in metres)
Table 5 Ratings for Impact of vadose zone and hydraulicconductivity
Parameter Rating
Impact of vadose zonea
0 to<5 25–10 1Hydraulic conductivity (K) (metres/day)1 to<4.06 14.06 to<12.18 212.18 to<28.42 428.42 to<40.6 640.6–81.2 8
a Cumulative clay thickness above the mean water table (in metres)
Hydrogeology Journal DOI 10.1007/s10040-014-1147-8
Author's personal copy
C→xD will be called a certain decision rule in S; if 0<cerx(C, D)<1, the decision rule will be referred to as anuncertain decision rule in S. If cerx(C, D) > 0.5, theapproximate decision rule C→D can be interpreted as ‘Cmostly implies D’.
Coverage factor of the decision rule C→xD: mathe-matically, the coverage factor, covx(C, D) can beexpressed as:
covx C;Dð Þ ¼ suppx C;Dð Þ= D xð Þj j ð8Þ
Fig. 4 DRASIC parameter maps
Hydrogeology Journal DOI 10.1007/s10040-014-1147-8
Author's personal copy
¼ σx C;Dð Þ=Π D xð Þ½ � ð9Þ
where,
Π D xð Þ½ � ¼ D xð Þj j= Uj j ð10Þ
If C→xD is a decision rule, then D→xC is the inversedecision rule. As such the coverage factor is the certaintyfactor for the inverse decision rule.
Results and discussion
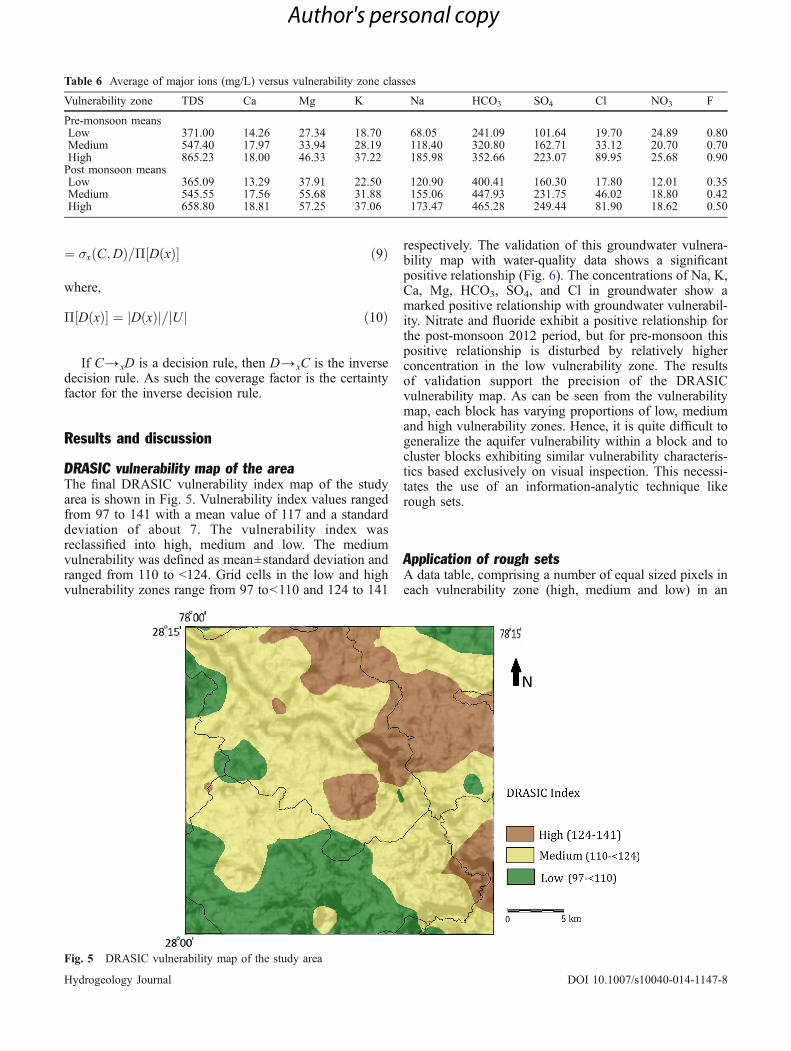
DRASIC vulnerability map of the areaThe final DRASIC vulnerability index map of the studyarea is shown in Fig. 5. Vulnerability index values rangedfrom 97 to 141 with a mean value of 117 and a standarddeviation of about 7. The vulnerability index wasreclassified into high, medium and low. The mediumvulnerability was defined as mean±standard deviation andranged from 110 to <124. Grid cells in the low and highvulnerability zones range from 97 to<110 and 124 to 141
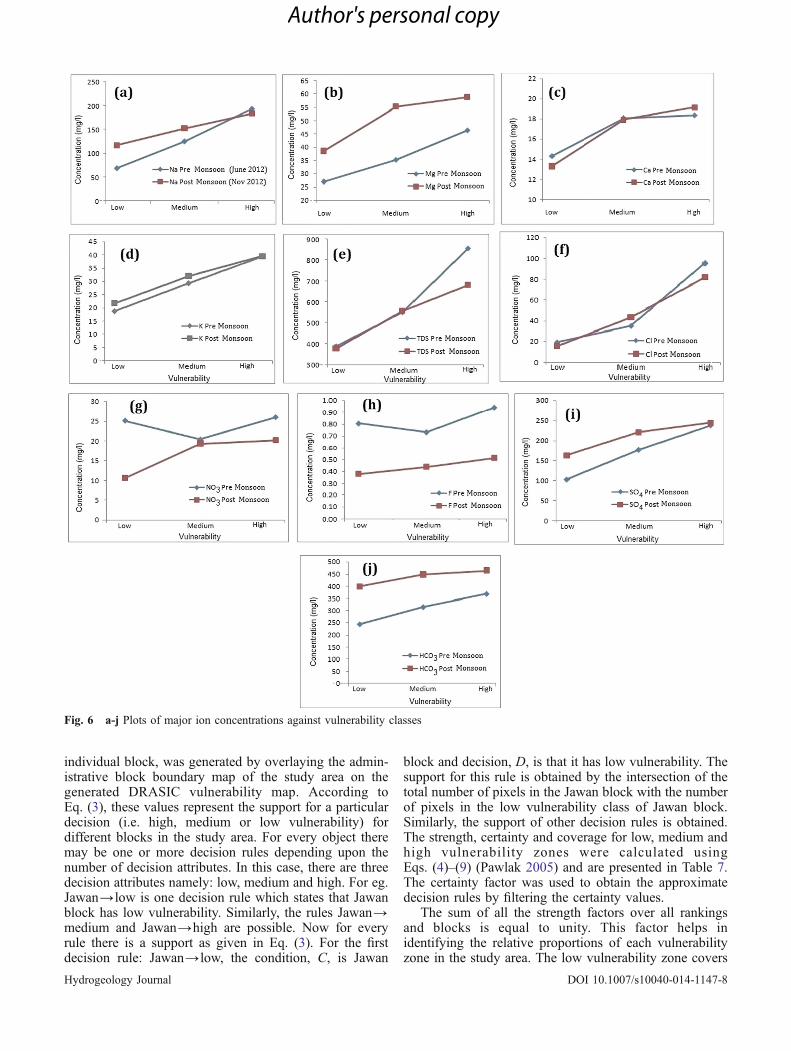
respectively. The validation of this groundwater vulnera-bility map with water-quality data shows a significantpositive relationship (Fig. 6). The concentrations of Na, K,Ca, Mg, HCO3, SO4, and Cl in groundwater show amarked positive relationship with groundwater vulnerabil-ity. Nitrate and fluoride exhibit a positive relationship forthe post-monsoon 2012 period, but for pre-monsoon thispositive relationship is disturbed by relatively higherconcentration in the low vulnerability zone. The resultsof validation support the precision of the DRASICvulnerability map. As can be seen from the vulnerabilitymap, each block has varying proportions of low, mediumand high vulnerability zones. Hence, it is quite difficult togeneralize the aquifer vulnerability within a block and tocluster blocks exhibiting similar vulnerability characteris-tics based exclusively on visual inspection. This necessi-tates the use of an information-analytic technique likerough sets.
Application of rough setsA data table, comprising a number of equal sized pixels ineach vulnerability zone (high, medium and low) in an
Table 6 Average of major ions (mg/L) versus vulnerability zone classes
Vulnerability zone TDS Ca Mg K Na HCO3 SO4 Cl NO3 F
Pre-monsoon meansLow 371.00 14.26 27.34 18.70 68.05 241.09 101.64 19.70 24.89 0.80Medium 547.40 17.97 33.94 28.19 118.40 320.80 162.71 33.12 20.70 0.70High 865.23 18.00 46.33 37.22 185.98 352.66 223.07 89.95 25.68 0.90Post monsoon meansLow 365.09 13.29 37.91 22.50 120.90 400.41 160.30 17.80 12.01 0.35Medium 545.55 17.56 55.68 31.88 155.06 447.93 231.75 46.02 18.80 0.42High 658.80 18.81 57.25 37.06 173.47 465.28 249.44 81.90 18.62 0.50
Fig. 5 DRASIC vulnerability map of the study area
Hydrogeology Journal DOI 10.1007/s10040-014-1147-8
Author's personal copy
individual block, was generated by overlaying the admin-istrative block boundary map of the study area on thegenerated DRASIC vulnerability map. According toEq. (3), these values represent the support for a particulardecision (i.e. high, medium or low vulnerability) fordifferent blocks in the study area. For every object theremay be one or more decision rules depending upon thenumber of decision attributes. In this case, there are threedecision attributes namely: low, medium and high. For eg.Jawan→ low is one decision rule which states that Jawanblock has low vulnerability. Similarly, the rules Jawan→medium and Jawan→high are possible. Now for everyrule there is a support as given in Eq. (3). For the firstdecision rule: Jawan→ low, the condition, C, is Jawan
block and decision, D, is that it has low vulnerability. Thesupport for this rule is obtained by the intersection of thetotal number of pixels in the Jawan block with the numberof pixels in the low vulnerability class of Jawan block.Similarly, the support of other decision rules is obtained.The strength, certainty and coverage for low, medium andhigh vulnerability zones were calculated usingEqs. (4)–(9) (Pawlak 2005) and are presented in Table 7.The certainty factor was used to obtain the approximatedecision rules by filtering the certainty values.
The sum of all the strength factors over all rankingsand blocks is equal to unity. This factor helps inidentifying the relative proportions of each vulnerabilityzone in the study area. The low vulnerability zone covers
Fig. 6 a-j Plots of major ion concentrations against vulnerability classes
Hydrogeology Journal DOI 10.1007/s10040-014-1147-8
Author's personal copy
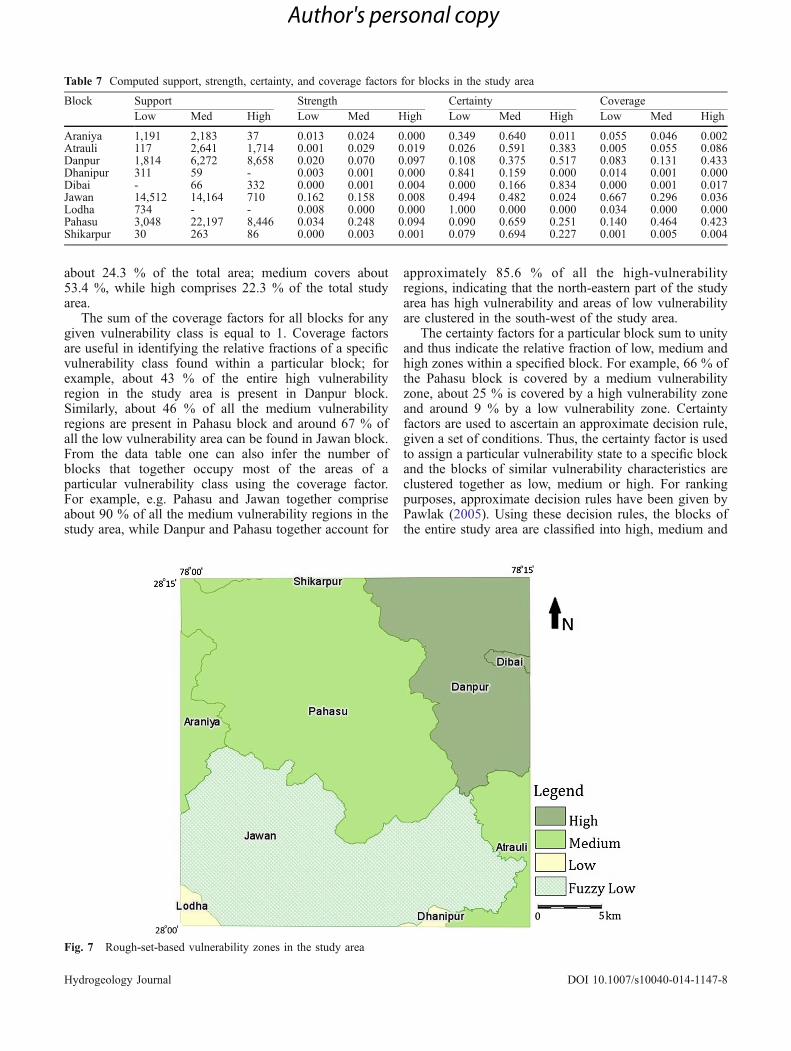
about 24.3 % of the total area; medium covers about53.4 %, while high comprises 22.3 % of the total studyarea.
The sum of the coverage factors for all blocks for anygiven vulnerability class is equal to 1. Coverage factorsare useful in identifying the relative fractions of a specificvulnerability class found within a particular block; forexample, about 43 % of the entire high vulnerabilityregion in the study area is present in Danpur block.Similarly, about 46 % of all the medium vulnerabilityregions are present in Pahasu block and around 67 % ofall the low vulnerability area can be found in Jawan block.From the data table one can also infer the number ofblocks that together occupy most of the areas of aparticular vulnerability class using the coverage factor.For example, e.g. Pahasu and Jawan together compriseabout 90 % of all the medium vulnerability regions in thestudy area, while Danpur and Pahasu together account for
approximately 85.6 % of all the high-vulnerabilityregions, indicating that the north-eastern part of the studyarea has high vulnerability and areas of low vulnerabilityare clustered in the south-west of the study area.
The certainty factors for a particular block sum to unityand thus indicate the relative fraction of low, medium andhigh zones within a specified block. For example, 66 % ofthe Pahasu block is covered by a medium vulnerabilityzone, about 25 % is covered by a high vulnerability zoneand around 9 % by a low vulnerability zone. Certaintyfactors are used to ascertain an approximate decision rule,given a set of conditions. Thus, the certainty factor is usedto assign a particular vulnerability state to a specific blockand the blocks of similar vulnerability characteristics areclustered together as low, medium or high. For rankingpurposes, approximate decision rules have been given byPawlak (2005). Using these decision rules, the blocks ofthe entire study area are classified into high, medium and
Fig. 7 Rough-set-based vulnerability zones in the study area
Table 7 Computed support, strength, certainty, and coverage factors for blocks in the study area
Block Support Strength Certainty CoverageLow Med High Low Med High Low Med High Low Med High
Araniya 1,191 2,183 37 0.013 0.024 0.000 0.349 0.640 0.011 0.055 0.046 0.002Atrauli 117 2,641 1,714 0.001 0.029 0.019 0.026 0.591 0.383 0.005 0.055 0.086Danpur 1,814 6,272 8,658 0.020 0.070 0.097 0.108 0.375 0.517 0.083 0.131 0.433Dhanipur 311 59 - 0.003 0.001 0.000 0.841 0.159 0.000 0.014 0.001 0.000Dibai - 66 332 0.000 0.001 0.004 0.000 0.166 0.834 0.000 0.001 0.017Jawan 14,512 14,164 710 0.162 0.158 0.008 0.494 0.482 0.024 0.667 0.296 0.036Lodha 734 - - 0.008 0.000 0.000 1.000 0.000 0.000 0.034 0.000 0.000Pahasu 3,048 22,197 8,446 0.034 0.248 0.094 0.090 0.659 0.251 0.140 0.464 0.423Shikarpur 30 263 86 0.000 0.003 0.001 0.079 0.694 0.227 0.001 0.005 0.004
Hydrogeology Journal DOI 10.1007/s10040-014-1147-8
Author's personal copy
low vulnerability zones; thus, Danpur and Dibai cluster ina high vulnerability zone, while Pahasu block and parts ofShikarpur, Araniya and Atrauli that lie in the study areaare clustered into a medium vulnerability zone. Parts ofLodha and Dhanipur block in the study area fall in a lowvulnerability zone.
In the case where certainty is <0.5 in all thevulnerability classes for a particular block, a singledominant vulnerability state cannot be assigned to theblock. This can be regarded as an indiscernible set, wherecertainty <0.5 in all the ranking classes and these blockscan pose challenges to decision making in planningsituations. A crisp classification of vulnerability zones ispreferred; thus, the blocks in the indiscernible sets can beassigned their maximal vulnerability characteristic and aprefix fuzzy is added to the vulnerability state. Figure 7shows the rough-set-based vulnerability classification ofthe different blocks in the study area.
Summary and conclusions
The present study is based on the integrated GIS-rough settechnique which involves the assessment of vulnerabilitycharacteristics of a geographical area and its representa-tion with respect to administrative boundaries within thestudy area. The GIS-based DRASIC model assessesaquifer vulnerability of a geographical area irrespectiveof administrative boundaries, whereas the rough setmethod generalizes the vulnerability characteristics withina block. This enhances the utility of vulnerability mappingand is also helpful for water-resource planning at blocklevel. The uniqueness of the present work lies in thecoupling of GIS and rough sets to enhance the utility ofvulnerability maps for groundwater management andpolicy makers. The results show that high vulnerabilityis observed in some areas in the north and east of thestudy area. The south-western part shows low to mediumvulnerability to contamination. Most of the central portionand parts of the south-eastern area show mediumvulnerability. The vulnerability index ranges from 97 to141. Statistical validation of the DRASIC vulnerabilitymap was carried out using field-water-quality data. Mostof the ions show a marked positive relationship withgroundwater vulnerability and this supports the precisionof the DRASIC vulnerability map.
The rough-set-based mathematical approach by Pawlak(2005) is employed in this work to cluster the blocksaccording to the groundwater vulnerability characteristics.Three important factors are computed: strength, certaintyand coverage. Certainty factors and approximate decisionrules were used to group the different blocks according totheir vulnerability states and consequently a rough-set-based vulnerability map was prepared. This map showshigh vulnerability in Danpur and Dibai, and mediumvulnerability in Pahasu and parts of Araniya, Shikarpur,Atrauli. In some cases, the approximate decision rules didnot give a crisp classification and resultantly Jawan blockcould not be assigned a dominant vulnerability state. This
indiscernibility was overcome by assigning a fuzzy lowvulnerability state to the block according to its certaintyfactor. Rough set methodology in combination with GISgives us new insights into the database for a betterunderstanding of the vulnerability characteristics of thearea. This technique can be upscaled and applied to largerareas to enhance the utility of vulnerability maps.
Acknowledgements The financial assistance received by the firstauthor in the form of Senior Research Fellowship from UniversityGrant Commission, New Delhi, is acknowledged. The authors arethankful to the reviewer Dr. Fernando A. L. Pacheco and ananonymous reviewer for their suggestions, which helped improvethe manuscript.
References
Al-Adamat RAN, Foster IDN, Baban SMJ (2003) Groundwatervulnerability and risk mapping for the Basaltic aquifer of theAzraq basin of Jordan using GIS, Remote sensing andDRASTIC. Appl Geogr 23:303–324
Aller L, Bennet T, Lehr JH, Petty RJ (1987) DRASTIC: astandardized system for evaluating groundwater pollutionpotential using hydrogeologic settings. US EPA report 600/2–85/018. US EPA, Washington, DC
APHA (1992) Standard methods for the examination of water andwastewater, 18th edn. American Public Health Association,Washington, DC
Awawdeh MM, Jaradat RA (2010) Evaluation of aquifers vulner-ability to contamination in the Yarmouk River basin, Jordan,based on DRASTIC method. Arab J Geosci 3:273–282
Bekesi G, McConchie J (2002) The use of aquifer-media charac-teristics to model vulnerability to contamination, ManawatuRegion, New Zealand. Hydrogeol J 10:322–331
Burrough PA, McDonnell R (1998) Principles of geographicalinformation systems. Oxford University Press, New York, 346pp
Burrough PA, Macmillan RA, Van Deursen W (1992) Fuzzyclassification methods for determining land suitability from soilprofile observations and topography. J Soil Sci 43(2):193–210
CGWB (2002) Groundwater resource and development potentials ofAligarh, Uttar Pradesh. Central Ground Water Board, Faridabad,India, 40 pp
Connell LD, Van den Daele G (2003) A quantitative approach toaquifer vulnerability mapping. J Hydrol 276:71–88
Denny SC, Allen DM, Journeay JM (2006) DRASTIC-Fm: amodified vulnerability mapping method for structurally con-trolled aquifers in the southern Gulf Islands, British Columbia,Canada. J Hydrol. doi:10.1007/s10040-006-0102-8
Dixon B (2005) Applicability of neuro-fuzzy techniques inpredicting ground-water vulnerability: a GIS-based sensitivityanalysis. J Hydrol 309:17–38
GEC, Ministry Of Water Resources (1997) Report of the ground-water resource estimation committee: groundwater resourceestimation methodology. Government of India, New Delhi
Guo Q, Wang Y, Gao X, Ma T (2007) A new model (DRARCH) forassessing groundwater vulnerability to arsenic contamination atbasin scale: a case study in Taiyuan basin, northern China.Environ Geol 52:923–932
Javadi S, Kavehkar N, Mousavizadeh MH, Mohammadi K (2011)Modification of DRASTIC model to map groundwater vulner-ability to pollution using nitrate measurements in agriculturalareas. J Agric Sci Tech 13:239–249
Kalinski RJ, Kelly WE, Bogardi I, Ehrman RL, Yamamoto PD(1994) Correlation between DRASTIC vulnerabilities andincidents of VOC contamination of municipal wells inNebraska. Groundwater 32(1):31–34
Hydrogeology Journal DOI 10.1007/s10040-014-1147-8
Author's personal copy
Komorowski J, Pawlak Z, Polkowski L, Skowron A (1999) Roughsets: a tutorial. In: Pal SK, Skowron A (eds) Rough fuzzyhybridization: a new trend in decision making. Springer,Singapore, pp 3–98
Martínez-Bastida JJ, Arauzo M, Valladolid M (2010) Intrinsic andspecific vulnerability of groundwater in central Spain: the riskof nitrate pollution. Hydrogeol J 18:681–698
National Informatics Centre (2011) Srishti GIS web portal. http://gis.up.nic.in:8080/srishti/. Accessed January 2013
Navulur KCS, Engel BA (1998) Groundwater vulnerability assess-ment to non-point source nitrate pollution on a regional scaleusing GIS. Trans Am Soc Agric Eng 41:1671–1678
Neshat A, Pradhan B, Pirasteh S, Shafri HZM (2013) Estimatinggroundwater vulnerability to pollution using a modifiedDRASTIC model in the Kerman agricultural area. EnvironEarth Sci. doi:10.1007/s12665-013-2690-7
Pacheco FAL, Sanches Fernandes LF (2013) The multivariatestatistical structure of DRASTIC model. J Hydrol 476:442–459
Panagopoulos GP, Antonakos AK, Lambrakis NJ (2006)Optimization of the DRASTIC method for groundwatervulnerability assessment via the use of simple statisticalmethods and GIS. Hydrol J 14:894–911
Pawlak Z (1982) Rough sets. Int J Comp Inf Sci 11:341–356Pawlak Z (1991) Rough sets: theoretical aspects of reasoning about
data. Kluwer, BostonPawlak Z (2005) Some remarks on conflict analysis. Eur J Oper Res
166:649–654
Sener E, Davraz A (2013) Assessment of groundwater vulnerabilitybased on a modified DRASTIC model, GIS and an analytichierarchy process (AHP) method: the case of Egirdir Lake basin(Isparta, Turkey). Hydrogeol J 21:701–714
Skowron A, Rauszer C (1992) The discernibility matrixes andfunctions in information systems. In: Slowinski R (ed)Intelligent decision support. Kluwer, Boston, pp 331–362
Skowron A, Zhong N (2001) A rough set-based knowledgediscovery process. Int J Appl Math Comput Sci 11(3):603–619
Sui DZ (1992) A fuzzy GIS modeling approach for urban landevaluation. Comput Environ Urban Syst 16(2):101–115
Tilahun K, Merkel BJ (2010) Assessment of groundwater vulner-ability to pollution in Dire Dawa, Ethiopia using DRASTIC.Environ Earth Sci 59:1485–1496
Uddameri V, Honnungar V (2007) Combining rough sets and GIStechniques to assess aquifer vulnerability characteristics in thesemi-arid South Texas. Environ Geol 51:931–939
Umar R, Ahmed I, Alam F (2009) Mapping groundwater vulnerablezones using modified DRASTIC approach of an alluvial aquiferin parts of Central Ganga Plain. Western Uttar Pradesh J GeolSoc India 73:193–201
Voudouris K, Kazakis N, Polemio M, Kareklas K (2010)Assessment of intrinsic vulnerability using the DRASTICmodel and GIS in the Kiti aquifer, Cyprus. Eur Water 30:13–24
Wang Y, Merkel BJ, Li Y, Ye H, Fu S, Ihm D (2007) Vulnerabilityof groundwater in Quaternary aquifers to organic contaminants:a case study in Wuhan City, China. Environ Geol. doi:10.1007/s00254-007-0669-y
Hydrogeology Journal DOI 10.1007/s10040-014-1147-8
Author's personal copy
Related Documents