Fax to: +4930/82787-65242 Karl-D. Baumann Springer, Berlin From: Re: Environmental Geology DOI 10.1007/s00254-004-1107-z Modelling seasonal variations in nitrate and sulphate concentrations in a vulnerable alluvial aquifer Authors: Peeters · Haerens · der Sluys · Dassargues I. Permission to publish Dear Karl-D. Baumann, I have checked the proofs of my article and ❑ I have no corrections. The article is ready to be published without changes. ❑ I have a few corrections. I am enclosing the following pages: ❑ I have made many corrections. Enclosed is the complete article. II. Offprint order ❑ I do not wish to order offprints ❑ Offprint order enclosed Remarks: Date / signature III. Copyright Transfer Statement (sign only if not submitted previously) The copyright to this article is transferred to Springer-Verlag (for U.S. government employees: to the extent transferable) effective if and when the article is accepted for publication. The copyright transfer covers the exclusive right to reproduce and distribute the article, including reprints, translations, photographic reproductions, microform, electronic form (offline, online) or any other reproductions of similar nature. An author may make his/her article published in this journal available on his/her home page provided the source of the published article is cited and Springer-Verlag is mentioned as copyright owner. Authors are requested to create a link to the published article in Springer’s internet service. The link must be accompanied by the following text: “The original publication is available at springerlink.com.” Please use the appropriate DOI for the article (go to the Linking Options in the article, then to OpenURL and use the link with the DOI). Articles disseminated via SpringerLink are indexed, abstracted and referenced by many abstracting and information services, bibliographic networks, subscription agencies, library networks, and consortia. The author warrants that this contribution is original and that he/she has full power to make this grant. The author signs for and accepts responsibility for releasing this material on behalf of any and all co-authors. After submission of this agreement signed by the corresponding author, changes of authorship or in the order of the authors listed will not be accepted by Springer. Date / Author’s signature

Welcome message from author
This document is posted to help you gain knowledge. Please leave a comment to let me know what you think about it! Share it to your friends and learn new things together.
Transcript
Fax to: +4930/82787-65242Karl-D. BaumannSpringer, Berlin
From:Re: Environmental Geology DOI 10.1007/s00254-004-1107-z
Modelling seasonal variations in nitrate and sulphate concentrations in a vulnerable alluvialaquifer
Authors: Peeters · Haerens · der Sluys · Dassargues
I. Permission to publishDear Karl-D. Baumann,
I have checked the proofs of my article and
❑ I have no corrections. The article is ready to be published without changes.
❑ I have a few corrections. I am enclosing the following pages:
❑ I have made many corrections. Enclosed is the complete article.
II. Offprint order❑ I do not wish to order offprints❑ Offprint order enclosed
Remarks:
Date / signature
III. Copyright Transfer Statement (sign only if not submitted previously)The copyright to this article is transferred to Springer-Verlag (for U.S. government employees: to the extenttransferable) effective if and when the article is accepted for publication. The copyright transfer covers theexclusive right to reproduce and distribute the article, including reprints, translations, photographic reproductions,microform, electronic form (offline, online) or any other reproductions of similar nature.An author may make his/her article published in this journal available on his/her home page provided the
source of the published article is cited and Springer-Verlag is mentioned as copyright owner. Authors arerequested to create a link to the published article in Springer’s internet service. The link must be accompaniedby the following text: “The original publication is available at springerlink.com.” Please use the appropriateDOI for the article (go to the Linking Options in the article, then to OpenURL and use the link with the DOI).Articles disseminated via SpringerLink are indexed, abstracted and referenced by many abstracting andinformation services, bibliographic networks, subscription agencies, library networks, and consortia.The author warrants that this contribution is original and that he/she has full power to make this grant. The
author signs for and accepts responsibility for releasing this material on behalf of any and all co-authors.After submission of this agreement signed by the corresponding author, changes of authorship or in the order
of the authors listed will not be accepted by Springer.
Date / Author’s signature

Journal: Environmental GeologyDOI: 10.1007/s00254-004-1107-z
Offprint Order Form• If you do not return this order form, we assume thatyou do not wish to order offprints.
• To determine if your journal provides free offprints,please check the journal’s instructions to authors.
• You are entitled to a PDF file if you order offprints. • If you order offprints after the issue has gone to press,costs are much higher. Therefore, we can supply• Please specify where to send the PDF file:offprints only in quantities of 300 or more after thistime.
• For orders involving more than 500 copies, please askthe production editor for a quotation.
❑
Please note that orders will be processed only if a credit card number has beenprovided. For German authors, payment by direct debit is also possible.
I wish to be charged in ❑ Euro ❑ USD
Prices include surface mail postage and handling.Customers in EU countries who are not registered for VATshould add VAT at the rate applicable in their country.
VAT registration number (EU countries only):
For authors resident in Germany: payment by directdebit:I authorize Springer to debit the amount owed frommy bank account at the due time.
Account no.:
Bank code:
Bank:
Date / Signature:
Please enter my order for:
Price USDPrice EURCopies330.00300.0050❑405.00365.00100❑575.00525.00200❑750.00680.00300❑940.00855.00400❑1,130.001,025.00500❑
Please charge my credit card❑ Eurocard/Access/Mastercard❑ American Express❑ Visa/Barclaycard/Americard
Number (incl. check digits):_ _ _ _ _ _ _ _ _ _ _ _ _ _ _ _ _ _ _Valid until: _ _ / _ _
Date / Signature:
Ship offprints to:Send receipt to:
❑ Luk PeetersCatholic University of LeuvenDept. of Geology-GeographyLaboratory of Hydrogeology16b RedingenstraatLeuven3000, Belgium
❑ Luk PeetersCatholic University of LeuvenDept. of Geology-GeographyLaboratory of Hydrogeology16b RedingenstraatLeuven3000, Belgium
❑ ❑

Environmental Geology© Springer-Verlag 2004DOI 10.1007/s00254-004-1107-z
Original Article
Modelling seasonal variations in nitrate andsulphate concentrations in a vulnerable alluvialaquiferLuk Peeters (✉) · Bruno Haerens · Jan Van der Sluys · Alain Dassargues
L. Peeters · B. Haerens · A. DassarguesLaboratory for Hydrogeology, Department of Geology-Geography, Faculty of Exact Science,Catholic University of Leuven, Redingenstraat 16b, 3000 Leuven, Belgium
J. V. der SluysVlaamse Maatschappij voor Watervoorziening (VMW), Belliardstraat 73, 1070 Brussels, Belgium
A. DassarguesHydrogeology and Environmental Geology, Department of Georesources, Geotechnologies andBuilding Materials (GEOMAC), University of Liège, B52/3 Liège, Belgium
✉ L. PeetersPhone: +0032 16 32 64 49E-mail: [email protected]
Received: 8 April 2004 / Accepted: 7 May 2004
Abstract The Eisden–Meeswijk region in Belgium has been affected by mining subsidence due
to the deep coal mining activities. Groundwater levels in the alluvial plain of the Meuse River are
maintained below the ground surface by drainage installations and municipal well fields. A
correlation between the water level in the Meuse River and the variation in nitrate and sulphate
concentrations in the aquifer has been observed. A transient groundwater model is developed for
the period May 1998–May 2002 and advective transport simulations have been carried out using
this model. During dry periods, the major groundwater flow is directed towards the Meuse River,
thereby feeding the river. During wet periods, however, groundwater flows in the opposite direction.
Due to these variations in groundwater flow direction and to the extraction of groundwater, zones
of higher solute concentration exist of which the position and extension vary both spatially and
temporally.
1
Keywords Groundwater flow · Transport · Nitrate · Sulphate · Belgium
IntroductionThe city of Eisden is situated in the northeast of Belgium, along the Meuse River, which forms
the border with The Netherlands (Fig. 1). In the past century, there was intensive coal mining
activity in this region. From 1922 until 1987, 73,191,893 tons of coal were mined in Eisden at a
depth up to 700 m in the carboniferous coal mines (Dusar 1996). As a result of the coal exploitation,
irregular land subsidence was induced in the area. According to Vansteelandt (1984a), the
subsidence reached up to 7 m near the city centre of Eisden, affecting an area of 44.70 km2 (Fig. 1).
These changes in topography led to (1) building damages, (2) a need for higher embankments of
the main canal “Zuid-Willems” and (3) changes in the flow direction of small streams like the
Vrietselbeek and the Genootsbeek. These two small streams originally drained the area towards
the Meuse River, but nowadays, surface water flow is directed towards the new lowest topographical
points. Since groundwater levels are still in equilibrium with the water level of the Meuse River,
land subsidence and the lack of exit points for the streams could theoretically cause the water level
to locally exceed the ground level. In order to prevent flooding, the agency “Dienst Mijnschade”,
who is responsible for mitigating the damages caused by the coal mining activities, has installed
pumping installations on both streams. Excessive water is pumped towards the Zuid-Willems
Canal and the Meuse River. In Leut, a drainage system has been placed beneath the main street
of the village (Fig. 1)to drain excess water towards the Meuse River. Additionally, the drinking
water company VMW installed two well fields of 14 pumping wells each in Eisden and Meeswijk
for drinking water production. The well screens are located in the shallow, alluvial aquifer,
consisting of mixed gravel and sand deposits from the Meuse River.
2

Fig. 1 Location of the region studied with indication of the calculated mining subsidence (after Vansteelandt
1984b)
The main concerns for the quality of drinking water are the highly variable sulphate and nitrate
concentrations in the groundwater. The main source of sulphate in the aquifer is acid mine drainage
from the mine tailings of the former coal mine in Eisden. The mine tailings cover an area of
approximately 17 ha and reach a height of 80 m. The tailings mainly consist of sandstone and
3
shale with a pyrite content of 0.31–1.39% in weight (Cammaer 1998). Oxidation of pyrite by
infiltrating water results in sulphate-rich groundwater (Sams and Beer 2000; Denimal and others
2002). On the other hand, about half of the land surface in the region studied is used for agriculture,
i.e. mostly pastures and cornfields. There, the use of fertilizers is the main source of nitrate in
groundwater (Canter 1996; Walraevens and others 2003).
Monthly measurements of nitrate and sulphate contents in the pumping wells and biannual
sampling in the monitoring wells, show an increase in nitrate concentrations when the river level
of the Meuse is high, and an increase in sulphate concentrations when river levels are low.
The objective of this study is to investigate both the temporal and the spatial variations of the
nitrate and sulphate concentrations in the alluvial aquifer. This is done by simulating the solute
flowpaths for a 4-year period by means of a transient groundwater model.
MethodsA transient groundwater model for a simulation period from May 1998 until May 2002 is created,
using modflow (McDonald and others 1988) in combination with the groundwater modelling
system (GMS; Environmental Modelling Systems, Inc. 2003) as the pre–and postprocessor.
Flowpaths of solutes in the alluvial aquifer are simulated using modpath (Pollock 1994).
Advective transport computations are also used for delineating the capture zones around the VMW
well fields. The modelling of seasonal variations in sulphate and nitrate concentrations are modelled
with mt3d (Zheng and Wang 1999) in transient conditions.
GeologyThe region studied is a part of the Campine Basin (southern North Sea Basin) and consists of
Tertiary clay and sand deposits dipping 0.7° NNE, discordantly overlain by Quaternary alluvial
gravels and cover sands. To the south of the study area, Oligocene marine clay overlain by
Oligocene clayey sands is found. Miocene sands were deposited on top of these sediments (Buffel
and others 2001). There are four NW–SE oriented, east-vergent normal faults in the area, of which
only the most northern fault was active until the Quaternary (Houtgast and others 2002; Fig. 2).
4
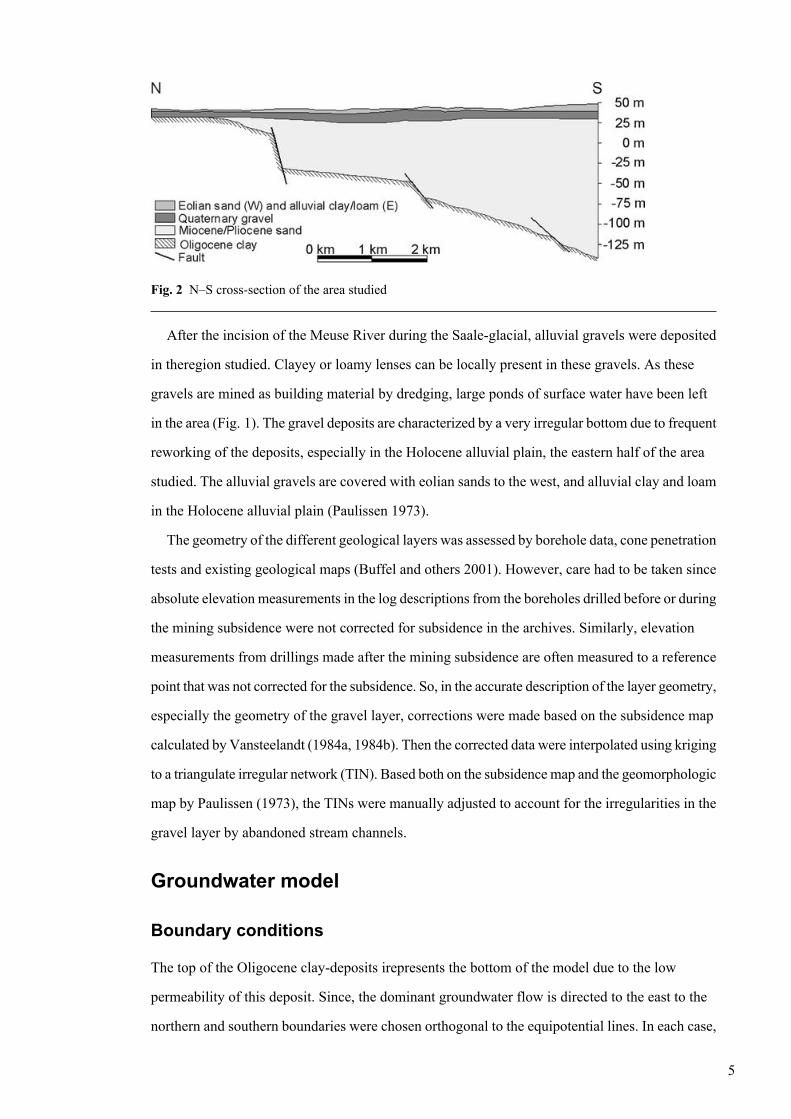
Fig. 2 N–S cross-section of the area studied
After the incision of the Meuse River during the Saale-glacial, alluvial gravels were deposited
in theregion studied. Clayey or loamy lenses can be locally present in these gravels. As these
gravels are mined as building material by dredging, large ponds of surface water have been left
in the area (Fig. 1). The gravel deposits are characterized by a very irregular bottom due to frequent
reworking of the deposits, especially in the Holocene alluvial plain, the eastern half of the area
studied. The alluvial gravels are covered with eolian sands to the west, and alluvial clay and loam
in the Holocene alluvial plain (Paulissen 1973).
The geometry of the different geological layers was assessed by borehole data, cone penetration
tests and existing geological maps (Buffel and others 2001). However, care had to be taken since
absolute elevation measurements in the log descriptions from the boreholes drilled before or during
the mining subsidence were not corrected for subsidence in the archives. Similarly, elevation
measurements from drillings made after the mining subsidence are often measured to a reference
point that was not corrected for the subsidence. So, in the accurate description of the layer geometry,
especially the geometry of the gravel layer, corrections were made based on the subsidence map
calculated by Vansteelandt (1984a, 1984b). Then the corrected data were interpolated using kriging
to a triangulate irregular network (TIN). Based both on the subsidence map and the geomorphologic
map by Paulissen (1973), the TINs were manually adjusted to account for the irregularities in the
gravel layer by abandoned stream channels.
Groundwater model
Boundary conditions
The top of the Oligocene clay-deposits irepresents the bottom of the model due to the low
permeability of this deposit. Since, the dominant groundwater flow is directed to the east to the
northern and southern boundaries were chosen orthogonal to the equipotential lines. In each case,
5

the prescribed piezometric levels will be estimated from a piezometer nearby: piezometer 7–0196
in the south and piezometer 7–0352 in the north (Fig. 1). The western border was chosen at the
edge of the alluvial valley, since a steep groundwater gradient is observed between the Campine
Plateau and the alluvial valley (Loy 1980). The boundaries were assigned specified heads (Dirichlet
boundary), variable in time, based on measurements in the aforementioned piezometers and the
regional groundwater map by Loy (1980).
The model is bordered in the east by the Meuse River. Since the bottom of the river mainly
consists of mixed gravels, one can consider that there is no difference in conductivity between the
river bed itself and the alluvial aquifer. Therefore, a specified head condition equal to the level of
the river was chosen to represent the Meuse. The specified heads are assigned along the river based
on river stage measurements in Elsloo (upriver) and Grevenbicht (downriver), following a
longitudinal river profile.
Groundwater abstractions in the well fields are entered in the model based on monthly abstraction
data provided by the VMW. The water fluxes, pumped or drained in the area (Eisden, Leut and
Meeswijk, Fig. 1) to keep the water level beneath the ground level, are introduced as a monthly
areal flux applied to the drained grid-cells.
An estimation of the recharge of the aquifer is found by applying the method of Thornthwaite
(1948). Rainfall and temperature data were provided by the Royal Institute for Meteorology of
Belgium and the runoff is estimated to be 20% of the rainfall. The large ponds left after dredging
gravel are represented in the model through cells with high conductivity (0.1 m/s; Reilly 2001).
Grid
A three-layered grid of 134 rows and 138 columns is constructed, representing, from top to bottom,
the alluvial gravel deposits, the Miocene–Pliocene sands and the Oligocene clayey sands. The
largest dimension of a grid cell is 100 m and the grid is progressively refined to a minimum cell
with a dimension of 20 by 20 m near the pumping wells.
Hydraulic conductivity
Several pumping tests in the well fields of Eisden and Meeswijk were previously conducted by
the water company. The average hydraulic conductivity values obtained for the gravel are
compromised between 0.039 and 0.014 m/s. Since the pumping tests were carried out on a local
scale, an initial, uniform value of 0.010 m/s was assigned to the gravel layer in the model domain.
This value has been locally adapted as part of the groundwater model calibration.
6
No pumping test data are available in the sand deposits. Hydraulic conductivity values for these
layers are taken from a previous groundwater study (IWACO 1998). A K-value of 8.0×10⁻⁵ m/s
is assigned to the bottom layer, representing the clayey sands, and a value of 1.8×10⁻⁴ m/s is used
for the Miocene–Pliocene sands. A storage coefficient equivalent to the specific yield is chosen
at 0.1, since it is a water table aquifer (Spitz and Moreno 1996).
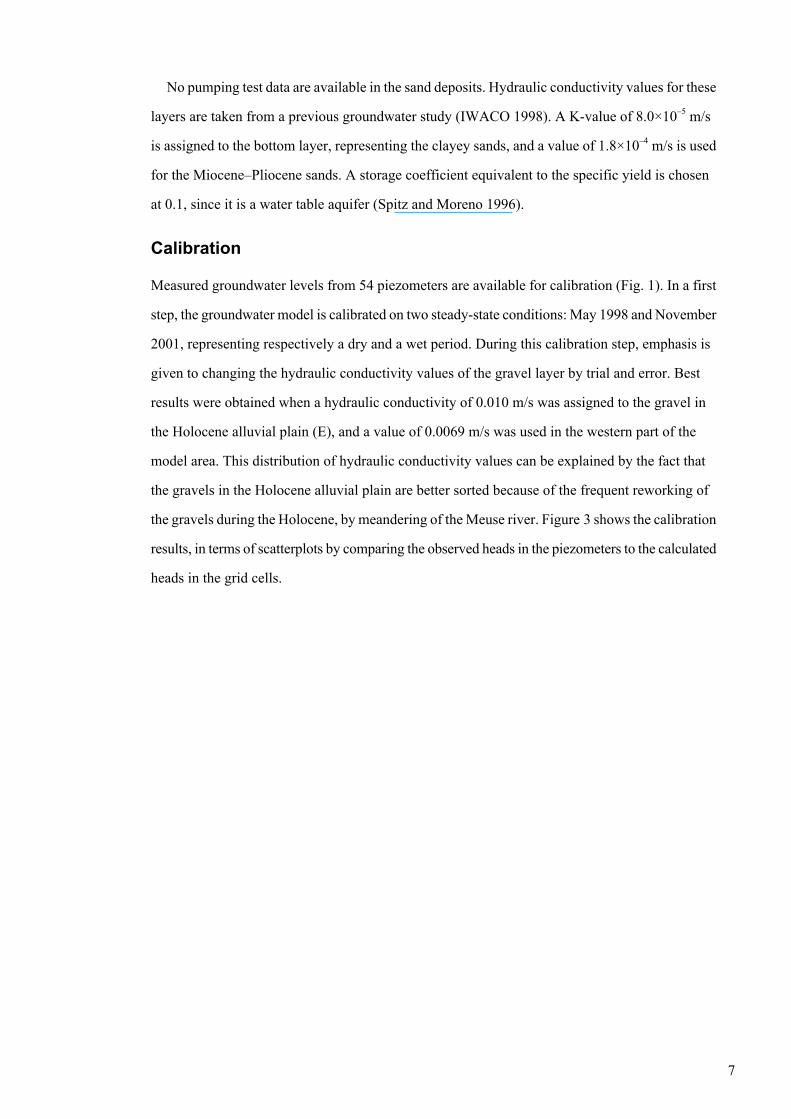
Calibration
Measured groundwater levels from 54 piezometers are available for calibration (Fig. 1). In a first
step, the groundwater model is calibrated on two steady-state conditions: May 1998 and November
2001, representing respectively a dry and a wet period. During this calibration step, emphasis is
given to changing the hydraulic conductivity values of the gravel layer by trial and error. Best
results were obtained when a hydraulic conductivity of 0.010 m/s was assigned to the gravel in
the Holocene alluvial plain (E), and a value of 0.0069 m/s was used in the western part of the
model area. This distribution of hydraulic conductivity values can be explained by the fact that
the gravels in the Holocene alluvial plain are better sorted because of the frequent reworking of
the gravels during the Holocene, by meandering of the Meuse river. Figure 3 shows the calibration
results, in terms of scatterplots by comparing the observed heads in the piezometers to the calculated
heads in the grid cells.
7
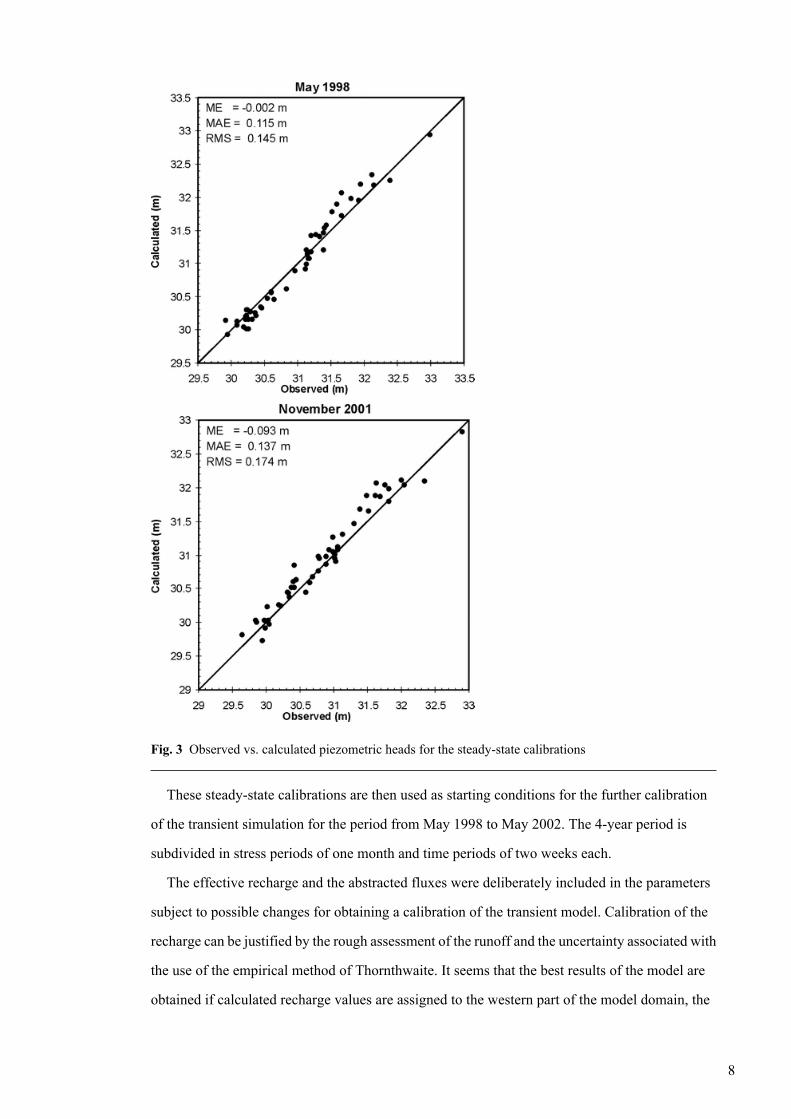
Fig. 3 Observed vs. calculated piezometric heads for the steady-state calibrations
These steady-state calibrations are then used as starting conditions for the further calibration
of the transient simulation for the period from May 1998 to May 2002. The 4-year period is
subdivided in stress periods of one month and time periods of two weeks each.
The effective recharge and the abstracted fluxes were deliberately included in the parameters
subject to possible changes for obtaining a calibration of the transient model. Calibration of the
recharge can be justified by the rough assessment of the runoff and the uncertainty associated with
the use of the empirical method of Thornthwaite. It seems that the best results of the model are
obtained if calculated recharge values are assigned to the western part of the model domain, the
8
recharge in the Holocene alluvial plain (E) being set only to 60% of this calculated value. This
difference is caused by the presence of loamy and clayey soils in the eastern part compared to
more sandy soils in the west (Paulissen 1973).
A slight calibration of the drained and pumped fluxes is allowed because of the large uncertainty
lying in the values of the effective abstracted fluxes. The uncertainty arises because only monthly
total values are available, and for the municipal well fields only values of the global production
of the fourteen pumping wells together is available. Another source of uncertainty is introduced
since the extent of the drained surface is not exactly known.
Calibration is performed by evaluating the performance of the model compared to measured
groundwater heads for each time step. Time series comparing computed and observed piezometric
heads for two example piezometers are given in Fig. 4, showing an acceptable calibration.
Fig. 4 Observed and calculated time series for observation wells 4005-030 and 4005-057
9

Results
The calculated piezometric contour maps (Fig. 5) clearly show (1) the generally eastward flow
direction and (2) the local drawdowns near the main well fields and (3) to a lesser extent, a local
depression near the drain. The transient groundwater flow simulation also demonstrates the great
influence of the Meuse River on flow conditions in the aquifer. When river levels are low, i.e. in
summer, the river is fed by the aquifer and groundwater flow is directed towards the river. When
high river levels prevail, like in winter, the river feeds the aquifer which causes a direction change
for the groundwater flow in the uttermost eastern part of the studied region.
Fig. 5 Calculated piezometric maps. Captures zones for the pumping fields are indicated in grey
Transport simulation
Methods
Simulation of nitrate and sulphate transport in theregion studied is carried out using two different
approaches. First, the capture zone delineation of the well fields is carried out by applying backward
particle tracking to the two different steady state groundwater flow conditions. Secondly, simulation
of solute transport from spatially and temporally variable sources is performed by a
three-dimensional transport model based on the transient groundwater flow model.
The capture zones are calculated for both well fields using the backward particle tracking
software modpath (Pollock 1994). As mentioned before, the effective porosity of the gravel layer
10
is set to a value of 0.1, based on former studies (IWACO 1998) and literature values in similar
conditions (Anderson and Woesner 1996).
The mt3d code (Zheng and Wang 1999) is used to simulate the transport of solutes in the
saturated zone by advective transport, using the hybrid method Of characteristics (HMOC), based
on the transient flow calibration. Due to numerical limitations, the time steps used for transport
are determined by the computer program. The size of the time steps is approximately 18 h.
Because the dominant transport mechanism in this aquifer is advective transport, it has been
decided, at this stage of the study to disregard the dispersion component of transport (Zheng and
Bennet 1995). Since the aquifer is unconfined and relatively thin, dissolved oxygen is assumed to
be present in the aquifer therefore denitrification and sulphate reduction processes can be neglected
(Berner 1981).
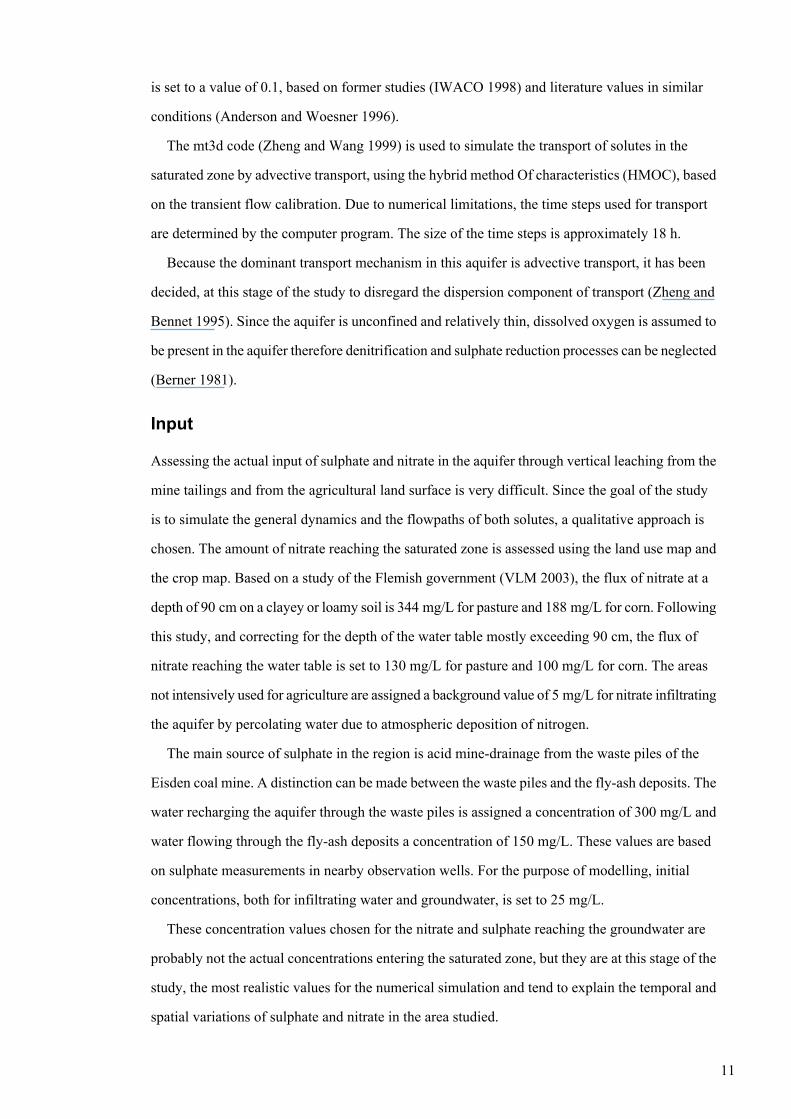
Input
Assessing the actual input of sulphate and nitrate in the aquifer through vertical leaching from the
mine tailings and from the agricultural land surface is very difficult. Since the goal of the study
is to simulate the general dynamics and the flowpaths of both solutes, a qualitative approach is
chosen. The amount of nitrate reaching the saturated zone is assessed using the land use map and
the crop map. Based on a study of the Flemish government (VLM 2003), the flux of nitrate at a
depth of 90 cm on a clayey or loamy soil is 344 mg/L for pasture and 188 mg/L for corn. Following
this study, and correcting for the depth of the water table mostly exceeding 90 cm, the flux of
nitrate reaching the water table is set to 130 mg/L for pasture and 100 mg/L for corn. The areas
not intensively used for agriculture are assigned a background value of 5 mg/L for nitrate infiltrating
the aquifer by percolating water due to atmospheric deposition of nitrogen.
The main source of sulphate in the region is acid mine-drainage from the waste piles of the
Eisden coal mine. A distinction can be made between the waste piles and the fly-ash deposits. The
water recharging the aquifer through the waste piles is assigned a concentration of 300 mg/L and
water flowing through the fly-ash deposits a concentration of 150 mg/L. These values are based
on sulphate measurements in nearby observation wells. For the purpose of modelling, initial
concentrations, both for infiltrating water and groundwater, is set to 25 mg/L.
These concentration values chosen for the nitrate and sulphate reaching the groundwater are
probably not the actual concentrations entering the saturated zone, but they are at this stage of the
study, the most realistic values for the numerical simulation and tend to explain the temporal and
spatial variations of sulphate and nitrate in the area studied.
11
Results
The capture zone delineation (Fig. 5) for the Eisden well field, shows that the capture zone
encompasses the waste piles and fly-ash deposits of the coal mine at Eisden. The flow lines
calculated by modpath show that most of the capture zone can be divided in two main regions:
one region where groundwater streamlines reach the well field from the northwest, the other region
where it is flowing from the southeast.
The biggest difference between the two periods (May 1998 and November 2001) is observed
for the well field located closest to the Meuse River. Since most of the groundwater comes from
the northwest of the pumping wells during the dry period, the capture zone extends towards the
east and even reaches the Meuse River during the wet period. Based on flow lines, it can be
observed that the major part of the groundwater abstracted is flowing from the northwest, but there
is still a considerable amount coming from the southwest. Simulation of nitrate and sulphate
transport during the period May 1998 through May 2002 is carried out using input concentrations
as described previously.
Nitrate
The simulation shows that nitrate coming from the most northern source areas is transported
towards the Meuse River and does not flow towards the pumping wells. In this simulation, the
influence of the Meuse River is clearly illustrated (Fig. 6). During summer periods most of the
nitrate is transported towards the river. During winter periods however, nitrate transport towards
the river is not possible due to the groundwater flow inversion in the aquifer. This results in a zone
parallel to the river where nitrate is temporally stored and then mainly transported towards the
pumping field.
12
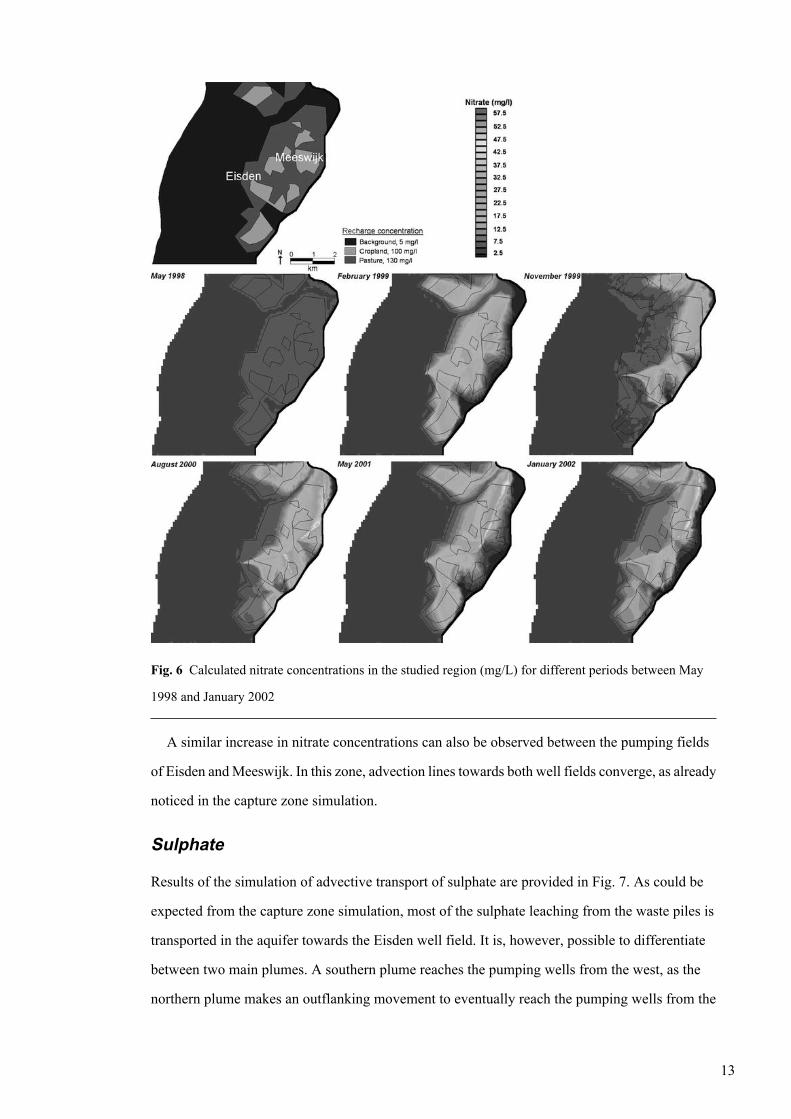
Fig. 6 Calculated nitrate concentrations in the studied region (mg/L) for different periods between May
1998 and January 2002
A similar increase in nitrate concentrations can also be observed between the pumping fields
of Eisden and Meeswijk. In this zone, advection lines towards both well fields converge, as already
noticed in the capture zone simulation.
Sulphate
Results of the simulation of advective transport of sulphate are provided in Fig. 7. As could be
expected from the capture zone simulation, most of the sulphate leaching from the waste piles is
transported in the aquifer towards the Eisden well field. It is, however, possible to differentiate
between two main plumes. A southern plume reaches the pumping wells from the west, as the
northern plume makes an outflanking movement to eventually reach the pumping wells from the
13

north. Sulphate derived from the fly-ash deposit in the north is mostly transported towards the
Meeswijk pumping field.
Fig. 7 Calculated sulphate concentrations in the region studied (mg/L) for different periods between May
1998 and January 2002
Again, the influence of the groundwater flow inversion during wet periods can be noticed.
During dry periods, with overall flow towards the river, the extension of the contamination plumes
generally increases towards the east. As soon as groundwater flow inversion occurs, the size of
the plume decreases. Analogous to the nitrate simulation, a zone of increased sulphate concentrations
can be observed between Eisden and Meeswijk.
14

DiscussionThe calibrated groundwater model was able to give a good description of the groundwater
flow-fields in the studied aquifer. In the future, the reliability of the model could be increased if
more accurate values for groundwater abstractions and a more precise calculation of actual recharge
were available.
To test the reliability of the simulations in predicting the spatial and temporal variations in
solute concentrations in the region studied, a comparison is made between the simulated
concentrations and the measured concentrations in the observation wells (Figs. 8 and 9).
Fig. 8 Measured nitrate concentrations in the region studied (mg/L)
15
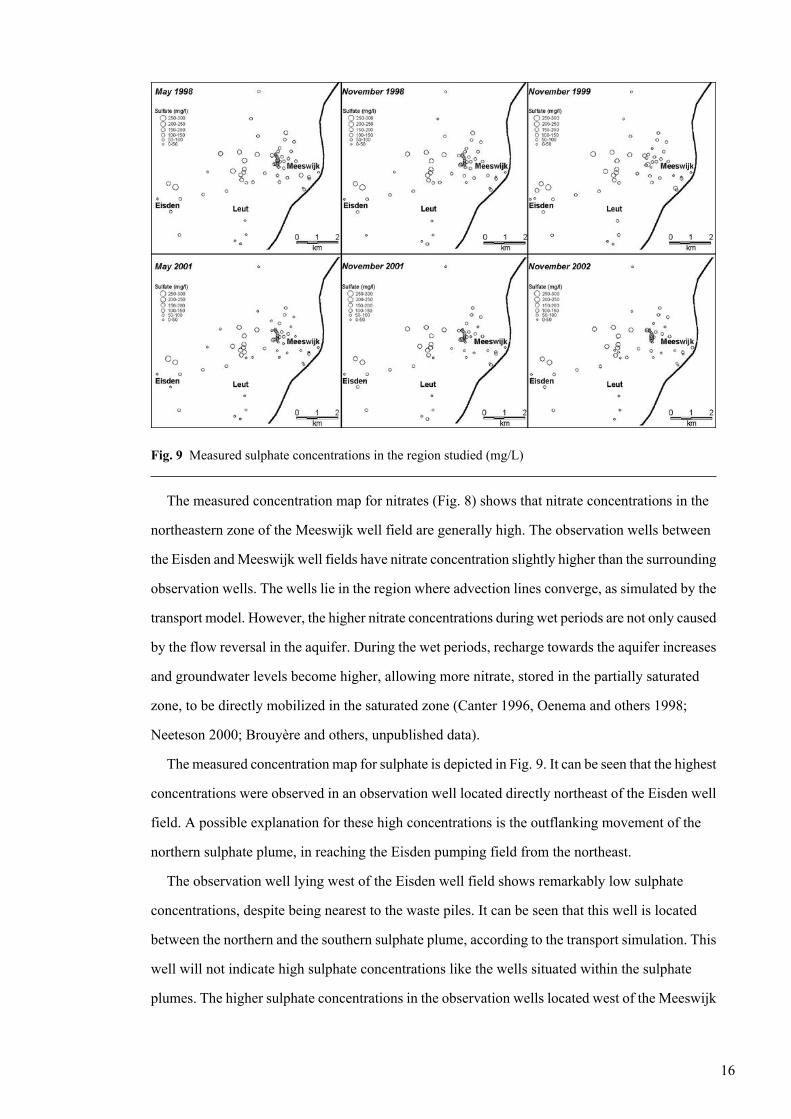
Fig. 9 Measured sulphate concentrations in the region studied (mg/L)
The measured concentration map for nitrates (Fig. 8) shows that nitrate concentrations in the
northeastern zone of the Meeswijk well field are generally high. The observation wells between
the Eisden and Meeswijk well fields have nitrate concentration slightly higher than the surrounding
observation wells. The wells lie in the region where advection lines converge, as simulated by the
transport model. However, the higher nitrate concentrations during wet periods are not only caused
by the flow reversal in the aquifer. During the wet periods, recharge towards the aquifer increases
and groundwater levels become higher, allowing more nitrate, stored in the partially saturated
zone, to be directly mobilized in the saturated zone (Canter 1996, Oenema and others 1998;
Neeteson 2000; Brouyère and others, unpublished data).
The measured concentration map for sulphate is depicted in Fig. 9. It can be seen that the highest
concentrations were observed in an observation well located directly northeast of the Eisden well
field. A possible explanation for these high concentrations is the outflanking movement of the
northern sulphate plume, in reaching the Eisden pumping field from the northeast.
The observation well lying west of the Eisden well field shows remarkably low sulphate
concentrations, despite being nearest to the waste piles. It can be seen that this well is located
between the northern and the southern sulphate plume, according to the transport simulation. This
well will not indicate high sulphate concentrations like the wells situated within the sulphate
plumes. The higher sulphate concentrations in the observation wells located west of the Meeswijk
16
well field can be explained by the sulphate plume induced by leaching water through the fly-ash
deposits and then flowing into the aquifer towards the Meeswijk pumping field.
ConclusionA groundwater flow model is developed for the period May 1998 to May 2002 and calibrated
using monthly groundwater head measurements in 54 observation wells. Subsequently, transport
simulations are carried out using modpath and mt3d. The transport simulations are limited to
advection due to the lack of any data concerning dispersion coefficients. Other transport processes
are considered negligible at this stage of the study.
The groundwater flow model shows an eastward groundwater flow towards the Meuse River
with two cones of depression near the well fields of Eisden and Meeswijk. It is observed that
during wet periods, the aquifer is fed by the river and consequently an inversion of groundwater
flow occurs.
The transport simulations show the existence of zones where advection lines are converging
from different directions (i.e. because of flow reversal during wet periods). The latter can be an
explanation for the observation of higher nitrate concentrations in that area during wet periods.
From the simulation of advective transport of sulphate, the existence of two separate sulphate
plumes can be deduced: the southern one is directly captured by the Eisden well field while the
northern plume reaches the well field from the north, giving a possible explanation for the local
high-sulphate concentrations in this area. Future work on nitrate and sulphate transport in the area
of study will focus on incorporating transport by dispersion into the transport simulations.
Acknowledgements The authors wish to thank Dr. Paul De Smedt (drinking water company
VMW) for providing data and support during the research. The corrections and remarks of the
anonymous reviewers are greatly appreciated.
ReferencesAnderson M, Woesner W (1992) Applied groundwater modeling. Simulation of flow and advective transport.Academic Press, New York, 381p
Berner RA (1981) A new geochemical classification of sedimentary environments. J Sediment Petrol51(2):359–365
Brouyère S, Dassargues A, Hallet V (2004) Migration of contaminants through the unsaturated zone overlyingthe Hesbaye chalky aquifer in Belgium: a field investigation. J Contamin Hydrol (in press)
Buffel P, Claes S, Gullentops F (2001) Geologische kaart van België, kaartblad Rekem (26) and verklarendetekst (Geological map of Belgium, sheet Rekem (26) and explanatory text). Ministerie van de VlaamseGemeenschap, Afdeling Natuurlijke Rijkdommen en Energie, Brussels, schaal 1/50.000
17
Cammaer C (1998) Coal mining and groundwater in Flanders (Belgium). Aardk Med 9:110–122
Canter L (1996) Nitrates in groundwater. Lewis, New York, 261 pp
Denimal S, Tribovillard N, Barbecot F, Dever L (2002) Leaching of coal-mine tips (Nord-Pas-de-Calaiscoal basin, France) and sulphate transfer to the chalk aquifer: example of acid mine drainage in a bufferedenvironment. Environ Geol 42:966–981
Dusar M (1996) Energie: Steenkool (Energy: Coal). In: Gullentops F, Wouters L (eds) Delfstoffen inVlaanderen (Natural resources of the Flemish community). Ministery of the Flemish Community, Brussels,pp 107–116
Houtgast RF, Van Balen RT, Bouwer LM, Brand GBM (2002) Late Quaternary activity of the FeldbissFault Zone, Roer Valley Rift System, the Netherlands, based on displaced flucial terrace fragments.Tectonophysics 352:295–315
IWACO (1998) Nader onderzoek winningen Eisden en Meeswijk, projectnummer 3360220 (Study of thewell fields in Eisden and Meeswijk, Project no. 3360220). IWACO, Mechelen
Loy W (1980) Hydrogeologische studie van het Kempisch plateau en de Limburgse maasvallei (Hydrogeologicstudy of the Campine Plateau and the valley of the Meuse River in Limburg). Ministerie van VlaamseAangelegenheden en Ministerie van Volksgezondheid, Brussels, 120 pp
McDonald MG, Harbaugh AW, Bantaz ER, Hill MC (2000) Modflow-2000, the U.S. Geological Surveymodular groundwater model: user guide to modularization concepts and the groundwater flow process. USGeological Survey, Open-File Report 00–92, Reston, Virginia, 130 pp
Neeteson J (2000) Nitrogen Quo Vadis. In: Vlassak K, Agenbag GA, Van Cleemput O (eds) Nitrogendynamics en intensive and extensive agriculture. ACCO, Leuven, pp 149–161
Oenema O, Boers PCM, Van Eerdt MM, Fraters B, van der Meer HG, Roest CWJ, Schr JJ, Willems WJ(1998) Leaching of nitrate from agriculture to groundwater: the effect of policies and measures in TheNetherlands. Environ Pollut 102(S1) 471–478
Paulissen E (1973) De morfologie en de kwartairstratigrafie van de Maasvallei in Belgisch Limburg(Morphology and quaternary stratigraphy of the valley of the Meuse River in Belgian Limburg). PhD Thesis,Catholic University of Leuven, Leuven, 266 pp
Pollock DW (1994) User’s Guide for MODPATH/MODPATH-PLOT, Version 3: a particle trackingpost-processing package for MODFLOW, the U. S. Geological Survey finite-difference ground-water flowmodel. USGS Open-File Report 94–464, USGS, Reston, Virginia, 249 pp
Reilly TE (2001) System and boundary conceptualization in ground-water flow simulation, vol 3. In:Applications of hydraulics. USGS, Reston, Virginia, 29 pp
Sams J, Beer K (2000) Effects of coal-mine drainage on stream water quality in the Allegheny andMonongahela River Basins: sulphate transport and trends. USGS Water Resources Investigations Report99–4208, USGS, Reston, Virginia, 23 pp
Spitz H, Moreno J (1996) A practical guide to groundwater and solute transport modelling. Wiley, NewYork, 461 pp
Thornthwaite CW (1948) An approach towards a rational classification of climate. Geogr Rev 38(1):55–94
Vansteelandt P (1984a) De waterhuishouding in het mijnverzakkingsgebied van de kolenmijn Eisden(Hydrogeology of the mining subsidence area of the Eisden coal mine). Tijdschrift Water 18:138–143
Vansteelandt P (1984b) De waterhuishouding in het mijnverzakkingsgebied van de kolenmijn Eisden(Hydrogeology of the mining subsidence area of the Eisden coal mine). Tijdschrift Water 19: 150–155
VLM (2000) N-(eco)2: Bepaling van de hoeveelheid minerale stikstof in de bodem als beleidsinstrument(Assessment of the amount of mineral nitrogen in soil for policy-making). Project no. 2000/1, VlaamseLand Maatschappij, Brussels, pp 215
Walraevens K, Eppinger R, Van Camp M (2003). Verspreiding van nitraat in het grondwater in Vlaanderen(Nitrate occurence in groundwater in Flanders). Tijdschrift Water 8:30–38
Zheng C, Bennet DB (1995) Applied contaminant transport modelling: theory and practice. New York,Wiley, 440 pp
18
Zheng C, Wang P (1999) MT3DMS: a modular three-dimensional multispecies transport model for simulationof advection, dispersion, and chemical reactions of contaminants in groundwater. US Army Corps ofEngineers, Tuscaloosa, 220 pp
19
Related Documents