An Extended Friction Model to capture Load and Temperature effects in Robot Joints Andr´ e Carvalho Bittencourt, Erik Wernholt, Shiva Sander-Tavallaey and Torgny Brog˚ ardh Abstract— Friction is the result of complex interactions be- tween contacting surfaces in a nanoscale perspective. Depending on the application, the different models available are more or less suitable. Available static friction models are typically considered to be dependent only on relative speed of interacting surfaces. However, it is known that friction can be affected by other factors than speed. In this work, static friction in robot joints is studied with respect to changes in joint angle, load torque and temperature. The effects of these variables are analyzed by means of experiments on a standard industrial robot. Justified by their significance, load torque and temperature are included in an extended static friction model. The proposed model is validated in a wide operating range, reducing the average error a factor of 6 when compared to a standard static friction model. I. INTRODUCTION Friction exists in all mechanisms to some extent. It can be defined as the tangential reaction force between two surfaces in contact. It is a nonlinear phenomenon which is physically dependent on contact geometry, topology, properties of the materials, relative velocity, lubricant, etc [1]. Friction has been constantly investigated by researchers due to its impor- tance in several fields [2]. In this paper, friction has been studied based on experiments on an industrial robot. One reason for the interest in friction of manipulator joints is the need to model friction for control purposes [3]–[7], where a precise friction model can considerably improve the overall performance of a manipulator with respect to accuracy and control stability. Since friction can relate to the wear down process of mechanical systems [8], including robot joints [9], there is also interest in friction modeling for robot condition monitoring and fault detection [9]–[16]. A friction model consistent with real experiments is nec- essary for successful simulation, design and evaluation. Due to the complexity of friction, it is however often difficult to obtain models that can describe all the empirical observations (see [1] for a comprehensive discussion on friction physics and first principle friction modeling). In a robot joint, the complex interaction of components such as gears, bearings and shafts which are rotating/sliding at different velocities, makes physical modeling difficult. An example of an ap- proach to model friction of complex transmissions can be This work was supported by ABB and the Vinnova Industry Excellence Center LINK-SIC at Link¨ oping University. A. C. Bittencourt and E. Wernholt are with the Division of Auto- matic Control, Department of Electrical Engineering, Link¨ oping University, Link¨ oping, Sweden [andrecb,erikw]@isy.liu.se S. Sander-Tavallaey is with ABB Corporate Research, V¨ aster˚ as, Sweden [email protected] T. Brog˚ ardh is with ABB Robotics, V¨ aster˚ as, Sweden [email protected] found in [17], where the author designs joint friction models based on physical models of elementary joint components as helical gear pairs and pre-stressed roller bearings. Empirically motivated friction models have been successfully used in many applications, including robotics [5], [18]– [20]. This category of models was developed through time according to empirical observations of the phenomenon [2]. Considering a set of states, X , and parameters, θ, these models can be described as the sum of N functions that describe the behavior of friction, F , F (X ,θ)= N X i=1 f i (X ,θ). (M) X =[z, ˙ q, q] gives the set of Generalized empirical Friction Model structures (GFM) [1], where z is an internal state related to the dynamic behavior of friction and q is a generalized coordinate and ˙ q = dq/dt. Among the GFM model structures, the LuGre model [5], [19] is a common choice in the robotics community. For a revolute joint, it can be described as τ f = σ 0 z + σ 1 ˙ z + h(˙ ϕ m ) (M L ) ˙ z =˙ ϕ m - σ 0 | ˙ ϕ m | g(˙ ϕ m ) z, where τ f is the friction torque and ϕ m is the joint motor angle. The state z is related to the dynamic behavior of asperities in the interacting surfaces and can be interpreted as their average deflection, with stiffness σ 0 and damping σ 1 . The function h(˙ ϕ m ) represents the velocity strengthening (viscous) friction, typically taken as h(˙ ϕ m )= F v ˙ ϕ m , and g(˙ ϕ m ) captures the velocity weakening of friction. Motivated by the observations of Stribeck [18], [21], g(˙ ϕ m ) is usually modeled as g(˙ ϕ)= F c + F s e -| ˙ ϕm ˙ ϕs | α . Where F c is the Coulomb friction, F s is, in this paper, de- fined as the standstill friction parameter * , ˙ ϕ s is the Stribeck velocity and α is the exponent of the Stribeck nonlinearity. The model structure M L is a GFM with X =[z, ˙ ϕ m ] and θ =[σ 0 ,σ 1 ,F c ,F s ,F v ,ϕ s ,α]. According to [19] it can successfully describe many of the friction characteristics. Since z is not measurable, a difficulty with M L is the estimation of the dynamic parameters [σ 0 ,σ 1 ]. In [5], these parameters are estimated in a robot joint by means of open * Fs is commonly called static friction. An alternative nomenclature was adopted to make a distinction between the dynamic/static friction phenomena.

Welcome message from author
This document is posted to help you gain knowledge. Please leave a comment to let me know what you think about it! Share it to your friends and learn new things together.
Transcript
An Extended Friction Model to capture Loadand Temperature effects in Robot Joints
Andre Carvalho Bittencourt, Erik Wernholt, Shiva Sander-Tavallaey and Torgny Brogardh
Abstract— Friction is the result of complex interactions be-tween contacting surfaces in a nanoscale perspective. Dependingon the application, the different models available are moreor less suitable. Available static friction models are typicallyconsidered to be dependent only on relative speed of interactingsurfaces. However, it is known that friction can be affected byother factors than speed.
In this work, static friction in robot joints is studied withrespect to changes in joint angle, load torque and temperature.The effects of these variables are analyzed by means ofexperiments on a standard industrial robot. Justified by theirsignificance, load torque and temperature are included in anextended static friction model. The proposed model is validatedin a wide operating range, reducing the average error a factorof 6 when compared to a standard static friction model.
I. INTRODUCTION
Friction exists in all mechanisms to some extent. It can bedefined as the tangential reaction force between two surfacesin contact. It is a nonlinear phenomenon which is physicallydependent on contact geometry, topology, properties of thematerials, relative velocity, lubricant, etc [1]. Friction hasbeen constantly investigated by researchers due to its impor-tance in several fields [2]. In this paper, friction has beenstudied based on experiments on an industrial robot.
One reason for the interest in friction of manipulator jointsis the need to model friction for control purposes [3]–[7],where a precise friction model can considerably improvethe overall performance of a manipulator with respect toaccuracy and control stability. Since friction can relate tothe wear down process of mechanical systems [8], includingrobot joints [9], there is also interest in friction modeling forrobot condition monitoring and fault detection [9]–[16].
A friction model consistent with real experiments is nec-essary for successful simulation, design and evaluation. Dueto the complexity of friction, it is however often difficult toobtain models that can describe all the empirical observations(see [1] for a comprehensive discussion on friction physicsand first principle friction modeling). In a robot joint, thecomplex interaction of components such as gears, bearingsand shafts which are rotating/sliding at different velocities,makes physical modeling difficult. An example of an ap-proach to model friction of complex transmissions can be
This work was supported by ABB and the Vinnova Industry ExcellenceCenter LINK-SIC at Linkoping University.
A. C. Bittencourt and E. Wernholt are with the Division of Auto-matic Control, Department of Electrical Engineering, Linkoping University,Linkoping, Sweden [andrecb,erikw]@isy.liu.se
S. Sander-Tavallaey is with ABB Corporate Research, Vasteras, [email protected]
T. Brogardh is with ABB Robotics, Vasteras, [email protected]
found in [17], where the author designs joint friction modelsbased on physical models of elementary joint components ashelical gear pairs and pre-stressed roller bearings.
Empirically motivated friction models have been successfullyused in many applications, including robotics [5], [18]–[20]. This category of models was developed through timeaccording to empirical observations of the phenomenon [2].Considering a set of states, X , and parameters, θ, thesemodels can be described as the sum of N functions thatdescribe the behavior of friction, F ,
F(X , θ) =N∑i=1
fi(X , θ). (M)
X = [z, q, q] gives the set of Generalized empirical FrictionModel structures (GFM) [1], where z is an internal staterelated to the dynamic behavior of friction and q is ageneralized coordinate and q = dq/dt.
Among the GFM model structures, the LuGre model [5],[19] is a common choice in the robotics community. For arevolute joint, it can be described as
τf = σ0z + σ1z + h(ϕm) (ML)
z = ϕm − σ0|ϕm|g(ϕm)
z,
where τf is the friction torque and ϕm is the joint motorangle. The state z is related to the dynamic behavior ofasperities in the interacting surfaces and can be interpreted astheir average deflection, with stiffness σ0 and damping σ1.The function h(ϕm) represents the velocity strengthening(viscous) friction, typically taken as h(ϕm) = Fvϕm, andg(ϕm) captures the velocity weakening of friction. Motivatedby the observations of Stribeck [18], [21], g(ϕm) is usuallymodeled as
g(ϕ) = Fc + Fse−| ˙ϕm
ϕs|α .
Where Fc is the Coulomb friction, Fs is, in this paper, de-fined as the standstill friction parameter∗, ϕs is the Stribeckvelocity and α is the exponent of the Stribeck nonlinearity.The model structure ML is a GFM with X = [z, ϕm] andθ = [σ0, σ1, Fc, Fs, Fv, ϕs, α]. According to [19] it cansuccessfully describe many of the friction characteristics.
Since z is not measurable, a difficulty with ML is theestimation of the dynamic parameters [σ0, σ1]. In [5], theseparameters are estimated in a robot joint by means of open
∗Fs is commonly called static friction. An alternative nomenclaturewas adopted to make a distinction between the dynamic/static frictionphenomena.
loop experiments and by use of high resolution encoders.Open-loop experiments are not always possible, and it iscommon to accept only a static description of ML. Forconstant velocities, ML is equivalent to the static modelMS :
τf (ϕ) = g(ϕm)sign( ˙ϕm) + h(ϕm) (MS)
which is fully described by the g- and h functions. In fact,ML simply adds dynamics to MS . The typical choice forg and h as defined for ML yields the static model structureM0:
τf ( ˙ϕm) =[Fc + Fse
−| ˙ϕmϕs|α]
sign( ˙ϕm) + Fv ˙ϕm. (M0)
M0 requires a total of 4† parameters to describe the velocityweakening regime g(ϕm) and 1 parameter to capture viscousfriction h(ϕm). See Figure 3 for an interpretation of theparameters.
From empirical observations, it is known that friction can beaffected by several factors,
• temperature,• force/torque levels,• position,
• velocity,• acceleration,• lubricant/grease properties.
A shortcoming of the LuGre model structure, as with anyGFM, is the dependence only of the states X = [z, q, q]. Inmore demanding applications, the effects of the remainingvariables can not be neglected. For instance in [17], theauthor observes a strong temperature dependence, while in[5] joint load torque and temperature are considered asdisturbances and estimated in an adaptive framework. In[9], the influence of both joint load torque and temperatureare observed. However, more work is needed in order tounderstand the influence of different factors on the frictionproperties. A more comprehensive friction model is neededto improve the performance of control and diagnosis ofsystems including friction phenomena.
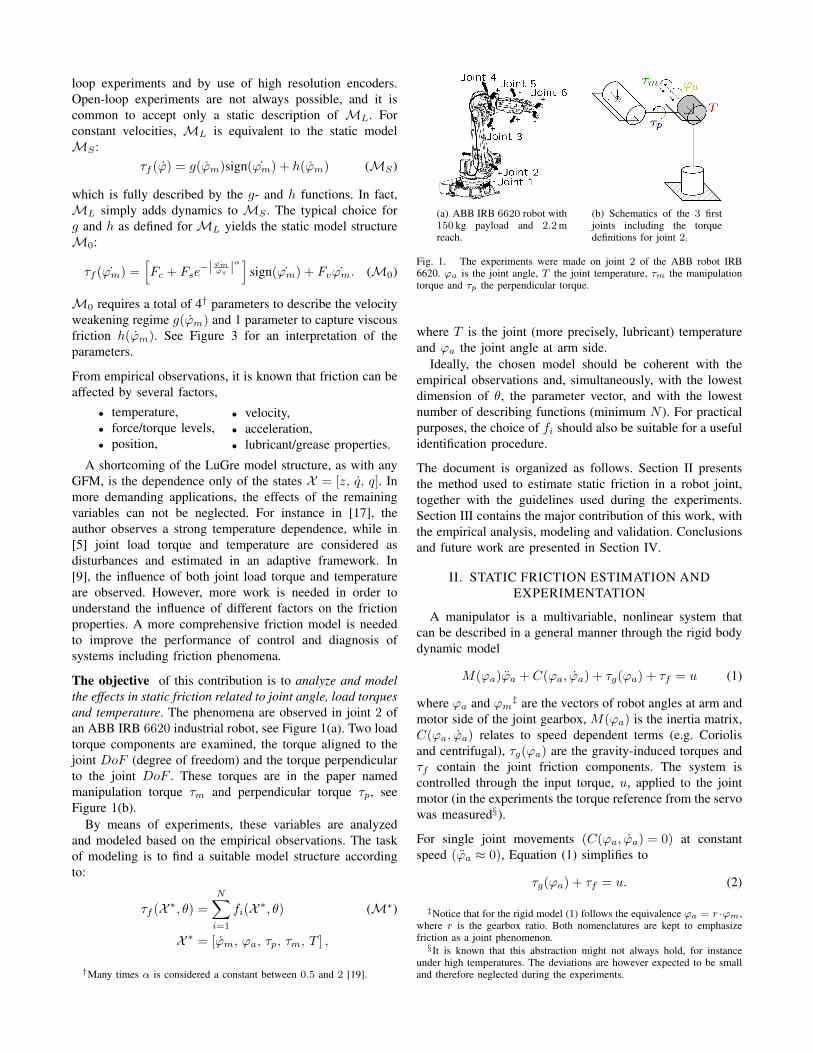
The objective of this contribution is to analyze and modelthe effects in static friction related to joint angle, load torquesand temperature. The phenomena are observed in joint 2 ofan ABB IRB 6620 industrial robot, see Figure 1(a). Two loadtorque components are examined, the torque aligned to thejoint DoF (degree of freedom) and the torque perpendicularto the joint DoF . These torques are in the paper namedmanipulation torque τm and perpendicular torque τp, seeFigure 1(b).
By means of experiments, these variables are analyzedand modeled based on the empirical observations. The taskof modeling is to find a suitable model structure accordingto:
τf (X ∗, θ) =N∑i=1
fi(X ∗, θ) (M∗)
X ∗ = [ϕm, ϕa, τp, τm, T ] ,
†Many times α is considered a constant between 0.5 and 2 [19].
(a) ABB IRB 6620 robot with150 kg payload and 2.2 mreach.
(b) Schematics of the 3 firstjoints including the torquedefinitions for joint 2.
Fig. 1. The experiments were made on joint 2 of the ABB robot IRB6620. ϕa is the joint angle, T the joint temperature, τm the manipulationtorque and τp the perpendicular torque.
where T is the joint (more precisely, lubricant) temperatureand ϕa the joint angle at arm side.
Ideally, the chosen model should be coherent with theempirical observations and, simultaneously, with the lowestdimension of θ, the parameter vector, and with the lowestnumber of describing functions (minimum N ). For practicalpurposes, the choice of fi should also be suitable for a usefulidentification procedure.
The document is organized as follows. Section II presentsthe method used to estimate static friction in a robot joint,together with the guidelines used during the experiments.Section III contains the major contribution of this work, withthe empirical analysis, modeling and validation. Conclusionsand future work are presented in Section IV.
II. STATIC FRICTION ESTIMATION ANDEXPERIMENTATION
A manipulator is a multivariable, nonlinear system thatcan be described in a general manner through the rigid bodydynamic model
M(ϕa)ϕa + C(ϕa, ϕa) + τg(ϕa) + τf = u (1)
where ϕa and ϕm‡ are the vectors of robot angles at arm andmotor side of the joint gearbox, M(ϕa) is the inertia matrix,C(ϕa, ϕa) relates to speed dependent terms (e.g. Coriolisand centrifugal), τg(ϕa) are the gravity-induced torques andτf contain the joint friction components. The system iscontrolled through the input torque, u, applied to the jointmotor (in the experiments the torque reference from the servowas measured§).
For single joint movements (C(ϕa, ϕa) = 0) at constantspeed (ϕa ≈ 0), Equation (1) simplifies to
τg(ϕa) + τf = u. (2)
‡Notice that for the rigid model (1) follows the equivalence ϕa = r ·ϕm,where r is the gearbox ratio. Both nomenclatures are kept to emphasizefriction as a joint phenomenon.§It is known that this abstraction might not always hold, for instance
under high temperatures. The deviations are however expected to be smalland therefore neglected during the experiments.
The applied torque u drives only friction and gravity-inducedtorques. If realistic estimates of τg(ϕa) are available, it iseasy to isolate the friction component in Equation (2). If suchestimate is not possible (e.g. not all masses are completelyknown), τf can still be estimated as follows.
The required torques to drive a joint in forward, u+, andreverse, u−, directions at constant speed ¯ϕm and at a jointangle ϕa (so that τg(ϕa) is equal in both directions), are
τf ( ¯ϕm) + τg(ϕa) = u+
τf (− ¯ϕm) + τg(ϕa) = u−.
Subtracting the equations yields
τf ( ¯ϕm)− τf (− ¯ϕm) = u+ − u−
and supposing a direction independent friction,i.e. τf (− ¯ϕm) = −τf ( ¯ϕm), the resulting directionindependent friction is:
τf ( ¯ϕm) =u+ − u−
2. (3)
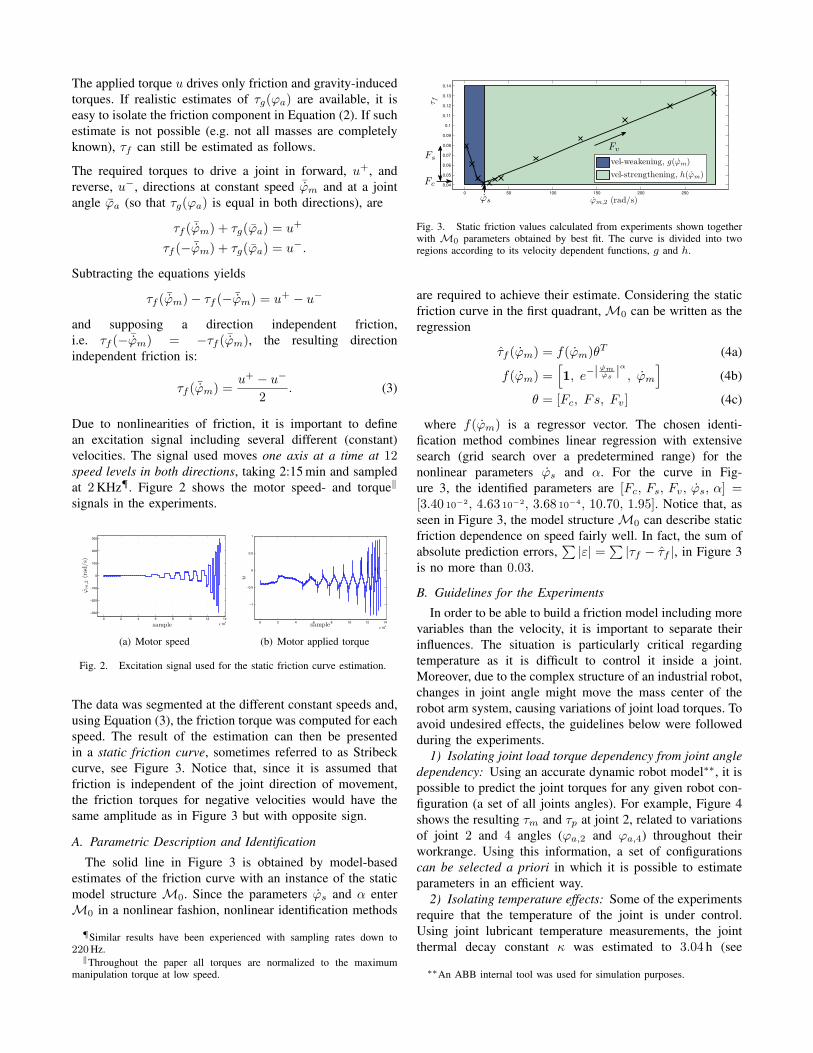
Due to nonlinearities of friction, it is important to definean excitation signal including several different (constant)velocities. The signal used moves one axis at a time at 12speed levels in both directions, taking 2:15 min and sampledat 2 KHz¶. Figure 2 shows the motor speed- and torque‖
signals in the experiments.
0 2 4 6 8 10 12 14
x 104
−300
−200
−100
0
100
200
300
sample
ϕm
,2(r
ad/s
)
(a) Motor speed
0 2 4 6 8 10 12 14
x 104
−1
−0.5
0
0.5
1
sample
u
(b) Motor applied torque
Fig. 2. Excitation signal used for the static friction curve estimation.
The data was segmented at the different constant speeds and,using Equation (3), the friction torque was computed for eachspeed. The result of the estimation can then be presentedin a static friction curve, sometimes referred to as Stribeckcurve, see Figure 3. Notice that, since it is assumed thatfriction is independent of the joint direction of movement,the friction torques for negative velocities would have thesame amplitude as in Figure 3 but with opposite sign.
A. Parametric Description and Identification
The solid line in Figure 3 is obtained by model-basedestimates of the friction curve with an instance of the staticmodel structure M0. Since the parameters ϕs and α enterM0 in a nonlinear fashion, nonlinear identification methods
¶Similar results have been experienced with sampling rates down to220 Hz.‖Throughout the paper all torques are normalized to the maximum
manipulation torque at low speed.
0 50 100 150 200 250
0.04
0.05
0.06
0.07
0.08
0.09
0.1
0.11
0.12
0.13
0.14
ϕm,2 (rad/s)
τ f
vel-weakening, g(ϕm)
vel-strengthening, h(ϕm)
ϕs
Fs
Fc
Fv
Fig. 3. Static friction values calculated from experiments shown togetherwith M0 parameters obtained by best fit. The curve is divided into tworegions according to its velocity dependent functions, g and h.
are required to achieve their estimate. Considering the staticfriction curve in the first quadrant,M0 can be written as theregression
τf (ϕm) = f(ϕm)θT (4a)
f(ϕm) =[1, e−|
ϕmϕs|α , ϕm
](4b)
θ = [Fc, Fs, Fv] (4c)
where f(ϕm) is a regressor vector. The chosen identi-fication method combines linear regression with extensivesearch (grid search over a predetermined range) for thenonlinear parameters ϕs and α. For the curve in Fig-ure 3, the identified parameters are [Fc, Fs, Fv, ϕs, α] =[3.40 10−2, 4.63 10−2, 3.68 10−4, 10.70, 1.95]. Notice that, asseen in Figure 3, the model structureM0 can describe staticfriction dependence on speed fairly well. In fact, the sum ofabsolute prediction errors,
∑|ε| =
∑|τf − τf |, in Figure 3
is no more than 0.03.
B. Guidelines for the Experiments
In order to be able to build a friction model including morevariables than the velocity, it is important to separate theirinfluences. The situation is particularly critical regardingtemperature as it is difficult to control it inside a joint.Moreover, due to the complex structure of an industrial robot,changes in joint angle might move the mass center of therobot arm system, causing variations of joint load torques. Toavoid undesired effects, the guidelines below were followedduring the experiments.
1) Isolating joint load torque dependency from joint angledependency: Using an accurate dynamic robot model∗∗, it ispossible to predict the joint torques for any given robot con-figuration (a set of all joints angles). For example, Figure 4shows the resulting τm and τp at joint 2, related to variationsof joint 2 and 4 angles (ϕa,2 and ϕa,4) throughout theirworkrange. Using this information, a set of configurationscan be selected a priori in which it is possible to estimateparameters in an efficient way.
2) Isolating temperature effects: Some of the experimentsrequire that the temperature of the joint is under control.Using joint lubricant temperature measurements, the jointthermal decay constant κ was estimated to 3.04 h (see
∗∗An ABB internal tool was used for simulation purposes.
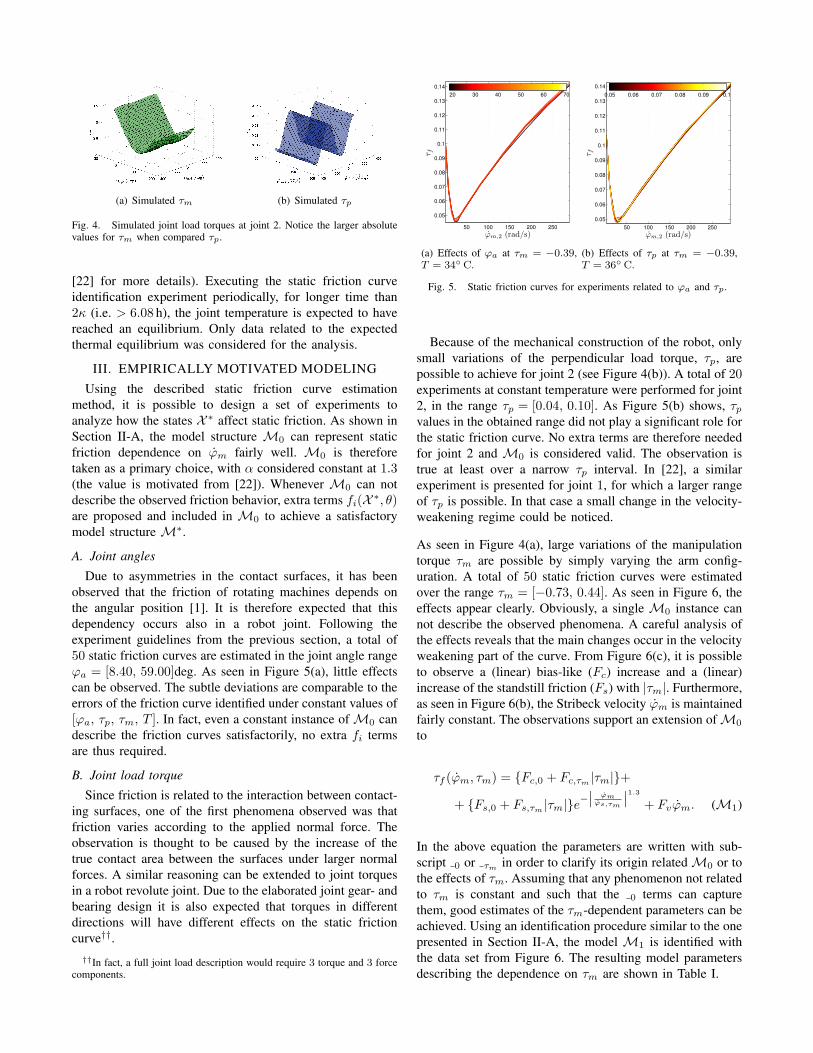
(a) Simulated τm (b) Simulated τp
Fig. 4. Simulated joint load torques at joint 2. Notice the larger absolutevalues for τm when compared τp.
[22] for more details). Executing the static friction curveidentification experiment periodically, for longer time than2κ (i.e. > 6.08 h), the joint temperature is expected to havereached an equilibrium. Only data related to the expectedthermal equilibrium was considered for the analysis.
III. EMPIRICALLY MOTIVATED MODELING
Using the described static friction curve estimationmethod, it is possible to design a set of experiments toanalyze how the states X ∗ affect static friction. As shown inSection II-A, the model structure M0 can represent staticfriction dependence on ϕm fairly well. M0 is thereforetaken as a primary choice, with α considered constant at 1.3(the value is motivated from [22]). Whenever M0 can notdescribe the observed friction behavior, extra terms fi(X ∗, θ)are proposed and included in M0 to achieve a satisfactorymodel structure M∗.
A. Joint angles
Due to asymmetries in the contact surfaces, it has beenobserved that the friction of rotating machines depends onthe angular position [1]. It is therefore expected that thisdependency occurs also in a robot joint. Following theexperiment guidelines from the previous section, a total of50 static friction curves are estimated in the joint angle rangeϕa = [8.40, 59.00]deg. As seen in Figure 5(a), little effectscan be observed. The subtle deviations are comparable to theerrors of the friction curve identified under constant values of[ϕa, τp, τm, T ]. In fact, even a constant instance ofM0 candescribe the friction curves satisfactorily, no extra fi termsare thus required.
B. Joint load torque
Since friction is related to the interaction between contact-ing surfaces, one of the first phenomena observed was thatfriction varies according to the applied normal force. Theobservation is thought to be caused by the increase of thetrue contact area between the surfaces under larger normalforces. A similar reasoning can be extended to joint torquesin a robot revolute joint. Due to the elaborated joint gear- andbearing design it is also expected that torques in differentdirections will have different effects on the static frictioncurve††.††In fact, a full joint load description would require 3 torque and 3 force
components.
ϕm,2 (rad/s)
τ f
50 100 150 200 250
0.05
0.06
0.07
0.08
0.09
0.1
0.11
0.12
0.13
0.14
20 30 40 50 60 70
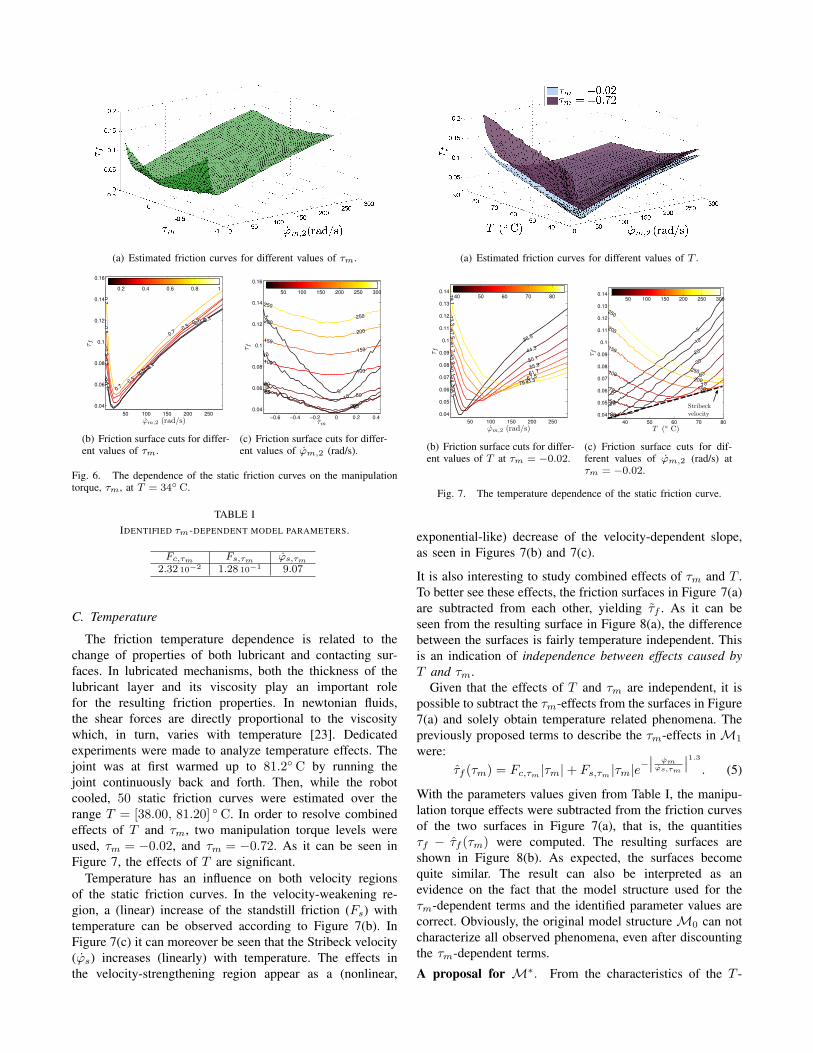
(a) Effects of ϕa at τm = −0.39,T = 34◦ C.
ϕm,2 (rad/s)
τ f
50 100 150 200 250
0.05
0.06
0.07
0.08
0.09
0.1
0.11
0.12
0.13
0.14
0.05 0.06 0.07 0.08 0.09 0.1
(b) Effects of τp at τm = −0.39,T = 36◦ C.
Fig. 5. Static friction curves for experiments related to ϕa and τp.
Because of the mechanical construction of the robot, onlysmall variations of the perpendicular load torque, τp, arepossible to achieve for joint 2 (see Figure 4(b)). A total of 20experiments at constant temperature were performed for joint2, in the range τp = [0.04, 0.10]. As Figure 5(b) shows, τpvalues in the obtained range did not play a significant role forthe static friction curve. No extra terms are therefore neededfor joint 2 and M0 is considered valid. The observation istrue at least over a narrow τp interval. In [22], a similarexperiment is presented for joint 1, for which a larger rangeof τp is possible. In that case a small change in the velocity-weakening regime could be noticed.
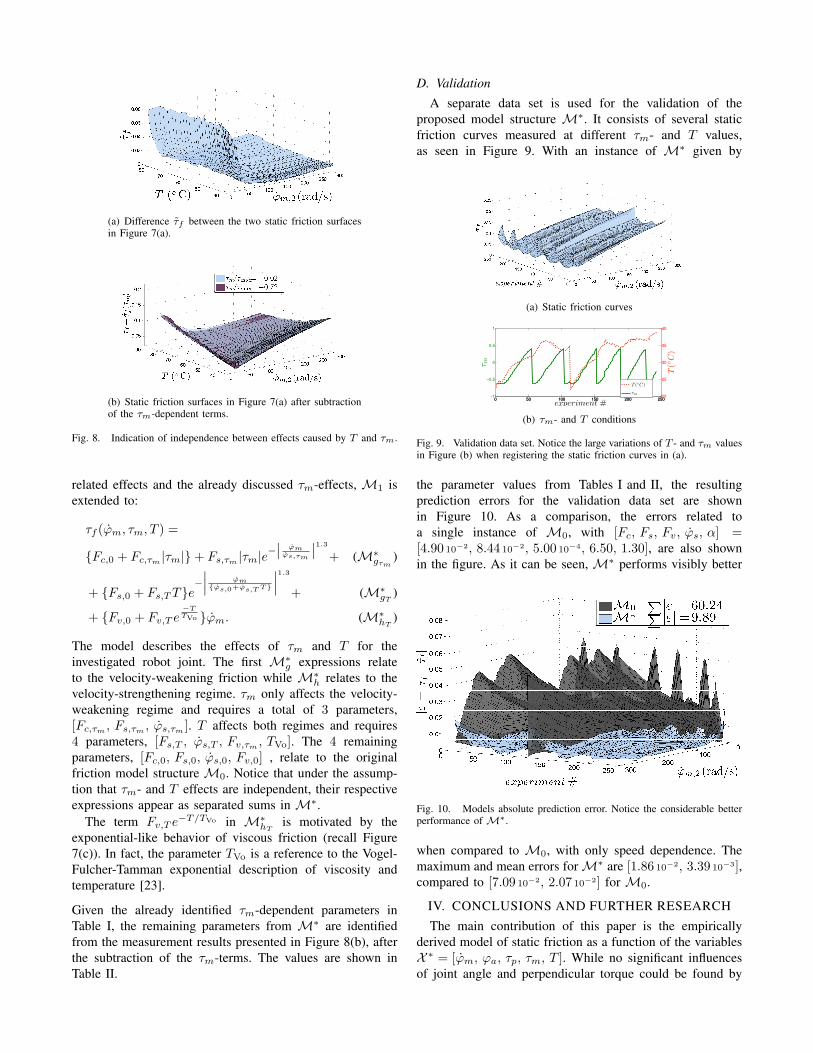
As seen in Figure 4(a), large variations of the manipulationtorque τm are possible by simply varying the arm config-uration. A total of 50 static friction curves were estimatedover the range τm = [−0.73, 0.44]. As seen in Figure 6, theeffects appear clearly. Obviously, a single M0 instance cannot describe the observed phenomena. A careful analysis ofthe effects reveals that the main changes occur in the velocityweakening part of the curve. From Figure 6(c), it is possibleto observe a (linear) bias-like (Fc) increase and a (linear)increase of the standstill friction (Fs) with |τm|. Furthermore,as seen in Figure 6(b), the Stribeck velocity ϕm is maintainedfairly constant. The observations support an extension ofM0
to
τf (ϕm, τm) = {Fc,0 + Fc,τm |τm|}+
+ {Fs,0 + Fs,τm |τm|}e−∣∣ ϕmϕs,τm
∣∣1.3+ Fvϕm. (M1)
In the above equation the parameters are written with sub-script 0 or τm in order to clarify its origin relatedM0 or tothe effects of τm. Assuming that any phenomenon not relatedto τm is constant and such that the 0 terms can capturethem, good estimates of the τm-dependent parameters can beachieved. Using an identification procedure similar to the onepresented in Section II-A, the model M1 is identified withthe data set from Figure 6. The resulting model parametersdescribing the dependence on τm are shown in Table I.
(a) Estimated friction curves for different values of τm.
0.1
0.1
0.1
0.1
0.1
0.1
0.3
0.3
0.3
0.3
0.3
0.3
0.5
0.5
0.5
0.7
0.7
0.7
ϕm,2 (rad/s)
τ f
50 100 150 200 250
0.04
0.06
0.08
0.1
0.12
0.14
0.16
0.2 0.4 0.6 0.8 1
(b) Friction surface cuts for differ-ent values of τm.
5
5
10
10
20
20
25
25
30
3050
50
100
100
150
150
200
200
250
250
τm
τ f
−0.6 −0.4 −0.2 0 0.2 0.4
0.04
0.06
0.08
0.1
0.12
0.14
0.16
50 100 150 200 250 300
(c) Friction surface cuts for differ-ent values of ϕm,2 (rad/s).
Fig. 6. The dependence of the static friction curves on the manipulationtorque, τm, at T = 34◦ C.
TABLE IIDENTIFIED τm-DEPENDENT MODEL PARAMETERS.
Fc,τm Fs,τm ϕs,τm2.32 10−2 1.28 10−1 9.07
C. Temperature
The friction temperature dependence is related to thechange of properties of both lubricant and contacting sur-faces. In lubricated mechanisms, both the thickness of thelubricant layer and its viscosity play an important rolefor the resulting friction properties. In newtonian fluids,the shear forces are directly proportional to the viscositywhich, in turn, varies with temperature [23]. Dedicatedexperiments were made to analyze temperature effects. Thejoint was at first warmed up to 81.2◦ C by running thejoint continuously back and forth. Then, while the robotcooled, 50 static friction curves were estimated over therange T = [38.00, 81.20] ◦C. In order to resolve combinedeffects of T and τm, two manipulation torque levels wereused, τm = −0.02, and τm = −0.72. As it can be seen inFigure 7, the effects of T are significant.
Temperature has an influence on both velocity regionsof the static friction curves. In the velocity-weakening re-gion, a (linear) increase of the standstill friction (Fs) withtemperature can be observed according to Figure 7(b). InFigure 7(c) it can moreover be seen that the Stribeck velocity(ϕs) increases (linearly) with temperature. The effects inthe velocity-strengthening region appear as a (nonlinear,
(a) Estimated friction curves for different values of T .
38.5
38.5
44.3
44.3
50.150.1
55.955.9
61.7
61.7
67.5
67.5
73.3
73.3
79.1
79.1
ϕm,2 (rad/s)τ f
50 100 150 200 250
0.04
0.05
0.06
0.07
0.08
0.09
0.1
0.11
0.12
0.13
0.14
40 50 60 70 80
(b) Friction surface cuts for differ-ent values of T at τm = −0.02.
5
5
10
10
20
20
30
30
50
50
7070
100
100
150
150
200
200
250
250
T (◦ C)
τ f
40 50 60 70 80
0.04
0.05
0.06
0.07
0.08
0.09
0.1
0.11
0.12
0.13
0.14
50 100 150 200 250 300
Stribeckvelocity
(c) Friction surface cuts for dif-ferent values of ϕm,2 (rad/s) atτm = −0.02.
Fig. 7. The temperature dependence of the static friction curve.
exponential-like) decrease of the velocity-dependent slope,as seen in Figures 7(b) and 7(c).
It is also interesting to study combined effects of τm and T .To better see these effects, the friction surfaces in Figure 7(a)are subtracted from each other, yielding τf . As it can beseen from the resulting surface in Figure 8(a), the differencebetween the surfaces is fairly temperature independent. Thisis an indication of independence between effects caused byT and τm.
Given that the effects of T and τm are independent, it ispossible to subtract the τm-effects from the surfaces in Figure7(a) and solely obtain temperature related phenomena. Thepreviously proposed terms to describe the τm-effects in M1
were:τf (τm) = Fc,τm |τm|+ Fs,τm |τm|e
−∣∣ ϕmϕs,τm
∣∣1.3. (5)
With the parameters values given from Table I, the manipu-lation torque effects were subtracted from the friction curvesof the two surfaces in Figure 7(a), that is, the quantitiesτf − τf (τm) were computed. The resulting surfaces areshown in Figure 8(b). As expected, the surfaces becomequite similar. The result can also be interpreted as anevidence on the fact that the model structure used for theτm-dependent terms and the identified parameter values arecorrect. Obviously, the original model structure M0 can notcharacterize all observed phenomena, even after discountingthe τm-dependent terms.
A proposal for M∗. From the characteristics of the T -
(a) Difference τf between the two static friction surfacesin Figure 7(a).
(b) Static friction surfaces in Figure 7(a) after subtractionof the τm-dependent terms.
Fig. 8. Indication of independence between effects caused by T and τm.
related effects and the already discussed τm-effects, M1 isextended to:
τf (ϕm, τm, T ) =
{Fc,0 + Fc,τm |τm|}+ Fs,τm |τm|e−∣∣ ϕmϕs,τm
∣∣1.3+ (M∗gτm )
+ {Fs,0 + Fs,TT}e−∣∣∣ ϕm{ϕs,0+ϕs,T T}
∣∣∣1.3+ (M∗gT )
+ {Fv,0 + Fv,T e−TTVo }ϕm. (M∗hT )
The model describes the effects of τm and T for theinvestigated robot joint. The first M∗g expressions relateto the velocity-weakening friction while M∗h relates to thevelocity-strengthening regime. τm only affects the velocity-weakening regime and requires a total of 3 parameters,[Fc,τm , Fs,τm , ϕs,τm ]. T affects both regimes and requires4 parameters, [Fs,T , ϕs,T , Fv,τm , TVo]. The 4 remainingparameters, [Fc,0, Fs,0, ϕs,0, Fv,0] , relate to the originalfriction model structure M0. Notice that under the assump-tion that τm- and T effects are independent, their respectiveexpressions appear as separated sums in M∗.
The term Fv,T e−T/TVo in M∗hT is motivated by the
exponential-like behavior of viscous friction (recall Figure7(c)). In fact, the parameter TVo is a reference to the Vogel-Fulcher-Tamman exponential description of viscosity andtemperature [23].
Given the already identified τm-dependent parameters inTable I, the remaining parameters from M∗ are identifiedfrom the measurement results presented in Figure 8(b), afterthe subtraction of the τm-terms. The values are shown inTable II.
D. Validation
A separate data set is used for the validation of theproposed model structure M∗. It consists of several staticfriction curves measured at different τm- and T values,as seen in Figure 9. With an instance of M∗ given by
(a) Static friction curves
0 50 100 150 200 250−1
−0.5
0
0.5
1
τ m
experiment #0 50 100 150 200 25020
25
30
35
40
T(◦
C)
T (◦C)
τm
(b) τm- and T conditions
Fig. 9. Validation data set. Notice the large variations of T - and τm valuesin Figure (b) when registering the static friction curves in (a).
the parameter values from Tables I and II, the resultingprediction errors for the validation data set are shownin Figure 10. As a comparison, the errors related toa single instance of M0, with [Fc, Fs, Fv, ϕs, α] =[4.90 10−2, 8.44 10−2, 5.00 10−4, 6.50, 1.30], are also shownin the figure. As it can be seen, M∗ performs visibly better
Fig. 10. Models absolute prediction error. Notice the considerable betterperformance of M∗.
when compared to M0, with only speed dependence. Themaximum and mean errors forM∗ are [1.86 10−2, 3.39 10−3],compared to [7.09 10−2, 2.07 10−2] for M0.
IV. CONCLUSIONS AND FURTHER RESEARCHThe main contribution of this paper is the empirically
derived model of static friction as a function of the variablesX ∗ = [ϕm, ϕa, τp, τm, T ]. While no significant influencesof joint angle and perpendicular torque could be found by
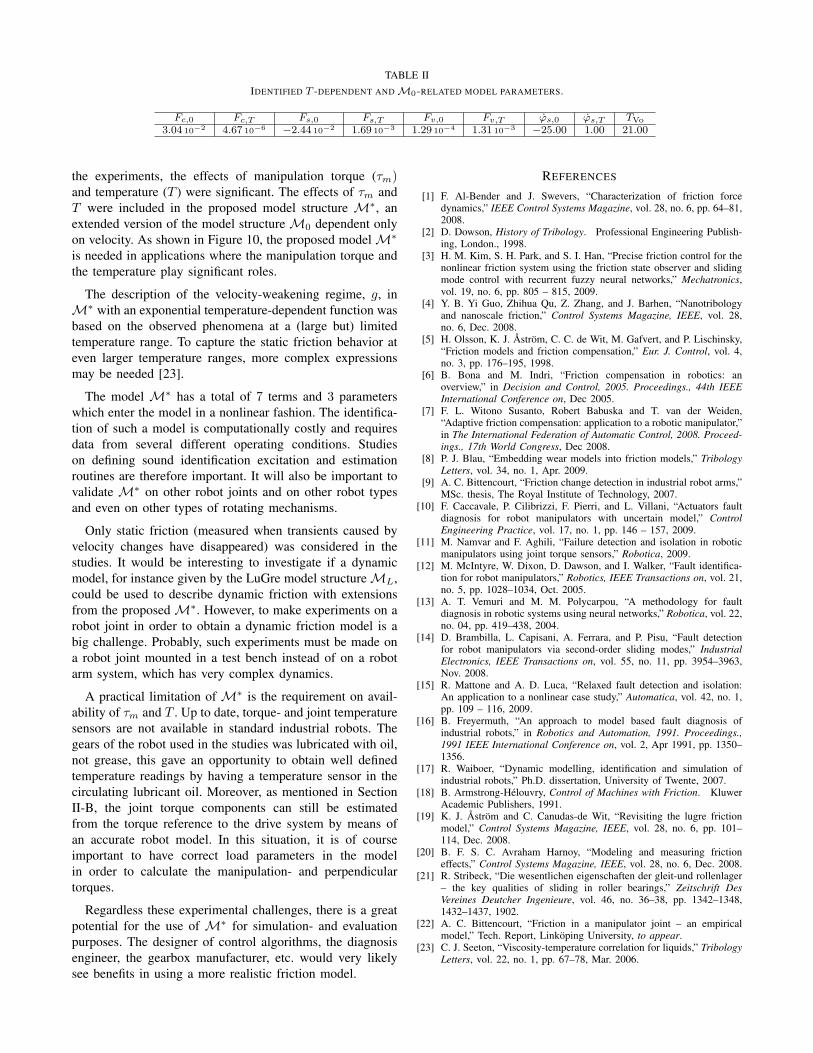
TABLE IIIDENTIFIED T -DEPENDENT ANDM0-RELATED MODEL PARAMETERS.
Fc,0 Fc,T Fs,0 Fs,T Fv,0 Fv,T ϕs,0 ϕs,T TVo
3.04 10−2 4.67 10−6 −2.44 10−2 1.69 10−3 1.29 10−4 1.31 10−3 −25.00 1.00 21.00
the experiments, the effects of manipulation torque (τm)and temperature (T ) were significant. The effects of τm andT were included in the proposed model structure M∗, anextended version of the model structureM0 dependent onlyon velocity. As shown in Figure 10, the proposed modelM∗is needed in applications where the manipulation torque andthe temperature play significant roles.
The description of the velocity-weakening regime, g, inM∗ with an exponential temperature-dependent function wasbased on the observed phenomena at a (large but) limitedtemperature range. To capture the static friction behavior ateven larger temperature ranges, more complex expressionsmay be needed [23].
The model M∗ has a total of 7 terms and 3 parameterswhich enter the model in a nonlinear fashion. The identifica-tion of such a model is computationally costly and requiresdata from several different operating conditions. Studieson defining sound identification excitation and estimationroutines are therefore important. It will also be important tovalidate M∗ on other robot joints and on other robot typesand even on other types of rotating mechanisms.
Only static friction (measured when transients caused byvelocity changes have disappeared) was considered in thestudies. It would be interesting to investigate if a dynamicmodel, for instance given by the LuGre model structureML,could be used to describe dynamic friction with extensionsfrom the proposedM∗. However, to make experiments on arobot joint in order to obtain a dynamic friction model is abig challenge. Probably, such experiments must be made ona robot joint mounted in a test bench instead of on a robotarm system, which has very complex dynamics.
A practical limitation of M∗ is the requirement on avail-ability of τm and T . Up to date, torque- and joint temperaturesensors are not available in standard industrial robots. Thegears of the robot used in the studies was lubricated with oil,not grease, this gave an opportunity to obtain well definedtemperature readings by having a temperature sensor in thecirculating lubricant oil. Moreover, as mentioned in SectionII-B, the joint torque components can still be estimatedfrom the torque reference to the drive system by means ofan accurate robot model. In this situation, it is of courseimportant to have correct load parameters in the modelin order to calculate the manipulation- and perpendiculartorques.
Regardless these experimental challenges, there is a greatpotential for the use of M∗ for simulation- and evaluationpurposes. The designer of control algorithms, the diagnosisengineer, the gearbox manufacturer, etc. would very likelysee benefits in using a more realistic friction model.
REFERENCES
[1] F. Al-Bender and J. Swevers, “Characterization of friction forcedynamics,” IEEE Control Systems Magazine, vol. 28, no. 6, pp. 64–81,2008.
[2] D. Dowson, History of Tribology. Professional Engineering Publish-ing, London., 1998.
[3] H. M. Kim, S. H. Park, and S. I. Han, “Precise friction control for thenonlinear friction system using the friction state observer and slidingmode control with recurrent fuzzy neural networks,” Mechatronics,vol. 19, no. 6, pp. 805 – 815, 2009.
[4] Y. B. Yi Guo, Zhihua Qu, Z. Zhang, and J. Barhen, “Nanotribologyand nanoscale friction,” Control Systems Magazine, IEEE, vol. 28,no. 6, Dec. 2008.
[5] H. Olsson, K. J. Astrom, C. C. de Wit, M. Gafvert, and P. Lischinsky,“Friction models and friction compensation,” Eur. J. Control, vol. 4,no. 3, pp. 176–195, 1998.
[6] B. Bona and M. Indri, “Friction compensation in robotics: anoverview,” in Decision and Control, 2005. Proceedings., 44th IEEEInternational Conference on, Dec 2005.
[7] F. L. Witono Susanto, Robert Babuska and T. van der Weiden,“Adaptive friction compensation: application to a robotic manipulator,”in The International Federation of Automatic Control, 2008. Proceed-ings., 17th World Congress, Dec 2008.
[8] P. J. Blau, “Embedding wear models into friction models,” TribologyLetters, vol. 34, no. 1, Apr. 2009.
[9] A. C. Bittencourt, “Friction change detection in industrial robot arms,”MSc. thesis, The Royal Institute of Technology, 2007.
[10] F. Caccavale, P. Cilibrizzi, F. Pierri, and L. Villani, “Actuators faultdiagnosis for robot manipulators with uncertain model,” ControlEngineering Practice, vol. 17, no. 1, pp. 146 – 157, 2009.
[11] M. Namvar and F. Aghili, “Failure detection and isolation in roboticmanipulators using joint torque sensors,” Robotica, 2009.
[12] M. McIntyre, W. Dixon, D. Dawson, and I. Walker, “Fault identifica-tion for robot manipulators,” Robotics, IEEE Transactions on, vol. 21,no. 5, pp. 1028–1034, Oct. 2005.
[13] A. T. Vemuri and M. M. Polycarpou, “A methodology for faultdiagnosis in robotic systems using neural networks,” Robotica, vol. 22,no. 04, pp. 419–438, 2004.
[14] D. Brambilla, L. Capisani, A. Ferrara, and P. Pisu, “Fault detectionfor robot manipulators via second-order sliding modes,” IndustrialElectronics, IEEE Transactions on, vol. 55, no. 11, pp. 3954–3963,Nov. 2008.
[15] R. Mattone and A. D. Luca, “Relaxed fault detection and isolation:An application to a nonlinear case study,” Automatica, vol. 42, no. 1,pp. 109 – 116, 2009.
[16] B. Freyermuth, “An approach to model based fault diagnosis ofindustrial robots,” in Robotics and Automation, 1991. Proceedings.,1991 IEEE International Conference on, vol. 2, Apr 1991, pp. 1350–1356.
[17] R. Waiboer, “Dynamic modelling, identification and simulation ofindustrial robots,” Ph.D. dissertation, University of Twente, 2007.
[18] B. Armstrong-Helouvry, Control of Machines with Friction. KluwerAcademic Publishers, 1991.
[19] K. J. Astrom and C. Canudas-de Wit, “Revisiting the lugre frictionmodel,” Control Systems Magazine, IEEE, vol. 28, no. 6, pp. 101–114, Dec. 2008.
[20] B. F. S. C. Avraham Harnoy, “Modeling and measuring frictioneffects,” Control Systems Magazine, IEEE, vol. 28, no. 6, Dec. 2008.
[21] R. Stribeck, “Die wesentlichen eigenschaften der gleit-und rollenlager– the key qualities of sliding in roller bearings,” Zeitschrift DesVereines Deutcher Ingenieure, vol. 46, no. 36–38, pp. 1342–1348,1432–1437, 1902.
[22] A. C. Bittencourt, “Friction in a manipulator joint – an empiricalmodel,” Tech. Report, Linkoping University, to appear.
[23] C. J. Seeton, “Viscosity-temperature correlation for liquids,” TribologyLetters, vol. 22, no. 1, pp. 67–78, Mar. 2006.
Related Documents