Journal of Multidisciplinary Engineering Science and Technology (JMEST) ISSN: 3159-0040 Vol. 2 Issue 12, December - 2015 www.jmest.org JMESTN42351274 3490 An Enhanced Correlation Thermodynamic Model For Fuel Inducted Spark-Ignition Engine Cycle Optimization Gerald J Micklow, PhD, PE Department of Mechanical and Aerospace Engineering, Florida Institute of Technology, Melbourne, Florida, USA [email protected] Abstract—A time dependent computer code was developed to predict the performance of a spark ignition internal combustion fuel inducted engine. The code can be used to predict engine performance for automotive and racing applications. It can predict in-cylinder temperature, gas pressure and heat transfer coefficients as a function of crank angle and utilizes a variable specific heat calculation throughout the cycle. The compression of an air- fuel-residual gas mixture is calculated followed by a finite rate burn based on the turbulent flame speed and cylinder geometry. This turbulent flame intensity varies across the RPM span and a new semi-empirical correlation was formulated based upon a joint experimental/computational effort by the investigator which utilizes extensive dynamometer experimental results for automotive engine applications. To predict residual gas content, an iterative technique was used. On the combustion and expansion stroke, the ten combustion product constituents are tracked. The engine friction, instantaneous heat transfer, and blowby past the piston rings are calculated by empirical correlations. In-cylinder wall temperatures are determined based on a newly developed empirical correlation by the authors which accounts for the influences of air- fuel ratio, compression ratio, spark timing and coolant temperature. Auto-ignition or knock is also predicted. The output of the computer code includes; turbulent burn speed, burn duration, knock pressure, knock temperature, exhaust temperatures, engine indicated and brake horsepower, mean effective pressure, pumping power loss, total heat loss to the cooling system and thermal efficiencies. To optimize engine performance of an engine for racing applications and provide an experimental data base for the numerical code validation, a test program was developed and numerous engines were run under various operating conditions. When compared against the experimental data, predicted engine power output and brake engine thermal efficiency were predicted with good agreement. Keywords—Internal combustion engine,Cycle analysis,Performance prediction,Heat transfer,Thermal efficiency,Turbulence,Wall temperature Introduction Today, our nation faces tremendous energy, economic and environmental challenges. Significant changes in the production and consumption of energy must take place to minimize adverse energy and environmental impacts. Currently, 93% of the energy consumed in the US comes from non-renewable fossil and nuclear fuel. Transportation accounts for 67% of the petroleum consumed and the transportation sector is 97% dependent on oil. One of the key aspects in the development of future automotive and transportation propulsion systems is high thermal efficiency as related to good fuel economy with good performance and low pollutant emissions. Engineering design analyses to obtain these goals are strongly driven by computational studies. The models consist of simple analysis models (heat release), zero dimensional models (cycle analysis), quasi-one-dimensional models (gas dynamics in the intake and exhaust system), phenomenological models (coarse spatial resolutions with highly empirical sub-grid models) and computational fluid dynamics models (CFD) which can be full three dimensional calculations with semi-empirical models utilized. There is “no” perfect model; and each must be used within the scope of its ability to predict and the time allotted for the study. Sometimes the models can be used to motivate experiments, sometimes to improve understanding or predict trends, and sometimes to make quantitative experiments that can be used directly on design. With continual improvements in computational speed and memory, multi-dimensional engine simulations have become an important and useful tool to aid researchers and designers in the understanding of complex in-cylinder combustion processes and pollutant emission formation. While the accuracy of the multi-dimensional engine modeling has significantly improved over the last decades, the time, cost and hardware requirements required for setting up geometrically or physically complex CFD

Welcome message from author
This document is posted to help you gain knowledge. Please leave a comment to let me know what you think about it! Share it to your friends and learn new things together.
Transcript

Journal of Multidisciplinary Engineering Science and Technology (JMEST)
ISSN: 3159-0040
Vol. 2 Issue 12, December - 2015
www.jmest.org
JMESTN42351274 3490
An Enhanced Correlation Thermodynamic Model For Fuel Inducted Spark-Ignition Engine
Cycle Optimization Gerald J Micklow, PhD, PE
Department of Mechanical and Aerospace Engineering, Florida Institute of Technology, Melbourne, Florida, USA [email protected]
Abstract—A time dependent computer code was developed to predict the performance of a spark ignition internal combustion fuel inducted engine. The code can be used to predict engine performance for automotive and racing applications. It can predict in-cylinder temperature, gas pressure and heat transfer coefficients as a function of crank angle and utilizes a variable specific heat calculation throughout the cycle. The compression of an air-fuel-residual gas mixture is calculated followed by a finite rate burn based on the turbulent flame speed and cylinder geometry. This turbulent flame intensity varies across the RPM span and a new semi-empirical correlation was formulated based upon a joint experimental/computational effort by the investigator which utilizes extensive dynamometer experimental results for automotive engine applications. To predict residual gas content, an iterative technique was used. On the combustion and expansion stroke, the ten combustion product constituents are tracked. The engine friction, instantaneous heat transfer, and blowby past the piston rings are calculated by empirical correlations. In-cylinder wall temperatures are determined based on a newly developed empirical correlation by the authors which accounts for the influences of air-fuel ratio, compression ratio, spark timing and coolant temperature. Auto-ignition or knock is also predicted. The output of the computer code includes; turbulent burn speed, burn duration, knock pressure, knock temperature, exhaust temperatures, engine indicated and brake horsepower, mean effective pressure, pumping power loss, total heat loss to the cooling system and thermal efficiencies. To optimize engine performance of an engine for racing applications and provide an experimental data base for the numerical code validation, a test program was developed and numerous engines were run under various operating conditions. When compared against the experimental data, predicted engine power output and brake engine thermal efficiency were predicted with good agreement.
Keywords—Internal combustion engine,Cycle analysis,Performance prediction,Heat transfer,Thermal efficiency,Turbulence,Wall temperature
Introduction
Today, our nation faces tremendous energy, economic and environmental challenges. Significant changes in the production and consumption of energy must take place to minimize adverse energy and environmental impacts. Currently, 93% of the energy consumed in the US comes from non-renewable fossil and nuclear fuel. Transportation accounts for 67% of the petroleum consumed and the transportation sector is 97% dependent on oil. One of the key aspects in the development of future automotive and transportation propulsion systems is high thermal efficiency as related to good fuel economy with good performance and low pollutant emissions.
Engineering design analyses to obtain these goals are strongly driven by computational studies. The models consist of simple analysis models (heat release), zero dimensional models (cycle analysis), quasi-one-dimensional models (gas dynamics in the intake and exhaust system), phenomenological models (coarse spatial resolutions with highly empirical sub-grid models) and computational fluid dynamics models (CFD) which can be full three dimensional calculations with semi-empirical models utilized. There is “no” perfect model; and each must be used within the scope of its ability to predict and the time allotted for the study. Sometimes the models can be used to motivate experiments, sometimes to improve understanding or predict trends, and sometimes to make quantitative experiments that can be used directly on design.
With continual improvements in computational speed and memory, multi-dimensional engine simulations have become an important and useful tool to aid researchers and designers in the understanding of complex in-cylinder combustion processes and pollutant emission formation. While the accuracy of the multi-dimensional engine modeling has significantly improved over the last decades, the time, cost and hardware requirements required for setting up geometrically or physically complex CFD
Journal of Multidisciplinary Engineering Science and Technology (JMEST)
ISSN: 3159-0040
Vol. 2 Issue 12, December - 2015
www.jmest.org
JMESTN42351274 3491
simulations is normally too large for this to be a mainstream portion of the design process.
Zero-dimensional thermodynamic cycle type IC engine simulations and one-dimensional simulations were the harbingers of the three-dimensional CFD models embodied in research type codes. Although these 1-D formulations originated at least four decades ago, they have not been totally forced into extinction by 3-D CFD simulations, but indeed remain on the forefront of all aspects of modern internal combustion engine research. A literature survey reveals that 1-D models are currently being used for IC engine studies related to emissions, alternative fuels, hydrogen enrichment and the HCCI engine concept. Ramos [1] documented one of the earliest compendiums of various IC models that is still relevant to modern SI combustion engine research and development. One-dimensional model calculations have been compared with those predicted by one- and two-zone thermodynamic models [2]. The two-zone thermodynamic and the one-dimensional models tend to show the same qualitative trends. However, the one-dimensional models provide more detailed information than thermodynamic models. Foster [3] emphasized the development of diagnostic type multi-zone thermodynamic models where experimental data is used as input to obtain closure of the system equations. Verhelst and Sheppard [4] present an extensive overview of multi-zone thermodynamic modeling of spark-ignition engine combustion. They conclude that multi-zone thermodynamic models can provide a valuable tool for the understanding and design development of combustion in spark-ignition engines. The essential chemistry and physics must be sufficiently embodied in sub-models for various processes such as turbulent wrinkling, flame development, flame geometry, heat transfer, etc. One-dimensional (CFD) models solve the transient coupled mass, momentum, and energy equations for one spatial independent variable. Colella [5] combined a 1-D multi-fluid turbulent entrainment combustion model with a front tracking algorithm. Flame expansion speeds were predicted to within one percent for 1-D flame tubes. Bisetti et al. [6] employed a 1-D Direct Numerical Simulation methodology, including hydrogen–air finite-rate chemistry, to investigate the effect of temperature stratification during the autoignition of lean premixed hydrogen–air mixtures at high pressure, constant volume conditions For Homogeneous Charge Compression Ignition (HCCI) engines. Sezer and Bilgin [7] developed a two-zone quasi-one-dimensional cycle model for the theoretical exergetic (second law of thermodynamics) evaluation of spark ignition engine operation. The effects of fuel–air equivalence ratio, engine speed and spark timing on the exergy transfers, irreversibilities and efficiencies were investigated theoretically. The primary finding was that a parametric exergetic analysis provides a better understanding of
interactions between operating conditions, energy conversions and transfer processes, which permits the revelation of the magnitude of work potential lost during the cycle in a more realistic way than the first law analysis, and points to several possible ways for improving engine performance. Ramachandran [8] used a two zone thermodynamic model for the simulation of a four stroke spark ignition engine running on alternate hydrocarbon fuel is presented. Specific results are presented for ethanol, although the model can also be used as a preliminary test on a wide range of alternate hydrocarbon fuels. Narayanan and Bade Shrestha [9] developed a two zone zero-dimensional simulation model to predict the performance parameters of a spark ignition engine fueled with landfill gas, methane, and landfill gas-hydrogen mixtures. The model was employed to estimate combustion duration, ignition lag, associated mass burning rates, and performance parameters for various operating conditions in an internal combustion engine. Rakopoulos and Michos [10] incorporated a quasi-dimensional, multi-zone combustion model into a closed cycle simulation code for the prediction of performance and nitric oxide (NO) emissions of a SI engine operated on biogas, with small amounts of hydrogen added. The model simulated the experimentally observed trend of increased NO concentrations with increased hydrogen fractions, while the absolute measured values were quite adequately predicted. Le Corre and Pirotais [11] studied strategies for reduced NOx emissions in a natural gas fuelled SI engine under operating under lean conditions. A two-zone thermodynamic model was used to evaluate two in situ techniques: EGR (Exhaust Gas Recirculation) and RGR (Reformed Gas Recirculation) for injecting additional mass flow rate into the inlet gases to achieve the reduction in NOx emissions. Numerical results and experimental data agreed to within an error less than 0.5% for both in-cylinder pressure and NOx emissions. An experimental and simulation study of the effect of blending ethanol with unleaded gasoline on the performance and pollutant emissions of a four-stroke spark ignition engine was conducted by Al-Baghdadi [12]. A quasi-one-dimensional model was developed to study the effect of ethanol blending on the thermodynamic cycle of the engine. The Ricardo E6/US engine was used for verification and comparison of the simulated results with experimental tests. The results of the study showed that the addition of ethanol (from 0 to 30 vol %) increases the engine power, thermal efficiency, and specific fuel consumption and reduces the nitrogen oxides, carbon monoxide, and hydrocarbon emissions. The ethanol added also improves the combustion process, reduces the crevices flow energy, reduces the cylinder temperature, reduces the ignition delay, speeds up the flame front propagation, and reduces the combustion duration.

Journal of Multidisciplinary Engineering Science and Technology (JMEST)
ISSN: 3159-0040
Vol. 2 Issue 12, December - 2015
www.jmest.org
JMESTN42351274 3492
Conte and Boulouchos [13] developed a quasi-one-dimensional flame model coupled with a detailed two-zone model of heat release to study the addition of hydrogen-rich gas to gasoline in a 4-stroke, 2-cylinder, and .5 liter engine. It is shown the addition of hydrogen-rich gas to gasoline has profound effects on the combustion process, which becomes globally faster, particularly in the onset phase. Results show that the quasi-one-dimensional model is capable of capturing the laminar and turbulent flame speeds for a given fuel. With increasing concentration of hydrogen-rich gas the laminar flame speed is shown to increase up to a factor of three. Goldsborough and Van Blarigan [14] employed a zero-dimensional thermodynamic model with detailed chemical kinetics, and empirical scavenging, heat transfer, and friction component sub-models to analyze the steady-state operating characteristics of a free piston IC engine. The operating conditions included high compression ratio (~30:1) and low
homogeneous charge compression ignition (HCCI) combustion. The cycle simulations, using hydrogen as the fuel, indicated the critical factors affecting the engine’s performance, and suggest the limits of improvement possible relative to conventional IC engine technologies. Chang et al. [15] studied exhaust gas rebreathing as a practical enabler that could be used in HCCI production engines. A 1-D cycle simulation with thermal networks is carried out under load and speed transitions. A knock integral autoignition model, a modified Woschni heat transfer model for HCCI engines and empirical correlations to define burn rate and combustion efficiency are incorporated into the engine cycle simulation model. It is shown that thermal inertia must be considered in order to fully optimize HCCI engine operation. Shaver et al. [16] developed a one-zone thermodynamic model to assess cycle-to-cycle dynamics and mode transition in HCCI engines with variable valve actuation. It is demonstrated that multi-mode HCCI engines will likely be necessary to obtain the emission and efficiency benefits of HCCI in a practical system. The thermodynamic model captured the physical aspects most relevant for multi-mode HCCI control : pressure evolution, combustion timing and power output. For HCCI the onset of combustion is predicted by integrating a single global reaction in the form of an Arrhenius rate expression and determining when this value crosses a threshold level. The combination of single zone HCCI and SI combustion models, an integrated Arrhenius rate for HCCI ignition and a control mass exhaust manifold model is shown to accurately predict steady state HCCI and the dynamics of SI-to-HCCI mode transitions. The intent of this study is to develop a quasi-one-dimensional phenomenological cycle analysis to predict the performance of standard and high output spark ignition engines for automotive and racing applications. Speed of analysis was considered to be of paramount importance. A complex three-
dimensional CFD analysis could take days to weeks to months to complete. The current analysis takes only a fraction of a second on a personal computer. Predications of in-cylinder temperature, gas pressure and heat transfer coefficients as a function of crank angle are made using a variable specific heat calculation throughout the cycle. The compression of an air-fuel-residual gas mixture is calculated followed by a finite rate burn based on the turbulent flame speed and cylinder geometry. This flame speed varies across the RPM span and a new semi-empirical releationship was formulated based on an analysis of dynamometer test data results. The fuel and combustion constituents are calculated throughout the cycle to determine exhaust emissions. The in-cylinder wall temperatures are determined from a new semi-empirical correlation based on experimental data and influenced by rpm, air-fuel ratio, compression ratio, spark timing and coolant temperature. As for the residual gas content, an iterative technique was used. On the combustion and expansion stroke, the combustion product constituents are tracked. The engine friction, instantaneous heat transfer, and blowby past the piston rings are calculated by empirical correlations. In the event of auto-ignition or knock occurring, the tendency for this to occur is also calculated. The output of the computer analysis includes; turbulent burn speed, burn duration, knock pressure, knock temperature, exhaust temperatures, engine indicated and brake horsepower, mean effective pressure (mep), friction power loss and mep, pumping power loss, total heat loss to the cooling system and thermal efficiencies
To predict these quantities, a quasi-one-dimensional analysis for fuel inducted two and four-stroke internal combustion engines was developed. Comparisons predictions of the analysis against dynamometer test data for typical engine performance parameters showed good agreement. The physical models and numerical techniques will be discussed in the following sections. PHYSICAL MODELING AND NUMERICAL ANALYSIS The following thermodynamic analysis will be applicable to internal combustion engine configurations in which fuel and air are inducted through the intake valve. The fuel will be assumed to be entirely in the vaporous state. Consider a control volume encasing the cylinder contents. The differential form of the first law of thermodymanics becomes:
11hm
d
dVp
d
dQ
d
dmu
d
dum (1)
where ml - mass flow rate across the rings hl - enthalpy/unit mass of blowby mass
Journal of Multidisciplinary Engineering Science and Technology (JMEST)
ISSN: 3159-0040
Vol. 2 Issue 12, December - 2015
www.jmest.org
JMESTN42351274 3493
u - internal energy per unit mass Q - heat transfer P - pressure V - volume
- crankshaft angle
- engine rotational speed THERMODYNAMIC PROPERTIES
The specific heats will be assumed to vary throughout the cycle and the internal energy and enthalpy will be assumed to be a function of pressure and temperature. For the compression process, a fuel/air/residual gas mixture is assumed. Six constituents are calculated. For the combustion and expansion processes, ten equilibrium combustion products are calculated. The assumptions and the solution techniques for these subroutines are presented in Appendices I and II, respectively.
The internal energy of the system is given by
ub uxxuu )1( (2)
where x is the mass fraction of the burned gas in the cylinder, ub is the internal energy of the burned gas that is at a temperature Tb, and uu is the internal energy of the unburned gas at temperature Tu. In a similar manner, the specific volume is given by:
ub vxxvv )1( (3)
A set of six ordinary differential equations can be derived describing the rate of change of pressure, temperature, work, heat loss, mass loss and enthalpy loss with respect to crank angle. By simultaneously integrating these equations from the start of the compression until the end of the expansion, the pressure-volume diagram, the instantaneous heat loss, the indicated efficiency, indicated power and the indicated mean effective pressure are determined. First, a functional relationship between vb, Tb, and P is defined as:
),( pTvv bbb (4)
Differentiating this expression with respect to the crank angle gives:
d
dp
p
v
d
dT
T
v
d
dv bb
b
bb
(5)
Note the emergence of the derivative of the pressure with respect to the crank angle which is one of the derivatives of interest. A subroutine was programmed to return the requisite partial derivatives in logarithmic form. Substitution of the logarithmic derivatives into Eq. (5) yields:
d
dp
p
v
p
v
d
dT
T
v
T
v
d
dv bbb
b
b
b
bb
ln
ln
ln
ln
(6)
and for the unburned gas
d
dp
p
v
p
v
d
dT
T
v
T
v
d
dv uuu
u
u
u
uu
ln
ln
ln
ln
(7)
The relationship between the internal energy, the gas temperature and the gas pressure leads to the following expression.
d
dp
p
v
T
vv
d
dT
T
v
T
pvc
d
du
b
b
bb
b
b
b
b
bpb
b
)ln
ln
ln
ln(
)ln
ln(
(8)
d
dp
p
v
T
vv
d
dT
T
v
T
pvc
d
du
u
u
uu
u
u
u
u
upu
u
)ln
ln
ln
ln(
)ln
ln(
(9)
Note the pressures of the unburned and the burned gas have been assumed to be equal, which is a good assumption for open chamber engines. ENERGY EQUATION
Now to investigate the energy equation, Eq. (1) term by term. The first term on the left becomes:
d
dxuu
d
dux
d
dux
d
dum ub
ub )()1( (10)
The relationships for the derivatives of the burned
and unburned internal energies with respect to are obtained from Eq. (8) and Eq. (9). Mass blowby past rings The remaining term on the left-hand side requires the introduction of conservation of mass and an empirical relationship to compute the blowby past the piston rings.
Cmm
d
dm l (11)
The constant C is based on the particular ring design. For approximately 2.5% cylinder mass loss the
coefficient is 0.8 [19]. is the engine rotational rate.
Heat transfer The heat transfer for the system will be expressed as:

Journal of Multidisciplinary Engineering Science and Technology (JMEST)
ISSN: 3159-0040
Vol. 2 Issue 12, December - 2015
www.jmest.org
JMESTN42351274 3494
ub QQ
d
dQ (12)
where Qb and Qu are the heat transfer rates for the burned and unburned gas respectively. To express the heat loss as a function of temperature requires the introduction of a heat transfer coefficient. The convective heat transfer is represented by
)( wbbb TThAQ (13)
)( wuuu TThAQ (14)
where Ab and Au are the areas of the burned and unburned gas in contact with the cylinder walls at temperature Tw. To calculate the areas Ab and Au, detailed cylinder data is required along with the flame speed. The calculation of the flame speed will be discussed later. For the current setup, the areas were assumed to have the following form.
21
2
)4
2( x
b
VbAb
(15)
)1)(4
2( 2
12
xb
VbAu
(16)
b is the cylinder bore. Equation (15) and Eq. (16) are empirical functions which have the correct limits in the cases when x approaches 0 and 1. The fraction of cylinder area contacted by the burned gas is assumed to be proportional to the square root of the burned mass to reflect the fact that because of the density difference between the burned and unburned gas, the burned gas occupies a larger volume fraction of the cylinder than the unburned gas. The heat transfer coefficients are calculated by the Woschni correlation
[20].
8.055.08.02.026.3 wTpbhc
(17)
where b - bore (m) p - pressure (kPa)
T - temperature (K) w - average cylinder gas velocity The average gas velocity is given by:
)p-(pVp
TVC+SC=w
m
rr
rd2p1 (18)
where
Vd - piston displacement Sp - Mean piston speed
Tr - reference temperature pr - reference pressure Vr - reference volume pm - motored pressure
For the compression process C1 = 2.28, C2 = 0.0, while for the combustion and expansion processes C1 = 2.28, C2 = .00324. The second term in Eq. (18) is to accommodate the increased turbulence due to combustion. Enthalpy loss due to blowby past the rings The work term in Eq. (1) requires no further explanation, but the enthalpy of the blowby gas must be specified. Early in the combustion process unburned gas leaks past the rings. Late in the combustion process burned gas leaks past the rings. Thus, an empirical relationship to represent this phenomena is as follows:
bul hxhx=h 22 )1( (19)
Equation (19) has the correct limits in that it recognizes that a larger portion of the unburned gas will be leaking than the burned gas early in the combustion process. To utilize Eq. (19), the enthalpies of the gases must be calculated. For the unburned gas, the fuel/air/residual gas mixture enthalpy is calculated as presented in Appendix I. The burned gas enthalpy will be calculated ias in Appendix II. Energy equation variables and dervatives Examination of all the terms in the energy equation reveals the following derivatives.
d
dx,
d
dV,
d
dT,
d
dT,
d
dp ub (20)
And the following variables:
ubububub h,h,,,u,u,T,Tp, (21)
C, , h, b, m, V, x (22)
pupbub
u
u
b
b c,c,p
,p
,T
,T )ln(
)ln(
)ln(
)ln(
)ln(
)ln(
)ln(
)ln(
(23)
These variables are all known functions of crank
angle, if x, the burned mass fraction, the blowby
mass formulation and engine geometry are specified. The mass at any crank angle is assumed to be given by:
)](exp[ 11 Cmm (24)

Journal of Multidisciplinary Engineering Science and Technology (JMEST)
ISSN: 3159-0040
Vol. 2 Issue 12, December - 2015
www.jmest.org
JMESTN42351274 3495
where m1 is the mass at the start of the compression
stroke assumed to be at 180 BTDC and 1 is 180 BTDC. The coefficient C is found in Eq. (11). The cylinder volume is given by:
])sin1(1[1
cos12
11 2/122
0
r
V=V (25)
(25)
where
r - compression ratio
- stroke/rod length/2 V0 - volume at top dead center(TDC) Burn law, flame speed, burn duration The mass fraction burned is represented by an empirical burning law. The expressions are as follows: Before ignition
0x (26)
During the burn:
]}θ
)θπ(θcos[-{1
2
1=
b
sx (27)
After the burn
.1x (28)
where s is the burn initiation and b is the burn duration. The burn duration is assumed to be a function of the turbulent flame speed and the cylinder geometry. The laminar flame speed is a function of the gas pressure and temperature, residual gas content, fuel type, and equivalence ratio [21]. The expression is given by
00
0,p
p
T
TSS u
LL (29)
with p0 and T0 equal to 1 atm and 298 K respectively. For gasoline;
51.3271.04.2 (30)
77.214.0357.0 (31)
2
0, )21.1(9.545.30 LS (32)
where is the equivalence ratio. The presence of any residual gas will impede the flame propagation. The following expression will make this correction.
)06.21()( 77.0
0, fSfS LL (33)
f is the residual mass fraction. The turbulent flame speed is obtained by correcting the laminar flame speed for turbulence intensity. The turbulence intensity can be assumed to be directly proportional to mean piston speed. Thus a turbulent correction is as follows;
LT SS (34)
The analysis begins with a specific turbulent flame
speed correction coefficient, , which is a turbulence
intensity coefficient multiplied by the rpm.
rpm* (35)
From engine test results, an experimental data set across a range of 3200 to 5600 rpm was created. By altering the turbulence intensity coefficient in the computed results until the theoretical results match to the actual dynamometer results in horsepower; a specific turbulence intensity correlation coefficient, ,
for each rpm can be determined. Once the turbulent intensity correlation coefficient , is determined for
each specific rpm across the rpm range, a best fit trend line and equation is found as shown in Fig. 1. The turbulent intensity coefficient ξ, is presented in Fig. 2.
8549234.13
)(1028208.19)(8792355.10
)(2790303.3)(5518911.0
)(491991.0)(0018155.0
2
34
56
rpmrpm
rpmrpm
rpmrpm
(36)
Figure 1 Turbulence Intensity Correlation Coefficient φ versus rpm/1000
Figure 2 Turbulent Intensity Coefficient, versus
rpm
Journal of Multidisciplinary Engineering Science and Technology (JMEST)
ISSN: 3159-0040
Vol. 2 Issue 12, December - 2015
www.jmest.org
JMESTN42351274 3496
This constitutes an new semi-empirically derived approximation of turbulent flame intensity within a cylinder. However, due to the actual non-uniform flame propagation across the cylinder, variations occur cycle to cycle as well as cylinder to cylinder causing errors in the theoretical horsepower output.
The turbulent intensity coefficient φ is then multiplied by the rpm as given by eq (35), resulting in the turbulent flame speed correction factor ξ. This value multiplied by the laminar flame speed will result in the turbulent flame speed during the in-cylinder combustion process.
A known gauged output to most engines is the coolant temperature. However, for the computer code simulation, the temperature of the cylinder walls is of importance to be able to predict the wall heat transfer. Therefore, a new semi-empirical correlation must be derived to give the relationship between the water coolant temperature and the in-cylinder wall temperature. Wall Temperature A study was conducted by French and Atkins on the thermal loads in an engine [24] Based on the results of this experimental program an empirical correlation was developed to predict the in-cylinder wall temperature. The main effects on heat losses are due to engine speed, throttle setting and mixture strength. The in-cylinder wall temperature is affected by many operating parameters including the air/fuel ratio, engine speed, ignition timing, compression ratio, and the coolant temperature. By using a base case operating engine cycle, the effect of each the aforementioned parameters on in-cylinder wall temperature can be correlated to a specific engine parameter. It is assumed that each parameter is linear and a superposition of the effects can be utilized.
),,,,( coolW TrITrpmfnT (37)
Where for the base case:
Φ is the equivalence ratio and equal to 1.13
rpm is 5520
IT is the ignition timing and the base value is 37 degrees BTDC
r is the base compression ratio and equal to 5
Tcool is the coolant temperature, base value equals 85 °C
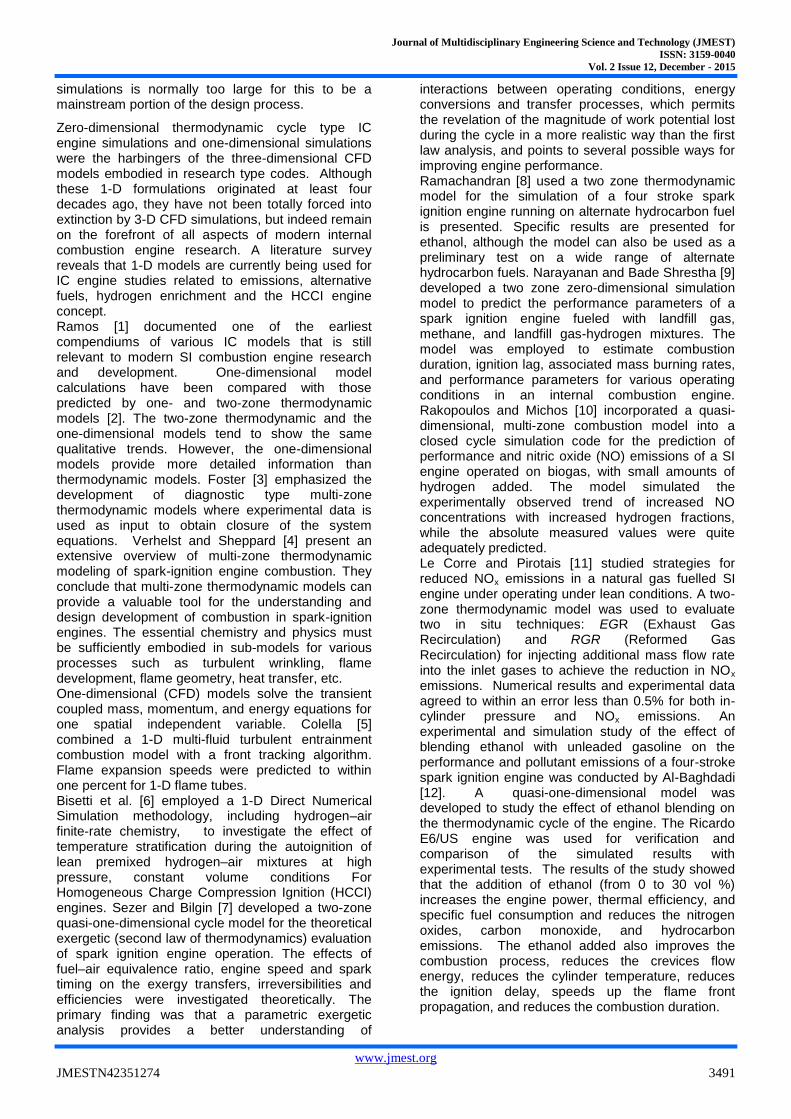
Fuel flow has the largest influence on heat flux aside from smaller effects due to operating conditions. A plot of air/fuel mixture versus wall temperature in ºC is shown in Fig. 3.
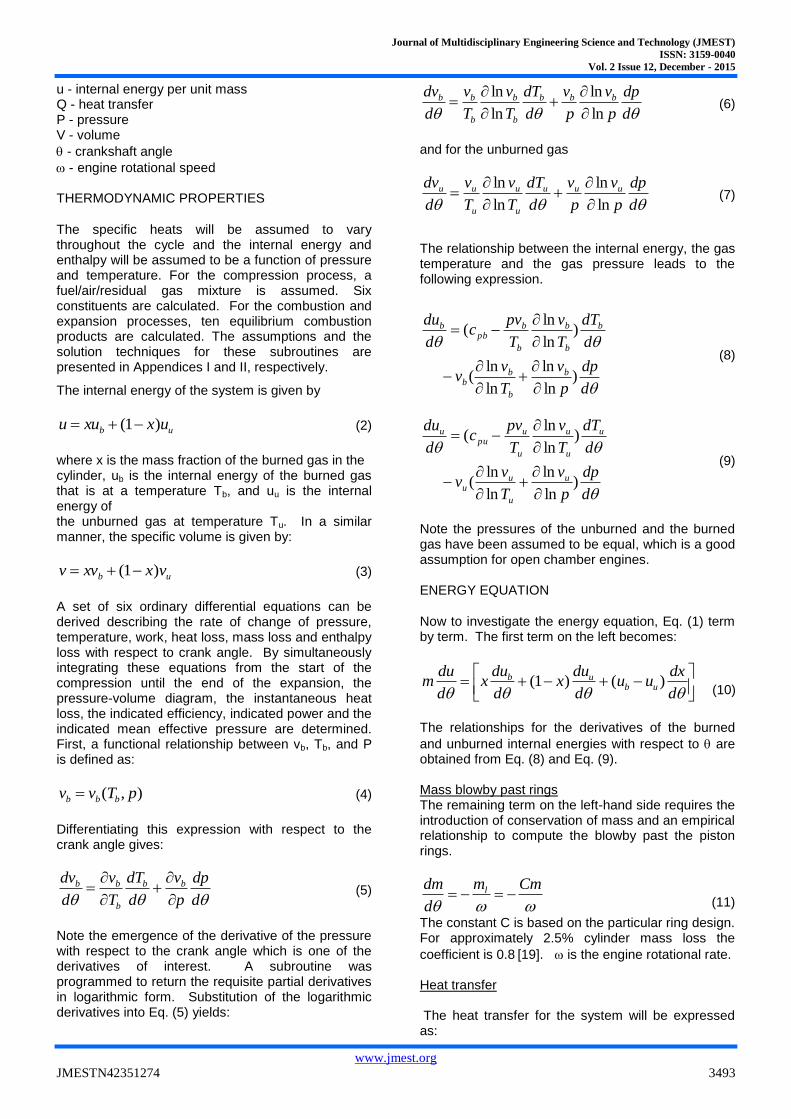
Metal Temperatures peak at around 95 rev/sec. It is also recommended that the cylinder liner temperature does not exceed 160 ºC. The effect of engine speed on wall temperature is shown in Fig. 4.
Figure 3 Air-Fuel Ratio versus Wall Temperature
Figure 4 Engine Speed versus Wall Temperature Increase
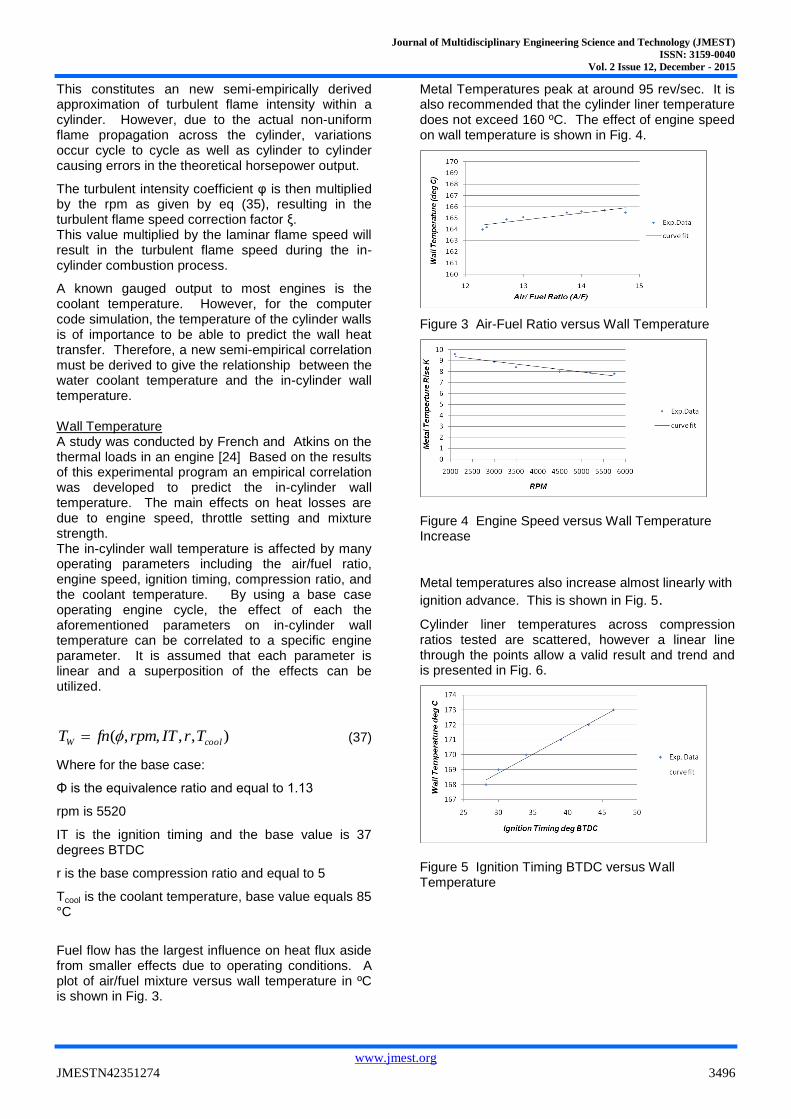
Metal temperatures also increase almost linearly with
ignition advance. This is shown in Fig. 5.
Cylinder liner temperatures across compression ratios tested are scattered, however a linear line through the points allow a valid result and trend and is presented in Fig. 6.
Figure 5 Ignition Timing BTDC versus Wall Temperature

Journal of Multidisciplinary Engineering Science and Technology (JMEST)
ISSN: 3159-0040
Vol. 2 Issue 12, December - 2015
www.jmest.org
JMESTN42351274 3497
Figure 6 Compression Ratio versus Wall Temperature
Heat transfer from the cylinder liner to the coolant is mainly by forced convection due to a higher response of the metal temperatures at lower heat fluxes. Fig. 7 shows the trend of wall temperature with coolant temperature.
Figure 7 Coolant Temperature versus Wall Temperature
The base case engine operating parameters were determined to have an in-cylinder wall temperature of 409.54 K. The empirical equation allows the in cylinder wall temperature to be calculated. The equation for the in-cylinder wall temperature in K as a function of the equivalence ratio, rpm, ignition timing, compression ratio and coolant temperature is shown below.
883.0
1614.0)85(894.054.409
coolwall TT
)5520(0005.)37(277.0)5.8(449.5 rpmr
(38)
Autoignition
The ability to calculate autoignition of the unburned gas mixture was also included [22]. Autoignition occurs when
1
dt (39)
where
is the induction time
t is the elapsed time from the start of the end gas compression
The expression for the induction time is
T
pON
3800exp
10068.17 7.1
402.3
(40)
ON is the fuel octane number. This expression is numerically integrated to predict knock.
SOLUTION PROCEDURE
The energy equation, Eq. (1), is a relationship between three derivatives, their integrals, and parameters dependent upon the integrals. Thus, the energy equation has the following form;
TTpd
dT
d
dT
d
dpf ub
ub 0,,,,,,
(41) 41
With two more equations, Eq. (38) can be put in the form of three ordinary differential equations that can be integrated numerically. The standard form of these three equations are
TTpfd
dpub ),,,(1
(42)
TTpfd
dTub
b ),,,(2 (43)
TTpfd
dTub
u ),,,(3
(44)
It is convenient to integrate simultaneously for the work done, heat lost and the enthalpy loss by blowby past the rings.
Two of the required equations can be obtained by differentiating Eq. (3) and incorporating Eq. (5) and Eq. (6) to give
d
dxvv
d
dvx
d
dm
m
V
d
dV
mub
b
)(
1
2 (48)
pfd
dW),(4
(45)
TTpfd
dQub
l ),,,(5
(46)
TTpfd
dHub
l ),,,(6
(47)

Journal of Multidisciplinary Engineering Science and Technology (JMEST)
ISSN: 3159-0040
Vol. 2 Issue 12, December - 2015
www.jmest.org
JMESTN42351274 3498
()
and
d
dxvv
d
dp
p
v
p
vx
p
v
p
vx
d
dT
T
v
T
vx
d
dT
T
v
T
vx
m
VC
d
dV
m
ub
uubb
u
u
u
u
ub
b
b
b
b
)(
ln)1(
ln
ln
ln)1(
ln
ln1
(49)
The last equation comes from the unburned gas entropy. The unburned gas entropy can change due to mass loss across the the rings and wall heat transfer.
d
dsxQ u
u
)1( (50)
The entropy can also be expressed in a state relationship as a function of pressure and
temperature. Taking the derivative with respect to gives;
d
dp
T
v
T
v
d
dT
T
c
d
ds
u
u
u
uu
u
pu
ln
ln
(51)
Combining Eq. (50) and Eq. (51) will eliminate the
derivative of the entropy with respect to . This gives;
)(1
14
2
ln
ln
21
2
wu
u
uu
upu
TTx
x
m
b
Vbh
d
dp
T
vv
d
dTc
(52)
To solve Eqs. (45)-(47), Eqs. (1), (49), and (52) are required. The following terms are defined based on expressions in these equations.
VC
d
dV
mA
1 (53)
u
wu
u
u
pu
u
b
wb
b
b
pb
b
T
TTx
T
v
c
v
T
TTx
T
v
c
v
b
Vb
m
hB
)1(ln
ln
ln
ln4
2
21
21
2
(54)
Cxx
d
dx
Tc
hh
T
vv
d
dxvvCI
bpb
bu
b
bb
ub
)(
ln
ln
)(
2 (55)
p
v
p
v
T
v
Tc
vxD bb
b
b
bpb
b
ln
ln
ln
ln2
2
(56)
p
v
p
v
T
v
Tc
vxE uu
u
u
upu
u
ln
ln
ln
ln)1(
22
(57)
Finally the six equations to be integrated are:
ED
CIBA
d
dp
(58)
C
xxd
dx
xc
hh
ED
CIBA
T
v
c
v
xmc
TTxb
Vbh
d
dT
pb
bu
b
b
pb
b
pb
wb
b
)()(
ln
ln
)(4
2
2
21
2
(59)
ED
CIBA
T
v
c
v
xmc
TTxb
Vbh
d
dT
u
u
pu
u
pu
wu
u
ln
ln
)(4
22
12
(60)
d
dVp
d
dW
(61)
))(1()(
*4
2
21
21
2
wuwb
l
TTxTTx
b
Vbh
d
dQ
(62)

Journal of Multidisciplinary Engineering Science and Technology (JMEST)
ISSN: 3159-0040
Vol. 2 Issue 12, December - 2015
www.jmest.org
JMESTN42351274 3499
])1[( 22
bul hxhx
Cm
d
dH
(63)
Equations (58)-(63) are integrated using a fourth-order Runge-Kutta numerical integration scheme.
EXHAUST BLOWDOWN, RESIDUAL MASS FRACTION, AND PUMPING LOSS
For the exhaust blowdown, an isentropic expansion from the in-cylinder pressure at BDC to atmospheric pressure was assumed. The equilidrium combustion products subroutine was used to obtain the thermodynamic properties for residual gas. The exhaust temperature calculation was performed with a Newton-Raphson iterative method since the equilibrium composition is a function of temperature and the residual gas temperature drops as the flow expands across the exhaust valve. The intake charge is diluted by the residual gas left in the cylinder and the temperature increases as the gases mix. Based on the first law of thermodynamics, the following expression is derived for the enthalpy, h1 at the beginning of the compression stroke. The
p
pfRTfhhfh
ex
inexexin )1()1(1 (64)
where
hin - enthalpy of the intake air
hex -enthalpy of the exhaust gas
Tex -exhaust gas temperature
pin, pex -pressure of the intake and exhaust respectively
The residual mass fraction f, is given by;
p
p
T
T
rf
bdc
ex
ex
bdc
v
1 (65)
where rv is the compression ratio , and Tbdc, pbdc are the in-cylinder temperature and pressure at BDC before the exhaust valve opens. The increased temperature at the beginning of the compression stroke plus the dilution of the intake charge with the residual exhaust gas will change the in-cylinder thermodynamic properties which will change the exhaust gas temperature and the residual mass fraction. Therefore, an iterative technique is required to calculate the correct in-cylinder conditions. Once again a Newton-Rahpson linearization technique was used.
Finally, the pumping losses were incorporated based on the assumptions that the intake valve opens at TDC and closes at BDC and the exhaust valve opens
at BDC and closes at TDC. The expression for the pumping work then becomes;
VppW dexin )(0 (66)
FRICTION An engine friction model was incorporated into the analysis based on the empirical relationships of Bishop [23]. The effects of bearing friction, cam gear friction, viscous piston friction, static ring tension and ring gas pressure friction were included. RESULTS EXPERIMENTAL CONDITIONS To assess to capability of the analysis, an eight cylinder V-8 engine configuration was investigated. The experimental investigation was performed on a water brake dynamometer using a 7.4 liter Chevrolet V-8 engine configuration. The following data hold for this enigne; Displacement 7.4 L Bore 11.05 cm Stroke 10.16 cm Compression Ratio 10:1 Stoke/rod length/2 0.326 Pistion ring number 2 Piston Skirt length 7.62 cm Intake valve number 1 Valve head diameter 5.56 cm Number of cylinders 8 The engine was operated under wide open throttle (WOT) conditions under an rpm range of 3200 to 5500 rpm and were corrected to SAE standard day conditions. Table 1 presents the engine operating conditions investigated.
Coolant Temperature
(deg C)
Ignition Timing (deg
BTDC)
Air/Fuel Ratio
82 -38 14
71 -38 14
82 -38 13.25
82 -40 14
Table 1 Operating Conditions Investigated
The base case was for the engine operating at a coolant temperature of 82 °C, an ignition timing of 38 degrees BTDC and with an Air/Fuel ratio of 14.
Figure 8 presents a plot of brake power output versus rpm for for the base case. Good agreement is obtained between the measured and predicted brake engine power output. Average error between the measured and predicited power output is less than 1%. Figure 9 presents a comparison between the predicted and experimental thermal efficiency for the base case. Good agreement is obtained.
Journal of Multidisciplinary Engineering Science and Technology (JMEST)
ISSN: 3159-0040
Vol. 2 Issue 12, December - 2015
www.jmest.org
JMESTN42351274 3500
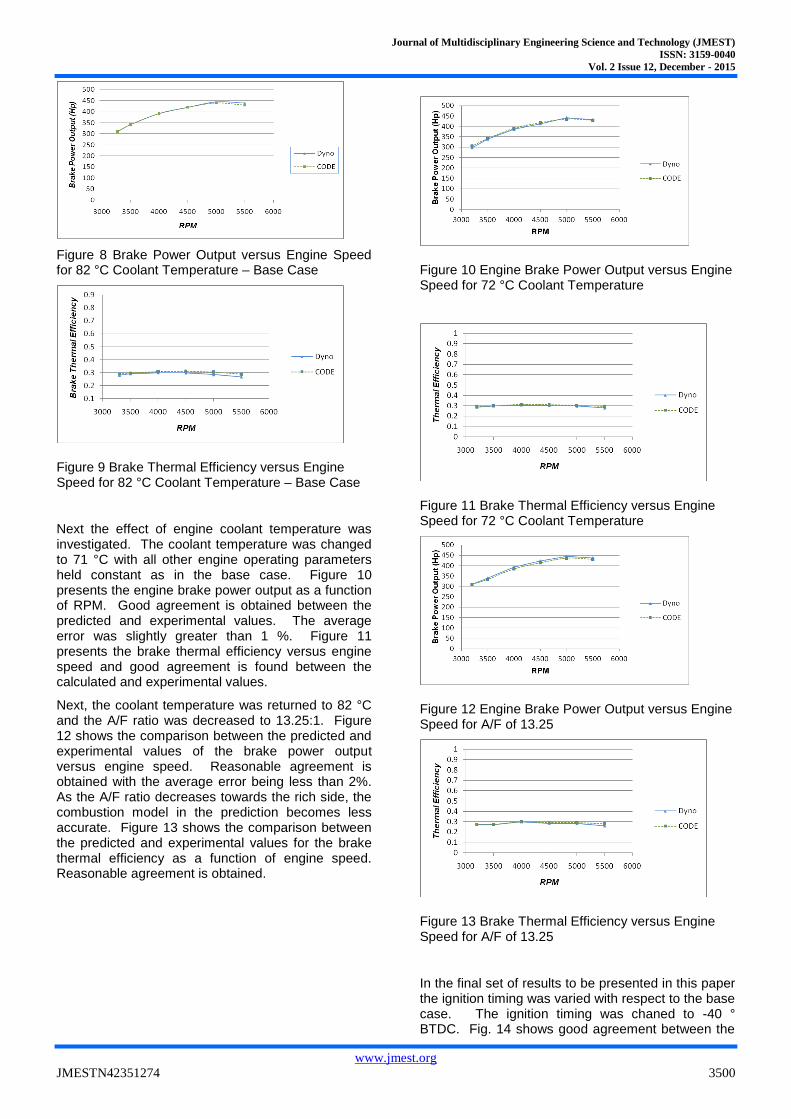
Figure 8 Brake Power Output versus Engine Speed for 82 °C Coolant Temperature – Base Case
Figure 9 Brake Thermal Efficiency versus Engine Speed for 82 °C Coolant Temperature – Base Case
Next the effect of engine coolant temperature was investigated. The coolant temperature was changed to 71 °C with all other engine operating parameters held constant as in the base case. Figure 10 presents the engine brake power output as a function of RPM. Good agreement is obtained between the predicted and experimental values. The average error was slightly greater than 1 %. Figure 11 presents the brake thermal efficiency versus engine speed and good agreement is found between the calculated and experimental values.
Next, the coolant temperature was returned to 82 °C and the A/F ratio was decreased to 13.25:1. Figure 12 shows the comparison between the predicted and experimental values of the brake power output versus engine speed. Reasonable agreement is obtained with the average error being less than 2%. As the A/F ratio decreases towards the rich side, the combustion model in the prediction becomes less accurate. Figure 13 shows the comparison between the predicted and experimental values for the brake thermal efficiency as a function of engine speed. Reasonable agreement is obtained.
Figure 10 Engine Brake Power Output versus Engine Speed for 72 °C Coolant Temperature
Figure 11 Brake Thermal Efficiency versus Engine Speed for 72 °C Coolant Temperature
Figure 12 Engine Brake Power Output versus Engine Speed for A/F of 13.25
Figure 13 Brake Thermal Efficiency versus Engine Speed for A/F of 13.25
In the final set of results to be presented in this paper the ignition timing was varied with respect to the base case. The ignition timing was chaned to -40 ° BTDC. Fig. 14 shows good agreement between the
Journal of Multidisciplinary Engineering Science and Technology (JMEST)
ISSN: 3159-0040
Vol. 2 Issue 12, December - 2015
www.jmest.org
JMESTN42351274 3501
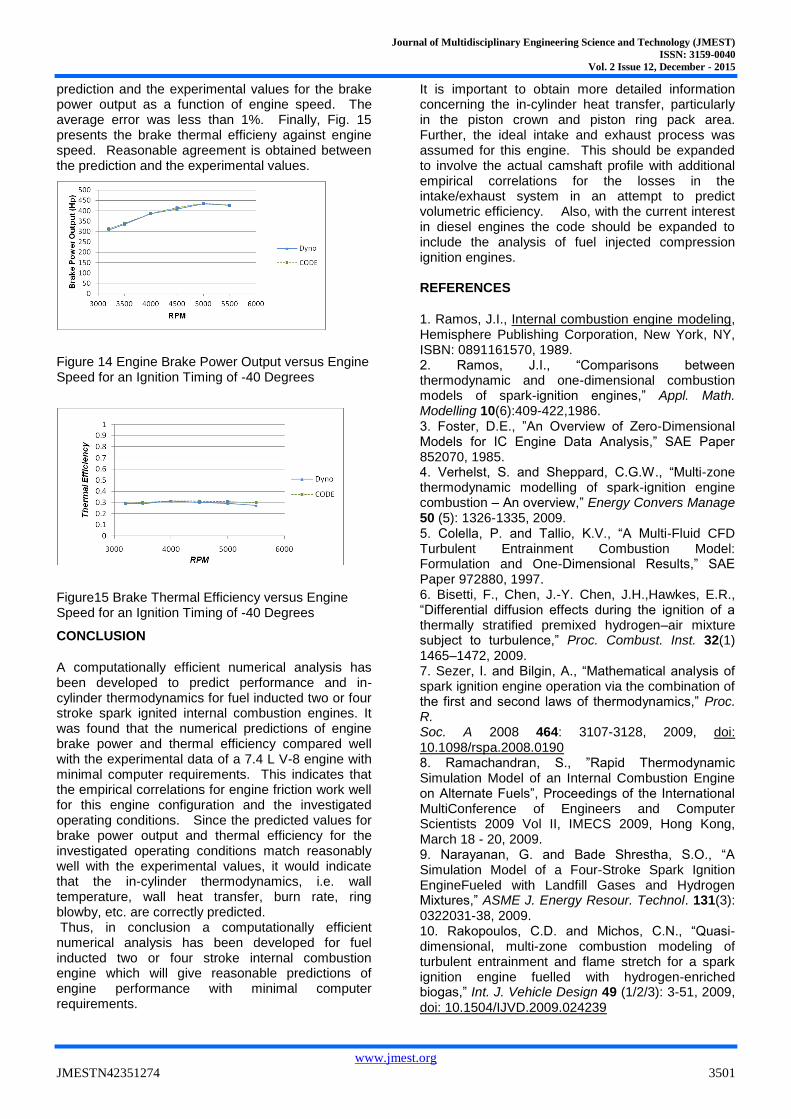
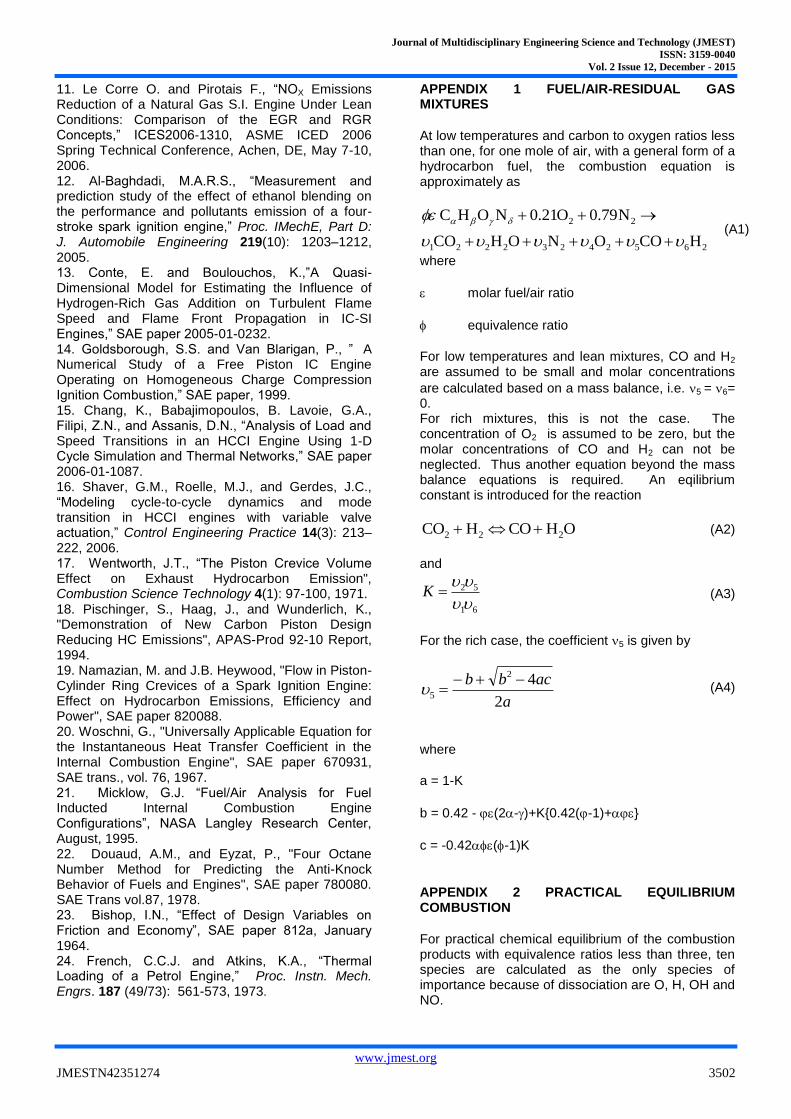
prediction and the experimental values for the brake power output as a function of engine speed. The average error was less than 1%. Finally, Fig. 15 presents the brake thermal efficieny against engine speed. Reasonable agreement is obtained between the prediction and the experimental values.
Figure 14 Engine Brake Power Output versus Engine Speed for an Ignition Timing of -40 Degrees
Figure15 Brake Thermal Efficiency versus Engine Speed for an Ignition Timing of -40 Degrees
CONCLUSION
A computationally efficient numerical analysis has been developed to predict performance and in-cylinder thermodynamics for fuel inducted two or four stroke spark ignited internal combustion engines. It was found that the numerical predictions of engine brake power and thermal efficiency compared well with the experimental data of a 7.4 L V-8 engine with minimal computer requirements. This indicates that the empirical correlations for engine friction work well for this engine configuration and the investigated operating conditions. Since the predicted values for brake power output and thermal efficiency for the investigated operating conditions match reasonably well with the experimental values, it would indicate that the in-cylinder thermodynamics, i.e. wall temperature, wall heat transfer, burn rate, ring blowby, etc. are correctly predicted. Thus, in conclusion a computationally efficient numerical analysis has been developed for fuel inducted two or four stroke internal combustion engine which will give reasonable predictions of engine performance with minimal computer requirements.
It is important to obtain more detailed information concerning the in-cylinder heat transfer, particularly in the piston crown and piston ring pack area. Further, the ideal intake and exhaust process was assumed for this engine. This should be expanded to involve the actual camshaft profile with additional empirical correlations for the losses in the intake/exhaust system in an attempt to predict volumetric efficiency. Also, with the current interest in diesel engines the code should be expanded to include the analysis of fuel injected compression ignition engines. REFERENCES
1. Ramos, J.I., Internal combustion engine modeling, Hemisphere Publishing Corporation, New York, NY, ISBN: 0891161570, 1989. 2. Ramos, J.I., “Comparisons between thermodynamic and one-dimensional combustion models of spark-ignition engines,” Appl. Math. Modelling 10(6):409-422,1986. 3. Foster, D.E., ”An Overview of Zero-Dimensional Models for IC Engine Data Analysis,” SAE Paper 852070, 1985. 4. Verhelst, S. and Sheppard, C.G.W., “Multi-zone thermodynamic modelling of spark-ignition engine combustion – An overview,” Energy Convers Manage 50 (5): 1326-1335, 2009. 5. Colella, P. and Tallio, K.V., “A Multi-Fluid CFD Turbulent Entrainment Combustion Model: Formulation and One-Dimensional Results,” SAE Paper 972880, 1997. 6. Bisetti, F., Chen, J.-Y. Chen, J.H.,Hawkes, E.R., “Differential diffusion effects during the ignition of a thermally stratified premixed hydrogen–air mixture subject to turbulence,” Proc. Combust. Inst. 32(1) 1465–1472, 2009. 7. Sezer, I. and Bilgin, A., “Mathematical analysis of spark ignition engine operation via the combination of the first and second laws of thermodynamics,” Proc. R. Soc. A 2008 464: 3107-3128, 2009, doi: 10.1098/rspa.2008.0190 8. Ramachandran, S., ”Rapid Thermodynamic Simulation Model of an Internal Combustion Engine on Alternate Fuels”, Proceedings of the International MultiConference of Engineers and Computer Scientists 2009 Vol II, IMECS 2009, Hong Kong, March 18 - 20, 2009. 9. Narayanan, G. and Bade Shrestha, S.O., “A Simulation Model of a Four-Stroke Spark Ignition EngineFueled with Landfill Gases and Hydrogen Mixtures,” ASME J. Energy Resour. Technol. 131(3): 0322031-38, 2009. 10. Rakopoulos, C.D. and Michos, C.N., “Quasi-dimensional, multi-zone combustion modeling of turbulent entrainment and flame stretch for a spark ignition engine fuelled with hydrogen-enriched biogas,” Int. J. Vehicle Design 49 (1/2/3): 3-51, 2009, doi: 10.1504/IJVD.2009.024239
Journal of Multidisciplinary Engineering Science and Technology (JMEST)
ISSN: 3159-0040
Vol. 2 Issue 12, December - 2015
www.jmest.org
JMESTN42351274 3502
11. Le Corre O. and Pirotais F., “NOX Emissions Reduction of a Natural Gas S.I. Engine Under Lean Conditions: Comparison of the EGR and RGR Concepts,” ICES2006-1310, ASME ICED 2006 Spring Technical Conference, Achen, DE, May 7-10, 2006. 12. Al-Baghdadi, M.A.R.S., “Measurement and prediction study of the effect of ethanol blending on the performance and pollutants emission of a four-stroke spark ignition engine,” Proc. IMechE, Part D: J. Automobile Engineering 219(10): 1203–1212, 2005. 13. Conte, E. and Boulouchos, K.,”A Quasi-Dimensional Model for Estimating the Influence of Hydrogen-Rich Gas Addition on Turbulent Flame Speed and Flame Front Propagation in IC-SI Engines,” SAE paper 2005-01-0232. 14. Goldsborough, S.S. and Van Blarigan, P., ” A Numerical Study of a Free Piston IC Engine Operating on Homogeneous Charge Compression Ignition Combustion,” SAE paper, 1999. 15. Chang, K., Babajimopoulos, B. Lavoie, G.A., Filipi, Z.N., and Assanis, D.N., “Analysis of Load and Speed Transitions in an HCCI Engine Using 1-D Cycle Simulation and Thermal Networks,” SAE paper 2006-01-1087. 16. Shaver, G.M., Roelle, M.J., and Gerdes, J.C., “Modeling cycle-to-cycle dynamics and mode transition in HCCI engines with variable valve actuation,” Control Engineering Practice 14(3): 213–222, 2006. 17. Wentworth, J.T., “The Piston Crevice Volume Effect on Exhaust Hydrocarbon Emission", Combustion Science Technology 4(1): 97-100, 1971. 18. Pischinger, S., Haag, J., and Wunderlich, K., "Demonstration of New Carbon Piston Design Reducing HC Emissions", APAS-Prod 92-10 Report, 1994. 19. Namazian, M. and J.B. Heywood, "Flow in Piston-Cylinder Ring Crevices of a Spark Ignition Engine: Effect on Hydrocarbon Emissions, Efficiency and Power", SAE paper 820088. 20. Woschni, G., "Universally Applicable Equation for the Instantaneous Heat Transfer Coefficient in the Internal Combustion Engine", SAE paper 670931, SAE trans., vol. 76, 1967. 21. Micklow, G.J. “Fuel/Air Analysis for Fuel Inducted Internal Combustion Engine Configurations”, NASA Langley Research Center, August, 1995. 22. Douaud, A.M., and Eyzat, P., "Four Octane Number Method for Predicting the Anti-Knock Behavior of Fuels and Engines", SAE paper 780080. SAE Trans vol.87, 1978. 23. Bishop, I.N., “Effect of Design Variables on Friction and Economy”, SAE paper 812a, January 1964. 24. French, C.C.J. and Atkins, K.A., “Thermal Loading of a Petrol Engine,” Proc. Instn. Mech. Engrs. 187 (49/73): 561-573, 1973.
APPENDIX 1 FUEL/AIR-RESIDUAL GAS MIXTURES
At low temperatures and carbon to oxygen ratios less than one, for one mole of air, with a general form of a hydrocarbon fuel, the combustion equation is approximately as
26524232221
22
HCOONOHCO
N79.0O21.0NOHC
(A1)
where
molar fuel/air ratio
equivalence ratio
For low temperatures and lean mixtures, CO and H2 are assumed to be small and molar concentrations
are calculated based on a mass balance, i.e. 5 = 6= 0. For rich mixtures, this is not the case. The concentration of O2 is assumed to be zero, but the molar concentrations of CO and H2 can not be neglected. Thus another equation beyond the mass balance equations is required. An eqilibrium constant is introduced for the reaction
OHCOHCO 222 (A2)
and
61
52
K (A3)
For the rich case, the coefficient 5 is given by
a
acbb
2
42
5
(A4)
where
a = 1-K
b = 0.42 - (2-)+K{0.42(-1)+}
c = -0.42(-1)K
APPENDIX 2 PRACTICAL EQUILIBRIUM COMBUSTION
For practical chemical equilibrium of the combustion products with equivalence ratios less than three, ten species are calculated as the only species of importance because of dissociation are O, H, OH and NO.

Journal of Multidisciplinary Engineering Science and Technology (JMEST)
ISSN: 3159-0040
Vol. 2 Issue 12, December - 2015
www.jmest.org
JMESTN42351274 3503
NOOHO H H
COONOHCO
NONOHC
1098726
524232221
22 79.021.0
(B1)
Four of the equations for the unknowns are obtained through a mass balance. These are
C = (y1+y5)n (B2)
H = (2y2+2y6+y7+y9)n (B3)
O = (2y1+y2+2y4+y5+y8+y9+y10)n-0.42 (B4)
N = (2y3+y10)n-1.58 (B5)
Where n is the total number of moles and yi is the mole fraction. Also
1 iy (B6)
Six additional equations are required to obtain the equilibrium concentrations. These are
1 iy (B6)
HH2
12
2/1
6
2/1
71
y
pyK
(B7)
OO2
12
2/1
4
2/1
82
y
pyK
(B8)
OHO2
1H
2
122
2/1
6
2/1
4
93
yy
yK
(B9)
NON2
1O
2
122
2/1
3
2/1
4
104
yy
yK
(B10)
OHO2
1H 222
2/1
6
2/1
4
25
pyy
yK
(B11)
22 COO2
1CO
2/1
5
2/1
4
16
pyy
yK
(B12)
Equilibrium constant data is input on the form of curve fits to experimental data. Through algebraic manipulations, the problem can be reduced to four equations with four unknowns. The equations are non-linear and a Newton-Raphson linearization was used to obtain an iterative solution. The linearized set of equations is solved using Gaussian elimination. The required input is the instantaneous gas pressure, temperature, and the equivalence ratio. The solution gives the mixture entahlpy, internal energy, specific volume, entropy, constant pressure specific heat and the equilibrium concentrations of the ten constituents.
Related Documents