Contrast-Enhanced First Pass Myocardial Perfusion Imaging: Correlation Between Myocardial Blood Flow in Dogs at Rest and During Hyperemia N. Wilke, C. Simm, J. Zhang, J. Ellermann, X. Ya, H. Merkle, G. Path, H. Liidemann, R. J. Bache, K. Ugurbil The sensitivity of contrastenhanced MR first pass perfusion imaging in detection and quantification of hypoperfused my- ocardium was evaluated using an instrumented, closed-chest dog model where graded regional hypoperfusionwas induced by applying predetermined levels of stenosis to the left ante- rior descending artery (LAD). All measurements were per- formed at rest and under stress induced by dipyridamole (DIP). Myocardial perfusion was assessed both with MR and radiolabeled microspheres injected immediately before the administration of the MR contrast agent. Ultrafast MR imaging was performed using a Turbo FLASH sequence with a 180" inversion prepulse. A Gd-DTPA bolus was injected into the left atrium and T,-weighted images were acquiredwith every heart beat. Signal intensity measuredfrom the images in regions of the LAD and left circumflex (LCx) perfusion beds was plotted against time to generate signal intensity versus time curves (SI time curve). Various flow indices were derived according to the indicator dilution theory, and compared with and without volume correction due to vasodilation to the myocardial blood flow (MBF) calculatedfrom radiolabeledmicrospheres. Corre- lation of the MR and MBF data demonstrated that different transmural and regional myocardial perfusion levels can be easily visualized in the perfusion images and accurately mon- itored by the SI time curves. Detection of the impairment of myocardial perfusion improved significantly after administra- tion of DIP. The inverse mean transit time calculated from the SI time curve was found to yield a linear correlation to abso- lute MBF derived from the microsphere data. These results suggest that with intracardiac injections of exogenous con- trast agent, myocardial perfusion can be assessed parametri- cally with first pass contrast enhanced ultrafast MRI. Key words: ischemia; contrast; cardiac; MR. INTRODUCTION Magnetic resonance imaging of the heart has become an increasingly important diagnostic tool, primarily for the MRM 29485-497 (1993) From the University of Minnesota Medical School (J.Z., X.Y., G.P., R.J.B., K.U., H.M.), the Center for Magnetic Resonance Research (J.Z., J.E., X.Y., H.M., K.U.), Minneapolis, Minnesota, Siemens Medical Engineering Group (N.W., C.S., H.L.), the University of Erlangen, II. Medical Clinic (N.W., C.S., H.L.), Cardiology, Erlangen, Germany. Address correspondence to: Norbert Wilke, M.D. or K h i l Ugurbil, Ph.D., University of Minnesota, Center for Magnetic Resonance Research Medical School, 385 East River Road, Minneapolis, Minnesota 55455. Present address for NW: Center for Magnetic Resonance Research, Uni- versity of Minnesota. Received December 17, 1991; revised September 11,1992; accepted Sep- tember 11, 1992. This work was supported by NIH grants HL33600 and HL32427. Copyright 0 1993 by Williams 8 Wilkins All rights of reproduction in any form reserved. 0740-31 94/93 $3.00 qualitative assessment of cardiac topography and motion (1). MRI, however, is currently not used routinely for evaluating coronary artery disease (CAD), which is the most prevalent pathophysiological condition encoun- tered in industrialized countries. At the present time, the method of choice in diagnosis of CAD is coronary arteri- ography. Despite the acknowledged pivotal role of this method in the diagnosis of CAD, however, the functional significance of an arteriographic lesion often cannot be determined from arteriograms alone because of the im- precise relationship between coronary luminal narrow- ing and myocardial perfusion (2). The current MRI techniques are insufficient for a com- plete evaluation of CAD and its consequences on the cardiac muscle. Such a comprehensive evaluation would require the ability to detect coronary stenosis that is not severe enough to result in wall motion abnormality under resting conditions but which will induce hypoperfusion upon exertion or other stress. .This type of information can be obtained from ultrafast MR imaging which has the potential to perform Gd-DTPA inflow studies in the sub- second range using a contrast agent as an indicator for analysis of regional myocardial perfusion (3-6). We have already demonstrated that first pass contrast- enhanced myocardial perfusion imaging using ultrafast MRI is possible in combination with a pharmacological stress test in patients with CAD and that hypoperfused myocardium due to coronary stenosis can be detected (7). The present study, using a closed chest canine model, was designed to quantitatively evaluate the sensitivity and accuracy of the method for characterizing regional perfusion perturbations induced by predetermined levels of coronary stenosis, ranging from mild narrowing to to- tal occlusion under basal conditions, and during hyper- emia induced by dipyridamole (DIP). METHODS Magnetic Resonance Imaging Technique A Turbo-FLASH sequence (8) (TR = 6.5 ms; TE = 3 ms; Flip angle = 9O was installed on a 1.5 T MAGNETOM SP (Siemens AG, Erlangen, Germany). The total time for im- age acquisition was 585 ms; although this is rather long compared to the heart cycle duration, motion appears frozen because the signal intensities of the image are primarily determined by the low order terms in k-space. The sequence consisted of an inversion pulse, followed by a delay, T, and subsequent acquisition of a Turbo FLASH image. TI-weighted contrast was obtained by the inversion preparation pulse and the subsequent delay. 485

Welcome message from author
This document is posted to help you gain knowledge. Please leave a comment to let me know what you think about it! Share it to your friends and learn new things together.
Transcript
Contrast-Enhanced First Pass Myocardial Perfusion Imaging: Correlation Between Myocardial Blood Flow in Dogs at Rest and During Hyperemia N. Wilke, C. Simm, J. Zhang, J. Ellermann, X. Ya, H. Merkle, G. Path, H. Liidemann, R. J. Bache, K. Ugurbil
The sensitivity of contrastenhanced MR first pass perfusion imaging in detection and quantification of hypoperfused my- ocardium was evaluated using an instrumented, closed-chest dog model where graded regional hypoperfusion was induced by applying predetermined levels of stenosis to the left ante- rior descending artery (LAD). All measurements were per- formed at rest and under stress induced by dipyridamole (DIP). Myocardial perfusion was assessed both with MR and radiolabeled microspheres injected immediately before the administration of the MR contrast agent. Ultrafast MR imaging was performed using a Turbo FLASH sequence with a 180" inversion prepulse. A Gd-DTPA bolus was injected into the left atrium and T,-weighted images were acquired with every heart beat. Signal intensity measured from the images in regions of the LAD and left circumflex (LCx) perfusion beds was plotted against time to generate signal intensity versus time curves (SI time curve). Various flow indices were derived according to the indicator dilution theory, and compared with and without volume correction due to vasodilation to the myocardial blood flow (MBF) calculated from radiolabeled microspheres. Corre- lation of the MR and MBF data demonstrated that different transmural and regional myocardial perfusion levels can be easily visualized in the perfusion images and accurately mon- itored by the SI time curves. Detection of the impairment of myocardial perfusion improved significantly after administra- tion of DIP. The inverse mean transit time calculated from the SI time curve was found to yield a linear correlation to abso- lute MBF derived from the microsphere data. These results suggest that with intracardiac injections of exogenous con- trast agent, myocardial perfusion can be assessed parametri- cally with first pass contrast enhanced ultrafast MRI. Key words: ischemia; contrast; cardiac; MR.
INTRODUCTION
Magnetic resonance imaging of the heart has become an increasingly important diagnostic tool, primarily for the
MRM 29485-497 (1993) From the University of Minnesota Medical School (J.Z., X.Y., G.P., R.J.B., K.U., H.M.), the Center for Magnetic Resonance Research (J.Z., J.E., X.Y., H.M., K.U.), Minneapolis, Minnesota, Siemens Medical Engineering Group (N.W., C.S., H.L.), the University of Erlangen, II. Medical Clinic (N.W., C.S., H.L.), Cardiology, Erlangen, Germany. Address correspondence to: Norbert Wilke, M.D. or K h i l Ugurbil, Ph.D., University of Minnesota, Center for Magnetic Resonance Research Medical School, 385 East River Road, Minneapolis, Minnesota 55455. Present address for NW: Center for Magnetic Resonance Research, Uni- versity of Minnesota. Received December 17, 1991; revised September 11,1992; accepted Sep- tember 11, 1992. This work was supported by NIH grants HL33600 and HL32427.
Copyright 0 1993 by Williams 8 Wilkins All rights of reproduction in any form reserved.
0740-31 94/93 $3.00
qualitative assessment of cardiac topography and motion (1). MRI, however, is currently not used routinely for evaluating coronary artery disease (CAD), which is the most prevalent pathophysiological condition encoun- tered in industrialized countries. At the present time, the method of choice in diagnosis of CAD is coronary arteri- ography. Despite the acknowledged pivotal role of this method in the diagnosis of CAD, however, the functional significance of an arteriographic lesion often cannot be determined from arteriograms alone because of the im- precise relationship between coronary luminal narrow- ing and myocardial perfusion (2).
The current MRI techniques are insufficient for a com- plete evaluation of CAD and its consequences on the cardiac muscle. Such a comprehensive evaluation would require the ability to detect coronary stenosis that is not severe enough to result in wall motion abnormality under resting conditions but which will induce hypoperfusion upon exertion or other stress. .This type of information can be obtained from ultrafast MR imaging which has the potential to perform Gd-DTPA inflow studies in the sub- second range using a contrast agent as an indicator for analysis of regional myocardial perfusion (3-6).
We have already demonstrated that first pass contrast- enhanced myocardial perfusion imaging using ultrafast MRI is possible in combination with a pharmacological stress test in patients with CAD and that hypoperfused myocardium due to coronary stenosis can be detected (7). The present study, using a closed chest canine model, was designed to quantitatively evaluate the sensitivity and accuracy of the method for characterizing regional perfusion perturbations induced by predetermined levels of coronary stenosis, ranging from mild narrowing to to- tal occlusion under basal conditions, and during hyper- emia induced by dipyridamole (DIP).
METHODS Magnetic Resonance Imaging Technique
A Turbo-FLASH sequence (8) (TR = 6.5 ms; TE = 3 ms; Flip angle = 9 O was installed on a 1.5 T MAGNETOM SP (Siemens AG, Erlangen, Germany). The total time for im- age acquisition was 585 ms; although this is rather long compared to the heart cycle duration, motion appears frozen because the signal intensities of the image are primarily determined by the low order terms in k-space. The sequence consisted of an inversion pulse, followed by a delay, T, and subsequent acquisition of a Turbo FLASH image. TI-weighted contrast was obtained by the inversion preparation pulse and the subsequent delay.
485
486 Wilke et al.
Image acquisition was triggered from the left ventricular pressure trace that was obtained through the implanted left ventricular catheter (see section below on the animal model). Systolic images in the short axis view (Matrix = 90 (phase encode) x 128 (read-out), Voxel size = 1.8 X 2.7 X 15 mm3) were acquired with every heart beat with- out trigger delay. A Helmholtz coil with an 18-cm diam- eter was employed (Siemens AG, Erlangen, Germany]. With the post-inversion pulse delay time 7 of 100 ms, the signal from myocardium and blood was nulled and pro- vided maximal sensitivity to the Gd-DTPA induced TI- reduction.
Ultrafast Turbo FLASH imaging does not operate in steady state; however, the spin system recovers between image data acquisition. Cardiac motion appears frozen since the image impression is primarily determined by the central Fourier lines.
Animal Model
The animal model used was a closed-chest, instrumented canine model. Three adult mongrel dogs weighing 20-25 kg were anesthetized using sodium pentobarbital (30-35 mg/kg intravenously), intubated, and ventilated with supplemental oxygen via a respirator. The left femoral artery was isolated, and a heparin-filled polyvinyl chlo- ride catheter (3.0-mm o.d.1 was inserted and advanced into the ascending aorta. -A thoracotomy was performed in the left fourth intercostal space. The pericardium was opened, and the heart was suspended in the pericardial cradle. A heparin-filled catheter was introduced into the left ventricular cavity. A similar catheter was placed into the left atrium through the atrial appendage. A 1.5- to 2.0-cm segment of the left anterior descending artery (LAD] proximal to the first major epicardial left ventrical (LV) branch was dissected free, and a hydraulic occluder constructed of polyvinyl chloride tubing (2.7-mm o.d.1 was placed around the artery. A silicone elastomer cath- eter (0.3-mm i.d.) was placed within the LAD distal to the occluder (9). The instrumentation leads were external- ized through the chest wall, the pericardium and chest were closed and the animals were allowed to recover for 5 days.
On the day of the study, animals were anesthetized with sodium pentobarbital (30-35 mg/kg intravenously followed by 4 mg/kg/h continuous infusion). Aortic, LV, and mean LAD intracoronary pressures were monitored continuously during the study using a Spectramed pres- sure transducer positioned at the midchest level. Heart rate was maintained at 60 to 75 beats/min by intravenous administration of propranolol and Xylazine (RompunB]. Dipyridamole (PersantinB) when used was administered intravenously (0.8 mg/kg intravenously) for a period of 2 min to create maximum coronary dilation; a bolus injec- tion of Gd-DTPA (0.05 mmol/kg) into the left atrium was performed about 2 to 4 min later during the maximum dilated state.
Myocardial Blood-Flow Measurements
Distribution of blood flow across the wall of LV was mea-
than one blood flow measurement was performed in the same animal using different types of radioactively la- beled microspheres, as is standard practice; specifically, we employed microspheres tagged with radioactive iso- topes of I, Sr, Cr, Nb, Ce, and Sc (i.e., lz5I, 85Sr, %r, 95Nb, 14'Ce, and 46Sc). Typically, not more than four different injections were performed in each animal. For each mea- surement, approximately 3 x lo6 microspheres were in- jected into the left atrial catheter which was then flushed with 10 ml normal saline solution. Due to the sensitivity of the radioisotopic method, the number of microspheres injected is very small and repetitive administration can be performed on the same heart, as is done routinely, without inducing ischemia or any other deleterious con- sequences, as has been previously demonstrated for eight sequential injections (111. After completion of the study, the heart was removed and fixed in 10% buffered forma- lin. Subsequently, the heart was sectioned into four trans- verse rings from base to apex, such that a myocardial ring 1.5 cm in thickness contained the slice previously used for the MR perfusion study. The left ventricular wall in each ring was cut into six sections (illustrated by the dashed lines in Fig. 1) and each section was then divided into three transmural layers of equal thickness for trans- mural determination of blood flow. Radioactivity in each tissue sample was counted specifically for all the iso- topes that were injected to that heart.
Radioactivity in myocardial and blood reference spec- imens was determined using a gamma spectrometer (model 5912, Packard Instrument Company, Downers Grove, IL]. Blood flows were expressed as ml/min/g wet weight.
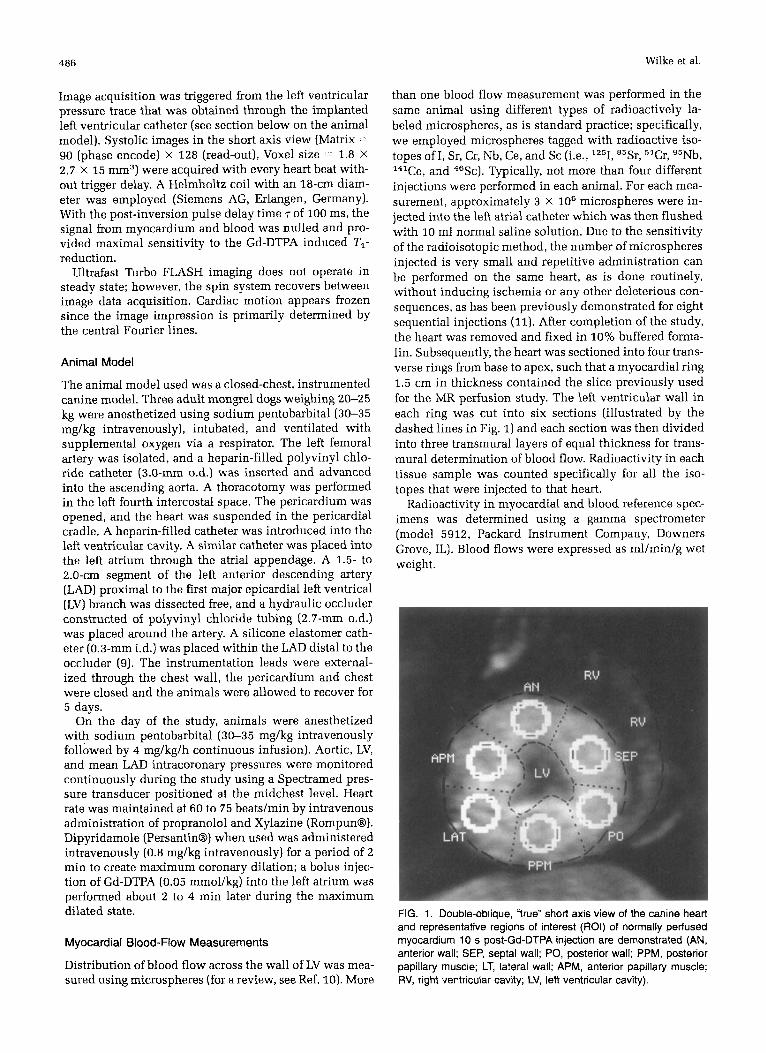
FIG. 1. Double-oblique, "true" short axis view of the canine heart and representative regions of interest (ROI) of normally petfused myocardium 10 s post-Gd-DTPA injection are demonstrated (AN, anterior wall; SEP, septa1 wall; PO, posterior wall; PPM, posterior papillary muscle; LT, lateral wall; APM, anterior papillary muscle;
sured using microspheres (for a review, see Ref. 10). More RV, right ventricular cavity; LV, left ventricular cavity).
Con trast-Enhanced First Pass Myocardial Perfusion Imaging 487
MR Contrast Agent
The paramagnetic compound Gadolinium diethylenetri- amine pentaacetic acid (Gd-DTPA) decreases TI and T2 relaxation time. We used a heavily TI-weighted Turbo FLASH sequence where the signal changes due to T2* effects are minimized. The localization and elimination of Gd-DTPA are similar to that of iodinated x-ray contrast agent (12). Like x-ray contrast agent used in densitomet- ric techniques, Gd-DTPA was used as an indicator for MR first pass perfusion imaging. Gd-DTPA was administered as a bolus using a dose of 0.05 mmol/kg for each mea- surement of perfusion through the heart; for repeated measurements on the same animal, 60-min time intervals were allowed between consecutive injections.
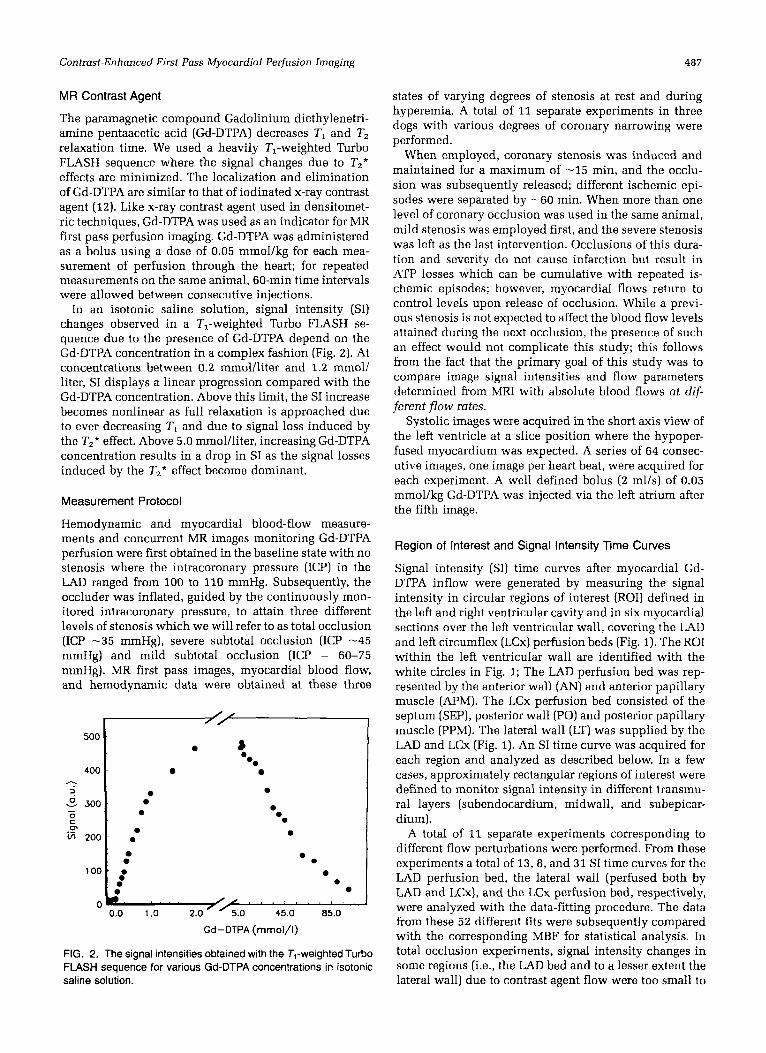
In an isotonic saline solution, signal intensity (SI) changes observed in a TI-weighted Turbo FLASH se- quence due to the presence of Gd-DTPA depend on the Gd-DTPA concentration in a complex fashion (Fig. 2). At concentrations between 0.2 mmol/liter and 1.2 mmol/ liter, SI displays a linear progression compared with the Gd-DTPA concentration. Above this limit, the SI increase becomes nonlinear as full relaxation is approached due to ever decreasing T I and due to signal loss induced by the T,* effect. Above 5.0 mmol/liter, increasing Gd-DTPA concentration results in a drop in SI as the signal losses induced by the T2* effect become dominant.
Measurement Protocol
Hemodynamic and myocardial blood-flow measure- ments and concurrent MR images monitoring Gd-DTPA perfusion were first obtained in the baseline state with no stenosis where the intracoronary pressure (ICP) in the LAD ranged from 100 to 110 mmHg. Subsequently, the occluder was inflated, guided by the continuously mon- itored intracoronary pressure, to attain three different levels of stenosis which we will refer to as total occlusion (ICP -35 mmHg), severe subtotal occlusion (ICP -45 mmHg) and mild subtotal occlusion (ICP = 60-75 mmHg). MR first pass images, myocardial blood flow, and hernodynamic data were obtained at these three
500
400 h
2 - 300 - 0 C 0,
5 200
100
C
8
0
0
:
0
0
1.0 1 .o 2.0 /<.O 45.0 85.0
Gd-DTPA (mmol/l)
FIG. 2. The signal intensities obtained with the T,-weighted Turbo FLASH sequence for various Gd-DTPA concentrations in isotonic saline solution.
states of varying degrees of stenosis at rest and during hyperemia. A total of 11 separate experiments in three dogs with various degrees of coronary narrowing were performed.
When employed, coronary stenosis was induced and maintained for a maximum of -15 min, and the occlu- sion was subsequently released; different ischemic epi- sodes were separated by -60 min. When more than one level of coronary occlusion was used in the same animal, mild stenosis was employed first, and the severe stenosis was left as the last intervention. Occlusions of this dura- tion and severity do not cause infarction but result in ATP losses which can be cumulative with repeated is- chemic episodes; however, myocardial flows return to control levels upon release of occlusion. While a previ- ous stenosis is not expected to affect the blood flow levels attained during the next occlusion, the presence of such an effect would not complicate this study; this follows from the fact that the primary goal of this study was to compare image signal intensities and flow parameters determined from MRI with absolute blood flows at dif- ferent flow rates.
Systolic images were acquired in the short axis view of the left ventricle at a slice position where the hypoper- fused myocardium was expected. A series of 64 consec- utive images, one image per heart beat, were acquired for each experiment. A well defined bolus (2 ml/s) of 0.05 mrnol/kg Gd-DTPA was injected via the left atrium after the fifth image.
Region of Interest and Signal Intensity Time Curves
Signal intensity (SI) time curves after myocardial Gd- DTPA inflow were generated by measuring the signal intensity in circular regions of interest (ROI) defined in the left and right ventricular cavity and in six myocardial sections over the left ventricular wall, covering the LAD and left circumflex (LCx) perfusion beds (Fig. 1). The ROI within the left ventricular wall are identified with the white circles in Fig. 1; The LAD perfusion bed was rep- resented by the anterior wall (AN) and anterior papillary muscle (APM). The LCx perfusion bed consisted of the septum (SEP), posterior wall (PO) and posterior papillary muscle (PPM). The lateral wall (LT) was supplied by the LAD and LCx (Fig. 1). An SI time curve was acquired for each region and analyzed as described below. In a few cases, approximately rectangular regions of interest were defined to monitor signal intensity in different transmu- ral layers (subendocardium, midwall, and subepicar- dium).
A total of 11 separate experiments corresponding to different flow perturbations were performed. From these experiments a total of 13,8, and 31 SI time curves for the LAD perfusion bed, the lateral wall (perfused both by LAD and LCx), and the LCx perfusion bed, respectively, were analyzed with the data-fitting procedure. The data from these 52 different fits were subsequently compared with the corresponding MBF for statistical analysis. In total occlusion experiments, signal intensity changes in some regions (i.e., the LAD bed and to a lesser extent the lateral wall) due to contrast agent flow were too small to
488 Wilke et al.
permit a quantitative analysis. Therefore, fewer measure- ments from these regions compared to the regions located over the LCx bed were used in the parametric analysis of the MRI data and the statistical comparison with micro- sphere blood flow data.
Analysis of SI Time Curves
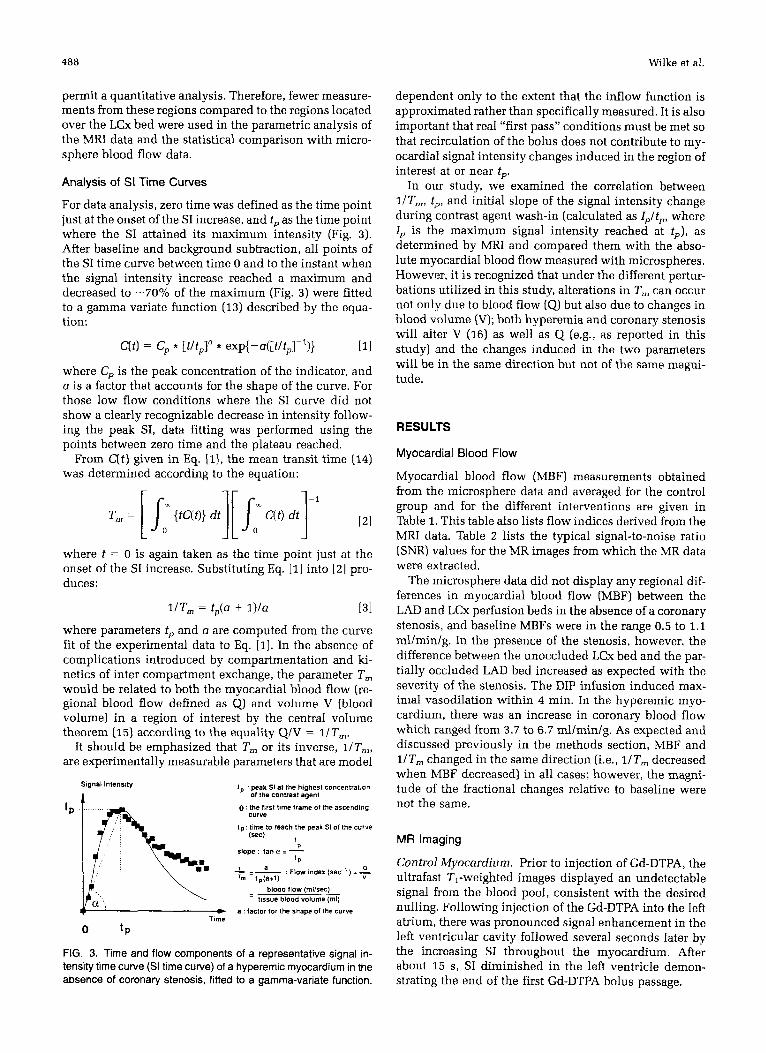
For data analysis, zero time was defined as the time point just at the onset of the SI increase, and tp as the time point where the SI attained its maximum intensity (Fig. 3). After baseline and background subtraction, all points of the SI time curve between time 0 and to the instant when the signal intensity increase reached a maximum and decreased to -70% of the maximum (Fig. 3) were fitted to a gamma variate function (13) described by the equa- tion:
where Cp is the peak concentration of the indicator, and a is a factor that accounts for the shape of the curve. For those low flow conditions where the SI curve did not show a clearly recognizable decrease in intensity follow- ing the peak SI, data fitting was performed using the points between zero time and the plateau reached.
From C(t) given in Eq. [l], the mean transit time (14) was determined according to the equation:
where t = 0 is again taken as the time point just at the onset of the SI increase. Substituting Eq. [I] into [2] pro- duces:
l/Tm = tP(O + l) /a [31
where parameters tp and a are computed from the curve fit of the experimental data to Eq. [I]. In the absence of complications introduced by compartmentation and ki- netics of inter compartment exchange, the parameter T, would be related to both the myocardial blood flow (re- gional blood flow defined as Q1 and volume V (blood volume) in a region of interest by the central volume theorem (15) according to the equality Q/V = l/T,.
It should be emphasized that T, or its inverse, l / T m , are experimentally measurable parameters that are model
Signal lnlensily I p peak SI at the highest concentration of the contrast agent
0 the ftrst time frame of the ascending curve
t p time to reach the peak SI of the curve
slope tan a = 1 lsec) I
f P
blood ilow (mllsec) tissue blood volume (ml)
+ Time
a : factor for the shaoe of !he curve
0 t P
FIG. 3. Time and flow components of a representative signal in- tensity time curve (SI time curve) of a hyperemic myocardium in the absence of coronary stenosis, fitted to a gamma-variate function.
dependent only to the extent that the inflow function is approximated rather than specifically measured. It is also important that real "first pass" conditions must be met so that recirculation of the bolus does not contribute to my- ocardial signal intensity changes induced in the region of interest at or near tp.
In our study, we examined the correlation between IIT,, tp, and initial slope of the signal intensity change during contrast agent wash-in (calculated as Ip l tp , where 1, is the maximum signal intensity reached at t p ) , as determined by MRI and compared them with the abso- lute myocardial blood flow measured with microspheres. However, it is recognized that under the different pertur- bations utilized in this study, alterations in T, can occur not only due to blood flow (Q1 but also due to changes in blood volume (V); both hyperemia and coronary stenosis will alter V (16) as well as Q (e.g., as reported in this study) and the changes induced in the two parameters will be in the same direction but not of the same magni- tude.
RESULTS
Myocardial Blood Flow
Myocardial blood flow (MBF) measurements obtained from the microsphere data and averaged for the control group and for the different interventions are given in Table 1. This table also lists flow indices derived from the MRI data. Table 2 lists the typical signal-to-noise ratio (SNR) values for the MR images from which the MR data were extracted.
The microsphere data did not display any regional dif- ferences in myocardial blood flow (MBF) between the LAD and LCx perfusion beds in the absence of a coronary stenosis, and baseline MBFs were in the range 0.5 to 1.1 ml/min/g. In the presence of the stenosis, however, the difference between the unoccluded LCx bed and the par- tially occluded LAD bed increased as expected with the severity of the stenosis. The DIP infusion induced max- imal vasodilation within 4 min. In the hyperemic myo- cardium, there was an increase in coronary blood flow which ranged from 3.7 to 6.7 mllminlg. As expected and discussed previously in the methods section, MBF and 1/T, changed in the same direction (i.e., l/Tm decreased when MBF decreased) in all cases; however, the magni- tude of the fractional changes relative to baseline were not the same.
MR Imaging
Control Myocardium. Prior to injection of Gd-DTPA, the ultrafast TI-weighted images displayed an undetectable signal from the blood pool, consistent with the desired nulling. Following injection of the Gd-DTPA into the left atrium, there was pronounced signal enhancement in the left ventricular cavity followed several seconds later by the increasing SI throughout the myocardium. After about 15 s, SI diminished in the left ventricle demon- strating the end of the first Gd-DTPA bolus passage.
Contrast-Enhanced First Pass Myocardial Perfusion Imaging 489
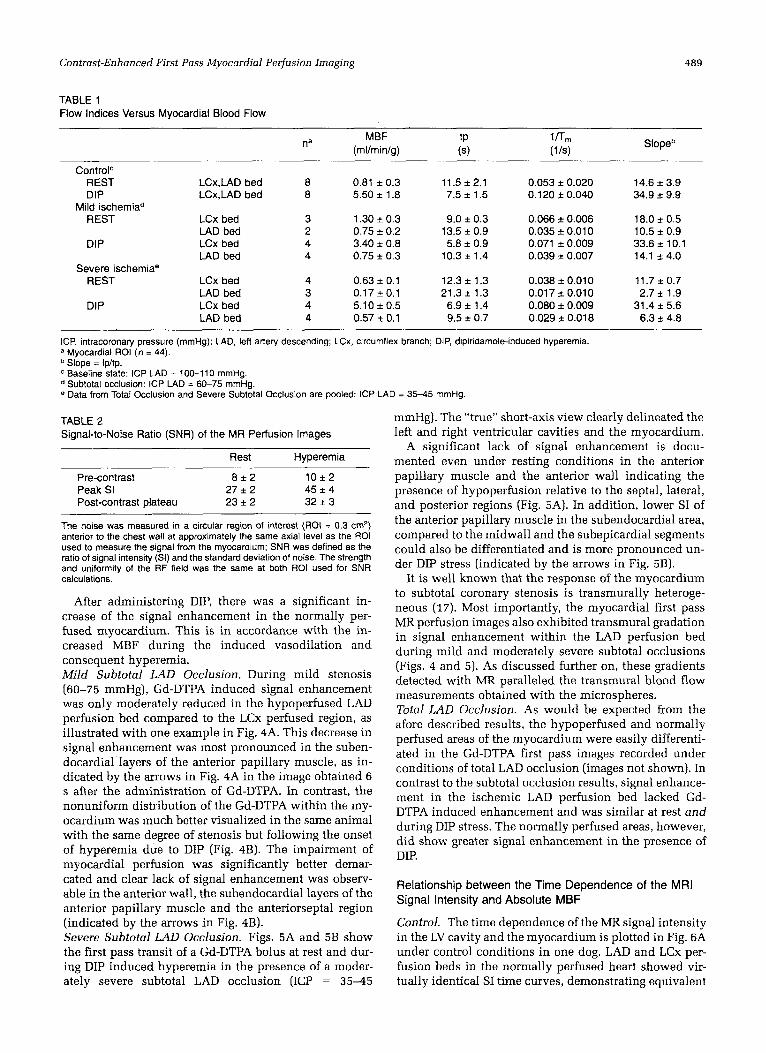
TABLE 1 Flow Indices Versus Myocardial Blood Flow
MBF (ml/min/g) na Slopeb
ControlC REST DIP
REST
DIP
Mild ischemiad
Severe ischemia* REST
DIP
LCx,LAD bed LCx,LAD bed
LCx bed LAD bed LCx bed LAD bed
LCx bed LAD bed LCx bed LAD bed
8 8
3 2 4 4
4 3 4 4
0.81 0.3 5.50 i 1.8
1.30 i 0.3 0.75 i 0.2 3.40 f 0.8 0.75 i 0.3
0.63 i 0.1 0.17 i 0.1 5.10 i 0.5 0.57 i 0.1
11.5 f 2.1 7.5 i 1.5
9.0 i 0.3 13.5 r 0.9 5.8 i 0.9
10.3k1.4
12.3 i 1.3 21.3 i 1.3 6.9 i 1.4 9.5 f 0.7
0.053 k 0.020 0.120 i 0.040
0.066 i 0.006 0.035 r 0.010 0.071 i 0.009 0.039 f 0.007
0.038 i 0.010 0.017 f 0.010 0.080 i 0.009 0.029 f 0.01 8
14.6 * 3.9 34.9 * 9.9
18.0 * 0.5 10.5 i 0.9 33.6 * 10.1 14.1 5 4.0
11.7 * 0.7 2.7 f 1.9
31.4 f 5.6 6.3 i 4.8
ICP, intracoronary pressure (mmHg); LAD, lefl artery descending; LCx, circumflex branch; DIP, dipiridamole-induced hyperemia. a Myocardial ROI (n = 44).
Slope = Ip/tp. Baseline state: ICP LAD = 100-110 mmHg. Subtotal occlusion: ICP LAD = 60-75 mmHg. Data from Total Occlusion and Severe Subtotal Occlusion are pooled: ICP LAD = 35-45 mmHg.
TABLE 2 Signal-to-Noise Ratio (SNR) of the MR Perfusion Images
Rest Hyperemia
Pre-contrast 8 i 2 10+2 Peak SI 27 i 2 45 i 4 Post-contrast plateau 23 + 2 32 k 3
The noise was measured in a circular region of interest (ROI = 0 3 cm2) anterior to the chest wall at approximately the same axial level as the ROI used to measure the signal from the myocardium, SNR was defined as the ratio of signal intensity (SI) and the standard deviation of noise The strength and uniformity of the RF field was the same at both ROI used for SNR calculations
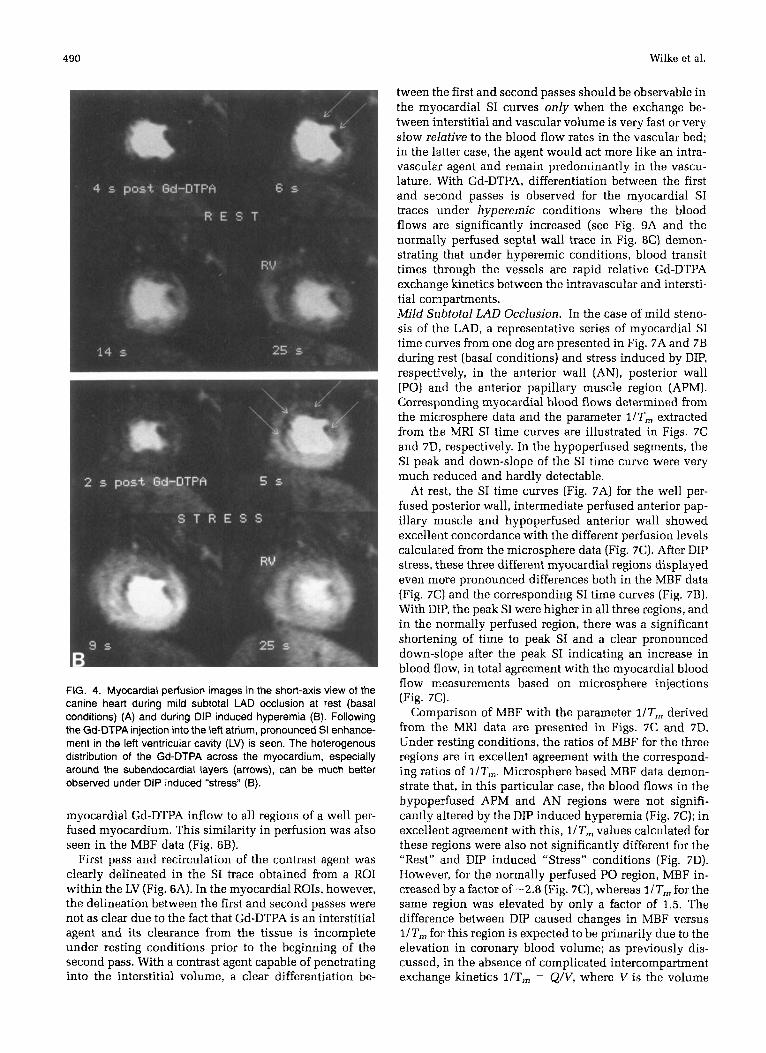
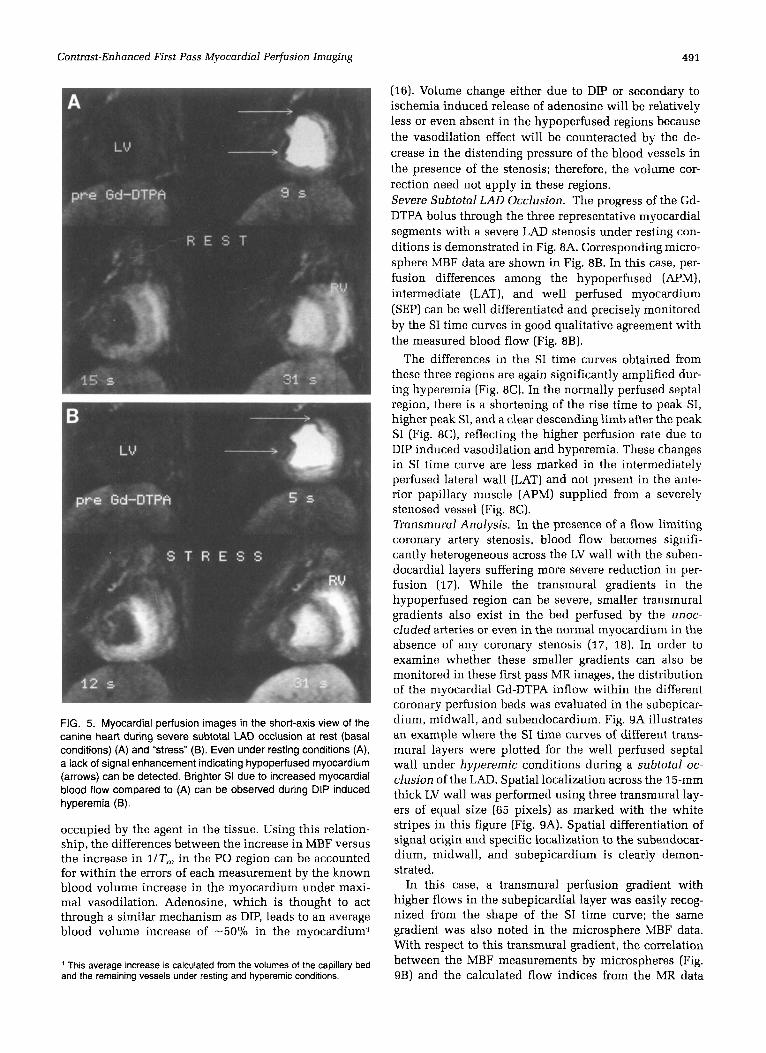
After administering DIP, there was a significant in- crease of the signal enhancement in the normally per- fused myocardium. This is in accordance with the in- creased MBF during the induced vasodilation and consequent hyperemia. Mild Subtotal LAD Occlusion, During mild stenosis [ 60-75 mmHg), Gd-DTPA induced signal enhancement was only moderately reduced in the hypoperfused LAD perfusion bed compared to the LCx perfused region, as illustrated with one example in Fig. 4A. This decrease in signal enhancement was most pronounced in the suben- docardial layers of the anterior papillary muscle, as in- dicated by the arrows in Fig. 4A in the image obtained 6 s after the administration of Gd-DTPA. In contrast, the nonuniform distribution of the Gd-DTPA within the my- ocardium was much better visualized in the same animal with the same degree of stenosis but following the onset of hyperemia due to DIP (Fig. 4B). The impairment of myocardial perfusion was significantly better demar- cated and clear lack of signal enhancement was observ- able in the anterior wall, the subendocardial layers of the anterior papillary muscle and the anteriorseptal region (indicated by the arrows in Fig. 4B). Severe Subtotal LAD Occlusion. Figs. 5A and 5B show the first pass transit of a Gd-DTPA bolus at rest and dur- ing DIP induced hyperemia in the presence of a moder- ately severe subtotal LAD occlusion (ICP = 35-45
mmHg). The “true” short-axis view clearly delineated the left and right ventricular cavities and the myocardium.
A significant lack of signal enhancement is docu- mented even under resting conditions in the anterior papillary muscle and the anterior wall indicating the presence of hypoperfusion relative to the septal, lateral, and posterior regions (Fig. 5A). In addition, lower SI of the anterior papillary muscle in the subendocardial area, compared to the midwall and the subepicardial segments could also be differentiated and is more pronounced un- der DIP stress (indicated by the arrows in Fig. 5B).
It is well known that the response of the myocardium to subtotal coronary stenosis is transmurally heteroge- neous (17). Most importantly, the myocardial first pass MR perfusion images also exhibited transmural gradation in signal enhancement within the LAD perfusion bed during mild and moderately severe subtotal occlusions (Figs. 4 and 5). As discussed further on, these gradients detected with MR paralleled the transmural blood flow measurements obtained with the microspheres. Total LAD Occlusion. As would be expected from the afore described results, the hypoperfused and normally perfused areas of the myocardium were easily differenti- ated in the Gd-DTPA first pass images recorded under conditions of total LAD occlusion (images not shown). In contrast to the subtotal occlusion results, signal enhance- ment in the ischemic LAD perfusion bed lacked Gd- DTPA induced enhancement and was similar at rest and during DIP stress. The normally perfused areas, however, did show greater signal enhancement in the presence of DIP.
Relationship between the Time Dependence of the MRI Signal Intensity and Absolute MBF
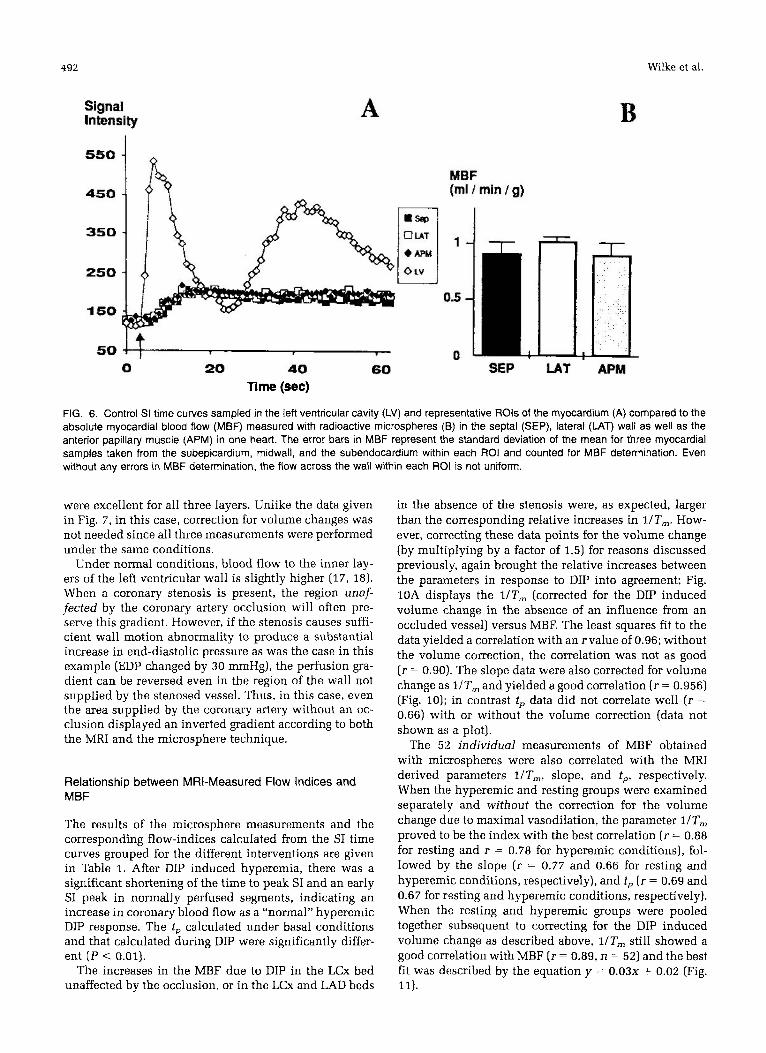
Control. The time dependence of the MR signal intensity in the LV cavity and the myocardium is plotted in Fig. 6A under control conditions in one dog. LAD and LCx per- fusion beds in the normally perfused heart showed vir- tually identical SI time curves, demonstrating equivalent
490 Wilke et al.
tween the first and second passes should be observable in the myocardial SI curves only when the exchange be- tween interstitial and vascular volume is very fast or very slow relative to the blood flow rates in the vascular bed; in the latter case, the agent would act more like an intra- vascular agent and remain predominantly in the vascu- lature. With Gd-DTPA, differentiation between the first and second passes is observed for the myocardial SI traces under hyperemic conditions where the blood flows are significantly increased (see Fig. 9A and the normally perfused septa1 wall trace in Fig. 8C) demon- strating that under hyperemic conditions, blood transit times through the vessels are rapid relative Gd-DTPA exchange kinetics between the intravascular and intersti- tial compartments. Mild Subtotal LAD Occlusion. In the case of mild steno- sis of the LAD, a representative series of myocardial SI time curves from one dog are presented in Fig. 7A and 7B during rest (basal conditions) and stress induced by DIP, respectively, in the anterior wall (AN), posterior wall (PO) and the anterior papillary muscle region (APM). Corresponding myocardial blood flows determined from the microsphere data and the parameter l /Tm extracted from the MRI SI time curves are illustrated in Figs. 7C and 7D, respectively. In the hypoperfused segments, the SI peak and down-slope of the SI time curve were very much reduced and hardly detectable.
At rest, the SI time curves (Fig. 7A) for the well per- fused posterior wall, intermediate perfused anterior pap- illary muscle and hypoperfused anterior wall showed excellent concordance with the different perfusion levels calculated from the microsphere data (Fig. 7C). After DIP stress, these three different myocardial regions displayed even more pronounced differences both in the MBF data (Fig. 7C) and the corresponding SI time curves (Fig. 7B). With DIP, the peak SI were higher in all three regions, and in the normally perfused region, there was a significant shortening of time to peak SI and a clear pronounced down-slope after the peak SI indicating an increase in blood flow, in total agreement with the myocardial blood flow measurements based on microsphere injections (Fig. 7C).
Comparison of MBF with the parameter TIT,,, derived from the MRI data are presented in Figs. 7C and 7D. Under resting conditions, the ratios of MBF for the three regions are in excellent agreement with the correspond- ing ratios of l/Tm. Microsphere based MBF data demon- strate that, in this particular case, the blood flows in the hypoperfused APM and AN regions were not signifi- cantly altered by the DIP induced hyperemia (Fig. 7C); in excellent agreement with this, l/Tm values calculated for these regions were also not significantly different for the “Rest” ,md DIP induced “Stress” conditions (Fig. 7D). However, for the normally perfused PO region, MBF in- creased by a factor of -2.8 (Fig. 7C), whereas l/Tm for the same region was elevated by only a factor of 1.5. The difference between DIP caused changes in MBF versus l/Tm for this region is expected to be primarily due to the elevation in coronary blood volume; as previously dis- cussed, in the absence of complicated intercompartment exchange kinetics 1/T, = Q/V, where V is the volume
FIG. 4. Myocardial perfusion images in the short-axis view of the canine heart during mild subtotal LAD occlusion at rest (basal conditions) (A) and during DIP induced hyperemia (B). Following the Gd-DTPA injection into the left atrium, pronounced SI enhance- ment in the left ventricular cavity (LV) is seen. The heterogenous distribution of the Gd-DTPA across the myocardium, especially around the subendocardial layers (arrows), can be much better observed under DIP induced “stress” (B).
myocardial Gd-DTPA inflow to all regions of a well per- fused myocardium. This similarity in perfusion was also seen in the MBF data (Fig. 6B).
First pass and recirculation of the contrast agent was clearly delineated in the SI trace obtained from a ROI within the LV (Fig. 6A). In the myocardial ROIs, however, the delineation between the first and second passes were not as clear due to the fact that Gd-DTPA is an interstitial agent and its clearance from the tissue is incomplete under resting conditions prior to the beginning of the second pass. With a contrast agent capable of penetrating into the interstitial volume, a clear differentiation be-
Contrast-Enhanced First Pass Myocardial Perfusion lmoging 491
FIG. 5. Myocardial perfusion images in the short-axis view of the canine heart during severe subtotal LAD occlusion at rest (basal conditions) (A) and "stress" (B). Even under resting conditions (A), a lack of signal enhancement indicating hypoperfused myocardium (arrows) can be detected. Brighter SI due to increased myocardial blood flow compared to (A) can be observed during DIP induced hyperemia (B).
occupied by the agent in the tissue. Using this relation- ship, the differences between the increase in MBF versus the increase in l/Tm in the PO region can be accounted for within the errors of each measurement by the known blood volume increase in the myocardium under maxi- mal vasodilation. Adenosine, which is thought to act through a similar mechanism as DIP, leads to an average blood volume increase of -50% in the myocardium1
This average increase is calculated from the volumes of the capillary bed and the remaining vessels under resting and hyperemic conditions.
(16). Volume change either due to DIP or secondary to ischemia induced release of adenosine will be relatively less or even absent in the hypoperfused regions because the vasodilation effect will be counteracted by the de- crease in the distending pressure of the blood vessels in the presence of the stenosis; therefore, the volume cor- rection need not apply in these regions. Severe Subtotal LAD Occlusion. The progress of the Gd- DTPA bolus through the three representative myocardial segments with a severe LAD stenosis under resting con- ditions js demonstrated in Fig. 8A. Corresponding micro- sphere MBF data are shown in Fig. 8B. In this case, per- fusion differences among the hypoperfused (APM), intermediate (LAT), and well perfused myocardium (SEP) can be well differentiated and precisely monitored by the SI time curves in good qualitative agreement with the measured blood flow (Fig. 8B).
The differences in the SI time curves obtained from these three regions are again significantly amplified dur- ing hyperemia (Fig. 8C). In the normally perfused septal region, there is a shortening of the rise time to peak SI, higher peak SI, and a clear descending limb after the peak SI (Fig. 8C), reflecting the higher perfusion rate due to DIP induced vasodilation and hyperemia. These changes in SI time curve are less marked in the intermediately perfused lateral wall (LAT) and not present in the ante- rior papillary muscle (APM) supplied from a severely stenosed vessel (Fig. 8C). Transmural Analysis. In the presence of a flow limiting coronary artery stenosis, blood flow becomes signifi- cantly heterogeneous across the LV wall with the suben- docardial layers suffering more severe reduction in per- fusion (17). While the transmural gradients in the hypoperfused region can be severe, smaller transmural gradients also exist in the bed perfused by the UROC-
cluded arteries or even in the normal myocardium in the absence of any coronary stenosis (17, 18). In order to examine whether these smaller gradients can also be monitored in these first pass MR images, the distribution of the myocardial Gd-DTPA inflow within the different coronary perfusion beds was evaluated in the subepicar- dium, midwall, and subendocardium. Fig. 9A illustrates an example where the SI time curves of different trans- mural layers were plotted for the well perfused septal wall under hyperemic conditions during a subtotal oc- clusion of the LAD. Spatial localization across the 15-mm thick LV wall was performed using three transmural lay- ers of equal size (65 pixels) as marked with the white stripes in this figure (Fig. 9A). Spatial differentiation of signal origin and specific localization to the subendocar- dium, midwall, and subepicardium is clearly demon- strated.
In this case, a transmural perfusion gradient with higher flows in the subepicardial layer was easily recog- nized from the shape of the SI time curve; the same gradient was also noted in the microsphere MBF data. With respect to this transmural gradient, the correlation between the MBF measurements by microspheres (Fig. 9B) and the calculated flow indices from the MR data
492
Time (sec)
Wilke et al.
FIG. 6. Control SI time curves sampled in the left ventricular cavity (LV) and representative ROls of the myocardium (A) compared to the absolute myocardial blood flow (MBF) measured with radioactive microspheres (6) in the septa1 (SEP), lateral (LAT) wall as well as the anterior papillary muscle (APM) in one heart. The error bars in MBF represent the standard deviation of the mean for three myocardial samples taken from the subepicardium, midwall, and the subendocardium within each ROI and counted for MBF determination. Even without any errors in MBF determination, the flow across the wall within each ROI is not uniform.
were excellent for all three layers. Unlike the data given in Fig. 7, in this case, correction for volume changes was not needed since all three measurements were performed under the same conditions.
Under normal conditions, blood flow to the inner lay- ers of the left ventricular wall is slightly higher (17, 18). When a coronary stenosis is present, the region unaf- fected by the coronary artery occlusion will often pre- serve this gradient. However, if the stenosis causes suffi- cient wall motion abnormality to produce a substantial increase in end-diastolic pressure as was the case in this example (EDP changed by 30 mmHg), the perfusion gra- dient can be reversed even in the region of the wall not supplied by the stenosed vessel. Thus, in this case, even the area supplied by the coronary artery without an oc- clusion displayed an inverted gradient according to both the MRI and the microsphere technique.
Relationship between MRI-Measured Flow Indices and MBF
The results of the microsphere measurements and the corresponding flow-indices calculated from the SI time curves grouped for the different interventions are given in Table 1. After DIP induced hyperemia, there was a significant shortening of the time to peak SI and an early SI peak in normally perfused segments, indicating an increase in coronary blood flow as a “normal” hyperemic DIP response. The tp calculated under basal conditions and that calculated during DIP were significantly differ- ent ( P < 0.01).
The increases in the MBF due to DIP in the LCx bed unaffected by the occlusion, or in the LCx and LAD beds
in the absence of the stenosis were, as expected, larger than the corresponding relative increases in llTm. How- ever, correcting these data points for the volume change (by multiplying by a factor of 1.5) for reasons discussed previously, again brought the relative increases between the parameters in response to DIP into agreement; Fig. 10A displays the l/Tm (corrected for the DIP induced volume change in the absence of an influence from an occluded vessel) versus MBF. The least squares fit to the data yielded a correlation with an rvalue of 0.96; without the volume correction, the correlation was not as good ( r = 0.90). The slope data were also corrected for volume change as l /Tm and yielded a good correlation ( r = 0.956) (Fig. 10); in contrast tp data did not correlate well ( r = 0.66) with or without the volume correction (data not shown as a plot).
The 52 individual measurements of MBF obtained with microspheres were also correlated with the MRI derived parameters TITm, slope, and tp , respectively. When the hyperemic and resting groups were examined separately and without the correction for the volume change due to maximal vasodilation, the parameter TIT, proved to be the index with the best correlation ( r = 0.88 for resting and r = 0.78 for hyperemic conditions), fol- lowed by the slope ( r = 0.77 and 0.66 for resting and hyperemic conditions, respectively), and tp ( r = 0.69 and 0.67 for resting and hyperemic conditions, respectively). When the resting and hyperemic groups were pooled together subsequent to correcting for the DIP induced volume change as described above, l/Tm still showed a good correlation with MBF ( r = 0.89, n = 52) and the best fit was described by the equation y = 0 . 0 3 ~ + 0.02 (Fig. 11).
Contrast-Enhanced First Pass Myocardial Perfusion Imaging 493
Signal A Signal B lnlensily lnlensily
300 T REST STRESS
4001 .I
300
200 200
.loo 100
0 10 20 30 40 0 10 20 30 40 Time (sec) Time (see)
* PO u AN -0- APM
D MBF (rnl/rnin/g) 1 f l , (1 /sec)
C
6r
4 In Rest = 0 T Stress =
0.09 r 0.06
2 0.03
0 0 PO APM AN PO APM AN
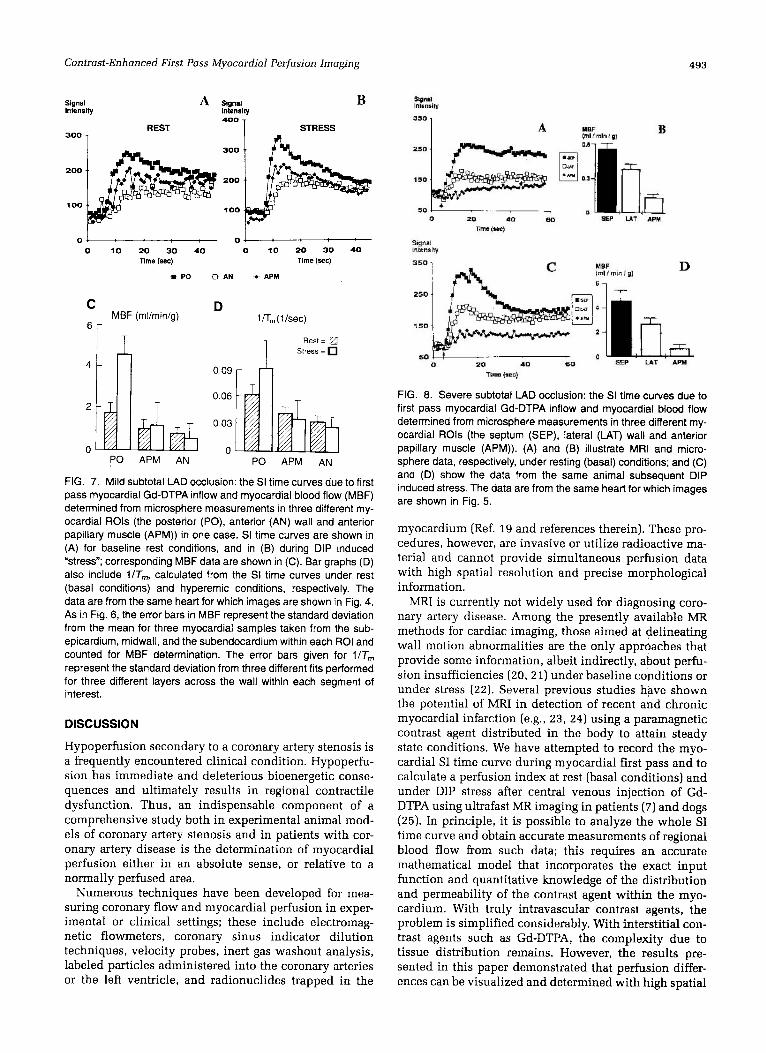
FIG. 7. Mild subtotal LAD occlusion: the SI time curves due to first pass myocardial Gd-DTPA inflow and myocardial blood flow (MBF) determined from microsphere measurements in three different my- ocardial ROls (the posterior (PO), anterior (AN) wall and anterior papillary muscle (APM)) in one case. SI time curves are shown in (A) for baseline rest conditions, and in (B) during DIP induced “stress”; corresponding MBF data are shown in (C). Bar graphs (D) also include VT,,,, calculated from the SI time curves under rest (basal conditions) and hyperemic conditions, respectively. The data are from the same heart for which images are shown in Fig. 4. A s in Fig. 6, the error bars in MBF represent the standard deviation from the mean for three myocardial samples taken from the sub- epicardium, midwall, and the subendocardium within each ROI and counted for MBF determination. The error bars given for 1/T, represent the standard deviation from three different fits performed for three different layers across the wall within each segment of interest.
DISCUSSION
Hypoperfusion secondary to a coronary artery stenosis is a frequently encountered clinical condition. Hypoperfu- sion has immediate and deleterious bioenergetic conse- quences and ultimately results in regional contractile dysfunction. Thus, an indispensable component of a comprehensive study both in experimental animal mod- els of coronary artery stenosis and in patients with cor- onary artery disease is the determination of myocardial perfusion either in an absolute sense, or relative to a normally perfused area.
Numerous techniques have been developed for mea- suring coronary flow and myocardial perfusion in exper- imental or clinical settings; these include electromag- netic flowmeters, coronary sinus indicator dilution techniques, velocity probes, inert gas washout analysis, labeled particles administered into the coronary arteries or the left ventricle, and radionuclides trapped in the
FIG. 8. Severe subtotal LAD occlusion: the SI time curves due to first pass myocardial Gd-DTPA inflow and myocardial blood flow determined from microsphere measurements in three different my- ocardial ROls (the septum (SEP), lateral (LAT) wall and anterior papillary muscle (APM)). (A) and (B) illustrate MRI and micro- sphere data, respectively, under resting (basal) conditions; and (C) and (D) show the data from the same animal subsequent DIP induced stress. The data are from the same heart for which images are shown in Fig. 5.
myocardium (Ref. 19 and references therein). These pro- cedures, however, are invasive or utilize radioactive ma- terial and cannot provide simultaneous perfusion data with high spatial resolution and precise morphological information.
MRI is currently not widely used for diagnosing coro- nary artery disease. Among the presently available MR methods for cardiac imaging, those aimed at delineating wall motion abnormalities are the only approaches that provide some information, albeit indirectly, about perfu- sion insufficiencies (20, 21) under baseline conditions or under stress (22). Several previous studies have shown the potential of MRI in detection of recent and chronic myocardial infarction (e.g., 23, 24) using a paramagnetic contrast agent distributed in the body to attain steady state conditions. We have attempted to record the myo- cardial SI time curve during myocardial first pass and to calculate a perfusion index at rest (basal conditions) and under DIP stress after central venous injection of Gd- DTPA using ultrafast MR imaging in patients (7) and dogs (25). In principle, it is possible to analyze the whole SI time curve and obtain accurate measurements of regional blood flow from such data; this requires an accurate mathematical model that incorporates the exact input function and quantitative knowledge of the distribution and permeability of the contrast agent within the myo- cardium. With truly intravascular contrast agents, the problem is simplified considerably. With interstitial con- trast agents such as Gd-DTPA, the complexity due to tissue distribution remains. However, the results pre- sented in this paper demonstrated that perfusion differ- ences can be visualized and determined with high spatial
494 Wilke et al.
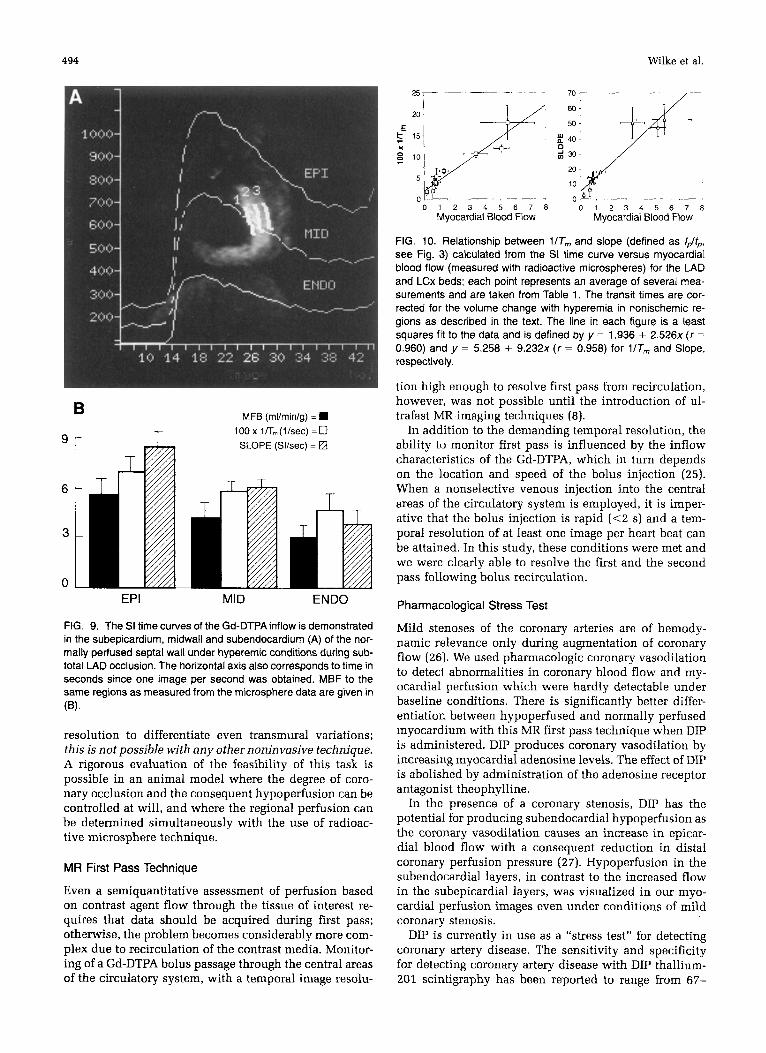
FIG. 9. The SI time curves of the Gd-DTPA inflow is demonstrated in the subepicardium. midwall and subendocardium (A) of the nor- mally perfused septa1 wall under hyperemic conditions during sub- total LAD occlusion. The horizontal axis also corresponds to time in seconds since one image per second was obtained. MBF to the same regions as measured from the microsphere data are given in (4
resolution to differentiate even transmural variations; this is not possible with any other noninvasive technique. A rigorous evaluation of the feasibility of this task is possible in an animal model where the degree of coro- nary occlusion and the consequent hypoperfusion can be controlled at will, and where the regional perfusion can be determined simultaneously with the use of radioac- tive microsphere technique.
MR First Pass Technique
Even a semiquantitative assessment of perfusion based on contrast agent flow through the tissue of interest re- quires that data should be acquired during first pass; otherwise, the problem becomes considerably more com- plex due to recirculation of the contrast media. Monitor- ing of a Gd-DTPA bolus passage through the central areas of the circulatory system, with a temporal image resolu-
0 1 2 3 4 5 6 7 8 0 1 2 3 4 5 6 7 8 Myocardial Blood Flow Myocardial Blood Flow
FIG. 10. Relationship between l lT, and slope (defined as /&, see Fig. 3) calculated from the SI time curve versus myocardial blood flow (measured with radioactive microspheres) for the LAD and LCx beds; each point represents an average of several mea- surements and are taken from Table 1. The transit times are cor- rected for the volume change with hyperemia in nonischemic re- gions as described in the text. The line in each figure is a least squares fit to the data and is defined by y = 1.936 + 2 . 5 2 6 ~ ( r =
0.960) and y = 5.258 + 9 . 2 3 2 ~ ( r = 0.958) for 1/T, and Slope, respectively.
tion high enough to resolve first pass from recirculation, however, was not possible until the introduction of ul- trafast MR imaging techniques (8).
In addition to the demanding temporal resolution, the ability to monitor first pass is influenced by the inflow characteristics of the Gd-DTPA, which in turn depends on the location and speed of the bolus injection (25). When a nonselective venous injection into the central areas of the circulatory system is employed, it is imper- ative that the bolus injection is rapid (<2 s) and a tem- poral resolution of at least one image per heart beat can be attained. In this study, these conditions were met and we were clearly able to resolve the first and the second pass following bolus recirculation.
Pharmacological Stress Test
Mild stenoses of the coronary arteries are of hemody- namic relevance only during augmentation of coronary flow (26). We used pharmacologic coronary vasodilation to detecl abnormalities in coronary blood flow and my- ocardial perfusion which were hardly detectable under baseline conditions. There is significantly better differ- entiation between hypoperfused and normally perfused myocardium with this MR first pass technique when DIP is administered. DIP produces coronary vasodilation by increasing myocardial adenosine levels. The effect of DIP is abolished by administration of the adenosine receptor antagonist theophylline.
In the presence of a coronary stenosis, DIP has the potential for producing subendocardial hypoperfusion as the coronary vasodilation causes an increase in epicar- dial blood flow with a consequent reduction in distal coronary perfusion pressure (27). Hypoperfusion in the subendocardial layers, in contrast to the increased flow in the subepicardial layers, was visualized in our myo- cardial perfusion images even under conditions of mild coronary stenosis.
DIP is currently in use as a “stress test” for detecting coronary artery disease. The sensitivity and specificity for detecting coronary artery disease with DIP thallium- 201 scintigraphy has been reported to range from 67-
Contrast-Enhanced First Pass Myocardial Perfusion Imaging 495
MBF vs. 1fTm
* / 0.20
. n.52 ,=a 89 y=003+002x ..
0.00 0 0 20 4 0 60 80
MBF (mUminlg)
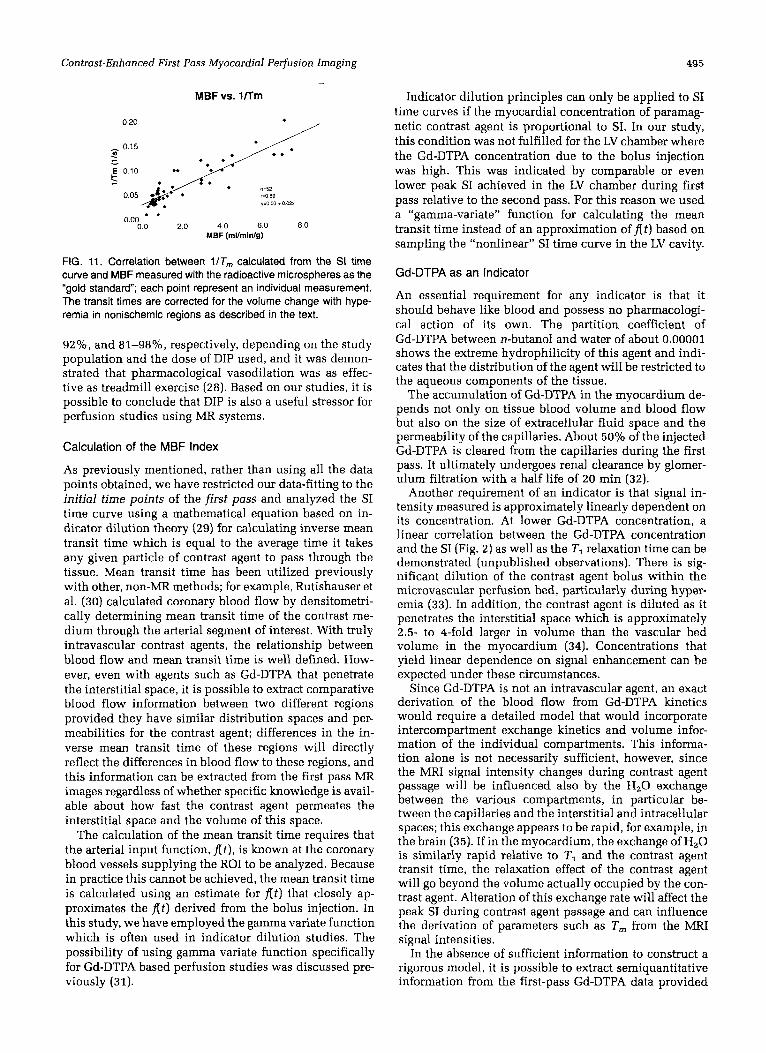
FIG. 11. Correlation between l /Tm calculated from the SI time curve and MBF measured with the radioactive microspheres as the “gold standard; each point represent an individual measurement. The transit times are corrected for the volume change with hype- remia in nonischemic regions as described in the text.
92%, and 81-98%, respectively, depending on the study population and the dose of DIP used, and it was demon- strated that pharmacological vasodilation was as effec- tive as treadmill exercise (28). Based on our studies, it is possible to conclude that DIP is also a useful stressor for perfusion studies using MR systems.
Calculation of the MBF Index
As previously mentioned, rather than using all the data points obtained, we have restricted our data-fitting to the initial time points of the first pass and analyzed the SI time curve using a mathematical equation based on in- dicator dilution theory (29) for calculating inverse mean transit time which is equal to the average time it takes any given particle of contrast agent to pass through the tissue. Mean transit time has been utilized previously with other, non-MR methods; for example, Rutishauser et al. (30) calculated coronary blood flow by densitometri- cally determining mean transit time of the contrast me- dium through the arterial segment of interest. With truly intravascular contrast agents, the relationship between blood flow and mean transit time is well defined. How- ever, even with agents such as Gd-DTPA that penetrate the interstitial space, it is possible to extract comparative blood flow information between two different regions provided they have similar distribution spaces and per- meabilities for the contrast agent; differences in the in- verse mean transit time of these regions will directly reflect the differences in blood flow to these regions, and this information can be extracted from the first pass MR images regardless of whether specific knowledge is avail- able about how fast the contrast agent permeates the interstitial space and the volume of this space.
The calculation of the mean transit time requires that the arterial input function, At), is known at the coronary blood vessels supplying the ROI to be analyzed. Because in practice this cannot be achieved, the mean transit time is calculated using an estimate for At) that closely ap- proximates the At) derived from the bolus injection. In this study, we have employed the gamma variate function which is often used in indicator dilution studies. The possibility of using gamma variate function specifically for Gd-DTPA based perfusion studies was discussed pre- viously (31).
Indicator dilution principles can only be applied to SI time curves if the myocardial concentration of paramag- netic contrast agent is proportional to SI. In our study, this condition was not fulfilled for the LV chamber where the Gd-DTPA concentration due to the bolus injection was high. This was indicated by comparable or even lower peak SI achieved in the LV chamber during first pass relative to the second pass. For this reason we used a “gamma-variate” function for calculating the mean transit time instead of an approximation of At ) based on sampling the “nonlinear” SI time curve in the LV cavity.
Gd-DTPA as an Indicator
An essential requirement for any indicator is that it should behave like blood and possess no pharmacologi- cal action of its own. The partition coefficient of Gd-DTPA between n-butanol and water of about 0.00001 shows the extreme hydrophilicity of this agent and indi- cates that the distribution of the agent will be restricted to the aqueous components of the tissue.
The accumulation of Gd-DTPA in the myocardium de- pends not only on tissue blood volume and blood flow but also on the size of extracellular fluid space and the permeability of the capillaries. About 50% of the injected Gd-DTPA is cleared from the capillaries during the first pass. It ultimately undergoes renal clearance by glomer- ulum filtration with a half life of 20 min (32).
Another requirement of an indicator is that signal in- tensity measured is approximately linearly dependent on its concentration. At lower Gd-DTPA concentration, a linear correlation between the Gd-DTPA concentration and the SI (Fig. 2) as well as the TI relaxation time can be demonstrated (unpublished observations). There is sig- nificant dilution of the contrast agent bolus within the microvascular perfusion bed, particularly during hyper- emia (33). In addition, the contrast agent is diluted as it penetrates the interstitial space which is approximately 2.5- to 4-fold larger in volume than the vascular bed volume in the myocardium (34). Concentrations that yield linear dependence on signal enhancement can be expected under these circumstances.
Since Gd-DTPA is not an intravascular agent, an exact derivation of the blood flow from Gd-DTPA kinetics would require a detailed model that would incorporate intercompartment exchange kinetics and volume infor- mation of the individual compartments. This informa- tion alone is not necessarily sufficient, however, since the MRI signal intensity changes during contrast agent passage will be influenced also by the H20 exchange between the various compartments, in particular be- tween the capillaries and the interstitial and intracellular spaces; this exchange appears to be rapid, for example, in the brain (35). If in the myocardium, the exchange of H20 is similarly rapid relative to TI and the contrast agent transit time, the relaxation effect of the contrast agent will go beyond the volume actually occupied by the con- trast agent. Alteration of this exchange rate will affect the peak SI during contrast agent passage and can influence the derivation of parameters such as T, from the MRI signal intensities.
In the absence of sufficient information to construct a rigorous model, it is possible to extract semiquantitative information from the first-pass Gd-DTPA data provided
496 Wilke et al.
only the initial time points of the first pass are consid- ered; for these points, the averaged SI within a myocar- dial ROI is expected to be determined mainly from the Gd-DTPA within the vascular bed and only partly from the interstitial space. This expectation is based on the observation that Gd-DTPA penetration is not sufficiently rapid to reach equilibrium during the first pass when myocardial flows are in excess of -0.5 ml/min/gm (36); especially during hyperemic conditions, transit times are sufficiently short for Gd-DTPA to approach the behavior of an intravascular agent. Therefore, at least in the initial time points of the first pass, when the extraction into the interstitial space is relatively small, l / T m can be ex- pected to be approximately proportional to Q/V where V will effectively include a small contribution from the interstitial space. The magnitude of this contribution to V will depend on the exchange kinetics Gd-DTPA relative to the actual blood flow rates; thus, at high flow rates, effective V will tend to approach the vascular volume because the shorter transit times will mean less penetra- tion into the interstitial space. At high flow rates induced by hyperemia, however, this effect will be counteracted by the fact that actual blood volume in the tissue will increase, leading to longer T,,, values.
Despite the ambiguities about the exact nature of V, empirically both 1/T, and “slope” displayed acceptable correlations with MBF. Within the accuracy of these mea- surements, it is unlikely that the nonlinearities present in these relationships are sufficiently large to be recognized and differentiated from the simple linear correlation, sug- gesting that at the present state of the data, more compli- cated models need not significantly improve these corre- lations. A major experimental error in these studies is the difficulty of performing both the MRI and MBF measure- ments exactly in the same ROIs. Even though detailed images were obtained to guide the postmortem section- ing of the heart for the microsphere counts, achieving exact correspondence is hampered by the dimensional changes in the heart during the fixation process; in the presence of flow heterogeneities, we believe that this becomes a primary source of error in the correlations presented between MBF and the MRI derived parame- ters. This error, which is a random error, is averaged when the data for a given state are pooled together (as in Table 1 and Fig. 10) and is more pronounced when each individual measurement is examined separately as in Fig. 11.
Based on the aforelisted observations, differentiation of the underperfused areas can be expected in patients, even though the clinical situation may differ from the animal model with respect to the administration of the bolus and consequent definition of the input function and the tissue conditions; for example, chronic ischemia in patients may lead to edema if the hypoperfusion is sufficiently severe and prolonged. Under such condi- tions, while the reduced blood flow will significantly affect T,,,. the effective volume of the contrast agent dis- tribution will probably not change significantly during the initial time points of the first pass since equilibration with the interstitial space may still not be achieved and penetration into the interstitial space may still be limited (36). In agreement with this expectation, first pass studies in patients were able to delineate areas of underperfusion successfully (7).
It is important to emphasize again that patient studies differ from the animal studies described here with re- spect to the point of injection of the contrast agent. While in these animal studies, the injections are intracardiac and hence lead to relatively sharp “input” functions, in patient studies conducted so far and most likely in the future, the injection point is more peripheral and result in a broader input function. Never-the-less, image quality in delineating hypoperfused areas in patients (7) have been similar to those reported here; furthermore, the derivation of flow indices can be improved even when injection is not intracardiac by sampling accurately the “input function” in the LV chamber, and using this true input function rather than a gamma variate function to analyse the data. The true input function can possibly be obtained using a low dose “pre”-injection so that contrast agent concentration is not too high in the chamber during the first pass.
CONCLUSIONS
The MR first pass technique using Gd-DTPA as an indi- cator is well suited to obtain myocardial perfusion im- ages and has the potential to assess relative myocardial perfusion quantitatively. This technique is sensitive to varying degrees of myocardial hypoperfusion, and corre- lates well with absolute MBF, especially at flow rates lower than -5 mllminlg. The linear correlation becomes weaker at higher rates and improves with correction due to blood volume changes. While determination of abso- lute blood flow rates accurately using this technique is still premature, it is important to note that relative flow rates within a given heart can be determined quite accu- rately. For example, the correlation between TIT,,, and MBF remains good enough to distinguish the small trans- mural perfusion heterogeneity across the wall of the left ventricle during coronary vasodilation. In addition, the high flow rates in the normally perfused muscle under hyperemic conditions provide greater contrast compared to underperfused areas effected by the stenosis and result in better visualization and demarcation of the hypoper- fused myocardium. The observations in these animal studies with respect to delineation of hypoperfused re- gions in the myocardium is in excellent agreement with our parallel studies in patients (7). At present, only one slice may be imaged with sufficient temporal and spatial resolution using the Turbo FLASH sequence. It is desir- able, if not mandatory to obtain flow information in a multislice mode for the technique to have real clinical utility. This can be accomplished using multiple “low dose” Gd-DTPA injections and perfusion can be evalu- ated in the entire heart using multiple slices along the short axis or the longitudinal axis; this has been ac- complished in our laboratory and will be reported sepa- rately. Improvements in image quality, speed, and SNR, which will be realized in the future with improved instrumentation and techniques can also significantly enhance the accuracy of the data obtained in first pass studies. Finally, true intravascular agents can eliminate the inherent complications present with an interstitial agent and permit more definitive quantitation of blood flows.
Contrast-Enhanced First Pass Myocardial Pezfusion Imaging 497
ACKNOWLEDGMENTS
The authors thank Professor K. Bachmann (11. Medical Clinic, Cardiology, University of Erlangen) for his contributions and support of this work, and Dr. T. Machnig for his participation in the experiments. We gratefully acknowledge Dr. M. Deimling, E. Miiller, and R. Backer from the Siemens Medical Engineering Group, Erlangen, for many helpful discussions.
REFERENCES 1. G. Wesbey, C. B. Higgins, P. Lanzer, D. Stark, E. Botvinick, N.
2. S. E. Nissen, J. C. Gurley, Circulation 81(4), 1431 (1990). 3. H. L. Kantor, in “MRI-Clinical Magnetic Resonance Imag-
ing” (R. R. Edelmann, J. R. Hesselink, J. Newhouse, D. J. Sartoris, Eds.), p. 745, W. B. Saunders Company, Philadel- phia, 1990.
4. D. J. Atkinson, D. Burstein, R. R. Edelmann, Radiology 174, 757 (1990).
5. W. J. Manning, D. J. Atkinson, W. Grossmann, S. Paulin, R. R. Edelmann, 7. Am. Coll. Cardiol. 19, 968 (1992).
6. N. Wilke, T. Machnig, G. Engels, A. Weikl, K. Klarner, B. Kiefer, G. Lenz, C. Simm, K. Bachmann, Electromedica 58, 102 (1990).
7. N. Wilke, G. Engels, T. Machnig, A. Weikl, K. Klarner, K. Bachmann, B. Kiefer, G. Lenz, J. Haustein, Proc. Radiol. COC. N. Am. 101, 77 (1990).
B. Schiller, Circulation 69, 523 (1984).
8. A. Haase, Magn. Reson. Med. 13, 77 (1990). 9. P. Gwirtz, J. Appl. Physiol. 60, 720 (1986). 10. E. 0. Feigel, Physiol. Rev. 63, 30 (1983). 11. R. W. Baer, E. D. Verrier, J. I. E. Hoffman, Circulation 62,
12. H. J. Weinmann, M. Laniado, W. Miitzel, Chem. Phys. Med.
13. H. K. Thompson, C. F. Stramer, R. E. Whalen, H. D. McIntosh
14. F. S. Grodins, Circ. Res. 10, 429 (1962). 15. G. N. Stewart, Am. J. Physiol. 58, 10 (1921). 16. G. J. Crystal, H. F. Downey, and F. A. Bashhour, Am. J.
17. R. J. Bache, P. A. McHale, J. C. Greenfield, Am. J. Physiol.
111-65 (1980).
NMR 16, 167 (1984).
Circ. Res. 14, 502 (1964).
Physiol. 241, H194-H201 (1981).
232, H645 (1977).
18. R. J. Gelpi, H. H. Gingolani, S. H. A. M. Mosca, G. J. Ruinated, A. Kosglov, Arch. Int. Physiol. Biochim. 70, 377 (1982).
19. R. Vogel, M. LeFree, E. Bates, W. O’Neill, R. Foster, P. Kirlin, D. Smith, B. Pitt, Am. Heart]. 107, 153 (1984).
20. L. Axel, L. Dougherty, Radiology 171, 841 (1989). 21. U. Sechtem, P. W. Pflugfelder, R. D. White, R. G. Gould, W.
Holt, M. J. Lipton, C. B. Higgins, AIR 148, 239 (1987). 22. D. J. Pennell, S. R. Underwood, D. B. Longmore, I. Comput.
Assist. Tomogr. 14(2), 167 (1990). 23. M. T. McNamara, C. B. Higgins, R. L. Ehmann, D. Revel, R.
Sievers, R. C. Brasch, Radiology 153, 157 (1984). 24. A. de Roos, J. Doornbos, E. E. van der Wall, A. E. van
Vorthuisen, AJR 150, 531 (1988). 25. N. Wilke, C. Simm, T. Machnig, J. Zhang, J. Ellermann, G.
Path, H. Merkle, X. Ya, R. G. Bache, K. Ugurbil in “Book of Abstracts, Society of Magnetic Resonance in Medicine, 1991,” p. 244.
26. K. L. Gould, Am. J. Cardiol. 41, 267 (1978). 27. R. J. Bache, F. J. Cohb, J. C. Greenfield, I. Clin. Invest. 54,
1462 (1974). 28. A. S. Iskandrian, H. Jaekyeong, A. Askenase, B. L. Segal, N.
Auerbach, Am. Heart J. 115(2), 432 (1988). 29. W. F. Hamilton, J. W. Moore, J. M. Kinsman, R. G. Spurling,
Am. J. Physiol. 99, 534 (1932). 30. W. Rutishauser, W. D. Bussmann, G. Noseda, W. Meier, J.
Wellover, Am. I. Roentgenol. Radium Ther. Nucl. Med. 109, 12 (1970).
31. B. R. Rosen, J. W. Belliveau, D. Chien, Magn. Reson. Q. 5, 263 (1989).
32. U. Schmiedl, M. E. Moseley, M. D. Ogan, W. M. Chew, R. C. Brasch, J. Comput. Assist. Tomogr. 11(2), 306 (1987).
33. H. Weiss, M. M. Winbury, Am. J. Physiol. 226, 838 (1974). 34. P. I. Polimeni, Am. J. Physiol. 227, 676 (1974). 35. D. S. Williams, J. A. Detre, J. S. Leigh, A. Koretsky, Proc.
Natl. Acad. Sci. USA 89, 212 (1992). 36. E. C. Y. Tong, F. S. Prato, G. Wiesenberg, T. Y. Lee, E. Carroll,
in “Book of Abstracts, Society of Magnetic Resonance in Medicine, 1991,” p. 245.
Related Documents


