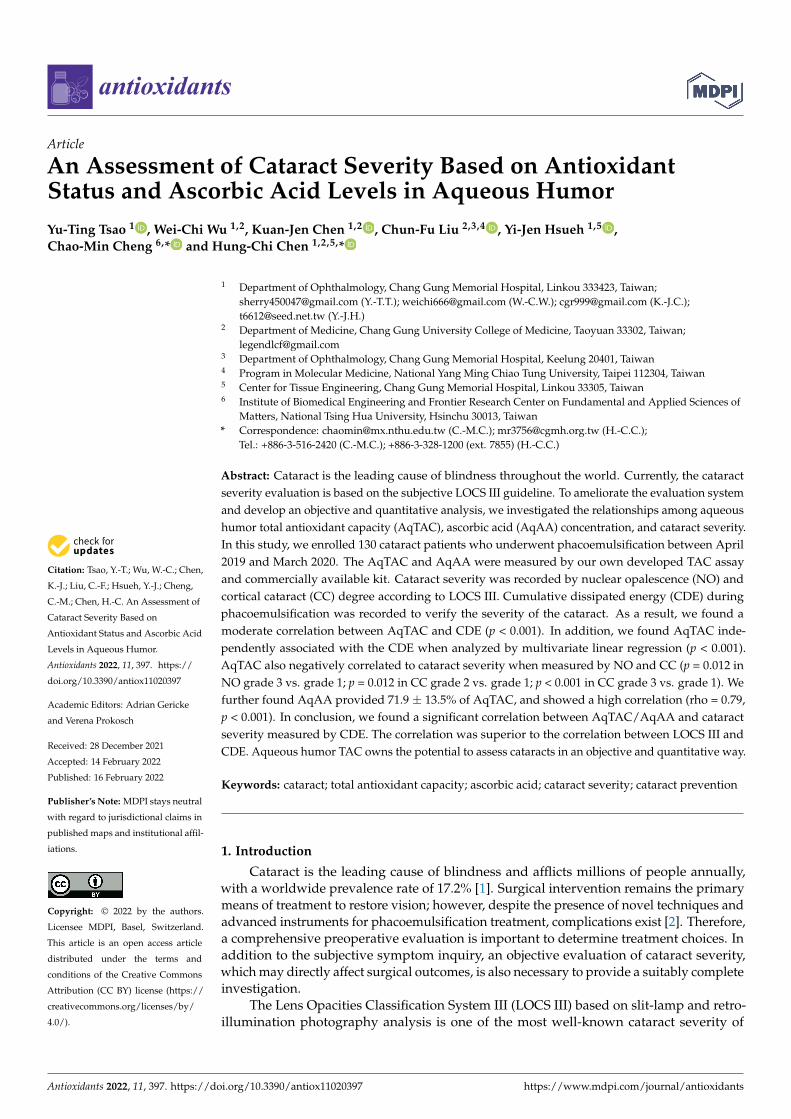
Citation: Tsao, Y.-T.; Wu, W.-C.; Chen, K.-J.; Liu, C.-F.; Hsueh, Y.-J.; Cheng, C.-M.; Chen, H.-C. An Assessment of Cataract Severity Based on Antioxidant Status and Ascorbic Acid Levels in Aqueous Humor. Antioxidants 2022, 11, 397. https:// doi.org/10.3390/antiox11020397 Academic Editors: Adrian Gericke and Verena Prokosch Received: 28 December 2021 Accepted: 14 February 2022 Published: 16 February 2022 Publisher’s Note: MDPI stays neutral with regard to jurisdictional claims in published maps and institutional affil- iations. Copyright: © 2022 by the authors. Licensee MDPI, Basel, Switzerland. This article is an open access article distributed under the terms and conditions of the Creative Commons Attribution (CC BY) license (https:// creativecommons.org/licenses/by/ 4.0/). antioxidants Article An Assessment of Cataract Severity Based on Antioxidant Status and Ascorbic Acid Levels in Aqueous Humor Yu-Ting Tsao 1 , Wei-Chi Wu 1,2 , Kuan-Jen Chen 1,2 , Chun-Fu Liu 2,3,4 , Yi-Jen Hsueh 1,5 , Chao-Min Cheng 6, * and Hung-Chi Chen 1,2,5, * 1 Department of Ophthalmology, Chang Gung Memorial Hospital, Linkou 333423, Taiwan; [email protected] (Y.-T.T.); [email protected] (W.-C.W.); [email protected] (K.-J.C.); [email protected] (Y.-J.H.) 2 Department of Medicine, Chang Gung University College of Medicine, Taoyuan 33302, Taiwan; [email protected] 3 Department of Ophthalmology, Chang Gung Memorial Hospital, Keelung 20401, Taiwan 4 Program in Molecular Medicine, National Yang Ming Chiao Tung University, Taipei 112304, Taiwan 5 Center for Tissue Engineering, Chang Gung Memorial Hospital, Linkou 33305, Taiwan 6 Institute of Biomedical Engineering and Frontier Research Center on Fundamental and Applied Sciences of Matters, National Tsing Hua University, Hsinchu 30013, Taiwan * Correspondence: [email protected] (C.-M.C.); [email protected] (H.-C.C.); Tel.: +886-3-516-2420 (C.-M.C.); +886-3-328-1200 (ext. 7855) (H.-C.C.) Abstract: Cataract is the leading cause of blindness throughout the world. Currently, the cataract severity evaluation is based on the subjective LOCS III guideline. To ameliorate the evaluation system and develop an objective and quantitative analysis, we investigated the relationships among aqueous humor total antioxidant capacity (AqTAC), ascorbic acid (AqAA) concentration, and cataract severity. In this study, we enrolled 130 cataract patients who underwent phacoemulsification between April 2019 and March 2020. The AqTAC and AqAA were measured by our own developed TAC assay and commercially available kit. Cataract severity was recorded by nuclear opalescence (NO) and cortical cataract (CC) degree according to LOCS III. Cumulative dissipated energy (CDE) during phacoemulsification was recorded to verify the severity of the cataract. As a result, we found a moderate correlation between AqTAC and CDE (p < 0.001). In addition, we found AqTAC inde- pendently associated with the CDE when analyzed by multivariate linear regression (p < 0.001). AqTAC also negatively correlated to cataract severity when measured by NO and CC (p = 0.012 in NO grade 3 vs. grade 1; p = 0.012 in CC grade 2 vs. grade 1; p < 0.001 in CC grade 3 vs. grade 1). We further found AqAA provided 71.9 ± 13.5% of AqTAC, and showed a high correlation (rho = 0.79, p < 0.001). In conclusion, we found a significant correlation between AqTAC/AqAA and cataract severity measured by CDE. The correlation was superior to the correlation between LOCS III and CDE. Aqueous humor TAC owns the potential to assess cataracts in an objective and quantitative way. Keywords: cataract; total antioxidant capacity; ascorbic acid; cataract severity; cataract prevention 1. Introduction Cataract is the leading cause of blindness and afflicts millions of people annually, with a worldwide prevalence rate of 17.2% [1]. Surgical intervention remains the primary means of treatment to restore vision; however, despite the presence of novel techniques and advanced instruments for phacoemulsification treatment, complications exist [2]. Therefore, a comprehensive preoperative evaluation is important to determine treatment choices. In addition to the subjective symptom inquiry, an objective evaluation of cataract severity, which may directly affect surgical outcomes, is also necessary to provide a suitably complete investigation. The Lens Opacities Classification System III (LOCS III) based on slit-lamp and retro- illumination photography analysis is one of the most well-known cataract severity of Antioxidants 2022, 11, 397. https://doi.org/10.3390/antiox11020397 https://www.mdpi.com/journal/antioxidants

Welcome message from author
This document is posted to help you gain knowledge. Please leave a comment to let me know what you think about it! Share it to your friends and learn new things together.
Transcript
�����������������
Citation: Tsao, Y.-T.; Wu, W.-C.; Chen,
K.-J.; Liu, C.-F.; Hsueh, Y.-J.; Cheng,
C.-M.; Chen, H.-C. An Assessment of
Cataract Severity Based on
Antioxidant Status and Ascorbic Acid
Levels in Aqueous Humor.
Antioxidants 2022, 11, 397. https://
doi.org/10.3390/antiox11020397
Academic Editors: Adrian Gericke
and Verena Prokosch
Received: 28 December 2021
Accepted: 14 February 2022
Published: 16 February 2022
Publisher’s Note: MDPI stays neutral
with regard to jurisdictional claims in
published maps and institutional affil-
iations.
Copyright: © 2022 by the authors.
Licensee MDPI, Basel, Switzerland.
This article is an open access article
distributed under the terms and
conditions of the Creative Commons
Attribution (CC BY) license (https://
creativecommons.org/licenses/by/
4.0/).
antioxidants
Article
An Assessment of Cataract Severity Based on AntioxidantStatus and Ascorbic Acid Levels in Aqueous HumorYu-Ting Tsao 1 , Wei-Chi Wu 1,2, Kuan-Jen Chen 1,2 , Chun-Fu Liu 2,3,4 , Yi-Jen Hsueh 1,5 ,Chao-Min Cheng 6,* and Hung-Chi Chen 1,2,5,*
1 Department of Ophthalmology, Chang Gung Memorial Hospital, Linkou 333423, Taiwan;[email protected] (Y.-T.T.); [email protected] (W.-C.W.); [email protected] (K.-J.C.);[email protected] (Y.-J.H.)
2 Department of Medicine, Chang Gung University College of Medicine, Taoyuan 33302, Taiwan;[email protected]
3 Department of Ophthalmology, Chang Gung Memorial Hospital, Keelung 20401, Taiwan4 Program in Molecular Medicine, National Yang Ming Chiao Tung University, Taipei 112304, Taiwan5 Center for Tissue Engineering, Chang Gung Memorial Hospital, Linkou 33305, Taiwan6 Institute of Biomedical Engineering and Frontier Research Center on Fundamental and Applied Sciences of
Matters, National Tsing Hua University, Hsinchu 30013, Taiwan* Correspondence: [email protected] (C.-M.C.); [email protected] (H.-C.C.);
Tel.: +886-3-516-2420 (C.-M.C.); +886-3-328-1200 (ext. 7855) (H.-C.C.)
Abstract: Cataract is the leading cause of blindness throughout the world. Currently, the cataractseverity evaluation is based on the subjective LOCS III guideline. To ameliorate the evaluation systemand develop an objective and quantitative analysis, we investigated the relationships among aqueoushumor total antioxidant capacity (AqTAC), ascorbic acid (AqAA) concentration, and cataract severity.In this study, we enrolled 130 cataract patients who underwent phacoemulsification between April2019 and March 2020. The AqTAC and AqAA were measured by our own developed TAC assayand commercially available kit. Cataract severity was recorded by nuclear opalescence (NO) andcortical cataract (CC) degree according to LOCS III. Cumulative dissipated energy (CDE) duringphacoemulsification was recorded to verify the severity of the cataract. As a result, we found amoderate correlation between AqTAC and CDE (p < 0.001). In addition, we found AqTAC inde-pendently associated with the CDE when analyzed by multivariate linear regression (p < 0.001).AqTAC also negatively correlated to cataract severity when measured by NO and CC (p = 0.012 inNO grade 3 vs. grade 1; p = 0.012 in CC grade 2 vs. grade 1; p < 0.001 in CC grade 3 vs. grade 1). Wefurther found AqAA provided 71.9 ± 13.5% of AqTAC, and showed a high correlation (rho = 0.79,p < 0.001). In conclusion, we found a significant correlation between AqTAC/AqAA and cataractseverity measured by CDE. The correlation was superior to the correlation between LOCS III andCDE. Aqueous humor TAC owns the potential to assess cataracts in an objective and quantitative way.
Keywords: cataract; total antioxidant capacity; ascorbic acid; cataract severity; cataract prevention
1. Introduction
Cataract is the leading cause of blindness and afflicts millions of people annually,with a worldwide prevalence rate of 17.2% [1]. Surgical intervention remains the primarymeans of treatment to restore vision; however, despite the presence of novel techniques andadvanced instruments for phacoemulsification treatment, complications exist [2]. Therefore,a comprehensive preoperative evaluation is important to determine treatment choices. Inaddition to the subjective symptom inquiry, an objective evaluation of cataract severity,which may directly affect surgical outcomes, is also necessary to provide a suitably completeinvestigation.
The Lens Opacities Classification System III (LOCS III) based on slit-lamp and retro-illumination photography analysis is one of the most well-known cataract severity of
Antioxidants 2022, 11, 397. https://doi.org/10.3390/antiox11020397 https://www.mdpi.com/journal/antioxidants
Antioxidants 2022, 11, 397 2 of 15
grading systems [3]. However, accumulative state-of-the-art evidence has emphasized theimportance of ultrasonic energy expenditure during the phacoemulsification process [4–8].Ultrasonic energy expenditure, which is usually recorded as cumulative dissipated energy(CDE) during the phacoemulsification process, may be used as a measure of cataractseverity, and it has several advantages including the following: (1) it directly reflectslens density [9]; (2) it is an objective and quantitative value, compared with the LOCS IIIcataract grade classification system; (3) it is directly associated with surgical applicabilityand outcomes [4–6]. The only drawback of using CDE to measure cataract severity isthat it cannot be tested before surgery. Providing a preoperative parameter that is highlycorrelated to CDE is highly desirable, as it may be used to guide treatment.
Oxidative stress, which is believed to be implicated in the overall process leadingto the formation of cataracts, could be a potential indicator of cataract severity [10]. Asthe ocular lens is continually exposed to sunlight and ambient stimuli, the productionof toxic free radicals is inevitable. As a result, rather than measuring oxidative status,research has focused on total antioxidant capacity (TAC) as an indicator of the capacity toconfront the pathogenesis of ocular diseases [11–13]. Previous studies have demonstratedthe protective effect of antioxidants on cataractogenesis [14–16]. However, most of thesestudies were epidemiologic or serum-based studies, and some of the results are inconsistent.The inconsistency of the results might be due to the fact that neither the epidemiologicfactors nor serum factors contact with the crystalline lens directly, and therefore, they mayeasily be affected by methodology variations. In this regard, aqueous humor, which isin direct contact with the lens and is its primary nutritional source, may offer a betterresource for exploring the correlation between aqueous humor antioxidant status andcataract formation.
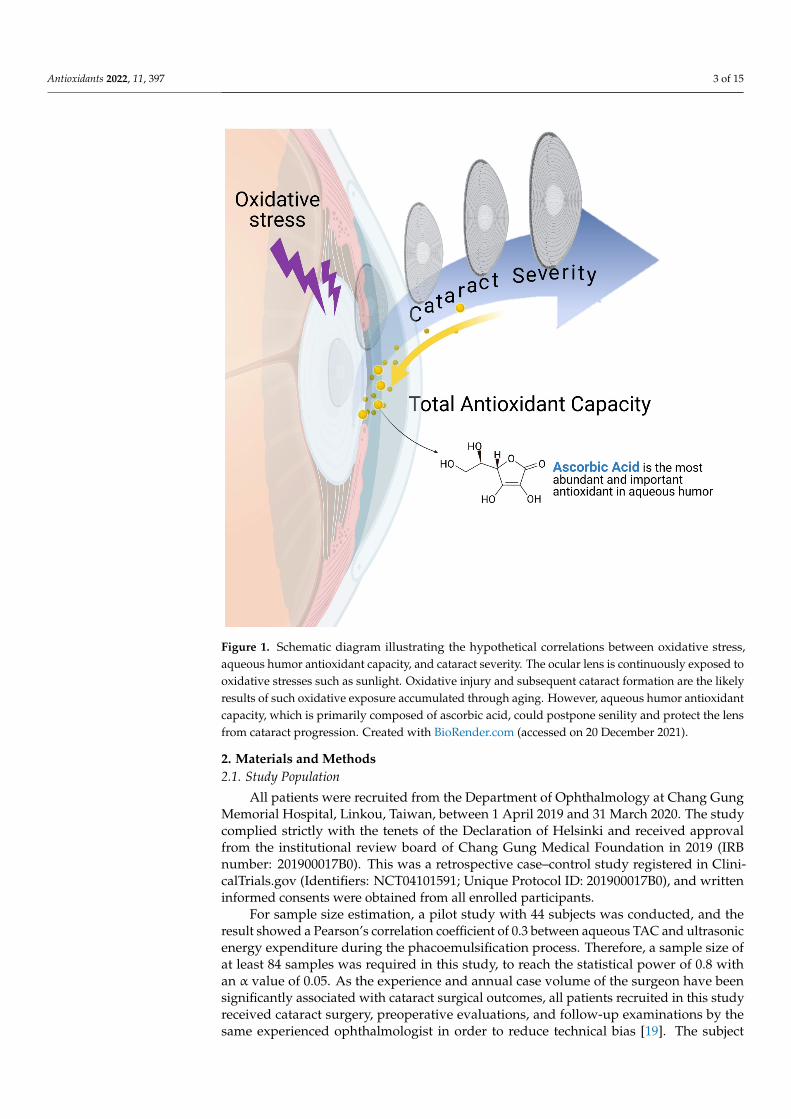
Among the elements of the antioxidant defense system in aqueous humor, ascorbicacid (AA) is a small-molecule antioxidant. AA is actively transported from serum to theaqueous humor, where it is 20–40 times more highly concentrated [17,18]. Given this, AAwas believed to play a particularly noteworthy antioxidative role in aqueous humor. Wehypothesized that the antioxidants in aqueous humor, especially AA, could be measured todiagnose cataract presence and severity and may also be leveraged for preventative andtreatment strategies. Most of the aqueous humor-based studies to date have been hamperedby insufficient sample sizes and invasive sampling techniques. Therefore, the aim of thisstudy was to overcome these limitations and examine the associations between aqueoushumor antioxidant status, AA level, and cataract severity. The primary aim of this studywas to identify the correlation between TAC, AA, and CDE, and additionally to investigatethe correlation between TAC, AA, and the most important cataract surgical outcomes suchas best-corrected visual acuity (BCVA) improvement and intraocular pressure (IOP) change.The secondary aim was to evaluate the proportion of AA’s contribution to TAC in cataractpatients and provide insight into the pathophysiological mechanisms of cataract formation.Our hypothesis is illustrated in Figure 1.
Antioxidants 2022, 11, 397 3 of 15Antioxidants 2022, 10, x FOR PEER REVIEW 3 of 16
Figure 1. Schematic diagram illustrating the hypothetical correlations between oxidative stress, aqueous humor antioxidant capacity, and cataract severity. The ocular lens is continuously exposed to oxidative stresses such as sunlight. Oxidative injury and subsequent cataract formation are the likely results of such oxidative exposure accumulated through aging. However, aqueous humor antioxidant capacity, which is primarily composed of ascorbic acid, could postpone senility and protect the lens from cataract progression. Created with BioRender.com (accessed on 4 February 2022).
2. Materials and Methods 2.1. Study Population
All patients were recruited from the Department of Ophthalmology at Chang Gung Memorial Hospital, Linkou, Taiwan, between 1 April 2019 and 31 March 2020. The study complied strictly with the tenets of the Declaration of Helsinki and received approval from the institutional review board of Chang Gung Medical Foundation in 2019 (IRB number: 201900017B0). This was a retrospective case–control study registered in ClinicalTrials.gov (Identifiers: NCT04101591; Unique Protocol ID: 201900017B0), and written informed con-sents were obtained from all enrolled participants.
For sample size estimation, a pilot study with 44 subjects was conducted, and the result showed a Pearson’s correlation coefficient of 0.3 between aqueous TAC and ultra-sonic energy expenditure during the phacoemulsification process. Therefore, a sample size of at least 84 samples was required in this study, to reach the statistical power of 0.8 with an α value of 0.05. As the experience and annual case volume of the surgeon have been significantly associated with cataract surgical outcomes, all patients recruited in this
Figure 1. Schematic diagram illustrating the hypothetical correlations between oxidative stress,aqueous humor antioxidant capacity, and cataract severity. The ocular lens is continuously exposed tooxidative stresses such as sunlight. Oxidative injury and subsequent cataract formation are the likelyresults of such oxidative exposure accumulated through aging. However, aqueous humor antioxidantcapacity, which is primarily composed of ascorbic acid, could postpone senility and protect the lensfrom cataract progression. Created with BioRender.com (accessed on 20 December 2021).
2. Materials and Methods2.1. Study Population
All patients were recruited from the Department of Ophthalmology at Chang GungMemorial Hospital, Linkou, Taiwan, between 1 April 2019 and 31 March 2020. The studycomplied strictly with the tenets of the Declaration of Helsinki and received approvalfrom the institutional review board of Chang Gung Medical Foundation in 2019 (IRBnumber: 201900017B0). This was a retrospective case–control study registered in Clini-calTrials.gov (Identifiers: NCT04101591; Unique Protocol ID: 201900017B0), and writteninformed consents were obtained from all enrolled participants.
For sample size estimation, a pilot study with 44 subjects was conducted, and theresult showed a Pearson’s correlation coefficient of 0.3 between aqueous TAC and ultrasonicenergy expenditure during the phacoemulsification process. Therefore, a sample size ofat least 84 samples was required in this study, to reach the statistical power of 0.8 withan α value of 0.05. As the experience and annual case volume of the surgeon have beensignificantly associated with cataract surgical outcomes, all patients recruited in this studyreceived cataract surgery, preoperative evaluations, and follow-up examinations by thesame experienced ophthalmologist in order to reduce technical bias [19]. The subject
Antioxidants 2022, 11, 397 4 of 15
recruitment flow diagram for this study is presented in Figure S1. In brief, among the240 cataract patients who received phacoemulsification and intraocular lens implantation(PHACO IOL) by one ophthalmic surgeon (Chen, H.C.), 130 were included in this study,and 103 had their IOP or BCVA checked one month later.
2.2. Sample Collection and Data Acquisition
Aqueous humor samples were collected from each patient at the beginning of PHACOIOL surgery. In brief, a 27-gauge needle connected to an insulin syringe was carefullyinserted into the anterior chamber at the temporal limbus, and 0.1 mL of aqueous humorwas aspirated. The undiluted aqueous samples were then stored immediately in a −80 ◦Cfreezer until analysis.
Patient demographics were recorded by the medical chart. Initial cataract severityassessment was graded according to the LOCS III cataract grade classification system aspart of routine preoperative evaluations [3]. The degree of nuclear opalescence (NO) andcortical cataract (CC) were evaluated and recorded using a slit lamp (BQ 900, Haag-Streit,Bern, Switzerland). The final cataract severity measurement was calculated using CDE(mJ) as determined by the Infiniti Vision System (Alcon Laboratories, Inc., Fort Worth, TX,USA) following the phacoemulsification process. To evaluate surgical efficacy, the BCVAof each patient was measured using the Snellen chart, and the results were convertedto the logarithm of the minimum angle of resolution (LogMAR) for analysis. For BCVAvalues worse than 0.01 and recorded in a semiquantitative scale, LogMAR of 1.85 wasrecorded for counting fingers vision, LogMAR of 2.3 was recorded for hand movementvision, LogMAR of 2.8 was recorded for light perception, and LogMAR of 3.0 was recordedfor no light perception [19,20]. To evaluate surgical safety, the IOP was measured usinga pneumatonometer (Canon, TX-10, Canon Corporation, Tokyo, Japan). Both BCVA andIOP were examined preoperatively and at least 1 month after cataract surgery. We thencalculated the differences between preoperative and follow-up BCVA and IOP values todetermine surgical efficacy and safety.
2.3. Aqueous Humor Antioxidant Capacity
We have developed a TAC assay based on copper (II) redox reactions [21,22]. Thebicinchoninic acid (BCA) and CuSO4 were purchased from ThermoFisher Scientific (con-tained in the PierceTM BCA Protein Assay Kit, Catalog number: 23225, Waltham, MA,USA). The AA, which is a widely used antioxidant, was purchased from Fisher Scientific(B581-05, JT Baker, Phillipsburg, NJ, USA) to establish the standard curve. We establishedthe standard curve using serial diluted 0.02–2.5 mM AA solutions. Briefly, 10 µL of theundiluted aqueous sample was applied into wells of a 96-well microplate, and 200 µL of0.08% CuSO4 solution diluted by BCA was then added and incubated for 20 min away fromlight. The Cu2+ could be reduced to Cu1+ by various antioxidant compounds, and Cu1+
further formed a violet chelate complex via the interaction with BCA. The colorimetricresults were measured at 570 nm by an absorbance microplate reader (Sunrise™ Tecan,Männedorf, Switzerland). The accuracy and stability of the TAC assay were verified in ourprevious study. The calculated limit of detection (LOD) of the TAC assay was 0.016 mM,and the limit of quantitation (LOQ) of the TAC assay was 0.053 mM. In addition, the intraas-say and interassay coefficients of variability (CV) were 4.25% (n = 8) and 4.13% (n = 19),respectively. The TAC assay was stable under a wide range of pH levels (pH 4–10) [11]. Wealso used the colorimetric OxiSelect™ Ascorbic Acid Assay Kit (FRASC, Cell Biolabs Inc.,San Diego, CA, USA) to measure aqueous humor AA concentration [23].
2.4. Statistical Analysis
Descriptive statistics were used for patient characterizations, which were presentedas means with standard deviations or proportions as appropriate. The normality of dis-tribution was tested for all continuous data using the Kolmogorov–Smirnov test. Theproportional correlation of aqueous humor AA in TAC was presented as a pie chart and
Antioxidants 2022, 11, 397 5 of 15
analyzed using the Spearman correlation analysis. Univariate and multivariate ordinallogistic regression analysis was used to calculate the effects of TAC on cataract severityparameters—NO and CC. The correlation between aqueous humor TAC with CDE, surgicalefficacy (improvement in BCVA), and surgical safety (change in IOP) were first analyzed bySpearman’s correlation coefficient and further examined by univariate and multivariate lin-ear regression analyses. Parameters including patient age, sampling eye site, gender, bodymass index (BMI), ocular diseases, and systemic diseases were considered as confoundingfactors and adjusted in all the multivariate regression models. The sample size requirementand statistical power analysis of this study were calculated using the statistical program,G*Power 3.1 [24]. All other statistical analyses were conducted using Stata software version14 (StataCorp LP, College Station, TX, USA). A p value of less than 0.05 was consideredstatistically significant.
3. Results3.1. Study Population
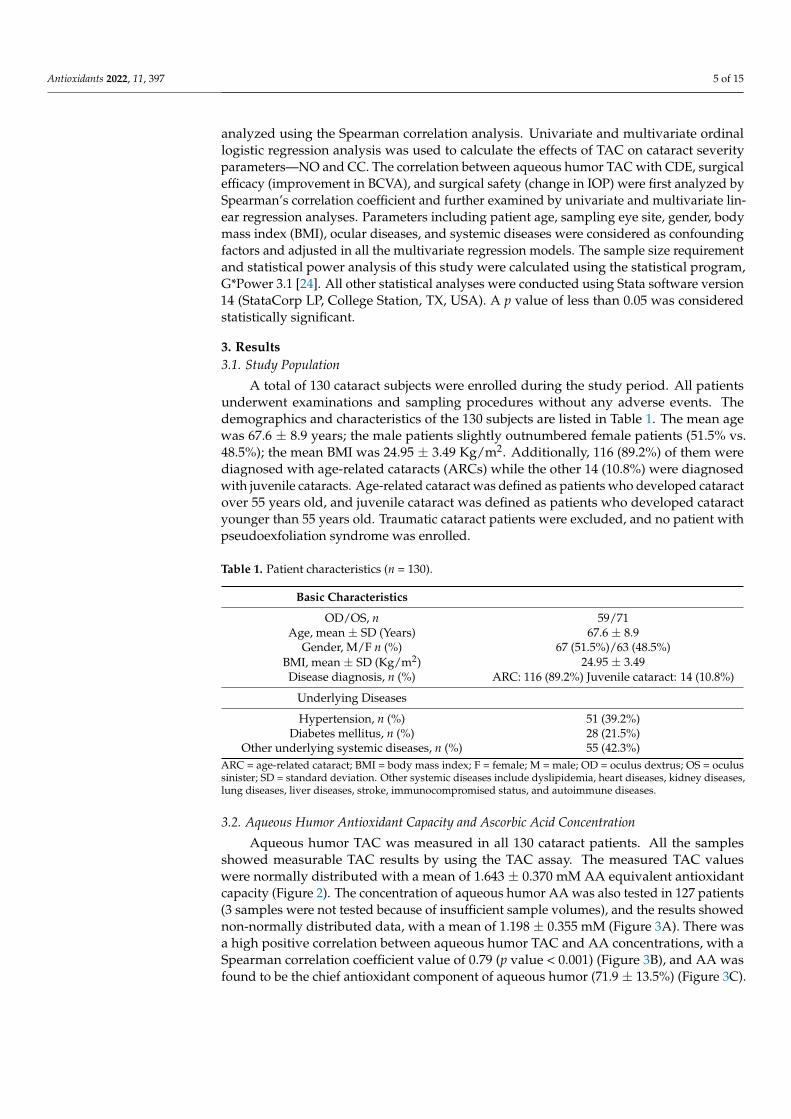
A total of 130 cataract subjects were enrolled during the study period. All patientsunderwent examinations and sampling procedures without any adverse events. Thedemographics and characteristics of the 130 subjects are listed in Table 1. The mean agewas 67.6 ± 8.9 years; the male patients slightly outnumbered female patients (51.5% vs.48.5%); the mean BMI was 24.95 ± 3.49 Kg/m2. Additionally, 116 (89.2%) of them werediagnosed with age-related cataracts (ARCs) while the other 14 (10.8%) were diagnosedwith juvenile cataracts. Age-related cataract was defined as patients who developed cataractover 55 years old, and juvenile cataract was defined as patients who developed cataractyounger than 55 years old. Traumatic cataract patients were excluded, and no patient withpseudoexfoliation syndrome was enrolled.
Table 1. Patient characteristics (n = 130).
Basic Characteristics
OD/OS, n 59/71Age, mean ± SD (Years) 67.6 ± 8.9
Gender, M/F n (%) 67 (51.5%)/63 (48.5%)BMI, mean ± SD (Kg/m2) 24.95 ± 3.49Disease diagnosis, n (%) ARC: 116 (89.2%) Juvenile cataract: 14 (10.8%)
Underlying Diseases
Hypertension, n (%) 51 (39.2%)Diabetes mellitus, n (%) 28 (21.5%)
Other underlying systemic diseases, n (%) 55 (42.3%)ARC = age-related cataract; BMI = body mass index; F = female; M = male; OD = oculus dextrus; OS = oculussinister; SD = standard deviation. Other systemic diseases include dyslipidemia, heart diseases, kidney diseases,lung diseases, liver diseases, stroke, immunocompromised status, and autoimmune diseases.
3.2. Aqueous Humor Antioxidant Capacity and Ascorbic Acid Concentration
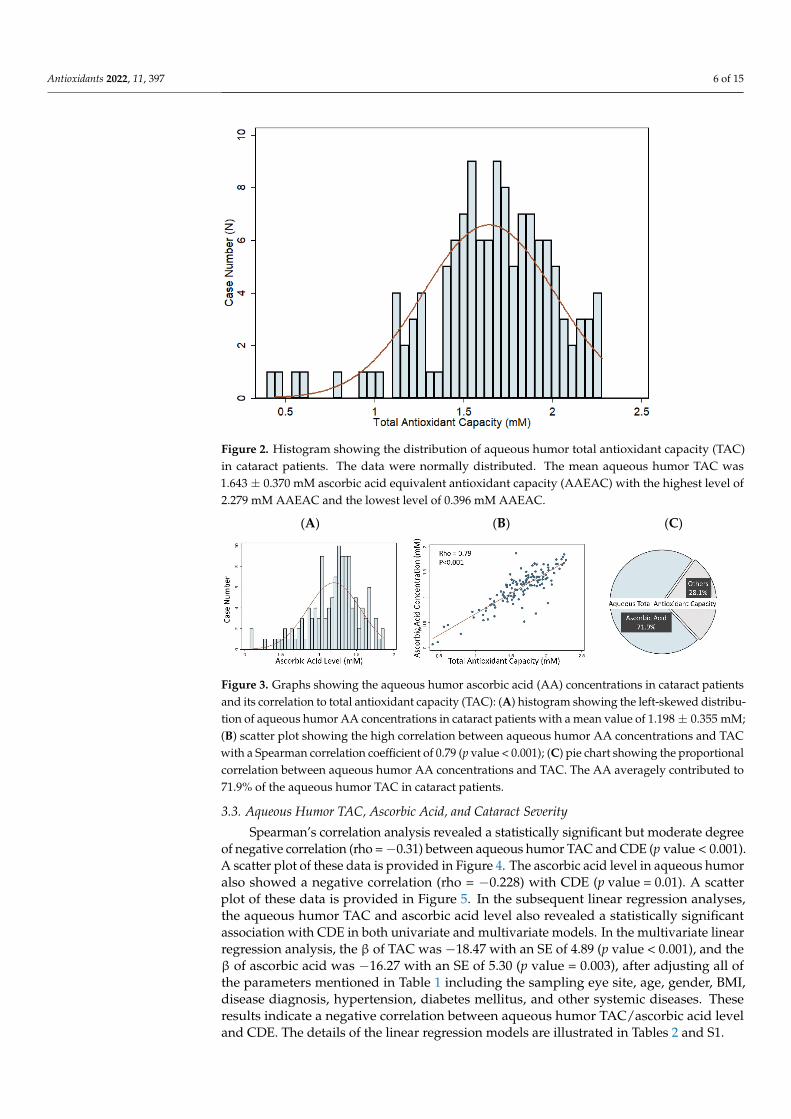
Aqueous humor TAC was measured in all 130 cataract patients. All the samplesshowed measurable TAC results by using the TAC assay. The measured TAC valueswere normally distributed with a mean of 1.643 ± 0.370 mM AA equivalent antioxidantcapacity (Figure 2). The concentration of aqueous humor AA was also tested in 127 patients(3 samples were not tested because of insufficient sample volumes), and the results showednon-normally distributed data, with a mean of 1.198 ± 0.355 mM (Figure 3A). There wasa high positive correlation between aqueous humor TAC and AA concentrations, with aSpearman correlation coefficient value of 0.79 (p value < 0.001) (Figure 3B), and AA wasfound to be the chief antioxidant component of aqueous humor (71.9 ± 13.5%) (Figure 3C).
Antioxidants 2022, 11, 397 6 of 15
Antioxidants 2022, 10, x FOR PEER REVIEW 6 of 16
samples were not tested because of insufficient sample volumes), and the results showed non-normally distributed data, with a mean of 1.198 ± 0.355 mM (Figure 3A). There was a high positive correlation between aqueous humor TAC and AA concentrations, with a Spearman correlation coefficient value of 0.79 (p value < 0.001) (Figure 3B), and AA was found to be the chief antioxidant component of aqueous humor (71.9 ± 13.5%) (Figure 3C).
Figure 2. Histogram showing the distribution of aqueous humor total antioxidant capacity (TAC) in cataract patients. The data were normally distributed. The mean aqueous humor TAC was 1.643 ± 0.370 mM ascorbic acid equivalent antioxidant capacity (AAEAC) with the highest level of 2.279 mM AAEAC and the lowest level of 0.396 mM AAEAC.
(A) (B) (C)
Figure 3. Graphs showing the aqueous humor ascorbic acid (AA) concentrations in cataract patients and its correlation to total antioxidant capacity (TAC): (A) histogram showing the left-skewed dis-tribution of aqueous humor AA concentrations in cataract patients with a mean value of 1.198 ± 0.355 mM; (B) scatter plot showing the high correlation between aqueous humor AA concentrations and TAC with a Spearman correlation coefficient of 0.79 (p value < 0.001); (C) pie chart showing the proportional correlation between aqueous humor AA concentrations and TAC. The AA averagely contributed to 71.9% of the aqueous humor TAC in cataract patients.
3.3. Aqueous Humor TAC, Ascorbic Acid, and Cataract Severity Spearman’s correlation analysis revealed a statistically significant but moderate de-
gree of negative correlation (rho = −0.31) between aqueous humor TAC and CDE (p value < 0.001). A scatter plot of these data is provided in Figure 4. The ascorbic acid level in aqueous humor also showed a negative correlation (rho = −0.228) with CDE (p value =
Figure 2. Histogram showing the distribution of aqueous humor total antioxidant capacity (TAC)in cataract patients. The data were normally distributed. The mean aqueous humor TAC was1.643 ± 0.370 mM ascorbic acid equivalent antioxidant capacity (AAEAC) with the highest level of2.279 mM AAEAC and the lowest level of 0.396 mM AAEAC.
Antioxidants 2022, 10, x FOR PEER REVIEW 6 of 16
samples were not tested because of insufficient sample volumes), and the results showed non-normally distributed data, with a mean of 1.198 ± 0.355 mM (Figure 3A). There was a high positive correlation between aqueous humor TAC and AA concentrations, with a Spearman correlation coefficient value of 0.79 (p value < 0.001) (Figure 3B), and AA was found to be the chief antioxidant component of aqueous humor (71.9 ± 13.5%) (Figure 3C).
Figure 2. Histogram showing the distribution of aqueous humor total antioxidant capacity (TAC) in cataract patients. The data were normally distributed. The mean aqueous humor TAC was 1.643 ± 0.370 mM ascorbic acid equivalent antioxidant capacity (AAEAC) with the highest level of 2.279 mM AAEAC and the lowest level of 0.396 mM AAEAC.
(A) (B) (C)
Figure 3. Graphs showing the aqueous humor ascorbic acid (AA) concentrations in cataract patients and its correlation to total antioxidant capacity (TAC): (A) histogram showing the left-skewed dis-tribution of aqueous humor AA concentrations in cataract patients with a mean value of 1.198 ± 0.355 mM; (B) scatter plot showing the high correlation between aqueous humor AA concentrations and TAC with a Spearman correlation coefficient of 0.79 (p value < 0.001); (C) pie chart showing the proportional correlation between aqueous humor AA concentrations and TAC. The AA averagely contributed to 71.9% of the aqueous humor TAC in cataract patients.
3.3. Aqueous Humor TAC, Ascorbic Acid, and Cataract Severity Spearman’s correlation analysis revealed a statistically significant but moderate de-
gree of negative correlation (rho = −0.31) between aqueous humor TAC and CDE (p value < 0.001). A scatter plot of these data is provided in Figure 4. The ascorbic acid level in aqueous humor also showed a negative correlation (rho = −0.228) with CDE (p value =
Figure 3. Graphs showing the aqueous humor ascorbic acid (AA) concentrations in cataract patientsand its correlation to total antioxidant capacity (TAC): (A) histogram showing the left-skewed distribu-tion of aqueous humor AA concentrations in cataract patients with a mean value of 1.198 ± 0.355 mM;(B) scatter plot showing the high correlation between aqueous humor AA concentrations and TACwith a Spearman correlation coefficient of 0.79 (p value < 0.001); (C) pie chart showing the proportionalcorrelation between aqueous humor AA concentrations and TAC. The AA averagely contributed to71.9% of the aqueous humor TAC in cataract patients.
3.3. Aqueous Humor TAC, Ascorbic Acid, and Cataract Severity
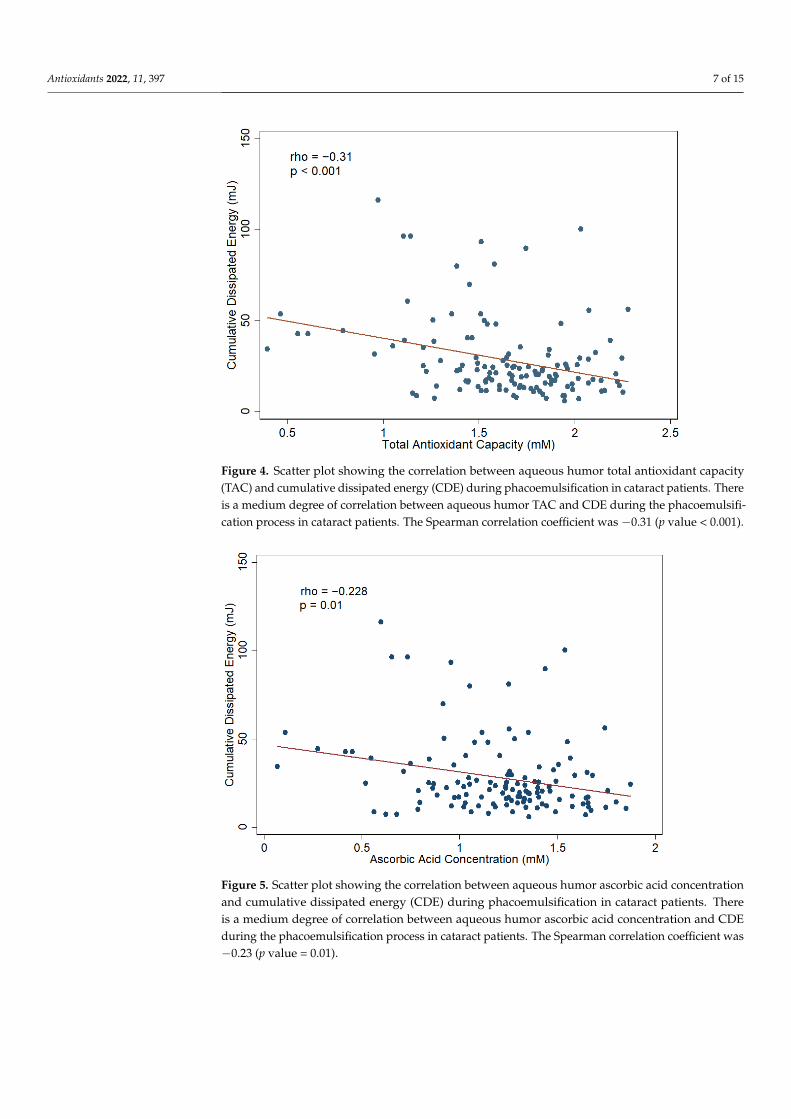
Spearman’s correlation analysis revealed a statistically significant but moderate degreeof negative correlation (rho =−0.31) between aqueous humor TAC and CDE (p value < 0.001).A scatter plot of these data is provided in Figure 4. The ascorbic acid level in aqueous humoralso showed a negative correlation (rho = −0.228) with CDE (p value = 0.01). A scatterplot of these data is provided in Figure 5. In the subsequent linear regression analyses,the aqueous humor TAC and ascorbic acid level also revealed a statistically significantassociation with CDE in both univariate and multivariate models. In the multivariate linearregression analysis, the β of TAC was −18.47 with an SE of 4.89 (p value < 0.001), and theβ of ascorbic acid was −16.27 with an SE of 5.30 (p value = 0.003), after adjusting all ofthe parameters mentioned in Table 1 including the sampling eye site, age, gender, BMI,disease diagnosis, hypertension, diabetes mellitus, and other systemic diseases. Theseresults indicate a negative correlation between aqueous humor TAC/ascorbic acid leveland CDE. The details of the linear regression models are illustrated in Tables 2 and S1.
Antioxidants 2022, 11, 397 7 of 15
Antioxidants 2022, 10, x FOR PEER REVIEW 8 of 16
Table 3. Univariate and multivariate ordinal logistic regression analyses for total antioxidant capac-ity on cataract severity of nuclear opalescence and cortical cataract.
Crude Odds Ratio Adjusted Odds Ratio OR (95% CI) p Value OR (95% CI) p Value
Nuclear Opalescence
Grade 2 vs. Grade 1 0.453 (0.04–5.18) 0.524 0.348 (0.028–4.301) 0.411 Grade 3 vs. Grade 1 0.11 (0.016–0.735) 0.023 * 0.078 (0.011–0.571) 0.012 *
Cortical Cataract
Grade 2 vs. Grade 1 0.027 (0.001–1.055) 0.053 0.001 (0–0.355) 0.02 * Grade 3 vs. Grade 1 0.005 (0–0.147) 0.002 ** < 0.001 (0–0.051) <0.001 ***
OR: odds ratio; CI: confidence interval. Age, eye site, gender, body mass index, disease diagnosis, and underlying diseases were adjusted as the confounding factors. *: p-value < 0.05; **: p-value < 0.01; ***: p-value < 0.001.
Figure 4. Scatter plot showing the correlation between aqueous humor total antioxidant capacity (TAC) and cumulative dissipated energy (CDE) during phacoemulsification in cataract patients. There is a medium degree of correlation between aqueous humor TAC and CDE during the phacoemulsification process in cataract patients. The Spearman correlation coefficient was −0.31 (p value < 0.001).
Figure 4. Scatter plot showing the correlation between aqueous humor total antioxidant capacity(TAC) and cumulative dissipated energy (CDE) during phacoemulsification in cataract patients. Thereis a medium degree of correlation between aqueous humor TAC and CDE during the phacoemulsifi-cation process in cataract patients. The Spearman correlation coefficient was −0.31 (p value < 0.001).
Antioxidants 2022, 10, x FOR PEER REVIEW 9 of 16
Figure 5. Scatter plot showing the correlation between aqueous humor ascorbic acid concentration and cumulative dissipated energy (CDE) during phacoemulsification in cataract patients. There is a medium degree of correlation between aqueous humor ascorbic acid concentration and CDE during the phacoemulsification process in cataract patients. The Spearman correlation coefficient was −0.23 (p value = 0.01).
3.4. Aqueous Humor TAC and Cataract Surgical Outcomes To evaluate the correlation between aqueous humor TAC and surgical efficacy,
Spearman’s correlation analysis and linear regression analysis were applied; the results reveal no statistically significant association between aqueous humor TAC and BCVA im-provement, with a p value of 0.658 according to Spearman’s correlation analysis (Figure 6), 0.188 according to the univariate linear regression analysis, and 0.335 according to the multivariate linear regression analysis. The detailed data are displayed in Table S3. Re-garding the correlation between aqueous humor TAC and surgical safety, aqueous humor TAC was not significantly associated with the change in IOP according to Spearman’s correlation analysis (p value = 0.785, Figure 7), univariate linear regression analysis (p value = 0.562), and multivariate linear regression analysis (p value = 0.327). The detailed data are displayed in Table S4.
Figure 5. Scatter plot showing the correlation between aqueous humor ascorbic acid concentrationand cumulative dissipated energy (CDE) during phacoemulsification in cataract patients. Thereis a medium degree of correlation between aqueous humor ascorbic acid concentration and CDEduring the phacoemulsification process in cataract patients. The Spearman correlation coefficient was−0.23 (p value = 0.01).
Antioxidants 2022, 11, 397 8 of 15
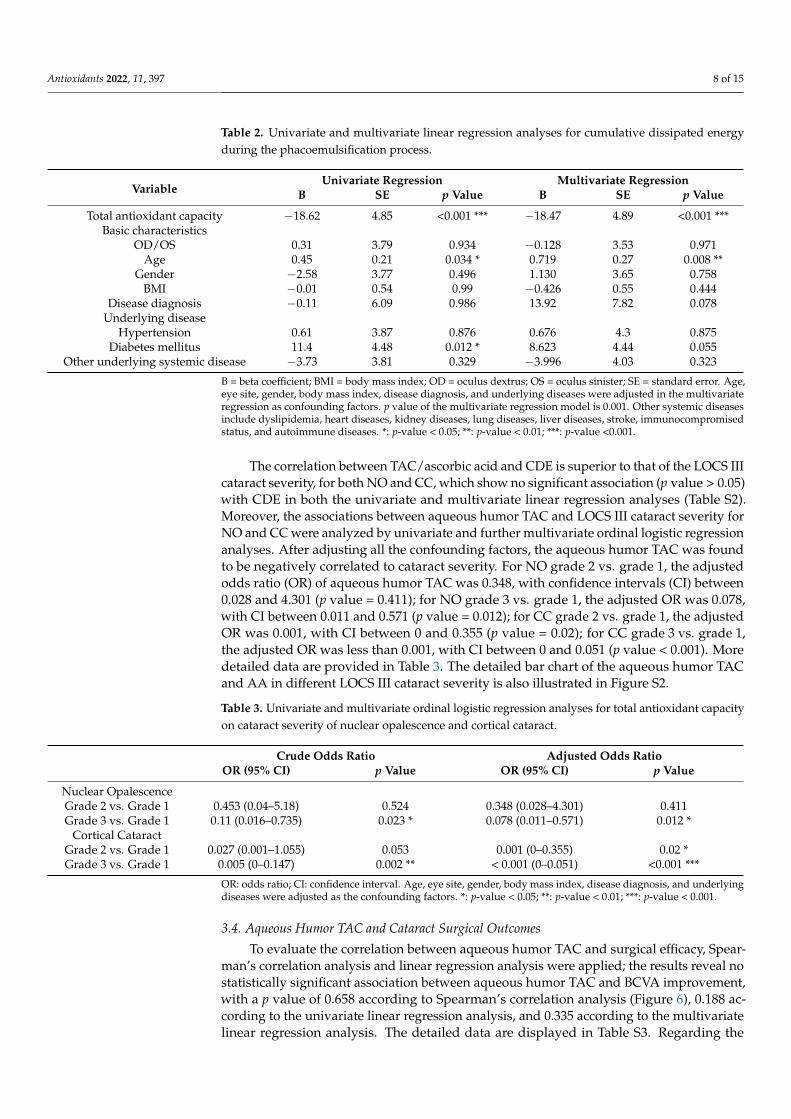
Table 2. Univariate and multivariate linear regression analyses for cumulative dissipated energyduring the phacoemulsification process.
VariableUnivariate Regression Multivariate Regression
B SE p Value B SE p Value
Total antioxidant capacity −18.62 4.85 <0.001 *** −18.47 4.89 <0.001 ***Basic characteristics
OD/OS 0.31 3.79 0.934 −0.128 3.53 0.971Age 0.45 0.21 0.034 * 0.719 0.27 0.008 **
Gender −2.58 3.77 0.496 1.130 3.65 0.758BMI −0.01 0.54 0.99 −0.426 0.55 0.444
Disease diagnosis −0.11 6.09 0.986 13.92 7.82 0.078Underlying disease
Hypertension 0.61 3.87 0.876 0.676 4.3 0.875Diabetes mellitus 11.4 4.48 0.012 * 8.623 4.44 0.055
Other underlying systemic disease −3.73 3.81 0.329 −3.996 4.03 0.323
B = beta coefficient; BMI = body mass index; OD = oculus dextrus; OS = oculus sinister; SE = standard error. Age,eye site, gender, body mass index, disease diagnosis, and underlying diseases were adjusted in the multivariateregression as confounding factors. p value of the multivariate regression model is 0.001. Other systemic diseasesinclude dyslipidemia, heart diseases, kidney diseases, lung diseases, liver diseases, stroke, immunocompromisedstatus, and autoimmune diseases. *: p-value < 0.05; **: p-value < 0.01; ***: p-value <0.001.
The correlation between TAC/ascorbic acid and CDE is superior to that of the LOCS IIIcataract severity, for both NO and CC, which show no significant association (p value > 0.05)with CDE in both the univariate and multivariate linear regression analyses (Table S2).Moreover, the associations between aqueous humor TAC and LOCS III cataract severity forNO and CC were analyzed by univariate and further multivariate ordinal logistic regressionanalyses. After adjusting all the confounding factors, the aqueous humor TAC was foundto be negatively correlated to cataract severity. For NO grade 2 vs. grade 1, the adjustedodds ratio (OR) of aqueous humor TAC was 0.348, with confidence intervals (CI) between0.028 and 4.301 (p value = 0.411); for NO grade 3 vs. grade 1, the adjusted OR was 0.078,with CI between 0.011 and 0.571 (p value = 0.012); for CC grade 2 vs. grade 1, the adjustedOR was 0.001, with CI between 0 and 0.355 (p value = 0.02); for CC grade 3 vs. grade 1,the adjusted OR was less than 0.001, with CI between 0 and 0.051 (p value < 0.001). Moredetailed data are provided in Table 3. The detailed bar chart of the aqueous humor TACand AA in different LOCS III cataract severity is also illustrated in Figure S2.
Table 3. Univariate and multivariate ordinal logistic regression analyses for total antioxidant capacityon cataract severity of nuclear opalescence and cortical cataract.
Crude Odds Ratio Adjusted Odds RatioOR (95% CI) p Value OR (95% CI) p Value
Nuclear OpalescenceGrade 2 vs. Grade 1 0.453 (0.04–5.18) 0.524 0.348 (0.028–4.301) 0.411Grade 3 vs. Grade 1 0.11 (0.016–0.735) 0.023 * 0.078 (0.011–0.571) 0.012 *
Cortical CataractGrade 2 vs. Grade 1 0.027 (0.001–1.055) 0.053 0.001 (0–0.355) 0.02 *Grade 3 vs. Grade 1 0.005 (0–0.147) 0.002 ** < 0.001 (0–0.051) <0.001 ***
OR: odds ratio; CI: confidence interval. Age, eye site, gender, body mass index, disease diagnosis, and underlyingdiseases were adjusted as the confounding factors. *: p-value < 0.05; **: p-value < 0.01; ***: p-value < 0.001.
3.4. Aqueous Humor TAC and Cataract Surgical Outcomes
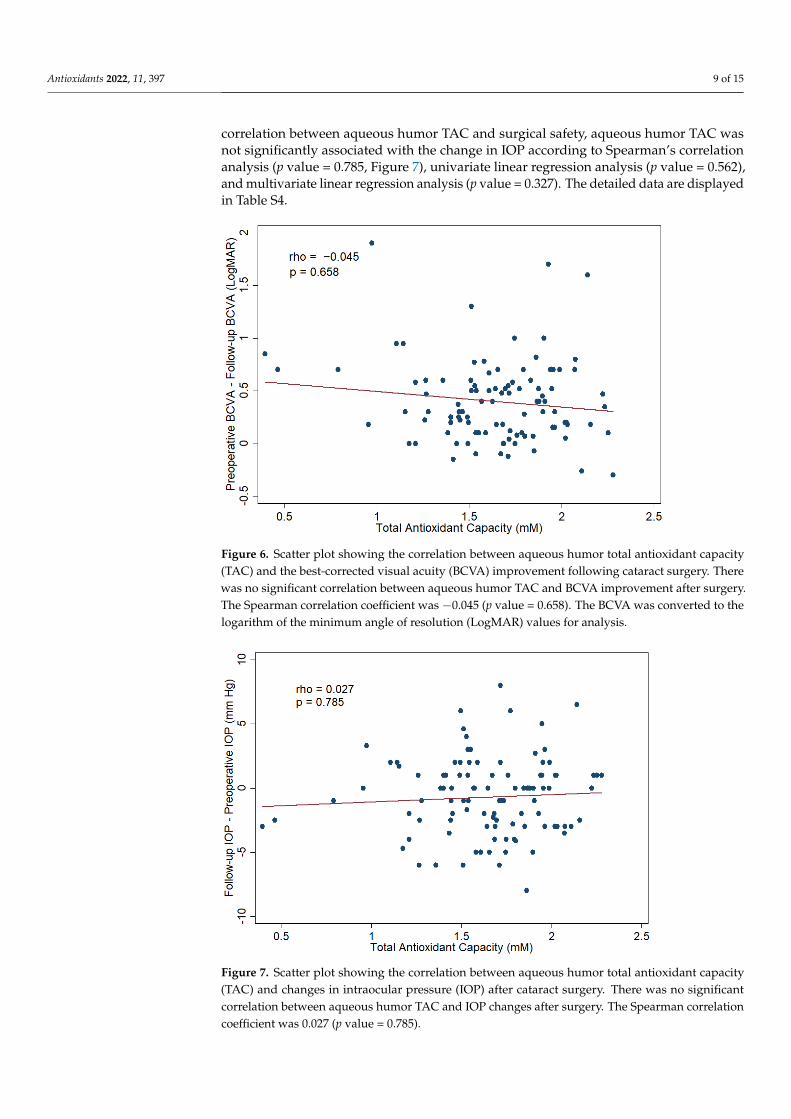
To evaluate the correlation between aqueous humor TAC and surgical efficacy, Spear-man’s correlation analysis and linear regression analysis were applied; the results reveal nostatistically significant association between aqueous humor TAC and BCVA improvement,with a p value of 0.658 according to Spearman’s correlation analysis (Figure 6), 0.188 ac-cording to the univariate linear regression analysis, and 0.335 according to the multivariatelinear regression analysis. The detailed data are displayed in Table S3. Regarding the
Antioxidants 2022, 11, 397 9 of 15
correlation between aqueous humor TAC and surgical safety, aqueous humor TAC wasnot significantly associated with the change in IOP according to Spearman’s correlationanalysis (p value = 0.785, Figure 7), univariate linear regression analysis (p value = 0.562),and multivariate linear regression analysis (p value = 0.327). The detailed data are displayedin Table S4.
Antioxidants 2022, 10, x FOR PEER REVIEW 10 of 16
Figure 6. Scatter plot showing the correlation between aqueous humor total antioxidant capacity (TAC) and the best-corrected visual acuity (BCVA) improvement following cataract surgery. There was no significant correlation between aqueous humor TAC and BCVA improvement after surgery. The Spearman correlation coefficient was −0.045 (p value = 0.658). The BCVA was converted to the logarithm of the minimum angle of resolution (LogMAR) values for analysis.
Figure 7. Scatter plot showing the correlation between aqueous humor total antioxidant capacity (TAC) and changes in intraocular pressure (IOP) after cataract surgery. There was no significant
Figure 6. Scatter plot showing the correlation between aqueous humor total antioxidant capacity(TAC) and the best-corrected visual acuity (BCVA) improvement following cataract surgery. Therewas no significant correlation between aqueous humor TAC and BCVA improvement after surgery.The Spearman correlation coefficient was −0.045 (p value = 0.658). The BCVA was converted to thelogarithm of the minimum angle of resolution (LogMAR) values for analysis.
Antioxidants 2022, 10, x FOR PEER REVIEW 10 of 16
Figure 6. Scatter plot showing the correlation between aqueous humor total antioxidant capacity (TAC) and the best-corrected visual acuity (BCVA) improvement following cataract surgery. There was no significant correlation between aqueous humor TAC and BCVA improvement after surgery. The Spearman correlation coefficient was −0.045 (p value = 0.658). The BCVA was converted to the logarithm of the minimum angle of resolution (LogMAR) values for analysis.
Figure 7. Scatter plot showing the correlation between aqueous humor total antioxidant capacity (TAC) and changes in intraocular pressure (IOP) after cataract surgery. There was no significant
Figure 7. Scatter plot showing the correlation between aqueous humor total antioxidant capacity(TAC) and changes in intraocular pressure (IOP) after cataract surgery. There was no significantcorrelation between aqueous humor TAC and IOP changes after surgery. The Spearman correlationcoefficient was 0.027 (p value = 0.785).
Antioxidants 2022, 11, 397 10 of 15
4. Discussion
This is a preliminary study to examine the proportional contribution of AA to aque-ous humor TAC in cataract patients. Using the TAC assay we developed, we furtherinvestigated the correlation between aqueous humor TAC and cataract severity, surgicalefficacy, and surgical safety. Most importantly, we found that aqueous humor TAC levelprovided a significant correlation to cataract severity, which is presented in the relationbetween aqueous humor TAC/AA and CDE/LOCS III cataract severity of NO and CC.Although previous studies have reported that antioxidants are associated with reducedrisk of cataract development, most of them were epidemiological studies, nutrition studies,or serum-based studies, none of which involves direct contact with the lens because ofthe blood–ocular barrier [25,26]. To provide insight into the correlation between TAC andcataractogenesis, we chose to directly analyze aqueous humor, the primary circulatorysystem of the lens.
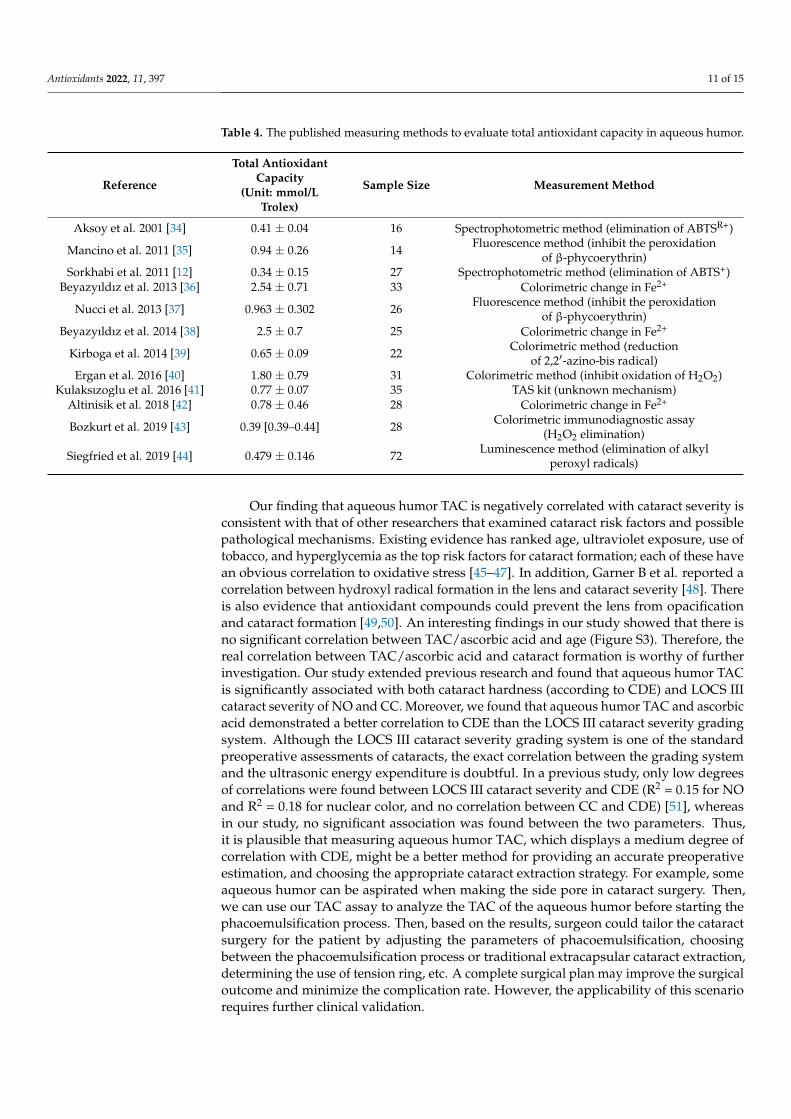
There are several ways to evaluate the TAC, including the oxygen radical absorbancecapacity (ORAC) assay [27], the DPPH assay [28], the Trolox equivalent antioxidant ca-pacity (TEAC) assay [29], the ferric reducing antioxidant power (FRAP) assay [30], thecupric reducing antioxidant capacity (CUPRAC) assay [31], etc. However, because ofthe complexity of TAC, which includes enzymes, proteins, and small molecules, none ofthe assays could completely evaluate the antioxidant capacity of all these antioxidants.Furthermore, because of the different mechanisms and targets of each assay, the assays mayshow incoherent results between each other [32,33]. Therefore, choosing an appropriateTAC assay that could represent the majority of the TAC in the sample is important. Table 4demonstrates the published measuring methods to evaluate TAC in aqueous humor. Al-though there were obvious differences in the TAC results measured by different assays,we could find that most researchers choose to use colorimetric change based on Fe2+ toevaluate the TAC in aqueous humor, and their results showed much more TAC in aqueoushumor than the rest. This result may be because small molecules are major componentsof TAC in aqueous humor, and colorimetric change based on metal ions is an appropriatemethod to evaluate small-molecular-type antioxidants. However, there are still severaldrawbacks of the current, commercially available FRAP assay. First, the relatively largesample volume requirement, and second, the requirement of low pH level to maintain thestability of Fe3+-TPTZ compound. Therefore, we have developed our own assay based oncopper (II) redox reactions to measure the TAC in aqueous humor [11]. In our previouslypublished paper, we developed our TAC assay to measure TAC in aqueous humor, whichrequires only 10 µL sample per test. In addition, it could produce results with high accuracy,insistence, and good stability among a wide range of pH levels and experimental times.We also compared the results with commercially available FRAP assay, which showedhigh consistency. Furthermore, we built up the standard curve by ascorbic acid, which isthe most abundant antioxidant in aqueous humor. This increased the similarity betweenstandard solution and clinical samples. Therefore, although our TAC assay still could notmeasure all the antioxidants in aqueous humor, we believe that our own developed TACassay may be the most appropriate TAC assay to evaluate TAC in aqueous humor.
Antioxidants 2022, 11, 397 11 of 15
Table 4. The published measuring methods to evaluate total antioxidant capacity in aqueous humor.
Reference
Total AntioxidantCapacity
(Unit: mmol/LTrolex)
Sample Size Measurement Method
Aksoy et al. 2001 [34] 0.41 ± 0.04 16 Spectrophotometric method (elimination of ABTSR+)
Mancino et al. 2011 [35] 0.94 ± 0.26 14 Fluorescence method (inhibit the peroxidationof β-phycoerythrin)
Sorkhabi et al. 2011 [12] 0.34 ± 0.15 27 Spectrophotometric method (elimination of ABTS+)Beyazyıldız et al. 2013 [36] 2.54 ± 0.71 33 Colorimetric change in Fe2+
Nucci et al. 2013 [37] 0.963 ± 0.302 26 Fluorescence method (inhibit the peroxidationof β-phycoerythrin)
Beyazyıldız et al. 2014 [38] 2.5 ± 0.7 25 Colorimetric change in Fe2+
Kirboga et al. 2014 [39] 0.65 ± 0.09 22 Colorimetric method (reductionof 2,2′-azino-bis radical)
Ergan et al. 2016 [40] 1.80 ± 0.79 31 Colorimetric method (inhibit oxidation of H2O2)Kulaksızoglu et al. 2016 [41] 0.77 ± 0.07 35 TAS kit (unknown mechanism)
Altinisik et al. 2018 [42] 0.78 ± 0.46 28 Colorimetric change in Fe2+
Bozkurt et al. 2019 [43] 0.39 [0.39–0.44] 28 Colorimetric immunodiagnostic assay(H2O2 elimination)
Siegfried et al. 2019 [44] 0.479 ± 0.146 72 Luminescence method (elimination of alkylperoxyl radicals)
Our finding that aqueous humor TAC is negatively correlated with cataract severity isconsistent with that of other researchers that examined cataract risk factors and possiblepathological mechanisms. Existing evidence has ranked age, ultraviolet exposure, use oftobacco, and hyperglycemia as the top risk factors for cataract formation; each of these havean obvious correlation to oxidative stress [45–47]. In addition, Garner B et al. reported acorrelation between hydroxyl radical formation in the lens and cataract severity [48]. Thereis also evidence that antioxidant compounds could prevent the lens from opacificationand cataract formation [49,50]. An interesting findings in our study showed that there isno significant correlation between TAC/ascorbic acid and age (Figure S3). Therefore, thereal correlation between TAC/ascorbic acid and cataract formation is worthy of furtherinvestigation. Our study extended previous research and found that aqueous humor TACis significantly associated with both cataract hardness (according to CDE) and LOCS IIIcataract severity of NO and CC. Moreover, we found that aqueous humor TAC and ascorbicacid demonstrated a better correlation to CDE than the LOCS III cataract severity gradingsystem. Although the LOCS III cataract severity grading system is one of the standardpreoperative assessments of cataracts, the exact correlation between the grading systemand the ultrasonic energy expenditure is doubtful. In a previous study, only low degreesof correlations were found between LOCS III cataract severity and CDE (R2 = 0.15 for NOand R2 = 0.18 for nuclear color, and no correlation between CC and CDE) [51], whereasin our study, no significant association was found between the two parameters. Thus,it is plausible that measuring aqueous humor TAC, which displays a medium degree ofcorrelation with CDE, might be a better method for providing an accurate preoperativeestimation, and choosing the appropriate cataract extraction strategy. For example, someaqueous humor can be aspirated when making the side pore in cataract surgery. Then,we can use our TAC assay to analyze the TAC of the aqueous humor before starting thephacoemulsification process. Then, based on the results, surgeon could tailor the cataractsurgery for the patient by adjusting the parameters of phacoemulsification, choosingbetween the phacoemulsification process or traditional extracapsular cataract extraction,determining the use of tension ring, etc. A complete surgical plan may improve the surgicaloutcome and minimize the complication rate. However, the applicability of this scenariorequires further clinical validation.
Antioxidants 2022, 11, 397 12 of 15
The superior correlation between aqueous humor TAC and cataract severity might beattributable to the objective and quantitative recording system, and the close relationship be-tween oxidative stress and cataract formation. On the other hand, our findings revealed nosignificant associations between aqueous humor TAC and the surgical efficacy or surgicalsafety evaluated by BCVA and IOP. These results are reasonable according to previous stud-ies showing that CDE was not associated with postoperative IOP changes [52]. However,previous studies have delineated the correlation between CDE and postoperative dry eyeincidence, intraocular mechanical trauma, macular edema incidence, retinal vasculature,and perfusion density [53–56]. Moreover, there is a more significant correlation betweenCDE and corneal endothelial cell loss during the phacoemulsification process [6,57,58].Although there is no evidence directly explaining the correlation between aqueous humorTAC and cataract surgical outcomes, aqueous humor TAC has the potential to be influential.As we have revealed the moderate correlation between aqueous humor TAC and CDE, thecorrelations between aqueous humor TAC and more aspects of clinical cataract surgicaloutcomes are worthy of further research.
There are several limitations of this study. As an invasive procedure was necessaryto obtain the aqueous humor sample, the recruitment of healthy subjects was prohibited,and a control group was not possible. Examining aqueous humor TAC levels repeatedlyin a longitudinal follow-up setting was also not possible. To overcome these limitationsand provide a trustworthy result, we designed the study in a rigorous way. First, weconducted a pilot study to calculate the sample size requirement of this study to reach asatisfactory statistical power. Second, all the patients who participated in this study receivedpreoperative cataract severity evaluations and cataract surgery by the same ophthalmologistto reduce technical bias. Third, we measured the correlation between aqueous humor TACand cataract severity in many ways including the LOCS III cataract severity grading systemfor NO and CC; CDE determined during cataract surgery was used to confirm results. Last,we adjusted the potential confounding factors in all of our regression models and found ageand diabetes mellitus to be significant confounders in our multivariate regression analysis.The other limitation of this study is that we did not enroll and discuss the systemic andtopical medication use of the patients, and the current findings are not sufficient enough toconclude that antioxidant therapy can prevent cataract formation or progression. Furtherclinical trials are warranted to verify the applicability of antioxidant therapy in slowingcataract development.
5. Conclusions
In summary, ascorbic acid contributed to the majority of aqueous humor TAC, andboth the aqueous humor TAC and ascorbic acid demonstrated negative correlations to CDEuse during cataract surgery. Moreover, aqueous humor TAC and ascorbic acid show a bettercorrelation to cataract severity measured by CDE than the current LOCS III cataract severitygrading system. However, there was no significant correlation between aqueous humorTAC and postoperative BCVA and IOP changes. According to these findings, measuring theTAC levels in aqueous humor owns the potential to provide clinicians with a useful cataractseverity scoring system for the determination of cataract extraction strategy; measuringthe TAC levels could also provide the cornerstone and guidance for examining potentialantioxidant-based cataract therapies. Future advancements in optic devices for noninvasiveassessments of aqueous humor TAC would be significantly advantageous to this prescribedprocess and additional processes that may be developed as a result of this guidance.
Supplementary Materials: The following supporting information can be downloaded at: https://www.mdpi.com/article/10.3390/antiox11020397/s1, Figure S1: Flow diagram presenting therecruitment process of the study subjects, Figure S2: Bar chart showing the total antioxidant capacity(TAC) and ascorbic acid concentration (AA) in each LOCS severity score, Figure S3: Scatter plotshowing the correlation between aqueous humor total antioxidant capacity (TAC)/ascorbic acid con-centration (AA) and Patient Age, Table S1: Univariate and Multivariate Linear Regression Analysesof ascorbic acid for cumulative dissipated energy during the phacoemulsification process, Table S2:
Antioxidants 2022, 11, 397 13 of 15
Univariate and multivariate linear regression analyses for cumulative dissipated energy during thephacoemulsification process based on nuclear opalescence and cortical cataract, Table S3: Univariateand multivariate linear regression analyses for the improvement of best-corrected visual acuity aftercataract surgery, Table S4: Univariate and multivariate linear regression analyses for the changes ofintraocular pressure after cataract surgery.
Author Contributions: Conceptualization, Y.-T.T., W.-C.W., K.-J.C., H.-C.C. and C.-M.C.; methodol-ogy, Y.-T.T., H.-C.C. and C.-M.C.; software, Y.-T.T.; validation, Y.-T.T.; formal analysis, C.-F.L. andY.-J.H.; investigation, Y.-T.T.; resources, W.-C.W., K.-J.C. and H.-C.C.; data curation, Y.-T.T., C.-F.L.and Y.-J.H.; writing—original draft preparation, Y.-T.T.; writing—review and editing, C.-M.C. andH.-C.C.; visualization, C.-F.L. and Y.-J.H.; supervision, C.-M.C. and H.-C.C.; project administration,Y.-T.T.; funding acquisition, H.-C.C. All authors have read and agreed to the published version ofthe manuscript.
Funding: This study was funded by research grants from the Ministry of Science and Technology,Taiwan (MOST 110-2221-E-182A-006- to Chen HC), and Chang Gung Memorial Hospital, Linkou,Taiwan (CMRPG3L0601 to Chen HC). The sponsor or funding organization had no role in the designor conduct of this research.
Institutional Review Board Statement: This study was conducted in accordance with the Declarationof Helsinki and approved by the Institutional Review Board of Chang Gung Medical Foundation in2019 (IRB number: 201900017B0).
Informed Consent Statement: Informed consent was obtained from all subjects involved in the study.
Data Availability Statement: Data is contained within the article and supplementary material.
Acknowledgments: The authors thank Hui-Ju Tsai, the Principal Investigator of the Institute of Popu-lation Health Sciences, National Health Research Institutes, and the Maintenance Project of the Centerfor Big Data Analytics and Statistics at Chang Gung Memorial Hospital, for statistical consultation.
Conflicts of Interest: The authors declare no conflict of interest.
References1. Hashemi, H.; Pakzad, R.; Yekta, A.; Aghamirsalim, M.; Pakbin, M.; Ramin, S.; Khabazkhoob, M. Global and regional prevalence
of age-related cataract: A comprehensive systematic review and meta-analysis. Eye 2020, 34, 1357–1370. [CrossRef]2. Pershing, S.; Morrison, D.E.; Hernandez-Boussard, T. Cataract surgery complications and revisit rates among three states.
Am. J. Ophthalmol. 2016, 171, 130–138. [CrossRef] [PubMed]3. Chylack, L.T., Jr.; Wolfe, J.K.; Singer, D.M.; Leske, M.C.; Bullimore, M.A.; Bailey, I.L.; Friend, J.; McCarthy, D.; Wu, S.-Y. The Lens
Opacities Classification System III. Arch. Ophthalmol. 1993, 111, 831–836. [CrossRef] [PubMed]4. Schafer, M.E.; Arbisser, B. Quantification of acoustic exposure during cataract surgery. In Proceedings of the IEEE Ultrasonics
Symposium, Montreal, QC, Canada, 23–27 August 2004; pp. 1828–1831.5. Liu, C.; Liu, Y.; Ye, S.; Liu, L.; Zhang, W.; Wu, M. Effect of topical nonsteroidal anti-inflammatory drugs and nuclear hardness on
maintenance of mydriasis during phacoemulsification surgery. J. Ocul. Pharmacol. Ther. 2014, 30, 831–836. [CrossRef]6. Sorrentino, F.S.; Matteini, S.; Imburgia, A.; Bonifazzi, C.; Sebastiani, A.; Parmeggiani, F. Torsional phacoemulsification: A pilot
study to revise the “harm scale” evaluating the endothelial damage and the visual acuity after cataract surgery. PLoS ONE 2017,12, e0186975. [CrossRef] [PubMed]
7. Coco, G.; Cremonesi, P.; Menassa, N.; Pagano, L.; Gadhvi, K.A.; Semeraro, F.; Kaye, S.B.; Romano, V. Changes in pupillometryassociated with dissipated energy during phacoemulsification. Eur. J. Ophthalmol. 2020, 31, 2962–2968. [CrossRef] [PubMed]
8. Shajari, M.; Rusev, V.; Mayer, W.; Diakonis, V.; Petermann, K.; Kohnen, T. Impact of lens density and lens thickness on cumulativedissipated energy in femtosecond laser–assisted cataract surgery. Lasers Med. Sci. 2019, 34, 1229–1234. [CrossRef]
9. Al-Osaily, A.M.; Al-Jindan, M.Y. Intra-correlations between cataract density based on Scheimpflug image, phacodynamics,surgery duration, and endothelial cell loss after phacoemulsification. Saudi J. Ophthalmol. 2018, 32, 188–193. [CrossRef]
10. Kaur, J.; Kukreja, S.; Kaur, A.; Malhotra, N.; Kaur, R. The oxidative stress in cataract patients. J. Clin. Diagn. Res. 2012, 6, 1629–1632.[CrossRef]
11. Tsao, Y.T.; Wu, W.C.; Chen, K.J.; Yeh, L.K.; Hwang, Y.S.; Hsueh, Y.J.; Chen, H.C.; Cheng, C.M. Analysis of aqueous humor totalantioxidant capacity and its correlation with corneal endothelial health. Bioeng. Transl. Med. 2020, 6, e10199. [CrossRef]
12. Sorkhabi, R.; Ghorbanihaghjo, A.; Javadzadeh, A.; Rashtchizadeh, N.; Moharrery, M. Oxidative DNA damage and total antioxidantstatus in glaucoma patients. Mol. Vis. 2011, 17, 41–46. [PubMed]
13. Gawali, K.S.; Patil, N.B. Catalase activity and total antioxidant capacity in lens epithelial cells of different morphological types ofsenile cataract patients. Int. J. Res. Med. 2016, 5, 92–96.
Antioxidants 2022, 11, 397 14 of 15
14. Mathew, M.C.; Ervin, A.M.; Tao, J.; Davis, R.M. Antioxidant vitamin supplementation for preventing and slowing the progressionof age-related cataract. Cochrane Database Syst. Rev. 2012, 6, CD004567. [CrossRef] [PubMed]
15. Jacques, P.F.; Chylack, L.T., Jr. Epidemiologic evidence of a role for the antioxidant vitamins and carotenoids in cataract prevention.Am. J. Clin. Nutr. 1991, 53, 352S–355S. [CrossRef]
16. Mares, J. Food antioxidants to prevent cataract. JAMA 2015, 313, 1048–1049. [CrossRef]17. Taylor, A.; Jacques, P.F.; Nadler, D.; Morrow, F.; Sulsky, S.I.; Shepard, D. Relationship in humans between ascorbic acid
consumption and levels of total and reduced ascorbic acid in lens, aqueous humor, and plasma. Curr. Eye Res. 1991, 10, 751–759.[CrossRef]
18. Huang, W.; Koralewska-Makár, A.; Bauer, B.; Åkesson, B. Extracellular glutathione peroxidase and ascorbic acid in aqueoushumor and serum of patients operated on for cataract. Clin. Chim. Acta 1997, 261, 117–130. [CrossRef]
19. Cox, J.T.; Subburaman, G.-B.B.; Munoz, B.; Friedman, D.S.; Ravindran, R.D. Visual acuity outcomes after cataract surgery:High-volume versus low-volume surgeons. Ophthalmology 2019, 126, 1480–1489. [CrossRef]
20. Schulze-Bonsel, K.; Feltgen, N.; Burau, H.; Hansen, L.; Bach, M. Visual Acuities “Hand Motion” and “Counting Fingers” Can BeQuantified with the Freiburg Visual Acuity Test. Investig. Ophthalmol. Vis. Sci. 2006, 47, 1236–1240. [CrossRef]
21. Shichi, H.; Page, T.; Sahouri, M.J.; Shin, D.H. Microplate assay of ascorbic acid in aqueous humor with bicinchoninic acid.J. Ocul. Pharmacol. Ther. 1997, 13, 201–206. [CrossRef]
22. Rubio, C.P.; Hernández-Ruiz, J.; Martinez-Subiela, S.; Tvarijonaviciute, A.; Ceron, J.J. Spectrophotometric assays for totalantioxidant capacity (TAC) in dog serum: An update. BMC Vet. Res. 2016, 12, 166. [CrossRef] [PubMed]
23. Choy, C.K.M.; Benzie, I.F.F.; Cho, P. Ascorbic acid concentration and total antioxidant activity of human tear fluid measured usingthe FRASC assay. Investig. Ophthalmol. Vis. Sci. 2000, 41, 3293–3298.
24. Faul, F.; Erdfelder, E.; Lang, A.-G.; Buchner, A. G* Power 3: A flexible statistical power analysis program for the social, behavioral,and biomedical sciences. Behav. Res. Methods 2007, 39, 175–191. [CrossRef] [PubMed]
25. Gale, C.R.; Hall, N.F.; Phillips, D.I.; Martyn, C.N. Plasma antioxidant vitamins and carotenoids and age-related cataract.Ophthalmology 2001, 108, 1992–1998. [CrossRef]
26. Li, L.; Duker, J.S.; Yoshida, Y.; Niki, E.; Rasmussen, H.; Russell, R.M.; Yeum, K.-J. Oxidative stress and antioxidant status in olderadults with early cataract. Eye 2009, 23, 1464–1468. [CrossRef]
27. Cao, G.; Alessio, H.M.; Cutler, R.G. Oxygen-radical absorbance capacity assay for antioxidants. Free Radic. Biol. Med. 1993, 14,303–311. [CrossRef]
28. Blois, M.S. Antioxidant determinations by the use of a stable free radical. Nature 1958, 181, 1199–1200. [CrossRef]29. Miller, N.J.; Rice-Evans, C.; Davies, M.J.; Gopinathan, V.; Milner, A. A novel method for measuring antioxidant capacity and its
application to monitoring the antioxidant status in premature neonates. Clin. Sci. 1993, 84, 407–412. [CrossRef]30. Benzie, I.F.; Strain, J.J. The ferric reducing ability of plasma (FRAP) as a measure of “antioxidant power”: The FRAP assay.
Anal. Biochem. 1996, 239, 70–76. [CrossRef]31. Apak, R.; Güçlü, K.; Özyürek, M.; Karademir, S.E. Novel total antioxidant capacity index for dietary polyphenols and vitamins C
and E, using their cupric ion reducing capability in the presence of neocuproine: CUPRAC method. J. Agric. Food Chem. 2004, 52,7970–7981. [CrossRef]
32. Prior, R.L.; Cao, G. In vivo total antioxidant capacity: Comparison of different analytical methods1. Free Radic. Biol. Med. 1999, 27,1173–1181. [CrossRef]
33. Cao, G.; Prior, R.L. Comparison of different analytical methods for assessing total antioxidant capacity of human serum.Clin. Chem. 1998, 44, 1309–1315. [CrossRef] [PubMed]
34. Aksoy, H.; Keles, S.; Koçer, I.; Akçay, F. Diabetic cataract and the total antioxidant status in aqueous humor. De Gruyter 2001, 39,143–145. [CrossRef] [PubMed]
35. Mancino, R.; Di Pierro, D.; Varesi, C.; Cerulli, A.; Feraco, A.; Cedrone, C.; Pinazo-Duran, M.D.; Coletta, M.; Nucci, C. Lipidperoxidation and total antioxidant capacity in vitreous, aqueous humor, and blood samples from patients with diabetic retinopathy.Mol. Vis. 2011, 17, 1298. [PubMed]
36. Beyazyıldız, E.; Çankaya, A.B.; Ergan, E.; Anayol, M.A.; Özdamar, Y.; Sezer, S.; Tırhıs, M.H.; Yılmazbas, P.; Öztürk, F. Changesof total antioxidant capacity and total oxidant status of aqueous humor in diabetes patients and correlations with diabeticretinopathy. Int. J. Ophthalmol. 2013, 6, 531. [PubMed]
37. Nucci, C.; Di Pierro, D.; Varesi, C.; Ciuffoletti, E.; Russo, R.; Gentile, R.; Cedrone, C.; Duran, M.D.P.; Coletta, M.; Mancino, R.Increased malondialdehyde concentration and reduced total antioxidant capacity in aqueous humor and blood samples frompatients with glaucoma. Mol. Vis. 2013, 19, 1841.
38. Beyazyıldız, E.; Çankaya, A.B.; Beyazyıldız, Ö.; Ergan, E.; Çelik, H.T.; Yılmazbas, P.; Öztürk, F. Disturbed oxidant/antioxidantbalance in aqueous humour of patients with exfoliation syndrome. Jpn. J. Ophthalmol. 2014, 58, 353–358. [CrossRef]
39. Kirboga, K.; Ozec, A.V.; Kosker, M.; Dursun, A.; Toker, M.I.; Aydin, H.; Erdogan, H.; Topalkara, A.; Arici, M.K. The associationbetween diabetic retinopathy and levels of ischemia-modified albumin, total thiol, total antioxidant capacity, and total oxidativestress in serum and aqueous humor. J. Ophthalmol. 2014, 2014, 820853. [CrossRef]
40. Ergan, E.; Ozturk, F.; Beyazyildiz, E.; Elgin, U.; Sen, E.; Cankaya, A.B.; Celik, T. Oxidant/antioxidant balance in the aqueoushumor of patients with glaucoma. Int. J. Ophthalmol. 2016, 9, 249.
Antioxidants 2022, 11, 397 15 of 15
41. Kulaksızoglu, S.; Karalezli, A. Aqueous humour and serum levels of nitric oxide, malondialdehyde and total antioxidant status inpatients with type 2 diabetes with proliferative diabetic retinopathy and nondiabetic senile cataracts. Can. J. Diabetes 2016, 40,115–119. [CrossRef]
42. Altinisik, M.; Koytak, A.; Elbay, A.; Toklu, E.; Sezer, T.; Kocyigit, A. Oxidant-antioxidant balance in the aqueous humor of patientswith retinal vein occlusion. In The Seminars in Ophthalmology; Taylor & Francis: Abingdon, UK, 2018; pp. 675–682.
43. Bozkurt, E.; Çakır, B.; Çelik, E.; Dogan, E.; Uçak, T.; Alagöz, G. Correlation of the aqueous humor total antioxidant capacity, totaloxidant status, and levels of IL-6 and VEGF with diabetic retinopathy status. Arq. Bras. Oftalmol. 2019, 82, 136–140. [CrossRef][PubMed]
44. Siegfried, C.J.; Shui, Y.-B. Intraocular oxygen and antioxidant status: New insights on the effect of vitrectomy and glaucomapathogenesis. Am. J. Ophthalmol. 2019, 203, 12–25. [CrossRef] [PubMed]
45. Vinson, J.A. Oxidative stress in cataracts. Pathophysiology 2006, 13, 151–162. [CrossRef] [PubMed]46. Singh, S.; Pardhan, S.; Kulothungan, V.; Swaminathan, G.; Ravichandran, J.S.; Ganesan, S.; Sharma, T.; Raman, R. The prevalence
and risk factors for cataract in rural and urban India. Indian J. Ophthalmol. 2019, 67, 477–483. [CrossRef]47. Tang, Y.; Wang, X.; Wang, J.; Jin, L.; Huang, W.; Luo, Y.; Lu, Y. Risk factors of age-related cataract in a Chinese adult population:
The Taizhou Eye Study. Clin. Exp. Ophthalmol. 2018, 46, 371–379. [CrossRef]48. Garner, B.; Davies, M.J.; Truscott, R.J. Formation of hydroxyl radicals in the human lens is related to the severity of nuclear
cataract. Exp. Eye Res. 2000, 70, 81–88. [CrossRef]49. Nakazawa, Y.; Nagai, N.; Ishimori, N.; Oguchi, J.; Tamura, H. Administration of antioxidant compounds affects the lens chaperone
activity and prevents the onset of cataracts. Biomed. Pharmacother. 2017, 95, 137–143. [CrossRef]50. Ma, Z.; Liu, J.; Li, J.; Jiang, H.; Kong, J. Klotho ameliorates the onset and progression of cataract via suppressing oxidative stress
and inflammation in the lens in streptozotocin-induced diabetic rats. Int. Immunopharmacol. 2020, 85, 106582. [CrossRef]51. Davison, J.A.; Chylack, L.T., Jr. Clinical application of the lens opacities classification system III in the performance of phacoemul-
sification. J. Cataract Refract. Surg. 2003, 29, 138–145. [CrossRef]52. Lee, R.Y.; Chen, R.I.; Kasuga, T.; Cui, Q.N.; Porco, T.C.; Lin, S.C. The Effect of Cumulative Dissipated Energy on Changes in
Intraocular Pressure Following Uncomplicated Cataract Surgery by Phacoemulsification. J. Glaucoma 2016, 25, 565. [CrossRef]53. Sahu, P.; Das, G.; Malik, A.; Biakthangi, L. Dry eye following phacoemulsification surgery and its relation to associated
intraoperative risk factors. Middle East Afr. J. Ophthalmol. 2015, 22, 472. [CrossRef]54. Charles Crozafon, P.; Bouchet, C.; Zignani, M.; Griner, R.; Foster, S.D.; Zou, M.; Dhariwal, M. Comparison of real-world treatment
outcomes of femtosecond laser-assisted cataract surgery and phacoemulsification cataract surgery: A retrospective, observationalstudy from an outpatient clinic in France. Eur. J. Ophthalmol. 2021, 31, 1809–1816. [CrossRef] [PubMed]
55. Anastasilakis, K.; Mourgela, A.; Symeonidis, C.; Dimitrakos, S.A.; Ekonomidis, P.; Tsinopoulos, I. Macular edema after uncom-plicated cataract surgery: A role for phacoemulsification energy and vitreoretinal interface status? Eur. J. Ophthalmol. 2015, 25,192–197. [CrossRef] [PubMed]
56. Zhou, Y.; Zhou, M.; Wang, Y.; Ben, S.; Gao, M.; Zhang, S.; Liu, H.; Sun, X. Short-term changes in retinal vasculature and layerthickness after phacoemulsification surgery. Curr. Eye Res. 2020, 45, 31–37. [CrossRef] [PubMed]
57. Mahdy, M.A.S.; Eid, M.Z.; Mohammed, M.A.-B.; Hafez, A.; Bhatia, J. Relationship between endothelial cell loss and microcoaxialphacoemulsification parameters in noncomplicated cataract surgery. Clin. Ophthalmol. 2012, 6, 503. [CrossRef] [PubMed]
58. Gonen, T.; Sever, O.; Horozoglu, F.; Yasar, M.; Keskinbora, K.H. Endothelial cell loss: Biaxial small-incision torsional phacoemulsi-fication versus biaxial small-incision longitudinal phacoemulsification. J. Cataract Refract. Surg. 2012, 38, 1918–1924. [CrossRef][PubMed]
Related Documents