The 2015 Nonprofit Employee Benefits Survey COMPREHENSIVE ANALYSIS AN ANNUAL RESEARCH REPORT BY PPI BENEFIT SOLUTIONS (PPI)

Welcome message from author
This document is posted to help you gain knowledge. Please leave a comment to let me know what you think about it! Share it to your friends and learn new things together.
Transcript

The 2015 Nonprofit Employee Benefits Survey
COMPREHENSIVE ANALYSIS
AN ANNUAL RESEARCH REPORT BY PPI BENEFIT SOLUTIONS (PPI)

03
04
09
11
12
14
20
23
25
28
29
31
•
•
•
•
•
•
•
•
•
•
•
•
Page 2PPI Benefit Solutions 2015 Nonprofit Employee Benefits Survey
TABLE OF CONTENTSRE
SULT
SExecutive Summary
Prevalence of Benefits
Selecting Benefit Plans
Enrollment Methods
Eligibility and Waiting Periods
Contribution Strategies
Copays, Coinsurance, and Deductibles
Prescriptions
Compliance
Conclusion
Overview of Participants
About the Survey

Page 3PPI Benefit Solutions 2015 Nonprofit Employee Benefits Survey
2015 is a monumental year for employer-sponsored benefits as the Affordable Care Act’s (ACA) Employer Mandate, or “Pay or Play,” became effective January 1st for employers with 100 or more full-time equivalent employees. In addition to the perennial strain of rising healthcare costs, these unprecedented regulatory changes are putting additional pressure on employers as they determine if, when, and how the law applies, whether they qualify for a delay in its implementation, what constitutes a full-time employee, and how to satisfy the new IRS reporting requirements. Our 2015 Nonprofit Employee Benefits Survey results indicate that nonprofits’ understanding of the ACA has dropped: in 2014, 92% of surveyed nonprofits felt they had at least a moderate understanding of the law; in 2015 that number plummeted to 47%. In 2014, 18% of employers felt that they were extremely knowledgeable of the ACA, only 5% made that claim in 2015.
Although few nonprofit organizations (NPOs) are going so far as to eliminate healthcare benefits or reduce their employee-only premium contributions as a result of the ACA, they are changing the types of plans being offered and decreasing dependent contributions, thus shifting more cost onto employees. This trend is reflected among our 2015 survey results. 56% of surveyed nonprofits now have a Health Savings Account (HSA) option in place, up from only 12% in 2014, evidence that consumer directed health plans (CDHPs) are quickly gaining momentum throughout the nonprofit sector.
As a trade-off for lower premiums, HSA-compatible plans feature high deductibles, exposing consumers to the true costs of the care they receive. To help offset these high deductibles, more employers are offering group voluntary products that feature very low premiums and help reduce an employee’s overall out-of-pocket expenses. One might infer that access to these products supports nonprofit employee retention efforts, which can be a challenge in an accelerating economy.
EXECUTIVE SUMMARY
Although not highest on the list of challenges, easing the benefits administration burden through automation can impact the bottom line, especially given the volume of data employers must maintain and harvest to comply with new regulations. In addition, we see less resistance to employee self-service, as former concerns about the lack of Internet access and familiarity among personnel are waning. In 2014, 15% of surveyed nonprofits used employee self-service, and in 2015, that number has increased to 23%. As more NPOs embrace technology to manage their operations, it is likely that employee self-service adoption will continue on this upward trend. We hope the following survey report provides you with helpful information! We welcome your feedback and ideas for future surveys.
Key 2015 Results:
Nonprofits are growing less confident in their understanding of Healthcare Reform (ACA) as new regulations are put into effect: see page 25.
The majority of nonprofits have not calculated the cost of compliance with Healthcare Reform (ACA): see page 25.
More employers are offering High Deductible Health Plans and Tax Advantage Accounts to control costs: see page 6.
The prevalence of voluntary benefits continues to rise as a way to increase choice for employees at little to no cost for employers: see page 6.
The transition away from paper enrollment has been slow among nonprofits, but use of online self-service is steadily increasing: see page 11.

Page 4PPI Benefit Solutions 2015 Nonprofit Employee Benefits Survey
PREVALENCE OF BENEFITS
The most prevalent benefits among surveyed nonprofits are group medical, group dental, and employer-paid life insurance, each of which are offered by more than 90% of participants. Nearly 100% of participants offer group medical to employees, which may be a result of new regulations imposed by Healthcare Reform (ACA).
These regulations state that beginning in 2015, employers with 100 or more full-time employees (which made up about 75% of our 2015 survey participants) must offer affordable medical coverage to full-time employees, and their dependents, or be subject to certain penalties.
All Benefits.
Other Membership or Discount Programs
Pet Insurance
Tuition Assistance/Continuing Education
Identity Theft
Doctors by phone or online
Group Legal
Long-Term Care
Cancer Benefit
Critical Illness
Accident Insurance (separate from AD&D)
Voluntary Short-Term Disability (STD)
Voluntary Long-Term Disability (LTD)
Voluntary Vision
Voluntary Dental
Supplemental Medical
Child Life
Spouse Life
Voluntary Life
Group Short-Term Disability (STD)
Group Long-Term Disability (LTD)
Group Vision
Tax Advantage Accounts (HSA, HRA, FSA, etc.)
Employer-Paid Life Insurance
Group Dental (of any plan type)
Group Medical
7.1%
35.4%
7.1%
29.2%
4.6%
5.8%
18.3%
10.8%
25.4%
20.4%
34.2%
22.1%
31.7%
28.3%
36.3%
8.3%
54.6%
49.2%
70.4%
80.9%
47.1%
94.7%
93.5%
19.6%
98.8%

Medical Plans.
Preferred Provider Organizations (PPOs) are the most common medical plan type offered by surveyed nonprofits. In addition, 55.6% of nonprofit medical plans can be categorized as a High Deductible Health Plan (HDHP). HDHPs have lower premiums and higher deductibles than traditional health plans.
Page 5PPI Benefit Solutions 2015 Nonprofit Employee Benefits Survey
What’s the Difference Between a Medical PPO, POS, HMO, and EPO?
Dental Plans.
Preferred Provider Organizations (PPOs) are the most common dental plan type offered by surveyed nonprofits, accounting for 73.7% of results.
The general characteristics of a dental PPO, POS, and DMO/DHMO (refer to HMO in the chart) are comparable to medical, so please refer to the chart on the left for basic guidance.
A dental plan described as a “monthly switch” allows employees to switch between a DMO/DHMO and either a PPO or indemnity plan. An indemnity plan, or fee-for-service plan, reimburses the covered person for incurred expenses once the deductible is met.
Have To Stay In-Network? Cost-Sharing Advantages/
Disadvantages
PPO (Preferred Provider
Organization)No Deductible,
copay
Flexibility; no referrals;
expensive copays
POS (Point of Service) No Deductible,
copayLower cost if in-network
HMO (Health Maintenance Organization)
Yes, except emergencies Copay
Lower cost; less freedom to choose provider
EPO (Exclusive Provider
Organization)Yes Copay
Lower cost; more restrictive
network
Indemnity
Monthly Switch
DMO/DHMO
POS
PPO 73.7%
10.5%
39.8%
2.3%
4.7%
HDHP
EPO
Indemnity
HMO
POS
PPO 54.6%
35.2%
31.9%
0.5%
21.3%
55.6%

1) More HDHPs
2) More Tax Advantage Accounts*Graph shows change from 2014 to 2015
3) More Voluntary Benefits*Graph shows change from 2014 to 2015
Perc
enta
ge
Page 6PPI Benefit Solutions 2015 Nonprofit Employee Benefits Survey
Tax Advantage Accounts.
Flexible Spending Accounts (FSAs) are the most common type of tax advantage account offered by nonprofits, accounting for 82.0% of results. This shows a 23.8% increase over 2014, when FSAs were offered by 58.2% of participants.
Who contributes?
Who owns the account?
Does the money roll over?
HSA (Health Savings
Account)
Employer or employee Employee Yes
HRA (Health Reimbursement
Account)Employer only Employer Employer
decides
FSA (Flexible Spending Account)
Employer or employee Employer
Some employers allow up to $500;
otherwise the money goes back to the
employer
What’s the Difference Between an HSA, HRA, and FSA?
INSIGHT: More Employers Offering HDHPs, Tax Advantage Accounts, and Voluntary Benefits to Help Control Costs
Transit/Parking
Dependent CareSpending Account
Limited Purpose FSA
FSA
HRA
HSA
49.6%
55.6%
82.0%
51.9%
69.9%
27.8%
0
20
40
60
80
100
FSA
HSA
HRA
Perc
enta
ge0
10
20
30
40
50
Critical Illness
Transit
Cancer
30
40
50
60
2014
2015
2013
Perc
enta
ge

Employer-Paid Life Insurance. Paid Leave.
Page 7PPI Benefit Solutions 2015 Nonprofit Employee Benefits Survey
The most common employer-paid life insurance is “1X Salary,” accounting for 36.1% of results. Of the 8.4% of participants who selected “other,” 65% wrote in “1.5X Salary”.
Paid time off (bundled vacation,
sick, personal days)
Paid time off annual rollover allowance
Bought time off
Floating holidays
Paid sick leavecash-out option
Vacation days
Parental leave/ Elder care
Military leave
Paternity leave
Holidays
Personal days
Bereavement
Sick leave
39.1%
28.2%
2.9%
96.0%
32.8%
79.9%
7.5%
75.3%
59.8%
83.3%
26.4%
40.8%
28.7%
The most prevalent paid leave benefits offered by nonprofits are holidays, bereavement time, and sick leave. Vacation days and personal days are also offered by the large majority.
3.0% 3X Salary
36.1%1X Salary
22.3%2X Salary
0.0% 5X Salary
0.6%4X Salary
9.0% $40,000 to $74,999
9.6%$1 to $19,999
9.0%$20,000 to $39,999
8.4% Other
1.8%$75,000 or more
Multiple of Annual Income:
Fixed Dollar Amount:

Wellness Programs.
Page 8PPI Benefit Solutions 2015 Nonprofit Employee Benefits Survey
Employee AssistancePrograms (EAP)
66.9%Flu vaccinations
51.9%
Gym membership discount or reimbursement
Health fairs
Health/biometricscreenings
Healthcare advocate/coach
Services provided by a third party wellness company
Onsite gym facility
Nutritional counseling
Premium discounts for participation in a wellness program
Premium discount for completing a Health Risk Assessment
Premium discount for participation in a weight loss program
Premium discounts for not using tobacco products
Telemedicine Services
39.1% 24.8%
20.3% 19.5%
14.3% 13.5%
12.8% 9.8%
8.3% 5.3%
4.5% 3.0%
Employee assistance programs (EAPs) are the most common wellness benefit offered by nonprofit employers, as reported by 66.9% of participants. This represents a 7.5% increase from 2014 results, and a 33% increase since 2013. Following EAPs are flu vaccinations, gym membership discounts or reimbursements, health fairs, and health/biometric screenings.

97.3% 85.9% 80.4% 79.6%
Key
SELECTING BENEFIT PLANS
Extremely important
Very important
Moderately important
Slightly important
Not at all important
Objectives.
Not surprisingly, the number one objective when selecting benefit plans continues to be “controlling costs,” as indicated by the 97.3% of participants who rated it “very” to “extremely” important. This was considered the top objective in both 2013 and 2014 as well. Following this is “attracting and retaining employees” and “increasing employee job satisfaction.” This combination of trying to control the cost of benefits while using them to attract talent and improve employee job satisfaction creates a tough balancing act for employers.
Nearly 80% of employers also consider “providing benefit options that are easy to understand” a top objective. Very few participantsconsider any of the listed objectives to be “slightly” to “not at all important.”
Page 9PPI Benefit Solutions 2015 Nonprofit Employee Benefits Survey
Objectives Considered “Very” to “Extremely” Important
Controlling costs
Attracting & retaining employees
Increasing employee job satisfaction
Providing benefit options that are easy to understand
97.3% 85.9% 80.4% 79.6%
97.3% 85.9% 80.4% 79.6%
97.3% 85.9% 80.4% 79.6%
Encouraging healthy lifestyles
Addressing employees' diverse needs
Providing benefit options that areeasy to understand
Reducing benefit administration costs
Increasing employee job satisfaction
Attracting & retaining employees
Controlling costs 75.2%
41.8%
31.8%
35.9%
34.1%
28.6%
32.0%
44.1%
22.1%
48.6%
38.2%
45.5%
40.5%
35.6%
13.2%
18.2%
20.9%
17.7%
25.5%
25.6%
5.0%
5.5%
Statistics less than 5% are not labeled

Key
Challenges.
Extremely challenging
Very challenging
Moderately challenging
Slightly challenging
Not at all challenging
The most challenging factor when providing employee benefits is “cost to nonprofit,” as indicated by the 89.4% of participants who rated this “very” to “extremely” challenging. “Cost to employees” is the second most challenging factor, and has been a rising concern since 2009.
It is surprising that the number of participants who consider “Healthcare Reform Implementation” to be “extremely challenging” has decreased almost 10% in the last year, from 28.3% in 2014 to 18.4% in 2015. This contradicts results listed later in this report which show that nonprofits are growing less confident in their understanding of Healthcare Reform. We suspect that this is because nonprofits have begun relying more heavily on their brokers or benefits administrators when it comes to Healthcare Reform, and therefore see it as less of a challenge.
Page 10PPI Benefit Solutions 2015 Nonprofit Employee Benefits Survey
“Cost to Employees” Has Steadily
Increased as a Top Challenge
Since 2009
40
50
60
70
80
2014 2015
2013
200947.0%
70.0%
78.7% 79.3%
Statistics less than 5% are not labeled
Meeting the needs of diverseemployee populations
Healthcare Reform Implementation
Employee resistance to change
Compliance with state and federalregulations
Competition for talent
Employee education andcommunication
Administrative burden
Plan design/quality of benefitsand networks
Cost to employees
Cost to nonprofit 59.4% 30.9% 9.7%
42.9% 36.4% 14.3%
20.5% 38.1% 28.8%
11.2% 20.5% 43.7%
10.2% 31.5% 37.0%
9.9% 22.5% 38.5%
13.8% 20.3% 32.3%
12.0% 30.4% 35.0%
18.4% 26.9% 34.0%
15.3% 25.9% 40.3%
20.0%
24.0%
19.7%
15.7%
15.7%
14.2%
14.8%
9.8%
9.4%
9.7%
5.6%
6.9%
6.6%

ENROLLMENT METHODS
Paper
One-On-One Meetings
Online Employee Self-Service
Telephonic
Page 11PPI Benefit Solutions 2015 Nonprofit Employee Benefits Survey
Paper EnrollmentDecreasing
Online Employee Self-Service Increasing
5
10
15
20
25
2014
2015
2013
Perc
enta
ge
INSIGHT: Nonprofit Use of Employee Self-Service Steadily Increasing
2014
2015
100
80
60
Perc
enta
gePe
rcen
tage
Group Meetings
Paper enrollment is the most widely used enrollment method among nonprofit employers. Although paper has been the top result for the last several years, its prevalence has begun to decline, dropping from 83.8% in 2014 to 72.8% in 2015.
We find it surprising that nonprofits still rely so heavily on paper, while corporate employers continue to move towards paperless enrollment.We expect to see this downward trend continue in years to come.
In comparison, online employee self-service rose from 14.5% in 2014 to 22.8% in 2015.
Why Are Nonprofits Moving to Employee Self-Service?
• Reduces burden on limited staff by eliminating time consuming and tedious paper processing
• Empowers employees to become more involved in their benefits
• Increases security of employees’ personal and identifiable information
• Easier to manage eligibility data over multiple classes of employees
• Gives employees 24/7 access to benefits information
72.8% 55.8%
49.1% 22.8%
3.6%
11.0%
8.3%
5.7%

Page 12PPI Benefit Solutions 2015 Nonprofit Employee Benefits Survey
ELIGIBILITY AND WAITING PERIODSMedical Eligibility.
A majority of nonprofits, 52.1%, require employees to work 30 hours per week to be eligible for medical benefits. This was true in 2014 as well, and accounted for 35.2% of results.
To be eligible for medical benefits, 12.4% of participants still require employees to work more than 30 hours per week. Depending on the size of the employer and its orientation period, this may not comply with ACA requirements.
What is the ACA’s Employer Mandate?
The ACA’s Employer Mandate requires employers to offer health insurance that is affordable and provides minimum value to their full-time employees and dependents or face penalties.
Who does this apply to?
Who is considered a full-time employee?An employee who works an average of 30 hours or more per week.
Who is considered a full-time equivalent employee?A combination of employees, each of whom individually is not full-time, but who, in combination, are equivalent to a full-time employee.
What does “minimum value” mean?A plan provides “minimum value” if it is designed to pay at least 60% of the total cost of medical services for a standard population.
How is “affordable” coverage determined?Coverage is considered “affordable” if the employee’s contribution for self-only coverage does not exceed 9.5% of the employee’s wages.
For more information, please see our Healthcare Reform Kit at ppibenefits.com/HCR-Kit.
2015 2016
Employers with 1-49 Full-Time
Equivalent EmployeesN/A N/A
Employers with 50-99 Full-Time
Equivalent Employees
Additional one-year delay as long as certain
conditions are met
Employer must offer coverage to 95% of full-time employees
Employers with 100 or More
Full-Time Equivalent Employees
Employer must offer coverage to 70% of full-time employees
Employer must offer coverage to 95% of full-time employees
30 Hrs/Wk52.1%
21-29 Hrs/Wk16.6%
20 Hrs/Wk15.2%
More than 30 Hrs/Wk
12.4%
Less than20 Hrs/Wk
3.7%

Page 13PPI Benefit Solutions 2015 Nonprofit Employee Benefits Survey
Medical Waiting Period. Life Waiting Period.“First of the month following the date of hire” is the most common waiting period for nonprofit medical plans, accounting for 25.3% of results. 2.8% of surveyed nonprofits impose a medical waiting period of “first of the month after 90 days,” which, depending on the date of hire, may not be in compliance with the ACA.
Under the ACA, a group health plan or payer offering group health insurance coverage may not apply any waiting period that exceeds 90 days. For plan years beginning 1/1/2015, final rules allow for a one month employment-based orientation period. However, depending on the length of the subsequent waiting period, the employer may be out of compliance with the Employer Mandate which requires coverage be offered to a full-time employee by the first day of the fourth month following employment.
“First of the month following the date of hire” is the most common waiting period for nonprofit life plans, accounting for 26.1% of results.
12.4% of respondents selected “other,” the majority of whom wrote in “first of the month after 90 days.” Some, however, indicated that their waiting periods are as long as “one year” or “first of the month after 12 months.”
5.5% 30 days from date of hire
10.1%Active upon date of hire
14.3% 90 days from date of hire
4.1%60 days from date of hire
13.8% First of the month after 30 days
25.3%First of the month following date of hire
2.8% First of the month after 90 days
20.7%First of the month after 60 days
4.3% 30 days from date of hire
14.3%Active upon date of hire
17.4% 90 days from date of hire
3.1%60 days from date of hire
11.8% First of the month after 30 days
26.1%First of the month following date of hire
10.6%First of the month after 60 days
Based on years of service
Based on compensation
or position
Percentage of premium
Varies by plan type
No dependent coverage
2-tier structure
3-tier structure
4-tier structure
Defined contribution
Other

Page 14PPI Benefit Solutions 2015 Nonprofit Employee Benefits Survey
CONTRIBUTION STRATEGIESMedical Contribution Strategies.
The majority of nonprofit medical plans feature a percentage of premium contribution with a four tier rate structure (employee only, employee plus spouse, employee plus child(ren), employee plus family).
Of the participants who selected “Other,” most specified that they base contributions on the number of hours employees work.
Defined Contribution Strategies.
We asked participants who currently use a defined contribution funding strategy to describe how the contributions are structured:
Some coverages remain 100% employer-paid
Health plan waivers retain full contribution
Health plan waivers forfeit contributions
Health plan waivers receive a smaller contribution
Employees forfeit any remaining credit
Employees retain any unused credit
82.2%
1.4%
19.2%
8.2%
8.2%
1.4%
Fixed dollar amount by
dependent tier33.7%
Other13.7% Equal, fixed
dollar amount for all employees
27.4%Separate
contributionsfor medical andother benefits
25.3%
Percentage of premium
Defined contribution
Based on years of service
Based on compensation
or position
Varies by plan type
No dependent coverage
2-tier dependent
structure
3-tier dependent structure
4-tier dependent
structure
Other
10.7%
41.1%
5.4%
13.1%
13.1%
5.4%
5.4%
11.3%
39.3%
6.0%

Key
Funding of Medical Coverage For Employees and Dependents.
Page 15PPI Benefit Solutions 2015 Nonprofit Employee Benefits Survey
Do not coverPaid 100% by organizationCost shared by organization and employeePaid 100% by employee
The cost of medical coverage for employees and dependents is most often split between the organization and the employee. The majority of surveyed nonprofits do not extend medical coverage to part-time employees, non-dependent children*, or dependent grandchildren. *Employers who do not offer coverage to non-dependent children may not be in compliance with the ACA. The ACA requires that if coverage is offered to children, eligibility cannot be conditioned upon financial dependence. It can only be conditioned upon relationship (birth or adopted children) and age (until 26).
Statistics less than 5% are not labeled
Full-Time Employees
Part-Time Employees
Opposite-Sex Spouses
Same-Sex Spouses
Opposite-Sex Domestic Partners
Same-SexDomesticPartners
Dependent Children
Foster Children
Non-Dependent Children
Dependent Grandchildren
85.0%52.0%
75.9% 71.1%
46.4%47.7%
77.1% 48.4%
65.4% 61.9%
32.3%
13.5%
16.2%16.1%
35.5%
14.5%
12.8%
33.2%
16.3% 17.1%
31.1%
16.4%
23.3%
13.2%
21.3%

Key
Page 16PPI Benefit Solutions 2015 Nonprofit Employee Benefits Survey
Funding of Additional Benefits.
Dental LifeLong-Term Disability
Short-Term Disability Vision
Paid in full by employer
Cost shared by employer and employee
Employer-paid base plan with employee buy-up
Employee-paid (voluntary)
Do not offer
The cost of dental coverage is most commonly shared by employer and employee, as noted by 60% of participants. About 25% of employers cover the full cost of dental coverage for employees.
Life insurance is most often covered 100% by the employer, as indicated by nearly 85% of participants. The majority of surveyed nonprofits also cover the cost of long-term disability, 71.4%, and short-term disability, 53.3%.
Funding of employer-sponsored vision is fairly evenly split between employer-paid and cost shared. Almost 25% of participants only offer voluntary vision (employee-paid), and nearly 30% do not offer vision coverage at all.
26.9%
59.6%
10.5%
71.4%
10.1%
12.5%
27.7%
18.7%
24.7%
28.3%
83.5%
7.6%
5.3%
53.3%
17.4%
21.0%
6.0%Statistics less than 5% are not labeled
None
Less than $50
$50 to $100
$101 to $150
$151 to $200
$201 to $250
$251 to $300
$301 to $400
$401 to $500
$501 to $600
$601 to $750
More than $750

Page 17PPI Benefit Solutions 2015 Nonprofit Employee Benefits Survey
Monthly Employee Payroll Deduction for the Medical Plan with the Most Enrolled Participants.
Employee Only - Employee Payroll Deduction Employee Plus Child(ren) - Employee Payroll Deduction
Employee Plus Spouse - Employee Payroll Deduction Employee Plus Family - Employee Payroll Deduction
None
Less than $50
$50 to $100
$101 to $150
$151 to $200
$201 to $250
$251 to $300
$301 to $400
$401 to $500
$501 to $600
$601 to $750
More than $750
None
Less than $50
$50 to $100
$101 to $150
$151 to $200
$201 to $250
$251 to $300
$301 to $400
$401 to $500
$501 to $600
$601 to $750
More than $750
None
Less than $50
$50 to $100
$101 to $150
$151 to $200
$201 to $250
$251 to $300
$301 to $400
$401 to $500
$501 to $600
$601 to $750
More than $750
None
Less than $50
$50 to $100
$101 to $150
$151 to $200
$201 to $250
$251 to $300
$301 to $400
$401 to $500
$501 to $600
$601 to $750
More than $750
14.4%
17.5%
16.1%
17.5%
6.5%
7.1%
12.3%
7.8%
3.9%
5.2%
5.8%0.6%
0.0%
0.0%
1.1%
1.1%
1.1%
2.3%
5.7%
19.0%
12.3%
1.9%
7.7%
6.9%
6.3%
12.5%
8.8%
10.0%
8.1%
11.3%
6.9%
4.4%
1.9%
5.6%
6.5%
1.9%
12.3%
13.0%
9.0%
3.2%
7.1%
6.5%
6.5%
5.2%
12.9%
11.6%
20.7%
33.9%

Page 18PPI Benefit Solutions 2015 Nonprofit Employee Benefits Survey
Annual Percentage of Premium Employer Contribution for the Medical Plan with the Most Enrolled Participants.
Employee Only - Percentage of Premium Contribution
Employee Plus Dependent - Percentage of Premium Contribution
Employee Plus Family - Percentage of Premium Contribution
7.6%
30.3%
13.0%
4.3%6.5%
3.8%
Lessthan25%
25%to
40%
41%to
55%
56%to
70%
71%to
85%
86%to
99%
100%
34.6%
17.4%
13.8%
4.2%
7.8%
10.8% 9.6%
Lessthan25%
25%to
40%
41%to
55%
56%to
70%
71%to
85%
86%to
99%
100%
36.5%
16.5% 15.9%
4.9%6.1%
13.4%
6.7%
Lessthan25%
25%to
40%
41%to
55%
56%to
70%
71%to
85%
86%to
99%
100%
36.6%

Page 19PPI Benefit Solutions 2015 Nonprofit Employee Benefits Survey
Annual Fixed Dollar Amount Employer Contribution for the Medical Plan with the Most Enrolled Participants.
Employee Only - Fixed Dollar Contribution
Employee Plus Dependent - Fixed Dollar Contribution
Employee Plus Family - Fixed Dollar Contribution
26.1%
6.5%
17.4%
8.7%
2.2%4.3%
6.5%6.5%4.3%
17.4%
Lessthan
$5,000
$5,000to
$5,999
$6,000to
$6,999
$7,000to
$7,999
$8,000to
$8,999
$9,000to
$9,999
$12,000to
$13,999
$10,000to
$11,999
$14,000to
$15,999
$16,000or
more
27.1%
4.2%
22.9%
4.2%
8.3%6.3%
0.0%
4.2%4.2%
18.8%
Lessthan
$5,000
$5,000to
$5,999
$6,000to
$6,999
$7,000to
$7,999
$8,000to
$8,999
$9,000to
$9,999
$12,000to
$13,999
$10,000to
$11,999
$14,000to
$15,999
$16,000or
more
19.2%
0.0%
7.7%
3.8% 3.8%1.9%
7.7%9.6%
19.2%
26.9%
Lessthan
$5,000
$5,000to
$5,999
$6,000to
$6,999
$7,000to
$7,999
$8,000to
$8,999
$9,000to
$9,999
$12,000to
$13,999
$10,000to
$11,999
$14,000to
$15,999
$16,000or
more

Key
COPAYS, COINSURANCE, AND DEDUCTIBLESIn-Network PCP and Specialist Copayment Amounts for the Medical Plan with the Most Enrolled Participants.
The copayment (copay) amount for nonprofit medical plans is most often between $20 and $35 for a primary care physician (PCP), as reported by 75.1% of surveyed nonprofits. For a specialist, the copay is most often between $40 and $45, as reported by 33.3% of surveyed nonprofits.
None of our participants reported a copay of more than $60 for a PCP, and only 6.4% reported that their copay was this high for a specialist.
Page 20PPI Benefit Solutions 2015 Nonprofit Employee Benefits Survey
PCP
Specialist
Less than $20
$20 to $25
$30 to $35
$40 to $45
$50 to $55
More than $60
16.8%
6.4%
3.7%
0.0%
22.4%
16.0%
36.6%
38.5%
4.3%
15.4%
33.3%
6.4%
In-Network PCP and Specialist Coinsurance Amounts for the Medical Plan with the Most Enrolled Participants.
The coinsurance amount for nonprofit medical plans is often less than 10% for both primary care physicians (PCPs), as reported by 38.9% of surveyed nonprofits, and specialists, as reported by 39.3% of surveyed nonprofits.
Less than 10%
10% to 15%
20% to 25%
30% to 35%
40% to 45%
50% to 55%
38.9%
14.0%
0.9%
0.0%
5.6%
6.5%
24.1%
14.8%
6.5%
21.5%
1.9%
0.0%
70% or more
60% to 65%
11.2%
39.3%
10.2%
4.6%
0.0%
Key Key
$0
$1 to $999
$1,000 to $2,499
$2,500 to $3,999
$4,000 to $5,499
$5,500 to $6,999
$7,000 to $8,999
$9,000 to $14,999
$0
$1 to $999
$1,000 to $2,499
$2,500 to $3,999
$4,000 to $5,499
$5,500 to $6,999
$7,000 to $8,999
$9,000 to $14,999PCP
Specialist

Annual, In-Network Deductible for the MEDICAL PLAN with the Most Enrolled Participants.
Page 21PPI Benefit Solutions 2015 Nonprofit Employee Benefits Survey
PPO Plan - Annual, In-Network Deductible POS Plan - Annual, In-Network Deductible
HMO Plan - Annual, In-Network Deductible EPO Plan - Annual, In-Network Deductible
$0
$1 to $999
$1,000 to $2,499
$2,500 to $3,999
$4,000 to $5,499
$5,500 to $6,999
$7,000 to $8,999
$9,000 to $14,999
$0
$1 to $999
$1,000 to $2,499
$2,500 to $3,999
$4,000 to $5,499
$5,500 to $6,999
$7,000 to $8,999
$9,000 to $14,999
$0
$1 to $999
$1,000 to $2,499
$2,500 to $3,999
$4,000 to $5,499
$5,500 to $6,999
$7,000 to $8,999
$9,000 to $14,999
$0
$1 to $999
$1,000 to $2,499
$2,500 to $3,999
$4,000 to $5,499
$5,500 to $6,999
$7,000 to $8,999
$9,000 to $14,999
20.7%
32.6%
0.0%
0.0%
3.3%
8.7%
14.1%
20.7%
9.7%
38.7%
0.0%
0.0%
6.5%
4.8%
11.3%
29.0%
11.9%
44.8%
0.0%
0.0%
1.5%
7.5%
19.4%
14.9%
14.9%
34.0%
2.1%
2.1%
2.1%
4.3%
14.9%
25.5%

Page 22PPI Benefit Solutions 2015 Nonprofit Employee Benefits Survey
Annual, IN-NETWORK Deductible for the DENTAL PLAN with the Most Enrolled Participants.
Annual, OUT-OF-NETWORK Deductible for the DENTAL PLAN with the Most Enrolled Participants.
$0
$1 to $24
$25 to $49
$50 to $99
$100 to $149
$150 to $199
$200 to $249
$250 to $299
$300 or more
$0
$1 to $24
$25 to $49
$50 to $99
$100 to $149
$150 to $199
$200 to $249
$250 to $299
$300 or more
33.5%
12.7%
3.8%
1.3%
0.6%
3.2%
1.9%
38.6%
0.7%
7.0%
8.5%
47.2%
3.5%
10.6%
4.4%
12.0%
0.0%
10.6%
What’s the difference between copays, coinsurance, and deductibles?
Copays/ Copayments
Definition
A fixed amount you pay for healthcare services that is typically paid at the time of service. Copayments vary by plan and can change depending on the type of care you receive.
Example
The copayment you owe when you visit your primary care physician (PCP) might be $25. However, your copayment may be higher if you go to the emergency room, to a specialist, or to an out-of-network doctor.
Coinsurance
Definition
Your share of the cost of a covered health care service, calculated as a percentage of your plan’s allowed amount for that service. You will start paying coinsurance once you’ve met your plan’s deductible.
Example
If your health insurance or plan’s allowed amount for an office visit is $100 and you’ve already met your deductible, your coinsurance payment of 20% would be $20. The health insurance or plan will pay $80.
Deductibles
DefinitionThe amount you owe for health care services before your health insurance or plan begins to pay.
Example
For example, if your deductible is $2,500, you will pay 100% of the cost of covered health care services until you’ve paid $2,500. After that, you’ll share the cost with your plan through copays and coinsurance. The deductible may not apply to all services.

Page 23PPI Benefit Solutions 2015 Nonprofit Employee Benefits Survey
PRESCRIPTIONSPrescription Drug Plans.
The majority of surveyed nonprofits offer a three tier prescription drug plan to employees, as indicated by 66% of participants.
Plan pays once deductible is met
12.3%Single tier
4.3%
Two tiers8.6%
Three tiers66.0%
Four tiers8.6%
What do prescription drug tiers mean?
Drug tiers divide prescription drugs into different levels of cost. Drugs in Tier 1 will be the least expensive, while drugs in Tier 4will be the most expensive.
Single Tier Plan: Payment is the same regardless of the drug.
Two Tier Plan: Prescription drugs will typically be grouped into two levels of payment:
• Tier 1: Low cost, generic drugs
• Tier 2: Higher cost, brand-name drugs
Three Tier Plan: Prescription drugs will typically be grouped into three levels of payment:
• Tier 1: Low cost, generic drugs
• Tier 2: Intermediate cost for specially selected brand-name drugs
• Tier 3: Highest cost for specially selected brand-name drugs
Four Tier Plan: Prescription drugs will typically be grouped into four levels of payment:
• Tier 1: Low cost, generic drugs
• Tier 2: Intermediate cost for specially selected brand-name drugs
• Tier 3: Higher cost for specially selected brand-name drugs
• Tier 4: Highest cost for specially selected brand-name drugs
First-Tier Drugs Often includes generic medications.
Second-Tier Drugs Often includes preferred brand name medications.
Third-Tier Drugs Often includes non-preferred brand name medications.
Fourth-Tier Drugs Often includes specialty medications.

First-TierDrugs
Second-TierDrugs
Third-Tier Drugs
Fourth-TierDrugs
SpecialtyDrugs
80.7%
50.0%
67.6%
19.1%
22.6%
17.1%
52.6%46.8%
15.8%
10.3%
20.0%
10.0%
10.0%
10.5%
10.5% 10.5%
18.5%
6.5%
First-TierDrugs
Second-TierDrugs
Third-TierDrugs
Fourth-TierDrugs
SpecialtyDrugs
20.0%
80.0%
20.0%
60.0%20.0%
37.5%
50.0%51.9%
25.0%
33.3%33.3%
37.5%
16.7%
14.8
Less than $20$20 to $39$40 to $59$60 to $79$80 to $99$100 or more
Page 24PPI Benefit Solutions 2015 Nonprofit Employee Benefits Survey
30-day Supply (Retail) Copayment Amounts for the Prescription Drug Plan with the Most Enrolled Employees.
30-day Supply (Retail) Coinsurance Amounts for the Prescription Drug Plan with the Most Enrolled Employees.
Less than 40%40% to 89%90% to 100%
Key KeyKey
Statistics less than 5% are not labeledStatistics less than 5% are not labeled

Key
Key
INSIGHT: Nonprofits Growing Less Confident in their Understanding of Healthcare Reform (ACA)
27.2%
14.8%
38.3%
14.8%
4.9%
7.4%
12.9%
16.0%
56.4%
7.4%
Understanding Healthcare Reform (ACA). More than 50% of nonprofits report that they have “very little” to “no” understanding of how Healthcare Reform (ACA) and its reporting requirements apply to their organization.
Cost of Healthcare Reform (ACA) Compliance. 56.4% of nonprofits have not yet calculated the cost of compliance with Healthcare Reform (ACA). This number has decreased slightly over the last year, from 60.5% in 2014.
Raises expenses less than 5%Raises expenses 5% to 10%Raises expenses more than 10%It will not raise expensesHave not calculated the cost
Extremely thorough understandingVery thorough understandingModerate understandingVery little understandingNo understanding
Nonprofits reporting a VERY to EXTREMELY thorough understanding of Healthcare Reform
10
20
30
40
50
60
70
802014
2015
0
10
20
30
40
50
60
2014
2015
Nonprofits reporting VERY LITTLE to NO understanding of Healthcare Reform
Perc
enta
gePe
rcen
tage
Page 25PPI Benefit Solutions 2015 Nonprofit Employee Benefits Survey
COMPLIANCE
How can you learn more about Healthcare Reform (ACA)?
Check out our Healthcare Reform Kit at: ppibenefits.com/HCR-Kit.
The kit includes:
• Employer Action Overview, including how PPI can help• Healthcare Reform Timeline• Employer Mandate Flowchart• Summary of the Impact on Employees• And more!
44.5%
45.0%

PPI Benefit Solutions 2015 Nonprofit Employee Benefits Survey Page 26
Cost-Saving Strategies in Response to Rising Costs.
We have already implemented this
We plan to implement this in the next year
We plan to implement this in the next 3 years
We plan to implement this at some point but we aren’t sure when
We do not plan to implement this
“Increasing employee contributions,” “offering a high deductible medical plan (HDHP),” and “implementing or expanding a wellness program with incentives” are among the top cost-saving strategies implemented by nonprofit employers in response to rising healthcare costs. These results are consistent with those of 2014.
Among the least likely cost-saving strategies are “reduce or eliminate dependent coverage,” “restrict eligibility for coverage,” and “offer a Minimum Value plan only.”
Key
Wellness incentives
Consolidate administration
Offer a Minimum Value plan ONLY
Replace some benefits withemployee-paid voluntary plans
Change to a defined contribution model
Move to a private exchange marketplace
Restrict eligibility for coverage
Extend the new hire waiting period
Offer a high-deductible medical plan
Reduce or eliminate dependent coverage
Reduce or drop certain benefits
Increase employee contributions 41.8% 15.8%11.0% 6.8% 24.7%
15.8% 9.8%9.0% 7.5% 57.9%
5.6% 82.5%7.1%
38.7% 17.6%5.6% 34.5%
7.7% 81.5%6.9%
12.6% 79.5%
6.3% 88.3%
11.9% 71.4%9.5%
10.5% 70.2%12.9%
10.4% 82.4%
15.2% 8.0%7.2% 67.2%
20.6% 26.0%9.2% 13.7% 30.5%
Statistics less than 5% are not labeled

42.0%50.9%
5.9%
0.6% 0.6%
79.1%
20.9%Key
Key
PPI Benefit Solutions 2015 Nonprofit Employee Benefits Survey Page 27
Compliance with State and Federal Regulations.
More than 90% of nonprofits are “very” to “extremely” confident that their benefit plans are compliant with state and federal regulations. Only 1.2% are “slightly” to “not at all” confident.
Extremely confidentVery confidentModerately confidentSlightly confidentNot at all confident
Very likelyModerately likelyNot at all likely
Likelihood to Discontinue Healthcare Benefits and Send Employees to a State or Federal Healthcare Exchange.
Almost 80% of surveyed nonprofits are “not at all likely” to discontinue healthcare benefits and send employees to a state or federal exchange.
Nonprofits who plan to move to a private exchange marketplace
10
15
20
2014
2015
60
80
100
2014
2015
Perc
enta
gePe
rcen
tage
Why Are More Nonprofits Considering Private Exchange Marketplaces?
• Defined contribution funding allows for more predictable cost control
• Retail-like shopping experience with extensive plan choice
• Decision support and educational tools
• Reduced administrative burden on human resources departments
INSIGHT: Nonprofits Show a Slow, but Steadily Growing Interest in Private Exchange Marketplaces
Nonprofits who DO NOT plan to move to a private exchange marketplace
8.2%
9.8%
Page 28PPI Benefit Solutions 2015 Nonprofit Employee Benefits Survey
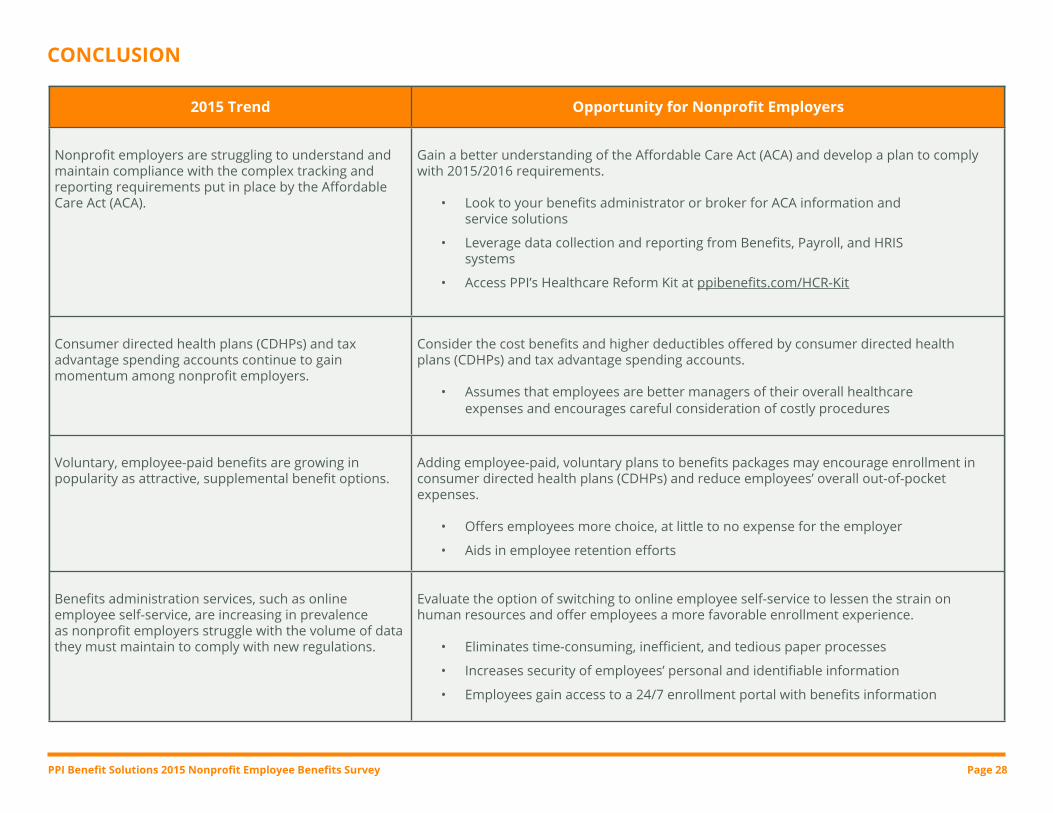
CONCLUSION
2015 Trend Opportunity for Nonprofit Employers
Nonprofit employers are struggling to understand and maintain compliance with the complex tracking and reporting requirements put in place by the Affordable Care Act (ACA).
Gain a better understanding of the Affordable Care Act (ACA) and develop a plan to comply with 2015/2016 requirements.
• Look to your benefits administrator or broker for ACA information and service solutions
• Leverage data collection and reporting from Benefits, Payroll, and HRIS systems
• Access PPI’s Healthcare Reform Kit at ppibenefits.com/HCR-Kit
Consumer directed health plans (CDHPs) and tax advantage spending accounts continue to gain momentum among nonprofit employers.
Consider the cost benefits and higher deductibles offered by consumer directed health plans (CDHPs) and tax advantage spending accounts.
• Assumes that employees are better managers of their overall healthcare expenses and encourages careful consideration of costly procedures
Voluntary, employee-paid benefits are growing in popularity as attractive, supplemental benefit options.
Adding employee-paid, voluntary plans to benefits packages may encourage enrollment in consumer directed health plans (CDHPs) and reduce employees’ overall out-of-pocket expenses.
• Offers employees more choice, at little to no expense for the employer
• Aids in employee retention efforts
Benefits administration services, such as online employee self-service, are increasing in prevalence as nonprofit employers struggle with the volume of data they must maintain to comply with new regulations.
Evaluate the option of switching to online employee self-service to lessen the strain on human resources and offer employees a more favorable enrollment experience.
• Eliminates time-consuming, inefficient, and tedious paper processes
• Increases security of employees’ personal and identifiable information
• Employees gain access to a 24/7 enrollment portal with benefits information

Key
The 2015 Nonprofit Employee Benefits Survey was conducted over a period of four weeks, beginning March 9, 2015 and ending April 3, 2015. A total of 299 responses were received, representing a 16% increase over last year’s participation. The majority of responses were submitted by human resources professionals at mid-sized private nonprofits located in northeastern United States.
OVERVIEW OF PARTICIPANTS
Nonprofit Location.
Company Size.
501(c) Classifications.
Page 29PPI Benefit Solutions 2015 Nonprofit Employee Benefits Survey
91.9%
2.3%0.8%
3.1%1.9%
Less than 20 employees20 to 49 employees50 to 199 employees200 to 500 employeesMore than 500 employees
46.1%
15.9%18.2%
10.5% 9.3%
86.7%
13.3%
Key
NortheastMidwestWestSouthSouthwest
Key
501(c)(3) - Charitable Organizations (Public Charity or Private Foundation)All other 501(c) classifications

Nonprofit Classifications. Participant Job Title.
Page 30PPI Benefit Solutions 2015 Nonprofit Employee Benefits Survey
Benefits Manager/ Director/Coordinator
CFO/Controller/ Director of Finance
COO/Operations Director/Manager
Executive Director/ President/CEO
Office Manager
Program Manager/ Director/Coordinator
Other
Human Resources Manager/Director/
Coordinator
13.3%
6.3%
48.0%
2.3%
6.3%
11.3%
1.2%
Human Services24.4%
Mental Health & Crisis Intervention
3.9%
Arts, Culture, &Humanities
3.1%Healthcare15.9%
Environment2.3%
Education15.5%
Volunteerism & Grant Making Foundations
2.7%Housing & Shelter5.8%
11.3%

Page 31PPI Benefit Solutions 2015 Nonprofit Employee Benefits Survey
ABOUT PPI
PPI Benefit Solutions, working exclusively through benefits brokers, helps smaller, mid-sized employers relieve the day-to-day challenges of managing an employee benefits program. With over 40 years of benefits administration experience working with nonprofit organizations, PPI leverages strategic relationships with a broad array of nationally recognized insurance carriers and powerful, web-based technology to provide a single solution for multiple carrier enrollments and eligibility processing (including online enrollment and employee self-service), electronic eligibility data and discrepancy management, true premium billing and payments, COBRA administration, and member advocacy services, all at little or no cost to the employer.
PPI (Professional Pensions Inc., dba PPI Benefit Solutions) is a subsidiary of NFP Corp. (NFP). For more information, visit www.ppibenefits.com.
Key Facts
Year Established............................................................................1967 PPI Employees...................................................................................55 Clients...................................................................................1,381 Covered Members....................................................................140,000 Annual Premium..............................................................$418 million
ABOUT THE SURVEY
Supporting the nonprofit community with insurance and service solutions that meet unique fiscal and management needs is a rich part of our history and value system. As a result, we continually strive to improve the way we support the benefit selection and management process.
In 2009, we recognized that most compensation and benefit surveys did not target smaller, private nonprofit organizations and offered very little benefits-specific data. We set out to close that gap and developed an annual survey that would help our nonprofit clients benchmark their benefit plans against organizations of similar size and location.
Each year, our Annual Nonprofit Employee Benefits Survey continues to grow in number of participants, and now reaches far beyond our own nonprofit client base. As the health care marketplace continues to evolve, PPI will continue to provide valuable insight into the fundamental concerns and challenges of nonprofit benefit plan sponsors.

This material was created by PPI Benefit Solutions to provide accurate and reliable information on the subjects covered but should not be regarded as a complete analysis of these subjects. It is not intended to provide specific legal, tax or other professional advice. The service of an appropriate professional should be sought regarding your individual situation. PPI does not offer tax or legal advice. “PPI®” is a service mark of Professional Pensions, Inc., a subsidiary of NFP Corp. (NFP). Copyright 2015, Professional Pensions, Inc.
A: 10 Research Pkwy. Ste. 200, Wallingford, CT 06492 | P: 888.674.0046 | W: www.ppibenefits.com
Related Documents