An analytical modeling framework to evaluate converged networks through business-oriented metrics Almir P. Guimarães a,b,n , Paulo R.M. Maciel b , Rivalino Matias Jr. c a Campus Arapiraca, Federal University of Alagoas, Arapiraca, AL, Brazil b Center of Informatics, Federal University of Pernambuco, Recife, PE, Brazil c School of Computer Science, Federal University of Uberlândia, Uberlândia, MG, Brazil article info Article history: Received 11 June 2012 Received in revised form 8 March 2013 Accepted 10 April 2013 Available online 27 April 2013 Keywords: Dependability Stochastic Petri Net Reliability Block Diagram Reliability importance Infrastructure design abstract Nowadays, society has increasingly relied on convergent networks as an essential means for individuals, businesses, and governments. Strategies, methods, models and techniques for preventing and handling hardware or software failures as well as avoiding performance degradation are, thus, fundamental for prevailing in business. Issues such as operational costs, revenues and the respective relationship to key performance and dependability metrics are central for defining the required system infrastructure. Our work aims to provide system performance and dependability models for supporting optimization of infrastructure design, aimed at business oriented metrics. In addition, a methodology is also adopted to support both the modeling and the evaluation process. The results showed that the proposed methodology can significantly reduce the complexity of infrastructure design as well as improve the relationship between business and infrastructure aspects. & 2013 Elsevier Ltd. All rights reserved. 1. Introduction The infrastructure required to support services of converged networks is increasingly more complex than ordinary commu- nication networks. It takes the form of complex system intercon- nections through a variety of network components such as routers, switches, firewalls, communication links, and other related components. In order to realize the design of converged networks, infra- structure metrics (e.g., availability, reliability, throughput) as well as their values should be selected, beyond the effort to achieve a design that minimizes costs and meets the selected metrics. Since converged networks are a means to helping the business meet its objectives, not formally taking business requirements into account is a major weakness. Ref. [10] explains that today's approach in meeting business requirements is to talk to business managers and ask them what the business needs in terms of availability, reliability, etc. These requirements are then expressed formally in a document called Service Level Agreement (SLA) [14], whereby the service provider makes certain guarantees that the service user can expect to be fulfilled. This problem should be considered seriously, since hundreds of thousands of dollars in financial outlay can easily be the difference between an ad hoc solution and another one that formally takes business considerations into account, even for medium-sized infrastructures [10]. In the last years, some optimization techniques have been proposed for system designs (telecommunication systems, manu- facturing systems and power systems) [5,7,9,11,15–17]. These systems consider reliability as an important design measure. Generally, the optimization techniques can be classified as linear programming, dynamic programming, integer programming, geometric programming, heuristic methods, genetic algorithms (GA) or a hybrid approach. Ref. [5] proposes a decomposition-based approach to exactly solve the multi-objective Redundancy Allocation Problem for series–parallel systems. The work in [7] describes and demon- strates two methods to intelligently reduce the size of the Pareto set. The first method is a pseudo-ranking scheme that helps the decision maker select solutions that reflect his/her objective function priorities. In the second approach, the authors used data mining clustering techniques to group the data by using the k- means algorithm to find clusters of similar solutions. Ref. [9] presents a method that can be used to design an ad hoc network topology optimized for higher reliability. Ref. [11] presents an algorithm based on a hybrid optimization approach (probabilistic solution discovery and Monte Carlo simulation) to solving pro- blems related to minimization of the network design cost, subject Contents lists available at SciVerse ScienceDirect journal homepage: www.elsevier.com/locate/ress Reliability Engineering and System Safety 0951-8320/$ - see front matter & 2013 Elsevier Ltd. All rights reserved. http://dx.doi.org/10.1016/j.ress.2013.04.008 n Corresponding author at: Campus Arapiraca, Federal University of Alagoas, Arapiraca, AL, Brazil. Tel.: +55 82 9331 5381. E-mail addresses: [email protected], [email protected], [email protected] (A.P. Guimarães), [email protected] (P.R.M. Maciel), [email protected] (R. Matias Jr.). Reliability Engineering and System Safety 118 (2013) 81–92

Welcome message from author
This document is posted to help you gain knowledge. Please leave a comment to let me know what you think about it! Share it to your friends and learn new things together.
Transcript
Reliability Engineering and System Safety 118 (2013) 81–92
Contents lists available at SciVerse ScienceDirect
Reliability Engineering and System Safety
0951-83http://d
n CorrArapirac
E-malmirgurivalino
journal homepage: www.elsevier.com/locate/ress
An analytical modeling framework to evaluate converged networksthrough business-oriented metrics
Almir P. Guimarães a,b,n, Paulo R.M. Maciel b, Rivalino Matias Jr.c
a Campus Arapiraca, Federal University of Alagoas, Arapiraca, AL, Brazilb Center of Informatics, Federal University of Pernambuco, Recife, PE, Brazilc School of Computer Science, Federal University of Uberlândia, Uberlândia, MG, Brazil
a r t i c l e i n f o
Article history:Received 11 June 2012Received in revised form8 March 2013Accepted 10 April 2013Available online 27 April 2013
Keywords:DependabilityStochastic Petri NetReliability Block DiagramReliability importanceInfrastructure design
20/$ - see front matter & 2013 Elsevier Ltd. Ax.doi.org/10.1016/j.ress.2013.04.008
esponding author at: Campus Arapiraca, Fea, AL, Brazil. Tel.: +55 82 9331 5381.ail addresses: [email protected]@yahoo.com.br (A.P. Guimarães), [email protected] (R. Matias Jr.).
a b s t r a c t
Nowadays, society has increasingly relied on convergent networks as an essential means for individuals,businesses, and governments. Strategies, methods, models and techniques for preventing and handlinghardware or software failures as well as avoiding performance degradation are, thus, fundamental forprevailing in business. Issues such as operational costs, revenues and the respective relationship to keyperformance and dependability metrics are central for defining the required system infrastructure.Our work aims to provide system performance and dependability models for supporting optimization ofinfrastructure design, aimed at business oriented metrics. In addition, a methodology is also adopted tosupport both the modeling and the evaluation process. The results showed that the proposedmethodology can significantly reduce the complexity of infrastructure design as well as improve therelationship between business and infrastructure aspects.
& 2013 Elsevier Ltd. All rights reserved.
1. Introduction
The infrastructure required to support services of convergednetworks is increasingly more complex than ordinary commu-nication networks. It takes the form of complex system intercon-nections through a variety of network components such as routers,switches, firewalls, communication links, and other relatedcomponents.
In order to realize the design of converged networks, infra-structure metrics (e.g., availability, reliability, throughput) as wellas their values should be selected, beyond the effort to achieve adesign that minimizes costs and meets the selected metrics. Sinceconverged networks are a means to helping the business meet itsobjectives, not formally taking business requirements into accountis a major weakness. Ref. [10] explains that today's approach inmeeting business requirements is to talk to business managersand ask them what the business needs in terms of availability,reliability, etc. These requirements are then expressed formally ina document called Service Level Agreement (SLA) [14], wherebythe service provider makes certain guarantees that the serviceuser can expect to be fulfilled.
ll rights reserved.
deral University of Alagoas,
r, [email protected],@cin.ufpe.br (P.R.M. Maciel),
This problem should be considered seriously, since hundreds ofthousands of dollars in financial outlay can easily be the differencebetween an ad hoc solution and another one that formally takesbusiness considerations into account, even for medium-sizedinfrastructures [10].
In the last years, some optimization techniques have beenproposed for system designs (telecommunication systems, manu-facturing systems and power systems) [5,7,9,11,15–17]. Thesesystems consider reliability as an important design measure.Generally, the optimization techniques can be classified as linearprogramming, dynamic programming, integer programming,geometric programming, heuristic methods, genetic algorithms(GA) or a hybrid approach.
Ref. [5] proposes a decomposition-based approach to exactlysolve the multi-objective Redundancy Allocation Problem forseries–parallel systems. The work in [7] describes and demon-strates two methods to intelligently reduce the size of the Paretoset. The first method is a pseudo-ranking scheme that helps thedecision maker select solutions that reflect his/her objectivefunction priorities. In the second approach, the authors used datamining clustering techniques to group the data by using the k-means algorithm to find clusters of similar solutions. Ref. [9]presents a method that can be used to design an ad hoc networktopology optimized for higher reliability. Ref. [11] presents analgorithm based on a hybrid optimization approach (probabilisticsolution discovery and Monte Carlo simulation) to solving pro-blems related to minimization of the network design cost, subject
A.P. Guimarães et al. / Reliability Engineering and System Safety 118 (2013) 81–9282
to a known constraint on all-terminal reliability. Ref. [15]addresses the problem of determining the optimal network designwithin a multi-objective search based on an effective coupling ofgenetic algorithms and Monte Carlo simulation. In turn, Ref. [16]has solved the reliability optimization problem by using a heuristicapproach based on a quantized Hopfield network. Finally, Ref. [17]presents an application of ant system in a reliability optimizationproblem for a series system with multiple-choice constraints tomaximize the system reliability to the system budget.
Note that none of these references considered the businessmetrics formally. Instead, they deal with business metrics asconstraints to designs based on technical metrics. The maincontribution of this work in comparison with the previous worksis related to the usage of business metrics integrated withtechnical metrics in the formal modeling. We evaluate andcompare alternative infrastructure designs considering not onlytechnical metrics, but specially business metrics, in a formal way.It extends our preliminary research work presented in [1–3],consolidating and generalizing their results, as well as proposingnew analytical models for supporting optimization of convergednetworks design, aimed at business oriented metrics. In addition,a new methodology is also adopted to reduce the complexityof infrastructure design as well as improving the relationshipbetween infrastructure and business aspects. The obtained resultsshow that the proposed approach provides quasi-optimal infra-structure design that improves the business aspects such asinfrastructure revenues, costs and profits. Furthermore, it providesthe possibility of an objective comparison among different designsolutions.
The rest of this paper is organized as follows. Section 2describes the business-oriented and network infrastructure mod-els. Section 3 explains the adopted methodology in order to selectthe quasi-optimal design considering the relationship betweenbusiness and infrastructure aspects. Section 4 presents a casestudy where we apply our approach in a real converged network.Finally, Section 5 concludes the paper and introduces ideas forfuture research works.
1 Its value, in month/year, must be converted to the appropriate value in hoursor seconds.
2. Models
This section presents the models adopted for quantifying thenetwork infrastructure performance and dependability based onbusiness-oriented aspects.
2.1. Business-oriented models
This section presents a set of business metrics to support theoptimization of infrastructure design.
Infrastructure cost: The next expression is based on the Calcu-lating Infrastructure Cost [10]. In order to calculate the infrastruc-ture cost, one needs a model considering the infrastructureresources of hardware and software. Each l-th component, suchas a router, consists of a set of n resources, such thatCl ¼ fr1; r2;…; rng. As an example, a router consists of tworesources: hardware and operating system. In turn, each k-thcomponent class, i.e., router class, switch class, consists of similarcomponents, such that CLk ¼ fC1;C2;…;Clg. In turn, RC is the set ofk component classes, such that RC¼ fCL1;CL2;…;CLkg. Eachresource has a cost rate (cost per unit time) of rk,l,n. If eachresource has a variable cost rate (rk,l,n):
ICostðtÞ ¼Z t
0∑jRCj
k ¼ 1∑jCLk j
l ¼ 1∑jCl j
n ¼ 1rk;l;nðτÞ
!� dτ ð1Þ
Now, a constant cost rate is assumed. Let t be equal to T(a constant time period, t¼T). The cost of the infrastructure over
the time period T (typically 1 month or 1 year1) can be calculatedas the sum of individual cost for all components (see Eq. (2)). Thiswork considers the constant cost rates:
ICostðTÞ ¼ ∑jRCj
k ¼ 1∑jCLk j
l ¼ 1∑jCl j
n ¼ 1rk;l;n
!� T ð2Þ
Infrastructure revenues: This study considered the calculation ofrevenues directly from the converged networks in a serviceprovider perspective, through resource allocation to the customer.This model considers a customer and its services. A generalizationto a greater number of customers is straightforward.
The proposed model calculates the revenues from each type ofservice that flows through the network. It considers features suchas system availability (A), throughput (thps) and financial value (fv)of a service j. If a variable throughput is considered:
Rvðt;A; thps; fvÞ ¼Z t
0∑k
j ¼ 1AðτÞ � thpsjðτÞ � fvj
!dτ ð3Þ
Now, the mean throughput and a steady-state availability areassumed. Let t be equal to T (a constant time period, t¼T).The revenues of the infrastructure over the time period T (typically1 month or 1 year see footnote 1) can be calculated (see Eq. (4)).This work considers the mean throughput.
RvðT ;A; thps; fvÞ ¼ ∑k
j ¼ 1A� thpsj � fvj
!� T ð4Þ
�
thps: mean throughput, in packets per second (pps); � thpsðτÞ: instantaneous throughput, in packets per second (pps); � A: steady-state system availability in the time period; � AðτÞ: instantaneous availability; � T: time period; � fv: financial value associated with a service, in $/packet.Penalty: The penalty is based on the system time outage and itscost, per j service, is calculated according to the offered servicelevel (see Eq. (5)) over a time period T (typically 1 month or 1 yearsee footnote 1). Regarding function I, Eq. (6) shows its differentvalues in accordance with the offered service level. Thresholds,regarding availability, should be defined for each service levelðthnothn−1o⋯oth2oth1Þ.
As an example, considering that the calculated availability isgreater than a threshold defined in a contract (th1), there is nopenalty and the value of function I, I1, is zero.
PjðT ;A; IÞ ¼
0 for A≥th1T � I2 � ð1−AÞ for th2≤Aoth1
⋮ ⋮T � In � ð1−AÞ for thn≤Aothn−1
8>>>><>>>>:
ð5Þ
IðAÞ ¼
I1 for A≥th1I2 for th2≤Aoth1⋮ ⋮In for thn≤Aothn−1
8>>>><>>>>:
ð6Þ
The total cost of the penalty over a time period T can be calculatedas the sum of individual cost of penalties for each service j(see Eq. (7)):
PT ðT ;A; IÞ ¼ ∑k
j ¼ 1Pj ð7Þ
A.P. Guimarães et al. / Reliability Engineering and System Safety 118 (2013) 81–92 83
�
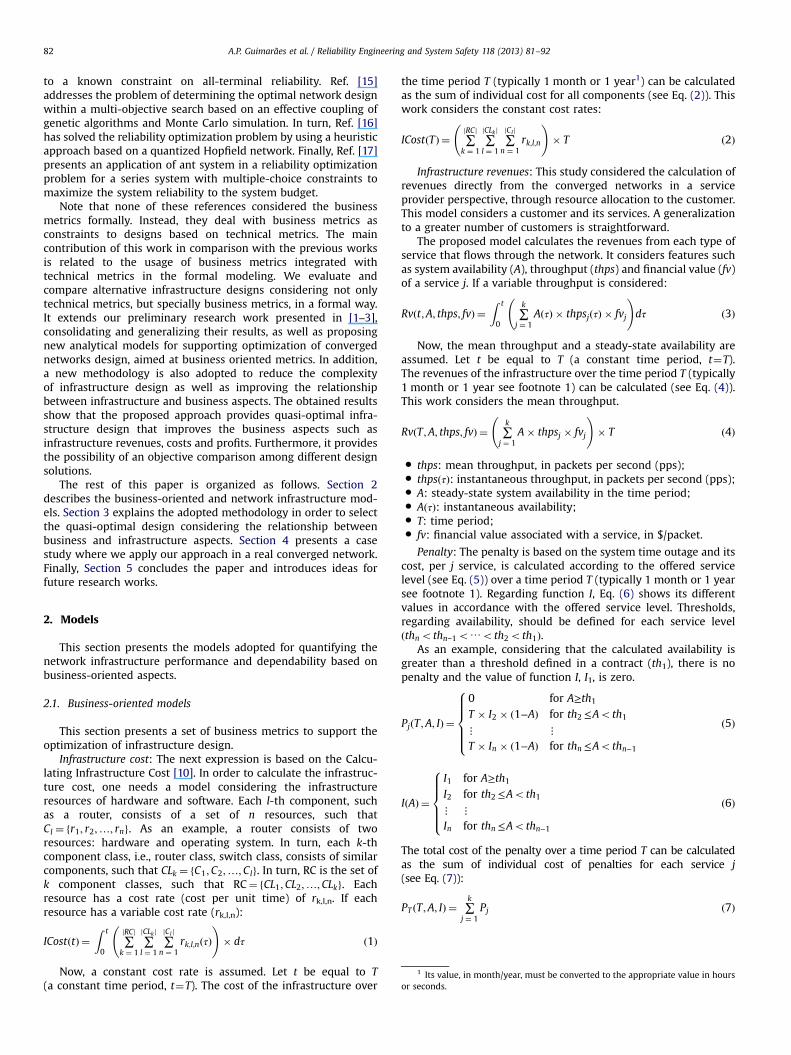
th: threshold value at service level i, such that 0≤thi ≤1; � T: time period; � A: steady-state system availability in the time period; �Fig. 1. Queuing policy model.
Table 1Immediate transitions parameters.
Transition Enabling function Priority Weight Queuing policy
tx-rt 5 w1 Custom queuingtx-nrt 5 w2 Custom queuingtdesc-rt Poutbff−rt4n1 4 1 Custom queuing
I: a function whose value depends on the service level i, in $=h.
Profit: The profit is a financial benefit that is realized when theamount of revenue gained from a business activity exceeds thecosts to sustain the activity. The profit is obtained using Eq. (8),wherewr and wc are the assigned weights to the revenue and costsfunctions:
Pf ðT ;A; thps; fv; IÞ ¼wr � RvðT ;A; thps; fvÞ þwc
�ðICostðTÞ þ PT ðT ;A; IÞÞ ð8ÞAdditional profit per monetary unit spent (APf) and Downtime
variation per monetary unit spent (DVr): APf is the amount ofadditional profit per monetary unit spent between two solutions.If a new solution has a APf that is greater than one ð41Þ, thesolution should be selected. Eq. (9) shows the correspondingexpression. In turn, DVr is the downtime variation per monetaryunit spent between two solutions. Eq. (10) shows the correspond-ing expression:
APf ¼ΔPf ðT ;A; thps; fv; IÞ=ΔICostðTÞ ð9Þ
DVr ¼ΔDðA; TÞ=ΔICostðTÞ ð10Þ
tdesc-nrt Poutbff−nrt4n2 4 1 Custom queuingtx-rt p1 1 Priority queuing
� tx-nrt p2 1 Priority queuingtdesc-rt Poutbff−rt4n3 4 1 Priority queuingtdesc-nrt Poutbff−nrt4n4 4 1 Priority queuingΔPf ðT ;A; thps; fv; IÞ ¼ Pf jðT ;A; thps; fv; IÞ−Pf iðT ;A; thps; fv; IÞ.Pf jðT ;A; thps; fv; IÞ is the profit to solution j and Pf iðT ;A; thps; fv; IÞis the profit to solution i;
�
ΔDðA; TÞ ¼DjðA; TÞ−DiðA; TÞ. DjðA; TÞ is the downtime to solutionj and DiðA; TÞ is the downtime to solution i;�
ΔICostðTÞ ¼ ICostjðTÞ−ICostiðTÞ. ICostj(T) is the infrastructure costto solution j and ICosti(T) is the infrastructure cost to solution i.2.2. Network infrastructure models
This section presents the base models for quantifying networkinfrastructure metrics. The proposed models are generic enough torepresent a wide variety of mechanisms found in real convergednetwork designs. The adopted modeling strategy is presented.
Modeling strategy: This work adopts a hybrid modeling strategy[12] that considers the advantages of both Reliability BlockDiagrams (RBDs) [22] and Stochastic Petri Nets (SPNs) [6,20]. Sucha hierarchical approach is adopted to mitigate the complexity forrepresenting large systems that can generate the state-spaceexplosion problem [23] for some state-based models. Essentially,the strategy aims at adopting the most suitable model forrepresenting the subsystems and combining the results so as toobtain system model evaluation result.
Performance model: There are many variables characterizingnetwork performance. Delay, blocking, packet loss and throughputare examples. Since we are interested in the packet loss andthroughput metrics, our performance model (see Fig. 1) representsthe Custom Queuing [25] and Priority Queuing [13] policies on aninterface. It represents voice and data traffic. Modification of thismodel to represent a larger number of traffic is straightforward.Essential modeling elements are: the weight and priority para-meters of the immediate transitions tx-rt and tx-nrt, together withthe place Pnet and corresponding enabling functions of the tdesc-rtand tdesc-nrt immediate transitions. The parameters related tothese immediate transitions are presented in Table 1.
The Tx-rt and Tx-nrt generic stochastic transitions represent theinter-packet time characteristics of the voice and data traffic,respectively. The generic stochastic transitions Tprs-nrt and
Tprs-rt represent the interface processing time of each data andvoice packet. In case the number of tokens in places Poutbff-rt andPoutbff-nrt is greater than the standard queue sizes (representedby n1 and n2), then the immediate transitions tdesc-rt and tdesc-nrt fire. This is modeled by the enabling function assigned to thesetransitions as shown in Table 1.
For the custom queuing policy, the weights, represented byvariables w1 and w2, indicate the firing probability of simulta-neous enabled transitions within an Extended Conflict Set (ECS).Such weights are subsequently modified for the study and evalua-tion of different scenarios. In turn, for the priority queuing policy,the parameters that are represented by the variables p1 and p2determine the firing of the transition with the highest, instead ofother simultaneous enabled transitions in an ECS (see Table 1).
Dependability models: Now, the dependability models arepresented.
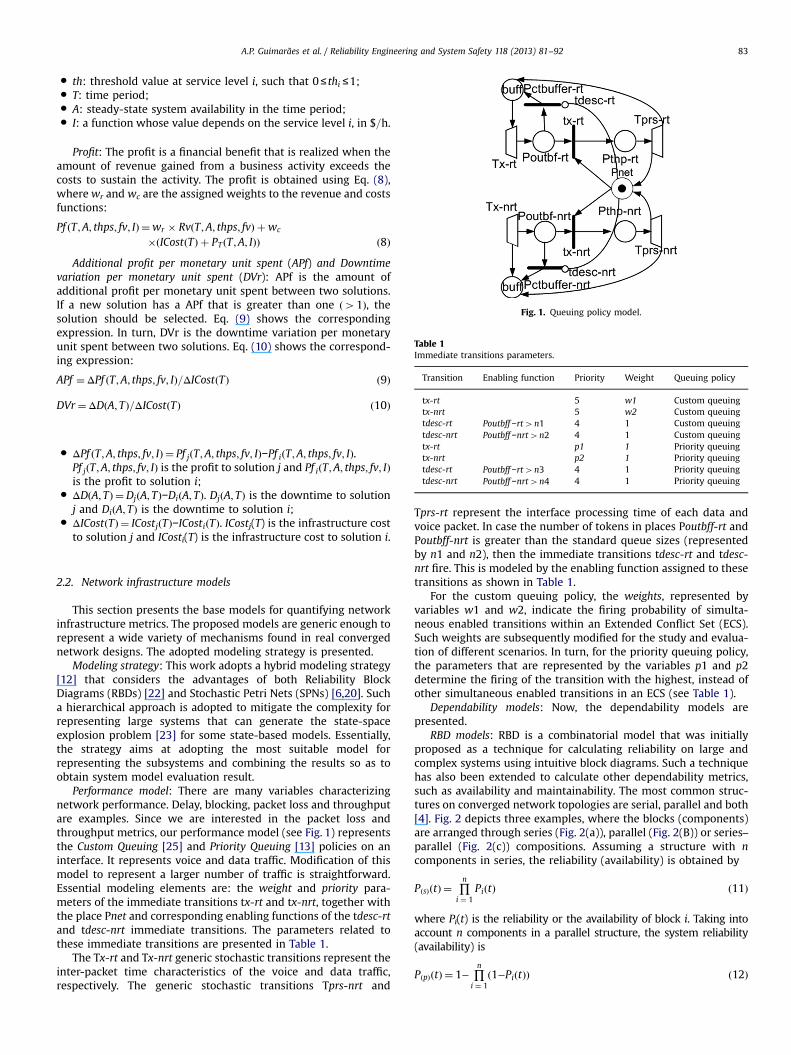
RBD models: RBD is a combinatorial model that was initiallyproposed as a technique for calculating reliability on large andcomplex systems using intuitive block diagrams. Such a techniquehas also been extended to calculate other dependability metrics,such as availability and maintainability. The most common struc-tures on converged network topologies are serial, parallel and both[4]. Fig. 2 depicts three examples, where the blocks (components)are arranged through series (Fig. 2(a)), parallel (Fig. 2(B)) or series–parallel (Fig. 2(c)) compositions. Assuming a structure with ncomponents in series, the reliability (availability) is obtained by
PðsÞðtÞ ¼ ∏n
i ¼ 1PiðtÞ ð11Þ
where Pi(t) is the reliability or the availability of block i. Taking intoaccount n components in a parallel structure, the system reliability(availability) is
PðpÞðtÞ ¼ 1− ∏n
i ¼ 1ð1−PiðtÞÞ ð12Þ
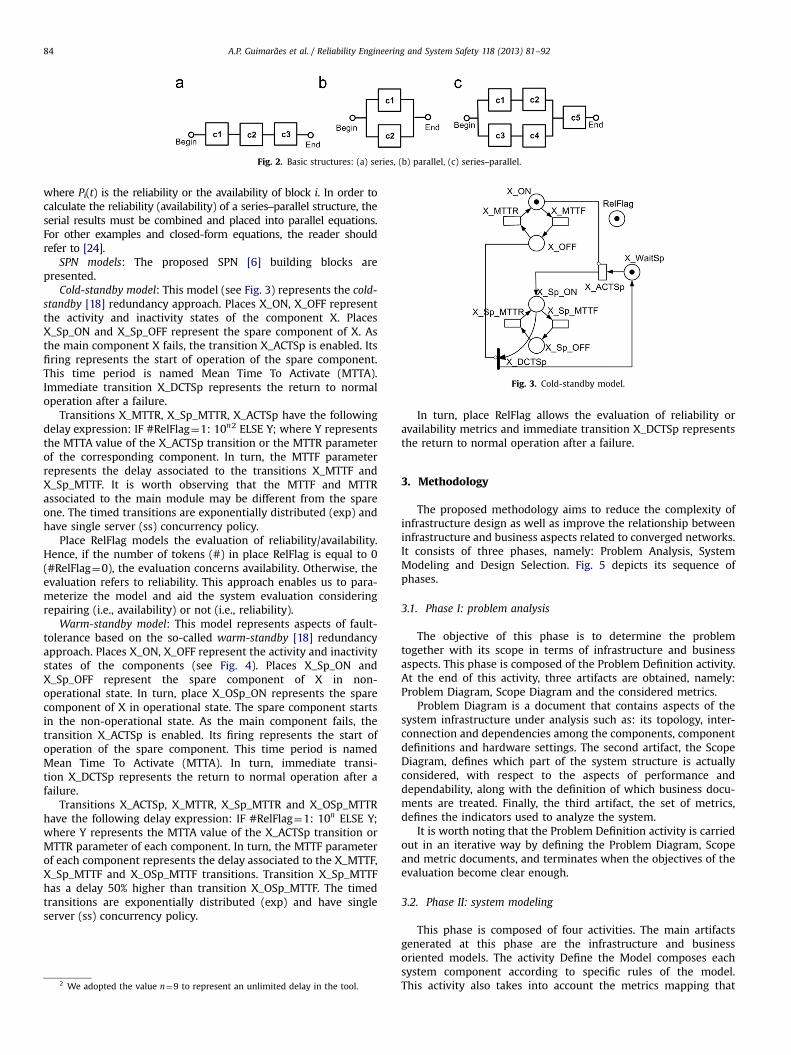
Fig. 2. Basic structures: (a) series, (b) parallel, (c) series–parallel.
Fig. 3. Cold-standby model.
A.P. Guimarães et al. / Reliability Engineering and System Safety 118 (2013) 81–9284
where Pi(t) is the reliability or the availability of block i. In order tocalculate the reliability (availability) of a series–parallel structure, theserial results must be combined and placed into parallel equations.For other examples and closed-form equations, the reader shouldrefer to [24].
SPN models: The proposed SPN [6] building blocks arepresented.
Cold-standby model: This model (see Fig. 3) represents the cold-standby [18] redundancy approach. Places X_ON, X_OFF representthe activity and inactivity states of the component X. PlacesX_Sp_ON and X_Sp_OFF represent the spare component of X. Asthe main component X fails, the transition X_ACTSp is enabled. Itsfiring represents the start of operation of the spare component.This time period is named Mean Time To Activate (MTTA).Immediate transition X_DCTSp represents the return to normaloperation after a failure.
Transitions X_MTTR, X_Sp_MTTR, X_ACTSp have the followingdelay expression: IF #RelFlag¼1: 10n2 ELSE Y; where Y representsthe MTTA value of the X_ACTSp transition or the MTTR parameterof the corresponding component. In turn, the MTTF parameterrepresents the delay associated to the transitions X_MTTF andX_Sp_MTTF. It is worth observing that the MTTF and MTTRassociated to the main module may be different from the spareone. The timed transitions are exponentially distributed (exp) andhave single server (ss) concurrency policy.
Place RelFlag models the evaluation of reliability/availability.Hence, if the number of tokens (#) in place RelFlag is equal to 0(#RelFlag¼0), the evaluation concerns availability. Otherwise, theevaluation refers to reliability. This approach enables us to para-meterize the model and aid the system evaluation consideringrepairing (i.e., availability) or not (i.e., reliability).
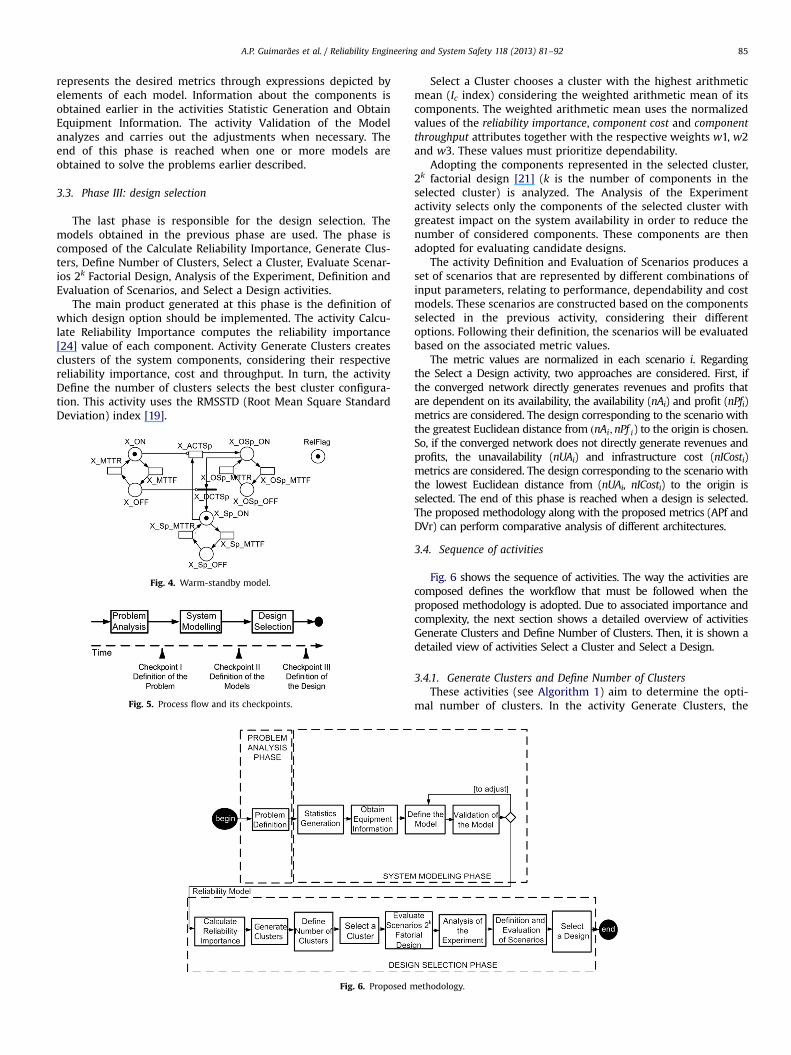
Warm-standby model: This model represents aspects of fault-tolerance based on the so-called warm-standby [18] redundancyapproach. Places X_ON, X_OFF represent the activity and inactivitystates of the components (see Fig. 4). Places X_Sp_ON andX_Sp_OFF represent the spare component of X in non-operational state. In turn, place X_OSp_ON represents the sparecomponent of X in operational state. The spare component startsin the non-operational state. As the main component fails, thetransition X_ACTSp is enabled. Its firing represents the start ofoperation of the spare component. This time period is namedMean Time To Activate (MTTA). In turn, immediate transi-tion X_DCTSp represents the return to normal operation after afailure.
Transitions X_ACTSp, X_MTTR, X_Sp_MTTR and X_OSp_MTTRhave the following delay expression: IF #RelFlag¼1: 10n ELSE Y;where Y represents the MTTA value of the X_ACTSp transition orMTTR parameter of each component. In turn, the MTTF parameterof each component represents the delay associated to the X_MTTF,X_Sp_MTTF and X_OSp_MTTF transitions. Transition X_Sp_MTTFhas a delay 50% higher than transition X_OSp_MTTF. The timedtransitions are exponentially distributed (exp) and have singleserver (ss) concurrency policy.
2 We adopted the value n¼9 to represent an unlimited delay in the tool.
In turn, place RelFlag allows the evaluation of reliability oravailability metrics and immediate transition X_DCTSp representsthe return to normal operation after a failure.
3. Methodology
The proposed methodology aims to reduce the complexity ofinfrastructure design as well as improve the relationship betweeninfrastructure and business aspects related to converged networks.It consists of three phases, namely: Problem Analysis, SystemModeling and Design Selection. Fig. 5 depicts its sequence ofphases.
3.1. Phase I: problem analysis
The objective of this phase is to determine the problemtogether with its scope in terms of infrastructure and businessaspects. This phase is composed of the Problem Definition activity.At the end of this activity, three artifacts are obtained, namely:Problem Diagram, Scope Diagram and the considered metrics.
Problem Diagram is a document that contains aspects of thesystem infrastructure under analysis such as: its topology, inter-connection and dependencies among the components, componentdefinitions and hardware settings. The second artifact, the ScopeDiagram, defines which part of the system structure is actuallyconsidered, with respect to the aspects of performance anddependability, along with the definition of which business docu-ments are treated. Finally, the third artifact, the set of metrics,defines the indicators used to analyze the system.
It is worth noting that the Problem Definition activity is carriedout in an iterative way by defining the Problem Diagram, Scopeand metric documents, and terminates when the objectives of theevaluation become clear enough.
3.2. Phase II: system modeling
This phase is composed of four activities. The main artifactsgenerated at this phase are the infrastructure and businessoriented models. The activity Define the Model composes eachsystem component according to specific rules of the model.This activity also takes into account the metrics mapping that
A.P. Guimarães et al. / Reliability Engineering and System Safety 118 (2013) 81–92 85
represents the desired metrics through expressions depicted byelements of each model. Information about the components isobtained earlier in the activities Statistic Generation and ObtainEquipment Information. The activity Validation of the Modelanalyzes and carries out the adjustments when necessary. Theend of this phase is reached when one or more models areobtained to solve the problems earlier described.
3.3. Phase III: design selection
The last phase is responsible for the design selection. Themodels obtained in the previous phase are used. The phase iscomposed of the Calculate Reliability Importance, Generate Clus-ters, Define Number of Clusters, Select a Cluster, Evaluate Scenar-ios 2k Factorial Design, Analysis of the Experiment, Definition andEvaluation of Scenarios, and Select a Design activities.
The main product generated at this phase is the definition ofwhich design option should be implemented. The activity Calcu-late Reliability Importance computes the reliability importance[24] value of each component. Activity Generate Clusters createsclusters of the system components, considering their respectivereliability importance, cost and throughput. In turn, the activityDefine the number of clusters selects the best cluster configura-tion. This activity uses the RMSSTD (Root Mean Square StandardDeviation) index [19].
Fig. 4. Warm-standby model.
Fig. 5. Process flow and its checkpoints.
Fig. 6. Proposed m
Select a Cluster chooses a cluster with the highest arithmeticmean (Ic index) considering the weighted arithmetic mean of itscomponents. The weighted arithmetic mean uses the normalizedvalues of the reliability importance, component cost and componentthroughput attributes together with the respective weights w1, w2and w3. These values must prioritize dependability.
Adopting the components represented in the selected cluster,2k factorial design [21] (k is the number of components in theselected cluster) is analyzed. The Analysis of the Experimentactivity selects only the components of the selected cluster withgreatest impact on the system availability in order to reduce thenumber of considered components. These components are thenadopted for evaluating candidate designs.
The activity Definition and Evaluation of Scenarios produces aset of scenarios that are represented by different combinations ofinput parameters, relating to performance, dependability and costmodels. These scenarios are constructed based on the componentsselected in the previous activity, considering their differentoptions. Following their definition, the scenarios will be evaluatedbased on the associated metric values.
The metric values are normalized in each scenario i. Regardingthe Select a Design activity, two approaches are considered. First, ifthe converged network directly generates revenues and profits thatare dependent on its availability, the availability (nAi) and profit (nPfi)metrics are considered. The design corresponding to the scenario withthe greatest Euclidean distance from ðnAi;nPf i) to the origin is chosen.So, if the converged network does not directly generate revenues andprofits, the unavailability (nUAi) and infrastructure cost (nICosti)metrics are considered. The design corresponding to the scenario withthe lowest Euclidean distance from (nUAi, nICosti) to the origin isselected. The end of this phase is reached when a design is selected.The proposed methodology along with the proposed metrics (APf andDVr) can perform comparative analysis of different architectures.
3.4. Sequence of activities
Fig. 6 shows the sequence of activities. The way the activities arecomposed defines the workflow that must be followed when theproposed methodology is adopted. Due to associated importance andcomplexity, the next section shows a detailed overview of activitiesGenerate Clusters and Define Number of Clusters. Then, it is shown adetailed view of activities Select a Cluster and Select a Design.
3.4.1. Generate Clusters and Define Number of ClustersThese activities (see Algorithm 1) aim to determine the opti-
mal number of clusters. In the activity Generate Clusters, the
ethodology.

A.P. Guimarães et al. / Reliability Engineering and System Safety 118 (2013) 81–9286
Agglomerative Hierarchical Clustering (AHC) approach wasapplied to group similar network components using the reliabilityimportance, cost and throughput attributes on a specific config-uration. Different configurations of clusters were created. TheRMSSTD [19] index is calculated at each step of the hierarchicalalgorithm [8]. This index measures the homogeneity of theformed clusters. Then, it is possible to construct a graph repre-senting the RMSSTD variation in accordance with the number ofclusters. The point of maximum curvature indicates a thresholdbetween decline and stabilization phases of RMSSTD. This pointindicates the optimal number of clusters, nc. This value will beused in the next activity, Select a Cluster. In this algorithm, CPrepresents the set of components. In turn, C represents the set ofclusters. The used notations in the algorithms are describedbelow:
�
nc: optimal number of clusters, such that nc ∈ Znþ;
� nij: number of elements in cluster i, dimension j, such that i∈Znþand j∈Zn
þ;
� xij: expected value in the cluster i and dimension j; � xk: element in kth position; � ri, cost, thp: correspond to the values of the attributesreliability importance, component cost and componentthroughput;
�
nri, ncost, nthp: correspond to the normalized values of theattributes reliability importance, component cost and compo-nent throughput of each component i;�
mxri, mxcost, mxthp: maximum values of the correspondingattribute on the whole data set;�
d: number of dimension; � Ic: Ic index of a cluster;Algorithm 1. Calculate the optimal number of clusters.
Input: CP #Set of all Components#dist(c1,c2) #A Distance Function#Output: nc #The optimal number of Clusters#int p; #Number of Components within a Cluster#CP⟶R3;CP¼ fcpijcpi ¼ ðrii; costi; thpiÞg;int k; #Number of Components#C # Set of Clusters#C¼ fcijci ¼ fcp1;…; cppgg#Each element cpi of CP is placed in a cluster ci#for i¼1 to k do
ci ¼ fcpigend forC¼ fc1;…; ckgwhile C:size≥1 do
t⟵C:size
RMSSTDt ¼ffiffiffiffiffiffiffiffiffiffiffiffiffiffiffiffiffiffiffiffiffiffiffiffiffiffiffiffiffiffiffiffiffiffiffiffi∑i ¼ 1…C:size
j ¼ 1…d∑nijk ¼ 1ðxk−xijÞ2
∑i ¼ 1…C:sizej ¼ 1…d
ðnij−1Þ2
s
if t¼1 thenGo To Line 26
end ifðcmin1; cmin2Þ ¼min distðci; cjÞ for all ci; cj∈CRemove cmin1 and cmin2 from Cadd fcmin1; cmin2g to C
end whileSelect nc # Based on the RMSSTD values#
3.4.2. Select a ClusterIn this activity, the selected cluster represents the components
that have the greatest impact on the aspects of infrastructure
dependability (see Algorithm 2). Initially, the attributes of thethree-dimensional components of CP are normalized, resulting inthe NCP set.
The selected cluster will have the highest value corre-sponding to Ic index. The weights (w1, w2 and w3) correspondto reliability importance, component cost and compo-nent throughput attributes and can take any values. Thesevalues vary according to the priority afforded to aspects ofdependability, cost and performance related to thecomponents.
Algorithm 2. Select a Cluster.
Input: nc #The optimal number of Clusters#Output: SC #Selected Cluster#P ⟶Rnc #Number of components in each cluster i#P¼ fp1;…; pigCP⟶R3;CP¼ fcpijcpi ¼ ðrii; costi; thpiÞg;NCP⟶R3;NCP¼ fncpijncpi ¼ ðnrii;ncosti;nthpiÞg;int k; #Number of Components#ci ¼ fcp1;…; cppi g; #Cluster i#g⟵1;Ic⟵0;#Normalize CP#for cpi∈CP do
NCP¼ fncpi ncpi ¼ ð riimxri
; costimxcost
; thpimxthp
Þg���
end for#Select the Appropriated Cluster#for i¼1 to nc do
Ici ¼∑pim ¼ 1
ððw1�nrim Þþðw2�ncostm Þþðw3�nthpm ÞÞ∑dk ¼ 1
wk
pi
if Ici4 Ic thenIc⟵Icig⟵i
end ifend forSC¼cg;cg ¼ fcp1;…; cppgReturn (SC); #Return the selected cluster with p components#
3.4.3. Select a Design
The purpose of this activity is to optimize the process ofinfrastructure design selection in terms of infrastructure andbusiness oriented metrics (see Algorithm 3).
Algorithm 3. Select a Design.
Input: SS¼ fssigjssi ¼ fððAiðsc′Þ;UAiðsc′Þ; Pf iðsc′Þ; ICostiðsc′ÞÞg;#Set of Scenarios#Output: SD¼ ðm1;m2Þ #Selected Design#int dl,l,dg,g;int n; #Number of Options##First Approach m1¼A, m2¼Pf; Second Approach m1¼UA,m2¼ ICost.#SS¼ fssijssi ¼ ðm1i;m2iÞg;normalize ssi;∀i;for i¼1 to n|SC’| doNSS¼ fnssijnssi ¼ ðnm1i;nm2iÞg;nssi ¼ ðð m1i−m1mn
m1mx−m1mnÞ; ð m2i−m2mn
m2mx−m2mnÞÞ;
end for#Choosing the Quasi-optimal Design (Greatest EuclideanDistance)#dg⟵0;
A.P. Guimarães et al. / Reliability Engineering and System Safety 118 (2013) 81–92 87
g⟵1;for i¼1 to njSC′jdo
di ¼ffiffiffiffiffiffiffiffiffiffiffiffiffiffiffiffiffiffiffiffiffiffiffiffiffiffiffiffiffiffiffiffiffiðnAiÞ2 þ ðnPf iÞ2
q;
if di4dg thendg⟵di;g⟵i;
elsedg⟵dg;
end ifend forSelected Design - ðnAgÞ; ðnPf gÞ;#Choosing the Quasi-Optimal Design (Lowest EuclideanDistance)#
d1 ¼ffiffiffiffiffiffiffiffiffiffiffiffiffiffiffiffiffiffiffiffiffiffiffiffiffiffiffiffiffiffiffiffiffiffiffiffiffiffiffiffiffiffiffiffiðnUA1Þ2 þ ðnICost1Þ2
q;
dl⟵d1;l⟵1;for i¼2 to njSC′j
di ¼ffiffiffiffiffiffiffiffiffiffiffiffiffiffiffiffiffiffiffiffiffiffiffiffiffiffiffiffiffiffiffiffiffiffiffiffiffiffiffiffiffiffiðnUAiÞ2 þ ðnICostiÞ2
q;
if diodl thendl⟵di;l⟵i;
elsedl⟵dl;
end ifend forSelected Design - (nUAl), (nICostl);
Scenarios are built, based on different combinations of inputparameters, relating to performance, dependability and cost mod-els. Each scenario i, which represents a candidate design, hasdifferent associated metrics. The set of built scenarios,SS¼ fssijssi ¼ ðAiðsc′Þ;UAiðsc′Þ; Pf iðsc′Þ; ICostiðsc′ÞÞg, is based on theSC′ components, SC′DSC and SC ¼ fcp1;…; cppg. In turn, SC′ isobtained through the analysis of the 2k factorial design function,considering SC. This analysis selects components represented inthe selected cluster SC, with greatest impact on the systemavailability.
The metric values are normalized (see Eq. (13)) in each builtscenario resulting in the NSS set:
nmi ¼ ðmi−MnÞ=ðMx−MnÞ ð13Þ
The notation used in this equation is shown below:
�
nmi: normalized measure in the scenario i, such that 0≤nmi ≤1; � mi: measure of the metric in scenario i, such that mi ∈Rþ; � Mmn: minimum value, such that Mmn ∈Rþ; � Mmx: maximum value, such that Mmx ∈Rþ; � nssi: normalized metric values of each scenario i in NSS;Fig. 7. Proposed architectures: (a) first architecture, (b
Then, the choice of the quasi-optimal infrastructure design willbe made in accordance with the selected approach. For the firstapproach, the normalized metrics of availability (nA) and Profit(nPf) are considered. The design corresponding to the scenariowith the greatest Euclidean distance from (nAi, nPfi) to the origin ischosen. In the second approach, the normalized metrics ofunavailability (nUA) and infrastructure cost (nICost) are consid-ered. The design corresponding to the scenario with the lowestEuclidean distance from (nUAi, nICosti) to the origin is selected.Furthermore, this algorithm can be adapted to treat otherapproaches. It is worth observing that only one of the approachescan be used in the algorithm each time.
4. Case study
This section is divided into two parts. First, some basearchitectures are used to support different scenarios in order toevaluate our proposal. The quasi-optimal design for each eval-uated architecture, in terms of infrastructure and businessaspects, is determined for situations where the proposed meth-odology is not considered and for situations considering itsapplication. The second part presents an application of thismethodology together with the DVr metric in a real convergednetwork.
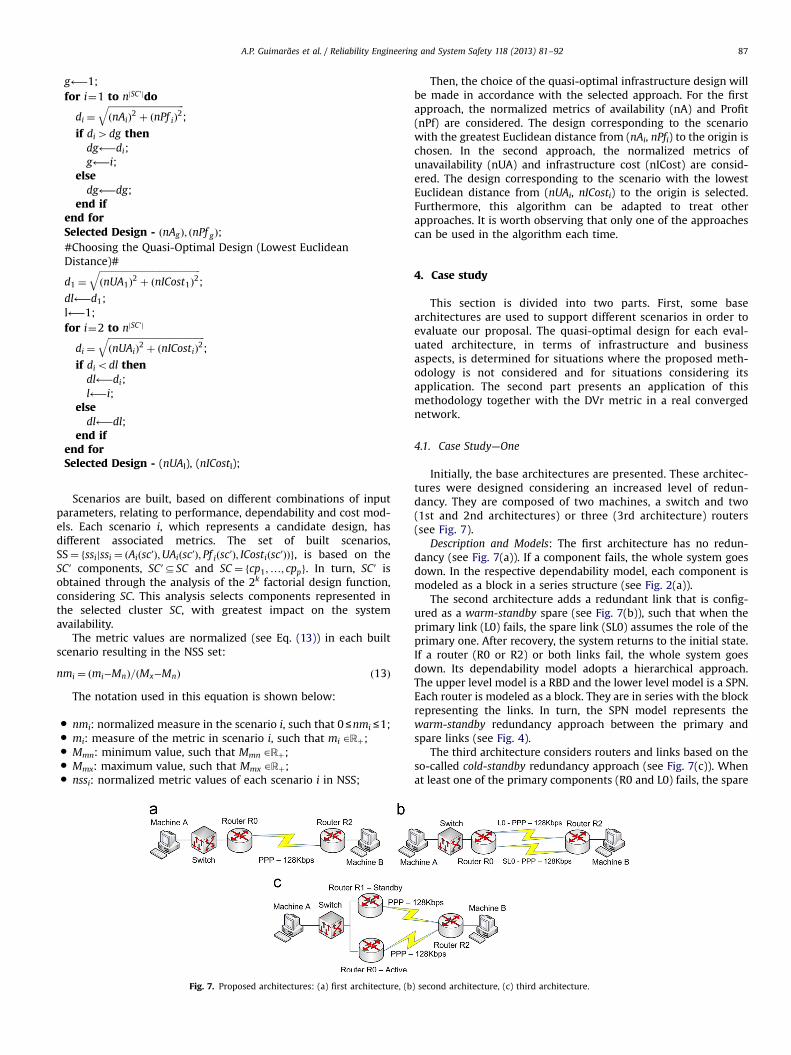
4.1. Case Study—One
Initially, the base architectures are presented. These architec-tures were designed considering an increased level of redun-dancy. They are composed of two machines, a switch and two(1st and 2nd architectures) or three (3rd architecture) routers(see Fig. 7).
Description and Models: The first architecture has no redun-dancy (see Fig. 7(a)). If a component fails, the whole system goesdown. In the respective dependability model, each component ismodeled as a block in a series structure (see Fig. 2(a)).
The second architecture adds a redundant link that is config-ured as a warm-standby spare (see Fig. 7(b)), such that when theprimary link (L0) fails, the spare link (SL0) assumes the role of theprimary one. After recovery, the system returns to the initial state.If a router (R0 or R2) or both links fail, the whole system goesdown. Its dependability model adopts a hierarchical approach.The upper level model is a RBD and the lower level model is a SPN.Each router is modeled as a block. They are in series with the blockrepresenting the links. In turn, the SPN model represents thewarm-standby redundancy approach between the primary andspare links (see Fig. 4).
The third architecture considers routers and links based on theso-called cold-standby redundancy approach (see Fig. 7(c)). Whenat least one of the primary components (R0 and L0) fails, the spare
) second architecture, (c) third architecture.
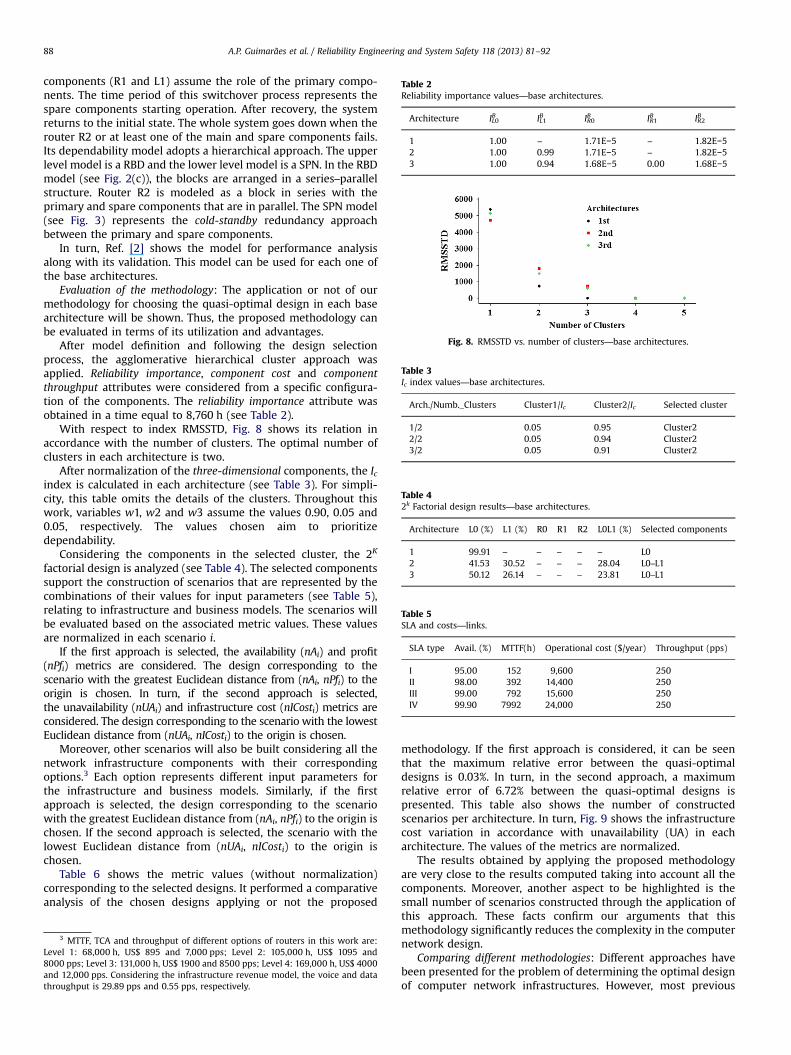
Table 2Reliability importance values—base architectures.
Architecture IBL0 IBL1 IBR0 IBR1 IBR2
1 1.00 – 1.71E−5 – 1.82E−52 1.00 0.99 1.71E−5 – 1.82E−53 1.00 0.94 1.68E−5 0.00 1.68E−5
Fig. 8. RMSSTD vs. number of clusters—base architectures.
Table 3Ic index values—base architectures.
Arch./Numb._Clusters Cluster1/Ic Cluster2/Ic Selected cluster
1/2 0.05 0.95 Cluster22/2 0.05 0.94 Cluster23/2 0.05 0.91 Cluster2
Table 42k Factorial design results—base architectures.
Architecture L0 (%) L1 (%) R0 R1 R2 L0L1 (%) Selected components
1 99.91 – – – – – L02 41.53 30.52 – – – 28.04 L0–L13 50.12 26.14 – – – 23.81 L0–L1
Table 5SLA and costs—links.
SLA type Avail. (%) MTTF(h) Operational cost ($/year) Throughput (pps)
I 95.00 152 9,600 250II 98.00 392 14,400 250III 99.00 792 15,600 250IV 99.90 7992 24,000 250
A.P. Guimarães et al. / Reliability Engineering and System Safety 118 (2013) 81–9288
components (R1 and L1) assume the role of the primary compo-nents. The time period of this switchover process represents thespare components starting operation. After recovery, the systemreturns to the initial state. The whole system goes down when therouter R2 or at least one of the main and spare components fails.Its dependability model adopts a hierarchical approach. The upperlevel model is a RBD and the lower level model is a SPN. In the RBDmodel (see Fig. 2(c)), the blocks are arranged in a series–parallelstructure. Router R2 is modeled as a block in series with theprimary and spare components that are in parallel. The SPN model(see Fig. 3) represents the cold-standby redundancy approachbetween the primary and spare components.
In turn, Ref. [2] shows the model for performance analysisalong with its validation. This model can be used for each one ofthe base architectures.
Evaluation of the methodology: The application or not of ourmethodology for choosing the quasi-optimal design in each basearchitecture will be shown. Thus, the proposed methodology canbe evaluated in terms of its utilization and advantages.
After model definition and following the design selectionprocess, the agglomerative hierarchical cluster approach wasapplied. Reliability importance, component cost and componentthroughput attributes were considered from a specific configura-tion of the components. The reliability importance attribute wasobtained in a time equal to 8,760 h (see Table 2).
With respect to index RMSSTD, Fig. 8 shows its relation inaccordance with the number of clusters. The optimal number ofclusters in each architecture is two.
After normalization of the three-dimensional components, the Icindex is calculated in each architecture (see Table 3). For simpli-city, this table omits the details of the clusters. Throughout thiswork, variables w1, w2 and w3 assume the values 0.90, 0.05 and0.05, respectively. The values chosen aim to prioritizedependability.
Considering the components in the selected cluster, the 2K
factorial design is analyzed (see Table 4). The selected componentssupport the construction of scenarios that are represented by thecombinations of their values for input parameters (see Table 5),relating to infrastructure and business models. The scenarios willbe evaluated based on the associated metric values. These valuesare normalized in each scenario i.
If the first approach is selected, the availability (nAi) and profit(nPfi) metrics are considered. The design corresponding to thescenario with the greatest Euclidean distance from (nAi, nPfi) to theorigin is chosen. In turn, if the second approach is selected,the unavailability (nUAi) and infrastructure cost (nICosti) metrics areconsidered. The design corresponding to the scenario with the lowestEuclidean distance from (nUAi, nICosti) to the origin is chosen.
Moreover, other scenarios will also be built considering all thenetwork infrastructure components with their correspondingoptions.3 Each option represents different input parameters forthe infrastructure and business models. Similarly, if the firstapproach is selected, the design corresponding to the scenariowith the greatest Euclidean distance from (nAi, nPfi) to the origin ischosen. If the second approach is selected, the scenario with thelowest Euclidean distance from (nUAi, nICosti) to the origin ischosen.
Table 6 shows the metric values (without normalization)corresponding to the selected designs. It performed a comparativeanalysis of the chosen designs applying or not the proposed
3 MTTF, TCA and throughput of different options of routers in this work are:Level 1: 68,000 h, US$ 895 and 7,000 pps; Level 2: 105,000 h, US$ 1095 and8000 pps; Level 3: 131,000 h, US$ 1900 and 8500 pps; Level 4: 169,000 h, US$ 4000and 12,000 pps. Considering the infrastructure revenue model, the voice and datathroughput is 29.89 pps and 0.55 pps, respectively.
methodology. If the first approach is considered, it can be seenthat the maximum relative error between the quasi-optimaldesigns is 0.03%. In turn, in the second approach, a maximumrelative error of 6.72% between the quasi-optimal designs ispresented. This table also shows the number of constructedscenarios per architecture. In turn, Fig. 9 shows the infrastructurecost variation in accordance with unavailability (UA) in eacharchitecture. The values of the metrics are normalized.
The results obtained by applying the proposed methodologyare very close to the results computed taking into account all thecomponents. Moreover, another aspect to be highlighted is thesmall number of scenarios constructed through the application ofthis approach. These facts confirm our arguments that thismethodology significantly reduces the complexity in the computernetwork design.
Comparing different methodologies: Different approaches havebeen presented for the problem of determining the optimal designof computer network infrastructures. However, most previous
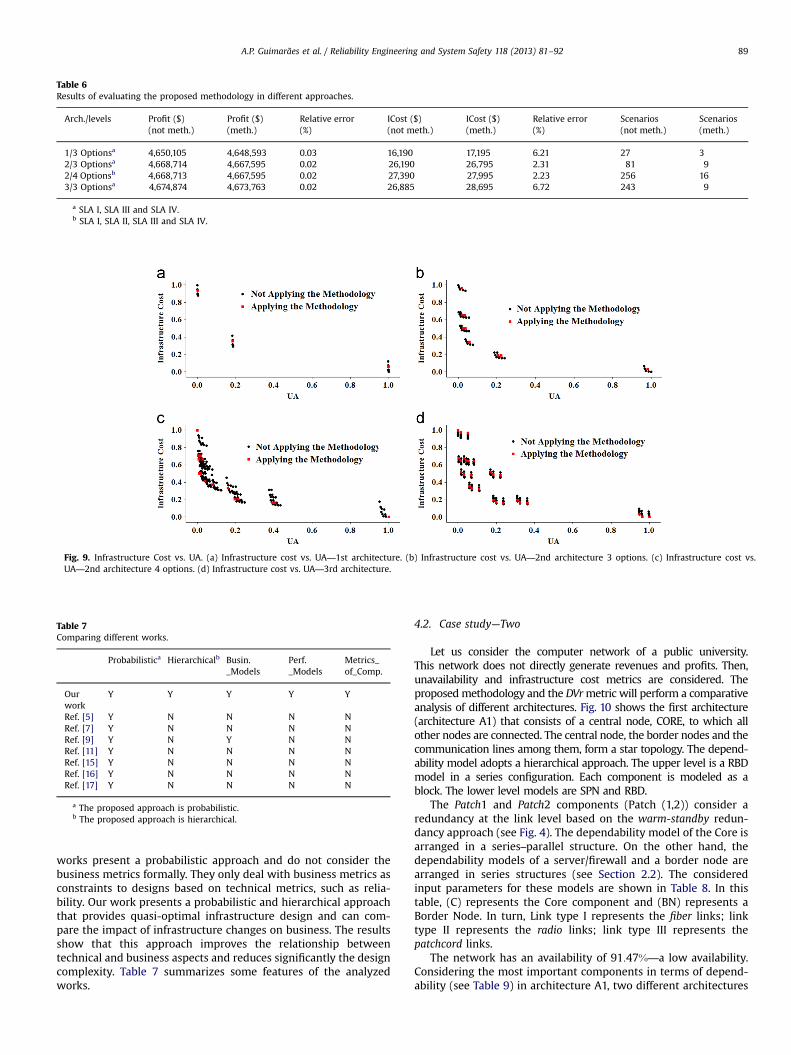
Table 6Results of evaluating the proposed methodology in different approaches.
Arch./levels Profit ($)(not meth.)
Profit ($)(meth.)
Relative error(%)
ICost ($)(not meth.)
ICost ($)(meth.)
Relative error(%)
Scenarios(not meth.)
Scenarios(meth.)
1/3 Optionsa 4,650,105 4,648,593 0.03 16,190 17,195 6.21 27 32/3 Optionsa 4,668,714 4,667,595 0.02 26,190 26,795 2.31 81 92/4 Optionsb 4,668,713 4,667,595 0.02 27,390 27,995 2.23 256 163/3 Optionsa 4,674,874 4,673,763 0.02 26,885 28,695 6.72 243 9
a SLA I, SLA III and SLA IV.b SLA I, SLA II, SLA III and SLA IV.
Fig. 9. Infrastructure Cost vs. UA. (a) Infrastructure cost vs. UA—1st architecture. (b) Infrastructure cost vs. UA—2nd architecture 3 options. (c) Infrastructure cost vs.UA—2nd architecture 4 options. (d) Infrastructure cost vs. UA—3rd architecture.
Table 7Comparing different works.
Probabilistica Hierarchicalb Busin._Models
Perf._Models
Metrics_of_Comp.
Ourwork
Y Y Y Y Y
Ref. [5] Y N N N NRef. [7] Y N N N NRef. [9] Y N Y N NRef. [11] Y N N N NRef. [15] Y N N N NRef. [16] Y N N N NRef. [17] Y N N N N
a The proposed approach is probabilistic.b The proposed approach is hierarchical.
A.P. Guimarães et al. / Reliability Engineering and System Safety 118 (2013) 81–92 89
works present a probabilistic approach and do not consider thebusiness metrics formally. They only deal with business metrics asconstraints to designs based on technical metrics, such as relia-bility. Our work presents a probabilistic and hierarchical approachthat provides quasi-optimal infrastructure design and can com-pare the impact of infrastructure changes on business. The resultsshow that this approach improves the relationship betweentechnical and business aspects and reduces significantly the designcomplexity. Table 7 summarizes some features of the analyzedworks.
4.2. Case study—Two
Let us consider the computer network of a public university.This network does not directly generate revenues and profits. Then,unavailability and infrastructure cost metrics are considered. Theproposed methodology and the DVrmetric will perform a comparativeanalysis of different architectures. Fig. 10 shows the first architecture(architecture A1) that consists of a central node, CORE, to which allother nodes are connected. The central node, the border nodes and thecommunication lines among them, form a star topology. The depend-ability model adopts a hierarchical approach. The upper level is a RBDmodel in a series configuration. Each component is modeled as ablock. The lower level models are SPN and RBD.
The Patch1 and Patch2 components (Patch (1,2)) consider aredundancy at the link level based on the warm-standby redun-dancy approach (see Fig. 4). The dependability model of the Core isarranged in a series–parallel structure. On the other hand, thedependability models of a server/firewall and a border node arearranged in series structures (see Section 2.2). The consideredinput parameters for these models are shown in Table 8. In thistable, (C) represents the Core component and (BN) represents aBorder Node. In turn, Link type I represents the fiber links; linktype II represents the radio links; link type III represents thepatchcord links.
The network has an availability of 91:47%—a low availability.Considering the most important components in terms of depend-ability (see Table 9) in architecture A1, two different architectures
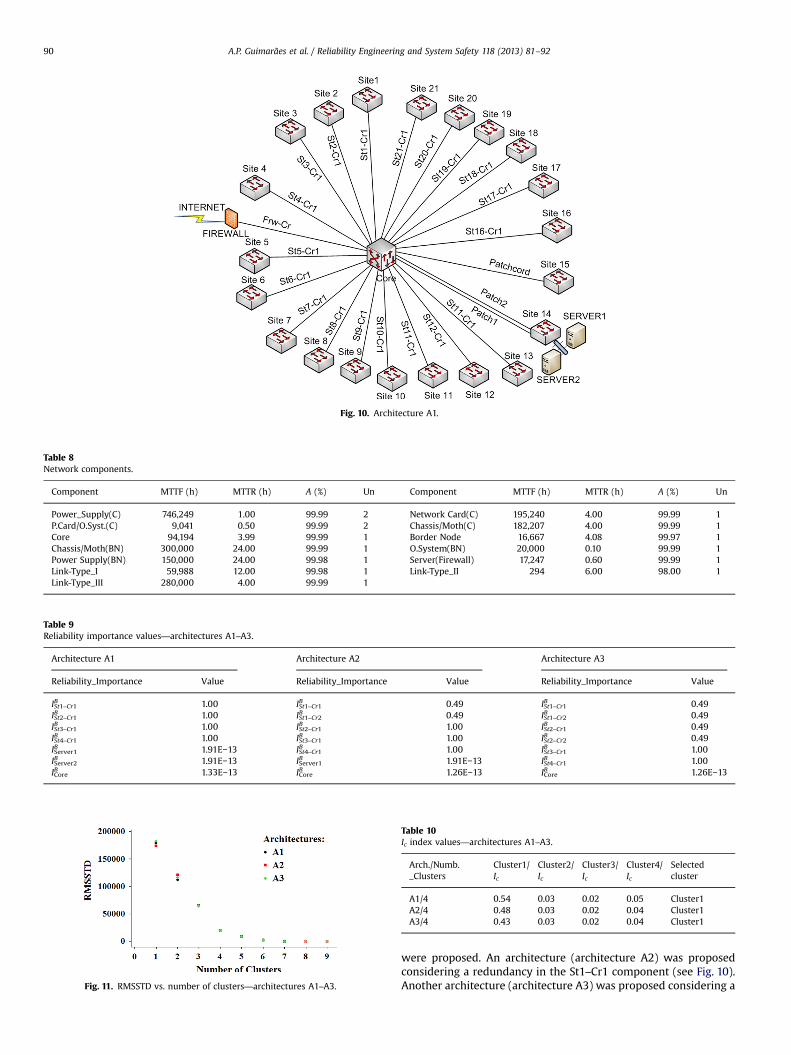
Fig. 10. Architecture A1.
Table 8Network components.
Component MTTF (h) MTTR (h) A (%) Un Component MTTF (h) MTTR (h) A (%) Un
Power_Supply(C) 746,249 1.00 99.99 2 Network Card(C) 195,240 4.00 99.99 1P.Card/O.Syst.(C) 9,041 0.50 99.99 2 Chassis/Moth(C) 182,207 4.00 99.99 1Core 94,194 3.99 99.99 1 Border Node 16,667 4.08 99.97 1Chassis/Moth(BN) 300,000 24.00 99.99 1 O.System(BN) 20,000 0.10 99.99 1Power Supply(BN) 150,000 24.00 99.98 1 Server(Firewall) 17,247 0.60 99.99 1Link-Type_I 59,988 12.00 99.98 1 Link-Type_II 294 6.00 98.00 1Link-Type_III 280,000 4.00 99.99 1
Table 9Reliability importance values—architectures A1–A3.
Architecture A1 Architecture A2 Architecture A3
Reliability_Importance Value Reliability_Importance Value Reliability_Importance Value
IBSt1–Cr1 1.00 IBSt1–Cr1 0.49 IBSt1–Cr1 0.49IBSt2–Cr1 1.00 IBSt1–Cr2 0.49 IBSt1–Cr2 0.49IBSt3–Cr1 1.00 IBSt2–Cr1 1.00 IBSt2–Cr1 0.49IBSt4–Cr1 1.00 IBSt3–Cr1 1.00 IBSt2–Cr2 0.49IBServer1 1.91E−13 IBSt4–Cr1 1.00 IBSt3–Cr1 1.00IBServer2 1.91E−13 IBServer1 1.91E−13 IBSt4–Cr1 1.00IBCore 1.33E−13 IBCore 1.26E−13 IBCore 1.26E−13
Fig. 11. RMSSTD vs. number of clusters—architectures A1–A3.
Table 10Ic index values—architectures A1–A3.
Arch./Numb._Clusters
Cluster1/Ic
Cluster2/Ic
Cluster3/Ic
Cluster4/Ic
Selectedcluster
A1/4 0.54 0.03 0.02 0.05 Cluster1A2/4 0.48 0.03 0.02 0.04 Cluster1A3/4 0.43 0.03 0.02 0.04 Cluster1
A.P. Guimarães et al. / Reliability Engineering and System Safety 118 (2013) 81–9290
were proposed. An architecture (architecture A2) was proposedconsidering a redundancy in the St1–Cr1 component (see Fig. 10).Another architecture (architecture A3) was proposed considering a
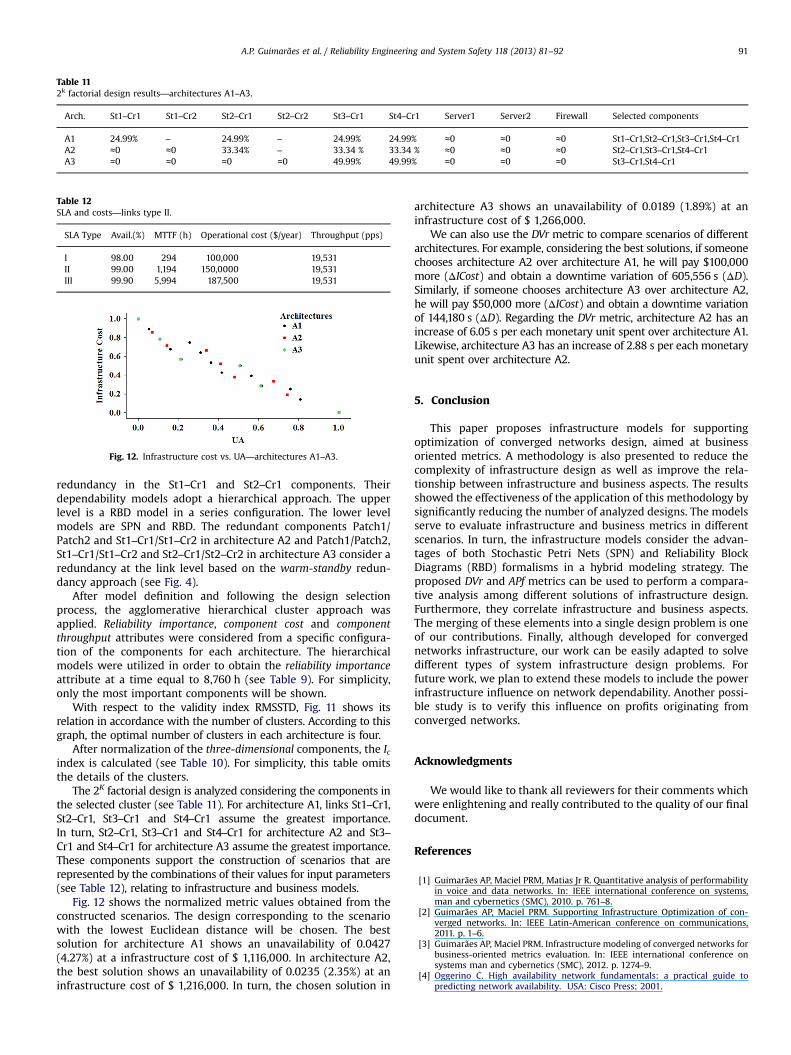
Table 112k factorial design results—architectures A1–A3.
Arch. St1–Cr1 St1–Cr2 St2–Cr1 St2–Cr2 St3–Cr1 St4–Cr1 Server1 Server2 Firewall Selected components
A1 24.99% – 24.99% – 24.99% 24.99% ≈0 ≈0 ≈0 St1–Cr1,St2–Cr1,St3–Cr1,St4–Cr1A2 ≈0 ≈0 33.34% – 33.34 % 33.34 % ≈0 ≈0 ≈0 St2–Cr1,St3–Cr1,St4–Cr1A3 ≈0 ≈0 ≈0 ≈0 49.99% 49.99% ≈0 ≈0 ≈0 St3–Cr1,St4–Cr1
Table 12SLA and costs—links type II.
SLA Type Avail.(%) MTTF (h) Operational cost ($/year) Throughput (pps)
I 98.00 294 100,000 19,531II 99.00 1,194 150,0000 19,531III 99.90 5,994 187,500 19,531
Fig. 12. Infrastructure cost vs. UA—architectures A1–A3.
A.P. Guimarães et al. / Reliability Engineering and System Safety 118 (2013) 81–92 91
redundancy in the St1–Cr1 and St2–Cr1 components. Theirdependability models adopt a hierarchical approach. The upperlevel is a RBD model in a series configuration. The lower levelmodels are SPN and RBD. The redundant components Patch1/Patch2 and St1–Cr1/St1–Cr2 in architecture A2 and Patch1/Patch2,St1–Cr1/St1–Cr2 and St2–Cr1/St2–Cr2 in architecture A3 consider aredundancy at the link level based on the warm-standby redun-dancy approach (see Fig. 4).
After model definition and following the design selectionprocess, the agglomerative hierarchical cluster approach wasapplied. Reliability importance, component cost and componentthroughput attributes were considered from a specific configura-tion of the components for each architecture. The hierarchicalmodels were utilized in order to obtain the reliability importanceattribute at a time equal to 8,760 h (see Table 9). For simplicity,only the most important components will be shown.
With respect to the validity index RMSSTD, Fig. 11 shows itsrelation in accordance with the number of clusters. According to thisgraph, the optimal number of clusters in each architecture is four.
After normalization of the three-dimensional components, the Icindex is calculated (see Table 10). For simplicity, this table omitsthe details of the clusters.
The 2K factorial design is analyzed considering the components inthe selected cluster (see Table 11). For architecture A1, links St1–Cr1,St2–Cr1, St3–Cr1 and St4–Cr1 assume the greatest importance.In turn, St2–Cr1, St3–Cr1 and St4–Cr1 for architecture A2 and St3–Cr1 and St4–Cr1 for architecture A3 assume the greatest importance.These components support the construction of scenarios that arerepresented by the combinations of their values for input parameters(see Table 12), relating to infrastructure and business models.
Fig. 12 shows the normalized metric values obtained from theconstructed scenarios. The design corresponding to the scenariowith the lowest Euclidean distance will be chosen. The bestsolution for architecture A1 shows an unavailability of 0.0427(4.27%) at a infrastructure cost of $ 1,116,000. In architecture A2,the best solution shows an unavailability of 0.0235 (2.35%) at aninfrastructure cost of $ 1,216,000. In turn, the chosen solution in
architecture A3 shows an unavailability of 0.0189 (1.89%) at aninfrastructure cost of $ 1,266,000.
We can also use the DVr metric to compare scenarios of differentarchitectures. For example, considering the best solutions, if someonechooses architecture A2 over architecture A1, he will pay $100,000more (ΔICost) and obtain a downtime variation of 605,556 s (ΔD).Similarly, if someone chooses architecture A3 over architecture A2,he will pay $50,000 more (ΔICost) and obtain a downtime variationof 144,180 s (ΔD). Regarding the DVr metric, architecture A2 has anincrease of 6.05 s per each monetary unit spent over architecture A1.Likewise, architecture A3 has an increase of 2.88 s per each monetaryunit spent over architecture A2.
5. Conclusion
This paper proposes infrastructure models for supportingoptimization of converged networks design, aimed at businessoriented metrics. A methodology is also presented to reduce thecomplexity of infrastructure design as well as improve the rela-tionship between infrastructure and business aspects. The resultsshowed the effectiveness of the application of this methodology bysignificantly reducing the number of analyzed designs. The modelsserve to evaluate infrastructure and business metrics in differentscenarios. In turn, the infrastructure models consider the advan-tages of both Stochastic Petri Nets (SPN) and Reliability BlockDiagrams (RBD) formalisms in a hybrid modeling strategy. Theproposed DVr and APf metrics can be used to perform a compara-tive analysis among different solutions of infrastructure design.Furthermore, they correlate infrastructure and business aspects.The merging of these elements into a single design problem is oneof our contributions. Finally, although developed for convergednetworks infrastructure, our work can be easily adapted to solvedifferent types of system infrastructure design problems. Forfuture work, we plan to extend these models to include the powerinfrastructure influence on network dependability. Another possi-ble study is to verify this influence on profits originating fromconverged networks.
Acknowledgments
We would like to thank all reviewers for their comments whichwere enlightening and really contributed to the quality of our finaldocument.
References
[1] Guimarães AP, Maciel PRM, Matias Jr R. Quantitative analysis of performabilityin voice and data networks. In: IEEE international conference on systems,man and cybernetics (SMC), 2010. p. 761–8.
[2] Guimarães AP, Maciel PRM. Supporting Infrastructure Optimization of con-verged networks. In: IEEE Latin-American conference on communications,2011. p. 1–6.
[3] Guimarães AP, Maciel PRM. Infrastructure modeling of converged networks forbusiness-oriented metrics evaluation. In: IEEE international conference onsystems man and cybernetics (SMC), 2012. p. 1274–9.
[4] Oggerino C. High availability network fundamentals: a practical guide topredicting network availability. USA: Cisco Press; 2001.
A.P. Guimarães et al. / Reliability Engineering and System Safety 118 (2013) 81–9292
[5] Cao D, Murat A, Chinnam RB. Efficient exact optimization of multi-objectiveredundancy allocation problems in series–parallel systems. Reliability Engi-neering and System Safety 2013;111:154–63.
[6] Bolch G, Greiner S, De Meer H, Trivedi KS. Queuing networks and Markovchains: modelling and performance evaluation with computer science appli-cations. 2nd ed.John Wiley & Sons; 2001.
[7] Taboadaa HA, Baheranwalaa F, Coita DW, Wattanapongsakorn N. Practicalsolutions for multi-objective optimization: an application to system reliabilitydesign problems. Reliability Engineering and System Safety 2007;92(3):314–22.
[8] H. Hamilton(n.d.). Knowledge discovery in databases. From http://www2.cs.uregina.ca/�dbd/cs831/index.html Accessed 1 October 2012.
[9] Cook JL, Ramirez-Marquez JE. Optimal design of cluster-based ad-hoc net-works using probabilistic solution discovery. Reliability Engineering andSystem Safety 2009;94(2):218–28.
[10] Sauve J, Moura A, Marques F. Business-driven design of infrastructures for ITservices. Journal of Network and Systems Management 2009;17(4):422–56.
[11] Ramirez-Marquez JE, Rocco CM. All-terminal network reliability optimizationvia probabilistic solution discovery. Reliability Engineering and System Safety2008;93(11):1689–97.
[12] Trivedi KS, Kim DS, Roy A, Medhi D. Dependability and security models. In:design of reliable communication networks 2009. p. 11–20.
[13] Gospodinov M. The affects of different queuing disciplines over FTP, video andVoIP performance. In: International conference on computer systems andtechnologies, 2004. p. 1–5.
[14] Buco MJ, Chang RN, Luan LZ, Ward C, Wolf JL, Yu PS. Utility computing SLAmanagement based upon business objectives. IBM Systems Journal2004;43:159–78.
[15] Marseguerra M, Zio E, Podofillini L, Coit DW. Optimal design of reliablenetwork systems in presence of uncertainty. IEEE Transactions on Reliability2005;54(2):243–53.
[16] Nourelfath M, Nahas N. Quantized Hopfield networks for reliability optimiza-tion. Reliability Engineering and System Safety 2003;81(2):191–6.
[17] Nahas N, Nourelfath M. Ant system for reliability optimization of a seriessystem with multiple-choice and budget constraints. Reliability Engineeringand System Safety 2005;87(1):1–12.
[18] Lee PA, Anderson T. Fault tolerance: principles and practice. New York:Springer-Verlag; 1990.
[19] Rujasiri P, Chomtee B. Comparison of clustering techniques for cluster analysis.Kasetsart Journal Natural Science 2009;43(2):378–88.
[20] German R. Performance analysis of communicating systems—modeling withnon-Markovian stochastic Petri nets. New York: John Wiley & Sons Inc.; 2000.
[21] Jain R. The art of computer systems performance analysis: techniques forexperimental design, measurement, simulation and modeling. John Wiley &Sons Inc.; 1990.
[22] Sahner R, Trivedi KS, Puliafito A. Performance and reliability analysis ofcomputer systems. Kluwer Academic Publishers Group; 2002 ISBN 0-7923-9650-2.
[23] Antti V. The state explosion problem. Lectures on Petri nets I: basic models,advances in petri nets, the volumes are based on the Advanced Course on PetriNets. London: Springer-Verlag; 429–528.
[24] Kuo W, Zuo MJ. Optimal reliability modeling: principles and applications.Hoboken, NJ: John Wiley & Sons Inc.; 2003 ISBN 0-471-39761-X.
[25] Chen X, Wang C, Xuan D, Li Z, Min Y, Zhao W. Survey on QoS management ofVoIP. In: Proceedings of the international conference on computer networksand mobile computing, ICCNMC, 2003. p. 69–77.
Related Documents