COMPUTING Using Metrics to Evaluate Software System Maintainability In this month’s Computing Practices we offer a sneak preview of Computer’s September issue on software metrics. Software metrics have been much criticized in the last few years, some- times justly but more often unjustly, because critics misunderstand the intent behind the technology. Software complexity metrics, for example, rarely measure the “inherent complexity’ embedded in software systems, but they do a very good job of comparing the relative complexity of one portion of a system with another. In essence, they are good modeling tools. Whether they are also good measuring tools depends on how consistently and appropriately they are applied. The two articles showcased here suggest ways of applying such metrics. Our first article, by Don Coleman et al., sets forth maintainability metrics for gauging the effect of maintenance changes in software systems, rank ordering subsystem complexity, and comparing the “quality” of two different systems, The second article, by Norman Schneidewind, describes an approach to validating software quality metrics for large-scale projects such as the space shuttle flight software. The proposed metrics isolate specific quality factors that let us predict and control software quality. Please feel free to contact me di- rectly about articles you liked, didn’ t like, or would like to see in this section (omanQcs.uidaho.edu). -Paul Oman Don Coleman and Dan Ash, Hewlett-Packard Bruce Lowther, Micron Semiconductor Paul Oman, University of Idaho ith the maturation of software development practices, software main- tainability has become one of the most important concerns of the soft- ware industry. In his classic book on software engineering, Fred Brooks’ claimed, “The total cost of maintaining a widely used program is typically 40 percent or more of the cost of developing it.” Parikh* had a more pessimistic view, claiming that 45 to 60 percent is spent on maintenance. More recently, two recognized ex- perts, Corbi3 and Yourdon, claimed that software maintainability is one of the ma- jor challenges for the 1990s. These statements were validated recently by Dean Morton, executive vice presi- dent and chief operating officer of Hewlett-Packard, who gave the keynote address at the 1992 Hewlett-Packard Software Engineering Productivity Conference. Mor- ton stated that Hewlett-Packard (HP) currently has between 40 and 50 million lines of code under maintenance and that 60 to 80 percent of research and development personnel are involved in maintenance activities. He went on to say that 40 to 60 percent of the cost of production is now maintenance expense. The intent of this article is to demonstrate how automated software maintainabil- ity analysis can be used to guide software-related decision making. We have applied metrics-based software maintainability models to 11 industrial software systems and used the results for fact-finding and process-selection decisions. The results indicate that automated maintainability assessment can be used to support buy-versus-build de- cisions, pre- and post-reengineering analysis, subcomponent quality analysis, test re- source allocation, and the prediction and targeting of defect-prone subcomponents. Further, the analyses can be conducted at various levels of granularity. At the com- ponent level, we can use these models to monitor changes to the system as they occur and to predict fault-prone components. At the file level, we can use them to identify subsystems that are not well organized and should be targeted for perfective mainte- nance. The results can also be used to determine when a system should be reengi- neered. Finally, we can use these models to compare whole systems. Comparing a known-quality system to a third-party system can provide a basis for deciding whether to purchase the third-party system or develop a similar system internally. NlX-9162/94/$4.00 0 1994 IEEE COMPUTER

Welcome message from author
This document is posted to help you gain knowledge. Please leave a comment to let me know what you think about it! Share it to your friends and learn new things together.
Transcript
COMPUTING
Using Metrics to Evaluate Software System Maintainability
In this month’s Computing Practices we offer a sneak preview of Computer’s September issue on software metrics. Software metrics have been much criticized in the last few years, some- times justly but more often unjustly, because critics misunderstand the intent behind the technology. Software complexity metrics, for example, rarely measure the “inherent complexity’ embedded in software systems, but they do a very good job of comparing the relative complexity of one portion of a system with another. In essence, they are good modeling tools. Whether they are also good measuring tools depends on how consistently and appropriately they are applied. The two articles showcased here suggest ways of applying such metrics.
Our first article, by Don Coleman et al., sets forth maintainability metrics for gauging the effect of maintenance changes in software systems, rank ordering subsystem complexity, and comparing the “quality” of two different systems,
The second article, by Norman Schneidewind, describes an approach to validating software quality metrics for large-scale projects such as the space shuttle flight software. The proposed metrics isolate specific quality factors that let us predict and control software quality.
Please feel free to contact me di- rectly about articles you liked, didn’t like, or would like to see in this section (omanQcs.uidaho.edu).
-Paul Oman
Don Coleman and Dan Ash, Hewlett-Packard
Bruce Lowther, Micron Semiconductor
Paul Oman, University of Idaho
ith the maturation of software development practices, software main- tainability has become one of the most important concerns of the soft- ware industry. In his classic book on software engineering, Fred Brooks’
claimed, “The total cost of maintaining a widely used program is typically 40 percent or more of the cost of developing it.” Parikh* had a more pessimistic view, claiming that 45 to 60 percent is spent on maintenance. More recently, two recognized ex- perts, Corbi3 and Yourdon, claimed that software maintainability is one of the ma- jor challenges for the 1990s.
These statements were validated recently by Dean Morton, executive vice presi- dent and chief operating officer of Hewlett-Packard, who gave the keynote address at the 1992 Hewlett-Packard Software Engineering Productivity Conference. Mor- ton stated that Hewlett-Packard (HP) currently has between 40 and 50 million lines of code under maintenance and that 60 to 80 percent of research and development personnel are involved in maintenance activities. He went on to say that 40 to 60 percent of the cost of production is now maintenance expense.
The intent of this article is to demonstrate how automated software maintainabil- ity analysis can be used to guide software-related decision making. We have applied metrics-based software maintainability models to 11 industrial software systems and used the results for fact-finding and process-selection decisions. The results indicate that automated maintainability assessment can be used to support buy-versus-build de- cisions, pre- and post-reengineering analysis, subcomponent quality analysis, test re- source allocation, and the prediction and targeting of defect-prone subcomponents. Further, the analyses can be conducted at various levels of granularity. At the com- ponent level, we can use these models to monitor changes to the system as they occur and to predict fault-prone components. At the file level, we can use them to identify subsystems that are not well organized and should be targeted for perfective mainte- nance. The results can also be used to determine when a system should be reengi- neered. Finally, we can use these models to compare whole systems. Comparing a known-quality system to a third-party system can provide a basis for deciding whether to purchase the third-party system or develop a similar system internally.
NlX-9162/94/$4.00 0 1994 IEEE COMPUTER
Recent studies in metrics for software maintainability and quality assessment have demonstrated that the software’s characteristics, history, and associated en- vironment(s) are all useful in measuring the quality and maintainability of that software.5-7 Hence, measurement of these characteristics can be incorporated into software maintainability assessment mod- els, which can then be applied to evalu- ate industrial software systems. Successful models should identify and measure what most practitioners view as important com- ponents of software maintainability.
A comparison of five models
We recently analyzed five methods for quantifying software maintainability from software metrics. The definition, derivation, and validation of these five methods has been documented else- where.’ Only a synopsis of the five meth- ods is presented here:
l Hierarchical multidimensional as- sessment models view software main- tainability as a hierarchical structure of the source code’s attributes6
l Polynomial regression models use re- gression analysis as a tool to explore the relationship between software maintainability and software metrics8
l An aggregate complexity measure gauges software maintainability as a function of entr0py.s
l Principal components analysis is a sta- tistical technique to reduce collinear- ity between commonly used complex- ity metrics in order to identify and reduce the number of components used to construct regression models.’
l Factor analysis is another statistical technique wherein metrics are or- thogonalized into unobservable un- derlying factors, which are then used to model system maintainability.5
Tests of the models indicate that all five compute reasonably accurate main- tainability scores from calculations based on simple (existing) metrics. All five models and the validation data were pre-
August 1994
sented to HP Corporate Engineering managers in the spring and summer of 1993. At that time it was decided that the hierarchical multidimensional assess- ment and the polynomial regression models would be pursued as simple mechanisms for maintainability assess- ment that could be used by maintenance engineers in a variety of locations. HP wanted quick, easy-to-calculate indices that “line” engineers could use at their desks. The following subsections explain how these methods were applied to in- dustrial systems.
HPMAS: A hierarchical multidimen- sional assessment model. HPMAS is HP’s software maintainability assessment system based on a hierarchical organiza- tion of a set of software metrics. For this particular type of maintainability prob- lem, Oman and Hagemeister’j have sug- gested a hierarchical model dividing maintainability into three underlying di- mensions or attributes:
(1) The control structure, which includes characteristics pertaining to the way
the program or system is decom- posed into algorithms.
(2) The information structure, which in- cludes characteristics pertaining to the choice and use of data structure and dataflow techniques.
(3) Typography, naming, and comment- ing, which includes characteristics pertaining to the typographic layout, and naming and commenting of code.
We can easily define or identify sepa- rate metrics that can measure each di- mension’s characteristics. Once the met- rics have been defined and/or identified, an “index of maintainability” for each di- mension can be defined as a function of those metrics. Finally, the three dimen- sion scores can be combined for a total maintainability index for the system. For our work, we used existing metrics to cal- culate a deviation from acceptable ranges and then used the inverse of that devia- tion as an index of quality.
Most metrics have an optimum range of values within which the software is more easily maintained. A method called weight and trigger-point-range analysis is
Sohare maintenance detfinitions
Definitions for software “makznance” and “maintainabilii are many, but they et@ fairfy rxinei&enf in acope and intent. Here are the IEEE standard definitions:’
EAaintenaficcr: The process of ntodiiing a software system or component after dekefy to correct faults. improve performance or other attributes, or adapt to a changed ~ron~~t.
~~~~: The ease w&h which a s&Ware system or component can be mod&d to correct faults, improve performance or other attributes, or adapt to a changed environment.
Consistent with these definitions, the maintenance orocess can be divided into three areas of focus:’
Cwrective malntem?&ae: Maintenance performed to correct faults in hard- ware or software.
Adaptive m&Mena~a: Software maintenance performed to make a com- puter progmm usable in a changed environment.
Perfect&e malntcllnafice: Software maintenance performed to improve the performance, mairfteirWMty, or other attributes of a computer program.
1. IEEE Std. 8WJ.12-1890, ‘Gloaaary of Sofhvare Engineerirtg Termhlogy,” in Soifwaw Engineer- ing s&+&m -, IEEE CS Press, Los Alamitos, Calif., Order No. 104846T, 1993.
used to quantify maintainability by cal- culating a “degree of fit” from a table of acceptable metric ranges. When the met- ric value falls outside the optimum range, it indicates that maintainability is lower; hence, there is a deviation (or penalty) on the component’s contribution to maintainability. The optimum range value, called the trigger point range, re- flects the “goodness” of the program style. For example, if the acceptable range for average lines ofcode (aveLOC) is between 5 and 75, values falling below 5 and above 75 serve as the trigger points for what would be classified as poor style. If the measured average lines of code value lies within the acceptable range, there is no penalty. If the metric value falls outside the trigger point range but is close to the bounds (trigger points), we then apply a proportional deviation, which can run up to 100 percent (the maximum penalty). The weighted devia- tion is computed by multiplying the cal- culated deviation by a weighted value be- tween zero and one, inclusive. The metric attributes are combined based on the as- sumption that the dimensional maintain- ability is 100 percent (highly maintain- able); they are then reduced by the deviation percentage of each metric. Di- mension maintainability is calculated as
c wiDi DMdimension = l- ~
c wi
The overall maintainability index is the product of the three dimensions. Multi- plying the three dimensions’ maintainabil- ity gives a lower overall maintainability than averaging does, which underscores the fact that deviation in one aspect of maintainability will hinder other aspects of the maintenance effort, thus reducing maintainability of the entire system.
HPMAS was calibrated against HP en- gineers’ subjective evaluation of 16 soft- ware systems, as measured by an abridged version of the AFOTEC (Air Force Onerational Test and Evaluation Center) software quality assessment in- strument.9 HPMAS maintainability in- dices range from 0 to 100, with lO&rep- resenting excellent maintainability.
Polynomial asskssment tools. Regres- sion analysis is a statistical method for predicting values of one or more response (dependent) variables from a collection of predictor (independent) variables. For purposes of software maintainability as- sessment, we need to create a polynomial equation by which a system’s maintain- ability is expressed as a function of the as- sociated metric attributes. We have used this technique to develop a set of polyno- mial maintainability assessment models.8 These models were developed as simple software maintainability assessment methods that could be calculated from ex- isting metrics. Since these models were intended for use by maintenance practi- tioners “in the trenches,” the models were again calibrated to HP engineers’ subjec- tive evaluation of the software as mea- sured by the abridged version of the AFOTEC software quality assessment in- strument.9 That is, the independent vari- ables used in our models were a host of 40 complexity metrics, and the dependent variable was the (numeric) result of the abridged AFOTEC survey.
Approximately 50 regression models were constructed in an attempt to iden- tify simple models that could be calcu- lated from existing tools and still be generic enough to apply to a wide range of software systems. In spite of the current research trend away from the use of Hal- stead metrics, all tests clearly indicated that Halstead’s volume and effort metrics were the best predictors of maintainabil- ity for the HP test data. The regression model that seemed most applicable was a four-metric polynomial based on Hal- stead’s effort metric and on metrics mea- suring extended cyclomatic complexity, lines of code, and number of comments:
Maintainability = 171 - 3.42 x ln(aveE) - 0.23 x aveV(g’) - 16.2 x In(aveLOC) + aveCM
where aveE, aveV(g’), aveLOC, and aveCM are the average effort, extended V(G), average lines of code, and number of comments per submodule (function or procedure) in the software system.
Preliminary results indicated that this model was too sensitive to large numbers
of comments. That is, large comment blocks, especially in small modules, un- duly inflated the resulting maintainabil- ity indices. To rectify this, we replaced the aveCM component with percent com- ments (perCM), and a ceiling function was placed on the factor to limit its con- tribution to a maximum value of 5O.‘O Also, because there has been much dis- cussion of the nonmonotonicity of Hal- stead’s effort metric (it is not a nonde- creasing function under the concatenation operation), we reconstructed the model using Halstead’s volume metric instead. Thus, the final four-metric polynomial now used in our work is
Maintainability = 171 -5.2 x ln(aveVol) -0.23 x ave V(g’) -16.2 x In(aveLOC)
+(50x sin(JZ&ZZ))
This polynomial has been compared to the original model using the same vali- dation data. The average residual be- tween the effort-based model and the volume-based model is less than 1.4.
Applying the models to industrial software
A software maintainability model is only useful if it can provide developers and maintainers in an industrial setting with more information about the system. Hence, the data used to test and validate our models consisted entirely of genuine industrial systems provided by Hewlett- Packard and Defense Department con- tractors. The examples are presented here to show how these models can aid software maintainers in their decision making. The data presented in the fol- lowing subsections is real and unaltered, except that proprietary information has been removed.
Using HPMAS in a prelpostanalysis of maintenance changes. Over several years of software maintenance, systems tend to
46 COMPUTER
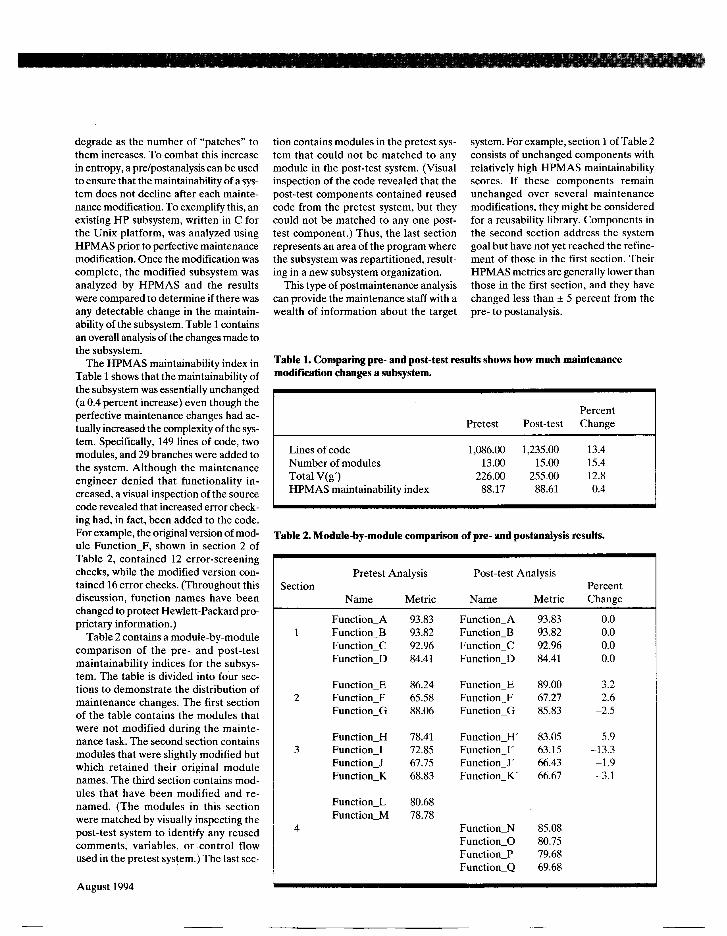
degrade as the number of “patches” to them increases. To combat this increase in entropy, a prelpostanalysis can be used to ensure that the maintainability of a sys- tem does not decline after each mainte- nance modification. To exemplify this, an existing HP subsystem, written in C for the Unix platform, was analyzed using HPMAS prior to perfective maintenance modification. Once the modification was complete, the modified subsystem was analyzed by HPMAS and the results were compared to determine if there was any detectable change in the maintain- ability of the subsystem. Table 1 contains an overall analysis of the changes made to the subsystem.
The HPMAS maintainability index in Table 1 shows that the maintainability of the subsystem was essentially unchanged (a 0.4 percent increase) even though the perfective maintenance changes had ac- tually increased the complexity of the sys- tem. Specifically, 149 lines of code, two modules, and 29 branches were added to the system. Although the maintenance engineer denied that functionality in- creased, a visual inspection of the source code revealed that increased error check- ing had, in fact, been added to the code. For example, the original version of mod- ule Function-F, shown in section 2 of Table 2, contained 12 error-screening checks, while the modified version con- tained 16 error checks. (Throughout this discussion, function names have been changed to protect Hewlett-Packard pro- prietary information.)
Table 2 contains a module-by-module comparison of the pre- and post-test maintainability indices for the subsys- tem. The table is divided into four sec- tions to demonstrate the distribution of maintenance changes. The first section of the table contains the modules that were not modified during the mainte- nance task. The second section contains modules that were slightly modified but which retained their original module names. The third section contains mod- ules that have been modified and re- named. (The modules in this section were matched by visually inspecting the post-test system to identify any reused comments, variables, or control flow used in the pretest system.) The last sec-
August 1994
tion contains modules in the pretest sys- tem that could not be matched to any module in the post-test system. (Visual inspection of the code revealed that the post-test components contained reused code from the pretest system, but they could not be matched to any one post- test component.) Thus, the last section represents an area of the program where the subsystem was repartitioned, result- ing in a new subsystem organization.
This type of postmaintenance analysis can provide the maintenance staff with a
system. For example, section 1 of Table 2 consists of unchanged components with relatively high HPMAS maintainability scores. If these components remain unchanged over several maintenance modifications, they might be considered for a reusability library. Components in the second section address the system goal but have not yet reached the refine- ment of those in the first section. Their HPMAS metrics are generally lower than those in the first section, and they have changed less than f 5 percent from the
wealth of information about the target pre- to postanalysis.
Table 1. Comparing pre- and post-test results shows bow much maintenance modification changes a subsystem.
Percent Pretest Post-test Change
Lines of code 1,086.00 L235.00 13.4 Number of modules 13.00 15.00 15.4 Total V(g’) 226.00 255.00 12.8 HPMAS maintainability index 88.17 88.61 0.4
Table 2. Module-by-module comparison of pre- and postanalysis results.
Pretest Analysis Post-test Analysis Section Percent
Name Metric Name Metric Change
Function-A 93.83 Function-A 93.83 0.0 1 Function-B 93.82 Function-B 93.82 0.0
Function-C 92.96 Function-C 92.96 0.0 Function-D 84.41 Function-D 84.41 0.0
Function-E 86.24 Function-E 89.00 3.2 2 Function-F 65.58 Function-F 67.27 2.6
Function-G 88.06 Function-G 85.83 -2.5
Function-H 78.41 Function-H’ 83.05 5.9 3 Function-I 72.85 Function-I’ 63.15 -13.3
Function-J 67.75 Function-J’ 66.43 -1.9 Function-K 68.83 Function-K’ 66.67 -3.1
Function-L 80.68 Function-M 78.78
4 Function-N 85.08 Function-O 80.75 Function-P 79.68 Function-Q 69.68
200 Ilf Highest MI
L
250
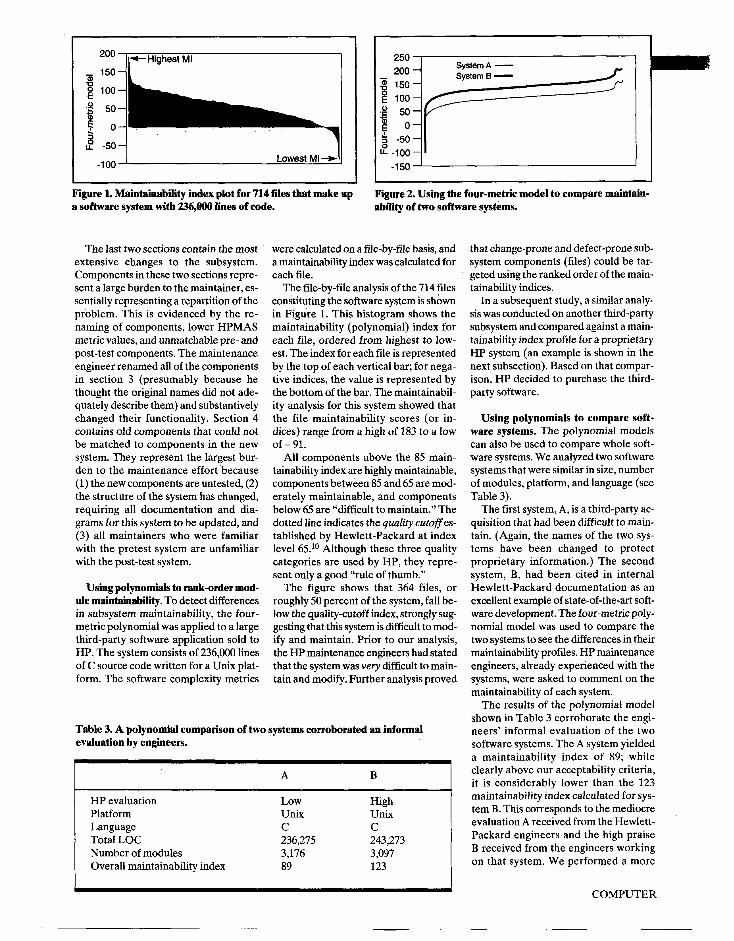
Figure 1. Maintainability index plot for 714 files that make up a software system with 236,000 lines of code.
Figure 2. Using the four-metric model to compare maintain- ability of two software systems.
The last two sections contain the most extensive changes to the subsystem. Components in these two sections repre- sent a large burden to the maintainer, es- sentially representing a repartition of the problem. This is evidenced by the re- naming of components, lower HPMAS metric values, and unmatchable pre- and post-test components. The maintenance engineer renamed all of the components in section 3 (presumably because he thought the original names did not ade- quately describe them) and substantively changed their functionality. Section 4 contains old components that could not be matched to components in the new system. They represent the largest bur- den to the maintenance effort because (1) the new components are untested, (2) the structure of the system has changed, requiring all documentation and dia- grams for this system to be updated, and (3) all maintainers who were familiar with the pretest system are unfamiliar with the post-test system.
were calculated on a file-by-file basis, and a maintainability index was calculated for each file.
The file-by-file analysis of the 714 files constituting the software system is shown in Figure 1. This histogram shows the maintainability (polynomial) index for each file, ordered from highest to low- est.‘The index for each file is represented by the top of each vertical bar; for nega- tive indices, the value is represented by the bottom of the bar. The maintainabil- ity analysis for this system showed that the file maintainability scores (or in- dices) range from a high of 183 to a low of-91.
All components above the 85 main- tainability index are highly maintainable, components between 85 and 65 are mod- erately maintainable, and components below 65 are “difficult to maintain.” The dotted line indicates the quality cutoff es- tablished by Hewlett-Packard at index level 65.1° Although these three quality categories are used by HP, they repre- sent only a good “rule of thumb.”
Using polynomials to rank-order mod- The figure shows that 364 files, or ule maintiabiity. To detect differences roughly 50 percent of the system, fall be- in subsystem maintainability, the four- low the quality-cutoff index, strongly sug- metric polynomial was applied to a large gesting that this system is difficult to mod- third-party software application sold to ify and maintain. Prior to our analysis, HP. The system consists of 236,000 lines the HP maintenance engineers had stated of C source code written for a Unix plat- that the system was very difficult to main- form. The software complexity metrics tain and modify. Further analysis proved
Table 3. A polynomial comparison of two systems corroborated an informal evaluation by engineers.
A B I
HP evaluation Platform Language Total LOC Number of modules Overall maintainability index
Low Unix C 236,275 3,176 89
High Unix C 243,273 3,097 123
that change-prone and defect-prone sub- system components (files) could be tar- geted using the ranked order of the main- tainability indices.
In a subsequent study, a similar analy- sis was conducted on another third-party subsystem and compared against a main- tainability index profile for a proprietary HP system (an example is shown in the next subsection). Based on that compar- ison, HP decided to purchase the third- party software.
Using polynomials to compare soft- ware systems. The polynomial models can also be used to compare whole soft- ware systems. We analyzed two software systems that were similar in size, number of modules, platform, and language (see Table 3).
The first system, A, is a third-party ac- quisition that had been difficult to main- tain. (Again, the names of the two sys- tems have been changed to protect proprietary information.) The second system, B, had been cited in internal Hewlett-Packard documentation as an excellent example of state-of-the-art soft- ware development. The four-metric poly- nomial model was used to compare the two systems to see the differences in their maintainability profiles. HP maintenance engineers, already experienced with the systems, were asked to comment on the maintainability of each system.
The results of the polynomial model shown in Table 3 corroborate the engi- neers’ informal evaluation of the two software systems. The A system yielded a maintainability index of 89; while clearly above our acceptability criteria, it is considerably lower than the 123 maintainability index calculated for sys- tem B. This corresponds to the mediocre evaluation A received from the Hewlett- Packard engineers and the high praise B received from the engineers working on that system. We performed a more
COMPUTER
gy Low MI (33.4%)
Medium MI (34.4%)
System A
I Low MI
System 6 (966%)
Low Ml: x < 65 Med Ml: 65 S x < 65 High Ml: 65 $x
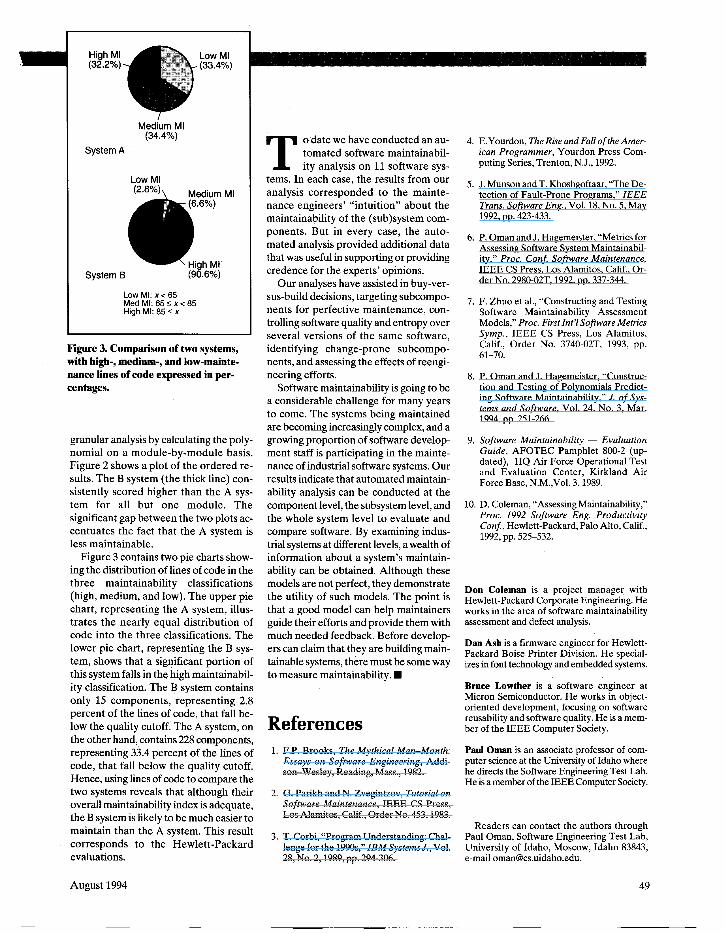
Figure 3. Comparison of two systems, with high-, medium-, and low-mainte- nance lines of code expressed in per- centages.
granular analysis by calculating the poly- nomial on a module-by-module basis. Figure 2 shows a plot of the ordered re- sults. The B system (the thick line) con- sistently scored higher than the A sys- tem for all but one module. The significant gap between the two plots ac- centuates the fact that the A system is less maintainable.
Figure 3 contains two pie charts show- ing the distribution of lines of code in the three maintainability classifications (high, medium, and low). The upper pie chart, representing the A system, illus- trates the nearly equal distribution of code into the three classifications. The lower pie chart, representing the B sys- tem, shows that a significant portion of this system falls in the high maintainabil- ity classification. The B system contains only 15 components, representing 2.8 percent of the lines of code, that fall be- low the quality cutoff. The A system, on the other hand, contains 228 components, representing 33.4 percent of the lines of code, that fall below the quality cutoff. Hence, using lines of code to compare the two systems reveals that although their overall maintainability index is adequate, the B system is likely to be much easier to maintain than the A system. This result corresponds to the Hewlett-Packard evaluations.
August 1994
T o date we have conducted an au- tomated software maintainabil- ity analysis on 11 software sys-
tems. In each case, the results from our analysis corresponded to the mainte- nance engineers’ “intuition” about the maintainability of the (sub)system com- ponents. But in every case, the auto- mated analysis provided additional data that was useful in supporting or providing credence for the experts’ opinions.
Our analyses have assisted in buy-ver- sus-build decisions, targeting subcompo- nents for perfective maintenance, con- trolling software quality and entropy over several versions of the same software, identifying change-prone subcompo- nents, and assessing the effects of reengi- neering efforts.
Software maintainability is going to be a considerable challenge for many years to come. The systems being maintained are becoming increasingly complex, and a growing proportion of software develop- ment staff is participating in the mainte- nance of industrial software systems. Our results indicate that automated maintain- ability analysis can be conducted at the component level, the subsystem level, and the whole system level to evaluate and compare software. By examining indus- trial systems at different levels, a wealth of information about a system’s maintain- ability can be obtained. Although these models are not perfect, they demonstrate the utility of such models. The point is that a good model can help maintainers guide their efforts and provide them with much needed feedback. Before develop- ers can claim that they are building main- tainable systems, there must be some way to measure maintainability. W
References 1. F.P. Brooks, The Mythical Man-Month:
Essays on Software Engineering, Addi- son-Wesley, Reading, Mass., 1982.
2. G. Parikh and N. Zvegintzov, Tutorial on Software Maintenance, IEEE CS Press, Los Alamitos, Calif., Order No. 453,1983.
3. T. Corbi, “Program Understanding: Chal- lenge for the 199Os,” IBM Systems J., Vol. 28, No. 2,1989, pp. 294-306.
4. E.Yourdon, The Rise and Fall of the Amer- ican Programmer, Yourdon Press Com- puting Series, Trenton, NJ., 1992.
5. J. Munson and T. Khoshgoftaar, “The De- tection of Fault-Prone Programs,” IEEE Trans. Software Eng., Vol. 18, No. 5, May 1992, pp. 423-433.
6. P. Oman and J. Hagemeister, “Metrics for Assessing Software System Maintainabil- ity,” Proc. Conf Software Maintenance, IEEE CS Press, Los Alamitos, Calif., Or- der No. 2980-02T, 1992, pp. 337-344.
7. F. Zhuo et al., “Constructing and Testing Software Maintainability Assessment Models,” Proc. First Znt’l Software Metrics Symp., IEEE CS Press, Los Alamitos, Calif., Order No. 3740-02T, 1993, pp. 61-70.
8. P. Oman and J. Hagemeister, “Construc- tion and Testing of Polynomials Predict- ing Software Maintainability,” J. of Sys- tems and Software, Vol. 24, No. 3, Mar. 1994, pp. 251-266.
9. Software Maintainability - Evaluation Guide, AFOTEC Pamphlet 800-2 (up- dated), HQ Air Force Operational Test and Evaluation Center, Kirkland Air Force Base, N.M.,Vol. 3,1989.
10. D. Coleman, “Assessing Maintainability,” Proc. 1992 Software Eng. Productivity Cant, Hewlett-Packard, Palo Alto, Calif., 1992, pp. 525-532.
Don Coleman is a project manager with Hewlett-Packard Corporate Engineering. He works in the area of software maintainability assessment and defect analysis.
Dan Ash is a firmware engineer for Hewlett- Packard Boise Printer Division. He special- izes in font technology and embedded systems.
Bruce Lowther is a software engineer at Micron Semiconductor. He works in object- oriented development, focusing on software reusability and software quality. He is a mem- ber of the IEEE Computer Society.
Paul Oman is an associate professor of com- puter science at the University of Idaho where he directs the Software Engineering Test Lab. He is a member of the IEEE Computer Society.
Readers can contact the authors through Paul Oman, Software Engineering Test Lab, University of Idaho, Moscow, Idaho 83843, e-mail [email protected].
49
Related Documents