African Journal of Biotechnology Vol. 11(25), pp. 6750-6757, 27 March, 2012 Available online at http://www.academicjournals.org/AJB DOI: 10.5897/AJB11.1427 ISSN 1684–5315 © 2012 Academic Journals Full Length Research Paper Amplification of real-time high resolution melting analysis PCR method for polycystic kidney disease (PKD) gene mutations in autosomal dominant polycystic kidney disease patients Rusni Mohd Jas 1 , Ramachandran Vasudevan 1 , Patimah Ismail 1 *, Abdul Halim Abdul Gafor 2 , Saidi Moin 3 and Sima Ataollahi Eshkoor 1 1 Genetic Research Group, Department of Biomedical Science, Faculty of Medicine and Health Sciences, Universiti Putra Malaysia, Malaysia. 2 Nephrology Unit, Department of Medicine, Faculty of Medicine, Universiti Kebangsaan Malaysia, Malaysia. 3 Department of Biomedical Science, Faculty of Medicine and Health Sciences, Universiti Putra Malaysia, Malaysia. Accepted 20 January, 2012 PKD1 and PKD2 are the two genes responsible for the development of autosomal dominant polycystic kidney disease (ADPKD). PKD1 gene mutations accounts for ≈85% of all ADPKD cases, while the remaining ≈15% of cases is caused by mutations in the PKD2 gene. Genotyping for PKD1 and PKD2 mutations was usually identified using conventional polymerase chain reaction (PCR) or PCR-single stranded conformation polymorphisms (SSCP) methods. In this study, we assessed the usefulness of eight common primers amplifying the respective genes in real-time high resolution melting analysis PCR (real-time HRMA PCR) in terms of time, cost and sensitivity with respect to PCR-SSCP method. We found that case sample can easily be differentiated from control sample by melting curve profile difference, although a primer was found to be less useful. We concluded that real-time HRMA PCR is a rapid and sensitive method to categorize samples based on the melting curve profiles with comparable sensitivity to conventional PCR-SSCP. Key words: Autosomal dominant polycystic kidney disease (ADPKD), real-time PCR, high resolution melting analysis, PKD1, PKD2. INTRODUCTION Autosomal dominant polycystic kidney disease (ADPKD) is one of the most common genetic renal diseases affecting approximately 1 in 400 or 1 in 1000 life birth *Corresponding author. E-mail: [email protected]. Tel: 03-89472314. Fax: 03- 89436178. Abbreviations: ADPKD, Autosomal dominant polycystic kidney disease; PCR, polymerase chain reaction; SSCP, single stranded conformation polymorphisms. (Torres and Harris, 2009). The disease is caused by mutations occurring in two known genes: PKD1 located on chromosome 16 (16p13.3) and PKD2 gene located on chromosome 4 (4q22). Both type 1 ADPKD and type 2 are phenotypically similar with development of numerous cysts in both kidneys that may lead to end stage renal disease requiring dialysis in patients. However, type 1 ADPKD is more severe in terms of age of diagnosis, prevalence of hypertension and age of end stage renal disease, requiring dialysis or renal transplantation. Most patients suffering from type 1 ADPKD experience renal failure in their fifth decade of life, while it is delayed by

Welcome message from author
This document is posted to help you gain knowledge. Please leave a comment to let me know what you think about it! Share it to your friends and learn new things together.
Transcript
African Journal of Biotechnology Vol. 11(25), pp. 6750-6757, 27 March, 2012 Available online at http://www.academicjournals.org/AJB DOI: 10.5897/AJB11.1427 ISSN 1684–5315 © 2012 Academic Journals
Full Length Research Paper
Amplification of real-time high resolution melting analysis PCR method for polycystic kidney disease
(PKD) gene mutations in autosomal dominant polycystic kidney disease patients
Rusni Mohd Jas1, Ramachandran Vasudevan1, Patimah Ismail1*, Abdul Halim Abdul Gafor2,
Saidi Moin3 and Sima Ataollahi Eshkoor 1
1Genetic Research Group, Department of Biomedical Science, Faculty of Medicine and Health Sciences, Universiti Putra
Malaysia, Malaysia. 2Nephrology Unit, Department of Medicine, Faculty of Medicine, Universiti Kebangsaan Malaysia, Malaysia.
3Department of Biomedical Science, Faculty of Medicine and Health Sciences, Universiti Putra Malaysia, Malaysia.
Accepted 20 January, 2012
PKD1 and PKD2 are the two genes responsible for the development of autosomal dominant polycystic kidney disease (ADPKD). PKD1 gene mutations accounts for ≈85% of all ADPKD cases, while the remaining ≈15% of cases is caused by mutations in the PKD2 gene. Genotyping for PKD1 and PKD2 mutations was usually identified using conventional polymerase chain reaction (PCR) or PCR-single stranded conformation polymorphisms (SSCP) methods. In this study, we assessed the usefulness of eight common primers amplifying the respective genes in real-time high resolution melting analysis PCR (real-time HRMA PCR) in terms of time, cost and sensitivity with respect to PCR-SSCP method. We found that case sample can easily be differentiated from control sample by melting curve profile difference, although a primer was found to be less useful. We concluded that real-time HRMA PCR is a rapid and sensitive method to categorize samples based on the melting curve profiles with comparable sensitivity to conventional PCR-SSCP. Key words: Autosomal dominant polycystic kidney disease (ADPKD), real-time PCR, high resolution melting analysis, PKD1, PKD2.
INTRODUCTION Autosomal dominant polycystic kidney disease (ADPKD) is one of the most common genetic renal diseases affecting approximately 1 in 400 or 1 in 1000 life birth
*Corresponding author. E-mail: [email protected]. Tel: 03-89472314. Fax: 03- 89436178.
Abbreviations: ADPKD, Autosomal dominant polycystic kidney disease; PCR, polymerase chain reaction; SSCP, single stranded conformation polymorphisms.
(Torres and Harris, 2009). The disease is caused by mutations occurring in two known genes: PKD1 located on chromosome 16 (16p13.3) and PKD2 gene located on chromosome 4 (4q22). Both type 1 ADPKD and type 2 are phenotypically similar with development of numerous cysts in both kidneys that may lead to end stage renal disease requiring dialysis in patients. However, type 1 ADPKD is more severe in terms of age of diagnosis, prevalence of hypertension and age of end stage renal disease, requiring dialysis or renal transplantation. Most patients suffering from type 1 ADPKD experience renal failure in their fifth decade of life, while it is delayed by
Jas et al. 6751
Table 1. Primers used to amplify the PKD genes.
Primer Primer sequence (5’-3’) bp* Annealing
(°C) HRM
melting (°C) Reference
PKD1
AC2.5
(F) AAG GGT GGC AGA GGA GGT GA
(R) CTA ATC GGC GGG GAG CTC TA
120 61.0 74-84
Peral et al., 1994
D16S291
(F) GCA GCC TCA GTT GTG TTT CCT AAT C
(R) AGT GCT GGG ATT ACA GGC ATG AAC C
180 62.6 77-84 Binczak et al., 2006
FF (F) CGT GCT GCT GCC CTA CGT C
(R) CGT CCC CGA GCC ATT GTG 487 64.9 68-83 Kim et al., 2000
PKD2
D4S423
(F) TTG AGT AGT TCC TGA AGC AGC
(R) CAA AGT CCT CCA TCT TGA GTG
120
61.8
73-85
Lee et al., 2001
D4S1544
(F) CCA TAC TAA CAC AAT GGA TAT AGC
(R) CAG AAA CTC CAG CAG AGA CT
250 53.9 73-85
D4S2460
(F) CCA AAA TCA TGT GAG CCA
(R) GAG CAG CCA ACT GTA T
210 58.7 75-84
*bp; base pair, F, forward, R, reverse
about two decades in patients with type 2 ADPKD (Schieren et al., 2006).
The mutations in ADPKD are screened by using polymerase chain reaction (PCR) -based methodology. All the methods require the need of post PCR processing such as single stranded conformation polymorphisms (SSCP) and temperature gradient gel electrophoresis (TGGE). The basic of these methodology is to separate the DNA molecules which differ by one or more nucleotides based on the size and the chemical or physical characteristics (Gasser et al., 2006). However, since gel electrophoresis is the only way to further analyse the amplicons, the techniques are relatively more laborious, and in need for rigid precautions to eliminate products crossover (Krypuy et al., 2006) and contamination that might happen when PCR products were exposed to the environment (Reed and Wittwer, 2004) as well as a considerable technical skills required (Laurie and George, 2009). Moreover, not all mutations can be identified, thus selecting possible samples to which mutations are present is a challenge.
High resolution melting analysis (HRMA) when combined with real-time PCR is proven to be a rapid technique for genotyping with a comparable sensitivity as the conventional methodology. In this study, we aimed to evaluate the usefulness of common primers that amplify PKD1 and PKD2 genes to be used for ADPKD samples genotyping from normal control sample using the real-
time HRMA analysis and to compare the advantages in contrast to PCR-SSCP.
MATERIALS AND METHODS
Samples and DNA extraction
Buccal cells samples were collected from ADPKD patients and control subjects after obtaining the ethical clearance from respective organisations (Universiti Putra Malaysia (Reference number: UPM/FPSK/PADS/T7-MJKEtikaPer/F01(JSB_Okt03); Universiti Kebangsaan Malaysia (Reference number: UKM.1.5.3.5/244/SPP3). A total of 16 buccal cells samples were recruited from the patients and control subjects. Each tube containing the samples was first washed thrice with 0.9% sodium chloride solution with 3:1 ratio. According to the manufacturer’s kit (Fermentas: Hanover, USA) protocol, genomic DNA was extracted and kept at -20°C. The concentration and purity of DNA was checked by using biophotometer (Eppendorf, Germany) against Tris-EDTA (TE) buffer as blank at 260 nm wavelength. Primers and PCR conditions
Three sets of primers were used to amplify both PKD1 and PKD2 gene, respectively (Table 1). The cycling optimizations for all primers were done in gradient PCR (Bio-Rad Thermal Cycler) using normal samples. A total volume of 25 µl PCR reaction was prepared in a single closed-tube containing 1x PCR buffer, 3.0 mM MgCl2 and 0.21 µM of each primer with 10 to 20 ng of genomic DNA. All primers had an initial denaturation of 94°C for 4 to 6 min,
6752 Afr. J. Biotechnol.
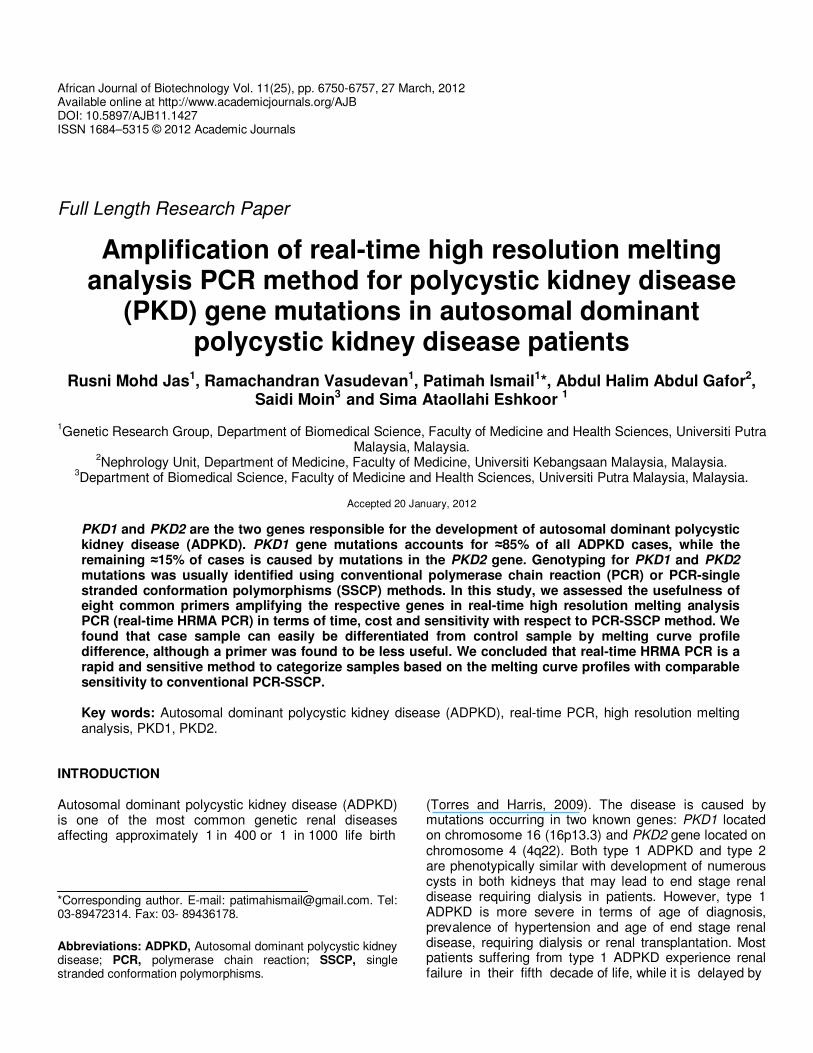
Figure 1. PCR-SSCP result showing bands generated by 1, primer D16S291; 2, primer D4S423. The numbers of band are the same for control and case subject, and only different in the base size. All control samples regardless of primers had a slightly larger band size than the case samples, therefore migrated slower. The patterns of bands in the gel enabled the samples to be differentiated (a, control sample; b, case sample). PCR-SSCP, polymerase chain reaction-single stranded conformation polymorphisms.
with a 30 cycles of denaturation, annealing with optimized temperature and extension; and final extension at 72°C for 10 to 20 min (Table 1).
Single-stranded conformation polymorphisms
All samples were run in conventional PCR (Mastercycler, Eppendorf, Germany) prior to SSCP analysis. Electrophoresis were carried out in Origins (Elchrom Scientific, Cham, Switzerland) with voltage applied at 72 V (6 V per cm where cm = distance between electrodes) for up to 15 h. Following electrophoresis, the gels were stained with SYBR Green II. Real-time HRMA PCR For real-time PCR, each reaction tube was added 1 µl (20x) EvaGreen intercalating dye (Biotium, CA), to a total volume of 25 µl. The same cycling conditions were used in the Rotor-Gene 6000™ (Corbett Research, Mortlake, New South Wales, Australia) for real-time HRMA with pre-amplification with additional five cycles. Melting temperatures were between 65 and 98°C and was raised at a rate of 0.1°C per second. The melt curve analysis was done by using the Rotor-Gene™ 6000 real-time rotary analyzer software. All samples and primers were run in duplicates for validation. A third blinded run for all primers were done by another person to further confirm the data obtained.
RESULTS AND DISCUSSION
Subjects ADPKD patients were diagnosed as having numerous cysts in both kidneys that were evidence during ultrasound with a mean age of 54.38 years. Control subjects were selected from healthy general population and were not related to the patients. They were matched by gender, age and race to the patients. The quantity of DNA is between 90 and 125 µg with purity reading at 1.43 to 1.7 PCR SSCP The PCR SSCP result showed several bands for control and case sample. Figure 1 shows the PCR SSCP result for primer D16S291 and primer D4S423. Although, the number of bands was the same for both control and case, the bands size differed. Control samples had larger product size than case samples, so they migrated slower as opposed to the case samples. The same findings were observed by using all primers in which control samples
Jas et al. 6753
200bp
100bp A B C D E 100bp
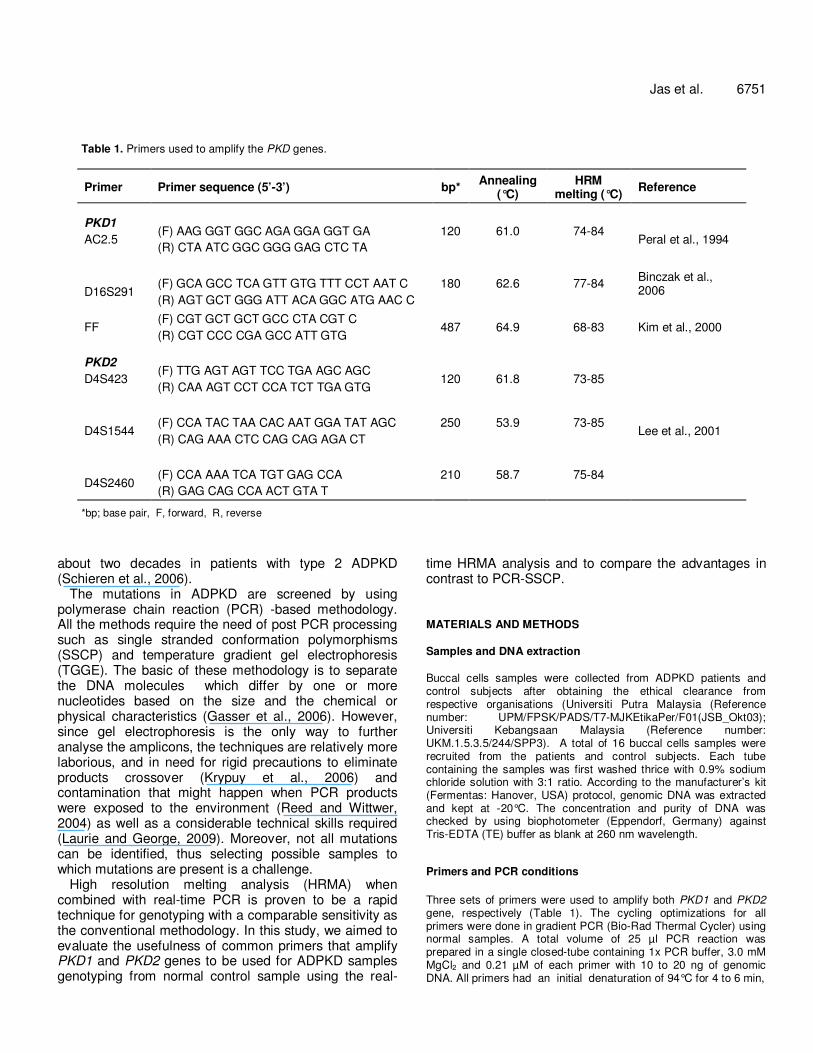
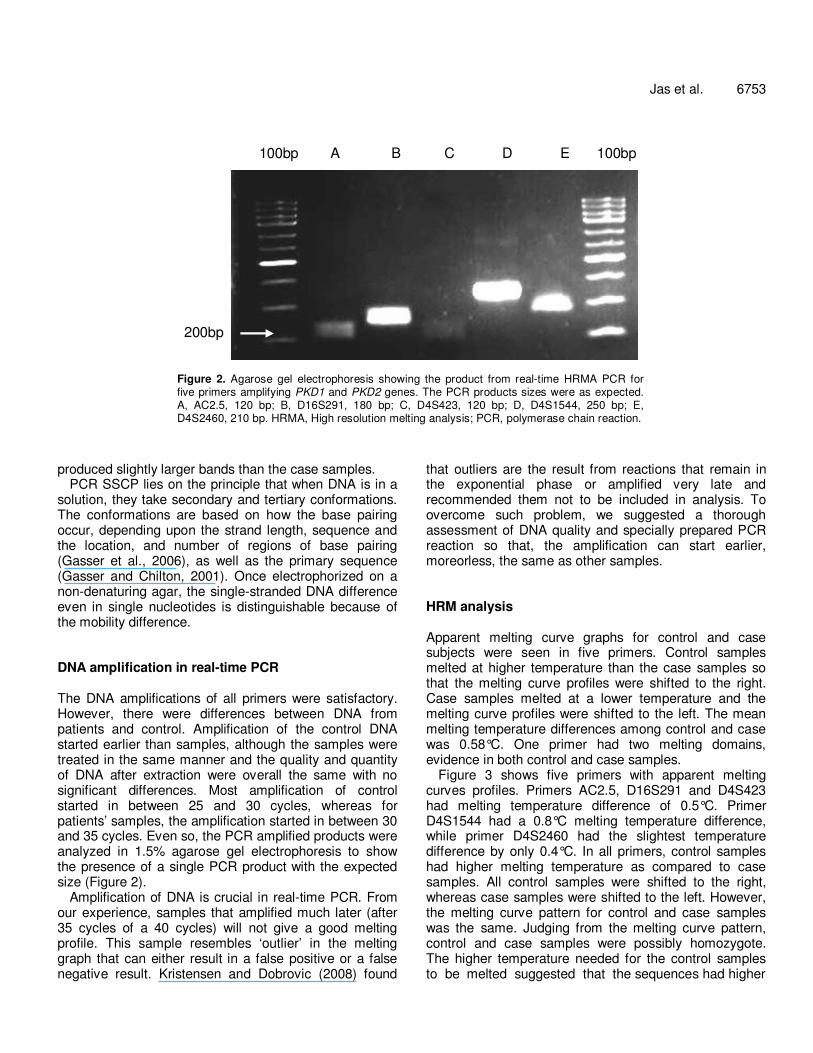
Figure 2. Agarose gel electrophoresis showing the product from real-time HRMA PCR for five primers amplifying PKD1 and PKD2 genes. The PCR products sizes were as expected. A, AC2.5, 120 bp; B, D16S291, 180 bp; C, D4S423, 120 bp; D, D4S1544, 250 bp; E, D4S2460, 210 bp. HRMA, High resolution melting analysis; PCR, polymerase chain reaction.
produced slightly larger bands than the case samples. PCR SSCP lies on the principle that when DNA is in a
solution, they take secondary and tertiary conformations. The conformations are based on how the base pairing occur, depending upon the strand length, sequence and the location, and number of regions of base pairing (Gasser et al., 2006), as well as the primary sequence (Gasser and Chilton, 2001). Once electrophorized on a non-denaturing agar, the single-stranded DNA difference even in single nucleotides is distinguishable because of the mobility difference. DNA amplification in real-time PCR The DNA amplifications of all primers were satisfactory. However, there were differences between DNA from patients and control. Amplification of the control DNA started earlier than samples, although the samples were treated in the same manner and the quality and quantity of DNA after extraction were overall the same with no significant differences. Most amplification of control started in between 25 and 30 cycles, whereas for patients’ samples, the amplification started in between 30 and 35 cycles. Even so, the PCR amplified products were analyzed in 1.5% agarose gel electrophoresis to show the presence of a single PCR product with the expected size (Figure 2).
Amplification of DNA is crucial in real-time PCR. From our experience, samples that amplified much later (after 35 cycles of a 40 cycles) will not give a good melting profile. This sample resembles ‘outlier’ in the melting graph that can either result in a false positive or a false negative result. Kristensen and Dobrovic (2008) found
that outliers are the result from reactions that remain in the exponential phase or amplified very late and recommended them not to be included in analysis. To overcome such problem, we suggested a thorough assessment of DNA quality and specially prepared PCR reaction so that, the amplification can start earlier, moreorless, the same as other samples. HRM analysis Apparent melting curve graphs for control and case subjects were seen in five primers. Control samples melted at higher temperature than the case samples so that the melting curve profiles were shifted to the right. Case samples melted at a lower temperature and the melting curve profiles were shifted to the left. The mean melting temperature differences among control and case was 0.58°C. One primer had two melting domains, evidence in both control and case samples.
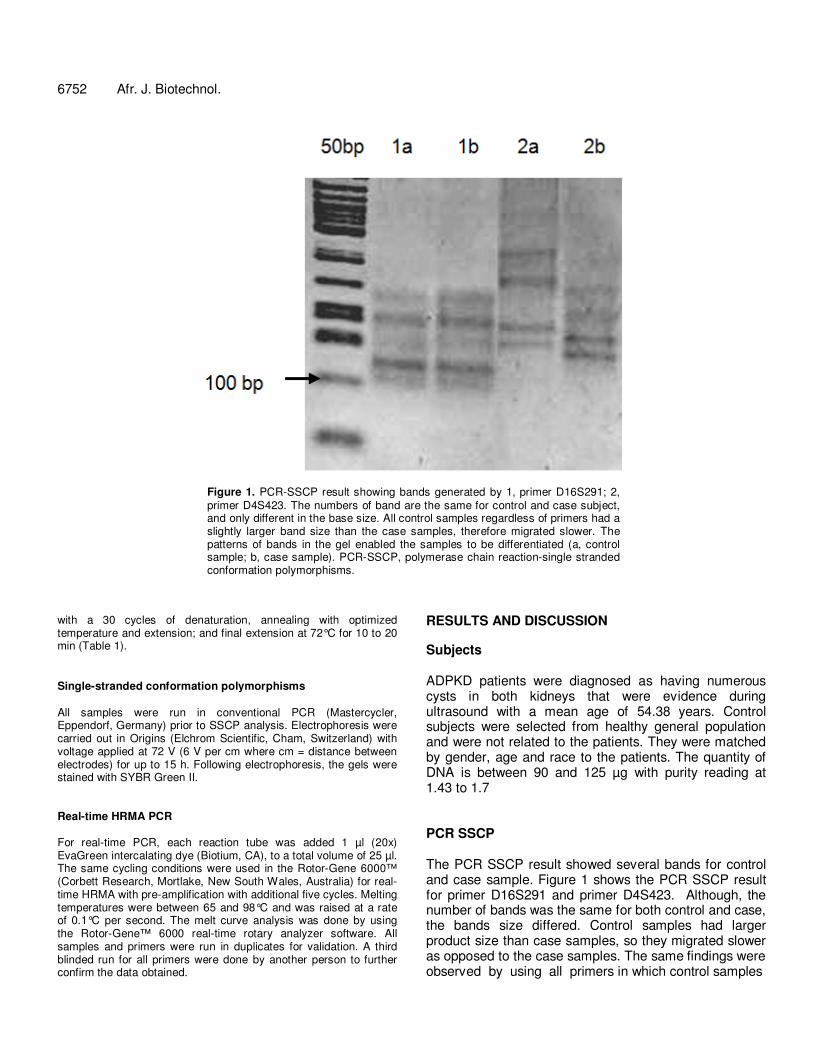
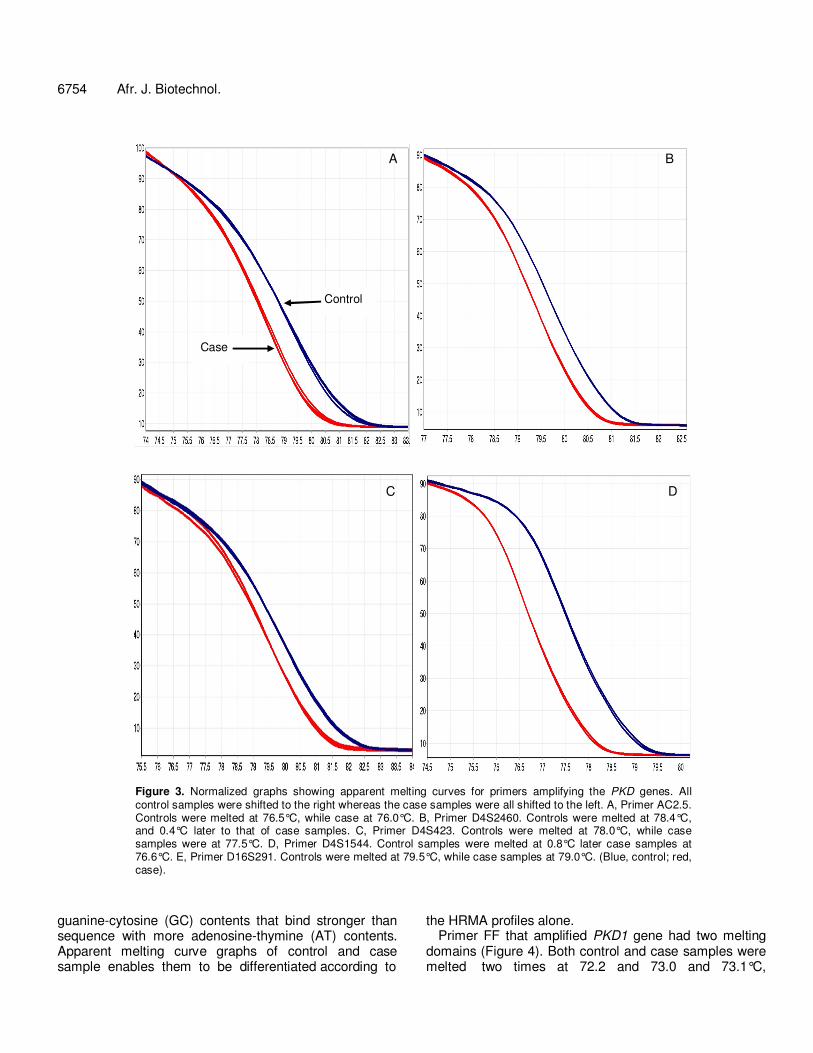
Figure 3 shows five primers with apparent melting curves profiles. Primers AC2.5, D16S291 and D4S423 had melting temperature difference of 0.5°C. Primer D4S1544 had a 0.8°C melting temperature difference, while primer D4S2460 had the slightest temperature difference by only 0.4°C. In all primers, control samples had higher melting temperature as compared to case samples. All control samples were shifted to the right, whereas case samples were shifted to the left. However, the melting curve pattern for control and case samples was the same. Judging from the melting curve pattern, control and case samples were possibly homozygote. The higher temperature needed for the control samples to be melted suggested that the sequences had higher
6754 Afr. J. Biotechnol.
A B
C D
Control
Case
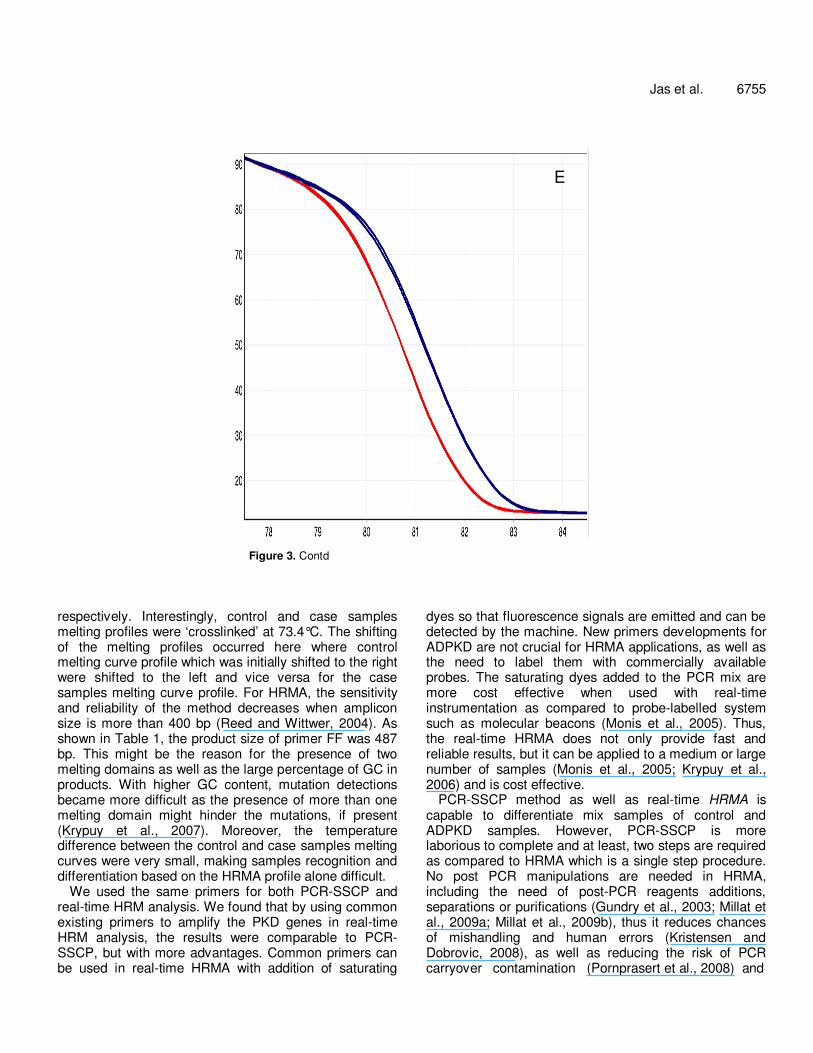
Figure 3. Normalized graphs showing apparent melting curves for primers amplifying the PKD genes. All control samples were shifted to the right whereas the case samples were all shifted to the left. A, Primer AC2.5. Controls were melted at 76.5°C, while case at 76.0°C. B, Primer D4S2460. Controls were melted at 78.4°C, and 0.4°C later to that of case samples. C, Primer D4S423. Controls were melted at 78.0°C, while case samples were at 77.5°C. D, Primer D4S1544. Control samples were melted at 0.8°C later case samples at 76.6°C. E, Primer D16S291. Controls were melted at 79.5°C, while case samples at 79.0°C. (Blue, control; red, case).
guanine-cytosine (GC) contents that bind stronger than sequence with more adenosine-thymine (AT) contents. Apparent melting curve graphs of control and case sample enables them to be differentiated according to
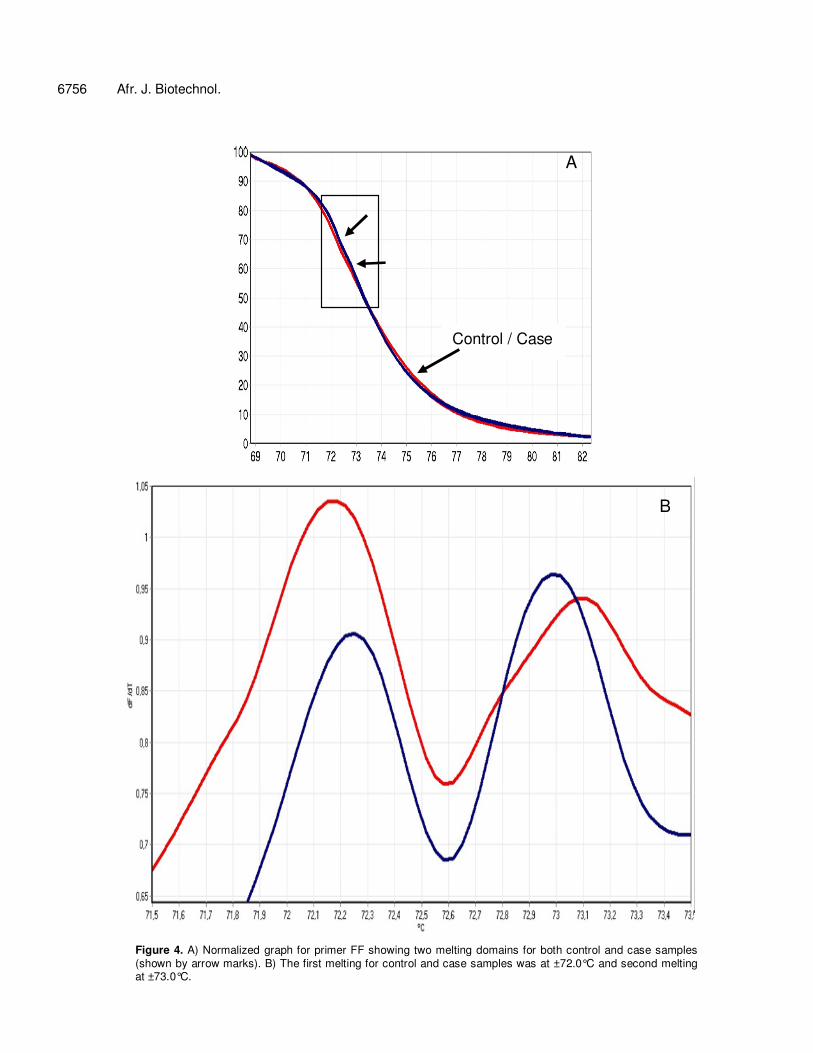
the HRMA profiles alone. Primer FF that amplified PKD1 gene had two melting
domains (Figure 4). Both control and case samples were melted two times at 72.2 and 73.0 and 73.1°C,
Jas et al. 6755
E
Figure 3. Contd
respectively. Interestingly, control and case samples melting profiles were ‘crosslinked’ at 73.4°C. The shifting of the melting profiles occurred here where control melting curve profile which was initially shifted to the right were shifted to the left and vice versa for the case samples melting curve profile. For HRMA, the sensitivity and reliability of the method decreases when amplicon size is more than 400 bp (Reed and Wittwer, 2004). As shown in Table 1, the product size of primer FF was 487 bp. This might be the reason for the presence of two melting domains as well as the large percentage of GC in products. With higher GC content, mutation detections became more difficult as the presence of more than one melting domain might hinder the mutations, if present (Krypuy et al., 2007). Moreover, the temperature difference between the control and case samples melting curves were very small, making samples recognition and differentiation based on the HRMA profile alone difficult.
We used the same primers for both PCR-SSCP and real-time HRM analysis. We found that by using common existing primers to amplify the PKD genes in real-time HRM analysis, the results were comparable to PCR-SSCP, but with more advantages. Common primers can be used in real-time HRMA with addition of saturating
dyes so that fluorescence signals are emitted and can be detected by the machine. New primers developments for ADPKD are not crucial for HRMA applications, as well as the need to label them with commercially available probes. The saturating dyes added to the PCR mix are more cost effective when used with real-time instrumentation as compared to probe-labelled system such as molecular beacons (Monis et al., 2005). Thus, the real-time HRMA does not only provide fast and reliable results, but it can be applied to a medium or large number of samples (Monis et al., 2005; Krypuy et al., 2006) and is cost effective.
PCR-SSCP method as well as real-time HRMA is capable to differentiate mix samples of control and ADPKD samples. However, PCR-SSCP is more laborious to complete and at least, two steps are required as compared to HRMA which is a single step procedure. No post PCR manipulations are needed in HRMA, including the need of post-PCR reagents additions, separations or purifications (Gundry et al., 2003; Millat et al., 2009a; Millat et al., 2009b), thus it reduces chances of mishandling and human errors (Kristensen and Dobrovic, 2008), as well as reducing the risk of PCR carryover contamination (Pornprasert et al., 2008) and
6756 Afr. J. Biotechnol.
Control / Case
A
B
Figure 4. A) Normalized graph for primer FF showing two melting domains for both control and case samples (shown by arrow marks). B) The first melting for control and case samples was at ±72.0°C and second melting at ±73.0°C.
the crossover of PCR products (Krypuy et al., 2006). Therefore, this will increase the sensitivity for a more accurate amplicons differentiation.
More time is needed for the PCR-SSCP procedure. The electrophoresis run time is based on the PCR product size. The larger the size, the longer the time needed for electrophoresis. We found that the method needs up to 18 h to be completed, until analysis can be done, whereas real-time HRMA needs at most 4 h to be completed and analysis can be done almost immediately after amplification. Results are obtained in a very short time. The rapidness of the method makes it appropriate to be applied to medium and large number of samples (Monis et al., 2005; Krypuy et al., 2006).
We concluded that HRMA is an efficient method to differentiate ADPKD samples from control. HRMA is an inexpensive method which can be done in a single-step closed-tube procedure performed without gel electrophoresis. The samples can be kept at -20°C for further manipulations and agarose gel electrophoresis method can be used for analysis when the HRMA revealed unclear melting profile or for sequencing purpose as the method is non-destructive (Vossen et al., 2009). The main limitation of HRM is that a specific mutation cannot be readily identified and it has to be combined with a sequencing method. Although, the samples used were less in number, the primers that were used in conventional PCR to detect mutations of the PKD genes can be applied in a HRMA to differentiate between control and ADPKD patients for a rapid screening process. It is a fast and reliable method and can replace the current methodology in screening the polymorphisms for ADPKD such as the PCR-SSCP technique. We applied this method with larger number of samples in screening the polymorphisms for congenital heart disease and end stage renal disease among Malaysian subjects. REFERENCES Gasser RB, Chilton NB (2001). Applications of single-strand
conformation polymorphism (SSCP) to taxonomy, diagnosis, population genetics and molecular evolution of parasitic nematodes. Veterinary Parasitology, 101: 201-213.
Gasser RB, Hu M, Chilton NB, Campbell BE, Jex AJ, Otranto D, Cafarchia C, Beveridge I, Zhu X (2006). Single-strand conformation polymorphism (SSCP) for the analysis of genetic variation. Nat Protoc. 1: 3121-3128.
Gundry CN, Vandersteen JG, Reed GH, Pryor RJ, Chen J, Wittwer CT (2003). Amplicon melting analysis with labeled primers: a closed-tube method for differentiating homozygotes and heterozygotes. Clinical Chemistry, 49: 396-406.
Jas et al. 6757 Kristensen LS, Dobrovic A (2008). Direct genotyping of single
nucleotide polymorphisms in methyl metabolism genes using probe-free high-resolution melting analysis. Cancer Epidemiol Biomarkers Prev. 17: 1240-1247.
Krypuy M, Ahmed AA, Etemadmoghadam D, Hyland SJ, Defazio A, Fox SB, Brenton JD, Bowtell DD, Dobrovic A (2007). High resolution melting for mutation scanning of TP53 exons 5-8. BMC Cancer, 7: 168.
Krypuy M, Newnham GM, Thomas DM, Conron M, Dobrovic A (2006). High resolution melting analysis for the rapid and sensitive detection of mutations in clinical samples: KRAS codon 12 and 13 mutations in non-small cell lung cancer. BMC Cancer, 6: 295.
Laurie AD, George PM (2009). Evaluation of high-resolution melting analysis for screening the LDL receptor gene. Clinical Biochemistry, 42: 528-535.
Millat G, Chanavat V, Julia S, Crehalet H, Bouvagnet P, Rousson R, (2009a). Validation of high-resolution DNA melting analysis for mutation scanning of the LMNA gene. Clinical Biochemistry, 42: 892-898.
Millat G, Chanavat V, Rodriguez-Lafrasse C, Rousson R (2009b). Rapid, sensitive and inexpensive detection of SCN5A genetic variations by high resolution melting analysis. Clinical Biochemistry, 42: 491-499.
Monis PT, Giglio S, Saint CP (2005). Comparison of SYTO9 and SYBR Green I for real-time polymerase chain reaction and investigation of the effect of dye concentration on amplification and DNA melting curve analysis. Anal. Biochem. 340: 24-34.
Pornprasert S, Phusua A, Suanta S, Saetung R, Sanguansermsri T (2008). Detection of alpha-thalassemia-1 Southeast Asian type using real-time gap-PCR with SYBR Green1 and high resolution melting analysis. Eur. J. Haematol. 80: 510-514.
Reed GH, Wittwer CT (2004). Sensitivity and specificity of single-nucleotide polymorphism scanning by high-resolution melting analysis. Clin. Chemistry, 50: 1748-1754.
Schieren G, Rumberger B, Klein M, Kreutz C, Wilpert J, Geyer M, Faller D, Timmer J, Quack I, Rump LC, Walz G, Donauer J (2006). Gene profiling of polycystic kidneys. Nephrol. Dial. Transplant. 21: 1816-24.
Torres VE, Harris PC (2009). Autosomal dominant polycystic kidney disease: the last 3 years. Kidney Int. 76: 149-168.
Vossen RH, Aten E, Roos A, Den Dunnen JT (2009). High-resolution melting analysis (HRMA): more than just sequence variant screening. Human Mutation, 30: 860-866.
Related Documents