Amplicon-Dependent CCNE1 Expression Is Critical for Clonogenic Survival after Cisplatin Treatment and Is Correlated with 20q11 Gain in Ovarian Cancer Dariush Etemadmoghadam 1 , Joshy George 1,2 , Prue A. Cowin 1 , Carleen Cullinane 3 , Maya Kansara 1 , Australian Ovarian Cancer Study Group, Kylie L. Gorringe 1,4 , Gordon K. Smyth 5 , David D. L. Bowtell 1,2 * 1 Cancer Genomics Program, Peter MacCallum Cancer Centre, East Melbourne, Australia, 2 Department of Biochemistry, University of Melbourne, Parkville, Australia, 3 Translational Research Program, Peter MacCallum Cancer Centre, East Melbourne, Australia, 4 Department of Pathology, University of Melbourne, Parkville, Australia, 5 Bioinformatics Division, Walter and Eliza Hall Institute of Medical Research, Parkville, Australia Abstract Genomic amplification of 19q12 occurs in several cancer types including ovarian cancer where it is associated with primary treatment failure. We systematically attenuated expression of genes within the minimally defined 19q12 region in ovarian cell lines using short-interfering RNAs (siRNA) to identify driver oncogene(s) within the amplicon. Knockdown of CCNE1 resulted in G1/S phase arrest, reduced cell viability and apoptosis only in amplification-carrying cells. Although CCNE1 knockdown increased cisplatin resistance in short-term assays, clonogenic survival was inhibited after treatment. Gain of 20q11 was highly correlated with 19q12 amplification and spanned a 2.5 Mb region including TPX2, a centromeric protein required for mitotic spindle function. Expression of TPX2 was highly correlated with gene amplification and with CCNE1 expression in primary tumors. siRNA inhibition of TPX2 reduced cell viability but this effect was not amplicon-dependent. These findings demonstrate that CCNE1 is a key driver in the 19q12 amplicon required for survival and clonogenicity in cells with locus amplification. Co-amplification at 19q12 and 20q11 implies the presence of a cooperative mutational network. These observations have implications for the application of targeted therapies in CCNE1 dependent ovarian cancers. Citation: Etemadmoghadam D, George J, Cowin PA, Cullinane C, Kansara M, et al. (2010) Amplicon-Dependent CCNE1 Expression Is Critical for Clonogenic Survival after Cisplatin Treatment and Is Correlated with 20q11 Gain in Ovarian Cancer. PLoS ONE 5(11): e15498. doi:10.1371/journal.pone.0015498 Editor: Nathalie Wong, Chinese University of Hong Kong, China Received August 31, 2010; Accepted October 17, 2010; Published November 12, 2010 Copyright: ß 2010 Etemadmoghadam et al. This is an open-access article distributed under the terms of the Creative Commons Attribution License, which permits unrestricted use, distribution, and reproduction in any medium, provided the original author and source are credited. Funding: This study was funded by a National Health and Medical Research Council (NHMRC) project grant 628779 (www.nhmrc.gov.au). The Australian Ovarian Cancer Study is supported by the U.S. Army Medical Research and Materiel Command under DAMD17-01-1-0729, The Cancer Council Victoria, Queensland Cancer Fund, The Cancer Council New South Wales, The Cancer Council South Australia, The Cancer Foundation of Western Australia, The Cancer Council Tasmania and the NHMRC. The funders had no role in study design, data collection and analysis, decision to publish, or preparation of the manuscript. Competing Interests: The authors have declared that no competing interests exist. * E-mail: [email protected] Introduction Advanced stage serous tumors account for the majority of invasive ovarian cancers and despite a generally good initial response to cytoreductive surgery and platinum-based chemother- apy, most women face a high risk of recurrence and poor long- term survival [1]. Platinum-based agents, such as cisplatin and carboplatin, are toxic to dividing cells due to the formation of DNA adducts that result in double strand breaks, activating DNA damage-mediated apoptotic signals [2]. Response to chemother- apy is, however, difficult to predict and there are currently no predictive biomarkers for serous ovarian cancers in clinical use. We have previously mapped a region of 19q12 amplification associated with treatment-resistant serous ovarian tumors by performing a genome-wide survey of copy number change [3]. These findings were consistent with previous reports of amplifi- cation being associated with poor overall survival [4,5]. Similarly, recurrent amplification of 19q12 has been reported in a variety of cancers including esophageal [6], gastric [7], lung [8] and endometrial tumors [9]. The 19q12 amplification is a high-level focal amplification that targets a cluster of only several genes on chromosome 19. CCNE1 (Cyclin E) has previously been suggested as the target of amplification in ovarian cancer [4,10,11], however a systematic analysis of known genes within the amplicon has not been performed. Furthermore, whilst CCNE1 amplification likely provides an oncogenic stimulus through activation of the cell cycle, it is not obvious how it may contribute to primary chemotherapy resistance. For example, over-expression of CCNE1 in vitro renders ovarian cancer cells more sensitive to platinum agents, presumably due to increased proliferation [12]. It is possible that the biological consequence of 19q12 amplification is not limited to over-expression of CCNE1, and that other genes in the amplicon contribute to tumor growth or progression. Furthermore, other co-existing mutational events elsewhere in the cancer genome may cooperate or enhance the oncogenic effect of CCNE1 over-expression. We performed an siRNA knockdown screen of all annotated genes within and immediately flanking the 19q12 amplicon in ovarian cancer cell lines with or without regional amplification. We found CCNE1 to be the only gene target within the amplicon that reduced cell viability in the amplicon-containing OVCAR-3 cell line after siRNA knockdown. CCNE1 knockdown induced cell cycle arrest and apoptosis, while also impairing clonogenic survival after cisplatin treatment, despite increasing in vitro drug resistance in a short-term cytotoxicity assay. In a disease setting, these results PLoS ONE | www.plosone.org 1 November 2010 | Volume 5 | Issue 11 | e15498

Welcome message from author
This document is posted to help you gain knowledge. Please leave a comment to let me know what you think about it! Share it to your friends and learn new things together.
Transcript
Amplicon-Dependent CCNE1 Expression Is Critical forClonogenic Survival after Cisplatin Treatment and IsCorrelated with 20q11 Gain in Ovarian CancerDariush Etemadmoghadam1, Joshy George1,2, Prue A. Cowin1, Carleen Cullinane3, Maya Kansara1,
Australian Ovarian Cancer Study Group, Kylie L. Gorringe1,4, Gordon K. Smyth5, David D. L. Bowtell1,2*
1 Cancer Genomics Program, Peter MacCallum Cancer Centre, East Melbourne, Australia, 2 Department of Biochemistry, University of Melbourne, Parkville, Australia,
3 Translational Research Program, Peter MacCallum Cancer Centre, East Melbourne, Australia, 4 Department of Pathology, University of Melbourne, Parkville, Australia,
5 Bioinformatics Division, Walter and Eliza Hall Institute of Medical Research, Parkville, Australia
Abstract
Genomic amplification of 19q12 occurs in several cancer types including ovarian cancer where it is associated with primarytreatment failure. We systematically attenuated expression of genes within the minimally defined 19q12 region in ovariancell lines using short-interfering RNAs (siRNA) to identify driver oncogene(s) within the amplicon. Knockdown of CCNE1resulted in G1/S phase arrest, reduced cell viability and apoptosis only in amplification-carrying cells. Although CCNE1knockdown increased cisplatin resistance in short-term assays, clonogenic survival was inhibited after treatment. Gain of20q11 was highly correlated with 19q12 amplification and spanned a 2.5 Mb region including TPX2, a centromeric proteinrequired for mitotic spindle function. Expression of TPX2 was highly correlated with gene amplification and with CCNE1expression in primary tumors. siRNA inhibition of TPX2 reduced cell viability but this effect was not amplicon-dependent.These findings demonstrate that CCNE1 is a key driver in the 19q12 amplicon required for survival and clonogenicity in cellswith locus amplification. Co-amplification at 19q12 and 20q11 implies the presence of a cooperative mutational network.These observations have implications for the application of targeted therapies in CCNE1 dependent ovarian cancers.
Citation: Etemadmoghadam D, George J, Cowin PA, Cullinane C, Kansara M, et al. (2010) Amplicon-Dependent CCNE1 Expression Is Critical for ClonogenicSurvival after Cisplatin Treatment and Is Correlated with 20q11 Gain in Ovarian Cancer. PLoS ONE 5(11): e15498. doi:10.1371/journal.pone.0015498
Editor: Nathalie Wong, Chinese University of Hong Kong, China
Received August 31, 2010; Accepted October 17, 2010; Published November 12, 2010
Copyright: � 2010 Etemadmoghadam et al. This is an open-access article distributed under the terms of the Creative Commons Attribution License, whichpermits unrestricted use, distribution, and reproduction in any medium, provided the original author and source are credited.
Funding: This study was funded by a National Health and Medical Research Council (NHMRC) project grant 628779 (www.nhmrc.gov.au). The Australian OvarianCancer Study is supported by the U.S. Army Medical Research and Materiel Command under DAMD17-01-1-0729, The Cancer Council Victoria, Queensland CancerFund, The Cancer Council New South Wales, The Cancer Council South Australia, The Cancer Foundation of Western Australia, The Cancer Council Tasmania andthe NHMRC. The funders had no role in study design, data collection and analysis, decision to publish, or preparation of the manuscript.
Competing Interests: The authors have declared that no competing interests exist.
* E-mail: [email protected]
Introduction
Advanced stage serous tumors account for the majority of
invasive ovarian cancers and despite a generally good initial
response to cytoreductive surgery and platinum-based chemother-
apy, most women face a high risk of recurrence and poor long-
term survival [1]. Platinum-based agents, such as cisplatin and
carboplatin, are toxic to dividing cells due to the formation of
DNA adducts that result in double strand breaks, activating DNA
damage-mediated apoptotic signals [2]. Response to chemother-
apy is, however, difficult to predict and there are currently no
predictive biomarkers for serous ovarian cancers in clinical use.
We have previously mapped a region of 19q12 amplification
associated with treatment-resistant serous ovarian tumors by
performing a genome-wide survey of copy number change [3].
These findings were consistent with previous reports of amplifi-
cation being associated with poor overall survival [4,5]. Similarly,
recurrent amplification of 19q12 has been reported in a variety of
cancers including esophageal [6], gastric [7], lung [8] and
endometrial tumors [9].
The 19q12 amplification is a high-level focal amplification that
targets a cluster of only several genes on chromosome 19. CCNE1
(Cyclin E) has previously been suggested as the target of
amplification in ovarian cancer [4,10,11], however a systematic
analysis of known genes within the amplicon has not been
performed. Furthermore, whilst CCNE1 amplification likely
provides an oncogenic stimulus through activation of the cell
cycle, it is not obvious how it may contribute to primary
chemotherapy resistance. For example, over-expression of CCNE1
in vitro renders ovarian cancer cells more sensitive to platinum
agents, presumably due to increased proliferation [12]. It is
possible that the biological consequence of 19q12 amplification is
not limited to over-expression of CCNE1, and that other genes in
the amplicon contribute to tumor growth or progression.
Furthermore, other co-existing mutational events elsewhere in
the cancer genome may cooperate or enhance the oncogenic effect
of CCNE1 over-expression.
We performed an siRNA knockdown screen of all annotated
genes within and immediately flanking the 19q12 amplicon in
ovarian cancer cell lines with or without regional amplification.
We found CCNE1 to be the only gene target within the amplicon
that reduced cell viability in the amplicon-containing OVCAR-3
cell line after siRNA knockdown. CCNE1 knockdown induced cell
cycle arrest and apoptosis, while also impairing clonogenic survival
after cisplatin treatment, despite increasing in vitro drug resistance
in a short-term cytotoxicity assay. In a disease setting, these results
PLoS ONE | www.plosone.org 1 November 2010 | Volume 5 | Issue 11 | e15498
suggest that treatment failure in CCNE1 amplified tumors may
relate to rapid repopulation of the tumor after chemotherapy and
not cellular drug resistance specifically. We also found TPX2
amplification and over-expression to be significantly correlated
with CCNE1 copy number status implying the presence of a
cooperative mutational network between these genes.
Results
Focal amplification of 19q12 is common to various tumortypes
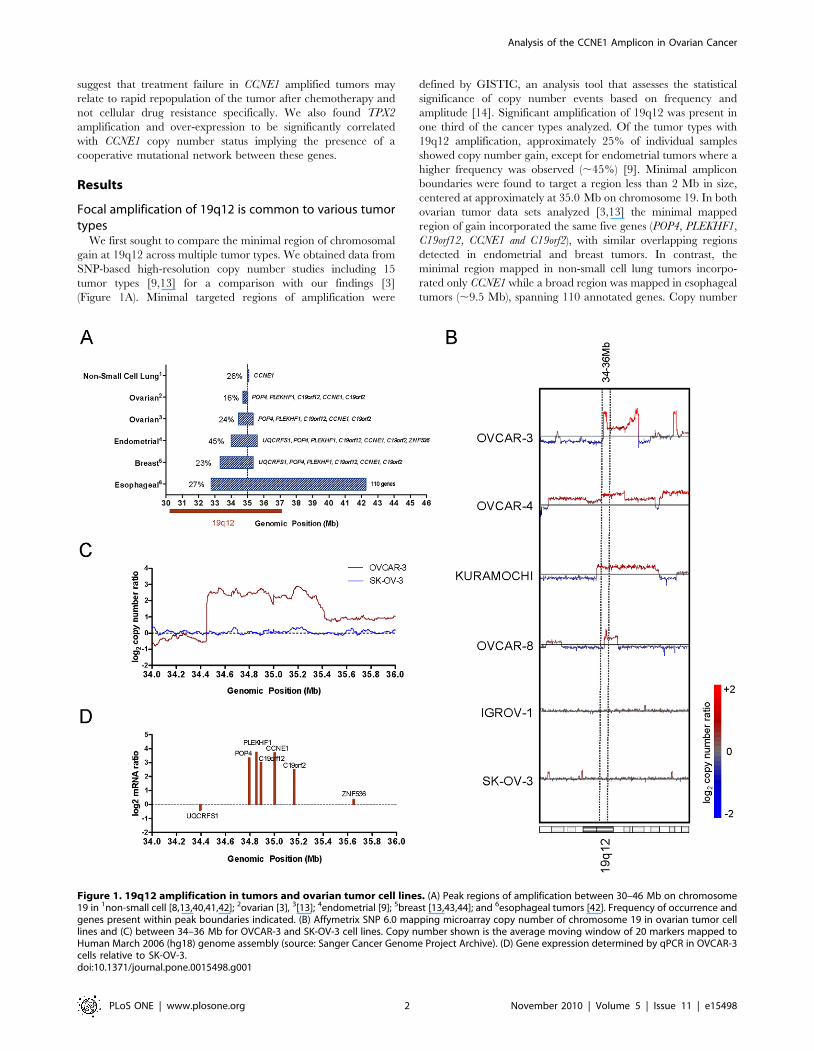
We first sought to compare the minimal region of chromosomal
gain at 19q12 across multiple tumor types. We obtained data from
SNP-based high-resolution copy number studies including 15
tumor types [9,13] for a comparison with our findings [3]
(Figure 1A). Minimal targeted regions of amplification were
defined by GISTIC, an analysis tool that assesses the statistical
significance of copy number events based on frequency and
amplitude [14]. Significant amplification of 19q12 was present in
one third of the cancer types analyzed. Of the tumor types with
19q12 amplification, approximately 25% of individual samples
showed copy number gain, except for endometrial tumors where a
higher frequency was observed (,45%) [9]. Minimal amplicon
boundaries were found to target a region less than 2 Mb in size,
centered at approximately at 35.0 Mb on chromosome 19. In both
ovarian tumor data sets analyzed [3,13] the minimal mapped
region of gain incorporated the same five genes (POP4, PLEKHF1,
C19orf12, CCNE1 and C19orf2), with similar overlapping regions
detected in endometrial and breast tumors. In contrast, the
minimal region mapped in non-small cell lung tumors incorpo-
rated only CCNE1 while a broad region was mapped in esophageal
tumors (,9.5 Mb), spanning 110 annotated genes. Copy number
Figure 1. 19q12 amplification in tumors and ovarian tumor cell lines. (A) Peak regions of amplification between 30–46 Mb on chromosome19 in 1non-small cell [8,13,40,41,42]; 2ovarian [3], 3[13]; 4endometrial [9]; 5breast [13,43,44]; and 6esophageal tumors [42]. Frequency of occurrence andgenes present within peak boundaries indicated. (B) Affymetrix SNP 6.0 mapping microarray copy number of chromosome 19 in ovarian tumor celllines and (C) between 34–36 Mb for OVCAR-3 and SK-OV-3 cell lines. Copy number shown is the average moving window of 20 markers mapped toHuman March 2006 (hg18) genome assembly (source: Sanger Cancer Genome Project Archive). (D) Gene expression determined by qPCR in OVCAR-3cells relative to SK-OV-3.doi:10.1371/journal.pone.0015498.g001
Analysis of the CCNE1 Amplicon in Ovarian Cancer
PLoS ONE | www.plosone.org 2 November 2010 | Volume 5 | Issue 11 | e15498
change of the 19q12 locus showed a degree of tumor specificity, in
that the amplification was not seen in 10 other tumor types for
which substantial data was available, including small cell lung,
hepatocellular, colorectal and prostate cancer (data not shown).
We also note that amplification of 19q12 has been identified by
cDNA array-CGH analysis of gastric tumors [15,16], however this
tumor type was not included as our analysis was limited to high-
resolution SNP copy number data.
To identify cell lines that were representative of primary tumors
for functional studies we analyzed high-resolution SNP copy
number data for 22 ovarian cancer cell lines at chromosome
19q12 (Sanger Cancer Genome Project Archive) and identified
seven cell lines (OVCAR-3, OVCAR-4, Kuramochi, RMG-I,
Caov-4, EFO-21, OVCAR-8) that had overlapping amplification
at 19q12 (Figure 1B and Figure S1). Of the seven cell lines,
OVCAR-3 contained a focal, high-level amplification that best
recapitulated data from primary ovarian tumors (Figure 1C).
Quantitative-PCR (qPCR) demonstrated that the five genes within
the region of high-level amplification in OVCAR-3 (POP4,
PLEKHF1, C19orf12, CCNE1 and C19orf2), but not flanking genes
(UQCRFS1 and ZNF536), were over-expressed relative to the SK-
OV-3 control cell line lacking 19q12 amplification (Figure 1D). Of
the five genes, PLEKHF1 and CCNE1 showed the highest
expression. The 19q12 amplicon can therefore be mapped to a
region spanning 34.4–35.4 of chromosome 19 and involving 5
annotated genes, each of which is over-expressed in OVCAR-3.
Cells lines with amplification at 19q12 are specificallysensitive to CCNE1 knockdown
Short interfering RNA (siRNA) were used to knockdown the
expression of the seven genes in and adjacent to the high-level
19q12 amplicon in OVCAR-3 and SK-OV-3 plus GAPDH and
non-silencing (NS) controls. A schematic of the experimental
design used for the combined siRNA knockdown strategy and
subsequent drug treatment protocol is shown in Figure 2A.
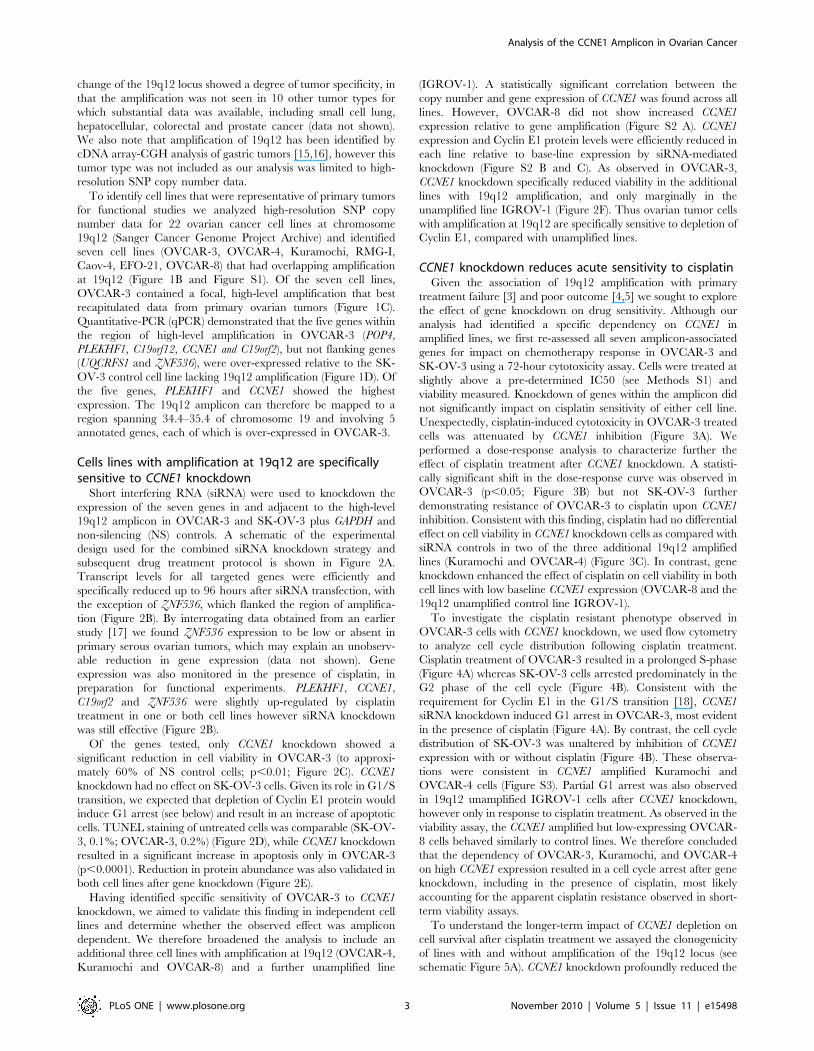
Transcript levels for all targeted genes were efficiently and
specifically reduced up to 96 hours after siRNA transfection, with
the exception of ZNF536, which flanked the region of amplifica-
tion (Figure 2B). By interrogating data obtained from an earlier
study [17] we found ZNF536 expression to be low or absent in
primary serous ovarian tumors, which may explain an unobserv-
able reduction in gene expression (data not shown). Gene
expression was also monitored in the presence of cisplatin, in
preparation for functional experiments. PLEKHF1, CCNE1,
C19orf2 and ZNF536 were slightly up-regulated by cisplatin
treatment in one or both cell lines however siRNA knockdown
was still effective (Figure 2B).
Of the genes tested, only CCNE1 knockdown showed a
significant reduction in cell viability in OVCAR-3 (to approxi-
mately 60% of NS control cells; p,0.01; Figure 2C). CCNE1
knockdown had no effect on SK-OV-3 cells. Given its role in G1/S
transition, we expected that depletion of Cyclin E1 protein would
induce G1 arrest (see below) and result in an increase of apoptotic
cells. TUNEL staining of untreated cells was comparable (SK-OV-
3, 0.1%; OVCAR-3, 0.2%) (Figure 2D), while CCNE1 knockdown
resulted in a significant increase in apoptosis only in OVCAR-3
(p,0.0001). Reduction in protein abundance was also validated in
both cell lines after gene knockdown (Figure 2E).
Having identified specific sensitivity of OVCAR-3 to CCNE1
knockdown, we aimed to validate this finding in independent cell
lines and determine whether the observed effect was amplicon
dependent. We therefore broadened the analysis to include an
additional three cell lines with amplification at 19q12 (OVCAR-4,
Kuramochi and OVCAR-8) and a further unamplified line
(IGROV-1). A statistically significant correlation between the
copy number and gene expression of CCNE1 was found across all
lines. However, OVCAR-8 did not show increased CCNE1
expression relative to gene amplification (Figure S2 A). CCNE1
expression and Cyclin E1 protein levels were efficiently reduced in
each line relative to base-line expression by siRNA-mediated
knockdown (Figure S2 B and C). As observed in OVCAR-3,
CCNE1 knockdown specifically reduced viability in the additional
lines with 19q12 amplification, and only marginally in the
unamplified line IGROV-1 (Figure 2F). Thus ovarian tumor cells
with amplification at 19q12 are specifically sensitive to depletion of
Cyclin E1, compared with unamplified lines.
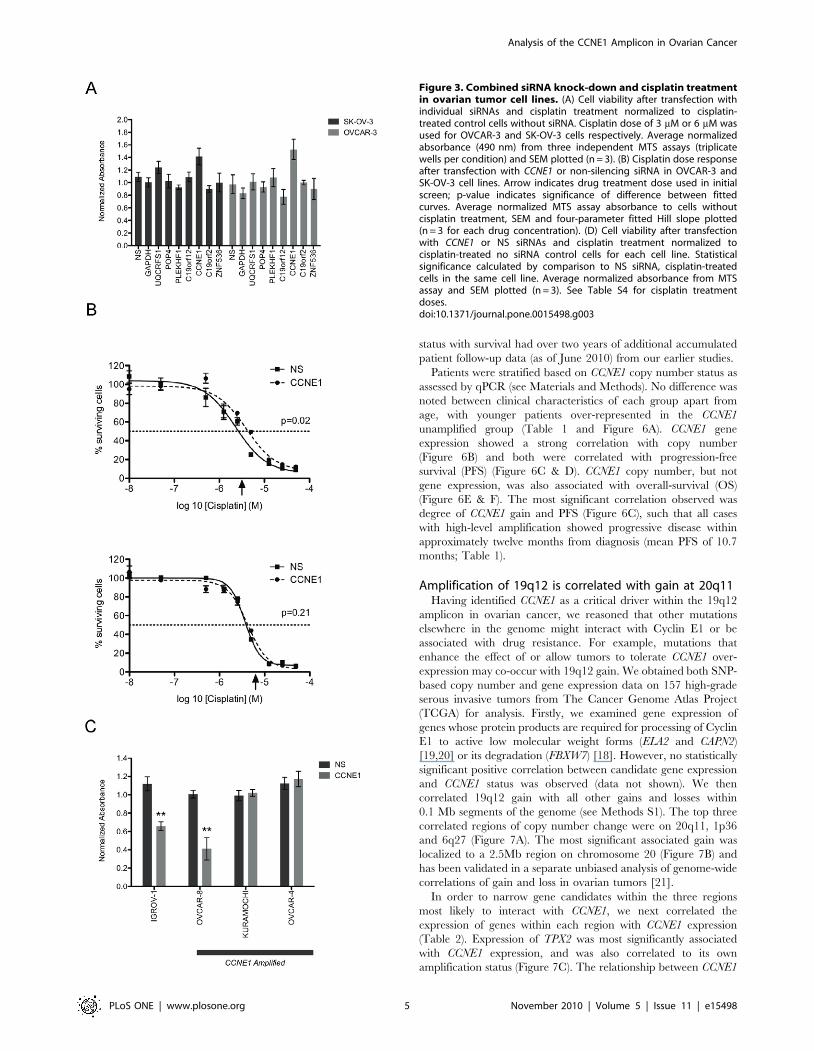
CCNE1 knockdown reduces acute sensitivity to cisplatinGiven the association of 19q12 amplification with primary
treatment failure [3] and poor outcome [4,5] we sought to explore
the effect of gene knockdown on drug sensitivity. Although our
analysis had identified a specific dependency on CCNE1 in
amplified lines, we first re-assessed all seven amplicon-associated
genes for impact on chemotherapy response in OVCAR-3 and
SK-OV-3 using a 72-hour cytotoxicity assay. Cells were treated at
slightly above a pre-determined IC50 (see Methods S1) and
viability measured. Knockdown of genes within the amplicon did
not significantly impact on cisplatin sensitivity of either cell line.
Unexpectedly, cisplatin-induced cytotoxicity in OVCAR-3 treated
cells was attenuated by CCNE1 inhibition (Figure 3A). We
performed a dose-response analysis to characterize further the
effect of cisplatin treatment after CCNE1 knockdown. A statisti-
cally significant shift in the dose-response curve was observed in
OVCAR-3 (p,0.05; Figure 3B) but not SK-OV-3 further
demonstrating resistance of OVCAR-3 to cisplatin upon CCNE1
inhibition. Consistent with this finding, cisplatin had no differential
effect on cell viability in CCNE1 knockdown cells as compared with
siRNA controls in two of the three additional 19q12 amplified
lines (Kuramochi and OVCAR-4) (Figure 3C). In contrast, gene
knockdown enhanced the effect of cisplatin on cell viability in both
cell lines with low baseline CCNE1 expression (OVCAR-8 and the
19q12 unamplified control line IGROV-1).
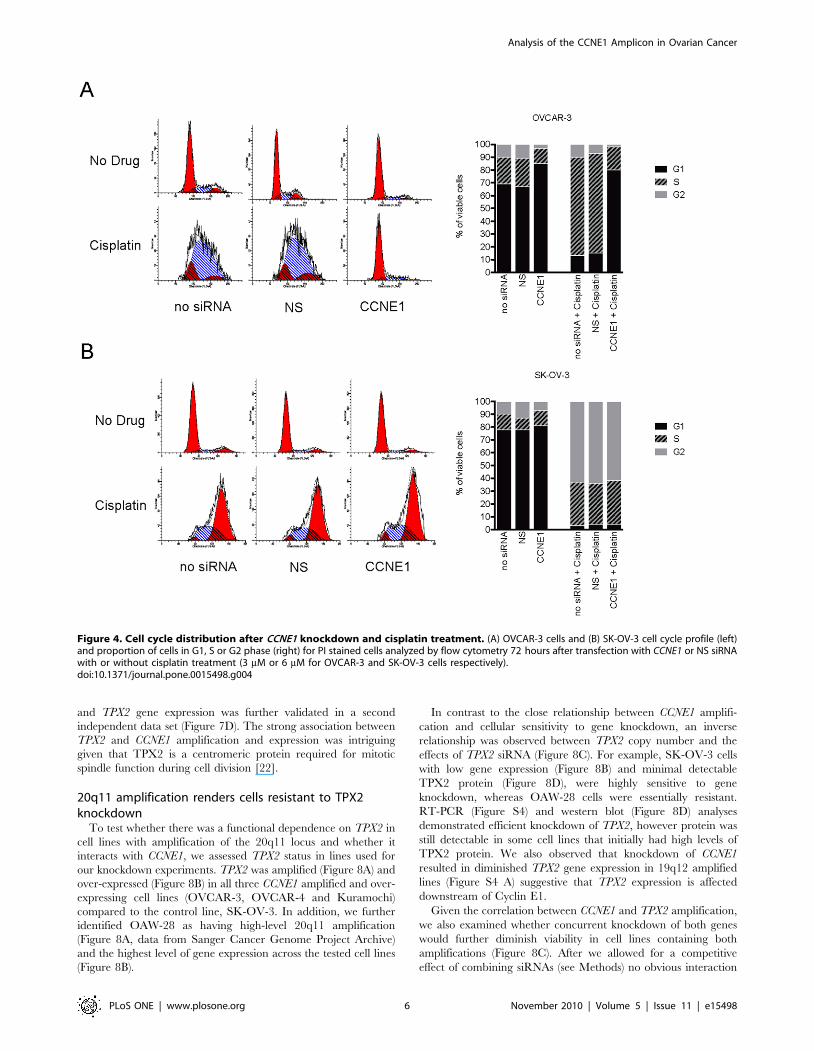
To investigate the cisplatin resistant phenotype observed in
OVCAR-3 cells with CCNE1 knockdown, we used flow cytometry
to analyze cell cycle distribution following cisplatin treatment.
Cisplatin treatment of OVCAR-3 resulted in a prolonged S-phase
(Figure 4A) whereas SK-OV-3 cells arrested predominately in the
G2 phase of the cell cycle (Figure 4B). Consistent with the
requirement for Cyclin E1 in the G1/S transition [18], CCNE1
siRNA knockdown induced G1 arrest in OVCAR-3, most evident
in the presence of cisplatin (Figure 4A). By contrast, the cell cycle
distribution of SK-OV-3 was unaltered by inhibition of CCNE1
expression with or without cisplatin (Figure 4B). These observa-
tions were consistent in CCNE1 amplified Kuramochi and
OVCAR-4 cells (Figure S3). Partial G1 arrest was also observed
in 19q12 unamplified IGROV-1 cells after CCNE1 knockdown,
however only in response to cisplatin treatment. As observed in the
viability assay, the CCNE1 amplified but low-expressing OVCAR-
8 cells behaved similarly to control lines. We therefore concluded
that the dependency of OVCAR-3, Kuramochi, and OVCAR-4
on high CCNE1 expression resulted in a cell cycle arrest after gene
knockdown, including in the presence of cisplatin, most likely
accounting for the apparent cisplatin resistance observed in short-
term viability assays.
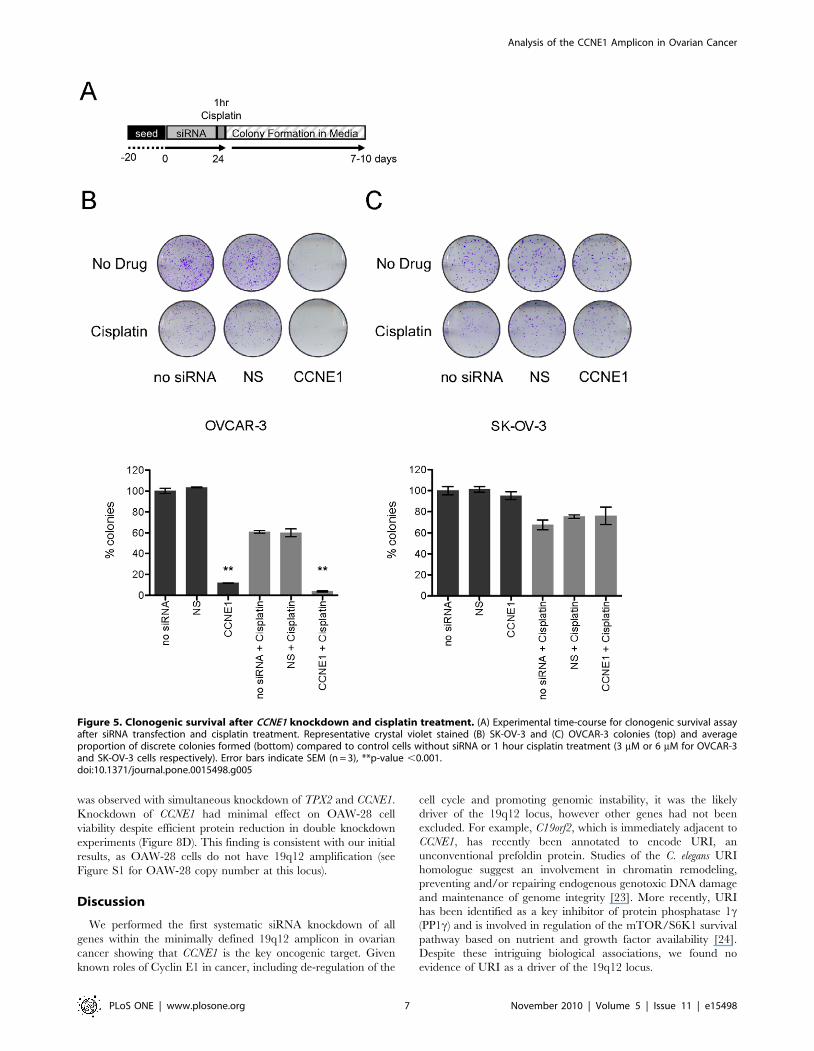
To understand the longer-term impact of CCNE1 depletion on
cell survival after cisplatin treatment we assayed the clonogenicity
of lines with and without amplification of the 19q12 locus (see
schematic Figure 5A). CCNE1 knockdown profoundly reduced the
Analysis of the CCNE1 Amplicon in Ovarian Cancer
PLoS ONE | www.plosone.org 3 November 2010 | Volume 5 | Issue 11 | e15498
clonogenic capacity of OVCAR-3 but not SK-OV-3 in the
absence of drug (Figure 5B and 5C). In contrast to increased
resistance to cisplatin in short-term cytotoxicity assays, CCNE1
attenuation reduced clonogenic survival of OVCAR-3 cells after
cisplatin treatment (Figure 5B). We did not explore the in vivo
effects of CCNE1 knockdown in ovarian tumor lines with 19q12
amplification, as we were unable to generate viable lines with
stable lentivirus integration of short hairpin RNA (shRNA)
directed to CCNE1 (data not shown).
CCNE1 amplification is predictive of poor outcome inprimary tumors
CCNE1 copy number was measured in 43 primary ovarian
tumors from patients with advanced-stage, serous invasive disease.
In addition, we included data from 52 tumors from our previous
genomic analysis of platinum-resistance in ovarian cancer [3] and
obtained matching gene expression data for all samples [17]. All
patients underwent primary surgery followed by platinum-based
chemotherapy. Clinical information used to correlate CCNE1
Figure 2. siRNA mediated knock-down of 19q12 genes in ovarian tumor cell lines. (A) Experimental schematic for combined siRNAtransfection and drug treatment. (B) qPCR heatmap showing log2 gene expression ratio to untransfected OVCAR-3 (top) and SK-OV-3 (bottom) cellsfor each siRNA (columns) at gene targets (rows) with or without cisplatin treatment 72 hours after transfection. (C) Cell viability normalized to nosiRNA control cells after transfection with each siRNA. Statistical significance (t-test) calculated by comparison to non-silencing (NS) siRNA in the samecell line using data from three independent MTS assays performed with triplicate wells per condition. Average normalized absorbance at 490 nm andSEM plotted (n = 3), **p-value ,0.01. (D) Proportion of apoptotic cells assessed by TUNEL staining in no siRNA control cells or after transfection withNS or CCNE1 targeted siRNA. Data shown from three independent experiments with duplicate wells analyzed per condition. Average percentage ofapoptotic cells and SEM plotted (n = 3). ***p-value ,0.0001 (Chi squared) calculated by comparison of total cell counts between OVCAR-3 cellstreated with a CCNE1 siRNA and all other conditions. (E) CCNE1 protein expression by western blot to confirm siRNA-mediated CCNE1 knockdown atexperimental endpoint. (F) Cell viability in additional cell lines after transfection with CCNE1 or non-silencing siRNAs normalized to each cell line withno siRNA added. Statistical significance (t-test) calculated by comparison to NS siRNA in the same cell line. Average normalized absorbance from MTSassay and SEM plotted (n = 3); *p-value ,0.05, **p-value ,0.01.doi:10.1371/journal.pone.0015498.g002
Analysis of the CCNE1 Amplicon in Ovarian Cancer
PLoS ONE | www.plosone.org 4 November 2010 | Volume 5 | Issue 11 | e15498
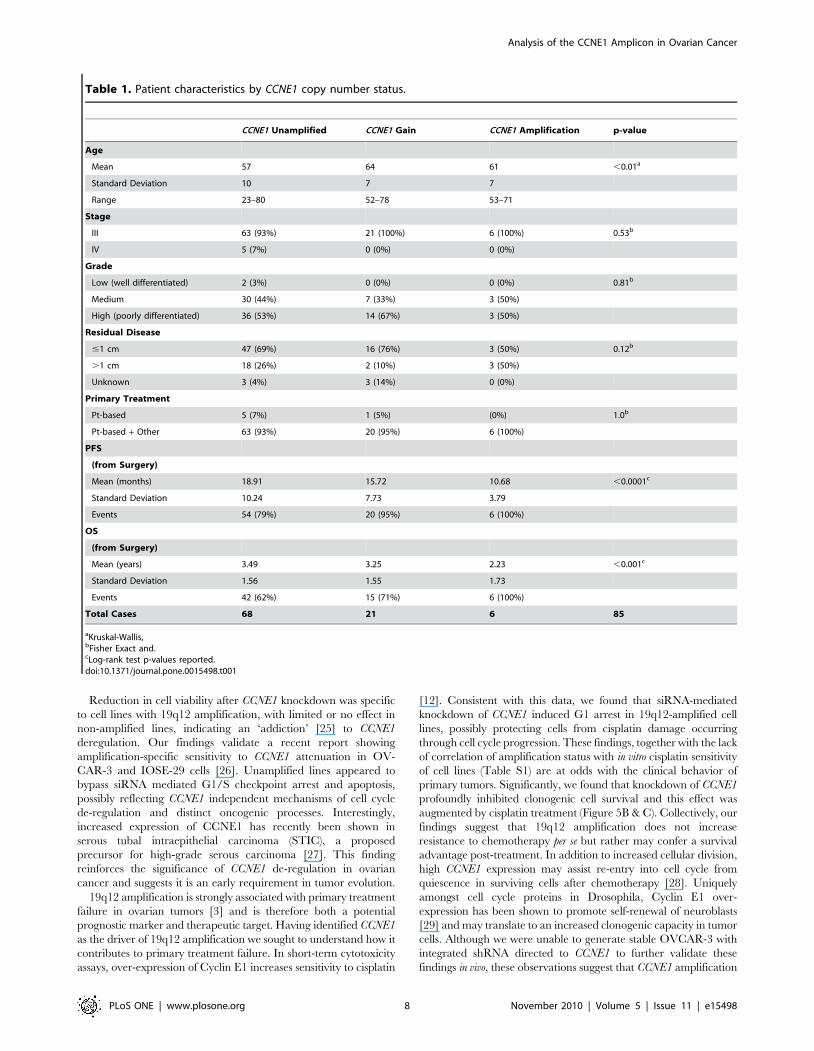
status with survival had over two years of additional accumulated
patient follow-up data (as of June 2010) from our earlier studies.
Patients were stratified based on CCNE1 copy number status as
assessed by qPCR (see Materials and Methods). No difference was
noted between clinical characteristics of each group apart from
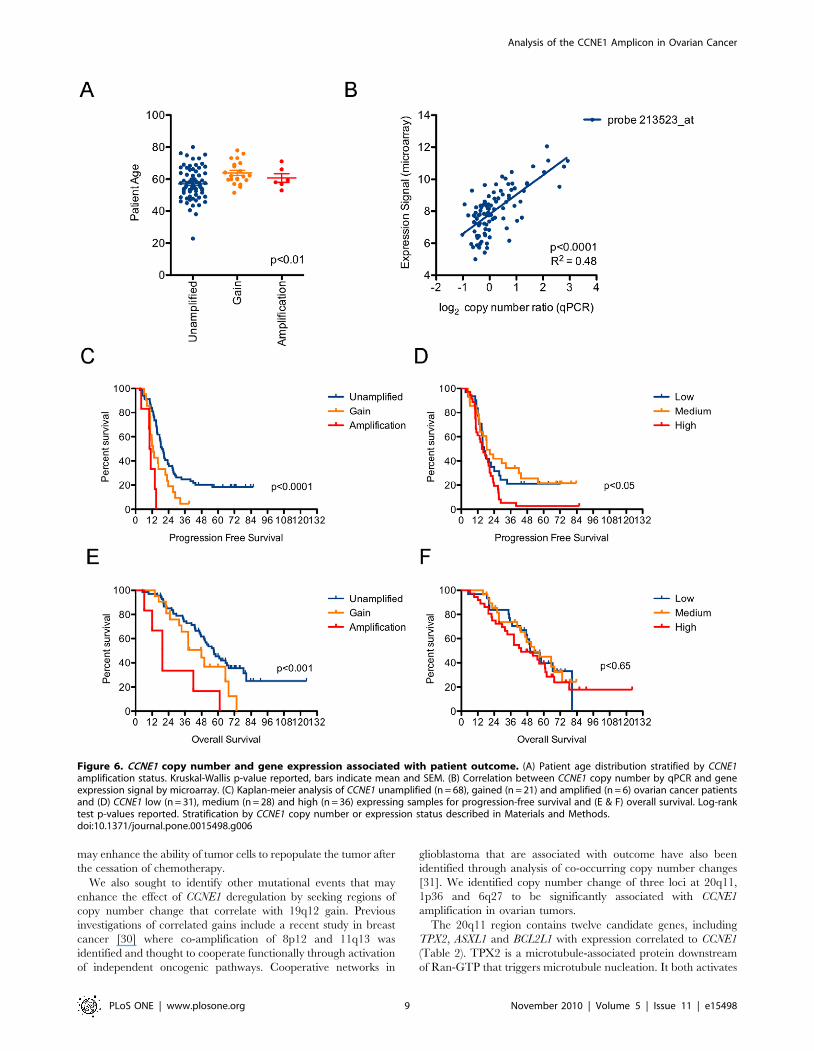
age, with younger patients over-represented in the CCNE1
unamplified group (Table 1 and Figure 6A). CCNE1 gene
expression showed a strong correlation with copy number
(Figure 6B) and both were correlated with progression-free
survival (PFS) (Figure 6C & D). CCNE1 copy number, but not
gene expression, was also associated with overall-survival (OS)
(Figure 6E & F). The most significant correlation observed was
degree of CCNE1 gain and PFS (Figure 6C), such that all cases
with high-level amplification showed progressive disease within
approximately twelve months from diagnosis (mean PFS of 10.7
months; Table 1).
Amplification of 19q12 is correlated with gain at 20q11Having identified CCNE1 as a critical driver within the 19q12
amplicon in ovarian cancer, we reasoned that other mutations
elsewhere in the genome might interact with Cyclin E1 or be
associated with drug resistance. For example, mutations that
enhance the effect of or allow tumors to tolerate CCNE1 over-
expression may co-occur with 19q12 gain. We obtained both SNP-
based copy number and gene expression data on 157 high-grade
serous invasive tumors from The Cancer Genome Atlas Project
(TCGA) for analysis. Firstly, we examined gene expression of
genes whose protein products are required for processing of Cyclin
E1 to active low molecular weight forms (ELA2 and CAPN2)
[19,20] or its degradation (FBXW7) [18]. However, no statistically
significant positive correlation between candidate gene expression
and CCNE1 status was observed (data not shown). We then
correlated 19q12 gain with all other gains and losses within
0.1 Mb segments of the genome (see Methods S1). The top three
correlated regions of copy number change were on 20q11, 1p36
and 6q27 (Figure 7A). The most significant associated gain was
localized to a 2.5Mb region on chromosome 20 (Figure 7B) and
has been validated in a separate unbiased analysis of genome-wide
correlations of gain and loss in ovarian tumors [21].
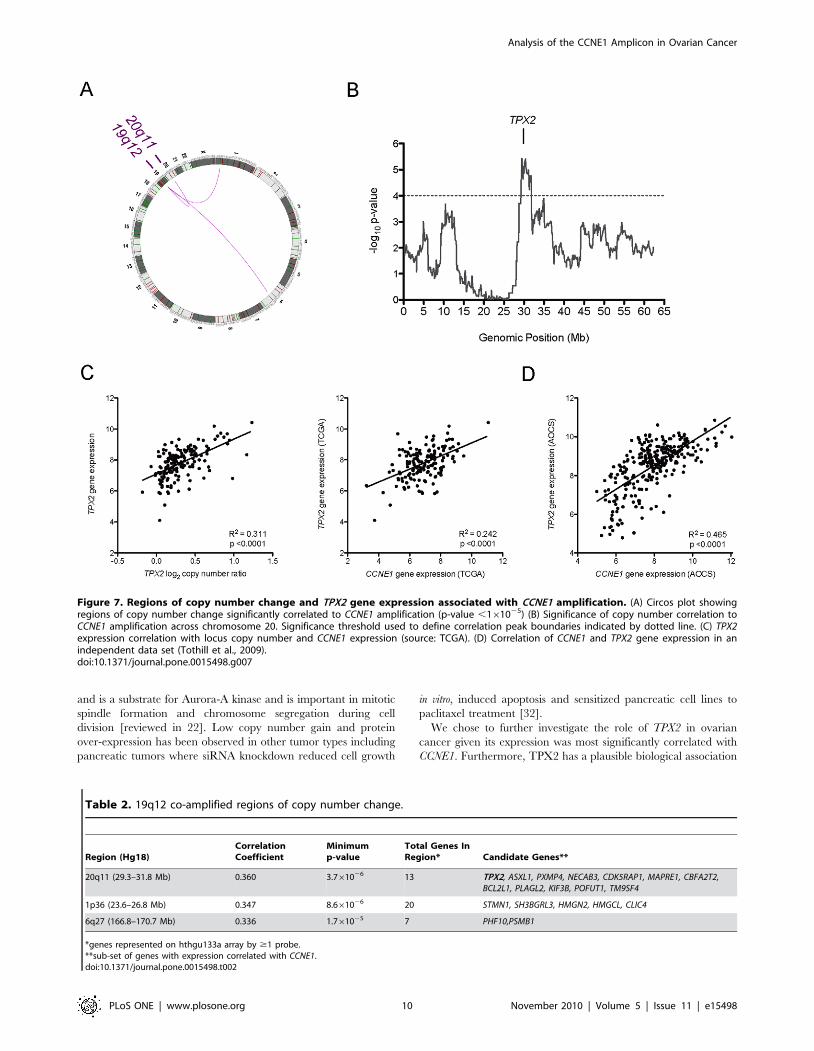
In order to narrow gene candidates within the three regions
most likely to interact with CCNE1, we next correlated the
expression of genes within each region with CCNE1 expression
(Table 2). Expression of TPX2 was most significantly associated
with CCNE1 expression, and was also correlated to its own
amplification status (Figure 7C). The relationship between CCNE1
Figure 3. Combined siRNA knock-down and cisplatin treatmentin ovarian tumor cell lines. (A) Cell viability after transfection withindividual siRNAs and cisplatin treatment normalized to cisplatin-treated control cells without siRNA. Cisplatin dose of 3 mM or 6 mM wasused for OVCAR-3 and SK-OV-3 cells respectively. Average normalizedabsorbance (490 nm) from three independent MTS assays (triplicatewells per condition) and SEM plotted (n = 3). (B) Cisplatin dose responseafter transfection with CCNE1 or non-silencing siRNA in OVCAR-3 andSK-OV-3 cell lines. Arrow indicates drug treatment dose used in initialscreen; p-value indicates significance of difference between fittedcurves. Average normalized MTS assay absorbance to cells withoutcisplatin treatment, SEM and four-parameter fitted Hill slope plotted(n = 3 for each drug concentration). (D) Cell viability after transfectionwith CCNE1 or NS siRNAs and cisplatin treatment normalized tocisplatin-treated no siRNA control cells for each cell line. Statisticalsignificance calculated by comparison to NS siRNA, cisplatin-treatedcells in the same cell line. Average normalized absorbance from MTSassay and SEM plotted (n = 3). See Table S4 for cisplatin treatmentdoses.doi:10.1371/journal.pone.0015498.g003
Analysis of the CCNE1 Amplicon in Ovarian Cancer
PLoS ONE | www.plosone.org 5 November 2010 | Volume 5 | Issue 11 | e15498
and TPX2 gene expression was further validated in a second
independent data set (Figure 7D). The strong association between
TPX2 and CCNE1 amplification and expression was intriguing
given that TPX2 is a centromeric protein required for mitotic
spindle function during cell division [22].
20q11 amplification renders cells resistant to TPX2knockdown
To test whether there was a functional dependence on TPX2 in
cell lines with amplification of the 20q11 locus and whether it
interacts with CCNE1, we assessed TPX2 status in lines used for
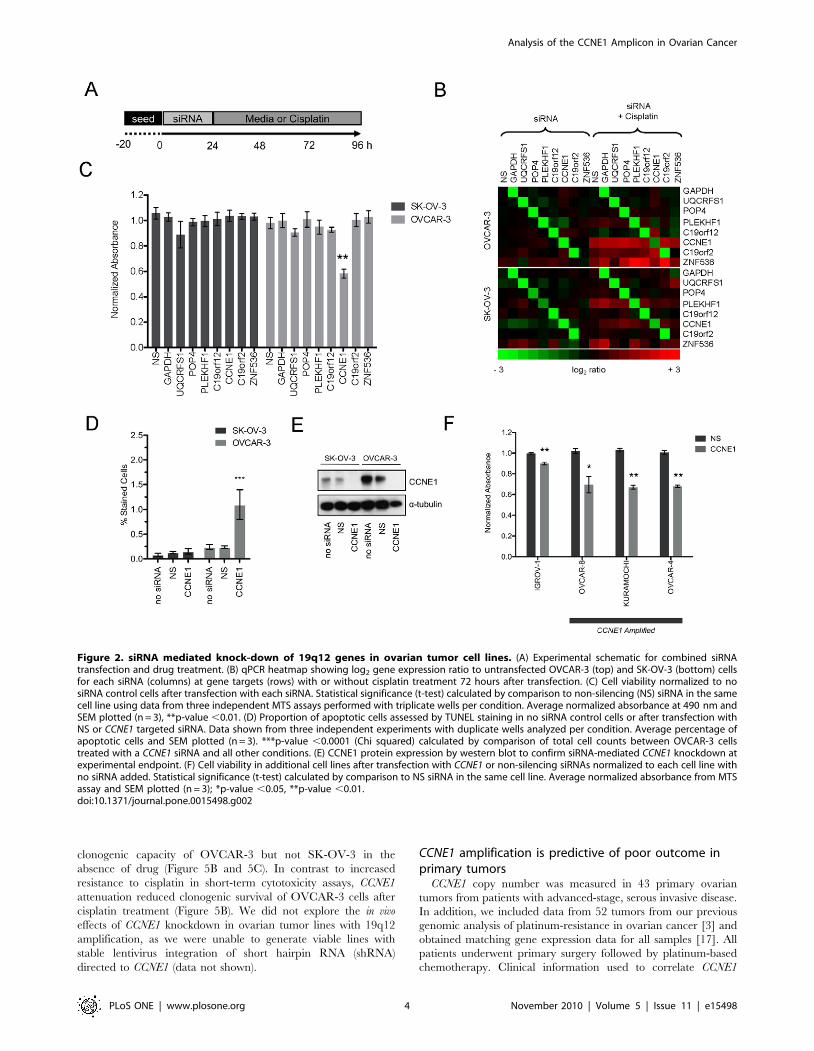
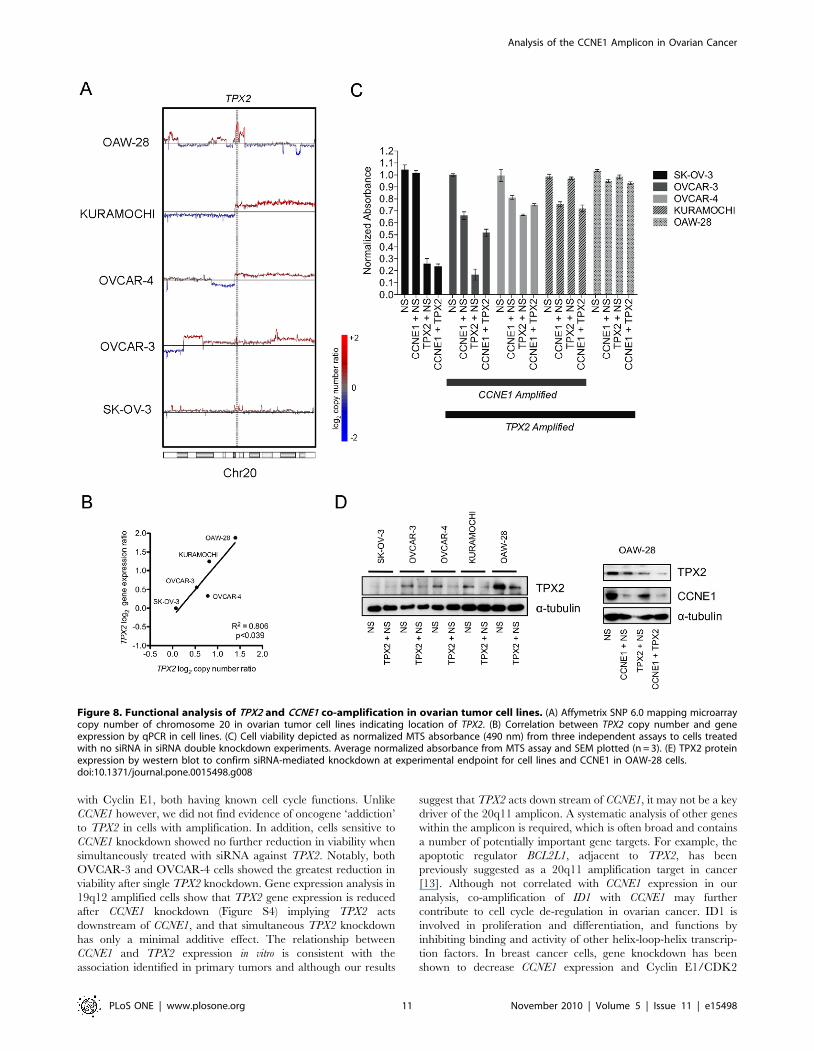
our knockdown experiments. TPX2 was amplified (Figure 8A) and
over-expressed (Figure 8B) in all three CCNE1 amplified and over-
expressing cell lines (OVCAR-3, OVCAR-4 and Kuramochi)
compared to the control line, SK-OV-3. In addition, we further
identified OAW-28 as having high-level 20q11 amplification
(Figure 8A, data from Sanger Cancer Genome Project Archive)
and the highest level of gene expression across the tested cell lines
(Figure 8B).
In contrast to the close relationship between CCNE1 amplifi-
cation and cellular sensitivity to gene knockdown, an inverse
relationship was observed between TPX2 copy number and the
effects of TPX2 siRNA (Figure 8C). For example, SK-OV-3 cells
with low gene expression (Figure 8B) and minimal detectable
TPX2 protein (Figure 8D), were highly sensitive to gene
knockdown, whereas OAW-28 cells were essentially resistant.
RT-PCR (Figure S4) and western blot (Figure 8D) analyses
demonstrated efficient knockdown of TPX2, however protein was
still detectable in some cell lines that initially had high levels of
TPX2 protein. We also observed that knockdown of CCNE1
resulted in diminished TPX2 gene expression in 19q12 amplified
lines (Figure S4 A) suggestive that TPX2 expression is affected
downstream of Cyclin E1.
Given the correlation between CCNE1 and TPX2 amplification,
we also examined whether concurrent knockdown of both genes
would further diminish viability in cell lines containing both
amplifications (Figure 8C). After we allowed for a competitive
effect of combining siRNAs (see Methods) no obvious interaction
Figure 4. Cell cycle distribution after CCNE1 knockdown and cisplatin treatment. (A) OVCAR-3 cells and (B) SK-OV-3 cell cycle profile (left)and proportion of cells in G1, S or G2 phase (right) for PI stained cells analyzed by flow cytometry 72 hours after transfection with CCNE1 or NS siRNAwith or without cisplatin treatment (3 mM or 6 mM for OVCAR-3 and SK-OV-3 cells respectively).doi:10.1371/journal.pone.0015498.g004
Analysis of the CCNE1 Amplicon in Ovarian Cancer
PLoS ONE | www.plosone.org 6 November 2010 | Volume 5 | Issue 11 | e15498
was observed with simultaneous knockdown of TPX2 and CCNE1.
Knockdown of CCNE1 had minimal effect on OAW-28 cell
viability despite efficient protein reduction in double knockdown
experiments (Figure 8D). This finding is consistent with our initial
results, as OAW-28 cells do not have 19q12 amplification (see
Figure S1 for OAW-28 copy number at this locus).
Discussion
We performed the first systematic siRNA knockdown of all
genes within the minimally defined 19q12 amplicon in ovarian
cancer showing that CCNE1 is the key oncogenic target. Given
known roles of Cyclin E1 in cancer, including de-regulation of the
cell cycle and promoting genomic instability, it was the likely
driver of the 19q12 locus, however other genes had not been
excluded. For example, C19orf2, which is immediately adjacent to
CCNE1, has recently been annotated to encode URI, an
unconventional prefoldin protein. Studies of the C. elegans URI
homologue suggest an involvement in chromatin remodeling,
preventing and/or repairing endogenous genotoxic DNA damage
and maintenance of genome integrity [23]. More recently, URI
has been identified as a key inhibitor of protein phosphatase 1c(PP1c) and is involved in regulation of the mTOR/S6K1 survival
pathway based on nutrient and growth factor availability [24].
Despite these intriguing biological associations, we found no
evidence of URI as a driver of the 19q12 locus.
Figure 5. Clonogenic survival after CCNE1 knockdown and cisplatin treatment. (A) Experimental time-course for clonogenic survival assayafter siRNA transfection and cisplatin treatment. Representative crystal violet stained (B) SK-OV-3 and (C) OVCAR-3 colonies (top) and averageproportion of discrete colonies formed (bottom) compared to control cells without siRNA or 1 hour cisplatin treatment (3 mM or 6 mM for OVCAR-3and SK-OV-3 cells respectively). Error bars indicate SEM (n = 3), **p-value ,0.001.doi:10.1371/journal.pone.0015498.g005
Analysis of the CCNE1 Amplicon in Ovarian Cancer
PLoS ONE | www.plosone.org 7 November 2010 | Volume 5 | Issue 11 | e15498
Reduction in cell viability after CCNE1 knockdown was specific
to cell lines with 19q12 amplification, with limited or no effect in
non-amplified lines, indicating an ‘addiction’ [25] to CCNE1
deregulation. Our findings validate a recent report showing
amplification-specific sensitivity to CCNE1 attenuation in OV-
CAR-3 and IOSE-29 cells [26]. Unamplified lines appeared to
bypass siRNA mediated G1/S checkpoint arrest and apoptosis,
possibly reflecting CCNE1 independent mechanisms of cell cycle
de-regulation and distinct oncogenic processes. Interestingly,
increased expression of CCNE1 has recently been shown in
serous tubal intraepithelial carcinoma (STIC), a proposed
precursor for high-grade serous carcinoma [27]. This finding
reinforces the significance of CCNE1 de-regulation in ovarian
cancer and suggests it is an early requirement in tumor evolution.
19q12 amplification is strongly associated with primary treatment
failure in ovarian tumors [3] and is therefore both a potential
prognostic marker and therapeutic target. Having identified CCNE1
as the driver of 19q12 amplification we sought to understand how it
contributes to primary treatment failure. In short-term cytotoxicity
assays, over-expression of Cyclin E1 increases sensitivity to cisplatin
[12]. Consistent with this data, we found that siRNA-mediated
knockdown of CCNE1 induced G1 arrest in 19q12-amplified cell
lines, possibly protecting cells from cisplatin damage occurring
through cell cycle progression. These findings, together with the lack
of correlation of amplification status with in vitro cisplatin sensitivity
of cell lines (Table S1) are at odds with the clinical behavior of
primary tumors. Significantly, we found that knockdown of CCNE1
profoundly inhibited clonogenic cell survival and this effect was
augmented by cisplatin treatment (Figure 5B & C). Collectively, our
findings suggest that 19q12 amplification does not increase
resistance to chemotherapy per se but rather may confer a survival
advantage post-treatment. In addition to increased cellular division,
high CCNE1 expression may assist re-entry into cell cycle from
quiescence in surviving cells after chemotherapy [28]. Uniquely
amongst cell cycle proteins in Drosophila, Cyclin E1 over-
expression has been shown to promote self-renewal of neuroblasts
[29] and may translate to an increased clonogenic capacity in tumor
cells. Although we were unable to generate stable OVCAR-3 with
integrated shRNA directed to CCNE1 to further validate these
findings in vivo, these observations suggest that CCNE1 amplification
Table 1. Patient characteristics by CCNE1 copy number status.
CCNE1 Unamplified CCNE1 Gain CCNE1 Amplification p-value
Age
Mean 57 64 61 ,0.01a
Standard Deviation 10 7 7
Range 23–80 52–78 53–71
Stage
III 63 (93%) 21 (100%) 6 (100%) 0.53b
IV 5 (7%) 0 (0%) 0 (0%)
Grade
Low (well differentiated) 2 (3%) 0 (0%) 0 (0%) 0.81b
Medium 30 (44%) 7 (33%) 3 (50%)
High (poorly differentiated) 36 (53%) 14 (67%) 3 (50%)
Residual Disease
#1 cm 47 (69%) 16 (76%) 3 (50%) 0.12b
.1 cm 18 (26%) 2 (10%) 3 (50%)
Unknown 3 (4%) 3 (14%) 0 (0%)
Primary Treatment
Pt-based 5 (7%) 1 (5%) (0%) 1.0b
Pt-based + Other 63 (93%) 20 (95%) 6 (100%)
PFS
(from Surgery)
Mean (months) 18.91 15.72 10.68 ,0.0001c
Standard Deviation 10.24 7.73 3.79
Events 54 (79%) 20 (95%) 6 (100%)
OS
(from Surgery)
Mean (years) 3.49 3.25 2.23 ,0.001c
Standard Deviation 1.56 1.55 1.73
Events 42 (62%) 15 (71%) 6 (100%)
Total Cases 68 21 6 85
aKruskal-Wallis,bFisher Exact and.cLog-rank test p-values reported.doi:10.1371/journal.pone.0015498.t001
Analysis of the CCNE1 Amplicon in Ovarian Cancer
PLoS ONE | www.plosone.org 8 November 2010 | Volume 5 | Issue 11 | e15498
may enhance the ability of tumor cells to repopulate the tumor after
the cessation of chemotherapy.
We also sought to identify other mutational events that may
enhance the effect of CCNE1 deregulation by seeking regions of
copy number change that correlate with 19q12 gain. Previous
investigations of correlated gains include a recent study in breast
cancer [30] where co-amplification of 8p12 and 11q13 was
identified and thought to cooperate functionally through activation
of independent oncogenic pathways. Cooperative networks in
glioblastoma that are associated with outcome have also been
identified through analysis of co-occurring copy number changes
[31]. We identified copy number change of three loci at 20q11,
1p36 and 6q27 to be significantly associated with CCNE1
amplification in ovarian tumors.
The 20q11 region contains twelve candidate genes, including
TPX2, ASXL1 and BCL2L1 with expression correlated to CCNE1
(Table 2). TPX2 is a microtubule-associated protein downstream
of Ran-GTP that triggers microtubule nucleation. It both activates
Figure 6. CCNE1 copy number and gene expression associated with patient outcome. (A) Patient age distribution stratified by CCNE1amplification status. Kruskal-Wallis p-value reported, bars indicate mean and SEM. (B) Correlation between CCNE1 copy number by qPCR and geneexpression signal by microarray. (C) Kaplan-meier analysis of CCNE1 unamplified (n = 68), gained (n = 21) and amplified (n = 6) ovarian cancer patientsand (D) CCNE1 low (n = 31), medium (n = 28) and high (n = 36) expressing samples for progression-free survival and (E & F) overall survival. Log-ranktest p-values reported. Stratification by CCNE1 copy number or expression status described in Materials and Methods.doi:10.1371/journal.pone.0015498.g006
Analysis of the CCNE1 Amplicon in Ovarian Cancer
PLoS ONE | www.plosone.org 9 November 2010 | Volume 5 | Issue 11 | e15498
and is a substrate for Aurora-A kinase and is important in mitotic
spindle formation and chromosome segregation during cell
division [reviewed in 22]. Low copy number gain and protein
over-expression has been observed in other tumor types including
pancreatic tumors where siRNA knockdown reduced cell growth
in vitro, induced apoptosis and sensitized pancreatic cell lines to
paclitaxel treatment [32].
We chose to further investigate the role of TPX2 in ovarian
cancer given its expression was most significantly correlated with
CCNE1. Furthermore, TPX2 has a plausible biological association
Figure 7. Regions of copy number change and TPX2 gene expression associated with CCNE1 amplification. (A) Circos plot showingregions of copy number change significantly correlated to CCNE1 amplification (p-value ,161025) (B) Significance of copy number correlation toCCNE1 amplification across chromosome 20. Significance threshold used to define correlation peak boundaries indicated by dotted line. (C) TPX2expression correlation with locus copy number and CCNE1 expression (source: TCGA). (D) Correlation of CCNE1 and TPX2 gene expression in anindependent data set (Tothill et al., 2009).doi:10.1371/journal.pone.0015498.g007
Table 2. 19q12 co-amplified regions of copy number change.
Region (Hg18)CorrelationCoefficient
Minimump-value
Total Genes InRegion* Candidate Genes**
20q11 (29.3–31.8 Mb) 0.360 3.761026 13 TPX2, ASXL1, PXMP4, NECAB3, CDK5RAP1, MAPRE1, CBFA2T2,BCL2L1, PLAGL2, KIF3B, POFUT1, TM9SF4
1p36 (23.6–26.8 Mb) 0.347 8.661026 20 STMN1, SH3BGRL3, HMGN2, HMGCL, CLIC4
6q27 (166.8–170.7 Mb) 0.336 1.761025 7 PHF10,PSMB1
*genes represented on hthgu133a array by $1 probe.**sub-set of genes with expression correlated with CCNE1.doi:10.1371/journal.pone.0015498.t002
Analysis of the CCNE1 Amplicon in Ovarian Cancer
PLoS ONE | www.plosone.org 10 November 2010 | Volume 5 | Issue 11 | e15498
with Cyclin E1, both having known cell cycle functions. Unlike
CCNE1 however, we did not find evidence of oncogene ‘addiction’
to TPX2 in cells with amplification. In addition, cells sensitive to
CCNE1 knockdown showed no further reduction in viability when
simultaneously treated with siRNA against TPX2. Notably, both
OVCAR-3 and OVCAR-4 cells showed the greatest reduction in
viability after single TPX2 knockdown. Gene expression analysis in
19q12 amplified cells show that TPX2 gene expression is reduced
after CCNE1 knockdown (Figure S4) implying TPX2 acts
downstream of CCNE1, and that simultaneous TPX2 knockdown
has only a minimal additive effect. The relationship between
CCNE1 and TPX2 expression in vitro is consistent with the
association identified in primary tumors and although our results
suggest that TPX2 acts down stream of CCNE1, it may not be a key
driver of the 20q11 amplicon. A systematic analysis of other genes
within the amplicon is required, which is often broad and contains
a number of potentially important gene targets. For example, the
apoptotic regulator BCL2L1, adjacent to TPX2, has been
previously suggested as a 20q11 amplification target in cancer
[13]. Although not correlated with CCNE1 expression in our
analysis, co-amplification of ID1 with CCNE1 may further
contribute to cell cycle de-regulation in ovarian cancer. ID1 is
involved in proliferation and differentiation, and functions by
inhibiting binding and activity of other helix-loop-helix transcrip-
tion factors. In breast cancer cells, gene knockdown has been
shown to decrease CCNE1 expression and Cyclin E1/CDK2
Figure 8. Functional analysis of TPX2 and CCNE1 co-amplification in ovarian tumor cell lines. (A) Affymetrix SNP 6.0 mapping microarraycopy number of chromosome 20 in ovarian tumor cell lines indicating location of TPX2. (B) Correlation between TPX2 copy number and geneexpression by qPCR in cell lines. (C) Cell viability depicted as normalized MTS absorbance (490 nm) from three independent assays to cells treatedwith no siRNA in siRNA double knockdown experiments. Average normalized absorbance from MTS assay and SEM plotted (n = 3). (E) TPX2 proteinexpression by western blot to confirm siRNA-mediated knockdown at experimental endpoint for cell lines and CCNE1 in OAW-28 cells.doi:10.1371/journal.pone.0015498.g008
Analysis of the CCNE1 Amplicon in Ovarian Cancer
PLoS ONE | www.plosone.org 11 November 2010 | Volume 5 | Issue 11 | e15498
activity [33]. Interestingly, we also note the presence of a non-
coding RNA (NCRNA00028) and two micro-RNAs (hsa-mir-1825
and hsa-mir-3193) within the defined region of chromosome
20q11 gain. The potential effect of amplification on their function
or subsequent de-regulation of downstream targets was not
investigated in our current analysis. However, we are not aware
of any evidence that would link these molecules to the regulation
of CCNE1.
In primary tumors, CCNE1 copy number was significantly
associated with shorter progression-free and overall survival, with
tumors bearing high-level amplification showing the worst
outcome (Figure 6). Copy number status was more informative
than gene expression; a significant correlation with high expression
and PFS was observed, but not for OS. Similar to ERBB2
amplification in breast cancer, high-level CCNE1 amplification
may therefore have predominant clinical utility in identifying
patients most likely to have a poor response to standard treatment.
Interestingly, younger patients were less likely to have CCNE1
amplified tumors (Table 1 and Figure 6A) suggesting a difference
between the etiology of these tumors.
Our observations have potential implications for future thera-
peutic strategies based on targeting of cell cycle deregulation such
as via cyclin-dependent kinase (CDK) inhibition. To date, the
clinical success of single-agent CDK inhibitors has been disap-
pointing [34]. Limited success may in part relate to off-target drug
effects or redundancy between CDKs. It is anticipated that
chemotherapeutic agents may sensitize cells to CDK inhibition
[35]. However as shown here, interruption of G1/S transition may
increase resistance to G1/S-phase targeted treatment and therefore
CCNE1/CDK2 targeted therapies may need to appropriately
phased with conventional therapy. Additionally, the surprising
degree of resistance of cells without 19q12 amplification to CCNE1
knockdown suggests that CDK2 inhibitor clinical trials should
incorporate careful pre-selection of ovarian cancer patients and
other tumor subtypes associated with Cyclin E1 over-expression,
such as triple-negative and basal-like breast tumors [36].
Materials and Methods
Ethics StatementThis study was approved by the Human Research Ethics
Committees at the Peter MacCallum Cancer Centre, Queensland
Institute of Medical Research, University of Melbourne and all
participating hospitals. Written informed consent was obtained
from all participants in this study.
Cell LinesOvarian cell lines were maintained at 37u and 5% CO2 in
RPMI 1640 containing 10% (v/v) FCS, 50 U.mL21 penicillin and
50 ug.mL21 streptomycin, except for OAW-28 cells which were
maintained in DMEM containing 10% (v/v) FCS, 50 U.mL21
penicillin, 50 ug.mL21 streptomycin and 0.2 U.mL21 insulin.
Transfection and drug-treatment assays were performed in
antibiotic-free medium.
Copy Number DataMicroarray data was obtained from Tumorscape (www.broad-
institute.org/tumorscape), the Cancer Genome Atlas Project
(TCGA) (cancergenome.nih.gov) for primary tumors and the
Sanger Cancer Genome Project Archive (http://www.sanger.ac.
uk/genetics/CGP/Archive/) for ovarian cell lines. Data was
visualized using Partek Genomics Suite 6.4 (Partek Inc., St Louis,
MO) and Tree View [37]. Further copy number analysis is
described in Methods S1.
Molecular MethodsCell line DNA was extracted using a DNeasy Kit (Qiagen,
Valencia, CA) and quantitative-PCR (qPCR) analysis of CCNE1
DNA copy number status was performed as described previously
[3]. Total RNA was extracted from cell pellets using an RNeasy
mini Kit (Qiagen) and reverse transcribed using M-MLV prior to
SYBR green qPCR as detailed in Methods S1. Primer sequences
to measure gene expression were obtained from qPrimerDepot
[38]. Two primer sets were used to assess TPX2 copy number and
were designed using Primer3 [39] or obtained elsewhere [32]. All
primers are listed in Table S2.
siRNA TransfectionCells were seeded at a density of 5–106103 cells per well in 96
well plates (for viability assays), Lab-Tek II Chamber Slides (Sigma
Aldrich, St Louis, MO) (for TUNEL staining) or 3–66104 cells in
24 well plates (for all other assays) approximately 20 hours prior to
transfection. Selected seeding densities resulted in cell growth as a
sub-confluent monolayer at transfection. ON-Target plus siRNA
pools (listed in Table S3) and transfection reagents were obtained
from Dharmacon (ThermoFisher Scientific, Lafayette, CO).
Optimal transfection conditions were determined based on
maximal gene knockdown and minimal cytotoxicity as assessed
by RT-PCR and MTS cell viability assay (see Methods S1).
Nuclear localization of siGLO Green RNA duplex was used to
monitor transfection efficiency by fluorescence microscopy 24–
48 hours after transfection (data not shown). Transfection reagent
and siRNA pools were pre-incubated at room temperature for 15
minutes in serum-free media (20% of final transfection volume) to
facilitate formation of lipid-siRNA complexes. Cells were then
incubated in final transfection mix containing 0.4% (v/v)
DharmaFECT 2 and 50 nM siRNA in antibiotic-free media with
serum. In double knockdown experiments, total siRNA amount
was normalized between treatment groups by addition of a non-
silencing siRNA up to 100 nM. After 24 hours, media was
replaced and following a further 72 hours, cells assayed for
viability, cisplatin sensitivity (at a pre-determined IC50 dose,
Table S4), cell cycle distribution, clonogenic survival or apoptosis
as described below and in Methods S1.
Western BlotWhole cell protein lysates were boiled, resolved by SDS-PAGE
using 12.5% (w/v) acrylamide gels and then transferred to PVDF
membranes. Blots were blocked in 5% (w/v) non-fat milk powder
in PBS-T (0.1% Tween 20 in PBS) and probed overnight at 4uC in
1:500 primary antibody against human Cyclin E1 (clone HE12)
(Santa Cruz Biotechnology, Santa Cruz, CA) or TPX2 (clone
18D5) (Biolegend, San Diego, CA). Membranes were washed in
PBS-T and incubated with 1:7000 dilution of peroxidase-
conjugate secondary antibody for 1 hr at room temperature,
washed and developed by chemoluminescence before being
exposed to radiographic film. Blots were re-probed with an
antibody against a-tubulin to assess protein loading.
Flow CytometryControl, transfected and cisplatin treated cells were rinsed in
PBS, trypsinized to form a single-cell suspension and fixed in 70%
ice-cold ethanol. Cell were pelleted and resuspended in a solution
containing 50 mg.mL21 propidium iodide and 100 U.mL21
RNAseA (Qiagen) for 30 minutes at room temperature. Up to
10,000 cells were then counted by FACS. Viable cell cycle profiles
and percentage of cells in each cell cycle phase was determined
using Modfit LT (Beckman Coulter, Brea, CA).
Analysis of the CCNE1 Amplicon in Ovarian Cancer
PLoS ONE | www.plosone.org 12 November 2010 | Volume 5 | Issue 11 | e15498
TUNEL StainingApoptotic cells were identified using the ApopTagH In Situ
Apoptosis Detection Kit (Intergen, Purchase, NY). A minimum of
eight, uniformly spaced images were taken per well and positively
and negatively stained cells counted by a researcher blinded to the
experimental setup.
Clonogenic Survival AssayTransfected cells were treated with cisplatin for 1 hour then
PBS washed, trypsinized to form a single-cell suspension, counted
(Coulter Counter) and cell number equalized for each experimen-
tal condition. Cells were then seeded at low density in wells of a 6-
well plate in triplicate and left to form colonies for up to ten days.
The number of plated cells differed depending on cell line plating
efficiency; 500 and 15,000 cells were used for SK-OV-3 and
OVCAR-3 respectively. Cell colonies were then fixed and stained
with 20% (v/v) methanol and 0.1% (w/v) crystal violet. Cells were
rinsed in water, air-dried and discrete colonies counted using
MetaMorph (Molecular Devices, Sunnyvale, CA).
CCNE1 Copy Number and Gene Expression in PrimaryTumors
Tumor samples and clinical data were obtained from women
with advanced stage, serous invasive disease enrolled through the
Australian Ovarian Cancer Study (www.aocstudy.org). This
project had institutional ethics review board approval at all
participating centers.
Samples were segregated based on CCNE1 copy number level as
assessed by qPCR (above) using a log2 copy number ratio cut-off of
$0.5 (,3 copies) for gain and $2 (,8 copies) for amplification
(Table 1). Matched expression data from Affymetrix U133 plus 2.0
microarrays was obtained from a previous study [17]. The CCNE1
probe showing the highest signal level (213523_at) was selected for
our analysis and showed a significant correlation with gene copy
number (Figure 6B). Samples were segregated into low, medium
and high expression of CCNE1, where tumors with high expression
were defined as those above the median signal value + [0.5 x
median absolute deviation (MAD)] and low expressing tumors
where those below the median signal value – [0.5 *MAD].
Statistical analysis was performed in GraphPad Prism (GraphPad
Software, San Diego, CA). PFS and OS was calculated from the
date of diagnosis (surgery).
Supporting Information
Figure S1 Heat-map of copy number change in ovariantumor cell lines. Affymetrix SNP 6.0 mapping microarray copy
number of chromosome 19 in 22 ovarian tumor cell lines between
34–36 Mb (source: Sanger Cancer Genome Project Archive).
(TIF)Figure S2 CCNE1 gene and protein expression inknockdown experiments. (A) Correlation between CCNE1
copy number status and gene expression by qPCR in ovarian cell
lines. (B) CCNE1 gene expression in ovarian cell lines normalized
to SK-OV-3 with no siRNA treatment after transfection with
CCNE1 or non-silencing siRNA. (C) CCNE1 protein expression by
western-blot to confirm siRNA-mediated Cyclin E1 knockdown at
experimental endpoint in ovarian cell lines. (TIF)
Figure S3 Cell cycle distribution after CCNE1 knock-down and cisplatin treatment in additional cell lines.Cycle profile (left) and proportion of cells in G1, S or G2 phase
(right) for PI stained cells analyzed by flow cytometry after
transfection with CCNE1 or non-silencing siRNA and with or
without cisplatin treatment in (A) IGROV-1, (B) OVCAR-8, (C)
Kuramochi and (D) OVCAR-4 cell lines. (TIF)
Figure S4 CCNE1 and TPX2 gene expression in com-bined knockdown experiments. CCNE1 and TPX2 gene
expression ratios in ovarian cell lines normalized to no siRNA
treated cells in each line after single or combined transfection with
NS, CCNE1 and TPX2 siRNA. (TIF)
Table S1 Cisplatin IC50 values from 72 hour cytotoxic-ity assays. (DOC)
Table S2 Primer Sequences. (DOC)
Table S3 ON-Target plus siRNA pools (Dharmacon).(DOC)
Table S4 Cisplatin experimental doses and effect oncell viability. (DOC)
Methods S1 Supplementary Methods. (DOC)
Acknowledgments
The authors wish to thank Andy Futreal (Wellcome Trust Sanger Institute)
for allowing access to copy number data generated on tumor cell lines.
We gratefully acknowledge the cooperation of the following institutions
associated with the Australian Ovarian Cancer Study: New South Wales:
John Hunter Hospital, North Shore Private Hospital, Royal Hospital for
Women, Royal North Shore Hospital, Royal Prince Alfred Hospital,
Westmead Hospital; Queensland: Mater Misericordiae Hospital, Royal
Brisbane and Women’s Hospital, Townsville Hospital, Wesley Hospital;
South Australia: Flinders Medical Centre, Queen Elizabeth II, Royal
Adelaide Hospital; Tasmania: Royal Hobart Hospital; Victoria: Freema-
sons Hospital, Mercy Hospital for Women, Monash Medical Centre, Royal
Women’s Hospital; Western Australia: King Edward Memorial Hospital,
St John of God Hospitals Subiaco, Sir Charles Gairdner Hospital, Western
Australia Research Tissue Network (WARTN): and the Westmead
Gynaecological Oncology Tissue Bank, a member of the Australasian
Biospecimens Network-Oncology group.
We also acknowledge the contribution of the AOCS Management
Group: D Bowtell, G Chenevix-Trench, A Green, P Webb, A deFazio, D
Gertig, the study nurses and research assistants and express our gratitude to
all women who participated in the study.
Author Contributions
Conceived and designed the experiments: DE JG DDLB. Performed the
experiments: DE JG PAC MK. Analyzed the data: DE JG PAC MK.
Contributed reagents/materials/analysis tools: AOCSG CC. Wrote the
paper: DE DDLB. Contributed to study conception and design: CC KLG
GKS. Critically revised the manuscript: PAC CC KLG.
References
1. Marchetti C, Pisano C, Facchini G, Bruni GS, Magazzino FP, et al. (2010) First-
line treatment of advanced ovarian cancer: current research and perspectives.
Expert Rev Anticancer Ther 10: 47–60.
2. Siddik ZH (2003) Cisplatin: mode of cytotoxic action and molecular basis of
resistance. Oncogene 22: 7265–7279.
3. Etemadmoghadam D, deFazio A, Beroukhim R, Mermel C, George J, et al.
(2009) Integrated genome-wide DNA copy number and expression analysis
identifies distinct mechanisms of primary chemoresistance in ovarian carcino-
mas. Clin Cancer Res 15: 1417–1427.
4. Mayr D, Kanitz V, Anderegg B, Luthardt B, Engel J, et al. (2006) Analysis
of gene amplification and prognostic markers in ovarian cancer using
comparative genomic hybridization for microarrays and immunohisto-
chemical analysis for tissue microarrays. Am J Clin Pathol 126: 101–
109.
5. Farley J, Smith LM, Darcy KM, Sobel E, O’Connor D, et al. (2003) Cyclin E
expression is a significant predictor of survival in advanced, suboptimally
debulked ovarian epithelial cancers: a Gynecologic Oncology Group study.
Cancer Res 63: 1235–1241.
Analysis of the CCNE1 Amplicon in Ovarian Cancer
PLoS ONE | www.plosone.org 13 November 2010 | Volume 5 | Issue 11 | e15498
6. Lin L, Prescott MS, Zhu Z, Singh P, Chun SY, et al. (2000) Identification and
characterization of a 19q12 amplicon in esophageal adenocarcinomas reveals
cyclin E as the best candidate gene for this amplicon. Cancer Res 60:
7021–7027.
7. Akama Y, Yasui W, Yokozaki H, Kuniyasu H, Kitahara K, et al. (1995)
Frequent amplification of the cyclin E gene in human gastric carcinomas.
Jpn J Cancer Res 86: 617–621.
8. Weir BA, Woo MS, Getz G, Perner S, Ding L, et al. (2007) Characterizing the
cancer genome in lung adenocarcinoma. Nature.
9. Salvesen HB, Carter SL, Mannelqvist M, Dutt A, Getz G, et al. (2009)
Integrated genomic profiling of endometrial carcinoma associates aggressive
tumors with indicators of PI3 kinase activation. Proc Natl Acad Sci U S A 106:
4834–4839.
10. Gorringe KL, Jacobs S, Thompson ER, Sridhar A, Qiu W, et al. (2007) High-
resolution single nucleotide polymorphism array analysis of epithelial ovarian
cancer reveals numerous microdeletions and amplifications. Clin Cancer Res 13:
4731–4739.
11. Nakayama K, Nakayama N, Jinawath N, Salani R, Kurman RJ, et al. (2007)
Amplicon profiles in ovarian serous carcinomas. Int J Cancer 120: 2613–2617.
12. Bedrosian I, Lu KH, Verschraegen C, Keyomarsi K (2004) Cyclin E
deregulation alters the biologic properties of ovarian cancer cells. Oncogene
23: 2648–2657.
13. Beroukhim R, Mermel CH, Porter D, Wei G, Raychaudhuri S, et al. (2010) The
landscape of somatic copy-number alteration across human cancers. Nature 463:
899–905.
14. Beroukhim R, Getz G, Nghiemphu L, Barretina J, Hsueh T, et al. (2007)
Assessing the significance of chromosomal aberrations in cancer: Methodology
and application to glioma. Proc Natl Acad Sci U S A 104: 20007–20012.
15. Gorringe KL, Boussioutas A, Bowtell DD (2005) Novel regions of chromosomal
amplification at 6p21, 5p13, and 12q14 in gastric cancer identified by array
comparative genomic hybridization. Genes Chromosomes Cancer 42: 247–259.
16. Leung SY, Ho C, Tu IP, Li R, So S, et al. (2006) Comprehensive analysis of
19q12 amplicon in human gastric cancers. Mod Pathol 19: 854–863.
17. Tothill RW, Tinker AV, George J, Brown R, Fox SB, et al. (2008) Novel
molecular subtypes of serous and endometrioid ovarian cancer linked to clinical
outcome. Clin Cancer Res 14: 5198–5208.
18. Hwang HC, Clurman BE (2005) Cyclin E in normal and neoplastic cell cycles.
Oncogene 24: 2776–2786.
19. Akli S, Keyomarsi K (2003) Cyclin E and its low molecular weight forms in
human cancer and as targets for cancer therapy. Cancer Biol Ther 2: S38–47.
20. Mull BB, Cox J, Bui T, Keyomarsi K (2009) Post-translational modification and
stability of low molecular weight cyclin E. Oncogene 28: 3167–3176.
21. Gorringe KL, George J, Anglesio MS, Ramakrishna M, Etemadmoghadam D,
et al. (2010) Copy number analysis identifies novel interactions between genomic
loci in ovarian cancer. PLoS One 5.
22. Gruss OJ, Vernos I (2004) The mechanism of spindle assembly: functions of Ran
and its target TPX2. J Cell Biol 166: 949–955.
23. Parusel CT, Kritikou EA, Hengartner MO, Krek W, Gotta M (2006) URI-1 is
required for DNA stability in C. elegans. Development 133: 621–629.
24. Djouder N, Metzler SC, Schmidt A, Wirbelauer C, Gstaiger M, et al. (2007)
S6K1-mediated disassembly of mitochondrial URI/PP1gamma complexes
activates a negative feedback program that counters S6K1 survival signaling.
Mol Cell 28: 28–40.
25. Weinstein IB (2002) Cancer. Addiction to oncogenes—the Achilles heal of
cancer. Science 297: 63–64.26. Nakayama N, Nakayama K, Shamima Y, Ishikawa M, Katagiri A, et al. (2010)
Gene amplification CCNE1 is related to poor survival and potential therapeutic
target in ovarian cancer. Cancer 116: 2621–2634.27. Sehdev AS, Kurman RJ, Kuhn E, Shih IM (2010) Serous tubal intraepithelial
carcinoma upregulates markers associated with high-grade serous carcinomasincluding Rsf-1 (HBXAP), cyclin E and fatty acid synthase. Mod Pathol.
28. Geng Y, Yu Q, Sicinska E, Das M, Schneider JE, et al. (2003) Cyclin E ablation
in the mouse. Cell 114: 431–443.29. Chia W, Somers WG, Wang H (2008) Drosophila neuroblast asymmetric
divisions: cell cycle regulators, asymmetric protein localization, and tumorigen-esis. J Cell Biol 180: 267–272.
30. Kwek SS, Roy R, Zhou H, Climent J, Martinez-Climent JA, et al. (2009) Co-amplified genes at 8p12 and 11q13 in breast tumors cooperate with two major
pathways in oncogenesis. Oncogene 28: 1892–1903.
31. Bredel M, Scholtens DM, Harsh GR, Bredel C, Chandler JP, et al. (2009) Anetwork model of a cooperative genetic landscape in brain tumors. JAMA 302:
261–275.32. Warner SL, Stephens BJ, Nwokenkwo S, Hostetter G, Sugeng A, et al. (2009)
Validation of TPX2 as a potential therapeutic target in pancreatic cancer cells.
Clin Cancer Res 15: 6519–6528.33. Swarbrick A, Akerfeldt MC, Lee CS, Sergio CM, Caldon CE, et al. (2005)
Regulation of cyclin expression and cell cycle progression in breast epithelialcells by the helix-loop-helix protein Id1. Oncogene 24: 381–389.
34. Malumbres M, Barbacid M (2009) Cell cycle, CDKs and cancer: a changingparadigm. Nat Rev Cancer 9: 153–166.
35. Shapiro GI (2006) Cyclin-dependent kinase pathways as targets for cancer
treatment. J Clin Oncol 24: 1770–1783.36. Agarwal R, Gonzalez-Angulo AM, Myhre S, Carey M, Lee JS, et al. (2009)
Integrative analysis of cyclin protein levels identifies cyclin b1 as a classifier andpredictor of outcomes in breast cancer. Clin Cancer Res 15: 3654–3662.
37. Eisen MB, Spellman PT, Brown PO, Botstein D (1998) Cluster analysis and
display of genome-wide expression patterns. Proc Natl Acad Sci U S A 95:14863–14868.
38. Cui W, Taub DD, Gardner K (2007) qPrimerDepot: a primer database forquantitative real time PCR. Nucleic Acids Res 35: D805–809.
39. Rozen S, Skaletsky H (2000) Primer3 on the WWW for general users and forbiologist programmers. Methods Mol Biol 132: 365–386.
40. Sos ML, Michel K, Zander T, Weiss J, Frommolt P, et al. (2009) Predicting drug
susceptibility of non-small cell lung cancers based on genetic lesions. J ClinInvest 119: 1727–1740.
41. Ramos AH, Dutt A, Mermel C, Perner S, Cho J, et al. (2009) Amplification ofchromosomal segment 4q12 in non-small cell lung cancer. Cancer Biol Ther 8:
2042–2050.
42. Bass AJ, Watanabe H, Mermel CH, Yu S, Perner S, et al. (2009) SOX2 is anamplified lineage-survival oncogene in lung and esophageal squamous cell
carcinomas. Nat Genet 41: 1238–1242.43. Nikolsky Y, Sviridov E, Yao J, Dosymbekov D, Ustyansky V, et al. (2008)
Genome-wide functional synergy between amplified and mutated genes inhuman breast cancer. Cancer Res 68: 9532–9540.
44. Haverty PM, Fridlyand J, Li L, Getz G, Beroukhim R, et al. (2008) High-
resolution genomic and expression analyses of copy number alterations in breasttumors. Genes Chromosomes Cancer 47: 530–542.
Analysis of the CCNE1 Amplicon in Ovarian Cancer
PLoS ONE | www.plosone.org 14 November 2010 | Volume 5 | Issue 11 | e15498
Related Documents