Ammonia excretion and expression of transport proteins in the gills and skin of the intertidal fish Lipophrys pholis Luciana R. Souza-Bastos a , Maria Inês Páscoa b , Carolina A. Freire a , Jonathan M. Wilson b, ⁎ a Departamento de Fisiologia, Setor de Ciências Biológicas, Universidade Federal do Paraná, Curitiba, Paraná, Brazil b Centro Interdisciplinar de Investigação Marinha e Ambiental (CIIMAR), Universidade do Porto, Porto, Portugal abstract article info Article history: Received 8 August 2013 Received in revised form 11 September 2013 Accepted 12 September 2013 Available online 18 September 2013 Keywords: Ammonia excretion Intertidal fish Na + /K + -ATPase Rhesus glycoprotein Na + /H + -exchanger Carbonic anhydrase Na + :K + :2Cl − cotransporter Intertidal pools are intensely challenging environments, due to rapid and extreme fluctuations in water conditions during the tidal cycle. Emersion is another challenge intertidal fishes may face. Mechanisms of ammonia excretion and ion regulation were studied in the resident amphibious blennid Lipophrys pholis. The ammonia transporters Rhcg1 and Rhcg2 were cloned and characterized. Fish were challenged for 24 h to 1) emersion, 2) fresh water (FW), and 3) high environmental ammonia (HEA; 1 mM NH 4 Cl), or 4) am- monia loading (1.5 μmol/g NH 4 HCO 3 ). When air exposed, L. pholis maintained aquatic ammonia excretion rates (J Amm ) while branchial Na + /K + -ATPase (NKA) activity increased, but no changes at the protein or mRNA levels of transporters were noted. In FW, J Amm decreased and osmotic problems were encountered. Skin NKA activity decreased, branchial Rhcg2, and skin Rhcg1 and Rhcg2 increased. Exposure to HEA only increased branchial Rhcg2 levels. Although internal ammonia loading only led to a modest non-significant increase in J Amm , skin NKA (activity and α-subunit), carbonic anhydrase protein levels, and branchial Rhcg1 levels increased. In summary, variable responses were observed involving both gill and skin but given the instability of its habitat, the constitutive expression of transporters is likely also of importance. © 2013 Elsevier Inc. All rights reserved. 1. Introduction Intertidal fishes endure rapid environmental changes in salinity, dissolved oxygen, pH, and temperature of the water resulting from tidal cycles (e.g. Bridges, 1988; Martin, 1995; Sayer, 2005). In addi- tion, some intertidal fish display an amphibious habit, intentionally exposing themselves to the air. These fish may remain exposed to the air for hours or even days in the field (Graham, 1973; Martin, 1995; Graham, 1997; Sayer, 2005). This habit is present in several species of the Blenniidae (Order Perciformes, Sub-order Blennioidei) (Graham, 1973, 1997). The blennid Lipophrys (=Blennius) pholis (Linnaeus, 1758) inhabits rocky crevices or intertidal pools and is able to tolerate up to 5 days of emersion in highly humid environment (Davenport and Vahl, 1979; Davenport and Sayer, 1986; Martin, 1995; Graham, 1997). These blennids are very abundant and show a broad distribution range from Mauritius to Norway, including the Azores and the Mediterranean (Davenport and Sayer, 1986; Stefanni et al., 2006; Lima et al., 2008; Ferreira et al., 2009). The mobile phase of the species is during the peri- od of larval recruitment; after they settle on a certain rocky coast, where they remain. For this reason, they are considered good indicators of local environmental conditions, and thus, useful as sentinel species in ecotox- icological studies (e.g. Lima et al., 2008; Solé et al., 2008; Ferreira et al., 2009). The excretion of nitrogenous compounds is strongly dependent on the environment occupied. As aquatic animals, teleost fishes are essentially ammonotelic, in that they excrete their nitrogenous wastes primarily as ammonia, which is the fastest and metabolically easiest, i.e., the “least expensive” way to get rid of nitrogenous waste (Evans et al., 2005; Sayer, 2005; Weihrauch et al., 2009; Chew and Ip, in press). In teleosts in general, 80 to 90% of the ammonia produced is excreted through the gills (Evans et al., 2005; Weihrauch et al., 2009; Wright and Wood, 2009). Ammonia can be excreted either as non- ionized NH 3 (g) or as the ammonium ion (NH 4 + ), through: 1) diffusion of NH 3 through the recently-discovered Rhesus (Rh) glycoprotein am- monia channels, 2) paracellular diffusion of NH 4 + , 3) apical exchange of Na + /NH 4 + , 4) apical exchange of H + /NH 4 + , and 5) NH 4 + substituting K + through the basolateral Na + /K + -ATPase and/or Na + :K + :2Cl − (Randall and Ip, 2006; Weihrauch et al., 2009; Wright and Wood, 2009). Moreover, previous studies with L. pholis have reported that up to 47% of the ammonia could be excreted through the skin, especially during emersion, when the branchial function is obviously reduced (Davenport and Sayer, 1986; Sayer and Davenport, 1987a). In addi- tion, some other species of amphibious fishes, when out of the water, convert ammonia to other less toxic nitrogenous compounds, like urea and glutamine, which can be either excreted or accumulat- ed (e.g. Saha and Ratha, 1998; Sayer, 2005; Chew and Ip, in press) Comparative Biochemistry and Physiology, Part A 167 (2014) 15–24 ⁎ Corresponding author at: Centro Interdisciplinar de Investigação Marinha e Ambiental (CIIMAR), Rua dos Bragas 289, Porto 4050-123, Portugal. Tel.: +351 22 340 1809; fax: +351 22 339 0608. E-mail address: [email protected] (J.M. Wilson). 1095-6433/$ – see front matter © 2013 Elsevier Inc. All rights reserved. http://dx.doi.org/10.1016/j.cbpa.2013.09.009 Contents lists available at ScienceDirect Comparative Biochemistry and Physiology, Part A journal homepage: www.elsevier.com/locate/cbpa

Welcome message from author
This document is posted to help you gain knowledge. Please leave a comment to let me know what you think about it! Share it to your friends and learn new things together.
Transcript
Comparative Biochemistry and Physiology, Part A 167 (2014) 15–24
Contents lists available at ScienceDirect
Comparative Biochemistry and Physiology, Part A
j ourna l homepage: www.e lsev ie r .com/ locate /cbpa
Ammonia excretion and expression of transport proteins in the gills andskin of the intertidal fish Lipophrys pholis
Luciana R. Souza-Bastos a, Maria Inês Páscoa b, Carolina A. Freire a, Jonathan M. Wilson b,⁎a Departamento de Fisiologia, Setor de Ciências Biológicas, Universidade Federal do Paraná, Curitiba, Paraná, Brazilb Centro Interdisciplinar de Investigação Marinha e Ambiental (CIIMAR), Universidade do Porto, Porto, Portugal
⁎ Corresponding author at: Centro Interdisciplinar de In(CIIMAR), Rua dos Bragas 289, Porto 4050-123, Portufax: +351 22 339 0608.
E-mail address: [email protected] (J.M. Wil
1095-6433/$ – see front matter © 2013 Elsevier Inc. All rihttp://dx.doi.org/10.1016/j.cbpa.2013.09.009
a b s t r a c t
a r t i c l e i n f oArticle history:Received 8 August 2013Received in revised form 11 September 2013Accepted 12 September 2013Available online 18 September 2013
Keywords:Ammonia excretionIntertidal fishNa+/K+-ATPaseRhesus glycoproteinNa+/H+-exchangerCarbonic anhydraseNa+:K+:2Cl− cotransporter
Intertidal pools are intensely challenging environments, due to rapid and extreme fluctuations in waterconditions during the tidal cycle. Emersion is another challenge intertidal fishes may face. Mechanismsof ammonia excretion and ion regulation were studied in the resident amphibious blennid Lipophrys pholis.The ammonia transporters Rhcg1 and Rhcg2 were cloned and characterized. Fish were challenged for 24 hto 1) emersion, 2) fresh water (FW), and 3) high environmental ammonia (HEA; 1 mM NH4Cl), or 4) am-monia loading (1.5 μmol/g NH4HCO3). When air exposed, L. pholis maintained aquatic ammonia excretionrates (JAmm) while branchial Na+/K+-ATPase (NKA) activity increased, but no changes at the protein ormRNA levels of transporters were noted. In FW, JAmm decreased and osmotic problems were encountered.Skin NKA activity decreased, branchial Rhcg2, and skin Rhcg1 and Rhcg2 increased. Exposure to HEA onlyincreased branchial Rhcg2 levels. Although internal ammonia loading only led to a modest non-significantincrease in JAmm, skinNKA (activity andα-subunit), carbonic anhydrase protein levels, and branchial Rhcg1 levelsincreased. In summary, variable responses were observed involving both gill and skin but given the instability ofits habitat, the constitutive expression of transporters is likely also of importance.
© 2013 Elsevier Inc. All rights reserved.
1. Introduction
Intertidal fishes endure rapid environmental changes in salinity,dissolved oxygen, pH, and temperature of the water resulting fromtidal cycles (e.g. Bridges, 1988; Martin, 1995; Sayer, 2005). In addi-tion, some intertidal fish display an amphibious habit, intentionallyexposing themselves to the air. These fish may remain exposed tothe air for hours or even days in the field (Graham, 1973; Martin,1995; Graham, 1997; Sayer, 2005). This habit is present in severalspecies of the Blenniidae (Order Perciformes, Sub-order Blennioidei)(Graham, 1973, 1997).
The blennid Lipophrys (=Blennius) pholis (Linnaeus, 1758) inhabitsrocky crevices or intertidal pools and is able to tolerate up to 5 days ofemersion in highly humid environment (Davenport and Vahl, 1979;Davenport and Sayer, 1986; Martin, 1995; Graham, 1997). Theseblennids are very abundant and show a broad distribution range fromMauritius to Norway, including the Azores and the Mediterranean(Davenport and Sayer, 1986; Stefanni et al., 2006; Lima et al., 2008;Ferreira et al., 2009). The mobile phase of the species is during the peri-od of larval recruitment; after they settle on a certain rocky coast, wherethey remain. For this reason, they are considered good indicators of local
vestigaçãoMarinha e Ambientalgal. Tel.: +351 22 340 1809;
son).
ghts reserved.
environmental conditions, and thus, useful as sentinel species in ecotox-icological studies (e.g. Lima et al., 2008; Solé et al., 2008; Ferreira et al.,2009).
The excretion of nitrogenous compounds is strongly dependenton the environment occupied. As aquatic animals, teleost fishes areessentially ammonotelic, in that they excrete their nitrogenouswastes primarily as ammonia, which is the fastest and metabolicallyeasiest, i.e., the “least expensive”way to get rid of nitrogenous waste(Evans et al., 2005; Sayer, 2005;Weihrauch et al., 2009; Chew and Ip,in press). In teleosts in general, 80 to 90% of the ammonia produced isexcreted through the gills (Evans et al., 2005;Weihrauch et al., 2009;Wright and Wood, 2009). Ammonia can be excreted either as non-ionized NH3(g) or as the ammonium ion (NH4
+), through: 1) diffusionof NH3 through the recently-discovered Rhesus (Rh) glycoprotein am-monia channels, 2) paracellular diffusion of NH4
+, 3) apical exchangeof Na+/NH4
+, 4) apical exchange of H+/NH4+, and 5) NH4
+ substitutingK+ through the basolateral Na+/K+-ATPase and/or Na+:K+:2Cl−
(Randall and Ip, 2006;Weihrauch et al., 2009;Wright andWood, 2009).Moreover, previous studies with L. pholis have reported that up to
47% of the ammonia could be excreted through the skin, especiallyduring emersion, when the branchial function is obviously reduced(Davenport and Sayer, 1986; Sayer and Davenport, 1987a). In addi-tion, some other species of amphibious fishes, when out of thewater, convert ammonia to other less toxic nitrogenous compounds,like urea and glutamine, which can be either excreted or accumulat-ed (e.g. Saha and Ratha, 1998; Sayer, 2005; Chew and Ip, in press)
Table 1Values of pH (mean ± SEM, n = 6) measured in the water used in the 24 h-experiments with L. pholis. Experiments: air exposure (AE), freshwater exposure (FW), exposure to highenvironmental ammonia (HEA), or injected (INJ) with NaCl (sham control; CT-INJ) or ammonia (NH4HCO3; AM-INJ). CT = controls.
pH values measured in the experimental water
Air exposure Exposure to FW or HEA Injection
CT AE CT FW HEA CT-INJ (NaCl) AM-INJ (NH4HCO3)
EXP water 8.03 ± 0.01 7.72 ± 0.05 7.90 ± 0.02 7.78 ± 0.02 7.85 ± 0.03 7.85 ± 0.03 7.85 ± 0.02AcidTrap – 1.00 ± 0.003 – – – – –
16 L.R. Souza-Bastos et al. / Comparative Biochemistry and Physiology, Part A 167 (2014) 15–24
although the importance of ureotely is more limited than previouslythought (Chew and Ip, in press), and does not include L. pholis (Sayerand Davenport, 1987a).
Thus, for amphibious fishes in general, and L. pholis in particular,there is still an incomplete picture of the mechanisms of ammonia ex-cretion, and ion regulation, especially under situations simulating theirintertidal habit. This study aimed at identifying the molecular mecha-nisms involved and the relative roles of the gills and skin in ammoniaelimination. To this end, two ammonia transporters, Rhcg1 and Rhcg2,were cloned and characterized. The response of L. pholis challenged for24 h with emersion, fresh water, HEA, or ammonia loading was thenexamined. Ammonia fluxes, ATPase activity measurements and theprotein level expression of a number of transporters was measuredby immunoblotting as well as transcript levels of Rhcg1 and Rhcg2.Immunohistochemistry was used to complement some of thosefindings.
2. Material and methods
2.1. Animals and laboratory maintenance
Lipophrys pholis (Actinopterygii, Perciformes, Blenniidae) (n = 41;11.05 ± 1.83 g; 9.6 ± 0.5 cm) were obtained along the rocky coastsof Matosinhos beach in the city of Porto, Portugal, through hand collec-tion using small nets, in March and April 2010. Fishes were transportedto the Centro Interdisciplinar de Investigação Marinha e Ambiental(CIIMAR) of the University of Porto, in 30 L containers, with waterfrom the sampling site (~20 min). In CIIMAR, fish were taken to theAquatic Animal Facility (BOGA), where they were held in 1000 L tankscontaining seawater (33‰), under constant aeration and biologicalfiltration. Air and water temperature were kept at 16 °C through airconditioning. The acclimation stock tank had 50% of its volume re-placed weekly. Animals were fed on alternate days with mussels(Mytilus edulis). However, animals were fasted 24 h prior to thestart of experiments.
2.2. Experiments
The experimental design used for the three types of experimentsfollowed a similar pre-exposure procedure. Fish to be used in the
Table 2Bodymass (g),musclewater content (%), andmuscle levels of sodiumand potassium(μmol/gw(AE), fresh water (FW), high environmental ammonia (HEA) and NH4HCO3 injection (AM-INJ)
Experiments
Air exposure Exposure to FW o
CT AE CT
Mass (g) Before 9.1 ± 0.8a 9.6 ± 1.5a 3.0 ± 0.4a
After 9.1 ± 0.8a 8.4 ± 1.5a,⁎ 3.0 ± 0.4a
Muscle water (%) 80.4 ± 0.4 79.5 ± 0.2 81.6 ± 0.4Sodium (μmol/g) 15.3 ± 1.9 16.7 ± 2.0 16.4 ± 2.2Potassium (μmol/g) 51.7 ± 6.3 58 ± 5.8 40.7 ± 5.8
Lower case letters indicate differences between the experimental groups, within a certain experexception of the condition CT-INJ where “n” was 5.⁎ Indicate that the weight of the fish after the 24 h experiment is different from the weight# Indicates that the experimental value is different from its respective control.
experiments were removed from the stock tank and placed in 30 Laquaria. In these aquaria fish were no longer fed for 24 h. After this pe-riod, they were weighed, and individually distributed to twelve 1 Laquaria containing 1 L of seawater under constant aeration, wherethey remained for another 24 h to acclimate.
2.2.1. Air exposure experimentsAfter the acclimation period, the seawater of the control fish was re-
placedwith 1 L of fresh seawater (CT, n = 6), and the experimentalfishwere individually transferred from the pre-exposure aquaria to sealedcontainers (500 mL) where they were exposed to air (AE, n = 6). Hu-midified air was passed through the fish containers with the exitingair passing through an acid trap in order to collect any volatilized NH3
(g) produced by the fish. This exiting air was first passed through an al-kaline solution (0.1 NKOH) for CO2 removal, and then through 30 mL of0.1 N HCl to trap NH3 as NH4
+. The pH and ammonia levels were deter-mined in the acid solution after 24 h (Table 1). At this time, the air-exposed fish were rinsed with 50 mL of seawater. This rinse waterwas then used for the determination of pH and ammonia concentra-tions. From the control fish aquaria, 2 mL water samples were also col-lected after 24 h for pH and total ammonia determination. Tissues weresampled as described below.
2.2.2. Experiment of freshwater and ammonia exposureIn this series of experiments, after the acclimation period, water
in the individual aquaria was replaced with either: 1 L of seawater(control in 33‰, CT, n = 6), 1 L of fresh water [dechlorinated Oportocity tap water (0.5 mM Na+, hardness of 50 mg/L HCO3
−, pH 8), FWEXP, n = 5], or 1 L of 1 mM NH4Cl in seawater (high environmentalammonia, HEA EXP, n = 6). Fish were exposed to these conditionsfor 24 h for ammonia flux determination and terminal samplingfollowed.
2.2.3. Ammonia loading experimentAfter the acclimation period, fish were individually anesthetized
with MS-222 (Aquapharm, UK 1:10,000) and injected (intraperitoneal-ly) with 5 μL per g wet mass of either 0.3 M NaCl (CT-INJ, n = 5) or0.3 M NH4HCO3 (AM-INJ, n = 6). Each fish was then returned to itsaquarium, now with new seawater. Ammonia flux measurementswere conducted over 24 h followed by terminal tissue sampling. The
etmass) of L. pholis exposed to thedifferent experimental conditions for 24 h [air exposure].
r HEA Injection
FW HEA CT-INJ (NaCl) AM-INJ (NH4HCO3)
3.3 ± 0.07a 4.2 ± 0.5b 21.5 ± 5.5a 28.5 ± 6.5a
3.7 ± 0.1a,⁎ 4.2 ± 0.5b 21.4 ± 5.4a 28.4 ± 6.5a
84.7 ± 0.5# 82.1 ± 0.4 80.5 ± 0.9 79.8 ± 0.69.5 ± 0.3# 15.8 ± 1.6 27.2 ± 3.0 31.4 ± 2.5
38.1 ± 1.4 41.5 ± 6.9 85.1 ± 9.9 103.2 ± 10.9
iment, either before or after the experiment. The experimentwas always “n = 6”, with the
before the experiment.
17L.R. Souza-Bastos et al. / Comparative Biochemistry and Physiology, Part A 167 (2014) 15–24
exposure period was counted after their full recovery from the anesthe-sia, which took around 10 min.
In all three experiments, aquariumwater was sampled (2 mL) at thestart of each experiment and after the 24 h of exposure to the experi-mental conditions. These samples were all assayed for pH and ammonialevels (Table 1).
2.3. Tissue sampling
After all 24-h experiments, fish were anesthetized (MS 222Aquapharm, 1:10,000) and weighed (Table 2). Animals were thenkilled through spinal transection, followed by sampling of thebranchial arches, epaxial white muscle, and ventral skin. Left sidebranchial arches, and skin samples were placed in tubes and imme-diately frozen in liquid nitrogen, and then stored in an ultra freezer(−80 °C) for later enzymatic (ATPase), protein (Western blotting)and transcript (PCR) expression analysis. In addition, right sidebranchial arches and pieces of ventral skin with muscle werefixed in 3% paraformaldehyde in phosphate buffered saline for24 h at 4 °C for immunocytochemical analysis.
2.4. Sample analyses
2.4.1. Assays in the water
2.4.1.1. Ammonia. Total ammonia nitrogen (TAN) levels were assayedaccording to the protocol of Verdouw et al. (1978). Samples were readat 650 nm (Powerwave 340, Bio-Tek, Finland) immediately after the1 h period of incubation in the dark, at room temperature. Net ammoniaflux rates are expressed as μmol TAN/kg/h.
2.4.2. Assays in tissues
2.4.2.1. Muscle water and ion contents. Water content (%) was deter-mined inmuscle slices of 0.22 ± 0.01 g, n = 40. Tissue wasweighed(wet mass) in 5 mL pre-weighed glass vials (Mettler Toledo,Germany) and then dehydrated for 8 d at 60 °C, ensuring completestabilization of the dry mass of the samples. The difference in tissuemass represents the water content that is expressed as the percent-age of the initial wet mass of the sample (Table 2).
Muscle sodium and potassium concentrationswere assayed in driedmuscle pieces dissolved in 1 mL concentrated nitric acid through flamephotometry (PFP7, Jenway, UK). Samples were diluted 1:50 and 1:100,respectively. Ion levels are expressed as μEq/g wet mass (Table 2).
2.4.2.2. Tissue homogenization. A portion of the left side branchial arches,and ventral skin pieces were homogenized by sonication at 40% intensi-ty, for 10 s (Ultrasonic Processor VC 130, Sonic and Materials Inc., USA)in SEI buffer (150 mM sucrose, 10 mM EDTA, 50 mM imidazole buffer,pH 7.5), centrifuged (12,000 g for 8 min at 4 °C) and the supernatantused for the measurement of specific activity of the Na+/K+-ATPase(NKA), total protein content determination and Western blotting.
2.4.2.3. Specific activity of the Na+/K+-ATPase. The supernatant of the ho-mogenates of gills and skinwas used for the assay of the specific activityof the NKA, according to the protocol established and described inMcCormick (1993). Ouabain sensitive activity is expressed as μmolADP/mg protein/h.
2.4.2.4. Total protein content. Protein content of tissue homogenates wasdetermined according to Bradford (1976), using a BSA (bovine serumalbumin) standard in microplates read at 600 nm (Powerwave 340).
2.4.2.5. Protein expression—Western blotting. The expression of ammo-nia and ion transport-related proteins was determined throughWestern blotting, in gills and skin of L. pholis. Polyacrylamide gel
electrophoresis was performed under denaturing conditions (sodi-um dodecyl sulfate—SDS-PAGE) using step gradient gels (4% stack-ing, 10% resolving). Aliquots of 250 μL of the supernatants of tissuehomogenates were mixed with 250 μL of 2× Laemmli's reagent(0.125 M Tris–HCl, 20% glycerol, 4% SDS, 0.01% bromophenol blue,0.1 M dithiothreitol). Samples were then heated for 15 min at70 °C and then stored at 4 °C. Protein concentrations of the superna-tants were determined (above) and the final protein concentrationof the samples in Laemmli's reagent were diluted to 1 μg protein/μL.An aliquot of these samples containing 20 μg (gills) or 40 μg (skin)of total protein were separated by SDS-PAGE run (1 h in bufferTris-glycine + SDS, pH 9.2) under a constant voltage of 150 V(BioRad Mini Protean III, USA). Immediately after the run, proteinswere transferred to PVDF membranes (Amersham Hybond™-P, GEHealthcare, Portugal) during 1 h in Tris-glycine plus 0.075% SDSunder a constant voltage of 100 V (Hoefer TE22 transfer cell andEPS 2A200 power supply, GE Healthcare). After the transfer, mem-branes were dried for 1 h at 37 °C (Memmert, Germany).
Prior to probing, membranes were rehydrated and then blocked inTTBS (10 mM Tris–HCl, 500 mM NaCl, 0.05% Tween-20, pH 7.5) con-taining 5% skim milk powder for 1 h, and then immediately incubatedwith the primary antibodies diluted in 1% BSA/TTBS/0.05% sodiumazide, overnight at room temperature. Antibodies used were: rabbitanti-Fugu Rhesus glycoprotein polyclonals (Rhcg2 and Rhag, diluted1:500, Nakada et al., 2007a), rabbit anti-Na+/K+-ATPase α subunitaffinity purified polyclonal (αR1, 1:500; Wilson et al., 2007), mouseanti-Na+:K+:2Cl− cotransporter (NKCC) monoclonal (clone T4, 1:500;Lytle et al., 1995), rabbit anti-carbonic anhydrase (CA) polyclonal(1:500 for detection in skin and 1:5000 in gills; Abcam, UK), rabbitanti-sodium/proton exchangers 2 and 3 (NHE2 and NHE3, respectively)polyclonals (1:500; Ivanis et al., 2008), mouse anti-proliferating cell nu-clear antigen (PCNA) monoclonal (1:500; Santa Cruz Biotechnology,Germany), andmouse anti-actinmonoclonal (1:500, used as a referenceprotein; Sigma-Aldrich, USA).
Membranes were then washed for 5, 10, and 15 min in TTBSbuffer, and then incubated with the secondary goat anti-mouse orgoat anti-rabbit antibodies conjugated to horseradish peroxidase,depending on the species in which the primary antibody was pro-duced, diluted 1:50,000 in TTBS buffer for 1 h in room temperature.Membranes were again washed with TTBS, and the immunoreactivebands were detected through chemiluminescence (ImmobilonWestern Chemiluminescent HRP Substrate, Millipore, USA), withdigital image capture (Fujifilm LAS 4000mini; Fujifilm, Japan) andquantification using the analysis software SigmaScan Pro 5 (SPSS,USA).
2.4.2.6. Immunocytochemical detection of transport proteins. The protocolemployed was that described byWilson et al. (2007). The fixed gill andskin tissuewasprocessed for paraffin embedding, sectioned (5 μm), andcollected onto glass slides coated with 3-aminopropyltriethoxysilane(APS; Sigma-Aldrich). Sections were air dried, dewaxed, rehydratedand pre-treated with citraconic anhydride (0.05%) for 30 min(Namimatsu et al., 2005). Slides were then blocked with 5% normalgoat serum + 1% BSA in TPBS (0.05% Tween-20 in PBS) for 20 min atroom temperature, in humidity chambers. Slides were then incubatedwith primary antibodies diluted in 1% BSA/TPBS raised against Rhesusproteins (zfRhcg1-740, diluted 1:200 Nakada et al., 2007b), NKA αsubunit (α5, 1:100; Takeyasu et al., 1988), CFTR chloride channel(1:200; R&D Systems, USA), NKA α subunit (αR1, 1:500) in humiditychambers overnight at 4 °C. After incubation, slides were washed withTPBS for 5, 10, and 15 min, and then incubated with the secondary anti-body anti-mouse IgG (Alexa Fluor 568; Life Technologies, UK), and anti-rabbit IgG (Alexa Fluor 488; Life Technologies) diluted (1:500) in 1%BSA/TPBS, for 1 h at 37 °C in humidity chambers. Slides were then washedwith TPBS as before, except that this second wash buffer containedDAPI (4′,6-diamidino-2-phenylindole; Sigma-Aldrich), for nuclei
18 L.R. Souza-Bastos et al. / Comparative Biochemistry and Physiology, Part A 167 (2014) 15–24
staining. Coverslips were mounted with aqueous mounting media andsections observed and photographed with an epifluorescence micro-scope (DM6000B, Leica, Germany).
2.4.3. Rhcg characterization and transcript levels
2.4.3.1. Total RNA isolation and cDNA synthesis. For RNA extraction, gilland skin from all the experiments were collected and flash frozen inRNase-free 1.5 mL tubes. Gill and skin samples (~20 mg) were homog-enized in 700 μL of BioRad Aurum Total RNA extraction buffer with twoceramic beads for 30 s at 6800 rpm using a Precellys 24 homogenizer(Bertin, France). Total RNA from the individual samples were extractedusing the Aurum Total RNA Mini Kit (BioRad), following themanufacturer's protocol including on-column DNase I treatment tominimize genomic DNA contamination. After extraction, the final con-centration and the quality of the total RNA was assessed by NanoDropND-1000 spectrophotometer (Thermo Scientific, USA) and 1.2%formaldehyde-agarose gel electrophoresis, respectively, and stored at−80 °C until further use.
The cDNA for all experiments was synthesized from 1 μg of totalRNA (20 μL final volume) using iScript cDNA Synthesis Kit (BioRad),following the manufacturer's recommendations. Reverse transcriptionwas conducted using iScript reverse transcriptase and the followingprogram in MJ Mini Personal Thermocycler (BioRad) was applied:25 °C for 5 min; 42 °C for 30 min and 85 °C for 5 min.
2.4.3.2. Gene isolation. Partial sequences of Rhcg/Slc42a3were obtained byPCR using consensus primers designed from conserved regions of Slc42a3(Danio rerio, Fugu rubripes, Onchorhynchus mykiss, Tetraodon nigroviridis;fwd 5′-GCACACTGTTCCTGTGGATG-3′; rev 5′-CAGCAGGATCTCCCCAGA-3′). PCR was performed with 1 μL of sample cDNA with Phusion Flashmaster mix in a 20 μL reaction volume (Thermo Scientific) under the fol-lowing conditions: 98 °C 10 s denaturation step followed by 40 cycles of98 °C 1 s; 56 °C 5 s; and 72 °C 15 s. A single band was retrieved from 1%agarose gels in TBE (Tris–borate–EDTA) buffer using GFX column kit (GEHealthcare). Following an a-tailing reaction, the PCR product was clonedinto pGEM®-T Easy vector (Promega, USA) using JM109 competent cellsand blue/white screening. Selected white colonies were grown over-night in LB broth with ampicillin. The plasmids were extractedusing sv wizard DNAminipreps (Promega) and insert size confirmedby EcoR1 digest and agarose gel electrophoresis. Clones were se-quenced bidirectionally (StabVida, Portugal). The tBlastx analysisidentified a single PCR product as an Rhcg1 orthologue.
Specific primers were designed to obtain the complete cDNA se-quence of thepartial sequenceusing 5′ and 3′RACE (Rapid Amplification
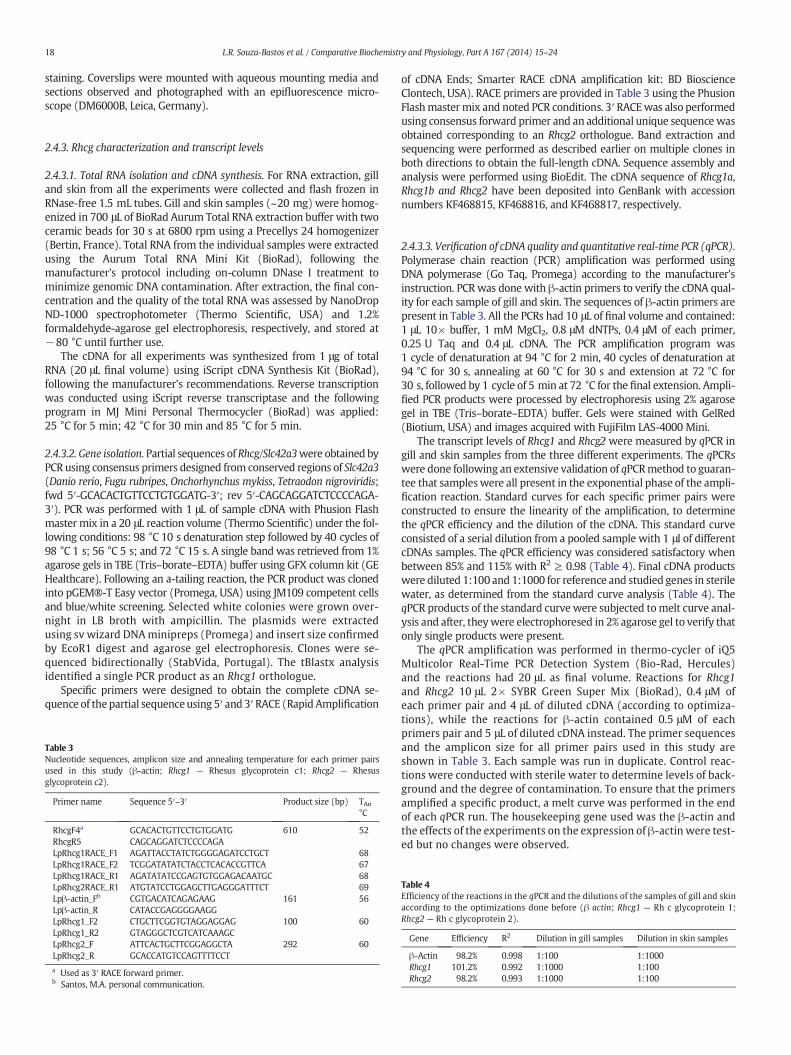
Table 3Nucleotide sequences, amplicon size and annealing temperature for each primer pairsused in this study (β-actin; Rhcg1 — Rhesus glycoprotein c1; Rhcg2 — Rhesusglycoprotein c2).
Primer name Sequence 5′–3′ Product size (bp) TAn°C
RhcgF4a GCACACTGTTCCTGTGGATG 610 52RhcgR5 CAGCAGGATCTCCCCAGALpRhcg1RACE_F1 AGATTACCTATCTGGGGAGATCCTGCT 68LpRhcg1RACE_F2 TCGGATATATCTACCTCACACCGTTCA 67LpRhcg1RACE_R1 AGATATATCCGAGTGTGGAGACAATGC 68LpRhcg2RACE_R1 ATGTATCCTGGAGCTTGAGGGATTTCT 69Lpβ-actin_Fb CGTGACATCAGAGAAG 161 56Lpβ-actin_R CATACCGAGGGGAAGGLpRhcg1_F2 CTGCTTCGGTGTAGGAGGAG 100 60LpRhcg1_R2 GTAGGGCTCGTCATCAAAGCLpRhcg2_F ATTCACTGCTTCGGAGGCTA 292 60LpRhcg2_R GCACCATGTCCAGTTTTCCT
a Used as 3′ RACE forward primer.b Santos, M.A. personal communication.
of cDNA Ends; Smarter RACE cDNA amplification kit: BD BioscienceClontech, USA). RACE primers are provided in Table 3 using the PhusionFlashmastermix and noted PCR conditions. 3′ RACEwas also performedusing consensus forward primer and an additional unique sequencewasobtained corresponding to an Rhcg2 orthologue. Band extraction andsequencing were performed as described earlier on multiple clones inboth directions to obtain the full-length cDNA. Sequence assembly andanalysis were performed using BioEdit. The cDNA sequence of Rhcg1a,Rhcg1b and Rhcg2 have been deposited into GenBank with accessionnumbers KF468815, KF468816, and KF468817, respectively.
2.4.3.3. Verification of cDNA quality and quantitative real-time PCR (qPCR).Polymerase chain reaction (PCR) amplification was performed usingDNA polymerase (Go Taq, Promega) according to the manufacturer'sinstruction. PCR was done with β-actin primers to verify the cDNA qual-ity for each sample of gill and skin. The sequences of β-actin primers arepresent in Table 3. All the PCRs had 10 μL of final volume and contained:1 μL 10× buffer, 1 mM MgCl2, 0.8 μM dNTPs, 0.4 μM of each primer,0.25 U Taq and 0.4 μL cDNA. The PCR amplification program was1 cycle of denaturation at 94 °C for 2 min, 40 cycles of denaturation at94 °C for 30 s, annealing at 60 °C for 30 s and extension at 72 °C for30 s, followed by 1 cycle of 5 min at 72 °C for the final extension. Ampli-fied PCR products were processed by electrophoresis using 2% agarosegel in TBE (Tris–borate–EDTA) buffer. Gels were stained with GelRed(Biotium, USA) and images acquired with FujiFilm LAS-4000 Mini.
The transcript levels of Rhcg1 and Rhcg2 were measured by qPCR ingill and skin samples from the three different experiments. The qPCRswere done following an extensive validation of qPCRmethod to guaran-tee that sampleswere all present in the exponential phase of the ampli-fication reaction. Standard curves for each specific primer pairs wereconstructed to ensure the linearity of the amplification, to determinethe qPCR efficiency and the dilution of the cDNA. This standard curveconsisted of a serial dilution from a pooled sample with 1 μl of differentcDNAs samples. The qPCR efficiency was considered satisfactory whenbetween 85% and 115% with R2 ≥ 0.98 (Table 4). Final cDNA productswere diluted 1:100 and 1:1000 for reference and studied genes in sterilewater, as determined from the standard curve analysis (Table 4). TheqPCR products of the standard curve were subjected tomelt curve anal-ysis and after, theywere electrophoresed in 2% agarose gel to verify thatonly single products were present.
The qPCR amplification was performed in thermo-cycler of iQ5Multicolor Real-Time PCR Detection System (Bio-Rad, Hercules)and the reactions had 20 μL as final volume. Reactions for Rhcg1and Rhcg2 10 μL 2× SYBR Green Super Mix (BioRad), 0.4 μM ofeach primer pair and 4 μL of diluted cDNA (according to optimiza-tions), while the reactions for β-actin contained 0.5 μM of eachprimers pair and 5 μL of diluted cDNA instead. The primer sequencesand the amplicon size for all primer pairs used in this study areshown in Table 3. Each sample was run in duplicate. Control reac-tions were conducted with sterile water to determine levels of back-ground and the degree of contamination. To ensure that the primersamplified a specific product, a melt curve was performed in the endof each qPCR run. The housekeeping gene used was the β-actin andthe effects of the experiments on the expression of β-actin were test-ed but no changes were observed.
Table 4Efficiency of the reactions in the qPCR and the dilutions of the samples of gill and skinaccording to the optimizations done before (β actin; Rhcg1 — Rh c glycoprotein 1;Rhcg2 — Rh c glycoprotein 2).
Gene Efficiency R2 Dilution in gill samples Dilution in skin samples
β-Actin 98.2% 0.998 1:100 1:1000Rhcg1 101.2% 0.992 1:1000 1:100Rhcg2 98.2% 0.993 1:1000 1:100
0
2
4
6
8
Na+
/K+-A
TP
ase
Spe
cific
Act
ivity
(µm
ol/m
g/h)
0
2
4
6
8
Gills
Skin
AIREXP
0
2
4
6
8
A
B
C
FWEXP
CTSW
NH3
EXP
NH3
INJNaClINJ
CTSW
cb
aa
ccc
ab b
c c
ba
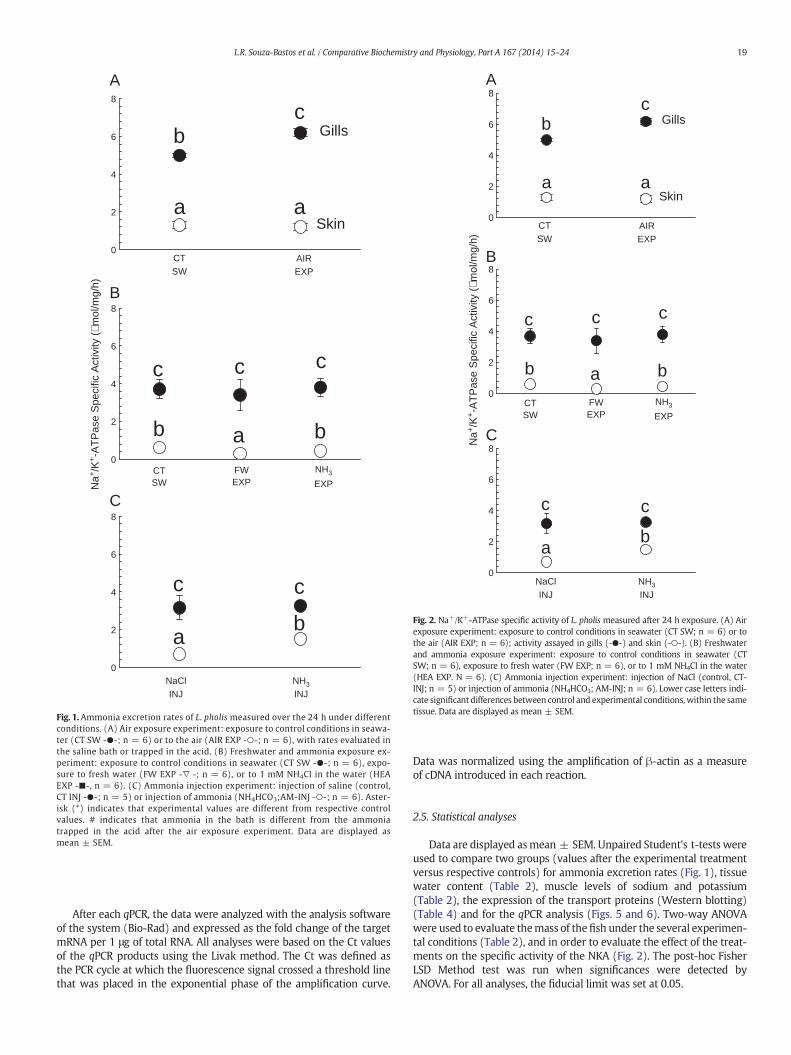
Fig. 1.Ammonia excretion rates of L. pholis measured over the 24 h under differentconditions. (A) Air exposure experiment: exposure to control conditions in seawa-ter (CT SW -●-; n = 6) or to the air (AIR EXP -○-; n = 6), with rates evaluated inthe saline bath or trapped in the acid. (B) Freshwater and ammonia exposure ex-periment: exposure to control conditions in seawater (CT SW -●-; n = 6), expo-sure to fresh water (FW EXP -∇ -; n = 6), or to 1 mM NH4Cl in the water (HEAEXP -■-, n = 6). (C) Ammonia injection experiment: injection of saline (control,CT INJ -●-; n = 5) or injection of ammonia (NH4HCO3;AM-INJ -○-; n = 6). Aster-isk (*) indicates that experimental values are different from respective controlvalues. # indicates that ammonia in the bath is different from the ammoniatrapped in the acid after the air exposure experiment. Data are displayed asmean ± SEM.
0
2
4
6
8
0
2
4
6
8
Gills
Skin
0
2
4
6
8
A
B
C
cb
aa
ccc
ab b
c c
ba
Na+
/K+-A
TP
ase
Spe
cific
Act
ivity
(µm
ol/m
g/h)
AIREXP
FWEXP
CTSW
NH3
EXP
NH3
INJNaClINJ
CTSW
Fig. 2. Na+/K+-ATPase specific activity of L. pholis measured after 24 h exposure. (A) Airexposure experiment: exposure to control conditions in seawater (CT SW; n = 6) or tothe air (AIR EXP; n = 6); activity assayed in gills (-●-) and skin (-○-). (B) Freshwaterand ammonia exposure experiment: exposure to control conditions in seawater (CTSW; n = 6), exposure to fresh water (FW EXP; n = 6), or to 1 mM NH4Cl in the water(HEA EXP. N = 6). (C) Ammonia injection experiment: injection of NaCl (control, CT-INJ; n = 5) or injection of ammonia (NH4HCO3; AM-INJ; n = 6). Lower case letters indi-cate significant differences between control and experimental conditions, within the sametissue. Data are displayed as mean ± SEM.
19L.R. Souza-Bastos et al. / Comparative Biochemistry and Physiology, Part A 167 (2014) 15–24
After each qPCR, the data were analyzed with the analysis softwareof the system (Bio-Rad) and expressed as the fold change of the targetmRNA per 1 μg of total RNA. All analyses were based on the Ct valuesof the qPCR products using the Livak method. The Ct was defined asthe PCR cycle at which the fluorescence signal crossed a threshold linethat was placed in the exponential phase of the amplification curve.
Data was normalized using the amplification of β-actin as a measureof cDNA introduced in each reaction.
2.5. Statistical analyses
Data are displayed asmean ± SEM. Unpaired Student's t-tests wereused to compare two groups (values after the experimental treatmentversus respective controls) for ammonia excretion rates (Fig. 1), tissuewater content (Table 2), muscle levels of sodium and potassium(Table 2), the expression of the transport proteins (Western blotting)(Table 4) and for the qPCR analysis (Figs. 5 and 6). Two-way ANOVAwere used to evaluate themass of thefish under the several experimen-tal conditions (Table 2), and in order to evaluate the effect of the treat-ments on the specific activity of the NKA (Fig. 2). The post-hoc FisherLSD Method test was run when significances were detected byANOVA. For all analyses, the fiducial limit was set at 0.05.
20 L.R. Souza-Bastos et al. / Comparative Biochemistry and Physiology, Part A 167 (2014) 15–24
3. Results
3.1. Ammonia excretion rates
Rates of ammonia excretionwere consistently around 250 μmol/kg/hin the air exposure experiment during both seawater parallel and serialcontrol periods, as well as during air-exposed (as measured in therinse water) (Fig. 1A). Little ammonia was volatilized into the air asdetermined by the acid trap: 0.263 ± 0.09 μmol/kg/h. In freshwater there was a decrease in the rates of ammonia excretion(83%) (Fig. 1B). No changes in ammonia excretion rates were notedin L. pholis exposed to HEA due to high data variability (Fig. 1B),and ammonia injection showed no changes (Fig. 1C).
3.2. Fish mass and muscle water and ion content
L. pholis exposed to the air lost almost 12% body mass over 24 h(Table 2). In contrast, fish exposed to fresh water gained 13% bodymass over 24 h (Table 2). Fish injected with NH4HCO3 or exposed toHEA did not show any mass changes (Table 2). Water content in themuscle of L. pholis was maintained ~80%, and did not change upon airexposure (Table 2). However, when L. pholis was submitted to freshwater, muscle gained 3.1% water. Finally, neither HEA nor ammoniainjection affected muscle water content (Table 2). Air exposure, HEAand ammonia injection did not alter muscle sodium concentrations(Table 2). However, exposure to fresh water caused a marked (42%)reduction in muscle sodium levels compared to controls. Muscle potas-sium concentrations ranged between 38.1 and 41.5 μmol/g wet massand did not differ between groups (Table 2).
3.3. Na+/K+-ATPase specific activity
Air exposure increased NKA activity in the gills of L. pholis (6.17 ±0.23 μmol ADP/mg protein/h) compared to seawater controls (5.05 ±0.14 μmol ADP/mg protein/h), with no change in the skin activity(Fig. 2A). Freshwater exposure resulted in decreased enzymatic activityin the skin (0.29 ± 0.03 μmol/mg protein/h), when compared to sea-water controls (0.61 ± 0.09 μmol/mg protein/h), but no change oc-curred in the gills. HEA resulted in no change in NKA activity (Fig. 2B).However, ammonia injection resulted in increased enzyme activity,but only in the skin: 1.46 ± 0.07 μmol/mg protein/h, when comparedto 0.74 ± 0.25 μmol/mg protein/h in the NaCl injected sham controls(Fig. 2C). Na+/K+-ATPase activity was always higher in the gills than
Table 5Intensity of theWestern Blot bands (arbitrary units) of proteins in the gills and skin of L. pholis eAIR, n = 6; fresh water— FW, n = 6 and HEA (high environmental ammonia)— NH3, n = 6;Proteins detected: Na+/H+ exchanger (NHE2 and NHE3), Rhesus glycoproteins (Rhag, Rhcganhydrase (CA) and proliferating cell nuclear antigen (PCNA). Protein expression is presentedfrom Sham control group.
Exp. Groups Tissue Proteins
NHE2 NHE3 Rhag Rh
CT Gill 1.72 ± 0.40 1.11 ± 0.22 3.81 ± 1.67 2.9Skin 2.09 ± 0.64 0.91 ± 0.38 0.26 ± 0.08 1.9
AIR Gill 1.69 ± 0.13 1.06 ± 0.14 2.59 ± 0.37 2.3Skin 2.35 ± 0.75 1.00 ± 0.26 0.42 ± 0,15 3.4
CT Gill 0.64 ± 0.29 0.76 ± 0.05 1.16 ± 0.21 1.3Skin 1.25 ± 0.41 0.88 ± 0.20 0.67 ± 0.28 0.7
FW Gill 0.31 ± 0.06 0.63 ± 0.04 0.91 ± 0.30 1.1Skin 2.07 ± 1.08 0.81 ± 0.37 1.00 ± 0.60 0.6
HEA Gill 0.53 ± 0.14 0.75 ± 0.13 1.48 ± 0.18 1.7Skin 1.98 ± 0.77 0.76 ± 0.16 0.98 ± 0.53 0.9
CT-INJ Gill 0.50 ± 0.06 0.83 ± 0.11 1.72 ± 0.21 1.4Skin 1.19 ± 0.68 0.80 ± 0.20 0.49 ± 0.14 0.7
AM-INJ Gill 0.58 ± 0.10 1.09 ± 0.15 1.93 ± 0.23 1.6Skin 1.48 ± 0.41 1.13 ± 0.32 0.84 ± 0.20 0.8
in the skin of L. pholis, both for controls and experimental fish, for allexperiments.
3.4. Protein level expression of transporters
3.4.1. Western blot detectionThe following ion transporters and related proteins were detect-
ed in crude homogenates of both gill and skin in L. pholis: NKAαsubunit, V-ATPase B subunit, Rhag, Rhcg2, NHE2, NHE3, carbonicanhydrase (CA) and PCNA. However, no changes were detected inthe protein level expression of the transporters in the gills andskin of L. pholis, upon air or freshwater exposure, or HEA (Table 5).In the skin of L. pholis, no signal for the NKCC was found, for controlsand fishes exposed to fresh water or HEA, although a band was de-tected in the other experiments. However, in the ammonia injectionexperiments, no difference was detected in the gills. In L. pholisinjected with NH4HCO3 there was an increase in the expression ofthe NKA and the CA in the skin in comparison to saline injected con-trols (Table 5).
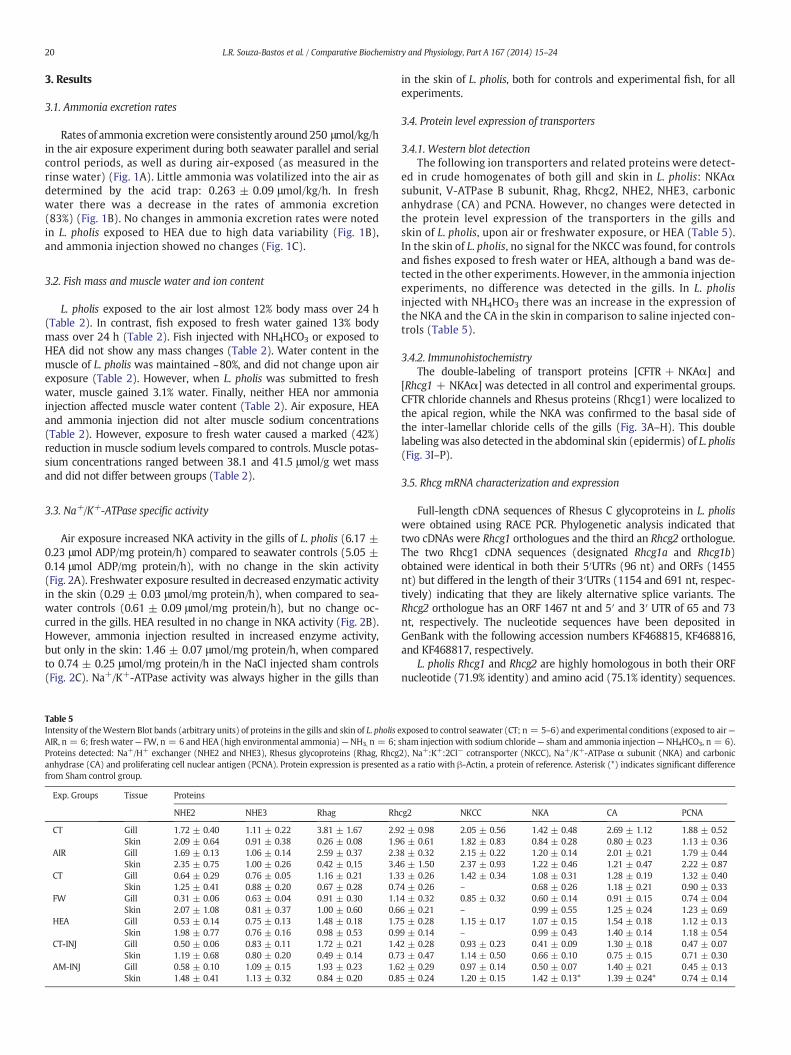
3.4.2. ImmunohistochemistryThe double-labeling of transport proteins [CFTR + NKAα] and
[Rhcg1 + NKAα] was detected in all control and experimental groups.CFTR chloride channels and Rhesus proteins (Rhcg1) were localized tothe apical region, while the NKA was confirmed to the basal side ofthe inter-lamellar chloride cells of the gills (Fig. 3A–H). This doublelabelingwas also detected in the abdominal skin (epidermis) of L. pholis(Fig. 3I–P).
3.5. Rhcg mRNA characterization and expression
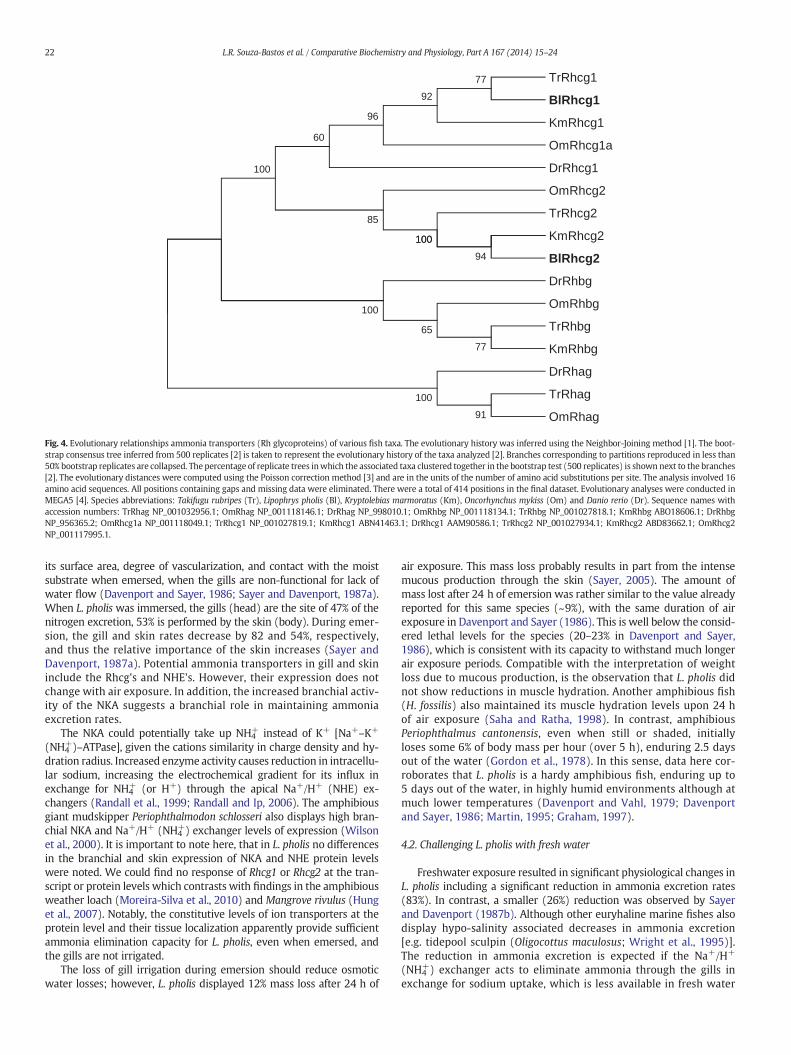
Full-length cDNA sequences of Rhesus C glycoproteins in L. pholiswere obtained using RACE PCR. Phylogenetic analysis indicated thattwo cDNAs were Rhcg1 orthologues and the third an Rhcg2 orthologue.The two Rhcg1 cDNA sequences (designated Rhcg1a and Rhcg1b)obtained were identical in both their 5′UTRs (96 nt) and ORFs (1455nt) but differed in the length of their 3′UTRs (1154 and 691 nt, respec-tively) indicating that they are likely alternative splice variants. TheRhcg2 orthologue has an ORF 1467 nt and 5′ and 3′ UTR of 65 and 73nt, respectively. The nucleotide sequences have been deposited inGenBank with the following accession numbers KF468815, KF468816,and KF468817, respectively.
L. pholis Rhcg1 and Rhcg2 are highly homologous in both their ORFnucleotide (71.9% identity) and amino acid (75.1% identity) sequences.
xposed to control seawater (CT; n = 5–6) and experimental conditions (exposed to air—sham injection with sodium chloride— sham and ammonia injection— NH4HCO3, n = 6).2), Na+:K+:2Cl− cotransporter (NKCC), Na+/K+-ATPase α subunit (NKA) and carbonicas a ratio with β-Actin, a protein of reference. Asterisk (*) indicates significant difference
cg2 NKCC NKA CA PCNA
2 ± 0.98 2.05 ± 0.56 1.42 ± 0.48 2.69 ± 1.12 1.88 ± 0.526 ± 0.61 1.82 ± 0.83 0.84 ± 0.28 0.80 ± 0.23 1.13 ± 0.368 ± 0.32 2.15 ± 0.22 1.20 ± 0.14 2.01 ± 0.21 1.79 ± 0.446 ± 1.50 2.37 ± 0.93 1.22 ± 0.46 1.21 ± 0.47 2.22 ± 0.873 ± 0.26 1.42 ± 0.34 1.08 ± 0.31 1.28 ± 0.19 1.32 ± 0.404 ± 0.26 – 0.68 ± 0.26 1.18 ± 0.21 0.90 ± 0.334 ± 0.32 0.85 ± 0.32 0.60 ± 0.14 0.91 ± 0.15 0.74 ± 0.046 ± 0.21 – 0.99 ± 0.55 1.25 ± 0.24 1.23 ± 0.695 ± 0.28 1.15 ± 0.17 1.07 ± 0.15 1.54 ± 0.18 1.12 ± 0.139 ± 0.14 – 0.99 ± 0.43 1.40 ± 0.14 1.18 ± 0.542 ± 0.28 0.93 ± 0.23 0.41 ± 0.09 1.30 ± 0.18 0.47 ± 0.073 ± 0.47 1.14 ± 0.50 0.66 ± 0.10 0.75 ± 0.15 0.71 ± 0.302 ± 0.29 0.97 ± 0.14 0.50 ± 0.07 1.40 ± 0.21 0.45 ± 0.135 ± 0.24 1.20 ± 0.15 1.42 ± 0.13* 1.39 ± 0.24* 0.74 ± 0.14
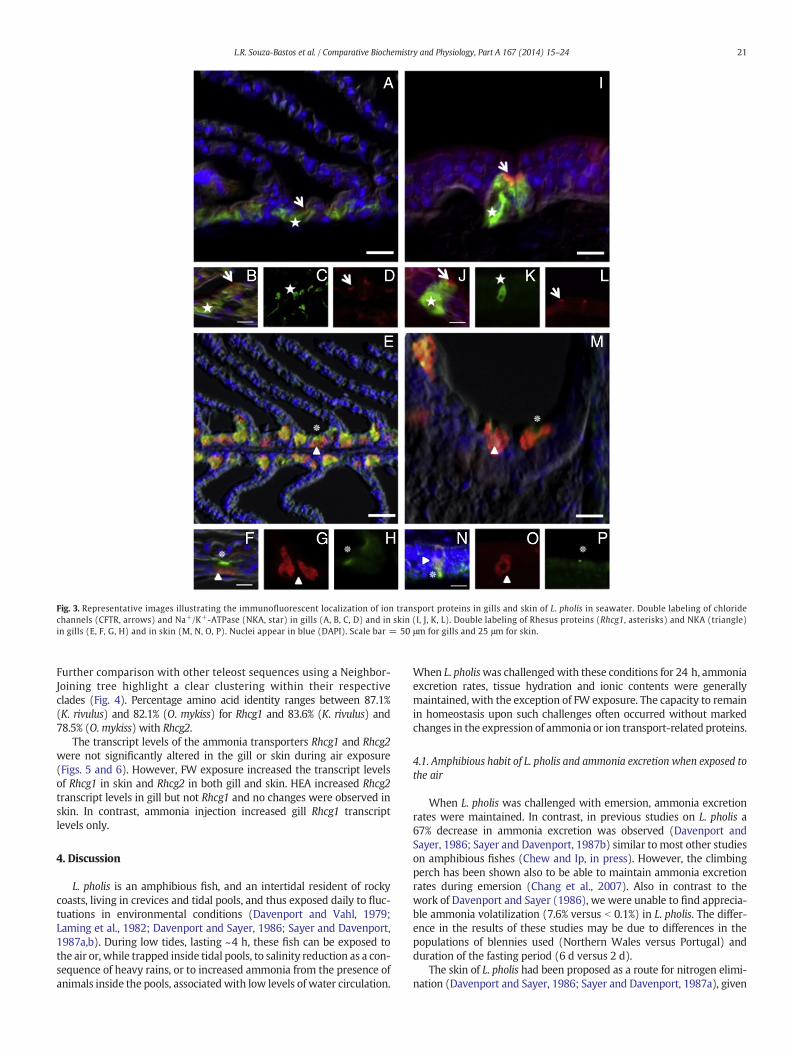
Fig. 3. Representative images illustrating the immunofluorescent localization of ion transport proteins in gills and skin of L. pholis in seawater. Double labeling of chloridechannels (CFTR, arrows) and Na+/K+-ATPase (NKA, star) in gills (A, B, C, D) and in skin (I, J, K, L). Double labeling of Rhesus proteins (Rhcg1, asterisks) and NKA (triangle)in gills (E, F, G, H) and in skin (M, N, O, P). Nuclei appear in blue (DAPI). Scale bar = 50 μm for gills and 25 μm for skin.
21L.R. Souza-Bastos et al. / Comparative Biochemistry and Physiology, Part A 167 (2014) 15–24
Further comparison with other teleost sequences using a Neighbor-Joining tree highlight a clear clustering within their respectiveclades (Fig. 4). Percentage amino acid identity ranges between 87.1%(K. rivulus) and 82.1% (O. mykiss) for Rhcg1 and 83.6% (K. rivulus) and78.5% (O.mykiss) with Rhcg2.
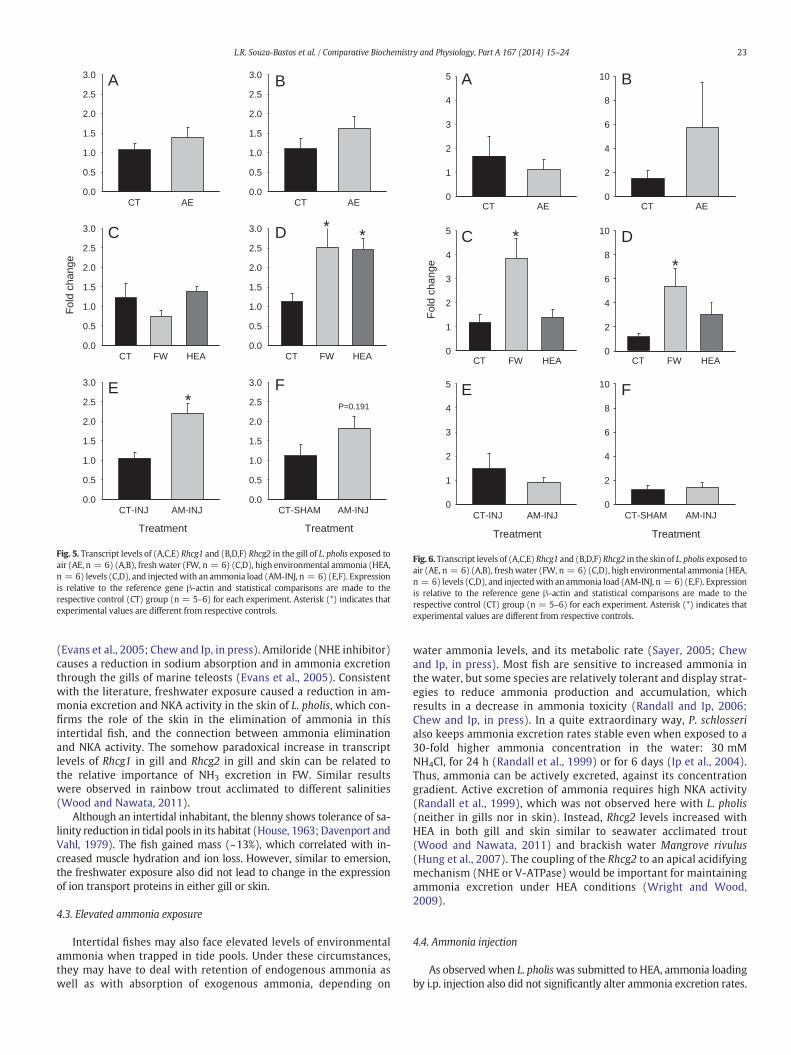
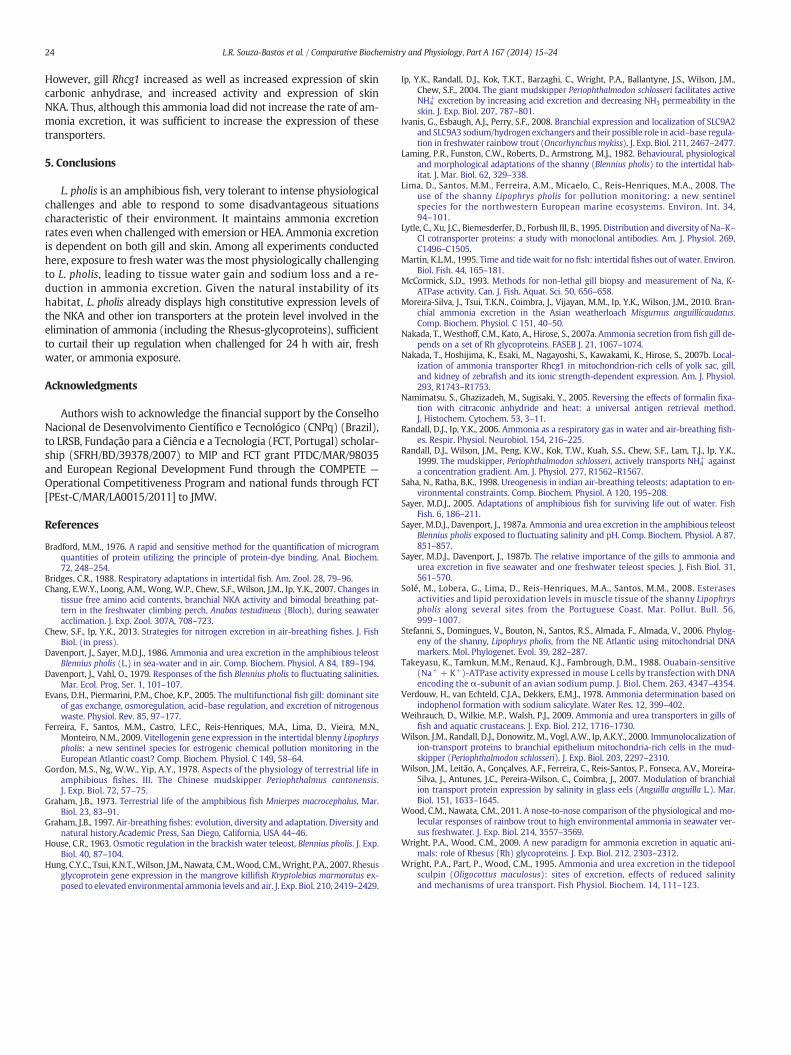
The transcript levels of the ammonia transporters Rhcg1 and Rhcg2were not significantly altered in the gill or skin during air exposure(Figs. 5 and 6). However, FW exposure increased the transcript levelsof Rhcg1 in skin and Rhcg2 in both gill and skin. HEA increased Rhcg2transcript levels in gill but not Rhcg1 and no changes were observed inskin. In contrast, ammonia injection increased gill Rhcg1 transcriptlevels only.
4. Discussion
L. pholis is an amphibious fish, and an intertidal resident of rockycoasts, living in crevices and tidal pools, and thus exposed daily to fluc-tuations in environmental conditions (Davenport and Vahl, 1979;Laming et al., 1982; Davenport and Sayer, 1986; Sayer and Davenport,1987a,b). During low tides, lasting ~4 h, these fish can be exposed tothe air or, while trapped inside tidal pools, to salinity reduction as a con-sequence of heavy rains, or to increased ammonia from the presence ofanimals inside the pools, associatedwith low levels of water circulation.
When L. pholiswas challengedwith these conditions for 24 h, ammoniaexcretion rates, tissue hydration and ionic contents were generallymaintained, with the exception of FW exposure. The capacity to remainin homeostasis upon such challenges often occurred without markedchanges in the expression of ammonia or ion transport-related proteins.
4.1. Amphibious habit of L. pholis and ammonia excretion when exposed tothe air
When L. pholis was challenged with emersion, ammonia excretionrates were maintained. In contrast, in previous studies on L. pholis a67% decrease in ammonia excretion was observed (Davenport andSayer, 1986; Sayer and Davenport, 1987b) similar to most other studieson amphibious fishes (Chew and Ip, in press). However, the climbingperch has been shown also to be able to maintain ammonia excretionrates during emersion (Chang et al., 2007). Also in contrast to thework of Davenport and Sayer (1986), we were unable to find apprecia-ble ammonia volatilization (7.6% versus b 0.1%) in L. pholis. The differ-ence in the results of these studies may be due to differences in thepopulations of blennies used (Northern Wales versus Portugal) andduration of the fasting period (6 d versus 2 d).
The skin of L. pholis had been proposed as a route for nitrogen elimi-nation (Davenport and Sayer, 1986; Sayer and Davenport, 1987a), given
TrRhcg1
BlRhcg1
KmRhcg1
OmRhcg1a
DrRhcg1
OmRhcg2
TrRhcg2
KmRhcg2100
85
77
92
96
60
100
BlRhcg2
DrRhbg
OmRhbg
TrRhbg
KmRhbg
DrRhag
TrRhag
OmRhag
94
100
91
100
77
65
100
Fig. 4. Evolutionary relationships ammonia transporters (Rh glycoproteins) of various fish taxa. The evolutionary history was inferred using the Neighbor-Joining method [1]. The boot-strap consensus tree inferred from 500 replicates [2] is taken to represent the evolutionary history of the taxa analyzed [2]. Branches corresponding to partitions reproduced in less than50% bootstrap replicates are collapsed. The percentage of replicate trees inwhich the associated taxa clustered together in the bootstrap test (500 replicates) is shown next to the branches[2]. The evolutionary distances were computed using the Poisson correction method [3] and are in the units of the number of amino acid substitutions per site. The analysis involved 16amino acid sequences. All positions containing gaps and missing data were eliminated. There were a total of 414 positions in the final dataset. Evolutionary analyses were conducted inMEGA5 [4]. Species abbreviations: Takifugu rubripes (Tr), Lipophrys pholis (Bl), Kryptolebias marmoratus (Km), Oncorhynchus mykiss (Om) and Danio rerio (Dr). Sequence names withaccession numbers: TrRhag NP_001032956.1; OmRhag NP_001118146.1; DrRhag NP_998010.1; OmRhbg NP_001118134.1; TrRhbg NP_001027818.1; KmRhbg ABO18606.1; DrRhbgNP_956365.2; OmRhcg1a NP_001118049.1; TrRhcg1 NP_001027819.1; KmRhcg1 ABN41463.1; DrRhcg1 AAM90586.1; TrRhcg2 NP_001027934.1; KmRhcg2 ABD83662.1; OmRhcg2NP_001117995.1.
22 L.R. Souza-Bastos et al. / Comparative Biochemistry and Physiology, Part A 167 (2014) 15–24
its surface area, degree of vascularization, and contact with the moistsubstrate when emersed, when the gills are non-functional for lack ofwater flow (Davenport and Sayer, 1986; Sayer and Davenport, 1987a).When L. pholis was immersed, the gills (head) are the site of 47% of thenitrogen excretion, 53% is performed by the skin (body). During emer-sion, the gill and skin rates decrease by 82 and 54%, respectively,and thus the relative importance of the skin increases (Sayer andDavenport, 1987a). Potential ammonia transporters in gill and skininclude the Rhcg's and NHE's. However, their expression does notchange with air exposure. In addition, the increased branchial activ-ity of the NKA suggests a branchial role in maintaining ammoniaexcretion rates.
The NKA could potentially take up NH4+ instead of K+ [Na+–K+
(NH4+)–ATPase], given the cations similarity in charge density and hy-
dration radius. Increased enzyme activity causes reduction in intracellu-lar sodium, increasing the electrochemical gradient for its influx inexchange for NH4
+ (or H+) through the apical Na+/H+ (NHE) ex-changers (Randall et al., 1999; Randall and Ip, 2006). The amphibiousgiant mudskipper Periophthalmodon schlosseri also displays high bran-chial NKA and Na+/H+ (NH4
+) exchanger levels of expression (Wilsonet al., 2000). It is important to note here, that in L. pholis no differencesin the branchial and skin expression of NKA and NHE protein levelswere noted. We could find no response of Rhcg1 or Rhcg2 at the tran-script or protein levels which contrasts with findings in the amphibiousweather loach (Moreira-Silva et al., 2010) and Mangrove rivulus (Hunget al., 2007). Notably, the constitutive levels of ion transporters at theprotein level and their tissue localization apparently provide sufficientammonia elimination capacity for L. pholis, even when emersed, andthe gills are not irrigated.
The loss of gill irrigation during emersion should reduce osmoticwater losses; however, L. pholis displayed 12% mass loss after 24 h of
air exposure. This mass loss probably results in part from the intensemucous production through the skin (Sayer, 2005). The amount ofmass lost after 24 h of emersion was rather similar to the value alreadyreported for this same species (~9%), with the same duration of airexposure in Davenport and Sayer (1986). This is well below the consid-ered lethal levels for the species (20–23% in Davenport and Sayer,1986), which is consistent with its capacity to withstand much longerair exposure periods. Compatible with the interpretation of weightloss due to mucous production, is the observation that L. pholis didnot show reductions in muscle hydration. Another amphibious fish(H. fossilis) also maintained its muscle hydration levels upon 24 hof air exposure (Saha and Ratha, 1998). In contrast, amphibiousPeriophthalmus cantonensis, even when still or shaded, initiallyloses some 6% of body mass per hour (over 5 h), enduring 2.5 daysout of the water (Gordon et al., 1978). In this sense, data here cor-roborates that L. pholis is a hardy amphibious fish, enduring up to5 days out of the water, in highly humid environments although atmuch lower temperatures (Davenport and Vahl, 1979; Davenportand Sayer, 1986; Martin, 1995; Graham, 1997).
4.2. Challenging L. pholis with fresh water
Freshwater exposure resulted in significant physiological changes inL. pholis including a significant reduction in ammonia excretion rates(83%). In contrast, a smaller (26%) reduction was observed by Sayerand Davenport (1987b). Although other euryhaline marine fishes alsodisplay hypo-salinity associated decreases in ammonia excretion[e.g. tidepool sculpin (Oligocottus maculosus; Wright et al., 1995)].The reduction in ammonia excretion is expected if the Na+/H+
(NH4+) exchanger acts to eliminate ammonia through the gills in
exchange for sodium uptake, which is less available in fresh water
CT AE0.0
0.5
1.0
1.5
2.0
2.5
3.0
CT AE0.0
0.5
1.0
1.5
2.0
2.5
3.0
CT FW HEA
Fol
d ch
ange
0.0
0.5
1.0
1.5
2.0
2.5
3.0
CT FW HEA0.0
0.5
1.0
1.5
2.0
2.5
3.0
Treatment
CT-INJ AM-INJ0.0
0.5
1.0
1.5
2.0
2.5
3.0
Treatment
CT-SHAM AM-INJ0.0
0.5
1.0
1.5
2.0
2.5
3.0
* P=0.191
A B
C D
E F
* *
Fig. 5. Transcript levels of (A,C,E) Rhcg1 and (B,D,F) Rhcg2 in the gill of L. pholis exposed toair (AE, n = 6) (A,B), freshwater (FW, n = 6) (C,D), high environmental ammonia (HEA,n = 6) levels (C,D), and injectedwith an ammonia load (AM-INJ, n = 6) (E,F). Expressionis relative to the reference gene β-actin and statistical comparisons are made to therespective control (CT) group (n = 5–6) for each experiment. Asterisk (*) indicates thatexperimental values are different from respective controls.
CT AE0
1
2
3
4
5
CT AE0
2
4
6
8
10
CT FW HEA
Fol
d ch
ange
0
1
2
3
4
5
CT FW HEA0
2
4
6
8
10
Treatment
CT-INJ AM-INJ0
1
2
3
4
5
Treatment
CT-SHAM AM-INJ0
2
4
6
8
10
*
A B
C D
E F
*
Fig. 6. Transcript levels of (A,C,E) Rhcg1 and (B,D,F) Rhcg2 in the skin of L. pholis exposed toair (AE, n = 6) (A,B), freshwater (FW, n = 6) (C,D), high environmental ammonia (HEA,n = 6) levels (C,D), and injectedwith an ammonia load (AM-INJ, n = 6) (E,F). Expressionis relative to the reference gene β-actin and statistical comparisons are made to therespective control (CT) group (n = 5–6) for each experiment. Asterisk (*) indicates thatexperimental values are different from respective controls.
23L.R. Souza-Bastos et al. / Comparative Biochemistry and Physiology, Part A 167 (2014) 15–24
(Evans et al., 2005; Chew and Ip, in press). Amiloride (NHE inhibitor)causes a reduction in sodium absorption and in ammonia excretionthrough the gills of marine teleosts (Evans et al., 2005). Consistentwith the literature, freshwater exposure caused a reduction in am-monia excretion and NKA activity in the skin of L. pholis, which con-firms the role of the skin in the elimination of ammonia in thisintertidal fish, and the connection between ammonia eliminationand NKA activity. The somehow paradoxical increase in transcriptlevels of Rhcg1 in gill and Rhcg2 in gill and skin can be related tothe relative importance of NH3 excretion in FW. Similar resultswere observed in rainbow trout acclimated to different salinities(Wood and Nawata, 2011).
Although an intertidal inhabitant, the blenny shows tolerance of sa-linity reduction in tidal pools in its habitat (House, 1963; Davenport andVahl, 1979). The fish gained mass (~13%), which correlated with in-creased muscle hydration and ion loss. However, similar to emersion,the freshwater exposure also did not lead to change in the expressionof ion transport proteins in either gill or skin.
4.3. Elevated ammonia exposure
Intertidal fishes may also face elevated levels of environmentalammonia when trapped in tide pools. Under these circumstances,they may have to deal with retention of endogenous ammonia aswell as with absorption of exogenous ammonia, depending on
water ammonia levels, and its metabolic rate (Sayer, 2005; Chewand Ip, in press). Most fish are sensitive to increased ammonia inthe water, but some species are relatively tolerant and display strat-egies to reduce ammonia production and accumulation, whichresults in a decrease in ammonia toxicity (Randall and Ip, 2006;Chew and Ip, in press). In a quite extraordinary way, P. schlosserialso keeps ammonia excretion rates stable even when exposed to a30-fold higher ammonia concentration in the water: 30 mMNH4Cl, for 24 h (Randall et al., 1999) or for 6 days (Ip et al., 2004).Thus, ammonia can be actively excreted, against its concentrationgradient. Active excretion of ammonia requires high NKA activity(Randall et al., 1999), which was not observed here with L. pholis(neither in gills nor in skin). Instead, Rhcg2 levels increased withHEA in both gill and skin similar to seawater acclimated trout(Wood and Nawata, 2011) and brackish water Mangrove rivulus(Hung et al., 2007). The coupling of the Rhcg2 to an apical acidifyingmechanism (NHE or V-ATPase) would be important for maintainingammonia excretion under HEA conditions (Wright and Wood,2009).
4.4. Ammonia injection
As observed when L. pholiswas submitted to HEA, ammonia loadingby i.p. injection also did not significantly alter ammonia excretion rates.
24 L.R. Souza-Bastos et al. / Comparative Biochemistry and Physiology, Part A 167 (2014) 15–24
However, gill Rhcg1 increased as well as increased expression of skincarbonic anhydrase, and increased activity and expression of skinNKA. Thus, although this ammonia load did not increase the rate of am-monia excretion, it was sufficient to increase the expression of thesetransporters.
5. Conclusions
L. pholis is an amphibious fish, very tolerant to intense physiologicalchallenges and able to respond to some disadvantageous situationscharacteristic of their environment. It maintains ammonia excretionrates even when challenged with emersion or HEA. Ammonia excretionis dependent on both gill and skin. Among all experiments conductedhere, exposure to fresh water was the most physiologically challengingto L. pholis, leading to tissue water gain and sodium loss and a re-duction in ammonia excretion. Given the natural instability of itshabitat, L. pholis already displays high constitutive expression levels ofthe NKA and other ion transporters at the protein level involved in theelimination of ammonia (including the Rhesus-glycoproteins), sufficientto curtail their up regulation when challenged for 24 h with air, freshwater, or ammonia exposure.
Acknowledgments
Authors wish to acknowledge the financial support by the ConselhoNacional de Desenvolvimento Científico e Tecnológico (CNPq) (Brazil),to LRSB, Fundação para a Ciência e a Tecnologia (FCT, Portugal) scholar-ship (SFRH/BD/39378/2007) to MIP and FCT grant PTDC/MAR/98035and European Regional Development Fund through the COMPETE —
Operational Competitiveness Program and national funds through FCT[PEst-C/MAR/LA0015/2011] to JMW.
References
Bradford, M.M., 1976. A rapid and sensitive method for the quantification of microgramquantities of protein utilizing the principle of protein-dye binding. Anal. Biochem.72, 248–254.
Bridges, C.R., 1988. Respiratory adaptations in intertidal fish. Am. Zool. 28, 79–96.Chang, E.W.Y., Loong, A.M., Wong, W.P., Chew, S.F., Wilson, J.M., Ip, Y.K., 2007. Changes in
tissue free amino acid contents, branchial NKA activity and bimodal breathing pat-tern in the freshwater climbing perch, Anabas testudineus (Bloch), during seawateracclimation. J. Exp. Zool. 307A, 708–723.
Chew, S.F., Ip, Y.K., 2013. Strategies for nitrogen excretion in air-breathing fishes. J. FishBiol. (in press).
Davenport, J., Sayer, M.D.J., 1986. Ammonia and urea excretion in the amphibious teleostBlennius pholis (L.) in sea-water and in air. Comp. Biochem. Physiol. A 84, 189–194.
Davenport, J., Vahl, O., 1979. Responses of the fish Blennius pholis to fluctuating salinities.Mar. Ecol. Prog. Ser. 1, 101–107.
Evans, D.H., Piermarini, P.M., Choe, K.P., 2005. The multifunctional fish gill: dominant siteof gas exchange, osmoregulation, acid–base regulation, and excretion of nitrogenouswaste. Physiol. Rev. 85, 97–177.
Ferreira, F., Santos, M.M., Castro, L.F.C., Reis-Henriques, M.A., Lima, D., Vieira, M.N.,Monteiro, N.M., 2009. Vitellogenin gene expression in the intertidal blenny Lipophryspholis: a new sentinel species for estrogenic chemical pollution monitoring in theEuropean Atlantic coast? Comp. Biochem. Physiol. C 149, 58–64.
Gordon, M.S., Ng, W.W., Yip, A.Y., 1978. Aspects of the physiology of terrestrial life inamphibious fishes. III. The Chinese mudskipper Periophthalmus cantonensis.J. Exp. Biol. 72, 57–75.
Graham, J.B., 1973. Terrestrial life of the amphibious fish Mnierpes macrocephalus. Mar.Biol. 23, 83–91.
Graham, J.B., 1997. Air-breathing fishes: evolution, diversity and adaptation. Diversity andnatural history.Academic Press, San Diego, California, USA 44–46.
House, C.R., 1963. Osmotic regulation in the brackish water teleost, Blennius pholis. J. Exp.Biol. 40, 87–104.
Hung, C.Y.C., Tsui, K.N.T.,Wilson, J.M., Nawata, C.M.,Wood, C.M.,Wright, P.A., 2007. Rhesusglycoprotein gene expression in the mangrove killifish Kryptolebias marmoratus ex-posed to elevated environmental ammonia levels and air. J. Exp. Biol. 210, 2419–2429.
Ip, Y.K., Randall, D.J., Kok, T.K.T., Barzaghi, C., Wright, P.A., Ballantyne, J.S., Wilson, J.M.,Chew, S.F., 2004. The giant mudskipper Periophthalmodon schlosseri facilitates activeNH4
+ excretion by increasing acid excretion and decreasing NH3 permeability in theskin. J. Exp. Biol. 207, 787–801.
Ivanis, G., Esbaugh, A.J., Perry, S.F., 2008. Branchial expression and localization of SLC9A2and SLC9A3 sodium/hydrogen exchangers and their possible role in acid–base regula-tion in freshwater rainbow trout (Oncorhynchus mykiss). J. Exp. Biol. 211, 2467–2477.
Laming, P.R., Funston, C.W., Roberts, D., Armstrong, M.J., 1982. Behavioural, physiologicaland morphological adaptations of the shanny (Blennius pholis) to the intertidal hab-itat. J. Mar. Biol. 62, 329–338.
Lima, D., Santos, M.M., Ferreira, A.M., Micaelo, C., Reis-Henriques, M.A., 2008. Theuse of the shanny Lipophrys pholis for pollution monitoring: a new sentinelspecies for the northwestern European marine ecosystems. Environ. Int. 34,94–101.
Lytle, C., Xu, J.C., Biemesderfer, D., Forbush III, B., 1995. Distribution and diversity of Na–K–Cl cotransporter proteins: a study with monoclonal antibodies. Am. J. Physiol. 269,C1496–C1505.
Martin, K.L.M., 1995. Time and tide wait for no fish: intertidal fishes out of water. Environ.Biol. Fish. 44, 165–181.
McCormick, S.D., 1993. Methods for non-lethal gill biopsy and measurement of Na, K-ATPase activity. Can. J. Fish. Aquat. Sci. 50, 656–658.
Moreira-Silva, J., Tsui, T.K.N., Coimbra, J., Vijayan, M.M., Ip, Y.K., Wilson, J.M., 2010. Bran-chial ammonia excretion in the Asian weatherloach Misgurnus anguillicaudatus.Comp. Biochem. Physiol. C 151, 40–50.
Nakada, T., Westhoff, C.M., Kato, A., Hirose, S., 2007a. Ammonia secretion from fish gill de-pends on a set of Rh glycoproteins. FASEB J. 21, 1067–1074.
Nakada, T., Hoshijima, K., Esaki, M., Nagayoshi, S., Kawakami, K., Hirose, S., 2007b. Local-ization of ammonia transporter Rhcg1 in mitochondrion-rich cells of yolk sac, gill,and kidney of zebrafish and its ionic strength-dependent expression. Am. J. Physiol.293, R1743–R1753.
Namimatsu, S., Ghazizadeh, M., Sugisaki, Y., 2005. Reversing the effects of formalin fixa-tion with citraconic anhydride and heat: a universal antigen retrieval method.J. Histochem. Cytochem. 53, 3–11.
Randall, D.J., Ip, Y.K., 2006. Ammonia as a respiratory gas in water and air-breathing fish-es. Respir. Physiol. Neurobiol. 154, 216–225.
Randall, D.J., Wilson, J.M., Peng, K.W., Kok, T.W., Kuah, S.S., Chew, S.F., Lam, T.J., Ip, Y.K.,1999. The mudskipper, Periophthalmodon schlosseri, actively transports NH4
+ againsta concentration gradient. Am. J. Physiol. 277, R1562–R1567.
Saha, N., Ratha, B.K., 1998. Ureogenesis in indian air-breathing teleosts: adaptation to en-vironmental constraints. Comp. Biochem. Physiol. A 120, 195–208.
Sayer, M.D.J., 2005. Adaptations of amphibious fish for surviving life out of water. FishFish. 6, 186–211.
Sayer, M.D.J., Davenport, J., 1987a. Ammonia and urea excretion in the amphibious teleostBlennius pholis exposed to fluctuating salinity and pH. Comp. Biochem. Physiol. A 87,851–857.
Sayer, M.D.J., Davenport, J., 1987b. The relative importance of the gills to ammonia andurea excretion in five seawater and one freshwater teleost species. J. Fish Biol. 31,561–570.
Solé, M., Lobera, G., Lima, D., Reis-Henriques, M.A., Santos, M.M., 2008. Esterasesactivities and lipid peroxidation levels in muscle tissue of the shanny Lipophryspholis along several sites from the Portuguese Coast. Mar. Pollut. Bull. 56,999–1007.
Stefanni, S., Domingues, V., Bouton, N., Santos, R.S., Almada, F., Almada, V., 2006. Phylog-eny of the shanny, Lipophrys pholis, from the NE Atlantic using mitochondrial DNAmarkers. Mol. Phylogenet. Evol. 39, 282–287.
Takeyasu, K., Tamkun, M.M., Renaud, K.J., Fambrough, D.M., 1988. Ouabain-sensitive(Na+ + K+)-ATPase activity expressed in mouse L cells by transfection with DNAencoding the α-subunit of an avian sodium pump. J. Biol. Chem. 263, 4347–4354.
Verdouw, H., van Echteld, C.J.A., Dekkers, E.M.J., 1978. Ammonia determination based onindophenol formation with sodium salicylate. Water Res. 12, 399–402.
Weihrauch, D., Wilkie, M.P., Walsh, P.J., 2009. Ammonia and urea transporters in gills offish and aquatic crustaceans. J. Exp. Biol. 212, 1716–1730.
Wilson, J.M., Randall, D.J., Donowitz, M., Vogl, A.W., Ip, A.K.Y., 2000. Immunolocalization ofion-transport proteins to branchial epithelium mitochondria-rich cells in the mud-skipper (Periophthalmodon schlosseri). J. Exp. Biol. 203, 2297–2310.
Wilson, J.M., Leitão, A., Gonçalves, A.F., Ferreira, C., Reis-Santos, P., Fonseca, A.V., Moreira-Silva, J., Antunes, J.C., Pereira-Wilson, C., Coimbra, J., 2007. Modulation of branchialion transport protein expression by salinity in glass eels (Anguilla anguilla L.). Mar.Biol. 151, 1633–1645.
Wood, C.M., Nawata, C.M., 2011. A nose-to-nose comparison of the physiological and mo-lecular responses of rainbow trout to high environmental ammonia in seawater ver-sus freshwater. J. Exp. Biol. 214, 3557–3569.
Wright, P.A., Wood, C.M., 2009. A new paradigm for ammonia excretion in aquatic ani-mals: role of Rhesus (Rh) glycoproteins. J. Exp. Biol. 212, 2303–2312.
Wright, P.A., Part, P., Wood, C.M., 1995. Ammonia and urea excretion in the tidepoolsculpin (Oligocottus maculosus): sites of excretion, effects of reduced salinityand mechanisms of urea transport. Fish Physiol. Biochem. 14, 111–123.
Related Documents