Structure of mitochondrial DNA control region and molecular phylogenetic relationship among three flounders of genus Pleuronectes Yan Zhang a, b,1 , Hui Zhang c,1 , Tianxiang Gao c, * , Zhenqing Miao a a Fishery College, Zhejiang Ocean University, Zhoushan 316004, China b Yellow Sea Fisheries Research Institute, Chinese Academy of Fishery Sciences, Qingdao 266071, China c Fisheries College, Ocean University of China, Qingdao 266003, China article info Article history: Received 26 February 2011 Accepted 15 May 2011 Available online 12 June 2011 Keywords: Control region Structure Pleuronectes Phylogenetic relationship Mitochondrial abstract Structure of mitochondrial DNA control region about three flounders – Pleuronectes yokohama, Pleuronectes schrenki and Pleuronectes herzensteini – were reported. The TAS, cTAS, CSB-A to CSB-F and CSB-1 to CSB-3 were detected in these three flounders. The results indicated that the structures of these parts were different from most fishes. All the mtDNA control region sequences of the three founders have tandem repeat sequences in the downstream of CSB-3, which is different from most vertebrates. According to the structure of the mtDNA control region, P. yokohama was more similar with P. schrenki and P. herzensteini was much different from the other two species. In addition, three segments such as control region, Cytb and COI are used to analyze the phylogenic relationships of the three species. The genetic distances and phylogenetic tree results support the classification by traditional morphology. It is not clear if P. yokohama and P. schrenki belong to the same species, and this should be accepted with caution. Ó 2011 Elsevier Ltd. All rights reserved. 1. Introduction As members of the genus of Pleuronectes, the flounders Pleuronectes yokohama, Pleuronectes schrenki and Pleuronectes herzensteini belong to the order of Pleuronectiformes (Nakabo, 2000). They are the important commercial fishery resources in Northwestern Pacific Ocean, especially in Japan (Nakabo, 2000). Up to present, there have been some studies on these three species, but most of them have focused on their life history and the aspect of ecology. There are few genetic studies on P. yokohama, P. herzensteini and P. schrenki (Abe, 2006; Zhang et al., 2008a, 2008b). Due to its compact size (16–17 kb), high rate of mutation and exclusive maternal mode of inheritance (Brown et al., 1979; Harrison, 1989), the mitochondrial genome has been widely used as a marker in molecular genetic studies. As a closed circular molecule, the piscine mtDNA contains a set of 37 genes specifying 13 proteins, two rRNAs, and 22 tRNAs encoded in both the heavy (H) and light (L) DNA strand (Meyer, 1993). The control region (D-loop) is the only non-coding segment in the vertebrate mitochondrial genome (Shui et al., 2008). Numerous studies have documented variation of DNA sequence in this region. Despite the presence of several highly conserved sequences (Saccone et al., 1987), this region is known to exhibit some of the highest rates of evolution on the mitochondrial DNA. Most of this variation consists of nucleotide substitutions and small insertions and deletions. However, considerable variation of length has been observed in an ever-growing list of species (Lunt et al., 1998), which is caused by variation in the number of tandemly repeated sequences. These repeats can be observed * Corresponding author. Tel.: þ86 532 8203 2063; fax: þ86 532 8203 2076. E-mail address: [email protected] (T. Gao). 1 These authors contribute equally to this paper. Contents lists available at ScienceDirect Biochemical Systematics and Ecology journal homepage: www.elsevier.com/locate/biochemsyseco 0305-1978/$ – see front matter Ó 2011 Elsevier Ltd. All rights reserved. doi:10.1016/j.bse.2011.05.008 Biochemical Systematics and Ecology 39 (2011) 627–634

Welcome message from author
This document is posted to help you gain knowledge. Please leave a comment to let me know what you think about it! Share it to your friends and learn new things together.
Transcript
Biochemical Systematics and Ecology 39 (2011) 627–634
Contents lists available at ScienceDirect
Biochemical Systematics and Ecology
journal homepage: www.elsevier .com/locate/biochemsyseco
Structure of mitochondrial DNA control region and molecularphylogenetic relationship among three flounders of genus Pleuronectes
Yan Zhang a,b,1, Hui Zhang c,1, Tianxiang Gao c,*, Zhenqing Miao a
a Fishery College, Zhejiang Ocean University, Zhoushan 316004, Chinab Yellow Sea Fisheries Research Institute, Chinese Academy of Fishery Sciences, Qingdao 266071, Chinac Fisheries College, Ocean University of China, Qingdao 266003, China
a r t i c l e i n f o
Article history:Received 26 February 2011Accepted 15 May 2011Available online 12 June 2011
Keywords:Control regionStructurePleuronectesPhylogenetic relationshipMitochondrial
* Corresponding author. Tel.: þ86 532 8203 2063E-mail address: [email protected] (T. Gao).
1 These authors contribute equally to this paper.
0305-1978/$ – see front matter � 2011 Elsevier Ltddoi:10.1016/j.bse.2011.05.008
a b s t r a c t
Structure of mitochondrial DNA control region about three flounders – Pleuronectesyokohama, Pleuronectes schrenki and Pleuronectes herzensteini – were reported. The TAS,cTAS, CSB-A to CSB-F and CSB-1 to CSB-3 were detected in these three flounders. Theresults indicated that the structures of these parts were different from most fishes. All themtDNA control region sequences of the three founders have tandem repeat sequences inthe downstream of CSB-3, which is different from most vertebrates. According to thestructure of the mtDNA control region, P. yokohama was more similar with P. schrenki andP. herzensteini was much different from the other two species. In addition, three segmentssuch as control region, Cytb and COI are used to analyze the phylogenic relationships of thethree species. The genetic distances and phylogenetic tree results support the classificationby traditional morphology. It is not clear if P. yokohama and P. schrenki belong to the samespecies, and this should be accepted with caution.
� 2011 Elsevier Ltd. All rights reserved.
1. Introduction
As members of the genus of Pleuronectes, the flounders Pleuronectes yokohama, Pleuronectes schrenki and Pleuronectesherzensteini belong to the order of Pleuronectiformes (Nakabo, 2000). They are the important commercial fishery resources inNorthwestern Pacific Ocean, especially in Japan (Nakabo, 2000). Up to present, there have been some studies on these threespecies, but most of them have focused on their life history and the aspect of ecology. There are few genetic studies onP. yokohama, P. herzensteini and P. schrenki (Abe, 2006; Zhang et al., 2008a, 2008b).
Due to its compact size (16–17 kb), high rate of mutation and exclusive maternal mode of inheritance (Brown et al., 1979;Harrison,1989), themitochondrial genome has beenwidely used as amarker inmolecular genetic studies. As a closed circularmolecule, the piscine mtDNA contains a set of 37 genes specifying 13 proteins, two rRNAs, and 22 tRNAs encoded in both theheavy (H) and light (L) DNA strand (Meyer, 1993). The control region (D-loop) is the only non-coding segment in thevertebrate mitochondrial genome (Shui et al., 2008). Numerous studies have documented variation of DNA sequence in thisregion. Despite the presence of several highly conserved sequences (Saccone et al., 1987), this region is known to exhibit someof the highest rates of evolution on the mitochondrial DNA. Most of this variation consists of nucleotide substitutions andsmall insertions and deletions. However, considerable variation of length has been observed in an ever-growing list of species(Lunt et al., 1998), which is caused by variation in the number of tandemly repeated sequences. These repeats can be observed
; fax: þ86 532 8203 2076.
. All rights reserved.
Y. Zhang et al. / Biochemical Systematics and Ecology 39 (2011) 627–634628
near the 50 end of the control region (e.g. Starner et al., 2004) or near the 30 end (e.g. Broughton and Dowling, 1994), rangingfrom the size of four to that of hundreds of nucleotides, and it may have 2 to more than 100 copies (Lunt et al., 1998). In thisstudy, we report the sequencing and structural characteristics of the control region of the three flounders P. yokohama,P. schrenki and P. herzensteini, hoping that the variable sequences in the control regionmay provide useful information for thecomprehension of their genetic diversity. ThemtDNA cytochrome c oxidase submit I (COI) gene and cytochrome b (Cytb) geneare also used to reveal the phylogenetic relationships among them.
2. Materials and methods
2.1. Sample collection
Seven specimens, including two individuals of P. yokohama, two individuals of P. schrenki and three individuals ofP. herzensteiniwere collected from the seawaters nearby Hakodate of Japan in October, 2006. Muscle samples were preservedin 95% ethanol before DNA extraction. Sequences for Hippoglossus hippoglossus and H. stenolepis used as outgroup in thephylogenetic relationship studywere obtained from the GenBank and the accession numbers were AM749124 and AM749128respectively.
2.2. DNA extraction, PCR and sequencing
Genomic DNA was isolated from muscle tissue by proteinase K digestion followed by a standard phenol–chloroformmethod (Sambrook, 1989). Each polymerase chain reaction (PCR) was performed in a volume of 50 mL containing 20–50 ngtemplate DNA, 5 mL of 10� PCR buffer, 5 mL of MgCl2 (25mM),1 mL of dNTPs 10mM),10 pM of each primer and 2.5 units of TaqDNA polymerase (TaKaRa Biotechnology (Dalian) Co, Ltd.) in an Eppendorf Mastercycler 5533 (Eppendorf, Hamburg,Germany).
The complete sequences of the D-loop were amplified with primers Dl-S: 50-CCCACCACTAACTCCCAAAGC-30 (forward)(Han et al., 2008) and Dl-12S: 50-GCGGATACTTGCATGTGTAAG-30 (reverse), which was newly designed for this study. Theinitial denaturation was for 5 min at 94 �C, followed by 35 cycles of 45 s at 94 �C for denaturation, 45 s at 50 �C for annealing,1m at 72 �C for extension and a final extension at 72 �C for 10 min. Cytb gene sequences were amplified with primers L14734-Glu:50-AACCACCGTTGTTATTCAACT-30 (forward) and H15149-Cyb:50- CTCAGAATGACATTTGTCCTCA-30 (reverse) (Gao et al.,2004). Initial denaturation was for 5 min at 95 �C, followed by 35 cycles of 1 m at 95 �C for denaturation, 1 m at 50 �C forannealing, 1 m at 72 �C for extension and a final extension at 72 �C for 10 min. COI gene fragment was amplified followingWard (Ward et al., 2005).
All sets of PCR included a negative control reaction tube in which all reagents were included except template DNA. PCRproduct was separated on a 1.5% agarose gel and purified with the BioDev Gel Extraction System B (BioDev Technology(Beijing) Co., Ltd). Both strands of the purified products were sequenced using the bigdye terminator cycle sequencing kit v2.0(Applied Biosystems, Foster City, CA, USA), and sequencing was conducted on an ABI Prism 3730 automatic sequencer(Applied Biosystems) with both forward and reverse primers used for PCR amplification except the complete sequences of theD-loop, which were too long to sequence in a reaction. So they were sequenced in two reactions, using the primers Dl-S andDielei-D: 50-TAGGAACCAAATGCCAGGAA-30 (Zhang et al., 2010) for the first reaction and D-M: 50-TGATAACGGTTATTGAAGGT-30 (newly designed) and Dl-12S for the second reaction.
2.3. Sequence analysis
Sequences were edited and aligned using DNAStar software (DNASTAR, Inc., Madison, USA) and refined manually. Geneticdiversity indices such as number of haplotypes, polymorphic sites, transitions, transversions, and indels were obtained usingthe program ARLEQUIN (Ver. 2.0) (Schneider et al., 2000). The nucleotide compositions and the average distances betweenspecies and within species were calculated with MEGA 4.0 (Tamura et al., 2007). The gamma distribution shape parametersfor the rates sites of heterogeneity were calculated using the programModeltest 3.7 (Posada and Crandall, 1998). Cytb and COIgene sequences were translated into amino acid sequences in MEGA 4.0 (Tamura et al., 2007).
2.4. Phylogenetic analysis
Phylogenetic relationships among the three species of genus Pleuronecteswere reconstructed using neighbor joining (NJ),maximum parsimony (MP), maximum likelihood (ML) and Bayesian methods. The optimal bases substitution model and theoptimized parameters for NJ analysis were estimated by Modeltest 3.7 (Posada and Crandall, 1998) using the hierarchicallikelihood ratio tests (hLRTs). The best model for CR, Cytb, and COI fragments was HKY þ G. NJ and MP trees were recon-structed by PAUP* (Swofford, 2002). ML trees were reconstructed online at http://www.atgc-montpellier.fr/phyml/. Bayesiananalysis was conducted by MrBayes 3.1.2 (Huelsenbeck and Ronquist, 2001; Ronquist and Huelsenbeck, 2003), and theparameters of Bayesian analysis were as follows: Statefreqpr ¼ dirichlet(1,1,1,1), nst ¼ 2, rates ¼ gamma, ngen ¼ 1 000 000,samplefreq ¼ 100, nchains ¼ 4, savebrlens ¼ yes, burnin ¼ 2500, burninfrac ¼ 0.25. The three fragments CR, Cytb and COI
Y. Zhang et al. / Biochemical Systematics and Ecology 39 (2011) 627–634 629
were initially analyzed separately using the four methods described above, then concatenated into a single dataset andanalyzed using the Bayesian methods.
3. Results
3.1. Structure of the control region
The sequence length of the control region of P. yokohama and P. schrenki are 1741 bp and 1508 bp respectively. Thesequence length of the control region of P. herzensteini shows variability among the individuals, as the length of two samplesused in this study are 1521 bp and 1456 bp respectively (Fig. 1). The content of A þ T is higher than that of G þ C in all of thesequences (Table 1).
Compared with the recognition sites in some fishes reported, we have detected three domains in the threeflounders – the extended termination associated sequence domain, the central conserved sequence block domain andthe conserved sequence block domain. In addition, tandem repeat sequence is found in the three flounders at the 30-part.
One extended termination associated sequence domain is recognized in the three flounders (Fig. 2). A TAS (terminationassociated sequence) motif-TACAT is found in the 50 part of the control region. But the sites of the TAS in P. herzensteini aredifferent from those of P. yokohama and P. schrenki. In the meanwhile, a complementary TAS (cTAS) motif-ATGTA is detecteddownstream of the TAS motif in this study.
All of the six central conserved sequence blocks, including CSB-F, CSB-E, CSB-D, CSB-C, CSB-B and CSB-A, are detected inthe three flounders. The CSB-F distinguished the extended termination associated sequence domain from central conservedsequence block domain. The key sequence of the CSB-F is ATGTAGTAAGA-CCTACCAACC-G in this study (where the – indicatednucleotide variations such as transition, transversions or indels) (Fig. 3). CSB-E was located downstream of the CSB-F, which ischaracterized by the box GTGGGG. The consensus sequence of the CSB-E is AGGGACAAAAATTGTGGGGG in the threeflounders. The CSB-D follows CSB-E and the consensus sequence is TATTCCTGGCATTTGGTTCCTA. The CSB-C, CSB-B and CSB-Acome after the CSB-D and the consensus sequences of them are CTTTCATCGACGCTTACATAAGTTAATGT, CATA-CGACTCGTTACCCA and AGCGGGTAAGGGGTTCTCTTT respectively. These sequences are highly conserved and easily to berecognized in the central conserved sequence block domain.
In the conserved sequence block domain, three conserved sequence blocks-CSB1, CSB2 and CSB3 of the three flounders arefound after the central conserved sequence block domain in the control region. CSB1 is the first domain of the conservedsequence block domain. The sequences of CSB2 and CSB3 are relatively more conserved than that of CSB1. And the sequencesof the CSB1, CSB2 and CSB3 in the P. herzensteini are much different from P. yokohama and P. schrenki (Fig. 4).
Tandem repeat sequence is found in the three flounders at the 30-part. The number of repeat unit and the length of thetandem repeat sequences are different in the three flounders (Table 2). Especially, individuals of P. herzensteini exhibit lengthvariability, which is due to the lack of one repeat unit. The content of A þ T is also higher than that of G þ C in the tandemrepeat sequences.
Although the sequence of the repeat unit of P. herzensteini is 63 bp, which is 1 bp longer than that of P. yokohama and P.schrenki, it was similar in the three flounders (Fig. 5).
3.2. Phylogenetic relationship
Part of the control region and two fragments of the mtDNA genes, including COI and Cytb, are used to study the geneticdifference and the phylogenetic relationship of the three flounders. The lengths of CR, COI and Cytb used for the analysis are403 bp, 655 bp, and 414 bp respectively.
3.2.1. Genetic differenceNet average genetic distances (Kimura two parameter distances) are calculated based on the sequence of CR, COI and Cytb
(Table 3). Applying cytochrome b divergence rate of 2%/MY (Bowen et al., 2001), the divergent event of P. yokohama and P.schrenki, P. yokohama and P. herzensteini and P. schrenki, and P. herzensteini occurred about in 870 000 years before present(YBP), 2 365 000 YBP and 1 700 000 YBP, respectively. This result indicates that the divergence between the two speciesoccurred in Pliocene.
3.2.2. Phylogenetic treesTransition and transversion substitutions of the three fragments increase linearly against F84 distance (not given), indi-
cating that bases changes at these sites are not saturated.The NJ, MP, ML and Bayesian trees are reconstructed based on the three fragments haplotypes dataset. Also, a combined
dataset was used to reconstruct phylogenetic tree by the Bayesian analysis. The trees reconstructed by different methods aremostly similar to each other using H. hippoglossus and H. stenolepis as outgroups. All the trees indicate that the three cladesbelong to P. yokohama, P. schrenki and P. herzensteini respectively, with high bootstrap values for NJ, MP and ML trees anda high posterior probability for Bayesian tree (Fig. 6).
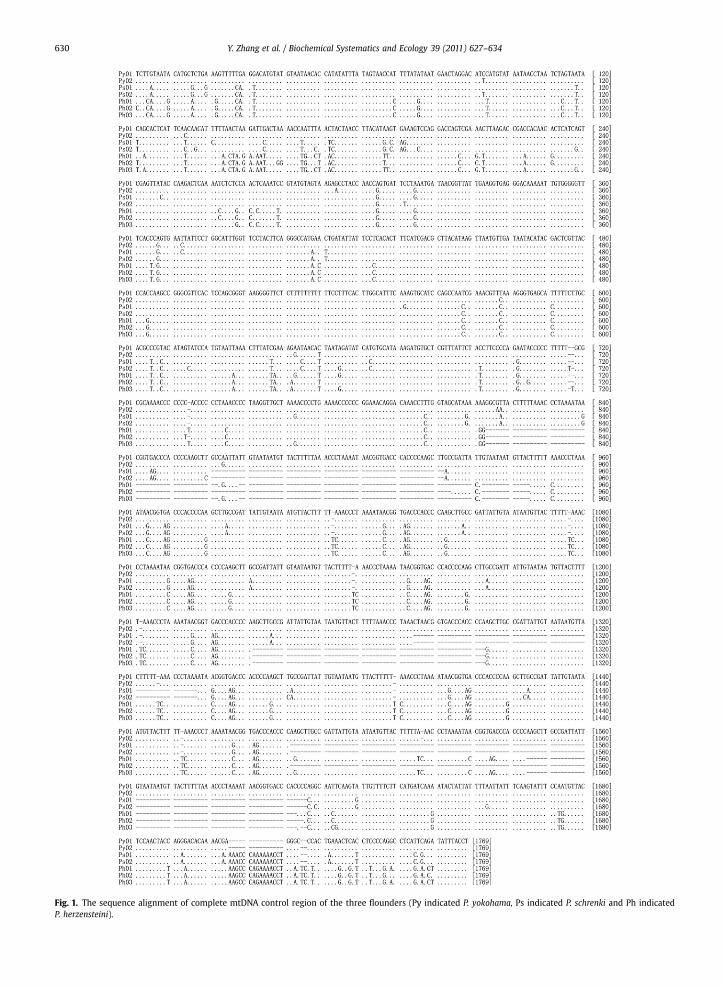
Fig. 1. The sequence alignment of complete mtDNA control region of the three flounders (Py indicated P. yokohama, Ps indicated P. schrenki and Ph indicatedP. herzensteini).
Y. Zhang et al. / Biochemical Systematics and Ecology 39 (2011) 627–634630
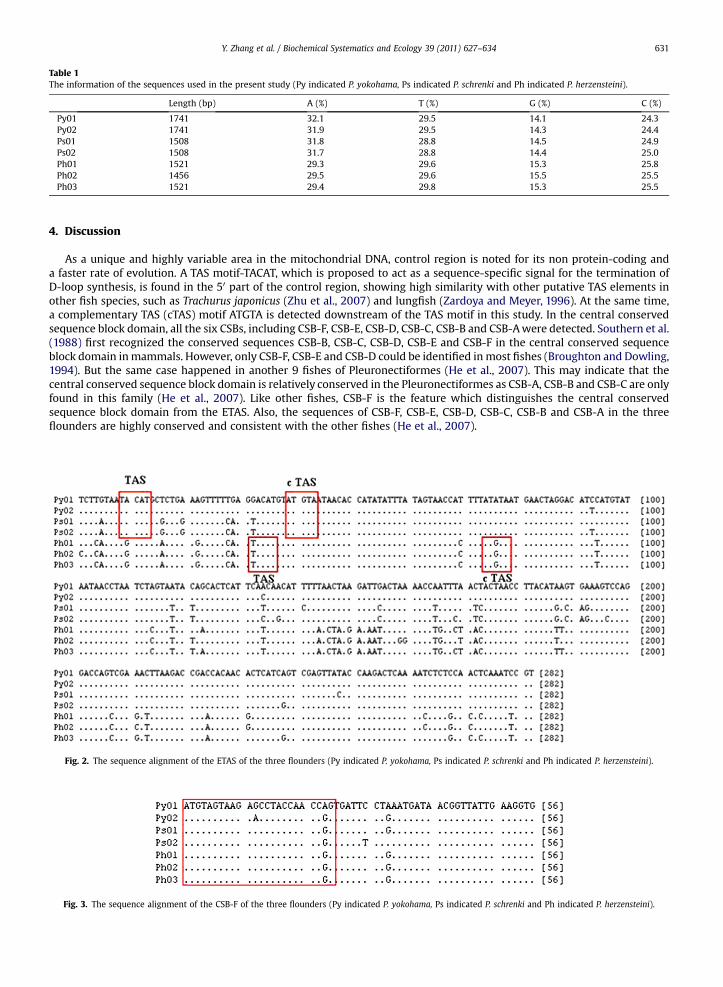
Table 1The information of the sequences used in the present study (Py indicated P. yokohama, Ps indicated P. schrenki and Ph indicated P. herzensteini).
Length (bp) A (%) T (%) G (%) C (%)
Py01 1741 32.1 29.5 14.1 24.3Py02 1741 31.9 29.5 14.3 24.4Ps01 1508 31.8 28.8 14.5 24.9Ps02 1508 31.7 28.8 14.4 25.0Ph01 1521 29.3 29.6 15.3 25.8Ph02 1456 29.5 29.6 15.5 25.5Ph03 1521 29.4 29.8 15.3 25.5
Y. Zhang et al. / Biochemical Systematics and Ecology 39 (2011) 627–634 631
4. Discussion
As a unique and highly variable area in the mitochondrial DNA, control region is noted for its non protein-coding anda faster rate of evolution. A TAS motif-TACAT, which is proposed to act as a sequence-specific signal for the termination ofD-loop synthesis, is found in the 50 part of the control region, showing high similarity with other putative TAS elements inother fish species, such as Trachurus japonicus (Zhu et al., 2007) and lungfish (Zardoya and Meyer, 1996). At the same time,a complementary TAS (cTAS) motif ATGTA is detected downstream of the TAS motif in this study. In the central conservedsequence block domain, all the six CSBs, including CSB-F, CSB-E, CSB-D, CSB-C, CSB-B and CSB-Awere detected. Southern et al.(1988) first recognized the conserved sequences CSB-B, CSB-C, CSB-D, CSB-E and CSB-F in the central conserved sequenceblock domain inmammals. However, only CSB-F, CSB-E and CSB-D could be identified inmost fishes (Broughton and Dowling,1994). But the same case happened in another 9 fishes of Pleuronectiformes (He et al., 2007). This may indicate that thecentral conserved sequence block domain is relatively conserved in the Pleuronectiformes as CSB-A, CSB-B and CSB-C are onlyfound in this family (He et al., 2007). Like other fishes, CSB-F is the feature which distinguishes the central conservedsequence block domain from the ETAS. Also, the sequences of CSB-F, CSB-E, CSB-D, CSB-C, CSB-B and CSB-A in the threeflounders are highly conserved and consistent with the other fishes (He et al., 2007).
Fig. 2. The sequence alignment of the ETAS of the three flounders (Py indicated P. yokohama, Ps indicated P. schrenki and Ph indicated P. herzensteini).
Fig. 3. The sequence alignment of the CSB-F of the three flounders (Py indicated P. yokohama, Ps indicated P. schrenki and Ph indicated P. herzensteini).
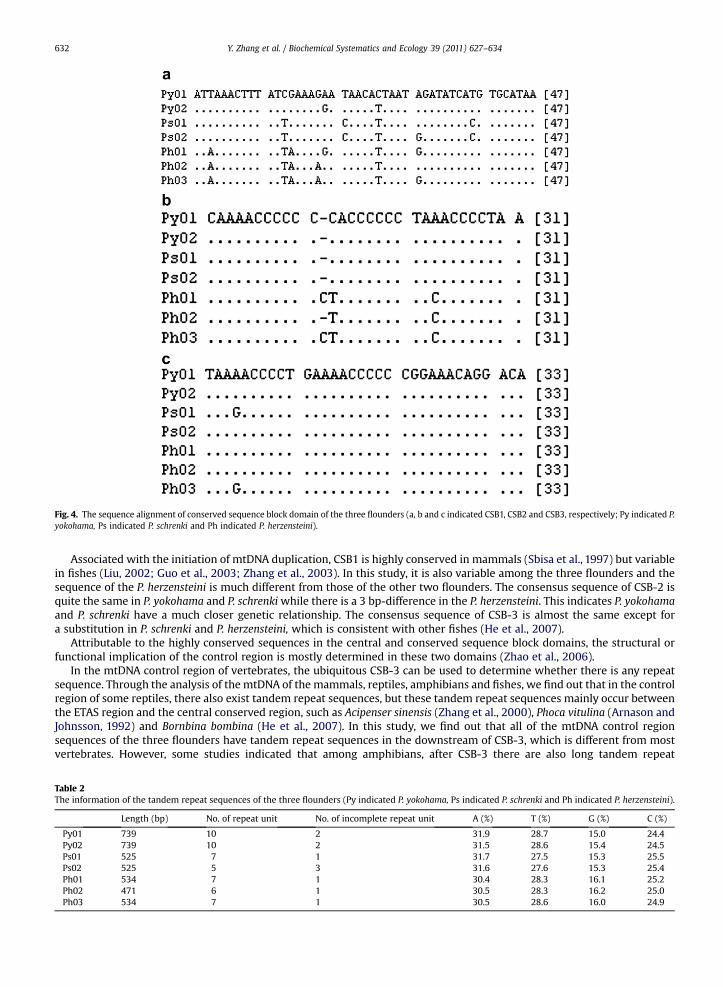
Fig. 4. The sequence alignment of conserved sequence block domain of the three flounders (a, b and c indicated CSB1, CSB2 and CSB3, respectively; Py indicated P.yokohama, Ps indicated P. schrenki and Ph indicated P. herzensteini).
Y. Zhang et al. / Biochemical Systematics and Ecology 39 (2011) 627–634632
Associated with the initiation of mtDNA duplication, CSB1 is highly conserved in mammals (Sbisa et al., 1997) but variablein fishes (Liu, 2002; Guo et al., 2003; Zhang et al., 2003). In this study, it is also variable among the three flounders and thesequence of the P. herzensteini is much different from those of the other two flounders. The consensus sequence of CSB-2 isquite the same in P. yokohama and P. schrenkiwhile there is a 3 bp-difference in the P. herzensteini. This indicates P. yokohamaand P. schrenki have a much closer genetic relationship. The consensus sequence of CSB-3 is almost the same except fora substitution in P. schrenki and P. herzensteini, which is consistent with other fishes (He et al., 2007).
Attributable to the highly conserved sequences in the central and conserved sequence block domains, the structural orfunctional implication of the control region is mostly determined in these two domains (Zhao et al., 2006).
In the mtDNA control region of vertebrates, the ubiquitous CSB-3 can be used to determine whether there is any repeatsequence. Through the analysis of the mtDNA of the mammals, reptiles, amphibians and fishes, we find out that in the controlregion of some reptiles, there also exist tandem repeat sequences, but these tandem repeat sequences mainly occur betweenthe ETAS region and the central conserved region, such as Acipenser sinensis (Zhang et al., 2000), Phoca vitulina (Arnason andJohnsson, 1992) and Bornbina bombina (He et al., 2007). In this study, we find out that all of the mtDNA control regionsequences of the three flounders have tandem repeat sequences in the downstream of CSB-3, which is different from mostvertebrates. However, some studies indicated that among amphibians, after CSB-3 there are also long tandem repeat
Table 2The information of the tandem repeat sequences of the three flounders (Py indicated P. yokohama, Ps indicated P. schrenki and Ph indicated P. herzensteini).
Length (bp) No. of repeat unit No. of incomplete repeat unit A (%) T (%) G (%) C (%)
Py01 739 10 2 31.9 28.7 15.0 24.4Py02 739 10 2 31.5 28.6 15.4 24.5Ps01 525 7 1 31.7 27.5 15.3 25.5Ps02 525 5 3 31.6 27.6 15.3 25.4Ph01 534 7 1 30.4 28.3 16.1 25.2Ph02 471 6 1 30.5 28.3 16.2 25.0Ph03 534 7 1 30.5 28.6 16.0 24.9
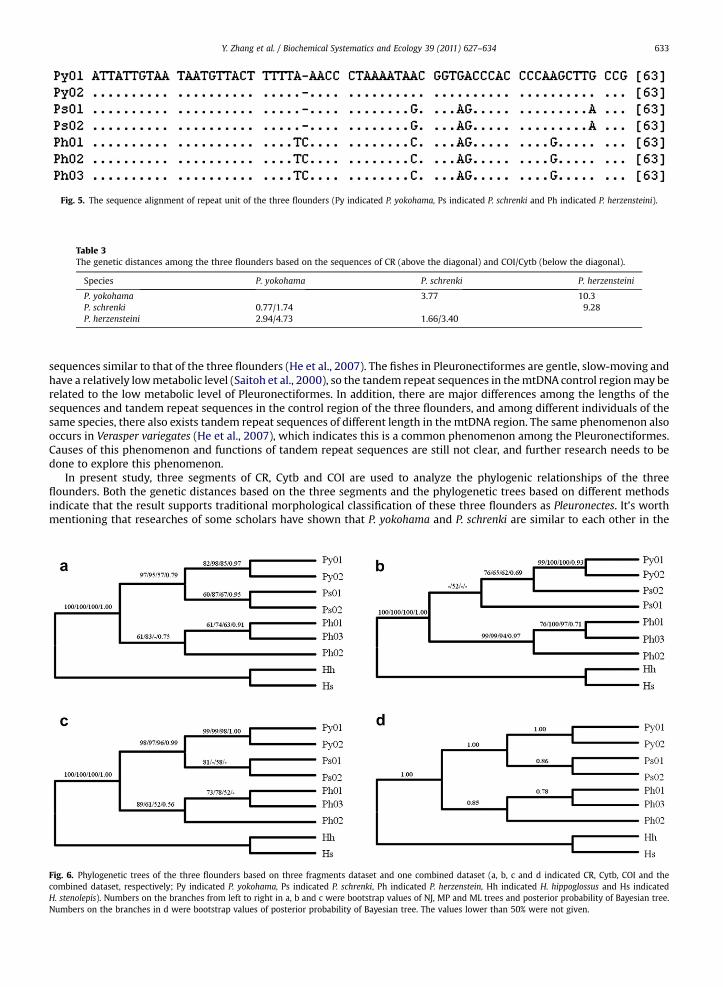
Fig. 5. The sequence alignment of repeat unit of the three flounders (Py indicated P. yokohama, Ps indicated P. schrenki and Ph indicated P. herzensteini).
Table 3The genetic distances among the three flounders based on the sequences of CR (above the diagonal) and COI/Cytb (below the diagonal).
Species P. yokohama P. schrenki P. herzensteini
P. yokohama 3.77 10.3P. schrenki 0.77/1.74 9.28P. herzensteini 2.94/4.73 1.66/3.40
Y. Zhang et al. / Biochemical Systematics and Ecology 39 (2011) 627–634 633
sequences similar to that of the three flounders (He et al., 2007). The fishes in Pleuronectiformes are gentle, slow-moving andhave a relatively lowmetabolic level (Saitoh et al., 2000), so the tandem repeat sequences in themtDNA control regionmay berelated to the low metabolic level of Pleuronectiformes. In addition, there are major differences among the lengths of thesequences and tandem repeat sequences in the control region of the three flounders, and among different individuals of thesame species, there also exists tandem repeat sequences of different length in the mtDNA region. The same phenomenon alsooccurs in Verasper variegates (He et al., 2007), which indicates this is a common phenomenon among the Pleuronectiformes.Causes of this phenomenon and functions of tandem repeat sequences are still not clear, and further research needs to bedone to explore this phenomenon.
In present study, three segments of CR, Cytb and COI are used to analyze the phylogenic relationships of the threeflounders. Both the genetic distances based on the three segments and the phylogenetic trees based on different methodsindicate that the result supports traditional morphological classification of these three flounders as Pleuronectes. It’s worthmentioning that researches of some scholars have shown that P. yokohama and P. schrenki are similar to each other in the
Fig. 6. Phylogenetic trees of the three flounders based on three fragments dataset and one combined dataset (a, b, c and d indicated CR, Cytb, COI and thecombined dataset, respectively; Py indicated P. yokohama, Ps indicated P. schrenki, Ph indicated P. herzenstein, Hh indicated H. hippoglossus and Hs indicatedH. stenolepis). Numbers on the branches from left to right in a, b and c were bootstrap values of NJ, MP and ML trees and posterior probability of Bayesian tree.Numbers on the branches in d were bootstrap values of posterior probability of Bayesian tree. The values lower than 50% were not given.
Y. Zhang et al. / Biochemical Systematics and Ecology 39 (2011) 627–634634
aspects of morphology and physiology, for example, Syasina and Sokolovskii (2001) reported the structure of the liver and gillof P. yokohama from different sites in Japan and compared the morphological characters among the genus Pleuronectes, theresult showed a little difference in the genus Pleuronectes on the morphology. Interestingly, Abe (2006) found that there wassomehow a hybridization phenomenon in the coastline of Japan between P. yokohama and P. schrenki according to thephylogetic tree. Although this study also shows P. yokohama and P. schrenki have a closer genetic relationship, there is alsoa certain degree of generic differentiation between them. According to the evolution rate 2%/MYof Cytb, we can calculate thatdifferentiation between the two flounders occured 870 000 YBP. Therefore we considered that it is too early to determine ifP. yokohama and P. schrenki belong to the same species.
Acknowledgments
The study was supported by Special Fund for Agro-scientific Research in the Public Interest (No. 201003068).
References
Abe, S., 2006. The Hybridization Phenomenon in Genus Pleuronectes Based on the DNA Marker. http://www2.fish.hokudai.ac.jp/21coe/News_Letters-Reports/gif/20060425h-14.pdf.
Arnason, U., Johnsson, E., 1992. The complete mitochondrial DNA sequence of the harbor seal, Phoca vitulina. J. Mol. Evol. 34, 493–505.Broughton, R.E., Dowling, T.E., 1994. Length variation in mitochondrial DNA of the minnow Cyprinella spiloptera. Genetics 138, 179–190.Bowen, B.W., Bass, A.L., Rocha, L.A., Grant, W.S., Robertson, D.R., 2001. Phylogeography of the trumpetfishes (Aulostomus): ring species complex on a global
scale. Evolution 55, 1029–1039.Brown, W.M., George, M., Wilson, A.C., 1979. Rapid evolution of animal mitochondiral DNA. Proc. Natl. Acad. Sci. 76, 1967–1974.Gao, T.X., Chen, S.Q., Liu, J.Q., Zhang, Y.P., 2004. Comparative analysis of mitochondrial DNA sequences between Verasper variegates and V. moseri. High. Tech.
Lett. 14, 329–334.Guo, X.H., Liu, S.J., Liu, Y., 2003. Comparative analysis of the mitochondrial DNA control region in cyprinids with different ploidy level. Aquaculture 224,
25–38.Han, Z.Q., Gao, T.X., Yanagimato, T., Sakurai, Y., 2008. Genetic population structure of Nibea albiflora in Yellow Sea and East China sea. Fish. Sci. 74, 544–552.Harrison, R.G., 1989. Animal mitochondrial DNA as a genetic marker in population and evolutionary biology. Trends Ecol. Evol. 4, 6–11.He, C.B., Cao, J., Liu, W.D., Zhou, Z.C., Ge, L.L., Gao, X.G., Wang, X.M., 2007. Structure anslysis of mtDNA control region of spotted halibut (Verasper Variegatus)
and its related species. Hereditas 29, 829–836.Huelsenbeck, J.P., Ronquist, F., 2001. MRBAYES: Bayesian inference of phylogeny. Bioinformatics 17, 754–755.Liu, H.Z., 2002. The structure and evolution of the mtDNA control region in fish: taking example for Acheilognathinae. Prog. Nat. Sci. 12, 266–270.Lunt, D.H., Whipple, L.E., Hyman, B.C., 1998. Mitochondrial DNA variable number tandem repeats (VNTRs): utility and problems in molecular ecology. Mol.
Ecol. 7, 1441–1455.Meyer, A., 1993. Evolution of Mitochondrial DNA in Fish. In: Hochachka, P.W., Mommsen, P. (Eds.), Biochemistry and Molecular Biology of Fish, vol. 2.
Elsevier Press, New York, pp. 1–38.Nakabo, T., 2000. Fishes of Japan with Pictorial Keys to the Species, 2nd ed. Tokai University Press, Kanagawaken, Japan.Posada, D., Crandall, K.A., 1998. Model test: testing the model of DNA substitution. Bioinformatics 14, 817–818.Ronquist, F., Huelsenbeck, J.P., 2003. MRBAYES 3: Bayesian phylogenetic inference under mixed model. Bioinformatics 19, 1572–1574.Saccone, C., Attimonelli, M., Sbisa, E., 1987. Structural elements highly preserved during the evolution of the D-loop-containing region in vertebrate
mitochondrial DNA. J. Mol. Evol. 26, 203–211.Saitoh, K., Hayashizaki, K., Yokoyama, Y., Asahida, T., Toyohara, H., Yamashita, Y., 2000. Complete nucleotide sequence of Japanese flounder (Paralichthys
olivaceus) mitochondrial genome: structural properties and cue for resolving teleostean relationships. J. Hered. 91, 271–278.Sambrook, J., 1989. Molecular Cloning: A Laboratory Manual, 2nd ed. Cold spring harbor laboratory press, New York.Sbisa, E., Tanzariello, F., Reyes, F., Pesole, G., Saccone, C., 1997. Mammalian mitochondrial D-loop region structure analysis: identification of new conserved
sequences and the functional and evolutional implications. Gene 205, 125–140.Schneider, S., Roessli, D., Excoffier, L., 2000. ARLEQUIN, Version 2.0: A Software for Population Genetic Data Analysis. University of Geneva, Geneva,
Switzerland.Shui, B.N., Han, Z.Q., Gao, T.X., Miao, Z.Q., 2008. Tandemly repeated sequence in 50end of mtDNA control region of Japanese Spanish mackerel Scomber-
omorus niphonius. Afr. J. Biotechnol. 7, 4415–4422.Southern, S.O., Southern, P.J., Dizon, A.E., 1988. Molecular characterization of a cloned dolphin mitochondrial genome. J. Mol. Evol. 28, 32–40.Starner, H., Pahlsson, C., Linden, M., 2004. Tandem repeat polymorphism and heteroplasmy in the mitochondrial DNA control region of threespine
stickleback (Gasterosteus aculeatus). Behav 141, 1357–1369.Swofford, D.L., 2002. PAUP*, Phylogenetic Analysis using Parsimony (*and Other Methods). Sinauer Associates, Sunderland MA. (Program).Syasina, I.G., Sokolovskii, A.S., 2001. Assessment of the state of flounders from Sivuch’ya Bight (Peter the Great Bay, Sea of Japan) based on histopathological
parameters. Russ. J. Mar. Biol. 27, 80–86.Tamura, K., Dudley, J., Nei, M., Kumar, S., 2007. MEGA4: molecular evolutionary genetics analysis (MEGA) software version 4.0. Mol. Biol. Evol. 24, 1596–
1599.Ward, R.D., Zemlak, T.S., Innes, B.H., Last, P.R., Hebert, P.D.N., 2005. DNA barcoding Australia’s fish species. Philos. Trans. R. Soc. Lond. B. Biol. Sci. 360, 1847–
1857.Zardoya, R., Meyer, A., 1996. The complete nucleotide sequence of the mitochondrial genome of the lungfish (Protopterus dolli) supportes its phylogenetic
position as a close relative of land vertebrates. Genet 142, 1249–1263.Zhang, H., Zhang, Y., Gao, T.X., Li, P.F., 2010. Genetic identification of two species of Pleuronichthys through DNA barcoding. Chin. J. Oceanol. Limnol. doi:10.
1007/s00343-011-0040-8.Zhang, S.M., Wu, Q.J., Zhang, Y.P., 2000. Tandem repeats of Chinese sturgeon (Acipenser sinensis ) and related species and its significance in evlution. Chin. J.
Biochem. Mol. Biol. 16, 458–461.Zhang, Y., Xiao, Y.S., Gao, T.X., 2008a. Analysis of genetic diversity of natural population in Pleuronectes yokohamae. J. Fish. Chin. 32, 492–496.Zhang, Y., Xiao, Y.S., Gao, T.X., 2008b. Molecular phylogeny of familiar flatfish species (Pleuronectidae) in the northwestern Pacific Ocean based on
mitochondria cytochrome oxidase I gene. Acta Oceanol. Sin. 27, 93–101.Zhang, Y., Zhang, E., He, S.P., 2003. Studies on the structure of the control region of the Bagridae in China and its phylogenetic significance. Acta Hydrobiol.
Sin. 27, 463–467.Zhao, J.L., Wang, W.W., Li, S.F., Cai, W.Q., 2006. Structure of the mitochondrial DNA control region of the sinipercine fishes and their phylogenetic rela-
tionship. Acta Genetica. Sin. 33, 793–799.Zhu, S.H., Zheng, W.G., Zou, J.X., Yang, F.C., Shen, X.Q., 2007. Mitochondrial DNA control region structure and molecular phylogenetic relationship of
Carangidae. Zool. Res. 28, 606–614.
Related Documents