AMERICAN METEOROLOGICAL SOCIETY Journal of Climate EARLY ONLINE RELEASE This is a preliminary PDF of the author-produced manuscript that has been peer-reviewed and accepted for publication. Since it is being posted so soon after acceptance, it has not yet been copyedited, formatted, or processed by AMS Publications. This preliminary version of the manuscript may be downloaded, distributed, and cited, but please be aware that there will be visual differences and possibly some content differences between this version and the final published version. The DOI for this manuscript is doi: 10.1175/2011JCLI4201.1 The final published version of this manuscript will replace the preliminary version at the above DOI once it is available. © 201 American Meteorological Society 1 https://ntrs.nasa.gov/search.jsp?R=20110022586 2018-07-13T00:24:20+00:00Z

Welcome message from author
This document is posted to help you gain knowledge. Please leave a comment to let me know what you think about it! Share it to your friends and learn new things together.
Transcript
AMERICANMETEOROLOGICALSOCIETY
Journal of Climate
EARLY ONLINE RELEASEThis is a preliminary PDF of the author-producedmanuscript that has been peer-reviewed and accepted for publication. Since it is being postedso soon after acceptance, it has not yet beencopyedited, formatted, or processed by AMSPublications. This preliminary version of the manuscript may be downloaded, distributed, andcited, but please be aware that there will be visualdifferences and possibly some content differences between this version and the final published version.
The DOI for this manuscript is doi: 10.1175/2011JCLI4201.1
The final published version of this manuscript will replacethe preliminary version at the above DOI once it is available.
© 201 American Meteorological Society1
https://ntrs.nasa.gov/search.jsp?R=20110022586 2018-07-13T00:24:20+00:00Z

Generated using version 3.0 of the official AMS LATEX template
On the causes and dynamics of the early twentieth century North
American pluvial
Benjamin I Cook ∗
NASA Goddard Institute for Space Studies, NY, NY, USA
Richard Seager
Lamont-Doherty Earth Observatory, Palisades, NY, USA
Ron L Miller
NASA Goddard Institute for Space Studies, NY, NY, USA
∗Corresponding author address: Benjamin I Cook, NASA Goddard Institute for Space Studies, 2880
Broadway, New York, NY 10025.
E-mail: [email protected]
1

ABSTRACT
The early twentieth century North American pluvial (1905-1917) was one of the most ex-
treme wet periods of the last five hundred years and directly led to overly generous water
allotments in the water-limited American West. Here we examine the causes and dynamics
of the pluvial event using a combination of observation-based data sets and general circula-
tion model (GCM) experiments. The character of the moisture surpluses during the pluvial
differed by region, alternately driven by increased precipitation (the Southwest), low evapo-
ration from cool temperatures (the Central Plains), or a combination of the two (the Pacific
Northwest). Cool temperature anomalies covered much of the west and persisted through
most months, part of a globally extensive period of cooler land and sea surface temperatures
(SST). Circulation during boreal winter favored increased moisture import and precipita-
tion in the southwest, while other regions and seasons were characterized by near normal
or reduced precipitation. Anomalies in the mean circulation, precipitation, and SST fields
are partially consistent with the relatively weak El Nino forcing during the pluvial, and also
reflect the impact of positive departures in the Arctic Oscillation that occurred in ten of the
thirteen pluvial winters. Differences between the reanalysis dataset, an independent statis-
tical drought model, and GCM simulations highlight some of the remaining uncertainties in
understanding the full extent of SST forcing of North American hydroclimatic variability.
1

1. Introduction
The development of western North America (NA) during the twentieth century was largely
made possible through human appropriation of natural water flows for industrial, municipal,
and agricultural uses (e.g., Barnett and Pierce 2009; Christensen et al. 2004; Sophocleous
2010; Reisner 1993; Worster 1992). One set of appropriations is legally formalized under the
Colorado River Compact (CRC) of 1922 (Christensen et al. 2004; MacDonnell et al. 1995),
an agreement that apportioned discharge from the Colorado River between the states in the
Upper (Wyoming, Utah, Colorado, New Mexico) and Lower (California, Arizona, Nevada)
Colorado River basins (Christensen et al. 2004). The CRC apportionments are based on
estimated climatological discharge at Lee’s Ferry on the Colorado River of 22 billion cubic
meters (BCM), using baseline flows from the early twentieth century (Christensen et al.
2004). As development in the west continued, and as the long term hydroclimate in the west
was clarified with longer instrumental records and paleoclimate reconstructions (Fye et al.
2003; Meko et al. 2007; Stockton and Jacoby 1976; Woodhouse et al. 2005), the overly gen-
erous nature of the original CRC allocations became apparent. For example, mean annual
discharge at Lee’s Ferry calculated over a much longer interval (1906-2000) was only 18.6
BCM, ranging in any given year from 6.5 BCM to 29.6 BCM (Christensen et al. 2004). The
reconstructed discharge extending back to 1512 C.E. is even lower (16.7 BCM), making it
highly likely that the flows that formed the basis for the CRC were higher than the hydro-
climatic baseline for the last 500 years (Christensen et al. 2004; Fye et al. 2003; Meko et al.
2007).
The exceptionally high flow during the early twentieth century coincided with anomalous
2

wet conditions throughout the west, spanning approximately 1905-1917, a period generally
referred to as the early twentieth century pluvial (the term pluvial referring to wetter than
normal conditions) (e.g., Fye et al. 2003, 2004; Woodhouse et al. 2005). This was the most
persistent pluvial event in the west to occur during the twentieth century, and recent drought
reconstructions based on networks of tree ring chronologies suggest it may have been the
wettest period in the west anytime in the last thousand years (Cook et al. 2004). An anal-
ysis of temperature and precipitation records from the time suggested that the pluvial (as
reflected in river discharge and drought metrics) arose from a combination of anomalously
high winter-time precipitation and reduced evaporation from cooler than normal warm sea-
son temperatures (Woodhouse et al. 2005).
To date, few studies have discussed the underlying dynamics or causes of the early twen-
tieth century pluvial. Fye et al. (2004) suggested that anomalously cool temperatures in
the North Pacific and warm conditions in the tropical Pacific would have favored increased
moisture flux into the southwest, although this was speculative because of the absence at
the time of atmospheric circulation datasets covering this time period. Since then, however,
new datasets and model simulations have become available, leaving us poised for an in-depth
investigation into the causes of the early twentieth century pluvial in western NA. Here, we
use available datasets and an ensemble of general circulation model (GCM) simulations to
investigate the North American pluvial (1905-1917) and assess 1) the relative importance
of temperature versus precipitation for the pluvial moisture surpluses, 2) the dynamics un-
derlying these anomalies, and 3) the importance of sea surface temperature (SST) forcing
during this interval.
3
2. Methods and Data
To maintain consistency with previous analyses (e.g., Fye et al. 2004), we define the pluvial
interval as 1905-1917. Over one of our analysis regions (the Central Plains), the pluvial
moisture surpluses begin several years prior to 1905; the 1905-1917 range, however, is the
common definition for the pluvial in the literature and this interval includes the major tem-
poral features of the pluvial at the continental scale. Our analysis will use observation-based
data sets, proxy based paleo-reconstructions of drought, and a suite of GCM experiments
to investigate the physics and dynamics underlying the spatial structure and temporal evo-
lution of the pluvial event. We divide the west into three regions, distinguished (as shown
below) by the main drivers of their respective pluvial moisture surpluses, their own distinct
climatologies, and SST-drought teleconnections. Despite these differences, all three regions
experienced significant wet conditions during the pluvial. The regions are the Southwest
(SW, 125oW-103oW, 25oN-42oN), the Northwest (NW, 125oW-103oW, 42oN-50oN), and the
Central Plains (CP, 103oW-90oW, 35oN-50oN). These regions are outlined in Figure 2 and
other subsequent figures.
a. Palmer Drought Severity Index
Droughts and pluvials may be defined in a variety of ways, depending on the research ques-
tion of interest (Dracup et al. 1980). At the core of all definitions, however, is the concept
of a moisture deficit (droughts) or surplus (pluvials). While these surpluses and deficits are
typically viewed primarily as a consequence of moisture supply (i.e., precipitation), they
may also strongly depend upon evaporative demand. One drought index that incorporates
4
information on moisture supply (via precipitation) and evaporative demand (as a function of
temperature) is the Palmer Drought Severity Index (PDSI) (Palmer 1965). PDSI is locally
normalized around a mean of zero with a typical range of -5 to +5; positive values indi-
cate wetter than normal conditions (pluvials) and negative values indicate drier conditions
(droughts). PDSI does have some weaknesses. For example, the potential evapotranspira-
tion calculation embedded within the PDSI uses the Thornthwaite equation (Thornthwaite
1948), which uses only temperature as an input; in reality, evapotranspiration may also de-
pend on relative humidity, wind, and cloudiness. Continuous and reliable estimates of these
other variables can be difficult to obtain, however, and the significance of these other fac-
tors may be largest in energy limited, rather than moisture limited, regions with relatively
high background relative humidity (e.g., Hobbins et al. 2008). PDSI also does not, in its
default form, explicitly model precipitation as snow or accumulated snowpack, which may
bias results for regions where seasonal snow cover is an important component of the regional
hydrology. Persistence is built into the PDSI calculation, however, meaning that values over
one season (e.g., boreal summer) will often partially reflect moisture conditions and climate
anomalies from previous months and seasons (e.g., St George et al. 2010). Summer (June-
July-August, JJA) PDSI, the focus of our analysis, should therefore still contain information
regarding temperature and precipitation anomalies during the antecedent winter and spring,
in addition to the contemporaneous summer.
We use two different PDSI datasets in our analysis. The first is the North American
Drought Atlas (NADA) version 2a (http://www.ncdc.noaa.gov/paleo/pdsi.html) (Cook
et al. 2007), a tree-ring proxy-based reconstruction of PDSI covering much of North Amer-
ica. The NADA product reconstructs PDSI for the summer (June-July-August) season
5

using 1,821 tree ring chronologies, over as many as 286 2.5ox2.5o grid-boxes. This product
is well-validated and versions of the NADA have been used in other studies of NA drought
variability (Cook et al. 1999, 2004, 2007; Fye et al. 2003; Herweijer et al. 2007). We use the
NADA to examine the spatial extent and intensity of the pluvial and also place the pluvial
anomalies within the context of moisture variability over the last five hundred years.
We also calculate a second set of PDSI values directly from available gridded monthly
temperature and precipitation data (see below) in order to investigate the relative contribu-
tion of temperature and precipitation to the PDSI during the pluvial. We set soil moisture
capacity for the upper and lower layers to 25.4 mm (1 inch) and 127 mm (5 inches) and
use 1926-2000 as our normalization period (“Climatically Appropriate For Existing Condi-
tions”). The PDSI calculation is applied to each grid-cell’s temperature and precipitation
separately; for regional comparisons the new PDSI grids are then spatially averaged over our
three defined regions.
b. Temperature and Precipitation
Gridded temperature and precipitation data are taken from version 2.1 of the Climate Re-
search Unit (CRU) monthly climate grids (Mitchell and Jones 2005). The CRU data are
statistically interpolated from monthly station observations to a regular terrestrial grid at
half degree spatial resolution and monthly temporal resolution, covering the time period
1901-2002. We use these data to look at seasonal temperature and precipitation anomalies
during the pluvial and also use them in our own calculation of PDSI. We also use SST data
from the Hadley Centre (HadISST; Rayner et al. 2003) and a dataset of global and hemi-
6
spherically averaged temperature for the last 150 years (HadCRUTv3; Brohan et al. 2006). A
measure of the El Nino Southern Oscillation (ENSO), the NINO3.4 index, is also calculated
from the HadISST dataset. Unless otherwise indicated, all temperature and precipitation
anomalies are expressed relative to a 1961-1990 climatology. We recognize that there may
be issues using this baseline period because of the strong warming trends over the twentieth
century. However, we note that 1) this time period is still often used as the standard base-
line in climate analyses, 2) data during this period is relatively well sampled spatially and
temporally, 3) persistent drought or pluvial events over NA are generally absent during this
interval, and 4) it is difficult to develop a comprehensive baseline prior to the pluvial period
and major warming trends.
c. Atmospheric Circulation
Data on atmospheric circulation and dynamics are taken from the Twentieth Century Re-
analysis Project (20CR) (Compo et al. 2006, 2011; Whitaker et al. 2004). This product
covers the time span 1871-2008, using a data assimilation model forced by observed climate
forcings and SSTs (from HadISST). This reanalysis only assimilates surface and sea level
pressure observations, and versions of the 20CR have already been used to investigate early
twentieth century circulation features (e.g., Cook et al. 2010; Wood and Overland 2009).
Because the reanalysis is constructed using an ensemble approach, a useful indicator of un-
certainty is the ensemble spread in the variables, for example in annual averaged 500 hPa
heights (Figure 1). The ensemble spread is low where the reanalysis is tightly constrained
by either a high density of observations (e.g., North America and Europe) or the prescribed
7

SST forcing (e.g., the tropics, where SST forcing of the atmosphere is strong). Over our
region of interest, the Pacific-North American sector, the spread is on the order of 20-40
meters over the land, but much higher over the North Pacific. This is not too surprising,
given the relative paucity of observations available in the North Pacific during this time.
Despite these caveats, we feel the 20CR is still an appropriate choice for our analysis, given
the relatively low ensemble spread over NA and our use of the 20CR as supporting analysis
to our main points.
d. GCM Experiments
We also use results from a 16-member ensemble of atmosphere GCM simulations forced
with observed SSTs to determine the extent to which SST forcing may be able to explain
climate anomalies during the pluvial. These simulations cover 1856 to the near present, and
have been previously used to investigate SST forcing of drought over NA with good success
(Seager et al. 2005b; Seager 2007). The SST forcing comes from Kaplan et al. (1998) for the
tropical Pacific Ocean for the entire period and, where available, for 1856-1870, and from
the Hadley center (Rayner et al. 2003) outside of the tropical Pacific from 1871 on. The
GCM is the Community Climate Model version 3 (CCM3), developed at the National Center
for Atmospheric Research (Kiehl et al. 1998). The model runs are referred to as GOGA for
Global Ocean Global Atmosphere. All results shown are the mean of a 16-member ensemble,
representing the SST-forced component of model variability.
8

3. Results and Discussion
a. The Pluvial in a Long-term context
Anomalous wet conditions were widespread throughout western NA during the pluvial, with
positive tree-ring reconstructed PDSI anomalies spanning from Mexico to southern Canada
and from the Pacific coast across the Great Plains (Figure 2). The largest PDSI anomalies
(+3 and greater) are concentrated along an axis extending from the SW into the NW and
northern CP regions. Notably, there are no major drought conditions (PDSI <-1) anywhere
during this time period, at least in the multi-year average.
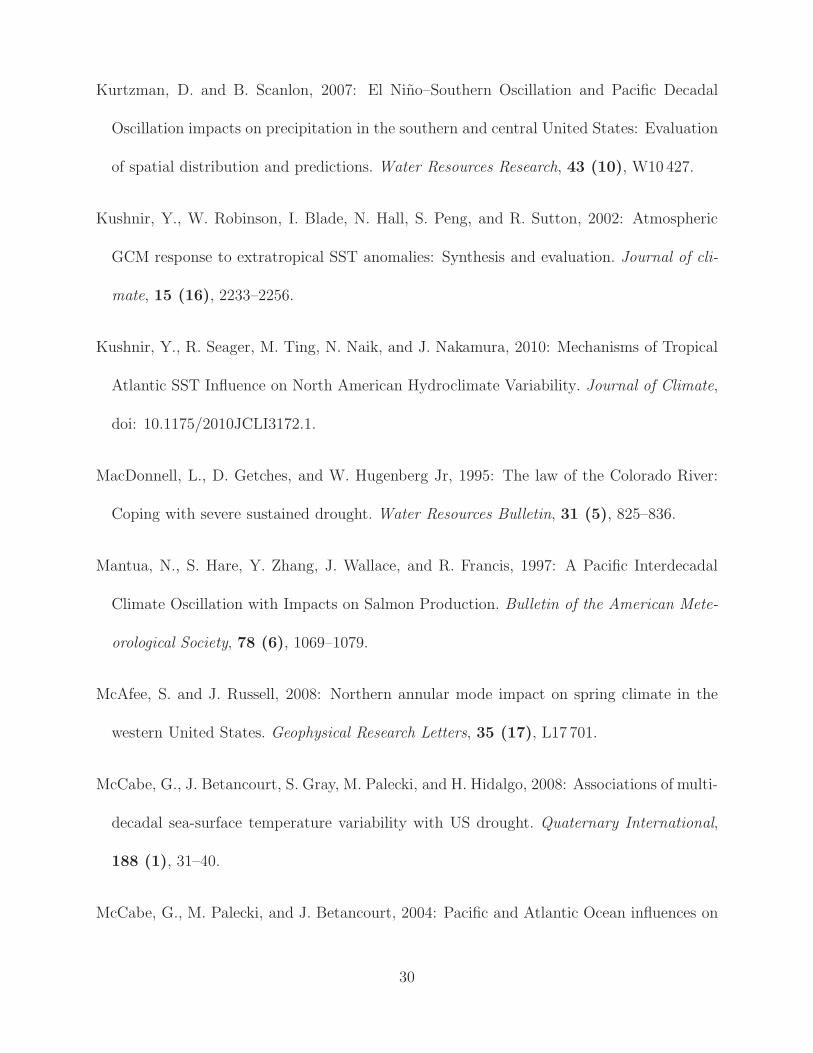
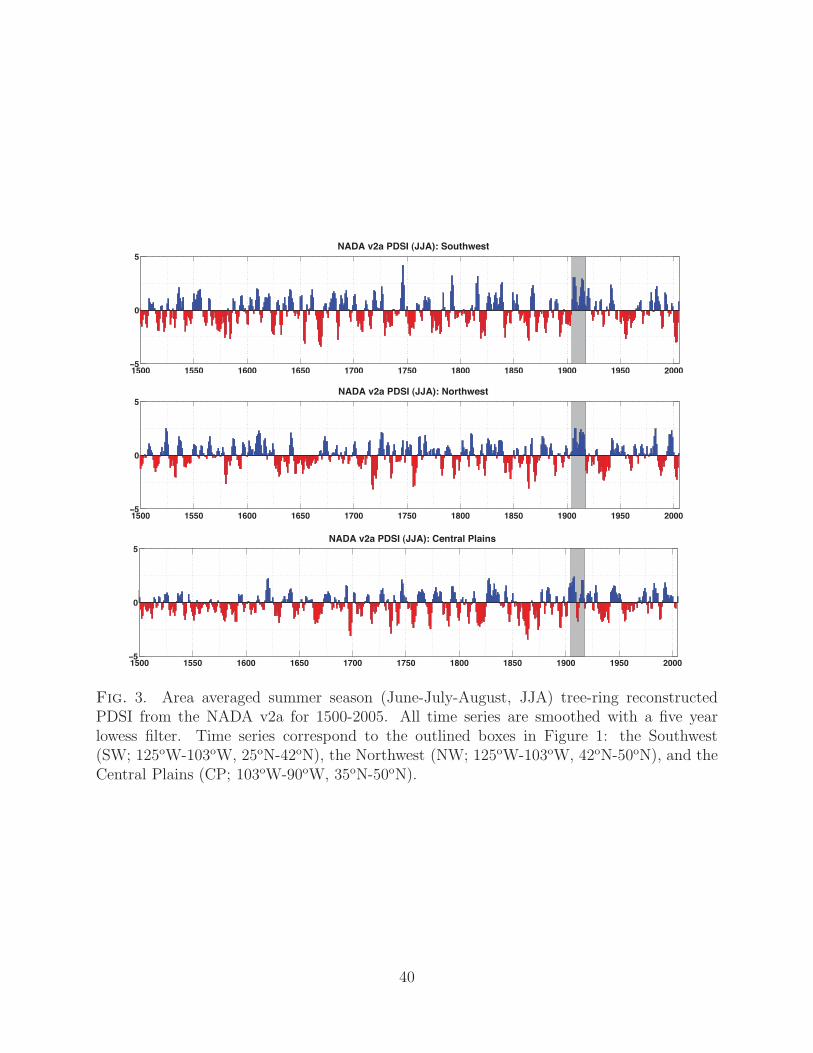
All three regions are characterized by high moisture variability and persistent drought
and pluvial periods over the last 500 years (Figure 3); time series are smoothed (5 year
lowess filter) to emphasize persistent events. Twentieth-century drought events are well-
resolved by the PDSI anomalies, including the well-documented droughts in the 1950s (SW)
and the 1930s ‘Dust Bowl’ (NW and CP), as well as the multi-decadal ‘megadroughts’ in
previous centuries. Compared to other pluvial intervals over the last five hundred years, the
early twentieth century event generally stands out through a combination of its intensity,
duration, and spatial extent. In all three regions, the time evolution of the pluvial indicates
two wet phases, with a break towards dry or near normal conditions around 1910. The break
in 1910 corresponds to La Nina conditions in the tropical Pacific, a situation that typically
suppresses precipitation in SW NA and the southern Great Plains. Over the CP region,
the pluvial appears to have started earlier than in either the SW or NW, and the post 1910
phase of the pluvial also appears weaker (drier) in this region.
9

b. Temperature and Precipitation During the Pluvial
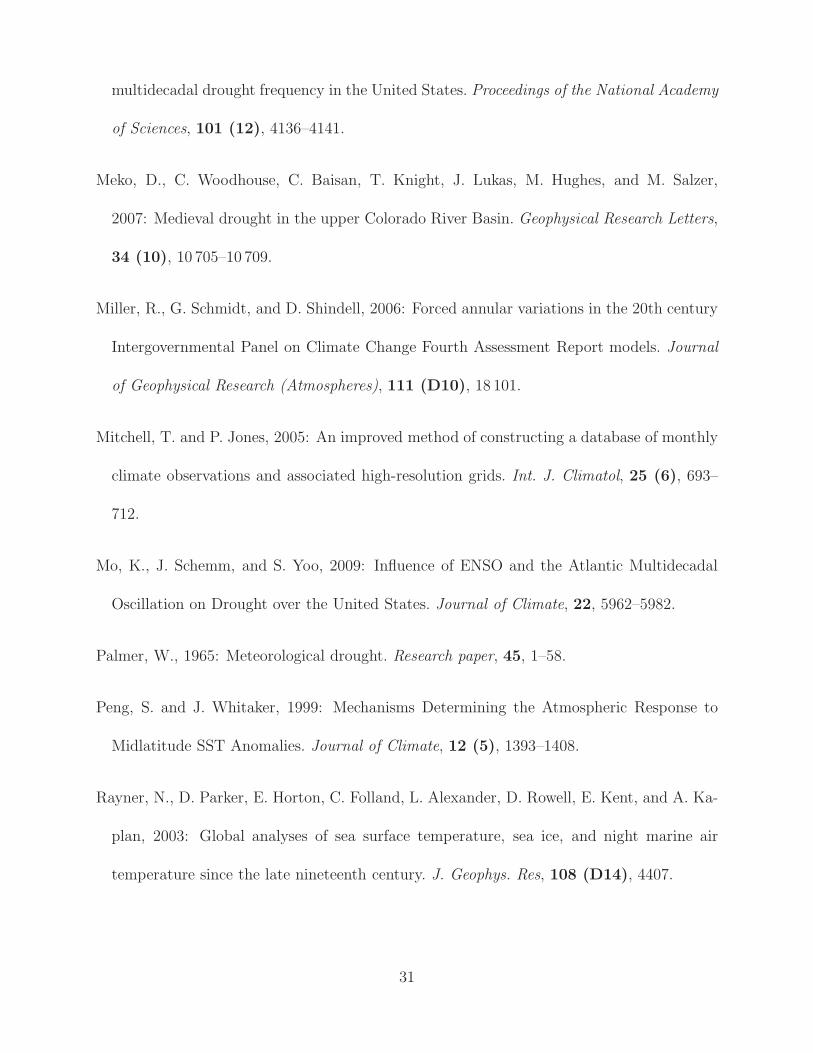
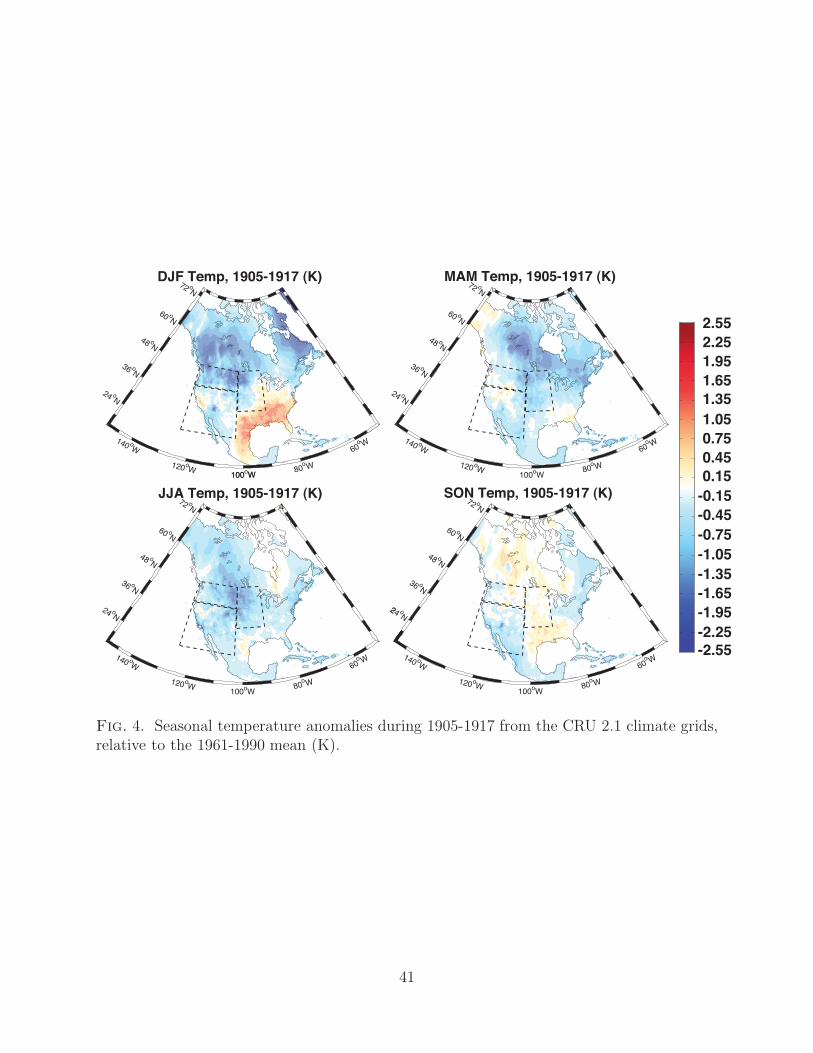
Temperature anomalies were generally cool throughout the west, especially during the spring
(MAM) and summer (JJA) peak evaporative seasons (Figure 4). The west was also cooler
than normal during winter (DJF), with the exception of slightly warmer than normal con-
ditions over California. The largest positive precipitation anomalies occurred in the SW
during DJF, with increases on the order of 50-60% (Figure 5), and in the SW during MAM,
although the spring anomalies occur over a much more limited area. There are some minor
increases over the region of the North American Monsoon, defined here as the areas of Mex-
ico and the Southwest that receives >50% of their annual precipitation during the boreal
summer (roughly 112oW-104oW and 22oN-32oN) (Adams and Comrie 1997). In the SW
regional average, however, these limited positive anomalies during JJA are largely cancelled
out by the negative anomalies further west. During DJF there were also wet anomalies in
the CP, but these were relatively low in absolute terms because the annual cycle in precip-
itation over this region peaks in the summer. What may be even more remarkable is how
many regions experienced precipitation deficits during the pluvial, especially the SW during
JJA and autumn (SON), the NW during DJF, and the CP during MAM. This supports the
hypothesis (Woodhouse et al. 2005) that cool temperature anomalies and low evaporative
demand may be as important as precipitation for explaining the large moisture surpluses
reflected in the positive PDSI values.
A look at the actual temperature (K) and precipitation (mm day-1) anomalies averaged
over the three regions during the pluvial provide some further insight (Figure 6). Overlain
in the precipitation plots is a scaled down (60%) version of the NINO3.4 index (dashed
10
line). When NINO3.4 is strongly positive, this is indicative of warm-phase El Nino events
generally associated with increased winter and spring precipitation in the southwest and
decreased precipitation during the same seasons in the northwest. During the pluvial, there
were five significant (≥+0.5 standard deviation from the mean) El Nino events: 1905, 1906,
1912, 1914, and 1915.
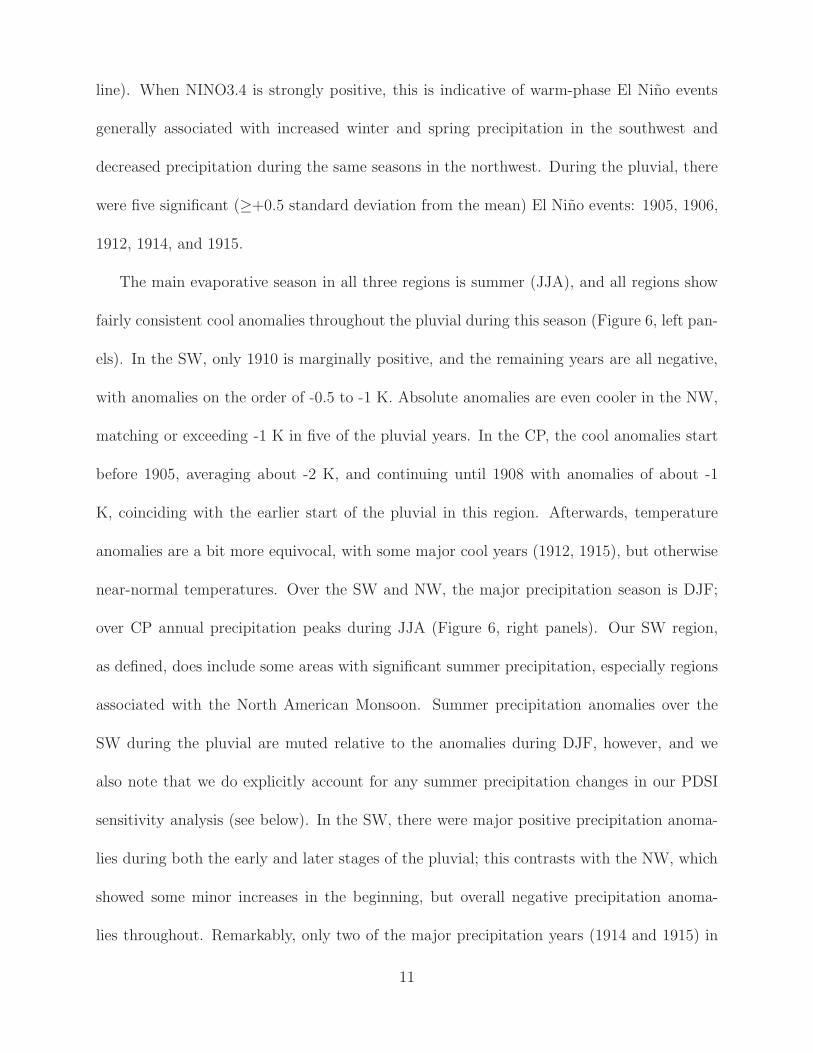
The main evaporative season in all three regions is summer (JJA), and all regions show
fairly consistent cool anomalies throughout the pluvial during this season (Figure 6, left pan-
els). In the SW, only 1910 is marginally positive, and the remaining years are all negative,
with anomalies on the order of -0.5 to -1 K. Absolute anomalies are even cooler in the NW,
matching or exceeding -1 K in five of the pluvial years. In the CP, the cool anomalies start
before 1905, averaging about -2 K, and continuing until 1908 with anomalies of about -1
K, coinciding with the earlier start of the pluvial in this region. Afterwards, temperature
anomalies are a bit more equivocal, with some major cool years (1912, 1915), but otherwise
near-normal temperatures. Over the SW and NW, the major precipitation season is DJF;
over CP annual precipitation peaks during JJA (Figure 6, right panels). Our SW region,
as defined, does include some areas with significant summer precipitation, especially regions
associated with the North American Monsoon. Summer precipitation anomalies over the
SW during the pluvial are muted relative to the anomalies during DJF, however, and we
also note that we do explicitly account for any summer precipitation changes in our PDSI
sensitivity analysis (see below). In the SW, there were major positive precipitation anoma-
lies during both the early and later stages of the pluvial; this contrasts with the NW, which
showed some minor increases in the beginning, but overall negative precipitation anoma-
lies throughout. Remarkably, only two of the major precipitation years (1914 and 1915) in
11
the SW actually correspond to El Nino events, despite the significant correlation between
NINO3.4 and precipitation over the SW during DJF (Pearson’s r=+0.33). Our SW region
includes some areas where the El Nino/precipitation teleconnections are strongest during
the spring and autumn (Andrade Jr and Sellers 1988) rather than winter, and we do find
wet spring (MAM) anomalies in other El Nino years during the pluvial (1905, 1906, 1912),
although these are muted relative to DJF (not shown). As with the cool temperature anoma-
lies, the positive precipitation anomalies in the CP begin before 1905. These precipitation
anomalies persist through the first four years of the pluvial; after 1908 the CP experiences
precipitation deficits every year except for 1915.
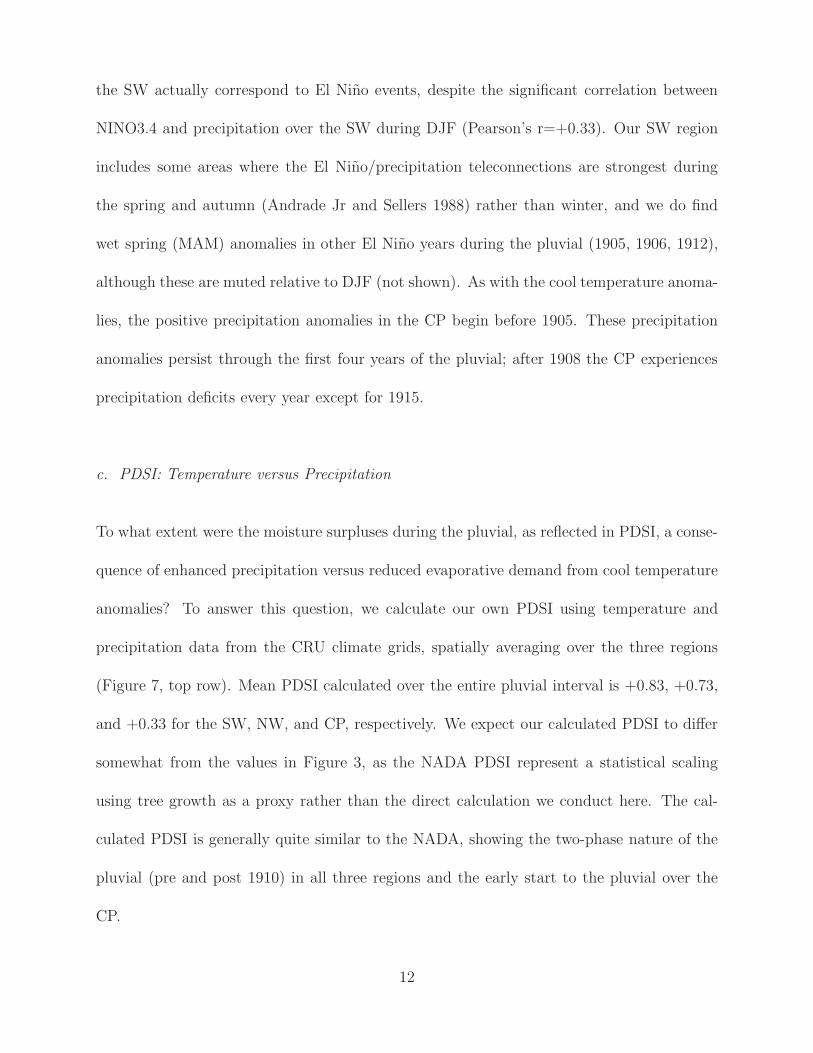
c. PDSI: Temperature versus Precipitation
To what extent were the moisture surpluses during the pluvial, as reflected in PDSI, a conse-
quence of enhanced precipitation versus reduced evaporative demand from cool temperature
anomalies? To answer this question, we calculate our own PDSI using temperature and
precipitation data from the CRU climate grids, spatially averaging over the three regions
(Figure 7, top row). Mean PDSI calculated over the entire pluvial interval is +0.83, +0.73,
and +0.33 for the SW, NW, and CP, respectively. We expect our calculated PDSI to differ
somewhat from the values in Figure 3, as the NADA PDSI represent a statistical scaling
using tree growth as a proxy rather than the direct calculation we conduct here. The cal-
culated PDSI is generally quite similar to the NADA, showing the two-phase nature of the
pluvial (pre and post 1910) in all three regions and the early start to the pluvial over the
CP.
12

To test the importance of temperature versus precipitation as contributing factors to
summer PDSI during the pluvial, we alternately substitute climatological values (1961-1990)
instead of observed temperature and precipitation into the PDSI calculation. We substitute
climatological values for each month (January-December), rather than specific seasons, to
account for minor but potentially important contributions from anomalies outside the main
precipitation and evaporation seasons. Substituting climatological temperature (keeping ob-
served precipitation) into the PDSI calculation results in varying impacts across the three
regions (Figure 7, center row). The average pluvial PDSI for the SW decreases moderately to
+0.60, but PDSI during the major pluvial years (1905, 1906, 1907, 1912, 1914, 1915) is only
slightly diminished. Over the NW, there are major reductions in PDSI across most pluvial
years, with mean PDSI dropping by over half from +0.73 to +0.31. Even more dramatically,
mean PDSI switches from positive to negative over the CP (+0.33 to -0.15), suggesting that,
without the cool temperatures, there would have been drought conditions over this region.
Calculations with climatological precipitation and observed temperatures (Figure 7, bottom
row) reduce the original calculated PDSI in the SW by 62% to +0.33. In the NW, mean
PDSI is reduced to +0.66, a relatively muted response compared to the climatological tem-
perature scenario, but with the major pluvial years (1907, 1912, 1916) reduced by half. In
the CP, substitution of climatological precipitation actually enhances the pluvial, increasing
mean PDSI to +0.84, muting early PDSI anomalies slightly but completely eliminating the
later drought years during the second half of the pluvial. From these results we conclude
that the causes of the moisture surpluses varied across these three regions, driven by high
precipitation (SW), low evaporative demand (CP), or a combination of both (NW).
Cool temperature anomalies, and the accompanying low evaporative demand, appear
13

to be important for explaining the pluvial moisture surpluses. However, this explanation
depends on the cool temperatures being an independent factor and not arising from their
occurrence near the beginning of the twentieth century warming trends or a result of in-
creased precipitation, which would make things wet and cool by favoring latent over sensible
heating or increasing cloud cover and shortwave reflection. In the first case, our cool temper-
atures would simply be a consequence of our relatively warm baseline; if the latter case were
true, this would mean the temperature anomalies would be a covariate with the precipitation,
rather than an independent causal factor. A look at global and hemispheric temperatures for
the late nineteenth to early twentieth century shows that temperature anomalies during the
pluvial period were cool even relative to previous decades (Figure 8). Thus, an observer in
1920, looking back, and with no knowledge of the coming warming, would have characterized
the pluvial decade as anomalously cool compared to previous years. For all three regions
there is a significant (p<0.05, calculated over 1901-2002) negative relationship between pre-
cipitation and temperature (Figure 9). However, when the pluvial years are isolated (blue
dots), we see that temperatures are near normal or cool (left side of the dashed line), regard-
less of the precipitation anomalies. Because precipitation during the winter and spring may
be stored as snow pack that carries over into subsequent seasons, the temperature response
to precipitation may also be lagged by several months. We repeated the correlation analysis,
this time comparing JJA temperature against antecedent DJF and MAM precipitation. For
this lagged analysis, only the SW showed a significant correlation (MAM precipitation versus
JJA temperature: ρ =-0.23, p<0.05), and with similar results indicating cool temperatures
during the pluvial that were largely independent of the precipitation anomalies. This gives
strong evidence to reject the second explanation and conclude that the temperature anoma-
14

lies during the pluvial were largely independent from the precipitation anomalies, allowing
them to be an independent causal factor for the pluvial moisture surpluses.
d. Sea Surface Temperatures
Drought and pluvial events over western NA are largely modulated by variations in SSTs,
originating primarily from the tropical Pacific (Seager et al. 2005b), part of a zonally and
hemispherically symmetric pattern of global hydroclimatic variability (Seager et al. 2003,
2005a). Increased precipitation in the SW is associated with warm-phase El Nino events
while cold-phase La Nina events typically suppress precipitation over the same region. The
sign of ENSO-precipitation teleconnections is reversed in the NW, with El Nino events
leading to drier than normal conditions. The influence of the tropical Pacific is typically
strongest during boreal winter.
Composited DJF SST anomalies from all El Nino events (defined as NINO3.4 index ≥
+0.5 standard deviation) over the last 130 years are shown in the top panel of Figure 10.
During a typical El Nino event, warm SST anomalies extend across most of the tropical
Pacific, flanked by cool SSTs in the extratropical central north and south Pacific ocean
basins. Warm SSTs also typically occur in a narrow band along the west coast of NA.
Averaged across all years during the pluvial, SSTs were globally cooler than normal (Figure
10, bottom panel) and the tropical Pacific is near normal, despite the occurrence of five El
Nino events (1905, 1906, 1912, 1914, 1915). Even during the pluvial El Nino events, off-
equatorial SST anomalies in the Pacific deviate from the expected El Nino pattern, especially
in the extratropical North Pacific which was nearly universally cool across the entire basin
15

(not shown). Coupled with the major precipitation surpluses in the SW during off El Nino
years, this suggests that El Nino forcing may be insufficient to satisfyingly explain the full
pluvial anomalies. The North Atlantic was also cooler than normal during the pluvial, a
condition that is typically associated with increased precipitation in central NA, especially
during the warm season (Enfield et al. 2001; Kushnir et al. 2010; Mo et al. 2009).
e. Dynamics
The impact of various modes of climate variability and atmospheric circulation on climate
in western NA is well established, including the Pacific North America pattern (PNA) (Wal-
lace and Gutzler 1981), the Arctic Oscillation (AO) (Hu and Feng 2010; McAfee and Russell
2008), and the El Nino Southern Oscillation (ENSO) (Andrade Jr and Sellers 1988). What is
less clear, however, is the extent to which the circulation during the pluvial or other intervals
represents a forced response to SSTs versus internal atmospheric variability, an important
distinction as SSTs currently provide the best source of predictability for NA hydroclimate
(Schubert et al. 2008, 2009). Forcing from tropical Pacific and tropical Atlantic SSTs is
currently well constrained by numerous studies (e.g., Cook et al. in press; Kushnir et al.
2010; Seager et al. 2005b) but the role of extratropical SSTs, especially in the extratropical
Pacific, is still controversial. There is limited empirical and modeling evidence suggesting
that SSTs in the extratropical Pacific may influence the overlying atmosphere (Frankignoul
and Sennechael 2007; Kushnir et al. 2002; Peng and Whitaker 1999; Wen et al. 2010). Many
of the most recent studies suggest that warm SSTs in the Kuroshio extension region may
force or reinforce an upper level ridge near the Gulf of Alaska during boreal winter, with
16

the atmospheric response typically lagging the ocean by 4-5 months (Peng and Whitaker
1999; Frankignoul and Sennechael 2007; Wen et al. 2010). Discerning the magnitude and
significance of the forced response is difficult, however, due to the high internal variability in
the atmosphere, the fact that extratropical Pacific SST variability is not independent from
ENSO, and the importance of the atmosphere as the primary driver of SST variability in
the extratropics (Deser et al. 2010; Junge and Haine 2001; Kushnir et al. 2002).
Winter (DJF) circulation during the pluvial, as reflected in the 500 hPa geopotential
height anomalies, is characterized by negative anomalies off the west coast of NA, flanked
by positive heights over the western extratropical Pacific and over eastern NA (Figure 11,
top panel). This configuration favors increased moisture advection into the SW along a
southwesterly track, a pattern highly favorable for so-called “Pineapple Express” winter
time storm events (Dettinger 2004; Fye et al. 2004). This circulation pattern bears some
superficial similarities to the canonical circulation response to El Nino forcing, but with some
substantial differences (Figure 11, middle panel). Specifically, the negative height anomalies
are weaker and shifted eastward, while the positive heights over NA shift southeast, extend-
ing over eastern NA and Mexico. The apparent weak circulation response to ENSO during
the pluvial is consistent with the limited impact of ENSO on the precipitation in the SW
during DJF and MAM, described previously. The circulation pattern also diverges from the
expected warm SST-ridge/cold SST-trough response that would be expected given the cold
North Pacific SSTs (Peng and Whitaker 1999; Frankignoul and Sennechael 2007; Wen et al.
2010). Low level height anomalies over the subtropical North Atlantic are weak (<5 m) or
non-existent during MAM and JJA (not shown). The absence of significant high pressure
anomalies over this region suggests a negligible role for cold North Atlantic SSTs in forcing
17
the precipitation anomalies.
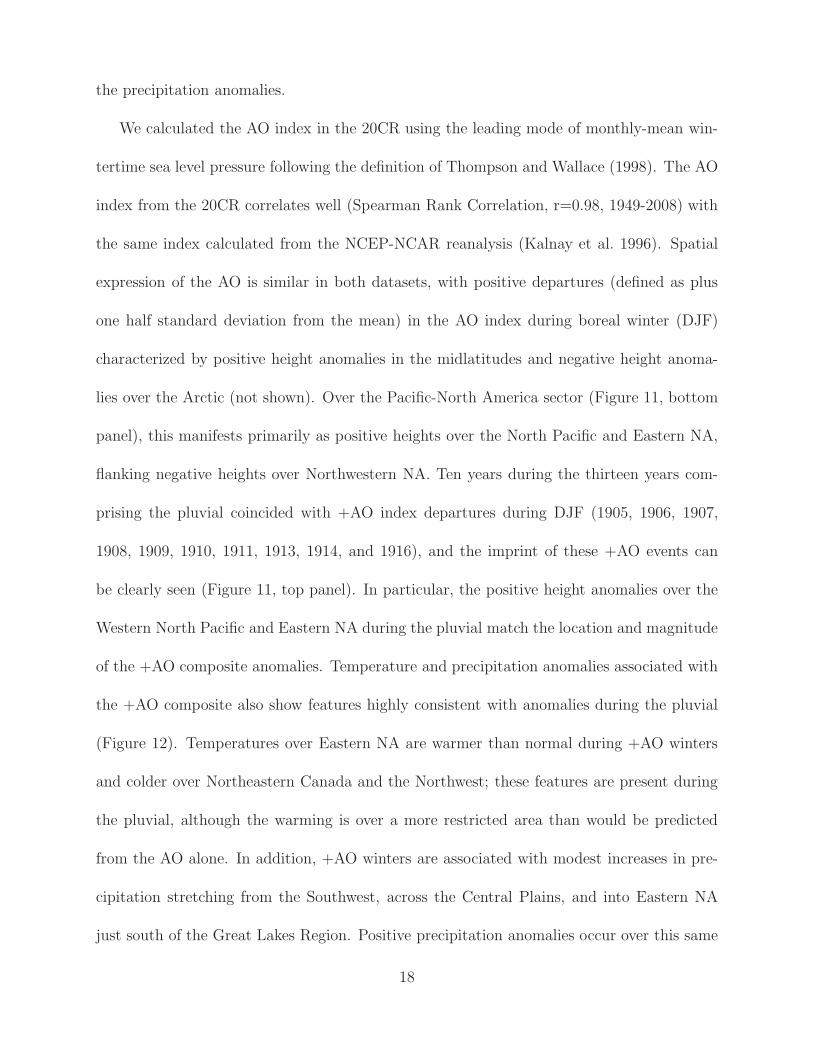
We calculated the AO index in the 20CR using the leading mode of monthly-mean win-
tertime sea level pressure following the definition of Thompson and Wallace (1998). The AO
index from the 20CR correlates well (Spearman Rank Correlation, r=0.98, 1949-2008) with
the same index calculated from the NCEP-NCAR reanalysis (Kalnay et al. 1996). Spatial
expression of the AO is similar in both datasets, with positive departures (defined as plus
one half standard deviation from the mean) in the AO index during boreal winter (DJF)
characterized by positive height anomalies in the midlatitudes and negative height anoma-
lies over the Arctic (not shown). Over the Pacific-North America sector (Figure 11, bottom
panel), this manifests primarily as positive heights over the North Pacific and Eastern NA,
flanking negative heights over Northwestern NA. Ten years during the thirteen years com-
prising the pluvial coincided with +AO index departures during DJF (1905, 1906, 1907,
1908, 1909, 1910, 1911, 1913, 1914, and 1916), and the imprint of these +AO events can
be clearly seen (Figure 11, top panel). In particular, the positive height anomalies over the
Western North Pacific and Eastern NA during the pluvial match the location and magnitude
of the +AO composite anomalies. Temperature and precipitation anomalies associated with
the +AO composite also show features highly consistent with anomalies during the pluvial
(Figure 12). Temperatures over Eastern NA are warmer than normal during +AO winters
and colder over Northeastern Canada and the Northwest; these features are present during
the pluvial, although the warming is over a more restricted area than would be predicted
from the AO alone. In addition, +AO winters are associated with modest increases in pre-
cipitation stretching from the Southwest, across the Central Plains, and into Eastern NA
just south of the Great Lakes Region. Positive precipitation anomalies occur over this same
18
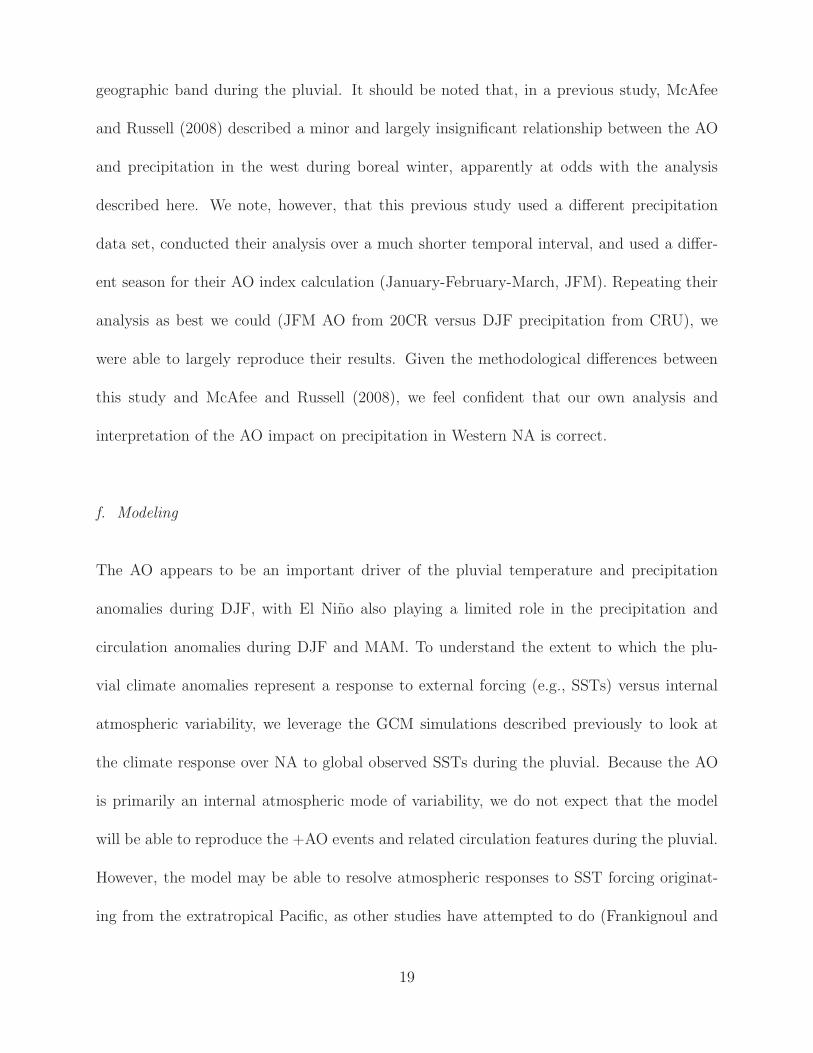
geographic band during the pluvial. It should be noted that, in a previous study, McAfee
and Russell (2008) described a minor and largely insignificant relationship between the AO
and precipitation in the west during boreal winter, apparently at odds with the analysis
described here. We note, however, that this previous study used a different precipitation
data set, conducted their analysis over a much shorter temporal interval, and used a differ-
ent season for their AO index calculation (January-February-March, JFM). Repeating their
analysis as best we could (JFM AO from 20CR versus DJF precipitation from CRU), we
were able to largely reproduce their results. Given the methodological differences between
this study and McAfee and Russell (2008), we feel confident that our own analysis and
interpretation of the AO impact on precipitation in Western NA is correct.
f. Modeling
The AO appears to be an important driver of the pluvial temperature and precipitation
anomalies during DJF, with El Nino also playing a limited role in the precipitation and
circulation anomalies during DJF and MAM. To understand the extent to which the plu-
vial climate anomalies represent a response to external forcing (e.g., SSTs) versus internal
atmospheric variability, we leverage the GCM simulations described previously to look at
the climate response over NA to global observed SSTs during the pluvial. Because the AO
is primarily an internal atmospheric mode of variability, we do not expect that the model
will be able to reproduce the +AO events and related circulation features during the pluvial.
However, the model may be able to resolve atmospheric responses to SST forcing originat-
ing from the extratropical Pacific, as other studies have attempted to do (Frankignoul and
19

Sennechael 2007; Kushnir et al. 2002; Peng and Whitaker 1999; Wen et al. 2010).
Geopotential heights composited from all El Nino years in the GCM ensemble show that
the model does a good job reproducing the major circulation features associated with El
Nino in the reanalysis (Figure 13, top panel), although with somewhat weaker amplitudes.
During the pluvial, however, the height anomaly pattern diverges from the reanalysis and
seems to simply reflect the imprint of the five El Nino events (Figure 13, bottom panel).
In the model composite, the positive height anomalies over the western North Pacific and
eastern NA are absent, and the major region of negative heights is centered over the ocean,
rather than being shifted to the east over the west coast of NA as it is in the reanalysis.
Since these features were largely a consequence of the +AO during the pluvial, something
the model is not capable of reproducing as a response to SST forcing, these differences are
not surprising. Temperature anomalies from the GCM ensemble (Figure 14) are cool but
muted compared to the observations and the model also does not reproduce the observed
spatial structure. The precipitation anomalies from the model largely reflect the influence
of El Nino events in the mean pluvial circulation, with enhanced precipitation in the SW
and Mexico in DJF and MAM (Figure 15). These anomalies, however, are muted compared
to observations (Figure 5), and have slightly different spatial patterns. For example, model
precipitation anomalies during DJF are shifted too far to the south, and the major pre-
cipitation increases occur in MAM, rather than DJF. These deviations from the observed
anomalies are also not surprising in light of the potentially important impact of the +AO
during the pluvial. As an aside, it should also be noted that two other atmosphere circu-
lation models, CAM3 and CAM4, are also unable to reproduce the pluvial anomalies (see
here: http://rainbow.ldeo.columbia.edu/%7Ejennie/comparemodel/).
20
In a recent study, Cook et al. (in press) used a statistical drought model to investigate
SST forcing of persistent multi-year twentieth century hydroclimatic events over western
NA, including the pluvial. Using statistical modes representing drought variability associ-
ated with tropical and extratropical Pacific SSTs, they were able to reproduce the magnitude
and spatial pattern of the pluvial above random noise in over 95% of their model ensemble
members, with an anomaly correlation between the ensemble median modeled drought pat-
tern and observations of 0.76. Their conclusion, that knowledge of tropical and extratropical
Pacific SSTs should be sufficient to predict the pluvial, appears to be at odds with results
from our SST forced GCM simulations which seem unable to fully resolve the important
circulation and precipitation anomalies.
In the statistical model, the mode of drought variability associated with the extratropical
North Pacific SSTs may simply reflect forcing of SSTs by atmospheric circulation anomalies,
or could be a high latitude expression of ocean variability linked to dynamics in the tropical
Pacific (An et al. 2007; Schneider and Cornuelle 2005). This would cause internal variability
to be mistaken for forcing in the statistical model and overestimate the SST-forced compo-
nent of the pluvial. On longer timescales than ENSO, Pacific SST variability is dominated
by the Pacific Decadal Oscillation (PDO), or Pacific Decadal Variability (PDV), which has a
strong expression in the North Pacific Ocean (Mantua et al. 1997; Zhang et al. 1997). Much
work has been done, mostly of an observational nature, suggesting that NA hydroclimate
can be influenced by the PDO (e.g., Gershunov and Barnett 1998; Goodrich 2007; McCabe
et al. 2004, 2008). For example, differences in a variety of hydroclimatic variables can be seen
in western NA between positive and negative phases of the PDO, even when only neutral
ENSO years are considered (e.g., Goodrich 2007). And for various combinations of PDO and
21

ENSO phases, drought and pluvial anomalies can be either amplified or diminished (e.g.,
Kurtzman and Scanlon 2007). However, the PDO is also associated with strong tropical
Pacific SST anomalies (Zhang et al. 1997) and these PDO-hydroclimate links could be ex-
plained by the tropical SST anomalies. Indeed, no GCM study to date has demonstrated
that any appreciable portion of the hydroclimate history of North America is explained as a
response to extratropical SST anomalies either in the Pacific or Atlantic Oceans. It is worth
noting, however, that Fye et al. (2004) surmised the atmospheric circulation anomalies dur-
ing the pluvial using only North Pacific SST information, conjecturing that the combined
warm tropical Pacific and cold North Pacific would lead to anticyclonic anomalies over the
western north Pacific and a long-wave trough centered near the west coast of NA. While the
physical basis for why this would happen is unclear, these circulation features are clearly
shown in Figure 11. It may be that this GCM, like others, potentially misses an impact
of SST anomalies in the extratropical Pacific on hydroclimatic variability over NA (which
are implicitly resolved within a statistical framework) or it could be that the circulation
anomalies important to the pluvial were a combination of El Nino forcing with significant
internal atmospheric variability, such as the AO. Only more work, including simulation with
other GCMs, may be able to resolve this issue.
4. Conclusions
Throughout history, persistent periods of extreme climate have significantly impacted the
functioning of societies, and have often been instrumental in shaping resource use policies and
societal reorganizations (e.g., Buckley et al. 2010; Hansen and Libecap 2004). One such event,
22

the early twentieth century pluvial, set up unrealistic expectations for water availability
in western NA, leading to development trajectories that surpassed the long-term support
capacity defined by the climatology of the region (Christensen et al. 2004). Increasing our
understanding of the causes and dynamics of this, and other, climate events can help us
place current and future climate changes in the proper context and inform how we deal with
these events at the societal level. The specific goal of this study was to investigate the causes
of the moisture surpluses during the early twentieth century pluvial, and determine how well
anomalies during that time fit into our understanding of NA hydroclimatic variability. Our
main results are summarized:
• Across the west, the origin of the moisture surpluses during the pluvial varied by
region and can be attributed primarily to increased precipitation (the SW), decreased
evaporative demand (the CP), or a combination of the two (the NW).
• El Nino played a partial role in the pluvial circulation anomalies and moisture sur-
pluses, contributing primarily to increased moisture convergence and precipitation in
the SW. However, other anomalies in the SST, circulation, and precipitation anomaly
fields diverged from the expected El Nino response. Forced circulation responses to
cold extratropical SSTs in the North Pacific were difficult to definitively diagnose either
within the 20CR or the GOGA model runs.
• Ten winters during the pluvial were associated with +AO events, and this is reflected
in much of the circulation, temperature, and precipitation anomaly patterns during
DJF. The large role played by the AO, an internal mode of atmospheric variability,
coupled with the relatively weak ENSO and SST forcing at the time, implies that the
23
pluvial was not predictable from SST information. If, however, the AO continues along
a positive trajectory, as predicted by many models (Miller et al. 2006), it may help
ameliorate some of the projected drying in the subtropics, including the SW region
(Seager 2007).
• However, the intensity and spatial extent of the pluvial can be well reproduced using
a statistical model with conceptualized tropical and extratropical Pacific SST forcing
(Cook et al. in press). An independent GCM simulation driven by SST observations
produces the El Nino response observed during the pluvial, but is incapable of simu-
lating other important features.
Studies of pluvial events (e.g., Schubert et al. 2008; Seager et al. 2005b) in the climate
literature are relatively rare when compared to the wealth of drought investigations. This
asymmetry is somewhat understandable, given the huge direct and indirect economic costs
associated with droughts (e.g., Cook et al. 2007). Even climatically advantageous periods
like the pluvial, however, may have adverse consequences if they are not placed in the proper
context, as witnessed by the overly generous nature of the CRC (Christensen et al. 2004).
Extensive research into drought variability over North America has helped illuminate the
role of SST variability in the ENSO region, and highlighted the importance of La Nina
events as major drivers of persistent drought in the west (e.g., Seager et al. 2005b). For the
early twentieth century pluvial, however, our investigation indicates that SSTs in the ENSO
region had relatively little explanatory power, and highlights the potentially important role of
internal variability (the AO, cool temperatures, etc) for driving moisture surpluses. Research
into pluvial dynamics is hampered, however, by the paucity of extended pluvial events that
24
have occurred during the instrumental period.
The discrepancy between the statistical model and the GCM also highlights some of
the uncertainties and the often disparate conclusions reached by empirical (McCabe et al.
2004, 2008) versus model based (Seager et al. 2005b; Seager 2007) investigations of North
American hydroclimatic variability. Specifically, the two camps disagree on the efficacy of
extratropical North Pacific forcing of NA hydroclimate with the GCM experiments indicating
the dominance of tropical forcing. Reducing this key uncertainty will require further studies
exploiting both empirical analyses and modeling.
Acknowledgments.
The authors thank three anonymous reviews for comments that significantly improved the
quality of this manuscript. Twentieth Century Reanalysis V2 data provided by the NOAA/OAR/ESRL
PSD, Boulder, Colorado, USA, from their Web site at http://www.esrl.noaa.gov/psd/.
Support for the Twentieth Century Reanalysis Project dataset is provided by the U.S. De-
partment of Energy, Office of Science Innovative and Novel Computational Impact on The-
ory and Experiment (DOE INCITE) program, and Office of Biological and Environmental
Research (BER), and by the National Oceanic and Atmospheric Administration Climate
Program Office. The authors gratefully acknowledge support from the NSF Climate Dy-
namics Program and the NASA Atmospheric Composition Program, as well as NSF grant
ATMO9-02716 and NOAA grant NA100AR-4310137. Lamont Contribution XXXX.
25

REFERENCES
Adams, D. and A. Comrie, 1997: The North American Monsoon. Bulletin of the American
Meteorological Society, 78 (10), 2197–2213.
An, S., J. Kug, A. Timmermann, I. Kang, and O. Timm, 2007: The Influence of ENSO on
the Generation of Decadal Variability in the North Pacific*. Journal of Climate, 20 (4),
667–680.
Andrade Jr, E. and W. Sellers, 1988: El Nino and its effect on precipitation in Arizona and
western New Mexico. International Journal of Climatology, 8 (4), 403–410.
Barnett, T. and D. Pierce, 2009: Sustainable water deliveries from the Colorado River in a
changing climate. Proceedings of the National Academy of Sciences, 106 (18), 7334.
Brohan, P., J. Kennedy, I. Harris, S. Tett, and P. Jones, 2006: Uncertainty estimates in
regional and global observed temperature changes: A new data set from 1850. Journal of
Geophysical Research-Atmospheres, 111 (D12), D12 106.
Buckley, B., et al., 2010: Climate as a contributing factor in the demise of Angkor, Cambodia.
Proceedings of the National Academy of Sciences, 107 (15), 6748.
Christensen, N., A. Wood, N. Voisin, D. Lettenmaier, and R. Palmer, 2004: The effects of
climate change on the hydrology and water resources of the Colorado River basin. Climatic
Change, 62 (1), 337–363.
26

Compo, G., J. Whitaker, and P. Sardeshmukh, 2006: Feasibility of a 100-year reanalysis
using only surface pressure data. Bulletin of the American Meteorological Society, 87 (2),
175–190.
Compo, G. P., et al., 2011: The twentieth century reanalysis project. Quarterly Journal of
the Royal Meteorological Society, 137 (654), 1–28, URL http://dx.doi.org/10.1002/
qj.776.
Cook, B., E. Cook, K. Anchukaitis, R. Seager, and R. Miller, in press: Forced and unforced
variability of twentieth century North American droughts and pluvials. Climate Dynamics,
DOI 10.1007/s00 382–010–0897–9.
Cook, B., R. Seager, and R. Miller, 2010: Atmospheric circulation anomalies during two
persistent north american droughts: 1932-1939 and 1948-1957. Climate Dynamics, in
press (DOI: 10.1007/s00382-010-0807-1).
Cook, E., D. Meko, D. Stahle, and M. Cleaveland, 1999: Drought Reconstructions for the
Continental United States*. Journal of Climate, 12 (4), 1145–1162.
Cook, E., R. Seager, M. Cane, and D. Stahle, 2007: North American drought: Reconstruc-
tions, causes, and consequences. Earth Science Reviews, 81 (1-2), 93–134.
Cook, E., C. Woodhouse, C. Eakin, D. Meko, and D. Stahle, 2004: Long-Term Aridity
Changes in the Western United States. Science, 306 (5698), 1015–1018.
Deser, C., M. Alexander, S. Xie, and A. Phillips, 2010: Sea Surface Temperature Variability:
Patterns and Mechanisms. Annu. Rev. Mar. Sci, 2, 115–43.
27

Dettinger, M., 2004: Fifty-two years of “pineapple-express” storms across the West Coast
of North America. Tech. rep., US Geological Survey, Scripps Institution of Oceanography
for the California Energy Commission.
Dracup, J., K. Lee, and E. Paulson Jr, 1980: On the definition of droughts. Water Resources
Research, 16 (2), 297–302.
Enfield, D., A. Mestas-Nunez, and P. Trimble, 2001: The Atlantic Multidecadal Oscillation
and its relationship to rainfall and river flows in the Continental US. Geophys. Res. Lett,
28, 2077–2080.
Frankignoul, C. and N. Sennechael, 2007: Observed influence of North Pacific SST anomalies
on the atmospheric circulation. Journal of Climate, 20 (3), 592–606.
Fye, F., D. Stahle, and E. Cook, 2003: Paleoclimatic analogs to twentieth-century moisture
regimes across the United States. Bulletin of the American Meteorological Society, 84 (7),
901–909.
Fye, F., D. Stahle, and E. Cook, 2004: Twentieth-Century Sea Surface Temperature Patterns
in the Pacific during Decadal Moisture Regimes over the United States. Earth Interactions,
8, 1–22.
Gershunov, A. and T. Barnett, 1998: Interdecadal modulation of ENSO teleconnections.
Bulletin of the American Meteorological Society, 79 (12), 2715–2725.
Goodrich, G., 2007: Influence of the Pacific decadal oscillation on winter precipitation and
drought during years of neutral ENSO in the western United States. Weather and fore-
casting, 22 (1), 116–124.
28
Hansen, Z. and G. Libecap, 2004: Small Farms, Externalities, and the Dust Bowl of the
1930s. Journal of Political Economy, 112 (3), 665–694.
Herweijer, C., R. Seager, E. Cook, and J. Emile-Geay, 2007: North American Droughts
of the Last Millennium from a Gridded Network of Tree-Ring Data. Journal of Climate,
20 (7), 1353–1376.
Hobbins, M., A. Dai, M. Roderick, and G. Farquhar, 2008: Revisiting the parameterization of
potential evaporation as a driver of long-term water balance trends. Geophysical Research
Letters, 35 (12), L12 403.
Hu, Q. and S. Feng, 2010: Influence of the Arctic oscillation on central United States summer
rainfall. Journal of Geophysical Research (Atmospheres), 115 (D14), 01 102.
Junge, M. and T. Haine, 2001: Mechanisms of North Atlantic wintertime sea surface tem-
perature anomalies. Journal of Climate, 14 (24), 4560–4572.
Kalnay, E., et al., 1996: The NCEP/NCAR 40-year reanalysis project. Bulletin of the Amer-
ican Meteorological Society, 77 (3), 437–471.
Kaplan, A., M. Cane, Y. Kushnir, A. Clement, M. Blumenthal, and B. Rajagopalan, 1998:
Analyses of global sea surface temperature 1856-1991. Journal of Geophysical Research,
103 (18), 567–18.
Kiehl, J., J. Hack, G. Bonan, B. Boville, D. Williamson, and P. Rasch, 1998: The Na-
tional Center for Atmospheric Research Community Climate Model: CCM3*. Journal of
Climate, 11 (6), 1131–1149.
29
Kurtzman, D. and B. Scanlon, 2007: El Nino–Southern Oscillation and Pacific Decadal
Oscillation impacts on precipitation in the southern and central United States: Evaluation
of spatial distribution and predictions. Water Resources Research, 43 (10), W10 427.
Kushnir, Y., W. Robinson, I. Blade, N. Hall, S. Peng, and R. Sutton, 2002: Atmospheric
GCM response to extratropical SST anomalies: Synthesis and evaluation. Journal of cli-
mate, 15 (16), 2233–2256.
Kushnir, Y., R. Seager, M. Ting, N. Naik, and J. Nakamura, 2010: Mechanisms of Tropical
Atlantic SST Influence on North American Hydroclimate Variability. Journal of Climate,
doi: 10.1175/2010JCLI3172.1.
MacDonnell, L., D. Getches, and W. Hugenberg Jr, 1995: The law of the Colorado River:
Coping with severe sustained drought. Water Resources Bulletin, 31 (5), 825–836.
Mantua, N., S. Hare, Y. Zhang, J. Wallace, and R. Francis, 1997: A Pacific Interdecadal
Climate Oscillation with Impacts on Salmon Production. Bulletin of the American Mete-
orological Society, 78 (6), 1069–1079.
McAfee, S. and J. Russell, 2008: Northern annular mode impact on spring climate in the
western United States. Geophysical Research Letters, 35 (17), L17 701.
McCabe, G., J. Betancourt, S. Gray, M. Palecki, and H. Hidalgo, 2008: Associations of multi-
decadal sea-surface temperature variability with US drought. Quaternary International,
188 (1), 31–40.
McCabe, G., M. Palecki, and J. Betancourt, 2004: Pacific and Atlantic Ocean influences on
30
multidecadal drought frequency in the United States. Proceedings of the National Academy
of Sciences, 101 (12), 4136–4141.
Meko, D., C. Woodhouse, C. Baisan, T. Knight, J. Lukas, M. Hughes, and M. Salzer,
2007: Medieval drought in the upper Colorado River Basin. Geophysical Research Letters,
34 (10), 10 705–10 709.
Miller, R., G. Schmidt, and D. Shindell, 2006: Forced annular variations in the 20th century
Intergovernmental Panel on Climate Change Fourth Assessment Report models. Journal
of Geophysical Research (Atmospheres), 111 (D10), 18 101.
Mitchell, T. and P. Jones, 2005: An improved method of constructing a database of monthly
climate observations and associated high-resolution grids. Int. J. Climatol, 25 (6), 693–
712.
Mo, K., J. Schemm, and S. Yoo, 2009: Influence of ENSO and the Atlantic Multidecadal
Oscillation on Drought over the United States. Journal of Climate, 22, 5962–5982.
Palmer, W., 1965: Meteorological drought. Research paper, 45, 1–58.
Peng, S. and J. Whitaker, 1999: Mechanisms Determining the Atmospheric Response to
Midlatitude SST Anomalies. Journal of Climate, 12 (5), 1393–1408.
Rayner, N., D. Parker, E. Horton, C. Folland, L. Alexander, D. Rowell, E. Kent, and A. Ka-
plan, 2003: Global analyses of sea surface temperature, sea ice, and night marine air
temperature since the late nineteenth century. J. Geophys. Res, 108 (D14), 4407.
31

Reisner, M., 1993: Cadillac desert: the American West and its disappearing water. Penguin
Group USA.
Schneider, N. and B. Cornuelle, 2005: The Forcing of the Pacific Decadal Oscillation. Journal
of Climate, 18 (21), 4355–4373.
Schubert, S., M. Suarez, P. Pegion, R. Koster, and J. Bacmeister, 2008: Potential pre-
dictability of long-term drought and pluvial conditions in the US Great Plains. Journal of
Climate, 21 (4), 802–816.
Schubert, S., et al., 2009: A US CLIVAR Project to Assess and Compare the Responses of
Global Climate Models to Drought-Related SST Forcing Patterns: Overview and Results.
Journal of Climate, 22 (19), 5251–5272.
Seager, R., 2007: The Turn of the Century North American Drought: Global Context,
Dynamics, and Past Analogs. Journal of Climate, 20 (22), 5527–5552.
Seager, R., N. Harnik, Y. Kushnir, W. Robinson, and J. Miller, 2003: Mechanisms of hemi-
spherically symmetric climate variability. Journal of Climate, 16 (18), 2960–2978.
Seager, R., N. Harnik, W. Robinson, Y. Kushnir, M. Ting, H. Huang, and J. Velez, 2005a:
Mechanisms of ENSO-forcing of hemispherically symmetric precipitation variability. Quar-
terly Journal of the Royal Meteorological Society, 131 (608).
Seager, R., Y. Kushnir, C. Herweijer, N. Naik, and J. Velez, 2005b: Modeling of Tropical
Forcing of Persistent Droughts and Pluvials over Western North America: 1856–2000.
Journal of Climate, 18 (19), 4065–4088.
32

Sophocleous, M., 2010: Review: groundwater management practices, challenges, and inno-
vations in the High Plains aquifer, USA—lessons and recommended actions. Hydrogeology
Journal, 18 (3), 559–575.
St George, S., D. Meko, and E. Cook, 2010: The seasonality of precipitation signals embedded
within the North American Drought Atlas. The Holocene, 20 (6), 983.
Stockton, C. and G. Jacoby, 1976: Long-Term Surface-Water Supply and Streamflow Trends
in the Upper Colorado River Basin. Lake Powell Research Project Bulletin, 1 (18).
Thompson, D. and J. Wallace, 1998: The Arctic Oscillation signature in the wintertime
geopotential height and temperature fields. Geophysical Research Letters, 25 (9), 1297–
1300.
Thornthwaite, C., 1948: An approach toward a rational classification of climate. Geographical
review, 38 (1), 55–94.
Wallace, J. and D. Gutzler, 1981: Teleconnections in the geopotential height field during the
Northern Hemisphere winter. Monthly Weather Review, 109 (4), 784–812.
Wen, N., Z. Liu, Q. Liu, and C. Frankignoul, 2010: Observed Atmospheric Responses to
Global SST Variability Modes: A Unified Assessment Using GEFA*. Journal of Climate,
23 (7), 1739–1759.
Whitaker, J., G. Compo, X. Wei, and T. Hamill, 2004: Reanalysis without radiosondes using
ensemble data assimilation. Monthly Weather Review, 132, 1190–1200.
33

Wood, K. and J. Overland, 2009: Early 20th century arctic warming in retrospect. Interna-
tional Journal of Climatology, Early View.
Woodhouse, C., K. Kunkel, D. Easterling, and E. Cook, 2005: The twentieth-century pluvial
in the western United States. Geophysical Research Letters, 32 (7), L07 701.
Worster, D., 1992: Rivers of empire: Water, aridity, and the growth of the American West.
Oxford University Press, USA.
Zhang, Y., J. Wallace, and D. Battisti, 1997: ENSO-like interdecadal variability: 1900-93.
Journal of Climate, 10 (5), 1004–1020.
34

List of Figures
1 Ensemble spread (meters) in annual average 500 hPa geopotential heights
from the 20CR during the pluvial interval (1905-1917). 38
2 Summer season (June-July-August, JJA) tree-ring reconstructed PDSI anoma-
lies from the NADA, averaged across all pluvial years (1905-1917). 39
3 Area averaged summer season (June-July-August, JJA) tree-ring reconstructed
PDSI from the NADA v2a for 1500-2005. All time series are smoothed with
a five year lowess filter. Time series correspond to the outlined boxes in Fig-
ure 1: the Southwest (SW; 125oW-103oW, 25oN-42oN), the Northwest (NW;
125oW-103oW, 42oN-50oN), and the Central Plains (CP; 103oW-90oW, 35oN-
50oN). 40
4 Seasonal temperature anomalies during 1905-1917 from the CRU 2.1 climate
grids, relative to the 1961-1990 mean (K). 41
5 Precipitation anomalies during 1905-1917 from the CRU 2.1 climate grids,
expressed as percent difference relative to the 1961-1990 mean. 42
6 Temperature (K) and precipitation (mm day-1) anomalies during 1905-1917
for the three outlined regions. The indicated three month seasons represent
the main evaporation and precipitation seasons for each region. Dashed lines
are a scaled version of the NINO3.4 index, included to indicate the five El
Nino years during the pluvial (1905, 1906, 1912, 1914, 1915). All temperature
and precipitation anomalies are relative to the 1961-1990 mean. 43
35

7 Summer season (JJA) PDSI calculated from the CRU 2.1 precipitation and
temperature climate grids averaged over the Southwest (SW, left column),
Northwest (NW, center column), and Central Plains (CP, right column). For
the pluvial period (1905-1917), PDSI is alternately calculated with observed
temperature and observed precipitation (top row), climatological tempera-
ture and observed precipitation (center row), and observed temperature and
climatological precipitation (bottom row). 44
8 Global and Northern Hemisphere averaged surface temperature anomalies (K,
from HadCRU), 1870-1940. The 1905-1917 pluvial interval (shaded grey) was
relatively cool compared to either the preceding or following decades. 45
9 Summer (JJA) temperature versus precipitation anomalies, averaged over the
three regions for 1901-2002 (from the CRU 2.1 climate grids). Years during the
pluvial (1905-1917) are colored in blue. Spearman rank correlations between
temperature and precipitation are shown on each plot. 46
10 Composite DJF sea surface temperature anomalies (K, from HadISST v1)
from all El Nino years (n=38) during the instrumental period (top) compared
to mean composite sea surface temperature anomalies from the thirteen year
pluvial interval (1905-1917; bottom). 47
11 Composite 500 hPa geopotential heights (meters) for all pluvial years (1905-
1917; top), composite El Nino winters and composite +AO winters. 48
12 Composite temperature and precipitation anomalies for all +AO winters. 49
36

13 Composite 500 hPa geopotential heights (meters) for all El Nino years (top)
and all pluvial years (1905-1917; bottom) from the ensemble mean of the
GCM simulations. 50
14 Temperature anomalies during 1905-1917 from the ensemble mean of the GCM
simulations (K), relative to the 1961-1990 ensemble mean. 51
15 Precipitation anomalies during 1905-1917 from the ensemble mean of the
GCM simulations, expressed as percent difference relative to the 1961-1990
ensemble mean. 52
37

20CR Ensemble Spread (m), 500 hPa Hgt (1905−1917)
0o 60
oE 120
oE 180
oW 120
oW 60
oW 0
o
60oS
30oS
0o
30oN
60oN
90oN
10 10
1010
1010
10
202020
20
20
20
20
30303030
40
404040
50
50
5050
30
30
30
30
60
60
6060
40
40
40
40
70
7070
70
80
808080
50
50
50
5060
60
60
6070
70
70
70
90
9090
90
90
90
8080
80
809090
90
90
20
20
90
8080
Fig. 1. Ensemble spread (meters) in annual average 500 hPa geopotential heights from the20CR during the pluvial interval (1905-1917).
38

140 oW
120 oW
100oW
80oW
60o W
24 oN
36 oN
48 oN
60 oN
72 oN
NADA v2a PDSI: 1905−1917
−5
−4
−3
−2
−1
0
1
2
3
4
5
Fig. 2. Summer season (June-July-August, JJA) tree-ring reconstructed PDSI anomaliesfrom the NADA, averaged across all pluvial years (1905-1917).
39
1500 1550 1600 1650 1700 1750 1800 1850 1900 1950 2000−5
0
5
NADA v2a PDSI (JJA): Central Plains
1500 1550 1600 1650 1700 1750 1800 1850 1900 1950 2000−5
0
5
NADA v2a PDSI (JJA): Northwest
1500 1550 1600 1650 1700 1750 1800 1850 1900 1950 2000−5
0
5
NADA v2a PDSI (JJA): Southwest
Fig. 3. Area averaged summer season (June-July-August, JJA) tree-ring reconstructedPDSI from the NADA v2a for 1500-2005. All time series are smoothed with a five yearlowess filter. Time series correspond to the outlined boxes in Figure 1: the Southwest(SW; 125oW-103oW, 25oN-42oN), the Northwest (NW; 125oW-103oW, 42oN-50oN), and theCentral Plains (CP; 103oW-90oW, 35oN-50oN).
40
140 oW
120 oW
100oW
80oW
60o W
24 oN
36 oN
48 oN
60 oN
72 oN
2
SON Temp, 1905-1917 (K)
140 oW
120 oW
100oW
80oW
60o W
24 oN
36 oN
48 oN
60 oN
72 oN
JJA Temp, 1905-1917 (K)
140 oW
120 oW
100oW
80oW
60o W
24 oN
36 oN
48 oN
60 oN
72 oN
MAM Temp, 1905-1917 (K)
100 W
140 oW
120 oW
100oW
80oW
60o W
24 oN
36 oN
48 oN
60 oN
72 oN
DJF Temp, 1905-1917 (K)
2.25
2.55
1.95
1.65
1.35
1.05
0.75
0.45
0.15
-0.15
-0.45
-0.75
-1.05
-1.35
-1.65
-1.95
-2.25
-2.55
Fig. 4. Seasonal temperature anomalies during 1905-1917 from the CRU 2.1 climate grids,relative to the 1961-1990 mean (K).
41

140 oW
120 oW
100oW
80oW
60o W
24 oN
36 oN
48 oN
60 oN
72 oN
DJF Precip, 1905-1917 (%)
−65
−55
−45
−35
−25
−15
−5
5
15
25
35
45
55
65
140 oW
120 oW
100oW
80oW
60o W
24 oN
36 oN
48 oN
60 oN
72 oN
MAM Precip, 1905-1917 (%)
140 oW
120 oW
100oW
80oW
60o W
24 oN
36 oN
48 oN
60 oN
72 oN
JJA Precip, 1905-1917 (%)
140 oW
120 oW
100oW
80oW
60o W
24 oN
36 oN
48 oN
60 oN
72 oN
SON Precip, 1905-1917 (%)
Fig. 5. Precipitation anomalies during 1905-1917 from the CRU 2.1 climate grids, expressedas percent difference relative to the 1961-1990 mean.
42

1905 1910 1915 1920 1925
−3
−2
−1
0
1
NW Temp Anomaly (K), JJA
1905 1910 1915 1920 1925
−3
−2
−1
0
1
CP Temp Anomaly (K), JJA
1905 1910 1915 1920 1925
−3
−2
−1
0
1
SW Temp Anomaly (K), JJA
1905 1910 1915 1920 1925−1
−0.5
0
0.5
1
SW Precip (mm day−1), DJF
1905 1910 1915 1920 1925−1
−0.5
0
0.5
1
NW Precip (mm day−1), DJF
1905 1910 1915 1920 1925−1
−0.5
0
0.5
1
CP Precip (mm day−1), JJA
Fig. 6. Temperature (K) and precipitation (mm day-1) anomalies during 1905-1917 for thethree outlined regions. The indicated three month seasons represent the main evaporationand precipitation seasons for each region. Dashed lines are a scaled version of the NINO3.4index, included to indicate the five El Nino years during the pluvial (1905, 1906, 1912, 1914,1915). All temperature and precipitation anomalies are relative to the 1961-1990 mean.
43

1905 1910 1915 1920 1925
−3
−2
−1
0
1
2
3
SW PDSI (Obs T, Obs P)
1905 1910 1915 1920 1925
−3
−2
−1
0
1
2
3
SW PDSI (Clim T, Obs P)
1905 1910 1915 1920 1925
−3
−2
−1
0
1
2
3
SW PDSI (Obs T, Clim P)
1905 1910 1915 1920 1925
−3
−2
−1
0
1
2
3
NW PDSI (Obs T, Clim P)
1905 1910 1915 1920 1925
−3
−2
−1
0
1
2
3
NW PDSI (Clim T, Obs P)
1905 1910 1915 1920 1925
−3
−2
−1
0
1
2
3
NW PDSI (Obs T, Obs P)
1905 1910 1915 1920 1925
−3
−2
−1
0
1
2
3
CP PDSI (Obs T, Clim P)
1905 1910 1915 1920 1925
−3
−2
−1
0
1
2
3
CP PDSI (Clim T, Obs P)
1905 1910 1915 1920 1925
−3
−2
−1
0
1
2
3
CP PDSI (Obs T, Obs P)
Fig. 7. Summer season (JJA) PDSI calculated from the CRU 2.1 precipitation and temper-ature climate grids averaged over the Southwest (SW, left column), Northwest (NW, centercolumn), and Central Plains (CP, right column). For the pluvial period (1905-1917), PDSI isalternately calculated with observed temperature and observed precipitation (top row), cli-matological temperature and observed precipitation (center row), and observed temperatureand climatological precipitation (bottom row).
44

1870 1880 1890 1900 1910 1920 1930 1940
−0.6
−0.5
−0.4
−0.3
−0.2
−0.1
0
0.1
0.2
HadCRU Annual Temp Anomalies (K)
Globe
NH
Fig. 8. Global and Northern Hemisphere averaged surface temperature anomalies (K, fromHadCRU), 1870-1940. The 1905-1917 pluvial interval (shaded grey) was relatively coolcompared to either the preceding or following decades.
45

−4 −2 0 2 4−2
−1.5
−1
−0.5
0
0.5
1
1.5
2
Temp Anomaly (K)
P
recip
An
om
aly
(m
m d
ay
−1)
Temp vs Precip: CP, JJA
All Years
Pluvial Years
−2 −1 0 1 2−1
−0.5
0
0.5
1
Temp Anomaly (K)
P
recip
An
om
aly
(m
m d
ay
−1)
Temp vs Precip: SW, JJA
All Years
Pluvial Years
−2 −1 0 1 2−1
−0.5
0
0.5
1
Temp Anomaly (K)
P
recip
An
om
aly
(m
m d
ay
−1)
Temp vs Precip: NW, JJA
All Years
Pluvial Years
r = -0.52r = -0.32 r = -0.56
Fig. 9. Summer (JJA) temperature versus precipitation anomalies, averaged over the threeregions for 1901-2002 (from the CRU 2.1 climate grids). Years during the pluvial (1905-1917)are colored in blue. Spearman rank correlations between temperature and precipitation areshown on each plot.
46

0o 60
oE 120
oE 180
oW 120
oW 60
oW 0
o
60oS
30oS
0o
30oN
60oN
DJF SST Anomaly (K): All El Nino Years
0o 60
oE 120
oE 180
oW 120
oW 60
oW 0
o
60oS
30oS
0o
30oN
60oN
DJF SST Anomaly (K): Pluvial (1905−1917)
−1.1
−0.9
−0.7
−0.5
−0.3
−0.1
0.1
0.3
0.5
0.7
0.9
1.1
Fig. 10. Composite DJF sea surface temperature anomalies (K, from HadISST v1) from allEl Nino years (n=38) during the instrumental period (top) compared to mean composite seasurface temperature anomalies from the thirteen year pluvial interval (1905-1917; bottom).
47

120oE 160
oE 160
oW 120
oW 80
oW
0o
18oN
36oN
54oN
72oN
0
0
0
0
5
5
5
5
0
0
0
10
10
10
10
5
5
10
1020
20
20
20
−40 40
−40
−30−30
−30
−30
−30
−30
−30
−20
−20
−20
−20
−20
−20
−20
−20
−20
−20
−20
−20
−20 −20
−20
−10
−10
−10
−10
−10
−10 −10
−10
−10
−10
−5−5
−5
−5
−5
−5
−5
−5
−5
DJF Height Anomaly: 500 hPa, Pluvial (1905−1917)
120oE 160
oE 160
oW 120
oW 80
oW
0o
18oN
36oN
54oN
72oN
0
0
0
0
0
00
0
0
5
5
5
55
5
5
5
10
10
10
10
10
10
20
20
5
20
30
DJF Height Anomaly: 500 hPa, All El Niño Years
−60
−50
−50
−40
−40
−40
−30
−30
−30
−30
−20
−20
−20
−20
−20
−10
−10
−10
−10
−10
−5
−5
−5
−5
−5
−5
−5
DJF Height Anomaly: 500 hPa, All +AO Years
120oE 160
oE 160
oW 120
oW 80
oW
0o
18oN
36oN
54oN
72oN
0
0
0
0
5
5
5
5
5
10
10
10
10
0
0
0
5
5
5
10
1020
20
20
200
30
−50
−50
−40
−40
−30
−30
−30
−30
−20
−20 −20 −20
−10
−10 −10
−10
−10−5 −5
−5
−5
−5
−5
−5
−5 −5
Fig. 11. Composite 500 hPa geopotential heights (meters) for all pluvial years (1905-1917;top), composite El Nino winters, and composite +AO winters.
48

140 oW
120 oW
100oW
80oW
60o W
24 oN
36 oN
48 oN
60 oN
72 oN
DJF Temp, +AO Years (K)
−2.55−2.25−1.95−1.65−1.35−1.05−0.75−0.45−0.150.150.450.751.051.351.651.952.252.55
140 oW
120 oW
100oW
80oW
60o W
24 oN
36 oN
48 oN
60 oN
72 oN
DJF Precip, +AO Years (%)
−65
−55
−45
−35
−25
−15
−5
5
15
25
35
45
55
65
Fig. 12. Composite temperature and precipitation anomalies for all +AO winters.
49

120oE 160
oE 160
oW 120
oW 80
oW
0o
18oN
36oN
54oN
72oN
0
0
0
5
5 5
10
10
0
0
0
DJF Height Anomaly (GOGA): 500 hPa, Pluvial (1905−1917)
−20
−20
−10−10
−10
−10
−10
−10
−10
−10
−5 −5
−5
−5−
5−
5
−5
−5
−5−5
−5 −5
−5
−5
−5
120oE 160
oE 160
oW 120
oW 80
oW
0o
18oN
36oN
54oN
72oN
0
0
0
0 0
0
5
5
5 55
0
0
0
0
10
10
10
10
55
5
5
10
10
10
10
20
20
20
5
5
0
−20
−20
−20 −10
−10
−10
−10
−10
5
−5
−5−5
−5
−5
−5
−5 −5
DJF Height Anomaly (GOGA): 500 hPa, All El Nino Years
Fig. 13. Composite 500 hPa geopotential heights (meters) for all El Nino years (top) andall pluvial years (1905-1917; bottom) from the ensemble mean of the GCM simulations.
50

140 oW
120 oW
100oW
80oW
60o W
24 oN
36 oN
48 oN
60 oN
72 oN
SON Temp, 1905-1917 (K, GOGA)
140 oW
120oW
100oW
80oW
60o W
24 oN
36 oN
48 oN
60 oN
72 oN
JJA Temp, 1905-1917 (K, GOGA)
140 oW
120 oW
100oW
80oW
60o W
24 oN
36 oN
48 oN
60 oN
72 oN
MAM Temp, 1905-1917 (K, GOGA)
140 oW
120oW
100oW
80oW
60o W
24 oN
36 oN
48 oN
60 oN
72 oN
DJF Temp, 1905-1917 (K, GOGA)
100 W
2.25
2.55
1.95
1.65
1.35
1.05
0.75
0.45
0.15
-0.15
-0.45
-0.75
-1.05
-1.35
-1.65
-1.95
-2.25
-2.55
Fig. 14. Temperature anomalies during 1905-1917 from the ensemble mean of the GCMsimulations (K), relative to the 1961-1990 ensemble mean.
51

140 oW
120 oW
100oW
80oW
60o W
24 oN
36 oN
48 oN
60 oN
72 oN
SON Precip, 1905-1917 (%, GOGA)
140 oW
120 oW
100oW
80oW
60o W
24 oN
36 oN
48 oN
60 oN
72 oN
JJA Precip, 1905-1917 (%, GOGA)
140 oW
120 oW
100oW
80oW
60o W
24 oN
36 oN
48 oN
60 oN
72 oN
MAM Precip, 1905-1917 (%, GOGA)
140 oW
120 oW
100oW
80oW
60o W
24 oN
36 oN
48 oN
60 oN
72 oN
DJF Precip, 1905-1917 (%, GOGA)
−65
−55
−45
−35
−25
−15
−5
5
15
25
35
45
55
65
Fig. 15. Precipitation anomalies during 1905-1917 from the ensemble mean of the GCMsimulations, expressed as percent difference relative to the 1961-1990 ensemble mean.
52
Related Documents