Ambient Air Pollutant Background Concentrations: Development & Use aq-ppt5-02

Welcome message from author
This document is posted to help you gain knowledge. Please leave a comment to let me know what you think about it! Share it to your friends and learn new things together.
Transcript

Ambient Air Pollutant Background Concentrations:
Development & Use
aq-ppt5-02
Overview
• Definition of a “background concentration” • Tiered background approach • Example #1- Single Monitor near Facility • Example #2 – Single Monitor not near Facility • Example #3 – “nearest neighbor” approach • Notes on Modeled Background
Concentrations

Definition of Background Concentration
Appendix W – Section 8.2.1a Background air quality includes pollutant concentrations due to: (1) Natural sources; (2) nearby sources other than the one(s) currently under consideration; and (3) unidentified sources.
Appendix W – Section 8.2.3b All sources expected to cause a significant concentration gradient in the vicinity of the source or sources under consideration for emission limit(s) should be explicitly modeled. The number of such sources is expected to be small except in unusual situations.

Tiered Background Approach
Ambient Design Values
Single-Site Monitor Background Concentrations
Multiple Monitor Triangulation/Nearest Neighbor
Alternative Approaches
Ambient Design Values
• Working definition: – The standard itself has a form, level, and
averaging period (e.g. three year average) – The design value is the EPA/MPCA defined statistic
that combines the form and averaging period of the standard (e.g. 3-year average of the 98th percentile concentration) to the level of the standard.
– Design values are calculated annually for each monitoring site.
Ambient Design Values
• Useful – Based on ambient air monitoring data – Widely applicable
• Downside – Generic values may not reflect site-specific
conditions – Lack of monitor density in the state – Challenge with the new standards

Single-Site Monitor Background Concentrations
Useful § Can provide a site-specific background concentration Downside § Involves a detailed evaluation of ambient monitoring
data § Incomplete coverage of monitoring data in the state § Need three years of data to complete the analysis

Single-Site Monitor Background Concentrations
A description of monitoring data proposed as representative of the proposed project area. The description should include the statistics of the data set and the quality control/assurance measures conducted for the data (Note: This also applies to raw data provided by the MPCA). Examples of acceptable statistics include correlation or covariance-related analysis of surface roughness that describe the relationship between the two sites. • Description of the monitoring data
– Basic descriptive statistics of the data – Basic description with statistics to support surface roughness features
of the monitor site and the source under review • May use a simple correlation approach and test for significance or use
covariance approaches for geostatistical data • Quality Control/Assurance Measures
– This requirement applies to data collected by an agency other than the MPCA or raw data provided by the MPCA

Single-Site Monitor Background Concentrations
A discussion of the similarity between the monitor location and the project area. A discussion should be provided that compares the two areas and supports the use of the monitoring data for the project site. Factors to consider:
A. The density and diversity of emission sources around the monitoring location. The purpose
of this factor is to determine if there are similarities between the monitoring location and the source under review. Note: This may also be useful information during the data editing process
B. A determination of how well the monitor captures the influence of nearby sources that are not affected by the project. Note: This is relevant if the monitor is within a reasonable distance of the source under review. If it is not – this analysis is still useful for the data editing process.
C. Differences in land use and terrain between the two locations that may influence air quality. Note: This analysis can be used to inform the first line item in the previous slide.
D. Similarity in monitor siting and probe height. Obvious key issue: probe height and siting location
E. Purpose of the monitoring activity and the geographic scale of representation.

Single-Site Monitor Background Concentrations
A detailed assessment of the meteorology of the project area and the area where monitoring data were obtained. For example, a wind-rose analysis that depicts the similarity between the project site and monitoring site in question, windspeed analysis (focus on frequency of clalm periods) and surface roughness comparison, as described above.

Single-Site Monitor Background Concentrations
• The distance between the monitor and the source under review. – There is an assumption that the closer a monitor
is to a source the more representative it will be of the ambient conditions.
– Document the type of pollutant, spatial distribution of sources, atmospheric characteristics of the pollutant (e.g., transformation, deposition, etc.) and meteorological conditions

Single-Site Monitor Background Concentrations
The approach used to edit out ambient air data from the monitoring data for sources that will be explicitly modeled. This is consistent with the definition of “background concentration” under Appendix W.

St. Paul Brass & Aluminum Foundry
Macalester College
RayVin, Inc. Monitor
Data Editing Case Study
§ RayVen, Inc is
expanding
§ Need an SO2 background that excludes explicit sources
§ SO2 Monitor is near the source
§ Nearby sources that should be explicitly modeled have been identified
Steps in the Data Editing Process
• Obtain monitoring data • Identify nearby sources that will be modeled explicitly • Using the monitoring site as the origin, identify the
direction (in degrees) of the nearby sources, and the facility under review
• Remove data points from the monitoring data that reflect the concentrations from the direction of the explicit nearby sources, and the facility under review
• Calculate background value with the remaining data, consistent with the form of the standards

St. Paul Brass & Aluminum Foundry
Macalester College
RayVin, Inc. Monitor

Findings
• Our monitoring data has revealed the following: – St. Paul Brass & Aluminum emissions recorded on
monitor with wind direction between 10 and 35 degrees
– Macalester College emissions recorded on monitor with wind direction between 200 and 235 degrees
• These values should be edited from the monitoring data – than proceed to traditional background concentration calculation
Multi-Site Monitor Background Concentrations
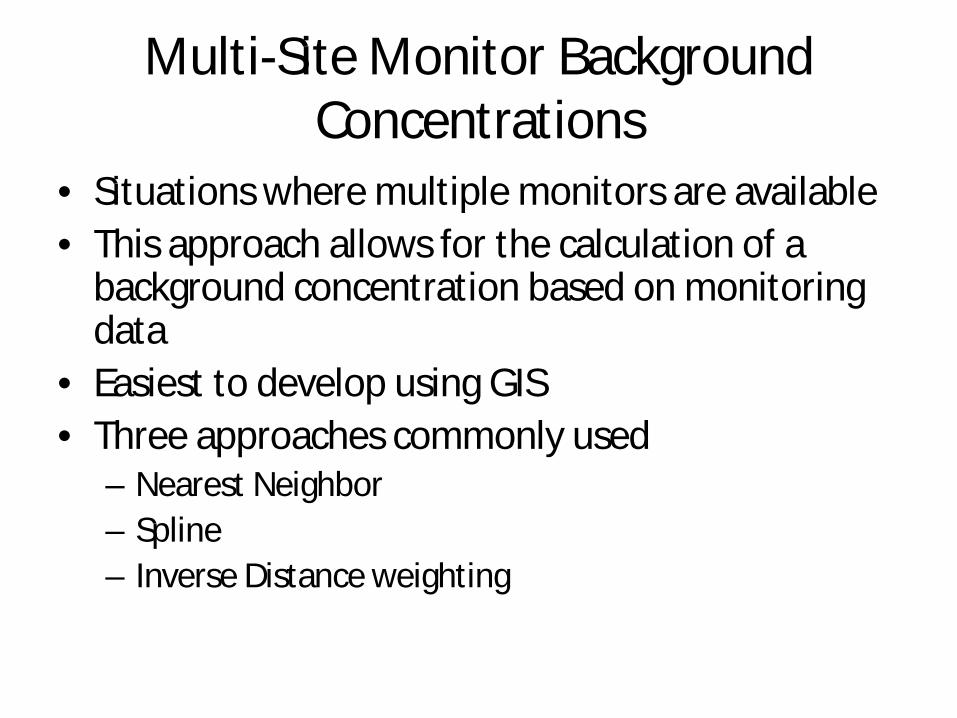
• Situations where multiple monitors are available • This approach allows for the calculation of a
background concentration based on monitoring data
• Easiest to develop using GIS • Three approaches commonly used
– Nearest Neighbor – Spline – Inverse Distance weighting
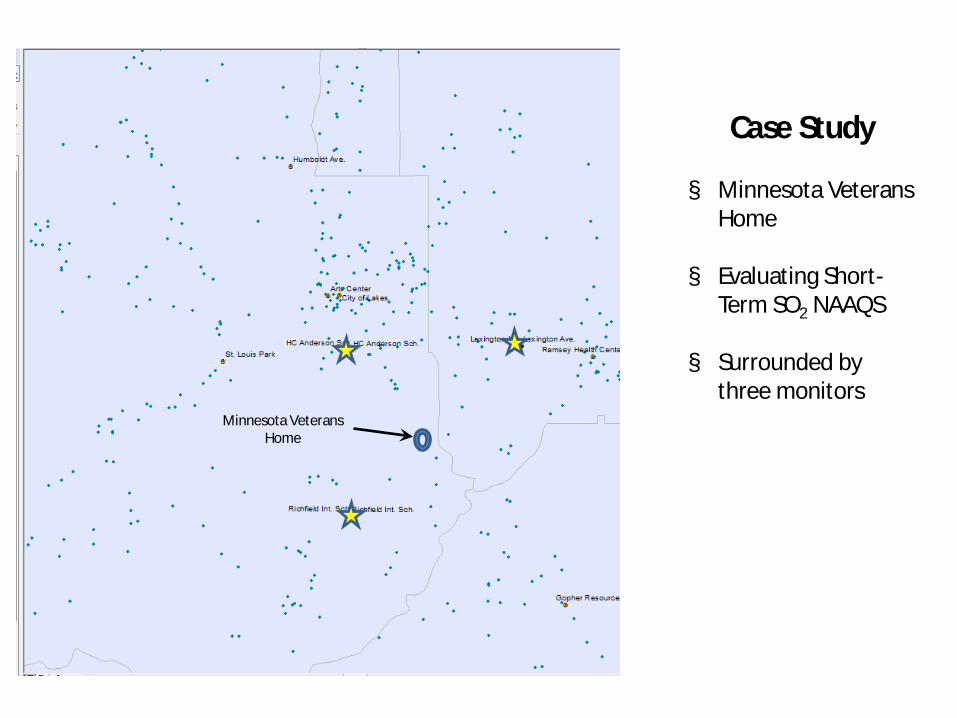
Case Study § Minnesota Veterans
Home
§ Evaluating Short-Term SO2 NAAQS
§ Surrounded by three monitors
Minnesota Veterans Home


Alternate (Non-Traditional) Approaches
• Case-by-case • Expect a justification for the use of a proposed
approach the explains why traditional approaches are insufficient
• Typical examples of non-traditional approaches include: – Modeled background values – Pairing approaches

Related Documents