VOL.36, No.2, AUTUMN 2005 ISSN 0084-5841

Welcome message from author
This document is posted to help you gain knowledge. Please leave a comment to let me know what you think about it! Share it to your friends and learn new things together.
Transcript

VO
L.36, NO
.2, Au
tum
n 2005
VOL.36, No.2, AUTUMN 2005
ISSN 0084-5841
Yoshisuke Kishida, Publisher & Chief EditorContributing Editors and Cooperators
- AFRICA -Kayombo, Benedict (Botswana)Fonteh, Fru Mathias (Cameroon)
El Behery, A.A.K. (Egypt)El Hossary, A.M. (Egypt)
Pathak, B.S. (Ethiopia)Bani, Richard Jinks (Ghana)Djokoto, Israel Kofi (Ghana)
Some, D. Kimutaiarap (Kenya)Houmy, Karim (Morocco)Igbeka, Joseph C. (Nigeria)
Odigboh, E.U. (Nigeria)Oni, Kayode C. (Nigeria)
Kuyembeh, N.G. (Sierra Leone)Abdoun, Abdien Hassan (Sudan)
Saeed, Amir Bakheit (Sudan)Khatibu, Abdisalam I. (Tanzania)Baryeh, Edward A. (Zimbabwe)Tembo, Solomon (Zimbabwe)
- AMERICAS -Cetrangolo, Hugo Alfredo (Argentina)
Naas, Irenilza de Alencar (Brazil)Ghaly, Abdelkader E. (Canada)
Hetz, Edmundo J. (Chile)Valenzuela, A.A. (Chile)
Aguirre, Robert (Colombia)Ulloa-Torres, Omar (Costa Rica)Magana, S.G. Campos (Mexico)
Ortiz-Laurel, H. (Mexico)Chancellor, William J. (U.S.A.)
Goyal, Megh Raj (U.S.A.)Mahapatra, Ajit K. (U.S.A.)Philips, Allan L. (U.S.A.)
Quick, G.R. (U.S.A.)
- ASIA and OCEANIA -Farouk, Shah M. (Bangladesh)Hussain, Daulat (Bangladesh)
Mazed, M.A. (Bangladesh)Gurung, Manbahadur (Bhutan)
Wang, Wanjun (China)Illangantileke, S. (India)
Ilyas, S. M. (India)Michael, A.M. (India)
Ojha, T.P. (India)Verma, S.R. (India)
Soedjatmiko (Indonesia)Behroozi-Lar, Mansoor (Iran)
Minaei, Saeid (Iran)Sakai, Jun (Japan)
Snobar, Bassam A. (Jordan)Chung, Chang Joo (Korea)
Lee, Chul Choo (Korea)Bardaie, Muhamad Zohadie (Malaysia)
Pariyar, Madan (Nepal)Ampratwum, David Boakye (Oman)
Eldin, Eltag Seif (Oman)Chaudhry, Allah Ditta (Pakistan)
Mughal, A.Q. (Pakistan)Rehman, Rafiq ur (Pakistan)
Devrajani, Bherular T. (Pakistan)Abu-Khalaf, Nawaf A. (Palestine)Nath, Surya (Papua New Guinea)Lantin, Reynaldo M. (Philippines)Venturina, Ricardo P. (Philippines)
Al-suhaibani, Saleh Abdulrahman (Saudi Arabia)Al-Amri, Ali Mufarreh Saleh (Saudi Arabia)
Chang, Sen-Fuh (Taiwan)Peng, Tieng-song (Taiwan)
Krishnasreni, Suraweth (Thailand)Phongsupasamit, Surin (Thailand)
Rojanasaroj. C. (Thailand)Salokhe, Vilas M. (Thailand)Singh, Gajendra (Thailand)
Pinar, Yunus (Turkey)Haffar, Imad (United Arab Emirates)
Lang, Pham Van (Viet Nam)Hazza’a, Abdulsamad Abdulmalik (Yemen)
- EUROPE -Kaloyanov, Anastas P. (Bulgaria)
Kic, Pavel (Czech)Have, Henrik (Denmark)Pellizzi, Giuseppe (Italy)
Wanders, A. Anne (Netherlands)Pawlak, Jan (Poland)
Marchenko, Oleg S. (Russia)Kilgour, John (U.K.)
Martinov, Milan (Yugoslavia)
EDITORIAL STAFF(Tel.+81-(0)3-3291-5718)
Yoshisuke Kishida, Chief EditorShinjiro Tetsuka, Managing Editor
Noriyuki Muramatsu, Assistant EditorZachary A. Henry, Editorial Consultant
ADVERTISING(Tel.+81-(0)3-3291-3672)
Yoshito Nakajima, Manager (Head Office)Hiroshi Yamamoto, Manager (Branch Office)Advertising Rate: 300 thousand yen per page
CIRCULATION(Tel.+81-(0)3-3291-5718)(Fax.+81-(0)3-3291-5717)
Editorial, Advertising and Circulation Headquarters7, 2-chome, Kanda Nishikicho, Chiyoda-ku, Tokyo 101-0054, Japan
URL: http://www.shin-norin.co.jpE-Mail: [email protected]
Copylight © 2005 byFARM MACHINERY INDUSTRIAL RESEACH CORP.
SHIN-NORIN Building7, 2-chome, Kanda Nishikicho, Chiyoda-ku, Tokyo 101-0054, Japan
Printed in Japan
This is the 125th issue since its maiden isue in the Spring of 1971

EDITORIAL
The advanced nations currently enjoying national prosperity have had the experience of agricultural development which later became the basis of industrial development. Today third and the fourth industries have developed enough to drive the economy. Yet, we have to admit that the basis of all industries is agriculture which produces food and a good natural environment required for human survival. In the history of agricultural development, mechanization has had the greatest impact on agriculture.
After WW2 in Japan, the investment in agricultural mechanization raised, not only agricultural production, but, also, industrial production by farmers. Only one percent of that total production value of farmers was invested in ag-ricultural machines which sustained Japanese agriculture and industries. More than thirty years ago it was said that mechanization of agriculture caused unemployment. The history of advanced nations, however, has proven that this was not true. On the contrary, mechanization generated new industries and expanded the opportunity for employment.
There are still many countries, mostly in the developing world, in need of agricultural mechanization. The gap be-tween developed and developing nations has widened steadily both economically and technologically. The farmers in developing nations want more support from developed nations. Their income is far lower than that of the farmers in developed nations which stands in the way of mechanization. In view of these realities, developed nations should give full support to promote mechanization in developing countries that would match each local situation.
The United Nations organizations and FAO are responsible for taking the initiative in providing that support. It is said that FAO is to cut down the department which has promoted agricultural mechanization in developing countries. I am greatly concerned about the support for mechanization of agriculture in developing countries as a result of that change in FAO. I would like to ask all of AMA readers, and the other people who have concerns to convey the message against this change for the worse to FAO by letters and e-mails.
AMA will maintain unchanging activity with its readers to back up the development of agricultural mechanization and engineering in developing countries. The largest part of the world population is farmers in the developing world. Unless they are making a good living, stable world peace will be never realized.
Yoshisuke KishidaChief Editor
Tokyo, JapanOctober , 2005
Yoshisuke Kishida
V.I.O. Ndirika
Toshiyuki Tsujimoto, Hai SakuraiKoichi Hashiguchi, Eiji Inoue
A.C. Ukatu
K.C. Roy, M.A. WohabA.D.M. Gulam Mustafa
A. Alam, Harpal SinghRanjan Mohnot, H.L. Kushwaha
D.S. Zibokere
Syed Zameer HussainS.C. Mandhar, S. Javare Gowda
Eden C. GageloniaB.D. Tadeo, E.G. Bautista
J.C. Cordero, J.A. DamianW.B. Collado, H. Monobe, S. IshiharaN. Sawamura, M. Daikoku, R. Otani
S. Soekarno, V.M. Salokhe
R. Kailappan, Parveen Kasur BaigN. Varadharaju, K. Appavu
V. Krishnasamy
Ying Yibin, Zhao Yun, Jin Juanqin
Ebubekir Altuntas
Turhan Koyuncu, Yunus Pinar
S.K. Dash, D.K. Das
T.W. Widodo, H. Ishida, J. TatsunoK. Tajima, E. Sakaguchi, K. Tamaki
AbstractsNews
Book Review
7
9
14
21
28
32
43
46
49
55
62
67
71
75
80
84
909394
Editorial
A Mathematical Model for Predicting Output Capacity of Selected Stationary Grain Threshers
Study on the Development of Agricultural Machines for Small-Scale Farmers, Pt.2 (Applied Technology to the Improvement of an Animal-Drawn Plow for Morocco and Africa)
Development of an Industrial Yam Peeler
Design and Development of a Low-Cost Potato Grader
Extensive Review of Crop Drying and Driers Developed in India
Insect Inhibitive Properties of Some Consumable Local Plant Mate-rials on Grains in Storage
Evaluation and Performance of Raw Mango Grader
Engineering the Crop Establishment System for Paddy Wet Seeding
Performance of Cage Wheel with Opposing Circumferential Lugs and Normal Cage Wheel in Wet Clay Soil
Fabrication and Testing of Tomato Seed Extractor
Computer-Aided Analysis of Forces Acting on a Trailed Plough
The Effects of Some Operational Parameters on Potato Planter’s Performance
The Use of Hot Air from Room Type Coolers for Drying Agricul-tural Products
Effect of Mechanization Level and Crop Rotation on Yield Energy Requirements
Simple Quality Evaluation of Chili Pepper Based on Continuous Weight Measurement During Dehydration Process
CONTENTS
AGRICULTURAL MECHANIZATION IN ASIA, AFRICA AND LATIN AMERICAVol.36, No.2, November 2005
New Co-operating Editors ..................................79Co-operating Editor ............................................97
Back Issues ........................................................100Instructions to AMA Contributors ...................102
★ ★ ★
VOL.36 NO.2 2005 AGRICULTURAL MECHANIZATION IN ASIA, AFRICA, AND LATIN AMERICA 9
A Mathematical Model for Predicting Output Capacity of Selected Stationary Grain Threshers
byV.I.O. NdirikaSenior Research Fellow/Senior LectureDepartment of Agricultural Engineering,Institute for Agricultural ResearchAhmadu Bello University, Zaria,NIGERIA
AbstractA mathematical expression for
predicting the output capacity for the threshing process in a throw-in-feed system of a selected stationary grain thresher is presented. The thresher output capacity model was developed by dimensional analysis, using the concept of Buckingham’s Pi Theorem. The model was veri fied and validated by fitting it into an established experimental data from stationary mechanical millet thresh-er. The result reveals that the fitted model correlates well with the ex-perimental data with R-square value of 0.99. Also, the dif ference between the means of the predicted and measured output ca pacities was not statistically signifi cant at 5 % level of significance. The yield factor (Km) obtained with the predicted model is approxi mately the same with the values ob tained from known and measured results.
IntroductionOne important criterion in evalu-
ating the performance of grain th reshers is the output capac-ity, which is the amount of grain threshed in an hour. The method of threshing often influences the output capacity. Traditionally, threshing of crops is carried out by beating with
pestle or stick and bul lock treading of harvested crops (Ndirika et al., 1996). However, the output capac-ity of these meth ods is very low, leading to delays in handling large volume of products and consequent losses (Singh and Joshi, 1979).
The development of agriculture during the past century and the in-creased productivity per agricultur al worker are due largely to the adop-tion of mechanical power for farm operations. The adaptation of the internal combustion engine and elec-tric motor for threshing opera tion in stationary powered grain thresh-ers has contributed to the progress in mechanization as they increase in magnitude of the crop processed and reduce time spent to complete threshing operation when compared to human-and animal-power (Mc-Colly and Martin, 1955).
The successful design and per-formance evaluation of a grain thresher depends on one’s knowl-edge of the output capacity, power requirement, threshing efficiency and grain loss (Ndirika, 1997; En-aburekhan, 1994; Gregory, 1988; Vas and Harrison, 1969). But not much information is available on the determination of the output ca pacity of grain threshers.
It has been reported that informa-tion pertaining to the crop-machine and operational parameters for sta-tionary grain threshers are limited.
Also, it has been reported that grain-straw ratio, bulk density, feed rate, separation efficiency and concave configurations influence the output capacity of grain thresh ers (Dash and Das, 1990, Enabu rekhan, 1994, Ndirika, 1997). Therefore, in mod-eling the output capacity these pa-rameters have to be studied and con-sidered in order to provide a better understanding of their fundamental relationships for the different ma-chines and crop variables. The limit-ed work on mathematical models for station ary grain threshers has been report ed by Huynh et al. (1982). The purpose of this study was to devel op and verify a mathematical mod el for predicting the output capacity of a stationary grain thresher.
Materials and MethodsTheoretical Development
The thresher output capacity model was developed by dimen sional analy-sis using the concept of Buckingham’s Pi Theory (Smith et al., 1970). The output capacity of a thresher (CT) can be modeled using dimensional analy-sis. Assume that the variables of im-portance are the feed rate (Fr), grain-straw ratio (Z) and the separation efficiency (Se) which is the fraction of threshed grain that was recovered through the concave opening by the concave configuration. Then,

AGRICULTURAL MECHANIZATION IN ASIA, AFRICA, AND LATIN AMERICA 2005 VOL.36 NO.210
CT = f (Fr, Z, Se) ...............................(1)
Using the [M],[L],[T] system of dimension, the dimensions of the variables identified in this study are presented in Table 1 while the di mensional matrix is presented in Table 2. The procedure for apply ing the Buckingham’s Pi Theorem to identify the dimensionless group to be formed is as follows:
The total number of variables = 4Number of fundamental dimen-
sions = 3Number of dimensionless groups
to be formed = 4 - 3= 1The required solution would be:
π = Km ...............................................(2)
Where, π = Pi term = dimension-less constant, Km
Km = Yield factorUsing the Buckingham’s Pi theo-
rem, p was found to be:
π = = Km ............................(3)
Rearrange equation 3 then,
CT = Km Fr Z Se ................................(4)
Huynh et al. (1982) predicted sep-aration efficiency as: (5)
Substituting the value of Se from equation 5 into equation 4 then, (6)
where,Λ1 = Threshing Parameter (mean
rate of threshing).Λ 2 = Grain migration parameter
(mean rate of migration or separa-tion for a grain through the crop stream thickness).Λ 3 = Concave separation param-
eter (Number of grains passing through the concave openings in one second per input).
According to Ndirika (1997), dwell time can be estimated as fol lows:td = Dwell time of the crop in the
thresher = ...........................(7)
where,Kb = Slippage factors for beater barsLc = Concave lengthVb = peripheral velocity of beater
The cylinder-concave arrange-ment and the description of crop mo-tion during threshing and sepa ration processes of the spike tooth thresher
used in the modeling are presented in Figs. 1 and 2, respec tively.
Determination of the Thresh-ing, Grain Migration and Con-cave Separation ParametersThe Threshing Parameter, Λ1
The threshing parameter, Λ1 which is the threshing frequency or the mean rate of threshing was deter mined by dimensional analysis us ing the concept of Buckingham’s Pi theorem and can be expressed as (Ndirika, 1997):
Λ1 = ..........................(8)
where,KT = Threshing constantVb = Peripheral velocity of beat ersσd = Crop bulk density (dry basis)D = Cylinder diameterβ= Moisture content of wet crop
(decimal)Fr = Feederate
Grain Migration Parameter,Λ 2
The grain migration parameter (mean rate of migration or separa tion for a grain through the crop stream thickness (Fig. 3) was mod eled based on the application of Newton’s second law of motion for a body under uniform acceleration start-ing from rest. It was assumed that the crop motion resistance (force)
CTFr Z Se
[Vb2σdD]
(1-β)Fr
Table 1 Dimensions of the variables influencing output capacity (CT)
Variable Symbol Dimensions, [M],[L],[T]Output capacity CT MT-1
Feedrate Fr MT-1
Grain-straw ratio Z -Separation efficiency Se -
Dimensions CT Fr Z Se
M 1 1 0 0L 0 0 0 0T -1 -1 0 0
Table 2 Dimensional matrix of variables
1-[Λ1Λ3(Λ3-Λ1)e-Λ2td+Λ2Λ1(Λ1-Λ2)e-Λ3td+Λ2Λ3(Λ2-Λ3)e-Λ1td](Λ1-Λ2) (Λ3-Λ2) (Λ3-Λ1)
Km Fr Z [1- [Λ1Λ3(Λ3-Λ1)e-Λ2td+Λ2Λ1(Λ1-Λ2)e-Λ3td+Λ2Λ3(Λ2-Λ3)e-Λ1td
(Λ1-Λ2) (Λ3-Λ2) (Λ3-Λ1)
LcKb Vb
Fig. 1 Cylinder-Concave arrangement of the spike tooth thresherFig. 2 Schematic description of crop motion during
threshing and separation processes of the model
Se =
CT =
...........(5)
...(6)

VOL.36 NO.2 2005 AGRICULTURAL MECHANIZATION IN ASIA, AFRICA, AND LATIN AMERICA 11
is constant and proportional to the force acting on the grain. The grain migration parameter was modeled and expressed as Ndirika (1997):
Λ 2 = ..........(9)
where,Kn= mean time coefficientg1 = acceleration due to gravita tional force in the vertical direction
Concave Separation Parame ter, Λ3
The following assumptions were made in determining the rate of grain passage through concave opening:
i. That the grain slides through the crop stream with constant ve locity across the concave surface;
ii That the passage of grain through a given concave opening formed by the rods and bars as shown by the concave geometry in Fig. 4 is only possible if the projec tion of the grain on the concave surface is within the concave open ing and;
iii That if the grain fails to pass through the concave opening it will move to the next concave opening at a constant speed.
The probability of grain passage through the concave opening was determined using the concept es-tablished by Huynh et al. (1982):
P = (a1-a2-d1)(b1-b2-d1)/(a1b1) ......(10)
for the concave geometry as in Fig. 4, where,
a1 = center line distance between rods;
b1 = center line distance between bars;
a2 = rod diameterb2 = width of the bar
d1 = average size of the grain which is considered spherical
P = probability of grain pas sage through the concave opening
The concave separation parame-ter, Λ3 was modeled and can be ex-pressed as Ndirika (1997):
Λ3 = 2/3Vb(a1-a2-d1)(b1-b2-d1)/a1b12..(10)
Values of ConstantsThe constants in the developed
relations were determined by the method of least squares analysis and by calculations using informa tion from available literature and pub-lished data. The values of con stants and sources used are present ed in Table 3.
Verification and Validation of the Model
The output capacity model was verified in order to confirm its con-sistency with established experi-
mental results from a thresher. The study was conducted on an existing millet thresher and the predicted model was also compared with the experimental data. The specifica-tions of the cylinder-concave unit and the operating conditions of the thresher used are shown in Tables 4 and 5, respectively.
A model would have greater con-fidence if a good fit and a high sig-nificance level is attained. However, the method developed by Gregory and Fedler (1986) for cal culating the coefficient of determi nation, R2 statistically for non-linear as well as for linear function and with one or more independent variables is ad-opted here. Thus,
R2 = 1 - Vo/Vt ..................................(11)
Where, R2 = coefficient of determinationVo
= estimated variance about the mean from the measured data
[g1+2Vb2/D]1/2
Kn[{1-β}Fr/σd Vb)1/2]
Fig.3 Force analysis of the crop stream in the threshing zone Fig.4 Concave configuration
S/N Constant Value Equation Source1 Km 0.69 6 Ndirika (1997)2 Kb 0.40 7 Huynh et al. (1982)3 KT 0.00218 8 Wagami (1979)4 Kn 2.25 9 Long et al. (1967) and Huynh et al. (1982)5 Z 0.66 6 Ndirika (1993)
Table 3 Values of constants
S/N Parameter Dimension1 Effective cylinder diameter, D 0.350m2 Concave Length, Lc 0.360m3 Cylinder concave clearance, C 0.006m4 Center line distance between adjacent concave rod, a1 0.018m5 Concave rod diameter, a2 0.008m6 Center line distance between adjacent concave bars, b1 0.025m7 Width of the concave bars, b2 0.0085m
Table 4 Cylinder and concave date for millet thresher

AGRICULTURAL MECHANIZATION IN ASIA, AFRICA, AND LATIN AMERICA 2005 VOL.36 NO.212
Vt = estimated variance about the mean of the data from the predicted model
Since the R2 value from equation 11 must have a level of significance before the model is considered veri fied, the statistical significance test was done to ascertain how ade-quately the sample data test used for developing the model repre sents the whole population. The significant level for a given R2 can be obtained by computing ‘t’ us ing the following equation (Snede cor and Cochran, 1980);
t = R(Df )1/2/ (1-R2)1/2.....................(12)
where,
t = Students ‘t’ valueR = Square root of coefficient of
determinationDf = Degrees of freedom (Num-
ber of data points minus Number of constant defined in the model)
The line of good fit is presented graphically (Fig. 5) and also used to compare the predicted output ca pacity model and the measured re sults. In order to further ascertain the validity of the model, equation 4 was linearlized by the method of least square, and by using the data in Table 6, the value of the con stant, Km in the equation was esti mated and compared to known values of Km. This was done using the results
from Table 6 by plotting the values of output capacities, CT from both the measured and pre dicted (com-puted) results against the product of feedrate (Fr), Grain-straw ratio (Z) and separation effi ciency (Se) as shown in Fig. 6. The same set of data was used to com pute the R-square value (R2).
Instrumentation and Measure mentsThe data generated from the sta-
tionary millet thresher used in the verification of the output capacity model were measured or evaluated by the following methods:
Capacit y measurement : The output capacity was measured by weighing the grains collected from the grain outlet at hourly intervals in the threshing operation.
Weight measurement: A met tler balance with 0.01 g calibration was used for weighing.
Time measurement: Time was measured using a stop watch.
Moisture content determina tion: Moisture content of crop was de-termined by oven dry method at a temperature of 130 ºC for 18 hours (ASAE, 1972).
Bulk density determination: The bulk density was found by weight- volume method under nat ural filling condition.
Speed measurement: A revolu tion counter (tachometer) was used for speed measurement.
Length measurement: A meter rule and vernier caliper was used in length measures.
S/N ParameterValue / Level
1 2 3 4 5 61 Feed rate, Fr (kg2)/s 0.02 0.03 0.04 0.05 0.06 0.072 Cylinder speed with road, Vb (m/s) 3.40 3.72 3.85 4.14 4.65 5.03 Cylinder speed in rpm 400 500 600 700 800 9004 Moisture content, ß (decimal) 0.09 0.10 0.11 0.12 0.13 0.142 Bulk densityσd (kg/m3) 102 98.6 90.2 82.83 75.8 62.123 Average grain Diameter, d1 (m) 0.003m7 Crop variety Ex-Borno4 Acceleration due to gravity of crop, g1 10m/s9 Power of prime mover used (kw) 3.7kw (5hp)
Table 5 Crop and operating conditions for millet thresher
Fig.5 Mesured vs predicted capacity for a millet thresherFig.6 Output capacity vs product of feedrate,
grain-straw ratio and separation efficiency
Cases Fr(kg/h)
Z(decimal)
Se(decimal)
X(Fr Z Se)
CT (kg/h)Predicted
(computed) Measured
1 29.87 0.66 0.956 19.02 13.12 13.312 31.62 0.66 0.966 20.16 13.91 14.113 49.66 0.66 0.968 31.73 21.89 22.214 57.45 0.66 0.983 37.27 25.72 26.095 60.67 0.66 0.984 39.40 27.19 27.58
Mean: 20.37 20.66Table 6 Experimental date: Measured and computed values of CT

VOL.36 NO.2 2005 AGRICULTURAL MECHANIZATION IN ASIA, AFRICA, AND LATIN AMERICA 13
Results and DiscussionsModel Validation
The output capacity model (Equa-t ion 6) was validated with the measured data from the existing millet thresher. From Fig. 5, it was observed that the model has a high correlation with the measured data obtained from the thresher with R2 value of 0.99 (Table 7). When the means of the predicted and mea-sured output capacities were com-pared statistically, it was shown that there was no significant differ ence between the means at 5 % lev el of significance, since the calculated ‘t’value (0.070) is less than the table ‘t’value (2.306) as shown in Table 7. From Fig. 6, the regression equation obtained from the least square anal-ysis for the pre dicted and measured results were:CT = 0.0012 + 0.69X and CT = -0.004 + 0.70X, respectively. Com paring the slopes (Km) of the two regression equations, it was ob served that the values of Km in both cases (0.69 and 0.70, respectively,) were approxi-mately the same. This also agrees with the value, 0.70 ob tained from Ajibola (1980). The results show that the model has a high correlation with the measured data from a millet thresher.
ConclusionsBased on the results of this study,
the following conclusions can be drawn: The output capacity of stationary grain thresher can be described us ing a mathematical model which in cludes parameters such as feed rate, grain–straw ratio, mean rate of threshing, mean rate of migration or separation of grain
through the crop stream thickness, number of grains passing through the concave open ings in one second per impact and dwell time of crop in the thresher.
This also takes into account vari-ables such as velocity of beaters, crop bulk density, cylinder diame-ter, crop moisture content, concave configurations and dimensions.
The difference between the means of the predicted and mea sured out-put capacities is not statis tically sig-nificant at 5 % level of significance.
The yield factor (Km) obtained with the predicted model is approx-imately the same with the values obtained from known and measured results.
The predicated output capacity model fits well with experimental results from existing millet thresh er.
REFERENCES
Ajiboye, R.A., 1980. Improvement on a locally built axial flow millet thresher.
B. Eng. Thesis. Dept. of Agricultural Engineering, Ahmadu Bello Uni-versity Zaria Nigeria.
ASAE., 1972. Moisture Measure-ment-Grain and Seeds. ASAE standard: S352, pp. 384
Dash, S.K. And Das, D.K., 1990. De-velopment Of A Power Oper ated Paddy Thresher. Agric. Mech. In Asia, Africa and Latin America, 20(3): 37-39.
Enaburekhan, J.S.O., 1994. Mathe-matical And Optimization Model-ling Of The Threshing Process In Stationary Grain Thresher, Unpublished Ph.D Thesis Dept Of Agric. Engineering A.B.U., Zaria.
Gregory, J.M., 1988. Combine Model For Grain Threshing. Mathemati-
cal Computer Model ing. Asae 11: 506-509.
Gregory, J. M. And Fedler, C.B., 1986. Model Evaluation And Re-search Verification (M.E.R.V.). Paper No. 86-5032. ASAE, St Jo-seph, Mi 49085.
Huynh, V.M., Powell, T. And Sid dall, J.N., 1982. Threshing And Sepa-rating Process - A Mathe matical Model, Trans. ASAE 65-73.
McColly, H.R. And Martin, J.W., 1955. Introduction To Agricul-tural Engineering,
McGraw- Hill Book Co. Inc New York, Toronto, London.
Ndirika, V.I.O., 1993. Development And Performance Evaluation Of A Millet Thresher. Journal Of Agri-cultural Technology. 1 (1): 2-10
Ndirika, V.I.O., Asota, C.N., Yiljep, Y.D. And Mudiare, O.J., 1996. Predicting The Power Require-ment And Threshing Efficiency Of Stationary Grain Threshers Us-ing Mathematical Models. Journal Of Agricultural Engineer ing And Technology. (4): 39-49.
Ndirika, V.I.O., 1997. Modeling The Performance Of Selected Sta-tionary Grain Threshers. Ph.D. Degree Thesis. Department Of Agricultural Engineering, Ahma-du Bello University Zaria Nigeria.
Singh, K.N. And Joshi, H.C., 1979. Axial Flow Paddy And Wheat Thresher. Appropriate Technol ogy Newsleter, Lucknow, U.P. India, 2(4): 5-6
Snedecor, G.W. And Cochran, W.G., 1980. Statistical Methods, 7th Edi-tion. The Iowa State Univer sity Press, Ames, Iowa.
Vas, F.M. And Harrison, H.P., 1969. The Effect Of Selected Mechani-cal Threshing Parameters On Ker-nel Damage And Threshabil ity Of Wheat. J. Canadian Agric. Engr. Research. 27: 119 - 130.
Wagami, S.Y., 1979. Design And Fab-rication Of A Prototype Thresher For Millet. B. Eng. Thesis. Depart-ment Of Agricul tural Engineering, Ahmadu Bello University Zaria, Nigeria. ■■
ModelValidation Parameters
R2 Value Calculated ‘t’ Value
Table ‘t’ Value Significance
Output Capacity (CT) 0.99 0.070 2.306 n.s.
Table 7 Calculated R2 and ‘t’ values of the compared output capacity modelwith measured date from millet thresher at P ≤ 0.05 level of significance
n.s.= Not significance
AGRICULTURAL MECHANIZATION IN ASIA, AFRICA, AND LATIN AMERICA 2005 VOL.36 NO.214
Study on the Development of Agricultural Machines for Small-Scale Farmers, Part 2(Applied Technology to the Improvement of an Animal-Drawn Plow for Morocco and Africa)
byToshiyuki TsujimotoJICA ExpertCFMA / IAVMOROCCO
Koichi HashiguchiProfessorKyushu University JAPAN
Hai SakuraiChief InstructorTBIC, JICAJAPAN
Eiji InoueAssoc. ProfessorKyushu University JAPAN
AbstractThe purpose of this research is to
improve the working performance of the animal-drawn plow for small-scale farmers in Africa, as based on conditions in Morocco. Animal-traction farming is not widespread in Africa, except in a few regions. Furthermore, tractor cultivation is still difficult for small-scale farm-ers due to economic constraints and the need for shared use of machines, which involves solving operational, technical and maintenance prob-lems.
The plowing depth with seed-covering cultivation is about 10 cm on the dry land of Morocco. Trac-tion forces are, therefore, low dur-ing actual operation. As a result, stable operation of animal-drawn plows and subsequent reduction of the workload on the draft animals
are being sought for farming opera-tions.
The minimizing of the standard deviation (SD) of measured data (amplitude of ranges) of the draft force was selected as the perfor-mance evaluation parameter for stable and efficient handling and for steady operation.
Throughout these experiments contributing most to the uniformity of plow performance the longest plow sole (51 cm) turned out to be the element when draft force, re-quired horsepower, stepping reduc-tion rate, and operational stability were considered.
IntroductionInfection of animals due to tsetse
flies is one of the primary reasons that animal traction has not been
popular in the agriculture of Af-rica, especially in the Sub-Saharan regions (FAO, 1990), as reported by Munzinger (1982). The use of horses, mules, asses (donkeys), or cows for animal traction is statisti-cally very low, and the practical use of animals for draft power is lower than in other countries. No infec-tion from tsetse flies is presently re-ported in Morocco. However, every country of Sub-Saharan Africa is endeavoring to eradicate infectious diseases, such as that from tsetse f lies, through widely developed cooperation with Kenya, Tanzania, Ghana, the Ivory Coast, Nigeria, and other countries.
Animal t ract ion is presently widely used in Morocco, regard-less of farm size. An investigation (Tsujimoto, 2002) of 35 agricultural cooperative associations indicated that one dominant feature of small-

VOL.36 NO.2 2005 AGRICULTURAL MECHANIZATION IN ASIA, AFRICA, AND LATIN AMERICA 15
scale farmers was the possession of an animal plow, harrow, or transport equipment item. S hared machines for animal power were considered to be important elements of farm ma-chinery inventory. Horses and mules were the main types of draft animals used for farming. The small-scale farmer, in particular, used the ass as a draft animal. Use of these domes-tic animals for farming is commonly noted among farmers holding 10 ha or less. Many farmers with holdings of a 50 ha scale also own cattle and other animals for use on their farms. Use of the traditional wooden plow for animal traction is dominant. The iron plow is made principally by two manufacturers; however, a local fac-tory for small-scale farm machines and implements produces a similar plow, which can be made to order. The same firm can also perform maintenance on the units produced.
The Moroccan government pro-vides a subsidy when the farmer buys these implements. For the animal-drawn plow the amount of subsidy has been designated as 50%. The government tries to encourage improvement of animal plows for small-scale farmers, but thus far, no research has been performed to im-prove plow stability or ease of han-dling. Therefore, research on modi-fication of the plow was carried out under typical conditions in Morocco. Technology from North Africa, from
a country such as Morocco, or from Europe, should be adopted for ap-plication to animal-drawn plows in other African countries such as the Sub-Saharan nations where upland crops, including wheat, are culti-vated and traditional animal power is used, rather than adapting tech-niques based on different farming conditions, for example, those from the rice farming areas in the Asian region.
Traditional plowing is used for wheat cultivation, and is called crop seed coverings. Plowing is done im-mediately after broadcast seeding. Therefore, it is not necessary to plow very deeply. The plowing depth is generally about 8 to 10 cm. Thus, local manufacturers in Morocco produce animal-drawn plows with a 31 cm plow sole. This results in poor handling efficiency and inconsistent operational stability and causes diffi-culties. There is also a problem with the durability of the animal plow.
The features of an animal-drawn plow in Morocco are described be-low.
1. It is used extensively in hilly terrain and mountainous regions.
2. The greatest advantage of using an animal-drawn plow in Morocco should be its ease of handling since plowing and covering of seed with soil are carried out simultaneously after hand sowing, with extremely shallow plowing of 8 to 10cm.
3. The fields are sandy, stony, and dry.
4. The harnesses and yokes of the draft animals are generally simple, thus, draft uniformity and easy han-dling of the plow are necessary.
5. The horse, mule, or the donkey generally works at a high speed, but they do not have sufficient energy, which causes the walking speed to decrease within 20 minutes of start-ing work (Bansal, 1992). This factor can apply additional stress to the animals. Therefore, the farmer could work more easily if draft force uni-formity and handling were improved, so that more continuous and stable work could be accomplished.
An experiment comparing the conditions of different lengths of the original plow sole for animal traction was conducted during this research. Depth and draft-force uniformity, as well as efficiency of handling were evaluated, and a simple-to-use plow was developed for small-scale farm-ers in North Africa.
Experimental MethodThe experimental devices and
field conditions are depicted in Figs. 1 and 2. A single horse was used for traction to help achieve stabil-ity and continuity of operation. A male horse that weighs about 2000 N (204 kg mass is the standard for
Fig. 1 Experimental devicesforce-measuring sensor by strain gage (4-gage method)
Draft Hitch Point (DHP)
Draft Resistance Point (DRP)
B (1200mm)
C (290mm)
G (360mm)F (2300mm)
D (550mm)E (710mm)
A (810mm)
Draft Power Point (DPP)
Fig. 2 Position of the DPP, RHP and DRP
AGRICULTURAL MECHANIZATION IN ASIA, AFRICA, AND LATIN AMERICA 2005 VOL.36 NO.216
Morocco. The horse’s health was excellent on the day of the experi-ment. Although the experiment ex-tended from morning to afternoon, the horse did not exhibit fatigue and was plowing constantly. The improved animal plow used for the experiment was designed as a modified version of the reversible type commonly used in Japan (an improved Japanese plow), and a trial was conducted in a factory for small-scale farm machines and im-plements in Morocco. Another ex-ample is the reversible type, of plow which is manufactured in northeast Spain and is called a Catalan plow (Spanish plow), which was made and assembled for trial purposes at this factory.
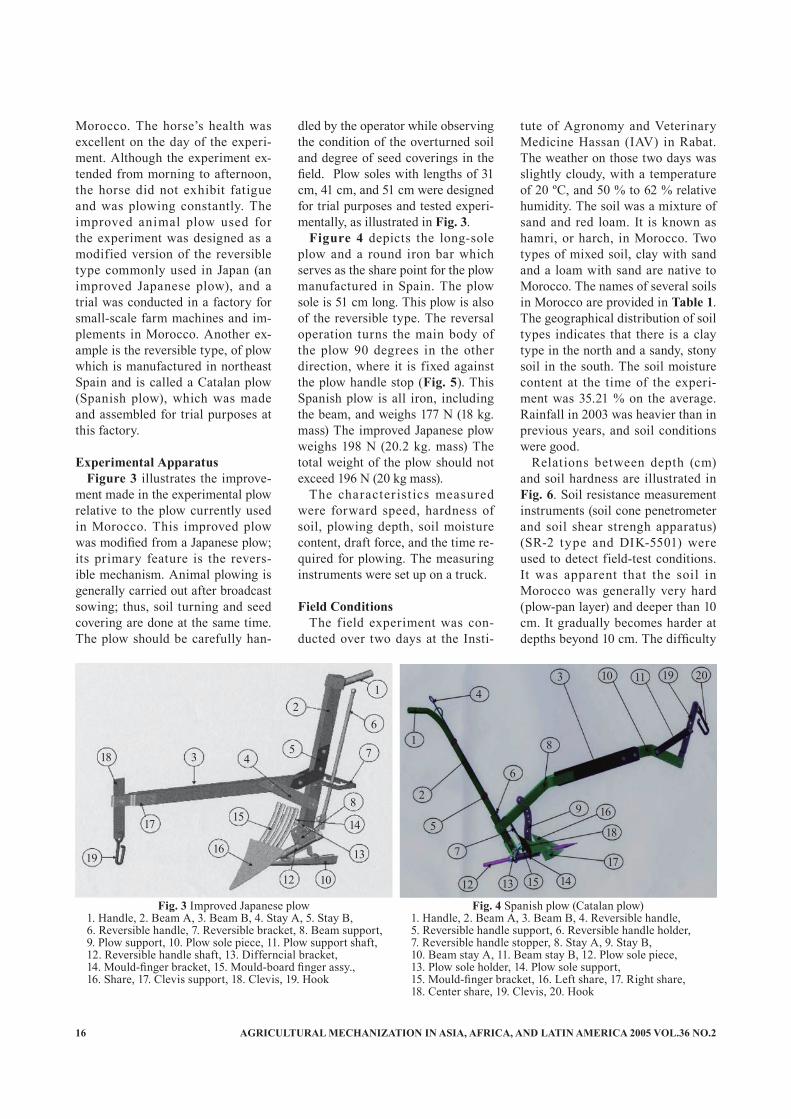
Experimental ApparatusFigure 3 illustrates the improve-
ment made in the experimental plow relative to the plow currently used in Morocco. This improved plow was modified from a Japanese plow; its primary feature is the revers-ible mechanism. Animal plowing is generally carried out after broadcast sowing; thus, soil turning and seed covering are done at the same time. The plow should be carefully han-
Fig. 3 Improved Japanese plow1. Handle, 2. Beam A, 3. Beam B, 4. Stay A, 5. Stay B, 6. Reversible handle, 7. Reversible bracket, 8. Beam support, 9. Plow support, 10. Plow sole piece, 11. Plow support shaft, 12. Reversible handle shaft, 13. Differncial bracket, 14. Mould-finger bracket, 15. Mould-board finger assy., 16. Share, 17. Clevis support, 18. Clevis, 19. Hook
Fig. 4 Spanish plow (Catalan plow)1. Handle, 2. Beam A, 3. Beam B, 4. Reversible handle, 5. Reversible handle support, 6. Reversible handle holder,7. Reversible handle stopper, 8. Stay A, 9. Stay B,10. Beam stay A, 11. Beam stay B, 12. Plow sole piece, 13. Plow sole holder, 14. Plow sole support,15. Mould-finger bracket, 16. Left share, 17. Right share,18. Center share, 19. Clevis, 20. Hook
19
18
1312
7
4
1
5
2
6
12
7
8
14
13
1012
543
15
16
17
103
15 1417
18
169
8
6
201911
dled by the operator while observing the condition of the overturned soil and degree of seed coverings in the field. Plow soles with lengths of 31 cm, 41 cm, and 51 cm were designed for trial purposes and tested experi-mentally, as illustrated in Fig. 3.
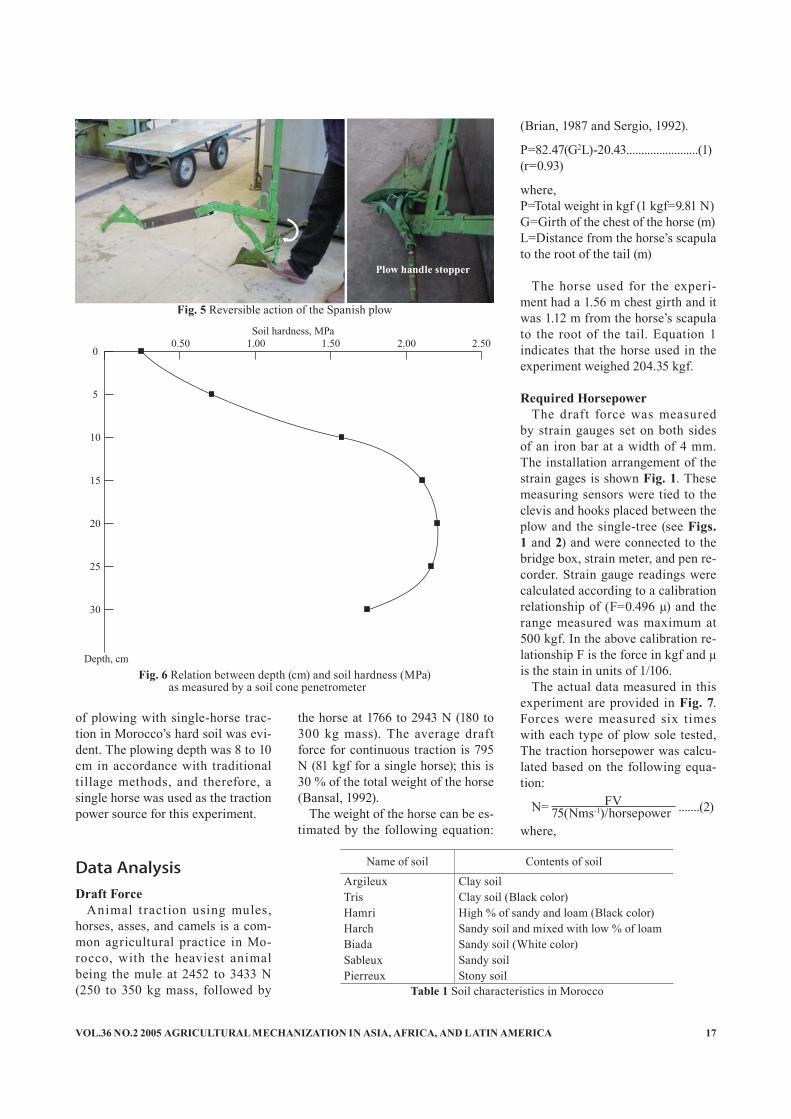
Figure 4 depicts the long-sole plow and a round iron bar which serves as the share point for the plow manufactured in Spain. The plow sole is 51 cm long. This plow is also of the reversible type. The reversal operation turns the main body of the plow 90 degrees in the other direction, where it is fixed against the plow handle stop (Fig. 5). This Spanish plow is all iron, including the beam, and weighs 177 N (18 kg. mass) The improved Japanese plow weighs 198 N (20.2 kg. mass) The total weight of the plow should not exceed 196 N (20 kg mass).
The character ist ics measured were forward speed, hardness of soil, plowing depth, soil moisture content, draft force, and the time re-quired for plowing. The measuring instruments were set up on a truck.
Field Conditions The field experiment was con-
ducted over two days at the Insti-
tute of Agronomy and Veterinary Medicine Hassan (IAV) in Rabat. The weather on those two days was slightly cloudy, with a temperature of 20 ºC, and 50 % to 62 % relative humidity. The soil was a mixture of sand and red loam. It is known as hamri, or harch, in Morocco. Two types of mixed soil, clay with sand and a loam with sand are native to Morocco. The names of several soils in Morocco are provided in Table 1. The geographical distribution of soil types indicates that there is a clay type in the north and a sandy, stony soil in the south. The soil moisture content at the time of the experi-ment was 35.21 % on the average. Rainfall in 2003 was heavier than in previous years, and soil conditions were good.
Relations between depth (cm) and soil hardness are illustrated in Fig. 6. Soil resistance measurement instruments (soil cone penetrometer and soil shear strengh apparatus) (SR-2 type and DIK-5501) were used to detect field-test conditions. It was apparent that the soil in Morocco was generally very hard (plow-pan layer) and deeper than 10 cm. It gradually becomes harder at depths beyond 10 cm. The difficulty
VOL.36 NO.2 2005 AGRICULTURAL MECHANIZATION IN ASIA, AFRICA, AND LATIN AMERICA 17
of plowing with single-horse trac-tion in Morocco’s hard soil was evi-dent. The plowing depth was 8 to 10 cm in accordance with traditional tillage methods, and therefore, a single horse was used as the traction power source for this experiment.
Data AnalysisDraft Force
Animal t raction using mules, horses, asses, and camels is a com-mon agricultural practice in Mo-rocco, with the heaviest animal being the mule at 2452 to 3433 N (250 to 350 kg mass, followed by
Plow handle stopper
Fig. 5 Reversible action of the Spanish plow
0.00 0.50 1.00 1.50 2.00 2.50
30
25
20
15
10
5
0
Fig. 6 Relation between depth (cm) and soil hardness (MPa) as measured by a soil cone penetrometer
Name of soil Contents of soil
Argileux Clay soilTris Clay soil (Black color)Hamri High % of sandy and loam (Black color)Harch Sandy soil and mixed with low % of loamBiada Sandy soil (White color)Sableux Sandy soilPierreux Stony soil
Table 1 Soil characteristics in Morocco
the horse at 1766 to 2943 N (180 to 300 kg mass). The average draft force for continuous traction is 795 N (81 kgf for a single horse); this is 30 % of the total weight of the horse (Bansal, 1992).
The weight of the horse can be es-timated by the following equation:
(Brian, 1987 and Sergio, 1992).
P=82.47(G2L)-20.43........................(1)(r=0.93)
where,P=Total weight in kgf (1 kgf=9.81 N)G=Girth of the chest of the horse (m)L=Distance from the horse’s scapula to the root of the tail (m)
The horse used for the experi-ment had a 1.56 m chest girth and it was 1.12 m from the horse’s scapula to the root of the tail. Equation 1 indicates that the horse used in the experiment weighed 204.35 kgf.
Required HorsepowerThe draft force was measured
by strain gauges set on both sides of an iron bar at a width of 4 mm. The installation arrangement of the strain gages is shown Fig. 1. These measuring sensors were tied to the clevis and hooks placed between the plow and the single-tree (see Figs. 1 and 2) and were connected to the bridge box, strain meter, and pen re-corder. Strain gauge readings were calculated according to a calibration relationship of (F=0.496 μ) and the range measured was maximum at 500 kgf. In the above calibration re-lationship F is the force in kgf and μ is the stain in units of 1/106.
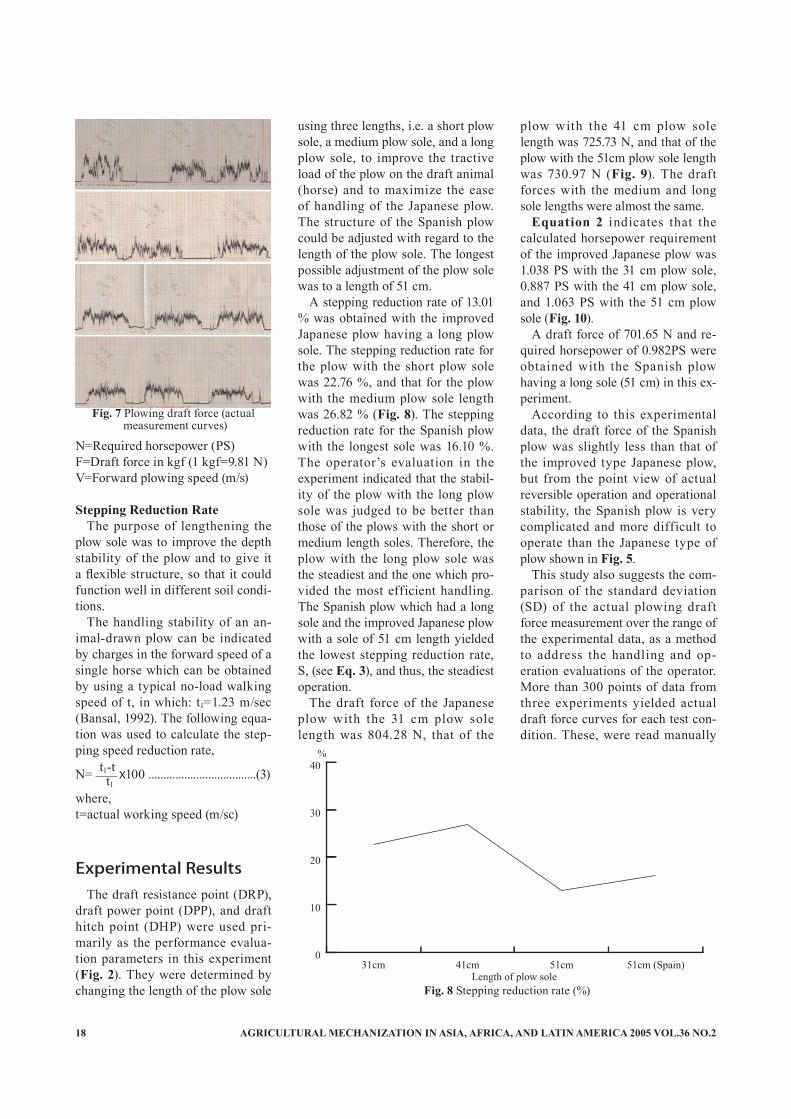
The actual data measured in this experiment are provided in Fig. 7. Forces were measured six times with each type of plow sole tested, The traction horsepower was calcu-lated based on the following equa-tion:
N= .......(2)
where,
FV 75(Nms-1)/horsepower
AGRICULTURAL MECHANIZATION IN ASIA, AFRICA, AND LATIN AMERICA 2005 VOL.36 NO.218
N=Required horsepower (PS) F=Draft force in kgf (1 kgf=9.81 N)V=Forward plowing speed (m/s)
Stepping Reduction RateThe purpose of lengthening the
plow sole was to improve the depth stability of the plow and to give it a flexible structure, so that it could function well in different soil condi-tions.
The handling stability of an an-imal-drawn plow can be indicated by charges in the forward speed of a single horse which can be obtained by using a typical no-load walking speed of t, in which: t1=1.23 m/sec (Bansal, 1992). The following equa-tion was used to calculate the step-ping speed reduction rate,
N= x100 ....................................(3)
where,t=actual working speed (m/sc)
Experimental ResultsThe draft resistance point (DRP),
draft power point (DPP), and draft hitch point (DHP) were used pri-marily as the performance evalua-tion parameters in this experiment (Fig. 2). They were determined by changing the length of the plow sole
Fig. 7 Plowing draft force (actualmeasurement curves)
using three lengths, i.e. a short plow sole, a medium plow sole, and a long plow sole, to improve the tractive load of the plow on the draft animal (horse) and to maximize the ease of handling of the Japanese plow. The structure of the Spanish plow could be adjusted with regard to the length of the plow sole. The longest possible adjustment of the plow sole was to a length of 51 cm.
A stepping reduction rate of 13.01 % was obtained with the improved Japanese plow having a long plow sole. The stepping reduction rate for the plow with the short plow sole was 22.76 %, and that for the plow with the medium plow sole length was 26.82 % (Fig. 8). The stepping reduction rate for the Spanish plow with the longest sole was 16.10 %. The operator’s evaluation in the experiment indicated that the stabil-ity of the plow with the long plow sole was judged to be better than those of the plows with the short or medium length soles. Therefore, the plow with the long plow sole was the steadiest and the one which pro-vided the most efficient handling. The Spanish plow which had a long sole and the improved Japanese plow with a sole of 51 cm length yielded the lowest stepping reduction rate, S, (see Eq. 3), and thus, the steadiest operation.
The draft force of the Japanese plow with the 31 cm plow sole length was 804.28 N, that of the
plow with the 41 cm plow sole length was 725.73 N, and that of the plow with the 51cm plow sole length was 730.97 N (Fig. 9). The draft forces with the medium and long sole lengths were almost the same.
Equation 2 indicates that the calculated horsepower requirement of the improved Japanese plow was 1.038 PS with the 31 cm plow sole, 0.887 PS with the 41 cm plow sole, and 1.063 PS with the 51 cm plow sole (Fig. 10).
A draft force of 701.65 N and re-quired horsepower of 0.982PS were obtained with the Spanish plow having a long sole (51 cm) in this ex-periment.
According to this experimental data, the draft force of the Spanish plow was slightly less than that of the improved type Japanese plow, but from the point view of actual reversible operation and operational stability, the Spanish plow is very complicated and more difficult to operate than the Japanese type of plow shown in Fig. 5.
This study also suggests the com-parison of the standard deviation (SD) of the actual plowing draft force measurement over the range of the experimental data, as a method to address the handling and op-eration evaluations of the operator. More than 300 points of data from three experiments yielded actual draft force curves for each test con-dition. These, were read manually
0
10
20
30
40
51cm (Spain)51cm41cm31cm
Fig. 8 Stepping reduction rate (%)
t1-t t1

VOL.36 NO.2 2005 AGRICULTURAL MECHANIZATION IN ASIA, AFRICA, AND LATIN AMERICA 19
600
650
700
750
800
850
51cm (Spain)51cm41cm31cm
Fig. 9 Average plow draft force with different plow sole length
0.00
0.20
0.40
0.60
0.80
1.00
1.20
51cm (Spain)51cm41cm31cm
Fig. 10 Required horse power (PS) and speed during plowing
0
100
200
300
400
500
51cm (Spain)51cm41cm31cm
Fig. 11 Cumparison of the standard deviation (SD) values for plow draft-force date for plows with various sole lengths
and their standard deviations calcu-lated. The actual standard deviation of the draft force for the improved Japanese plow with the long sole was the lowest obtained in this
experiment to determine plowing resistance characteristics, as is indi-cated in Fig. 11.
ConclusionsIt was evident throughout this ex-
periment that the operational advan-tage of the improved Japanese plow was the ease of handling. It was more stable and more efficient than the traditional plow in Morocco. The results of this research demon-strate that the increase in the length of the plow sole of the improved Japanese plow should be about 20 cm over that of the traditional 31 cm plow sole to achieve increased sta-bility and ease of handling.
Improving the depth and tractive force uniformity as well as the im-proving the handling of the animal-drawn plow used in Morocco and Sub-Saharan Africa can reduce the plowing labor for small-scale farm-ers.
The principal conclusions of this experiment are presented below.
1. The small-scale farmer in Mo-rocco uses animal traction plows on hill slopes, in hilly districts and in ravines. The uniformity of depth and draft is, therefore, a significant consideration. A long plow sole is very effective from this standpoint.
2. The minimum draft forces were obtained in this experiment with the plow with the long plow sole how-ever, the improved Japanese plow must be designed to have a long sole to achieve better handling charac-teristics and uniformity or depth and draft. The plow with the long sole had somewhat high mean val-ues of required horsepower during its smooth operation in continuous plowing.
3. Both the Japanese improved plow and the Spanish plow were stable with regard to draft force (N), horsepower (PS), and stepping reduction rate (%) with short, me-dium, and long plow sole lengths.
4. Maintaining a constant plowing speed is an important factor in ani-mal traction plowing. Therefore, the uniformity of depth and draft should be judged by the actual speed of operation as well as by the required

AGRICULTURAL MECHANIZATION IN ASIA, AFRICA, AND LATIN AMERICA 2005 VOL.36 NO.220
tractive horsepower. The stepping reduction rates of the improved Japanese plow and the Spanish plow were low. This indicates that the steadiest operation was achieved with the long-sole plows.
5. The long plow sole also proved to make the plow steadier in terms of running and operational evalua-tions. The results of this experiment indicate that the most important de-sign parameter is for animal-drawn plows to have a long sole.
REFERENCES
Bansal, R.K 1992. Vol.23 No.1 Per-formance of draft animals at work
in Morocco: Draf tability and power output. AMA. Japan
FAO,. 1990 Agricultural Services Bulletin 84 : Agricultural engi-neering in development : selection of the mechanization inputs.
Munzinger, Peter, 1982. Animal Traction in Africa. GTZ West Germany
Tsujimoto, Toshiyuki 2002. Agri-culture Mechanization Survey in Kingdom of Morocco. CFMA/JICA. Japan
Alexandratos, Nikos 1995. World Agriculture Towards 2010 FAO Study. Rome. Italy 151-159, 205
Jenane, Chakib 1998. Count ry study: Morocco. Global Farm Power Assessment for the year
2010/2020Bansal, R. K. 1994. Progress and
Prospects of Farm Mechanization in the Semi-Arid Regions of Mo-rocco.
Associat ion Marocaine de Ma-chinisme Agricole 1999. La Me-canisation Agricole au Maroc .
Starkey, Paul 1989. Harnessing and Implements for Animal Traction. Vieweg. GTZ, Germany
GRET, GRDR 1984. le point sur les Harnais , Pour la traction animal. France
Bashford, Leonard L, 1991. Vol.22 No.3 Draft and energy require-ment of agricultural implement in semi-arid regions of Morocco. AMA. Japan
■■
VOL.36 NO.2 2005 AGRICULTURAL MECHANIZATION IN ASIA, AFRICA, AND LATIN AMERICA 21
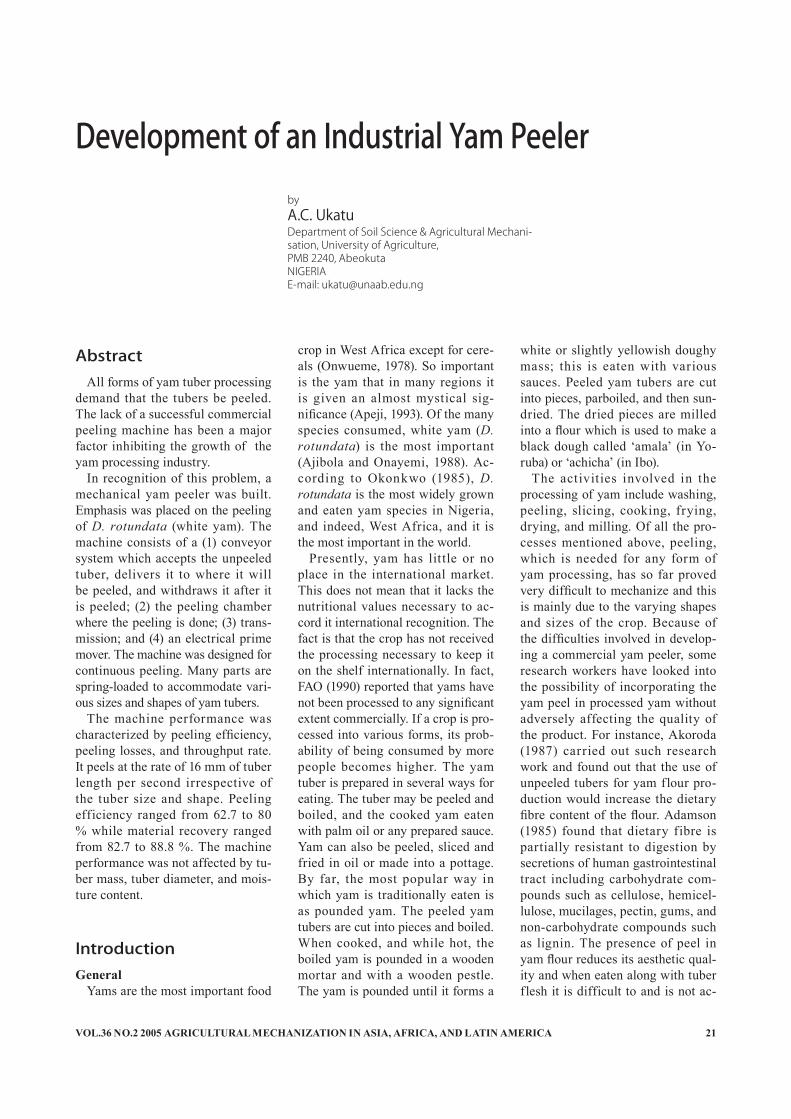
Development of an Industrial Yam PeelerbyA.C. UkatuDepartment of Soil Science & Agricultural Mechani-sation, University of Agriculture,PMB 2240, AbeokutaNIGERIAE-mail: [email protected]
AbstractAll forms of yam tuber processing
demand that the tubers be peeled. The lack of a successful commercial peeling machine has been a major factor inhibiting the growth of the yam processing industry.
In recognition of this problem, a mechanical yam peeler was built. Emphasis was placed on the peeling of D. rotundata (white yam). The machine consists of a (1) conveyor system which accepts the unpeeled tuber, delivers it to where it will be peeled, and withdraws it after it is peeled; (2) the peeling chamber where the peeling is done; (3) trans-mission; and (4) an electrical prime mover. The machine was designed for continuous peeling. Many parts are spring-loaded to accommodate vari-ous sizes and shapes of yam tubers.
The machine performance was characterized by peeling efficiency, peeling losses, and throughput rate. It peels at the rate of 16 mm of tuber length per second irrespective of the tuber size and shape. Peeling efficiency ranged from 62.7 to 80 % while material recovery ranged from 82.7 to 88.8 %. The machine performance was not affected by tu-ber mass, tuber diameter, and mois-ture content.
IntroductionGeneral
Yams are the most important food
crop in West Africa except for cere-als (Onwueme, 1978). So important is the yam that in many regions it is given an almost mystical sig-nificance (Apeji, 1993). Of the many species consumed, white yam (D. rotundata) is the most important (Ajibola and Onayemi, 1988). Ac-cording to Okonkwo (1985), D. rotundata is the most widely grown and eaten yam species in Nigeria, and indeed, West Africa, and it is the most important in the world.
Presently, yam has little or no place in the international market. This does not mean that it lacks the nutritional values necessary to ac-cord it international recognition. The fact is that the crop has not received the processing necessary to keep it on the shelf internationally. In fact, FAO (1990) reported that yams have not been processed to any significant extent commercially. If a crop is pro-cessed into various forms, its prob-ability of being consumed by more people becomes higher. The yam tuber is prepared in several ways for eating. The tuber may be peeled and boiled, and the cooked yam eaten with palm oil or any prepared sauce. Yam can also be peeled, sliced and fried in oil or made into a pottage. By far, the most popular way in which yam is traditionally eaten is as pounded yam. The peeled yam tubers are cut into pieces and boiled. When cooked, and while hot, the boiled yam is pounded in a wooden mortar and with a wooden pestle. The yam is pounded until it forms a
white or slightly yellowish doughy mass; this is eaten with various sauces. Peeled yam tubers are cut into pieces, parboiled, and then sun-dried. The dried pieces are milled into a flour which is used to make a black dough called ‘amala’ (in Yo-ruba) or ‘achicha’ (in Ibo).
The activities involved in the processing of yam include washing, peeling, slicing, cooking, frying, drying, and milling. Of all the pro-cesses mentioned above, peeling, which is needed for any form of yam processing, has so far proved very difficult to mechanize and this is mainly due to the varying shapes and sizes of the crop. Because of the difficulties involved in develop-ing a commercial yam peeler, some research workers have looked into the possibility of incorporating the yam peel in processed yam without adversely affecting the quality of the product. For instance, Akoroda (1987) carried out such research work and found out that the use of unpeeled tubers for yam flour pro-duction would increase the dietary fibre content of the flour. Adamson (1985) found that dietary fibre is partially resistant to digestion by secretions of human gastrointestinal tract including carbohydrate com-pounds such as cellulose, hemicel-lulose, mucilages, pectin, gums, and non-carbohydrate compounds such as lignin. The presence of peel in yam flour reduces its aesthetic qual-ity and when eaten along with tuber flesh it is difficult to and is not ac-
AGRICULTURAL MECHANIZATION IN ASIA, AFRICA, AND LATIN AMERICA 2005 VOL.36 NO.222
ceptable to consumers. The need to isolate peels from
yam products, therefore, becomes obvious. The work presented here was centred on the development of a mechanical system that would han-dle yam peeling for various shapes and sizes of yam tubers and with special attention to D. rotundata.
Review of LiteratureThe literature of the yam peel-
ing machine, and recent work on yam tuber peeling systems, are very scarce. Available literature is limited to work which has not gone beyond the four walls of the engineering research workshops. No published articles that described functional yam peeling machines were found in literature.
The shapes and sizes of yam tu-bers are the bottlenecks in develop-ing a yam peeling machine. Shape and size are inseparable in a physi-cal object and both are necessary if the object is to be satisfactorily described (Mohsenin, 1986). Sitkei (1986) stated that the functioning of many types of agricultural ma-chines is inf luenced decisively by the shapes and sizes of the objects participating. The shape and size of yam tuber vary from species to spe-cies (Course, 1967).
Generally, peeling involves the removal of a thin layer, called the peel, from a stock. This stock may be fruit, tuber, wood (debarking), or even metal (turning on the lathe). The work done so far on the devel-opment of material peeling systems reveal three general methods of peeling. They are the use of abrasive action, chemicals (like caustic solu-tion, brine and oil), and heat.
The abrasion method has been used to peel potatoes, ginger, and has been tried on yam tubers. Abra-sion peelers for potatoes are theoreti-cally designed to contact uniformly the surface of the potato being peeled with abrasive discs or rolls, in such a way as to remove the peel with as little peeling loss as possible. None of the peelers has proven to be entirely satisfactory for all potatoes (Talburt and Smith, 1975). Agrawal et al. (1983) developed an abrasive brush type ginger peeling machine. The operation of the machine was later optimized by Agrawal et al. (1987). The peeler consisted essen-tially of two continuous brush belts being driven in opposite directions with a downward relative velocity by a variable-speed electric motor. The movement of the two brush belts in opposite directions provided the abrasive action on the ginger pass-ing in between, while the downward relative velocity provided f low of ginger. In the manually operated ginger peeler developed by Charan et al. (1993), brushes made of coco-nut fibres were used as abrasive ma-terials. A moving abrasive material was mounted on two endless canvas
belts. A stationary abrasive surface was also developed with the same brushes, arranging them side by side on a wooden plank of 780 x 240 x 15 mm. A uniform gap of 15 mm was maintained between the moving and stationary surfaces so as to accom-modate ginger pawn between them.
Several methods have been used for peeling onions. The common methods used in modern onion processing industry are lye treat-ment, flame peeling and mechanical peeling (Srivastava et al. 1997). The authors stated that lime and flame peeling methods are harsh and not suitable for many onion products and, therefore, recommended the mechanical peeling method (abra-sion peeling). For their machine, they made use of four scoring blades as the peeling tool.
Attempts have been made to de-velop a functional cassava tuber peeler, using the abrasive action. Odigbo (1976) developed a con-tinuous cassava peeler consisting of a cylindrical knife assembly and a rough cylinder mounted paral-lel to each other 20 mm apart. He reported peeling efficiency of over 95 % but only for sized lots of cas-sava tuber slices. Ezekwe (1979), Odigbo (1983), and Nwokedi (1984) designed and constructed batch cassava peelers that were similar in principle. The peelers rotate a mix-ture of cassava tubers and abrasive materials in a drum to effect peel-ing. It has been reported (Ohwovo-riole et al., 1988) that the peelers work best for sized tubers and have no control on the depth of peel re-
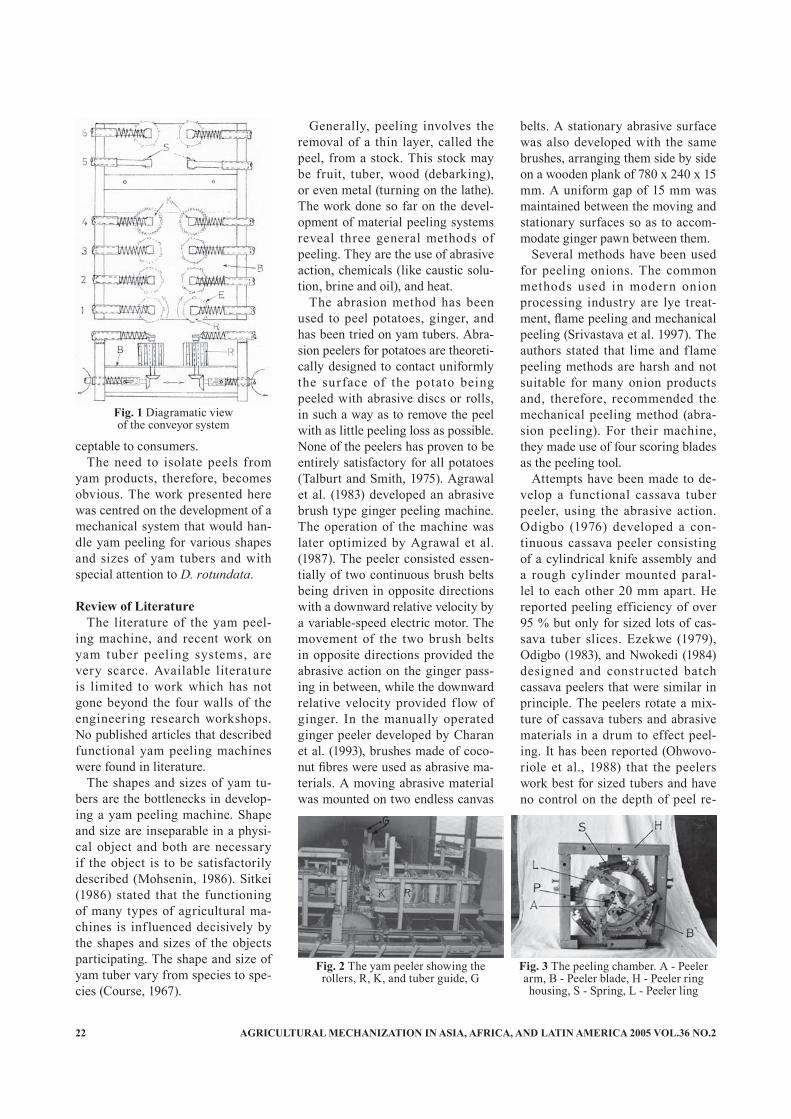
Fig. 1 Diagramatic viewof the conveyor system
Fig. 3 The peeling chamber. A - Peeler arm, B - Peeler blade, H - Peeler ring housing, S - Spring, L - Peeler ling
Fig. 2 The yam peeler showing therollers, R, K, and tuber guide, G

VOL.36 NO.2 2005 AGRICULTURAL MECHANIZATION IN ASIA, AFRICA, AND LATIN AMERICA 23
moved with resultant high losses of cassava flesh.
The previous work done on the development of yam peeler have failed to achieve a break-through. The work done, using abrasive ac-tion, by Ofi (1982) and many others, including students in various tertia-ry institutions (as research projects), are examples of such work.
Peeling by the use of chemicals and heat obviously denatures the peeled material. This is due to the action of heat and the reaction of the chemicals with the constituents of the peeled materials. The methods are, therefore, not recommended for yam peeling.
MethodologyMachine Development
The yam peeling machine con-sists mainly of the following named parts:
(i) Yam tuber container: This holds the tubers ready to be peeled.
(ii) A conveyor system: The con-veyor system is shown diagram-matically in Fig. 1. It consists of four pairs of cylindrical rollers, R, marked 1-4, for feeding the machine with unpeeled tubers; and another two pairs of rollers, marked 5-6, for withdrawing already peeled tubers. The rollers on the right hand side rotate in a clockwise direction while those on the left hand side rotate in the opposite direction such that any tuber placed between the rows and in contact with the roller surfaces is conveyed linearly forward on a bed,
B. The rollers are lined with rubber material, E, to minimize slippage between them and yam tubers. The view of the machine showing the rollers, R, is shown in Fig. 2. (The rollers are operated by a lever-crank mechanism, and bevel gear arrange-ment). The rollers, K, (Fig. 1) next to the peeling chamber are spiked to ensure there is no slip between tubers and roller surface, and also ensure stability of tubers during the peeling action. All the rollers are spring-loaded, as can be seen from Fig. 1, to cater for different sizes and shapes of tubers. In the pair of rollers numbered 5, there are chain drives through the sprockets, S. From there, chains drive two smaller spiked rollers positioned right inside where peeling is done, to initiate the withdrawal of a peeled tuber.
(iii) Tuber guides: There are two tuber guides, marked G, (Fig. 2). This part of the machine, which is also spring-loaded, ensures that any incoming tuber is directed to the peeler blades.
(iv) Peeling chamber: This is the unit where peeling takes place and is shown in Fig. 3. It is positioned be-tween pairs of rollers 4 and 5 of Fig. 1. It consists of (1) three peeler arms, A, which are spring-loaded such as at S to provide the pressure needed for peeling and to allow the peeler aperture, P, to be increased to the sizes and shapes of tubers; (2) peeler blades, B, fixed to the peeler arms and which scrape the tuber body to a pre-set depth; (3) a peeler ring, L, on which the peeler arms are mounted and are driven through a chain drive;
and (4) the peeler ring housing, H. The peeler arms have toothed struc-tures that act as openers which initi-ate the opening of the aperture when in contact with a tuber.
OperationThe roller conveyor draws the
yam tuber placed between the first pair of conveyor rollers into the peeling chamber. The peeler ring rotates through a chain drive. Any tuber being moved into the peeling chamber by the conveyor is directed by the tuber guides, G, to the aper-ture, P, (Fig. 3) formed by the peeler arms. Here the tuber makes con-tact with the openers. This contact causes the aperture to widen to the size and shape of the yam tuber to be peeled. The tuber immediately gets to the peeler blades which tra-verse round the tuber to perform the peeling. The peeler blades can be adjusted to cut various depths, ac-cording to the thickness of peel. The working of the yam peeler is dem-onstrated in Figs. 4 and 5. In Fig. 4, the tuber, T, is shown being fed to the peeling chamber by the pair of spiked conveyor rollers, K, through the guidance of the tuber guide, G, while the peeler arm, A, traverses round the tuber. Fig. 5 shows a stage when the peeling operation was about to be completed and the conveyor rollers on the other side of the peeling chamber kept withdraw-ing the tuber as peeling progressed.
Performance Evaluation TestsTwenty yam tubers of the D.
rotundata bought randomly from three different locations in a local market were made available for both
Fig. 5 Peeling oparation about to be completed. R - Lager withdrawal roller
Fig. 4 Tuber, T, being fed to the peeling chamber. K - Spiked roller, G - Tuber
guide, A-Peeler arm
Fig. 6 The peeled tubers
AGRICULTURAL MECHANIZATION IN ASIA, AFRICA, AND LATIN AMERICA 2005 VOL.36 NO.224
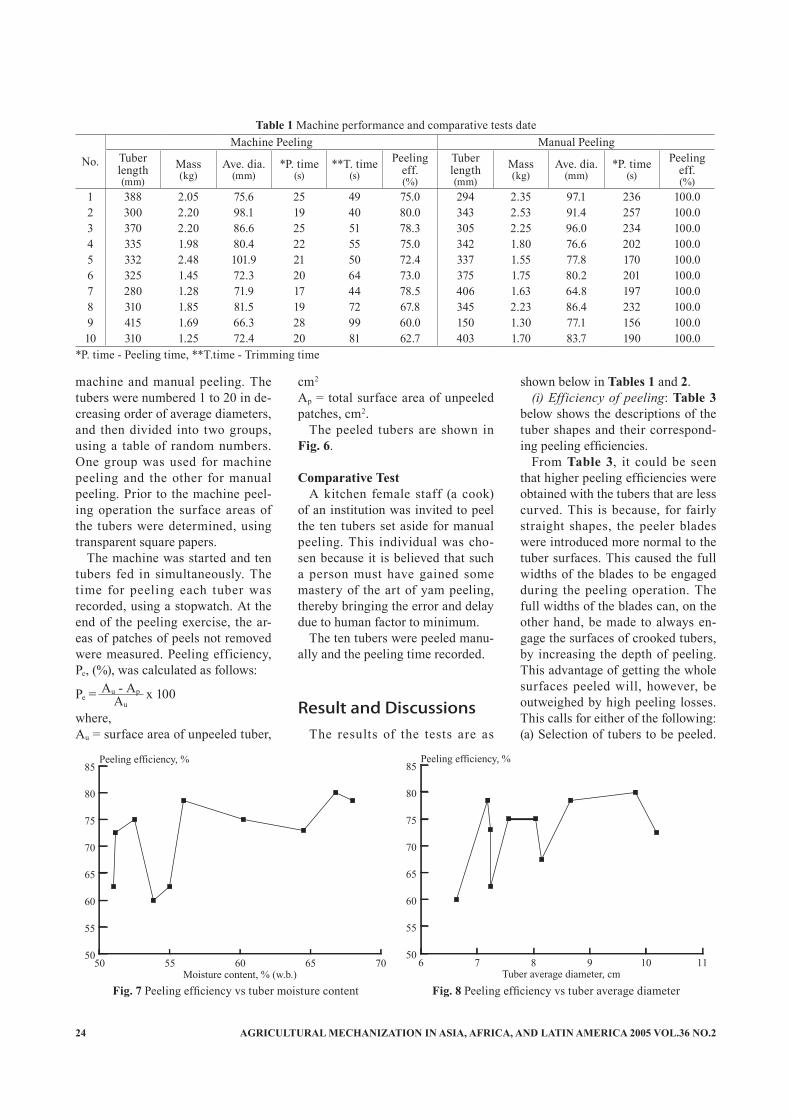
machine and manual peeling. The tubers were numbered 1 to 20 in de-creasing order of average diameters, and then divided into two groups, using a table of random numbers. One group was used for machine peeling and the other for manual peeling. Prior to the machine peel-ing operation the surface areas of the tubers were determined, using transparent square papers.
The machine was started and ten tubers fed in simultaneously. The time for peeling each tuber was recorded, using a stopwatch. At the end of the peeling exercise, the ar-eas of patches of peels not removed were measured. Peeling efficiency, Pe, (%), was calculated as follows:
Pe = x 100
where,Au = surface area of unpeeled tuber,
cm2 Ap = total surface area of unpeeled patches, cm2.
The peeled tubers are shown in Fig. 6.
Comparative Test
A kitchen female staff (a cook) of an institution was invited to peel the ten tubers set aside for manual peeling. This individual was cho-sen because it is believed that such a person must have gained some mastery of the art of yam peeling, thereby bringing the error and delay due to human factor to minimum.
The ten tubers were peeled manu-ally and the peeling time recorded.
Result and DiscussionsThe results of the tests are as
shown below in Tables 1 and 2.(i) Efficiency of peeling: Table 3
below shows the descriptions of the tuber shapes and their correspond-ing peeling efficiencies.
From Table 3, it could be seen that higher peeling efficiencies were obtained with the tubers that are less curved. This is because, for fairly straight shapes, the peeler blades were introduced more normal to the tuber surfaces. This caused the full widths of the blades to be engaged during the peeling operation. The full widths of the blades can, on the other hand, be made to always en-gage the surfaces of crooked tubers, by increasing the depth of peeling. This advantage of getting the whole surfaces peeled will, however, be outweighed by high peeling losses. This calls for either of the following: (a) Selection of tubers to be peeled.
Au - ApAu
50 55 60 65 7050
55
60
65
70
75
80
85y
6 7 8 9 10 1150
55
60
65
70
75
80
85y
Fig. 7 Peeling efficiency vs tuber moisture content Fig. 8 Peeling efficiency vs tuber average diameter
No.Machine Peeling Manual Peeling
Tuber length(mm)
Mass(kg)
Ave. dia.(mm)
*P. time(s)
**T. time(s)
Peeling eff.(%)
Tuber length(mm)
Mass(kg)
Ave. dia.(mm)
*P. time(s)
Peeling eff.(%)
1 388 2.05 75.6 25 49 75.0 294 2.35 97.1 236 100.02 300 2.20 98.1 19 40 80.0 343 2.53 91.4 257 100.03 370 2.20 86.6 25 51 78.3 305 2.25 96.0 234 100.04 335 1.98 80.4 22 55 75.0 342 1.80 76.6 202 100.05 332 2.48 101.9 21 50 72.4 337 1.55 77.8 170 100.06 325 1.45 72.3 20 64 73.0 375 1.75 80.2 201 100.07 280 1.28 71.9 17 44 78.5 406 1.63 64.8 197 100.08 310 1.85 81.5 19 72 67.8 345 2.23 86.4 232 100.09 415 1.69 66.3 28 99 60.0 150 1.30 77.1 156 100.010 310 1.25 72.4 20 81 62.7 403 1.70 83.7 190 100.0
Table 1 Machine performance and comparative tests date
*P. time - Peeling time, **T.time - Trimming time

VOL.36 NO.2 2005 AGRICULTURAL MECHANIZATION IN ASIA, AFRICA, AND LATIN AMERICA 25
(b) Increased time of trimming after peeling.
(ii) Effect of tuber moisture con-tent: Tests carried out during this work (result not included here) in-dicate that tubers of lower moisture contents offer higher resistance to cutting tools. The ratios of peeling efficiency values to the correspond-ing moisture content values were subjected to the mean square suc-cessive difference test, and a coef-ficient of -0.147 was obtained. This is less than 0.469, the critical value. This indicates randomness between the peeling efficiency and moisture content, and this is further shown by the graph of Fig. 7.
(iii) Effect of tuber diameter: The ratios of the peeling efficiency values to the corresponding tuber average diameters were examined using the mean square successive difference test. A coefficient of -0.224 was ob-
tained. This, again, is less than the critical value of 0.469. Tuber diam-eters, therefore, do not influence the peeling efficiencies. The graph of Fig. 8 supports this claim.
(iv) Effect of tuber mass: It was thought that the heavier the tuber the more difficult it would be for the machine to handle. The same type of test, as mentioned above, was also used for the ratios of the peel-ing efficiency values to tuber mass values. A coefficient of 0.132, which is also less than the critical value of 0.469, was obtained - an indication of randomness. The graph of Fig. 9 brings out this point. It is then con-cluded that tuber mass has no effect on peeling efficiency.
(v) Rate of peeling: The rate of peeling is defined as the length of tuber peeled per unit time, the mass and diameter of tuber notwithstand-ing. The date for tuber lengths
versus peeling times are presented in Table 1, and the plot is shown in Fig. 10. From the graph, the machine peels at an average rate of 16 mm/s.
(vi) Material recovery: Material recovery, MR.(%), is calculated from the relation:
MR. = (Mf/Mi) x 100
where,
Mi = mass of tuber before peelingMf = mass of tuber after peelingPeeling loss (%) = [(Mi - Mf)/Mi] x 100
From Table 2, a maximum peeling loss of 17.30 % and a minimum val-ue of 11.22 % were obtained. These correspond to a minimum material recovery of 82.70 % and a maximum value of 88.80 %. It should be noted that the peeling loss (the lost tuber flesh) values given above are more than the actual values because they include the mass of peels which
Table 2 Machine and manual peeling loss date
No.Machine peeling Manual peeling
Tuber mass before peeling
(kg)
Mass after peeling
(kg)Peeling loss
(%)Moisture content
(%)Ave. dia.
(mm)Tuber mass
before peeling(kg)
Mass after peeling
(kg)Peeling loss
(%)Ave. dia.
(mm)
1 2.05 1.82 11.22 60.2 75.6 2.35 1.92 18.30 97.12 2.20 1.85 15.91 66.8 98.1 2.53 1.99 21.34 91.43 2.20 1.90 13.64 68.0 86.6 2.25 1.91 15.11 96.04 1.98 1.70 14.14 52.5 80.4 1.80 1.25 30.56 76.65 2.48 2.07 16.53 51.1 101.9 1.55 1.13 27.10 77.86 1.45 1.25 13.79 64.5 72.3 1.78 1.35 24.16 80.27 1.28 1.10 14.06 56.6 71.9 1.63 1.23 24.54 64.88 1.85 1.53 17.30 55.0 81.5 2.23 1.90 14.80 86.49 1.69 1.47 13.02 53.8 66.3 1.30 1.02 21.54 77.110 1.25 1.10 12.00 51.0 72.4 1.70 1.38 18.82 83.7
1.0 1.5 2.0 2.550
55
60
65
70
75
80
85y
15 20 25 3025
30
35
40
45y
Fig. 9 Peeling efficiency vs tuber mass Fig. 10 Plot of tuber length vs peeling time

AGRICULTURAL MECHANIZATION IN ASIA, AFRICA, AND LATIN AMERICA 2005 VOL.36 NO.226
is not a loss. It was not feasible to separate the peels from the lost flesh but the method has been used in evaluating peelers for gingers and potatoes. The graphs of Figs. 11 and 12 indicate, respectively, no relation-ship between peeling loss and tuber moisture content or between peeling loss and tuber diameter.
(vii) Comparative advantage: The results of tests for this purpose are shown on Tables 1 and 2. It took the machine a total of 216 seconds to peel ten yam tubers while manual peeling lasted for 2,075 seconds for the same number of tubers. The ma-chine-peeled tubers were trimmed in 605 seconds.
A maximum peeling loss value of 30.56 % was obtained for manual peeling, as against a maximum val-ue of 17.30 % for machine peeling. The marked difference is due to the fact that the thickness of cut is fixed for machine peeling and varies with hand peeling, coupled with the fact
that not all peels were removed with machine peeling. The values for machine peeling are in the range of abrasion peeling for potatoes (12 to 20 %) as reported by Talburt and Smith (1975).
Peeling efficiency was always 100 % for hand peeling. From the data of Table 1, manual peeling required 2.53 times the time required for machine peeling. Secondly, the fact that the machine can work continu-ously over a longer period of time than the human hand gives it an edge over the manual method.
Conclusion and Recom-mendationsConclusion
A mechanical yam peeling ma-chine, which peels by abrasive ac-tion, has been developed and tested. The machine makes use of blades arranged to traverse round tubers
to perform the peeling action. The blades can be adjusted to vary the depth of peeling.
The major parts of the machine are (i) a tuber container, (ii) a con-veyor system to convey tubers to where they will be peeled, and with-draw them after peeling, (iii) tuber guides, which ensure that any in-coming tuber is directed right to the peeler blades, (iv) peeling chamber, where peeling takes place.
Peeling efficiencies ranged from 60 to 80 %. Higher peeling efficien-cies were obtained for the tubers that are fairly straight than those that tend to be curved. Material recovery was from 82.7 to 88.8 % when the mass of peel was treated as lost material also.
The functioning of the machine is independent of tuber mass, mois-ture content, and diameter. It peels yam tubers at an average rate of 16 mm/s, irrespective of tuber size and moisture content. However, as in the case of potato mechanical peelers, some trimming may be required especially when the product is to be boiled or fried for food. In the case of yam flour production, trimming might not be necessary.
RecommendationsThe following recommendations
are made for future work:1. Efforts should be made to reduce
the amount of metal used in the construction so as to reduce pro-
50 55 60 65 7010
12
14
16
18y
6 7 8 9 10 1110
12
14
16
18y
Fig. 11 Peeling loss vs tuber moisture content Fig. 12 Peeling loss vs tuber average diameter
TuberNo. Description of shape Peeling efficiency
(%)1 Fairly straight 752 Very straight and fairly round 803 Straight 804 Straight 78.35 Straight with non-uniform cross-section 72.46 Straight with stepped body 73.07 Straight 78.58 Fairly curved, with depressions 67.89 Markedly curved 60.010 Straight, elliptical cross-section and with depressions 62.7
Table 3 The description of tuber shapes and their corresponding efficiencies

VOL.36 NO.2 2005 AGRICULTURAL MECHANIZATION IN ASIA, AFRICA, AND LATIN AMERICA 27
duction costs.2. Only one pair of well-designed
feeder rollers could be tried for the machine since the major work of feeding tubers to the peeling chamber is done by the pair of spiked feeder roller, while others do the work of conveying the tu-bers from points of entry. The tu-ber point of entry could then be at the spiked pair of rollers, and this will assist in reducing the volume of metal used.
3. There should be a system for set-ting the peeling depth, instead of adjusting and measuring the length of protrusion of the peeler blades with a rule each time a cer-tain peeling depth is desired.
4. In the current work, mild steel materials were used in the fabri-cation of some parts that would come in contact with yam tubers, simply because a prototype was being considered. Stainless steel should be used for those parts.
5. The drive for the peeler ring should be designed in such a way that the speed of the peeler ring is reduced. This should enable the peeling action to be more of scraping off the peels than of tear-ing them off which increases peel-ing losses and leaves the peeled surface rough.
REFERENCES
Adamson, I. 1985 The dietary fibre of yam and cassava. In Advances in Yam Research. The Biochem. and Tech. of the yam t uber. Anambra State Univ. of Tech., Enugu - Nigeria, pp 321-342.
Agrawal, Y.C., Singhvi, A. and So-dhi, R.S. 1983. Ginger Peeling 1: Development of an abrasive brush type ginger peeling machine. Journal of Agrc. Eng., Indian Soc. of Agric. Engineers, Vol. 20, No. 3 and 4, pp 179-182.
Agrawal, Y.C., Hiran, A. and Ga-lundia, A.S. 1987. Ginger Peeling Machine Parameters. Journal of
AMA, Vol. 18, No. 2, pp 59-62.Ajibola, O.O. and Onayemi, O. 1988.
The Effect of Some Processing Variables on the Dehydration of Pregelled Yam Pieces. Journal of Food Sc. and Tech., Vol. 25, No. 3, pp 117-120.
Akoroda, N.O. 1987 Incorporating Tuber Peels in White Yam Flour. Trop. Sc., vol.27, 230-248
Apeji, S.A. 1993. Yam: the staff of life. African Farming, Jul./Aug., pp 35.
Charan, R., Agrawal, Y.C., Bhat-nagar, S., and Mehta, A.K. 1993. Application of
Abrasive and Lye Peeling of Gin-ger at Individual Farmer's Level. Jour. Of AMA, Vol. 24, No. 2, pp 61-64.
Ezekwe, G.O. 1979. Mechanising Cassava Peeling: The PRODA cassava nibbling machine. PRO-DA Tech. Reports No. 1, Sept., pp 1-20.
FAO 1990. Roots, Tubers, Plantains and Bananas in human nutrition. FAO Food and Nutrition Series, No. 24, Rome.
Mohsenin, N.N. 1986 Physical Properties of Plants and Animals. Gorden and Breach Science Pub-lishers, New York.
Nwokedi, P.M. 1984. Performance of a Cassava Peeling Machine. In Tropical root Crops: Production and uses in Africa. International Research Dev. Centre, pp 108-110.
Odigbo, E.U. 1976. A cassava Peel-ing Machine: Development - design and construction. J. Agric. Eng. Res., 21(3): 361-369.
Odigbo, E.U. 1983. Cassava: Pro-duction, Processing and Utilisa-tion. In Handbook of Tropical foods. H.T. Chan Jr (ed.), Marcel Dekker Inc., pp 145-200.
Ofi, O. 1982. Development of a Me-chanical Yam Peeler. Unpublished seminar paper, University of Ibadan, Nigeria.
Ohwovoriole, E.N., Oboli, S. and Mgbeke, A.C.C. 1988. Studies and Preliminary Design for a Cassave Peeling Machine. Trans of the
ASAE, Vol. 31(2), pp 380-385.Okonkwo, S.N.C. 1985 The Botany
of the Yam Plant and its Exploita-tion in Enhanced Productivity of the Crop. In Advances in Yam Research. Anamba State Univ. of Tech., Enugu - Nigeria.
Onwueme, I.C. 1978 The Tropi-cal Tuber Crops: yams, cassava, sweet potatoes and cocoyams. John Wiley and sons, Chichester, 234pp
Sitkei, G. 1986 Mechanics of Agri-cultural Materials. Elsevier Sci-ence Publishers, Amsterdam, The Netherlands, Budapest, Hungary.
Srivastava, A., VanEe, G., Lede-buhr, R.,Welch, D., and Wang, L. 1997. Design and Development of an Onion Peeling Machine. Trans of the ASAE, Vol 13(2): 167-173.
Talburt, W.F. and Smith, O.S. 1975 Potato Processing. The Avi Pub-lishing Company, Inc. Wesport, Connecticut
■■
AGRICULTURAL MECHANIZATION IN ASIA, AFRICA, AND LATIN AMERICA 2005 VOL.36 NO.228
Design and Development of a Low-cost Potato Grader
byK.C. RoyPrincipal Scientific Officer and HeadIWM DivisionBangladesh Agricultural Reserch InstituteJoydebpur, Gazipur 1701BANGLADESH
A.D.M. Gulam MustafaAssistant CommissionerOffice of the Deputy CommissionerPirojpurBANGLADESH
M.A. WohabSenior Scientific OfficerFMPE DivisionBangladesh Agricultural Reserch InstituteJoydebpur, GazipurBANGLADESH
AbstractPotatoes are sold in the market
without grading in Bangladesh. If potatoes were sold after grading, this would be beneficial to both produc-ers and consumers. Since mechani-cal graders are not available, pota-toes are graded, when necessary, by hand. This is a time consuming, costly, and inefficient method. In view of this, a power-operated po-tato grader was designed and fabri-cated using M.S. angle, M.S. shaft, G.I. wire, and rubber tubes. The grader consists of a frame, feeding mechanism, sieve, collection mecha-nism, and power transmission. The first prototype was developed and tested in the laboratory in 1998 to observe its performance. Based on the performance test the grader was modified, especially the feeding mechanism. The maximum power consumption was found to be 1,637 watts. The average capacity of the grader was 2,030 kg/hr. The cost of grading was only Tk 0.03 per kg. No injury occurred to graded potatoes.
Field performance at a private cold storage in Rajshahi District was highly satisfactory. The capacity of the grader at the cold storage was 1,500 kg/hr. The use of this grader will reduce the time and the cost of grading.
IntroductionThe total potato production of
Bangladesh in 2000 to 2001 was about 3.5 million tonnes. Of this production 0.25 million tonnes were used for seed and 300 tonnes were exported. There is a good market for both seed and ware potatoes in neighboring countries. It is expected that production will increase incom-ing years.
The purpose of grading potatoes is to aid in standardization and to fa-cilitate marketing. Sorting and pack-aging potatoes to a set of recognized official standards enable producers and buyers to fix a reasonable price for both. Grading is a direct benefit to all parties concerned in the buy-
ing and selling transaction. It is es-sential to the business of processors, wholesalers and retailers. Consum-ers get a benefit whenever the pack-ages carry the official grade marking (Schoenemann, 1977). Grading can be done based on physical dimension of potatoes as well as their weight. The former method of grading is preferred over the latter.
Potatoes are sold in the Bangla-desh market without grading. Large, medium and small potatoes are sold together. Large potatoes are used for processing, especially for making chips, and for baking. Medium and small size potatoes are preferred for culinary use seed potatoes should be between 28 and 55 mm and are graded into two sizes of 28 to 40 mm and 40 to 55 mm. Since me-chanical graders are not available, potatoes must be graded by hand through eye estimation which is very laborious, time consuming, costly and inefficient. Also, it is not possible to grade potatoes accurate-ly by eye estimation. In developed countries, potatoes are sold in the
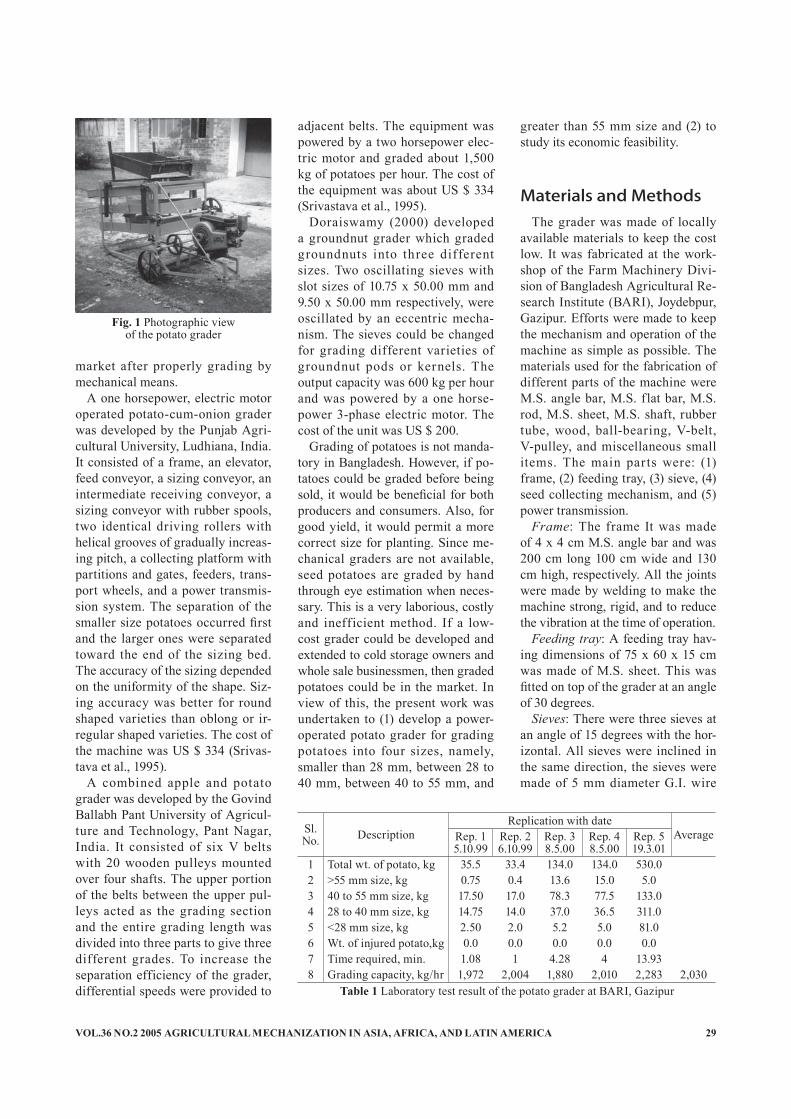
VOL.36 NO.2 2005 AGRICULTURAL MECHANIZATION IN ASIA, AFRICA, AND LATIN AMERICA 29
market after properly grading by mechanical means.
A one horsepower, electric motor operated potato-cum-onion grader was developed by the Punjab Agri-cultural University, Ludhiana, India. It consisted of a frame, an elevator, feed conveyor, a sizing conveyor, an intermediate receiving conveyor, a sizing conveyor with rubber spools, two identical driving rollers with helical grooves of gradually increas-ing pitch, a collecting platform with partitions and gates, feeders, trans-port wheels, and a power transmis-sion system. The separation of the smaller size potatoes occurred first and the larger ones were separated toward the end of the sizing bed. The accuracy of the sizing depended on the uniformity of the shape. Siz-ing accuracy was better for round shaped varieties than oblong or ir-regular shaped varieties. The cost of the machine was US $ 334 (Srivas-tava et al., 1995).
A combined apple and potato grader was developed by the Govind Ballabh Pant University of Agricul-ture and Technology, Pant Nagar, India. It consisted of six V belts with 20 wooden pulleys mounted over four shafts. The upper portion of the belts between the upper pul-leys acted as the grading section and the entire grading length was divided into three parts to give three different grades. To increase the separation efficiency of the grader, differential speeds were provided to
adjacent belts. The equipment was powered by a two horsepower elec-tric motor and graded about 1,500 kg of potatoes per hour. The cost of the equipment was about US $ 334 (Srivastava et al., 1995).
Doraiswamy (2000) developed a groundnut grader which graded groundnuts into three different sizes. Two oscillating sieves with slot sizes of 10.75 x 50.00 mm and 9.50 x 50.00 mm respectively, were oscillated by an eccentric mecha-nism. The sieves could be changed for grading different varieties of groundnut pods or kernels. The output capacity was 600 kg per hour and was powered by a one horse-power 3-phase electric motor. The cost of the unit was US $ 200.
Grading of potatoes is not manda-tory in Bangladesh. However, if po-tatoes could be graded before being sold, it would be beneficial for both producers and consumers. Also, for good yield, it would permit a more correct size for planting. Since me-chanical graders are not available, seed potatoes are graded by hand through eye estimation when neces-sary. This is a very laborious, costly and inefficient method. If a low-cost grader could be developed and extended to cold storage owners and whole sale businessmen, then graded potatoes could be in the market. In view of this, the present work was undertaken to (1) develop a power-operated potato grader for grading potatoes into four sizes, namely, smaller than 28 mm, between 28 to 40 mm, between 40 to 55 mm, and
greater than 55 mm size and (2) to study its economic feasibility.
Materials and MethodsThe grader was made of locally
available materials to keep the cost low. It was fabricated at the work-shop of the Farm Machinery Divi-sion of Bangladesh Agricultural Re-search Institute (BARI), Joydebpur, Gazipur. Efforts were made to keep the mechanism and operation of the machine as simple as possible. The materials used for the fabrication of different parts of the machine were M.S. angle bar, M.S. flat bar, M.S. rod, M.S. sheet, M.S. shaft, rubber tube, wood, ball-bearing, V-belt, V-pulley, and miscellaneous small items. The main parts were: (1) frame, (2) feeding tray, (3) sieve, (4) seed collecting mechanism, and (5) power transmission.
Frame: The frame It was made of 4 x 4 cm M.S. angle bar and was 200 cm long 100 cm wide and 130 cm high, respectively. All the joints were made by welding to make the machine strong, rigid, and to reduce the vibration at the time of operation.
Feeding tray: A feeding tray hav-ing dimensions of 75 x 60 x 15 cm was made of M.S. sheet. This was fitted on top of the grader at an angle of 30 degrees.
Sieves: There were three sieves at an angle of 15 degrees with the hor-izontal. All sieves were inclined in the same direction, the sieves were made of 5 mm diameter G.I. wire
Sl.No. Description
Replication with dateAverageRep. 1
5.10.99Rep. 26.10.99
Rep. 38.5.00
Rep. 48.5.00
Rep. 519.3.01
1 Total wt. of potato, kg 35.5 33.4 134.0 134.0 530.02 >55 mm size, kg 0.75 0.4 13.6 15.0 5.03 40 to 55 mm size, kg 17.50 17.0 78.3 77.5 133.04 28 to 40 mm size, kg 14.75 14.0 37.0 36.5 311.05 <28 mm size, kg 2.50 2.0 5.2 5.0 81.06 Wt. of injured potato,kg 0.0 0.0 0.0 0.0 0.07 Time required, min. 1.08 1 4.28 4 13.938 Grading capacity, kg/hr 1,972 2,004 1,880 2,010 2,283 2,030
Table 1 Laboratory test result of the potato grader at BARI, Gazipur
Fig. 1 Photographic viewof the potato grader

AGRICULTURAL MECHANIZATION IN ASIA, AFRICA, AND LATIN AMERICA 2005 VOL.36 NO.230
covered with rubber tubes. They were fitted with 2.5 x 2.5 cm M.S. angle bar frames. The length and width of the angle bar frame were 125 and 65 cm, respectively. Frames of the sieves were hung inside the main frame by a wooden crank. Sieves were moved in a to-and-fro motion by a mechanical power trans-mission system.
Seed collection mechanism: Provi-sions were made to fit gunny bags at the each end of the upper two sieves to collect the graded potatoes. At the end and below the bottom sieve, trays were placed on the ground to collect 28 to 40 mm and the smallest size potatoes, respectively.
Power t ransmission: A 3-hp, 3-phase 1,500 rpm electric motor was fitted at the front of the frame. Two 25 cm diameter V-pulleys and two 8 cm diameter V-pulleys were arranged on the frame through ball bearings having bearing cases, M.S. shaft, and V-belt. The motor speed of 1,500 rpm was reduced to 167 rpm and two cams were fitted at the two ends of the shaft to shake sieves at 167 strokes per minute.
Laboratory testFigure 1 shows a photographic
view of the grader. At no-load con-dition, the motor rpm was 1,500 and
at load condition it was 1,350 rpm. The stroke length of the sieves was 5 cm. A clamp meter was used to measure the motor current which was used to calculate the power consumption. A six hour endurance test was conducted to observe any failure in machine parts. Three per-sons were required to run the grader successfully. One person supplied potatoes to the hopper and two per-sons collected potatoes in trays and bags and cleared potatoes trapped inside the sieves. Figure 2 shows the grader in operation. During the laboratory test, bulk quantities of potatoes of different sizes were placed on the feeding tray. Potatoes fell continuously at the elevated side of the upper sieve. Potatoes were moved forward by shaking action to the end of the top sieve and those larger than 55 mm were collected in a gunny bag. Potatoes smaller than 55 mm were dropped from the top sieve to the second sieve. Potatoes larger than 40 mm and 28 mm were collected from the end of the second and the third sieves, respectively, and those smaller than 28 mm were collected from below the third sieve. The performance test was conducted in 1999, 2000 and 2001.
The cost of grading was calculated with the assumption that the cost of the grader, including the electric mo-tor, was Tk 20,000.00 (US $ 346.00, 1 US $ = Tk 57.86, in 2002), the life of the system was eight years, and was operated at least 750 hours an-nually.
Field TestOne unit of the grader was fabri-
cated at the workshop of the Farm Machinery Division, BARI to evalu-ate the long-term field performance,
and was sold to a private cold stor-age at Boalia, Rajshahi. In the 2001 potato harvest ing season, 22.5 tonnes of seed potatoes were graded by the machine in two days (15 hours). During the machine opera-tion, careful observations were made to find any defect. Some potatoes were trapped in the sieves, which were removed by hand. At the end of the operation, one cast iron V-pulley was partially broken and the main shaft of the power transmission, made of 2.5 cm diameter M.S. shaft, was broken due to fatigue. These parts were replaced with a high quality V-pulley and M.S. shaft.
Results and DiscussionNo parts of the grading system
failed during the six hours labora-tory endurance test. The laboratory performance test results of the three years operation are shown in Table 1. During the no-load and load con-dition, the power consumption was 1,490 and 1,639 watts, respectively. The average capacity of the potato grader from four observations was 2,030 kg/hr. Since potatoes from the feeding tray fall directly on the upper sieve, no bruises or cut oc-curred. Some potatoes were trapped on the sieves which were removed quickly by hand. In order to elimi-nate the trapping of potatoes on the sieve, modification is required in the shaking mechanism. Additionally, instead of only horizontal to and fro motion, a combination of hori-zontal and vertical movement needs to be made. Rubber tubes were cut longitudinally and glued to the G.I. wire of the sieves. Many tubes came out after continuous use. However,
Fig. 2 Potato grader in operation
Sl.No. Description Quantity
1 Total weight of potatoes, kg 22,5002 Injured potatoes, kg 03 Total time required, hour 154 Grading capacity, kg/hr 1,500
Table 2 Firld test result of the potato grader at Boalia, Rajshahi

VOL.36 NO.2 2005 AGRICULTURAL MECHANIZATION IN ASIA, AFRICA, AND LATIN AMERICA 31
these could be easily replaced by the workers. The result of the long-term field performance test at Rajshahi are shown in Table 2. From Table 1 and Table 2, it can be seen that the grading capacity in the field was significantly lower than that of the laboratory. This happened because operators in the field were new to the machine. It is expected that the grading capacity will increase with operator experience.
Large-scale manufacturers make costly machines that may not be appropriate for Bangladesh. The cost of one such machine of Euro-pean design made locally having a capacity of two tons per hour was Tk 240,000.00 (US $ 4,148.00). The present potato grader has been designed and fabricated in such a way as to keep its cost low. When the cost and capacity of the exotic machine with the present machine is compared, the local machine defi-nitely has many advantages. Table 3 shows the cost factors and items of the potato grader. From the table, it can be seen that the cost of grading with the present grader is only Tk 0.03 per kg, which is very negligible compared to the other costs of potato production. If we assume the yield to be 20 ton/ha, the cost of grading per ha is only Tk 600.00.
At present, the cost of grading po-tatoes manually is about Tk 0.11 per
kg. Therefore, the use of the grader would reduce the cost of grading by 73 %.
ConclusionsThe present work was undertaken
to develop a power-operated potato grader to grade potatoes into four different sizes and to study its eco-nomic feasibility. Accordingly, a grader was designed, developed and tested. After the preliminary tests, some modifications were made in the design for final fabrication. Both the laboratory and field tests were satisfactory. The capacity of the grader in the laboratory was 2,030 kg/hr and that in the field was 1,500 kg/hr. The lower grading capacity at the field level will improve after the operators gather experience in operating the machine. The cost of grading by the grader was 73 % lower than manual grading. The grader has a very good prospect of extension to cold storage owners and retailers. However, the problem of trapping potatoes on the sieves needs to be solved in order to have a trouble-free operation.
REFERENCES
Anonymous. 1982. Mechanization
and crop performance, In: The potato crop, the scientific basis for improvement, P.M. Jarris ed., Chapman and Hall, London, pp. 355-375.
Doriaswamy, G. 2000. Groundnut machines - grader, decorticator, harvester and thresher, Training cum study program on farm ma-chinery. Department of Farm Ma-chinery, College of Agricultural Engineering, Tamil Nadu Agri-cultural University, India. June 24-July 15.
Karim, M. R. and S. M. Elias. 1986. Economic profitability of major crops in Bangladesh. Agricultural Economics Division, Bangladesh Agricultural Research Institute, Joydebpur, 32p.
Schoenemann, J. A. 1977. Grading, packaging and marketing pota-toes, In: Potatoes production, stor-ing, processing, Ora Smith, Ed., 2nd Edition, The AVI Publishing Company Inc., West Port, pp. 470-505.
Srivastava, P. K., B. D. Shukla, N. S. L. Srivastava. 1995. Appropri-ate Agri. Based Technologies for Rural Women, Central Institute of Agricultural Engineering, Bhopal (M. P), India.
■■
Sl.No. Cost factor / items Unit Amout
1 Cost of grader Tk/unit 20,000.002 Life of grader Year 83 Annual use Hour 750
4
Annual fixed cost(a) Depreciation(b) Interest (15%)(c) Repair and maintenance
TotalTotal
Tk/yrTk/yrTk/yrTk/yrTk/hr
2,250.001,650.002,000.005,900.00
7.87
5
Operating cost (for engine)(a) Fuel(b) Lubricant(c) Labour (four labours, Tk 70/day)
Total
Tk/hrTk/hrTk/hrTk/hr
15.001.0035.0051.00
6 Total cost Tk/hr 58.877 Cost of grading (assuming 2,030 kg/hr capacity) Tk/kg 0.03
Table 3 Cost factors and items of the potato grader

AGRICULTURAL MECHANIZATION IN ASIA, AFRICA, AND LATIN AMERICA 2005 VOL.36 NO.232
Extensive Review of Crop Drying and Driers Developed in India
byA. AlamDy. Director General (Engg.)ICAR, KAB-IIPusa, New Delhi-12INDIA
Ranjan MohnotEx-Research AssociateDivision of Agricultural Engineering and Energy,Central Arid Zone Research Institute Jodhpur-3INDIA
Harpal SinghHeadDivision of Agricultural Engineering and Energy,Central Arid Zone Research Institute Jodhpur-3INDIA
H.L. KushwahaScientist (FM & P)Division of Agricultural Engineering and Energy,Central Arid Zone Research Institute Jodhpur-3INDIA
AbstractAn extensive review of drying and
driers developed in India during the last 4 to 5 decades was made. Re-searchers in the period have explored the possibilities of use of alternate energy sources such as solar, wind and biomass for drying/ventilation. During this period a number of dryer/drying techniques have been designed/evolved, developed, per-fected, and commercialized. Almost all agricultural materials have been tackled, drying characteristics stud-ied, and operational parameters op-timized under laboratory conditions. A number of drying units have been field evaluated. Recently work on osmotic dehydration of fruits and vegetables, has been investigated.
IntroductionBoth natural and forced convec-
tion type driers have been devel-oped. Natural circulation type driers are generally suitable for drying of fruits and vegetables as these driers
can not function against high static pressure. In the beginning (i.e. in the 1950’s) furnace oil fired LSU driers were in use in the Country particularly in paddy processing units. As the price of petroleum products increased, the use of such driers became prohibitive. It was in late 70’s that there was a shift from conventional to non-conventional fuel based driers. During that pe-riod a breakthrough was made in the development of efficient rice husk-fired furnaces for steam and hot air generation at IIT, Kharagpur, FCI Rice Mill, Thanjavur, M/S Indus Services Pvt. Ltd, Kolkata (WB), Annamalai University, Annam-alainagar, GBPUA&T, Pantnagar, and PAU, Ludhiana. Both step grate as well as cyclone type (Figs. 1, 2a, and 2b) rice husk fired furnaces were developed for drying purposes. These furnaces not only found ap-plication in paddy processing units but also in many other food indus-tries in the Country. Almost all the FCI’s, SWC’s Rice Mills and many other Agro Industries replaced their oil fired furnaces with that of rice
husk fired furnaces [20]. In addition, researchers in the last 4 to 5 decades also explored the possibilities of use of alternative energy sources such as solar and biomass for drying purposes. During this period a num-ber of dryers have been designed, developed, perfected, and commer-cialized. Almost all agricultural ma-terials have been tackled and drying characteristics studied under labora-tory as well as field conditions.
Some effor ts in the past have been made to document informa-tion on the subject [1, 7, 13, 15, 17 and 19], but all in piece meal. Thus, it deemed necessary to review and update the information on drying and driers developed in the Country. This paper presents an extensive review on drying techniques and driers developed in the Country in a systematic manner.
Work Done on Drying and DriersA. Electrically Operated Driers
(i) A laboratory model of a fruit

VOL.36 NO.2 2005 AGRICULTURAL MECHANIZATION IN ASIA, AFRICA, AND LATIN AMERICA 33
osmotic dehydrator with 5 kg hold-ing capacity was designed and de-veloped at the Coimbatore Centre of Post-harvest Technology Scheme (PHTS) which included the osmotic reactor, a fruit holding pan, a mix-ing chamber, an impeller, and a pumping system [14]. The unit was evaluated for its performance with bananas and grapes. Sugar syrup (60 degrees Brix) was circulated at flow rates of 4, 8 and 12 l/min. The temperature of the osmotic syrup was maintained at 50 ºC through-out 5 h of osmotic dehydration. A maximum water loss of 42.5 % in bananas and 24.6 % in grapes was observed after 5 h of osmosis at a flow rate of 12 l/min and, under static conditions, the water loss was 38.5 and 22.7 %, respectively. Solid gain under static conditions was 9.1 and 0.9 % for bananas and grapes, respectively. Moisture content of os-mosed banana at 12 l/min flow rate was 0.68 kg dry matter per kg water and reduced to an equilibrium mois-
ture content of 0.12 kg dry matter per kg water after 8 h of air drying. The osmosed grapes had a moisture content of 3.1 kg dry matter per kg water which reduced to 0.13 kg dry matter per kg water after 12 h of air drying.
(ii) A recirculatory hot air dryer for chillies was designed and de-veloped at Kharagpur Centre of the PHTS. The green chilies cut into two halves along the length gave best retention of colour and less drying time. Studies showed that green chillies took 4 h to dry at 70 ºC temperature and 90.6 % recircula-tion with a tray loading of 4 kg/m2
and air velocity 2 m/s. It showed a shrinkage ratio of 8.8 and a dehy-dration ratio of 7.9. The energy re-quired to remove 1 kg water was 2.6 kWh. The colour values measured with a Hunter laboratory colourim-eter, in terms of L, a and b Hunter values were 44.4, -1.2 and 18.6, re-spectively [14].
(iii) For production of sweetened
slices from banana, osmosis, as well as the concentration of sugar syrup, was carried out in a batch type ris-ing film evaporator at Kharagpur Centre of the PHTS [14]. It consists of a calender, foam separator, and shell and tube type condenser which can evaporate water at the rate of 18 kg/h. A PID steam flow controller was used for regulating the steam temperature. Air-drying of osmosed fruit slices was done in a tray dryer, until the desired water activities and moisture content were achieved. Since the osmosis and air-drying were involved, the process was not continuous and, therefore, the prod-uct had some draw backs associ-ated with those inherent in manual handling. One kg of bananas was peeled (peel 0.42 kg) and sliced, maintaining 6 mm thickness. The banana slices (0.57 kg) were dipped in 0.05 % solution of sodium meta bisulphate for 5 min maintaining the solution to slice ratio of 1.25:1. Slices were subjected to osmosis in sugar syrup (50 degrees Brix) maintaining slice to sugar ratio 1:5 for 4 h at 50 ºC product temperature and 95 ºC steam temperature and 700 mm Hg vacuum pressure. The osmosed banana slices were then blanched for 6 min in open steam and dried in a recirculatory tray dryer. Blanched osmosed banana slices weighing 0.43 kg when dried at 60 ºC with an air velocity of 2 m/s a recirculation of 47.7 %, and a tray load of 4.17 kg, produced 0.25 kg of dried sweetened banana slices. The sweetened banana slices had water activity of 0.72 at 21.6 ºC. The colour value in terms of yellowness index was 69.5 whereas the Hunter L, a and b values were 20.4, 3.3 and 6.6, respectively.
(iv) Garlic cloves were dried with hot air and combined microwave-hot air drying methods [22]. The combined microwave-hot air dry-ing experiments were carried out with 100 g sample sizes at 40, 50, 60 and 70 ºC temperature and at air velocities of 1 and 2 m/s using Fig. 1 Box type inclined grate paddy husk fired furnace developed at IIT, Kharagpur

AGRICULTURAL MECHANIZATION IN ASIA, AFRICA, AND LATIN AMERICA 2005 VOL.36 NO.234
a continuous microwave power of 40 W. For comparison of hot air drying, the same sample sizes were used with drying air temperatures of 60 and 70 ºC and air velocities of 2 m/s. The total drying time, co-lour, f lavour and strength of dried garlic cloves were used to evaluate the performance of the combined microwave-hot air drying and the conventional hot air drying process. Combined microwave-hot air dry-ing resulted in a reduction of drying time of 80 to 90 % as compared to conventional hot air drying and a superior quality final product.
(v) A model drying unit (tray sys-tem) was designed at Bhopal centre of the PHTS. The body of the dry-ing unit was made from perforated 16 gauge aluminum sheet and trays (700 x 250 x 50 mm) with a 10 mm hole size. The overall dimensions of the drying chamber were 0.8 x 0.35 x 1.2 m, which could accommodate five trays and dry 5 kg mushroom in 2 h. The drying chamber was insulated with 25 mm thick glass wool. Hot air (70 ºC), circulated at 155 m3/h, reduced moisture content from approximately 90 to 5 % wb in 2 h. Preliminary studies revealed that the colour of dried mushroom was greatly affected if excess water was not properly drained prior to drying. Thus, a centrifugal dewater-
slices during osmotic drying. Drying characteristics of osmosed button mushroom (40 ºC and 1:6 mushroom to salt solution ratio) were studied at four levels of drying temperature (55, 65, 75 and 85 ºC) and at 1.7 m/s air velocity. The samples were dried until they attained almost a constant weight which required approximate-ly 8 h. Also the validity of various mathematical models was tested for the experimental data in order to characterise the drying behaviour of osmosed mushroom slices during air drying [14].
B. Sun Drying(i) Work was done at Bhopal,
Pantnagar and Akola centres of the PHTS on the selection of surfaces for faster and higher quality sun drying. Tarpaulin, hessian, canvas cloth, black and white polyethylene, and concrete surfaces were evalu-ated as compared to mud f loor at Bhopal [4]. Tarpaulin (olive green), black polyethylene, and concrete surface were found to reduce drying time by 10 to 20 %. At Pantnagar, slow drying was reported on hori-zontal elevated 0.5, 1.0 m mesh wire surface as compared to blackish concrete surface. At Akola, a sand bed gave faster drying but created a sand separation problem. Tarpaulin and GI sheet were found significant-ly better than mud floor.
(ii) Sun drying characteristics of whole groundnut plant practiced by Gujarat farmers was studied [16]. The groundnut crop is gener-
Fig. 2b Horizontal cyclone type furnace, IIT, KharagpurFig. 2a Vertical cyclone type husk fired
furnace, FCI, Thanjavur
ing unit was also developed [9 and 10].
(vi) Different methods of mush-room drying, viz., sun drying, thin layer drying, solar cabinet drying, and f luidized bed drying, were evaluated at Coimbatore centre of the PHTS. Fluidized bed drying of mushroom at 50 ºC with an air flow rate of 35 m3/min dried the mush-room to a final moisture content of about 9 % db in 2 h [14]. The loss of nutrients and browning was less in fluidized bed drying compared to other methods of drying. A mush-room grower in the vicinity installed a dryer with a batch capacity of 6 kg and powered by a 2 hp motor with 4 kW heater and blower. Mushrooms, both oyster and milky type, were dried and mixed with spicy ingredi-ents to made a ready mix for gravy and soups.
(vii) Drying behaviour of button mushroom slices (3 to 4 mm thick) pre-treated with a 0.1 % solution of Potasium Meta Bi-sulphite (KMS) during osmotic drying was studied at Pantnagar centre of the PHTS with three levels of temperature (25, 40 and 50 ºC) and three different weights of mushroom to salt solu-tion ratio (1:4, 1:6 and 1:8). Osmotic drying of button mushroom slices was carried out in 10 % salt solution. Approximately 50 % moisture was removed in about 16.5 h of osmotic drying. Validity of various mathe-matical models was tested for exper-imental data in order to characterise the drying behaviour of mushroom

VOL.36 NO.2 2005 AGRICULTURAL MECHANIZATION IN ASIA, AFRICA, AND LATIN AMERICA 35
ally heaped in the field for open sun drying after harvest. To study the moisture loss, samples from three different locations in the heap (top, middle and bottom) were taken and analysed. After 96 h of exposure the initial moisture content of 61.5 % wb was reduced to 17.1, 15.1 and 13.4 % wb for the top middle and bottom layers. During the period of study, the average RH was 72 % and the maximum and minimum temperatures were 40 and 29.8 ºC, respectively.
C. Solar Driers(a) Natural Convection Type
(i) A single glass shielded 2 x 1 m size solar cabinet dryer was de-signed and evaluated for chilli dry-ing and compared with sun drying on selective surfaces with mud floor as the control [25]. In November with 3 kg/m2 of material the cabinet dryer reduced drying time from one-half to one-third that of sun drying on tarpaulin. Even with 12 kg/m2 of material the cabinet dryer performed well. A techno-economic study revealed that cabinet dry-ers are desirable for drying with 6 kg/m2 of material or more [4]. However, the performance was af-fected when a strong northern wind prevailed.
(ii) A solar-cum-wind aspirator was conceived to have a solar cabinet dryer with performance independent of wind direction [26, 27 and 28]. To prevent condensation in the 2 m2 dryer in the initial stage of drying, an air flow requirement of 1 m3/min was estimated. To design the proper size aspirator, the performance characteristics of 0.2, 0.4 and 0.6 m diameter solar-cum-wind aspirators were studied [3 and 26]. Based on the results obtained, an aspirator of 0.25 m diameter and 1.2 m height was designed to create 1 m3/min air flow at an average wind velocity of 4 km/h (Fig. 3). Intensive testing showed that the dryer was suitable for drying perishable and semi-perishable products including plan-
tation crops.(iii) The hot air comes in contact
with the product only once in the cabinet dryer, but the air still has capacity to remove more moisture if it could be passed through addi-tional layers of the product. Based on this idea, a multi-rack dryer was developed [29]. The product to be dried was stacked at several levels one above the other. The main frame was made of MS angle iron. The ap-erture area was approximately 6 m2
and was inclined at 45 degrees with the horizontal facing south (lati-tude 31 degrees N). The back and sides were closed with 25 mm thick wooden panels, which also served as insulation. Fourteen horizontal trays were arranged in the two columns of seven rows. Each tray had a height of 40 mm and measured 900 x 350 mm. The trays were inserted and removed from the respective sides through small slits. After the trays were put in position, the slits were closed. The air entered through the perforations in the base of the dryer, then rose to escape from the top slit. About 300 holes of 15 mm diameter each were provided for the entrance of the air through the bottom board. These holes were uniformly distrib-uted over the entire board so that the entrance of air was uniform. The top slit was 62.5 mm wide and ran along the entire width of the dryer which was 2 m. Two glass covers were
provided in six panels of framed construction. The air flow rate was controllable by varying the opening at the top slit. The dryer was tested with vegetables such as cauliflower, onions, spinach, potato, and chips. It took about 2 to 2.5 days to dry each of these vegetables (2 kg each). With this unit, it was possible to remove 2.9 kg moisture per day/m2 of glazed area. This was higher than the moisture removal rate of the cabinet dryer which was 1.5 kg/day/m2.
A mini multi-rack dryer, simi-lar to the larger multi-rack dryer but having only f ive racks was developed [29] for household ap-plications. The comparative drying performance of the mini multi-rack dryer was studied with fenugreek leaves. The net aperture area for solar radiation input for the mini multi-rack dryer and cabinet dryer was 0.65 m2 and 0.5 m2, respective-ly. Fenugreek leaves (1.5 kg) were loaded in the mini multi-rack dryer (0.3 kg/tray) compared to 0.8 kg in the cabinet dryer in three trays. One kg/m2/day moisture was removed with the mini multi-rack dryer com-pared to 0.68 kg/m2/day in the case of the solar cabinet dryer (i.e. 60 % better performance).
(iv) A multi-tray type natural convection solar cabinet dryer was developed at Udaipur centre of the PHTS [19 and 23]. The dryer was fabricated from wood, plywood,
Fig. 3 Solar cabinet dryer with solar-cum-wind aspirator, CIAE, Bhopal

AGRICULTURAL MECHANIZATION IN ASIA, AFRICA, AND LATIN AMERICA 2005 VOL.36 NO.236
wire mesh, MS sheet, angle iron, and glass. (Fig. 4). The cabinet was inclined at an angle of 25 to degrees the horizontal which was approxi-mately equal to latitude of Udaipur. A 25 mm side slit was provided at bottom of cabinet for fresh air entry. The front surface was covered with a 4 mm thick transparent glass sheet. At the top, two draught pipes each of 200 mm diameter and 1000 mm length were provided to carry away warm moist air by natural convec-tion. Twelve perforated trays 1000 x 455 mm each were provided to hold material to be dried. The inside of the side and rear panels was covered with a mylar reflecting material. The trays were painted black for maxi-mum absorption of solar radiation. The overall dimensions of the dryer were 2000 x 2220 x 2840 mm. Food products such as ginger, turmeric, chillies, onion, garlic, and leafy veg-etables, could be successfully dried in a batch of 60 to 75 kg. Only two to three man/days were needed to perform the operation. In general 6 to 8 days/batch were required for complete drying of the product de-pending upon initial moisture of the product under clear sunny days.
(v) A 25 kg batch capacity natu-ral convection solar dryer was also developed at the Udaipur centre for peanut drying. The dryer had 16 small trays, 1500 x 400 mm each, arranged in two columns. The unit consisted of a f lat plate solar col-
lector and drying chamber having provision for direct as well as in-direct heating. Air inlet openings were provided in the bottom of the air heater (1 x 0.5 m). The air heater was insulated with sawdust from the bottom and, at the top, a chim-ney was provided to augment air flow rate. The drying trays made of wooden planks and wire mesh had a total area of 3.2 m2 for holding 25 kg of peanuts. There was a gap of 100 mm between each tray. Peanuts with an initial moisture content of 21 % could be dried to about 8 to 10 % moisture content in 8 h [19].
(vi) A comparative study was un-dertaken to evaluate the quality of selected leafy vegetables (fenugreek, coriander, bathua and spinach) dried in a solar dryer and in the open sun [18]. The initial moisture content of the fresh vegetables varied from 86 to 94 % wb, and were dried to a range 7.7 to 15.0 % wb. Drying time varied from three to four h in the solar dryer which was 60 to 65 ºC and 8 to 12 h under open the sun, indicating 50 to 75 % reduction in the drying time as compared to sun drying. Additionally, in the solar dried vegetables, the retention of ascorbic acid was higher colour was better, and the f lavour and overall appearance was better.
(vii) A solar cabinet dryer based on the “Lawand” design, having a base area of 1.4 m2 and a volume of 0.3 m3, was developed and tested [12]. In this dryer the drying time for chillies was about 50 % less compared to open courtyard drying. However, damage to the wooden planks by weather, termites, and higher air temperature inside the dryer during dehydration were ma-jor problems [12]. An improved dry-er (base area 1.7 m2 and volume 1.4 m3 was made of MS sheet. An alu-minum chimney (0.15 m diameter and 0.76 m long) with a regulating valve was provided to facilitate air circulation. This permitted tempera-ture to be limited in the range of 60 to 65 ºC while dehydrating all types
of fruits and vegetables like chillies, date palm, and ber.
(viii) In order to capture maxi-mum energy throughout the year and simultaneously reduce the size of the dryer, a solar dryer with pro-vision to adjust the stand and stack material on an inclined plane was designed, developed, and tested [31 and 32]. The inclined dryer (capac-ity 10 kg) consisted of a rectangular box (1260 x 960 x 230 mm) made of angle iron and aluminum sheet. A 50 mm layer of pearl millet husk straw insulation was provided at the base. Six pieces of aluminum pipe 25 mm diameter and 80 mm long) were fixed in the front wall of the dryer to introduce fresh air. The air exited through two tapered slits on both sides of the dryer. Wire mesh was provided in the slits to protect the material from flies. Two sheets of plane glass 0.92 by 0.60 m were fitted at the top of the frame. The drying material was loaded in trays (920 x 610 x 50 mm), which were placed on the angle iron frame in-side the dryer through a door on the rear side. Five partitions were pro-vided in each tray to facilitate stack-ing of material on an inclined plane (Fig. 5). Several dryers could be connected in series depending upon the requirement. It was possible to vary inclination of the composite unit by a single operation from 49 to 4 degrees with respect to the hori-zontal to maintain optimum tilt in accordance with latitude and season of operation. The moisture content of fresh chillies was reduced from 82 to 7 % wb in 5.5 days at 10 kg/m2 material spread at 29.3 ºC ambient temperature. The dryer temperature was 66.6 ºC.
(ix) A large size solar dryer with a batch capacity of 100 kg of vegeta-bles, which could be commercially used for drying of fruits and vegeta-bles was constructed by connecting ten units of the inclined direct type solar dryer in series. Each dryer was connected to its adjacent dryer with MS iron, and nuts and bolts.
Fig. 4 Multi-tray natural convection solar cabinet dryer, CTAE, Udaipur

VOL.36 NO.2 2005 AGRICULTURAL MECHANIZATION IN ASIA, AFRICA, AND LATIN AMERICA 37
By connecting the driers only one person is required to keep the entire array of dryers at optimum tilt in accordance with latitude and season of operation. Vegetables; viz. spin-ach, okra, tomato, mint, ginger, red and green chillies, carrot, coriander leaves, fenugreek, peas, cabbage, onion, sweet potato, bitter gouard, sugar beet, and bathua; and fruits; viz. ber, sapodilla, and grape were successfully dried in this dryer.
Leafy vegetables could be dehy-drated up to a safe moisture content within 1.5 to 2.0 days at loading rates of 3.0 to 4.5 kg/m2 whereas the other vegetables could be dried within 3 to 4 days at a loading rates of 10 kg/m2. Extensive drying trials were also carried out to dehydrate 240 kg of spinach at a loading rate of 4 kg/m2 in 6 trials each of 2 days duration. Thus, about 80 to 100 kg of vegetables could be dried in this commercial solar dryer within 4 days [30]. For maintaining original colour of the dried product an indi-rect type solar dryer was construct-ed by shading trays in the existing dryer with a blackened aluminum sheet inserted just above the slits and beneath the transparent glass cover. Comparison of the perfor-mance of direct and indirect driers showed that with the direct type solar dryer, the moisture content of green chillies, with a load density of 10 kg/m2, was reduced from 80 to 7 % wb within 7 days while it took 10.5 days with the indirect type dry-er under inclement weather during a severe winter. However, the colour of chillies was better maintained in the indirect type dryer compared to direct type dryer.
(x) A step type natural convection solar dryer for drying of papain, fruits, and algae was developed at Coimbatore centre similar to that developed at Ludhiana and Udaipur centres of the PHTS [14]. The dryer had ten trays. It took 1 to 2 h to dry latex in the dryer (50 to 60 ºC) compared to 8 to 12 h in sun drying in aluminum trays (conventional
method). The solar dried product received 13.8 % higher prices com-pared to sun dried product. The step type solar dryer was also used for papaya leather drying. The conven-tional sun drying took 60.8 h com-pared to 39.3 h in case of solar dry-ing for the same level of moisture reduction (i.e. a saving of 35 % in drying time). The dryer was tested intensively from March to October. It took 3 to 11 h to dry algae from about 85 to 90 % to 3 to 5 % mois-ture content in the step type solar dryer. A temperature as high as 60 to 70 ºC could be maintained by ad-justing air inlet and outlet openings.
(xi) Chandra et al. [15] reported drying of groundnut crop in an ex-perimental plastic covered green house structure. It was different from earlier efforts because it had no conventional energy requirement. The green house was designed to provide sufficient natural convection for crop drying. Such a solar crop drying facility held considerable promise in Indian conditions where it had to compete with traditional drying methods involving any en-ergy expenditures. The green house type crop dryer can also be used for growing vegetables when drying operation is not needed.
(b) Forced Circulation Type Dryers(i) A solar energy based 1 t capac-
ity grain dryer was designed and de-veloped [8]. The dryer was capable of drying 1 t maize grain from mois-ture content of 20 to 25 % to 10 to 12 % in 8 h of sunshine. A flat plate collector system was designed and fabricated for heating the drying air from 20 to 45 ºC at solar intensities ranging from 600 to 650 W/m2. The collector system used a 4.5 x 1.5 m double glass cover and a single base plate. The complete solar collector unit was supported on an angle iron frame that holds the flat plate collec-tor at an angle of 25 degrees with the horizontal. Two 70.9 m3/min blowers were used to force the heated air in each of two 500 kg drying bins. The blowers were connected with a 100 mm diameter GI pipe with a globe valve to regulate air flow rate. The drying bins were 850 mm diameter and 1250 mm higher. Each bin had a false floor with 3 mm holes above a 150 mm plenum.
(ii) Three different capacity solar driers were developed for paddy drying using a flate plate solar air heater (0.25 t, 1 t and 10 t per day) [23]. The external dimensions of the solar air heater for the 0.25 t solar dryer were 4.6 x 1.6 m with a net area of 6.8 m2 for solar energy collection. The air channel was made of GI sheet and painted with black board paint at the top. It was insulated at the top and sides. The drying cham-
Fig. 5 Inclined direct type natural convection solardryer developed at CAZRI, Jodhpur

AGRICULTURAL MECHANIZATION IN ASIA, AFRICA, AND LATIN AMERICA 2005 VOL.36 NO.238
ber was rectangular in shape (1.8 x 0.9 x 0.7 m) and was made of 24 gauge GI sheet. The layer of grain was supported by the wire mesh. Hot air from the solar air heater was passed through the paddy lot. The wet paddy was dried at a constant air flow rate of 4.3 kg/h/kg of dried paddy during the month of October and November. The performance of the solar crop dryer was assessed by comparing it with paddy dried in an electrically operated dryer and dry-ing of unthreshed paddy suspended on ropes in the open sun. It took 6 to 7 h to dry paddy to safe moisture content in solar as well as electri-cally operated dryer compared to 4 to 5 days in open field drying.
A flat plate solar air heater like the 0.25 t solar dryer, was used for the 1 t dryer having a net solar en-ergy collection area of 28 m2. It was modular in construction and con-sisted of four modules in parallel. The outer size of each module was 4.6 x 1.9 m. The air heater consisted of two parallel plates of MS sheet of 24 gauge forming a channel for air flow and was insulated from the sides and base by glass wool and covered by a glass sheet at the top. There were heaters at the lower and top ends of this channel. The suc-tion of air was from the lower end whereas hot air delivery was form the top end of the heater. The dis-tance between the two plates of the air channel was 38 mm. Thickness of insulation on the base was 50 mm and on the side was 38 mm. The top side of the air channel was painted black which acted as an absorber. The space between the absorber and the 3 mm thick glass sheet was 45 mm. The inclination of the air heaters was kept at 45 degrees since most of the products were dried dur-ing the winter season.
A 3 hp air blower sucked hot air from the air heater and forced it through the paddy lot in the drying chamber (cylindrical bin of 2140 mm diameter and 1150 mm height). The hot air duct (228 x 278 mm)
connecting the air blower with the air heater was made of 24 gauge MS sheet. An intensive testing of the solar air heater was done between 10:30 and 2.00 PM. The average ef-ficiency of the air heater was found to be 46.2 %.
Designing of the 10 t/day capacity paddy solar dryer under Ludhiana conditions (October and November) involved selection of a suitable so-lar air heater and drying chamber. Computer models were developed for the solar air heater and drying chamber. The results indicated that as air flow rates increased the aver-age temperature at the air outlet de-creased. The drying time decreased with increase in collector area. A constraint was that the required temperature could be obtained only for 7 h in a day in the area. There-fore, a collector area 300 m2 with air flow rate of 100.8 kg/m2/h was found adequate.
(iii) A solar batch dryer developed at Coimbatore Centre of the PHTS had three bays with an 8 x 1.8 m double glass shielded flat plate solar collector, a centrifugal blower with 83 m3/min capacity at 50 mm of wa-ter, and a rectangular (2770 x 1770 x 300 mm) aeration bin for holding 1 t paddy as major components [5 and 7]. The solar energy absorber, made of 24 gauge GI sheet, was mounted 50 mm above the back of the collec-tor which was insulated with 50 mm of glass wool. The 3 mm thick glass shield was mounted with a 20 mm air gap. Staggered air baffles were provided in the air duct to create tur-bulence for better heat distributor. It was designed for 0.9 degrees latitude (11 degrees for Coimbatore) orienta-tion facing south. It took 7.5 h to dry 1 t of paddy from 24 to 14.5 % wb moisture content under ambient con-dition of 24 ºC and 60 % RH with plenum air temperature of 40 ºC.
A 0.5 t capacity solar dryer was also developed for paddy drying [23]. The dryer consisted of an 8 m2 absorber with ducting, a 3 hp blower, and drying bin. The absorber with
ducting was made into four modules each having an area of 2 m2. The duct and collector were insulated with glass wool. The collector was made of 20 gauge GI corrugated sheet and covered with two transpar-ent glass sheets 3 mm thick. Baffles were provided on the absorber plate in a staggered fashion. The absorber was placed at 10 degrees to the hori-zontal facing south. The delivery side of the blower (83 m3/min) was connected to the plenum chamber of a circular holding grain bin.
The performance of the dryer was evaluated for paddy drying and compared with that of drying on threshing floor and roadside drying. The drying rate was found to be maximum when the dryer was test-ed with 300 kg paddy instead of 500 kg. Thus, the drying bed thickness corresponding to 300 kg paddy was reported optimum for this particular drying system.
(iv) A power tiller trailer mounted solar dryer using an unshielded flat plate solar collector was designed, fabricated and tested at CRRI, Cut-tack [5 and 7]. Absorbers of 36 gauge corrugated aluminum sheet, 26 gauge BP sheet coated with black paint, and 26 gauge corrugated GI sheet were evaluated. No distinctive difference in the air temperature rise was obtained consequently, on strength and cost considerations the later was preferred. The solar col-lector resulted in 9 to 10 ºC temper-ature rise at an airflow rate of 16.7 m3/min.
(v) The Jabalpur centre of the PHTS developed a low cost dryer which gave 9 ºC temperature rise at an air flow of about 38 m3/min in bright sunny weather at an ambi-ent air temperature of 22.5 ºC. The dryer consisted of a 1 t circular aeration bin, a 0.5 hp blower, and an unshielded absorber solar collec-tor placed on the south facing wall enclosing the motor [2 and 7]. This dryer was adopted for groundnut drying (from 40 to 10% wb, mois-ture content) at the CIAE, Bhopal

VOL.36 NO.2 2005 AGRICULTURAL MECHANIZATION IN ASIA, AFRICA, AND LATIN AMERICA 39
[24] with suitable modifications to make use of the standard size of available sheet metal, to make it light for portability, and to reduce cost. It had a batch capacity of 1.4 m3. In December, it gave an air tempera-ture rise of 6 ºC (4 to 6 ºC range). In cloudy weather it ranged from 2 to 4 ºC with average of 3.5 ºC. Results suggested additional supplemental heating for groundnut drying.
(vi) The Coimbtore centre of the PHTS developed a roof built-in-solar dryer [23]. The existing roof of a grain storage room made of 20 gauge corrugated GI sheet was cov-ered with 6 mm thick transparent glass with a 50 mm clearance be-tween the roof surface and the glass sheet. The roof facing south at a 40 degree angle from the ground and placed east was painted black. Total absorber area of the collector was 18 m2 (12 x 1.5 m). The air duct (200 x 200 mm) received hot air from the collector and carried it to the dry-ing chamber. A 2 hp blower with 60 m3/min air discharge was incorpo-rated with the drying system. It took 9 h to dry 0.5 t paddy from 23.8 to 12.0 % wb, moisture content with a grain bed thickness of 300 to 400 mm under normal sunny days when the solar radiation intensity was 460 to 850 W/m2 and the ambient tem-perature was 29 to 32 ºC. The hot air temperature could be maintained in the range of 32 to 44 ºC.
(vii) Drying of fenugreek and co-riander leaves was performed [21] in a forced circulation solar hot air dryer. The solar dryer was provided with a 9 kW electric backup heater. Thirty-six units of solar collector each with a 2 m2 area, were ar-ranged in series in three rows with total collector area of 72 m2. The hot air was forced into the drying cham-ber loaded with 24 trays 600 x 600 mm. A 5 hp electric blower with air discharge rate 2500 m3/h was used. The fresh vegetables were loaded in the trays with material spread 3.3 to 3.7 kg/m2. The results revealed that 40 to 50 ºC temperature is ap-
propriate for good quality finished products. The solar dried fenugreek and coriander leaves retained their f lavour and exhibited only minor change in colour and appearance.
(viii) A roof built-in-solar col-lector (12 x 6 m) was designed and fabricated at the CIAE Bhopal [23]. The south facing roof of the existing shed was used for harnessing solar energy. A 1 t capacity grain dryer was developed and installed under the roof built-in-solar collector (i.e. shed). The grain was held between the two concentric perforated cyl-inders through which air diffused. Preliminary testing of the system indicted that 38.1 m3/min hot air at 50 ºC can be generated. On an aver-age 25 to 30 ºC above ambient tem-
perature was obtained.(ix) A cart-mounted engine waste
heat-cum-solar batch dryer was developed at Jabalpur centre of the PHTS. It was a low cost dryer with mobility. It consisted of 1.77 x 1.09 x 1.00 m aeration bin with a 225 mm deep plenum [6]. Usually only about one-third of the heat energy is available for shaft work whereas the remaining two-thirds go as waste through exhaust and surface heat losses. In this dryer this waste heat was salvaged to heat the air. To further supplement the dryer a 2 m2 unshielded flat plate solar collector with 100 mm air space was provided. In November, in partial overcast weather, using a 1.9 hp (petrol) en-gine, a 8.8 ºC temperature rise was
Fig. 6 Pictorial view of recirculating batch dryer coupled with rice huskfired furnace for paddy drying developed at IIT, Kharagpur
1. Bucket elevator 2. Paddy loading hopper 3. Blower with motor4. Secondary inlet 5. Mixing space 6. Curtain wall7. Precipitation space 8. Horizontal grate 9. Rotating leaver10. Furnace space 11. Inclined grate (at 45º) 12. Fluted roller13. Pulley 14. Hopper 15. Combustion space16. Discharge pipe 17. Hot air duct 18. Flue gas exit by pass19. Outer cylinder 20. Inner cylinder 21. Delivery pipe

AGRICULTURAL MECHANIZATION IN ASIA, AFRICA, AND LATIN AMERICA 2005 VOL.36 NO.240
obtained, (5.8 ºC from solar energy and 3.0 ºC from engine waste heat). It dried 0.7 t of paddy from 20 to 13 % wb moisture content in 8 h.
(x) A biogas aided solar roof dryer was designed and tested [33]. The dryer consisted of solar f lat plate collector at the roof, ducting, a blower, a rectangular drying bin, and a biogas burner for air heating so that the dryer could also be used under inclement weather conditions. The size of the dryer was 2770 x 1170 x 840 mm with a perforated false floor that had 16 holes per cm2
and were 1.5 mm diameter. The roof dryer was made of 20 gauge corrugated GI sheet. The collector sheet was painted black and covered with 6 mm thick single transparent glass. The size of the flat plate col-lector was 12 x 1.5 m (18 m2). The angle of inclination of the roof was 40 degrees facing south. Testing of dryer was done with 1 t of paddy for moisture reduction from 23 to 12 % wb. The drying time was 16 h open
sun drying, 9 h in the solar roof dryer, and 8 h in the biogas aided solar drying system.
D. Agricultural Waste Fired Dry-ers
(i) An agricultural waste-fired dryer was developed at Akola centre of the PHTS. It consisted of a simple furnace made of bricks in clay mor-tar having a horizontal grate and chimney, an indirect type heat ex-changer, a 3 hp electric blower, and an aeration bin. Agricultural waste such as cotton stalks, sorghum stub-ble, and pigeon pea stalks were used as fuel at the rate of 30 to 37 kg/h to get hot air 65 to 80 ºC. The flue gases escaped through the chimney [5 and 7]. The dryer was tested for drying cobs as well as grains of sor-ghum. A batch of 1.5 q of sorghum grains required 2.5 to 3.0 h to dry from 15.0 to 9.8 % wb, moisture content. With only small modifica-tions the same dryer was also used for drying of chillies and other high
moisture farm produces. The tem-perature of the hot air was adjusted as required for controlling the fuel feed rate (18 kg/h in this case).
(ii) A recirculating type dryer coupled with IRRI type husk-fired furnace was developed at Pantnagar centre of the PHTS. The furnace consisted of a rectangular fire-brick chamber having combustion and settling section, installed on an iron frame. A vibrating feeder dropped the husk continuously in the combus-tion chamber through the grate and hopper. The hot air blew through an opening at one end of the settling chamber. Ash that mixed with the hot air settled in the trap section [5 and 7]. With increased husk feed rate from 1 to 9 kg/h, the air temperature increased from 30.2 to 77.6 ºC at ambient conditions of 23 ºC and 71 % RH. At 8 q/h paddy feed rate, 28.3 m3/min of air, air temperature of 50 ºC and initial moisture content of 24.7 % wb, the heat utilization efficiency was 83 %. The unit had been suc-cessfully applied to a rice mill.
(iii) A 1.25 t capacity recircula-tory paddy dryer was developed at Kharagpur centre of the PHTS. The dryer was equipped with an inclined grate adjustable to 40, 45 and 50 degrees angle of inclination (Fig. 6). A centrifugal blower with a capacity of 8.5 m3/min was at-tached. The accumulated ash was periodically disposed off with the help of a horizontal revolving grate. A curtain wall at the end of the horizontal grate prevented fly ash or unbrunt rice husk from going into the outlet with hot gases. The husk was fed into the furnace with the help of a flutted roller placed at the bottom of the hopper. The air nec-essary for combustion was sucked through the opening for feeding the husk and partially through the grate openings. Additional air was intro-duced through the secondary inlet to the blower in order to reduce the flue gas temperature. As there was no carbon monoxide in the flue gas, this furnace could be used for dry-
Fig. 7 Schematic drawing of cyclone type paddy husk fired furnace coupledwith steam generator and grain dryer developed at IIT, Kharagpur
1. Delivery pipe 2. Elevator 3. Inner cylinder4. Outer cylinder 5. Paddy loading hopper 6. Drying unit7. Cold water 8. Ash pit 9. Water10. Fire tubes 11. Hot air duct 12. Safety valve13. Hot gases 14. Steam outlet 15. Pressure gauge16. Steam space 17. Water level indicator 18. Refractory brick lining19. Hopper with stand 20. Fluted roller 21. Blower with motor22. Cyclone furnace 23. Reentrant throat 24. Steam generator
VOL.36 NO.2 2005 AGRICULTURAL MECHANIZATION IN ASIA, AFRICA, AND LATIN AMERICA 41
ing of paddy without any undesir-able affects. The furnace efficiency at a husk feed rate of 11.7 to 16.9 kg/h was 44.5 %. Later, a horizontal cyclone type, highly efficient rice husk fired furnace (Fig. 2b) was de-signed, developed, and incorporated with steam generator (Fig. 7). The f lue gas from the steam generator was utilized for paddy drying using 1.25 m3/min air flow rate with 5 to 30 kg/h husk feed rate. The furnace efficiency at 20 kg/h husk feed rate was 80 % [20].
(iv) An agricultural waste-fired t rolley dryer was developed at Ludhiana centre of the PHTS. A standard tractor trolley of size, 3 x 2 x 0.6 m was modified for drying paddy grains in 0.40 to 0.45 m deep beds. The conventional Jullunder type pit furnace used for “jaggery” making, 1.8 m diameter and 1.8 m deep with the grate fixed at 0.45 m from top provided with a chimney, was used. A 1.5 x 1.5 x 0.25 m MS heat exchanger with 14 fins was connected to mixing chamber with a 1 m long asbestos cloth tubing. A 5 hp centrifugal blower sucked air from the mixing chamber and delivered it into a canvas plenum [7]. It took 5 h to dry a batch of 1.4 t paddy from 20 to 15% wb moisture content with 55 ºC hot air at 29.7 m3/min at an ambient tempreture of 15.5 ºC and 70 % RH.
E. OthersRefer to Table 1.
ConclusionsThe extensive review of drying
and driers revealed that both con-ventional and non-conventional en-ergy based driers have been devel-oped over many years. Oil furnace based LSU type driers were in use in the Country in the early 50’s. A break through was made in the de-velopment of efficient rice husk fired furnaces for steam and hot air gen-eration at IIT Kharagpur, FCI Rice Mills, Thanjavur, M/S Indus Ser-vices Pvt. Ltd., Kolkata (WB), An-namalai University, Annamalaina-gar, GBPUA&T, Pantnagar and PAU Ludhiana. Both step grate as well as cyclone type rice husk furnaces were developed for drying purposes. These furnaces not only found ap-plication in paddy processing units but also in many other food indus-tries in the Country. Almost all the FCIs, SWCs, Rice Mills and many other Agro Industries replaced their oil-fired furnaces with that of rice husk fired furnaces. Researchers in the last 4 to 5 decades explored the possibilities of the use of alternate energy sources such as solar and biomas for hot air generation. Dur-ing this period a number of driers have been designed, developed, per-fected, and commercialized. Almost all agricultural materials have been tackled and drying characteristics studied under laboratory as well as field conditions. Most recently work on osmotic dehydration of fruits and
Type of dryer Developed at Suitability Capacity
Tray- type copra dryer CPCRI, Kasaragod Copra 1000 coconuts/batch
Solar dryer CPCRI, Kasaragod Coconut, black pepper, arecanut and cardamom
80-100 coconuts/batch (4 days), 50 kg arecanut/ batch (30 days), 18 kg black pepper/batch (4 days)
Agricultural waste-fired dryer CPCRI, Kasaragod Coconut, arecanut, black
pepper, cocos beans400 coconut/batch, 150 kg arecanuts/batch, 40 kg fermented cocoa beans/batch
Cocoa- bean dryer CPCRI, Kasaragod Cocoa beans 40 kg/batch (62 h)
Low-cost poly-solar dryer CPCRI, Kasaragod Coconut, black pepper, fish, papads 60 coconut/batch
Cup and cone dryer Annamalai University, Annamalainagar (TN) Raw and parboiled paddy 1 t/batch
Table 1 Others
vegetables have been investigated.
REFERENCES
Alam, A. 1979. Use of solar energy in post harvest technology. Proc. Intl. Sun Day Seminar on solar Energy: Rural India and Edu-cational Institutions, Jyoti Solar Energy Institute, Vallabh Vidhy-anagar, Gujrat, May 3, 1979.
Alam, A. and Gupta, S.K. 1978. Solar blower for grain drying and ventilation. Proc. Intl. Solar En-ergy Conf. New Delhi, Jan 1978.
Alam, A. and Singh, H. 1980. Ex-hauster to augment airflow from a stack using wind energy. Paper no. 80-1205, presented in XVII ISAE Conv., New Delhi, Feb. 6-8, 1980.
Alam, A. and Singh, H. 1981. Dehydration of chilli for better economic returns. Intl. Conf. on Agril. Engg. and Agro-Industries in Asia, AIT, Bangkok, Nov. 10-13, 1981.
Alam, A. and Singh, H. 1988. Use of solar, wind and biomass energy in post harvest technol-ogy. Proc. NSEC-81, BM: 03, pp: 9:016-9.019.
Alam, A., Gupta, S.K. and Jain, D.K. 1978. Preventive grain dry-ers, Paper presented in XVI An-nual Convention of ISAE held at IIT, Kharagpur on Dec. 18-20, 1978.
Ali, N., Alam, A. and Ilyas, S.M.
AGRICULTURAL MECHANIZATION IN ASIA, AFRICA, AND LATIN AMERICA 2005 VOL.36 NO.242
1980. Crop Dryers: Use of Solar Energy and Agricultural Waste. Tech. Bul. No. CIAE/80/12, CIAE Bhopal.
Ali, Y. and Mathur, A.N. 1989. Development of solar based one tonne capicity dryer. In Proc. National Workshop on Solar Dry-ing. [Editors : AN Mathur, Yusuf Ali and RC Maheshwari, Himan-shu Publications, Udaipur, CTAE Udaipur], pp: 128-132.
Annonymous, 1996 -1998. An-nual Reports of AICRP on PHTS, CIAE, Bhopal Centre.
Annonymous, 1998. A profile of technologies development in AICRP in PHT. Leafet No. 1(123) 97-PHTS, CIPHET, Ludhiana.
Annonymous, 1998. CAZRI Jodh-pur, Annual Repor t 1997, pp: 59-60.
Annonymous, 1999. CAZRI Jodh-pur, Annual Report 1998, pp: 58.
Bhatnagar, S. and Ali, Y. 1989. An overview on design of solar dryer for agricultural and food products. In Proc. National Workshop on So-lar Drying. [Editors: AN Mathur, Yusuf Ali and RC Maheshwari, Himanshu Publications, Udaipur, CTAE Udaipur], pp: 67-77.
Bisht, B.S. 1999. Coordinator's Re-port for presentation at the Coor-dination Committee Meeting of AICRP on Post Harvest Technil-ogy, held at UAS Banglore, 27-29 Dec. 1999, CIPHET Ludhiana, pp: 1-53.
Chandra, P., Singh, H. and Singh, J. 1993. Developments in the use of solar energy for crop drying in India. Jl. of Rural Energy, vol. 2, No.1, pp: 1-10.
Chouhan, P.M. and Patel, N.C. 1989. Sun drying characterisitics of groundnut under the drying practices adopted by the farmers of Gujrat. In Proc. National Work-shop on Solar Drying. [Editors: AN Mathur, Yusuf Ali and RC Maheshwari, Himanshu Publica-tions, Udaipur], CTAE Udaipur, pp: 85-91.
Kachru, R.P. and Singh, H. 1992.
Drying of agricultural products for minimizing post harvest losses. Indian Farming, vol 42, No.1,pp: 29-32.
Mathew, S. and Sachcev, S. 1989. Quality evaluation of selected leafy vegetables dried in solar dri-er and open Sun. In Proc. National Workshop on Solar Drying. (Edi-tors: AN Mathur, Yusuf Ali and RC Maheshwari, Himanshu Publi-cations, Udaipur, CTAE Udaipur), pp: 103-111.
Mudgal, V.D., Jain, N.K., Bordia, J.S. and Seth, P. 1998. Research Digest (1972-97), PHTS, CTAE, Udaipur Centre, pp: 33-34.
NPC Published Report, 1986. Per-formance Evaluation of Rice Husk Fired Furnace Systems. [Study teams : BK Arora, AK srivastave and DPS Bains (NPC Team) & RC Maheshwari and Harpal Singh (CIAE Team)], National Produc-tivity Council, New Delhi, pp: 1-143.
Pande, V.K., Sonune, A.V. and Phil-lip, S.K. 2000. Solar drying of coriander and methi leaves. J.Fd. Sci. Technol, vol. 37, No.6, pp: 592-595.
Sharma, G.P. and Prasad, S. 2001. Drying of garlic cloves by micro-wave hot air combination. Paper (proof stage) in Jl. of Food Engi-neering, Elsevier.
Singh, H. 1993. Seventh Plan Achievement of AICRP on Re-newable Energy Sources for Ag-riculture and Agro based Indus-tries, CIAE Bhopal.
Singh, H. and Alam, A. 1981. De-velopment and testing of solar batch-in-bin dryer. Paper No. 81-Pas-508, presented in XVIII ISAE Conv. CSSRI Karnal, Feb. 26-28, 1981.
Singh, H. and Alam, A. 1981. Solar cabinet dryer for chilli drying. Jl. of Seeds and Farms, Vol.VII, No.7, pp: 25-26 and 31.
Singh, H. and Alam, A. 1983. De-velopment of solar-cum-wind spirator for drying and ventilation. J. Agril. Engg. ISAE, Vol.XIX,
No.4, pp: 63-68.Singh, H. and Alam, A. 1985. De-
sign of prime-mover less solar dehydrator. J. Agril. Engg., ISAE, Vol.22, No.2, pp: 35-41.
Singh, H. Alam, A. and Chandra, P. 1986. Dimensional analysis of performance of a solar-cum-wind aspirator developed at CIAE. EN-ERGY RESEARCH Vol.10, pp : 171-179.
Singh, P.P. and Mannan, K.D. 1989. A typical case study on solar dry-ing. In Proc. National Workshop on Solar Drying. [Editors : AN Mathur, Yusuf Ali and RC Ma-heshwari, Himanshu Publications, Udaipur, CTAE Udaipur], pp: 50-66.
Thanvi, K.P. 1998. Development of a commercial solar dryer for arid regions. Proc. NSEC-1998, pp:289-294.
Thanvi, K.P. and Pande, P.C. 1989. A low cost tilted type solar dryer. SESI, Renewable Energy for Rural Development, pp: 405-409.
Thanvi, K.P. and Pande, P.C. 1989. Performance evaluation of solar dryer developed at CAZRI, Jodh-pur. In Proc. National Workshop on Solar Drying. [Editors : AN Mathur, Yusuf Ali and RC Ma-heshwari, Himanshu Publications, Udaipur, CTAE Udaipur], pp: 157 -164.
Vijayaraghavan, N.C., Palanisamy, P.T. and Swaminathan, K.R. 1989. Study of biogas aided solar crop dryer. In Proc. National Workshop on Solar Drying. [Editors : AN Mathur, Yusuf Ali and RC Ma-heshwari, Himanshu Publications, Udaipur, CTAE Udaipur], pp: 195-203.
■■
VOL.36 NO.2 2005 AGRICULTURAL MECHANIZATION IN ASIA, AFRICA, AND LATIN AMERICA 43
Insect Inhibitive Properties of Some Consumable Local Plant Materials on Grains in Storage
byD.S. ZibokereDepartment of Agric. Environmental EngineeringNiger Delta University, Wilberforce Island, Bayelsa StateNIGERIAE-mail: [email protected]
AbstractThis work assesses the effective-
ness of four locally consumable plant fractions in the control of insect infestation on food grains in storage. The consumable local plant fractions were bush mango (Irvin-gia gabonensis) wood, defruited oil palm bunches, ginger tuber and onion bulbs all made into ash and powder, and applied respectively to dehusked rice kernels, shelled maize kernels, and cowpea seeds kept on shelves in the laboratory for six months. Results show that all plant fractions applied proved significant-ly effective in the inhibition of the activities of the insect pests of the food grains (p = 0.05, LSD) in rela-tion to the controls. However, wood ash and ginger powder treatments were especially recommended be-cause of their high residual toxicity on the insect pests, their low cost, and their availability.
IntroductionThroughout history, grains have
remained man’s most common and important source of protein and in fact, food. Whether it is cereals or leguminous, post harvest grains beyond the farm gate require proper handling including storage and within storage protection against
insect pests. Insect pest infestation either before or during storage and efforts toward its control has, equal-ly, remained man’s singular problem in food security. Untreated grains on storage shelves have resulted in heavy losses. The loss figure was 92.3 % for 12 months storage in the work of Giles (1963); Adu (1981) and Hall (1970) reported about 54 % and 62 % respectively for 6 months shelving. In fact, FAO (1990) sum-marizes it all by saying that losses of food to non-human agents may cumulate to millions of tonnes, es-pecially for developing economies. In what follows, the quest for reduc-ing losses to insects during storage of grains has resulted in heavy ap-plication of chemicals. These chem-icals are mostly organic based in the form of fumigants and dusts that are reported to have carcinogenic side effects and, in fact, are relatively expensive (Adu, 1981). Unhappily, methods to limit the effects of these chemicals to the offending insects have continued to evade research re-sults. Chemical treatment of stored food grains has therefore, continued to result in toxic consequences to the consuming humans, livestock, and, perhaps, the environment. Research efforts have, therefore, shifted in search of alternatives that would be less expensive, devoid of toxic side effects, and yet be at the immediate reach of the local farmer.
The possibility of obtaining in-secticidal effects from some local plant materials has long been inves-tigated. IITA (1976) used vegetable oil on cowpea seeds and stored for about two months. Several others have reported obtaining good insect inhibitive properties from plant parts - black pepper (Su, 1977), citrus peels (Taylor, 1975), garlic (Borukh et al., 1975), red chilli pepper (Zibokere, 1994) and some photo chemicals (Jacobson, 1984). Apart from the reports on garlic and chilli pepper, most plant parts used were not really consumable. It is the objective of this work to investigate the insect inhibitive properties of oil palm bunch ash (OPBA), wood ash (WA), onion bulb powder (OBP), and ginger tuber powder (GTP) on food grains in storage.
Materials and MethodOil palm bunch ash was obtained
by open air burning of defruited palm bunches in a drum. Wood ash was obtained by freely burning the wood of bush mango (Irvingia gabonensis)* at the fireplace of a local kitchen, and sieved through No. 60 mesh. Onion bulbs and gin-ger tubers were peeled, oven dried and separately hammer-mil led through an 8 mm round hole screen. The ground products were sieved

AGRICULTURAL MECHANIZATION IN ASIA, AFRICA, AND LATIN AMERICA 2005 VOL.36 NO.244
through No. 60 mesh (BS). The resulting powder of the two plant parts were collected and stored in airtight containers in the laboratory.
Uninfested cereal (maize and rice) and leguminous (cowpea) grains were procured from the local market place. These were dried to approxi-mately the same moisture content (12.62 % wb). Sixty 10 kg samples were prepared for each of the food grains into 60 sterilized plastic con-tainers. Forty-eight of these samples were thoroughly mixed with 20 g of each of the ash and powder in the order of four replicates of each food grain with each of the plant fraction as treatments. The remaining were untreated and kept as control sets. All were then inoculated with 10 live adult weevils of its kind. The inoculated sets were then weighed
and kept on rodent-proof, open shelves under ambient conditions in the Agricultural Engineering laboratory of Rivers State Univer-sity of Science and Technology, Port Harcourt for 24 weeks (six months). Note that the sample containers were of the same size and were cov-ered with fine mesh fabric for free ventilation. Half of the sample sets (i.e. 30 sets) were carefully analysed at the end of the 3rd month in stor-age. The second half of the sample sets were analysed at the end of the 6th month. Weight loss index, (Wi) was calculated following Zibokere (1994):
Wi = x 100 % .....................(1)
where,wi - wf represents loss in weight (subscripts representing initial and
final weights, kg).An infestation index was also cal-
culated following Ezeike (1984):
IF = x 100 % .....................(2)
where,W = total weight of seeds used, gw = total weight of seeds uninfest-ed, g
Data were also collected on insect mortality and grain damage respec-tively.
At the end of the experiment vi-ability tests were conducted on both petri-dish and soil-in-moisture cans and indices were calculated.
All the calculated indices, in ad-dition to other physical observations on the treatments were statistically compared to those of control (p = 0.05, LSD).
* The wood of Irvingia gabonensis is locally consumed medicinally and as chewing stick, while oil palm bunch is used as additive in prepar-ing certain consumable delicacies.
Results and DiscussionResults obtained from the experi-
ments are given in Tables 1, 2 and 3 on rice maize and cowpea re-spectively. The tables show that the wood ash is highly effective in the control of the storage insect pests of these food grains, followed by ginger powder treatment. It appears that the wood ash and ginger pow-der have greater residual toxicity on the insects since, unlike the other two treatments, mortality figures are about 24 % higher on prolonged storage (six months). The onion bulb powder however was shown to be very effective on the short term (three months). It appears that the active ingredient is the volatile sub-stance, which depletes on the long run and becomes less effective than the wood ash and ginger powder. A similar effect by a volatile substance was reported on garlic (Borukh et al., 1975), and on red chilli pepper
Treat -ment
Weight lossindex, %
Graindamage, %
Infestation index, %
Insectmortality, %
% seed viability
3rdmouth
6thmouth
3rdmouth
6thmouth
3rdmouth
6thmouth
3rdmouth
6thmouth
6thmouth
GTP 0.28 0.55 2.84 4.05 1.67 0.69 84.68 97.78 88.4OPBA 0.94 9.06 2.95 18.23 1.92 7.98 81.52 80.33 81.4
WA 0.13 0.39 2.44 3.14 1.34 0.18 84.73 99.15 88.6OBP 1.11 3.92 3.08 10.47 2.37 4.46 84.31 81.84 88.3
Control 19.88 38.72 54.51 92.06 38.65 63.73 0.27 0.00 85.4Table 3 Effect of consumable plant materials
on storage insect pests of cowpea (shelled)
Treat -ment
Weight lossindex, %
Graindamage, %
Infestation index, %
Insectmortality, %
% seed viability
3rdmouth
6thmouth
3rdmouth
6thmouth
3rdmouth
6thmouth
3rdmouth
6thmouth
6thmouth
GTP 0.96 1.73 2.69 4.86 1.44 1.08 85.08 97.96 77.9OPBA 0.85 8.78 3.85 15.94 1.88 6.23 82.25 71.74 77.7
WA 0.99 1.27 2.47 3.69 1.18 0.29 85.18 98.22 78.6OBP 0.94 4.89 3.23 9.77 1.86 3.47 85.60 74.93 76.5
Control 17.84 34.61 51.16 88.84 47.78 78.74 0.39 0.00 78.1Table 2 Effect of consumable plant materials
on storage insect pests of maize (shelled)
Treat -ment
Weight lossindex, %
Graindamage, %
Infestation index, %
Insectmortality, %
% seed viability
3rdmouth
6thmouth
3rdmouth
6thmouth
3rdmouth
6thmouth
3rdmouth
6thmouth
6thmouth
GTP 0.09 0.91 3.85 5.01 1.13 1.07 86.58 94.99 84.3OPBA 1.06 5.93 5.74 11.61 2.17 4.66 83.61 77.94 79.6
WA 0.11 0.49 3.17 4.47 1.74 0.56 84.34 98.41 84.8OBP 0.05 3.46 2.28 7.39 0.68 2.94 86.47 82.52 83.3
Control 16.71 39.56 53.61 94.82 44.93 84.72 0.39 0.00 81.8Table 1 Effect of consumable plant materials
on storage insect pests of rice (dehusked)
wi - wfwi
W - wW

VOL.36 NO.2 2005 AGRICULTURAL MECHANIZATION IN ASIA, AFRICA, AND LATIN AMERICA 45
(Zibokere, 1994). The insect inhibi-tive effect of OPBA was rather in-ferior to that of the other three. The scores on all the indices used were less significant.
Though the strongest insect inhib-itive action was shown by the wood ash and ginger powder treatments, the other two consumable plant ex-tracts used were also convincingly effective. Their scores were also significant relative to the scores of the control samples (p = 0.05, LSD).
Tolerance of the food grains to the treatments was assessed by quality assay method (AOSA, 1990). There were no real changes on the average quality parameters. This was un-like garlic and red chilli pepper that were reported to impart undesirable odour and coloration respectively on the food grains to which they were applied (Borukh et al., 1975 and Zibokere, 1994). Also there was no significant difference in seed viabil-ity between treated and untreated seeds. Mitchel and Kader (1985) had reported that most grains do not tol-erate chemical treatment in storage, showing excessive loss of viability. The insect controlling plant fraction did not affect the germinability of the grains to which they were ap-plied.
This work has, therefore, gener-ally shown that the consumable lo-cal plant materials used here could be reliable alternatives to the usual chemicals in food grain storage practice.
AcknowledgmentThe researcher expresses thanks
to the Department of Agricultural Engineering of the Rivers State Uni-versity of Science and Technology, Port Harcourt, for allowing the use of their laboratory for the experi-ments; to Miss Virginia Agedah, Mr. Otavie Sambo, and Miss Gloria Wariso for their numerous contribu-tions offered during the process of the experiments of this work.
REFERENCES
Adu, O. O. 1981. Storage losses: a bane of food availability. Pro-ceedings, National Conference on Strategies for Increasing Food Production in Nigeria, Held in Rivers State University of Science and Technology, Port Harcourt.
AOSA. 1990. Rules for test ing seeds. Bulletin of the Association of Official Seed Analysts, Wash-ington D. C.
Borukh, I. F; Kihtaba, V. I; Dem-kevich, L. T and O. Yu. Barabash. 1975. Bactericidal properties of the volatile fractions of garlic phytoncides. Prikladnaya Blo. Mikro 11(3): 428-430.
Ezeike, G, O. I. 1984. Near optimum conditions for yam (D. spp) tuber storage. Proceedings, Nigerian Society of Engineers (NSAE). 8: 99-116.
FAO. 1990. The state of food and agriculture in the world and re-gion reviewed. Structural Adjust-ments and Agriculture, Bulletin No. 23.
Giles, P. H. 1963. Cowpea storage by Northern farmers. Paper, 1st Nigerian Grain Legumes Confer-ence, Samaru.
Hall, D.W. 1970. Handling and stor-age of food grains in tropical and sub-tropical areas, FAO, Rome.
IITA. 1975. The cowpea biotechnol-ogy on natural pests control. An-nual Reports 9(2): 2-10.
Jacobson, M. A. 1974. Control of stored products insects with photo chemicals. Tropical Stored Prod-ucts 49: 54-56.
Mitchell, C. F and A. A. Kader. 1985. Post harvest treatment for insect control. Post harvest Tech-nology of Horticultural Crops, Special Pub: 100-103.
SU, H.C. F. 1977. Insecticidal prop-erties of black pepper to rice wee-vils and cowpea weevils. J. Econ Ent 70: 18-21.
Taylor, T. A. 1975. Effects of orange and grape fruit peels on calloso-bruchus maculates infestation of
cowpea. Ghana J. of Agric. Sc. 7: 61-62.
Zibokere, D. S. 1994. Insecticidal potency of red chilli pepper on pulse beetles in cowpea seeds storage. Indian J. of Agric. Sci. 64(10): 53-54.
■■
AGRICULTURAL MECHANIZATION IN ASIA, AFRICA, AND LATIN AMERICA 2005 VOL.36 NO.246
Evaluation and Performance of Raw Mango GraderbySyed Zameer HussainPresently Senior Research Fellowat Division of Agri. Engg. IARI,New Delhi - 110012INDIA
S. Javare GowdaProffessor and Head,Division of Agri. Engg.University of Agricultural Sciences BangaloreINDIA
S.C. MandharPrincipal Scientist and Head,Section of Agri. Engg. IIHR,Hessaraghatta Bangalore 560089INDIA
AbstractA mango grader suitable for pro-
cessing mangoes for export that worked on the principle of rolling the mango around the axis of mini-mum mass inertia was evaluated. Mangoes were made to roll down a slope in an expanding opening. Three grades were separated based on the opening size and a fourth grade consisted of mangoes that over f lowed the largest opening. The opening for grade I, grade II and grade III were 50 to 57, 57 to 64, and 64 to 70 mm respectively. The grader was tested for differ-ent raw mango varieties namely; Totapuri, Alphonso, Chinnarasam and Neelum at slopes 8 degrees, 12 degrees and 16 degrees. The rates for which the grader were tested were 720 kg/h, 1800 kg/h and 2400 kg/h. The best results were with the Neelum and the lowest with Chin-narasam. Further, the best results were shown by the widest opening (64 to 70 mm). Twelve degrees was the best slope. The percentage of fruits correctly graded decreased as the feeding rate decreased.
IntroductionIndia is considered as the second
largest fruit producing country in the World. Among the fruits, Mango (Mangifera indica Linn.) a native of India is one of the most relished fruit of the tropics, it occupies a prominent place among all the fruits and is considered as the “King of fruits” in India
India is the leading mango grow-ing country and produces about 65 % of the worlds total mango pro-duction. It is considered as the most important fruit and covers 35 % of area and 28 % of total production of fruits in the country. At present, in India mango occupies an area of 1.4 million hectares out of total fruit crop area of 3.94 million hectares. Out of total fruit production of 49.5 million tonnes, the estimated an-nual production of mango is 10.2 million tonnes. Although India has 65 % of world’s mango production, India’s “King of fruits” has never had a grip on international markets. It’s export is hardly 0.02 % of total production and only 3 % of the total export of mango (Srivastava, 1998).
For export as well as processing of mangoes, the fruits have to be
graded for size and quality. Efficient operation of mango peeling ma-chines requires prior size grading. Further, the export and processing of mangoes is seasonal and when grading is done manually, it is a la-bour and time consuming job.
Therefore, the objective of the present study was to evaluate the performance of a raw mango grader for its efficiency in grading.
Materials and MethodsThe grader consisted of a 2 x 0.5
m frame made of mild steel angles of 25 x 5 x 0.5 mm. Six 16 x 3 mm mild steel T-sections were used to make a converging opening of 50 mm at the feed end and 70 mm at the discharge end. Bolts and Nuts were used to fit the T-section in grooves at both ends of the frame. Thus the size of the opening be-tween the two T-sections were ad-justable by moving the T-section in the groove. The frame was mounted on two stands made of mild steel angle in such a way that it makes an 8 degrees angle to the horizon-tal. The highest end was chosen for fitting feeding chute made of mild
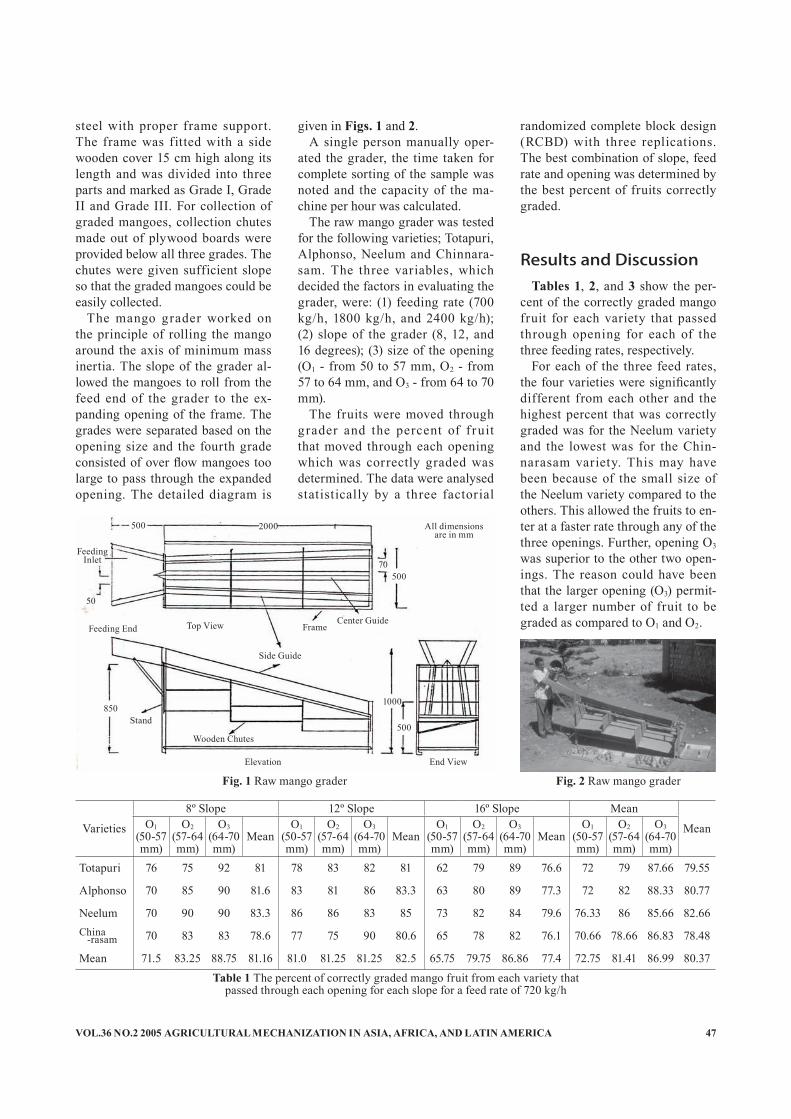
VOL.36 NO.2 2005 AGRICULTURAL MECHANIZATION IN ASIA, AFRICA, AND LATIN AMERICA 47
steel with proper frame support. The frame was fitted with a side wooden cover 15 cm high along its length and was divided into three parts and marked as Grade I, Grade II and Grade III. For collection of graded mangoes, collection chutes made out of plywood boards were provided below all three grades. The chutes were given sufficient slope so that the graded mangoes could be easily collected.
The mango grader worked on the principle of rolling the mango around the axis of minimum mass inertia. The slope of the grader al-lowed the mangoes to roll from the feed end of the grader to the ex-panding opening of the frame. The grades were separated based on the opening size and the fourth grade consisted of over flow mangoes too large to pass through the expanded opening. The detailed diagram is
given in Figs. 1 and 2.A single person manually oper-
ated the grader, the time taken for complete sorting of the sample was noted and the capacity of the ma-chine per hour was calculated.
The raw mango grader was tested for the following varieties; Totapuri, Alphonso, Neelum and Chinnara-sam. The three variables, which decided the factors in evaluating the grader, were: (1) feeding rate (700 kg/h, 1800 kg/h, and 2400 kg/h); (2) slope of the grader (8, 12, and 16 degrees); (3) size of the opening (O1 - from 50 to 57 mm, O2 - from 57 to 64 mm, and O3 - from 64 to 70 mm).
The fruits were moved through grader and the percent of f ruit that moved through each opening which was correctly graded was determined. The data were analysed statistically by a three factorial
randomized complete block design (RCBD) with three replications. The best combination of slope, feed rate and opening was determined by the best percent of fruits correctly graded.
Results and DiscussionTables 1, 2, and 3 show the per-
cent of the correctly graded mango fruit for each variety that passed through opening for each of the three feeding rates, respectively.
For each of the three feed rates, the four varieties were significantly different from each other and the highest percent that was correctly graded was for the Neelum variety and the lowest was for the Chin-narasam variety. This may have been because of the small size of the Neelum variety compared to the others. This allowed the fruits to en-ter at a faster rate through any of the three openings. Further, opening O3 was superior to the other two open-ings. The reason could have been that the larger opening (O3) permit-ted a larger number of fruit to be graded as compared to O1 and O2.
Varieties
8º Slope 12º Slope 16º Slope Mean
MeanO1(50-57mm)
O2(57-64mm)
O3(64-70mm)
MeanO1
(50-57mm)
O2(57-64mm)
O3(64-70mm)
MeanO1
(50-57mm)
O2(57-64mm)
O3(64-70mm)
MeanO1
(50-57mm)
O2(57-64mm)
O3(64-70mm)
Totapuri 76 75 92 81 78 83 82 81 62 79 89 76.6 72 79 87.66 79.55
Alphonso 70 85 90 81.6 83 81 86 83.3 63 80 89 77.3 72 82 88.33 80.77
Neelum 70 90 90 83.3 86 86 83 85 73 82 84 79.6 76.33 86 85.66 82.66China -rasam 70 83 83 78.6 77 75 90 80.6 65 78 82 76.1 70.66 78.66 86.83 78.48
Mean 71.5 83.25 88.75 81.16 81.0 81.25 81.25 82.5 65.75 79.75 86.86 77.4 72.75 81.41 86.99 80.37Table 1 The percent of correctly graded mango fruit from each variety that
passed through each opening for each slope for a feed rate of 720 kg/h
Side Guide
Center GuideFrame
Stand
FeedingInlet
2000500
70500
500
1000
Wooden Chutes
850
50
Feeding End Top View
Elevation End View
Fig. 1 Raw mango grader Fig. 2 Raw mango grader
All dimensions are in mm
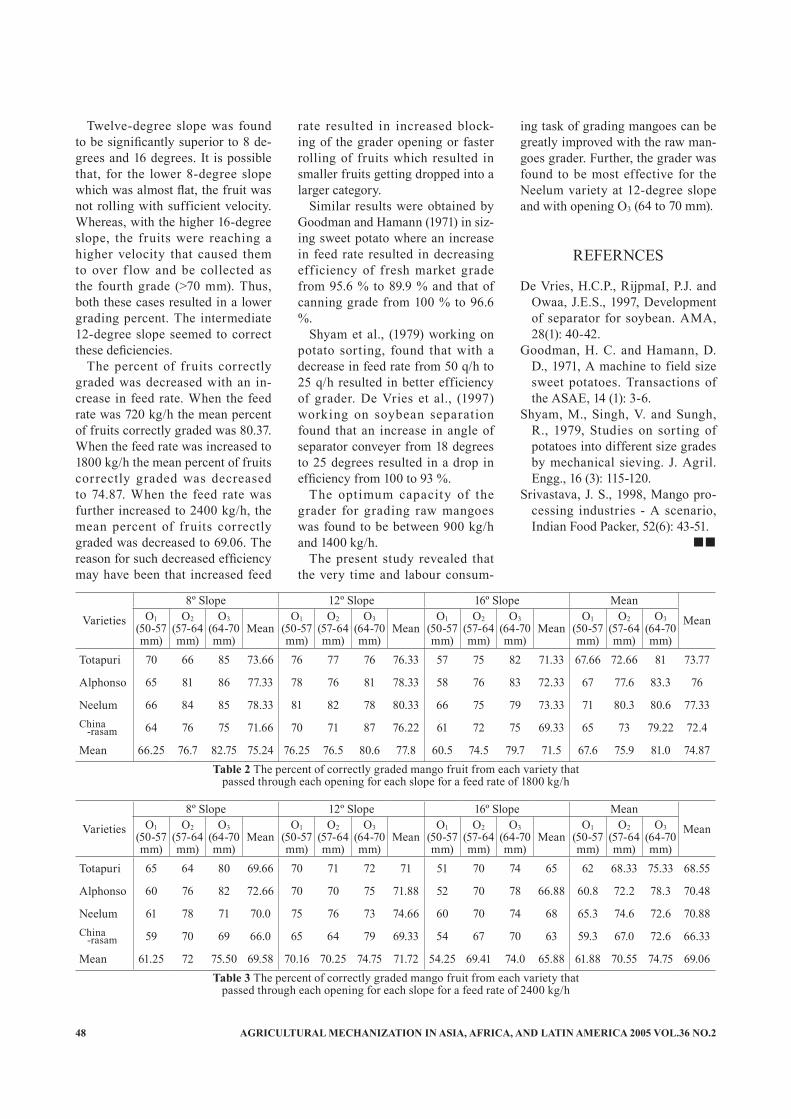
AGRICULTURAL MECHANIZATION IN ASIA, AFRICA, AND LATIN AMERICA 2005 VOL.36 NO.248
Twelve-degree slope was found to be significantly superior to 8 de-grees and 16 degrees. It is possible that, for the lower 8-degree slope which was almost flat, the fruit was not rolling with sufficient velocity. Whereas, with the higher 16-degree slope, the fruits were reaching a higher velocity that caused them to over f low and be collected as the fourth grade (>70 mm). Thus, both these cases resulted in a lower grading percent. The intermediate 12-degree slope seemed to correct these deficiencies.
The percent of fruits correctly graded was decreased with an in-crease in feed rate. When the feed rate was 720 kg/h the mean percent of fruits correctly graded was 80.37. When the feed rate was increased to 1800 kg/h the mean percent of fruits correctly graded was decreased to 74.87. When the feed rate was further increased to 2400 kg/h, the mean percent of fruits correctly graded was decreased to 69.06. The reason for such decreased efficiency may have been that increased feed
rate resulted in increased block-ing of the grader opening or faster rolling of fruits which resulted in smaller fruits getting dropped into a larger category.
Similar results were obtained by Goodman and Hamann (1971) in siz-ing sweet potato where an increase in feed rate resulted in decreasing efficiency of fresh market grade from 95.6 % to 89.9 % and that of canning grade from 100 % to 96.6 %.
Shyam et al., (1979) working on potato sorting, found that with a decrease in feed rate from 50 q/h to 25 q/h resulted in better efficiency of grader. De Vries et al., (1997) working on soybean separation found that an increase in angle of separator conveyer from 18 degrees to 25 degrees resulted in a drop in efficiency from 100 to 93 %.
The optimum capacity of the grader for grading raw mangoes was found to be between 900 kg/h and 1400 kg/h.
The present study revealed that the very time and labour consum-
ing task of grading mangoes can be greatly improved with the raw man-goes grader. Further, the grader was found to be most effective for the Neelum variety at 12-degree slope and with opening O3 (64 to 70 mm).
REFERNCES
De Vries, H.C.P., RijpmaI, P.J. and Owaa, J.E.S., 1997, Development of separator for soybean. AMA, 28(1): 40-42.
Goodman, H. C. and Hamann, D. D., 1971, A machine to field size sweet potatoes. Transactions of the ASAE, 14 (1): 3-6.
Shyam, M., Singh, V. and Sungh, R., 1979, Studies on sorting of potatoes into different size grades by mechanical sieving. J. Agril. Engg., 16 (3): 115-120.
Srivastava, J. S., 1998, Mango pro-cessing industries - A scenario, Indian Food Packer, 52(6): 43-51.
■■
Varieties
8º Slope 12º Slope 16º Slope Mean
MeanO1(50-57mm)
O2(57-64mm)
O3(64-70mm)
MeanO1
(50-57mm)
O2(57-64mm)
O3(64-70mm)
MeanO1
(50-57mm)
O2(57-64mm)
O3(64-70mm)
MeanO1
(50-57mm)
O2(57-64mm)
O3(64-70mm)
Totapuri 65 64 80 69.66 70 71 72 71 51 70 74 65 62 68.33 75.33 68.55
Alphonso 60 76 82 72.66 70 70 75 71.88 52 70 78 66.88 60.8 72.2 78.3 70.48
Neelum 61 78 71 70.0 75 76 73 74.66 60 70 74 68 65.3 74.6 72.6 70.88China -rasam 59 70 69 66.0 65 64 79 69.33 54 67 70 63 59.3 67.0 72.6 66.33
Mean 61.25 72 75.50 69.58 70.16 70.25 74.75 71.72 54.25 69.41 74.0 65.88 61.88 70.55 74.75 69.06Table 3 The percent of correctly graded mango fruit from each variety that
passed through each opening for each slope for a feed rate of 2400 kg/h
Varieties
8º Slope 12º Slope 16º Slope Mean
MeanO1(50-57mm)
O2(57-64mm)
O3(64-70mm)
MeanO1
(50-57mm)
O2(57-64mm)
O3(64-70mm)
MeanO1
(50-57mm)
O2(57-64mm)
O3(64-70mm)
MeanO1
(50-57mm)
O2(57-64mm)
O3(64-70mm)
Totapuri 70 66 85 73.66 76 77 76 76.33 57 75 82 71.33 67.66 72.66 81 73.77
Alphonso 65 81 86 77.33 78 76 81 78.33 58 76 83 72.33 67 77.6 83.3 76
Neelum 66 84 85 78.33 81 82 78 80.33 66 75 79 73.33 71 80.3 80.6 77.33China -rasam 64 76 75 71.66 70 71 87 76.22 61 72 75 69.33 65 73 79.22 72.4
Mean 66.25 76.7 82.75 75.24 76.25 76.5 80.6 77.8 60.5 74.5 79.7 71.5 67.6 75.9 81.0 74.87Table 2 The percent of correctly graded mango fruit from each variety that
passed through each opening for each slope for a feed rate of 1800 kg/h
VOL.36 NO.2 2005 AGRICULTURAL MECHANIZATION IN ASIA, AFRICA, AND LATIN AMERICA 49
Engineering the Crop Establishment System for Paddy Wet Seeding
byEden C. Gagelonia1
Supervising Science Research Specialist
Jocel C. Cordero1
Research Analyst
H. Monobe2
M. Daikoku2
Bernardo D. Tadeo1
Supervising Science Research Specialist
Joselito A. Damian1
Senior Science Research Spe-cialist
S. Ishihara2
R. Otani2
Elmer G. Bautista1
Science Research Specialist
Wilfredo B. Collado1
Senior Science Research Spe-cialist
N. Sawamura2
AbstractThe scarcity of labor supply and
high labor cost are making rice farmers shift from transplanting to the direct seeding method, which is a cost-saving and profit-enhancing technology. Farmers’ direct seeding practices include the use of seeds at high seeding rate and rice stubbles were not decomposed owing to short duration of land preparation. Dur-ing herbicide or fertilizer applica-tion, farmers cannot easily identify weeds and even step on some rice plants. Land leveling is also often taken for granted as most farmers wrongly believe that it is just an added cost in farming, not know-ing that poor leveling will adversely affect crop and water management. For continuous field operations, a good crop establishment system re-quires equipment for preparing the land well including side plowing, leveling, and seeding. With this sys-tem, field operations would be much faster and easier, and use of farm machines would be more effective.
The side-plow, field leveler and seeding technologies were devel-oped as attachments to the hand tractor. The hand tractor-drawn double disc plow was re-engineered to convert easily from levee side plowing to normal plowing and vice-versa. An L-shaped drag-type leveling device drawn by a hand tractor was developed to provide ef-ficient leveling. For faster seeding and effective field maintenance, a 12-row hand tractor-drawn seeder was developed. The seeding rate could be adjusted from 40 to 120 kg/ha.
To ensure stable seedling estab-lishment and good crop manage-ment using these implements, the field must be well prepared at least 21 days before seeding. To attain uniform seed distribution, seeds must be soaked and incubated for 24 h. Pre-emergence herbicides must be applied one to three days after seeding (DAS) to be effective. The field must be drained up to nine DAS to have good seedling emer-gence. Irrigation water should be
applied at 10 DAS and maintained at 5 cm water level to facilitate fertilizer application, weed control and tiller development. With this system, labor saved in side plowing, leveling, and seeding were 60.79 %, 86.75 % and 64.13 %, respectively. The labor saved with that of farm-ers’ practice for direct seeded and transplanted were 8.9 % and 46.35 %, respectively.
RationaleMany farmers are shifting from
transplanting to direct seeding due to the increasing cost of farm labor. Direct seeding can reduce water and labor costs for crop establishment such as seedling nursery manage-ment, cost of pulling, transporting, and transplanting. However, the shift to direct seeding is not without constraints. Pest problems (from birds, rats, snails, and weeds), espe-cially during crop establishment and high seeding rates are prevalent in wet direct- seeded rice culture.
1 Philippine Rice Reseach Institute, Maligaya, Science City of Muñoz, Nueva Ecija, PHILIPPINES
2 JICA experts, JICA-PhilRice TCP2, Philippine Rice Reseach Insti-tute

AGRICULTURAL MECHANIZATION IN ASIA, AFRICA, AND LATIN AMERICA 2005 VOL.36 NO.250
Direct seeding requires thorough land preparation to help manage weeds. Good leveling enhances emergence of seedlings. Few seed-lings would emerge in f looded portions of a field. Some farmers use wooden planks to level their fields but most of them do not; in-stead they use an inefficient comb-harrow for leveling. At present, land preparation is being done through the use of hand tractors. However, side plowing and leveling are done with the use of a carabao-drawn implement or hand tractor with two operators. With this system, use of farm machines becomes ineffec-tive. Thus, equipment for levee side plowing, leveling, and seeding that could be attached to the hand tractor is needed. The protocols of opera-tion must be established for better seedling establishment and emer-gence, and crop management.
ObjectivesThis study aimed to improve cur-
rent practices in land preparation and crop establishment in wet direct seeding, and more specifically to further reduce labor costs, improve seedling emergence, and increase the efficiency of hand tractor attach-ments.
MethodologyCurrent practices of farmers in di-
rect seeding were first documented
and improvement work was directed toward the inefficient practices. The side plow, field leveler, and mechan-ical seeder that could be attached to the hand tractor were developed for continuous and effective use of farm machines. The technology devel-oped was integrated in the farmers’ practices. Evaluation of seedling establishment, emergence, and crop management were conducted to identify a protocol for wet seeding using the developed technologies.
Results and DiscussionFarmers’ Practices in Direct Seed-ing
Table 1 shows that there is no pattern of change in the percentage of farmers practicing direct seeding from 1998 wet season to 2000 wet season although more farmers do direct seeding during the dry season because of better water control than in the wet season. Table 2 shows the mean input-use by ecosystem. In the irrigated lowland ecosystem, av-erage seeding rate ranges from 146 to 174 kg/ha or an equivalent of four cavans at 40 kg/cav, which is 50 % higher than the recommended seed-ing rate. The average NPK fertilizer applied is slightly higher in the dry season than in the wet season, but is still lower than the recommended fertilizer rate, most probably due to
high prices. Pesticides and herbi-cides applications are on the average of 1.73 and 0.83 l/ha, respectively. Labor use shows a decreasing trend both in irrigated and rainfed eco-systems respectively from 74.2 to 43.8 md/ha and from 62 to 41 md/ha owing to the use of farm machines. Across seasons, labor cost has the biggest share in the total production costs.
Land preparation was done in a relatively short period in areas with insufficient water through the use of hand tractors employing the disc-plow for plowing and the comb-harrow for harrowing. The hand tractor could not plow the sides along the levees. Floating tillers could but these are not common to farmers in Luzon. Most farmers used a carabao drawn plow; usually a moldboard plow for plowing the edges of the field. Land leveling was done through the use of a wooden plank drawn either by a carabao or hand tractor. Other farmers use the comb-harrow in leveling but some do not use a leveler at all.
Development of Technologies for Wet Seeding Operation
The hand tractor is the most com-mon machine used by farmers in land preparation. Other equipment can be attached to it to further in-crease its versatility and make farm operations faster and easier. Thus,
Item 1998 WS 1999 DS 1999 WS 2000 DS 2000 WS
Irrigated AreasSeeds (kg/ha) 146 174 173 172 161NPK Fert. (kg/ha) 75-11-9 82-15-11 82-15-10 91-22-18 67-15-6Herbicide (l/ha) 1.06 1.01 1.07 0.71 1.05Pestcide (l/ha) 1.36 1.74 1.70 1.44 2.44Labor (md/ha) 74.2 66.1 62.8 43.7 43.8
Rainfed AreasSeeds (kg/ha) 130 126 142 144 155NPK Fert. (kg/ha) 61-12-9 29-9-1 61-14-12 52-12-8 69-18-10Herbicide (l/ha) 0.70 0.45 0.84 0.76 0.79Pestcide (l/ha) 1.19 1.22 1.12 0.74 1.25Labor (md/ha) 62.1 55.7 62.3 38.0 41.0
Table 2 Average input-use in direct seeded rice, 1998 WS to 2000 WS
Souce: Small farm survey: Farm record keeping, PhilRice
Irrigated Rainfed
Wet Season1998 30.0 42.51999 38.3 32.92000 29.1 28.8
Dry Season1999 49.5 40.02000 42.0 33.8
Table 1 Percent distribution of farmerswho practiced direct seeding byecosystem, 1998 WS to 2000 WS
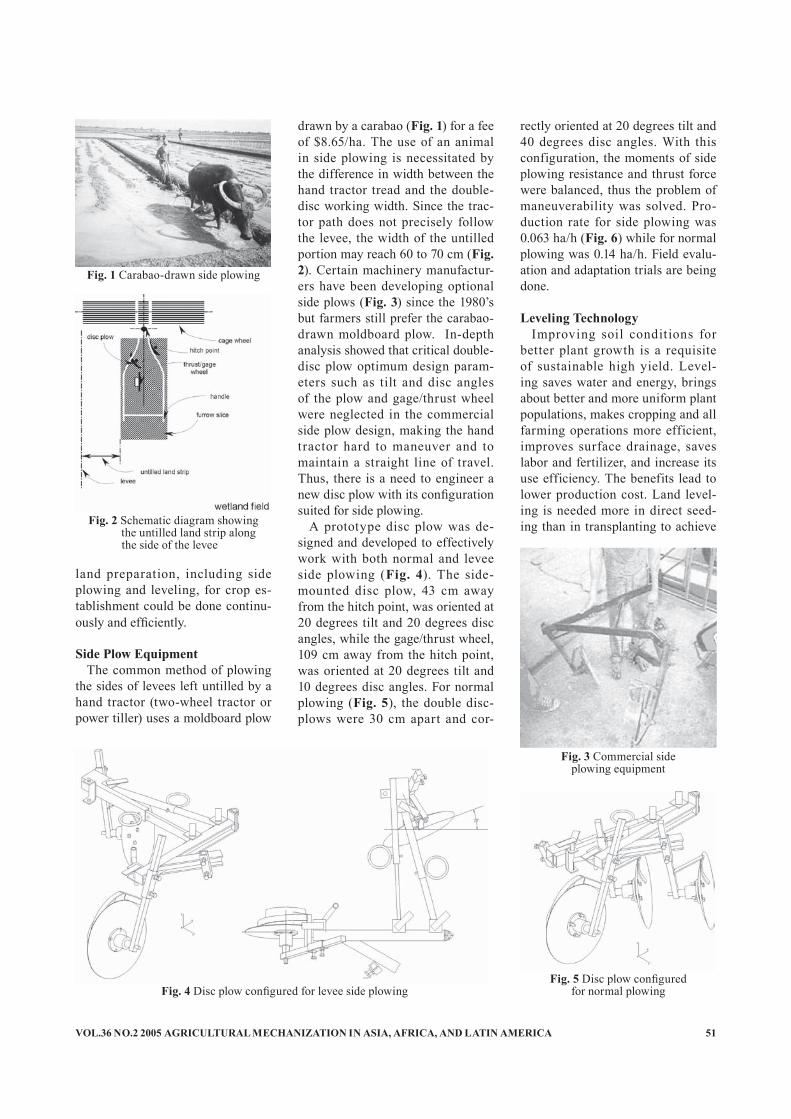
VOL.36 NO.2 2005 AGRICULTURAL MECHANIZATION IN ASIA, AFRICA, AND LATIN AMERICA 51
land preparation, including side plowing and leveling, for crop es-tablishment could be done continu-ously and efficiently.
Side Plow EquipmentThe common method of plowing
the sides of levees left untilled by a hand tractor (two-wheel tractor or power tiller) uses a moldboard plow
Fig. 1 Carabao-drawn side plowing
Fig. 2 Schematic diagram showingthe untilled land strip alongthe side of the levee
Fig. 3 Commercial sideplowing equipment
Fig. 4 Disc plow configured for levee side plowing
drawn by a carabao (Fig. 1) for a fee of $8.65/ha. The use of an animal in side plowing is necessitated by the difference in width between the hand tractor tread and the double-disc working width. Since the trac-tor path does not precisely follow the levee, the width of the untilled portion may reach 60 to 70 cm (Fig. 2). Certain machinery manufactur-ers have been developing optional side plows (Fig. 3) since the 1980’s but farmers still prefer the carabao-drawn moldboard plow. In-depth analysis showed that critical double-disc plow optimum design param-eters such as tilt and disc angles of the plow and gage/thrust wheel were neglected in the commercial side plow design, making the hand tractor hard to maneuver and to maintain a straight line of travel. Thus, there is a need to engineer a new disc plow with its configuration suited for side plowing.
A prototype disc plow was de-signed and developed to effectively work with both normal and levee side plowing (Fig. 4). The side-mounted disc plow, 43 cm away from the hitch point, was oriented at 20 degrees tilt and 20 degrees disc angles, while the gage/thrust wheel, 109 cm away from the hitch point, was oriented at 20 degrees tilt and 10 degrees disc angles. For normal plowing (Fig. 5), the double disc-plows were 30 cm apart and cor-
Fig. 5 Disc plow configuredfor normal plowing
rectly oriented at 20 degrees tilt and 40 degrees disc angles. With this configuration, the moments of side plowing resistance and thrust force were balanced, thus the problem of maneuverability was solved. Pro-duction rate for side plowing was 0.063 ha/h (Fig. 6) while for normal plowing was 0.14 ha/h. Field evalu-ation and adaptation trials are being done.
Leveling TechnologyImproving soil conditions for
better plant growth is a requisite of sustainable high yield. Level-ing saves water and energy, brings about better and more uniform plant populations, makes cropping and all farming operations more efficient, improves surface drainage, saves labor and fertilizer, and increase its use efficiency. The benefits lead to lower production cost. Land level-ing is needed more in direct seed-ing than in transplanting to achieve

AGRICULTURAL MECHANIZATION IN ASIA, AFRICA, AND LATIN AMERICA 2005 VOL.36 NO.252
good seedling establishment and management of water, nutrients, and pests. However, after plowing and harrowing, leveling is often neglect-ed, resulting in crop management problems. Therefore, there is a need to address the problem of unleveled field plots for an efficient and cost-effective farming operation.
The PhilRice leveler (Fig. 7) was redesigned in the following man-ner: width was reduced from 3.0 to 2.5 m; plank support was made spring-activated with three adjust-ing points; and adjustor was posi-tioned nearer the hitch point. Tests showed that in spite of the spring-activated leveling plate (Fig. 8), soil surface level still followed the hardpan contour. Much soil accu-mulated between the paddy wheels and the leveling plate. Changes such as reducing the spring deflection or index, tilting the leveling plate, and others were incorporated to solve these problems but the leveling plate still followed the hardpan contour due to the fixed position of the skid.
New designs were therefore, con-sidered to eliminate the effect of hardpan contour in leveling the soil surface. To do this, movement of the leveling plate should be made independent. Based on the Japanese 4WT-drawn leveler, a prototype of an L-shaped drag-type leveling equipment (Fig. 9), 2 m wide with 50 cm long protruded wings inclined up to 45 degrees, was fabricated and improved. Forces acting on the lev-eling plate are described in Fig. 10. The weight of the leveling assembly is balanced by the vertical compo-
nent of the pulling force of the hand tractor and the reacting pressure force of the soil and water mixture. It was reduced from 31 to 19 kg and prevented the leveling plate from sinking. During field operation, the leveling plate remained afloat while moving excess soil to lower portions of the field plot. When undulating portions were encountered, the op-erator stepped on the leveling plate directly.
Tests showed that after one pass of the leveling plate on the soil surface profile having eight varying degrees of undulation (Fig. 11), about 80 % of the field was uniformly leveled while the 20 % had four varying degrees of undulation (Fig. 12). The remaining undulations were mostly near the levees.
Mechanical Paddy SeederA mechanical sowing device
drawn by a commercial hand tractor was developed to mechanize direct seeding operations in medium and large farms. The hand, t ractor-drawn seeder attachment (Fig. 13) allowed seeding in furrows cre-ated by spring-loaded furrowing devices. The drum metering con-trols the rates of seeding through a two stage-chain-and-sprocket from
the hand tractor transmission. The seeder is equipped with six cylindri-cal hoppers, a spring-loaded furrow assembly, and a roller-type depth gauge. It can seed 2.5 m width in one pass with 12 rows at 20 cm spacing and spaced 20 cm, except the center row spaced at 30 cm. The seeding capacity is 3 to 5 ha/day. On the other hand, field efficiency largely decreases as the area of the field increases owing to increasing unproductive time such as reloading of seeds in the hopper.
Adaptation of the Technology in Farmers’ Field
Adaptation in farmers’ field was conducted in Aliaga, Nueva Ecija; Valencia, Bukidnon and Pigcauayan, North Cotabato. This was to evalu-ate the adaptability of the technol-ogy in different types of soil. These sites were selected because 100 % of the farmers were direct seeding during dry season and 50 % in wet season. The farmer-cooperators used seeding rates of 40 kg/ha and 80 kg/ha during dry and wet season, respectively. Farmer feedback was gathered through the use of ques-tionnaire and personal interview.
Based on the utilization, the disc side-plow and leveler attachments were suitable to any field condition. The hand tractor-drawn paddy seed-er could work well in shallow hard-pan except for minor adjustment and fine-tuning in the seeder. The cooperator in Bukidnon suggested that the hopper assembly and furrow opener assembly should be made adjustable. Optimum performance
Fig. 6 Levee side plowing
Fig. 7 Prototype of the PhilRice leveler
Fig. 8 The spring-activatedPhilRice leveler
Fig. 9 The prototype L-shapeddrag-type leveler
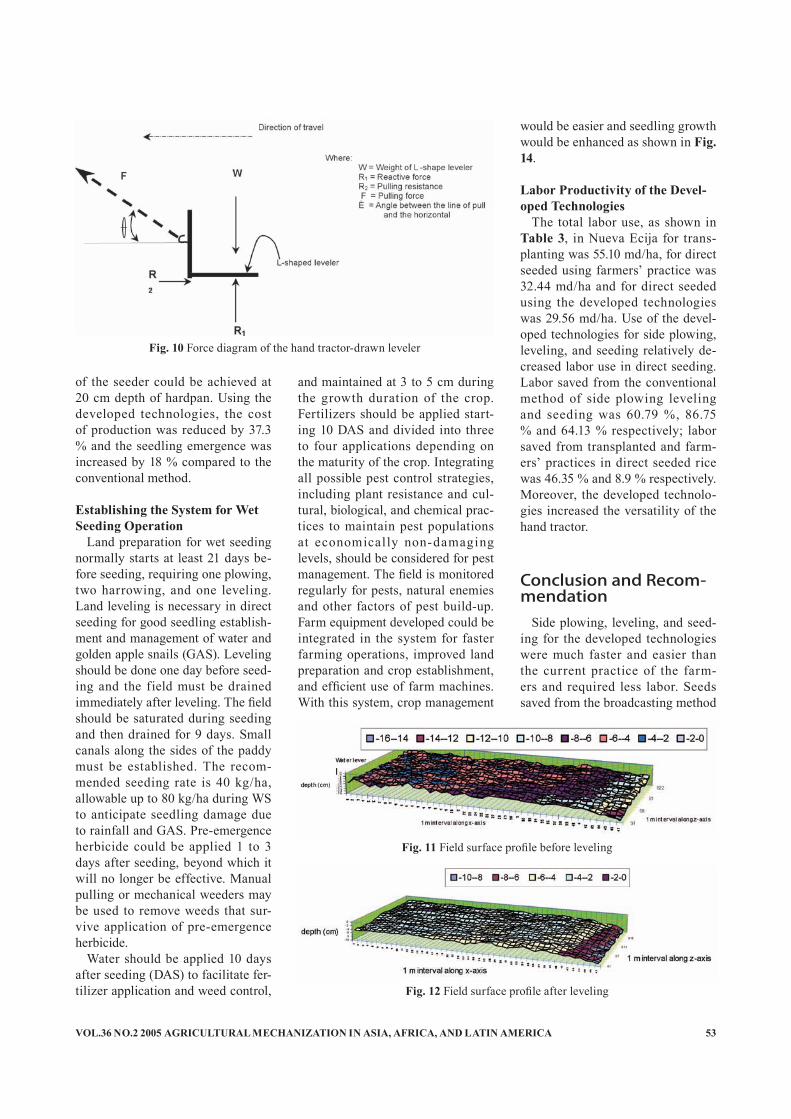
VOL.36 NO.2 2005 AGRICULTURAL MECHANIZATION IN ASIA, AFRICA, AND LATIN AMERICA 53
of the seeder could be achieved at 20 cm depth of hardpan. Using the developed technologies, the cost of production was reduced by 37.3 % and the seedling emergence was increased by 18 % compared to the conventional method.
Establishing the System for Wet Seeding Operation
Land preparation for wet seeding normally starts at least 21 days be-fore seeding, requiring one plowing, two harrowing, and one leveling. Land leveling is necessary in direct seeding for good seedling establish-ment and management of water and golden apple snails (GAS). Leveling should be done one day before seed-ing and the field must be drained immediately after leveling. The field should be saturated during seeding and then drained for 9 days. Small canals along the sides of the paddy must be established. The recom-mended seeding rate is 40 kg/ha, allowable up to 80 kg/ha during WS to anticipate seedling damage due to rainfall and GAS. Pre-emergence herbicide could be applied 1 to 3 days after seeding, beyond which it will no longer be effective. Manual pulling or mechanical weeders may be used to remove weeds that sur-vive application of pre-emergence herbicide.
Water should be applied 10 days after seeding (DAS) to facilitate fer-tilizer application and weed control,
and maintained at 3 to 5 cm during the growth duration of the crop. Fertilizers should be applied start-ing 10 DAS and divided into three to four applications depending on the maturity of the crop. Integrating all possible pest control strategies, including plant resistance and cul-tural, biological, and chemical prac-tices to maintain pest populations at economically non-damaging levels, should be considered for pest management. The field is monitored regularly for pests, natural enemies and other factors of pest build-up. Farm equipment developed could be integrated in the system for faster farming operations, improved land preparation and crop establishment, and efficient use of farm machines. With this system, crop management
would be easier and seedling growth would be enhanced as shown in Fig. 14.
Labor Productivity of the Devel-oped Technologies
The total labor use, as shown in Table 3, in Nueva Ecija for trans-planting was 55.10 md/ha, for direct seeded using farmers’ practice was 32.44 md/ha and for direct seeded using the developed technologies was 29.56 md/ha. Use of the devel-oped technologies for side plowing, leveling, and seeding relatively de-creased labor use in direct seeding. Labor saved from the conventional method of side plowing leveling and seeding was 60.79 %, 86.75 % and 64.13 % respectively; labor saved from transplanted and farm-ers’ practices in direct seeded rice was 46.35 % and 8.9 % respectively. Moreover, the developed technolo-gies increased the versatility of the hand tractor.
Conclusion and Recom-mendation
Side plowing, leveling, and seed-ing for the developed technologies were much faster and easier than the current practice of the farm-ers and required less labor. Seeds saved from the broadcasting method
Fig. 12 Field surface profile after leveling
Fig. 11 Field surface profile before leveling
Fig. 10 Force diagram of the hand tractor-drawn leveler

AGRICULTURAL MECHANIZATION IN ASIA, AFRICA, AND LATIN AMERICA 2005 VOL.36 NO.254
ranged f rom 50 to 70 %. Crop management is easier because the seeds are in rows. Also, the cost of production was reduced by 37.3 %, and the versatility of the hand trac-tor was increased. This technology is ready for field utilization, verifi-cation and demonstration in direct seeded areas. To achieve optimum seedling establishment and crop management, it is recommended that the field should be well pre-pared and thoroughly leveled.
REFERENCES
Mataia, Alice, C.B. Casiwan, G.O. Redondo, M. Velayo. 2001. Small Farm Survey: A Farm Record-Keeping Project. Philippine Rice Research Institute, Maligaya, Sci-ence City of Muñoz, Nueva Ecija, Philippines.
PhilRice Wet Seeded Rice Techno-guide, Poster developed by Phil-ippine Rice Research Institute, Maligaya, Science City of Muñoz, Nueva Ecija, Philippines
Gagelonia , EC, BD Tadeo, EG Bautista. Adaptation of the hand tractor-drawn paddy seeder in
selected areas in the Philippines, Annual Report 2001. Philippine Rice Research Institute, Maliga-ya, Science City of Muñoz, Nueva Ecija, Philippines
Tadeo, BD, EG Bautista, S Ishihara, H Monobe. Engineered side plow-ing capability of newly designed disc plow. Best paper during the 13th DA-BAR NRS, BSWM, Dil-iman, Quezon City, Philippines. 2-5 October 2001.
Tadeo, BD, EG Bautista, JC Cor-dero, EC Gagelonia. Development of land leveling equipment, An-nual Report 2001. Philippine Rice Research Institute, Maligaya, Sci-ence City of Muñoz, Nueva Ecija, Philippines.
Wet Seeded Rice Production. Rice Technology Bulletin, 2001. Phil-
Operation
Direct Seeded
Transplanted,md/ha
Farmers' practice,md/ha
Using the developed
technologies, md/ha
Seedbed preparation - - 0.78Plowing 1.24 1.24 1.33Side plowing 0.51 0.20 0.471st harrowing 1.03 1.03 1.012nd harrowing 0.99 0.99 0.85Leveling 1.6 0.22 0.97Repair and cleaning of dikes 1.9 1.9 2.17Seed soaking and incubation 0.76 0.51 0.67Sowing of seeds - - 0.47Fertilizer application (seedbed) - - 0.25Pulling/bundling of seedlings - - 3.67Hauling/distribution of seedlings - - 3.75Transplanting - - 15.9Broadcasting 0.92 0.33 -Replanting 0.49 0.27 0.42Fertilizer application 0.69 0.69 0.65Herbicide application 0.61 0.61 0.43Insecticide application 0.65 0.65 0.53Weeding/cleaning of canals 0.43 0.43 0.43Irrigation 0.83 0.83 1.19Draining 0.25 0.25 0.35Field visit 1.3 1.3 0.23Purchasing inputs 0.43 0.30 0.23Harvesting 12.5 12.5 12.73Threshing 1.96 1.96 1.83Hauling of threshed palay 1.12 1.12 0.66Drying 2.23 2.23 2.16
TOTAL 32.44 29.56 55.10
Fig. 13 The improved handtractor-drawn paddy seeder
Fig. 14 Mechanized direct seeding
ippine Rice Research Institute, Maligaya, Science City of Muñoz, Nueva Ecija, Philippines.
■■
Table 3 Comparison of labor use in direct seededand transplanted rice in Nueva Ecija, 2001 DS

VOL.36 NO.2 2005 AGRICULTURAL MECHANIZATION IN ASIA, AFRICA, AND LATIN AMERICA 55
Performance of Cage Wheel with Opposing Circumferential Lugs and Normal Cage Wheel in Wet Clay Soil
byS. SoekarnoProfessorAgricultural, Aquatic Systems andEngineering Program,Asian Institute of Technology,P.O.Box 4, Khlong Luang, Pathumthani 12120THAILAND
V.M. SalokheProfessorAgricultural, Aquatic Systems andEngineering Program,Asian Institute of Technology,P.O.Box 4, Khlong Luang, Pathumthani 12120THAILAND e-mail: [email protected]
AbstractIn Southeast Asia, rice is usually
grown under f looded or wet field conditions. In these wet clay soils, traction and f loatation of vehicles used for cultivation is a major prob-lem. Cage wheels have proven to be one of the best traction aids during wet land cultivation. Recent study revealed that opposing circumferen-tial lugs on a cage wheel may per-form well in these soils. The main objective of this study was to investi-gate the performance of cage wheels with opposing circumferential lugs. The specific objectives included the study of the effect of two types of lug arrangement (straight and stag-gered), the study of the effect of free sinkage along with a compares on of the performance of cage wheel, with opposing ci rcumferent ial lugs, with normal cage wheel with straight lugs. The study revealed that the cage wheel with opposing circumferential lugs performed well compared to the cage wheel with normal lugs. It could provide higher floatation and traction, and reduced wheel sinkage.
IntroductionTillage is considered as the larg-
est power consuming operation in agricultural practices. Agricultural engineers have been concerned with better performance of tillage imple-ments for many years. As a result, there are various kinds of improved tillage tools now available in the market. However, many of them are designed on the basis of practical field experience to suit local condi-tions without adequate rigorous theoretical considerations. When the standard dry farming machines for the cultivation of wet paddy fields are used, they face traction and floatation problems because of high moisture content of paddy fields (Johnson, 1965).
Triratanasirichai et al. (1990) re-viewed a number of findings con-cerning wheel performance in paddy conditions (e.g. Soemengat, 1962; Deng et al., 1984) and summarized that pneumatic, rubber-tired wheels perform poorly in paddy conditions. The power loss of these wheels can be up to 66 % of the total loss. Cage wheels perform better than rubber
tires in these conditions. They are inexpensive and easy to fabricate, and can be made much wider than a conventional tire. Cage wheels have proved to be one of the best traction aids for wet land cultivation.
A study of the effect of design parameters of the cage wheel in a soil bin showed that the wheel with 680 mm diameter, 16 lugs and 220 cm lug width gave the optimum dynamic performance. Tanaka and Nakashima (1986) stated that the thrust efficiency of the lug becomes maximum at 30 % slip in the case of a wheel with 12 lugs. Additionally, they studied the effect of lug angle on the soil reaction in clay loam in a soil bin and found that the aver-age lift by a lug increases when the lug angle becomes large while the average thrust decreases. The thrust becomes maximum when the wheel slip is 28.8 % (Tanaka and Nakashi-ma, 1988).
Jayasundera (1980) tested a pair of cage wheels with a diameter of 93 cm and a width of 38 cm in a flood-ed, puddled field fitted to a 12.5 kW four-wheel (two-wheel drive) tractor. He found that the 30º lug spacing
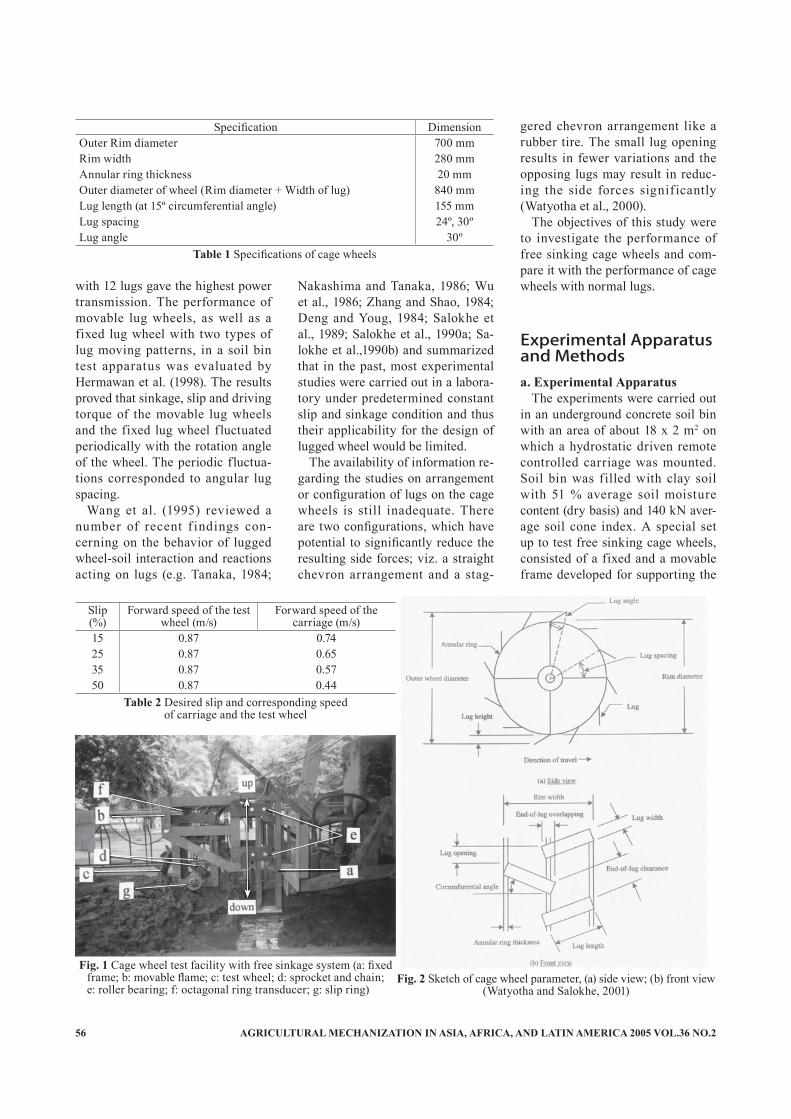
AGRICULTURAL MECHANIZATION IN ASIA, AFRICA, AND LATIN AMERICA 2005 VOL.36 NO.256
with 12 lugs gave the highest power transmission. The performance of movable lug wheels, as well as a fixed lug wheel with two types of lug moving patterns, in a soil bin test apparatus was evaluated by Hermawan et al. (1998). The results proved that sinkage, slip and driving torque of the movable lug wheels and the fixed lug wheel fluctuated periodically with the rotation angle of the wheel. The periodic fluctua-tions corresponded to angular lug spacing.
Wang et al. (1995) reviewed a number of recent f indings con-cerning on the behavior of lugged wheel-soil interaction and reactions acting on lugs (e.g. Tanaka, 1984;
Nakashima and Tanaka, 1986; Wu et al., 1986; Zhang and Shao, 1984; Deng and Youg, 1984; Salokhe et al., 1989; Salokhe et al., 1990a; Sa-lokhe et al.,1990b) and summarized that in the past, most experimental studies were carried out in a labora-tory under predetermined constant slip and sinkage condition and thus their applicability for the design of lugged wheel would be limited.
The availability of information re-garding the studies on arrangement or configuration of lugs on the cage wheels is still inadequate. There are two configurations, which have potential to significantly reduce the resulting side forces; viz. a straight chevron arrangement and a stag-
gered chevron arrangement like a rubber tire. The small lug opening results in fewer variations and the opposing lugs may result in reduc-ing the side forces signif icantly (Watyotha et al., 2000).
The objectives of this study were to investigate the performance of free sinking cage wheels and com-pare it with the performance of cage wheels with normal lugs.
Experimental Apparatus and Methodsa. Experimental Apparatus
The experiments were carried out in an underground concrete soil bin with an area of about 18 x 2 m2 on which a hydrostatic driven remote controlled carriage was mounted. Soil bin was filled with clay soil with 51 % average soil moisture content (dry basis) and 140 kN aver-age soil cone index. A special set up to test free sinking cage wheels, consisted of a fixed and a movable frame developed for supporting the
Specification DimensionOuter Rim diameter 700 mmRim width 280 mmAnnular ring thickness 20 mmOuter diameter of wheel (Rim diameter + Width of lug) 840 mmLug length (at 15º circumferential angle) 155 mmLug spacing 24º, 30ºLug angle 30º
Table 1 Specifications of cage wheels
Slip(%)
Forward speed of the test wheel (m/s)
Forward speed of the carriage (m/s)
15 0.87 0.7425 0.87 0.6535 0.87 0.5750 0.87 0.44
Table 2 Desired slip and corresponding speedof carriage and the test wheel
Fig. 1 Cage wheel test facility with free sinkage system (a: fixed frame; b: movable flame; c: test wheel; d: sprocket and chain;e: roller bearing; f: octagonal ring transducer; g: slip ring)
Fig. 2 Sketch of cage wheel parameter, (a) side view; (b) front view(Watyotha and Salokhe, 2001)
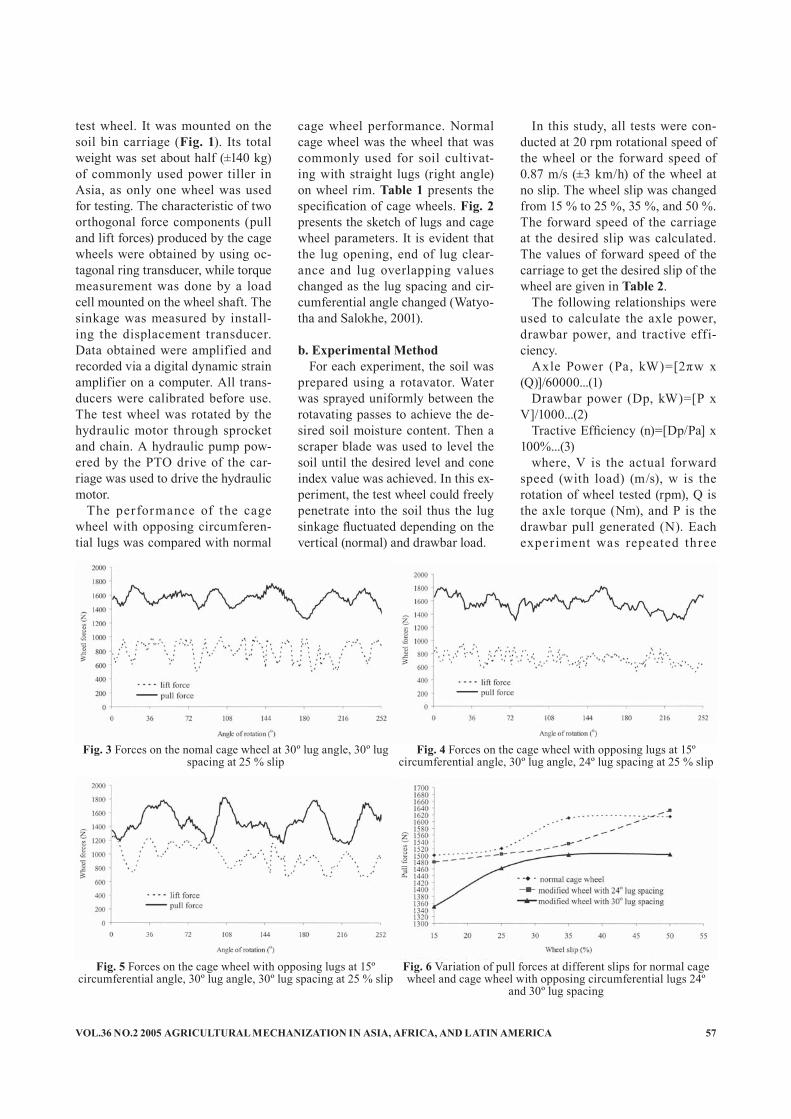
VOL.36 NO.2 2005 AGRICULTURAL MECHANIZATION IN ASIA, AFRICA, AND LATIN AMERICA 57
test wheel. It was mounted on the soil bin carriage (Fig. 1). Its total weight was set about half (±140 kg) of commonly used power tiller in Asia, as only one wheel was used for testing. The characteristic of two orthogonal force components (pull and lift forces) produced by the cage wheels were obtained by using oc-tagonal ring transducer, while torque measurement was done by a load cell mounted on the wheel shaft. The sinkage was measured by install-ing the displacement transducer. Data obtained were amplified and recorded via a digital dynamic strain amplifier on a computer. All trans-ducers were calibrated before use. The test wheel was rotated by the hydraulic motor through sprocket and chain. A hydraulic pump pow-ered by the PTO drive of the car-riage was used to drive the hydraulic motor.
The performance of the cage wheel with opposing circumferen-tial lugs was compared with normal
cage wheel performance. Normal cage wheel was the wheel that was commonly used for soil cultivat-ing with straight lugs (right angle) on wheel rim. Table 1 presents the specification of cage wheels. Fig. 2 presents the sketch of lugs and cage wheel parameters. It is evident that the lug opening, end of lug clear-ance and lug overlapping values changed as the lug spacing and cir-cumferential angle changed (Watyo-tha and Salokhe, 2001).
b. Experimental MethodFor each experiment, the soil was
prepared using a rotavator. Water was sprayed uniformly between the rotavating passes to achieve the de-sired soil moisture content. Then a scraper blade was used to level the soil until the desired level and cone index value was achieved. In this ex-periment, the test wheel could freely penetrate into the soil thus the lug sinkage fluctuated depending on the vertical (normal) and drawbar load.
In this study, all tests were con-ducted at 20 rpm rotational speed of the wheel or the forward speed of 0.87 m/s (±3 km/h) of the wheel at no slip. The wheel slip was changed from 15 % to 25 %, 35 %, and 50 %. The forward speed of the carriage at the desired slip was calculated. The values of forward speed of the carriage to get the desired slip of the wheel are given in Table 2.
The following relationships were used to calculate the axle power, drawbar power, and tractive effi-ciency.
Axle Power (Pa, kW)=[2πw x (Q)]/60000...(1)
Drawbar power (Dp, kW)=[P x V]/1000...(2)
Tractive Efficiency (n)=[Dp/Pa] x 100%...(3)
where, V is the actual forward speed (with load) (m/s), w is the rotation of wheel tested (rpm), Q is the axle torque (Nm), and P is the drawbar pull generated (N). Each exper iment was repeated three
Fig. 6 Variation of pull forces at different slips for normal cage wheel and cage wheel with opposing circumferential lugs 24º
and 30º lug spacing
Fig. 5 Forces on the cage wheel with opposing lugs at 15º circumferential angle, 30º lug angle, 30º lug spacing at 25 % slip
Fig. 4 Forces on the cage wheel with opposing lugs at 15º circumferential angle, 30º lug angle, 24º lug spacing at 25 % slip
Fig. 3 Forces on the nomal cage wheel at 30º lug angle, 30º lug spacing at 25 % slip

AGRICULTURAL MECHANIZATION IN ASIA, AFRICA, AND LATIN AMERICA 2005 VOL.36 NO.258
times. To compare among the mean of data recorded and calculated, the analysis variance and the Least Sig-nificant Difference (LSD) were used.
Results and DiscussionCharacteristic of Measured Wheel Forces
Figs. 3 to 5 show the charac-teristics of measured pull and lift forces of the cage wheels; of normal cage wheel and modif ied wheel with opposing circumferential lugs. The figure shows the real time and simultaneous cyclic variations of pull and lift forces fluctuating pe-riodically with the rotation angle. The corresponding period was ap-proximately equal to the interval of angular lug spacing. The pull force was higher than the lift force at all wheel slips and lug spacing. From the figures, it can be seen that
the peak values of both pull and lift forces were achieved at certain wheel rotation. For the normal cage wheel, the peak values were attained at every 30º angle of wheel rotation which corresponded to the spacing of lugs on the wheel. On the other hand, for cage wheel with opposing circumferential lugs, as the number of lugs on the wheel were twice than on the normal cage wheel for the same lug spacing, the peak values of forces were reached at every half degree of lug spacing. At 24º and 30º lug spacings, the peak values were achieved at about every 12º and 15º rotation angles respectively.
The characteristics of fluctuations of the wheel forces in this study agreed with the characteristics of pull and lif t forces obtained by Watyotha and Salokhe (2001). It also agreed with the calculated pull and lift forces of freely sinking cage wheel studied by Wang et al. (1995),
although the value of forces resulted were much higher. This might be caused by free sinking system, so the test wheel can fluctuate dynamically depending on the soil condition.
The results of mean pull force at various wheel slips and lug spac-ing are shown in Fig. 6. It can be seen from Fig. 6 that the pull forces increased slightly with the increase of slip. The mean pull forces of the normal cage wheel and cage wheel with opposing circumferential lugs (modified wheel) indicated that at all slips, the normal cage wheel gave the highest values of pull forces fol-lowed by the modified wheel with 24º lug spacing and 30º lug spac-ing, respectively. The LSD analysis showed that there was a significant difference between the mean pull force obtained by the normal cage wheel and modified wheel with 30º lug spacing at 15 % of slip. However, the mean pull forces by the modified
Fig. 8 Soil track on lugs of (a) normal wheel and (b) modified wheel at slip 50 %
Fig. 9 Sinkage variation (cm) at different slips for normal and modified wheel
Fig. 7 Variation of lift forces at different slips for normal cage wheel and cage wheel with opposing circumferential lugs 24º
and 30º lug spacing
(a) (b)

VOL.36 NO.2 2005 AGRICULTURAL MECHANIZATION IN ASIA, AFRICA, AND LATIN AMERICA 59
wheel with 24º and 30º lug spacings were not significantly different from that with normal wheel at 25 %, 35 % and 50 % slips, but their values were still less than the normal cage wheel. From the same figure, the ef-fect of lug spacing on the pull force can be observed and agreed with the study by Watyotha and Salokhe (2001) that the pull forces decreased significantly as the lug spacing in-creased. More horizontal soil com-pression and shearing caused by increasing the slip lead to increase the pull force.
Fig. 7 presents the mean lif t forces as a function of wheel slip. It was observed that the lift forces increased with the increasing of the slips. The values of mean lift forces of the cage wheel with opposing cir-cumferential lugs with 24º lug spac-ing showed that the lift forces were slightly higher compared to normal cage wheel. The values of mean lift forces of the cage wheel with oppos-ing circumferential lugs with 30º lug spacing showed that the lift forces were lower compared to normal cage wheel. Thus, the cage wheel with op-posing circumferential lugs with 24º lug spacing was more capable to float on soil than normal cage wheel. The effect of slip on forces agreed with study by Salokhe et al. (1994) that as the slip increased, the pull and lift forces on the succeeding and preced-ing lugs increased at all lug spacings.
Soil Sticking on LugsThe effect of lug spacing and
wheel slip on soil sticking on cage wheel lugs was studied. General observations showed that the soil sticking on lugs was experienced at every combination of lug spacing and wheel slip due the soil-metal adhesion. However, for the modi-fied cage wheel, soil trapping be-tween the lugs did not emerge and subsequent passing had no effect on progressive soil build up on the lugs. The amount of soil after the second, third and following passes was equal to that at the first pass. This was because the soil after the first pass was squeezed out to the sides on lugs before soil from sub-sequent passes was added. On the contrary, for the normal cage wheel, the soil stuck on lugs tended to in-crease after the second and third pass because the soil was not able to squeeze to the sides of the lugs.
In this study, the soil stuck on lugs was difficult to measure, because in the wet condition the soil was easy to spill from the lugs before it was weighed. The soil stuck on lugs of the normal wheel and modified wheel was visually observed (Fig. 8). It was observed that increasing of wheel slip would increase the pull forces, lift forces, wheel sinkage, and soil sticking on the lugs as well.
Comparison between soil sticking on lugs of normal wheel (picture a) and modified wheel with 30º lug spacing (picture b) showed that at 15 % and 25 % wheel slip, the amount of soil stuck on the lug was not sig-nificantly different. However, as the
slip increased to 35 % and 50 %, the soil started to block on the normal wheel lugs or at the middle of wheel rim. For the modified wheel, soil stuck only on lugs because of the role of soil-metal adhesion. And, soil could not block at the middle of wheel rim due to the squeezing of soil along the slope of the lugs to the side position.
Effect of Slip on Sinkage The inf luence of the slip on the
sinkage can be seen in Fig. 9. The sinkage of normal cage wheel and modified wheel at 15 %, 35 % and 50 % slips was significantly differ-ent for 24º lug spacing and but it was not significantly different for 30º lug spacing. On the other hand, in-creasing lug spacing from 24º to 30º decreased the mean lift forces sig-nificantly. At 25 % slip, the sinkage did not differ significantly among all cage wheel types tested.
Fig. 10 shows the pull per unit wheel sinkage for different wheels at various slips. For cage wheel with normal lugs, the pull per unit sink-age was much higher at 15 % slip compared to other wheels. How-ever, after 24 % slip the values were almost similar to other wheels. It means that at low slip, the normal cage wheel was more effective than other wheels tested. In terms of lift per unit wheel sinkage, the cage wheel with opposing circumfer-ential lugs at 24º lug spacing gave lowest forces while the cage wheel with opposing circumferential lugs
Fig. 11 Lift force per unit of sinkage (N/cm) at different slipsfor normal and modified wheel
Fig. 10 Pull force per unit of sinkage (N/cm) at different slipsfor normal and modified wheel

AGRICULTURAL MECHANIZATION IN ASIA, AFRICA, AND LATIN AMERICA 2005 VOL.36 NO.260
at 30º lug spacing gave the highest lift forces (Fig. 11).
Tractive Performance Analysis
The curve of drawbar power ver-sus wheel slip for different cage wheels is shown in Fig. 12. The drawbar power at 15 % slip did not differ significantly for normal cage wheel and cage wheel with oppos-ing circumferential lugs with 24º lug spacing, but they were significantly different for normal cage wheel and cage wheel with opposing circum-ferential lugs with 30º lug spacing. By considering that the slip must oc-cur to provide the pull (Gee-Clough, 1991), so the drawbar power depends on wheel slip and the calculated mean power could very well be fit-ted to a polynomial function of the form:
Po = As - Bs2...(1) where, Po is the power delivered
in kW; s is wheel slip in %; A and B are constants.
The values of coeff icients A and B, and the regression analysis showed a high correlation (Table 3). The increase of wheel slip led to a decrease of drawbar power. At 15 % slip the drawbar power reached maximum value and then decreased with further increase of wheel slip.
Fig. 13 shows the tractive ef-
ficiency curves for different cage wheels. As the slip increased, the tractive efficiency decreased due to the decreasing of traveling speed much more than the increasing of pull force. At 15 % slip, there was significant difference in tractive ef-ficiency for normal cage wheel and cage wheel with opposing circum-ferential lugs with 30º lug spacing. At 25 % and 35 % slips, there was significant difference in tractive ef-ficiency of normal cage wheel and cage wheel with opposing circum-ferential lugs with 30º lug spacing, as well as between cage wheel with opposing circumferential lugs with 24º and 30º lug spacings. And, at 50 % slip, there was no significant difference in tractive efficiency of different wheels.
ConclusionsFor cage wheels, with either nor-
mal lugs or with opposing circum-ferential lugs, the wheel forces fluc-tuated periodically with rotation an-gle. The corresponding period was approximately equal to the interval of angular lug spacing. The effect of wheel forces on the pull and lift forces was similar where, as the slip increased, the pull and lift forces
significantly increased. Comparison of normal cage wheel with modified wheel with 24º and 30º lug spacings showed that modified wheel with 30º lug spacing gave lower values of wheel forces at all slips.
Comparison of the performance of cage wheel with opposing cir-cumferential lugs with normal lugs showed that there was no significant difference between the drawbar power for all experiments. However, the tractive efficiency was found to be significantly different. The cage wheel with opposing circumferen-tial lugs at 30º lug spacing gave the highest value at all slips.
The study revealed that the cage wheel with opposing circumferen-tial lugs with 30º lug spacing per-formed well compared to the cage wheel with normal lugs. It could provide higher floatation and trac-tion, and reduced wheel sinkage, so the power tiller could be easily used for working in wet paddy fields. The newly developed facility for free floating of the cage wheel gave results close to real life situation in the actual field.
REFERENCES
Gee-Clough, D., and W. J. Chan-
Fig. 13 Tractive efficiency of normal cage wheel and cage wheel with opposing circumferential lugs (modified wheel) at various slips
Fig. 12 Drawbar power of normal cage wheel and cage wheel with opposing circumferential lugs (modified wheel) at various slips
Type of cage wheel Constant A Constant B R2* SEE**Normal cage wheel 0.0689 0.00114 0.86 0.24Cage wheel with opposing circumferential lug with 24º lug spacing 0.0662 0.00111 0.83 0.25Cage wheel with opposing circumferential lug with 30º lug spacing 0.0661 0.00109 0.88 0.18
Table 3 Results of regression analysis of drawbar power versus wheel slip for different cage wheels
*R2: coefficient of determination, **SEE: Standard Error Estimation
VOL.36 NO.2 2005 AGRICULTURAL MECHANIZATION IN ASIA, AFRICA, AND LATIN AMERICA 61
cel lor (1976), P u l l and Li f t Characteristics of Single Lug of Rigid Wheels in Wet Rice Soils, Transaction of the ASAE, 19(3): 433-441.
Gee-Clough, D. (1991), Lecture Notes: Soil Dynamics in Tillage and Traction. Asian Institute of Technology, Bangkok, Thailand (unpublished).
Hermawan, W., Oida, A. and M. Yamazaki (1998), Experimental Analysis of Soil Reaction on A Lug of A Movable Lug, Journal of Terramechanics, 35: 119-135.
Jayasundera, L. (1980), Study of Factors affecting the design of flat lugged cage wheels in paddy soil, AIT M. Eng. Thesis No. AE-80-15, Asian Inst itute of Technology, Bangkok, Thailand. (unpublished).
Johnson, L. (1965), Traction prob-lems in flooded rice soils, ASAE paper No. 65-124.
Salokhe, V. M., Manzoor, S. and D. Gee-Clough (1989), The measure-ment of forces on a cage wheel lug when operating in wet clay soil, Soil and Tillage Research, 14: 327-340.
Salokhe, V. M., Manzoor, S. and D. Gee-Clough (1990), Pull and lift forces acting on single cage wheel lugs, Journal of Terramechanics, 27 (1): 25-39.
Salokhe, V. M., Hong, T. T. and D. Gee-Clough (1994), Effect of low-to-medium slip, lug spacing and moisture content on lug forces, Journal of Terramechanics, 31 (6): 385-394.
Tanaka, T. (1984), Operation in pad-dy fields: State-of-the-art report, Journal of Terramechanics, 21 (2): 153-179.
Triratanasirichai, K., Oida, A. and M. Honda (1990), The perfor-mance of cage wheels for small power tillers in agricultural soils, Journal of Terramechanics, 27 (3): 193-205.
Wang, X. L., Yamazaki, M. and T. Tanaka (1992), Characteristic of the Interaction between lugged
wheel and paddy soil. Proceedings of 3rd Asian-Pacific Conference of the ISTVS, Bangkok, Thailand, pp: 134-144.
Wang, X. L., Yamazaki, M. and T. Tanaka (1993), Dynamic be-haviour of an open lugged wheel under paddy soil condit ions, Journal of Terramechanics, 30 (3): 191-203.
Wang, X. L., Yamazaki, M. and T. Tanaka (1993), Characteristics of soil reactions of an open lugged wheel under paddy soil condi-tions, Journal of Terramechanics, 32 (3): 115-125.
Watyotha, C. (2000), Performance of cage wheels with opposing circumferent ial lugs, AIT D. Eng. Dissertation No. Diss No. AE-00-1, Asian Institute of Tech-nology, Bangkok, Thailand. (un-published).
Watyotha, C. and V. M. Salokhe (2001), Pull, lift and side force characteristics of cage wheels with opposing circumferential lugs, Soil & Tillage Research Journal, 60: 123-134.
Watyotha, C. and V. M. Salokhe (2001), Tractive Performance of cage wheels with opposing cir-cumferential lugs, Journal of Ag-ricultural Engineering Research, 79 (4): 389-398.
Wimalawansa, L. S. (1982), study of optimum lug angle and spac-ing for medium powered tractor (46kW), AIT M. Eng. Thesis No. AE-82-15, Asian Institute of Technology, Bangkok, Thailand. (unpublished).
Wu, S. X., Hu, J. H. and J. Y. Wong (1984). Behaviour of soil under a lugged wheel, Peoceeding of 8th International Conference of the ISTVS, Cambridge, U. K.
Zhang, T. L. and Y. J. Shao (1984), The analysis on the dynamic per-formance of a single lug, Proceed-ings of 8th International Con-ference of ISTVS, Cambridge, 575-591.
Zhang, T. L. (1992), An advanced model for predicting flat lug dy-
namic performance, Proceeding of the International Agricultural Engineering Conference, Bang-kok, Thailand, pp: 17-23.
■■

AGRICULTURAL MECHANIZATION IN ASIA, AFRICA, AND LATIN AMERICA 2005 VOL.36 NO.262
Fabrication and Testing of Tomato Seed ExtractorbyR. KailappanProfessorDepartment of Agricultural Processing,College of Agric. Engineering,Tamil Nadu Agricultural Univercity,Coimbatore - 641 003INDIA
N. VaradharajuAssoc. ProfessorDepartment of Agricultural Processing,College of Agric. Engineering,Tamil Nadu Agricultural Univercity,Coimbatore - 641 003INDIA
V. KrishnasamyProfessorAgricultural College and Reserch InstituteTamil Nadu Agricultural Univercity,Coimbatore - 641 003INDIA
Parveen Kasur BaigPG StudentDepartment of Agricultural Processing,College of Agric. Engineering,Tamil Nadu Agricultural Univercity,Coimbatore - 641 003INDIA
K. AppavuProfessorAgricultural College and Reserch InstituteTamil Nadu Agricultural Univercity,Coimbatore - 641 003INDIA
AbstractA tomato seed extractor having a
capacity of 180 kg of fruits per hour has been fabricated and evaluated at the Department of Agricultural Pro-cessing, Tamil Nadu Agricultural University, Coimbatore, India. The unit consisted of a fruit squeezing chamber, and a seed separation unit. In the fruit squeezing chamber, the tomato fruits were pressed and squeezed by a rotating screw auger and discharged to the seed separa-tion chamber. The studs present in the rotating shaft in the seed separa-tion chamber opened the squeezed fruit and nozzles at the top sprayed water and washed the seed from the fruit flesh. Wash water carried the seed through the perforated cover and collected them in a removable perforated tank placed inside the main tank. The fruit flesh, after sep-aration of seed, was collected at the end of the seed separation chamber.
The fruit flesh collected could then be further processed to any desired value added product. The unit had a seed extraction efficiency of 98.8 %. As compared to manual method of seed extraction, the unit recorded 96.6 % saving in time and 89.6 % saving in cost. The cost of the unit is only about $ 190.
IntroductionTomato (Lycopersiocon esculen-
thum Mill), the second largest veg-etable crop after potato in the world, is grown over an area of 2.85 million ha and has a recorded production of 88.2 million tonnes. It is a non-sea-sonal crop and grown largely in all parts of India. In India, it is grown over an area of 0.31 million ha and has a recorded annual production of 46 million tonnes (Opandey, 1995). Though India is the second largest producer of vegetables (86 million
tonnes per annum) next to China, its per capita consumption is very low 135 g as compared to 400 g recommended for a balanced diet. Lack of available of quality seed is one of the important reasons for low vegetable production in this coun-try. At present, the seed of tomato are extracted from tomato fruits by cutting and crushing the fruits and then allowing the fruits to ferment along with the water for 12 to 24 hours. After partial fermentation, the pulp is washed repeatedly and seed are collected. This method of seed production is highly labour intensive, unhygenic, tedious, time consuming, and produces a large ef-fluent during the washing process. To overcome these problems and to collect the flesh portions of tomato for production of tomato pulp and paste, a tomato seed extractor has been developed.
VOL.36 NO.2 2005 AGRICULTURAL MECHANIZATION IN ASIA, AFRICA, AND LATIN AMERICA 63
Review of LiteratureHowthom and Pollard (1954) de-
scribed different methods of seed extraction using manual labourers. In one of the methods, the tomato fruits were fermented in water at 20 to 35 ºC for 3 days. Then, seed were washed repeatedly and used after drying.
Nicholos (1971) reported on a horizontal drum type brinjal seed extraction unit with rotating beat-ers inside. Dried brinjal fruits were used. The efficiency of the unit was 75 % and its capacity was 10 kg/h.
Ritchie (1971) reported that, in the fermentation method, the seed and pulp were squeezed from the fruit and left for fermentation in a warm room for 5 to 6 days. Due to the long fermentation, the mucilage around the seed was broken and clean seed were obtained after repeated wash-ing. The seed were cleaned by either using a 10 % sodium carbonate solution in equal volume of seed and pulp, or 567 ml of concentrated hydro-chloric acid (HCl) for each 10 kg of fruits that was stirred well for 30 minutes.
Patel and Patel (1974) used HCl acid for extracting seed from 76 tomato varieties. The pulped flesh of 1 kg of each variety was treated with 20 ml of concentrated HCl for 30 minutes and then washed 3 to 4 times with fresh water for separa-tion. Forty four varieties showed 100 % germination.
Brar and Hurisingh (1984) carried out seed extraction tests with four cultivars. The seed were extracted by 3 methods (fermentation, hydro-chloric acid, and hydrochloric acid after juice extraction). Optimum HCl acid rate was 10, 20 and 30 ml. Hydrochloric acid had an adverse effect on germination.
Gurmit Singh et al. (1985) con-ducted studies of the effect on ger-mination caused by the extraction of tomato seed. The fruits were crushed and the pulp was fermented for 24 to 120 hours. Seed germina-
tion decreased with the increased duration of fermentation. The best fermentation time was between 24 and 48 hours.
Raymond (1985) used both a wet and dry method of brinjal seed extraction. In the wet method, the fruits were crushed first and then passed through a screen to sepa-rate out the gelatinous seed from the bulk of the remaining material. Extra water was added during and after crushing in order to improve separation of seed. In the dry meth-od, over-ripened fruit were dried until they shriveled. The drying was accompanied by fading of skin co-lour to a coppery brown colour. The dried fruits were beaten manually and the seed were hand extracted.
Gowda et al. (1991) conducted studies on extraction of tomato seed using fermentation, acid, alkali, and mechanical extraction techniques. Use of HCl at 5 % or sulfuric acid at 4 % for a soaking time of 45 min gave better seed germination.
Kachru and Sheriff (1992) evalu-ated the performance of an axial flow vegetable seed extractor. Five wet vegetables and fruits (tomato, brinjal, watermelon, muskmelon and pumpkin) were tested. The seed loss and mechanical damage ranged between 0.82 and 15.02 % and 0.97 and 5.79 %, respectively were re-corded. The seed germination for tomato was 93 %.
Verma et al. (1992) designed an axial flow vegetable seed-extracting machine. In this machine the fruits were sliced, pulped, and seed were extracted. The pulp was discharged along with wash water.
Gabani and Siripurapu (1993) fabricated a chilli seed extractor. In this unit, the dried chilli fruits were crushed and a screen separated the seed from the crushed material. The mixture of seed and skin was separated in a cleaner and seed were collected separately.
More and Kanawade (1994) fabri-cated a power operated pomagranate seed extractor. A rotating shaft with
knives, along with a concave, sepa-rated the seed from the rind. Purity of the seed was 96 %.
Wehner and Humphires (1995) developed a single fruit seed extrac-tor for cucumber. An extractor cone present in the machine excavated the seed in the central cavity of the fruit, then washed and collected the seed through a strainer. In this method 100 % seed germination was recorded.
K ingsly (1998) fabr icated a brinjal seed extractor. It consisted of a fruit-crushing chamber and seed separation unit. In the crush-ing chamber the brinjal fruit were crushed into pulp by crushing rods. The pulp was fed into the seed sepa-ration unit and continuously agitated by a shaft rotating at 35 rpm. Due to the difference in specific weight, the pulp floated and the seed sank in the water, passed through a sieve kept at the bottom, and were collected through a seed outlet. The seed ef-ficiency of the unit was 98.8 %.
Materials and MethodsThe newly fabr icated tomato
seed-extracting machine (Fig. 1) consisted of two main components namely,1. Fruit squeezing chamber and2. Seed separation unit.
In the f ruit-squeezing cham-ber, the fruits were pressed and squeezed. The squeezed fruits were then transferred to the seed separa-tion unit where the seed were sepa-rated from the squeezed fruits.
Fruit squeezing ChamberIt consisted of the following parts.
(i) Feed hopper (ii) Rotor shaft (iii) Screw auger (iv) Outer cover (v) Power transmission system (vi) Mo-tor and (vii) Frame.
Feed Hopper : A t rapezoidal shaped tray type feed hopper, fixed at 23º to horizontal moved the to-mato fruits into the fruit squeezing unit by gravity. The length of the
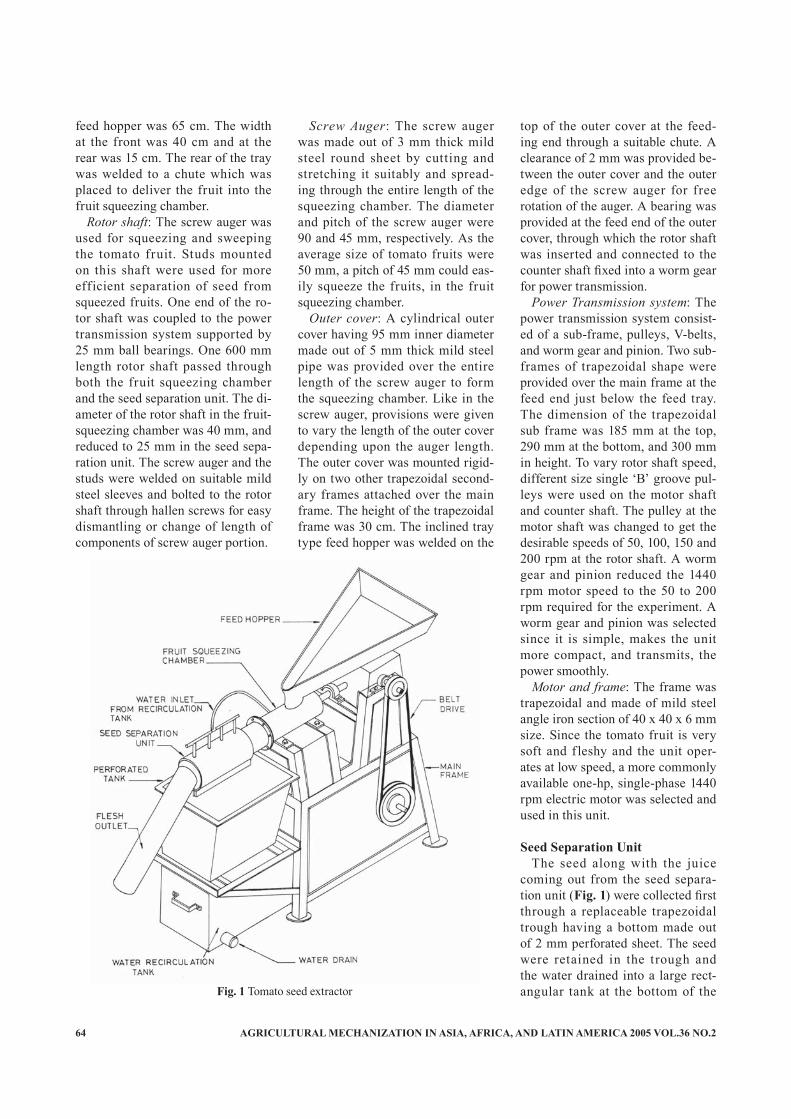
AGRICULTURAL MECHANIZATION IN ASIA, AFRICA, AND LATIN AMERICA 2005 VOL.36 NO.264
feed hopper was 65 cm. The width at the front was 40 cm and at the rear was 15 cm. The rear of the tray was welded to a chute which was placed to deliver the fruit into the fruit squeezing chamber.
Rotor shaft: The screw auger was used for squeezing and sweeping the tomato fruit. Studs mounted on this shaft were used for more efficient separation of seed from squeezed fruits. One end of the ro-tor shaft was coupled to the power transmission system supported by 25 mm ball bearings. One 600 mm length rotor shaft passed through both the fruit squeezing chamber and the seed separation unit. The di-ameter of the rotor shaft in the fruit-squeezing chamber was 40 mm, and reduced to 25 mm in the seed sepa-ration unit. The screw auger and the studs were welded on suitable mild steel sleeves and bolted to the rotor shaft through hallen screws for easy dismantling or change of length of components of screw auger portion.
Screw Auger: The screw auger was made out of 3 mm thick mild steel round sheet by cutting and stretching it suitably and spread-ing through the entire length of the squeezing chamber. The diameter and pitch of the screw auger were 90 and 45 mm, respectively. As the average size of tomato fruits were 50 mm, a pitch of 45 mm could eas-ily squeeze the fruits, in the fruit squeezing chamber.
Outer cover: A cylindrical outer cover having 95 mm inner diameter made out of 5 mm thick mild steel pipe was provided over the entire length of the screw auger to form the squeezing chamber. Like in the screw auger, provisions were given to vary the length of the outer cover depending upon the auger length. The outer cover was mounted rigid-ly on two other trapezoidal second-ary frames attached over the main frame. The height of the trapezoidal frame was 30 cm. The inclined tray type feed hopper was welded on the
top of the outer cover at the feed-ing end through a suitable chute. A clearance of 2 mm was provided be-tween the outer cover and the outer edge of the screw auger for free rotation of the auger. A bearing was provided at the feed end of the outer cover, through which the rotor shaft was inserted and connected to the counter shaft fixed into a worm gear for power transmission.
Power Transmission system: The power transmission system consist-ed of a sub-frame, pulleys, V-belts, and worm gear and pinion. Two sub-frames of trapezoidal shape were provided over the main frame at the feed end just below the feed tray. The dimension of the trapezoidal sub frame was 185 mm at the top, 290 mm at the bottom, and 300 mm in height. To vary rotor shaft speed, different size single ‘B’ groove pul-leys were used on the motor shaft and counter shaft. The pulley at the motor shaft was changed to get the desirable speeds of 50, 100, 150 and 200 rpm at the rotor shaft. A worm gear and pinion reduced the 1440 rpm motor speed to the 50 to 200 rpm required for the experiment. A worm gear and pinion was selected since it is simple, makes the unit more compact, and transmits, the power smoothly.
Motor and frame: The frame was trapezoidal and made of mild steel angle iron section of 40 x 40 x 6 mm size. Since the tomato fruit is very soft and f leshy and the unit oper-ates at low speed, a more commonly available one-hp, single-phase 1440 rpm electric motor was selected and used in this unit.
Seed Separation UnitThe seed along with the juice
coming out from the seed separa-tion unit (Fig. 1) were collected first through a replaceable trapezoidal trough having a bottom made out of 2 mm perforated sheet. The seed were retained in the trough and the water drained into a large rect-angular tank at the bottom of the Fig. 1 Tomato seed extractor

VOL.36 NO.2 2005 AGRICULTURAL MECHANIZATION IN ASIA, AFRICA, AND LATIN AMERICA 65
main frame. A small water pump mounted on the lower tank, recircu-lated the water for washing. When the wash water becomes thick, it may be drained and used as feed for animals. Fresh water must then be added for continued washing.
The seed collected in the trough have a gelatinous coating. The seed were cleaned by treating with a 2.5 % hydrochloric acid solution for 30 min and washed. The clean seed were tested for the germination by approved international methods.
Determination of Seed LossSeed loss was determined by
recovering the seed from the seed from the squeezed fruit collected at the squeezed fruit outlet. The entire squeezed fruit material collected from the squeezed fruit outlet dur-ing each test was dipped into water and the seed separated by gentle agitation. The percent seed loss was determined from the following equation.
Percent seed loss = x 100 Where,S1 = weight of seed collected from seed outlet, gS2 = weight of seed collected from squeezed fruits at squeezed fruit outlet, g
The percent seed loss was calcu-lated for different rotor shaft speeds and water flow rates.
Determination of Seed Extraction Efficiency
The percent seed extraction ef-ficiency was determined from the following equation.Seed extracting efficiency (percent)
= x 100
Where,S1 = Weight of seed collected from seed outlet, gS2 = Weight of seed collected from squeezed fruits at squeezed fruit outlet, g.
Calculation of Cost and TimeThe material cost and cost of fab-
rication were used with the standard procedures of Palanisamy, 1997 to determine the cost of operation. The cost of extraction of 1 kg of tomato seed with the machine was com-pared with the manual method of seed extraction. The cost and time saved were reported.
Results and DiscussionThe tomato seed extractor was
tested with PKM-1 tomato, a prim-ery variety in Tamil Nadu, India. Each experiment was replicated three times and the average values were reported. Three kg of tomato fruits were used during each test. The performance of the machine was tested by varying the following parameters.
Parameter ValueFeed water flow rate 5, 7.5, 10 l/min
Rotor shaft speed 50, 100, 150 and 200rpm
Auger length 240 and 340 mmThe following data were collected during testing.
(i) Weight of seed obt a ined through seed outlet
(ii) Weight of seed collected from the discharged flesh
From the data collected, the fol-lowing calculations were made
(i) Seed extraction efficiency(ii) Percent seed lossIn addition, germination studies
were conducted and germination percentage were determined.
S2S1 + S2
S1S1 + S2
The following Tables 1, 2 and 3 give the performance of the tomato seed extractor for different seed ex-traction feed water flow rates.
Seed extraction efficiency was slightly higher with a screw auger length of 340 mm at all water flow rates. The highest seed extraction efficiency was for 5 l/min water flow rate at both auger lengths and occurred with 100 and 150 rpm shaft speeds. At 10 l/min the seed extraction efficiency reduced from the lowest shaft speed (50 rpm) to the highest speed (200 rpm). The highest seed extraction efficiency (98.8 %) was at 7.5 l/min water flow rate, 340 mm auger length and 150 rpm shaft speed. This combination also gave the highest germination rate of 98 %. Generally, the lowest germination rate was at the highest water flow rate.
Cost of OperationThe cost of operation of the pro-
totype was estimated and compared to that of manual method of seed extraction. From the calculations made, it is seen that the capacity of the newly developed tomato seed ex-tractor is 180 kg of fruit per hour or 1.8 kg of tomato seed per hour. The cost of operation of tomato seed ex-tractor was determined and found to be $0.25 per kg of seed. The time re-quired for the tomato seed extractor to extract one kg of seed was 33.33 min whereas, in the manual method, it required 1000 min. By using this machine, it is possible to save 89.6
Length of Screw Auger (mm)
Rotor shaft speed (rpm)
Seed extraction efficiency (%) Seed loss (%) Seed
germination (%)
240
50 92.6 7.4 92100 94.5 5.5 95150 94.7 5.3 95200 90.0 10.0 94
340
50 95.1 4.9 95100 96.2 2.8 96150 97.6 2.4 97200 94.4 5.6 96
Table 1 Perfomance of tomato seed extractor with 5 l/minseed extraction feed water flow rate

AGRICULTURAL MECHANIZATION IN ASIA, AFRICA, AND LATIN AMERICA 2005 VOL.36 NO.266
Length of Screw Auger (mm)
Rotor shaft speed (rpm)
Seed extraction efficiency (%) Seed loss (%) Seed
germination (%)
240
50 94.6 5.4 95100 96.9 3.1 95150 97.2 2.8 96200 94.5 5.5 94
340
50 97.3 2.7 95100 97.5 2.5 97150 98.8 1.2 98200 95.1 4.9 96
Length of Screw Auger (mm)
Rotor shaft speed (rpm)
Seed extraction efficiency (%) Seed loss (%) Seed
germination (%)
240
50 97.5 2.5 94100 96.5 3.5 95150 94.5 5.5 95200 93.5 6.5 92
340
50 97.8 2.2 94100 97.1 2.9 95150 97.1 2.9 97200 95.5 4.5 94
Table 3 Perfomance of tomato seed extractor with 10 l/minseed extraction feed water flow rate
Table 2 Perfomance of tomato seed extractor with 7.5 l/minseed extraction feed water flow rate
% in cost and 96.6 % in time.
AcknowledgementThe authors express their sincere
thanks to Thiruvalargal Sheela Ma-nogaran, T.S. Thomas, Sukumaran, Pethurajan and other artisans who directly or indirectly helped in fab-ricating the prototype and success-ful testing of the unit.
REFERENCES
Brar, B.S. and Harisingh. 1984. Ef-fect of different methods of toma-to seed extraction on seed recov-ery and its germination. Harayana Journal of Horticulture Science, 13(3/4): 161-164.
Gabani, S.H. and S.C.B. Siripurapu. 1993. Chillies Seed Extractor. Spice India, September: 5-8.
Gurmitsingh, Harisingh and T.S. Dillon. 1985. Some aspect of seed extraction in tomato. Seed Re-search, 13(2): 67-72.
Howthorn, L.R. and L.H. Pollard. 1954. Vegetable and flower seed
production. The Blakiston Com-pany Inc., Newyork. pp.: 208-238.
Jaware Gowda, S.K.C. Talukdar and H.Ramaiah. 1991. Optimization of seed extraction. Techniques in Tomato. Seeds and Farms, 17(3): 15-17.
Kachru,R.P. and J.T. Sheriff. 1992. Performance evaluation of axial flow vegetable seed extractor. In-dian Journal of Agricultural Engi-neering, 2(1): 37-40.
Kingsly, A.R.P. 1998. Fabrication and performance evaluation of Brinjal Seed Extractor. Unpub-lished M.E.(Ag.Engg.) thesis. Tamil Nadu Agricutlural Univer-sity, Coimbatore.
Nicholas,L. 1971. A machine for vegetable seed extraction. Jour-nal of Agricultural Engineering, IASE, 8(3): 87-91.
Patil, A.V. and S.J. Patill. 1974. Ef-fect of concentrated Hydrochloric acid seed extraction method on 77germination of different variet-ies of Tomato. Research Journal of Mahatma Phule Krishi Agri-cultural University, 5(1):57-58.
Raymond, A.T.G. 1985. Vegetable seed production. Longman pub-
lishers, London. PP.223-229.Ritchie, D.B. 1971. Tomato seed ex-
traction. Horticulture Research, 11:127-135.
Wehner, T.C. and E.G. Humphries. 1995. A single fruit seed extractor for cucumbers. Horticulture tech-nology,5(3): 268-273.
■■
VOL.36 NO.2 2005 AGRICULTURAL MECHANIZATION IN ASIA, AFRICA, AND LATIN AMERICA 67
Computer-Aided Analysis of Forces Acting on a Trailed Plough
byYing YibinAssociate Dean and ProfessorCollege of Biosystem EngineeringZhejiang University;Hangzhou, Zhejiang 310029P.R. CHINAe-mail: [email protected]
Zhao YunProfessorCollege of Biosystem EngineeringZhejiang University;Hangzhou, Zhejiang 310029P.R. CHINAe-mail: [email protected]
AbstractThe traditional method of analyz-
ing forces acting on a trailed plough was evaluated, and the sources of the errors were studied in theory. The system of equations of forces acting on trailed plough was estab-lished, and the solution was found by the use of computer-aided analy-sis. In light of the equations, the influence of different values of pa-rameters on the forces was forecast. These results provided theoretical basis for designing and optimizing the structure of a trailed plough.
IntroductionTillage is the manipulation of soil
by mechanical forces (Gill, 1968) which can eradicate competitive weeds and improve the physical condition of the soil for plant growth (Smith, 1976), and is imperative to prepare the soil for planting or sowing. The common tool for soil tillage in agriculture is the trailed plough (TP). In order to look for the ways to reduce resistance to the working parts of the plough and the power consumption in tillage, to design and make use of trailed plough rationally, and to raise the efficiency of the unit, analysis of
forces acting on the trailed plough is needed. The traditional method of analyzing forces acting on a trailed plough is a graphical method, that is, to solve the problem by changing the space force system to 3 plane force systems. Because only 3 un-known forces could be sought out, at most, in a plane force system, hy-potheses must be made to simplify the problem before using graphical method (Shang, 1988; Beijing Ag-ricultural Engineering University, 1986; Zhengjiang Institute of Farm Machinery, 1981; Du, 1977). There-fore, the results of graphical method are not usually accurate, and cannot meet the requirements of practical application.
The objectives of this study were to establish the balance equations of forces applied to the trailed plough, to find solutions of the equations by analytic method, and to forecast the influence of different values of the parameters on forces and torques acting on the trailed plough.
MethodsForces Applied to Trailed Plough
Forces applied to a trailed plough form a typical space force system which is composed of three sec-tions: forces acting on the plough
bottom; forces acting on the land wheel, furrow wheel and tail wheel; and traction force of the tractor (Fig. 1).
Forces acting on the plough bot-tom: The resistances of soil against the plough bottom could be deter-mined by a test, and then simplified as a force (Rt) acting on the share point and a couple (Mt). The normal reacting forces (Nti) of the furrow wall against the landsides could be composed of a total normal reacting force of the soil against the landside (NTt).
Forces acting on the land wheel, furrow wheel, and tail wheel: The reacting forces of the ground or fur-row bottom against the land wheel (Q t1), furrow wheel (Qt2) and tail wheel (Qt3) are different, and com-posed of the normal reacting forces and the rolling friction.
Traction force of the tractor: The traction force (Pt) is acting on the hitch point by the tractor that could be resolved into three forces PtX, PtY and PtZ.
PtZ = PtX • Tgαt .................................(1)
Here, αt is the trail angle.
Existing Errors in the Graphical Method
The graphical method is of low accuracy and takes much time to
Jin JuanqinAssociate ProfessorCollege of Biosystem EngineeringZhejiang University;Hangzhou, Zhejiang 310029P.R. CHINAe-mail: [email protected]

AGRICULTURAL MECHANIZATION IN ASIA, AFRICA, AND LATIN AMERICA 2005 VOL.36 NO.268
draw the graph (Shang, 1988; Bei-jing Agricultural Engineering Uni-versity, 1986; Zhengjiang Institute of Farm Machinery, 1981). There are 6 unknown forces acting on the trailed plough which are: PtX, PtY, Qt1, Qt2, Qt3, and NTt. This is a typical space static's problem the solution of which could be found accurately by the use of analytic method. However, when we use graphical method to fi nd the solution, the space force system must first be projected to three planes: xoy, yoz, and zox. After projecting, the numbers of unknown forces in the three plane force systems are, respectively, 6, 6, and 5. However, only 3 unknown forces could be sought out, at most, in a plane force system. We have to assume the val-ues of some unknown forces in ad-vance, which would result in that the values of the unknown forces found from different plane force system would be different. So, in order to find a reasonable solution we must draw the graphs for many times. In this way, the graphical method is not only time-consuming but also of low accuracy.
However, the most serious prob-lems of the graphical method lie in the aspects below. This is to suppose that the normal reacting forces of
the furrow wall against the different landsides were equal, their magni-tudes were known, and their resul-tant acts on the landside of the cen-ter plough bottom or the imagined center plough bottom. By means of analyzing the wear condition of the landsides used in practice for a cer-tain period of time, it was found that the wear condition of the front land-side was different from that of the back landside. This means that, the normal pressures and frictions acting on the landsides of the front plough bottom and the back plough bottom are varied. In fact, the couple result-ing from the resistance of the soil against the plough bottom causes the trailed plough and tractor unit to rotate clockwise. Under the same an-gular displacement, the compressed deformation of furrow wall caused by the landside of the back plough bottom is larger than that caused by the landside of the front plough bot-tom, and the normal pressure and friction of the furrow wall against the landside of the back plough bot-tom is bigger than that of the furrow wall against the landside of the front plough bottom. Therefore, it is un-reasonable to suppose that the nor-mal reacting forces of furrow wall against the different landsides in a
trailed plough are equal. Besides, the magnitude of Ni was changed with the variation of working situation of the trailed plough unit, which could not be determined beforehand.
Equations of Forces Acting on the Trailed Plough
In light of the analysis above, the normal reacting forces of the furrow wall against each landside (Nti) are different. If taking every Nti as an unknown, the number of unknowns in this space static’s problem will be more than 6, and this problem can not be solved. Therefore, we should try to reduce the unknown first. According to the theory of soil me-chanics, the normal reacting force of the furrow wall against the landside is directly proportional to the area of the landside and the square root of the compressed deformation of the furrow wall. Hence, the normal reacting force of the furrow wall against a single landside could be calculated by the following formula:
Nti = k[θt(xtni - xt0)]/2 • Si .................(2)
where, Nti = normal reacting force of fur-row wall against the ith landside (N)k = compression constant of soilθt = rotating angle of the landsides in horizontal plane (º)xt0 = x coordinate of the rotating center of the plough (m)xtni = x coordinates of the center of the ith landside (m)Sti = area of the ith landside (m2)
The rotating angle (θt) of each landside around the hitch point re-mains the same. In order to avoid measuring k, one should suppose KtN = kθt
1/2 that. In this way, the KtN of each landside are equal and the resultant (NTt) for all the Nti could be calculated by the following for-mula:
........(3)
where, n is the number of the plough bottom, and KN is the only one un-known. Fig. 1 Forces applied to the trailed plough

VOL.36 NO.2 2005 AGRICULTURAL MECHANIZATION IN ASIA, AFRICA, AND LATIN AMERICA 69
Additionally, the resistance of the soil against the plough bottom was determined by test which could resolve into three forces: RX, RY, RZ acting on the share point and three couples: MRX, MRY, MRZ. The unknowns then in the space static's problem of the trailed plough are: PtX, PtY, Qt1, Qt2, Qt3, NTt. The co-ordinates of the unit were set up as Fig. 1, and the balance equations of forces applied to trailed plough were established as follows: Equations 4a to 4f.where,(x t0, yt0, zt0) = coordinates of the hitch point in TP (m)(x t1, yt1, zt1) = coordinates of the share point of front plough bottom in TP (m) (xt2, yt2, z t2) = coordinates of the mass center of TP (m)(xt3, yt3, zt3) = coordinates of the cen-ter of the land wheel in TP (m)(xt4, yt4, zt4) = coordinates of the cen-ter of the furrow wheel (m)(x t5, yt5, zt5) = coordinates of the mass center of the tail wheel (m) (xtk, ytk, ztk) = algebraic sum of co-ordinates of the share point of all ploughs in TP (m)(xtni, ytni, ztni) = coordinates of the center of the ith landside in TP (m)Gt = weight of TP (N)ft1 = friction coeffi cient between the landsides and furrow wall in TP ft2 = rolling friction coefficient be-tween the land wheel and ground in TP ft3 = rolling friction coefficient be-tween furrow wheel and furrow bottom in TPft4 = rolling friction coefficient be-tween the tail wheel and furrow bottom in TP Q t1 = normal react ing force of ground against the land wheel in TP (N)Qt2 = normal reacting force of fur-row bot tom against the fur row wheel (N) Qt3 = normal reacting force of fur-row bottom against the tail wheel (N) Ft = friction force between the land-
sides and furrow wall (N)Pt = traction force of the tractor in TP (N) αt = traction angle in TP (º)Rt = resistance of soil against the plough bottom in TP (N)Mt = couple caused by Rt (N•m)(PtX, PtY, PtZ) = three components of the Pt (N)(RtX, RtY, RtZ) = three components of Rt (N)(MtRX, MtRY, MtRZ) = three compo-nents of Mt (N•m)
Solution Finding and Simulation Calculation
The equations above could be written in the following matrix form
for the trailed plough:
At•Bt=Ct ..........................................(5) where, Equations 5a to 5c.
Results and DiscussionThrough designing the calcu-
lating program, we can f ind the solution of the equation 5 with the aid of a computer. Besides, on the basis of this program we can also forecast the varying conditions of forces acting on the main parts of the trailed plough when one struc-ture parameter of the trailed plough was changed. According to the
Equation 4a, 4b, 4c, 4d, 4e, 4f
Equation 5a, 5b, 5c
...(4b)
...(4c)
...(4a)
...(4d)
...(4e)
...(4f)
...(5a)
...(5b) ...(5c)
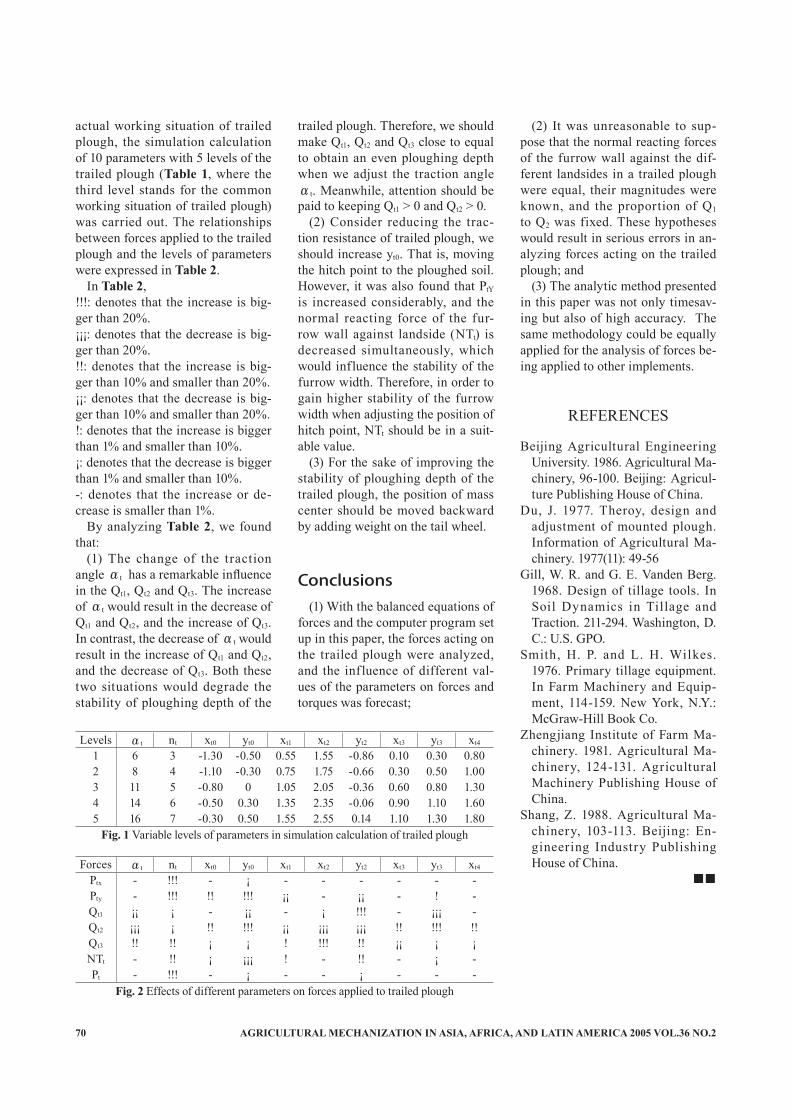
AGRICULTURAL MECHANIZATION IN ASIA, AFRICA, AND LATIN AMERICA 2005 VOL.36 NO.270
actual working situation of trailed plough, the simulation calculation of 10 parameters with 5 levels of the trailed plough (Table 1, where the third level stands for the common working situation of trailed plough) was carried out. The relationships between forces applied to the trailed plough and the levels of parameters were expressed in Table 2.
In Table 2,!!!: denotes that the increase is big-ger than 20%.¡¡¡: denotes that the decrease is big-ger than 20%.!!: denotes that the increase is big-ger than 10% and smaller than 20%.¡¡: denotes that the decrease is big-ger than 10% and smaller than 20%.!: denotes that the increase is bigger than 1% and smaller than 10%.¡: denotes that the decrease is bigger than 1% and smaller than 10%.-: denotes that the increase or de-crease is smaller than 1%.
By analyzing Table 2, we found that:
(1) The change of the traction angle αt has a remarkable influence in the Qt1, Qt2 and Qt3. The increase of αt would result in the decrease of Qt1 and Qt2, and the increase of Qt3. In contrast, the decrease of αt would result in the increase of Qt1 and Qt2, and the decrease of Qt3. Both these two situations would degrade the stability of ploughing depth of the
Levels αt nt xt0 yt0 xt1 xt2 yt2 xt3 yt3 xt4
1 6 3 -1.30 -0.50 0.55 1.55 -0.86 0.10 0.30 0.802 8 4 -1.10 -0.30 0.75 1.75 -0.66 0.30 0.50 1.003 11 5 -0.80 0 1.05 2.05 -0.36 0.60 0.80 1.304 14 6 -0.50 0.30 1.35 2.35 -0.06 0.90 1.10 1.605 16 7 -0.30 0.50 1.55 2.55 0.14 1.10 1.30 1.80
trailed plough. Therefore, we should make Qt1, Qt2 and Qt3 close to equal to obtain an even ploughing depth when we adjust the traction angle αt. Meanwhile, attention should be paid to keeping Qt1 > 0 and Qt2 > 0.
(2) Consider reducing the trac-tion resistance of trailed plough, we should increase yt0. That is, moving the hitch point to the ploughed soil. However, it was also found that PtY is increased considerably, and the normal reacting force of the fur-row wall against landside (NTt) is decreased simultaneously, which would influence the stability of the furrow width. Therefore, in order to gain higher stability of the furrow width when adjusting the position of hitch point, NTt should be in a suit-able value.
(3) For the sake of improving the stability of ploughing depth of the trailed plough, the position of mass center should be moved backward by adding weight on the tail wheel.
Conclusions (1) With the balanced equations of
forces and the computer program set up in this paper, the forces acting on the trailed plough were analyzed, and the influence of different val-ues of the parameters on forces and torques was forecast;
(2) It was unreasonable to sup-pose that the normal reacting forces of the furrow wall against the dif-ferent landsides in a trailed plough were equal, their magnitudes were known, and the proportion of Q1 to Q2 was fixed. These hypotheses would result in serious errors in an-alyzing forces acting on the trailed plough; and
(3) The analytic method presented in this paper was not only timesav-ing but also of high accuracy. The same methodology could be equally applied for the analysis of forces be-ing applied to other implements.
REFERENCES
Beijing Agricultural Engineering University. 1986. Agricultural Ma-chinery, 96-100. Beijing: Agricul-ture Publishing House of China.
Du, J. 1977. Theroy, design and adjustment of mounted plough. Information of Agricultural Ma-chinery. 1977(11): 49-56
Gill, W. R. and G. E. Vanden Berg. 1968. Design of tillage tools. In Soil Dynamics in Tillage and Traction. 211-294. Washington, D. C.: U.S. GPO.
Smith, H. P. and L. H. Wilkes. 1976. Primary tillage equipment. In Farm Machinery and Equip-ment, 114-159. New York, N.Y.: McGraw-Hill Book Co.
Zhengjiang Institute of Farm Ma-chinery. 1981. Agricultural Ma-chinery, 124-131. Agricultural Machinery Publishing House of China.
Shang, Z. 1988. Agricultural Ma-chinery, 103-113. Beijing: En-gineering Industry Publishing House of China.
■■
Fig. 2 Effects of different parameters on forces applied to trailed plough
Forces αt nt xt0 yt0 xt1 xt2 yt2 xt3 yt3 xt4
Ptx - !!! - ¡ - - - - - -Pty - !!! !! !!! ¡¡ - ¡¡ - ! -Qt1 ¡¡ ¡ - ¡¡ - ¡ !!! - ¡¡¡ -Qt2 ¡¡¡ ¡ !! !!! ¡¡ ¡¡¡ ¡¡¡ !! !!! !!Qt3 !! !! ¡ ¡ ! !!! !! ¡¡ ¡ ¡NTt - !! ¡ ¡¡¡ ! - !! - ¡ -Pt - !!! - ¡ - - ¡ - - -
Fig. 1 Variable levels of parameters in simulation calculation of trailed plough

VOL.36 NO.2 2005 AGRICULTURAL MECHANIZATION IN ASIA, AFRICA, AND LATIN AMERICA 71
The Effects of Some Operational Parameters on Potato Planter's Performance
byEbubekir AltuntasAssist. ProfessorUniversity of Gaziosmanpasa,Faculty of Agriculture,Department of Agricultural Engineering,60240, TokatTURKEY e-mail: [email protected]
AbstractThe objective of this study was to
determine the effects of tuber size and forward speed on full automatic potato planter's performance. The results were related by linear regres-sion. Uniformity of seed tuber spac-ing was determined by a computer programme and quantified by deter-mining the ratio of misses, doubles and coefficient of variation of spac-ing. The trials were conducted on 4 different tuber sizes (35 ≤ ts < 45 mm; 45 ≤ ts < 55 mm, 55 ≤ ts < 65 mm; 65 ≤ ts < 75 mm (whole or cut) and at 3 different forward speeds of machine (3.60 km/h, 5.40 km/h and 8.64 km/h). It was found that seed tuber distribution pattern in the row was disturbed as tuber size and machine forward speed increased. Small tuber gave better in row tuber distribution pattern than big tubers. However, lower coefficient of varia-tion of spacing and miss ratio were found with the usage of cut tubers than with whole tubers.
IntroductionPotato is an important crop for
industry and human food in Turkey. Approximately 5,370,000 tons of potato were produced on 210,000
ha in 2000 (Anonymous, 2001). The working capacity of potato planters depends on the machine forward speed and whether the planting units are fully automatic or semi auto-matic. The planting parameters are affected by working conditions and seed tuber characteristics as well as the structure of the machine (Siecz-ka et al., 1986; Gruzcek et al., 1988; Misener, 1979 and 1982). A regular planting can be achieved by leaving the potatoes at the same depth, pro-viding equal spacing between rows and giving equal spacing between tuber seeds on the same rows. Fully automatic potato planters have 160 to 200 tuber min-1 planting frequen-cy, nominal forward speeds of 4 to 6 km/h, and a working capacity of 2 to 8 ha per day.
Distribution of seed and plant on a row can be classified into three groups for precision drills (ISO 7256-1) (Anonymous, 1984). A miss is called if there is a gap between the plants equal to or grater than one and half times the intended center-to-center plant distance (Z). A double is called if the space be-tween adjacent seed pieces is less than the half of the intended center-to-center plant distance. Otherwise, distribution of seed tubers in a row is within the acceptable limit. It is required that 80 % of seed tuber
distribution in a row be within the ±25 % tolerance limits of Z statistical distribution (Kanafojski, 1972).
Non-uniformity of seed distribu-tion with extremely high coeffi-cients of variation affected the tuber yield. Tuber yield is decreased by reducing the number of seed pieces planted per unit area whether or not the pieces were uniformly spaced (Sieczka et al., 1986). The missed ratio is affected by the tuber type (whole or cut) and the sizes on a planter (Misener, 1982), and the tu-ber yield ratio (Rykbost, 1977, and James et al., 1973). The seed tuber distribution pattern on a row is af-fected by the tuber characteristics (size, shape, and type (whole or cut)) as well as the machine’s for-ward speeds (Sieczka et al., 1986; Misener, 1982; Toader and Draica, 1983 and Samploy and Eremin, 1985). The performance of the cup type planter is quite sensitive to tu-ber size. One important criterion for good performance is a proper match between seed size and planter cup size (Misener, 1982).
The Tokat region in Turkey has used the fully automatic potato planter for tubers that range from 35 to 65 mm diameter (whole) (TS 11617) and 65 to 75 mm diameter (whole and cut).
In this study, the effects of tuber

AGRICULTURAL MECHANIZATION IN ASIA, AFRICA, AND LATIN AMERICA 2005 VOL.36 NO.272
size and machine forward speed on potato planting frequency and distribution pattern in the row were determined with the fully automatic potato planter. The linear regression equations for the seed distribution pattern were determined.
Material and MethodsExperiments were conducted on
clay-loam soil conditions at the Agricultural Faculty of Gaziosman-pasa University-Tokat. An imported fully automatic potato planter with a double cup elevator planting unit was used for planting. The techni-cal characteristics of the planter are given in Table 1. The mean tuber characteristics of Granola type seed tubers used in this study are given in Table 2.
Turkish Standards Institute (TSE) classifies the seed tubers according to their size as: middle (35 ≤ ts < 45 mm), big (45 ≤ ts < 55 mm), and
great (55 ≤ ts < 65 mm) as TS 11617 (Anonymous, 1995). In addition to these three groups, in this research, 65 ≤ ts < 75 mm diameter (whole or cut) tubers were also studied. Lack of enough seed potatoes in the 28 to 35 mm range, prevented this group from being included in these experi-ments.
Planting frequencies were mea-sured as the number of tubers discharged per minute from the fully automatic potato planter. To facilitate seed spacing the cover-ing disks on one row were removed (Sieczka et al., 1986) or partially lifted, the potatoes were deposited in the furrow, and only lightly cov-ered by soil. Seed tuber spacing was measured from center to center of tubers (to the nearest 0.01 m). Data were collected over row lengths of 30.5 m (Misener, 1979 and 1982). The results of measurements of seed tuber distribution in the row were analysed by a special computer program. The potato planter was
adjusted for the experiments for a 5 cm planting depth and at a trans-mission ratio that provided a 40 cm spacing between tuber seeds. The experiments were carried out at 70 cm row spacing and at 3.60, 5.40 and 8.64 km/h machine forward speeds. The research was conducted under field conditions and planned in randomised block design with three replications.
In this study, the effects of tuber sizes and machine forward speed on potato planting frequency and potato distribution pattern in the row with the fully automatic potato planter were determined by linear regression equations. The linear re-gression model was represented by
y = α + β1 X1 + β2 X2
Where; y = dependent variableα; β1;, β2 = constantX1 = tuber diameter (mm)X2 = machine forward speed (km/h)
Results and Discussion The Planting Frequency
It was found that tuber sizes and forward speed had significant ef-fects on planting frequency of the full automatic potato planter (P < 0.01). The planting frequency showed a linear increase with for-ward speed when the ideal tuber size 35 to 45 mm diameter was used. However, it decreases with tuber sizes of 65 ≤ ts < 75 mm (whole). An increase in planting fre-quency occurred when 65 ≤ ts < 75 mm diameter tubers were used as cut. However, a decrease occurred when they were used as whole. The planting frequencies of the fully automatic potato planter with differ-ent tuber sizes at different forward speeds are given in Table 3.
The Row Seed Tuber Distribution The row seed tuber distributions
of the fully automatic potato planter with different tuber sizes at differ-
Characteristic Value Characteristic ValueTotal length (mm) 2,150 Depth of planting (mm) 50...130Total width (mm) 1,640 Band width and tickness (mm) 175 x 115Total height (mm) 2,140 Number of cup per unit 20 x 2 = 40Weight (kg) 670 Ridger disc diameter (mm) 570Hopper capacity (kg) 500 Working capacity (ha/h) 0.8
Table 1 Technical characteristics of the potato planter used in the experiment
Tuber size (mm)
Mean tuber weight (g)
Mean tuber length (mm)
Mean tuber width (mm)
Mean tuber tickness (mm)
Mean number of eyes
35 ≤ ts < 45 55.23 ±1.62 54.58 ±1.27 43.35 ±0.31 37.15 ±0.58 7.17 ±0.2245 ≤ ts < 55 97.46 ±3.87 71.34 ±2.30 49.02 ±0.70 45.34 ±0.67 9.04 ±0.4155 ≤ ts < 65 127.86 ±5.22 77.14 ±2.46 59.92 ±0.73 48.62 ±0.98 8.08 ±0.2965 ≤ ts < 75 223.85 ±9.47 97.06 ±3.40 74.37 ±0.68 58.15 ±1.23 8.96 ±0.29
Table 2 The mean tuber characteristics with respect to the tuber size
Tuber sizes Forward Speeds (km/h) Mean3.60 5.40 8.6435 ≤ ts < 45 203.33 246.67 336.67 268.22a45 ≤ ts < 55 188.33 242.33 213.33 214.67b55 ≤ ts < 65 166.67 206.67 193.33 188.89b65 ≤ ts < 75 (whole) 98.33 93.00 73.33 88.82c65 ≤ ts < 75 (cut) 85.00 106.00 103.00 98.33cMean 148.33b 182.67a 184.00a
LSD (Tuber diameter, p < 0.01): 36.133, LSD (Forward speed, p < 0.01): 27.989
Table 3 Average proportion of the planting frequencies (number of tube discharged per minute) of the fully automatic potato planter withdifferent tuber sizes at different machine forward speeds

VOL.36 NO.2 2005 AGRICULTURAL MECHANIZATION IN ASIA, AFRICA, AND LATIN AMERICA 73
ent forward speeds were given in Table 4. The seed tuber distribution pattern was affected by the tuber sizes, types and forward speeds.
According to these results, the acceptable limit values decreased with an increase in tuber size and with an increase in forward speed. It has been observed that small tubers gave better results than big tubers. The 65 ≤ ts < 75 mm cut tubers also gave better results than the whole tubers. In general, miss ratios increased with increasing tuber sizes and increasing forward speeds. When 65 ≤ ts < 75 mm tu-bers were used as cut, the miss ratio decreased in comparision with the whole tubers. The ratio of doubles decreased with the increase in tuber sizes. For each tuber size, the low-est ratio of doubles was obtained at the 8.64 km/h forward speed. The doubles ratios decreased relavitely with the usage of the cut tubers. The coefficient of variation of spacing increased with tuber size and for-ward speed. As a result of that, seed tuber distribution pattern on row was disturbed. Smaller tuber sizes and lower forward speeds yielded lower coefficient of variation values. Lower coefficient of variation values were obtained for cut tubers of 65 to 75 mm size than with whole tubers. Using the experimental data, the following linear regression equa-tions were developed for planting frequency and potato distribution pattern on row;
yfrequency = 470 - 5.78X1 + 6.27X2
r2 = 0.849ydouble = 69.1 - 0.807X1 - 1.37X2
r2 = 0.824yacceptable = 115 - 0.686X1 - 3.90X2
r2 = 0.863ymiss = -84.9 + 1.52X1 + 5.27X2
r2 = 0.922
According to the linear regression equations, the planting frequency was increased by the machine for-ward speed and decreased by the tuber sizes. The miss ratio and ac-ceptable limit ratio were decreased
by the tuber sizes. The double ratio was increased by the tuber size and machine forward speeds (Table 5).
Misener (1979), established that the miss ratios and the coefficient of variation increased with an in-crease in forward speeds. Gupta et al., (1984) and Gruzcek et al. (1988) found the miss ratios with a range of 0.00 to 29.36 % and 0.00 to 42.00 % respectively. Gruzcek et al., (1988)
found the coefficient of variation values between 48.00 and 68.00 % for 50 to 60 mm tuber size. Misener (1982) expressed that coefficient of variation values ranged from 48.2 to 50.1 % with a tuber weight of 80.2 g. The percentage of missing and doubles potato tubers increase with the increase of planting speed.
In this study, the planting frequen-cy ranged from 73.33 tuber min-1
Predictor Coefficient St. deviation T P
Planting frequency
Constant 470.17 48.51 9.69 0.00Tuber diameter -5.7837 0.7167 -8.07 0.00Forward speed 6.273 4.008 1.57 0.00
S = 32.37 R - Sq = 84.9 F = 37.79 DW = 1.68Predictor Coefficient St. deviation T P
Missratio
Constant -84.91 10.16 -8.36 0.00Tuber diameter 1.5180 0.1501 10.11 0.00Forward speed 5.2732 0.8394 6.28 0.00
S = 6.779 R - Sq = 92.2 F = 70.87 DW = 0.93Predictor Coefficient St. deviation T P
Acceptablelimit
Constant 114.947 7.602 15.12 0.00Tuber diameter -0.6855 0.1123 -6.10 0.00Forward speed -3.8933 0.6281 -6.21 0.00
S = 5.073 R - Sq = 86.3 F = 37.89 DW = 1.37Predictor Coefficient St. deviation T P
Doubleratio
Constant 69.116 7.623 9.07 0.00Tuber diameter -0.8068 0.1126 -7.16 0.00Forward speed -1.3663 0.6298 -2.17 0.00
S = 5.087 R - Sq = 82.4 F = 28.01 DW = 1.78
Tuberdiameter
(mm)
Seed tuber distribution patternForward
speed (km/h)Doubles
(%)Acceptable limit (%)
Miss(%)
CV(%)
35 ≤ ts < 453.60 25.71 71.43 2.86 47.795.40 29.41 61.77 8.82 53.938.64 23.53 52.94 23.53 79.84
45 ≤ ts < 553.60 24.99 65.63 9.38 43.995.40 33.33 56.67 10.00 59.168.64 18.18 54.55 27.27 79.16
55 ≤ ts < 653.60 21.88 65.62 12.50 44.605.40 14.29 62.85 22.86 59.318.64 2.86 40.00 57.14 96.19
65 ≤ ts < 75(whole)
3.60 4.76 52.38 42.86 75.365.40 8.57 42.86 48.57 95.878.64 0.00 27.03 72.97 73.48
65 ≤ ts < 75(cut)
3.60 2.86 54.29 42.85 55.995.40 4.55 40.90 54.55 60.268.64 2.50 35.00 62.50 72.36
Table 5 The linear regression model analysing for the plantingfrequency and seed tuber distribution pattern
Table 4 Average proportion of the miss, doubles, and acceptable and the coefficientof variation of the seed distribution pattern of the potato planter withdifferent tuber sizes at different machine forward speed
AGRICULTURAL MECHANIZATION IN ASIA, AFRICA, AND LATIN AMERICA 2005 VOL.36 NO.274
to 336.67 tuber min-1 for the fully automatic potato planter. However, the miss ratio ranged from 2.86 to 72.94 %, the doubles ratio ranged from 0.00 to 33.33 %, the acceptable tuber distance on rows ranged from 27.03 to 71.43 %, and the coeffi-cient of variation ranged from 43.99 to 96.16 % on the row seed tuber distribution for the fully automatic potato planter. Lower coefficient of variation values were obtained with cut tubers for 65 ≤ ts < 75 mm than with whole tubers. According to these results, 35 ≤ ts < 45 mm tuber size and a 3.6 km/h forward speed would be recommended for the fully automatic potato planter with double cup elevator.
ConclusionA full automatic potato planter
with a double cup belted planting unit was made for uniform plant-ing. The seed tuber distribution pattern was effected by the differ-ent tuber sizes and types (whole or cut). Seed tuber distribution pattern was spoiled when tuber sizes and machine forward speed increased, small tubers gave better results in seed tuber distribution pattern than larger tubers.
REFERENCES
Anonymous. (1984). Sowing Equip-ment-Test Methods.-Part-1. Single Seed Drills (Precision Drills), ISO 7256/1, First Edition.
Anonymous. (1995). Tohumluklar, Patates Tohumlugu, TS 11617 April 1985. Turkish Standards In-stitute (TSE), Ankara, Turkey.
Anonymous. (2001). http://www. tarim.gov.tr/istatistikler.
Gruzcek, T., Gastol, J., Gujski, B. (1988). Influence of Seed Tuber Size and Forward Speed of Plant-ers Using the Gripping Wheel Principle on Tuber Yield and Proportion of Seed Tubers. Pro-
duction Lageung-Vermaktung von Pflanz Und Speisekartoffeln. Heft.2. 93-99.
Gupta, M.L., Vatsa, D.K., Verma, M.K. (1994). Development of Power Tiller Operated Potato Planter-Cum-Fertilizer Applica-tor. Agricultural Mechanization in Asia, Africa and Latin America (AMA), Vol: 25, No: 2.
James, W.C., Lawrence, C.H. and Shih, C.D. (1973). Yield Losses due to Missing Plants. Amer. Po-tatoto Journal. 50: 345-352.
Kanafojski, C. (1972). Reshe Land-maschinentecnik Theory Und Konstruction Der Landmashinen (D_nge-, Saund Pflanzmashinen) Veb Verlag Technik Berlin.
Misener, G.C. (1979). Relative Per-formance of Cup and Pick Type Potato Planters. Canadian Agri-cultural Engineering. Vol: 21. No: 2. December. (p:131-134)
Misener, G.C. (1982). Potato Plant-ers-Uniformity of Seed Spacing. Transaction of the ASAE. Vol: 25. No: 6. (p:1504-1505)
Rykbost, K. (1977). McCain Foods Limited 1977 Research Farm Re-port, Unpublished.
Samylov, G.I., Eremin, V.N. (1985). Reducing the Number of Misses During Potato Planting. Tekh-nika-v- Sel'skom Khozyaitstve. 5/48-49.
Sieczka, J.B., Ewing, E., Markd-wardt, E.D. (1986). Potato Planter Performance and Effects of Non-Uniform Spacing. American Po-tato Journal, Vol 63. p; 25-37.
Toader, V., Draica, C. (1983). Po-tato Planting-an Important Link in Achieving High and Constant Yield. Productia-Vegetala, Horti-cultura.1983.32/2.
■■

VOL.36 NO.2 2005 AGRICULTURAL MECHANIZATION IN ASIA, AFRICA, AND LATIN AMERICA 75
The Use of Hot Air from Room Type Coolers for Drying Agricultural Products
byTurhan KoyuncuDepartment of Agricultural Machinery,Faculty of Agriculture, Ondokuz Mayis University, 55139, SamsunTURKEY e-mail: [email protected]
Yunus PinarDepartment of Agricultural Machinery,Faculty of Agriculture, Ondokuz Mayis University, 55139, SamsunTURKEY e-mail: [email protected]
AbstractRoom type coolers are exten-
sively used for cooling or freezing foods such as fruits, vegetables, medicinal plants, milk, yogur t, eggs, meats, poultry, fish, and ice cream in developed and developing countries. This type of equipment continuously transfers heat energy from the cooling room to outside in order to keep a low temperature inside. This means that the heat, which depends on the specifications of cold rooms and environment con-ditions, is given to the atmosphere. On the other hand, several agricul-tural products are dried with hot air to increase their storage period in these countries. However, the production of hot air is expensive. Particularly, in areas that have high humidity and low solar radiation, the cost of hot air is more expensive, and the use of waste hot air during harvesting period in these regions is very important for saving energy. Therefore, the possibility of using waste heat energy from cold rooms for drying agricultural products was investigated in this research. Four different types of room coolers (T-1, T-2, T-3 and T-4), a harvesting period from May to October, and the Black Sea Region of Turkey that has high humidity and low solar ra-
diation were specifically selected for this study. The results of the study shows that the hot air produced by room type coolers is suitable for drying agricultural products. Dur-ing the harvesting period, 2390 kWh waste heat energy can be used for drying and 3249 kg moisture can be removed from the product.
IntroductionIt is imperative to have proper
cooling for storing of food to ensure maximum quality. During stor-age time, the deterioration of food is mainly inf luenced by the tem-perature and relative humidity. The cooling reduces the growth of decay organisms and reduces water loss. For this reason, it is needed to keep the food in coolers as required by on the food specifications.
Room type coolers (cold rooms or room type freezers) are extensively used for cooling of foods such as fruits, vegetables, medicinal plants, milk, yogurt, and eggs, and for freezing of foods such as meats, poultry, fish, and ice cream in most commercial and non-commercial farm businesses in developed and developing countries. These coolers transfer heat from the cool room to the atmosphere. However, the waste
heat energy given to the ambient air is usually not used. However, in many farm businesses, several agricultural products such as veg-etables, fruits, and medicinal plants are dried by using hot air for long term storage. Heat energy is sup-plied from different heat sources such as electricity, fossil fuels and solar energy to dry these products. In most developing countries, these sources of energy are expensive for many farmers.
The possibility of using waste heat energy from four different types of room coolers for drying ag-ricultural products was investigated in this study.
NomenclatureA: Surface area, m2
Cp: Constant pressure specific heat, J/(kg ºC)
d: Diameter, mh: Heat transfer convection coeffi-
cient, W/(m2 ºC)k: Thermal conductivity, W/(m ºC)L: Length, mm: Mass of air or moisture, kg M: Absolute moisture, kg moisture/
kg airm4 : Mass flow, kg/sq: Thermal power, WQ: Net heat energy, kWht: Net working time, h V: Velocity, m/s
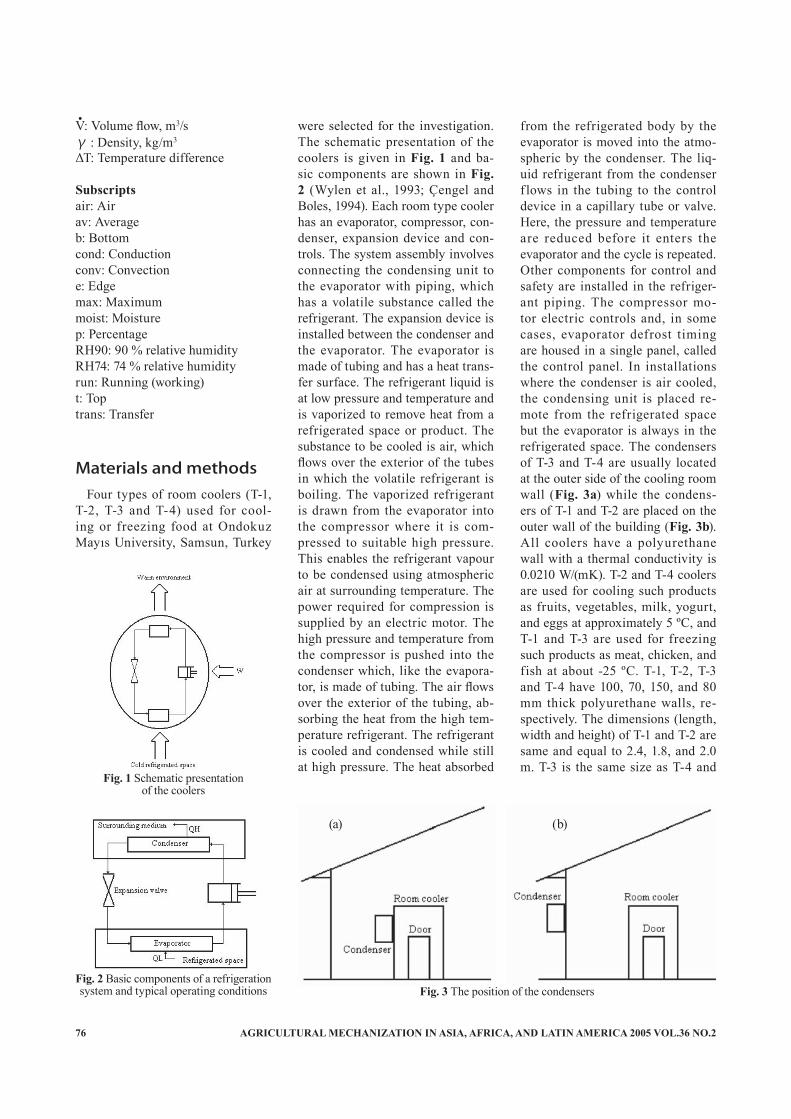
AGRICULTURAL MECHANIZATION IN ASIA, AFRICA, AND LATIN AMERICA 2005 VOL.36 NO.276
V4
: Volume flow, m3/sγ : Density, kg/m3
ΔT: Temperature difference
Subscriptsair: Airav: Averageb: Bottomcond: Conductionconv: Convectione: Edgemax: Maximummoist: Moisturep: PercentageRH90: 90 % relative humidityRH74: 74 % relative humidityrun: Running (working)t: Toptrans: Transfer
Materials and methodsFour types of room coolers (T-1,
T-2, T-3 and T-4) used for cool-ing or freezing food at Ondokuz Mayıs University, Samsun, Turkey
were selected for the investigation. The schematic presentation of the coolers is given in Fig. 1 and ba-sic components are shown in Fig. 2 (Wylen et al., 1993; Çengel and Boles, 1994). Each room type cooler has an evaporator, compressor, con-denser, expansion device and con-trols. The system assembly involves connecting the condensing unit to the evaporator with piping, which has a volatile substance called the refrigerant. The expansion device is installed between the condenser and the evaporator. The evaporator is made of tubing and has a heat trans-fer surface. The refrigerant liquid is at low pressure and temperature and is vaporized to remove heat from a refrigerated space or product. The substance to be cooled is air, which flows over the exterior of the tubes in which the volatile refrigerant is boiling. The vaporized refrigerant is drawn from the evaporator into the compressor where it is com-pressed to suitable high pressure. This enables the refrigerant vapour to be condensed using atmospheric air at surrounding temperature. The power required for compression is supplied by an electric motor. The high pressure and temperature from the compressor is pushed into the condenser which, like the evapora-tor, is made of tubing. The air flows over the exterior of the tubing, ab-sorbing the heat from the high tem-perature refrigerant. The refrigerant is cooled and condensed while still at high pressure. The heat absorbed
from the refrigerated body by the evaporator is moved into the atmo-spheric by the condenser. The liq-uid refrigerant from the condenser f lows in the tubing to the control device in a capillary tube or valve. Here, the pressure and temperature are reduced before it enters the evaporator and the cycle is repeated. Other components for control and safety are installed in the refriger-ant piping. The compressor mo-tor electric controls and, in some cases, evaporator defrost timing are housed in a single panel, called the control panel. In installations where the condenser is air cooled, the condensing unit is placed re-mote from the refrigerated space but the evaporator is always in the refrigerated space. The condensers of T-3 and T-4 are usually located at the outer side of the cooling room wall (Fig. 3a) while the condens-ers of T-1 and T-2 are placed on the outer wall of the building (Fig. 3b). All coolers have a polyurethane wall with a thermal conductivity is 0.0210 W/(mK). T-2 and T-4 coolers are used for cooling such products as fruits, vegetables, milk, yogurt, and eggs at approximately 5 ºC, and T-1 and T-3 are used for freezing such products as meat, chicken, and fish at about -25 ºC. T-1, T-2, T-3 and T-4 have 100, 70, 150, and 80 mm thick polyurethane walls, re-spectively. The dimensions (length, width and height) of T-1 and T-2 are same and equal to 2.4, 1.8, and 2.0 m. T-3 is the same size as T-4 and
Fig. 2 Basic components of a refrigeration system and typical operating conditions
Fig. 1 Schematic presentationof the coolers
Fig. 3 The position of the condensers
(a) (b)

VOL.36 NO.2 2005 AGRICULTURAL MECHANIZATION IN ASIA, AFRICA, AND LATIN AMERICA 77
πd2
4
the length, width and height are 3.6, 2.2, and 2.2 m.
The experiments were conducted at Ondokuz Mayıs University of Samsun. Situated in the Black Sea Region of Turkey at 4 m above sea level, the Samsun area has a rainy type climate with a high relative humidity. The yearly temperature is 14.40 ºC and the seasonal tempera-tures are: 21.33 ºC in summer, 16.20 ºC in autumn, 6.96 ºC in winter and 11.40 ºC in spring. The latitude and the longitude of the Samsun area are 41º 21́ N and 36º 15´ W, respec-tively. The six harvesting months of May, June, July, August, September and October in Samsun were chosen for the investigation. During these months, data related to the environ-mental conditions of Samsun were gathered from the meteorological station. In addition, the inside and outside air temperatures, surface temperatures, condenser fan capac-ity (air mass flow) and the air tem-peratures of the condensers were measured by digital instruments. In order to define the mass flow of the air from the condenser fan, a galva-nised iron sheet pipe was used (Fig. 4). The maximum velocity of the heated air and the condenser air was measured. The average velocity, the volume flow and the mass flow of the air were calculated as shown be-low (Holman, 1994).
Vav = 0.85Vmax ...................................(1)
V4
= Vav .....................................(2)
m4
=γV4
..............................................(3)
While the system of the room coolers run, the heat transfers from the cooling room to the ambient. This heat energy can be computed from the following equations (Shar-ma et al., 1991). All symbols used in the equations are described in the Nomenclature.
qrun = m4
Cp∆T.....................................(4)
The heat energy that needed to be transferred by the system (qtrans)
to keep low temperature inside the cooling room can also be found from the conduction or convection heat transfer equations given below (Fogiel, 1988).
qtrans = qcond = qconv ...........................(5)
qcond = A∆T..................................(6)
qconv = hA∆T.....................................(7)
Here, the heat transfer convection coefficient, h, for edge, top and bot-tom surfaces of the cooling room can be calculated, respectively, as given below (Fogiel, 1988).
he = 1.4 1/4
...................................(8)
ht = 0.61 1/5
.................................(9)
hb = 1.32 1/4
..............................(10)
The net working (operation) time (h/day) of the room coolers can also be calculated as seen below.
t = .....................................(11)
The percentage of the operation time is
tp = 100 ......................................(12)
The net heat energy given to the
ambient air by a condenser per day can be expressed as
Q = qrunt10-3.....................................(13)
The mass of the air heated by a condenser is
m = m4
t3600 ...................................(14)
When the produced hot air for agricultural drying is used, it is pos-sible to remove moisture from the product. The mass of this moisture removal from the product can be found from the equation given be-
kL
∆TL∆TL2
∆TL
qtrans24qrun
t24
Cooler types
qrun(W)
qtrans(W)
t(h/day)
tp(%)
m (kg air/day)
q (kWh/day)
mmoist (kgmoist/day)
T-1 340 187 13.2 55 1,452 4.49 6.09T-2 340 69 4.87 20 536 1.66 2.25T-3 340 203 14.33 60 1,576 4.87 6.62T-4 340 98 6.92 29 761 2.35 3.19
Cooler types
qrun(W)
qtrans(W)
t(h/day)
tp(%)
m (kg air/day)
q (kWh/day)
mmoist (kgmoist/day)
T-1 340 202 14.26 59 1,569 4.85 6.59T-2 340 91 6.42 27 706 2.18 2.96T-3 340 219 15.46 64 1,701 5.26 7.14T-4 340 129 9.10 38 1,001 3.09 4.20
Cooler types
qrun(W)
qtrans(W)
t(h/day)
tp(%)
m (kg air/day)
q (kWh/day)
mmoist (kgmoist/day)
T-1 340 160 11.29 47 1,242 3.84 5.22T-2 340 40 2.82 12 310 0.96 1.30T-3 340 174 12.28 51 1,351 4.17 5.67T-4 340 54 3.81 16 419 1.29 1.76
Table 3 Results for July for selected room type coolers
Table 2 Results for June for selected room type coolers
Table 1 Results for May for selected room type coolers
Fig. 4 Connection of the galvanized iron sheet pipe to the condenser
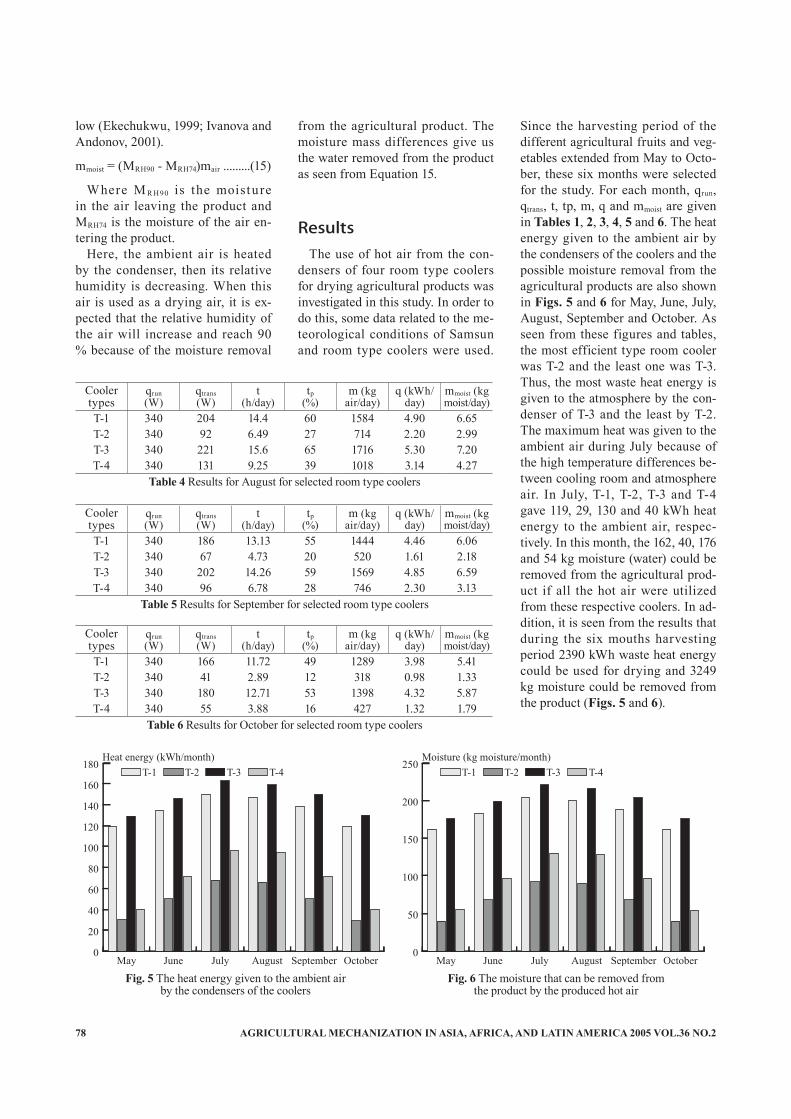
AGRICULTURAL MECHANIZATION IN ASIA, AFRICA, AND LATIN AMERICA 2005 VOL.36 NO.278
low (Ekechukwu, 1999; Ivanova and Andonov, 2001).
mmoist = (MRH90 - MRH74)mair .........(15)
Where M R H90 is the moisture in the air leaving the product and MRH74 is the moisture of the air en-tering the product.
Here, the ambient air is heated by the condenser, then its relative humidity is decreasing. When this air is used as a drying air, it is ex-pected that the relative humidity of the air will increase and reach 90 % because of the moisture removal
0
20
40
60
80
100
120
140
160
180T-4
T-3
T-2
T-1
OctoberSeptemberAugustJulyJuneMay0
50
100
150
200
250T-4
T-3
T-2
T-1
OctoberSeptemberAugustJulyJuneMay
Cooler types
qrun(W)
qtrans(W)
t(h/day)
tp(%)
m (kg air/day)
q (kWh/day)
mmoist (kgmoist/day)
T-1 340 186 13.13 55 1444 4.46 6.06T-2 340 67 4.73 20 520 1.61 2.18T-3 340 202 14.26 59 1569 4.85 6.59T-4 340 96 6.78 28 746 2.30 3.13
Cooler types
qrun(W)
qtrans(W)
t(h/day)
tp(%)
m (kg air/day)
q (kWh/day)
mmoist (kgmoist/day)
T-1 340 166 11.72 49 1289 3.98 5.41T-2 340 41 2.89 12 318 0.98 1.33T-3 340 180 12.71 53 1398 4.32 5.87T-4 340 55 3.88 16 427 1.32 1.79
Table 6 Results for October for selected room type coolers
Table 5 Results for September for selected room type coolers
from the agricultural product. The moisture mass differences give us the water removed from the product as seen from Equation 15.
ResultsThe use of hot air from the con-
densers of four room type coolers for drying agricultural products was investigated in this study. In order to do this, some data related to the me-teorological conditions of Samsun and room type coolers were used.
Since the harvesting period of the different agricultural fruits and veg-etables extended from May to Octo-ber, these six months were selected for the study. For each month, qrun, qtrans, t, tp, m, q and mmoist are given in Tables 1, 2, 3, 4, 5 and 6. The heat energy given to the ambient air by the condensers of the coolers and the possible moisture removal from the agricultural products are also shown in Figs. 5 and 6 for May, June, July, August, September and October. As seen from these figures and tables, the most efficient type room cooler was T-2 and the least one was T-3. Thus, the most waste heat energy is given to the atmosphere by the con-denser of T-3 and the least by T-2. The maximum heat was given to the ambient air during July because of the high temperature differences be-tween cooling room and atmosphere air. In July, T-1, T-2, T-3 and T-4 gave 119, 29, 130 and 40 kWh heat energy to the ambient air, respec-tively. In this month, the 162, 40, 176 and 54 kg moisture (water) could be removed from the agricultural prod-uct if all the hot air were utilized from these respective coolers. In ad-dition, it is seen from the results that during the six mouths harvesting period 2390 kWh waste heat energy could be used for drying and 3249 kg moisture could be removed from the product (Figs. 5 and 6).
Fig. 5 The heat energy given to the ambient air by the condensers of the coolers
Cooler types
qrun(W)
qtrans(W)
t(h/day)
tp(%)
m (kg air/day)
q (kWh/day)
mmoist (kgmoist/day)
T-1 340 204 14.4 60 1584 4.90 6.65T-2 340 92 6.49 27 714 2.20 2.99T-3 340 221 15.6 65 1716 5.30 7.20T-4 340 131 9.25 39 1018 3.14 4.27
Table 4 Results for August for selected room type coolers
Fig. 6 The moisture that can be removed from the product by the produced hot air

VOL.36 NO.2 2005 AGRICULTURAL MECHANIZATION IN ASIA, AFRICA, AND LATIN AMERICA 79
ConclusionsThe general conclusion is that the
hot air produced by different types of room coolers can easily be used for drying agricultural products in Samsun conditions. During the six mouths harvesting period 2390 kWh heat energy can be saved for drying and 3249 kg moisture can be removed from the product by using the selected room type coolers of this experiments.
REFERENCES
Çengel , Y. Bole s , M. (1994). Thermodynamics. Chap. 5, pp. 239-277. In: The Second Law of
Thermodynamics. McGraw-Hill, Inc., Princeton Road, S-1, Hight-stown, NJ 08520.
Ekechukwu, O. V. (1999). Review of Solar-Energy Drying Sys-tems I: An Overview of Drying Principles and Theory. Energy Conversion and Management, 40: 593-613.
Fogiel, M. (1988). The Heat Trans-fer Problem Solver. Chap. 2 and 6, pp. 43-111 and311-330, In: Steady State
Heat Conduction and Free Convec-tion Heat Transfer. Research and Education Association, 61 Ethel Road West Piscataway, New Jer-sey, 08854.
Holman, J. P. (1994). Experimental Methods for Engineers. Chap. 7,
pp. 260-313, In: Flow Measure-ment. McGraw-Hill Inc., New York.
Ivonava, D. Andonov, K. (2001). Analy t ical and Exper imental Study of Combined Fruit and Veg-etable Dryer. Energy Conversion and Management, 42 : 975-983.
Sharma, V. K., Sharma, S. Garg, H. P. (1991). Mathematical Modeling and Experimantal Evaluation of Natural Convection Type Solar Cabinet Dryer. Energy Conver-sion and Management, 31: 65-73.Wylen, G. V., Sonntag, R. Borg-
nakke, C. (1993). Fundamentals of Classical Thermodynamics. Chap. 6, pp. 193-222. In: The Second Law of Thermodynamics. John Wiley and Sons, Inc., Canada. ■■
Linus U. Opara, PhD CEngAssociate Professor, Agricultural Engineering & Postharvest Technology
Director, Agricultural Experiment StationSultan Qaboos University
Muscat, Sultanate of Oman
Formerly, Program Director (Engineering Technology)Massey University, New Zealand
Has extensive international experience in agricultural engineering and postharvest technol-ogy development in many countries in the South Pacific, Africa, China, South East Asia, and the Middle East. Worked as Visiting Expert and Consultant for the UN Food and Agriculture Organisation before taking up his current job. Was a principal author of the 1989-2004 Agricul-tural Mechanisation Development Plan of the Federal Republic of Nigeria.
Founding Editor-in-Chief, International Journal of Postharvest Technology & Innovation.Associate Editor, Agricultural Engineering International: The CIGR Journal of Scientific Re-
search & Development.
New Co-operating Editor

AGRICULTURAL MECHANIZATION IN ASIA, AFRICA, AND LATIN AMERICA 2005 VOL.36 NO.280
Effect of Mechanization Level and Crop Rotation on Yield Energy Requirements
byS.K. DashAssociate ProfessorDepartment of Farm Machinery and Power, College of Agric. Engineering and Technology, Orissa University of Agriculture and Technology,Bhubaneswar, OrissaINDIA
D.K. DasProfessor and HeadDepartment of Farm Machinery and Power, College of Agric. Engineering and Technology, Orissa University of Agriculture and Technology,Bhubaneswar, OrissaINDIA
AbstractThis experiment was conducted
for three farming systems, four lev-els mechanization and under three crop rotations. The mechanization level had significant effect on yield, human energy, indirect energy, and total energy and crop rotation had significant effect on indirect energy and total energy for paddy crop. The significant effect of both mechanization level and crop rota-tion were marked on yield, human energy, indirect energy and total en-ergy for groundnut and mung crop. The highest yield of 26.25 q/ha was obtained under T3R2 treatment for paddy crop. The T3R3 treatment showed the highest yield of 13.78 q/ha and 7.05 q/ha of groundnut and mung crop respectively.
IntroductionDevelopment and application of
energy resources are the key com-ponents for higher level of agricul-tural production. The source of en-ergy that goes into the production of crops includes material inputs such as seed, fertilizer, manure, insecti-cides and mechanical energy along with human and bullock power spent on executing the production
process. Energy requirements in ag-riculture vary mainly due to many factors such as the types of farming system, farm activities, area under cultivation, level of technology ad-opted, agro-climatic condition and crop rotation. The farm power acts as one of the most important factors for execution, of a multiple cropping programme.
Panesar and Bhatnagar (1987) developed energy coefficients for both animate and inanimate energy sources taking many aspects into consideration. Sing et al. (1975) studied energy input requirements of different rabi and kharif crops in various forms of mechanization. The result revealed that an increased level of mechanization will permit a reduction in cost of total production input, an increase in total energy in-put, and a reduction in labour input on a crop unit basis. Sing and Mittal (1991) reported that the total energy input for paddy crop varied from 19249 to 35096 mj/ha and was low-est on marginal farms and highest on medium farms. For wheat crop it was 4615 to 5979 mj/ha under rain-fed conditions and 17964 to 19778 mj/ha under irrigated condition.
The energy inputs in agriculture have a composite constitution inte-grating the human and animal labour with mechanical power. These com-
ponents of direct energy combined with indirect energy due to use of machines form the total energy input for crop production. Adequate infor-mation is not available on the pattern of energy utilization for crop produc-tion. The present research work was conducted to provide information about the effect of different levels of mechanization on yield and energy requirements for different crop under various crop rotations.
Materials and MethodsThe field experiment was con-
ducted at the Central Farm of Orissa University of Agriculture and Tech-nology, Bhubaneswar. It is in the East and Southeastern coastal plain agro-climatic zone of the state and situated between 18º 46' and 20º 95' North latitude and between 83º 48' and 87º 3' East Longitude. The aver-age rainfall of this zone is 1340 mm and about 74 % of the annual rain-fall is received during the months from June to September. The physi-cal characteristics of the soil of the experimental site were sandy loam, a bulk density 1.55 g/cc, a field ca-pacity of 15 %, a permanent wilting point of 6 %, and a hydraulic con-ductivity 0.25 m/day.
The experimental design was
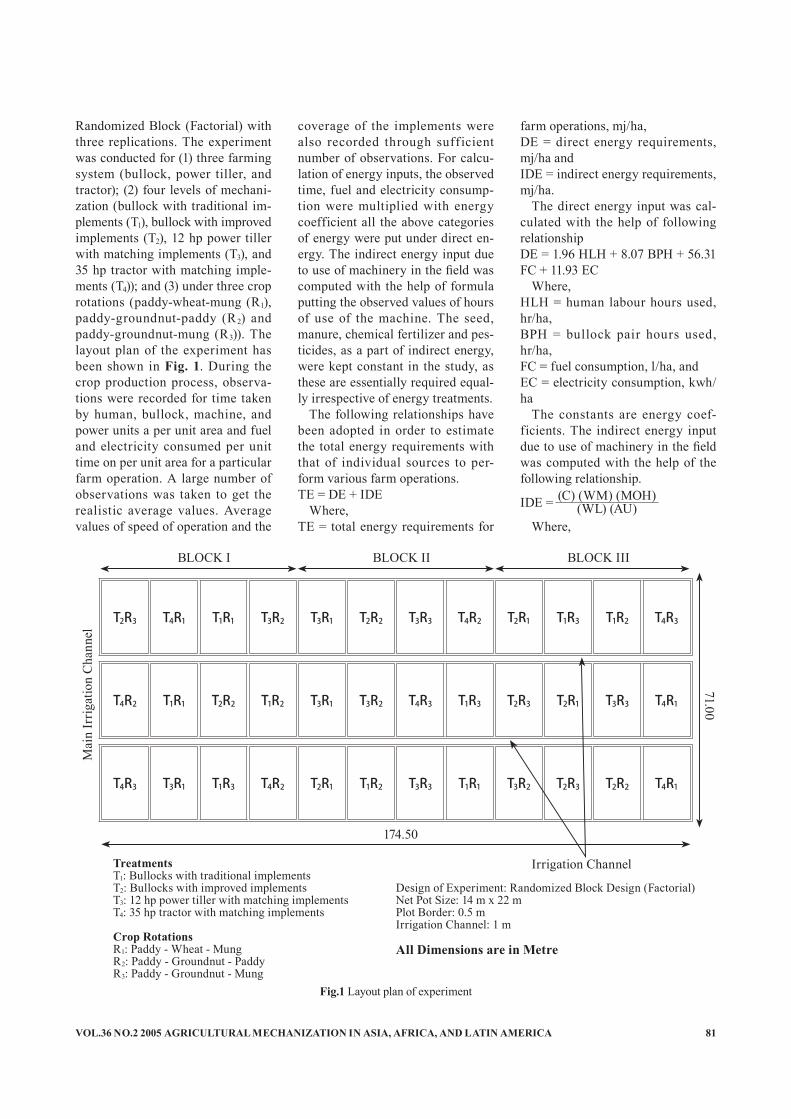
VOL.36 NO.2 2005 AGRICULTURAL MECHANIZATION IN ASIA, AFRICA, AND LATIN AMERICA 81
Randomized Block (Factorial) with three replications. The experiment was conducted for (1) three farming system (bullock, power tiller, and tractor); (2) four levels of mechani-zation (bullock with traditional im-plements (T1), bullock with improved implements (T2), 12 hp power tiller with matching implements (T3), and 35 hp tractor with matching imple-ments (T4)); and (3) under three crop rotations (paddy-wheat-mung (R1), paddy-groundnut-paddy (R2) and paddy-groundnut-mung (R3)). The layout plan of the experiment has been shown in Fig. 1. During the crop production process, observa-tions were recorded for time taken by human, bullock, machine, and power units a per unit area and fuel and electricity consumed per unit time on per unit area for a particular farm operation. A large number of observations was taken to get the realistic average values. Average values of speed of operation and the
coverage of the implements were also recorded through sufficient number of observations. For calcu-lation of energy inputs, the observed time, fuel and electricity consump-tion were multiplied with energy coefficient all the above categories of energy were put under direct en-ergy. The indirect energy input due to use of machinery in the field was computed with the help of formula putting the observed values of hours of use of the machine. The seed, manure, chemical fertilizer and pes-ticides, as a part of indirect energy, were kept constant in the study, as these are essentially required equal-ly irrespective of energy treatments.
The following relationships have been adopted in order to estimate the total energy requirements with that of individual sources to per-form various farm operations.TE = DE + IDE
Where,TE = total energy requirements for
farm operations, mj/ha,DE = direct energy requirements, mj/ha andIDE = indirect energy requirements, mj/ha.
The direct energy input was cal-culated with the help of following relationshipDE = 1.96 HLH + 8.07 BPH + 56.31 FC + 11.93 EC
Where,HLH = human labour hours used, hr/ha,BPH = bullock pair hours used, hr/ha,FC = fuel consumption, l/ha, andEC = electricity consumption, kwh/ha
The constants are energy coef-ficients. The indirect energy input due to use of machinery in the field was computed with the help of the following relationship.
IDE =
Where,
Mai
n Ir
rigat
ion
Cha
nnel
71.00
T2R3 T4R1 T1R1 T3R2 T3R1 T2R2 T3R3 T4R2 T2R1 T1R3 T1R2 T4R3
T4R2 T1R1 T2R2 T1R2 T3R1 T3R2 T4R3 T1R3 T2R3 T2R1 T3R3 T4R1
T4R3 T3R1 T1R3 T4R2 T2R1 T1R2 T3R3 T1R1 T3R2 T2R3 T2R2 T4R1
174.50
BLOCK I BLOCK II BLOCK III
Irrigation ChannelTreatmentsT1: Bullocks with traditional implementsT2: Bullocks with improved implementsT3: 12 hp power tiller with matching implementsT4: 35 hp tractor with matching implements
Crop RotationsR1: Paddy - Wheat - MungR2: Paddy - Groundnut - PaddyR3: Paddy - Groundnut - Mung
Design of Experiment: Randomized Block Design (Factorial)Net Pot Size: 14 m x 22 mPlot Border: 0.5 mIrrigation Channel: 1 m
All Dimensions are in Metre
Fig.1 Layout plan of experiment
(C) (WM) (MOH)(WL) (AU)

AGRICULTURAL MECHANIZATION IN ASIA, AFRICA, AND LATIN AMERICA 2005 VOL.36 NO.282
C = energy coefficient, mj/kg of machine,WM = weight of the machine, kg,MOH= machine operation hour, hr,WL = wear out life of the machine, hr andAU = annual use of the machine, hr
The total energy requirements for a particular farm operation has been expressed as TE = HE + BE + ME + EE + IDE (machine)
Where, HE, BE, ME, EE and IDE are human, bullock, mechanical, electrical and indirect energy re-spectively.
Results and DiscussionStatistical analysis of observed
data such as yield, human energy, indirect energy and total energy inputs under different field experi-
Treatments Grain yieldq/ha
Human energymj/ha
Indirect energymj/ha
Total energymj/ha
T1 24.83 3,234.01 116.66 7,073.65T2 25.38 1,972,53 244.94 5,065.94T3 26.14 1,600.75 242.17 6,021.26T4 25.61 1,582.26 377.17 6,207.10SEM (±) 0.11 2.07 1.11 1.76LSD (P=0.05) 0.33 6.26 3.25 5.35
Crop rotationR1 25.51 2,096.11 238.47 6,086.97R2 25.48 2,097.66 244.50 6,091.98R3 25.48 2,098.38 252.74 6,097.00SEM (±) 0.09 1.79 0.96 1.53LSD (P=0.05) 0.28 5.43 2.82 4.63
InteractionT1R1 24.81 3,229.62 111.53 7,067.38T1R2 24.81 3,235.13 116.30 7,073.65T1R3 24.87 3,237.30 122.17 7,079.91T2R1 25.69 1.972.47 236.80 5,059.44T2R2 25.23 1.972.53 242.02 5,065.94T2R3 25.24 1.972.59 256.02 5,072.44T3R1 25.93 1.599.07 235.70 6,018.42T3R2 26.25 1.600.75 243.06 6,021.26T3R3 26.18 1,602.42 247.75 6,024.09T4R1 25.58 1,583.28 369.85 6,202.64T4R2 25.62 1,582.26 376.62 6,207.10T4R3 25.63 1,581.24 385.04 6,211.56SEM (±) 0.187 3.577 1.920 3.053LSD (P=0.05) 0.566 10.850 5.631 9.262
Table 1 Grain yield, human energy, indirect energy and total energy requirement for paddy crop under different energy treatments and crop rotations
ments was made. The results were tested for significance by ‘F’ test. The effect of various treatments and crop rotation and their interac-tion were analyzed. The appropriate standard error of means (SEM) and least significant difference (LSD) were calculated at 5 % level of sig-nificance and presented in Table 1 through 3 for paddy, groundnut and mung crops.
The analysis of the result for paddy crop showed that the level of mechanization has significant effect on yield, human energy, and indi-rect energy whereas crop rotation has significant effect on indirect energy and total energy only. It does not have significant effect on yield and direct energy. All the treatments had significantly higher yield over T1 due to the fact that good puddle soil could not be achieved by puddling with country plough. The yield ob-
tained under T3 mechanization level was significantly higher than T4, T2 and T1. With respect to interaction, T3R3 gave the highest yield.
Groundnut crop was grown in two rotations. The analysis of the results showed that the level of mechaniza-tion and crop rotation had signifi-cant effect on yield, human energy, indirect energy and total energy in-puts. The average yield under the T3 treatment was the highest followed by T4, T2 and T1 treatments since the average soil mean weight diameter was observed to be the best. This allowed the preparation of a good seedbed with reduced human en-ergy. In the case of indirect energy and total energy, T4 treatment con-sumed the highest followed by T2, T3 and T1 and T1T3 and T2 respectively. This is because the tractor system for the groundnut crop required more tillage operation for seedbed preparation than the power tiller. The interaction had a significant ef-fect on total energy and the highest yield was obtained in the T3R3 en-ergy treatment.
Unlike groundnut the mung crop was grown under two rotations (R1 and R3). The highest yield was ob-tained in the T3 treatment followed by T2, T4 and T1. Similarly yield un-der the R3 rotation was significantly higher than the R1 crop rotation. The T1 energy treatment consumed the highest amount of human en-ergy followed by T2, T3 and T4 due to fact that most of the operations for mung crop were performed by hu-man labour. The wheat and summer paddy were grown in one crop rota-tion each. The highest yields were obtained in the T3 treatment for both the crops.
While analyzing the energy re-quirements operation-wise, it was seen that the irrigation energy has the major share of the in total ener-gy requirement. It varied for differ-ent crops under most of the mecha-nization levels due to the fact that the crops grown in rabi and summer season required more irrigation.
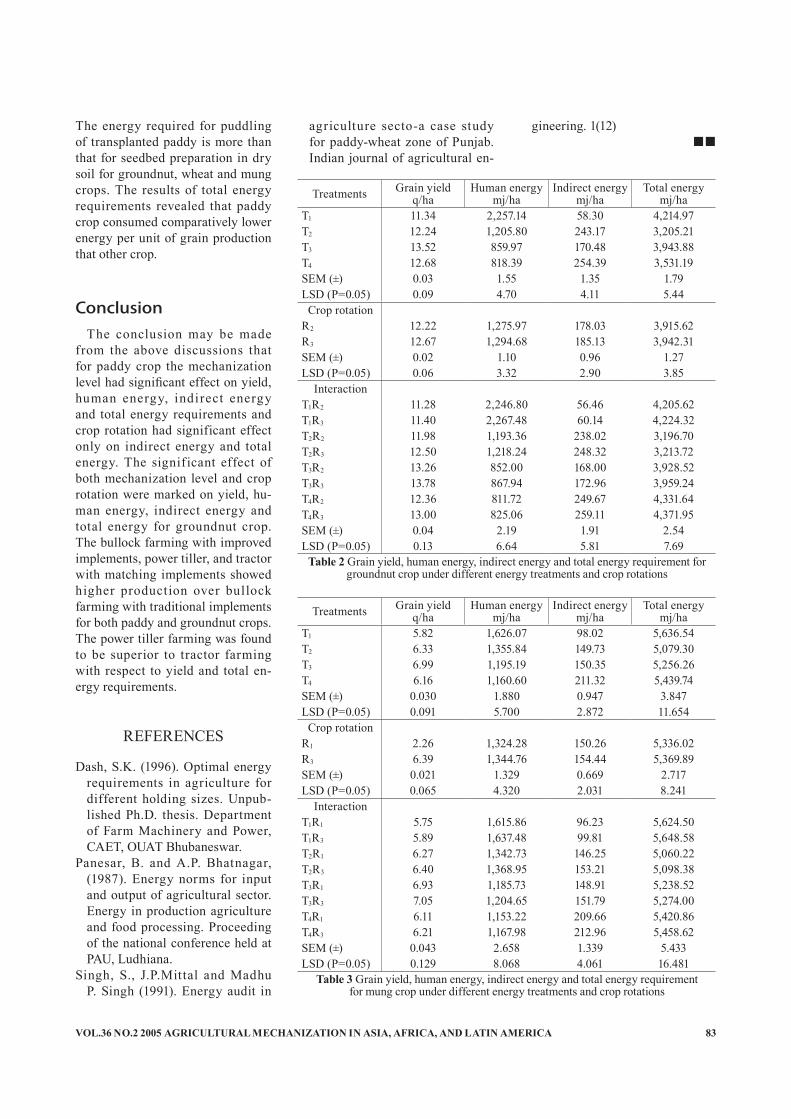
VOL.36 NO.2 2005 AGRICULTURAL MECHANIZATION IN ASIA, AFRICA, AND LATIN AMERICA 83
Treatments Grain yieldq/ha
Human energymj/ha
Indirect energymj/ha
Total energymj/ha
T1 5.82 1,626.07 98.02 5,636.54T2 6.33 1,355.84 149.73 5,079.30T3 6.99 1,195.19 150.35 5,256.26T4 6.16 1,160.60 211.32 5,439.74SEM (±) 0.030 1.880 0.947 3.847LSD (P=0.05) 0.091 5.700 2.872 11.654
Crop rotationR1 2.26 1,324.28 150.26 5,336.02R3 6.39 1,344.76 154.44 5,369.89SEM (±) 0.021 1.329 0.669 2.717LSD (P=0.05) 0.065 4.320 2.031 8.241
InteractionT1R1 5.75 1,615.86 96.23 5,624.50T1R3 5.89 1,637.48 99.81 5,648.58T2R1 6.27 1,342.73 146.25 5,060.22T2R3 6.40 1,368.95 153.21 5,098.38T3R1 6.93 1,185.73 148.91 5,238.52T3R3 7.05 1,204.65 151.79 5,274.00T4R1 6.11 1,153.22 209.66 5,420.86T4R3 6.21 1,167.98 212.96 5,458.62SEM (±) 0.043 2.658 1.339 5.433LSD (P=0.05) 0.129 8.068 4.061 16.481
Table 3 Grain yield, human energy, indirect energy and total energy requirementfor mung crop under different energy treatments and crop rotations
Treatments Grain yieldq/ha
Human energymj/ha
Indirect energymj/ha
Total energymj/ha
T1 11.34 2,257.14 58.30 4,214.97T2 12.24 1,205.80 243.17 3,205.21T3 13.52 859.97 170.48 3,943.88T4 12.68 818.39 254.39 3,531.19SEM (±) 0.03 1.55 1.35 1.79LSD (P=0.05) 0.09 4.70 4.11 5.44
Crop rotationR2 12.22 1,275.97 178.03 3,915.62R3 12.67 1,294.68 185.13 3,942.31SEM (±) 0.02 1.10 0.96 1.27LSD (P=0.05) 0.06 3.32 2.90 3.85
InteractionT1R2 11.28 2,246.80 56.46 4,205.62T1R3 11.40 2,267.48 60.14 4,224.32T2R2 11.98 1,193.36 238.02 3,196.70T2R3 12.50 1,218.24 248.32 3,213.72T3R2 13.26 852.00 168.00 3,928.52T3R3 13.78 867.94 172.96 3,959.24T4R2 12.36 811.72 249.67 4,331.64T4R3 13.00 825.06 259.11 4,371.95SEM (±) 0.04 2.19 1.91 2.54LSD (P=0.05) 0.13 6.64 5.81 7.69
Table 2 Grain yield, human energy, indirect energy and total energy requirement for groundnut crop under different energy treatments and crop rotations
The energy required for puddling of transplanted paddy is more than that for seedbed preparation in dry soil for groundnut, wheat and mung crops. The results of total energy requirements revealed that paddy crop consumed comparatively lower energy per unit of grain production that other crop.
ConclusionThe conclusion may be made
from the above discussions that for paddy crop the mechanization level had significant effect on yield, human energy, indirect energy and total energy requirements and crop rotation had significant effect only on indirect energy and total energy. The significant effect of both mechanization level and crop rotation were marked on yield, hu-man energy, indirect energy and total energy for groundnut crop. The bullock farming with improved implements, power tiller, and tractor with matching implements showed higher production over bullock farming with traditional implements for both paddy and groundnut crops. The power tiller farming was found to be superior to tractor farming with respect to yield and total en-ergy requirements.
REFERENCES
Dash, S.K. (1996). Optimal energy requirements in agriculture for different holding sizes. Unpub-lished Ph.D. thesis. Department of Farm Machinery and Power, CAET, OUAT Bhubaneswar.
Panesar, B. and A.P. Bhatnagar, (1987). Energy norms for input and output of agricultural sector. Energy in production agriculture and food processing. Proceeding of the national conference held at PAU, Ludhiana.
Singh, S., J.P.Mittal and Madhu P. Singh (1991). Energy audit in
agriculture secto-a case study for paddy-wheat zone of Punjab. Indian journal of agricultural en-
gineering. 1(12)■■
AGRICULTURAL MECHANIZATION IN ASIA, AFRICA, AND LATIN AMERICA 2005 VOL.36 NO.284
Simple Quality Evaluation of Chili Pepper Based on Continuous Weight Measurement During Dehydration Process
byTeguh Wikan WidodoGraduate StudentDepartment of Bioregulation Studies, Graduate School of Agriculture, Tokyo University of Agriculture1-1-1, Sakuragaoka, Setagaya, TokyoJAPAN
J. TatsunoLectureLaboratory of Agricultural Robotics,Tokyo University of AgricultureJAPAN
E. SakaguchiAssociate ProfessorLaboratory of Agricultural Process Engineering,Tokyo University of AgricultureJAPAN
H. IshidaAssociate ProfessorJunior College, Department of Nutrition,Tokyo University of AgricultureJAPAN
K. TajimaLectureLaboratory of Agricultural Robotics,Tokyo University of AgricultureJAPAN
K. TamakiProfessorRobotic Agricultural Research Center (RARC),Tokyo University of AgricultureJAPAN
AbstractExperiments using a continuous
and nondestructive weighing system successfully identified drying-rate patterns of chili pepper during the dehydration processes. The quality factors of moisture-content unifor-mity, pungency, color, rehydration capacity, and water activity, were analyzed to identify the correlation between drying-rate patterns and product quality. The dehydration process with highest drying rate re-sulted in the best quality of product. These facts accorded with an axiom that moisture mobility inside the pod and moisture evaporation from surface of chili pepper pods dur-ing dehydration process has a rela-tion ship to the quality of product.
Therefore, weight changes of chili pepper during dehydration would be possible for quality evaluation.
IntroductionBackground
Dehydration of chili pepper is necessary to make products such as oleoresin, food colorant, medi-cine, and spice. It is important to control the dehydration process of chili peppers because the qual-ity attributes of color, nutritional content, and rehydration capacity depend on process conditions. De-hydration process requirements to obtain good-quality products are as follows: a suitable temperature, tempering/continuing of the dehy-
dration process, product agitation for improvement of heat transfer, and the porous structure expansion (Govindarajan, 1985; Holdsworth, 1986; Heldman and Lund, 1992).
Generally, the three basic types of drying processes that are rec-ognized and used for industry are sun drying, solar drying, and atmo-spheric drying (Jayaraman and Das Gupta, 1992). Quality improvement by introducing process technology in an industrial-scale dryer is costly because of facility, and energy use expenses. Appropriate technology with low-cost operation and energy saving is considered appropriate for the dehydration process of chili pepper for improving product qual-ity. The sun-drying method is com-monly used in developing countries

VOL.36 NO.2 2005 AGRICULTURAL MECHANIZATION IN ASIA, AFRICA, AND LATIN AMERICA 85
because it is simple and low cost. However, this method results in inconsistent product quality, espe-cially moisture content uniformity. Therefore, a dryer with product agitation during the process may be useful for quality improvement.
Dehydration of agricultural prod-ucts is an energy-intensive opera-tion. In the agro-food industry, the dehydration process takes about 10 % of the total energy used in the sector (Mujumdar, 1998; Iguaz, et al., 2002). High price and shortage of fossil fuels increase the empha-sis on the use of solar energy as an alternative energy source. Solar energy is becoming an important alternative source of energy because it is in abundance it is inexhaustible, it has no pollution, and it has a low cost of operation.
Based on the requirements for improving quality of the product, energy use, and operation cost, a rotary-type dryer was considered the most appropriate in comparison with other factory dryer types (Luh and Jasper, 1981). In the dehydration process with a rotary-type dryer, the product was circulated and agitated to improve heat transfer and expand the bulk. Circulation and agitation increased moisture uniformity and decreased both the dehydration time
and heat loss (Hui, 1992; Armstrong, 2000). However, a rotary-type dryer required signifi cant energy to rotate the drum and agitate the product. Therefore, some consideration has been given to the use of solar-elec-tric power for rotation, agitation and heating air inside a glasshouse sys-tem (Trim and Ko, 1982; Carnegie, 1991; Ahmad and Khan, 1997).
Quality changes during the dehy-dration process are closely related to the mobility of moisture in the material and the evaporation of moisture from the material surface (Hui, 1992; Okos, et al., 1992). The resultant weight loss may be cor-related to quality. A continuous and nondestructive weighing system with a laboratory scale rotary-type dryer for measuring weight changes of chili pepper during dehydration was introduced by Widodo, et al., 2001. This experiment has investi-gated the relationship between the weight changes of chili pepper dur-ing the dehydration processes and quality of the product.
ObjectivesThe objectives of this study were
as follows:1. To test the continuous and non-
destructive weighing system in a rotary-type dryer for dehydration of chili pepper under several process conditions.
2. To evaluate the chili pepper quality using a scoring method with several quality factors.
3. To relate the weight changes of chili pepper during dehydration to the quality.
Experimental Material and Methods Dehydration Process
Dehydration of chili pepper (Cap-sicum annuum L. cv. nikkou) was conducted under several process conditions using a laboratory scale rotary-type dryer with a continuous nondestructive weighing system, as shown in Fig. 1. The average room temperature and relative humidity were 20 ºC and 25 %, respectively. Each experimental trial used 2 kg of fresh chili pepper with initial moisture content between 40 % and 70 % w.b.. The chili pepper was
Experiment Dehydration process conditionsM T B V R
D-1 1 1 0 2 2D-2 2 1 0 2 2D-3 3 1 0 2 2D-4 4 1 0 2 2D-5 1 3 0 2 2D-6 1 2 1 2 2D-7 1 2 1 1 2D-8 1 2 1 2 1D-9 1 2 0 2 2
Fig.1 Experimental Apparatus: (1) blower- heater, (2) plenum chamber, (3) dehydration drum,(4) measurement system
Where,M=1: dehydration drum rotation for 5 minutes and stopping for 30 min.M=2: dehydration drum rotation for 10 minutes and stopping for 20 min.M=3: dehydration drum rotation for 15 minutes and stopping for 15 min.M=4: dehydration drum rotates continuouslyT=1: dehydration process with drying air temperature of 60 ºCT=2: dehydration process with drying air temperature of 70 ºCT=3: dehydration process with drying air temperature of 80 ºCB=0: pre-drying treatment without chili pepper blanchingB=1: pre-drying treatment with chili pepper blanchingV=1: dehydration process with airfl ow rates of 2 m/sV=2: dehydration process with airfl ow rates of 4 m/sR=1: rotation speed of dehydration drum of 2 rpmR=2: rotation speed of dehydration drum of 4 rpm
Table 1 Dehydration process conditions
4
2
3
1
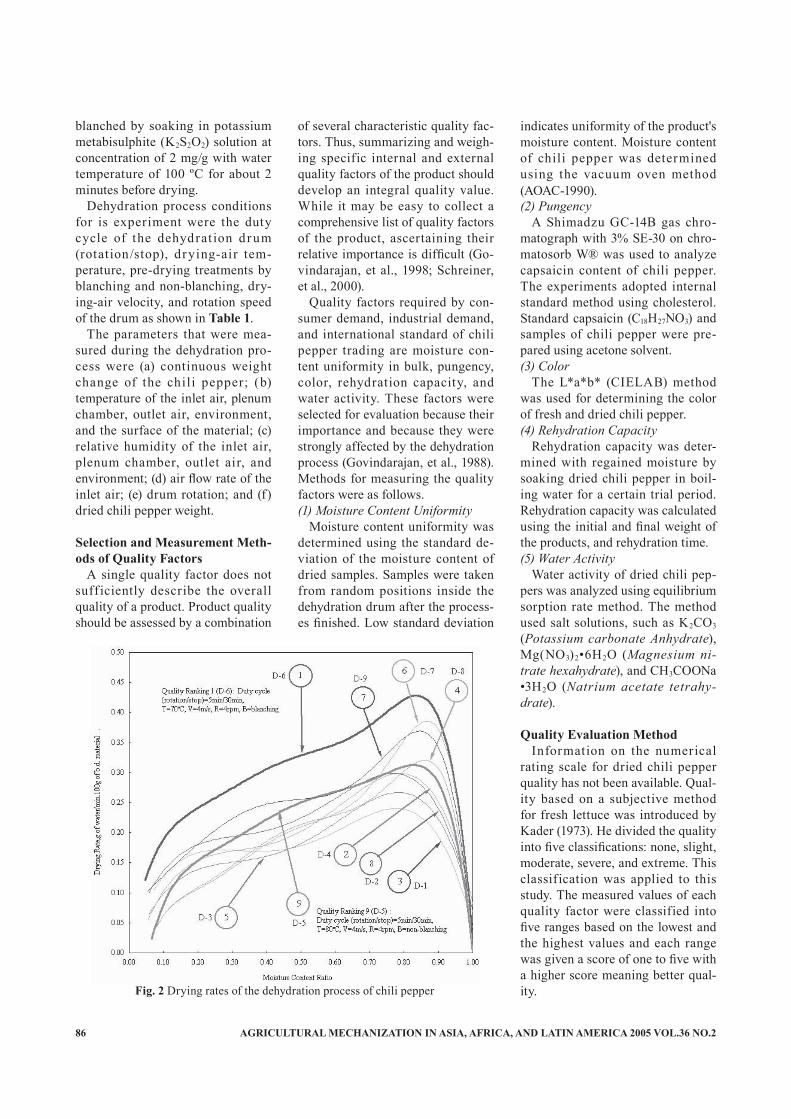
AGRICULTURAL MECHANIZATION IN ASIA, AFRICA, AND LATIN AMERICA 2005 VOL.36 NO.286
blanched by soaking in potassium metabisulphite (K2S2O2) solution at concentration of 2 mg/g with water temperature of 100 ºC for about 2 minutes before drying.
Dehydration process conditions for is experiment were the duty cycle of the dehydrat ion drum (rotation/stop), drying-air tem-perature, pre-drying treatments by blanching and non-blanching, dry-ing-air velocity, and rotation speed of the drum as shown in Table 1.
The parameters that were mea-sured during the dehydration pro-cess were (a) continuous weight change of the chili pepper; (b) temperature of the inlet air, plenum chamber, outlet air, environment, and the surface of the material; (c) relative humidity of the inlet air, plenum chamber, outlet air, and environment; (d) air flow rate of the inlet air; (e) drum rotation; and (f) dried chili pepper weight.
Selection and Measurement Meth-ods of Quality Factors
A single quality factor does not suff iciently describe the overall quality of a product. Product quality should be assessed by a combination
of several characteristic quality fac-tors. Thus, summarizing and weigh-ing specific internal and external quality factors of the product should develop an integral quality value. While it may be easy to collect a comprehensive list of quality factors of the product, ascertaining their relative importance is difficult (Go-vindarajan, et al., 1998; Schreiner, et al., 2000).
Quality factors required by con-sumer demand, industrial demand, and international standard of chili pepper trading are moisture con-tent uniformity in bulk, pungency, color, rehydration capacity, and water activity. These factors were selected for evaluation because their importance and because they were strongly affected by the dehydration process (Govindarajan, et al., 1988). Methods for measuring the quality factors were as follows.(1) Moisture Content Uniformity
Moisture content uniformity was determined using the standard de-viation of the moisture content of dried samples. Samples were taken from random positions inside the dehydration drum after the process-es finished. Low standard deviation
indicates uniformity of the product's moisture content. Moisture content of chili pepper was determined using the vacuum oven method (AOAC-1990).(2) Pungency
A Shimadzu GC-14B gas chro-matograph with 3% SE-30 on chro-matosorb W® was used to analyze capsaicin content of chili pepper. The experiments adopted internal standard method using cholesterol. Standard capsaicin (C18H27NO3) and samples of chili pepper were pre-pared using acetone solvent. (3) Color
The L*a*b* (CIELAB) method was used for determining the color of fresh and dried chili pepper.(4) Rehydration Capacity
Rehydration capacity was deter-mined with regained moisture by soaking dried chili pepper in boil-ing water for a certain trial period. Rehydration capacity was calculated using the initial and final weight of the products, and rehydration time.(5) Water Activity
Water activity of dried chili pep-pers was analyzed using equilibrium sorption rate method. The method used salt solutions, such as K2CO3 (Potassium carbonate Anhydrate), Mg(NO3)2•6H2O (Magnesium ni-trate hexahydrate), and CH3COONa•3H2O (Natrium acetate tetrahy-drate).
Quality Evaluation MethodInformation on the numerical
rating scale for dried chili pepper quality has not been available. Qual-ity based on a subjective method for fresh lettuce was introduced by Kader (1973). He divided the quality into five classifications: none, slight, moderate, severe, and extreme. This classification was applied to this study. The measured values of each quality factor were classified into five ranges based on the lowest and the highest values and each range was given a score of one to five with a higher score meaning better qual-ity.Fig. 2 Drying rates of the dehydration process of chili pepper
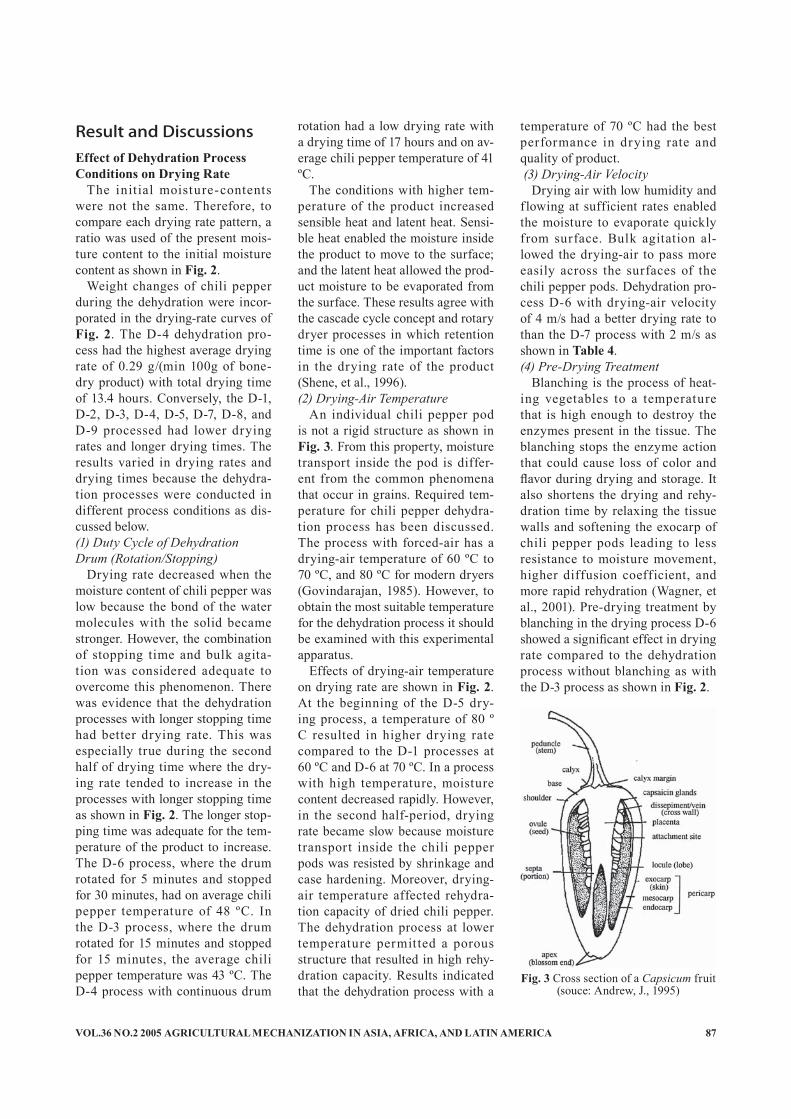
VOL.36 NO.2 2005 AGRICULTURAL MECHANIZATION IN ASIA, AFRICA, AND LATIN AMERICA 87
Result and DiscussionsEffect of Dehydration Process Conditions on Drying Rate
The init ial moisture-contents were not the same. Therefore, to compare each drying rate pattern, a ratio was used of the present mois-ture content to the initial moisture content as shown in Fig. 2.
Weight changes of chili pepper during the dehydration were incor-porated in the drying-rate curves of Fig. 2. The D-4 dehydration pro-cess had the highest average drying rate of 0.29 g/(min 100g of bone-dry product) with total drying time of 13.4 hours. Conversely, the D-1, D-2, D-3, D-4, D-5, D-7, D-8, and D-9 processed had lower drying rates and longer drying times. The results varied in drying rates and drying times because the dehydra-tion processes were conducted in different process conditions as dis-cussed below.(1) Duty Cycle of Dehydration Drum (Rotation/Stopping)
Drying rate decreased when the moisture content of chili pepper was low because the bond of the water molecules with the solid became stronger. However, the combination of stopping time and bulk agita-tion was considered adequate to overcome this phenomenon. There was evidence that the dehydration processes with longer stopping time had better drying rate. This was especially true during the second half of drying time where the dry-ing rate tended to increase in the processes with longer stopping time as shown in Fig. 2. The longer stop-ping time was adequate for the tem-perature of the product to increase. The D-6 process, where the drum rotated for 5 minutes and stopped for 30 minutes, had on average chili pepper temperature of 48 ºC. In the D-3 process, where the drum rotated for 15 minutes and stopped for 15 minutes, the average chili pepper temperature was 43 ºC. The D-4 process with continuous drum
rotation had a low drying rate with a drying time of 17 hours and on av-erage chili pepper temperature of 41 ºC.
The conditions with higher tem-perature of the product increased sensible heat and latent heat. Sensi-ble heat enabled the moisture inside the product to move to the surface; and the latent heat allowed the prod-uct moisture to be evaporated from the surface. These results agree with the cascade cycle concept and rotary dryer processes in which retention time is one of the important factors in the drying rate of the product (Shene, et al., 1996).(2) Drying-Air Temperature
An individual chili pepper pod is not a rigid structure as shown in Fig. 3. From this property, moisture transport inside the pod is differ-ent from the common phenomena that occur in grains. Required tem-perature for chili pepper dehydra-tion process has been discussed. The process with forced-air has a drying-air temperature of 60 ºC to 70 ºC, and 80 ºC for modern dryers (Govindarajan, 1985). However, to obtain the most suitable temperature for the dehydration process it should be examined with this experimental apparatus.
Effects of drying-air temperature on drying rate are shown in Fig. 2. At the beginning of the D-5 dry-ing process, a temperature of 80 ºC resulted in higher drying rate compared to the D-1 processes at 60 ºC and D-6 at 70 ºC. In a process with high temperature, moisture content decreased rapidly. However, in the second half-period, drying rate became slow because moisture transport inside the chili pepper pods was resisted by shrinkage and case hardening. Moreover, drying-air temperature affected rehydra-tion capacity of dried chili pepper. The dehydration process at lower temperature permitted a porous structure that resulted in high rehy-dration capacity. Results indicated that the dehydration process with a
temperature of 70 ºC had the best performance in drying rate and quality of product. (3) Drying-Air Velocity
Drying air with low humidity and f lowing at sufficient rates enabled the moisture to evaporate quickly from surface. Bulk agitation al-lowed the drying-air to pass more easily across the surfaces of the chili pepper pods. Dehydration pro-cess D-6 with drying-air velocity of 4 m/s had a better drying rate to than the D-7 process with 2 m/s as shown in Table 4. (4) Pre-Drying Treatment
Blanching is the process of heat-ing vegetables to a temperature that is high enough to destroy the enzymes present in the tissue. The blanching stops the enzyme action that could cause loss of color and flavor during drying and storage. It also shortens the drying and rehy-dration time by relaxing the tissue walls and softening the exocarp of chili pepper pods leading to less resistance to moisture movement, higher diffusion coefficient, and more rapid rehydration (Wagner, et al., 2001). Pre-drying treatment by blanching in the drying process D-6 showed a significant effect in drying rate compared to the dehydration process without blanching as with the D-3 process as shown in Fig. 2.
Fig. 3 Cross section of a Capsicum fruit(souce: Andrew, J., 1995)

AGRICULTURAL MECHANIZATION IN ASIA, AFRICA, AND LATIN AMERICA 2005 VOL.36 NO.288
Quality EvaluationIn the final analysis, after numer-
ous date had been compiled, statisti-cal analysis was needed to examine the correlation among groups and overall date. However, in this case, with only several experimental tri-als, the quality factors have been simply placed into a relative range of values from one to five with five indicating the highest quality.
Color (L*a*b*) was used for cal-culating the color difference (ΔE) as
Experiment Total color difference, ∆E
D-1 1.54D-2 1.78D-3 1.51D-4 1.55D-5 3.41D-6 1.13D-7 1.89D-8 2.28D-9 1.93
shown in Table 2. These values in Table 2 were placed into five ranges (Table 3) based on the lowest to the highest value of ΔE. The lower val-ues of ΔE indicate the highest qual-ity product and are assigned a value of five.
The subjective values of the other quality factors are shown in Table 4. To evaluate the correlation be-tween drying-rate patterns of the chili pepper during the dehydra-tion process and product quality, only the clear distinction among the curves that had good product qual-ity were considered. Dehydration process D-6 had the highest drying rate and the highest quality score and was given a quality ranking of one as shown in Fig. 2.
ConclusionQuality evaluation of chili pepper
after the dehydration processes, at different process conditions, using a laboratory scale rotary-type dryer led to the following conclusions.
1. Experiments using a continuous and nondestructive weighing system successfully identified drying-rate patterns of chili pepper during de-hydration.
2. Quality factors that included moisture-content uniformity, pun-gency, color, rehydration capacity,
and water activity, were analyzed to determine the correlation between drying-rate patterns and product quality. Among experimental trials, the dehydration process with high-est drying rate resulted in the best quality of product.
3. These facts support the axiom that moisture mobility inside the pod and the moisture evaporation from the surface of chili pepper pods during the dehydration process is related to the quality of the prod-uct. Therefore, weight changes of chili pepper during the dehydration process would identify quality.
REFERENCES
Ahmad, M. and Khan, A.S. (1997). Design and Construction of Solar Grain and Fruit Drying System. Agricultural Mechanization in Asia, Africa and Latin America, Vol. 28, No.4., 62-66.
Andrews, J. (1995). Peppers: The Domesticated Capsicums - New Edit ion. University of Texas Press, Austin.
Armstrong, et al. (2000). Rotary Drying for Threshing Petals from Marigold Flowers. Transactions of the ASAE, Vol. 4(2), 379-384.
Carnegie, E.J. (1991): Solar Fruit Drying in Solar Energy in Ag-riculture edited by Parker, B.F.
Range of total color difference, ∆E Score
1.13 - 1.69 51.70 - 2.26 42.27 - 2.83 32.84 - 3.40 23.41 - 3.57 1
Table 3 Evaluation of chili peppers color by scoring method
Table 2 Measurement result ofchili peppers color
Experiment Score by drying rate*
Quality factors**Moisture contents
uniformityPungency Color Rehydration
capacityWater
activity Total score Quality ranking
D-1 1 2 4 5 3 1 15 3D-2 2 2 2 4 3 2 13 8D-3 1 3 3 5 2 2 15 5D-4 1 5 5 5 3 2 20 2D-5 1 3 3 1 1 2 10 9D-6 5 4 4 5 5 5 23* 1D-7 1 1 3 4 3 3 14 6D-8 1 3 4 3 3 2 15 4D-9 2 3 1 4 3 3 14 7
*Drying rates were calculated using experimental date, i.e., initial moisture content, weight measurement during dehydration process, and drying time.
**Total score of general evaluations were 25 for the best and 5 for the worst quality. Among experiment results, dehydration process D-6 with total score of 23 and quality ranking 1 resulted in the best quality of product.
Table 4 Drying rates and quality factors ranking at different dehydration process conditions
VOL.36 NO.2 2005 AGRICULTURAL MECHANIZATION IN ASIA, AFRICA, AND LATIN AMERICA 89
Elsevier, New York, 335-349.Govindarajan, V.S. (1985). Cap-
sicum-Production, Technology, Chemistry, and Quality. Part I: History, Botany, Cultivation, and Primary Processing. CRC Critical Reviews in Food Science and Nu-trition, Vol. 22, Issue 2, 109-176.
Govindarajan, V.S. (1988). Cap-sicum-Production, Technology, Chemistry, and Quality. Part IV: Evaluat ion of Qual i t y. CRC Critical Reviews in Food Science and Nutrition, Vol. 25, Issue 3, 185-282.
Heldman D. R. and Lund, D. B. (1992). Dehydration. Handbook of Food Engineer ing. Marcel Dekker, Inc., New York, 437-562.
Holdsworth, S.D. (1986): Advances in the Dehydration of Fruits and Vegetables in Concentration and Drying of Foods by Carthy, D.M. Elsevier Applied Science Publish-ers, New York, 293-303.
Hui, Y. H.(1992). Encyclopedia of Food Science and Technology. Vol. 1 (A-D). John Wiley & Sons, Inc. New York, 556-574.
Iguaz, A., Lopez, A., and Virseda, A. (2002). Influence of air recy-cling on the performance of a con-tinuous rotary dryer for vegetable wholesale by-products. Journal of Food Engineering., Volume 54, Issue 4, 289-297.
Jayaraman, K.S. and Das Gupta, D.K. (1992). Dehydration of Fruits and Vegetables-Recent Develop-ments in Principles and Tech-niques. Drying Technology, 10(1), 1-50.
Kader, A.A., Lipton, W.J., and Mor-ris, L.L.(1973). System for Scor-ing Quality of Harvested Lettuce. Hortscience, Vol. 8(5), 408-409.
Luh, B. S. and Jasper, G. W. (1981): Vegetables Dehydration in Com-mercial Vegetable Processing. The AVI Publishing Company, West-port, Connecticut, 387- 473.
Mujumdar, A. S.(1998). Drying Fun-damentals. Proceeding of ASEAN Seminar and Workshop on Drying Technology 3-5 June 1998, Phit-
sanulok, Thailand, 161-193.Okos, M.R., et al. (1992). Food De-
hydration, in Handbook of Food Engineering edited by Heldman, D.R. and Lund, D.B., Marcel Dekker Inc., New York, 437-562.
Schreiner, M., et al. (2000). Envi-ronment Effects on Product Qual-ity in Fruit and Vegetable Qual-ity (An integrated View edited by Shewfelt, R.L. and Br_ckner, B. Technomic Publishing Co. Inc., Lancaster, 85-95.
Shene, C., et al. (1996). Modelling and Simulation of A Direct Con-tact Rotary Dryer. Drying Tech-nology, 14(10), 2419-2433.
Widodo, Teguh Wikan et al. (2001). Continuous and Nondestructive Weighing System of the Dehydra-tion Process of Chili Pepper in Application with a Rotary Type Dryer. Journal of the Society of Agricultural Structures, Japan. Vol. 32, No. 1, 1-10.
Trim and Ko (1982). Development of a forced convection solar dryer for red pepper. Trop. Agric. (Trini-dad), Vol. 59, No.4, 319-323.
Wagner, M.K., et al. (2001). Con-sumer and Family Sciences: Dry-ing Food and Nutrition. Purdue University, 1-13. Adapted by Mason, A.C., et al. http://www. agriculture.purdue.edu/Ag.comm.
■■

AGRICULTURAL MECHANIZATION IN ASIA, AFRICA, AND LATIN AMERICA 2005 VOL.36 NO.2 90
ABSTRACTS The ABSTRACTS pages is to introduce the abstracts of the article which cannot be published in whole contents owing to the limited publication space and so many contributions to AMA. The readers who wish to know the contents of the article more in detail are kindly requested to contact the authors.
264Application of Machine Vision in Evaluating Stem of
Fruits: Ying Yibin, Executive Dean and Professor, College of Biosystems Engineering, Zhejiang University, Hangzhou, Zhejiang 310029, P.R. China, Hansong Jing, Ph.D. Candi-date, Dept. of Biological Resource Engineering, University of Maryland, College Park, Maryland 20742, USA, Jin Juan-qin, Associate Professor, College of Biosystems Engineer-ing, Zhejiang University, Hangzhou, Zhejiang 310029, P.R. China.
Huanghua pear is an important fruit in China. The condition of pear stem is an important index in the clas-sification of Huanghua pear. Images of Huanghua pears were taken by a machine vision system. The median fil-tering method was used to smooth the image, and the lo-cal threshold algorithm was adopted to segment the pear from the background. As the normally used thinning and erosion-dilation algorithm in judging the presence of the stem is too slow, a new fast algorithm was put forward. Compared with other part of the pear, the stem is obvi-ously thin and long, with the help of various sized tem-plates, the judgement of whether the stem is present was easily done, meanwhile the stem head and the intersec-tion point of stem bottom and pear were labeled. Further-more, after the slopes of the tangential line of stem head and tangential line of stem bottom were calculated, the included angle of these two lines was determined. It was found that the included angle of the broken stem could be distinguished from that of the good stem. The algorithm for judging the presence and integrity of stems was effec-tive. The accuracies for stem presence and stem integrity were 100 % and 93 %, respectively. Also, the algorithm is of robustness and can be made invariant to translation and rotation.
273Field Performance Evaluation of a Low Land Paddy
Weeder: S.K. Swain, Training Associate (Agril. Engg.), Krishi Vigyan Kendra, Baliapal, Balasore, Orissa, India, S.C. Prad-han, Associate Professor, Dept. of FMP, CAET, OUAT, Bhu-baneswar, Orissa, India, N. Mohapatra, same.
A floating type CAET low land paddy weeder (Fig. 1) was developed in College of Agricultural Engineering and Technology. This is a simple, low cost, push-pull type manual weeder and is easy to operate. Its perfor-mance was compared with the Japanese Rake weeder in sandy loam soil condition for paddy variety Parijat at Central Farm, OUAT. The actual field capacity of the CAET weeder was found to be 0.0145 ha/hr with field efficiency of 85.89 %, weeding index of 88.79 % and performance index of 1254.88. The cost of operation of
this weeder was Rs. 276.22 per ha. Considering the pa-rameters for evaluation such as actual field capacity, field efficiency, weeding index, plant damage, performance index and cost of operation the CAET weeder was found to be superior to the Japanese weeder and manual hand weeding method. The performance of CAET weeder with respect to actual field capacity and weeding index was superior to that of Japanese weeder when operated by dif-ferent operators.
Fig. 1 CAET low land weeder
276Trough System of Withering for Black Tea Manufacture
an Introductory Overview: Samir Kumar Das, Research Scholar, Dept. of Agricultural and Food Engineering, IIT, Kharagpur, PIN-721302, WB, India, V.K. Tewari, Associate Professor, same.
The trough system of withering has proved to be far more advantageous than other batch withering systems like Loft and Drum systems; also in many respects than some continuous systems like Tat and Tunnel systems, and has been popularly adopted in the black tea manu-facturing countries. Open type withering trough was first developed and used, but more convenient enclosed type evolved later through development efforts. An introduc-

VOL.36 NO.2 2005 AGRICULTURAL MECHANIZATION IN ASIA, AFRICA, AND LATIN AMERICA 91
tory, comprehensive description of the trough withering system, based on literature review and practical observa-tions has been given.
279Study of the Farm Accidents on Different Agriculture
Farms of District Hyderabad, Sindh, Pakistan: A.A. Chan-nar, Associate Professor and Chairman, Department of Farm Power and Machinery, Faculty of Agricultural Engi-neering, Sindh Agriculture University Tandojam, Sindth, Pakistan, Syed Gulzar Ali Shah, Associate Professor, De-partment of Energy and Environment, same, Muhammad Siddique Memon, M.E (Agri.), qualify, Department of Farm Power and Machinery, same, Sheeraz Hussain Memom, B.E (Agri.), Department of Farm Power and Machinery, same.
The study to investigate the nature and type of farm ac-cidents on small, medium and large sized farms. 20 farm owners were interviewed about the type of accidents, which occurred on farms. The main features of farm were that tractor operators on all farms were uneducated and untrained.
Total number of accidents recorded on 20 farms were 29, out of which 06 accidents occurred on small farms, 09 accidents occurred on medium forms and 14 accidents occurred on large farms. The number of accidents caused by tractors were 05, threshers 07; farm implements and machinery 07; tube wells 02, sprayers 02; tractor and trolley 05 and hydraulic system 01. The injuries recorded due to 29 accidents were 24 temporary injuries and 5 per-manent injuries.
312Systematic Analysis and Optimization of Grain Post-
production Operation Patterns in South China: Zheng Wen-zhong, Assoc. Professor, Ph. Doctor, College of Bio-system Engineering and Food Science, Zhejiang Univer-sity, Hangzhou 310029, Zhejiang, P.R. China, He Yong, Pro-fessor and Head, same.
Based on the analysis of present situation and charac-teristics of grain postproduction system using four index-es, i.e. cost, efficiency, grain quantity loss and grain qual-ity indexes in Zhejiang province, P. R. China, a dynamic program model was put forward to optimize the process of grain postproduction patterns. According to the results optimization, some improved patterns were put forward, and comparison analysis between three improved pat-terns and three basic patterns shown that the improved patterns have higher efficiency, less losses, and higher rate of benefit to cost. The study results will help farmer and governor to make best choice and improvement of technology and equipment for grain postproduction treat-ment operation.
364Trends in Indian Flue Cured Virginia Tobacco (Nicotiana
Tobaccum) Harvesting, Curing and Grading: A. Manicka-vasagan, Ph. D. Scholar and FCV tobacco expert, Depart-ment of Biological and Agricultural Engineering, Faculty of Engineering, University Putra Malaysia, Malaysia, J. John Gunasekar, Assistant Professor and FCV tobacco expert, Department of Bio Energy, Tamil Nadu Agricultural Univer-sity, Coimbatore - 641 003, India, P. Doraisamy, Professor (Microbiology), Department of Environmental Science, same.
This paper describes the present scenario of post har-vest technologies in Indian FCV tobacco. There are many unit operations involved between harvesting of leaves and processing. Each stage demands skill and experience to produce quality end product. The quality specifications in the tobacco processing factories are higher than that of some food processing industries. Here, FCV tobacco harvesting, curing and grading in Indian context are well discussed in detail. The potential area for research in the processing of FCV tobacco is also given.
365Trends in Indian Flue Cured Virginia Tobacco (Nicotiana
Tobaccum) Threshing, Curing and Grading: A. Manicka-vasagan, Ph. D. Scholar and FCV tobacco expert, Depart-ment of Biological and Agricultural Engineering, Faculty of Engineering, University Putra Malaysia, Malaysia, J. John Gunasekar, Assistant Professor and FCV tobacco expert, Department of Bio Energy, Tamil Nadu Agricultural Univer-sity, Coimbatore - 641 003, India, P. Doraisamy, Professor (Microbiology), Department of Environmental Science, same.
This paper gives detailed account of post graded tech-nology such as threshing, packing and warehousing of In-dian FCV tobacco. Different parameter specifications and equipments used are discussed elaborately. The quality specifications in the tobacco threshing are very stringent and are very difficult to adhere. The potential area for re-search and development in threshing and packing of FCV tobacco is also discussed.
374Methodology for Estimation of Over Exploitation of
Ground Water Resources: AK. Singh, The University of the South Pacific, Private Mail Bag, Alafua Campus, Apia, Sa-moa, M.W. Ullah, same.
In the present context of the sustainable development of agriculture with special reference to crop production it is very essential to manage the ground water resources. Therefore, a periodic estimation of annual demand of wa-ter requirement for crop production will lead to prudent planning without affecting future usage. This paper at-tempts to put forward a simple method for the calculation of such demand which contributed the planners to take future steps in making decisions for water usage without over exploiting the ground water resources.

AGRICULTURAL MECHANIZATION IN ASIA, AFRICA, AND LATIN AMERICA 2005 VOL.36 NO.2 92
399Test Study on Main Parameters of Air-screen Cleaning
Mechanism: Fang Cheng, Assistant Professor, Department of Biosystems Engineering and Food Science, Zhejiang University, Hangzhou, P.R. China, Jun Wang, Professor, same, Zhaoyan Liu, Graduate Student, same.
The effects of structure and motion parameters of air-screen cleaning mechanism on its cleaning performance are presented. Each cleaning target get worse as the crank radius became larger. The lipped sieve opening should be selected mainly according to the impurity ratio after cleaning. A mathematic model was established and the optimum combination of parameters was obtained. The validation tests show good result with regard to the predi-cation values. The effects of materials state and feed rate on performance are analyzed also. The results provide reference basis for practical design and utilization of the air-screen cleaning mechanism.
493Hand Transmitted Vibration of Walking and Riding
Type Power Tillers: Bini Sam, Asst. Professor (FPM), Kerala Agricultural University, Farming Systems Research Station, Sadanandapuram, Kottarakkara, Kerala 691550, India, K. Kathirvel, Prof. and Head, AEC & RI, TNAU, Coimbatore, In-dia, R.Manian, Dean, same.
The ergonomic aspects of power tiller are of great im-portance as the operator of a power tiller has to endure various environment and stress. Excessive vibration and
noise level are the important shortcomings in power til-ler design. The hand transmitted vibration (HTV) of walking type (7.46 kW) and riding type (8.95 kW) power tillers were measured and analyzed with respect to expo-sure time as per the guidelines of International standards ISO 5349 (1986). The operations included rototilling in untilled and tilled field conditions at 1.5, 1.8, 2.1 and 2.4 km/h forward speeds and transporting at 3.5, 4.0, 4.5 and 5.0 km/h forward speeds on farm road and bitumen road. Acceleration levels increased with forward speed of travel under all operating conditions. The HTV during rototilling of 7.46 kW power tiller in untilled field varied from 3.43 to 5.26 m/s2 restricting the exposure time from 1/2 to 1 h to < 1/2 h. In tilled field the values were 2.66 to 4.55 m/s2 and 1 to 2 h to < 1/2 h respectively. For 8.95 kW power tiller, HTV varied from 3.31 to 5.09 m/s2 with an exposure time of 1 to 2 h to < 1/2 h. Among the power tillers walking type power tiller registered 3.62 to 4.11 % higher values of vibration. The HTV and exposure time during transport with 7.46 kW power tiller on farm road varied from 2.21 to 3.61 m/s2 and 2 to 4 h to 1/2 to 1 h. During transport with 8.95 kW power tiller on farm road HTV and exposure time varied from 2.72 to 3.66 m/s2 and 1 to 2 h to 1/2 to 1 h with the increase in forward speed. The latent period or the duration of exposure necessary before the onset of vascular symptoms, characterized by finger blanching for 10 percentiles of an exposed popula-tion varied from 4.04 to 8.23 years during rototilling and 5.79 to 12.73 years during transport.
■■
REMINDER
The reminder might run something like this:
THE AMA EDITORIAL STAFF WILL APPRECIATE RECEIVING ARTICLES FOR PUBLICATION TYPED DOUBLE-SPACE AND NOT REDUCED IN SIZE.
FARM MACHINERY INDUSTRIAL RESEARCH CORP.7-2 Kanda Nishikicho, Chiyoda-ku, Tokyo, Japan (Tel.81-(0)3-3291-5718, 3671~4)
E-mail: [email protected] URL: http://www.shin-norin.so.jp
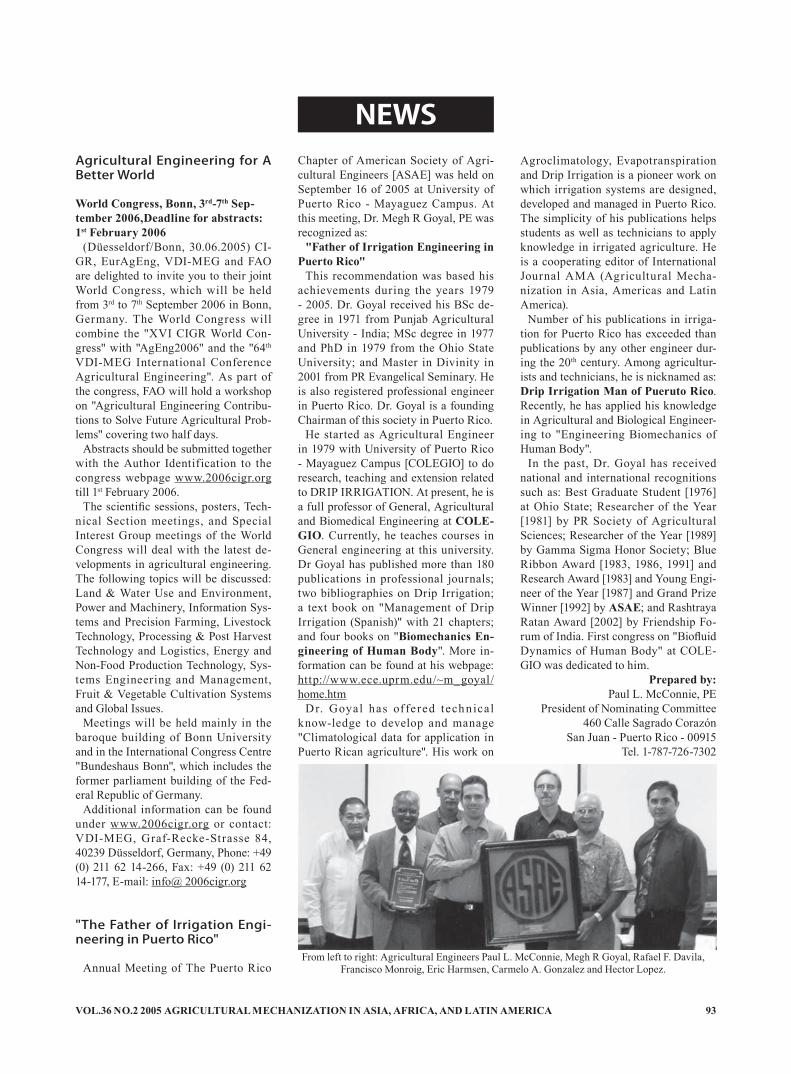
VOL.36 NO.2 2005 AGRICULTURAL MECHANIZATION IN ASIA, AFRICA, AND LATIN AMERICA 93
Agricultural Engineering for A Better World
World Congress, Bonn, 3rd-7th Sep-tember 2006,Deadline for abstracts: 1st February 2006
(Düesseldorf/Bonn, 30.06.2005) CI-GR, EurAgEng, VDI-MEG and FAO are delighted to invite you to their joint World Congress, which will be held from 3rd to 7th September 2006 in Bonn, Germany. The World Congress will combine the "XVI CIGR World Con-gress" with "AgEng2006" and the "64th
VDI-MEG International Conference Agricultural Engineering". As part of the congress, FAO will hold a workshop on "Agricultural Engineering Contribu-tions to Solve Future Agricultural Prob-lems" covering two half days.
Abstracts should be submitted together with the Author Identification to the congress webpage www.2006cigr.org till 1st February 2006.
The scientific sessions, posters, Tech-nical Section meetings, and Special Interest Group meetings of the World Congress will deal with the latest de-velopments in agricultural engineering. The following topics will be discussed: Land & Water Use and Environment, Power and Machinery, Information Sys-tems and Precision Farming, Livestock Technology, Processing & Post Harvest Technology and Logistics, Energy and Non-Food Production Technology, Sys-tems Engineering and Management, Fruit & Vegetable Cultivation Systems and Global Issues.
Meetings will be held mainly in the baroque building of Bonn University and in the International Congress Centre "Bundeshaus Bonn", which includes the former parliament building of the Fed-eral Republic of Germany.
Additional information can be found under www.2006cigr.org or contact: VDI-MEG, Graf-Recke-Strasse 84, 40239 Düsseldorf, Germany, Phone: +49 (0) 211 62 14-266, Fax: +49 (0) 211 62 14-177, E-mail: info@ 2006cigr.org
"The Father of Irrigation Engi-neering in Puerto Rico"
Annual Meeting of The Puerto Rico
Chapter of American Society of Agri-cultural Engineers [ASAE] was held on September 16 of 2005 at University of Puerto Rico - Mayaguez Campus. At this meeting, Dr. Megh R Goyal, PE was recognized as:
"Father of Irrigation Engineering in Puerto Rico"
This recommendation was based his achievements during the years 1979 - 2005. Dr. Goyal received his BSc de-gree in 1971 from Punjab Agricultural University - India; MSc degree in 1977 and PhD in 1979 from the Ohio State University; and Master in Divinity in 2001 from PR Evangelical Seminary. He is also registered professional engineer in Puerto Rico. Dr. Goyal is a founding Chairman of this society in Puerto Rico.
He started as Agricultural Engineer in 1979 with University of Puerto Rico - Mayaguez Campus [COLEGIO] to do research, teaching and extension related to DRIP IRRIGATION. At present, he is a full professor of General, Agricultural and Biomedical Engineering at COLE-GIO. Currently, he teaches courses in General engineering at this university. Dr Goyal has published more than 180 publications in professional journals; two bibliographies on Drip Irrigation; a text book on "Management of Drip Irrigation (Spanish)" with 21 chapters; and four books on "Biomechanics En-gineering of Human Body". More in-formation can be found at his webpage: http://www.ece.uprm.edu/~m_goyal/home.htm
Dr. Goyal has of fered technical know-ledge to develop and manage "Climatological data for application in Puerto Rican agriculture". His work on
Agroclimatology, Evapotranspiration and Drip Irrigation is a pioneer work on which irrigation systems are designed, developed and managed in Puerto Rico. The simplicity of his publications helps students as well as technicians to apply knowledge in irrigated agriculture. He is a cooperating editor of International Journal AMA (Agricultural Mecha-nization in Asia, Americas and Latin America).
Number of his publications in irriga-tion for Puerto Rico has exceeded than publications by any other engineer dur-ing the 20th century. Among agricultur-ists and technicians, he is nicknamed as: Drip Irrigation Man of Pueruto Rico. Recently, he has applied his knowledge in Agricultural and Biological Engineer-ing to "Engineering Biomechanics of Human Body".
In the past, Dr. Goyal has received national and international recognitions such as: Best Graduate Student [1976] at Ohio State; Researcher of the Year [1981] by PR Society of Agricultural Sciences; Researcher of the Year [1989] by Gamma Sigma Honor Society; Blue Ribbon Award [1983, 1986, 1991] and Research Award [1983] and Young Engi-neer of the Year [1987] and Grand Prize Winner [1992] by ASAE; and Rashtraya Ratan Award [2002] by Friendship Fo-rum of India. First congress on "Biofluid Dynamics of Human Body" at COLE-GIO was dedicated to him.
Prepared by:Paul L. McConnie, PE
President of Nominating Committee460 Calle Sagrado Corazón
San Juan - Puerto Rico - 00915Tel. 1-787-726-7302
NEWS
From left to right: Agricultural Engineers Paul L. McConnie, Megh R Goyal, Rafael F. Davila, Francisco Monroig, Eric Harmsen, Carmelo A. Gonzalez and Hector Lopez.

AGRICULTURAL MECHANIZATION IN ASIA, AFRICA, AND LATIN AMERICA 2005 VOL.36 NO.2 94
The Annual Meeting and an In-ternational Conference in Col-laboration with the "Agritech 2006" Exhibition
Tel Aviv, Israel, May 8-10, 2006
InvitationThe organizers are pleased to invite
you to participate in the Annual Meet-ing of the ISAE and the International Conference on "Advance in agricultural technologies and their economic and ecological impacts", which will be held in cooperation with the "Agritech 2006" Exhibition. You are invited also to sub-mit proposals for papers. The aim is to bring together researchers, producers and end users of agricultural equipment. Participants are asked to show their lat-est work and share their knowledge with their colleagues and all those involved in agricultural engineering. The partici-pants will have a unique chance to visit the largest show of agricultural equip-ment in the Middle East and to visit sites of professional and general interest.
TopicsThe theme of the conference encom-
passes emerging technologies in agricul-tural engineering and their economic and ecological impacts. The conference aims at highlighting technologies that were in the conceptual implementation phase.
The following topics will be consid-ered for oral and poster presentations:1.Advanced technologies in field and
greenhouse crops and their postharvest processing1.1 Precision agriculture1.2 Energy saving in greenhouses1.3 New sensors for improvement of
quality and safety of agricultural products
2. New agricultural technologies for re-duction of environmental damage2.1 Recycling and purification of ir-
rigation and sewage water2.2 Applications of GIS for agricul-
tural and environmental tasks2.3 Environment-friendly spray appli-
cationOrganizing Committee
Dr. Samuel Gan-Mor, Chairman - ARO
Mr. Yosi Kashti, Convener - AROProf. Itshak Shmulevich - TechnionProf. Yoav Sarig - AROMr. Roni Amir - AESMr. Ofer Juran - Juran Ltd.Dr. Ze'ev Schmilovitch - ARO
PapersSpeakers who wish to present papers
on the above topics are invited to submit a short abstract in English (250 words) to the head of the organizing committee:
Dr. Samuel Gan-MorE-mail: [email protected]: +972-3-9604704
Important datesDeadline for submission of abstracts is
December 15, 2005Notification of acceptance will be sent
by February 15, 2006Deadline for full short-form papers
(for inclusion in the CD ROM) - April 10, 2006Invite International Speakers
Speakers to be confirmedLanguage
English■■
Sustainable Agriculture & the In-ternational Rice-Wheat System
Autour(s):Dr. Rattan Lal - Ohio State University,
Columbus, USAProf. Peter R. Hobbs - Cornell Univer-
sity, Ithaca, New York, USANorman Uphoff - Cornell University,
Ithaca, New York, USADavid O. Hansen - Ohio State Univer-
sity, Columbus, USADetailed Description:
Addressing a topic of major impor-tance to the maintenance of world food supplies, this reference identifies knowledge gaps, defines priorities, and formulates recommendations for the improvement of the rice-wheat farming system. The book reveals new systems of rice intensification and management and illustrates the application of no-till and conservation farming to the rice-wheat system. With contributions from 65 international experts, and case stud-ies from India, Nepal, Pakistan, and
Book ReviewBangladesh, Sustainable Agriculture and residue management, weed control, water and nutrient efficiency, and inte-grated pest management.UK Pound Price: 99.00Published by:
CRC Press / Taylor & Francis Group, LLC, 6000 Broken Sound Parkway NW, Suite 3000, Boca Raton, FL33487, USA
Multi-Scale Integrated Analysis of Agroecosystems
Author(s): Dr. Mario Giampietro - Instituto Na-
zionale Richerche su Alimenti e Nuti-rizioneDetailed Description:
Ecologist, agronomists, and others who may question the validity of current models for determining growth of agro-ecosystems, need a new set of analytical tools that more effectively address the complex nature of related processes. Those who challenge assumptions of
optimization and static factors in agri-cultural modeling demand new methods beyond differential equations and tradi-tional statistical tests.
Multi-Scale Integrated Analysis of Agroecosystems explores alternative ways to study agricultural sustain-ability, presenting new approaches to organizing date and applying complex systems theory to actual cases. This in-novative text recognizes the changing dynamics of the multiple process and cross-relations within an environment, proposing a clearer analysis of agroeco-systems than that which can be provided by rigid, reductionist methods.
Main concepts, new vocabulary and narratives, and practical examples open the book, followed by technical chapters that provide a more detailed explana-tion of concepts. The final section of the book presents a tool kit based on these concepts, resulting in strong support of empirical observations that chal-lenge traditional notions regarding the sustainability of farming systems, food
VOL.36 NO.2 2005 AGRICULTURAL MECHANIZATION IN ASIA, AFRICA, AND LATIN AMERICA 95
systems, and agroecosystems.UK Pound Price: 62.99Published by:
CRC Press / Taylor & Francis Group, LLC, 6000 Broken Sound Parkway NW, Suite 3000, Boca Raton, FL33487, USA
Soils and Environmental Qual-ity, 3rd Edition
Author(s):Dr. Gary M. Pierzynski - Kansas State
University, Manhattan, Kansas, USAJ. Thomas Sims - University of Dela-
ware, Newark, Delaware, USAGeorge F. Vance - University of Wyo-
ming, Laramie, Wyoming, USADetailed Description:
What continues to make Soils and Environmental Quality a perpetual bestseller is its practical relevance. Now, with the timely release of a third edition, it remains the obvious choice for in-structors who strive to make their teach-ing applicable to contemporary issues.
The three authors, all teaching profes-sors distinguished in soil science, have updated this student favorite to include a greater number of even more relevant topics. Responding to requests, they have also placed an increased emphasis on management issues.
As with previous editions, the third edition offers students in soil or environ-mental science an overview of soil sci-ence, hydrology, atmospheric chemistry, and pollutant classification.
The text moves from the theoretical to the practical with an abundance of contemporary examples, such as an exploration of allowable pesticide con-centrations in drinking water and an inquiry into soil contamination from the trace elements in organic by-products. Also considered are the use of soil car-bon sequestration as a remedy for global climate change, and the effects of acid precipitation on forestation.
NEW TO THE THIRD EDITION:§ New chapters on nutrient manage-
ment planning, and the environmental testing of soil, plants, water, and air
§ Additional and revised case studies that continue to relate academic content to real-life situations, while inspiring students with real-life challenges to solve
§ Eight-page color inset§ Direct encouragement and links to
fully access the internet as a resource
for the most up-to-date findingsAlways Relevant, Always InterestingThe text also cover environmentally-
related current events, fostering dis-cussion of the political, economic, and regulatory aspects of environmental issues, the human side of environmen-tal problems, the use and misuse of the scientific method, and potential bias in the presentation of facts. Students in soil science, environmental science, chem-istry, biology, and other disciplines will gain valuable insight from this multifac-eted text.UK Pound Price: 32.99Published by:
CRC Press / Taylor & Francis Group, LLC, 6000 Broken Sound Parkway NW, Suite 3000, Boca Raton, FL33487, USA
Soil Sampling Preparation and Analysis, 2nd Edition
Author(s):Dr. Kim H. Tan - Emeritus Professor,
University of Georgia, USADetailed Description:
This second edition of the popular Soil Sampling, Preparation, and Analysis provides a hands-on guide to the method most commonly used in modern soil laboratories around the world, illustrat-ing the methods with actual results. Divided into three sections, the book covers principles of soil sampling and sources of errors and variability of re-sults, common producers for extraction and analysis in soil plant testing, and instrumentation. The author added three new chapters on soil and plant test meth-ods, electron microscopy, and nuclear magnetic resonance. He has extensively revised, updated and expanded all of the other chapters to reflect recent advances and shifting interest in the field.UK Pound Price: 74.99Published by:
CRC Press / Taylor & Francis Group, LLC, 6000 Broken Sound Parkway NW, Suite 3000, Boca Raton, FL33487, USA
Handbook of Ecological Indica-tors for Assessment of Ecosys-tem Health
Author(s):Dr. Sven E. Jorgensen - Royal Danish
School Pharmacy, Copenhagen, Den-mark
Dr. Fu-Liu Xu - Peking University, Beijing, People Republic of China
Dr. Robert Constanza - University of Vermont, Burlington, Vermont, USADetailed Description:
The field of ecosystem health explores the interactions between natural sys-tems, human health, and social organiza-tion. Handbook of Ecological Indicators for Assessment of Ecosystem Health is the first comprehensive account of ecological indicators for evaluating the health of a wide variety of ecosystems. It presents a conceptual framework for selecting, evaluating and validating eco-logical indicators of ecosystem health and applies this framework in a series of chapters on major ecosystem types, in-cluding coastal areas, forests, wetlands, fisheries and agricultural land. This text will be useful for a wide range of profes-sionals, including those in government agencies worldwide.UK Pound Price: 79.99Published by:
CRC Press / Taylor & Francis Group, LLC, 6000 Broken Sound Parkway NW, Suite 3000, Boca Raton, FL33487, USA
Regional Scale Ecological Risk Assessment: Using the Relative Risk Model
Author(s):Dr. Wayne G. Landis - Western Wash-
ington University, Bellingham, USADetailed Description:
Regional Scale Ecological Risk As-sessment: Using the Relative Risk Model is a collaborative summary and guide-book of the development, methods, and application of the Relative Risk Model (RRM) to meet the need for regional as-sessments with multiple stressors from diverse sources and numerous desired endpoints. Amenable to additional itera-tions as new information becomes avail-able, this assessment model is ideal for designing a dynamic management plan that can be customized to meet specific ecological needs.
Driven to expand ecological risk as-sessment to reflect the structure, func-tion, and scale of the environment, this book offers a new approach to evaluating risks at regional scales, as-sessing a variety of potential stressors within a dynamic landscape. The book proposes that using date on land use, hydrology, types of contaminants, the
AGRICULTURAL MECHANIZATION IN ASIA, AFRICA, AND LATIN AMERICA 2005 VOL.36 NO.2 96
distribution of species, and the history of disturbance can result in a computa-tion of risk gradients with in the system being managed. The calculation uses a process of setting ranks for a broad range of sources, stressors, and habitats with filters to denote exposure and ef-fect to look at a combined risk at large geographical scales. The book provides numerous real world examples of how this process works, how it is tested, and how it is used for making management decisions.
Regional Scale Ecological Risk As-sessment demonstrates the capabilities of RRM using nine case studies in the Pacific Northwest, Pennsylvania, Bra-zil, and Tasmania. This book provides detailed descriptions for each step of RRM-from the determination of assess-ment goals to documentation, evalua-tion, and communication with decision-makers-that can be practitioners in en-vironmental management, remediation, and related fields worldwide.UK Pound Price: 85.00Published by:
CRC Press / Taylor & Francis Group, LLC, 6000 Broken Sound Parkway NW, Suite 3000, Boca Raton, FL33487, USA
Soil Organic Matter Sustainable Agriculture
Author(s):Fred Magdoff - University of Vermont,
Burlington, Vermont, USADr. Ray R. Weil - University of Mary-
land, College Park, USADetailed Description:
Recognition of the importance of soil organic matter (SOM) in soil health and quality is a major part of foster-ing a holistic, preventive approach to agricultural management. Students in agronomy, horticulture, and soil science need a textbook that emphasizes strate-gies for using SOM management in the prevention of chemical, biological, and physical problems.
Soil Organic Matter in Sustainable Ag-riculture gathers key scientific reviews concerning issues that are critical for successful SOM management. This text-book contains evaluations of the types of organic soil constituents-organisms, fresh residues, and well-decomposed substances. It explores the beneficial ef-fects of organic matter on soil and the various practices that enhance SOM.
Chapters include an examination of the results of crop management practices on soil organisms, organic matter gains and losses, the significance of various SOM fractions, and the contributions of fungi and earthworms to soil quality and crop growth.
Emphasizing the prevention of im-balances that lead to soil and crop problems, the text also explores the de-velopment of soils suppressive to plant diseases and pests, and relates SOM management to the supply of nutrients to crops.
This book provides the essential scien-tific background and poses the challeng-ing questions that students need to better understand SOM and develop improved soil and crop management systems.UK Pound Price: 57.99Published by:
CRC Press / Taylor & Francis Group, LLC, 6000 Broken Sound Parkway NW, Suite 3000, Boca Raton, FL33487, USA
Engineering Design Reliability Handbook
Author(s):Efstratios Nikolaidis - University of
Toledo, Toledo, Ohio, USADan M. Ghiocel - Ghiocel Predictive
Technologies, Pittsford, New York, USASuren. Singhal - NASA Marshall
Space Flight Center, MSFC, Alabama, USADetailed Description:
Researchers in the engineering indus-try and academia are making important advances on reliability-based design and modeling of uncertainty when date is limited. Non deterministic approaches have enabled industries to save billions by reducing design and warranty costs and by improving quality.
Considering the lack of comprehen-sive and definitive presentations on the subject, Engineering Design Reliability Handbook is a valuable addition to the reliability literature. It presents the per-spectives of experts from the industry, national labs, and academia on non-deterministic approaches including probabilistic, interval and fuzzy sets-based methods, generalized information theory, Dempster-Shaffer evidence theo-ry, and robust reliability. It also presents recent advances in all important fields of reliability design including modeling of uncertainty, reliability assessment
of both static and dynamic components and systems, design decision making in the face of uncertainty, and reliability validation. The editors and the authors also discuss documented success stories and quantify the benefits of these ap-proaches.
With contributions from a team of respected international authors and the guidance of esteemed editors, this handbook is a distinctive addition to the acclaimed line of handbooks from CRC Press.UK Pound Price: 85.00Published by:
CRC Press / Taylor & Francis Group, LLC, 6000 Broken Sound Parkway NW, Suite 3000, Boca Raton, FL33487, USA
■■

VOL.36 NO.2 2005 AGRICULTURAL MECHANIZATION IN ASIA, AFRICA, AND LATIN AMERICA 97
-AFRICA-Benedict KayomboAssociate Professor of Soil and Water Engineering, Dept. of Agric. Engineering and Land Planning, Botswana College of Agriculture, University of Bo-tswana, Private Bag 0027, Gaborone, BOTSWANA.TEL(+267)-3650125, FAX(+267)-328753E-mail: [email protected]
Mathias Fru FontehAsst. Professor and Head, Dept. of Agric. Engineer-ing, Faculty of Agriculture, University of Dschang, P.O. Box 447, Dschang, West Province, CAMEROONTEL+237-45-1701/1994, FAX+237-45-2173/1932E-mail: [email protected]
Ahmed Abdel Khalek El BeheryAgric Engineering Research Institute, Agricultural Reserch Center, Nadi El-Said St. P.O. Box 256, Dokki 12311, Giza, EGYPT
Ali Mahmoud El HossarySenior Advisor to the Ministry of Agriculture and Chairman of (AGES)-Agengineering Consulting Group, Ministry of Agriculture - P.O.Box 195 Zama-lek 11211 Cairo, EGYPTTEL00-202-335-9304, FAX00-202-3494-132
B.S. PathakProject Manager, Agric. Implements Research and Improvement Centre, Melkassa, ETHIOPIA
Richard Jinks BaniLecturer & Co-ordinator, Agric. Engineering Div., Faculty of Agriculture, University of Ghana, Legon, GHANA
Israel Kofi DjokotoSenior Lecturer, University of Science and Technol-ogy, Kumasi, GHANA
David Kimutaiarap SomeProfessor, Deputy Vice-chancellor. Moi University, P.O. Box: 2405, Eldoret, KENYA
Karim HoumyProfessor and head of the Farm Mechanization Dept., Institute of Agronomy and Velerinary Medi-cine II, Secteur 13 Immeuble 2 Hay Riad, Rabat, MOROCCO, Tel+212-7-68-05-12, Fax+212-7-775801E-mail: [email protected]
Joseph Chukwugotium IgbekaProfessor, Dept. of Agricultural Engineering, Univ. of Ibadan,, Ibadan, NIGERIATEL+234-2-8101100-4, FAX+234-281030118E-mail: [email protected]
E.U, OdigbohProfessor, Agricultural Engg Dept., Faculty of En-gineering, University of Nigeria, Nsukka, Enugu state, NIGERIA, TEL+234-042-771676, FAX042- 770644/771550, E-mail: [email protected]
Kayode C. OniDirector/Chief Executive, National Centre for Agric. Mechanization (NCAM), P.M.B.1525, Ilorin, Kwara State, NIGERIATEL+234-031-224831, FAX+234-031-226257E-mail: [email protected]
N.G. KuyembehAssociate Professor, Njala University Colle, Univer-sity of Sierra Leone, Private Mail Bag, Free Town, SIERRA LEONETEL+249-778620-780045, FAX+249-11-771779
Abdien Hassan AbdounMember of Board, Amin Enterprises Ltd., P.O. Box 1333, Khartoum, SUDAN
Amir Bakheit SaeedAssoc. Professor, Dept. of Agric. Engineering, Fac-ulty of Agriculture, University of Khartoum, 310131 Shambat, SUDAN, TEL+249-11-310131
Abdisalam I. KhatibuNational Prolect Coordinafor and Direcror, FAO Ir-rigated Rice Production, Zanzibar, TANZANIA
Edward A. BaryehProfessor, Africa University, P.O.Box 1320, Mutare, ZIMBABWE
Solomon Tembo52 Goodrington Drive, PO Mabelreign,Sunridge, Harare, ZIMBABWE
-AMERICAS-Hugo Alfredo CetrangoloFull Professor and Director of Food and Agribusi-ness Program Agronomy College Buenos Aires University, Av. San Martin4453, (1417) Capital Fed-
eral, ARGENTINATEL+54-11-4524-8041/93, FAX+54-11-4514-8737/39E-mail: [email protected]
Irenilza de Alencar NääsProfessor, Agricultural Engineering College, UNI-CAMP, Agricultural Construction Dept.,P.O. Box 6011, 13081 -Campinas- S.P.,BRAZILTEL+55-19-7881039, FAX+55-19-7881010E-mail: [email protected]
A.E. GhalyProfessor, Biological Engineering Deparment Dalhousie University, P.O. Box 1000, Halifax, Nova Scotia, B3J2X4, CANADATEL+1-902-494-6014, FAX+1-902-423-2423E-mail: [email protected]
Edmundo J. HetzProfessor, Dept. of Agric. Eng. Univ. of Concepcion, Av. V.Mendez 595, P.O. Box 537, Chillan, CHILETEL+56-42-216333, FAX+56-42-275303E-mail: [email protected]
A.A. ValenzuelaEmeritus Professor, Ag. Eng. Fac., University of Concepcion,Casilla537Chillan, CHILETEL+56-42-223613, FAX+56-42-221167
Roberto AguirreAssociate Professor, National University of Colom-bia, A.A. 237, Palmira, COLOMBIATEL+57-572-2717000, FAX+57-572-2714235E-mail: [email protected]
Omar Ulloa-TorresProfessor, Escuela de Agricultura de la Region, Tropical Humeda(EARTH), Apdo. 4442- 1000, San Jose, COSTA RICATEL+506-255-2000, FAX+506-255-2726E-mail: [email protected]
S.G. Campos MaganaLeader of Agric. Engineering Dept. of the Gulf of Mexico Region of the National Institute of Forestry and Agricultural Research, Apdo. Postal 429. Vera-cruz, Ver. MEXICO
Hipolito Ortiz-LaurelHead of Agric. Engineering and Mechanization Dept./ Postgraduate College, Iturbide 73, Salinas de Hgo, S.L.P., C.P. 78600, MEXICO
B Kayombo M F Fonteh A A KEl Behery
A MEl Hossary
B S Pathak R J Bani I K Djokoto D K Some K Houmy J C Igbeka
E U-Odigboh K C Oni N GKuyembeh
A HAbdoun
A B Saeed A I Khatibu E A Baryeh S Tembo H ACetrangolo
I de A Nääs
A E Ghaly E J Hetz A AValenzuela
R Aguirre O Ulloa-Torres S G CMagana
H Ortiz-Laurel W JChancellor
M R Goyal A KMahapatra
Co-operating Editors

AGRICULTURAL MECHANIZATION IN ASIA, AFRICA, AND LATIN AMERICA 2005 VOL.36 NO.2 98
TEL+52-496-30448, FAX+52-496-30240
William J. ChancellorProfessor Emeritus, Bio. and Agr. Eng. Dept., Univ. of California, Davis, CA, 95616, U.S.A.TEL+1-530-753-4292, FAX+1-530-752-2640E-mail: [email protected]
Megh R. GoyalProf./Agric & Biomedical Engineering, Univer-sity of Puerto Rico, P.O.Box 5984, Mayaguez PR, 006815984, U.S.A.TEL+1-787-265-4702E-mail: [email protected]
Ajit K. MahapatraPresent add: Agric. & Biosystems Eng. Dept., South Dakota State Univ., P.O. Box2120 Brookings, SD 57007-1496, U.S.A.TEL605-6885291, FAX605-6886764E-mail: [email protected]
Graeme R. QuickLeader, Power & Machinery Section, 200 David-son Hall, Agricultural and Biosystems Engineer-ing Dept., Iowa State University, Ames, Iowa, 50011-3080 U.S.A.
-ASIA and OCEANIA-Shah M. FaroukProfessor (Retd.),Farm Power & Machinery Dept., Bangladesh Agricultural University, Mymensingh 2200, BANGLADESHTEL+880-91-5695ext.2596, FAX91-55810E-mail: [email protected]
Daulat HussainDean, Faculty of Agric. Engineering and Tech-nology, Bangladesh Agricultural University, My-mensingh-2202, BANGLADESHTEL+880-91-52245, FAX91-55810E-mail: [email protected]
Mohammed A. MazedMember-Director, Bangladesh Agri. Res. Council, Farmgate, Dhaka, BANGLADESHE-mail: [email protected]
Manbahadur GurungStore Officer, Bhutan Fruit Products Limited, Sam-tse, BHUTANTEL+975-65369
Wang WanjunPast Vice Director and Chief Engineer/Chinese Academy of Agricultural Mechanization Sciences,
1 Beishatan, Beijing, 100083, CHINATEL+86-(0)83-001-6488-2710, FAX001-6488-2710E-mail: [email protected]
Sarath IllangantilekeRegional Representative for South and West Asia, International Potato Center (CIP), Re-gional Office for CIP-South & West Asia, IARI (Indian Agric. Res. Institute) Campus, Pusa, New Delhe-12, 110002, INDIATEL+91-11-5719601/5731481, FAX./5731481E-mail: [email protected]
S. M. IlyasDirector of Central Institute of Post Harvest Engi-neering and Technology (CIPHET), Ludhiana. P.O., P.A.U, Ludhiana - 121004, INDIA Tel+91-161-808669, Fax:+91-161-808670E-mail: [email protected]
A.M. Michael1/64, Vattekunnam, Methanam Road, Edappally North P.O., Cochin, 682024, Kerala State, S. INDIA
T.P. OjhaDirector General(Engg.) Retd., ICAR, 110, Vineet Kung Akbarpur, Kolar Road, Bhopal, 462 023, INDIATEL+91-755-290045
S.R. VermaProf. of Agr. Eng, & Dean Eng.(Retd), 14, Good Friends Colony, Barewal Road , Via Ayoli Kalan, Lud-hiana 142027 Punjab, INDIATEL+91-(0)161-463096E-mail: [email protected]
SoedjatmikoPresident, MMAI(Indonesian Soc. of Agric. Eng. & Agroindustry), Menara Kadin Indonesia Lt.29 Jl. HR. Rasuna Said X-5/2-3 Jakarta, 12940, INDONESIATEL+62-(0)21-9168137/7560544, FAX(0)21-5274485/5274486/7561109
Mansoor Behroozi-LarProfessor, Agr. Machinery, Ph.D, Tehran University Faculty of Agriculture, Karaj, IRANTEL+98-21-8259240, E-mail: [email protected]
Saeid MinaeiAssistant Professor, Dept. of Agr. Machinery Eng., Tarbiat Modarres Univ., P.O.Box 14115-111, Tehran, IRANTEL+9821-6026522-3(office ext.2060, lab ext.2168)FAX+9821-6026524, E-mail: [email protected]
Jun SakaiProfessor Emeritus, Kyushu University, 2-31-1 Chi-haya, Higashi-ku, Fukuoka city, 813, JAPAN
TEL+81-92-672-2929, FAX+81-92-672-2929E-mail: [email protected]
Bassam A. SnobarProfessor and Vice President, Jordan University of Science and Technology, P.O.Box 3030 Irbid, 22110, JORDANTEL+962-2-295111, FAX+962-2-295123E-mail: [email protected]
Chang Joo ChungEmeritus Professor, Seoul National University, Ag-ricutural Engineering Department, College of Agri-culture and Life Sciences, Suwon, 441-744, KOREATEL+82-(0)331-291-8131, FAX+82-(0)331-297-7478E-mail: [email protected]
Chul Choo LeeMailing Address: Rm. 514 Hyundate Goldentel Bld. 76-3 Kwang Jin Ku,Seoul, KOREATEL+82-(0)2-446-3473, FAX+82-(0)2-446-3473E-mail: [email protected]
Muhamad Zohadie BardaieProfessor and Deputy Vice Chancellor (Develop-ment Affairs), Chancellory, Universiti Putra Malay-sia, 43400 UPM, Serdang, Selangor, Darul Ehsan, MALAYSIATEL+60-3-9486053, FAX3-9426471Email: [email protected]
Madan P. PariyarConsultant, Rural Development through Selfhelp Promotion Lamjung Project, German Technical Cooperation. P.O. Box 1457, Kathmandu, NEPAL
David Boakye AmpratwumAssociate Professor, Dept.of Bioresource and Agri-cultural Engineering, College of Agriculture, Sultan Qaboos University, P.O. Box 34, Post Code 123, Muscat, Sultanate of Oman, OMANTEL+968-513866, FAX513866E-mail: [email protected]
EITag Seif Eldin Mailling Address: Dept. of Agric. Mechanization, College of Agriculture, P.O. Box 32484, Al-Khod, Sultan Qaboos University, Muscat, Sultanate of Oman, OMAN
Allah Ditta ChaudhryProfessor and Dean Faculty of Agric. Engineering and Technology, University of Agriculture, Faisala-bad, PAKISTAN
A.Q.A. MughalVice Chancellor, Sindh Agriculture University, Tan-dojam, PAKISTAN
G R Quick S M Farouk DaoulatHussain
M A Mazed M Gurung Wang Wanjun
S Illangantileke S M Ilyas A M Michael T P Ojha
S R Verma Soedjatmiko M Behroozi-Lar
Saeid Minaei
J Sakai B A Snorbar C J Chung C C Lee M ZBardaie
M P Pariyar
D BAmpratwum
E S Eldin A DChaudhry
A Q Mughal R ur Rehmen B TDevrajani
N AAbu-Khalaf
Surya Nath R M Lantin R PVenturina
VOL.36 NO.2 2005 AGRICULTURAL MECHANIZATION IN ASIA, AFRICA, AND LATIN AMERICA 99
Rafiq ur RehmanDirector, Agricultural Mechanization Reserch Insti-tute, P.O. Box No. 416 Multan, PAKISTAN
Bherulal T. DevrajaniProfessor and Chairman, Faculty of Agricultural En-gineering, Sindh Agriculture University, Tandojam, Sindh, PAKISTANTEL+92-2233-5594
Nawaf A. Abu-KhalafEngineer, the Project Directorate in Palestinian Ag-ricultural Ministry, P.O.Box 405, Hebron, PALESTINETelfax: 972-2-2227846/7E-mail: [email protected]
Surya NathAssoci. Prof., Dept. of Agriculture, Papua New Guinea University of Technology, Private Mail Basg, Lae, PAPUA NEW GUINEATEL+675-475-5162, FAX473-4477E-mail: [email protected]
Reynaldo M. LantinProfessor, College of Engineering and Agro-Indus-trial Technology University of the Philippines Los Banos, Laguna 4031, PHILIPPINESTEL+63-(0)49-536-2792, FAX+63-(0)49-536-2873E-mail: [email protected]
Ricardo P. VenturinaPresident & General Manager, Rivelisa publishing House, 215 F, Angeles St. cor Taft Ave. Ext., 1300 Pasay City, Metro Manila,PHILIPPINES
Saleh Abdulrahman Al-suhaibaniProfessor, Agricultural Engineering Dept.,College of Agriculture, King Saud University,P.O. Box 2460 Riyadh 11451, SAUDI ARABIA
Ali Mufarreh Saleh Al-AmriProfessor, Dept. of Agric. Engineering, Colleg of Agricultural and Food Sciences, King Faisal Univer-sity, Al-Ahsa,SAUDI ARABIAE-Mail: [email protected],[email protected]
Sen-Fuh ChangProfessor, Agric.-Machinery Dept. National Taiwan University, Taipei, TAIWAN
Tieng-song PengDeputy Director, Taiwan Agricultural Mechaniza-tion Research and Development Center. FL. 9-6, No. 391 Sinyi Road, Sec. 4, TAIWAN
Suraweth KrishnasreniSenior Expert in Agricultural En-gineering, Depart-ment of Agricul-ture, Chatuchak, Bangkok 10900,
ThailandTel5792153,5794497,5798520,Ext.124, Fax9405791 E-mail: [email protected]
Surin PhongsupasamitProfessor of Agricultural Engineering, Dept. of Me-chanical Engineering, Faculty of Engineering, Chu-lalongkom University, Phyathai Road, Patumwan, Bangkok 10330, THAILAND
Chanchai RojanasarojResearch and Development Engineer, Dept. of Ag-riculture, Ministry of Agriculture and Cooperatives, Gang-Khen, Bangkok 10900, THAILAND
Vilas M. SalokheProfessor, AFE Program, Asian Institute of Technol-ogy, P.O. Box 4, Klang Luang. Pathumthani 12120, THAILANDTEL+66-2-5245479, FAX+66-2-5246200E-mail: [email protected]
Gajendra SinghProfessor, AFE Program, Asian Institute of Technol-ogy, P.O. Box 4, Klongluang, Pathumthani 12120, THAILAND
Yunus PinarProfessor, and Head, Agric. Machinery Dept, Fac-ulty of Agriculture, University of Ondokuz Mayis, Kurupelit, Samsun, TURKEY
Imad HaffarAssociate Professor of Agric. Engineering, Faculty of Agricultural Sciences, United Arab Emirates Uni-versity, Al Ain, P.O. Box 17555, UAETEL+971-506436385, FAX+971-3-632384E-mail: [email protected]
Pham Van LangDirector, Vietnam Institute of Agricultural Engineer-ing, A2-Phuong Mai, Dong Da Hanoi, VIET NAM
Abdulsamad Abdulmalik Hazza,aProfessor and Head of Agricultural Engineering Department, Faculty of Agriculture, Sana,a Univer-sity, P.O.Box 12355, Sana,a YEMENTel+9671-407300, Fax:9671-217711E-mail: [email protected]
-EUROPE-Anastas Petrov KaloyanovProfessor & Head, Research Laboratory of Farm Mechanization, Higher Institute of Economics, So-fia, BULGARIA
Pavel KicVice-Dean/Technical Faculty, Czech University of Agriculture Prague, 16521 Prague 6-Suchdol, CZECHTel+420-2-24383141, Fax+420-2-20921361Email: [email protected]
Henrik HaveProf. of Agric. Machinery and Mechanization at In-stitute of Agric. Engineering, Royal Veterinan/- and Agricultural University, Agrovej 10DK2630 Tastrup, DENMARK
Giuseppe PellizziDirector of the Institute of Agric. Engineering of the University of Milano and Professor of Agric. Machinery and Mechanization, Via G. Celoria, 2-20133 Milano, ITALYTel+39-02-503-16871, Fax+39-02-503-168459E-mail: [email protected]
Aalbert Anne WandersStaff Member, Dept. of Development Cooperation, Netherlands Agricultural Engineering Research Insti-tute (IMAG), Wageningen, NETHERLANDS
Jan PawlakProfessor, head of the Dept. of Economics and Utilization of Farm Machines at IBMER, Professor at the Univ. of Warmia and Mazury in Olsztyn, Fac. of Tech. Sci., POLAND
Oleg S. MarchenkoProfessor and agricultural engineer, Department Head in All-Russia Research Institute for Mechani-zation in Agriculture (VIM), 1st Institutsky proezd, 5, Moscow 109428, RUSSIATel+7(095)174-8700, Fax+7(095)171-4349E-mail: [email protected]
John KilgourSenior Lecturer in Farm Machinery Design at Silsoe College, Silsoe Campus, Silsoe, Bedford, MK45 4DT, UK
Milan MartinovFull Professor on Agricultural Machinery, Univer-sity of Novi Sad, Faculty of Engineering, Institute of mechanization and machine design, TRG D. Obra-dovica 6, 21 121 Novi Sad, PF55, YUGOSLAVIATEL+381-21-350-122(loc.298), FAX+381-21-350-592E-mail: [email protected]
J Kilgour M Martinov
S AAl-Suhaibani
A M SAl-Amri
S F Chang T S Peng S Krishnasreni S Phong-supasamit
C Rojanasaroj V M Salokhe G Singh Y Pinar
I Haffar P V Lang A A Hazza,a A P
KaloyanovP Kic H Have G Pellizzi A A
WandersJan Pawlak O S
Marchenko

AGRICULTURAL MECHANIZATION IN ASIA, AFRICA, AND LATIN AMERICA 2005 VOL.36 NO.2 100
Back Issues
AGRICULTURAL MECHANIZATION IN ASIA, AFRICA AND LATIN AMERICA
(Vol.33, No.4, Autumn, 2002)Management of Primary Tillage Operation to
Reduce Tractor Fuel Consumption (A. Abu Sirhan, B. Snobar, A. Battikhi) ..................
Effect of Tillage and Fertilizer on Semi-arid Sorghum Yield (B. Kayombo) ....................
Effects of Tillage Methods on Soil Physical Conditions and Yield of Beans in a Sandy Loam Soil (B. Kayombo, T. E. Simalenga, N. Hatibu) ......................................................
Technical Evaluation of an Indigenous Con-servation Tillage System (B. Kayombo) ....
Evaluation of Drum Seeder in Puddled Rice Fields (S. V. Subbaiah, K. Krishnaiah, V. Balasubramanian) ........................................
Direct Seeding Options, Equipment Devel-oped and Their Performance on Yield of Rice Crop (R. S. Devnani) ..........................
Development and Evaluation of Combined-operations Machine for Wheat Crop Es-tablishment in Sudan Irrigated Schemes (Sheikh El Din Abdel Gadir El-Awad) .......
Effect of Different Seed Spacing Practices on the Evapotranspiration and Yield of Faba Bean (H. F. Al-Jalil, J. A. Amayreh, N. H. Abu-Hamdeh) ..............................................
Development of a Complete Cassava Harvest-er: I - Conceptualization (E. U. Odigboh, Claudio A. Moreira) ....................................
Development of a Complete Cassava Har-vester: II - Design and Development of the Uprooter/Lifter System (E. U. Odigboh, Claudio A. Moreira) ....................................
Design and Development of a Prototype De-huller for Tempered Sorghum and Millet (E. L. Lazaro, J. F. Favier) ...........................
Design and Development of a Universal Dryer (A. J. Akor, D. S. Zibokere) ............... 65
◇ ◇ ◇
AGRICULTURAL MECHANIZATION IN ASIA, AFRICA AND LATIN AMERICA
(Vol.34, No.1, Winter, 2003)Feasibility of High-Speed Cultivation Device
(Sheikh El Din Abdel Gadir El-Awad, C. P. Crossley) ......................................................
Experimental Research on Dynamic Friction Coefficients of Coated Rice Seeds (Yang Mingjin, Yang Ling, He Peixiang, Li Qing-dong) .............................................................
Animal-drawn Soil Working Four-in-one Implements (J. P. Gupta, R. Ahmad) .........
Design and Development of Bullock Drawn Traction Sprayer (R. A. Gupta, S. R. Pund, B. P. Patel) ....................................................
CIRAD Stripper for Standing Cereal Crops: a Review of the Results (C. Marouze, P. Thaunay) ......................................................
Development of a Motorized Ginger Slicer (K. J. Simonyan, K. M. Jegede, S. W. J. Lyocks) .........................................................
Agricultural Mechanization in Botswana:
Better Agricultural Production in the New Millennium (R. Tsheko., A. K. Mahapa-tra) ................................................................
The Potential of Using Solar Energy for Chick Brooding in Port Harcourt, Nigeria (D. S. Zibokere, A. J. Akor) ...................................
Design and Development of Mobile Perfor-mance Inspection Equipment for Tractors (Dong Meidui, He Yong) .............................
Studies on Suitability of Lower Ethanol Proofs for Alcohol - Diesel Microemul-sions (T. K. Bhattacharya, S. Chatterjee, T. N. Mishra) ....................................................
Impact of Farm Mechanization on Employ-ment and Entrepreneurship (S. R. Meena, A. Jhamtani) ................................................
Agricultural Mechanization in Hills of Him-achal Pradesh - a Case Study (D. K. Vatsa, D. C. Saraswat) ............................................
The Present State of Farm Machinery Indus-try (Shin-Norinsha Co., Ltd.) ......................
The Ibaraki University at a Glance (Hiroshi Shimizu) .......................................................
Activities at the Hokkaido Agricultural Ma-chinery Association (Munehiro Takai) ......
Education and Research Activities of the Ni-igata University (Masato Suzuki) ..............
Main Products of Agricultural Machinery Manufacturers in Japan (Shin-Norinsha Co., Ltd.) ......................................................
◇ ◇ ◇
AGRICULTURAL MECHANIZATION IN ASIA, AFRICA AND LATIN AMERICA
(Vol.34, No.2, Spring, 2003)Relationship of Specific Draft with Soil and
Operating Parameters for M. B. Plough (K. N. Agrawal, E. V. Thomas) ..........................
Inf luence of Seedling Mat Characteristics and Machine Parameters on Performance of Self-propelled Rice Transplanter (Ved Prakash Chaudhary, B. P. Varshney)...........
Development and Evaluation of Manually-operated Garlic Planter (I. K. Garg, Anoop Dixit) ............................................................
Performance Evolution of Self-propelled Rice Transplanter under Different Puddled Field Conditions and Sedimentation Periods (Ved Prakash Chaudhary, B. P. Varshney) .
Ergonomics of Selected Soil Working Hand Tools in South India (C. Ramana, D. An-anta Krishnan) ..............................................
Impact of Precision Land Levelling on Water Saving and Drainage Requirements (Abdul Sattar, A. R. Tahir, F. H. Khan) ...................
Design, Development and Performance Eval-uation of Rotary Potato Digger (Muham-mad Yasin, M. Mehmood Ahmed, Rafiq-ur-Rehman) ..................................................
Effect of Variety and Moisture Content on the Engineering Properties of Paddy and Rice (K. Nalladurai, K. Alagusundaram, P. Gayathri) ......................................................
Assessment of Cereal Straw Availability in Combine Harvested Fields and its Recov-
ery by Baling (Omar Ahmad Bamaga, T. C. Thakur, M. L. Verma) ............................
Present Status of Farm Machinery Fleet in Kyrgystan: Case Study (B. Havrland, Pat-ric Kapila) .....................................................
Equipment and Power Input for Agriculture in Oman (David B. Ampratwum, Atsu S. S. Dorvlo)) ....................................................
Effect of Seating Attachment to a Power Til-ler on Hand-arm Vibration (S. Karmakar, V. K. Tiwari) . ...............................................
AGRICULTURAL MECHANIZATION IN ASIA, AFRICA AND LATIN AMERICA
(Vol.34, No.3 Summer, 2003)Effect of Different Seedbed Preparation
Methods on Physical Properties of Soil (Davut Karayel, Aziz Ozmerzi) ..................
Studies on Optimization of Puddled Soil Characteristics for Self-propelled Rice Transplanter (B. K. Behera, B. P. Varsh-ney) ...............................................................
Minimizing Error in Row-spacing While Drilling Seeds (D. S. Wadhwa) ...................
Improvement and Evaluation of Crop Planter to Work on Ridges in Irrigated Schemes of Sudan (S. El Din Abdel Gadir El-Awad) ....
Development of a System for Analyses of Nozzle Spray Distribution for Students and Applicators’ Education (Adnan I. Khdair) ..
Comparative of Weeding by Animal-drawn Cultivator and Manual Hoe in EN-nohoud Area, Western Sudan (Mohamed Hassan Dahab, Salih Fadl Elseid Hamad) .............
‘Tapak-tapak’ Pump: Water Lifting Device for Small Scale Irrigation and Rural Water Supply for Developing Countries (E. A. Ampofo, M. A. Zobisch, E. A. Baryeh) ......
Improved Harvesting of Straw (U. Ch. Eshk-araev) ............................................................
Design and Development of Multi-fruit Grad-er (P. K. Omre, R. P. Saxena) .......................
Development and Construction of a Machine for Waxing Fruits and Horticultural Prod-ucts (H. M. Duran Garcia, E. J. Gonzalez Galvan) .........................................................
Comparative Grain Storage in India and Canada (K. Alagusundaram, D. S. Jayas, K. Nalladurai) ...............................................
Design Guidelines for Tractor Operator’s Entry and Exit (Rajvir Yadav, A. H. Raval, Sahastrarashmi Pund) .................................
Physical Energy Input for Maize Production in Zambia (Ajit K. Mahapatra, R. Tsheko, K. L. Kumar, Pascal Chipasha) ...................
Farm Tractor Conditions in Botswana (Ed-ward A. Baryeh, Obokeng B. Raikane).......
An Energy Modeling Analysis of the Integrat-ed Commercial Biodiesel Production from Palm Oil for Thailand (Teerin Vanichseni, Sakda Intaravichai, Banyat Saitthiti, Th-anya Kiatiwat) ...............................................
◇ ◇ ◇
(Vol.33, No.4, Autumn, 2002-)
9
12
15
19
23
27
34
41
43
50
59
65
9
18
21
26
31
37
42
47
51
55
59
66
73
77
79
81
83
9
13
19
23
34
39
43
47
53
59
65
71
9
12
17
19
24
27
31
37
39
43
46
53
57
61
67
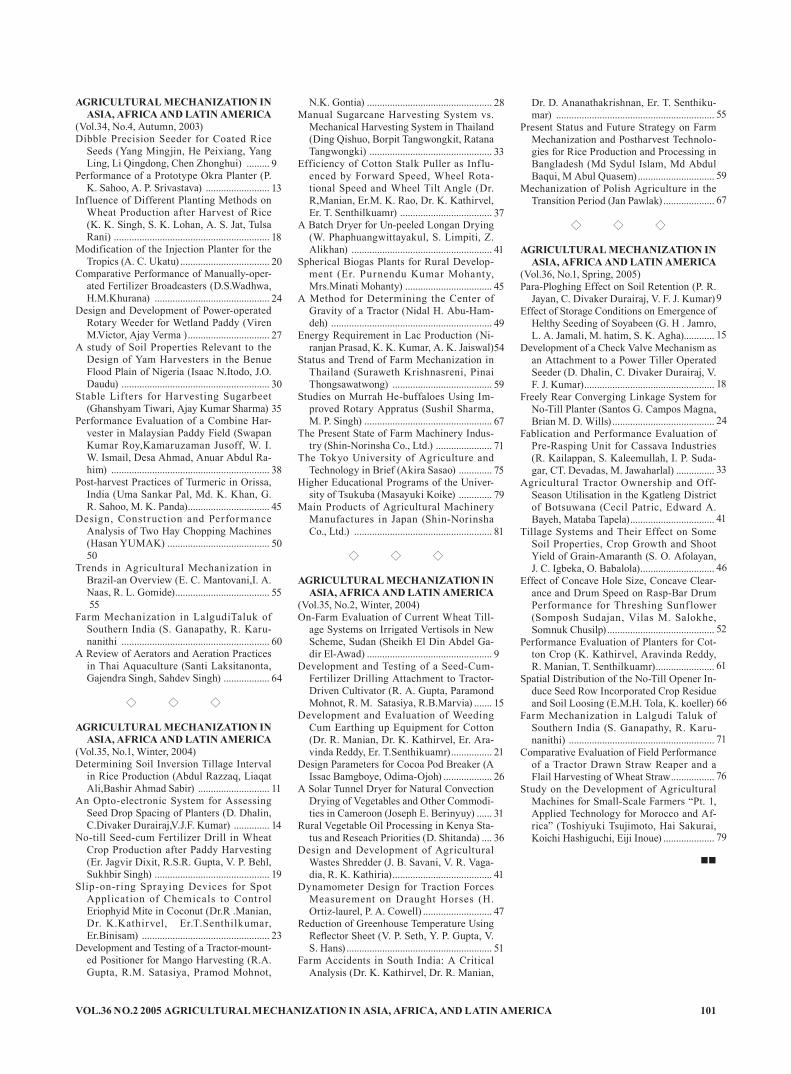
VOL.36 NO.2 2005 AGRICULTURAL MECHANIZATION IN ASIA, AFRICA, AND LATIN AMERICA 101
AGRICULTURAL MECHANIZATION IN ASIA, AFRICA AND LATIN AMERICA
(Vol.34, No.4, Autumn, 2003)Dibble Precision Seeder for Coated Rice
Seeds (Yang Mingjin, He Peixiang, Yang Ling, Li Qingdong, Chen Zhonghui) .........
Performance of a Prototype Okra Planter (P. K. Sahoo, A. P. Srivastava) .........................
Influence of Different Planting Methods on Wheat Production after Harvest of Rice (K. K. Singh, S. K. Lohan, A. S. Jat, Tulsa Rani) .............................................................
Modification of the Injection Planter for the Tropics (A. C. Ukatu) ...................................
Comparative Performance of Manually-oper-ated Fertilizer Broadcasters (D.S.Wadhwa, H.M.Khurana) .............................................
Design and Development of Power-operated Rotary Weeder for Wetland Paddy (Viren M.Victor, Ajay Verma ) ................................
A study of Soil Properties Relevant to the Design of Yam Harvesters in the Benue Flood Plain of Nigeria (Isaac N.Itodo, J.O. Daudu) ..........................................................
Stable Lifters for Harvesting Sugarbeet (Ghanshyam Tiwari, Ajay Kumar Sharma)
Performance Evaluation of a Combine Har-vester in Malaysian Paddy Field (Swapan Kumar Roy,Kamaruzaman Jusoff, W. I. W. Ismail, Desa Ahmad, Anuar Abdul Ra-him) ..............................................................
Post-harvest Practices of Turmeric in Orissa, India (Uma Sankar Pal, Md. K. Khan, G. R. Sahoo, M. K. Panda) ................................
Design, Construction and Performance Analysis of Two Hay Chopping Machines (Hasan YUMAK) ........................................50
Trends in Agricultural Mechanization in Brazil-an Overview (E. C. Mantovani,I. A. Naas, R. L. Gomide) ..................................... 55
Farm Mechanization in LalgudiTaluk of Southern India (S. Ganapathy, R. Karu-nanithi ..........................................................
A Review of Aerators and Aeration Practices in Thai Aquaculture (Santi Laksitanonta, Gajendra Singh, Sahdev Singh) ..................
◇ ◇ ◇
AGRICULTURAL MECHANIZATION IN ASIA, AFRICA AND LATIN AMERICA
(Vol.35, No.1, Winter, 2004)Determining Soil Inversion Tillage Interval
in Rice Production (Abdul Razzaq, Liaqat Ali,Bashir Ahmad Sabir) ............................
An Opto-electronic System for Assessing Seed Drop Spacing of Planters (D. Dhalin, C.Divaker Durairaj,V.J.F. Kumar) ..............
No-till Seed-cum Fertilizer Drill in Wheat Crop Production after Paddy Harvesting (Er. Jagvir Dixit, R.S.R. Gupta, V. P. Behl, Sukhbir Singh) .............................................
Slip-on-ring Spraying Devices for Spot Application of Chemicals to Control Eriophyid Mite in Coconut (Dr.R .Manian, Dr. K.Kathirvel, Er.T.Senthilkumar, Er.Binisam) ..................................................
Development and Testing of a Tractor-mount-ed Positioner for Mango Harvesting (R.A. Gupta, R.M. Satasiya, Pramod Mohnot,
9
13
18
20
24
27
30
35
38
45
50
55
60
64
11
14
19
23
N.K. Gontia) .................................................Manual Sugarcane Harvesting System vs.
Mechanical Harvesting System in Thailand (Ding Qishuo, Borpit Tangwongkit, Ratana Tangwongki) ................................................
Efficiency of Cotton Stalk Puller as Influ-enced by Forward Speed, Wheel Rota-tional Speed and Wheel Tilt Angle (Dr. R,Manian, Er.M. K. Rao, Dr. K. Kathirvel, Er. T. Senthilkuamr) ....................................
A Batch Dryer for Un-peeled Longan Drying (W. Phaphuangwittayakul, S. Limpiti, Z. Alikhan) .......................................................
Spherical Biogas Plants for Rural Develop-ment (Er. Purnendu Kumar Mohanty, Mrs.Minati Mohanty) ..................................
A Method for Determining the Center of Gravity of a Tractor (Nidal H. Abu-Ham-deh) ...............................................................
Energy Requirement in Lac Production (Ni-ranjan Prasad, K. K. Kumar, A. K. Jaiswal)
Status and Trend of Farm Mechanization in Thailand (Suraweth Krishnasreni, Pinai Thongsawatwong) .......................................
Studies on Murrah He-buffaloes Using Im-proved Rotary Appratus (Sushil Sharma, M. P. Singh) ..................................................
The Present State of Farm Machinery Indus-try (Shin-Norinsha Co., Ltd.) ......................
The Tokyo University of Agriculture and Technology in Brief (Akira Sasao) .............
Higher Educational Programs of the Univer-sity of Tsukuba (Masayuki Koike) .............
Main Products of Agricultural Machinery Manufactures in Japan (Shin-Norinsha Co., Ltd.) ......................................................
◇ ◇ ◇
AGRICULTURAL MECHANIZATION IN ASIA, AFRICA AND LATIN AMERICA
(Vol.35, No.2, Winter, 2004)On-Farm Evaluation of Current Wheat Till-
age Systems on Irrigated Vertisols in New Scheme, Sudan (Sheikh El Din Abdel Ga-dir El-Awad) .................................................
Development and Testing of a Seed-Cum-Fertilizer Drilling Attachment to Tractor-Driven Cultivator (R. A. Gupta, Paramond Mohnot, R. M. Satasiya, R.B.Marvia) .......
Development and Evaluation of Weeding Cum Earthing up Equipment for Cotton (Dr. R. Manian, Dr. K. Kathirvel, Er. Ara-vinda Reddy, Er. T.Senthikuamr) ................
Design Parameters for Cocoa Pod Breaker (A Issac Bamgboye, Odima-Ojoh) ...................
A Solar Tunnel Dryer for Natural Convection Drying of Vegetables and Other Commodi-ties in Cameroon (Joseph E. Berinyuy) ......
Rural Vegetable Oil Processing in Kenya Sta-tus and Reseach Priorities (D. Shitanda) ....
Design and Development of Agricultural Wastes Shredder (J. B. Savani, V. R. Vaga-dia, R. K. Kathiria) .......................................
Dynamometer Design for Traction Forces Measurement on Draught Horses (H. Ortiz-laurel, P. A. Cowell) ...........................
Reduction of Greenhouse Temperature Using Reflector Sheet (V. P. Seth, Y. P. Gupta, V. S. Hans) .........................................................
Farm Accidents in South India: A Critical Analysis (Dr. K. Kathirvel, Dr. R. Manian,
28
33
37
41
45
49
54
59
67
71
75
79
81
9
15
21
26
31
36
41
47
51
Dr. D. Ananathakrishnan, Er. T. Senthiku-mar) ..............................................................
Present Status and Future Strategy on Farm Mechanization and Postharvest Technolo-gies for Rice Production and Processing in Bangladesh (Md Sydul Islam, Md Abdul Baqui, M Abul Quasem) ..............................
Mechanization of Polish Agriculture in the Transition Period (Jan Pawlak) ....................
◇ ◇ ◇
AGRICULTURAL MECHANIZATION IN ASIA, AFRICA AND LATIN AMERICA
(Vol.36, No.1, Spring, 2005)Para-Ploghing Effect on Soil Retention (P. R.
Jayan, C. Divaker Durairaj, V. F. J. Kumar) Effect of Storage Conditions on Emergence of
Helthy Seeding of Soyabeen (G. H . Jamro, L. A. Jamali, M. hatim, S. K. Agha)............
Development of a Check Valve Mechanism as an Attachment to a Power Tiller Operated Seeder (D. Dhalin, C. Divaker Durairaj, V. F. J. Kumar) ...................................................
Freely Rear Converging Linkage System for No-Till Planter (Santos G. Campos Magna, Brian M. D. Wills) ........................................
Fablication and Performance Evaluation of Pre-Rasping Unit for Cassava Industries (R. Kailappan, S. Kaleemullah, I. P. Suda-gar, CT. Devadas, M. Jawaharlal) ...............
Agricultural Tractor Ownership and Off-Season Utilisation in the Kgatleng District of Botsuwana (Cecil Patric, Edward A. Bayeh, Mataba Tapela) .................................
Tillage Systems and Their Effect on Some Soil Properties, Crop Growth and Shoot Yield of Grain-Amaranth (S. O. Afolayan, J. C. Igbeka, O. Babalola) .............................
Effect of Concave Hole Size, Concave Clear-ance and Drum Speed on Rasp-Bar Drum Performance for Threshing Sunf lower (Somposh Sudajan, Vilas M. Salokhe, Somnuk Chusilp) ..........................................
Performance Evaluation of Planters for Cot-ton Crop (K. Kathirvel, Aravinda Reddy, R. Manian, T. Senthilkuamr) .......................
Spatial Distribution of the No-Till Opener In-duce Seed Row Incorporated Crop Residue and Soil Loosing (E.M.H. Tola, K. koeller)
Farm Mechanization in Lalgudi Taluk of Southern India (S. Ganapathy, R. Karu-nanithi) .........................................................
Comparative Evaluation of Field Performance of a Tractor Drawn Straw Reaper and a Flail Harvesting of Wheat Straw .................
Study on the Development of Agricultural Machines for Small-Scale Farmers “Pt. 1, Applied Technology for Morocco and Af-rica” (Toshiyuki Tsujimoto, Hai Sakurai, Koichi Hashiguchi, Eiji Inoue) ....................
■■
55
59
67
9
15
18
24
33
41
46
52
61
66
71
76
79

AGRICULTURAL MECHANIZATION IN ASIA, AFRICA, AND LATIN AMERICA 2005 VOL.36 NO.2 102
are written in the English language;are relevant: to the promotion of agricultural mecha-nization, particularly for the developing countries;have not been previously published elsewhere, or, if previously published are supported by a copyright permission;deal with practical and adoptable innovations by, small farmers with a minimum of complicated for-mulas, theories and schematic diagrams;have a 50 to 100-word abstract, preferably preceding the main body of the article;are printed, double-spaced, under 3,000 words (ap-proximately equivalent to 6 pages of AMA-size pa-per) ; and those thatart: supported by authentic sources, reference or bib-liography.written on floppy disc or CD-R
As a rule, articles that are not chosen for AMA pub-lication are not returned unless the writer(s) asks for their return and are covered with adequate postage stamps. At the earliest time possible, the writer(s) is advised whether the article is rejected or accepted.When an article is accepted but requires revision/modification, the details will be indicated in the re-turn reply from the AMA Chief Editor in which case such revision/modification must be completed and returned to AMA within three months from the date of receipt from the Editorial Staff."The AMA does not pay for articles published. How-ever, the writers are given collectively 5 free copies (one copy air-mailed and 4 copies sent by surface/sea mail) of the AMA issue wherein their articles are published. In addition, a single writer is given 25 off-prints of the article and plural writers are given 35 off-prints (also sent by surface/sea mail)"Complimentary copies: Following the publishing, three successive issue are sent to the author(s).
Articles for publication (original and one-copy) must be sent to AMA through the Co-operating Editor in the country where the article originates. (Please refer to the names and addresses of Co-operating Editors in any issue of the AMA). However, in the absence of any Co-operating Editor, the article may be sent directly to the AMA Chief Editor in Tokyo.Contributors of articles for the AMA for the first time are required to attach a passport size ID photograph (black and white print preferred) to the article. The same applies to those who have contributed articles three years earlier. In either case, ID photographs
Criteria for Article SelectionPriority in the selection of article for publication is given
to those that –a.b.
c.
d.
e.
f.
g.
h.
Rejected/Accepted Articlesa.
b.
c.
d.
Procedurea.
b.
INSTRUCTIONS TO AMA CONTRIBUTORSThe Editorial Staff of the AMA requests of articles for publication to observe the following editorial
policy and guidelines in order to improve communication and to facilitate the editorial process:
taken within the last 6 months are preferred.The article must bear the writer(s) name, title/designation, office/organization, nationality and com-plete mailing address.
Article must be sent on 3.5 inch floppy disk or CD-R with MS DOS format (e.g. Word Perfect, Word for DOS, Word for Windows... Absolutely necessary TEXT FORMAT) along with two printed copy (A4).The data for graphs and the black & white photo-graphs must be enclosed with the article.Whether the article is a technical or popular contribu-tion, lecture, research result, thesis or special report, the format must contain the following features:(i) brief and appropriate title;(ii) the writer(s) name, designation/title, office/organization; and mailing address;(iii) an abstract following ii) above;(iv) body proper (text/discussion);(v) conclusion/recommendation; and a(vi) bibliographyThe printed copy must be numbered (Arabic nu-meral) successively at the top center whereas the disc copy pages should not be number. Tables, graphs and diagrams must likewise be numbered. Table numbers must precede table titles, e.g., "Table 1. Rate of Seed-ing per Hectare". Such table number and title must be typed at the top center of the table. On the other hand, graphs, diagrams, maps and photographs are considered figures in which case the captions must be indicated below the figure and preceded by num-ber, e.g., "Figure 1. View of the Farm Buildings".The data for the graph must also be included. (e.g. EXCEL for Windows)Tables and figures must be preceded by texts or discussions. Inclusion of such tables and figures not otherwise referred to in the text/discussion must be avoided.Tables must be typed clearly without vertical lines or partitions. Horizontal lines must be drawn only to contain the sub-title heads of columns and at the bot-tom of the table.Express measurements in the metric system and crop yields in metric tons per hectare (t/ha) and smaller units in kilogram or gram (kg/plot or g/row).Indicate by footnotes or legends any abbreviations or symbols used in tables or figures.Convert national currencies in US dollars and use the later consistently.Round off numbers, if possible, to one or two deci-mal units, e.g., 45.5 kg/ha instead of 45.4762 kg/ha.When numbers must start a sentence, such numbers must be written in words, e.g., Forty-five workers..., or Five tractors..."instead of 45 workers..., or, 5 trac-tors.
c.
Format/Style Guidancea.
b.
c.
d.
e.
f.
g.
h.
i.
j.
k.
l.